Post, TX Map & Demographics
Post Map
Post Overview
$17,025
PER CAPITA INCOME
$72,586
AVG FAMILY INCOME
$44,701
AVG HOUSEHOLD INCOME
23.7%
WAGE / INCOME GAP [ % ]
76.3¢/ $1
WAGE / INCOME GAP [ $ ]
0.41
INEQUALITY / GINI INDEX
4,632
TOTAL POPULATION
2,919
MALE POPULATION
1,713
FEMALE POPULATION
170.40
MALES / 100 FEMALES
58.68
FEMALES / 100 MALES
39.8
MEDIAN AGE
3.3
AVG FAMILY SIZE
2.7
AVG HOUSEHOLD SIZE
1,195
LABOR FORCE [ PEOPLE ]
30.4%
PERCENT IN LABOR FORCE
5.8%
UNEMPLOYMENT RATE
Post Zip Codes
Post Area Codes
Income in Post
Income Overview in Post
Per Capita Income in Post is $17,025, while median incomes of families and households are $72,586 and $44,701 respectively.
| Characteristic | Number | Measure |
| Per Capita Income | 4,632 | $17,025 |
| Median Family Income | 809 | $72,586 |
| Mean Family Income | 809 | $77,343 |
| Median Household Income | 1,212 | $44,701 |
| Mean Household Income | 1,212 | $61,155 |
| Income Deficit | 809 | $0 |
| Wage / Income Gap (%) | 4,632 | 23.70% |
| Wage / Income Gap ($) | 4,632 | 76.30¢ per $1 |
| Gini / Inequality Index | 4,632 | 0.41 |
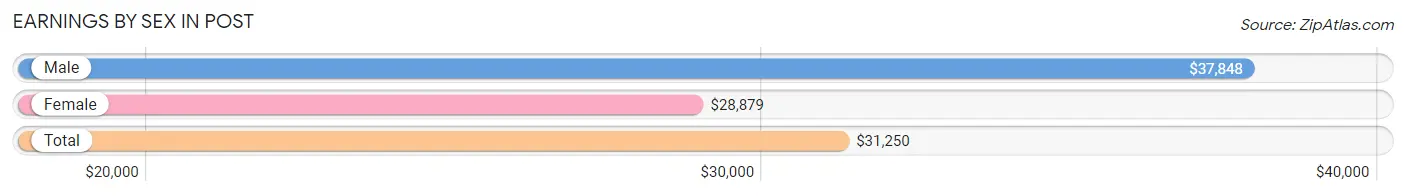
Earnings by Sex in Post
Average Earnings in Post are $31,250, $37,848 for men and $28,879 for women, a difference of 23.7%.
| Sex | Number | Average Earnings |
| Male | 831 (61.5%) | $37,848 |
| Female | 520 (38.5%) | $28,879 |
| Total | 1,351 (100.0%) | $31,250 |
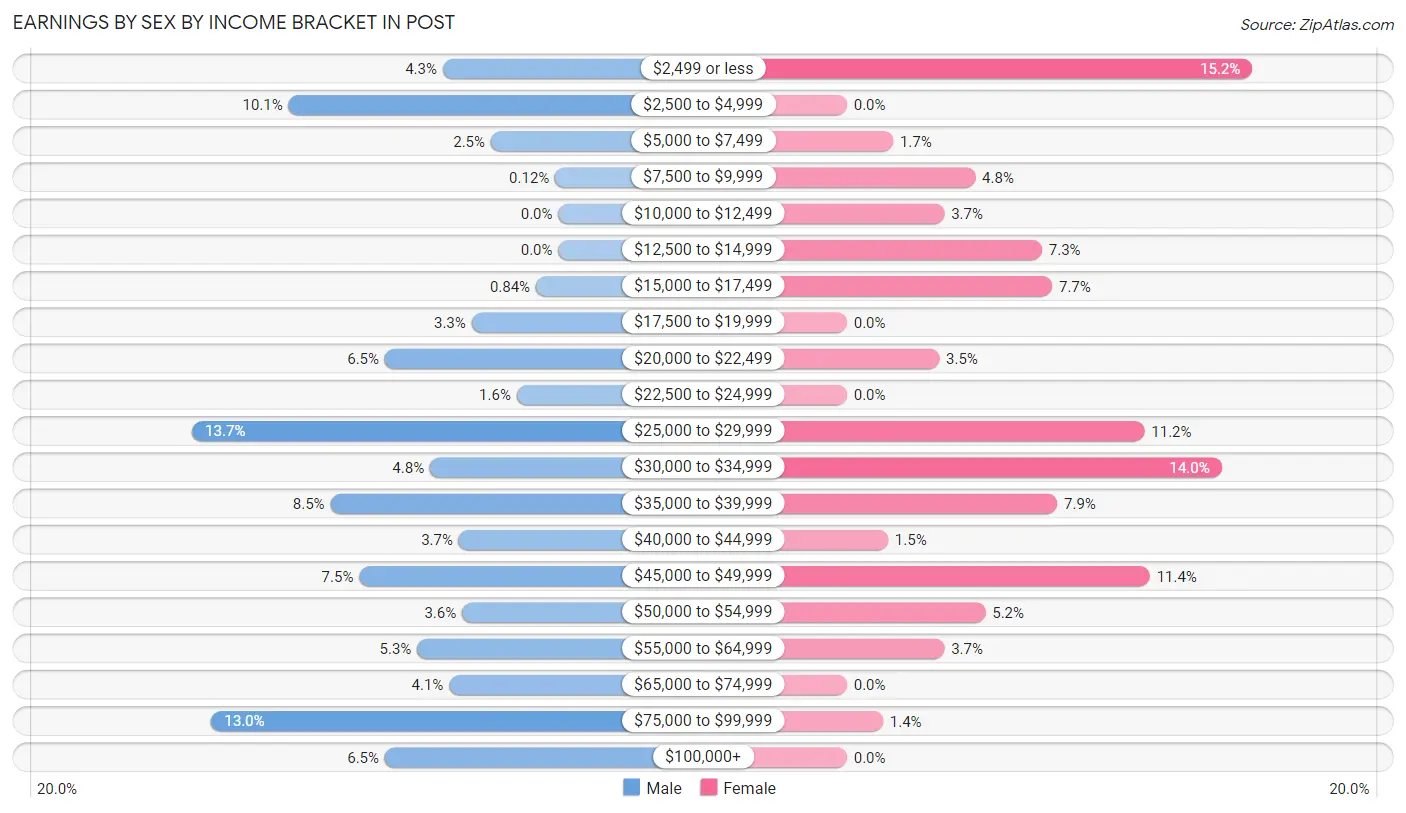
Earnings by Sex by Income Bracket in Post
The most common earnings brackets in Post are $25,000 to $29,999 for men (114 | 13.7%) and $2,499 or less for women (79 | 15.2%).
| Income | Male | Female |
| $2,499 or less | 36 (4.3%) | 79 (15.2%) |
| $2,500 to $4,999 | 84 (10.1%) | 0 (0.0%) |
| $5,000 to $7,499 | 21 (2.5%) | 9 (1.7%) |
| $7,500 to $9,999 | 1 (0.1%) | 25 (4.8%) |
| $10,000 to $12,499 | 0 (0.0%) | 19 (3.6%) |
| $12,500 to $14,999 | 0 (0.0%) | 38 (7.3%) |
| $15,000 to $17,499 | 7 (0.8%) | 40 (7.7%) |
| $17,500 to $19,999 | 27 (3.3%) | 0 (0.0%) |
| $20,000 to $22,499 | 54 (6.5%) | 18 (3.5%) |
| $22,500 to $24,999 | 13 (1.6%) | 0 (0.0%) |
| $25,000 to $29,999 | 114 (13.7%) | 58 (11.2%) |
| $30,000 to $34,999 | 40 (4.8%) | 73 (14.0%) |
| $35,000 to $39,999 | 71 (8.5%) | 41 (7.9%) |
| $40,000 to $44,999 | 31 (3.7%) | 8 (1.5%) |
| $45,000 to $49,999 | 62 (7.5%) | 59 (11.4%) |
| $50,000 to $54,999 | 30 (3.6%) | 27 (5.2%) |
| $55,000 to $64,999 | 44 (5.3%) | 19 (3.6%) |
| $65,000 to $74,999 | 34 (4.1%) | 0 (0.0%) |
| $75,000 to $99,999 | 108 (13.0%) | 7 (1.3%) |
| $100,000+ | 54 (6.5%) | 0 (0.0%) |
| Total | 831 (100.0%) | 520 (100.0%) |
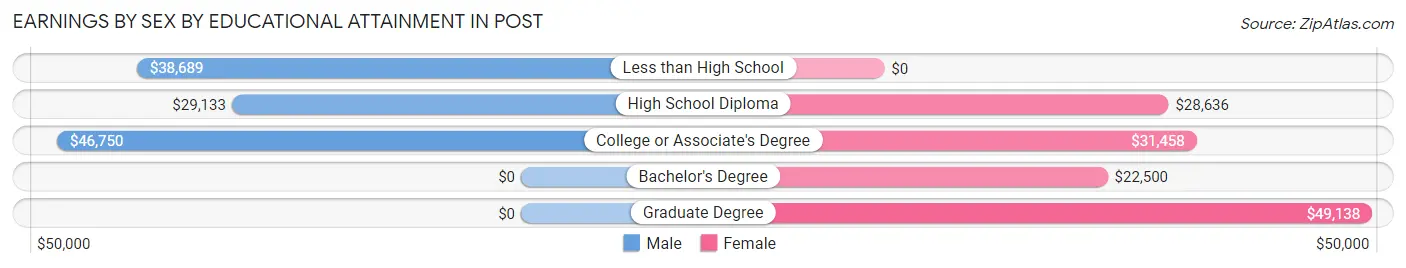
Earnings by Sex by Educational Attainment in Post
Average earnings in Post are $39,426 for men and $28,879 for women, a difference of 26.8%. Men with an educational attainment of college or associate's degree enjoy the highest average annual earnings of $46,750, while those with high school diploma education earn the least with $29,133. Women with an educational attainment of graduate degree earn the most with the average annual earnings of $49,138, while those with bachelor's degree education have the smallest earnings of $22,500.
| Educational Attainment | Male Income | Female Income |
| Less than High School | $38,689 | $0 |
| High School Diploma | $29,133 | $28,636 |
| College or Associate's Degree | $46,750 | $31,458 |
| Bachelor's Degree | - | - |
| Graduate Degree | - | - |
| Total | $39,426 | $28,879 |
Family Income in Post
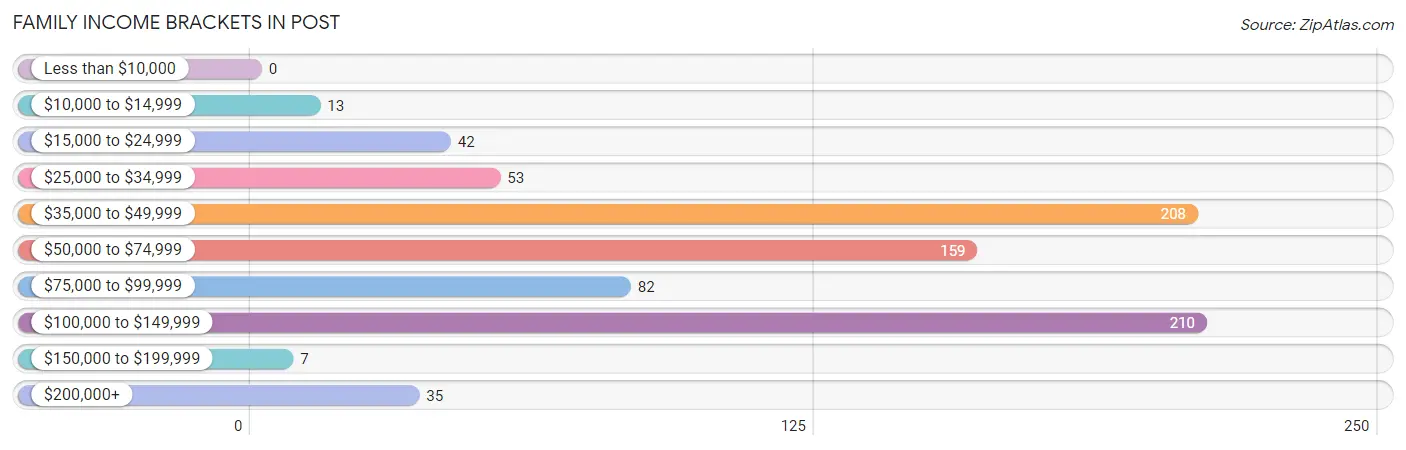
Family Income Brackets in Post
According to the Post family income data, there are 210 families falling into the $100,000 to $149,999 income range, which is the most common income bracket and makes up 26.0% of all families.
| Income Bracket | # Families | % Families |
| Less than $10,000 | 0 | 0.0% |
| $10,000 to $14,999 | 13 | 1.6% |
| $15,000 to $24,999 | 42 | 5.2% |
| $25,000 to $34,999 | 53 | 6.6% |
| $35,000 to $49,999 | 208 | 25.7% |
| $50,000 to $74,999 | 159 | 19.7% |
| $75,000 to $99,999 | 82 | 10.1% |
| $100,000 to $149,999 | 210 | 26.0% |
| $150,000 to $199,999 | 7 | 0.9% |
| $200,000+ | 35 | 4.3% |
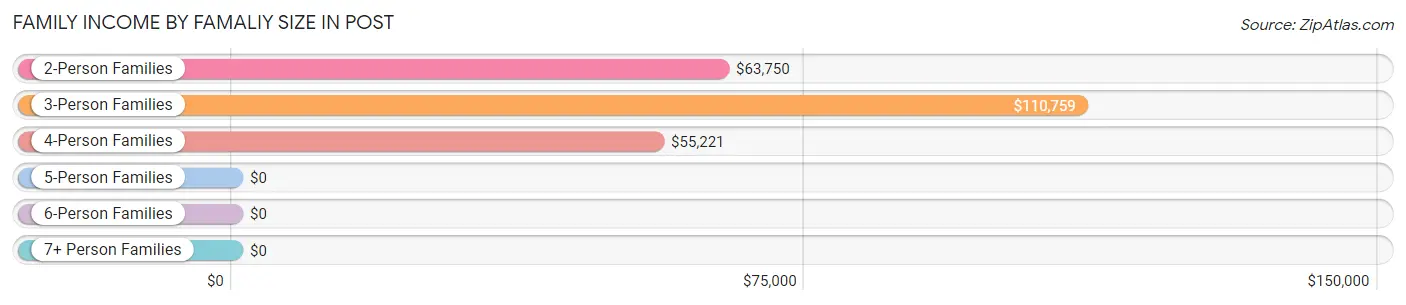
Family Income by Famaliy Size in Post
3-person families (61 | 7.5%) account for the highest median family income in Post with $110,759 per family, while 3-person families (61 | 7.5%) have the highest median income of $36,920 per family member.
| Income Bracket | # Families | Median Income |
| 2-Person Families | 420 (51.9%) | $63,750 |
| 3-Person Families | 61 (7.5%) | $110,759 |
| 4-Person Families | 229 (28.3%) | $55,221 |
| 5-Person Families | 7 (0.9%) | $0 |
| 6-Person Families | 23 (2.8%) | $0 |
| 7+ Person Families | 69 (8.5%) | $0 |
| Total | 809 (100.0%) | $72,586 |
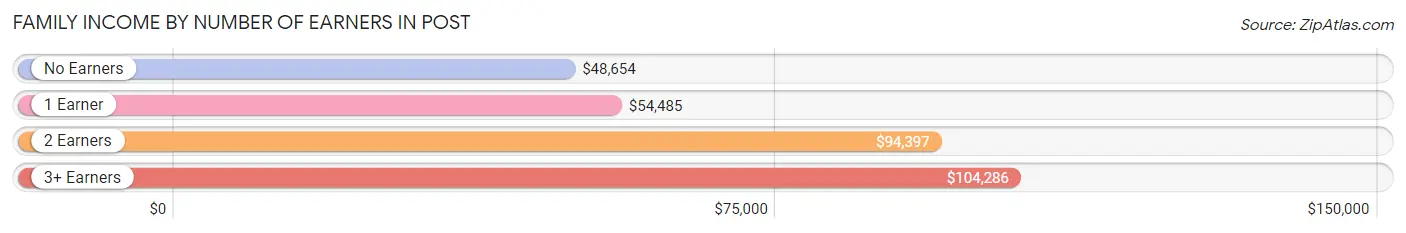
Family Income by Number of Earners in Post
The median family income in Post is $72,586, with families comprising 3+ earners (60) having the highest median family income of $104,286, while families with no earners (164) have the lowest median family income of $48,654, accounting for 7.4% and 20.3% of families, respectively.
| Number of Earners | # Families | Median Income |
| No Earners | 164 (20.3%) | $48,654 |
| 1 Earner | 291 (36.0%) | $54,485 |
| 2 Earners | 294 (36.3%) | $94,397 |
| 3+ Earners | 60 (7.4%) | $104,286 |
| Total | 809 (100.0%) | $72,586 |
Household Income in Post
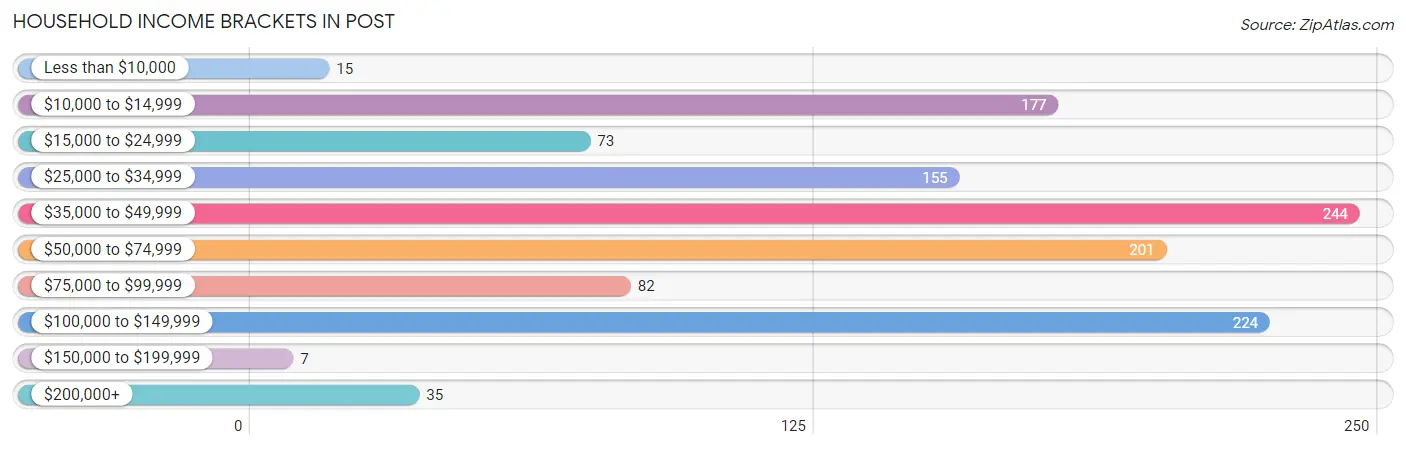
Household Income Brackets in Post
With 244 households falling in the category, the $35,000 to $49,999 income range is the most frequent in Post, accounting for 20.1% of all households. In contrast, only 7 households (0.6%) fall into the $150,000 to $199,999 income bracket, making it the least populous group.
| Income Bracket | # Households | % Households |
| Less than $10,000 | 15 | 1.2% |
| $10,000 to $14,999 | 177 | 14.6% |
| $15,000 to $24,999 | 73 | 6.0% |
| $25,000 to $34,999 | 155 | 12.8% |
| $35,000 to $49,999 | 244 | 20.1% |
| $50,000 to $74,999 | 201 | 16.6% |
| $75,000 to $99,999 | 82 | 6.8% |
| $100,000 to $149,999 | 224 | 18.5% |
| $150,000 to $199,999 | 7 | 0.6% |
| $200,000+ | 35 | 2.9% |
Household Income by Householder Age in Post
The median household income in Post is $44,701, with the highest median household income of $72,000 found in the 25 to 44 years age bracket for the primary householder. A total of 354 households (29.2%) fall into this category. Meanwhile, the 15 to 24 years age bracket for the primary householder has the lowest median household income of $0, with 23 households (1.9%) in this group.
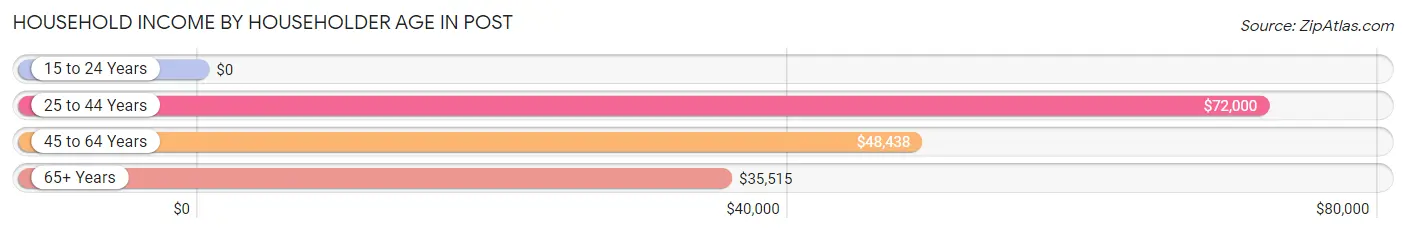
| Income Bracket | # Households | Median Income |
| 15 to 24 Years | 23 (1.9%) | $0 |
| 25 to 44 Years | 354 (29.2%) | $72,000 |
| 45 to 64 Years | 318 (26.2%) | $48,438 |
| 65+ Years | 517 (42.7%) | $35,515 |
| Total | 1,212 (100.0%) | $44,701 |
Poverty in Post
Income Below Poverty by Sex and Age in Post
With 21.6% poverty level for males and 17.4% for females among the residents of Post, 6 to 11 year old males and 16 and 17 year old females are the most vulnerable to poverty, with 133 males (78.2%) and 22 females (78.6%) in their respective age groups living below the poverty level.
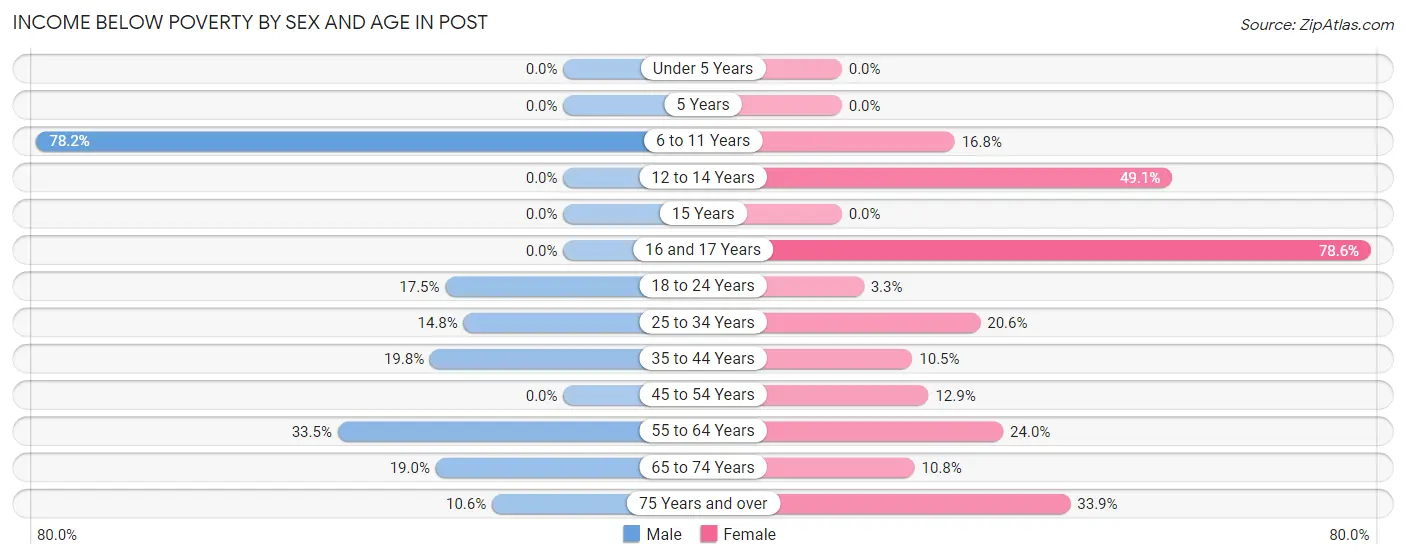
| Age Bracket | Male | Female |
| Under 5 Years | 0 (0.0%) | 0 (0.0%) |
| 5 Years | 0 (0.0%) | 0 (0.0%) |
| 6 to 11 Years | 133 (78.2%) | 27 (16.8%) |
| 12 to 14 Years | 0 (0.0%) | 26 (49.1%) |
| 15 Years | 0 (0.0%) | 0 (0.0%) |
| 16 and 17 Years | 0 (0.0%) | 22 (78.6%) |
| 18 to 24 Years | 24 (17.5%) | 9 (3.3%) |
| 25 to 34 Years | 44 (14.8%) | 29 (20.6%) |
| 35 to 44 Years | 20 (19.8%) | 13 (10.5%) |
| 45 to 54 Years | 0 (0.0%) | 22 (12.9%) |
| 55 to 64 Years | 68 (33.5%) | 46 (24.0%) |
| 65 to 74 Years | 29 (19.0%) | 20 (10.8%) |
| 75 Years and over | 18 (10.6%) | 74 (33.9%) |
| Total | 336 (21.6%) | 288 (17.4%) |
Income Above Poverty by Sex and Age in Post
According to the poverty statistics in Post, males aged under 5 years and females aged under 5 years are the age groups that are most secure financially, with 100.0% of males and 100.0% of females in these age groups living above the poverty line.
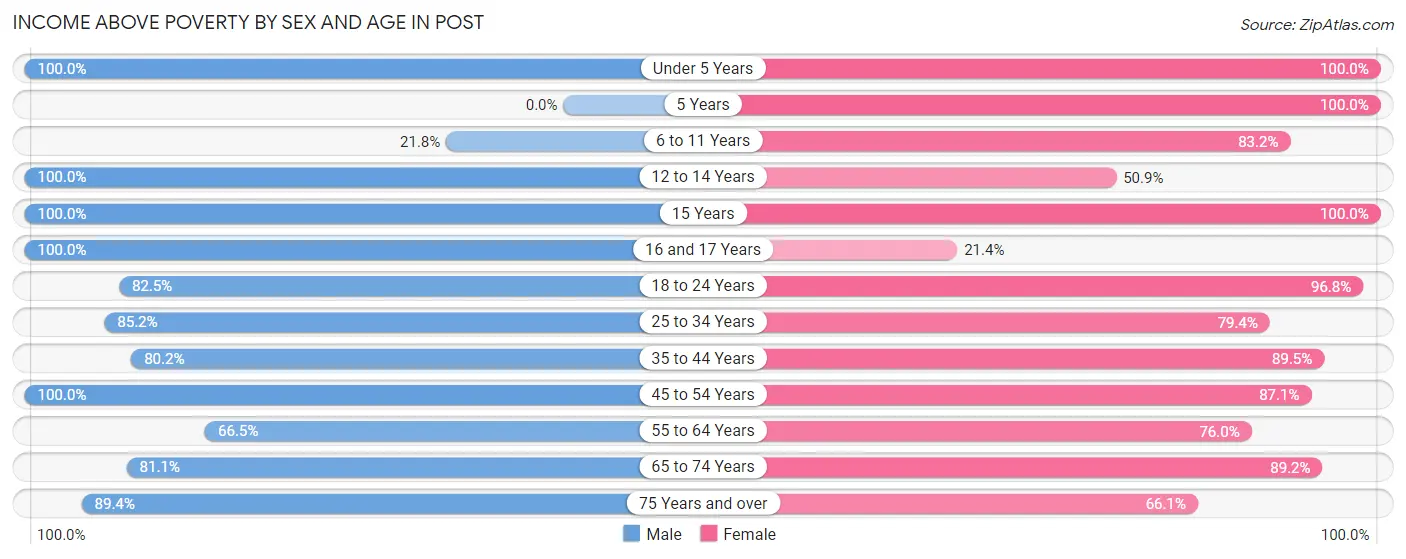
| Age Bracket | Male | Female |
| Under 5 Years | 99 (100.0%) | 47 (100.0%) |
| 5 Years | 0 (0.0%) | 18 (100.0%) |
| 6 to 11 Years | 37 (21.8%) | 134 (83.2%) |
| 12 to 14 Years | 33 (100.0%) | 27 (50.9%) |
| 15 Years | 27 (100.0%) | 37 (100.0%) |
| 16 and 17 Years | 52 (100.0%) | 6 (21.4%) |
| 18 to 24 Years | 113 (82.5%) | 268 (96.8%) |
| 25 to 34 Years | 253 (85.2%) | 112 (79.4%) |
| 35 to 44 Years | 81 (80.2%) | 111 (89.5%) |
| 45 to 54 Years | 111 (100.0%) | 149 (87.1%) |
| 55 to 64 Years | 135 (66.5%) | 146 (76.0%) |
| 65 to 74 Years | 124 (81.0%) | 165 (89.2%) |
| 75 Years and over | 152 (89.4%) | 144 (66.1%) |
| Total | 1,217 (78.4%) | 1,364 (82.6%) |
Income Below Poverty Among Married-Couple Families in Post
The poverty statistics for married-couple families in Post show that 5.7% or 38 of the total 662 families live below the poverty line. Families with 3 or 4 children have the highest poverty rate of 100.0%, comprising of 20 families. On the other hand, families with 1 or 2 children have the lowest poverty rate of 0.0%, which includes 0 families.
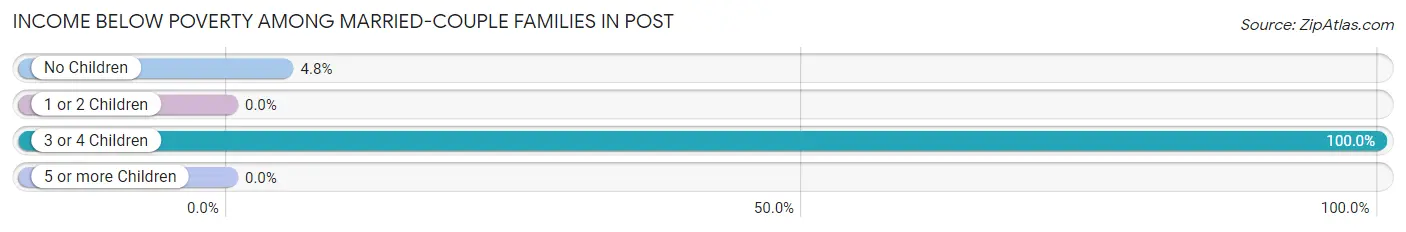
| Children | Above Poverty | Below Poverty |
| No Children | 354 (95.2%) | 18 (4.8%) |
| 1 or 2 Children | 208 (100.0%) | 0 (0.0%) |
| 3 or 4 Children | 0 (0.0%) | 20 (100.0%) |
| 5 or more Children | 62 (100.0%) | 0 (0.0%) |
| Total | 624 (94.3%) | 38 (5.7%) |
Income Below Poverty Among Single-Parent Households in Post
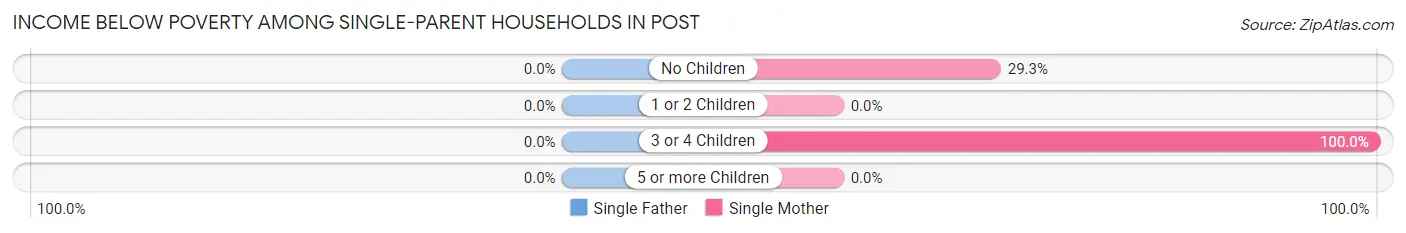
| Children | Single Father | Single Mother |
| No Children | 0 (0.0%) | 24 (29.3%) |
| 1 or 2 Children | 0 (0.0%) | 0 (0.0%) |
| 3 or 4 Children | 0 (0.0%) | 13 (100.0%) |
| 5 or more Children | 0 (0.0%) | 0 (0.0%) |
| Total | 0 (0.0%) | 37 (27.8%) |
Income Below Poverty Among Married-Couple vs Single-Parent Households in Post
The poverty data for Post shows that 38 of the married-couple family households (5.7%) and 37 of the single-parent households (25.2%) are living below the poverty level. Within the married-couple family households, those with 3 or 4 children have the highest poverty rate, with 20 households (100.0%) falling below the poverty line. Among the single-parent households, those with 3 or 4 children have the highest poverty rate, with 13 household (100.0%) living below poverty.
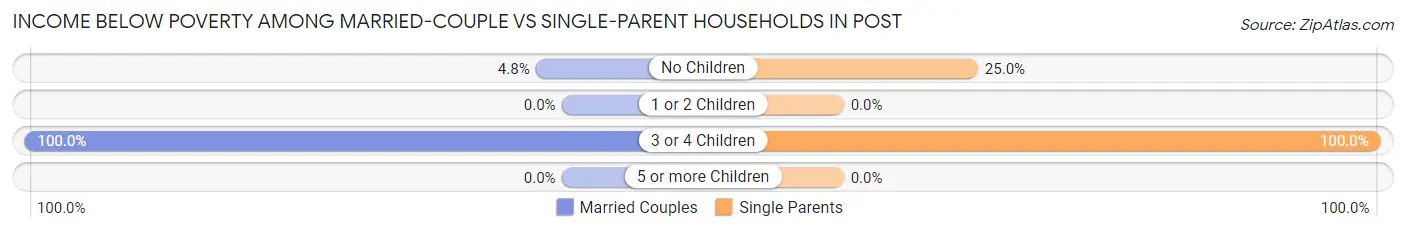
| Children | Married-Couple Families | Single-Parent Households |
| No Children | 18 (4.8%) | 24 (25.0%) |
| 1 or 2 Children | 0 (0.0%) | 0 (0.0%) |
| 3 or 4 Children | 20 (100.0%) | 13 (100.0%) |
| 5 or more Children | 0 (0.0%) | 0 (0.0%) |
| Total | 38 (5.7%) | 37 (25.2%) |
Race in Post
The most populous races in Post are White / Caucasian (3,030 | 65.4%), Hispanic or Latino (2,566 | 55.4%), and Two or more Races (671 | 14.5%).
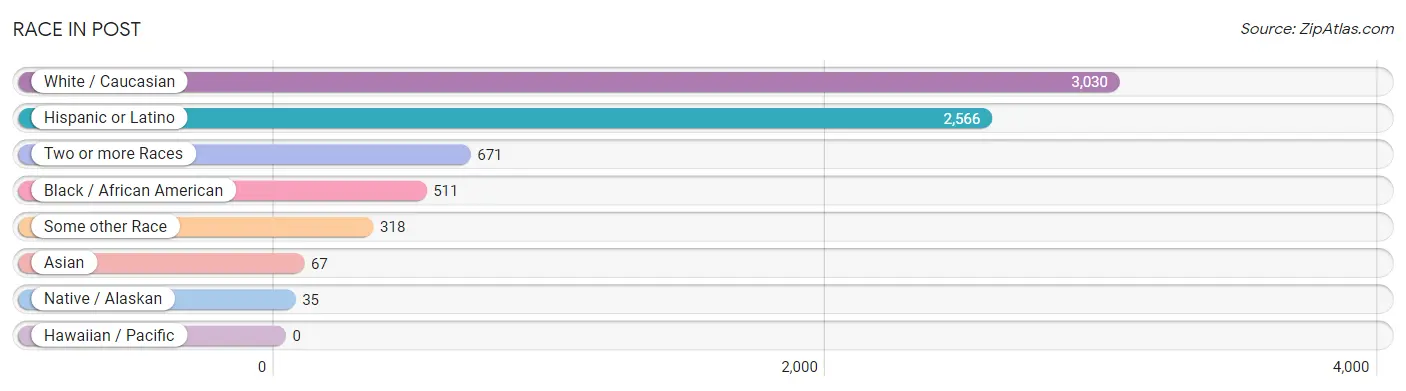
| Race | # Population | % Population |
| Asian | 67 | 1.5% |
| Black / African American | 511 | 11.0% |
| Hawaiian / Pacific | 0 | 0.0% |
| Hispanic or Latino | 2,566 | 55.4% |
| Native / Alaskan | 35 | 0.8% |
| White / Caucasian | 3,030 | 65.4% |
| Two or more Races | 671 | 14.5% |
| Some other Race | 318 | 6.9% |
| Total | 4,632 | 100.0% |
Ancestry in Post
The most populous ancestries reported in Post are Mexican (2,244 | 48.4%), German (259 | 5.6%), English (258 | 5.6%), American (198 | 4.3%), and Irish (166 | 3.6%), together accounting for 67.5% of all Post residents.
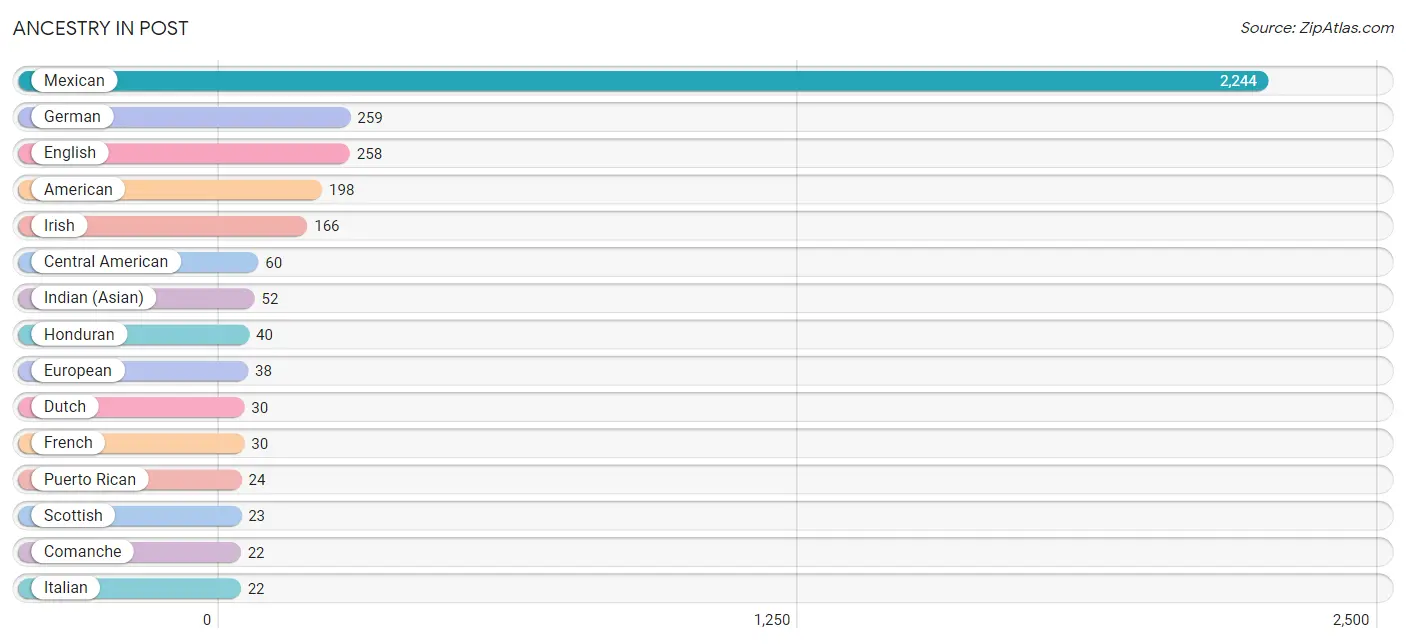
| Ancestry | # Population | % Population |
| American | 198 | 4.3% |
| Apache | 2 | 0.0% |
| Austrian | 12 | 0.3% |
| Central American | 60 | 1.3% |
| Colombian | 7 | 0.2% |
| Comanche | 22 | 0.5% |
| Cuban | 7 | 0.2% |
| Dominican | 12 | 0.3% |
| Dutch | 30 | 0.6% |
| Ecuadorian | 12 | 0.3% |
| English | 258 | 5.6% |
| European | 38 | 0.8% |
| French | 30 | 0.6% |
| German | 259 | 5.6% |
| Guatemalan | 20 | 0.4% |
| Honduran | 40 | 0.9% |
| Hopi | 2 | 0.0% |
| Indian (Asian) | 52 | 1.1% |
| Irish | 166 | 3.6% |
| Italian | 22 | 0.5% |
| Jamaican | 17 | 0.4% |
| Korean | 15 | 0.3% |
| Mexican | 2,244 | 48.4% |
| Northern European | 8 | 0.2% |
| Puerto Rican | 24 | 0.5% |
| Scottish | 23 | 0.5% |
| South American | 19 | 0.4% |
| Spaniard | 21 | 0.4% |
| Swiss | 11 | 0.2% |
| Welsh | 15 | 0.3% | View All 30 Rows |
Immigrants in Post
The most numerous immigrant groups reported in Post came from Latin America (1,101 | 23.8%), Central America (1,036 | 22.4%), Mexico (950 | 20.5%), Asia (70 | 1.5%), and Caribbean (43 | 0.9%), together accounting for 69.1% of all Post residents.
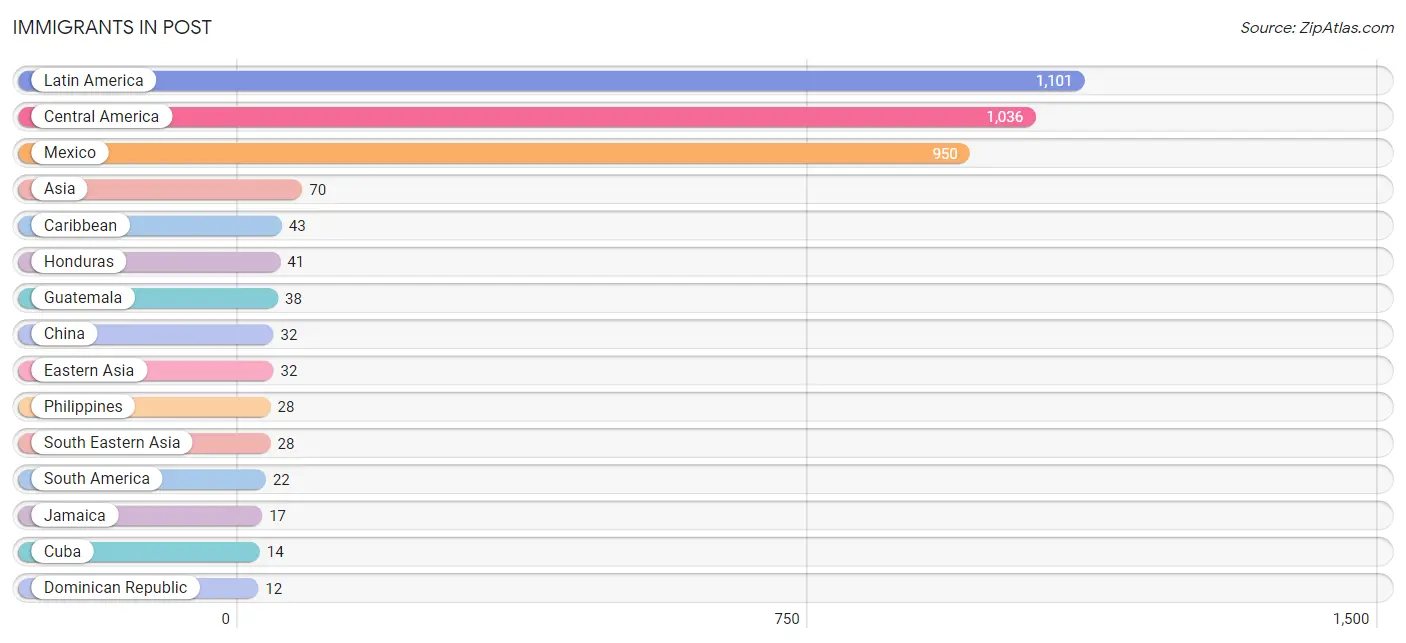
| Immigration Origin | # Population | % Population |
| Asia | 70 | 1.5% |
| Canada | 7 | 0.2% |
| Caribbean | 43 | 0.9% |
| Central America | 1,036 | 22.4% |
| China | 32 | 0.7% |
| Colombia | 10 | 0.2% |
| Cuba | 14 | 0.3% |
| Dominican Republic | 12 | 0.3% |
| Eastern Asia | 32 | 0.7% |
| Ecuador | 12 | 0.3% |
| El Salvador | 7 | 0.2% |
| Guatemala | 38 | 0.8% |
| Honduras | 41 | 0.9% |
| Israel | 10 | 0.2% |
| Jamaica | 17 | 0.4% |
| Latin America | 1,101 | 23.8% |
| Mexico | 950 | 20.5% |
| Philippines | 28 | 0.6% |
| South America | 22 | 0.5% |
| South Eastern Asia | 28 | 0.6% |
| Western Asia | 10 | 0.2% | View All 21 Rows |
Sex and Age in Post
Sex and Age in Post
The most populous age groups in Post are 40 to 44 Years (335 | 11.5%) for men and 20 to 24 Years (206 | 12.0%) for women.
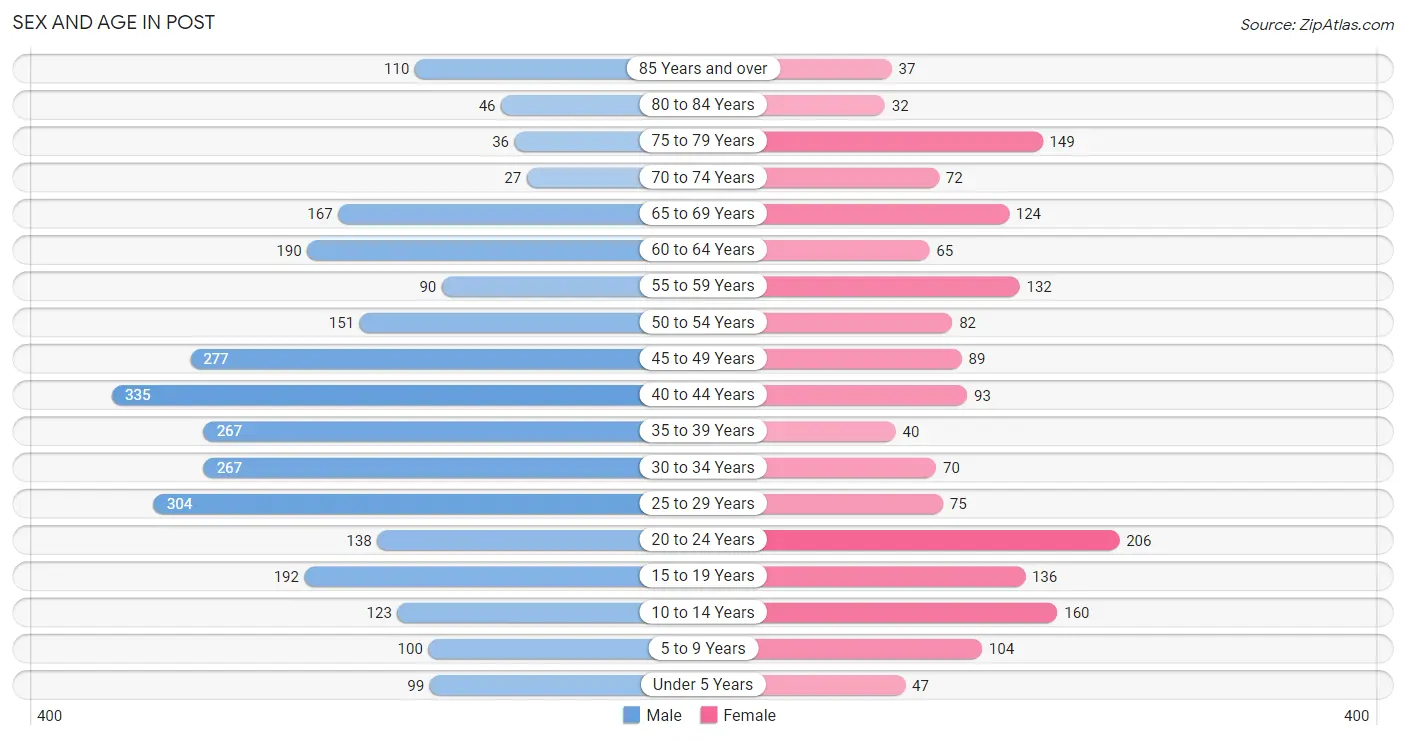
| Age Bracket | Male | Female |
| Under 5 Years | 99 (3.4%) | 47 (2.7%) |
| 5 to 9 Years | 100 (3.4%) | 104 (6.1%) |
| 10 to 14 Years | 123 (4.2%) | 160 (9.3%) |
| 15 to 19 Years | 192 (6.6%) | 136 (7.9%) |
| 20 to 24 Years | 138 (4.7%) | 206 (12.0%) |
| 25 to 29 Years | 304 (10.4%) | 75 (4.4%) |
| 30 to 34 Years | 267 (9.1%) | 70 (4.1%) |
| 35 to 39 Years | 267 (9.1%) | 40 (2.3%) |
| 40 to 44 Years | 335 (11.5%) | 93 (5.4%) |
| 45 to 49 Years | 277 (9.5%) | 89 (5.2%) |
| 50 to 54 Years | 151 (5.2%) | 82 (4.8%) |
| 55 to 59 Years | 90 (3.1%) | 132 (7.7%) |
| 60 to 64 Years | 190 (6.5%) | 65 (3.8%) |
| 65 to 69 Years | 167 (5.7%) | 124 (7.2%) |
| 70 to 74 Years | 27 (0.9%) | 72 (4.2%) |
| 75 to 79 Years | 36 (1.2%) | 149 (8.7%) |
| 80 to 84 Years | 46 (1.6%) | 32 (1.9%) |
| 85 Years and over | 110 (3.8%) | 37 (2.2%) |
| Total | 2,919 (100.0%) | 1,713 (100.0%) |
Families and Households in Post
Median Family Size in Post
The median family size in Post is 3.26 persons per family, with single male/father families (14 | 1.7%) accounting for the largest median family size of 4.07 persons per family. On the other hand, married-couple families (662 | 81.8%) represent the smallest median family size with 3.18 persons per family.
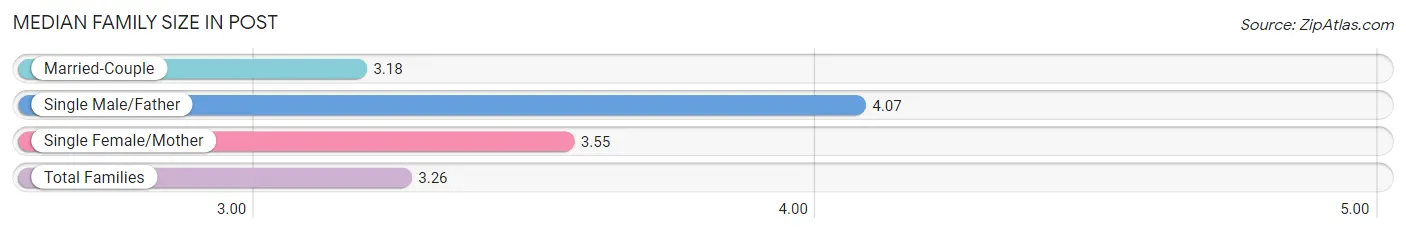
| Family Type | # Families | Family Size |
| Married-Couple | 662 (81.8%) | 3.18 |
| Single Male/Father | 14 (1.7%) | 4.07 |
| Single Female/Mother | 133 (16.4%) | 3.55 |
| Total Families | 809 (100.0%) | 3.26 |
Median Household Size in Post
The median household size in Post is 2.68 persons per household, with single male/father households (14 | 1.2%) accounting for the largest median household size of 4.07 persons per household. non-family households (403 | 33.3%) represent the smallest median household size with 1.21 persons per household.
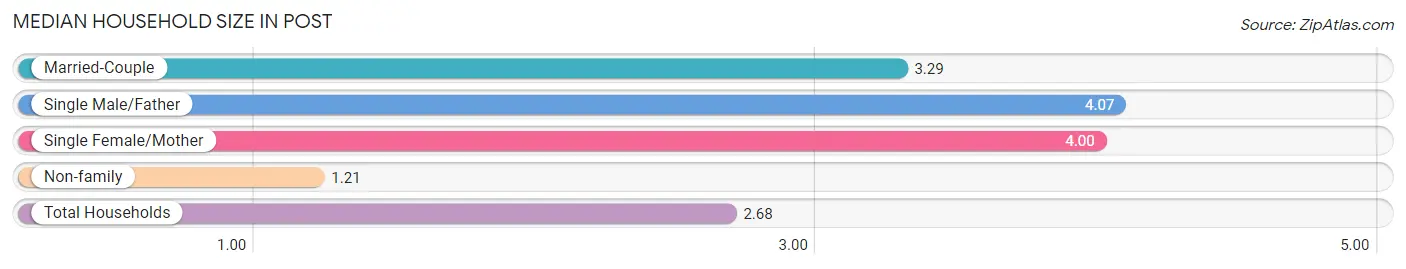
| Household Type | # Households | Household Size |
| Married-Couple | 662 (54.6%) | 3.29 |
| Single Male/Father | 14 (1.2%) | 4.07 |
| Single Female/Mother | 133 (11.0%) | 4.00 |
| Non-family | 403 (33.3%) | 1.21 |
| Total Households | 1,212 (100.0%) | 2.68 |
Household Size by Marriage Status in Post
Out of a total of 1,212 households in Post, 809 (66.7%) are family households, while 403 (33.3%) are nonfamily households. The most numerous type of family households are 2-person households, comprising 403, and the most common type of nonfamily households are 1-person households, comprising 333.
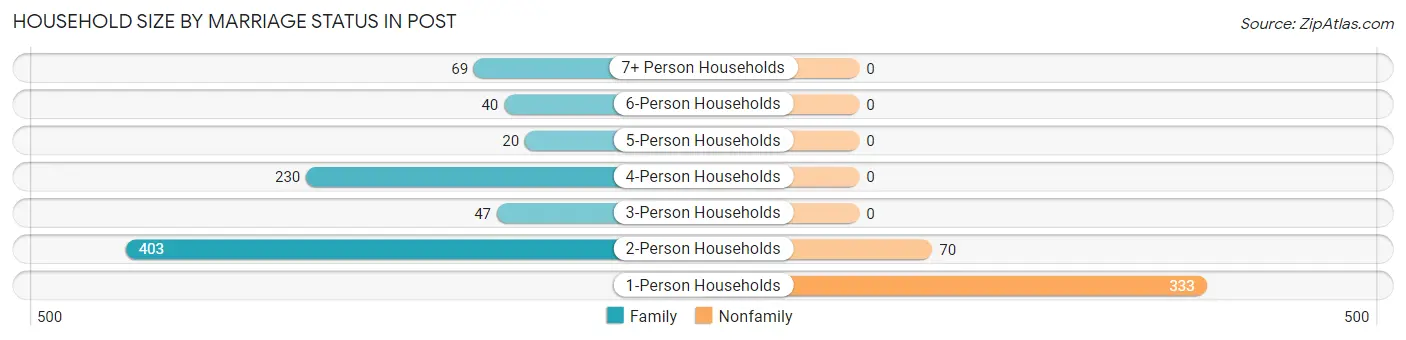
| Household Size | Family Households | Nonfamily Households |
| 1-Person Households | - | 333 (27.5%) |
| 2-Person Households | 403 (33.3%) | 70 (5.8%) |
| 3-Person Households | 47 (3.9%) | 0 (0.0%) |
| 4-Person Households | 230 (19.0%) | 0 (0.0%) |
| 5-Person Households | 20 (1.7%) | 0 (0.0%) |
| 6-Person Households | 40 (3.3%) | 0 (0.0%) |
| 7+ Person Households | 69 (5.7%) | 0 (0.0%) |
| Total | 809 (66.7%) | 403 (33.3%) |
Female Fertility in Post
Fertility by Age in Post
| Age Bracket | Women with Births | Births / 1,000 Women |
| 15 to 19 years | 0 (0.0%) | 0.0 |
| 20 to 34 years | 0 (0.0%) | 0.0 |
| 35 to 50 years | 0 (0.0%) | 0.0 |
| Total | 0 (0.0%) | 0.0 |
Fertility by Age by Marriage Status in Post
| Age Bracket | Married | Unmarried |
| 15 to 19 years | 0 (0.0%) | 0 (0.0%) |
| 20 to 34 years | 0 (0.0%) | 0 (0.0%) |
| 35 to 50 years | 0 (0.0%) | 0 (0.0%) |
| Total | 0 (0.0%) | 0 (0.0%) |
Fertility by Education in Post

| Educational Attainment | Women with Births | Births / 1,000 Women |
| Less than High School | 0 (0.0%) | 0.0 |
| High School Diploma | 0 (0.0%) | 0.0 |
| College or Associate's Degree | 0 (0.0%) | 0.0 |
| Bachelor's Degree | 0 (0.0%) | 0.0 |
| Graduate Degree | 0 (0.0%) | 0.0 |
| Total | 0 (0.0%) | 0.0 |
Fertility by Education by Marriage Status in Post
| Educational Attainment | Married | Unmarried |
| Less than High School | 0 (0.0%) | 0 (0.0%) |
| High School Diploma | 0 (0.0%) | 0 (0.0%) |
| College or Associate's Degree | 0 (0.0%) | 0 (0.0%) |
| Bachelor's Degree | 0 (0.0%) | 0 (0.0%) |
| Graduate Degree | 0 (0.0%) | 0 (0.0%) |
| Total | 0 (0.0%) | 0 (0.0%) |
Employment Characteristics in Post
Employment by Class of Employer in Post
Among the 1,083 employed individuals in Post, private company employees (600 | 55.4%), local government employees (125 | 11.5%), and self-employed (not incorporated) (91 | 8.4%) make up the most common classes of employment.
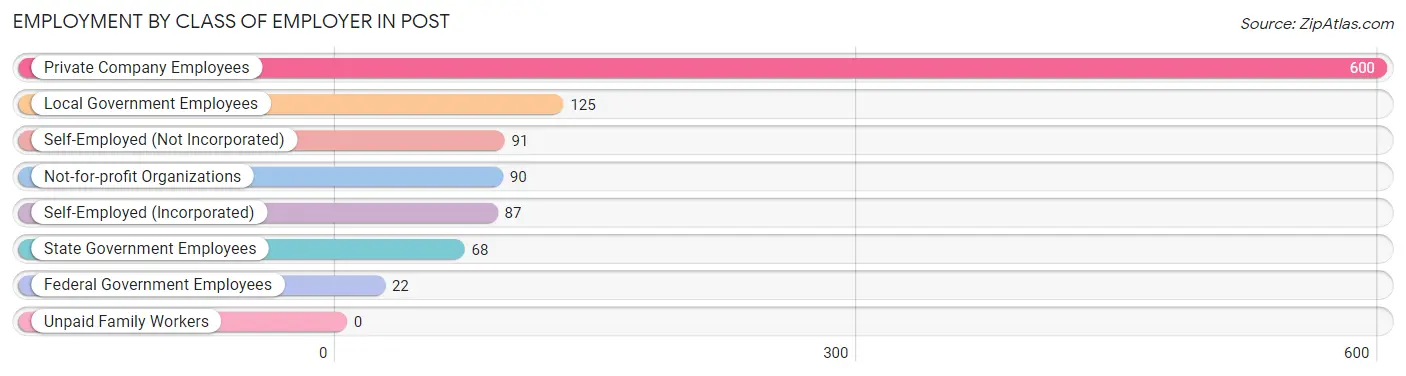
| Employer Class | # Employees | % Employees |
| Private Company Employees | 600 | 55.4% |
| Self-Employed (Incorporated) | 87 | 8.0% |
| Self-Employed (Not Incorporated) | 91 | 8.4% |
| Not-for-profit Organizations | 90 | 8.3% |
| Local Government Employees | 125 | 11.5% |
| State Government Employees | 68 | 6.3% |
| Federal Government Employees | 22 | 2.0% |
| Unpaid Family Workers | 0 | 0.0% |
| Total | 1,083 | 100.0% |
Employment Status by Age in Post
According to the labor force statistics for Post, out of the total population over 16 years of age (3,930), 30.4% or 1,195 individuals are in the labor force, with 5.8% or 69 of them unemployed. The age group with the highest labor force participation rate is 30 to 34 years, with 65.6% or 221 individuals in the labor force. Within the labor force, the 25 to 29 years age range has the highest percentage of unemployed individuals, with 24.2% or 44 of them being unemployed.
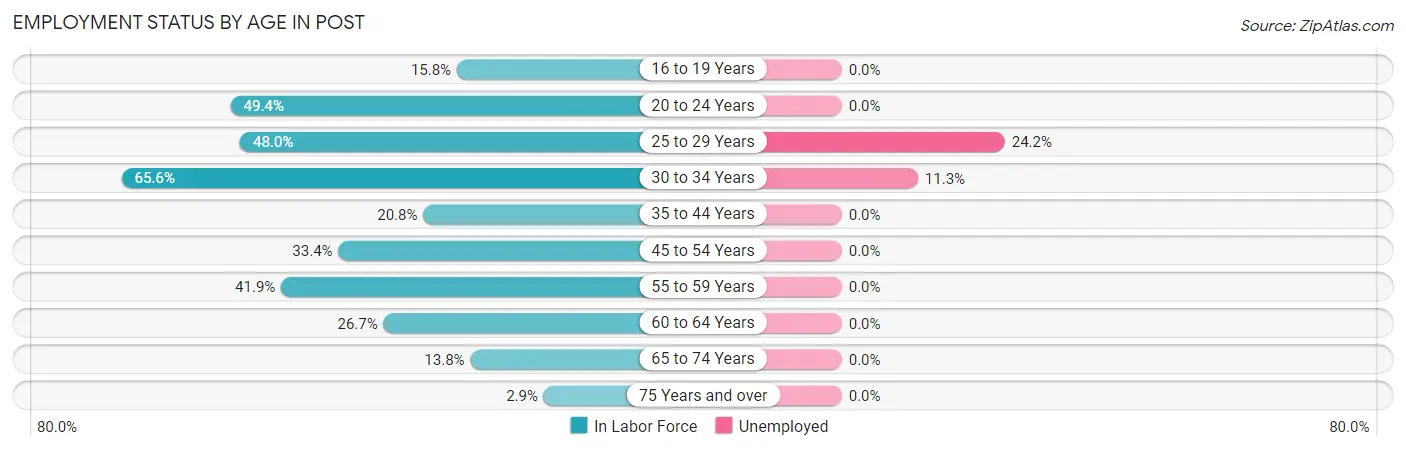
| Age Bracket | In Labor Force | Unemployed |
| 16 to 19 Years | 41 (15.8%) | 0 (0.0%) |
| 20 to 24 Years | 170 (49.4%) | 0 (0.0%) |
| 25 to 29 Years | 182 (48.0%) | 44 (24.2%) |
| 30 to 34 Years | 221 (65.6%) | 25 (11.3%) |
| 35 to 44 Years | 153 (20.8%) | 0 (0.0%) |
| 45 to 54 Years | 200 (33.4%) | 0 (0.0%) |
| 55 to 59 Years | 93 (41.9%) | 0 (0.0%) |
| 60 to 64 Years | 68 (26.7%) | 0 (0.0%) |
| 65 to 74 Years | 54 (13.8%) | 0 (0.0%) |
| 75 Years and over | 12 (2.9%) | 0 (0.0%) |
| Total | 1,195 (30.4%) | 69 (5.8%) |
Employment Status by Educational Attainment in Post
According to labor force statistics for Post, 36.3% of individuals (917) out of the total population between 25 and 64 years of age (2,527) are in the labor force, with 7.5% or 69 of them being unemployed. The group with the highest labor force participation rate are those with the educational attainment of bachelor's degree or higher, with 67.0% or 177 individuals in the labor force. Within the labor force, individuals with less than high school education have the highest percentage of unemployment, with 12.1% or 25 of them being unemployed.
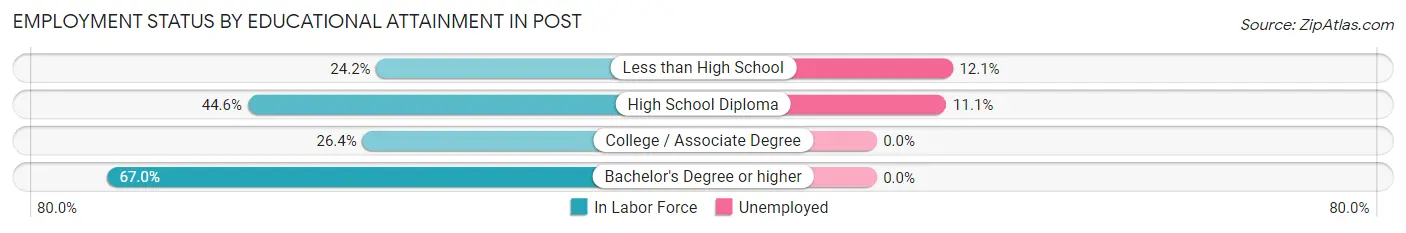
| Educational Attainment | In Labor Force | Unemployed |
| Less than High School | 206 (24.2%) | 103 (12.1%) |
| High School Diploma | 396 (44.6%) | 99 (11.1%) |
| College / Associate Degree | 138 (26.4%) | 0 (0.0%) |
| Bachelor's Degree or higher | 177 (67.0%) | 0 (0.0%) |
| Total | 917 (36.3%) | 190 (7.5%) |
Employment Occupations by Sex in Post
Management, Business, Science and Arts Occupations
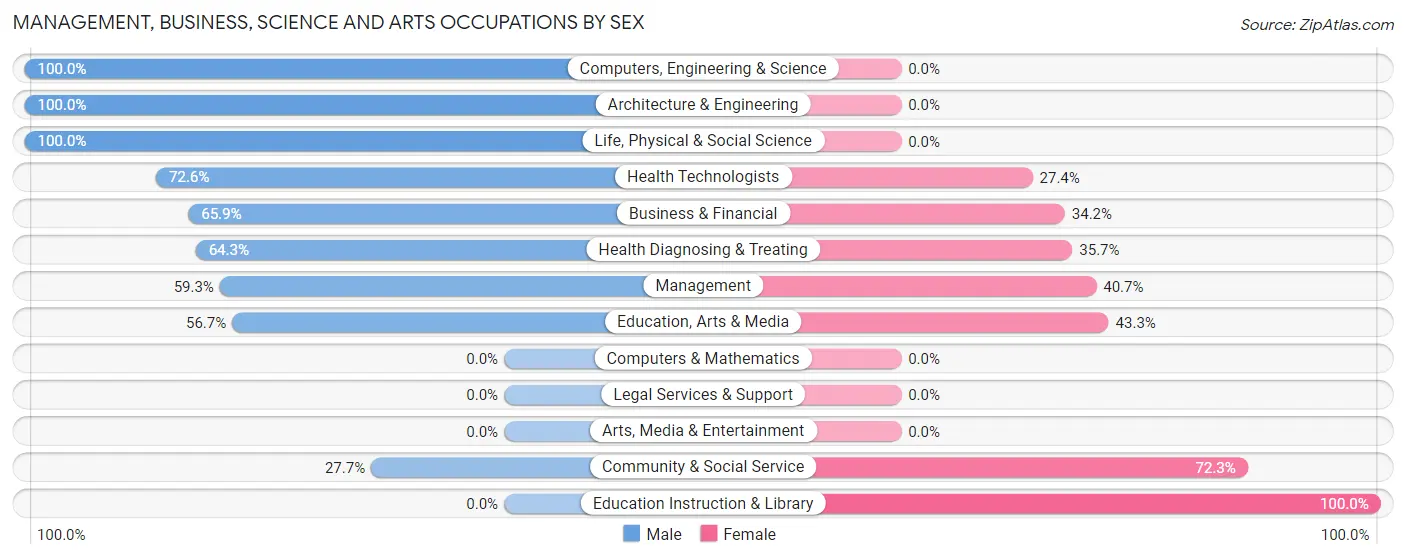
The most common Management, Business, Science and Arts occupations in Post are Community & Social Service (137 | 12.2%), Management (86 | 7.6%), Education Instruction & Library (70 | 6.2%), Health Diagnosing & Treating (70 | 6.2%), and Education, Arts & Media (67 | 6.0%).
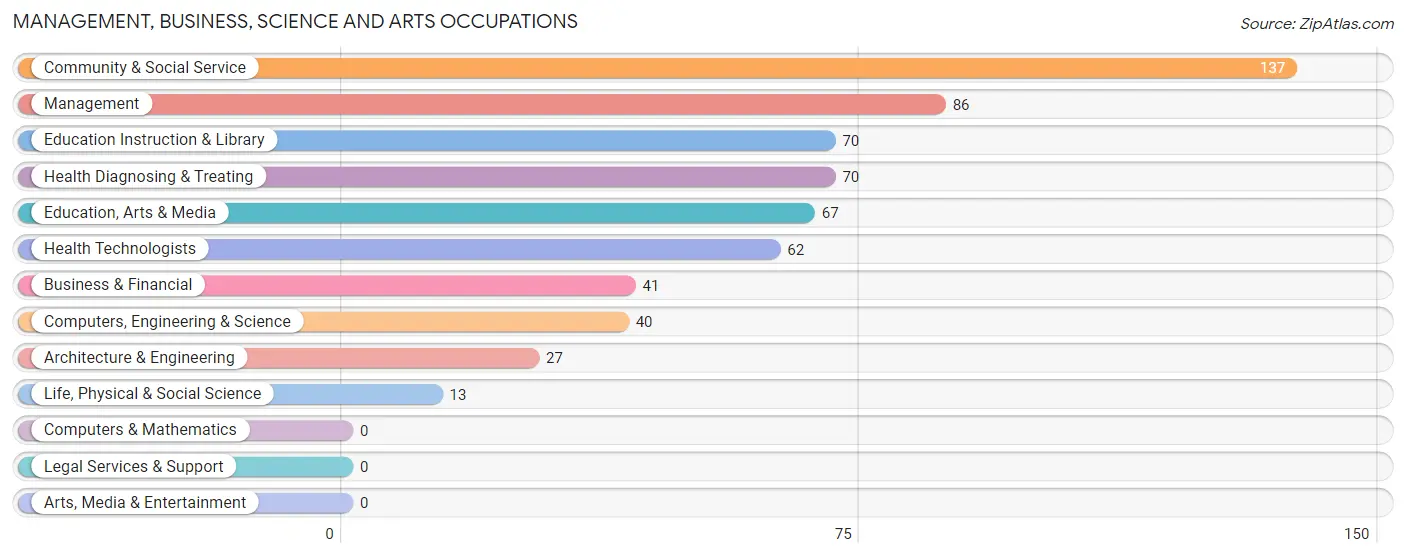
Management, Business, Science and Arts Occupations by Sex
Within the Management, Business, Science and Arts occupations in Post, the most male-oriented occupations are Computers, Engineering & Science (100.0%), Architecture & Engineering (100.0%), and Life, Physical & Social Science (100.0%), while the most female-oriented occupations are Education Instruction & Library (100.0%), Community & Social Service (72.3%), and Education, Arts & Media (43.3%).
| Occupation | Male | Female |
| Management | 51 (59.3%) | 35 (40.7%) |
| Business & Financial | 27 (65.8%) | 14 (34.2%) |
| Computers, Engineering & Science | 40 (100.0%) | 0 (0.0%) |
| Computers & Mathematics | 0 (0.0%) | 0 (0.0%) |
| Architecture & Engineering | 27 (100.0%) | 0 (0.0%) |
| Life, Physical & Social Science | 13 (100.0%) | 0 (0.0%) |
| Community & Social Service | 38 (27.7%) | 99 (72.3%) |
| Education, Arts & Media | 38 (56.7%) | 29 (43.3%) |
| Legal Services & Support | 0 (0.0%) | 0 (0.0%) |
| Education Instruction & Library | 0 (0.0%) | 70 (100.0%) |
| Arts, Media & Entertainment | 0 (0.0%) | 0 (0.0%) |
| Health Diagnosing & Treating | 45 (64.3%) | 25 (35.7%) |
| Health Technologists | 45 (72.6%) | 17 (27.4%) |
| Total (Category) | 201 (53.7%) | 173 (46.3%) |
| Total (Overall) | 622 (55.3%) | 503 (44.7%) |
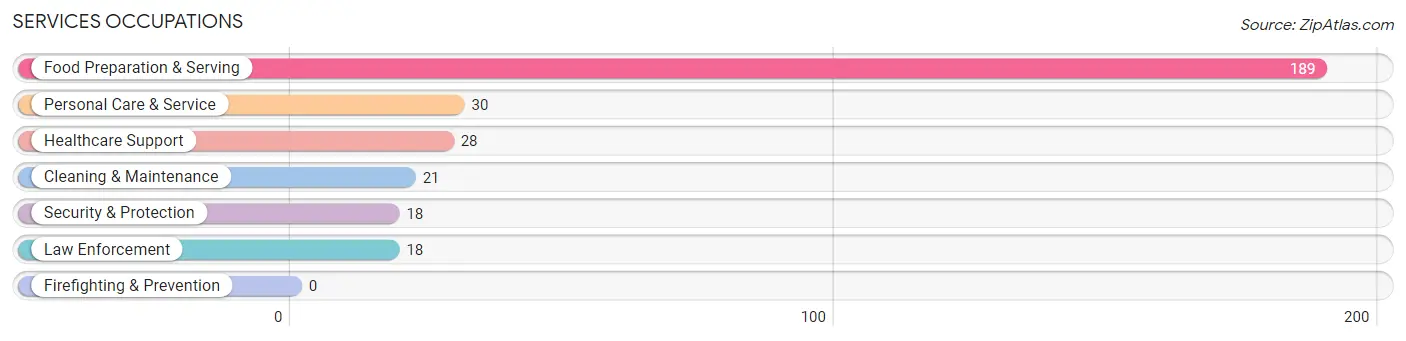
Services Occupations
The most common Services occupations in Post are Food Preparation & Serving (189 | 16.8%), Personal Care & Service (30 | 2.7%), Healthcare Support (28 | 2.5%), Cleaning & Maintenance (21 | 1.9%), and Security & Protection (18 | 1.6%).
Services Occupations by Sex
Within the Services occupations in Post, the most male-oriented occupations are Security & Protection (100.0%), Law Enforcement (100.0%), and Food Preparation & Serving (68.2%), while the most female-oriented occupations are Healthcare Support (100.0%), Cleaning & Maintenance (100.0%), and Personal Care & Service (100.0%).
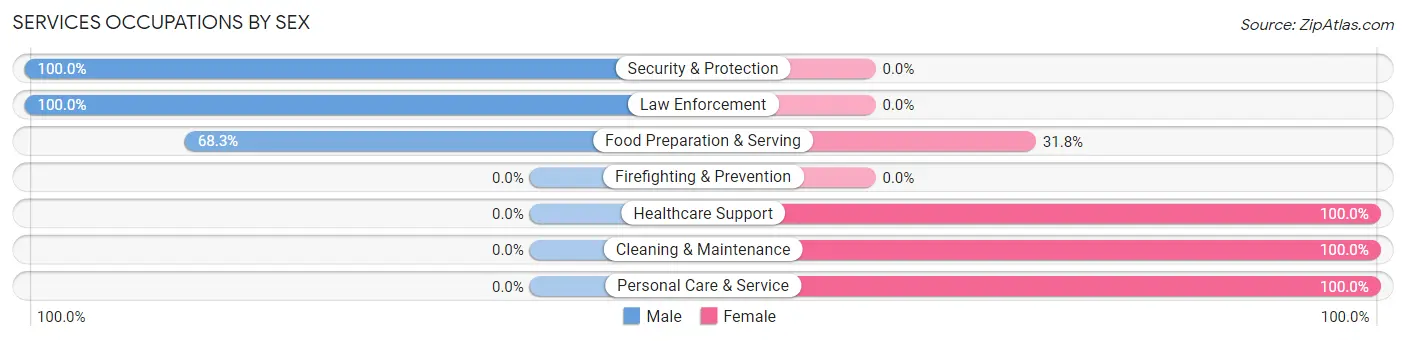
| Occupation | Male | Female |
| Healthcare Support | 0 (0.0%) | 28 (100.0%) |
| Security & Protection | 18 (100.0%) | 0 (0.0%) |
| Firefighting & Prevention | 0 (0.0%) | 0 (0.0%) |
| Law Enforcement | 18 (100.0%) | 0 (0.0%) |
| Food Preparation & Serving | 129 (68.2%) | 60 (31.8%) |
| Cleaning & Maintenance | 0 (0.0%) | 21 (100.0%) |
| Personal Care & Service | 0 (0.0%) | 30 (100.0%) |
| Total (Category) | 147 (51.4%) | 139 (48.6%) |
| Total (Overall) | 622 (55.3%) | 503 (44.7%) |
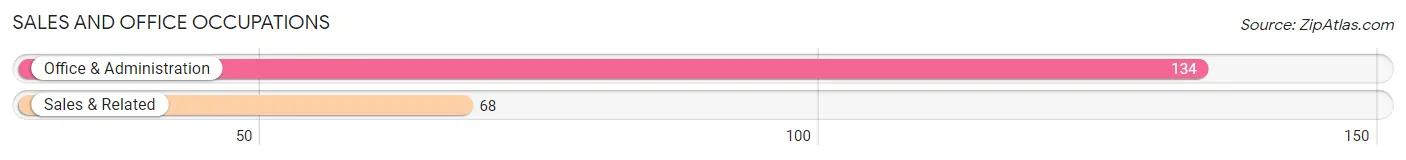
Sales and Office Occupations
The most common Sales and Office occupations in Post are Office & Administration (134 | 11.9%), and Sales & Related (68 | 6.0%).
Sales and Office Occupations by Sex

| Occupation | Male | Female |
| Sales & Related | 25 (36.8%) | 43 (63.2%) |
| Office & Administration | 22 (16.4%) | 112 (83.6%) |
| Total (Category) | 47 (23.3%) | 155 (76.7%) |
| Total (Overall) | 622 (55.3%) | 503 (44.7%) |
Natural Resources, Construction and Maintenance Occupations
The most common Natural Resources, Construction and Maintenance occupations in Post are , and Construction & Extraction (81 | 7.2%).
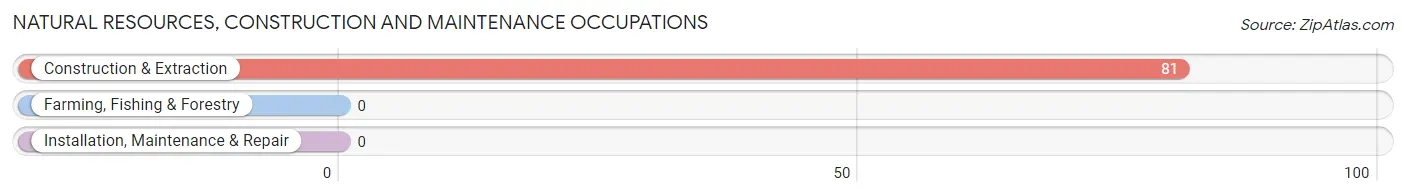
Natural Resources, Construction and Maintenance Occupations by Sex
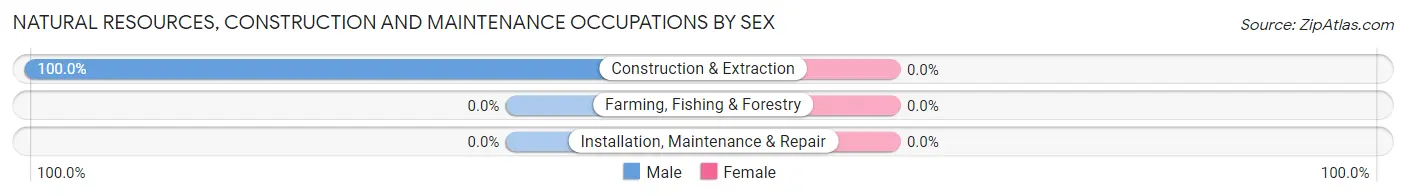
| Occupation | Male | Female |
| Farming, Fishing & Forestry | 0 (0.0%) | 0 (0.0%) |
| Construction & Extraction | 81 (100.0%) | 0 (0.0%) |
| Installation, Maintenance & Repair | 0 (0.0%) | 0 (0.0%) |
| Total (Category) | 81 (100.0%) | 0 (0.0%) |
| Total (Overall) | 622 (55.3%) | 503 (44.7%) |
Production, Transportation and Moving Occupations
The most common Production, Transportation and Moving occupations in Post are Production (79 | 7.0%), Transportation (75 | 6.7%), and Material Moving (28 | 2.5%).
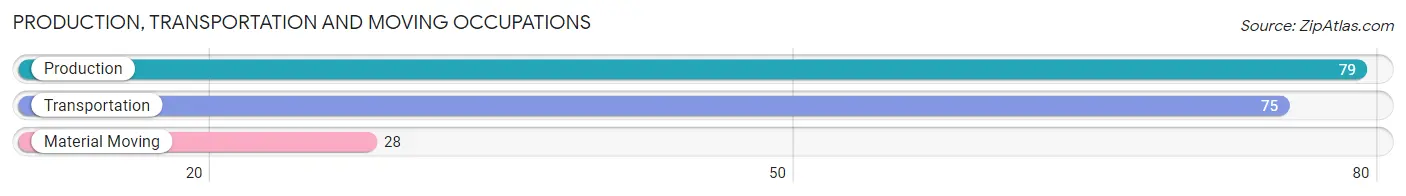
Production, Transportation and Moving Occupations by Sex
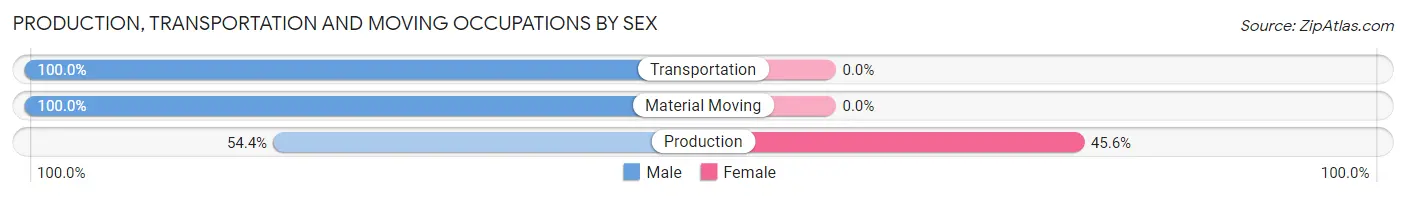
| Occupation | Male | Female |
| Production | 43 (54.4%) | 36 (45.6%) |
| Transportation | 75 (100.0%) | 0 (0.0%) |
| Material Moving | 28 (100.0%) | 0 (0.0%) |
| Total (Category) | 146 (80.2%) | 36 (19.8%) |
| Total (Overall) | 622 (55.3%) | 503 (44.7%) |
Employment Industries by Sex in Post
Employment Industries in Post
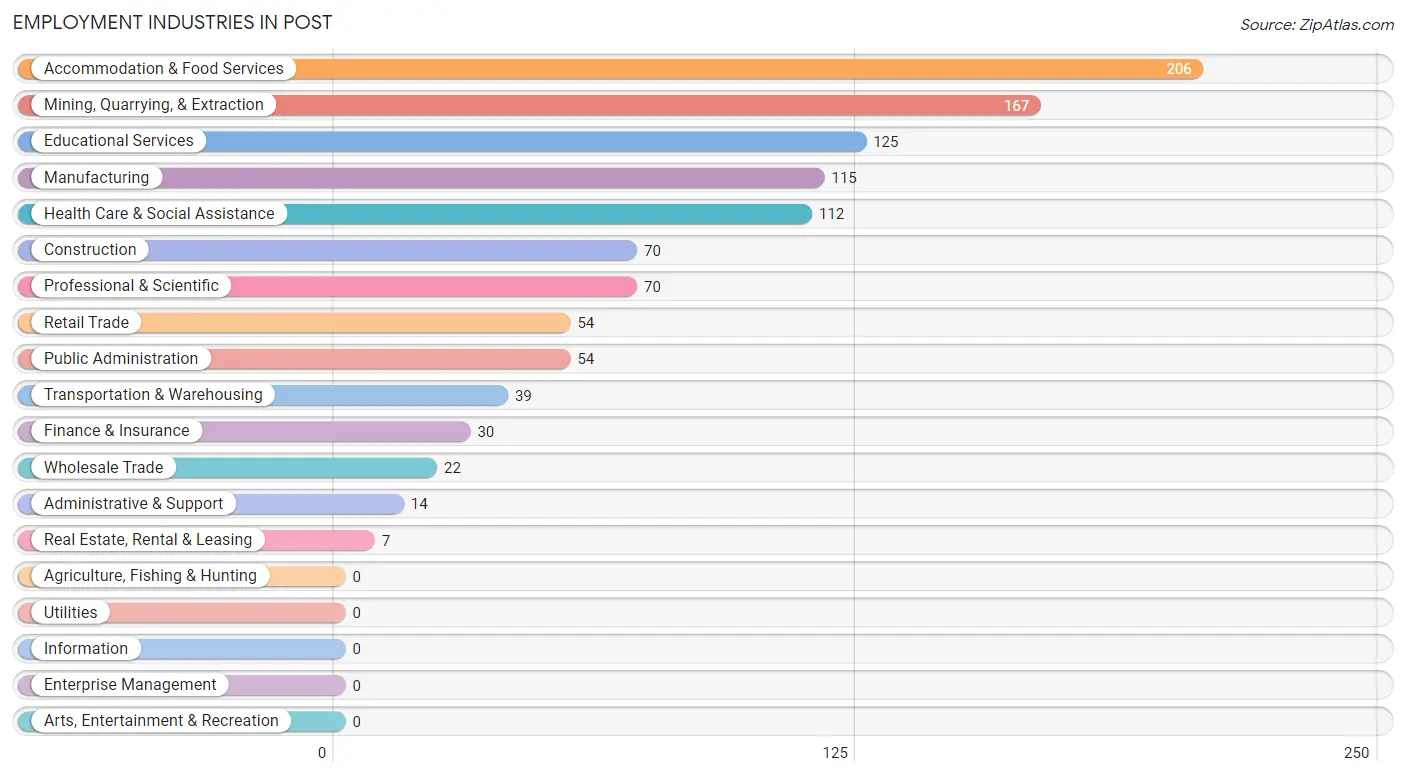
The major employment industries in Post include Accommodation & Food Services (206 | 18.3%), Mining, Quarrying, & Extraction (167 | 14.8%), Educational Services (125 | 11.1%), Manufacturing (115 | 10.2%), and Health Care & Social Assistance (112 | 10.0%).
Employment Industries by Sex in Post
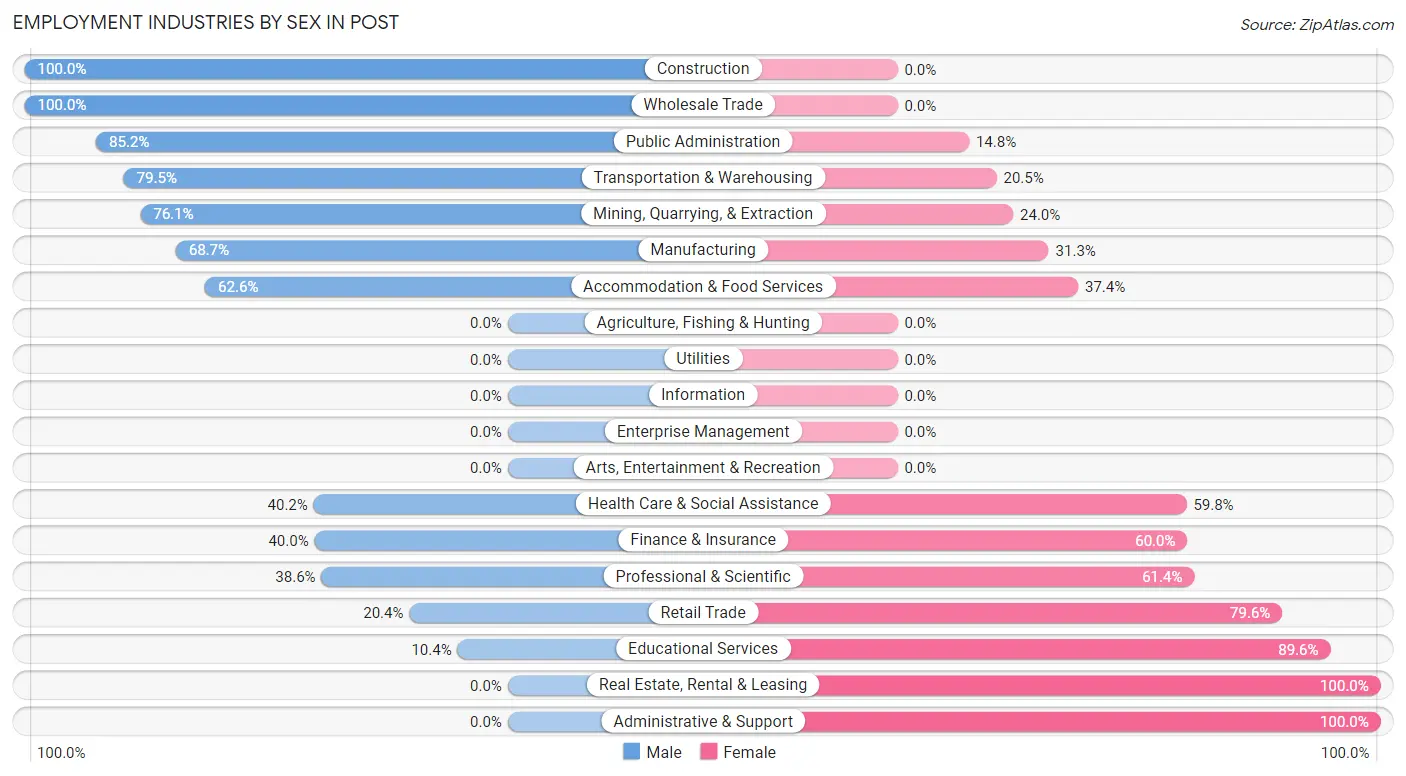
The Post industries that see more men than women are Construction (100.0%), Wholesale Trade (100.0%), and Public Administration (85.2%), whereas the industries that tend to have a higher number of women are Real Estate, Rental & Leasing (100.0%), Administrative & Support (100.0%), and Educational Services (89.6%).
| Industry | Male | Female |
| Agriculture, Fishing & Hunting | 0 (0.0%) | 0 (0.0%) |
| Mining, Quarrying, & Extraction | 127 (76.0%) | 40 (23.9%) |
| Construction | 70 (100.0%) | 0 (0.0%) |
| Manufacturing | 79 (68.7%) | 36 (31.3%) |
| Wholesale Trade | 22 (100.0%) | 0 (0.0%) |
| Retail Trade | 11 (20.4%) | 43 (79.6%) |
| Transportation & Warehousing | 31 (79.5%) | 8 (20.5%) |
| Utilities | 0 (0.0%) | 0 (0.0%) |
| Information | 0 (0.0%) | 0 (0.0%) |
| Finance & Insurance | 12 (40.0%) | 18 (60.0%) |
| Real Estate, Rental & Leasing | 0 (0.0%) | 7 (100.0%) |
| Professional & Scientific | 27 (38.6%) | 43 (61.4%) |
| Enterprise Management | 0 (0.0%) | 0 (0.0%) |
| Administrative & Support | 0 (0.0%) | 14 (100.0%) |
| Educational Services | 13 (10.4%) | 112 (89.6%) |
| Health Care & Social Assistance | 45 (40.2%) | 67 (59.8%) |
| Arts, Entertainment & Recreation | 0 (0.0%) | 0 (0.0%) |
| Accommodation & Food Services | 129 (62.6%) | 77 (37.4%) |
| Public Administration | 46 (85.2%) | 8 (14.8%) |
| Total | 622 (55.3%) | 503 (44.7%) |
Education in Post
School Enrollment in Post
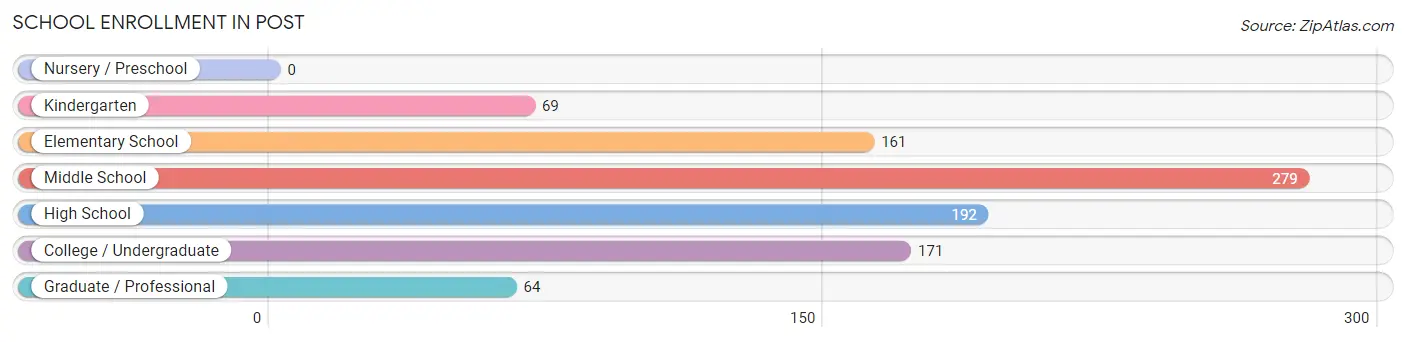
The most common levels of schooling among the 936 students in Post are middle school (279 | 29.8%), high school (192 | 20.5%), and college / undergraduate (171 | 18.3%).
| School Level | # Students | % Students |
| Nursery / Preschool | 0 | 0.0% |
| Kindergarten | 69 | 7.4% |
| Elementary School | 161 | 17.2% |
| Middle School | 279 | 29.8% |
| High School | 192 | 20.5% |
| College / Undergraduate | 171 | 18.3% |
| Graduate / Professional | 64 | 6.8% |
| Total | 936 | 100.0% |
School Enrollment by Age by Funding Source in Post
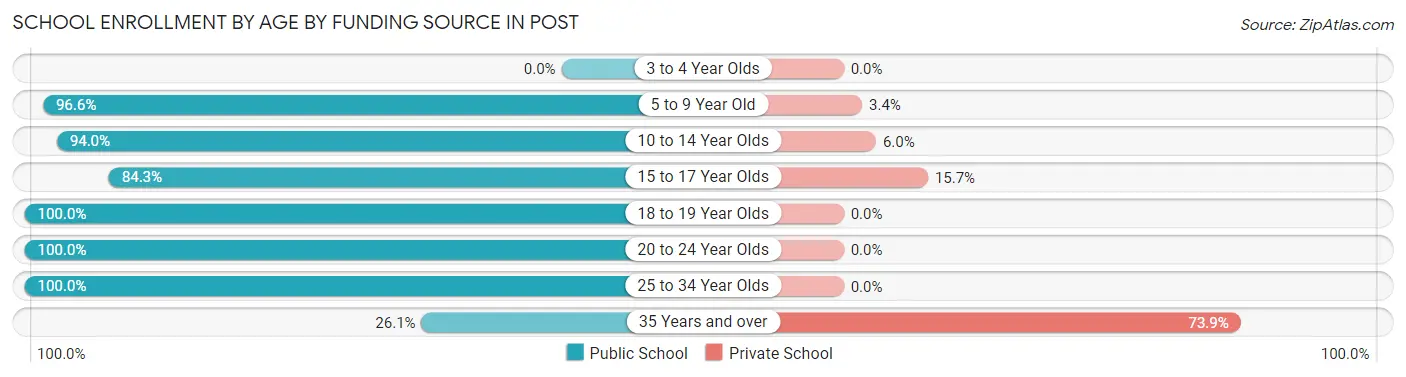
Out of a total of 936 students who are enrolled in schools in Post, 68 (7.3%) attend a private institution, while the remaining 868 (92.7%) are enrolled in public schools. The age group of 35 years and over has the highest likelihood of being enrolled in private schools, with 17 (73.9% in the age bracket) enrolled. Conversely, the age group of 18 to 19 year olds has the lowest likelihood of being enrolled in a private school, with 74 (100.0% in the age bracket) attending a public institution.
| Age Bracket | Public School | Private School |
| 3 to 4 Year Olds | 0 (0.0%) | 0 (0.0%) |
| 5 to 9 Year Old | 197 (96.6%) | 7 (3.4%) |
| 10 to 14 Year Olds | 266 (94.0%) | 17 (6.0%) |
| 15 to 17 Year Olds | 145 (84.3%) | 27 (15.7%) |
| 18 to 19 Year Olds | 74 (100.0%) | 0 (0.0%) |
| 20 to 24 Year Olds | 168 (100.0%) | 0 (0.0%) |
| 25 to 34 Year Olds | 12 (100.0%) | 0 (0.0%) |
| 35 Years and over | 6 (26.1%) | 17 (73.9%) |
| Total | 868 (92.7%) | 68 (7.3%) |
Educational Attainment by Field of Study in Post
Arts & humanities (65 | 16.3%), business (62 | 15.5%), communications (56 | 14.0%), science & technology (43 | 10.8%), and bio, nature & agricultural (42 | 10.5%) are the most common fields of study among 399 individuals in Post who have obtained a bachelor's degree or higher.
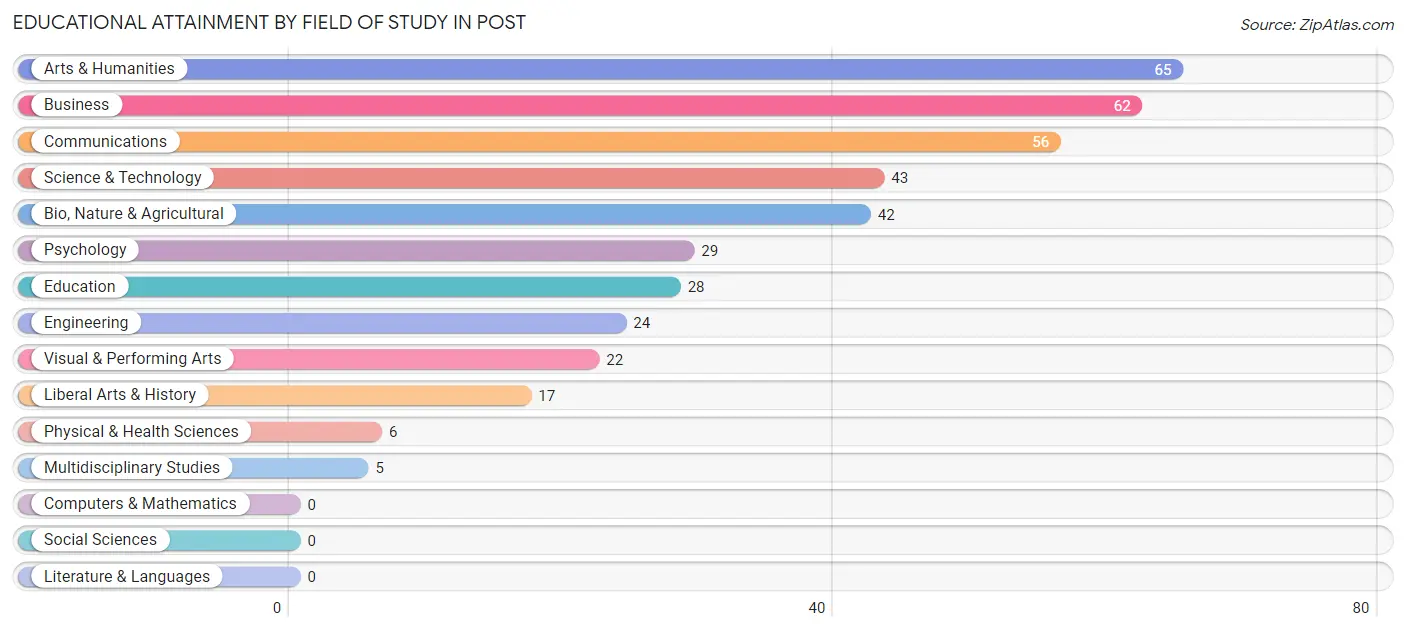
| Field of Study | # Graduates | % Graduates |
| Computers & Mathematics | 0 | 0.0% |
| Bio, Nature & Agricultural | 42 | 10.5% |
| Physical & Health Sciences | 6 | 1.5% |
| Psychology | 29 | 7.3% |
| Social Sciences | 0 | 0.0% |
| Engineering | 24 | 6.0% |
| Multidisciplinary Studies | 5 | 1.3% |
| Science & Technology | 43 | 10.8% |
| Business | 62 | 15.5% |
| Education | 28 | 7.0% |
| Literature & Languages | 0 | 0.0% |
| Liberal Arts & History | 17 | 4.3% |
| Visual & Performing Arts | 22 | 5.5% |
| Communications | 56 | 14.0% |
| Arts & Humanities | 65 | 16.3% |
| Total | 399 | 100.0% |
Transportation & Commute in Post
Vehicle Availability by Sex in Post
The most prevalent vehicle ownership categories in Post are males with 2 vehicles (271, accounting for 43.6%) and females with 2 vehicles (242, making up 58.8%).
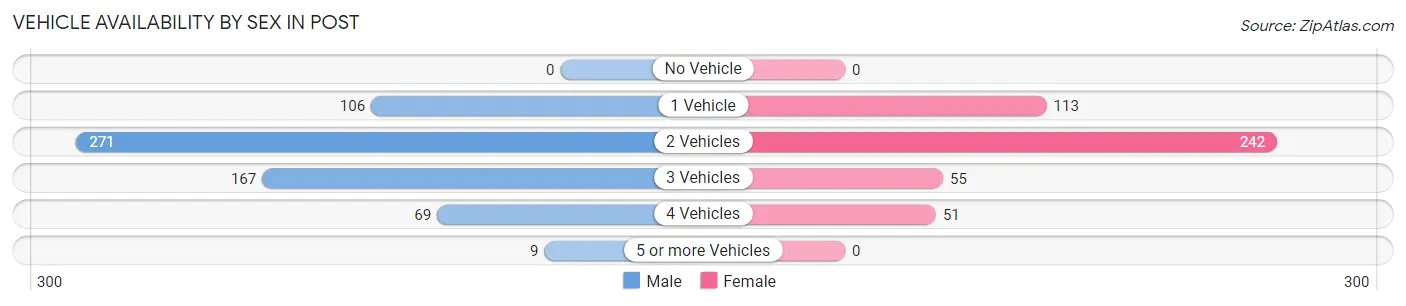
| Vehicles Available | Male | Female |
| No Vehicle | 0 (0.0%) | 0 (0.0%) |
| 1 Vehicle | 106 (17.0%) | 113 (24.5%) |
| 2 Vehicles | 271 (43.6%) | 242 (52.5%) |
| 3 Vehicles | 167 (26.9%) | 55 (11.9%) |
| 4 Vehicles | 69 (11.1%) | 51 (11.1%) |
| 5 or more Vehicles | 9 (1.5%) | 0 (0.0%) |
| Total | 622 (100.0%) | 461 (100.0%) |
Commute Time in Post
The most frequently occuring commute durations in Post are less than 5 minutes (422 commuters, 39.0%), 5 to 9 minutes (287 commuters, 26.5%), and 45 to 59 minutes (173 commuters, 16.0%).
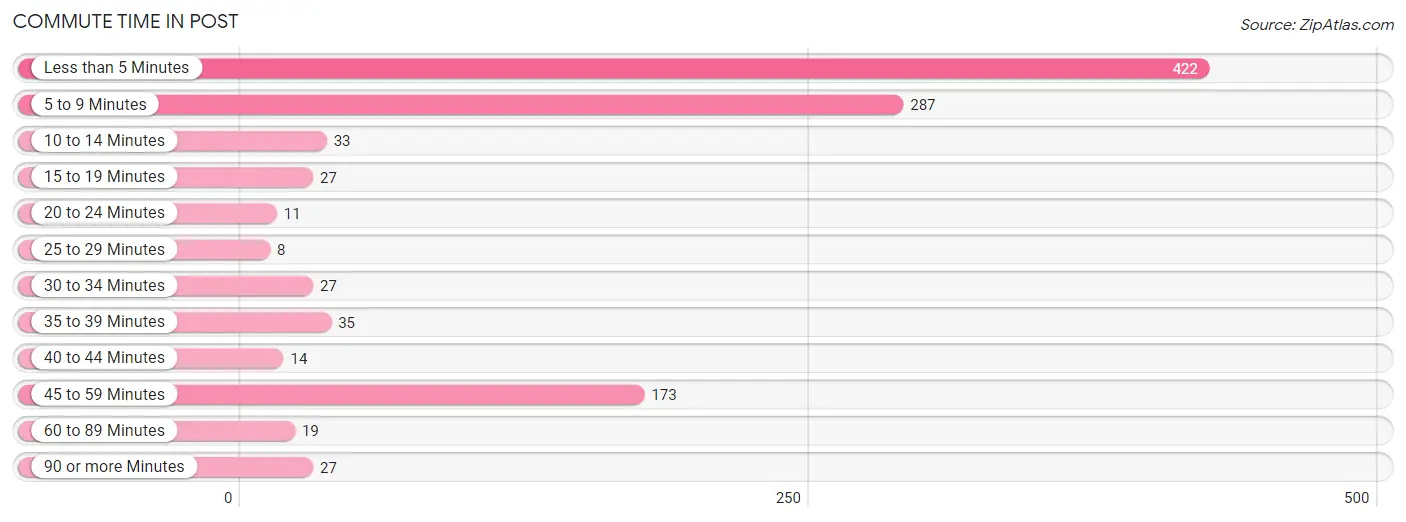
| Commute Time | # Commuters | % Commuters |
| Less than 5 Minutes | 422 | 39.0% |
| 5 to 9 Minutes | 287 | 26.5% |
| 10 to 14 Minutes | 33 | 3.0% |
| 15 to 19 Minutes | 27 | 2.5% |
| 20 to 24 Minutes | 11 | 1.0% |
| 25 to 29 Minutes | 8 | 0.7% |
| 30 to 34 Minutes | 27 | 2.5% |
| 35 to 39 Minutes | 35 | 3.2% |
| 40 to 44 Minutes | 14 | 1.3% |
| 45 to 59 Minutes | 173 | 16.0% |
| 60 to 89 Minutes | 19 | 1.8% |
| 90 or more Minutes | 27 | 2.5% |
Commute Time by Sex in Post
The most common commute times in Post are less than 5 minutes (209 commuters, 33.6%) for males and less than 5 minutes (213 commuters, 46.2%) for females.
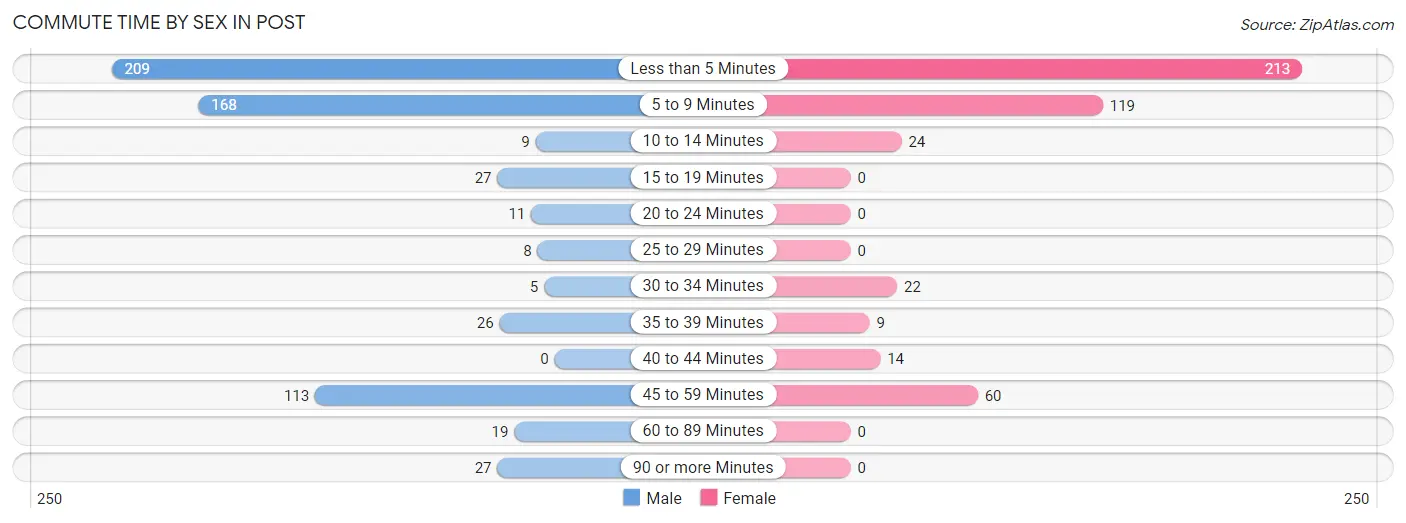
| Commute Time | Male | Female |
| Less than 5 Minutes | 209 (33.6%) | 213 (46.2%) |
| 5 to 9 Minutes | 168 (27.0%) | 119 (25.8%) |
| 10 to 14 Minutes | 9 (1.5%) | 24 (5.2%) |
| 15 to 19 Minutes | 27 (4.3%) | 0 (0.0%) |
| 20 to 24 Minutes | 11 (1.8%) | 0 (0.0%) |
| 25 to 29 Minutes | 8 (1.3%) | 0 (0.0%) |
| 30 to 34 Minutes | 5 (0.8%) | 22 (4.8%) |
| 35 to 39 Minutes | 26 (4.2%) | 9 (1.9%) |
| 40 to 44 Minutes | 0 (0.0%) | 14 (3.0%) |
| 45 to 59 Minutes | 113 (18.2%) | 60 (13.0%) |
| 60 to 89 Minutes | 19 (3.0%) | 0 (0.0%) |
| 90 or more Minutes | 27 (4.3%) | 0 (0.0%) |
Time of Departure to Work by Sex in Post
The most frequent times of departure to work in Post are 4:00 PM to 11:59 PM (159, 25.6%) for males and 8:00 AM to 8:29 AM (80, 17.3%) for females.
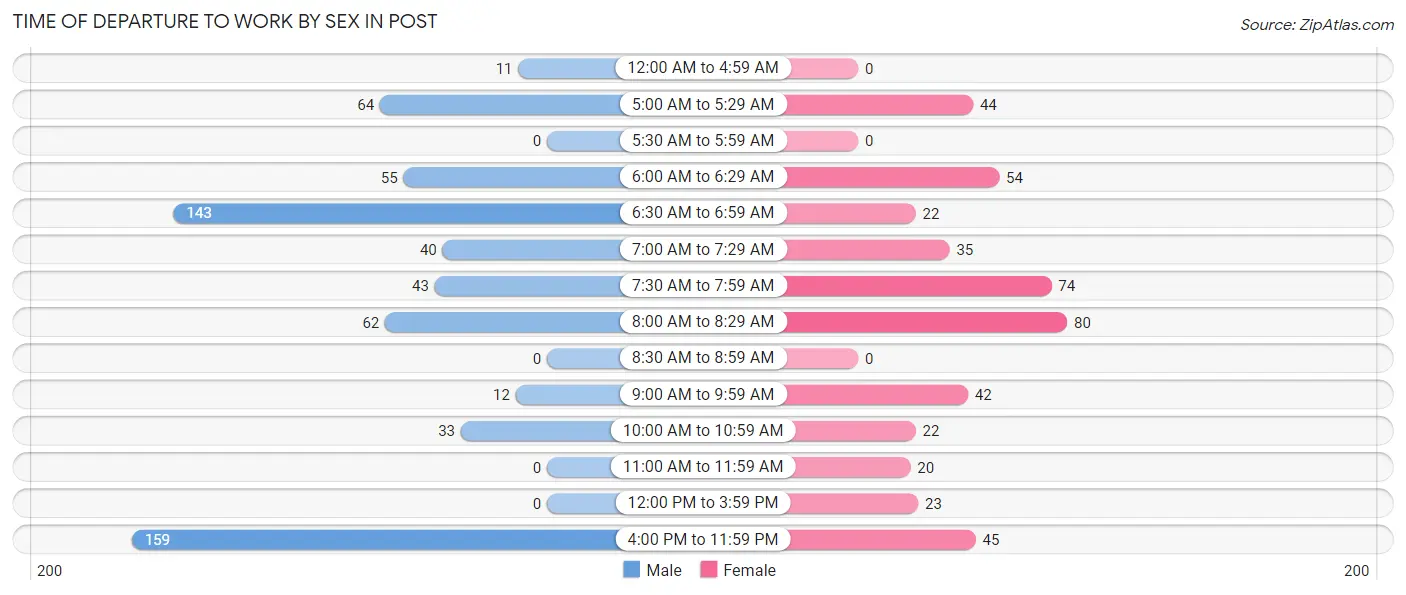
| Time of Departure | Male | Female |
| 12:00 AM to 4:59 AM | 11 (1.8%) | 0 (0.0%) |
| 5:00 AM to 5:29 AM | 64 (10.3%) | 44 (9.5%) |
| 5:30 AM to 5:59 AM | 0 (0.0%) | 0 (0.0%) |
| 6:00 AM to 6:29 AM | 55 (8.8%) | 54 (11.7%) |
| 6:30 AM to 6:59 AM | 143 (23.0%) | 22 (4.8%) |
| 7:00 AM to 7:29 AM | 40 (6.4%) | 35 (7.6%) |
| 7:30 AM to 7:59 AM | 43 (6.9%) | 74 (16.1%) |
| 8:00 AM to 8:29 AM | 62 (10.0%) | 80 (17.3%) |
| 8:30 AM to 8:59 AM | 0 (0.0%) | 0 (0.0%) |
| 9:00 AM to 9:59 AM | 12 (1.9%) | 42 (9.1%) |
| 10:00 AM to 10:59 AM | 33 (5.3%) | 22 (4.8%) |
| 11:00 AM to 11:59 AM | 0 (0.0%) | 20 (4.3%) |
| 12:00 PM to 3:59 PM | 0 (0.0%) | 23 (5.0%) |
| 4:00 PM to 11:59 PM | 159 (25.6%) | 45 (9.8%) |
| Total | 622 (100.0%) | 461 (100.0%) |
Housing Occupancy in Post
Occupancy by Ownership in Post
Of the total 1,212 dwellings in Post, owner-occupied units account for 752 (62.1%), while renter-occupied units make up 460 (38.0%).
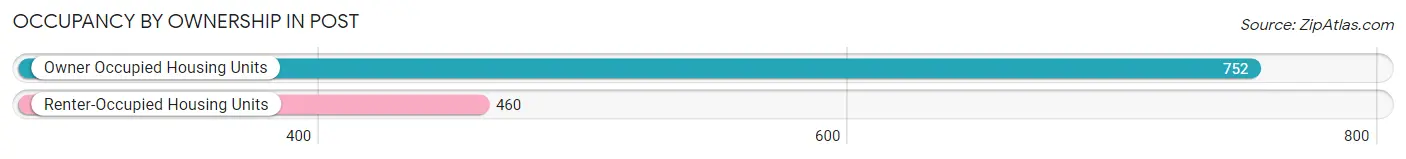
| Occupancy | # Housing Units | % Housing Units |
| Owner Occupied Housing Units | 752 | 62.1% |
| Renter-Occupied Housing Units | 460 | 38.0% |
| Total Occupied Housing Units | 1,212 | 100.0% |
Occupancy by Household Size in Post
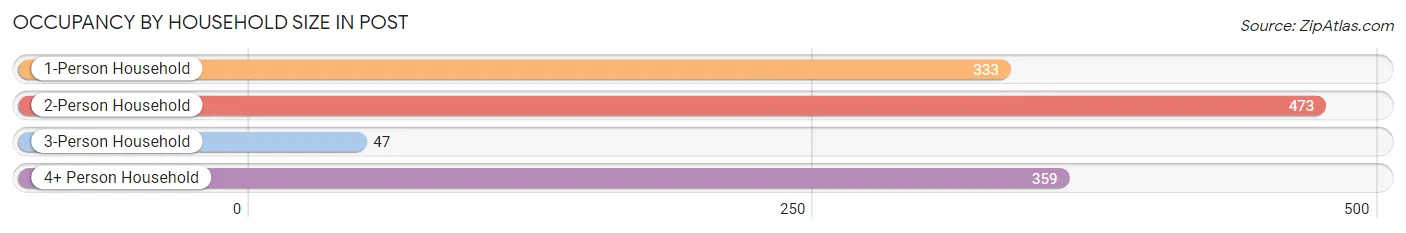
| Household Size | # Housing Units | % Housing Units |
| 1-Person Household | 333 | 27.5% |
| 2-Person Household | 473 | 39.0% |
| 3-Person Household | 47 | 3.9% |
| 4+ Person Household | 359 | 29.6% |
| Total Housing Units | 1,212 | 100.0% |
Occupancy by Ownership by Household Size in Post
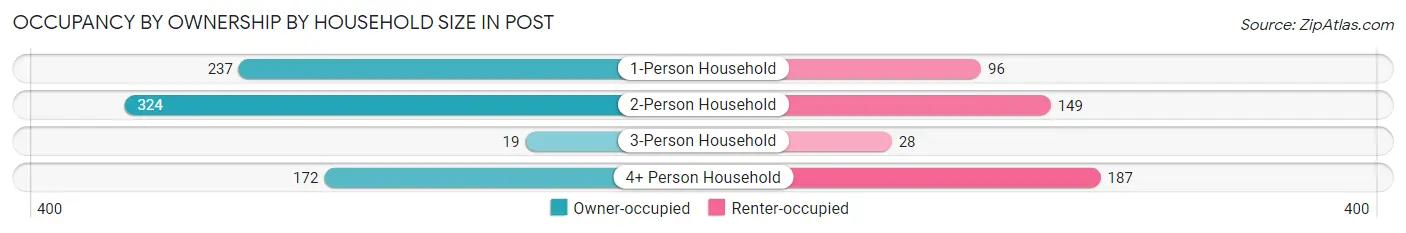
| Household Size | Owner-occupied | Renter-occupied |
| 1-Person Household | 237 (71.2%) | 96 (28.8%) |
| 2-Person Household | 324 (68.5%) | 149 (31.5%) |
| 3-Person Household | 19 (40.4%) | 28 (59.6%) |
| 4+ Person Household | 172 (47.9%) | 187 (52.1%) |
| Total Housing Units | 752 (62.1%) | 460 (38.0%) |
Occupancy by Educational Attainment in Post
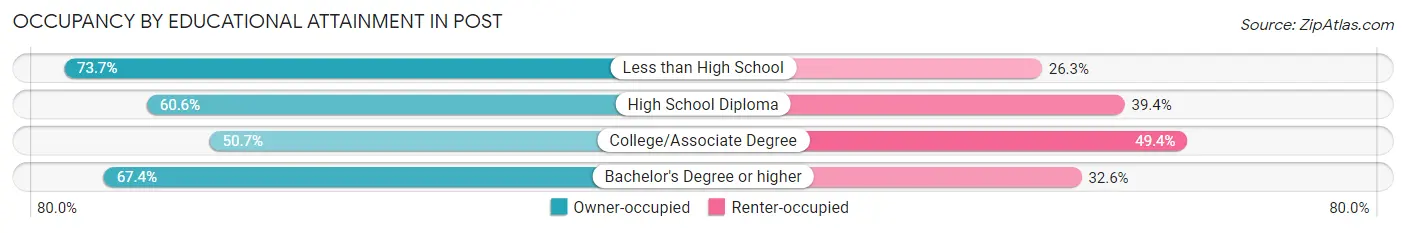
| Household Size | Owner-occupied | Renter-occupied |
| Less than High School | 188 (73.7%) | 67 (26.3%) |
| High School Diploma | 263 (60.6%) | 171 (39.4%) |
| College/Associate Degree | 156 (50.6%) | 152 (49.3%) |
| Bachelor's Degree or higher | 145 (67.4%) | 70 (32.6%) |
Occupancy by Age of Householder in Post
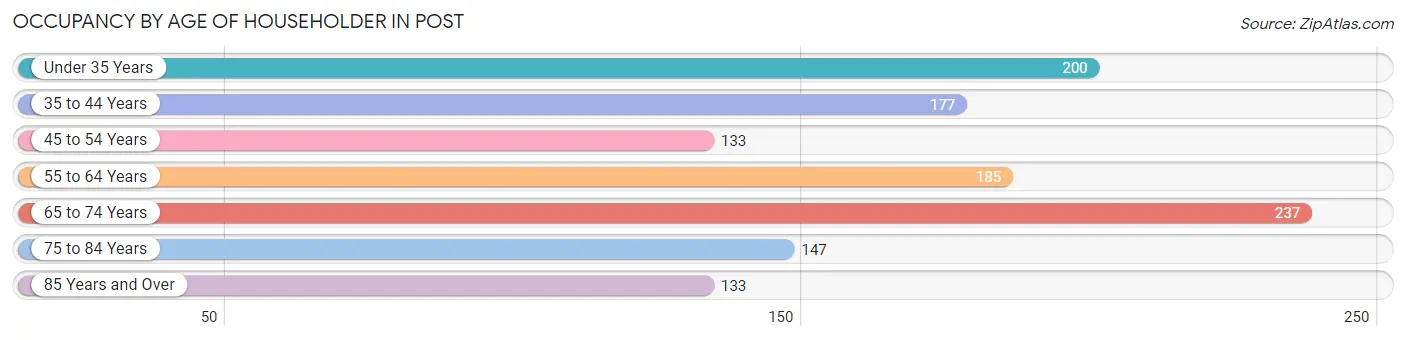
| Age Bracket | # Households | % Households |
| Under 35 Years | 200 | 16.5% |
| 35 to 44 Years | 177 | 14.6% |
| 45 to 54 Years | 133 | 11.0% |
| 55 to 64 Years | 185 | 15.3% |
| 65 to 74 Years | 237 | 19.6% |
| 75 to 84 Years | 147 | 12.1% |
| 85 Years and Over | 133 | 11.0% |
| Total | 1,212 | 100.0% |
Housing Finances in Post
Median Income by Occupancy in Post
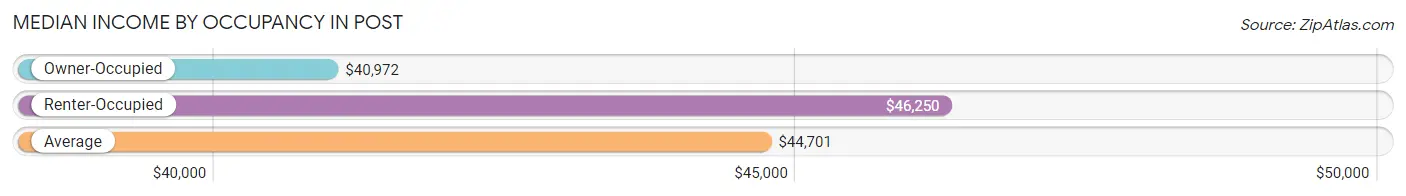
| Occupancy Type | # Households | Median Income |
| Owner-Occupied | 752 (62.1%) | $40,972 |
| Renter-Occupied | 460 (38.0%) | $46,250 |
| Average | 1,212 (100.0%) | $44,701 |
Occupancy by Householder Income Bracket in Post
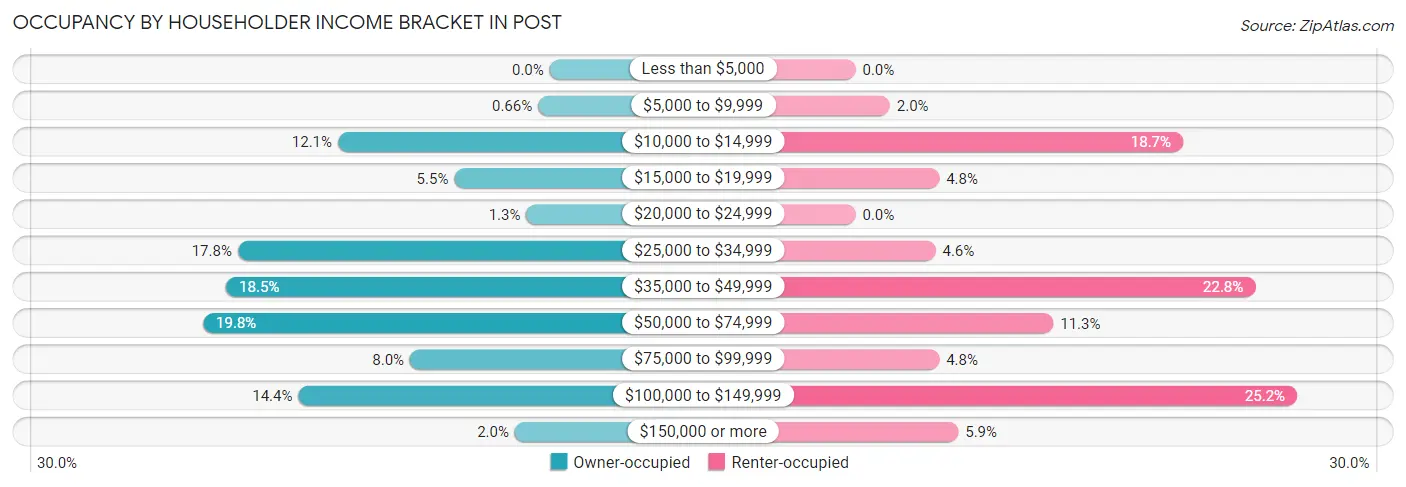
| Income Bracket | Owner-occupied | Renter-occupied |
| Less than $5,000 | 0 (0.0%) | 0 (0.0%) |
| $5,000 to $9,999 | 5 (0.7%) | 9 (2.0%) |
| $10,000 to $14,999 | 91 (12.1%) | 86 (18.7%) |
| $15,000 to $19,999 | 41 (5.4%) | 22 (4.8%) |
| $20,000 to $24,999 | 10 (1.3%) | 0 (0.0%) |
| $25,000 to $34,999 | 134 (17.8%) | 21 (4.6%) |
| $35,000 to $49,999 | 139 (18.5%) | 105 (22.8%) |
| $50,000 to $74,999 | 149 (19.8%) | 52 (11.3%) |
| $75,000 to $99,999 | 60 (8.0%) | 22 (4.8%) |
| $100,000 to $149,999 | 108 (14.4%) | 116 (25.2%) |
| $150,000 or more | 15 (2.0%) | 27 (5.9%) |
| Total | 752 (100.0%) | 460 (100.0%) |
Monthly Housing Cost Tiers in Post
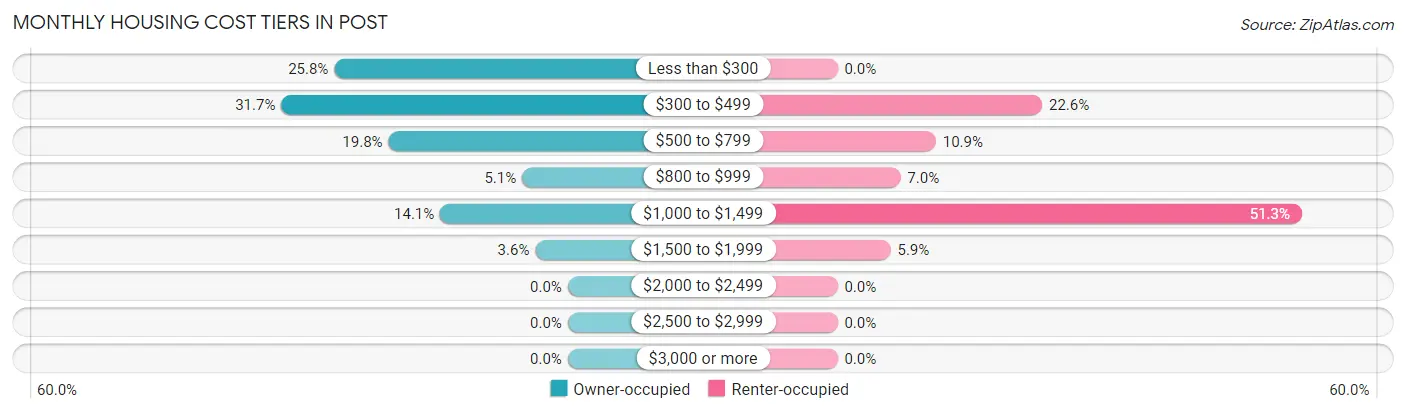
| Monthly Cost | Owner-occupied | Renter-occupied |
| Less than $300 | 194 (25.8%) | 0 (0.0%) |
| $300 to $499 | 238 (31.7%) | 104 (22.6%) |
| $500 to $799 | 149 (19.8%) | 50 (10.9%) |
| $800 to $999 | 38 (5.1%) | 32 (7.0%) |
| $1,000 to $1,499 | 106 (14.1%) | 236 (51.3%) |
| $1,500 to $1,999 | 27 (3.6%) | 27 (5.9%) |
| $2,000 to $2,499 | 0 (0.0%) | 0 (0.0%) |
| $2,500 to $2,999 | 0 (0.0%) | 0 (0.0%) |
| $3,000 or more | 0 (0.0%) | 0 (0.0%) |
| Total | 752 (100.0%) | 460 (100.0%) |
Physical Housing Characteristics in Post
Housing Structures in Post
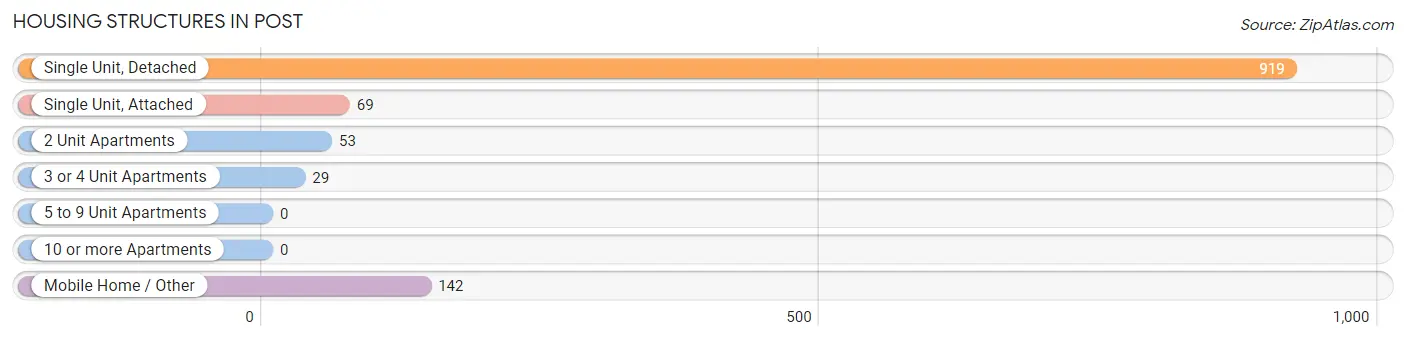
| Structure Type | # Housing Units | % Housing Units |
| Single Unit, Detached | 919 | 75.8% |
| Single Unit, Attached | 69 | 5.7% |
| 2 Unit Apartments | 53 | 4.4% |
| 3 or 4 Unit Apartments | 29 | 2.4% |
| 5 to 9 Unit Apartments | 0 | 0.0% |
| 10 or more Apartments | 0 | 0.0% |
| Mobile Home / Other | 142 | 11.7% |
| Total | 1,212 | 100.0% |
Housing Structures by Occupancy in Post
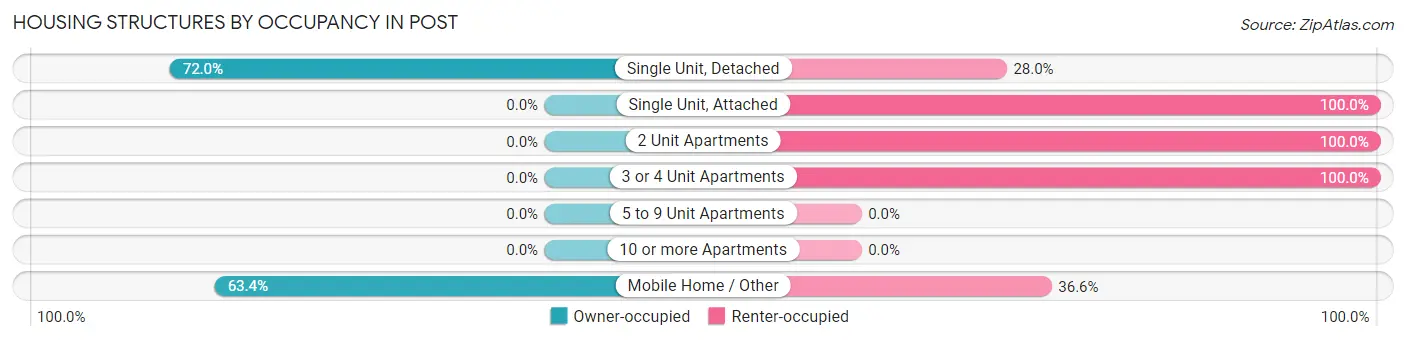
| Structure Type | Owner-occupied | Renter-occupied |
| Single Unit, Detached | 662 (72.0%) | 257 (28.0%) |
| Single Unit, Attached | 0 (0.0%) | 69 (100.0%) |
| 2 Unit Apartments | 0 (0.0%) | 53 (100.0%) |
| 3 or 4 Unit Apartments | 0 (0.0%) | 29 (100.0%) |
| 5 to 9 Unit Apartments | 0 (0.0%) | 0 (0.0%) |
| 10 or more Apartments | 0 (0.0%) | 0 (0.0%) |
| Mobile Home / Other | 90 (63.4%) | 52 (36.6%) |
| Total | 752 (62.1%) | 460 (38.0%) |
Housing Structures by Number of Rooms in Post
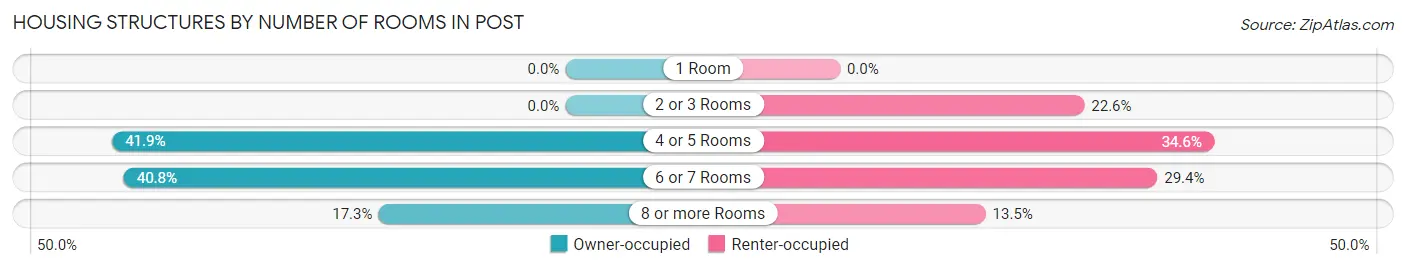
| Number of Rooms | Owner-occupied | Renter-occupied |
| 1 Room | 0 (0.0%) | 0 (0.0%) |
| 2 or 3 Rooms | 0 (0.0%) | 104 (22.6%) |
| 4 or 5 Rooms | 315 (41.9%) | 159 (34.6%) |
| 6 or 7 Rooms | 307 (40.8%) | 135 (29.3%) |
| 8 or more Rooms | 130 (17.3%) | 62 (13.5%) |
| Total | 752 (100.0%) | 460 (100.0%) |
Housing Structure by Heating Type in Post
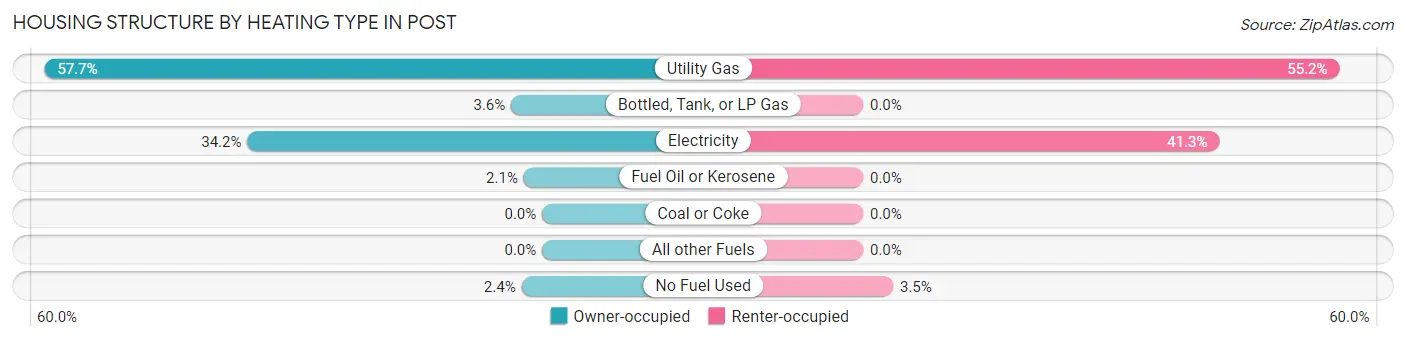
| Heating Type | Owner-occupied | Renter-occupied |
| Utility Gas | 434 (57.7%) | 254 (55.2%) |
| Bottled, Tank, or LP Gas | 27 (3.6%) | 0 (0.0%) |
| Electricity | 257 (34.2%) | 190 (41.3%) |
| Fuel Oil or Kerosene | 16 (2.1%) | 0 (0.0%) |
| Coal or Coke | 0 (0.0%) | 0 (0.0%) |
| All other Fuels | 0 (0.0%) | 0 (0.0%) |
| No Fuel Used | 18 (2.4%) | 16 (3.5%) |
| Total | 752 (100.0%) | 460 (100.0%) |
Household Vehicle Usage in Post
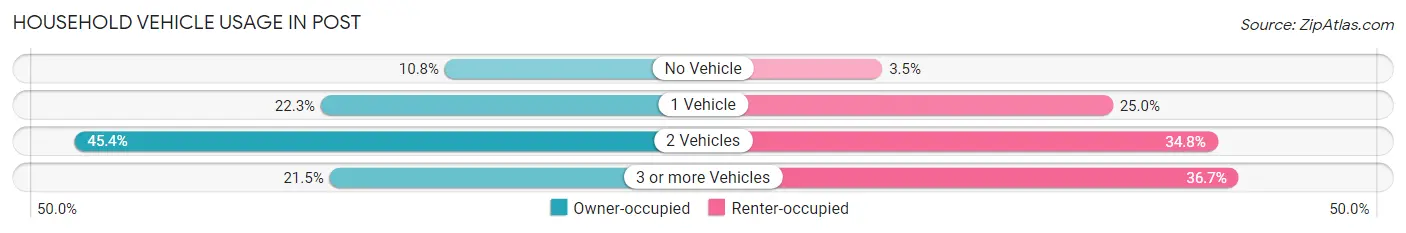
| Vehicles per Household | Owner-occupied | Renter-occupied |
| No Vehicle | 81 (10.8%) | 16 (3.5%) |
| 1 Vehicle | 168 (22.3%) | 115 (25.0%) |
| 2 Vehicles | 341 (45.4%) | 160 (34.8%) |
| 3 or more Vehicles | 162 (21.5%) | 169 (36.7%) |
| Total | 752 (100.0%) | 460 (100.0%) |
Real Estate & Mortgages in Post
Real Estate and Mortgage Overview in Post
| Characteristic | Without Mortgage | With Mortgage |
| Housing Units | 647 | 105 |
| Median Property Value | $45,700 | $105,600 |
| Median Household Income | $37,328 | $7 |
| Monthly Housing Costs | $389 | $0 |
| Real Estate Taxes | $1,129 | $0 |
Property Value by Mortgage Status in Post
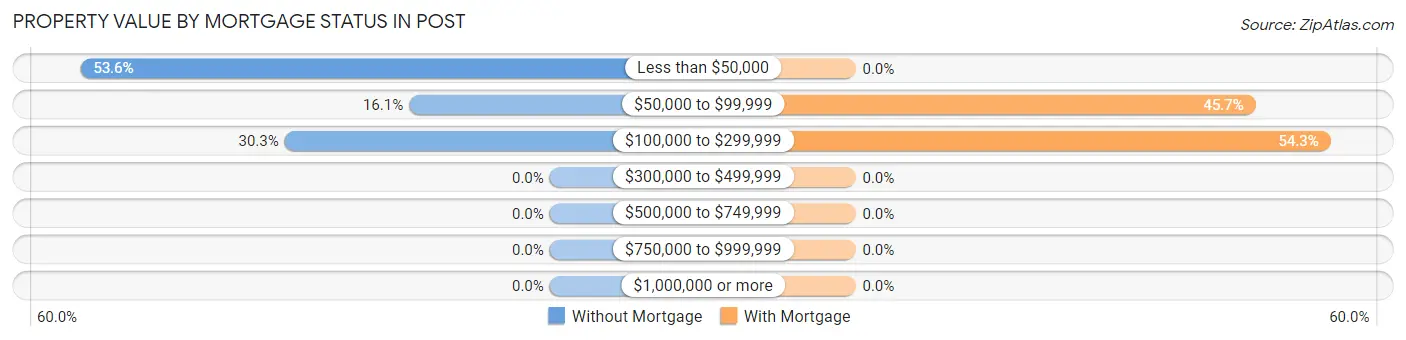
| Property Value | Without Mortgage | With Mortgage |
| Less than $50,000 | 347 (53.6%) | 0 (0.0%) |
| $50,000 to $99,999 | 104 (16.1%) | 48 (45.7%) |
| $100,000 to $299,999 | 196 (30.3%) | 57 (54.3%) |
| $300,000 to $499,999 | 0 (0.0%) | 0 (0.0%) |
| $500,000 to $749,999 | 0 (0.0%) | 0 (0.0%) |
| $750,000 to $999,999 | 0 (0.0%) | 0 (0.0%) |
| $1,000,000 or more | 0 (0.0%) | 0 (0.0%) |
| Total | 647 (100.0%) | 105 (100.0%) |
Household Income by Mortgage Status in Post
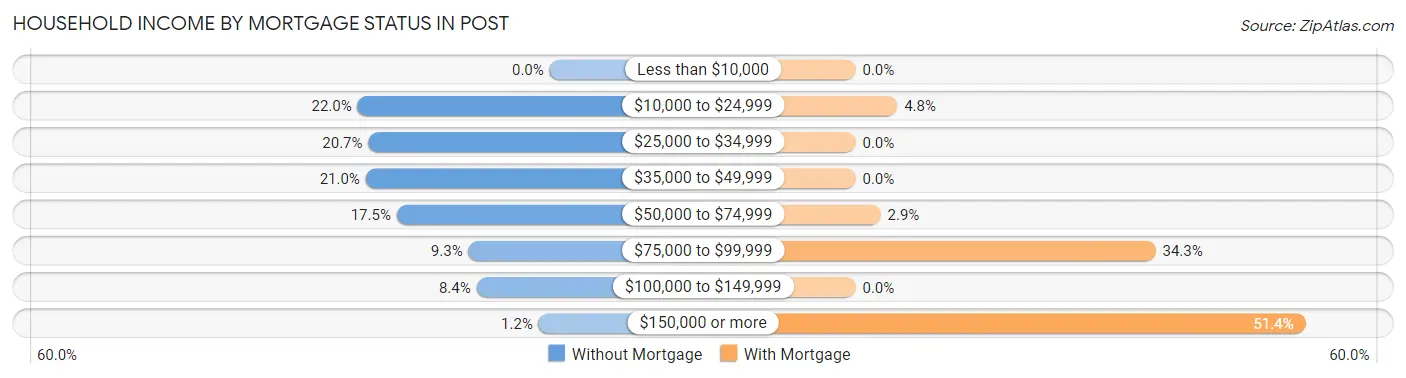
| Household Income | Without Mortgage | With Mortgage |
| Less than $10,000 | 0 (0.0%) | 0 (0.0%) |
| $10,000 to $24,999 | 142 (22.0%) | 5 (4.8%) |
| $25,000 to $34,999 | 134 (20.7%) | 0 (0.0%) |
| $35,000 to $49,999 | 136 (21.0%) | 0 (0.0%) |
| $50,000 to $74,999 | 113 (17.5%) | 3 (2.9%) |
| $75,000 to $99,999 | 60 (9.3%) | 36 (34.3%) |
| $100,000 to $149,999 | 54 (8.4%) | 0 (0.0%) |
| $150,000 or more | 8 (1.2%) | 54 (51.4%) |
| Total | 647 (100.0%) | 105 (100.0%) |
Property Value to Household Income Ratio in Post
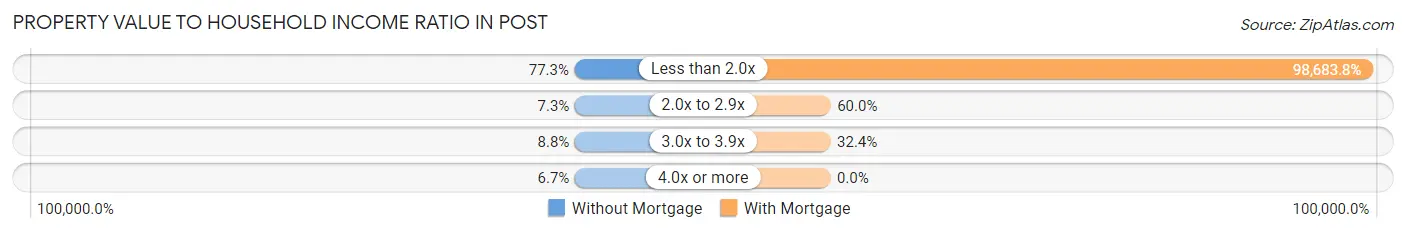
| Value-to-Income Ratio | Without Mortgage | With Mortgage |
| Less than 2.0x | 500 (77.3%) | 103,618 (98,683.8%) |
| 2.0x to 2.9x | 47 (7.3%) | 63 (60.0%) |
| 3.0x to 3.9x | 57 (8.8%) | 34 (32.4%) |
| 4.0x or more | 43 (6.7%) | 0 (0.0%) |
| Total | 647 (100.0%) | 105 (100.0%) |
Real Estate Taxes by Mortgage Status in Post
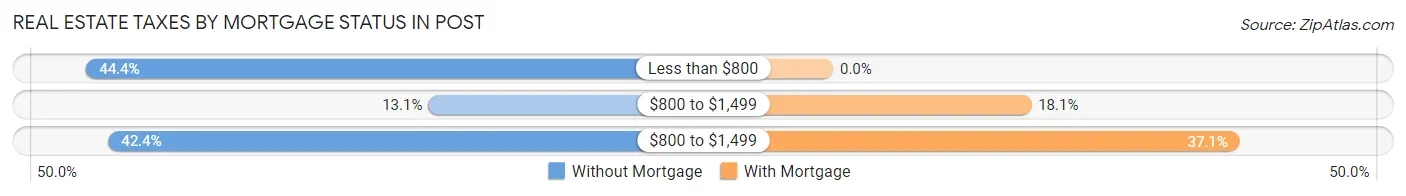
| Property Taxes | Without Mortgage | With Mortgage |
| Less than $800 | 287 (44.4%) | 0 (0.0%) |
| $800 to $1,499 | 85 (13.1%) | 19 (18.1%) |
| $800 to $1,499 | 274 (42.3%) | 39 (37.1%) |
| Total | 647 (100.0%) | 105 (100.0%) |
Health & Disability in Post
Health Insurance Coverage by Age in Post
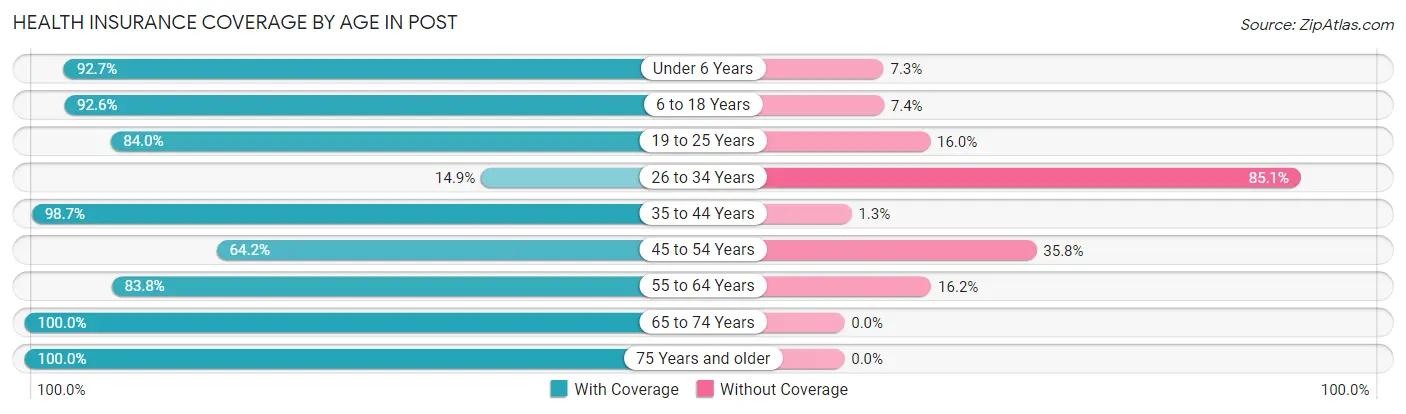
| Age Bracket | With Coverage | Without Coverage |
| Under 6 Years | 152 (92.7%) | 12 (7.3%) |
| 6 to 18 Years | 602 (92.6%) | 48 (7.4%) |
| 19 to 25 Years | 331 (84.0%) | 63 (16.0%) |
| 26 to 34 Years | 62 (14.9%) | 355 (85.1%) |
| 35 to 44 Years | 222 (98.7%) | 3 (1.3%) |
| 45 to 54 Years | 181 (64.2%) | 101 (35.8%) |
| 55 to 64 Years | 331 (83.8%) | 64 (16.2%) |
| 65 to 74 Years | 338 (100.0%) | 0 (0.0%) |
| 75 Years and older | 388 (100.0%) | 0 (0.0%) |
| Total | 2,607 (80.1%) | 646 (19.9%) |
Health Insurance Coverage by Citizenship Status in Post
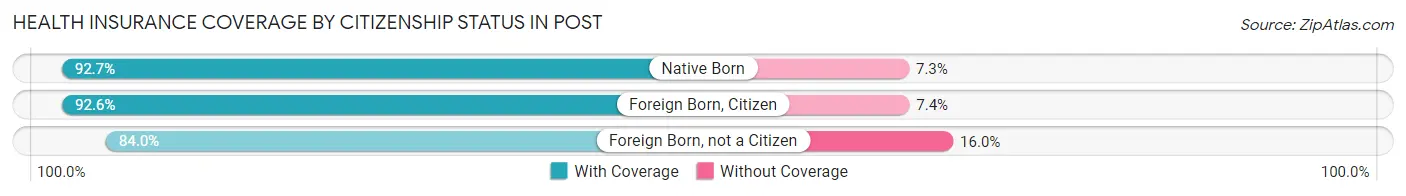
| Citizenship Status | With Coverage | Without Coverage |
| Native Born | 152 (92.7%) | 12 (7.3%) |
| Foreign Born, Citizen | 602 (92.6%) | 48 (7.4%) |
| Foreign Born, not a Citizen | 331 (84.0%) | 63 (16.0%) |
Health Insurance Coverage by Household Income in Post
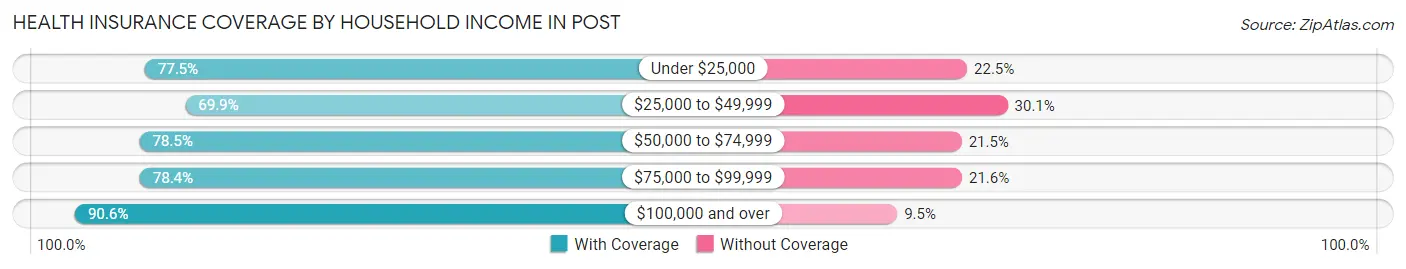
| Household Income | With Coverage | Without Coverage |
| Under $25,000 | 323 (77.5%) | 94 (22.5%) |
| $25,000 to $49,999 | 654 (69.9%) | 282 (30.1%) |
| $50,000 to $74,999 | 390 (78.5%) | 107 (21.5%) |
| $75,000 to $99,999 | 196 (78.4%) | 54 (21.6%) |
| $100,000 and over | 1,044 (90.5%) | 109 (9.5%) |
Public vs Private Health Insurance Coverage by Age in Post
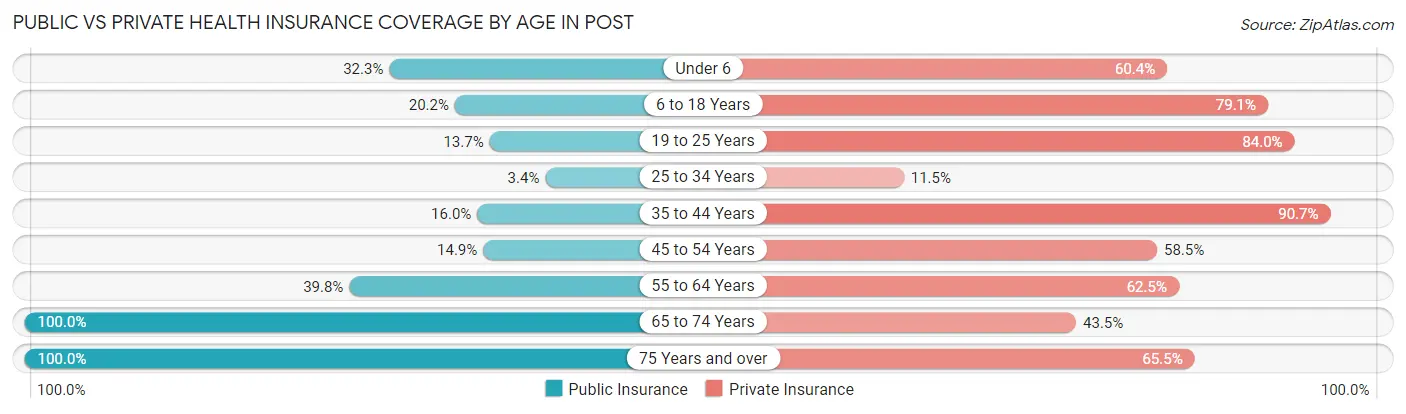
| Age Bracket | Public Insurance | Private Insurance |
| Under 6 | 53 (32.3%) | 99 (60.4%) |
| 6 to 18 Years | 131 (20.2%) | 514 (79.1%) |
| 19 to 25 Years | 54 (13.7%) | 331 (84.0%) |
| 25 to 34 Years | 14 (3.4%) | 48 (11.5%) |
| 35 to 44 Years | 36 (16.0%) | 204 (90.7%) |
| 45 to 54 Years | 42 (14.9%) | 165 (58.5%) |
| 55 to 64 Years | 157 (39.8%) | 247 (62.5%) |
| 65 to 74 Years | 338 (100.0%) | 147 (43.5%) |
| 75 Years and over | 388 (100.0%) | 254 (65.5%) |
| Total | 1,213 (37.3%) | 2,009 (61.8%) |
Disability Status by Sex by Age in Post
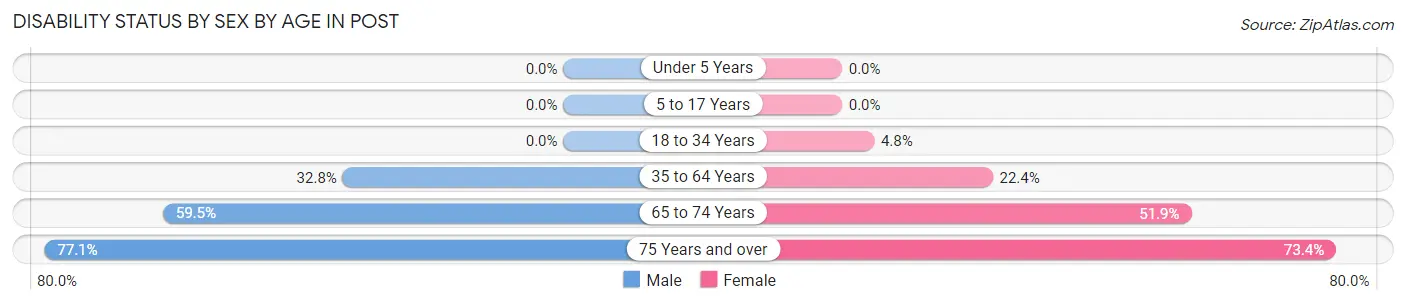
| Age Bracket | Male | Female |
| Under 5 Years | 0 (0.0%) | 0 (0.0%) |
| 5 to 17 Years | 0 (0.0%) | 0 (0.0%) |
| 18 to 34 Years | 0 (0.0%) | 20 (4.8%) |
| 35 to 64 Years | 136 (32.8%) | 109 (22.4%) |
| 65 to 74 Years | 91 (59.5%) | 96 (51.9%) |
| 75 Years and over | 131 (77.1%) | 160 (73.4%) |
Disability Class by Sex by Age in Post
Disability Class: Hearing Difficulty
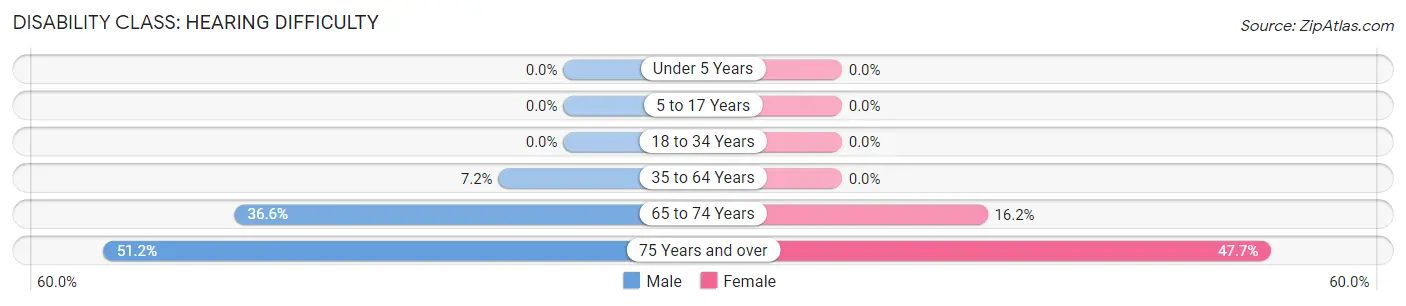
| Age Bracket | Male | Female |
| Under 5 Years | 0 (0.0%) | 0 (0.0%) |
| 5 to 17 Years | 0 (0.0%) | 0 (0.0%) |
| 18 to 34 Years | 0 (0.0%) | 0 (0.0%) |
| 35 to 64 Years | 30 (7.2%) | 0 (0.0%) |
| 65 to 74 Years | 56 (36.6%) | 30 (16.2%) |
| 75 Years and over | 87 (51.2%) | 104 (47.7%) |
Disability Class: Vision Difficulty
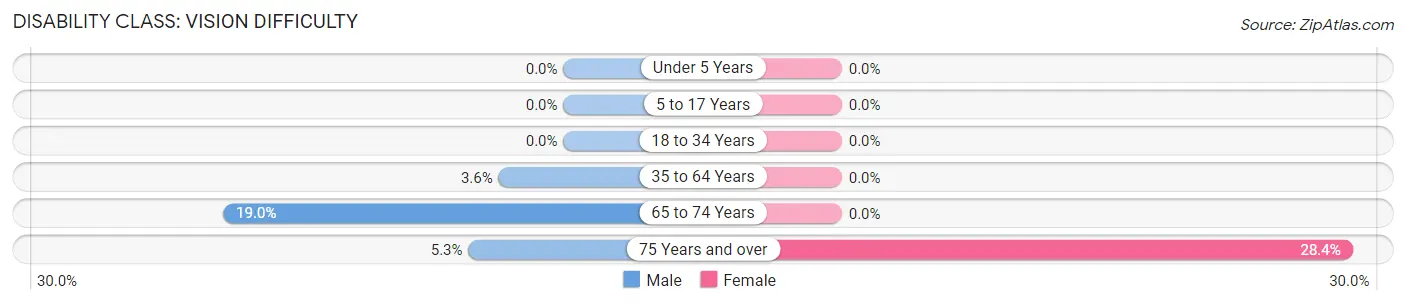
| Age Bracket | Male | Female |
| Under 5 Years | 0 (0.0%) | 0 (0.0%) |
| 5 to 17 Years | 0 (0.0%) | 0 (0.0%) |
| 18 to 34 Years | 0 (0.0%) | 0 (0.0%) |
| 35 to 64 Years | 15 (3.6%) | 0 (0.0%) |
| 65 to 74 Years | 29 (19.0%) | 0 (0.0%) |
| 75 Years and over | 9 (5.3%) | 62 (28.4%) |
Disability Class: Cognitive Difficulty
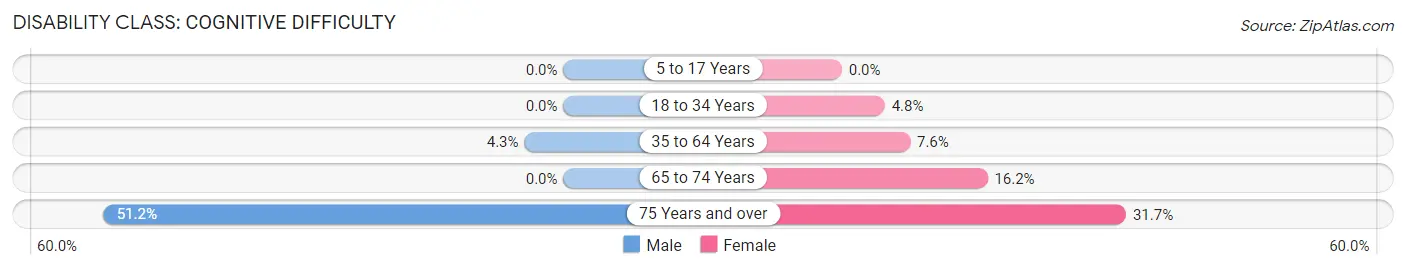
| Age Bracket | Male | Female |
| 5 to 17 Years | 0 (0.0%) | 0 (0.0%) |
| 18 to 34 Years | 0 (0.0%) | 20 (4.8%) |
| 35 to 64 Years | 18 (4.3%) | 37 (7.6%) |
| 65 to 74 Years | 0 (0.0%) | 30 (16.2%) |
| 75 Years and over | 87 (51.2%) | 69 (31.7%) |
Disability Class: Ambulatory Difficulty
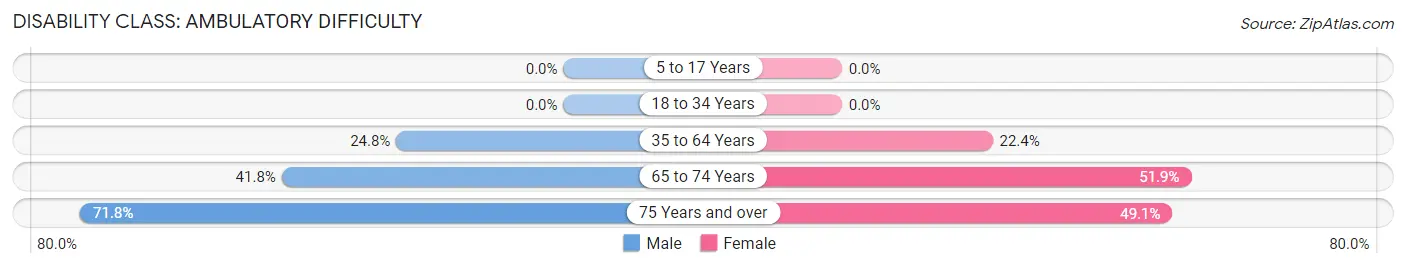
| Age Bracket | Male | Female |
| 5 to 17 Years | 0 (0.0%) | 0 (0.0%) |
| 18 to 34 Years | 0 (0.0%) | 0 (0.0%) |
| 35 to 64 Years | 103 (24.8%) | 109 (22.4%) |
| 65 to 74 Years | 64 (41.8%) | 96 (51.9%) |
| 75 Years and over | 122 (71.8%) | 107 (49.1%) |
Disability Class: Self-Care Difficulty
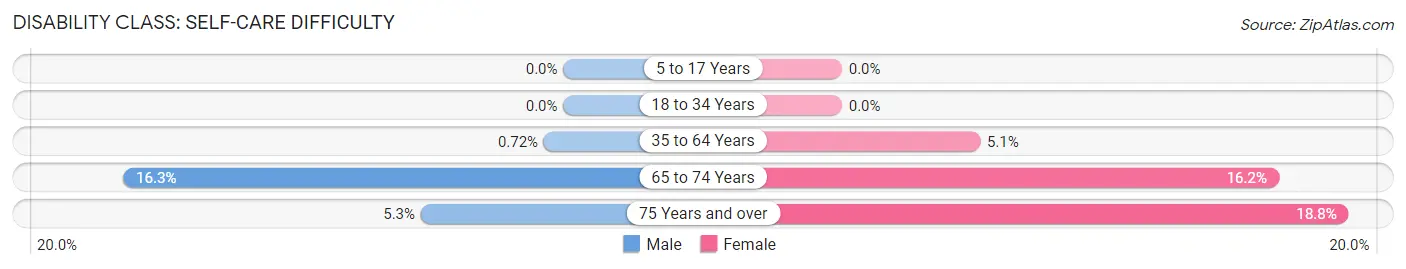
| Age Bracket | Male | Female |
| 5 to 17 Years | 0 (0.0%) | 0 (0.0%) |
| 18 to 34 Years | 0 (0.0%) | 0 (0.0%) |
| 35 to 64 Years | 3 (0.7%) | 25 (5.1%) |
| 65 to 74 Years | 25 (16.3%) | 30 (16.2%) |
| 75 Years and over | 9 (5.3%) | 41 (18.8%) |
Technology Access in Post
Computing Device Access in Post
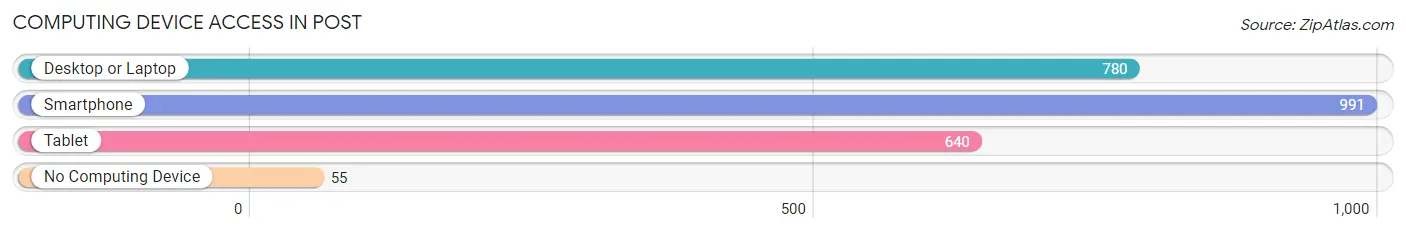
| Device Type | # Households | % Households |
| Desktop or Laptop | 780 | 64.4% |
| Smartphone | 991 | 81.8% |
| Tablet | 640 | 52.8% |
| No Computing Device | 55 | 4.5% |
| Total | 1,212 | 100.0% |
Internet Access in Post
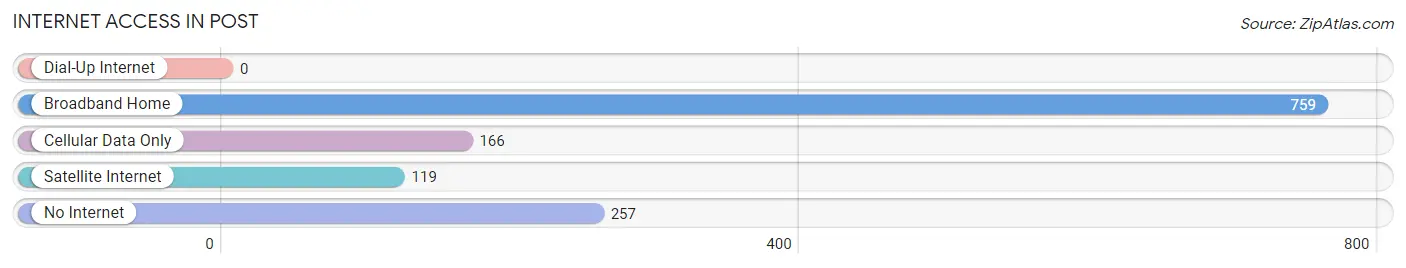
| Internet Type | # Households | % Households |
| Dial-Up Internet | 0 | 0.0% |
| Broadband Home | 759 | 62.6% |
| Cellular Data Only | 166 | 13.7% |
| Satellite Internet | 119 | 9.8% |
| No Internet | 257 | 21.2% |
| Total | 1,212 | 100.0% |
Post Summary
Texas is a state located in the south-central region of the United States. It is the second largest state in the country, both in terms of population and land area. Texas is known for its diverse geography, ranging from the piney woods of East Texas to the desert of West Texas, and its rich cultural heritage, which includes a mix of Spanish, Mexican, and Anglo influences. The state has a long and varied history, beginning with its Native American inhabitants and continuing through its days as a Spanish colony, its time as an independent republic, and its eventual annexation by the United States. Texas has also played an important role in the development of the American economy, particularly in the oil and gas industry.
History
The history of Texas dates back thousands of years, with evidence of human habitation in the region as far back as 12,000 years ago. The first known inhabitants of the area were Native American tribes, including the Caddo, Apache, and Comanche. These tribes were largely nomadic, following the seasonal migration of buffalo and other game animals.
In the 16th century, Spanish explorers arrived in the region, establishing missions and settlements. The Spanish also brought with them their language, culture, and religion, which had a lasting impact on the region. In 1821, Mexico won its independence from Spain, and Texas became part of the newly formed Mexican state.
In 1836, Texas declared its independence from Mexico, and the Republic of Texas was formed. This period of independence lasted until 1845, when Texas was annexed by the United States. During this time, the state experienced a period of rapid growth and development, as settlers from the United States and Europe moved to the region.
Geography
Texas is located in the south-central region of the United States, and is bordered by Oklahoma to the north, Arkansas and Louisiana to the east, and Mexico to the south and west. The state is divided into four distinct geographic regions: the Gulf Coastal Plains, the Great Plains, the Edwards Plateau, and the Basin and Range Province.
The Gulf Coastal Plains region is located along the Gulf of Mexico, and is characterized by flat, marshy terrain. The Great Plains region is located in the northern part of the state, and is characterized by rolling hills and grasslands. The Edwards Plateau is located in the central part of the state, and is characterized by rugged hills and canyons. The Basin and Range Province is located in the western part of the state, and is characterized by desert terrain.
Economy
The economy of Texas is one of the largest and most diverse in the United States. The state is a major producer of oil and natural gas, and is home to some of the largest oil and gas companies in the world. The state is also a major producer of agricultural products, including cotton, cattle, and wheat.
In addition to its traditional industries, Texas is also home to a growing technology sector, with many major technology companies based in the state. The state is also home to a number of major military installations, including Fort Hood and Lackland Air Force Base.
Demographics
As of 2020, the population of Texas was estimated to be 29.1 million, making it the second most populous state in the country. The state is racially and ethnically diverse, with a population that is roughly 44% White, 38% Hispanic, 11% African American, and 6% Asian. The state is also home to a large number of immigrants, with nearly one-third of the population being foreign-born.
The largest cities in Texas are Houston, San Antonio, Dallas, Austin, and Fort Worth. The state capital is Austin, and the state's largest metropolitan area is the Dallas-Fort Worth-Arlington metropolitan area.
Conclusion
Texas is a state with a rich and varied history, diverse geography, and a vibrant economy. The state is home to a diverse population, with a mix of Native American, Spanish, Mexican, and Anglo influences. The state is a major producer of oil and natural gas, and is home to a growing technology sector. Texas is also home to a number of major military installations, and is the second most populous state in the country.
Common Questions
What is Per Capita Income in Post?
Per Capita income in Post is $17,025.
What is the Median Family Income in Post?
Median Family Income in Post is $72,586.
What is the Median Household income in Post?
Median Household Income in Post is $44,701.
What is Income or Wage Gap in Post?
Income or Wage Gap in Post is 23.7%.
Women in Post earn 76.3 cents for every dollar earned by a man.
What is Inequality or Gini Index in Post?
Inequality or Gini Index in Post is 0.41.
What is the Total Population of Post?
Total Population of Post is 4,632.
What is the Total Male Population of Post?
Total Male Population of Post is 2,919.
What is the Total Female Population of Post?
Total Female Population of Post is 1,713.
What is the Ratio of Males per 100 Females in Post?
There are 170.40 Males per 100 Females in Post.
What is the Ratio of Females per 100 Males in Post?
There are 58.68 Females per 100 Males in Post.
What is the Median Population Age in Post?
Median Population Age in Post is 39.8 Years.
What is the Average Family Size in Post
Average Family Size in Post is 3.3 People.
What is the Average Household Size in Post
Average Household Size in Post is 2.7 People.
How Large is the Labor Force in Post?
There are 1,195 People in the Labor Forcein in Post.
What is the Percentage of People in the Labor Force in Post?
30.4% of People are in the Labor Force in Post.
What is the Unemployment Rate in Post?
Unemployment Rate in Post is 5.8%.