Spring, TX Map & Demographics
Spring Map
Spring Overview
$32,966
PER CAPITA INCOME
$87,173
AVG FAMILY INCOME
$83,754
AVG HOUSEHOLD INCOME
33.4%
WAGE / INCOME GAP [ % ]
66.6¢/ $1
WAGE / INCOME GAP [ $ ]
0.35
INEQUALITY / GINI INDEX
63,930
TOTAL POPULATION
30,704
MALE POPULATION
33,226
FEMALE POPULATION
92.41
MALES / 100 FEMALES
108.21
FEMALES / 100 MALES
33.1
MEDIAN AGE
3.5
AVG FAMILY SIZE
3.0
AVG HOUSEHOLD SIZE
34,373
LABOR FORCE [ PEOPLE ]
70.2%
PERCENT IN LABOR FORCE
4.6%
UNEMPLOYMENT RATE
Income in Spring
Income Overview in Spring
Per Capita Income in Spring is $32,966, while median incomes of families and households are $87,173 and $83,754 respectively.
| Characteristic | Number | Measure |
| Per Capita Income | 63,930 | $32,966 |
| Median Family Income | 15,686 | $87,173 |
| Mean Family Income | 15,686 | $103,643 |
| Median Household Income | 21,237 | $83,754 |
| Mean Household Income | 21,237 | $97,076 |
| Income Deficit | 15,686 | $0 |
| Wage / Income Gap (%) | 63,930 | 33.39% |
| Wage / Income Gap ($) | 63,930 | 66.61¢ per $1 |
| Gini / Inequality Index | 63,930 | 0.35 |
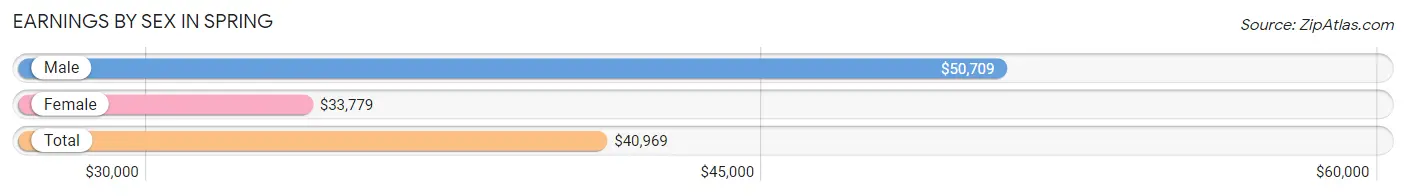
Earnings by Sex in Spring
Average Earnings in Spring are $40,969, $50,709 for men and $33,779 for women, a difference of 33.4%.
| Sex | Number | Average Earnings |
| Male | 19,191 (54.6%) | $50,709 |
| Female | 15,944 (45.4%) | $33,779 |
| Total | 35,135 (100.0%) | $40,969 |
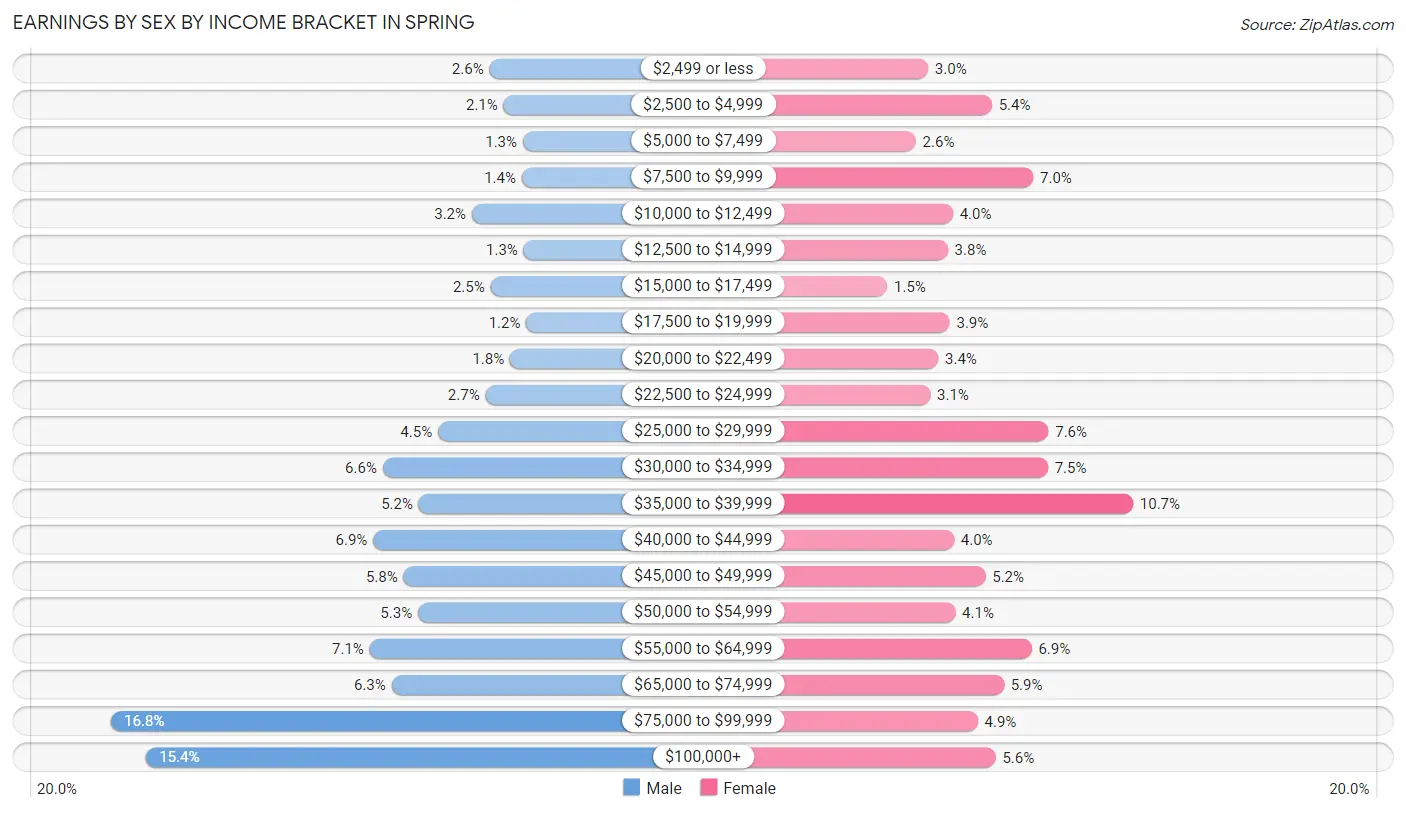
Earnings by Sex by Income Bracket in Spring
The most common earnings brackets in Spring are $75,000 to $99,999 for men (3,217 | 16.8%) and $35,000 to $39,999 for women (1,709 | 10.7%).
| Income | Male | Female |
| $2,499 or less | 496 (2.6%) | 484 (3.0%) |
| $2,500 to $4,999 | 393 (2.1%) | 866 (5.4%) |
| $5,000 to $7,499 | 256 (1.3%) | 412 (2.6%) |
| $7,500 to $9,999 | 263 (1.4%) | 1,113 (7.0%) |
| $10,000 to $12,499 | 622 (3.2%) | 633 (4.0%) |
| $12,500 to $14,999 | 250 (1.3%) | 602 (3.8%) |
| $15,000 to $17,499 | 487 (2.5%) | 240 (1.5%) |
| $17,500 to $19,999 | 230 (1.2%) | 614 (3.8%) |
| $20,000 to $22,499 | 347 (1.8%) | 546 (3.4%) |
| $22,500 to $24,999 | 523 (2.7%) | 497 (3.1%) |
| $25,000 to $29,999 | 866 (4.5%) | 1,204 (7.5%) |
| $30,000 to $34,999 | 1,263 (6.6%) | 1,200 (7.5%) |
| $35,000 to $39,999 | 1,004 (5.2%) | 1,709 (10.7%) |
| $40,000 to $44,999 | 1,331 (6.9%) | 640 (4.0%) |
| $45,000 to $49,999 | 1,114 (5.8%) | 827 (5.2%) |
| $50,000 to $54,999 | 1,009 (5.3%) | 648 (4.1%) |
| $55,000 to $64,999 | 1,357 (7.1%) | 1,103 (6.9%) |
| $65,000 to $74,999 | 1,199 (6.2%) | 937 (5.9%) |
| $75,000 to $99,999 | 3,217 (16.8%) | 781 (4.9%) |
| $100,000+ | 2,964 (15.4%) | 888 (5.6%) |
| Total | 19,191 (100.0%) | 15,944 (100.0%) |
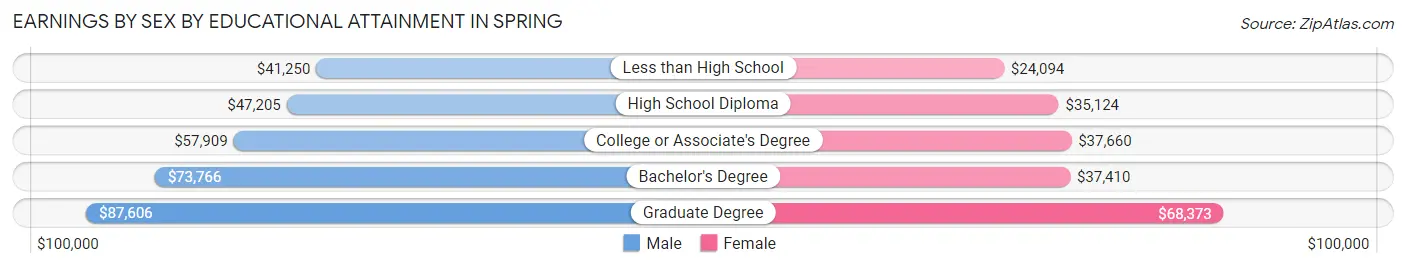
Earnings by Sex by Educational Attainment in Spring
Average earnings in Spring are $55,296 for men and $36,789 for women, a difference of 33.5%. Men with an educational attainment of graduate degree enjoy the highest average annual earnings of $87,606, while those with less than high school education earn the least with $41,250. Women with an educational attainment of graduate degree earn the most with the average annual earnings of $68,373, while those with less than high school education have the smallest earnings of $24,094.
| Educational Attainment | Male Income | Female Income |
| Less than High School | $41,250 | $24,094 |
| High School Diploma | $47,205 | $35,124 |
| College or Associate's Degree | $57,909 | $37,660 |
| Bachelor's Degree | $73,766 | $37,410 |
| Graduate Degree | $87,606 | $68,373 |
| Total | $55,296 | $36,789 |
Family Income in Spring
Family Income Brackets in Spring
According to the Spring family income data, there are 3,482 families falling into the $100,000 to $149,999 income range, which is the most common income bracket and makes up 22.2% of all families. Conversely, the less than $10,000 income bracket is the least frequent group with only 251 families (1.6%) belonging to this category.
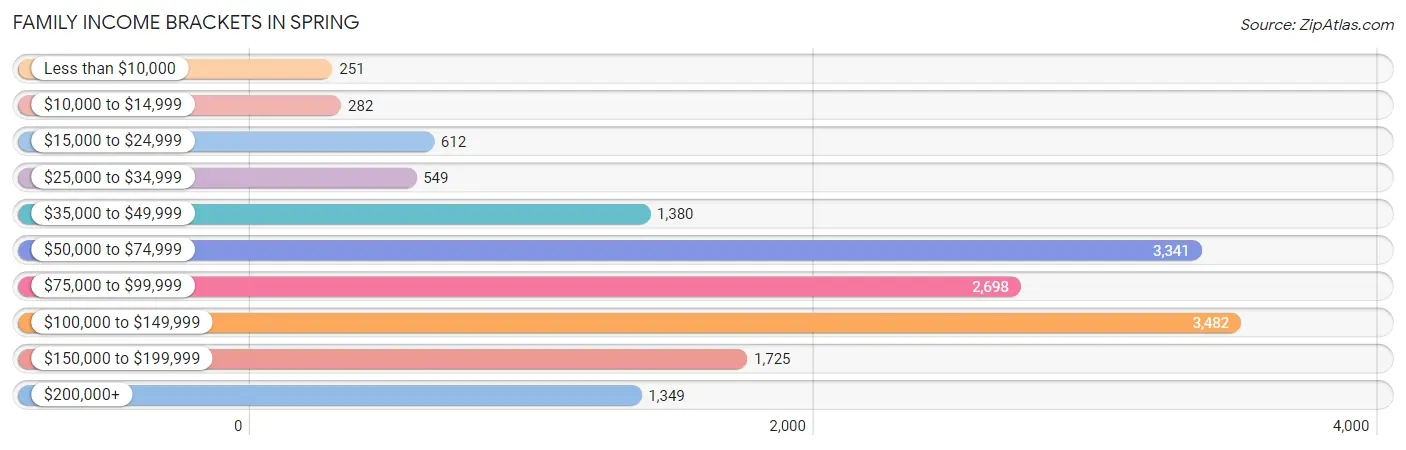
| Income Bracket | # Families | % Families |
| Less than $10,000 | 251 | 1.6% |
| $10,000 to $14,999 | 282 | 1.8% |
| $15,000 to $24,999 | 612 | 3.9% |
| $25,000 to $34,999 | 549 | 3.5% |
| $35,000 to $49,999 | 1,380 | 8.8% |
| $50,000 to $74,999 | 3,341 | 21.3% |
| $75,000 to $99,999 | 2,698 | 17.2% |
| $100,000 to $149,999 | 3,482 | 22.2% |
| $150,000 to $199,999 | 1,725 | 11.0% |
| $200,000+ | 1,349 | 8.6% |
Family Income by Famaliy Size in Spring
7+ person families (445 | 2.8%) account for the highest median family income in Spring with $109,010 per family, while 2-person families (6,000 | 38.3%) have the highest median income of $40,554 per family member.
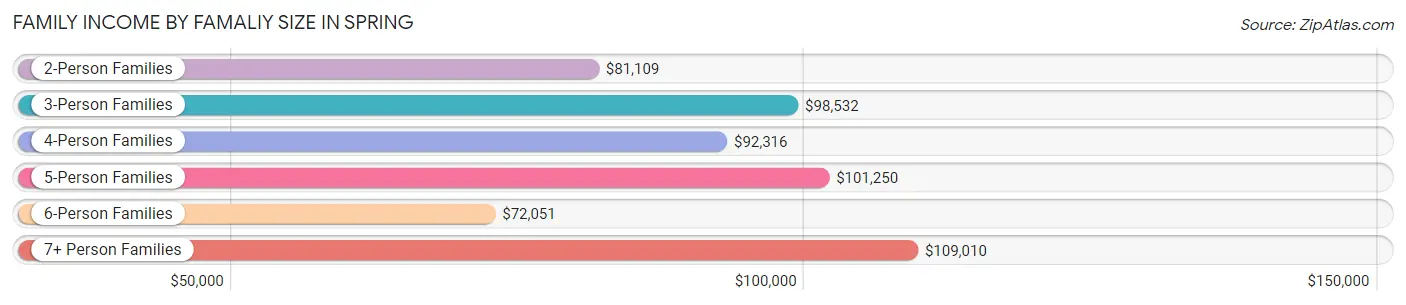
| Income Bracket | # Families | Median Income |
| 2-Person Families | 6,000 (38.3%) | $81,109 |
| 3-Person Families | 3,387 (21.6%) | $98,532 |
| 4-Person Families | 2,939 (18.7%) | $92,316 |
| 5-Person Families | 2,069 (13.2%) | $101,250 |
| 6-Person Families | 846 (5.4%) | $72,051 |
| 7+ Person Families | 445 (2.8%) | $109,010 |
| Total | 15,686 (100.0%) | $87,173 |
Family Income by Number of Earners in Spring
The median family income in Spring is $87,173, with families comprising 3+ earners (2,514) having the highest median family income of $116,824, while families with no earners (1,284) have the lowest median family income of $40,718, accounting for 16.0% and 8.2% of families, respectively.
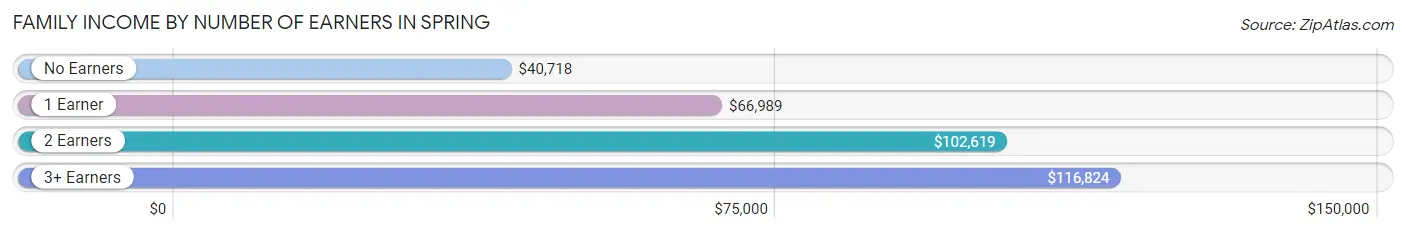
| Number of Earners | # Families | Median Income |
| No Earners | 1,284 (8.2%) | $40,718 |
| 1 Earner | 5,309 (33.9%) | $66,989 |
| 2 Earners | 6,579 (41.9%) | $102,619 |
| 3+ Earners | 2,514 (16.0%) | $116,824 |
| Total | 15,686 (100.0%) | $87,173 |
Household Income in Spring
Household Income Brackets in Spring
With 5,012 households falling in the category, the $50,000 to $74,999 income range is the most frequent in Spring, accounting for 23.6% of all households. In contrast, only 404 households (1.9%) fall into the less than $10,000 income bracket, making it the least populous group.
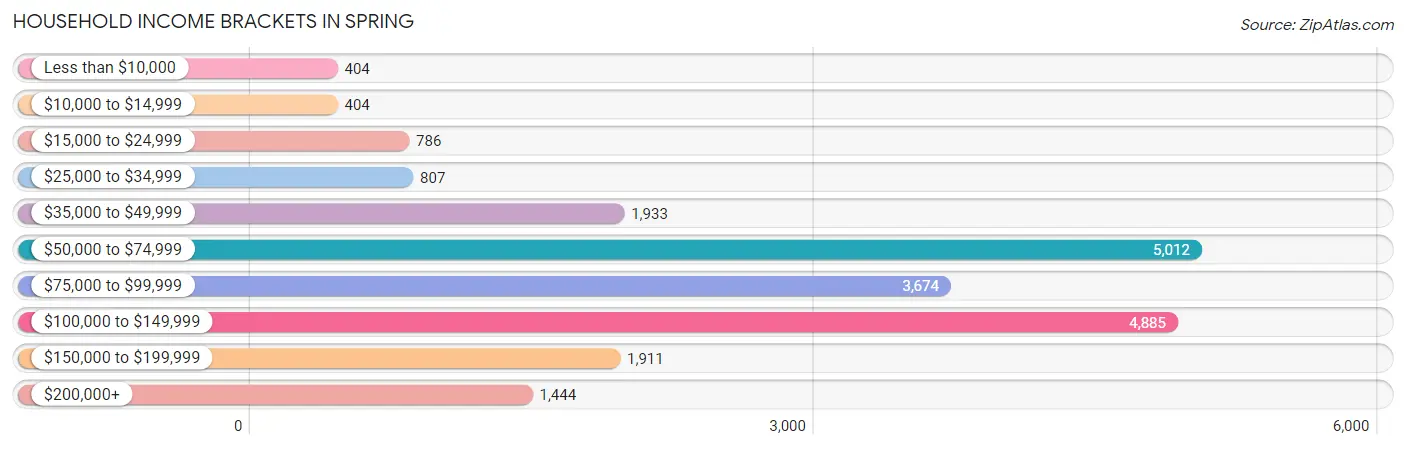
| Income Bracket | # Households | % Households |
| Less than $10,000 | 404 | 1.9% |
| $10,000 to $14,999 | 404 | 1.9% |
| $15,000 to $24,999 | 786 | 3.7% |
| $25,000 to $34,999 | 807 | 3.8% |
| $35,000 to $49,999 | 1,933 | 9.1% |
| $50,000 to $74,999 | 5,012 | 23.6% |
| $75,000 to $99,999 | 3,674 | 17.3% |
| $100,000 to $149,999 | 4,885 | 23.0% |
| $150,000 to $199,999 | 1,911 | 9.0% |
| $200,000+ | 1,444 | 6.8% |
Household Income by Householder Age in Spring
The median household income in Spring is $83,754, with the highest median household income of $91,622 found in the 45 to 64 years age bracket for the primary householder. A total of 8,131 households (38.3%) fall into this category. Meanwhile, the 65+ years age bracket for the primary householder has the lowest median household income of $59,485, with 3,314 households (15.6%) in this group.
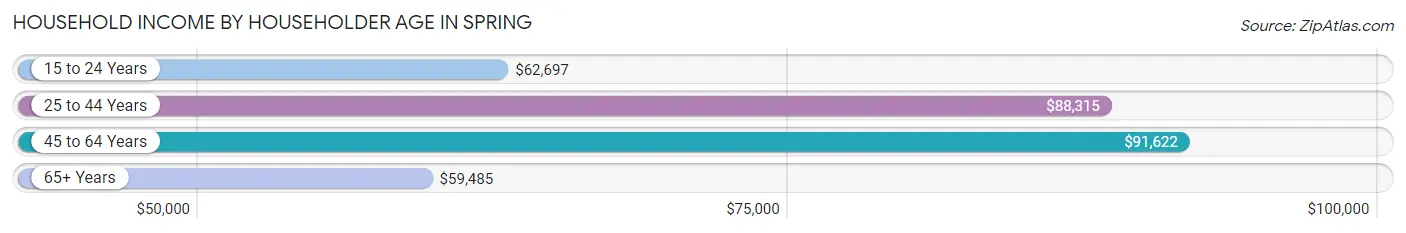
| Income Bracket | # Households | Median Income |
| 15 to 24 Years | 390 (1.8%) | $62,697 |
| 25 to 44 Years | 9,402 (44.3%) | $88,315 |
| 45 to 64 Years | 8,131 (38.3%) | $91,622 |
| 65+ Years | 3,314 (15.6%) | $59,485 |
| Total | 21,237 (100.0%) | $83,754 |
Poverty in Spring
Income Below Poverty by Sex and Age in Spring
With 7.6% poverty level for males and 10.8% for females among the residents of Spring, 15 year old males and under 5 year old females are the most vulnerable to poverty, with 23 males (23.0%) and 764 females (28.4%) in their respective age groups living below the poverty level.
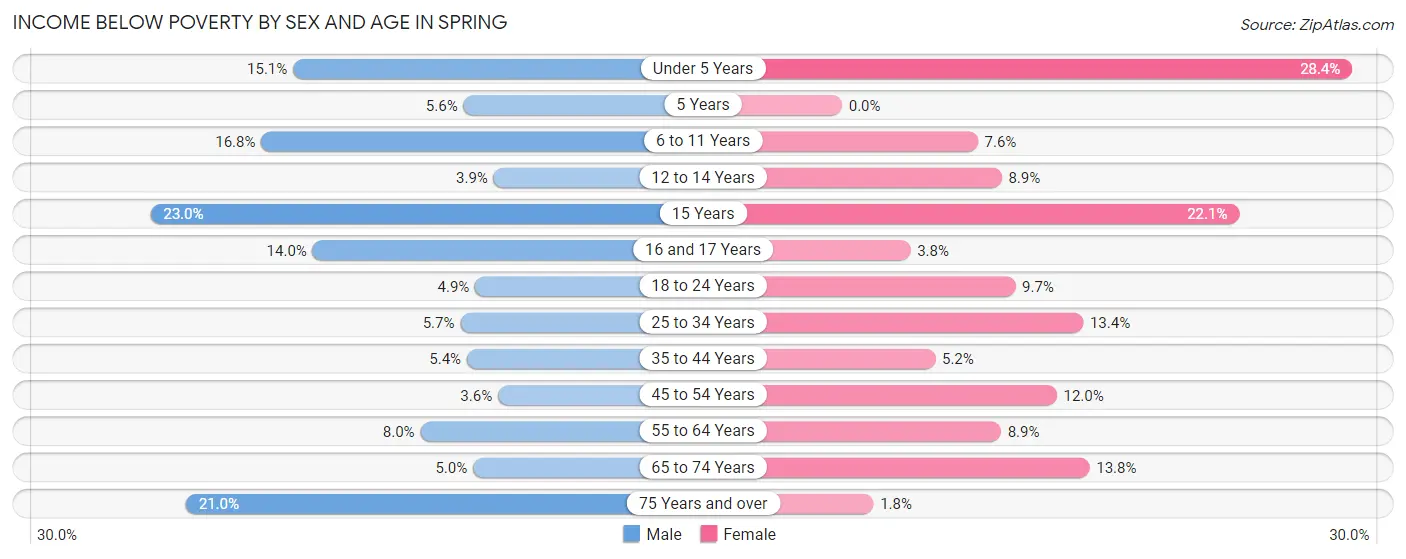
| Age Bracket | Male | Female |
| Under 5 Years | 320 (15.0%) | 764 (28.4%) |
| 5 Years | 28 (5.6%) | 0 (0.0%) |
| 6 to 11 Years | 413 (16.8%) | 300 (7.6%) |
| 12 to 14 Years | 59 (3.9%) | 83 (8.9%) |
| 15 Years | 23 (23.0%) | 52 (22.1%) |
| 16 and 17 Years | 105 (14.0%) | 43 (3.8%) |
| 18 to 24 Years | 144 (4.9%) | 257 (9.7%) |
| 25 to 34 Years | 340 (5.7%) | 750 (13.4%) |
| 35 to 44 Years | 268 (5.4%) | 233 (5.2%) |
| 45 to 54 Years | 126 (3.6%) | 436 (12.0%) |
| 55 to 64 Years | 280 (8.0%) | 346 (8.8%) |
| 65 to 74 Years | 83 (5.0%) | 308 (13.8%) |
| 75 Years and over | 160 (21.0%) | 23 (1.8%) |
| Total | 2,349 (7.6%) | 3,595 (10.8%) |
Income Above Poverty by Sex and Age in Spring
According to the poverty statistics in Spring, males aged 45 to 54 years and females aged 5 years are the age groups that are most secure financially, with 96.4% of males and 100.0% of females in these age groups living above the poverty line.
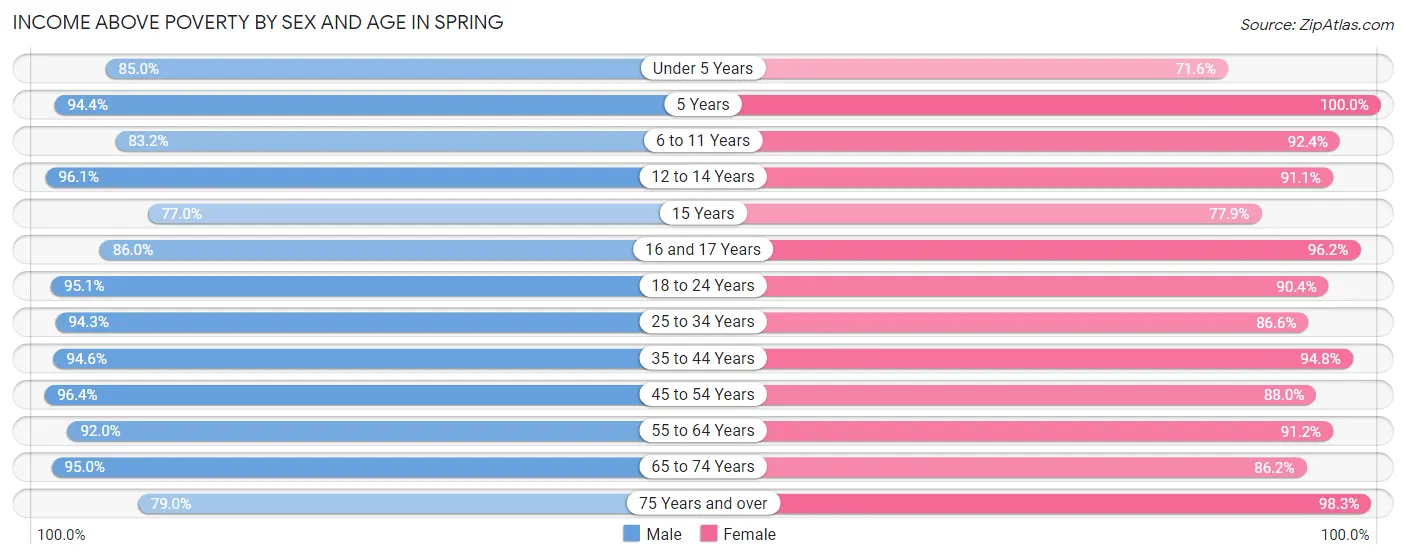
| Age Bracket | Male | Female |
| Under 5 Years | 1,806 (85.0%) | 1,924 (71.6%) |
| 5 Years | 476 (94.4%) | 364 (100.0%) |
| 6 to 11 Years | 2,042 (83.2%) | 3,670 (92.4%) |
| 12 to 14 Years | 1,463 (96.1%) | 851 (91.1%) |
| 15 Years | 77 (77.0%) | 183 (77.9%) |
| 16 and 17 Years | 647 (86.0%) | 1,086 (96.2%) |
| 18 to 24 Years | 2,787 (95.1%) | 2,406 (90.3%) |
| 25 to 34 Years | 5,585 (94.3%) | 4,833 (86.6%) |
| 35 to 44 Years | 4,720 (94.6%) | 4,259 (94.8%) |
| 45 to 54 Years | 3,339 (96.4%) | 3,209 (88.0%) |
| 55 to 64 Years | 3,237 (92.0%) | 3,562 (91.1%) |
| 65 to 74 Years | 1,568 (95.0%) | 1,927 (86.2%) |
| 75 Years and over | 601 (79.0%) | 1,288 (98.3%) |
| Total | 28,348 (92.3%) | 29,562 (89.2%) |
Income Below Poverty Among Married-Couple Families in Spring
The poverty statistics for married-couple families in Spring show that 3.2% or 374 of the total 11,654 families live below the poverty line. Families with 3 or 4 children have the highest poverty rate of 7.2%, comprising of 117 families. On the other hand, families with 5 or more children have the lowest poverty rate of 0.0%, which includes 0 families.
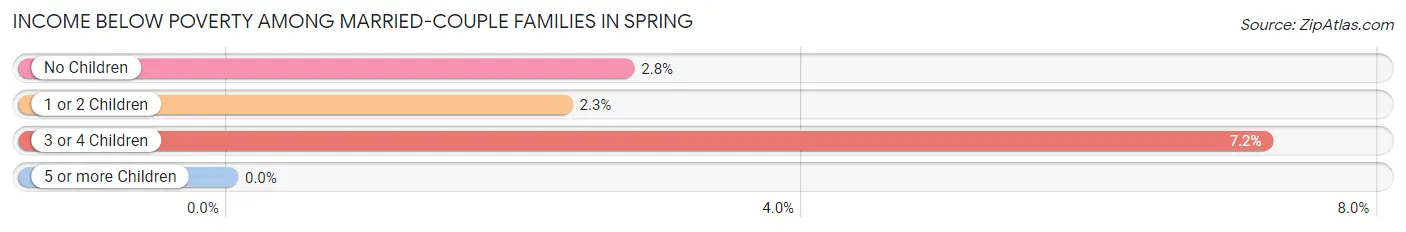
| Children | Above Poverty | Below Poverty |
| No Children | 5,819 (97.2%) | 165 (2.8%) |
| 1 or 2 Children | 3,858 (97.7%) | 92 (2.3%) |
| 3 or 4 Children | 1,505 (92.8%) | 117 (7.2%) |
| 5 or more Children | 98 (100.0%) | 0 (0.0%) |
| Total | 11,280 (96.8%) | 374 (3.2%) |
Income Below Poverty Among Single-Parent Households in Spring
According to the poverty data in Spring, 14.9% or 178 single-father households and 20.7% or 588 single-mother households are living below the poverty line. Among single-father households, those with 5 or more children have the highest poverty rate, with 18 households (100.0%) experiencing poverty. Likewise, among single-mother households, those with 5 or more children have the highest poverty rate, with 20 households (100.0%) falling below the poverty line.
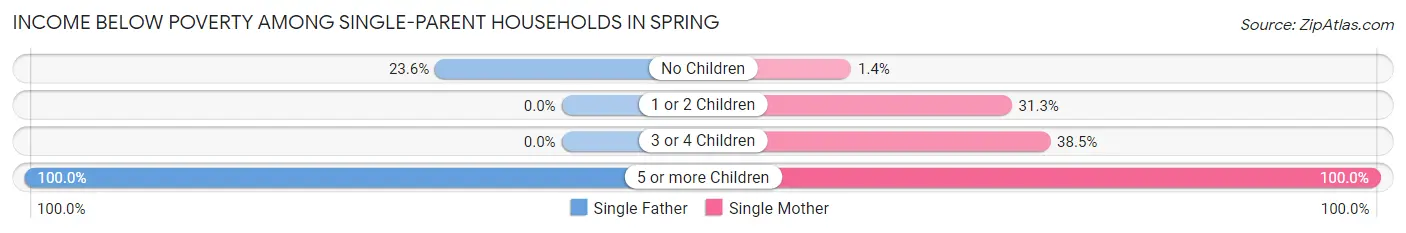
| Children | Single Father | Single Mother |
| No Children | 160 (23.6%) | 16 (1.4%) |
| 1 or 2 Children | 0 (0.0%) | 377 (31.3%) |
| 3 or 4 Children | 0 (0.0%) | 175 (38.5%) |
| 5 or more Children | 18 (100.0%) | 20 (100.0%) |
| Total | 178 (14.9%) | 588 (20.7%) |
Income Below Poverty Among Married-Couple vs Single-Parent Households in Spring
The poverty data for Spring shows that 374 of the married-couple family households (3.2%) and 766 of the single-parent households (19.0%) are living below the poverty level. Within the married-couple family households, those with 3 or 4 children have the highest poverty rate, with 117 households (7.2%) falling below the poverty line. Among the single-parent households, those with 5 or more children have the highest poverty rate, with 38 household (100.0%) living below poverty.
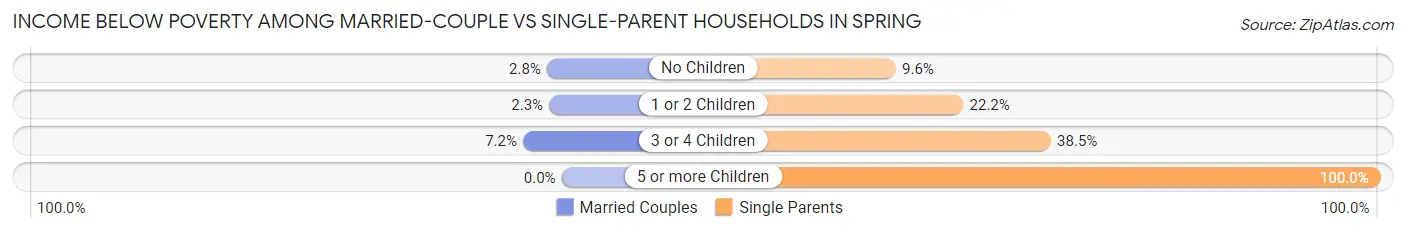
| Children | Married-Couple Families | Single-Parent Households |
| No Children | 165 (2.8%) | 176 (9.6%) |
| 1 or 2 Children | 92 (2.3%) | 377 (22.2%) |
| 3 or 4 Children | 117 (7.2%) | 175 (38.5%) |
| 5 or more Children | 0 (0.0%) | 38 (100.0%) |
| Total | 374 (3.2%) | 766 (19.0%) |
Race in Spring
The most populous races in Spring are White / Caucasian (32,929 | 51.5%), Hispanic or Latino (25,609 | 40.1%), and Black / African American (13,795 | 21.6%).
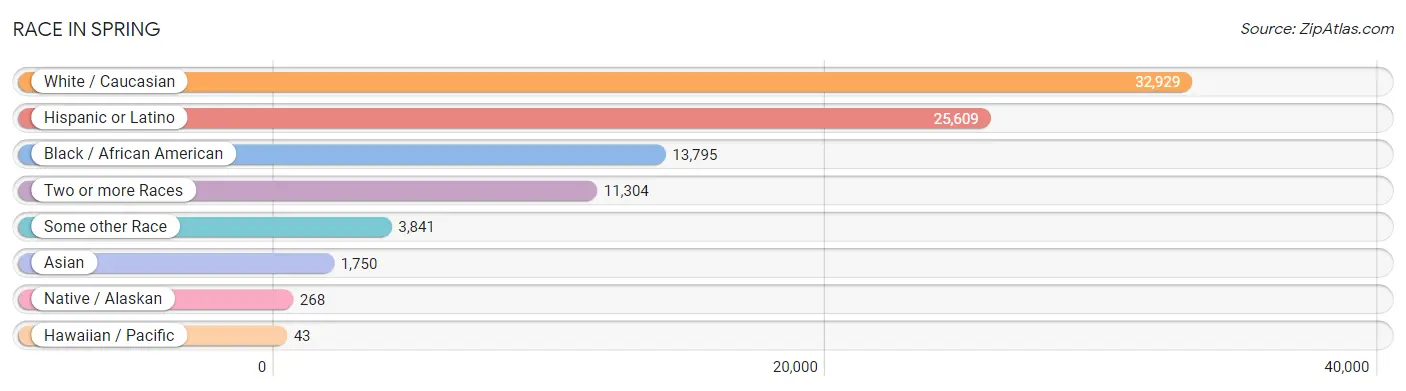
| Race | # Population | % Population |
| Asian | 1,750 | 2.7% |
| Black / African American | 13,795 | 21.6% |
| Hawaiian / Pacific | 43 | 0.1% |
| Hispanic or Latino | 25,609 | 40.1% |
| Native / Alaskan | 268 | 0.4% |
| White / Caucasian | 32,929 | 51.5% |
| Two or more Races | 11,304 | 17.7% |
| Some other Race | 3,841 | 6.0% |
| Total | 63,930 | 100.0% |
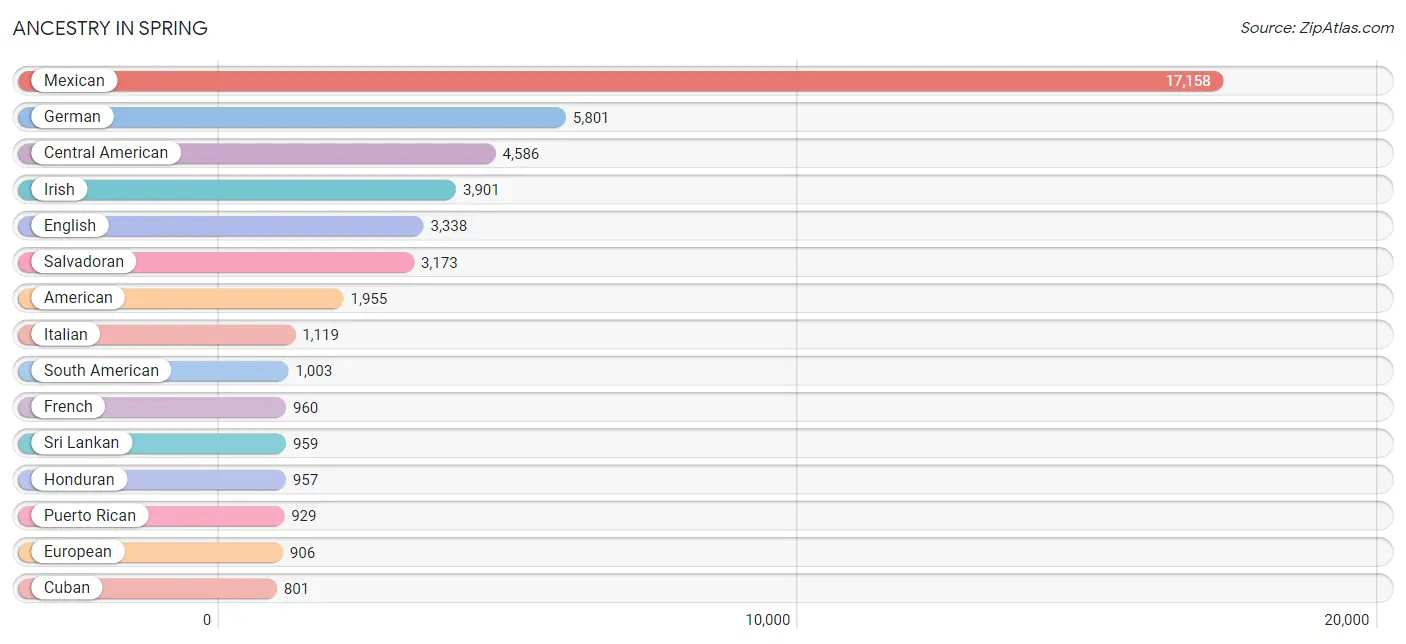
Ancestry in Spring
The most populous ancestries reported in Spring are Mexican (17,158 | 26.8%), German (5,801 | 9.1%), Central American (4,586 | 7.2%), Irish (3,901 | 6.1%), and English (3,338 | 5.2%), together accounting for 54.4% of all Spring residents.
| Ancestry | # Population | % Population |
| African | 366 | 0.6% |
| American | 1,955 | 3.1% |
| Apache | 33 | 0.1% |
| Arab | 316 | 0.5% |
| Argentinean | 23 | 0.0% |
| Armenian | 2 | 0.0% |
| Assyrian / Chaldean / Syriac | 16 | 0.0% |
| Bahamian | 12 | 0.0% |
| Belizean | 23 | 0.0% |
| Bhutanese | 115 | 0.2% |
| Brazilian | 8 | 0.0% |
| British | 104 | 0.2% |
| Burmese | 105 | 0.2% |
| Central American | 4,586 | 7.2% |
| Central American Indian | 98 | 0.2% |
| Cherokee | 191 | 0.3% |
| Chilean | 336 | 0.5% |
| Chinese | 30 | 0.1% |
| Choctaw | 130 | 0.2% |
| Colombian | 169 | 0.3% |
| Costa Rican | 72 | 0.1% |
| Creek | 9 | 0.0% |
| Cuban | 801 | 1.3% |
| Czech | 120 | 0.2% |
| Danish | 85 | 0.1% |
| Dominican | 365 | 0.6% |
| Dutch | 219 | 0.3% |
| Ecuadorian | 223 | 0.4% |
| Egyptian | 85 | 0.1% |
| English | 3,338 | 5.2% |
| European | 906 | 1.4% |
| Finnish | 43 | 0.1% |
| French | 960 | 1.5% |
| French Canadian | 109 | 0.2% |
| German | 5,801 | 9.1% |
| Greek | 108 | 0.2% |
| Guamanian / Chamorro | 95 | 0.2% |
| Guatemalan | 362 | 0.6% |
| Honduran | 957 | 1.5% |
| Hungarian | 138 | 0.2% |
| Indian (Asian) | 259 | 0.4% |
| Iranian | 18 | 0.0% |
| Irish | 3,901 | 6.1% |
| Iroquois | 10 | 0.0% |
| Italian | 1,119 | 1.8% |
| Jamaican | 42 | 0.1% |
| Japanese | 82 | 0.1% |
| Korean | 428 | 0.7% |
| Laotian | 11 | 0.0% |
| Lebanese | 60 | 0.1% |
| Lithuanian | 6 | 0.0% |
| Mexican | 17,158 | 26.8% |
| Mexican American Indian | 313 | 0.5% |
| Moroccan | 102 | 0.2% |
| Native Hawaiian | 8 | 0.0% |
| Nicaraguan | 22 | 0.0% |
| Nigerian | 424 | 0.7% |
| Northern European | 11 | 0.0% |
| Norwegian | 355 | 0.6% |
| Pakistani | 40 | 0.1% |
| Palestinian | 69 | 0.1% |
| Peruvian | 118 | 0.2% |
| Polish | 409 | 0.6% |
| Portuguese | 31 | 0.1% |
| Puerto Rican | 929 | 1.5% |
| Romanian | 18 | 0.0% |
| Russian | 168 | 0.3% |
| Salvadoran | 3,173 | 5.0% |
| Scandinavian | 301 | 0.5% |
| Scotch-Irish | 202 | 0.3% |
| Scottish | 626 | 1.0% |
| Slavic | 13 | 0.0% |
| Slovak | 36 | 0.1% |
| Slovene | 13 | 0.0% |
| South American | 1,003 | 1.6% |
| Spaniard | 135 | 0.2% |
| Spanish | 171 | 0.3% |
| Sri Lankan | 959 | 1.5% |
| Subsaharan African | 790 | 1.2% |
| Swedish | 134 | 0.2% |
| Swiss | 15 | 0.0% |
| Thai | 282 | 0.4% |
| Trinidadian and Tobagonian | 102 | 0.2% |
| Ukrainian | 13 | 0.0% |
| Uruguayan | 96 | 0.2% |
| Venezuelan | 38 | 0.1% |
| Welsh | 142 | 0.2% |
| West Indian | 29 | 0.1% |
| Yaqui | 13 | 0.0% | View All 89 Rows |
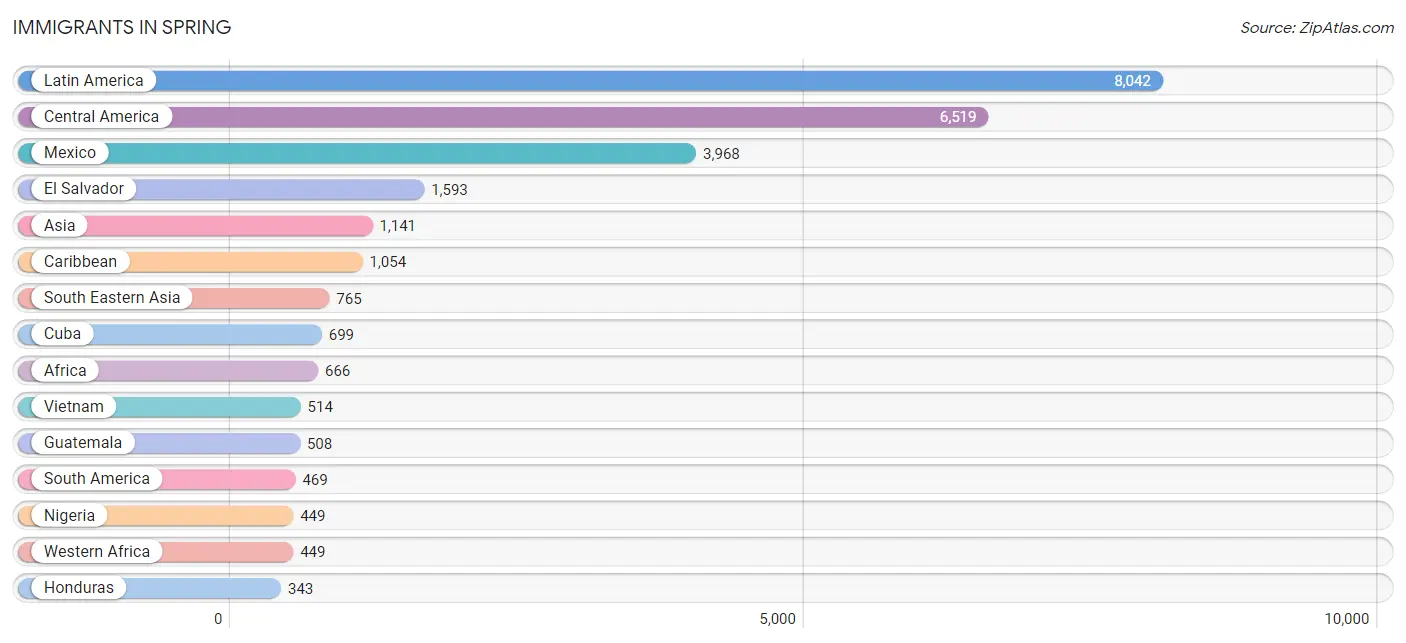
Immigrants in Spring
The most numerous immigrant groups reported in Spring came from Latin America (8,042 | 12.6%), Central America (6,519 | 10.2%), Mexico (3,968 | 6.2%), El Salvador (1,593 | 2.5%), and Asia (1,141 | 1.8%), together accounting for 33.3% of all Spring residents.
| Immigration Origin | # Population | % Population |
| Africa | 666 | 1.0% |
| Argentina | 46 | 0.1% |
| Asia | 1,141 | 1.8% |
| Belize | 23 | 0.0% |
| Brazil | 8 | 0.0% |
| Cambodia | 49 | 0.1% |
| Canada | 88 | 0.1% |
| Caribbean | 1,054 | 1.7% |
| Central America | 6,519 | 10.2% |
| Chile | 86 | 0.1% |
| China | 79 | 0.1% |
| Colombia | 112 | 0.2% |
| Costa Rica | 53 | 0.1% |
| Cuba | 699 | 1.1% |
| Dominican Republic | 59 | 0.1% |
| Eastern Asia | 125 | 0.2% |
| Eastern Europe | 147 | 0.2% |
| Ecuador | 142 | 0.2% |
| Egypt | 101 | 0.2% |
| El Salvador | 1,593 | 2.5% |
| England | 91 | 0.1% |
| Europe | 325 | 0.5% |
| France | 48 | 0.1% |
| Germany | 7 | 0.0% |
| Greece | 21 | 0.0% |
| Guatemala | 508 | 0.8% |
| Honduras | 343 | 0.5% |
| India | 82 | 0.1% |
| Iran | 31 | 0.1% |
| Jordan | 29 | 0.1% |
| Korea | 46 | 0.1% |
| Latin America | 8,042 | 12.6% |
| Mexico | 3,968 | 6.2% |
| Morocco | 116 | 0.2% |
| Nicaragua | 31 | 0.1% |
| Nigeria | 449 | 0.7% |
| Northern Africa | 217 | 0.3% |
| Northern Europe | 102 | 0.2% |
| Pakistan | 62 | 0.1% |
| Peru | 59 | 0.1% |
| Philippines | 171 | 0.3% |
| Romania | 36 | 0.1% |
| Russia | 111 | 0.2% |
| Saudi Arabia | 18 | 0.0% |
| South America | 469 | 0.7% |
| South Central Asia | 189 | 0.3% |
| South Eastern Asia | 765 | 1.2% |
| Southern Europe | 21 | 0.0% |
| Taiwan | 18 | 0.0% |
| Thailand | 31 | 0.1% |
| Trinidad and Tobago | 143 | 0.2% |
| Venezuela | 16 | 0.0% |
| Vietnam | 514 | 0.8% |
| Western Africa | 449 | 0.7% |
| Western Asia | 62 | 0.1% |
| Western Europe | 55 | 0.1% | View All 56 Rows |
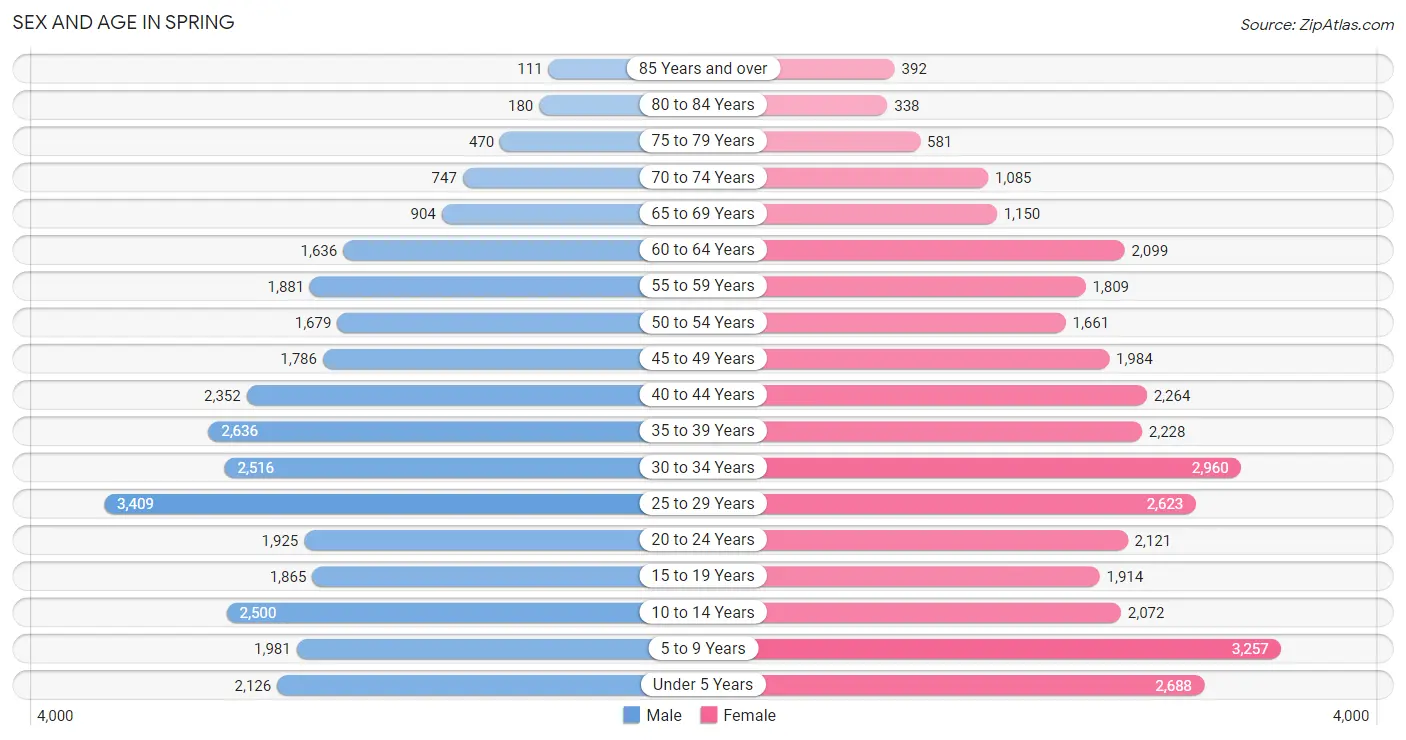
Sex and Age in Spring
Sex and Age in Spring
The most populous age groups in Spring are 25 to 29 Years (3,409 | 11.1%) for men and 5 to 9 Years (3,257 | 9.8%) for women.
| Age Bracket | Male | Female |
| Under 5 Years | 2,126 (6.9%) | 2,688 (8.1%) |
| 5 to 9 Years | 1,981 (6.5%) | 3,257 (9.8%) |
| 10 to 14 Years | 2,500 (8.1%) | 2,072 (6.2%) |
| 15 to 19 Years | 1,865 (6.1%) | 1,914 (5.8%) |
| 20 to 24 Years | 1,925 (6.3%) | 2,121 (6.4%) |
| 25 to 29 Years | 3,409 (11.1%) | 2,623 (7.9%) |
| 30 to 34 Years | 2,516 (8.2%) | 2,960 (8.9%) |
| 35 to 39 Years | 2,636 (8.6%) | 2,228 (6.7%) |
| 40 to 44 Years | 2,352 (7.7%) | 2,264 (6.8%) |
| 45 to 49 Years | 1,786 (5.8%) | 1,984 (6.0%) |
| 50 to 54 Years | 1,679 (5.5%) | 1,661 (5.0%) |
| 55 to 59 Years | 1,881 (6.1%) | 1,809 (5.4%) |
| 60 to 64 Years | 1,636 (5.3%) | 2,099 (6.3%) |
| 65 to 69 Years | 904 (2.9%) | 1,150 (3.5%) |
| 70 to 74 Years | 747 (2.4%) | 1,085 (3.3%) |
| 75 to 79 Years | 470 (1.5%) | 581 (1.8%) |
| 80 to 84 Years | 180 (0.6%) | 338 (1.0%) |
| 85 Years and over | 111 (0.4%) | 392 (1.2%) |
| Total | 30,704 (100.0%) | 33,226 (100.0%) |
Families and Households in Spring
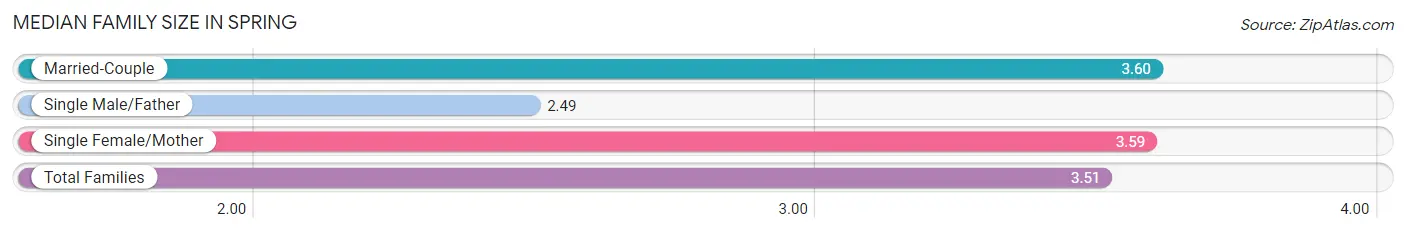
Median Family Size in Spring
The median family size in Spring is 3.51 persons per family, with married-couple families (11,654 | 74.3%) accounting for the largest median family size of 3.6 persons per family. On the other hand, single male/father families (1,194 | 7.6%) represent the smallest median family size with 2.49 persons per family.
| Family Type | # Families | Family Size |
| Married-Couple | 11,654 (74.3%) | 3.60 |
| Single Male/Father | 1,194 (7.6%) | 2.49 |
| Single Female/Mother | 2,838 (18.1%) | 3.59 |
| Total Families | 15,686 (100.0%) | 3.51 |
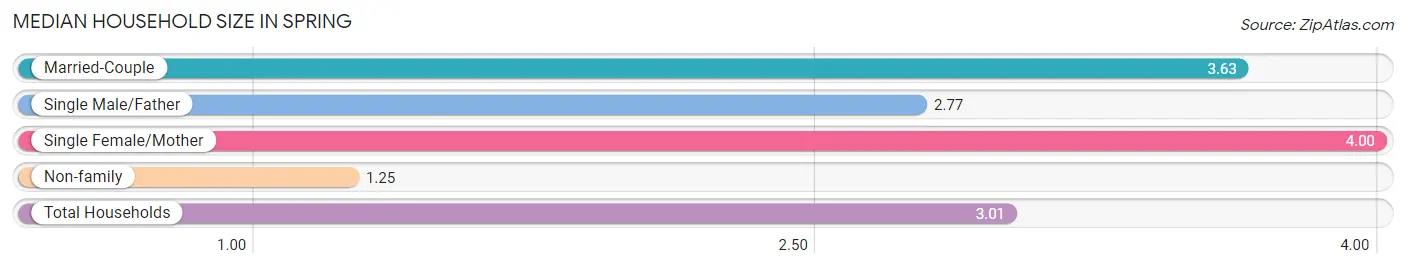
Median Household Size in Spring
The median household size in Spring is 3.01 persons per household, with single female/mother households (2,838 | 13.4%) accounting for the largest median household size of 4 persons per household. non-family households (5,551 | 26.1%) represent the smallest median household size with 1.25 persons per household.
| Household Type | # Households | Household Size |
| Married-Couple | 11,654 (54.9%) | 3.63 |
| Single Male/Father | 1,194 (5.6%) | 2.77 |
| Single Female/Mother | 2,838 (13.4%) | 4.00 |
| Non-family | 5,551 (26.1%) | 1.25 |
| Total Households | 21,237 (100.0%) | 3.01 |
Household Size by Marriage Status in Spring
Out of a total of 21,237 households in Spring, 15,686 (73.9%) are family households, while 5,551 (26.1%) are nonfamily households. The most numerous type of family households are 2-person households, comprising 5,609, and the most common type of nonfamily households are 1-person households, comprising 4,296.
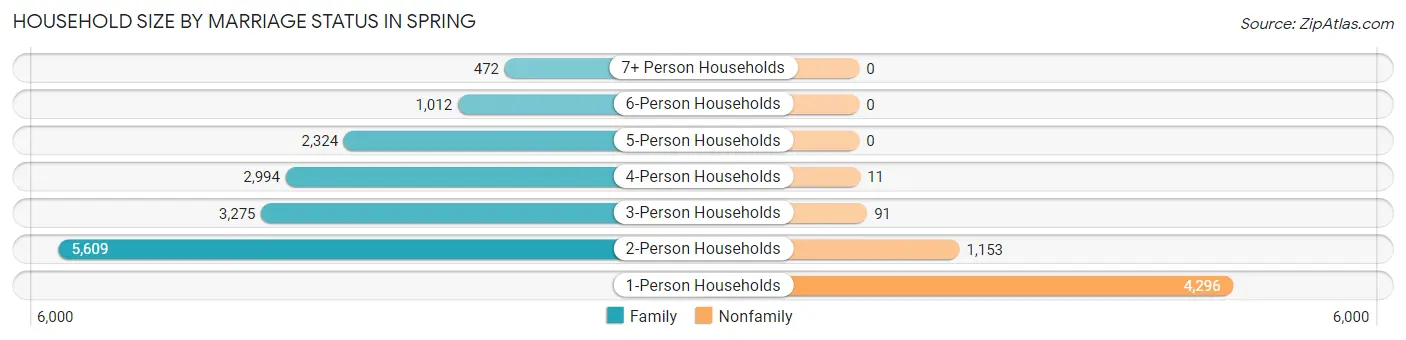
| Household Size | Family Households | Nonfamily Households |
| 1-Person Households | - | 4,296 (20.2%) |
| 2-Person Households | 5,609 (26.4%) | 1,153 (5.4%) |
| 3-Person Households | 3,275 (15.4%) | 91 (0.4%) |
| 4-Person Households | 2,994 (14.1%) | 11 (0.1%) |
| 5-Person Households | 2,324 (10.9%) | 0 (0.0%) |
| 6-Person Households | 1,012 (4.8%) | 0 (0.0%) |
| 7+ Person Households | 472 (2.2%) | 0 (0.0%) |
| Total | 15,686 (73.9%) | 5,551 (26.1%) |
Female Fertility in Spring
Fertility by Age in Spring
Average fertility rate in Spring is 47.0 births per 1,000 women. Women in the age bracket of 20 to 34 years have the highest fertility rate with 70.0 births per 1,000 women. Women in the age bracket of 20 to 34 years acount for 67.9% of all women with births.
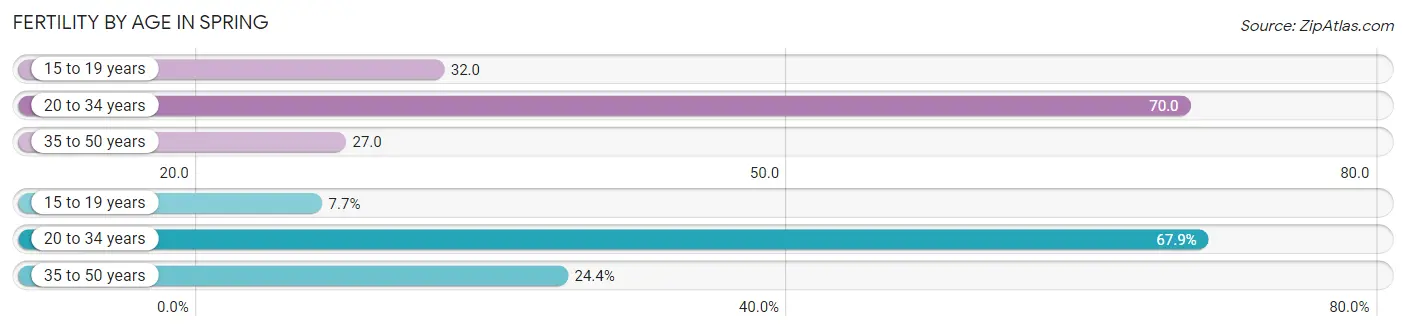
| Age Bracket | Women with Births | Births / 1,000 Women |
| 15 to 19 years | 61 (7.7%) | 32.0 |
| 20 to 34 years | 537 (67.9%) | 70.0 |
| 35 to 50 years | 193 (24.4%) | 27.0 |
| Total | 791 (100.0%) | 47.0 |
Fertility by Age by Marriage Status in Spring
68.9% of women with births (791) in Spring are married. The highest percentage of unmarried women with births falls into 15 to 19 years age bracket with 100.0% of them unmarried at the time of birth, while the lowest percentage of unmarried women with births belong to 35 to 50 years age bracket with 13.5% of them unmarried.

| Age Bracket | Married | Unmarried |
| 15 to 19 years | 0 (0.0%) | 61 (100.0%) |
| 20 to 34 years | 378 (70.4%) | 159 (29.6%) |
| 35 to 50 years | 167 (86.5%) | 26 (13.5%) |
| Total | 545 (68.9%) | 246 (31.1%) |
Fertility by Education in Spring
Average fertility rate in Spring is 47.0 births per 1,000 women. Women with the education attainment of bachelor's degree have the highest fertility rate of 66.0 births per 1,000 women, while women with the education attainment of college or associate's degree have the lowest fertility at 33.0 births per 1,000 women. Women with the education attainment of high school diploma represent 33.9% of all women with births.
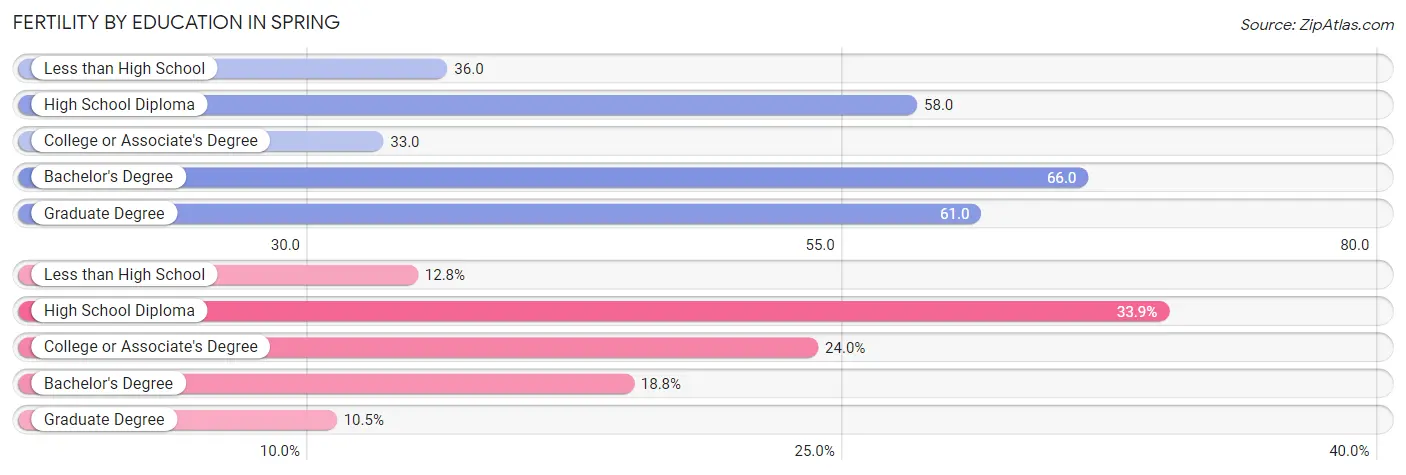
| Educational Attainment | Women with Births | Births / 1,000 Women |
| Less than High School | 101 (12.8%) | 36.0 |
| High School Diploma | 268 (33.9%) | 58.0 |
| College or Associate's Degree | 190 (24.0%) | 33.0 |
| Bachelor's Degree | 149 (18.8%) | 66.0 |
| Graduate Degree | 83 (10.5%) | 61.0 |
| Total | 791 (100.0%) | 47.0 |
Fertility by Education by Marriage Status in Spring
31.1% of women with births in Spring are unmarried. Women with the educational attainment of bachelor's degree are most likely to be married with 100.0% of them married at childbirth, while women with the educational attainment of less than high school are least likely to be married with 87.1% of them unmarried at childbirth.
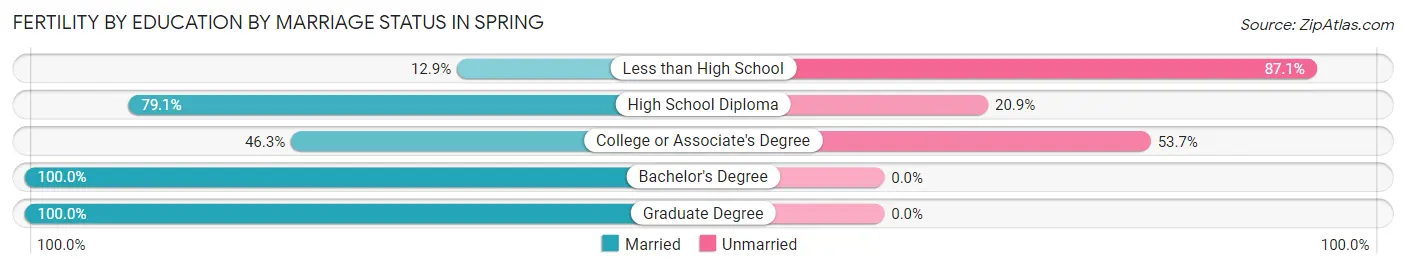
| Educational Attainment | Married | Unmarried |
| Less than High School | 13 (12.9%) | 88 (87.1%) |
| High School Diploma | 212 (79.1%) | 56 (20.9%) |
| College or Associate's Degree | 88 (46.3%) | 102 (53.7%) |
| Bachelor's Degree | 149 (100.0%) | 0 (0.0%) |
| Graduate Degree | 83 (100.0%) | 0 (0.0%) |
| Total | 545 (68.9%) | 246 (31.1%) |
Employment Characteristics in Spring
Employment by Class of Employer in Spring
Among the 32,178 employed individuals in Spring, private company employees (23,274 | 72.3%), self-employed (not incorporated) (2,457 | 7.6%), and local government employees (2,006 | 6.2%) make up the most common classes of employment.
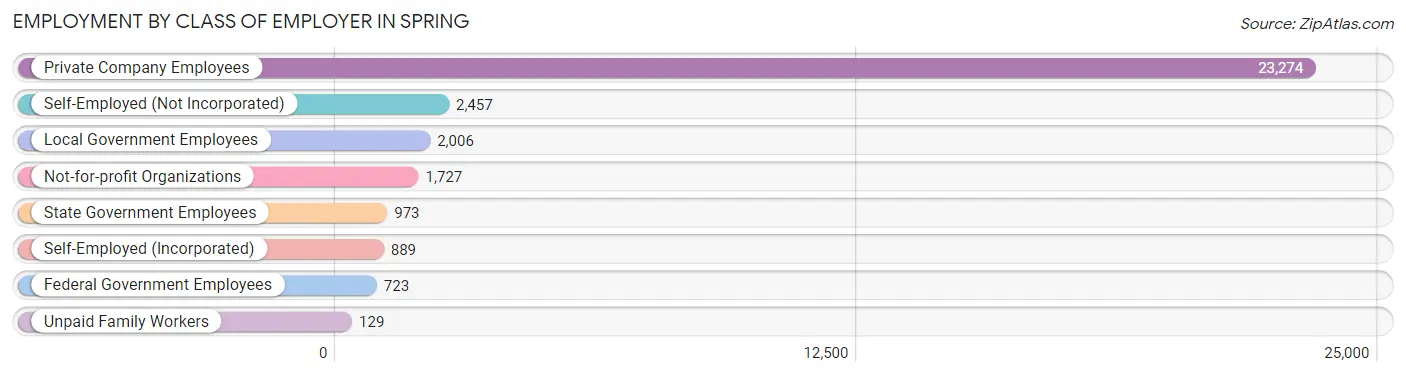
| Employer Class | # Employees | % Employees |
| Private Company Employees | 23,274 | 72.3% |
| Self-Employed (Incorporated) | 889 | 2.8% |
| Self-Employed (Not Incorporated) | 2,457 | 7.6% |
| Not-for-profit Organizations | 1,727 | 5.4% |
| Local Government Employees | 2,006 | 6.2% |
| State Government Employees | 973 | 3.0% |
| Federal Government Employees | 723 | 2.2% |
| Unpaid Family Workers | 129 | 0.4% |
| Total | 32,178 | 100.0% |
Employment Status by Age in Spring
According to the labor force statistics for Spring, out of the total population over 16 years of age (48,965), 70.2% or 34,373 individuals are in the labor force, with 4.6% or 1,581 of them unemployed. The age group with the highest labor force participation rate is 45 to 54 years, with 86.7% or 6,164 individuals in the labor force. Within the labor force, the 65 to 74 years age range has the highest percentage of unemployed individuals, with 11.2% or 111 of them being unemployed.
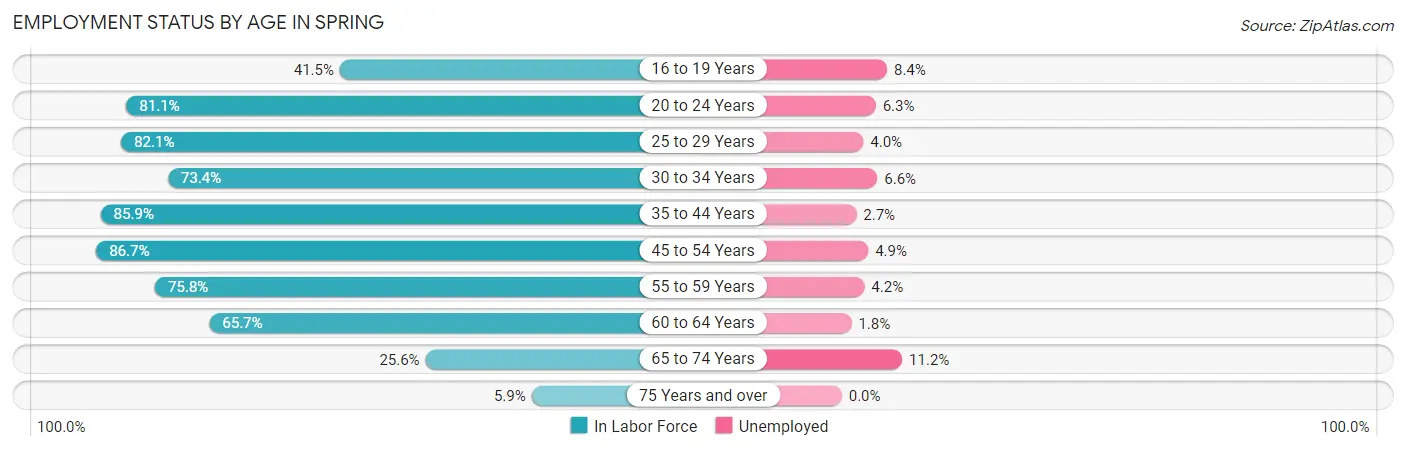
| Age Bracket | In Labor Force | Unemployed |
| 16 to 19 Years | 1,427 (41.5%) | 120 (8.4%) |
| 20 to 24 Years | 3,281 (81.1%) | 207 (6.3%) |
| 25 to 29 Years | 4,952 (82.1%) | 198 (4.0%) |
| 30 to 34 Years | 4,019 (73.4%) | 265 (6.6%) |
| 35 to 44 Years | 8,143 (85.9%) | 220 (2.7%) |
| 45 to 54 Years | 6,164 (86.7%) | 302 (4.9%) |
| 55 to 59 Years | 2,797 (75.8%) | 117 (4.2%) |
| 60 to 64 Years | 2,454 (65.7%) | 44 (1.8%) |
| 65 to 74 Years | 995 (25.6%) | 111 (11.2%) |
| 75 Years and over | 122 (5.9%) | 0 (0.0%) |
| Total | 34,373 (70.2%) | 1,581 (4.6%) |
Employment Status by Educational Attainment in Spring
According to labor force statistics for Spring, 80.3% of individuals (28,525) out of the total population between 25 and 64 years of age (35,523) are in the labor force, with 4.0% or 1,141 of them being unemployed. The group with the highest labor force participation rate are those with the educational attainment of bachelor's degree or higher, with 88.4% or 7,793 individuals in the labor force. Within the labor force, individuals with less than high school education have the highest percentage of unemployment, with 4.7% or 113 of them being unemployed.
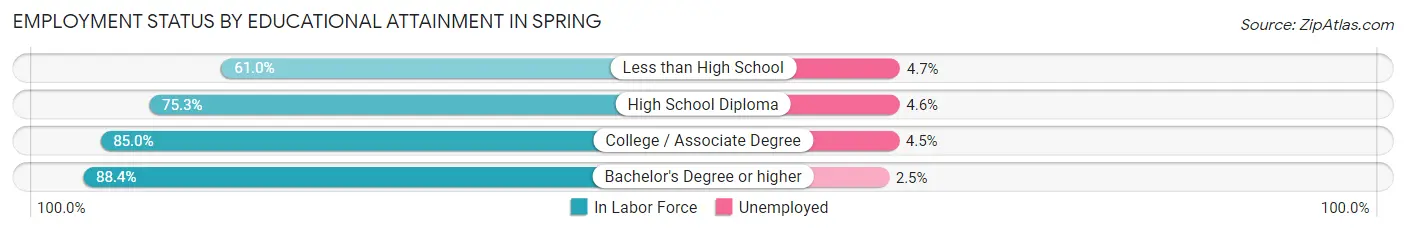
| Educational Attainment | In Labor Force | Unemployed |
| Less than High School | 2,403 (61.0%) | 185 (4.7%) |
| High School Diploma | 7,875 (75.3%) | 481 (4.6%) |
| College / Associate Degree | 10,464 (85.0%) | 554 (4.5%) |
| Bachelor's Degree or higher | 7,793 (88.4%) | 220 (2.5%) |
| Total | 28,525 (80.3%) | 1,421 (4.0%) |
Employment Occupations by Sex in Spring
Management, Business, Science and Arts Occupations
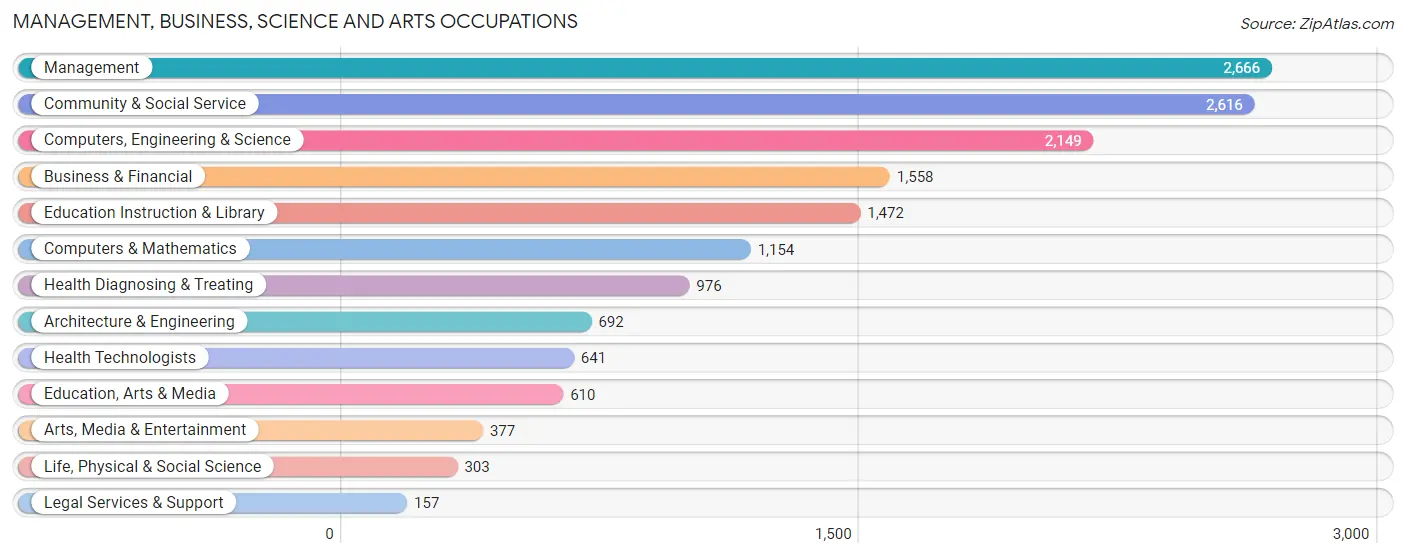
The most common Management, Business, Science and Arts occupations in Spring are Management (2,666 | 8.2%), Community & Social Service (2,616 | 8.0%), Computers, Engineering & Science (2,149 | 6.6%), Business & Financial (1,558 | 4.8%), and Education Instruction & Library (1,472 | 4.5%).
Management, Business, Science and Arts Occupations by Sex
Within the Management, Business, Science and Arts occupations in Spring, the most male-oriented occupations are Architecture & Engineering (93.1%), Computers & Mathematics (91.1%), and Computers, Engineering & Science (86.3%), while the most female-oriented occupations are Health Diagnosing & Treating (76.1%), Education, Arts & Media (74.9%), and Health Technologists (74.6%).
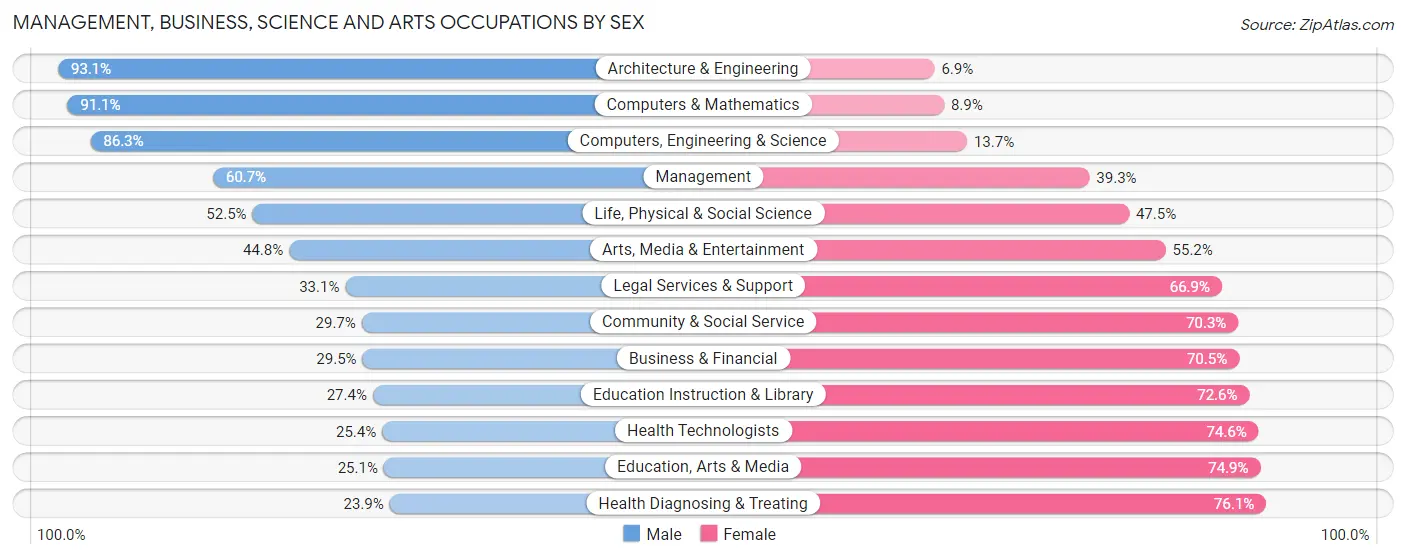
| Occupation | Male | Female |
| Management | 1,619 (60.7%) | 1,047 (39.3%) |
| Business & Financial | 460 (29.5%) | 1,098 (70.5%) |
| Computers, Engineering & Science | 1,854 (86.3%) | 295 (13.7%) |
| Computers & Mathematics | 1,051 (91.1%) | 103 (8.9%) |
| Architecture & Engineering | 644 (93.1%) | 48 (6.9%) |
| Life, Physical & Social Science | 159 (52.5%) | 144 (47.5%) |
| Community & Social Service | 777 (29.7%) | 1,839 (70.3%) |
| Education, Arts & Media | 153 (25.1%) | 457 (74.9%) |
| Legal Services & Support | 52 (33.1%) | 105 (66.9%) |
| Education Instruction & Library | 403 (27.4%) | 1,069 (72.6%) |
| Arts, Media & Entertainment | 169 (44.8%) | 208 (55.2%) |
| Health Diagnosing & Treating | 233 (23.9%) | 743 (76.1%) |
| Health Technologists | 163 (25.4%) | 478 (74.6%) |
| Total (Category) | 4,943 (49.6%) | 5,022 (50.4%) |
| Total (Overall) | 17,984 (55.0%) | 14,721 (45.0%) |
Services Occupations
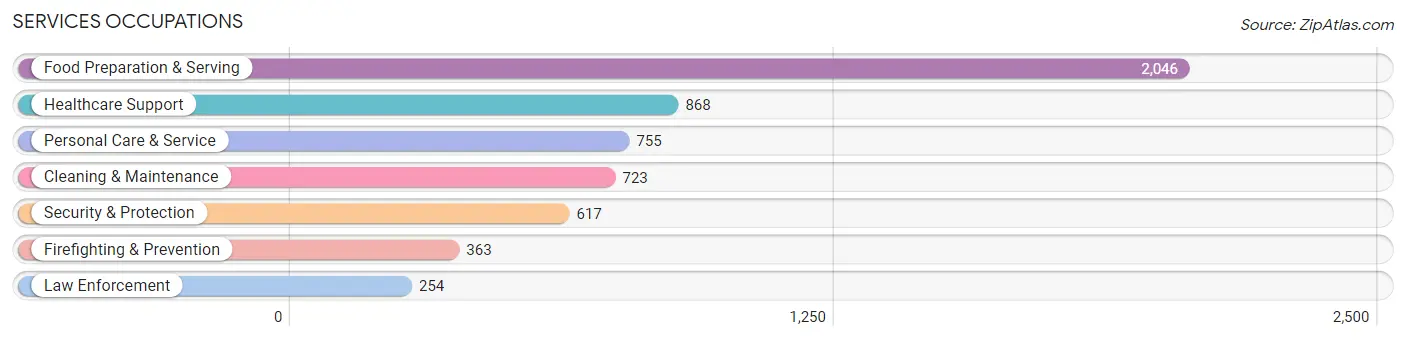
The most common Services occupations in Spring are Food Preparation & Serving (2,046 | 6.3%), Healthcare Support (868 | 2.6%), Personal Care & Service (755 | 2.3%), Cleaning & Maintenance (723 | 2.2%), and Security & Protection (617 | 1.9%).
Services Occupations by Sex
Within the Services occupations in Spring, the most male-oriented occupations are Law Enforcement (95.7%), Security & Protection (82.2%), and Firefighting & Prevention (72.7%), while the most female-oriented occupations are Personal Care & Service (98.7%), Healthcare Support (87.4%), and Food Preparation & Serving (52.5%).
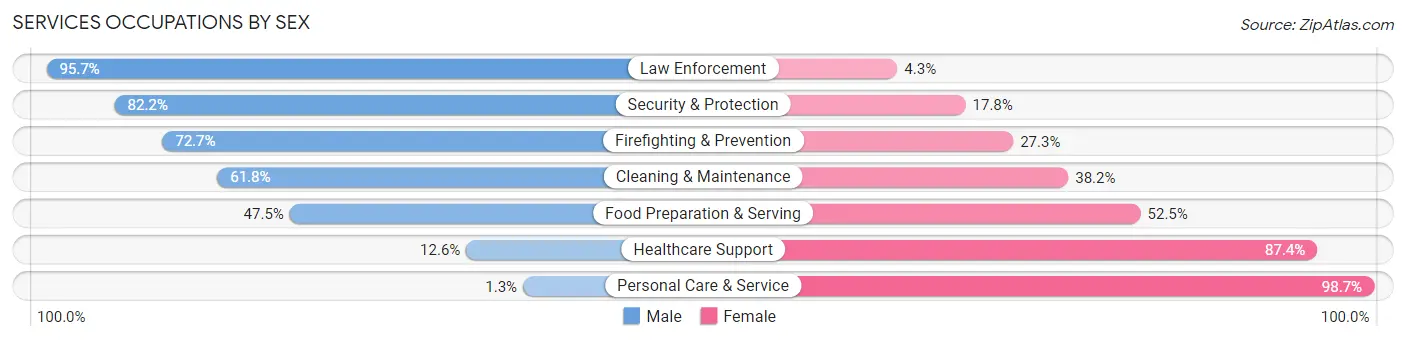
| Occupation | Male | Female |
| Healthcare Support | 109 (12.6%) | 759 (87.4%) |
| Security & Protection | 507 (82.2%) | 110 (17.8%) |
| Firefighting & Prevention | 264 (72.7%) | 99 (27.3%) |
| Law Enforcement | 243 (95.7%) | 11 (4.3%) |
| Food Preparation & Serving | 972 (47.5%) | 1,074 (52.5%) |
| Cleaning & Maintenance | 447 (61.8%) | 276 (38.2%) |
| Personal Care & Service | 10 (1.3%) | 745 (98.7%) |
| Total (Category) | 2,045 (40.8%) | 2,964 (59.2%) |
| Total (Overall) | 17,984 (55.0%) | 14,721 (45.0%) |
Sales and Office Occupations
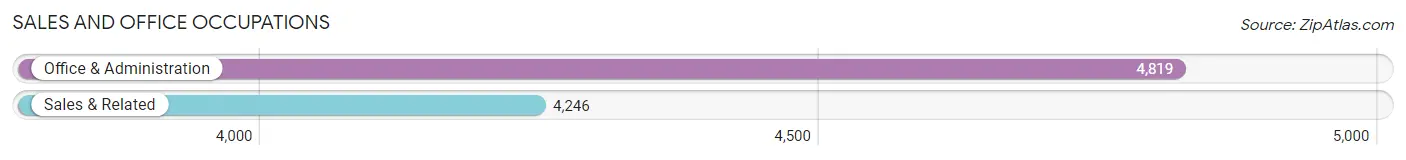
The most common Sales and Office occupations in Spring are Office & Administration (4,819 | 14.7%), and Sales & Related (4,246 | 13.0%).
Sales and Office Occupations by Sex
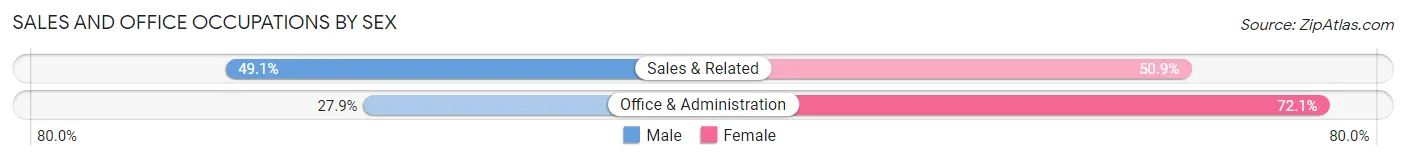
| Occupation | Male | Female |
| Sales & Related | 2,086 (49.1%) | 2,160 (50.9%) |
| Office & Administration | 1,343 (27.9%) | 3,476 (72.1%) |
| Total (Category) | 3,429 (37.8%) | 5,636 (62.2%) |
| Total (Overall) | 17,984 (55.0%) | 14,721 (45.0%) |
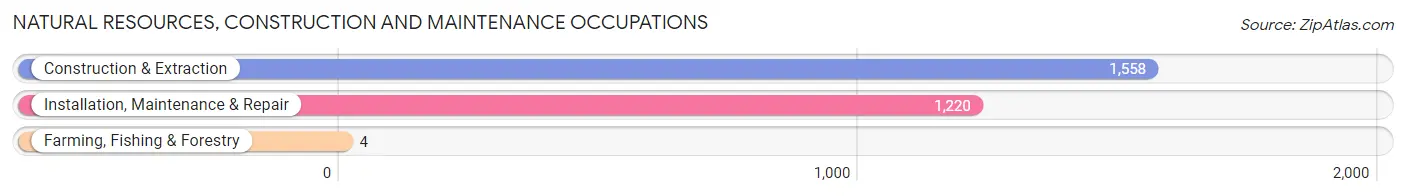
Natural Resources, Construction and Maintenance Occupations
The most common Natural Resources, Construction and Maintenance occupations in Spring are Construction & Extraction (1,558 | 4.8%), Installation, Maintenance & Repair (1,220 | 3.7%), and Farming, Fishing & Forestry (4 | 0.0%).
Natural Resources, Construction and Maintenance Occupations by Sex
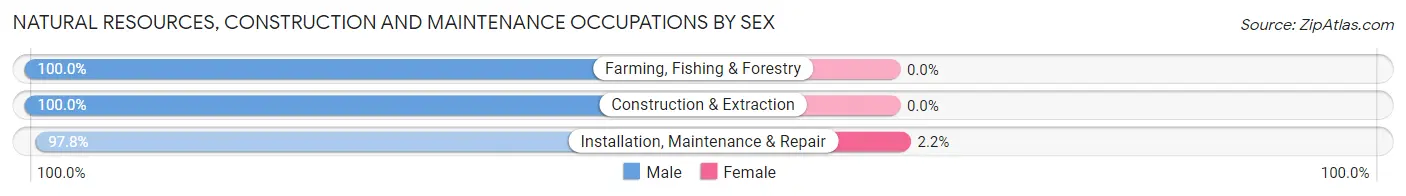
| Occupation | Male | Female |
| Farming, Fishing & Forestry | 4 (100.0%) | 0 (0.0%) |
| Construction & Extraction | 1,558 (100.0%) | 0 (0.0%) |
| Installation, Maintenance & Repair | 1,193 (97.8%) | 27 (2.2%) |
| Total (Category) | 2,755 (99.0%) | 27 (1.0%) |
| Total (Overall) | 17,984 (55.0%) | 14,721 (45.0%) |
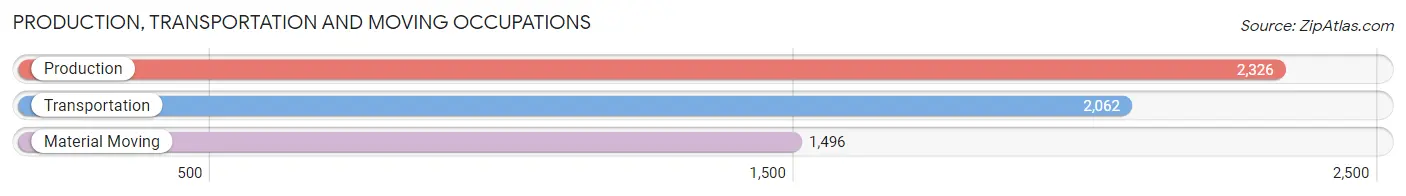
Production, Transportation and Moving Occupations
The most common Production, Transportation and Moving occupations in Spring are Production (2,326 | 7.1%), Transportation (2,062 | 6.3%), and Material Moving (1,496 | 4.6%).
Production, Transportation and Moving Occupations by Sex
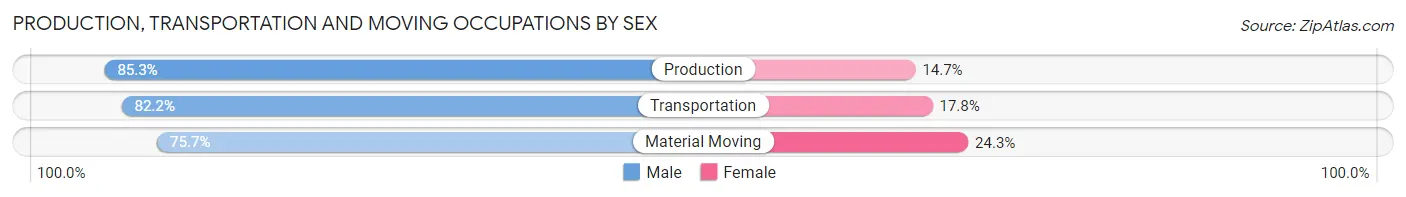
| Occupation | Male | Female |
| Production | 1,985 (85.3%) | 341 (14.7%) |
| Transportation | 1,695 (82.2%) | 367 (17.8%) |
| Material Moving | 1,132 (75.7%) | 364 (24.3%) |
| Total (Category) | 4,812 (81.8%) | 1,072 (18.2%) |
| Total (Overall) | 17,984 (55.0%) | 14,721 (45.0%) |
Employment Industries by Sex in Spring
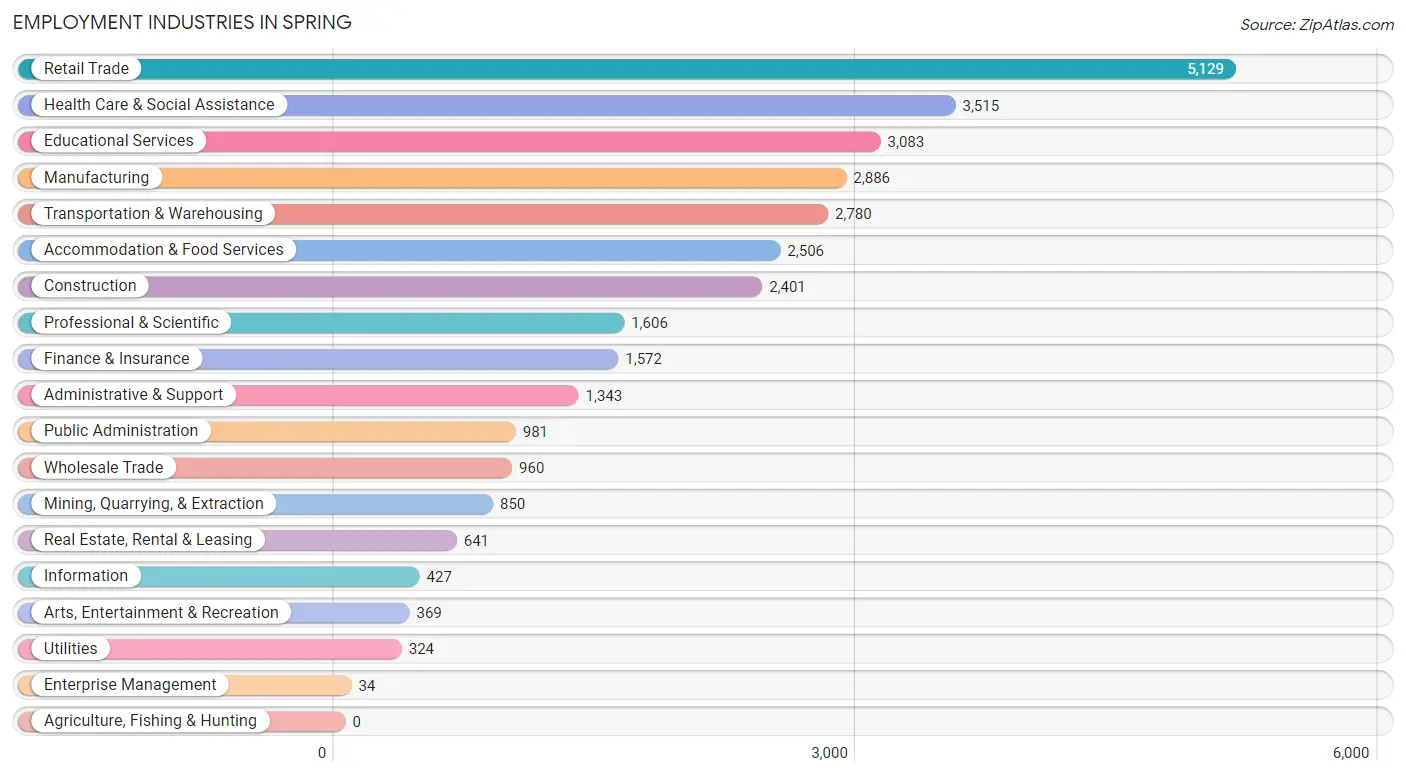
Employment Industries in Spring
The major employment industries in Spring include Retail Trade (5,129 | 15.7%), Health Care & Social Assistance (3,515 | 10.7%), Educational Services (3,083 | 9.4%), Manufacturing (2,886 | 8.8%), and Transportation & Warehousing (2,780 | 8.5%).
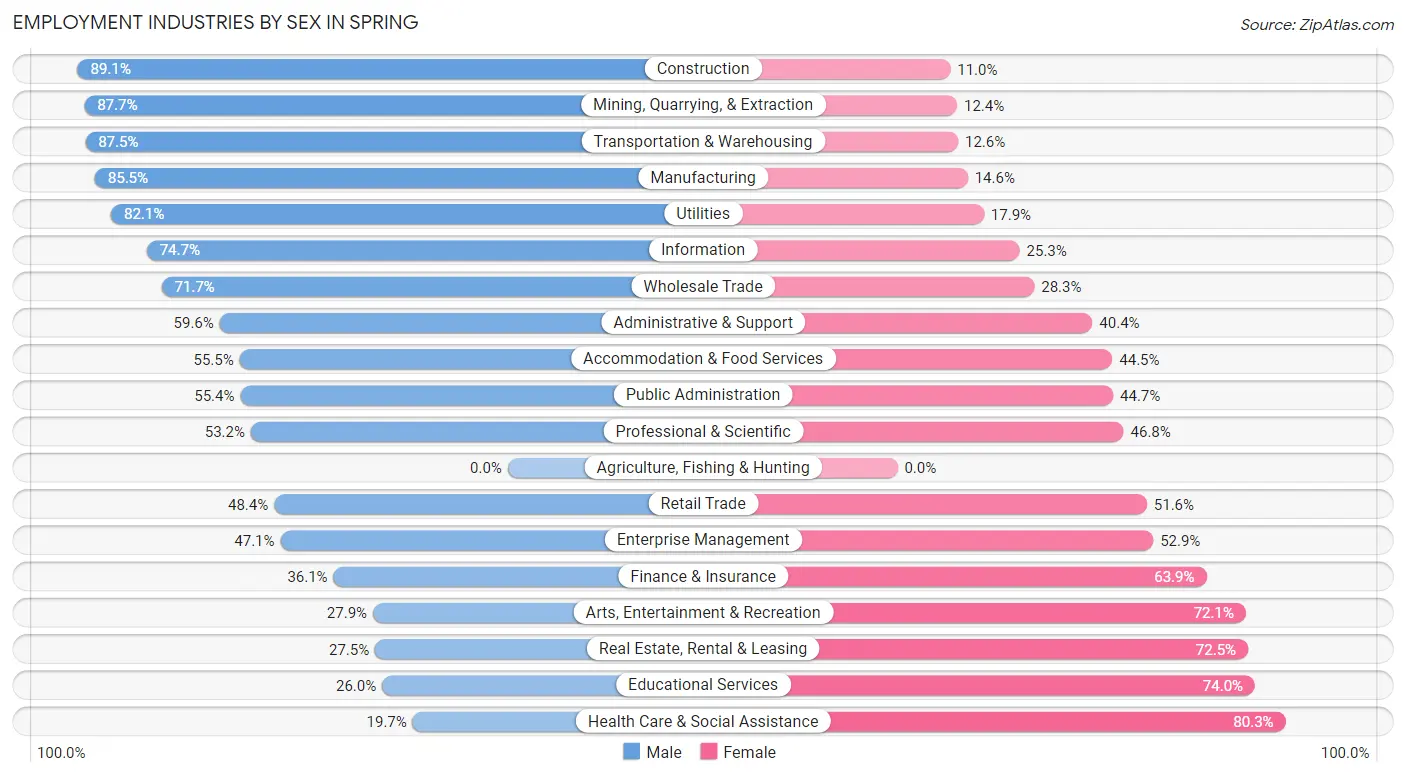
Employment Industries by Sex in Spring
The Spring industries that see more men than women are Construction (89.0%), Mining, Quarrying, & Extraction (87.6%), and Transportation & Warehousing (87.5%), whereas the industries that tend to have a higher number of women are Health Care & Social Assistance (80.3%), Educational Services (74.0%), and Real Estate, Rental & Leasing (72.5%).
| Industry | Male | Female |
| Agriculture, Fishing & Hunting | 0 (0.0%) | 0 (0.0%) |
| Mining, Quarrying, & Extraction | 745 (87.6%) | 105 (12.3%) |
| Construction | 2,138 (89.0%) | 263 (11.0%) |
| Manufacturing | 2,466 (85.5%) | 420 (14.5%) |
| Wholesale Trade | 688 (71.7%) | 272 (28.3%) |
| Retail Trade | 2,481 (48.4%) | 2,648 (51.6%) |
| Transportation & Warehousing | 2,431 (87.5%) | 349 (12.6%) |
| Utilities | 266 (82.1%) | 58 (17.9%) |
| Information | 319 (74.7%) | 108 (25.3%) |
| Finance & Insurance | 567 (36.1%) | 1,005 (63.9%) |
| Real Estate, Rental & Leasing | 176 (27.5%) | 465 (72.5%) |
| Professional & Scientific | 854 (53.2%) | 752 (46.8%) |
| Enterprise Management | 16 (47.1%) | 18 (52.9%) |
| Administrative & Support | 801 (59.6%) | 542 (40.4%) |
| Educational Services | 802 (26.0%) | 2,281 (74.0%) |
| Health Care & Social Assistance | 692 (19.7%) | 2,823 (80.3%) |
| Arts, Entertainment & Recreation | 103 (27.9%) | 266 (72.1%) |
| Accommodation & Food Services | 1,391 (55.5%) | 1,115 (44.5%) |
| Public Administration | 543 (55.3%) | 438 (44.7%) |
| Total | 17,984 (55.0%) | 14,721 (45.0%) |
Education in Spring
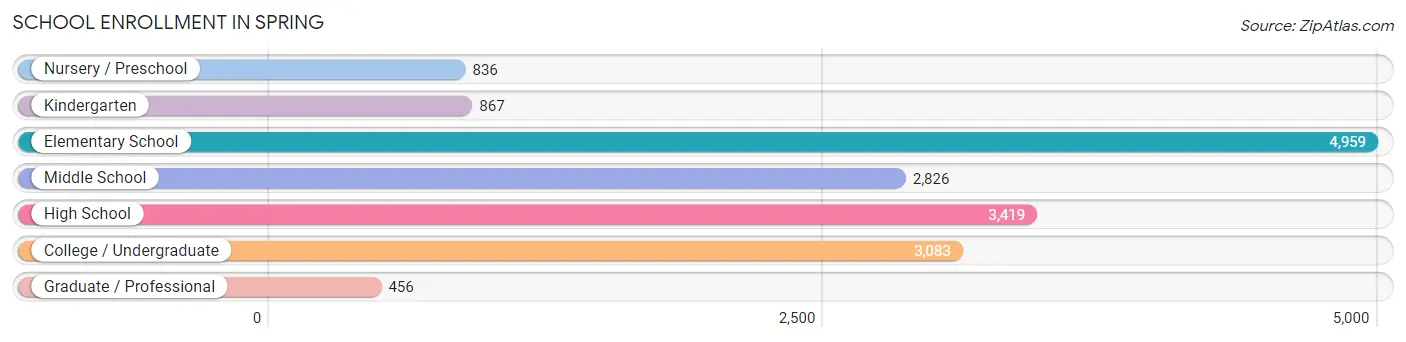
School Enrollment in Spring
The most common levels of schooling among the 16,446 students in Spring are elementary school (4,959 | 30.1%), high school (3,419 | 20.8%), and college / undergraduate (3,083 | 18.8%).
| School Level | # Students | % Students |
| Nursery / Preschool | 836 | 5.1% |
| Kindergarten | 867 | 5.3% |
| Elementary School | 4,959 | 30.1% |
| Middle School | 2,826 | 17.2% |
| High School | 3,419 | 20.8% |
| College / Undergraduate | 3,083 | 18.8% |
| Graduate / Professional | 456 | 2.8% |
| Total | 16,446 | 100.0% |
School Enrollment by Age by Funding Source in Spring
Out of a total of 16,446 students who are enrolled in schools in Spring, 1,546 (9.4%) attend a private institution, while the remaining 14,900 (90.6%) are enrolled in public schools. The age group of 25 to 34 year olds has the highest likelihood of being enrolled in private schools, with 206 (24.5% in the age bracket) enrolled. Conversely, the age group of 15 to 17 year olds has the lowest likelihood of being enrolled in a private school, with 2,152 (96.5% in the age bracket) attending a public institution.
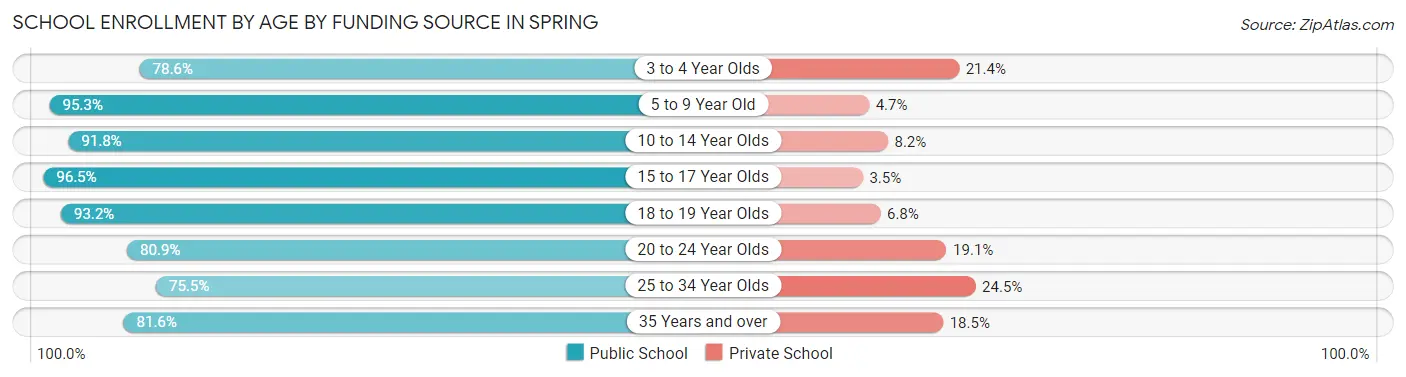
| Age Bracket | Public School | Private School |
| 3 to 4 Year Olds | 649 (78.6%) | 177 (21.4%) |
| 5 to 9 Year Old | 4,663 (95.3%) | 228 (4.7%) |
| 10 to 14 Year Olds | 4,146 (91.8%) | 369 (8.2%) |
| 15 to 17 Year Olds | 2,152 (96.5%) | 78 (3.5%) |
| 18 to 19 Year Olds | 840 (93.2%) | 61 (6.8%) |
| 20 to 24 Year Olds | 924 (80.9%) | 218 (19.1%) |
| 25 to 34 Year Olds | 635 (75.5%) | 206 (24.5%) |
| 35 Years and over | 897 (81.6%) | 203 (18.4%) |
| Total | 14,900 (90.6%) | 1,546 (9.4%) |
Educational Attainment by Field of Study in Spring
Business (2,446 | 22.4%), arts & humanities (1,528 | 14.0%), education (1,428 | 13.1%), engineering (857 | 7.8%), and computers & mathematics (802 | 7.3%) are the most common fields of study among 10,940 individuals in Spring who have obtained a bachelor's degree or higher.
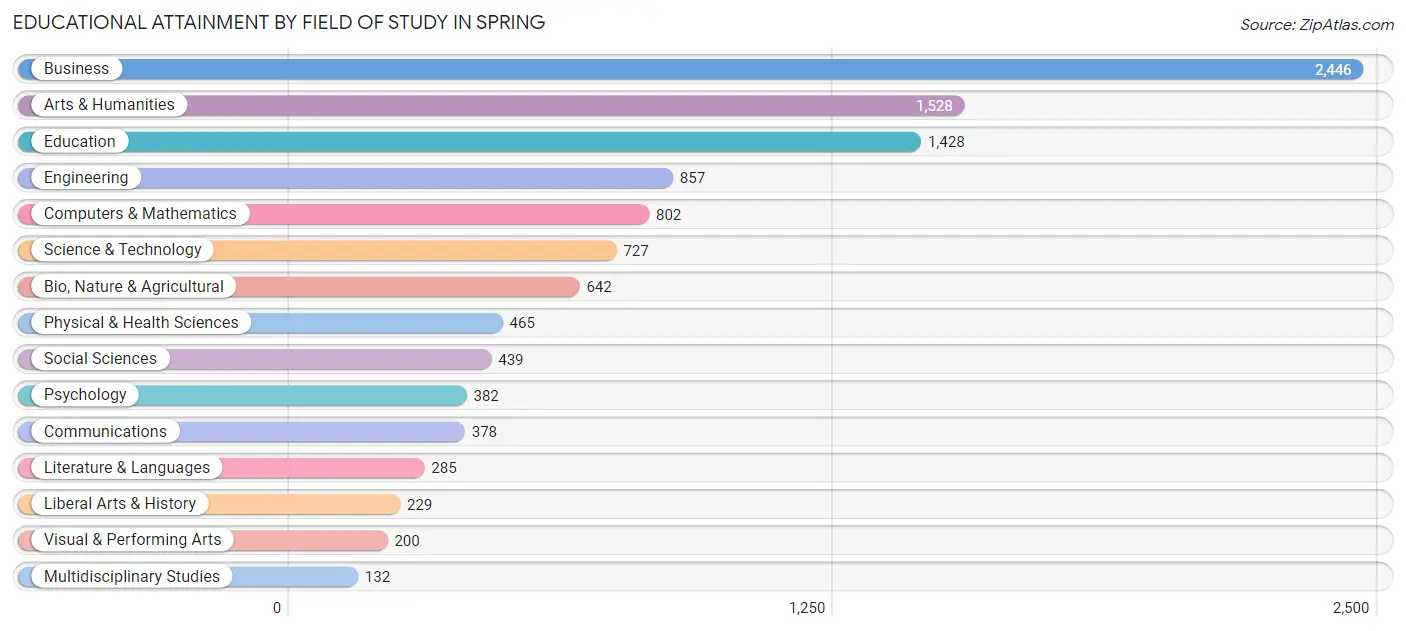
| Field of Study | # Graduates | % Graduates |
| Computers & Mathematics | 802 | 7.3% |
| Bio, Nature & Agricultural | 642 | 5.9% |
| Physical & Health Sciences | 465 | 4.3% |
| Psychology | 382 | 3.5% |
| Social Sciences | 439 | 4.0% |
| Engineering | 857 | 7.8% |
| Multidisciplinary Studies | 132 | 1.2% |
| Science & Technology | 727 | 6.7% |
| Business | 2,446 | 22.4% |
| Education | 1,428 | 13.1% |
| Literature & Languages | 285 | 2.6% |
| Liberal Arts & History | 229 | 2.1% |
| Visual & Performing Arts | 200 | 1.8% |
| Communications | 378 | 3.5% |
| Arts & Humanities | 1,528 | 14.0% |
| Total | 10,940 | 100.0% |
Transportation & Commute in Spring
Vehicle Availability by Sex in Spring
The most prevalent vehicle ownership categories in Spring are males with 2 vehicles (8,255, accounting for 46.4%) and females with 2 vehicles (6,090, making up 57.4%).
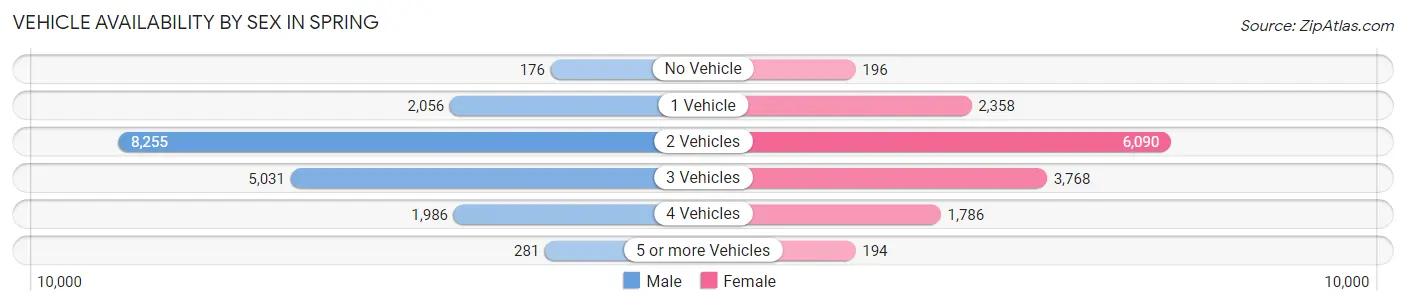
| Vehicles Available | Male | Female |
| No Vehicle | 176 (1.0%) | 196 (1.4%) |
| 1 Vehicle | 2,056 (11.6%) | 2,358 (16.4%) |
| 2 Vehicles | 8,255 (46.4%) | 6,090 (42.3%) |
| 3 Vehicles | 5,031 (28.3%) | 3,768 (26.2%) |
| 4 Vehicles | 1,986 (11.2%) | 1,786 (12.4%) |
| 5 or more Vehicles | 281 (1.6%) | 194 (1.3%) |
| Total | 17,785 (100.0%) | 14,392 (100.0%) |
Commute Time in Spring
The most frequently occuring commute durations in Spring are 30 to 34 minutes (5,530 commuters, 18.8%), 15 to 19 minutes (4,398 commuters, 14.9%), and 45 to 59 minutes (3,976 commuters, 13.5%).
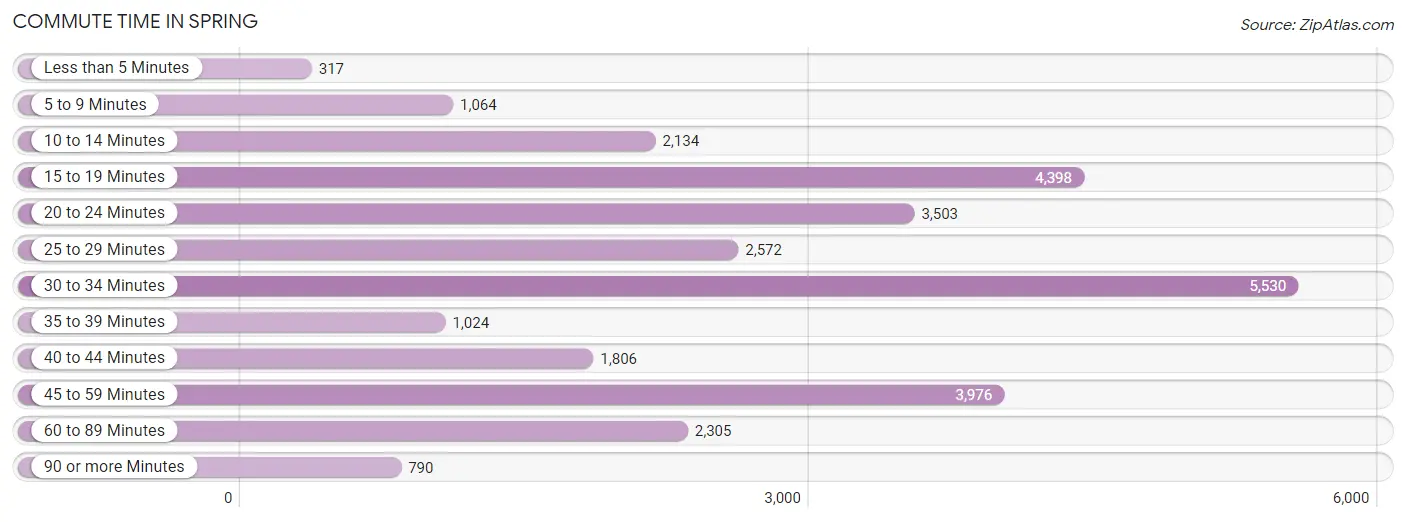
| Commute Time | # Commuters | % Commuters |
| Less than 5 Minutes | 317 | 1.1% |
| 5 to 9 Minutes | 1,064 | 3.6% |
| 10 to 14 Minutes | 2,134 | 7.2% |
| 15 to 19 Minutes | 4,398 | 14.9% |
| 20 to 24 Minutes | 3,503 | 11.9% |
| 25 to 29 Minutes | 2,572 | 8.7% |
| 30 to 34 Minutes | 5,530 | 18.8% |
| 35 to 39 Minutes | 1,024 | 3.5% |
| 40 to 44 Minutes | 1,806 | 6.1% |
| 45 to 59 Minutes | 3,976 | 13.5% |
| 60 to 89 Minutes | 2,305 | 7.8% |
| 90 or more Minutes | 790 | 2.7% |
Commute Time by Sex in Spring
The most common commute times in Spring are 30 to 34 minutes (2,855 commuters, 17.0%) for males and 30 to 34 minutes (2,675 commuters, 21.2%) for females.
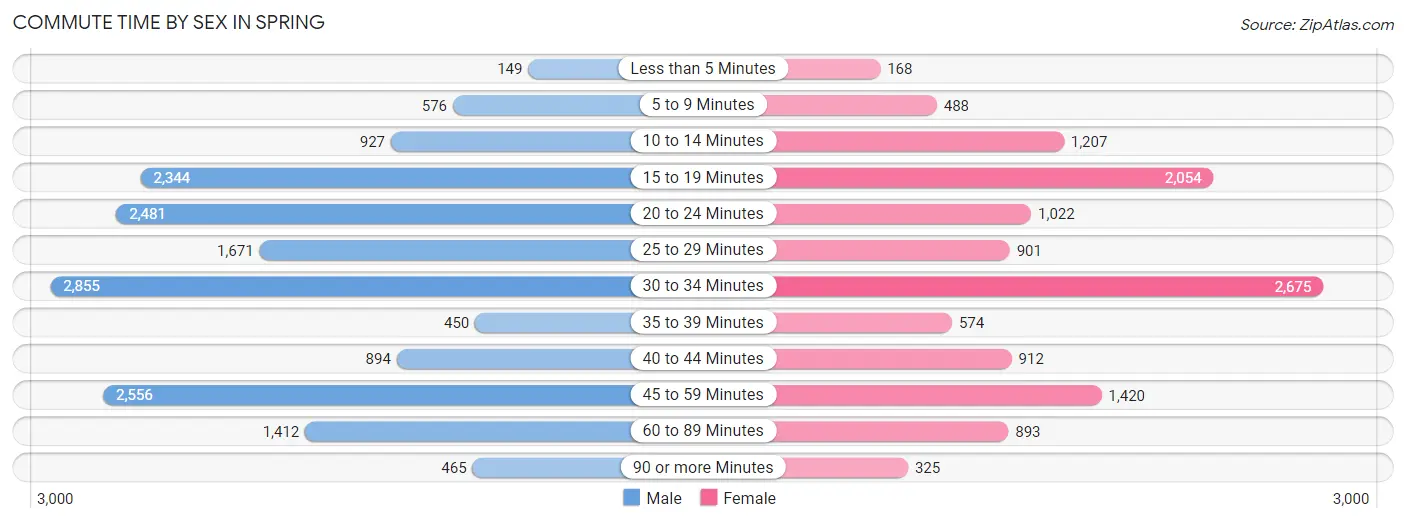
| Commute Time | Male | Female |
| Less than 5 Minutes | 149 (0.9%) | 168 (1.3%) |
| 5 to 9 Minutes | 576 (3.4%) | 488 (3.9%) |
| 10 to 14 Minutes | 927 (5.5%) | 1,207 (9.6%) |
| 15 to 19 Minutes | 2,344 (14.0%) | 2,054 (16.3%) |
| 20 to 24 Minutes | 2,481 (14.8%) | 1,022 (8.1%) |
| 25 to 29 Minutes | 1,671 (10.0%) | 901 (7.1%) |
| 30 to 34 Minutes | 2,855 (17.0%) | 2,675 (21.2%) |
| 35 to 39 Minutes | 450 (2.7%) | 574 (4.5%) |
| 40 to 44 Minutes | 894 (5.3%) | 912 (7.2%) |
| 45 to 59 Minutes | 2,556 (15.2%) | 1,420 (11.2%) |
| 60 to 89 Minutes | 1,412 (8.4%) | 893 (7.1%) |
| 90 or more Minutes | 465 (2.8%) | 325 (2.6%) |
Time of Departure to Work by Sex in Spring
The most frequent times of departure to work in Spring are 6:00 AM to 6:29 AM (2,763, 16.5%) for males and 7:00 AM to 7:29 AM (1,847, 14.6%) for females.
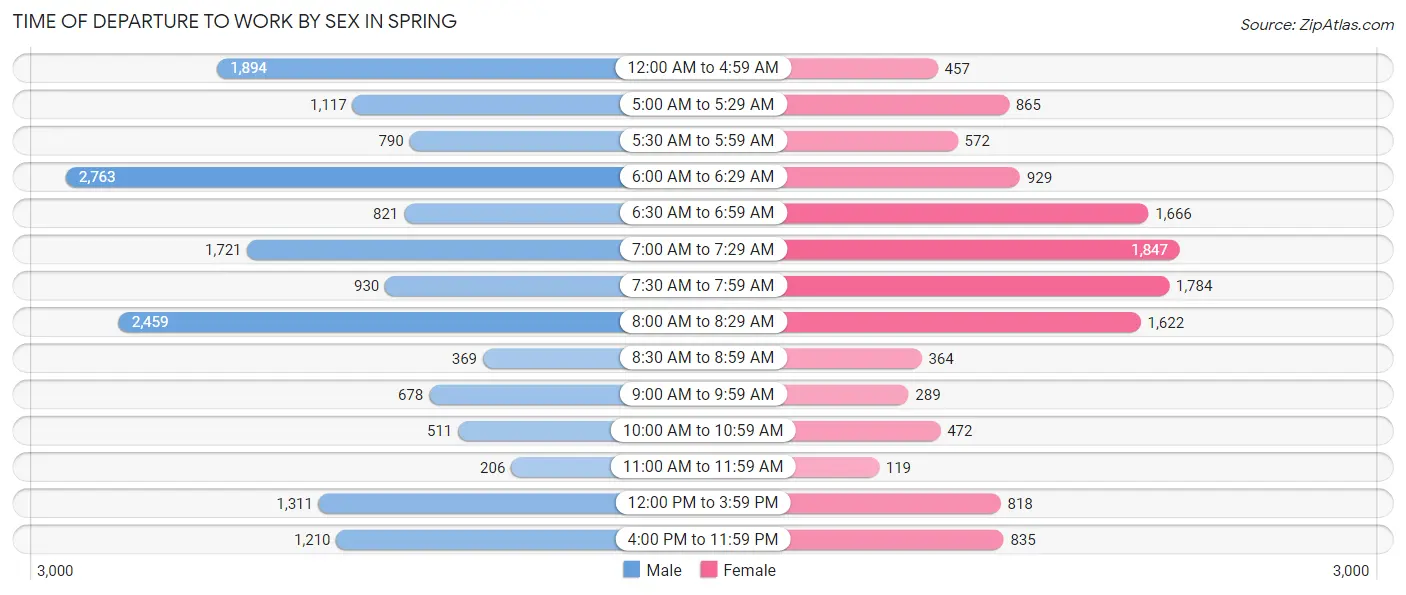
| Time of Departure | Male | Female |
| 12:00 AM to 4:59 AM | 1,894 (11.3%) | 457 (3.6%) |
| 5:00 AM to 5:29 AM | 1,117 (6.7%) | 865 (6.8%) |
| 5:30 AM to 5:59 AM | 790 (4.7%) | 572 (4.5%) |
| 6:00 AM to 6:29 AM | 2,763 (16.5%) | 929 (7.3%) |
| 6:30 AM to 6:59 AM | 821 (4.9%) | 1,666 (13.2%) |
| 7:00 AM to 7:29 AM | 1,721 (10.3%) | 1,847 (14.6%) |
| 7:30 AM to 7:59 AM | 930 (5.5%) | 1,784 (14.1%) |
| 8:00 AM to 8:29 AM | 2,459 (14.6%) | 1,622 (12.8%) |
| 8:30 AM to 8:59 AM | 369 (2.2%) | 364 (2.9%) |
| 9:00 AM to 9:59 AM | 678 (4.0%) | 289 (2.3%) |
| 10:00 AM to 10:59 AM | 511 (3.0%) | 472 (3.7%) |
| 11:00 AM to 11:59 AM | 206 (1.2%) | 119 (0.9%) |
| 12:00 PM to 3:59 PM | 1,311 (7.8%) | 818 (6.5%) |
| 4:00 PM to 11:59 PM | 1,210 (7.2%) | 835 (6.6%) |
| Total | 16,780 (100.0%) | 12,639 (100.0%) |
Housing Occupancy in Spring
Occupancy by Ownership in Spring
Of the total 21,237 dwellings in Spring, owner-occupied units account for 15,646 (73.7%), while renter-occupied units make up 5,591 (26.3%).
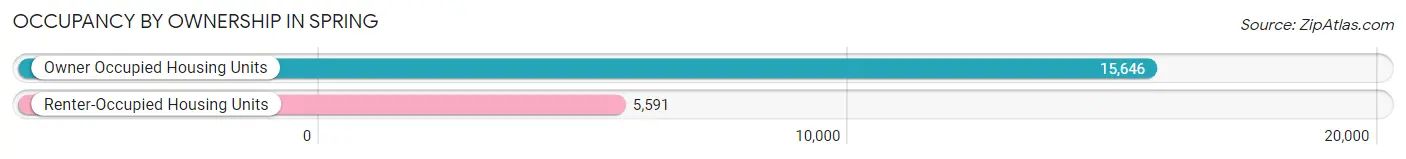
| Occupancy | # Housing Units | % Housing Units |
| Owner Occupied Housing Units | 15,646 | 73.7% |
| Renter-Occupied Housing Units | 5,591 | 26.3% |
| Total Occupied Housing Units | 21,237 | 100.0% |
Occupancy by Household Size in Spring
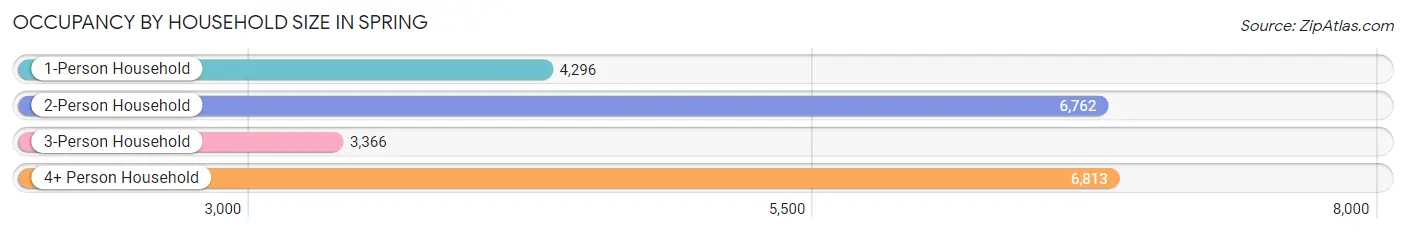
| Household Size | # Housing Units | % Housing Units |
| 1-Person Household | 4,296 | 20.2% |
| 2-Person Household | 6,762 | 31.8% |
| 3-Person Household | 3,366 | 15.9% |
| 4+ Person Household | 6,813 | 32.1% |
| Total Housing Units | 21,237 | 100.0% |
Occupancy by Ownership by Household Size in Spring
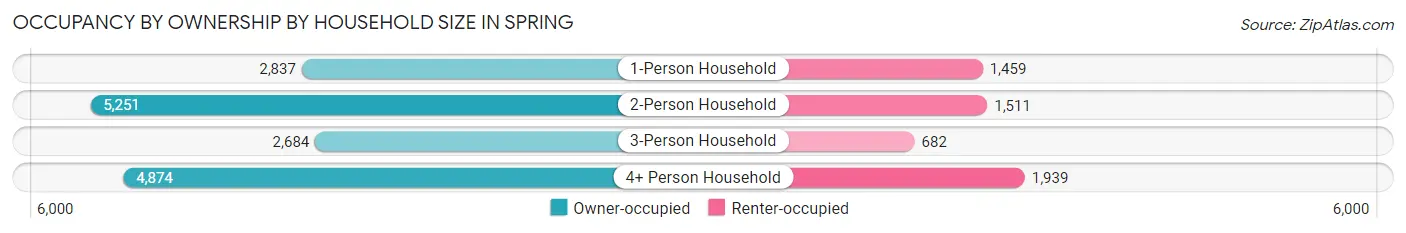
| Household Size | Owner-occupied | Renter-occupied |
| 1-Person Household | 2,837 (66.0%) | 1,459 (34.0%) |
| 2-Person Household | 5,251 (77.6%) | 1,511 (22.4%) |
| 3-Person Household | 2,684 (79.7%) | 682 (20.3%) |
| 4+ Person Household | 4,874 (71.5%) | 1,939 (28.5%) |
| Total Housing Units | 15,646 (73.7%) | 5,591 (26.3%) |
Occupancy by Educational Attainment in Spring
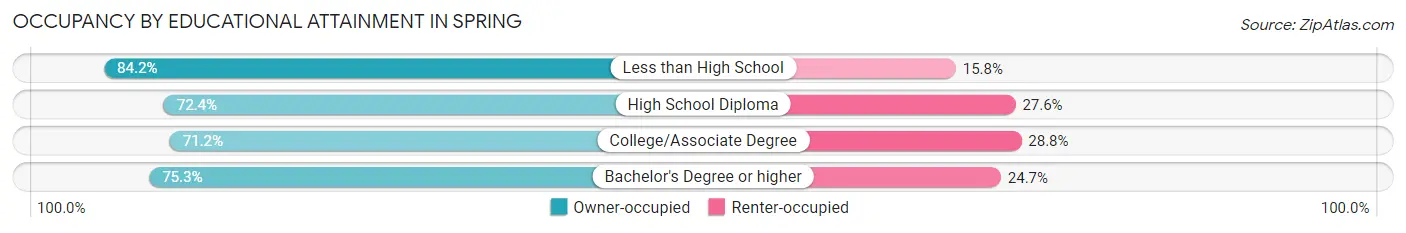
| Household Size | Owner-occupied | Renter-occupied |
| Less than High School | 1,350 (84.2%) | 253 (15.8%) |
| High School Diploma | 3,770 (72.4%) | 1,438 (27.6%) |
| College/Associate Degree | 5,845 (71.2%) | 2,363 (28.8%) |
| Bachelor's Degree or higher | 4,681 (75.3%) | 1,537 (24.7%) |
Occupancy by Age of Householder in Spring
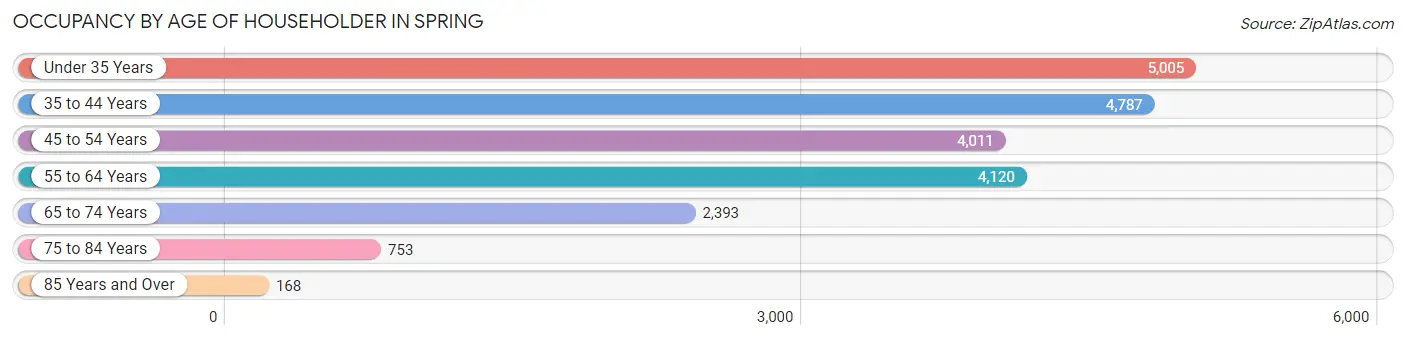
| Age Bracket | # Households | % Households |
| Under 35 Years | 5,005 | 23.6% |
| 35 to 44 Years | 4,787 | 22.5% |
| 45 to 54 Years | 4,011 | 18.9% |
| 55 to 64 Years | 4,120 | 19.4% |
| 65 to 74 Years | 2,393 | 11.3% |
| 75 to 84 Years | 753 | 3.5% |
| 85 Years and Over | 168 | 0.8% |
| Total | 21,237 | 100.0% |
Housing Finances in Spring
Median Income by Occupancy in Spring
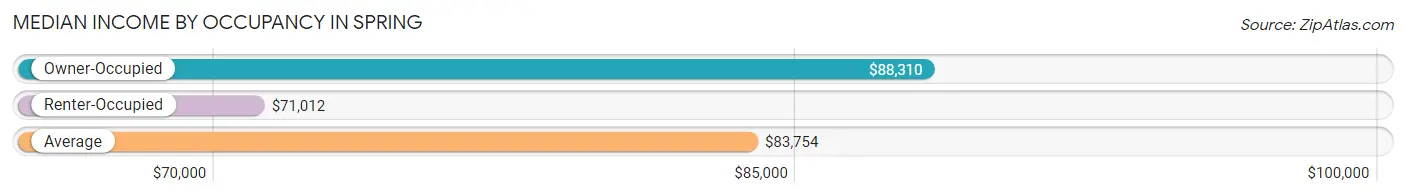
| Occupancy Type | # Households | Median Income |
| Owner-Occupied | 15,646 (73.7%) | $88,310 |
| Renter-Occupied | 5,591 (26.3%) | $71,012 |
| Average | 21,237 (100.0%) | $83,754 |
Occupancy by Householder Income Bracket in Spring
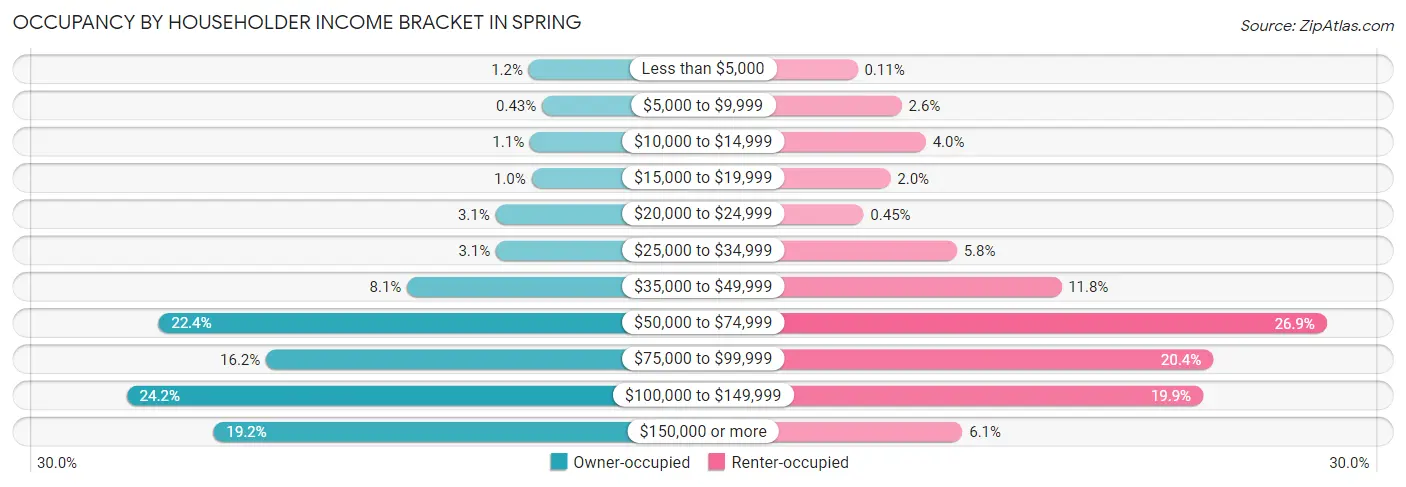
| Income Bracket | Owner-occupied | Renter-occupied |
| Less than $5,000 | 186 (1.2%) | 6 (0.1%) |
| $5,000 to $9,999 | 67 (0.4%) | 147 (2.6%) |
| $10,000 to $14,999 | 175 (1.1%) | 224 (4.0%) |
| $15,000 to $19,999 | 161 (1.0%) | 111 (2.0%) |
| $20,000 to $24,999 | 484 (3.1%) | 25 (0.4%) |
| $25,000 to $34,999 | 479 (3.1%) | 323 (5.8%) |
| $35,000 to $49,999 | 1,274 (8.1%) | 657 (11.7%) |
| $50,000 to $74,999 | 3,499 (22.4%) | 1,505 (26.9%) |
| $75,000 to $99,999 | 2,534 (16.2%) | 1,142 (20.4%) |
| $100,000 to $149,999 | 3,781 (24.2%) | 1,110 (19.9%) |
| $150,000 or more | 3,006 (19.2%) | 341 (6.1%) |
| Total | 15,646 (100.0%) | 5,591 (100.0%) |
Monthly Housing Cost Tiers in Spring
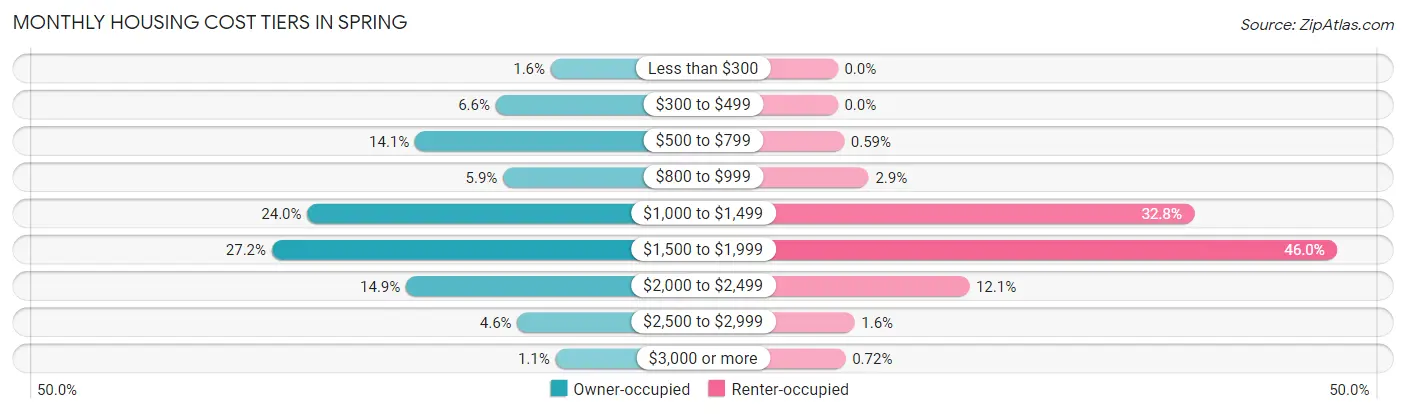
| Monthly Cost | Owner-occupied | Renter-occupied |
| Less than $300 | 242 (1.5%) | 0 (0.0%) |
| $300 to $499 | 1,036 (6.6%) | 0 (0.0%) |
| $500 to $799 | 2,198 (14.1%) | 33 (0.6%) |
| $800 to $999 | 929 (5.9%) | 160 (2.9%) |
| $1,000 to $1,499 | 3,750 (24.0%) | 1,834 (32.8%) |
| $1,500 to $1,999 | 4,262 (27.2%) | 2,569 (46.0%) |
| $2,000 to $2,499 | 2,328 (14.9%) | 677 (12.1%) |
| $2,500 to $2,999 | 725 (4.6%) | 87 (1.6%) |
| $3,000 or more | 176 (1.1%) | 40 (0.7%) |
| Total | 15,646 (100.0%) | 5,591 (100.0%) |
Physical Housing Characteristics in Spring
Housing Structures in Spring
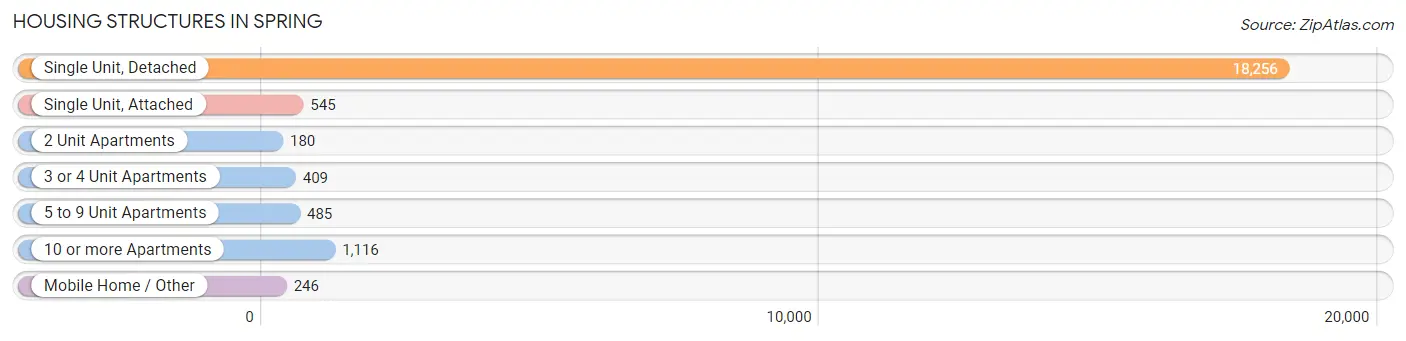
| Structure Type | # Housing Units | % Housing Units |
| Single Unit, Detached | 18,256 | 86.0% |
| Single Unit, Attached | 545 | 2.6% |
| 2 Unit Apartments | 180 | 0.9% |
| 3 or 4 Unit Apartments | 409 | 1.9% |
| 5 to 9 Unit Apartments | 485 | 2.3% |
| 10 or more Apartments | 1,116 | 5.2% |
| Mobile Home / Other | 246 | 1.2% |
| Total | 21,237 | 100.0% |
Housing Structures by Occupancy in Spring
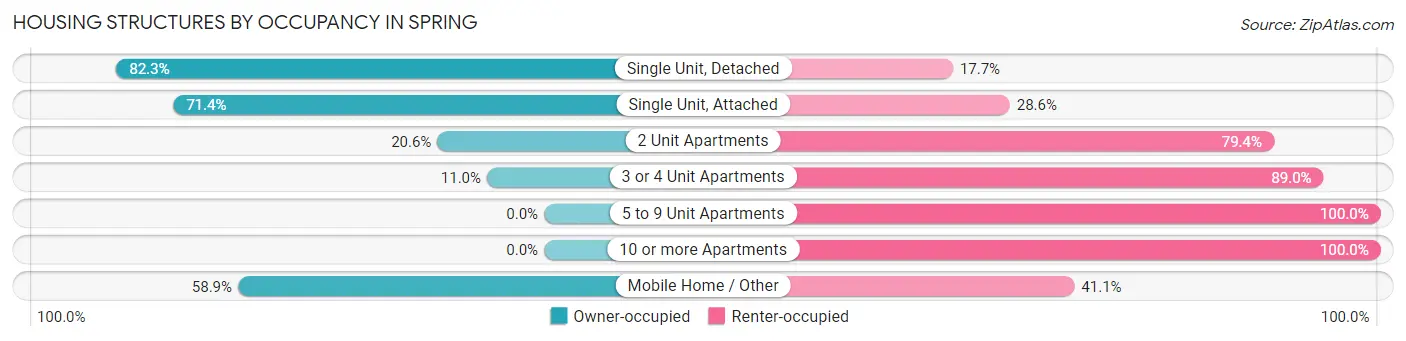
| Structure Type | Owner-occupied | Renter-occupied |
| Single Unit, Detached | 15,030 (82.3%) | 3,226 (17.7%) |
| Single Unit, Attached | 389 (71.4%) | 156 (28.6%) |
| 2 Unit Apartments | 37 (20.6%) | 143 (79.4%) |
| 3 or 4 Unit Apartments | 45 (11.0%) | 364 (89.0%) |
| 5 to 9 Unit Apartments | 0 (0.0%) | 485 (100.0%) |
| 10 or more Apartments | 0 (0.0%) | 1,116 (100.0%) |
| Mobile Home / Other | 145 (58.9%) | 101 (41.1%) |
| Total | 15,646 (73.7%) | 5,591 (26.3%) |
Housing Structures by Number of Rooms in Spring
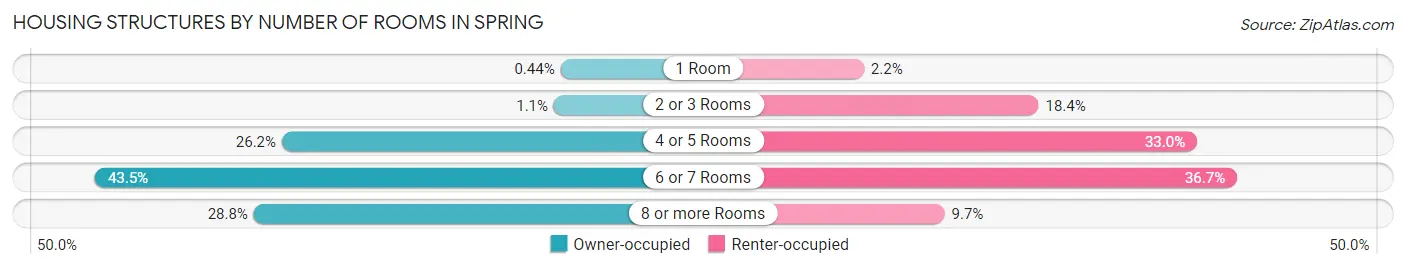
| Number of Rooms | Owner-occupied | Renter-occupied |
| 1 Room | 69 (0.4%) | 124 (2.2%) |
| 2 or 3 Rooms | 164 (1.1%) | 1,027 (18.4%) |
| 4 or 5 Rooms | 4,101 (26.2%) | 1,846 (33.0%) |
| 6 or 7 Rooms | 6,804 (43.5%) | 2,053 (36.7%) |
| 8 or more Rooms | 4,508 (28.8%) | 541 (9.7%) |
| Total | 15,646 (100.0%) | 5,591 (100.0%) |
Housing Structure by Heating Type in Spring
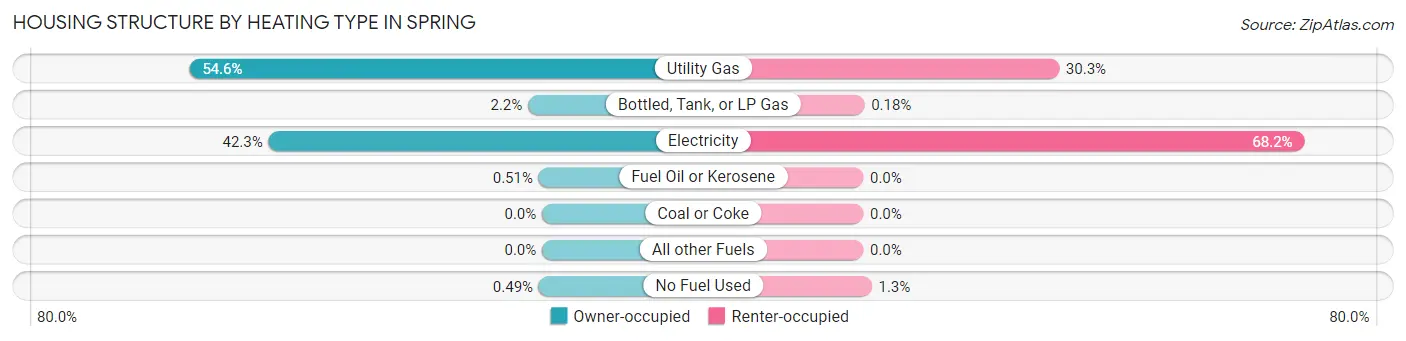
| Heating Type | Owner-occupied | Renter-occupied |
| Utility Gas | 8,535 (54.5%) | 1,693 (30.3%) |
| Bottled, Tank, or LP Gas | 338 (2.2%) | 10 (0.2%) |
| Electricity | 6,617 (42.3%) | 3,815 (68.2%) |
| Fuel Oil or Kerosene | 80 (0.5%) | 0 (0.0%) |
| Coal or Coke | 0 (0.0%) | 0 (0.0%) |
| All other Fuels | 0 (0.0%) | 0 (0.0%) |
| No Fuel Used | 76 (0.5%) | 73 (1.3%) |
| Total | 15,646 (100.0%) | 5,591 (100.0%) |
Household Vehicle Usage in Spring
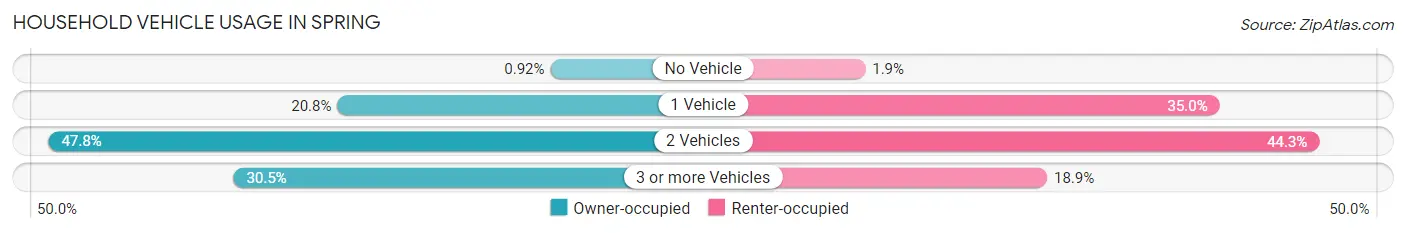
| Vehicles per Household | Owner-occupied | Renter-occupied |
| No Vehicle | 144 (0.9%) | 106 (1.9%) |
| 1 Vehicle | 3,256 (20.8%) | 1,955 (35.0%) |
| 2 Vehicles | 7,474 (47.8%) | 2,475 (44.3%) |
| 3 or more Vehicles | 4,772 (30.5%) | 1,055 (18.9%) |
| Total | 15,646 (100.0%) | 5,591 (100.0%) |
Real Estate & Mortgages in Spring
Real Estate and Mortgage Overview in Spring
| Characteristic | Without Mortgage | With Mortgage |
| Housing Units | 4,501 | 11,145 |
| Median Property Value | $183,200 | $208,200 |
| Median Household Income | $74,691 | $2,370 |
| Monthly Housing Costs | $657 | $162 |
| Real Estate Taxes | $3,283 | $333 |
Property Value by Mortgage Status in Spring
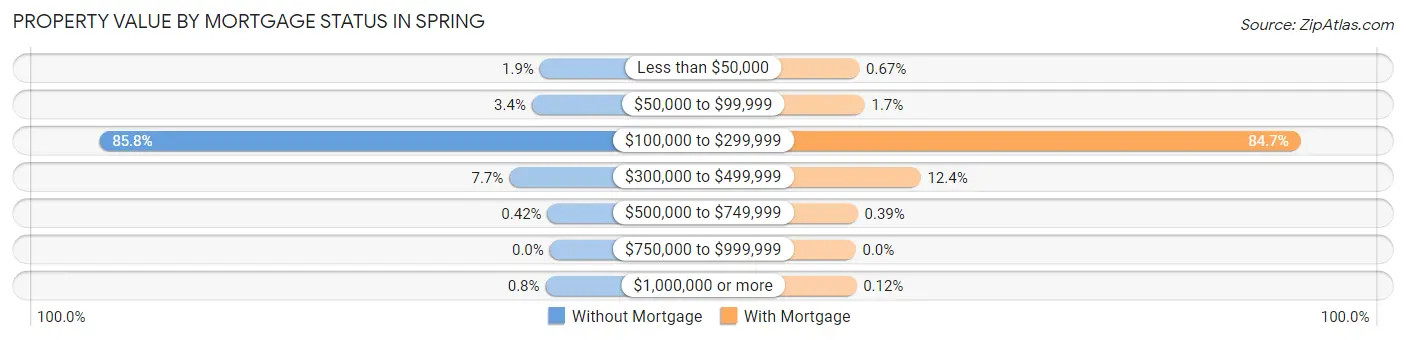
| Property Value | Without Mortgage | With Mortgage |
| Less than $50,000 | 85 (1.9%) | 75 (0.7%) |
| $50,000 to $99,999 | 153 (3.4%) | 191 (1.7%) |
| $100,000 to $299,999 | 3,861 (85.8%) | 9,444 (84.7%) |
| $300,000 to $499,999 | 347 (7.7%) | 1,379 (12.4%) |
| $500,000 to $749,999 | 19 (0.4%) | 43 (0.4%) |
| $750,000 to $999,999 | 0 (0.0%) | 0 (0.0%) |
| $1,000,000 or more | 36 (0.8%) | 13 (0.1%) |
| Total | 4,501 (100.0%) | 11,145 (100.0%) |
Household Income by Mortgage Status in Spring
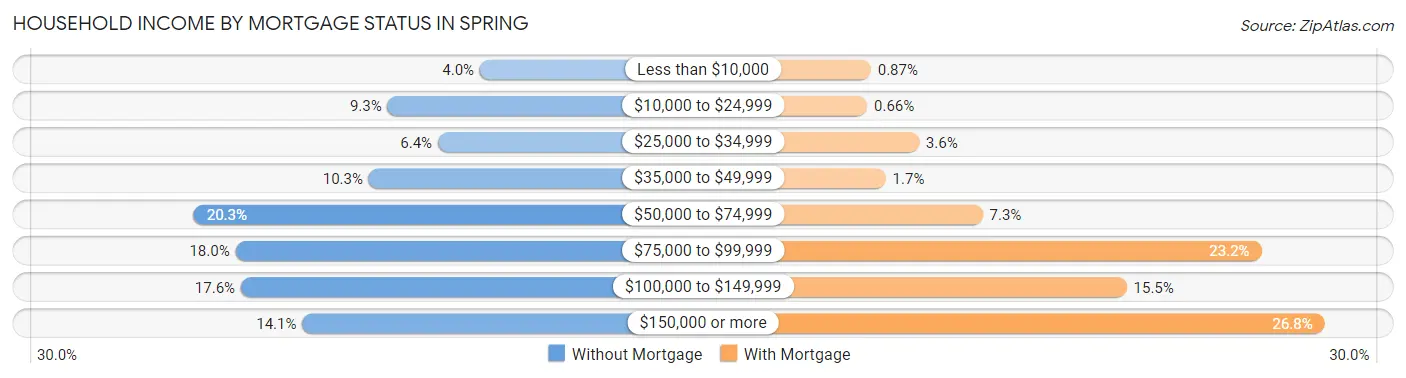
| Household Income | Without Mortgage | With Mortgage |
| Less than $10,000 | 179 (4.0%) | 97 (0.9%) |
| $10,000 to $24,999 | 417 (9.3%) | 74 (0.7%) |
| $25,000 to $34,999 | 287 (6.4%) | 403 (3.6%) |
| $35,000 to $49,999 | 465 (10.3%) | 192 (1.7%) |
| $50,000 to $74,999 | 915 (20.3%) | 809 (7.3%) |
| $75,000 to $99,999 | 808 (17.9%) | 2,584 (23.2%) |
| $100,000 to $149,999 | 794 (17.6%) | 1,726 (15.5%) |
| $150,000 or more | 636 (14.1%) | 2,987 (26.8%) |
| Total | 4,501 (100.0%) | 11,145 (100.0%) |
Property Value to Household Income Ratio in Spring
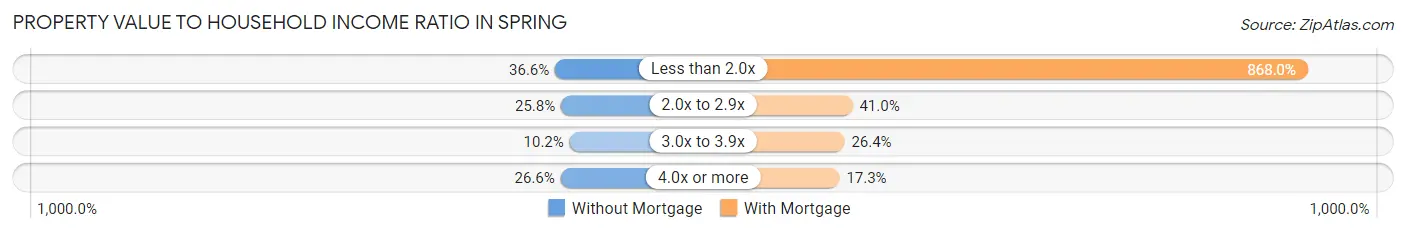
| Value-to-Income Ratio | Without Mortgage | With Mortgage |
| Less than 2.0x | 1,646 (36.6%) | 96,734 (868.0%) |
| 2.0x to 2.9x | 1,162 (25.8%) | 4,566 (41.0%) |
| 3.0x to 3.9x | 458 (10.2%) | 2,941 (26.4%) |
| 4.0x or more | 1,197 (26.6%) | 1,929 (17.3%) |
| Total | 4,501 (100.0%) | 11,145 (100.0%) |
Real Estate Taxes by Mortgage Status in Spring
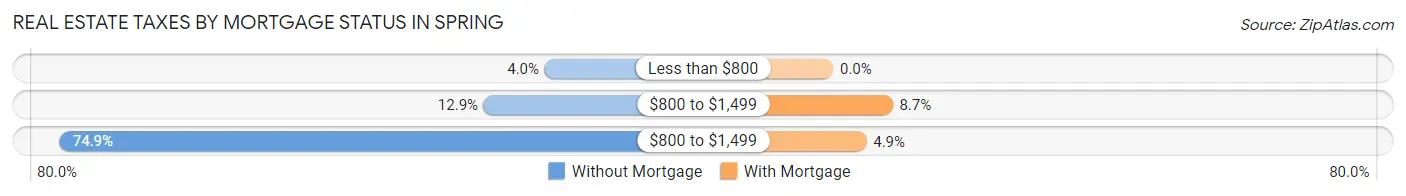
| Property Taxes | Without Mortgage | With Mortgage |
| Less than $800 | 179 (4.0%) | 0 (0.0%) |
| $800 to $1,499 | 580 (12.9%) | 967 (8.7%) |
| $800 to $1,499 | 3,369 (74.9%) | 542 (4.9%) |
| Total | 4,501 (100.0%) | 11,145 (100.0%) |
Health & Disability in Spring
Health Insurance Coverage by Age in Spring
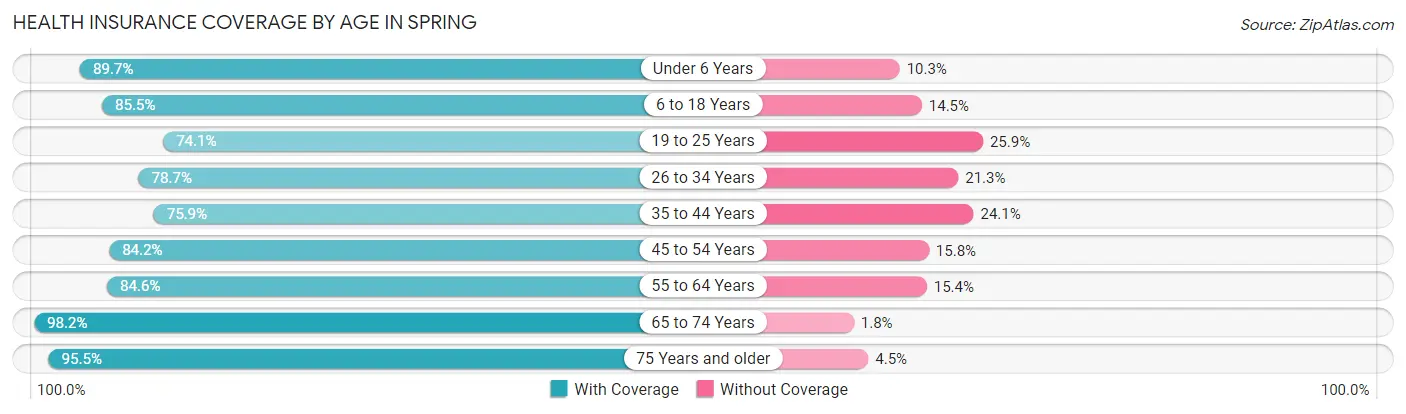
| Age Bracket | With Coverage | Without Coverage |
| Under 6 Years | 5,095 (89.7%) | 587 (10.3%) |
| 6 to 18 Years | 10,013 (85.5%) | 1,692 (14.5%) |
| 19 to 25 Years | 4,335 (74.1%) | 1,512 (25.9%) |
| 26 to 34 Years | 8,428 (78.7%) | 2,275 (21.3%) |
| 35 to 44 Years | 7,139 (75.9%) | 2,267 (24.1%) |
| 45 to 54 Years | 5,988 (84.2%) | 1,122 (15.8%) |
| 55 to 64 Years | 6,283 (84.6%) | 1,142 (15.4%) |
| 65 to 74 Years | 3,817 (98.2%) | 69 (1.8%) |
| 75 Years and older | 1,979 (95.5%) | 93 (4.5%) |
| Total | 53,077 (83.2%) | 10,759 (16.9%) |
Health Insurance Coverage by Citizenship Status in Spring
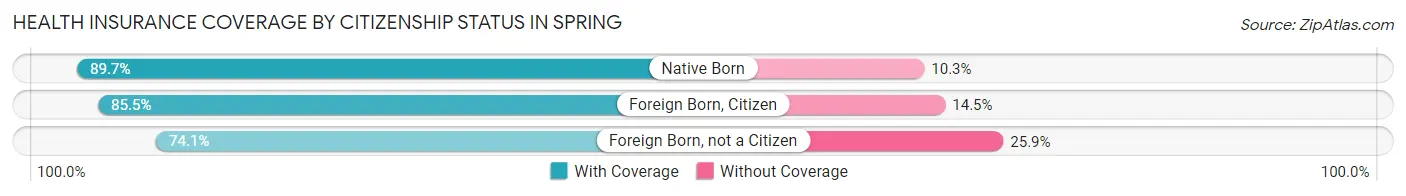
| Citizenship Status | With Coverage | Without Coverage |
| Native Born | 5,095 (89.7%) | 587 (10.3%) |
| Foreign Born, Citizen | 10,013 (85.5%) | 1,692 (14.5%) |
| Foreign Born, not a Citizen | 4,335 (74.1%) | 1,512 (25.9%) |
Health Insurance Coverage by Household Income in Spring
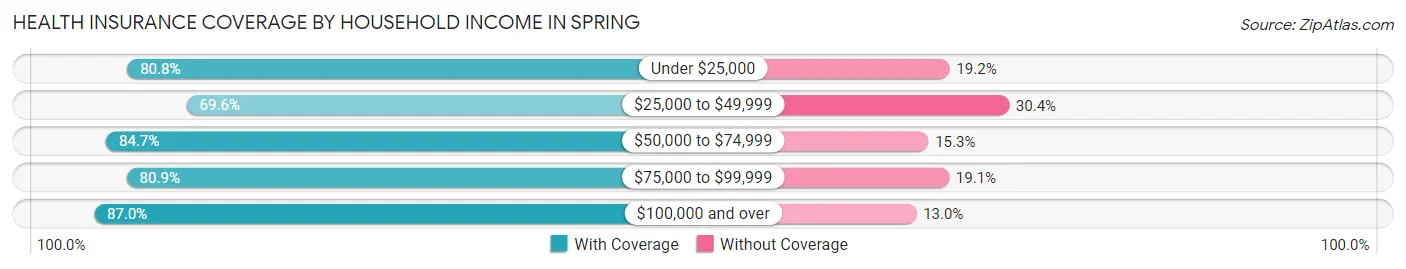
| Household Income | With Coverage | Without Coverage |
| Under $25,000 | 2,502 (80.8%) | 596 (19.2%) |
| $25,000 to $49,999 | 4,927 (69.6%) | 2,149 (30.4%) |
| $50,000 to $74,999 | 10,969 (84.7%) | 1,975 (15.3%) |
| $75,000 to $99,999 | 9,820 (80.9%) | 2,323 (19.1%) |
| $100,000 and over | 24,857 (87.0%) | 3,713 (13.0%) |
Public vs Private Health Insurance Coverage by Age in Spring
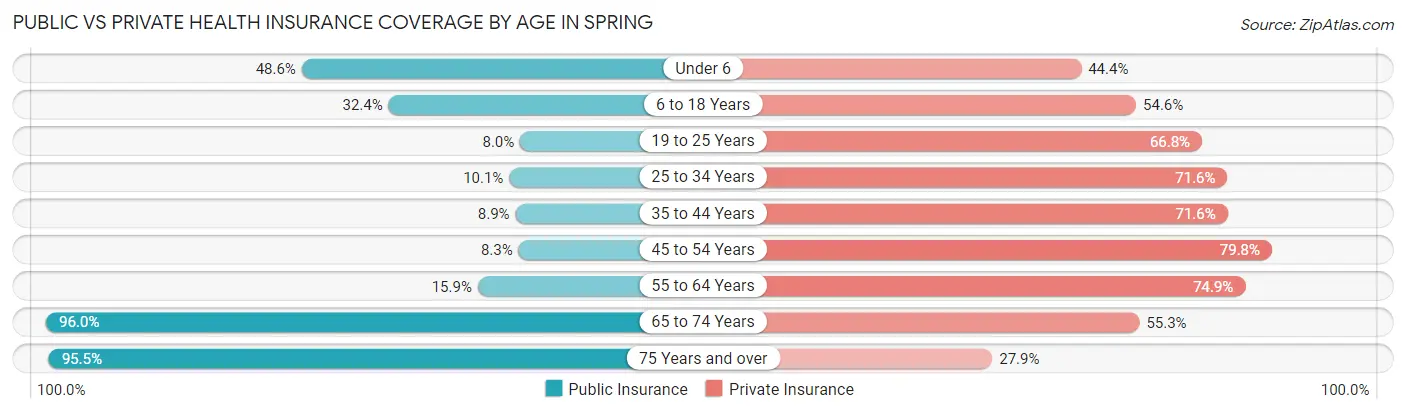
| Age Bracket | Public Insurance | Private Insurance |
| Under 6 | 2,760 (48.6%) | 2,525 (44.4%) |
| 6 to 18 Years | 3,797 (32.4%) | 6,394 (54.6%) |
| 19 to 25 Years | 469 (8.0%) | 3,908 (66.8%) |
| 25 to 34 Years | 1,076 (10.1%) | 7,659 (71.6%) |
| 35 to 44 Years | 836 (8.9%) | 6,735 (71.6%) |
| 45 to 54 Years | 591 (8.3%) | 5,675 (79.8%) |
| 55 to 64 Years | 1,180 (15.9%) | 5,559 (74.9%) |
| 65 to 74 Years | 3,731 (96.0%) | 2,147 (55.2%) |
| 75 Years and over | 1,979 (95.5%) | 579 (27.9%) |
| Total | 16,419 (25.7%) | 41,181 (64.5%) |
Disability Status by Sex by Age in Spring
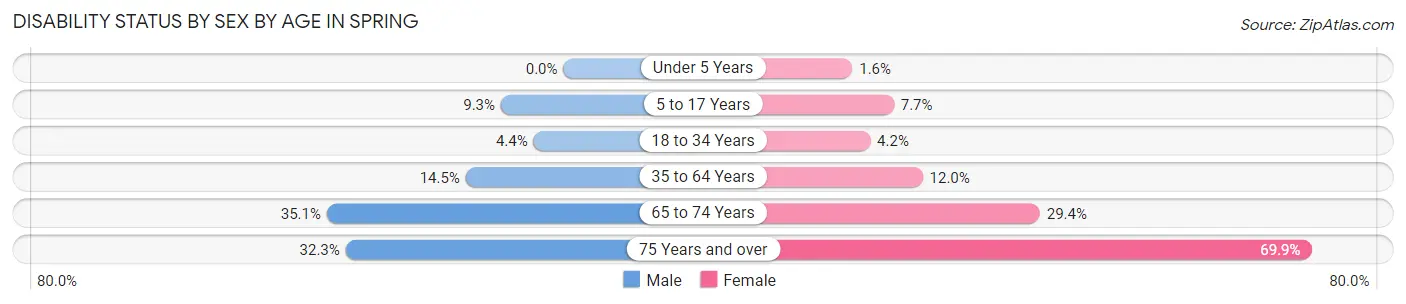
| Age Bracket | Male | Female |
| Under 5 Years | 0 (0.0%) | 42 (1.6%) |
| 5 to 17 Years | 495 (9.3%) | 516 (7.7%) |
| 18 to 34 Years | 392 (4.4%) | 347 (4.2%) |
| 35 to 64 Years | 1,725 (14.5%) | 1,445 (12.0%) |
| 65 to 74 Years | 580 (35.1%) | 657 (29.4%) |
| 75 Years and over | 246 (32.3%) | 916 (69.9%) |
Disability Class by Sex by Age in Spring
Disability Class: Hearing Difficulty
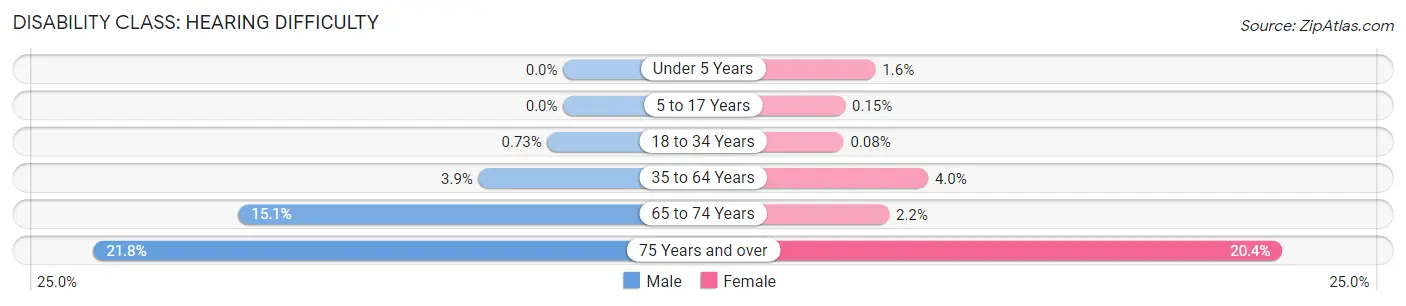
| Age Bracket | Male | Female |
| Under 5 Years | 0 (0.0%) | 42 (1.6%) |
| 5 to 17 Years | 0 (0.0%) | 10 (0.2%) |
| 18 to 34 Years | 65 (0.7%) | 7 (0.1%) |
| 35 to 64 Years | 467 (3.9%) | 482 (4.0%) |
| 65 to 74 Years | 249 (15.1%) | 49 (2.2%) |
| 75 Years and over | 166 (21.8%) | 268 (20.4%) |
Disability Class: Vision Difficulty
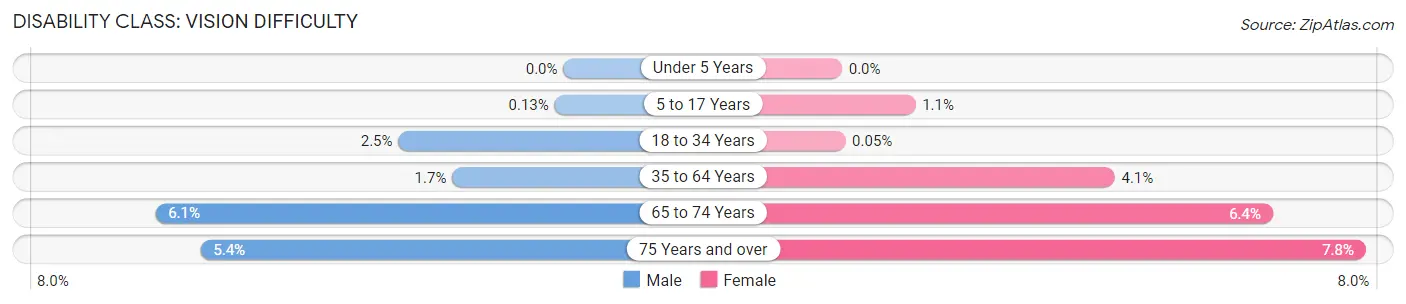
| Age Bracket | Male | Female |
| Under 5 Years | 0 (0.0%) | 0 (0.0%) |
| 5 to 17 Years | 7 (0.1%) | 73 (1.1%) |
| 18 to 34 Years | 217 (2.5%) | 4 (0.1%) |
| 35 to 64 Years | 196 (1.7%) | 488 (4.1%) |
| 65 to 74 Years | 100 (6.1%) | 143 (6.4%) |
| 75 Years and over | 41 (5.4%) | 102 (7.8%) |
Disability Class: Cognitive Difficulty
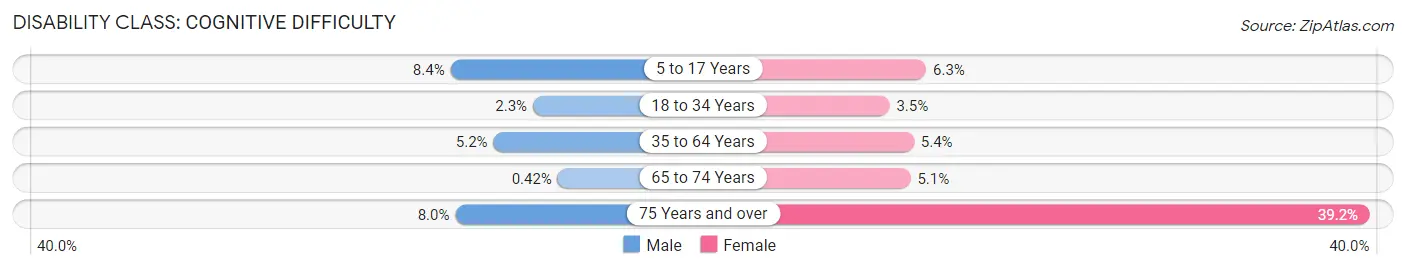
| Age Bracket | Male | Female |
| 5 to 17 Years | 447 (8.4%) | 419 (6.3%) |
| 18 to 34 Years | 200 (2.3%) | 292 (3.5%) |
| 35 to 64 Years | 617 (5.2%) | 644 (5.3%) |
| 65 to 74 Years | 7 (0.4%) | 114 (5.1%) |
| 75 Years and over | 61 (8.0%) | 514 (39.2%) |
Disability Class: Ambulatory Difficulty
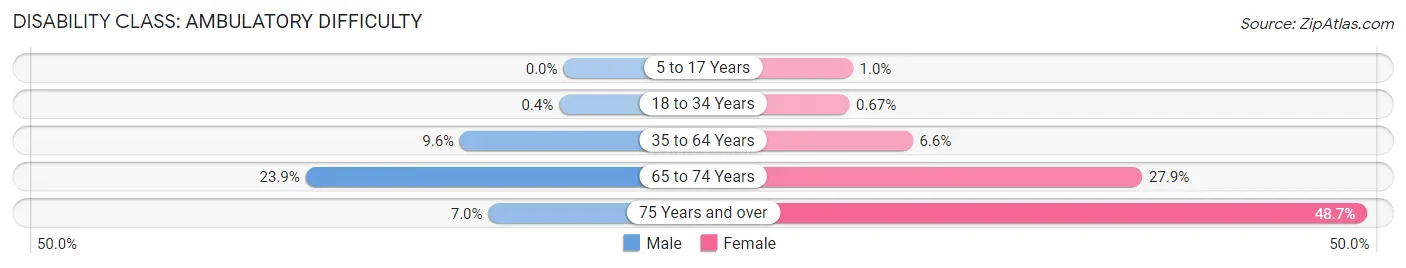
| Age Bracket | Male | Female |
| 5 to 17 Years | 0 (0.0%) | 67 (1.0%) |
| 18 to 34 Years | 35 (0.4%) | 55 (0.7%) |
| 35 to 64 Years | 1,142 (9.6%) | 790 (6.6%) |
| 65 to 74 Years | 395 (23.9%) | 623 (27.9%) |
| 75 Years and over | 53 (7.0%) | 639 (48.7%) |
Disability Class: Self-Care Difficulty
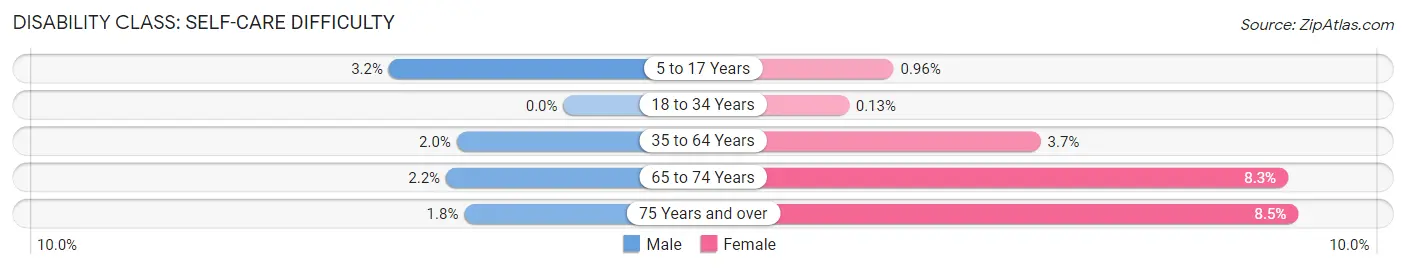
| Age Bracket | Male | Female |
| 5 to 17 Years | 173 (3.2%) | 64 (1.0%) |
| 18 to 34 Years | 0 (0.0%) | 11 (0.1%) |
| 35 to 64 Years | 235 (2.0%) | 445 (3.7%) |
| 65 to 74 Years | 36 (2.2%) | 185 (8.3%) |
| 75 Years and over | 14 (1.8%) | 111 (8.5%) |
Technology Access in Spring
Computing Device Access in Spring
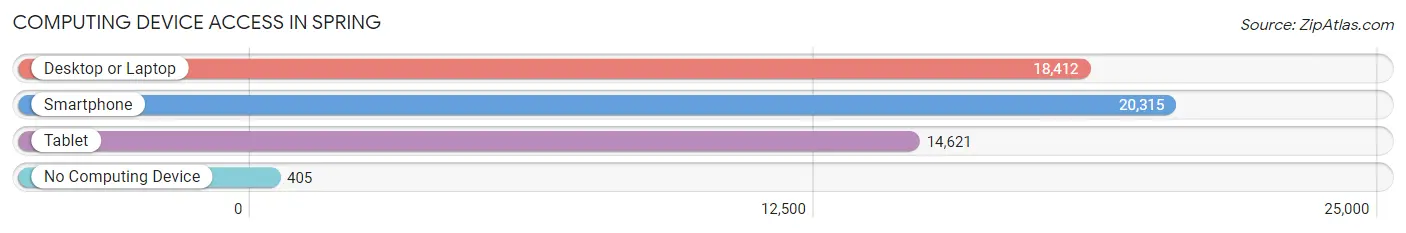
| Device Type | # Households | % Households |
| Desktop or Laptop | 18,412 | 86.7% |
| Smartphone | 20,315 | 95.7% |
| Tablet | 14,621 | 68.9% |
| No Computing Device | 405 | 1.9% |
| Total | 21,237 | 100.0% |
Internet Access in Spring
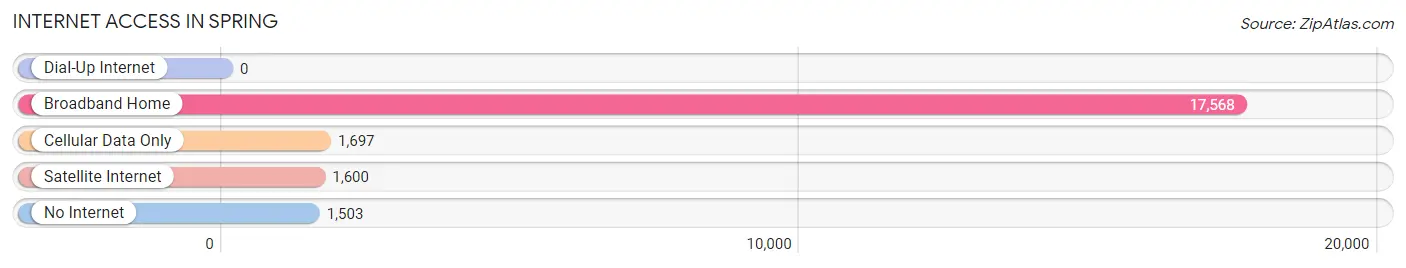
| Internet Type | # Households | % Households |
| Dial-Up Internet | 0 | 0.0% |
| Broadband Home | 17,568 | 82.7% |
| Cellular Data Only | 1,697 | 8.0% |
| Satellite Internet | 1,600 | 7.5% |
| No Internet | 1,503 | 7.1% |
| Total | 21,237 | 100.0% |
Spring Summary
Spring, Texas is a city located in Harris County, Texas, United States. It is located within the Houston–The Woodlands–Sugar Land metropolitan area. The city is situated on the Spring Creek, a tributary of the San Jacinto River. As of the 2010 census, the city had a population of 54,298.
Geography
Spring is located at 30°3′15″N 95°23′13″W (30.054167, -95.386944). It is located in the northern part of Harris County, approximately 25 miles north of downtown Houston. The city is bordered by The Woodlands to the south, Tomball to the west, and Humble to the east.
The city is located in the humid subtropical climate zone, with hot summers and mild winters. The average annual temperature is 68°F (20°C). The average annual precipitation is 48.6 inches (123 cm).
Economy
Spring is home to a variety of businesses, including oil and gas, manufacturing, retail, and healthcare. The city is also home to several corporate headquarters, including Anadarko Petroleum Corporation, Baker Hughes, and Schlumberger.
The city is also home to several shopping centers, including the Spring Town Center, the Spring Marketplace, and the Spring Towne Center.
Demographics
As of the 2010 census, the population of Spring was 54,298. The racial makeup of the city was 73.3% White, 11.3% African American, 0.7% Native American, 5.2% Asian, 0.1% Pacific Islander, 6.2% from other races, and 3.2% from two or more races. Hispanic or Latino of any race were 19.3% of the population.
The median income for a household in the city was $60,945, and the median income for a family was $71,817. The per capita income for the city was $27,845. About 6.2% of families and 8.3% of the population were below the poverty line, including 11.2% of those under age 18 and 6.2% of those age 65 or over.
Education
Spring is served by the Spring Independent School District. The district has one high school, Spring High School, and four middle schools. The district also has several elementary schools.
The city is also home to Lone Star College, a public community college. The college offers associate degrees and certificates in a variety of fields.
Conclusion
Spring, Texas is a city located in Harris County, Texas, United States. It is located within the Houston–The Woodlands–Sugar Land metropolitan area. The city is situated on the Spring Creek, a tributary of the San Jacinto River. As of the 2010 census, the city had a population of 54,298. The city is home to a variety of businesses, including oil and gas, manufacturing, retail, and healthcare. The city is also served by the Spring Independent School District and Lone Star College.
Common Questions
What is Per Capita Income in Spring?
Per Capita income in Spring is $32,966.
What is the Median Family Income in Spring?
Median Family Income in Spring is $87,173.
What is the Median Household income in Spring?
Median Household Income in Spring is $83,754.
What is Income or Wage Gap in Spring?
Income or Wage Gap in Spring is 33.4%.
Women in Spring earn 66.6 cents for every dollar earned by a man.
What is Inequality or Gini Index in Spring?
Inequality or Gini Index in Spring is 0.35.
What is the Total Population of Spring?
Total Population of Spring is 63,930.
What is the Total Male Population of Spring?
Total Male Population of Spring is 30,704.
What is the Total Female Population of Spring?
Total Female Population of Spring is 33,226.
What is the Ratio of Males per 100 Females in Spring?
There are 92.41 Males per 100 Females in Spring.
What is the Ratio of Females per 100 Males in Spring?
There are 108.21 Females per 100 Males in Spring.
What is the Median Population Age in Spring?
Median Population Age in Spring is 33.1 Years.
What is the Average Family Size in Spring
Average Family Size in Spring is 3.5 People.
What is the Average Household Size in Spring
Average Household Size in Spring is 3.0 People.
How Large is the Labor Force in Spring?
There are 34,373 People in the Labor Forcein in Spring.
What is the Percentage of People in the Labor Force in Spring?
70.2% of People are in the Labor Force in Spring.
What is the Unemployment Rate in Spring?
Unemployment Rate in Spring is 4.6%.