The Colony, TX Map & Demographics
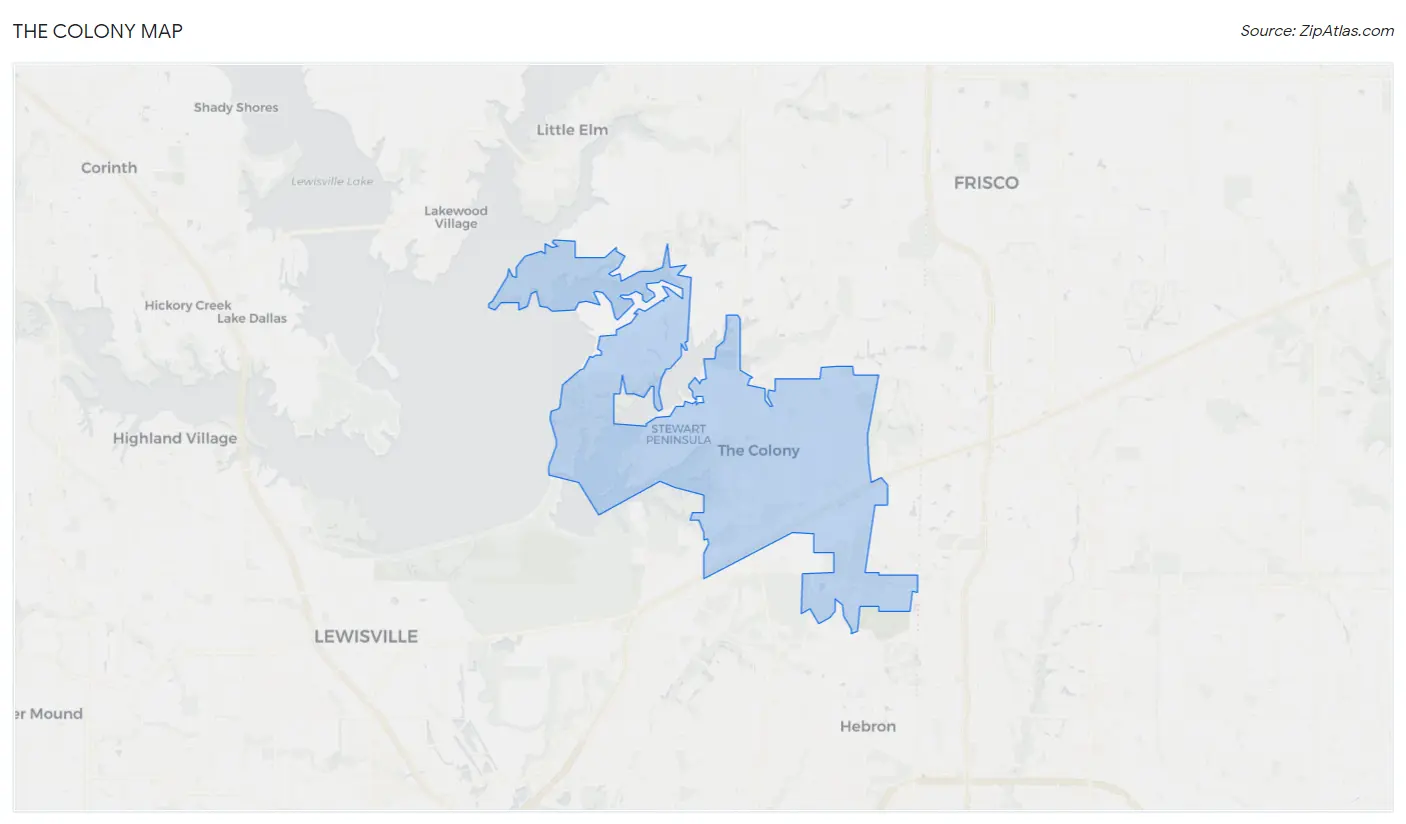
The Colony Map
The Colony Overview
$55,951
PER CAPITA INCOME
$125,855
AVG FAMILY INCOME
$106,518
AVG HOUSEHOLD INCOME
16.4%
WAGE / INCOME GAP [ % ]
83.6¢/ $1
WAGE / INCOME GAP [ $ ]
0.40
INEQUALITY / GINI INDEX
44,323
TOTAL POPULATION
22,108
MALE POPULATION
22,215
FEMALE POPULATION
99.52
MALES / 100 FEMALES
100.48
FEMALES / 100 MALES
37.2
MEDIAN AGE
3.0
AVG FAMILY SIZE
2.5
AVG HOUSEHOLD SIZE
28,822
LABOR FORCE [ PEOPLE ]
78.9%
PERCENT IN LABOR FORCE
4.1%
UNEMPLOYMENT RATE
The Colony Zip Codes
The Colony Area Codes
Income in The Colony
Income Overview in The Colony
Per Capita Income in The Colony is $55,951, while median incomes of families and households are $125,855 and $106,518 respectively.
| Characteristic | Number | Measure |
| Per Capita Income | 44,323 | $55,951 |
| Median Family Income | 11,845 | $125,855 |
| Mean Family Income | 11,845 | $157,865 |
| Median Household Income | 18,113 | $106,518 |
| Mean Household Income | 18,113 | $134,764 |
| Income Deficit | 11,845 | $0 |
| Wage / Income Gap (%) | 44,323 | 16.39% |
| Wage / Income Gap ($) | 44,323 | 83.61¢ per $1 |
| Gini / Inequality Index | 44,323 | 0.40 |
Earnings by Sex in The Colony
Average Earnings in The Colony are $59,916, $64,093 for men and $53,589 for women, a difference of 16.4%.
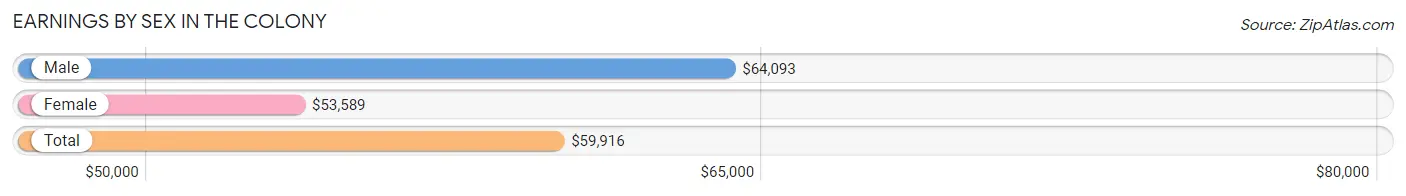
| Sex | Number | Average Earnings |
| Male | 15,806 (53.4%) | $64,093 |
| Female | 13,794 (46.6%) | $53,589 |
| Total | 29,600 (100.0%) | $59,916 |
Earnings by Sex by Income Bracket in The Colony
The most common earnings brackets in The Colony are $100,000+ for men (3,988 | 25.2%) and $100,000+ for women (2,400 | 17.4%).
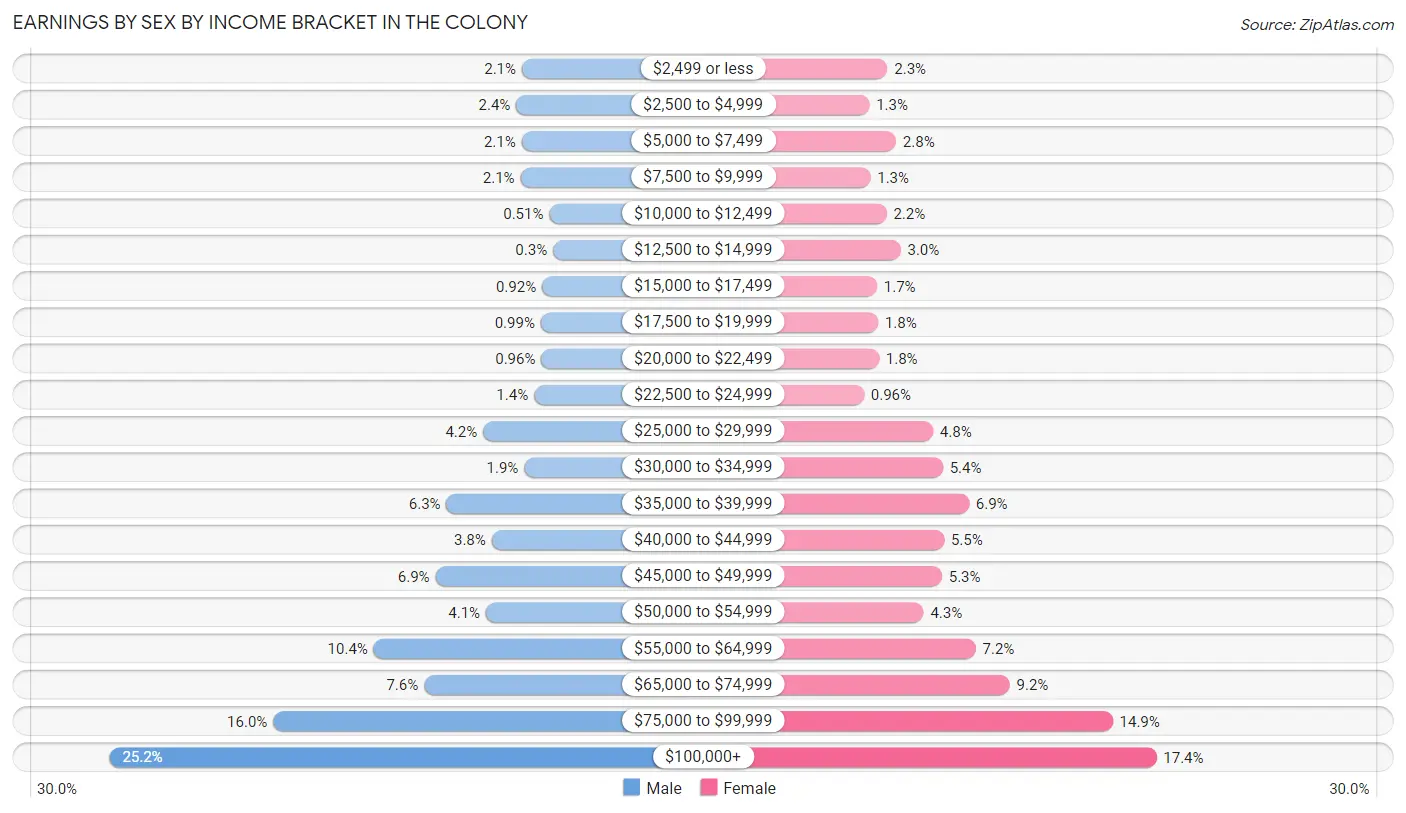
| Income | Male | Female |
| $2,499 or less | 324 (2.1%) | 315 (2.3%) |
| $2,500 to $4,999 | 374 (2.4%) | 174 (1.3%) |
| $5,000 to $7,499 | 327 (2.1%) | 381 (2.8%) |
| $7,500 to $9,999 | 336 (2.1%) | 182 (1.3%) |
| $10,000 to $12,499 | 81 (0.5%) | 308 (2.2%) |
| $12,500 to $14,999 | 48 (0.3%) | 416 (3.0%) |
| $15,000 to $17,499 | 145 (0.9%) | 233 (1.7%) |
| $17,500 to $19,999 | 157 (1.0%) | 242 (1.8%) |
| $20,000 to $22,499 | 151 (1.0%) | 248 (1.8%) |
| $22,500 to $24,999 | 217 (1.4%) | 133 (1.0%) |
| $25,000 to $29,999 | 668 (4.2%) | 667 (4.8%) |
| $30,000 to $34,999 | 303 (1.9%) | 743 (5.4%) |
| $35,000 to $39,999 | 994 (6.3%) | 946 (6.9%) |
| $40,000 to $44,999 | 592 (3.7%) | 753 (5.5%) |
| $45,000 to $49,999 | 1,092 (6.9%) | 737 (5.3%) |
| $50,000 to $54,999 | 643 (4.1%) | 594 (4.3%) |
| $55,000 to $64,999 | 1,640 (10.4%) | 999 (7.2%) |
| $65,000 to $74,999 | 1,193 (7.5%) | 1,262 (9.1%) |
| $75,000 to $99,999 | 2,533 (16.0%) | 2,061 (14.9%) |
| $100,000+ | 3,988 (25.2%) | 2,400 (17.4%) |
| Total | 15,806 (100.0%) | 13,794 (100.0%) |
Earnings by Sex by Educational Attainment in The Colony
Average earnings in The Colony are $70,166 for men and $58,833 for women, a difference of 16.2%. Men with an educational attainment of graduate degree enjoy the highest average annual earnings of $86,542, while those with less than high school education earn the least with $40,940. Women with an educational attainment of graduate degree earn the most with the average annual earnings of $74,391, while those with less than high school education have the smallest earnings of $25,833.
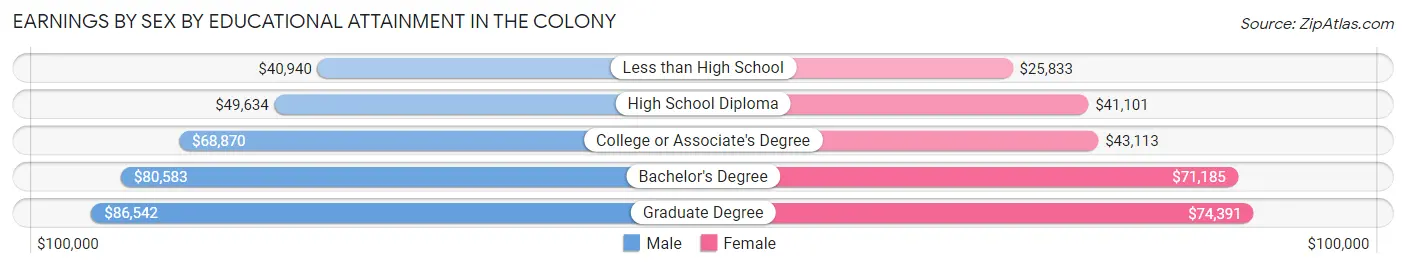
| Educational Attainment | Male Income | Female Income |
| Less than High School | $40,940 | $25,833 |
| High School Diploma | $49,634 | $41,101 |
| College or Associate's Degree | $68,870 | $43,113 |
| Bachelor's Degree | $80,583 | $71,185 |
| Graduate Degree | $86,542 | $74,391 |
| Total | $70,166 | $58,833 |
Family Income in The Colony
Family Income Brackets in The Colony
According to the The Colony family income data, there are 3,423 families falling into the $100,000 to $149,999 income range, which is the most common income bracket and makes up 28.9% of all families. Conversely, the $10,000 to $14,999 income bracket is the least frequent group with only 154 families (1.3%) belonging to this category.
| Income Bracket | # Families | % Families |
| Less than $10,000 | 225 | 1.9% |
| $10,000 to $14,999 | 154 | 1.3% |
| $15,000 to $24,999 | 166 | 1.4% |
| $25,000 to $34,999 | 237 | 2.0% |
| $35,000 to $49,999 | 450 | 3.8% |
| $50,000 to $74,999 | 1,031 | 8.7% |
| $75,000 to $99,999 | 1,765 | 14.9% |
| $100,000 to $149,999 | 3,423 | 28.9% |
| $150,000 to $199,999 | 1,860 | 15.7% |
| $200,000+ | 2,547 | 21.5% |
Family Income by Famaliy Size in The Colony
7+ person families (41 | 0.4%) account for the highest median family income in The Colony with $163,750 per family, while 2-person families (5,500 | 46.4%) have the highest median income of $61,130 per family member.
| Income Bracket | # Families | Median Income |
| 2-Person Families | 5,500 (46.4%) | $122,261 |
| 3-Person Families | 3,168 (26.8%) | $138,750 |
| 4-Person Families | 1,812 (15.3%) | $123,750 |
| 5-Person Families | 893 (7.5%) | $131,586 |
| 6-Person Families | 431 (3.6%) | $145,048 |
| 7+ Person Families | 41 (0.4%) | $163,750 |
| Total | 11,845 (100.0%) | $125,855 |
Family Income by Number of Earners in The Colony
The median family income in The Colony is $125,855, with families comprising 3+ earners (1,633) having the highest median family income of $147,006, while families with no earners (794) have the lowest median family income of $49,833, accounting for 13.8% and 6.7% of families, respectively.
| Number of Earners | # Families | Median Income |
| No Earners | 794 (6.7%) | $49,833 |
| 1 Earner | 2,913 (24.6%) | $94,470 |
| 2 Earners | 6,505 (54.9%) | $136,138 |
| 3+ Earners | 1,633 (13.8%) | $147,006 |
| Total | 11,845 (100.0%) | $125,855 |
Household Income in The Colony
Household Income Brackets in The Colony
With 4,474 households falling in the category, the $100,000 to $149,999 income range is the most frequent in The Colony, accounting for 24.7% of all households. In contrast, only 290 households (1.6%) fall into the $10,000 to $14,999 income bracket, making it the least populous group.
| Income Bracket | # Households | % Households |
| Less than $10,000 | 435 | 2.4% |
| $10,000 to $14,999 | 290 | 1.6% |
| $15,000 to $24,999 | 471 | 2.6% |
| $25,000 to $34,999 | 543 | 3.0% |
| $35,000 to $49,999 | 1,250 | 6.9% |
| $50,000 to $74,999 | 2,536 | 14.0% |
| $75,000 to $99,999 | 2,735 | 15.1% |
| $100,000 to $149,999 | 4,474 | 24.7% |
| $150,000 to $199,999 | 2,318 | 12.8% |
| $200,000+ | 3,061 | 16.9% |
Household Income by Householder Age in The Colony
The median household income in The Colony is $106,518, with the highest median household income of $135,730 found in the 45 to 64 years age bracket for the primary householder. A total of 7,236 households (40.0%) fall into this category. Meanwhile, the 15 to 24 years age bracket for the primary householder has the lowest median household income of $53,590, with 330 households (1.8%) in this group.
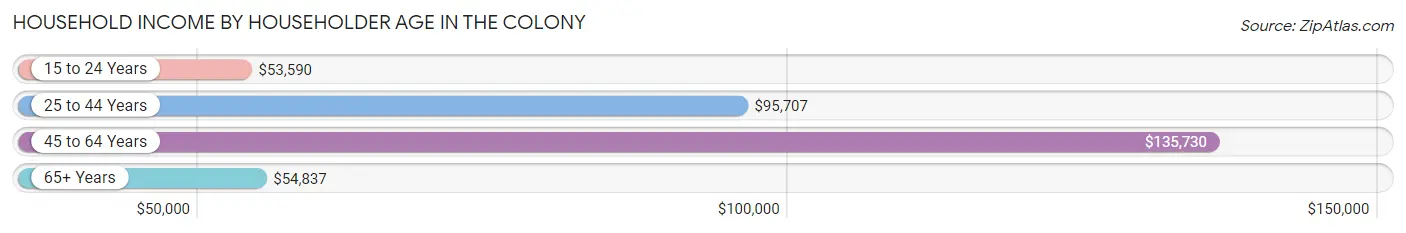
| Income Bracket | # Households | Median Income |
| 15 to 24 Years | 330 (1.8%) | $53,590 |
| 25 to 44 Years | 8,294 (45.8%) | $95,707 |
| 45 to 64 Years | 7,236 (40.0%) | $135,730 |
| 65+ Years | 2,253 (12.4%) | $54,837 |
| Total | 18,113 (100.0%) | $106,518 |
Poverty in The Colony
Income Below Poverty by Sex and Age in The Colony
With 6.6% poverty level for males and 7.2% for females among the residents of The Colony, 5 year old males and 75 year old and over females are the most vulnerable to poverty, with 32 males (24.4%) and 264 females (27.6%) in their respective age groups living below the poverty level.
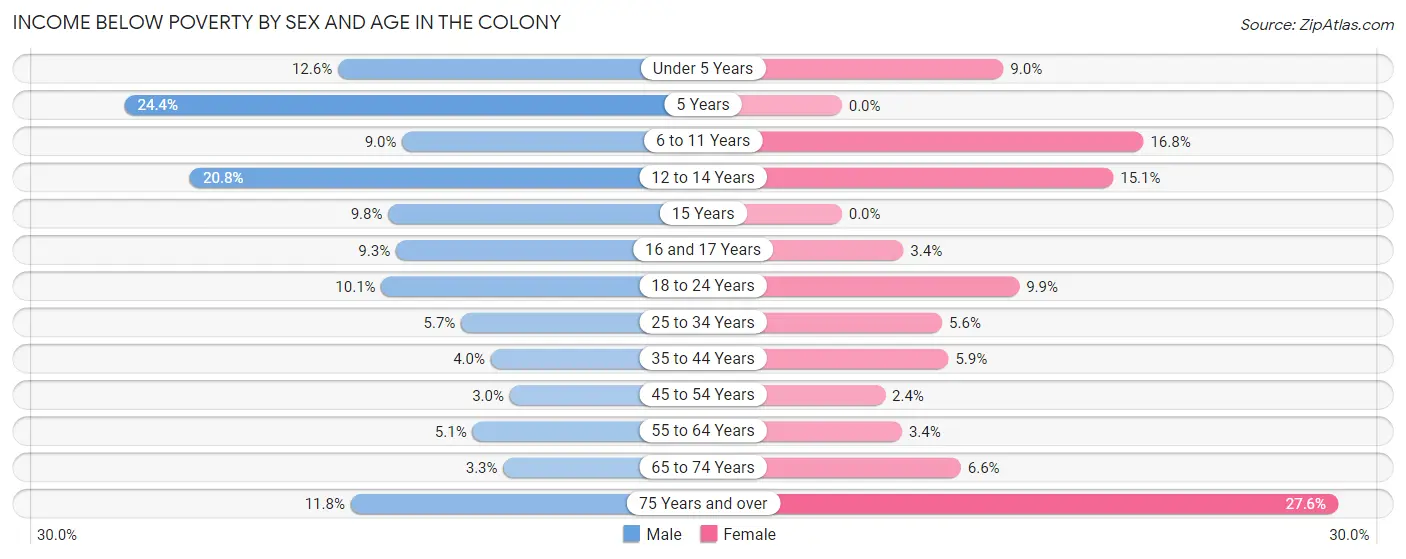
| Age Bracket | Male | Female |
| Under 5 Years | 170 (12.6%) | 152 (9.0%) |
| 5 Years | 32 (24.4%) | 0 (0.0%) |
| 6 to 11 Years | 111 (9.0%) | 211 (16.8%) |
| 12 to 14 Years | 160 (20.8%) | 109 (15.1%) |
| 15 Years | 27 (9.8%) | 0 (0.0%) |
| 16 and 17 Years | 30 (9.3%) | 15 (3.4%) |
| 18 to 24 Years | 162 (10.1%) | 117 (9.9%) |
| 25 to 34 Years | 242 (5.7%) | 255 (5.6%) |
| 35 to 44 Years | 147 (4.0%) | 202 (5.9%) |
| 45 to 54 Years | 110 (3.0%) | 85 (2.4%) |
| 55 to 64 Years | 152 (5.1%) | 97 (3.4%) |
| 65 to 74 Years | 42 (3.3%) | 83 (6.6%) |
| 75 Years and over | 65 (11.8%) | 264 (27.6%) |
| Total | 1,450 (6.6%) | 1,590 (7.2%) |
Income Above Poverty by Sex and Age in The Colony
According to the poverty statistics in The Colony, males aged 45 to 54 years and females aged 5 years are the age groups that are most secure financially, with 97.0% of males and 100.0% of females in these age groups living above the poverty line.
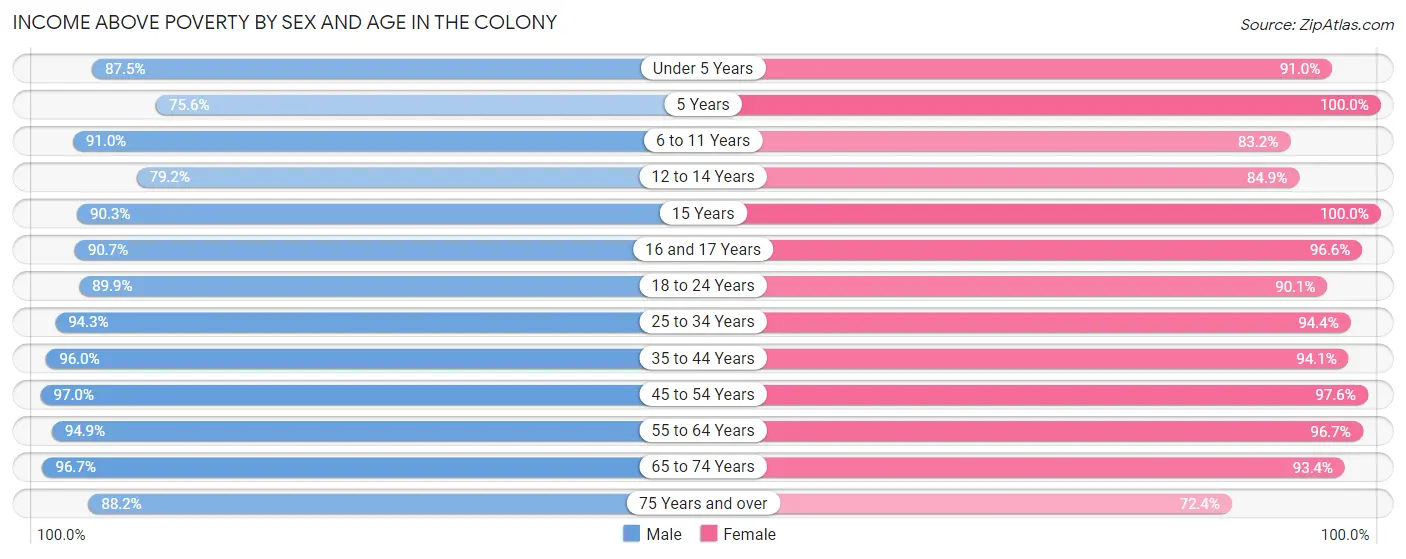
| Age Bracket | Male | Female |
| Under 5 Years | 1,185 (87.5%) | 1,536 (91.0%) |
| 5 Years | 99 (75.6%) | 176 (100.0%) |
| 6 to 11 Years | 1,127 (91.0%) | 1,045 (83.2%) |
| 12 to 14 Years | 610 (79.2%) | 612 (84.9%) |
| 15 Years | 250 (90.2%) | 141 (100.0%) |
| 16 and 17 Years | 292 (90.7%) | 422 (96.6%) |
| 18 to 24 Years | 1,438 (89.9%) | 1,067 (90.1%) |
| 25 to 34 Years | 4,008 (94.3%) | 4,308 (94.4%) |
| 35 to 44 Years | 3,488 (96.0%) | 3,198 (94.1%) |
| 45 to 54 Years | 3,586 (97.0%) | 3,442 (97.6%) |
| 55 to 64 Years | 2,854 (94.9%) | 2,797 (96.7%) |
| 65 to 74 Years | 1,217 (96.7%) | 1,169 (93.4%) |
| 75 Years and over | 484 (88.2%) | 692 (72.4%) |
| Total | 20,638 (93.4%) | 20,605 (92.8%) |
Income Below Poverty Among Married-Couple Families in The Colony
The poverty statistics for married-couple families in The Colony show that 3.1% or 290 of the total 9,349 families live below the poverty line. Families with 3 or 4 children have the highest poverty rate of 18.9%, comprising of 93 families. On the other hand, families with 5 or more children have the lowest poverty rate of 0.0%, which includes 0 families.
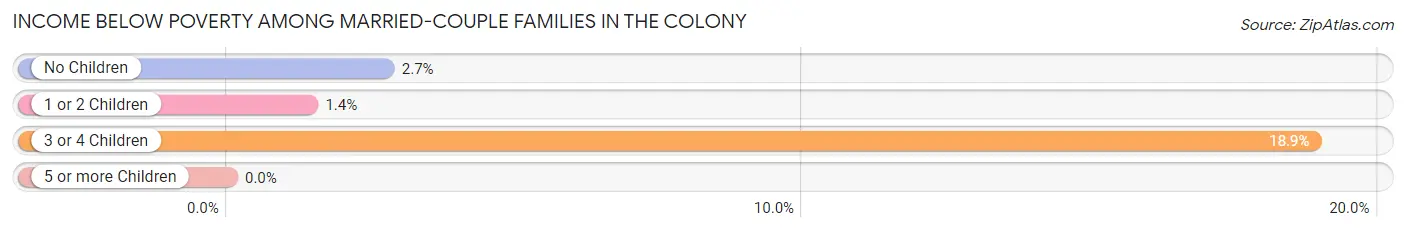
| Children | Above Poverty | Below Poverty |
| No Children | 5,345 (97.3%) | 150 (2.7%) |
| 1 or 2 Children | 3,303 (98.6%) | 47 (1.4%) |
| 3 or 4 Children | 400 (81.1%) | 93 (18.9%) |
| 5 or more Children | 11 (100.0%) | 0 (0.0%) |
| Total | 9,059 (96.9%) | 290 (3.1%) |
Income Below Poverty Among Single-Parent Households in The Colony
According to the poverty data in The Colony, 1.1% or 10 single-father households and 16.1% or 257 single-mother households are living below the poverty line. Among single-father households, those with no children have the highest poverty rate, with 10 households (2.5%) experiencing poverty. Likewise, among single-mother households, those with 3 or 4 children have the highest poverty rate, with 143 households (52.6%) falling below the poverty line.
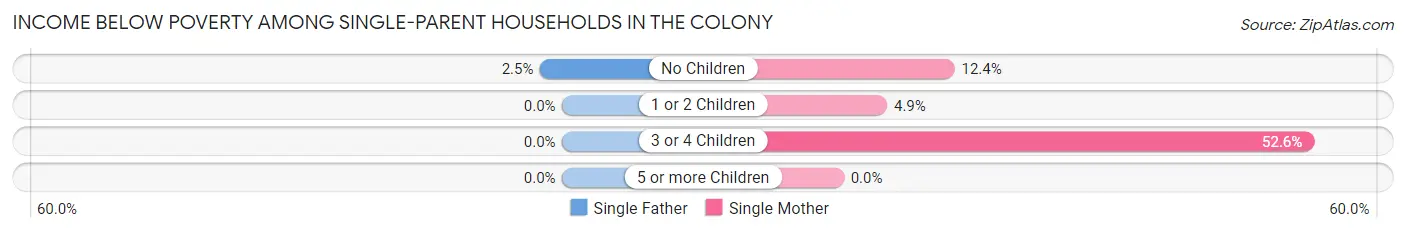
| Children | Single Father | Single Mother |
| No Children | 10 (2.5%) | 82 (12.4%) |
| 1 or 2 Children | 0 (0.0%) | 32 (4.9%) |
| 3 or 4 Children | 0 (0.0%) | 143 (52.6%) |
| 5 or more Children | 0 (0.0%) | 0 (0.0%) |
| Total | 10 (1.1%) | 257 (16.1%) |
Income Below Poverty Among Married-Couple vs Single-Parent Households in The Colony
The poverty data for The Colony shows that 290 of the married-couple family households (3.1%) and 267 of the single-parent households (10.7%) are living below the poverty level. Within the married-couple family households, those with 3 or 4 children have the highest poverty rate, with 93 households (18.9%) falling below the poverty line. Among the single-parent households, those with 3 or 4 children have the highest poverty rate, with 143 household (37.1%) living below poverty.
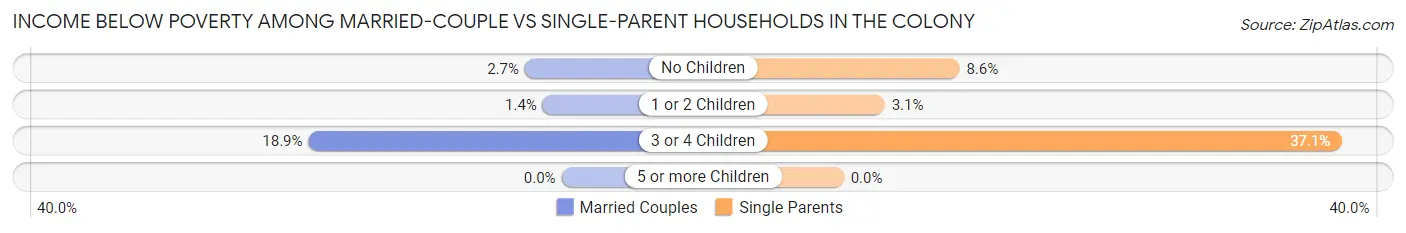
| Children | Married-Couple Families | Single-Parent Households |
| No Children | 150 (2.7%) | 92 (8.6%) |
| 1 or 2 Children | 47 (1.4%) | 32 (3.1%) |
| 3 or 4 Children | 93 (18.9%) | 143 (37.1%) |
| 5 or more Children | 0 (0.0%) | 0 (0.0%) |
| Total | 290 (3.1%) | 267 (10.7%) |
Race in The Colony
The most populous races in The Colony are White / Caucasian (28,369 | 64.0%), Hispanic or Latino (9,377 | 21.2%), and Two or more Races (5,504 | 12.4%).
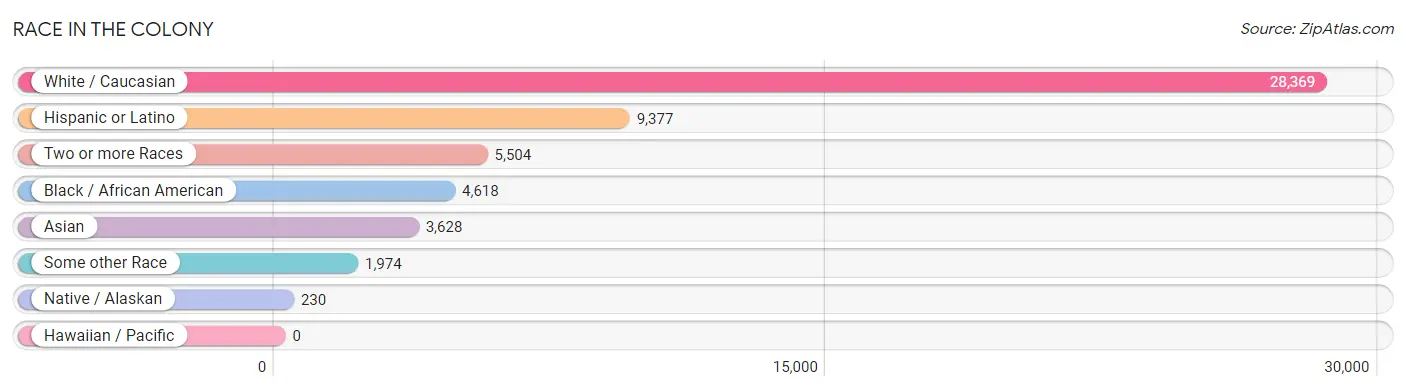
| Race | # Population | % Population |
| Asian | 3,628 | 8.2% |
| Black / African American | 4,618 | 10.4% |
| Hawaiian / Pacific | 0 | 0.0% |
| Hispanic or Latino | 9,377 | 21.2% |
| Native / Alaskan | 230 | 0.5% |
| White / Caucasian | 28,369 | 64.0% |
| Two or more Races | 5,504 | 12.4% |
| Some other Race | 1,974 | 4.4% |
| Total | 44,323 | 100.0% |
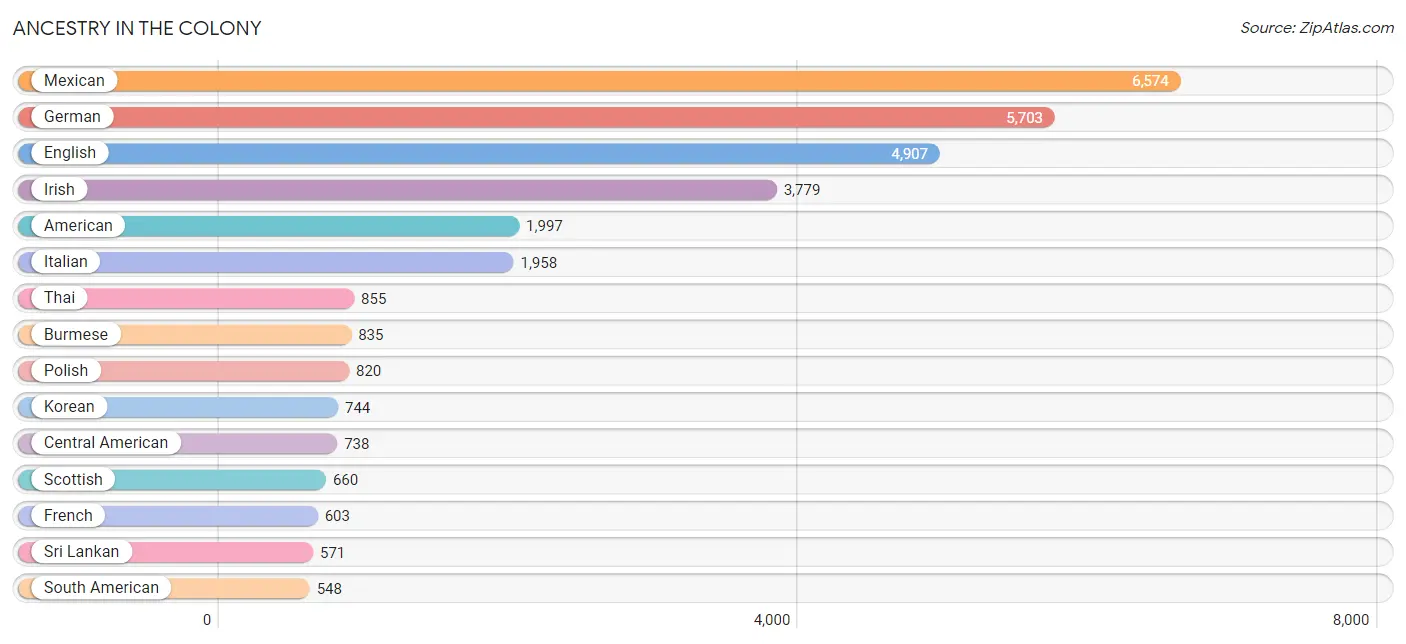
Ancestry in The Colony
The most populous ancestries reported in The Colony are Mexican (6,574 | 14.8%), German (5,703 | 12.9%), English (4,907 | 11.1%), Irish (3,779 | 8.5%), and American (1,997 | 4.5%), together accounting for 51.8% of all The Colony residents.
| Ancestry | # Population | % Population |
| African | 204 | 0.5% |
| Albanian | 5 | 0.0% |
| American | 1,997 | 4.5% |
| Apache | 48 | 0.1% |
| Arab | 301 | 0.7% |
| Armenian | 37 | 0.1% |
| Austrian | 20 | 0.1% |
| Belgian | 24 | 0.1% |
| Bhutanese | 241 | 0.5% |
| Brazilian | 155 | 0.4% |
| British | 248 | 0.6% |
| Bulgarian | 69 | 0.2% |
| Burmese | 835 | 1.9% |
| Canadian | 129 | 0.3% |
| Carpatho Rusyn | 3 | 0.0% |
| Celtic | 28 | 0.1% |
| Central American | 738 | 1.7% |
| Central American Indian | 115 | 0.3% |
| Cherokee | 258 | 0.6% |
| Cheyenne | 40 | 0.1% |
| Chickasaw | 81 | 0.2% |
| Choctaw | 87 | 0.2% |
| Colombian | 279 | 0.6% |
| Creek | 60 | 0.1% |
| Cuban | 431 | 1.0% |
| Czech | 181 | 0.4% |
| Czechoslovakian | 15 | 0.0% |
| Danish | 43 | 0.1% |
| Dominican | 17 | 0.0% |
| Dutch | 345 | 0.8% |
| Dutch West Indian | 24 | 0.1% |
| Eastern European | 38 | 0.1% |
| English | 4,907 | 11.1% |
| Estonian | 15 | 0.0% |
| Ethiopian | 6 | 0.0% |
| European | 512 | 1.2% |
| Filipino | 63 | 0.1% |
| Finnish | 31 | 0.1% |
| French | 603 | 1.4% |
| French Canadian | 146 | 0.3% |
| German | 5,703 | 12.9% |
| German Russian | 14 | 0.0% |
| Greek | 341 | 0.8% |
| Guatemalan | 69 | 0.2% |
| Honduran | 128 | 0.3% |
| Hungarian | 17 | 0.0% |
| Indian (Asian) | 404 | 0.9% |
| Iranian | 81 | 0.2% |
| Irish | 3,779 | 8.5% |
| Italian | 1,958 | 4.4% |
| Jamaican | 103 | 0.2% |
| Japanese | 410 | 0.9% |
| Jordanian | 66 | 0.2% |
| Kenyan | 28 | 0.1% |
| Korean | 744 | 1.7% |
| Lebanese | 227 | 0.5% |
| Lithuanian | 201 | 0.4% |
| Mexican | 6,574 | 14.8% |
| Mexican American Indian | 14 | 0.0% |
| Navajo | 9 | 0.0% |
| Nigerian | 84 | 0.2% |
| Northern European | 116 | 0.3% |
| Norwegian | 236 | 0.5% |
| Okinawan | 10 | 0.0% |
| Ottawa | 76 | 0.2% |
| Pakistani | 36 | 0.1% |
| Panamanian | 84 | 0.2% |
| Paraguayan | 12 | 0.0% |
| Polish | 820 | 1.8% |
| Portuguese | 109 | 0.3% |
| Pueblo | 85 | 0.2% |
| Puerto Rican | 437 | 1.0% |
| Romanian | 76 | 0.2% |
| Russian | 73 | 0.2% |
| Salvadoran | 457 | 1.0% |
| Scandinavian | 270 | 0.6% |
| Scotch-Irish | 399 | 0.9% |
| Scottish | 660 | 1.5% |
| Seminole | 6 | 0.0% |
| Slovak | 34 | 0.1% |
| South American | 548 | 1.2% |
| Spaniard | 315 | 0.7% |
| Spanish | 19 | 0.0% |
| Sri Lankan | 571 | 1.3% |
| Subsaharan African | 322 | 0.7% |
| Swedish | 211 | 0.5% |
| Swiss | 23 | 0.1% |
| Thai | 855 | 1.9% |
| Ukrainian | 117 | 0.3% |
| Uruguayan | 8 | 0.0% |
| Venezuelan | 249 | 0.6% |
| Vietnamese | 19 | 0.0% |
| Welsh | 277 | 0.6% |
| West Indian | 15 | 0.0% | View All 94 Rows |
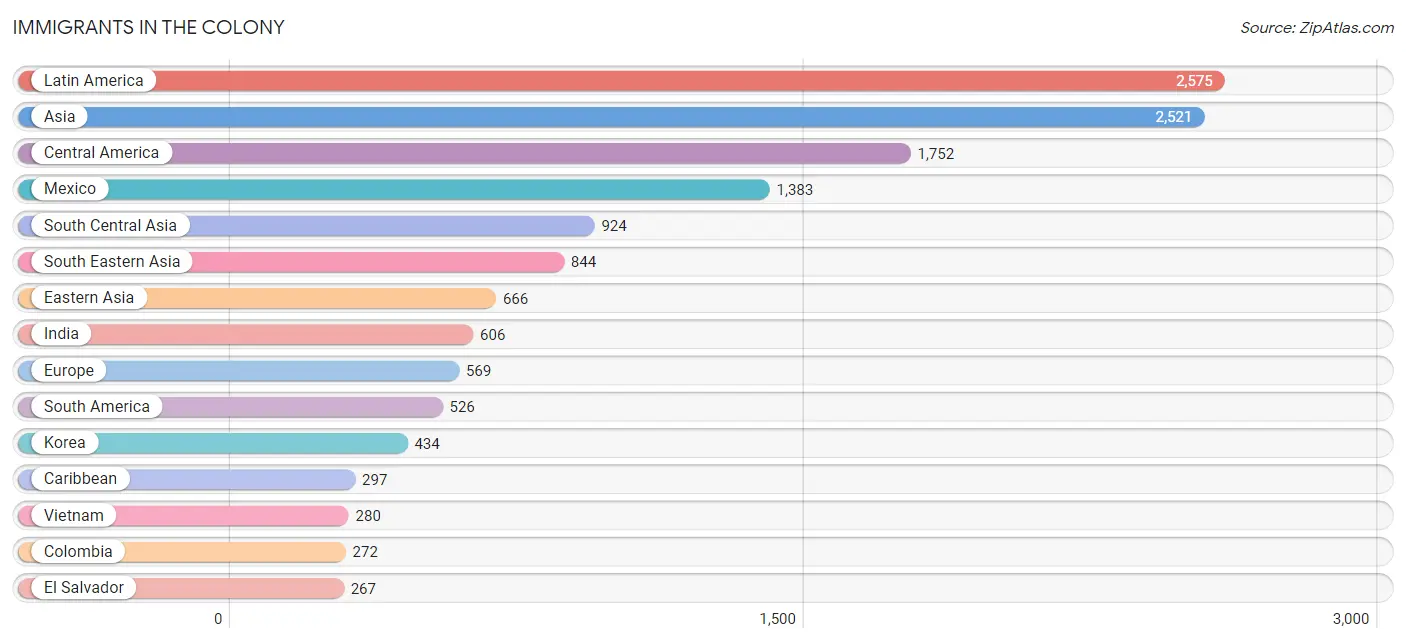
Immigrants in The Colony
The most numerous immigrant groups reported in The Colony came from Latin America (2,575 | 5.8%), Asia (2,521 | 5.7%), Central America (1,752 | 4.0%), Mexico (1,383 | 3.1%), and South Central Asia (924 | 2.1%), together accounting for 20.7% of all The Colony residents.
| Immigration Origin | # Population | % Population |
| Africa | 231 | 0.5% |
| Albania | 5 | 0.0% |
| Asia | 2,521 | 5.7% |
| Austria | 18 | 0.0% |
| Bangladesh | 19 | 0.0% |
| Brazil | 47 | 0.1% |
| Bulgaria | 13 | 0.0% |
| Cambodia | 262 | 0.6% |
| Canada | 157 | 0.4% |
| Caribbean | 297 | 0.7% |
| Central America | 1,752 | 4.0% |
| China | 229 | 0.5% |
| Colombia | 272 | 0.6% |
| Cuba | 220 | 0.5% |
| Eastern Africa | 158 | 0.4% |
| Eastern Asia | 666 | 1.5% |
| Eastern Europe | 258 | 0.6% |
| El Salvador | 267 | 0.6% |
| England | 86 | 0.2% |
| Ethiopia | 6 | 0.0% |
| Europe | 569 | 1.3% |
| Germany | 9 | 0.0% |
| Greece | 31 | 0.1% |
| Guatemala | 31 | 0.1% |
| Honduras | 71 | 0.2% |
| Hong Kong | 15 | 0.0% |
| India | 606 | 1.4% |
| Iran | 81 | 0.2% |
| Jamaica | 77 | 0.2% |
| Japan | 3 | 0.0% |
| Jordan | 23 | 0.1% |
| Kenya | 91 | 0.2% |
| Korea | 434 | 1.0% |
| Latin America | 2,575 | 5.8% |
| Malaysia | 20 | 0.1% |
| Mexico | 1,383 | 3.1% |
| Nepal | 4 | 0.0% |
| Netherlands | 47 | 0.1% |
| Nigeria | 64 | 0.1% |
| Northern Europe | 160 | 0.4% |
| Pakistan | 214 | 0.5% |
| Philippines | 216 | 0.5% |
| Poland | 97 | 0.2% |
| Portugal | 28 | 0.1% |
| Romania | 32 | 0.1% |
| Russia | 17 | 0.0% |
| Saudi Arabia | 46 | 0.1% |
| Scotland | 34 | 0.1% |
| Singapore | 10 | 0.0% |
| South Africa | 9 | 0.0% |
| South America | 526 | 1.2% |
| South Central Asia | 924 | 2.1% |
| South Eastern Asia | 844 | 1.9% |
| Southern Europe | 77 | 0.2% |
| Spain | 18 | 0.0% |
| Syria | 18 | 0.0% |
| Taiwan | 41 | 0.1% |
| Thailand | 56 | 0.1% |
| Ukraine | 78 | 0.2% |
| Uruguay | 8 | 0.0% |
| Venezuela | 187 | 0.4% |
| Vietnam | 280 | 0.6% |
| Western Africa | 64 | 0.1% |
| Western Asia | 87 | 0.2% |
| Western Europe | 74 | 0.2% |
| Zimbabwe | 61 | 0.1% | View All 66 Rows |
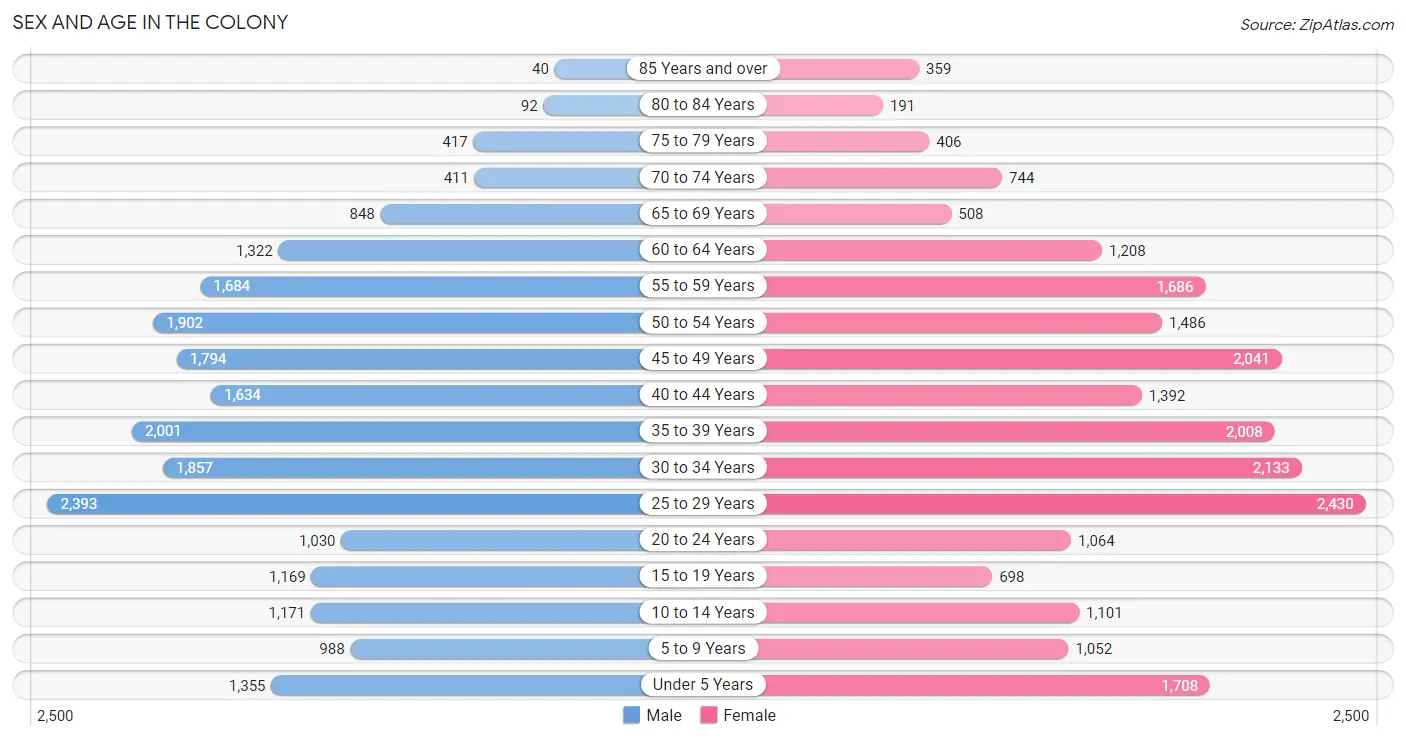
Sex and Age in The Colony
Sex and Age in The Colony
The most populous age groups in The Colony are 25 to 29 Years (2,393 | 10.8%) for men and 25 to 29 Years (2,430 | 10.9%) for women.
| Age Bracket | Male | Female |
| Under 5 Years | 1,355 (6.1%) | 1,708 (7.7%) |
| 5 to 9 Years | 988 (4.5%) | 1,052 (4.7%) |
| 10 to 14 Years | 1,171 (5.3%) | 1,101 (5.0%) |
| 15 to 19 Years | 1,169 (5.3%) | 698 (3.1%) |
| 20 to 24 Years | 1,030 (4.7%) | 1,064 (4.8%) |
| 25 to 29 Years | 2,393 (10.8%) | 2,430 (10.9%) |
| 30 to 34 Years | 1,857 (8.4%) | 2,133 (9.6%) |
| 35 to 39 Years | 2,001 (9.0%) | 2,008 (9.0%) |
| 40 to 44 Years | 1,634 (7.4%) | 1,392 (6.3%) |
| 45 to 49 Years | 1,794 (8.1%) | 2,041 (9.2%) |
| 50 to 54 Years | 1,902 (8.6%) | 1,486 (6.7%) |
| 55 to 59 Years | 1,684 (7.6%) | 1,686 (7.6%) |
| 60 to 64 Years | 1,322 (6.0%) | 1,208 (5.4%) |
| 65 to 69 Years | 848 (3.8%) | 508 (2.3%) |
| 70 to 74 Years | 411 (1.9%) | 744 (3.4%) |
| 75 to 79 Years | 417 (1.9%) | 406 (1.8%) |
| 80 to 84 Years | 92 (0.4%) | 191 (0.9%) |
| 85 Years and over | 40 (0.2%) | 359 (1.6%) |
| Total | 22,108 (100.0%) | 22,215 (100.0%) |
Families and Households in The Colony
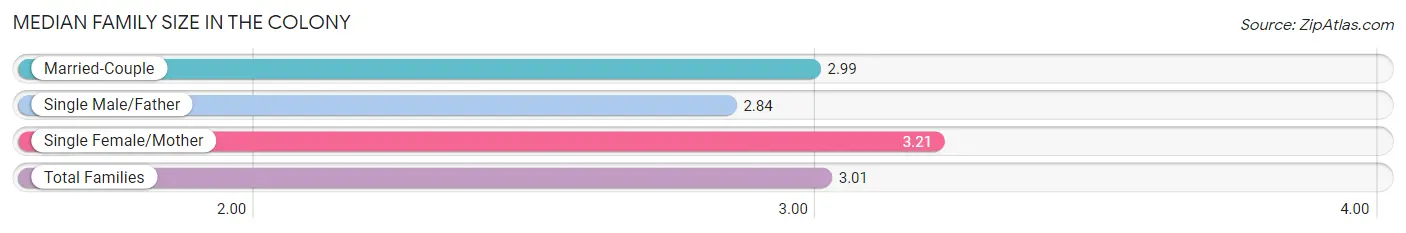
Median Family Size in The Colony
The median family size in The Colony is 3.01 persons per family, with single female/mother families (1,594 | 13.5%) accounting for the largest median family size of 3.21 persons per family. On the other hand, single male/father families (902 | 7.6%) represent the smallest median family size with 2.84 persons per family.
| Family Type | # Families | Family Size |
| Married-Couple | 9,349 (78.9%) | 2.99 |
| Single Male/Father | 902 (7.6%) | 2.84 |
| Single Female/Mother | 1,594 (13.5%) | 3.21 |
| Total Families | 11,845 (100.0%) | 3.01 |
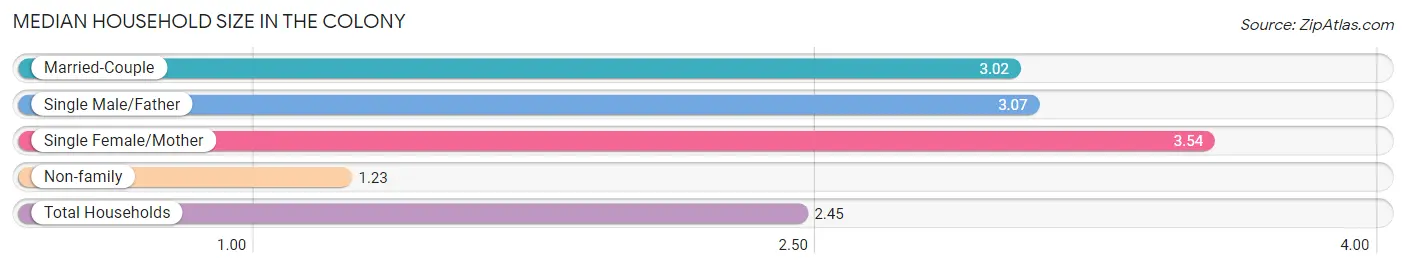
Median Household Size in The Colony
The median household size in The Colony is 2.45 persons per household, with single female/mother households (1,594 | 8.8%) accounting for the largest median household size of 3.54 persons per household. non-family households (6,268 | 34.6%) represent the smallest median household size with 1.23 persons per household.
| Household Type | # Households | Household Size |
| Married-Couple | 9,349 (51.6%) | 3.02 |
| Single Male/Father | 902 (5.0%) | 3.07 |
| Single Female/Mother | 1,594 (8.8%) | 3.54 |
| Non-family | 6,268 (34.6%) | 1.23 |
| Total Households | 18,113 (100.0%) | 2.45 |
Household Size by Marriage Status in The Colony
Out of a total of 18,113 households in The Colony, 11,845 (65.4%) are family households, while 6,268 (34.6%) are nonfamily households. The most numerous type of family households are 2-person households, comprising 5,131, and the most common type of nonfamily households are 1-person households, comprising 5,071.
| Household Size | Family Households | Nonfamily Households |
| 1-Person Households | - | 5,071 (28.0%) |
| 2-Person Households | 5,131 (28.3%) | 1,155 (6.4%) |
| 3-Person Households | 3,211 (17.7%) | 42 (0.2%) |
| 4-Person Households | 2,066 (11.4%) | 0 (0.0%) |
| 5-Person Households | 965 (5.3%) | 0 (0.0%) |
| 6-Person Households | 368 (2.0%) | 0 (0.0%) |
| 7+ Person Households | 104 (0.6%) | 0 (0.0%) |
| Total | 11,845 (65.4%) | 6,268 (34.6%) |
Female Fertility in The Colony
Fertility by Age in The Colony
Average fertility rate in The Colony is 65.0 births per 1,000 women. Women in the age bracket of 20 to 34 years have the highest fertility rate with 87.0 births per 1,000 women. Women in the age bracket of 20 to 34 years acount for 62.1% of all women with births.
| Age Bracket | Women with Births | Births / 1,000 Women |
| 15 to 19 years | 0 (0.0%) | 0.0 |
| 20 to 34 years | 488 (62.1%) | 87.0 |
| 35 to 50 years | 298 (37.9%) | 52.0 |
| Total | 786 (100.0%) | 65.0 |
Fertility by Age by Marriage Status in The Colony
79.1% of women with births (786) in The Colony are married. The highest percentage of unmarried women with births falls into 20 to 34 years age bracket with 25.8% of them unmarried at the time of birth, while the lowest percentage of unmarried women with births belong to 35 to 50 years age bracket with 12.7% of them unmarried.
| Age Bracket | Married | Unmarried |
| 15 to 19 years | 0 (0.0%) | 0 (0.0%) |
| 20 to 34 years | 362 (74.2%) | 126 (25.8%) |
| 35 to 50 years | 260 (87.3%) | 38 (12.8%) |
| Total | 622 (79.1%) | 164 (20.9%) |
Fertility by Education in The Colony
Average fertility rate in The Colony is 65.0 births per 1,000 women. Women with the education attainment of graduate degree have the highest fertility rate of 128.0 births per 1,000 women, while women with the education attainment of college or associate's degree have the lowest fertility at 35.0 births per 1,000 women. Women with the education attainment of graduate degree represent 32.3% of all women with births.
| Educational Attainment | Women with Births | Births / 1,000 Women |
| Less than High School | 66 (8.4%) | 62.0 |
| High School Diploma | 178 (22.7%) | 111.0 |
| College or Associate's Degree | 115 (14.6%) | 35.0 |
| Bachelor's Degree | 173 (22.0%) | 41.0 |
| Graduate Degree | 254 (32.3%) | 128.0 |
| Total | 786 (100.0%) | 65.0 |
Fertility by Education by Marriage Status in The Colony
20.9% of women with births in The Colony are unmarried. Women with the educational attainment of high school diploma are most likely to be married with 100.0% of them married at childbirth, while women with the educational attainment of less than high school are least likely to be married with 78.8% of them unmarried at childbirth.
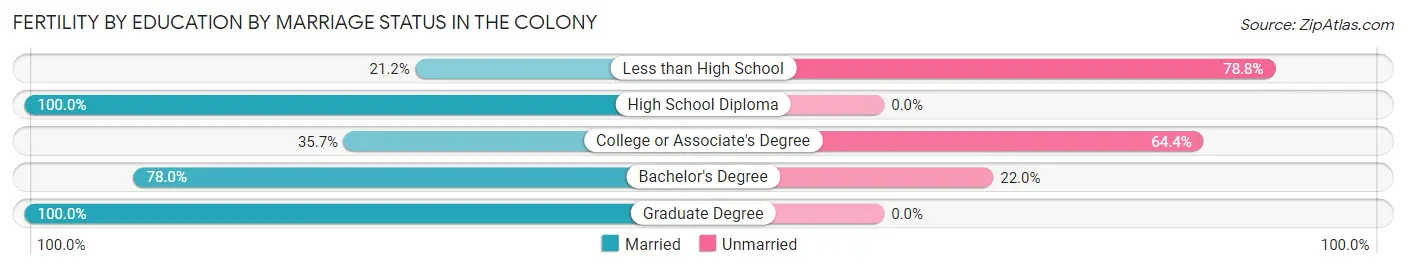
| Educational Attainment | Married | Unmarried |
| Less than High School | 14 (21.2%) | 52 (78.8%) |
| High School Diploma | 178 (100.0%) | 0 (0.0%) |
| College or Associate's Degree | 41 (35.6%) | 74 (64.3%) |
| Bachelor's Degree | 135 (78.0%) | 38 (22.0%) |
| Graduate Degree | 254 (100.0%) | 0 (0.0%) |
| Total | 622 (79.1%) | 164 (20.9%) |
Employment Characteristics in The Colony
Employment by Class of Employer in The Colony
Among the 27,120 employed individuals in The Colony, private company employees (20,922 | 77.1%), local government employees (1,746 | 6.4%), and not-for-profit organizations (1,372 | 5.1%) make up the most common classes of employment.
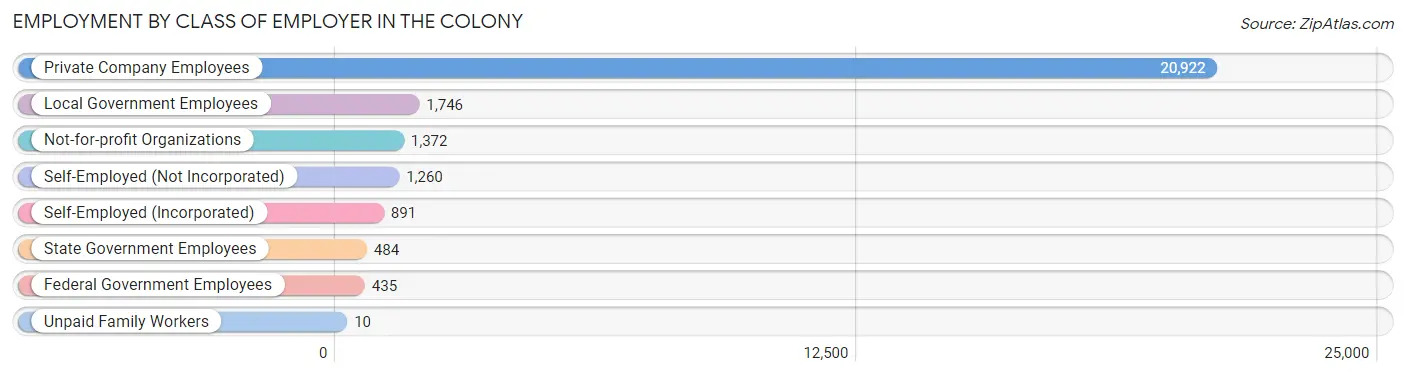
| Employer Class | # Employees | % Employees |
| Private Company Employees | 20,922 | 77.1% |
| Self-Employed (Incorporated) | 891 | 3.3% |
| Self-Employed (Not Incorporated) | 1,260 | 4.6% |
| Not-for-profit Organizations | 1,372 | 5.1% |
| Local Government Employees | 1,746 | 6.4% |
| State Government Employees | 484 | 1.8% |
| Federal Government Employees | 435 | 1.6% |
| Unpaid Family Workers | 10 | 0.0% |
| Total | 27,120 | 100.0% |
Employment Status by Age in The Colony
According to the labor force statistics for The Colony, out of the total population over 16 years of age (36,530), 78.9% or 28,822 individuals are in the labor force, with 4.1% or 1,182 of them unemployed. The age group with the highest labor force participation rate is 25 to 29 years, with 93.8% or 4,524 individuals in the labor force. Within the labor force, the 16 to 19 years age range has the highest percentage of unemployed individuals, with 17.8% or 122 of them being unemployed.
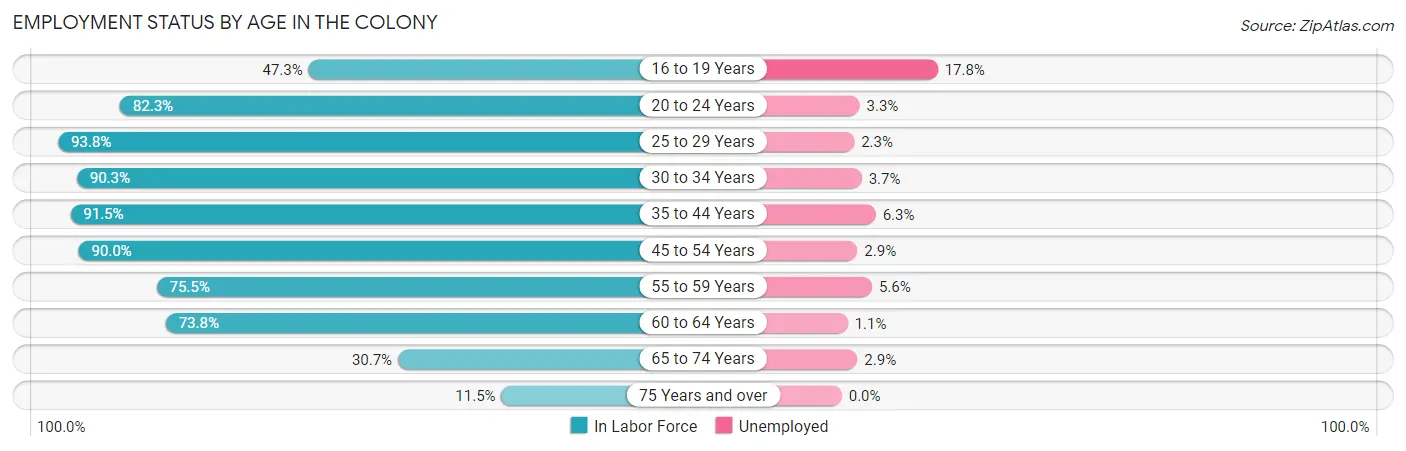
| Age Bracket | In Labor Force | Unemployed |
| 16 to 19 Years | 685 (47.3%) | 122 (17.8%) |
| 20 to 24 Years | 1,723 (82.3%) | 57 (3.3%) |
| 25 to 29 Years | 4,524 (93.8%) | 104 (2.3%) |
| 30 to 34 Years | 3,603 (90.3%) | 133 (3.7%) |
| 35 to 44 Years | 6,437 (91.5%) | 406 (6.3%) |
| 45 to 54 Years | 6,501 (90.0%) | 189 (2.9%) |
| 55 to 59 Years | 2,544 (75.5%) | 142 (5.6%) |
| 60 to 64 Years | 1,867 (73.8%) | 21 (1.1%) |
| 65 to 74 Years | 771 (30.7%) | 22 (2.9%) |
| 75 Years and over | 173 (11.5%) | 0 (0.0%) |
| Total | 28,822 (78.9%) | 1,182 (4.1%) |
Employment Status by Educational Attainment in The Colony
According to labor force statistics for The Colony, 87.9% of individuals (25,466) out of the total population between 25 and 64 years of age (28,971) are in the labor force, with 3.9% or 993 of them being unemployed. The group with the highest labor force participation rate are those with the educational attainment of bachelor's degree or higher, with 90.5% or 12,689 individuals in the labor force. Within the labor force, individuals with college / associate degree education have the highest percentage of unemployment, with 7.0% or 562 of them being unemployed.
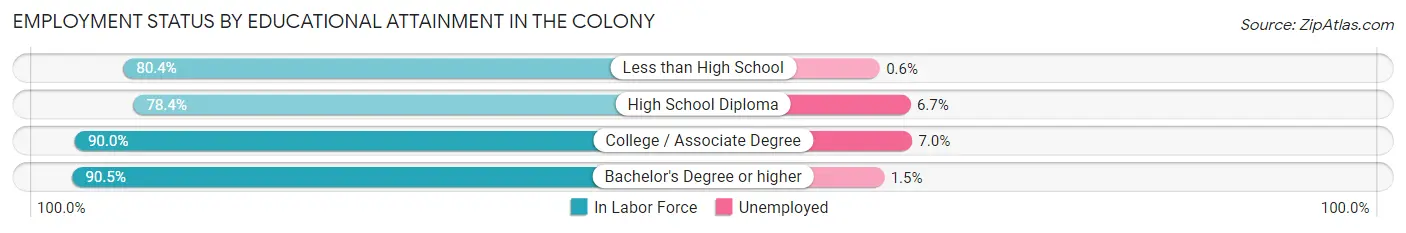
| Educational Attainment | In Labor Force | Unemployed |
| Less than High School | 1,212 (80.4%) | 9 (0.6%) |
| High School Diploma | 3,549 (78.4%) | 303 (6.7%) |
| College / Associate Degree | 8,024 (90.0%) | 624 (7.0%) |
| Bachelor's Degree or higher | 12,689 (90.5%) | 210 (1.5%) |
| Total | 25,466 (87.9%) | 1,130 (3.9%) |
Employment Occupations by Sex in The Colony
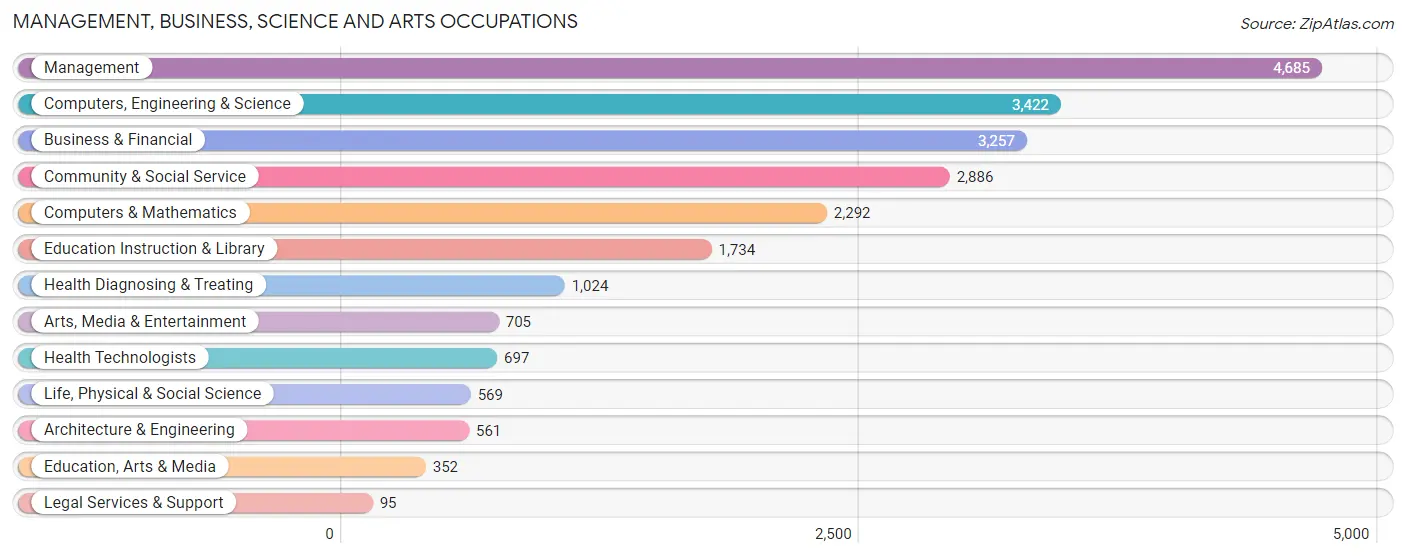
Management, Business, Science and Arts Occupations
The most common Management, Business, Science and Arts occupations in The Colony are Management (4,685 | 17.0%), Computers, Engineering & Science (3,422 | 12.4%), Business & Financial (3,257 | 11.8%), Community & Social Service (2,886 | 10.4%), and Computers & Mathematics (2,292 | 8.3%).
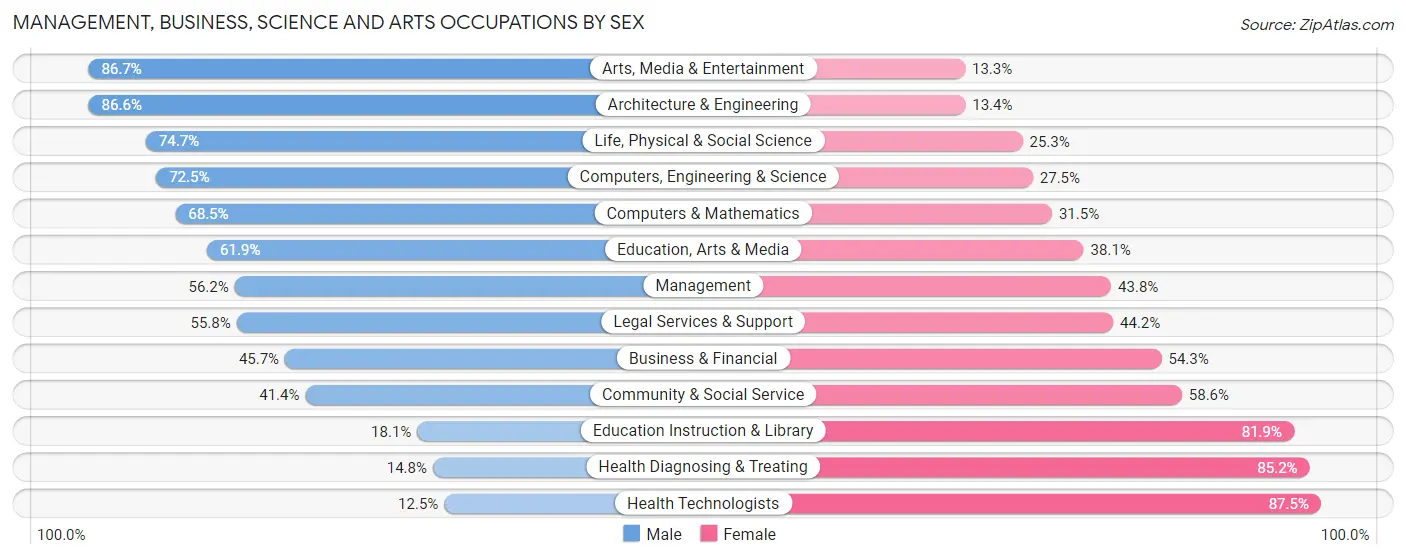
Management, Business, Science and Arts Occupations by Sex
Within the Management, Business, Science and Arts occupations in The Colony, the most male-oriented occupations are Arts, Media & Entertainment (86.7%), Architecture & Engineering (86.6%), and Life, Physical & Social Science (74.7%), while the most female-oriented occupations are Health Technologists (87.5%), Health Diagnosing & Treating (85.2%), and Education Instruction & Library (81.9%).
| Occupation | Male | Female |
| Management | 2,633 (56.2%) | 2,052 (43.8%) |
| Business & Financial | 1,488 (45.7%) | 1,769 (54.3%) |
| Computers, Engineering & Science | 2,482 (72.5%) | 940 (27.5%) |
| Computers & Mathematics | 1,571 (68.5%) | 721 (31.5%) |
| Architecture & Engineering | 486 (86.6%) | 75 (13.4%) |
| Life, Physical & Social Science | 425 (74.7%) | 144 (25.3%) |
| Community & Social Service | 1,196 (41.4%) | 1,690 (58.6%) |
| Education, Arts & Media | 218 (61.9%) | 134 (38.1%) |
| Legal Services & Support | 53 (55.8%) | 42 (44.2%) |
| Education Instruction & Library | 314 (18.1%) | 1,420 (81.9%) |
| Arts, Media & Entertainment | 611 (86.7%) | 94 (13.3%) |
| Health Diagnosing & Treating | 152 (14.8%) | 872 (85.2%) |
| Health Technologists | 87 (12.5%) | 610 (87.5%) |
| Total (Category) | 7,951 (52.1%) | 7,323 (47.9%) |
| Total (Overall) | 14,955 (54.1%) | 12,677 (45.9%) |
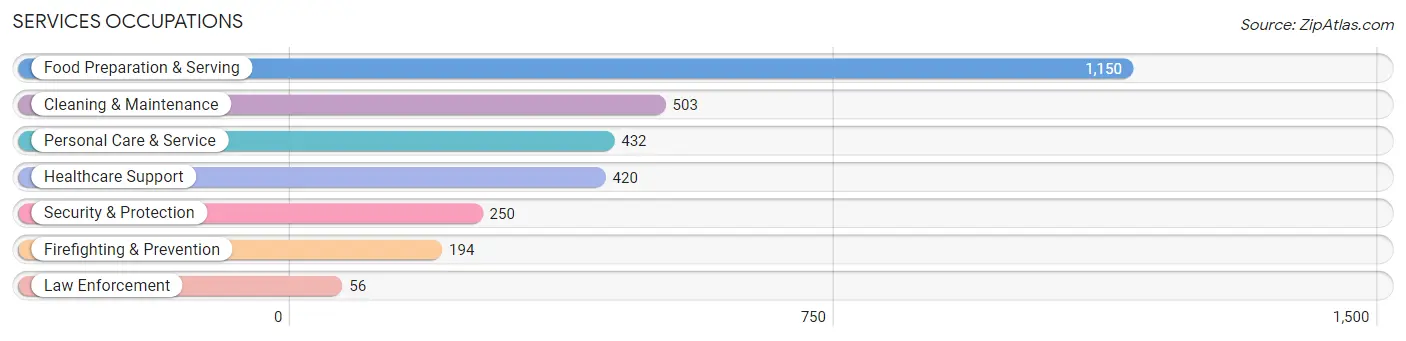
Services Occupations
The most common Services occupations in The Colony are Food Preparation & Serving (1,150 | 4.2%), Cleaning & Maintenance (503 | 1.8%), Personal Care & Service (432 | 1.6%), Healthcare Support (420 | 1.5%), and Security & Protection (250 | 0.9%).
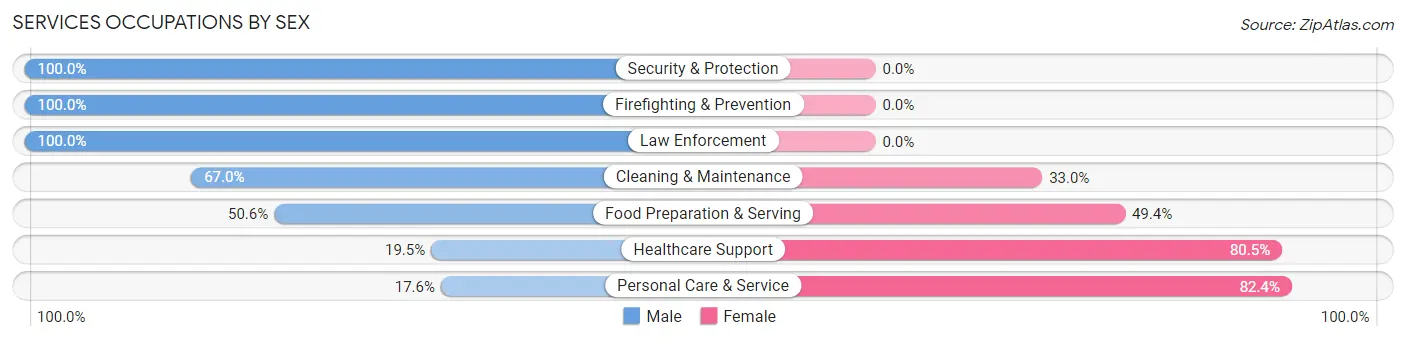
Services Occupations by Sex
Within the Services occupations in The Colony, the most male-oriented occupations are Security & Protection (100.0%), Firefighting & Prevention (100.0%), and Law Enforcement (100.0%), while the most female-oriented occupations are Personal Care & Service (82.4%), Healthcare Support (80.5%), and Food Preparation & Serving (49.4%).
| Occupation | Male | Female |
| Healthcare Support | 82 (19.5%) | 338 (80.5%) |
| Security & Protection | 250 (100.0%) | 0 (0.0%) |
| Firefighting & Prevention | 194 (100.0%) | 0 (0.0%) |
| Law Enforcement | 56 (100.0%) | 0 (0.0%) |
| Food Preparation & Serving | 582 (50.6%) | 568 (49.4%) |
| Cleaning & Maintenance | 337 (67.0%) | 166 (33.0%) |
| Personal Care & Service | 76 (17.6%) | 356 (82.4%) |
| Total (Category) | 1,327 (48.2%) | 1,428 (51.8%) |
| Total (Overall) | 14,955 (54.1%) | 12,677 (45.9%) |
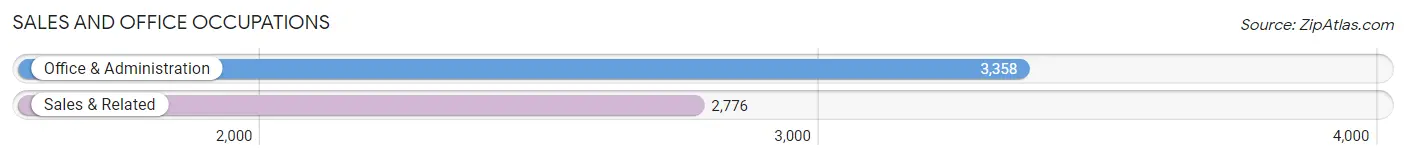
Sales and Office Occupations
The most common Sales and Office occupations in The Colony are Office & Administration (3,358 | 12.1%), and Sales & Related (2,776 | 10.1%).
Sales and Office Occupations by Sex
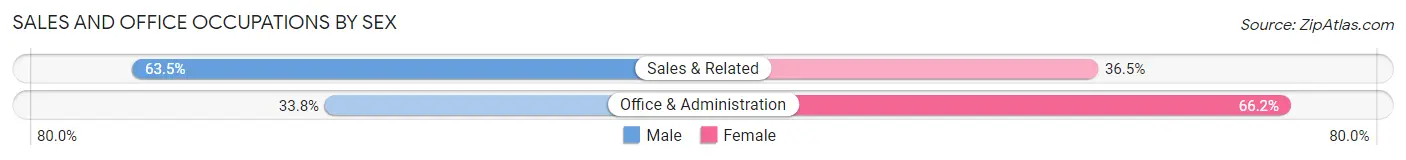
| Occupation | Male | Female |
| Sales & Related | 1,762 (63.5%) | 1,014 (36.5%) |
| Office & Administration | 1,135 (33.8%) | 2,223 (66.2%) |
| Total (Category) | 2,897 (47.2%) | 3,237 (52.8%) |
| Total (Overall) | 14,955 (54.1%) | 12,677 (45.9%) |
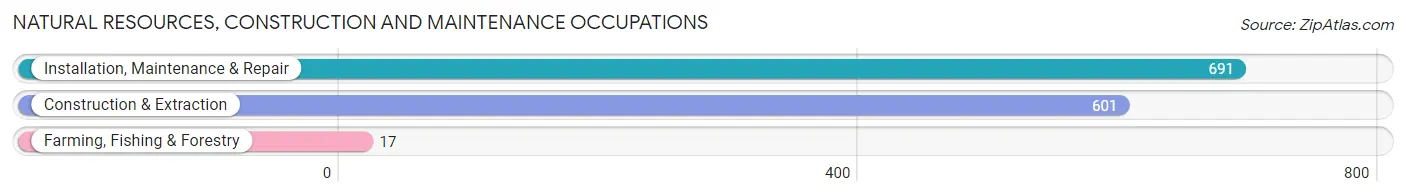
Natural Resources, Construction and Maintenance Occupations
The most common Natural Resources, Construction and Maintenance occupations in The Colony are Installation, Maintenance & Repair (691 | 2.5%), Construction & Extraction (601 | 2.2%), and Farming, Fishing & Forestry (17 | 0.1%).
Natural Resources, Construction and Maintenance Occupations by Sex
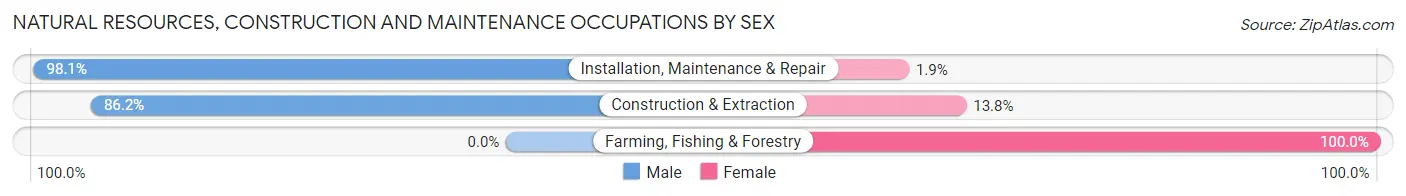
| Occupation | Male | Female |
| Farming, Fishing & Forestry | 0 (0.0%) | 17 (100.0%) |
| Construction & Extraction | 518 (86.2%) | 83 (13.8%) |
| Installation, Maintenance & Repair | 678 (98.1%) | 13 (1.9%) |
| Total (Category) | 1,196 (91.4%) | 113 (8.6%) |
| Total (Overall) | 14,955 (54.1%) | 12,677 (45.9%) |
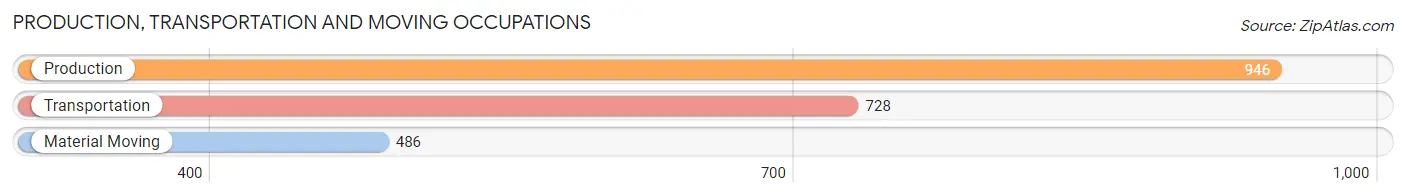
Production, Transportation and Moving Occupations
The most common Production, Transportation and Moving occupations in The Colony are Production (946 | 3.4%), Transportation (728 | 2.6%), and Material Moving (486 | 1.8%).
Production, Transportation and Moving Occupations by Sex
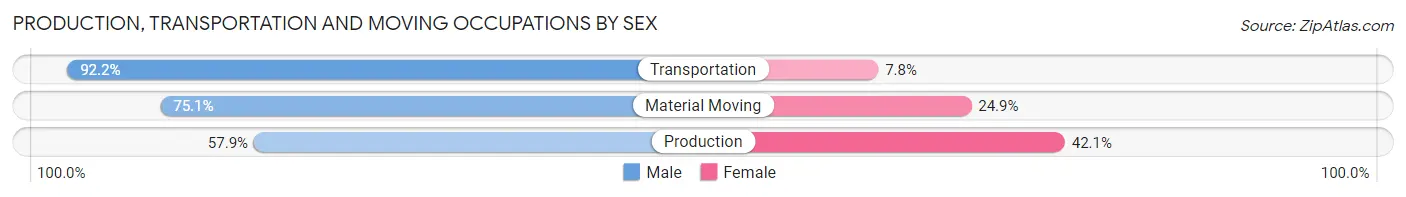
| Occupation | Male | Female |
| Production | 548 (57.9%) | 398 (42.1%) |
| Transportation | 671 (92.2%) | 57 (7.8%) |
| Material Moving | 365 (75.1%) | 121 (24.9%) |
| Total (Category) | 1,584 (73.3%) | 576 (26.7%) |
| Total (Overall) | 14,955 (54.1%) | 12,677 (45.9%) |
Employment Industries by Sex in The Colony
Employment Industries in The Colony
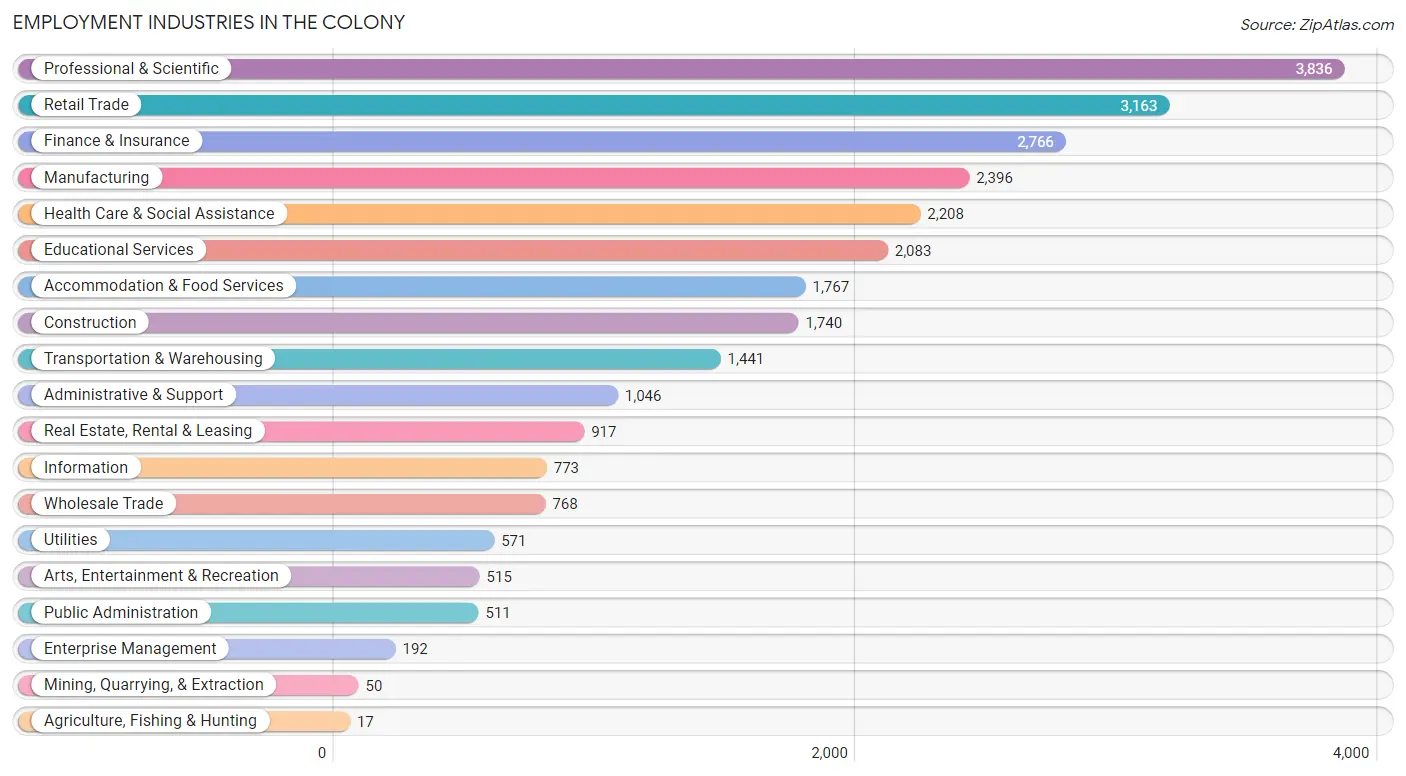
The major employment industries in The Colony include Professional & Scientific (3,836 | 13.9%), Retail Trade (3,163 | 11.5%), Finance & Insurance (2,766 | 10.0%), Manufacturing (2,396 | 8.7%), and Health Care & Social Assistance (2,208 | 8.0%).
Employment Industries by Sex in The Colony
The The Colony industries that see more men than women are Utilities (80.9%), Arts, Entertainment & Recreation (76.1%), and Wholesale Trade (72.1%), whereas the industries that tend to have a higher number of women are Agriculture, Fishing & Hunting (100.0%), Enterprise Management (87.0%), and Health Care & Social Assistance (78.6%).
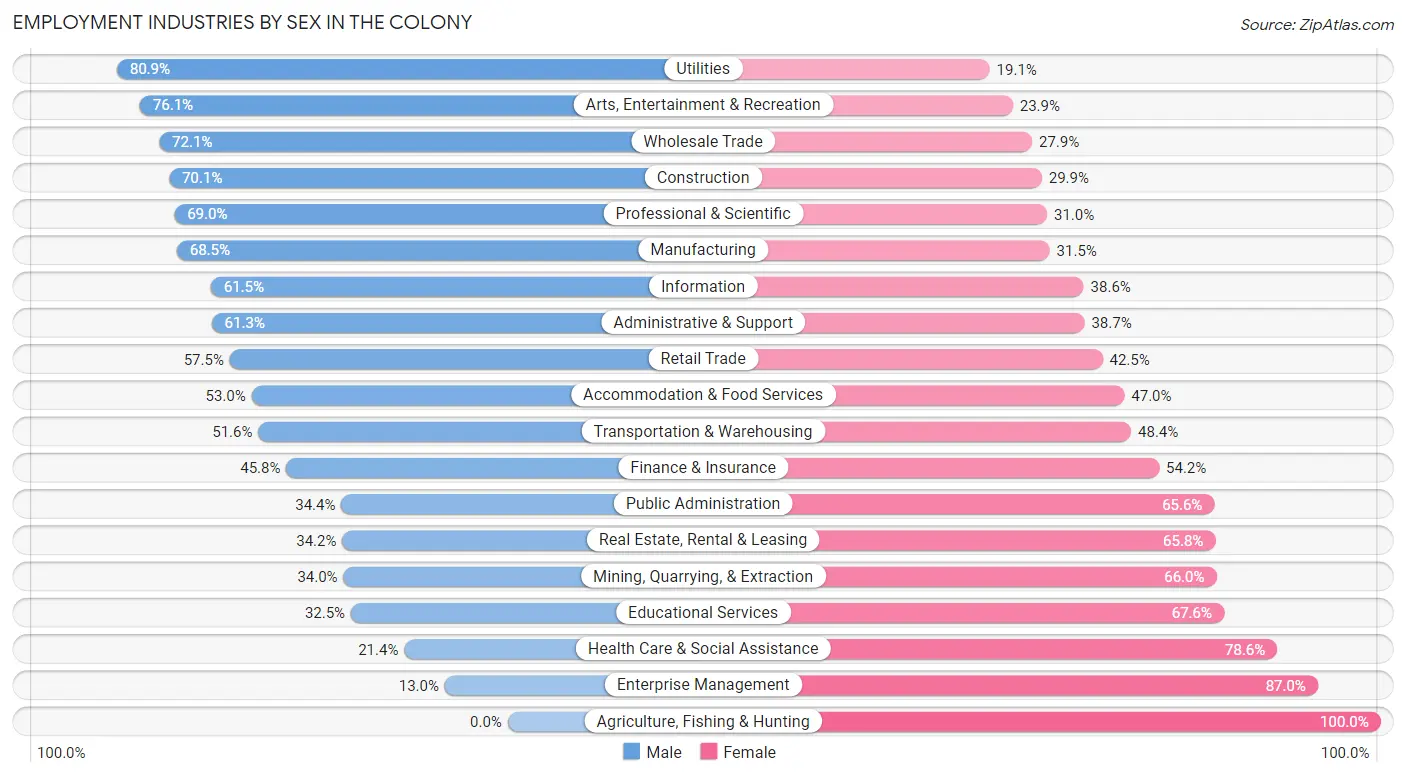
| Industry | Male | Female |
| Agriculture, Fishing & Hunting | 0 (0.0%) | 17 (100.0%) |
| Mining, Quarrying, & Extraction | 17 (34.0%) | 33 (66.0%) |
| Construction | 1,220 (70.1%) | 520 (29.9%) |
| Manufacturing | 1,641 (68.5%) | 755 (31.5%) |
| Wholesale Trade | 554 (72.1%) | 214 (27.9%) |
| Retail Trade | 1,820 (57.5%) | 1,343 (42.5%) |
| Transportation & Warehousing | 744 (51.6%) | 697 (48.4%) |
| Utilities | 462 (80.9%) | 109 (19.1%) |
| Information | 475 (61.5%) | 298 (38.6%) |
| Finance & Insurance | 1,268 (45.8%) | 1,498 (54.2%) |
| Real Estate, Rental & Leasing | 314 (34.2%) | 603 (65.8%) |
| Professional & Scientific | 2,648 (69.0%) | 1,188 (31.0%) |
| Enterprise Management | 25 (13.0%) | 167 (87.0%) |
| Administrative & Support | 641 (61.3%) | 405 (38.7%) |
| Educational Services | 676 (32.5%) | 1,407 (67.5%) |
| Health Care & Social Assistance | 473 (21.4%) | 1,735 (78.6%) |
| Arts, Entertainment & Recreation | 392 (76.1%) | 123 (23.9%) |
| Accommodation & Food Services | 937 (53.0%) | 830 (47.0%) |
| Public Administration | 176 (34.4%) | 335 (65.6%) |
| Total | 14,955 (54.1%) | 12,677 (45.9%) |
Education in The Colony
School Enrollment in The Colony
The most common levels of schooling among the 8,298 students in The Colony are middle school (1,848 | 22.3%), college / undergraduate (1,796 | 21.6%), and elementary school (1,681 | 20.3%).
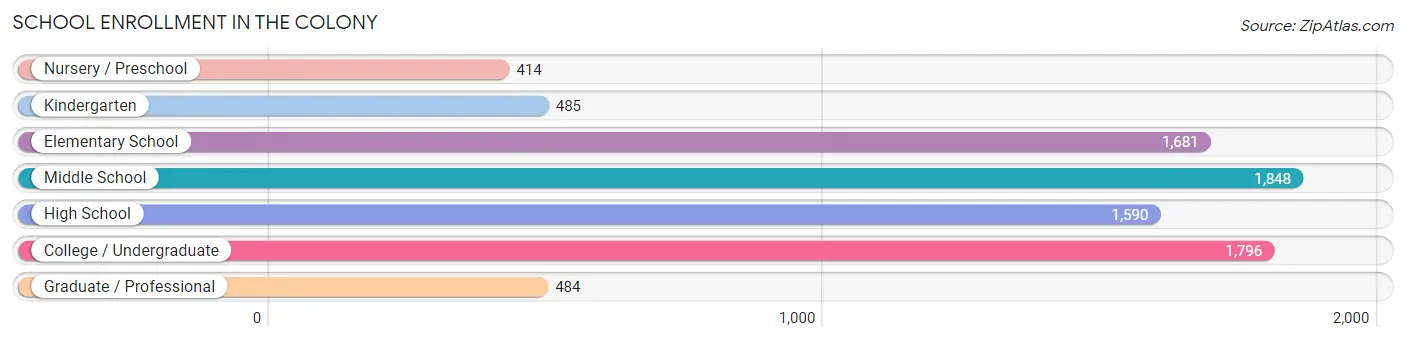
| School Level | # Students | % Students |
| Nursery / Preschool | 414 | 5.0% |
| Kindergarten | 485 | 5.8% |
| Elementary School | 1,681 | 20.3% |
| Middle School | 1,848 | 22.3% |
| High School | 1,590 | 19.2% |
| College / Undergraduate | 1,796 | 21.6% |
| Graduate / Professional | 484 | 5.8% |
| Total | 8,298 | 100.0% |
School Enrollment by Age by Funding Source in The Colony
Out of a total of 8,298 students who are enrolled in schools in The Colony, 846 (10.2%) attend a private institution, while the remaining 7,452 (89.8%) are enrolled in public schools. The age group of 3 to 4 year olds has the highest likelihood of being enrolled in private schools, with 163 (36.0% in the age bracket) enrolled. Conversely, the age group of 15 to 17 year olds has the lowest likelihood of being enrolled in a private school, with 1,097 (95.9% in the age bracket) attending a public institution.
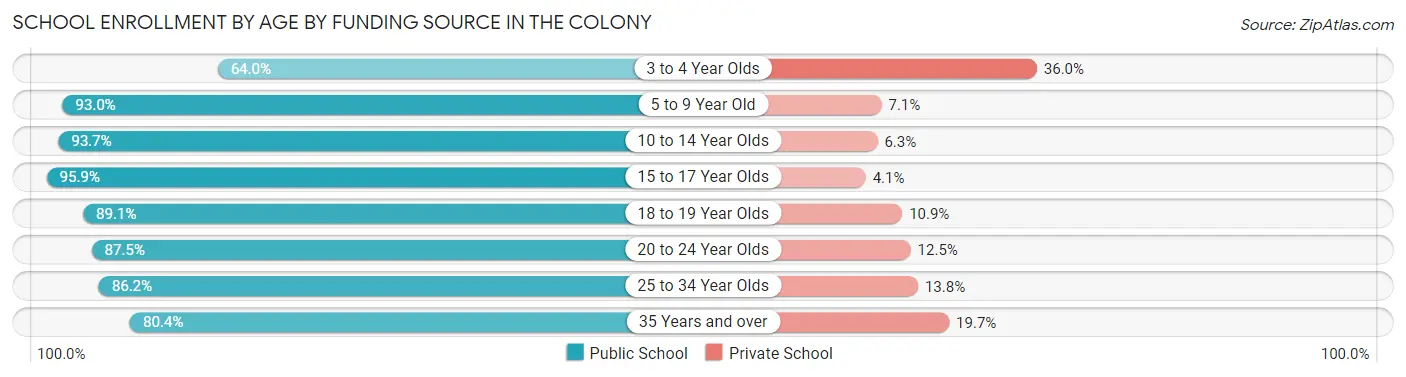
| Age Bracket | Public School | Private School |
| 3 to 4 Year Olds | 290 (64.0%) | 163 (36.0%) |
| 5 to 9 Year Old | 1,793 (92.9%) | 136 (7.0%) |
| 10 to 14 Year Olds | 2,129 (93.7%) | 143 (6.3%) |
| 15 to 17 Year Olds | 1,097 (95.9%) | 47 (4.1%) |
| 18 to 19 Year Olds | 466 (89.1%) | 57 (10.9%) |
| 20 to 24 Year Olds | 645 (87.5%) | 92 (12.5%) |
| 25 to 34 Year Olds | 529 (86.2%) | 85 (13.8%) |
| 35 Years and over | 503 (80.3%) | 123 (19.7%) |
| Total | 7,452 (89.8%) | 846 (10.2%) |
Educational Attainment by Field of Study in The Colony
Business (4,533 | 28.1%), engineering (1,362 | 8.5%), education (1,235 | 7.7%), arts & humanities (1,178 | 7.3%), and science & technology (1,026 | 6.4%) are the most common fields of study among 16,120 individuals in The Colony who have obtained a bachelor's degree or higher.
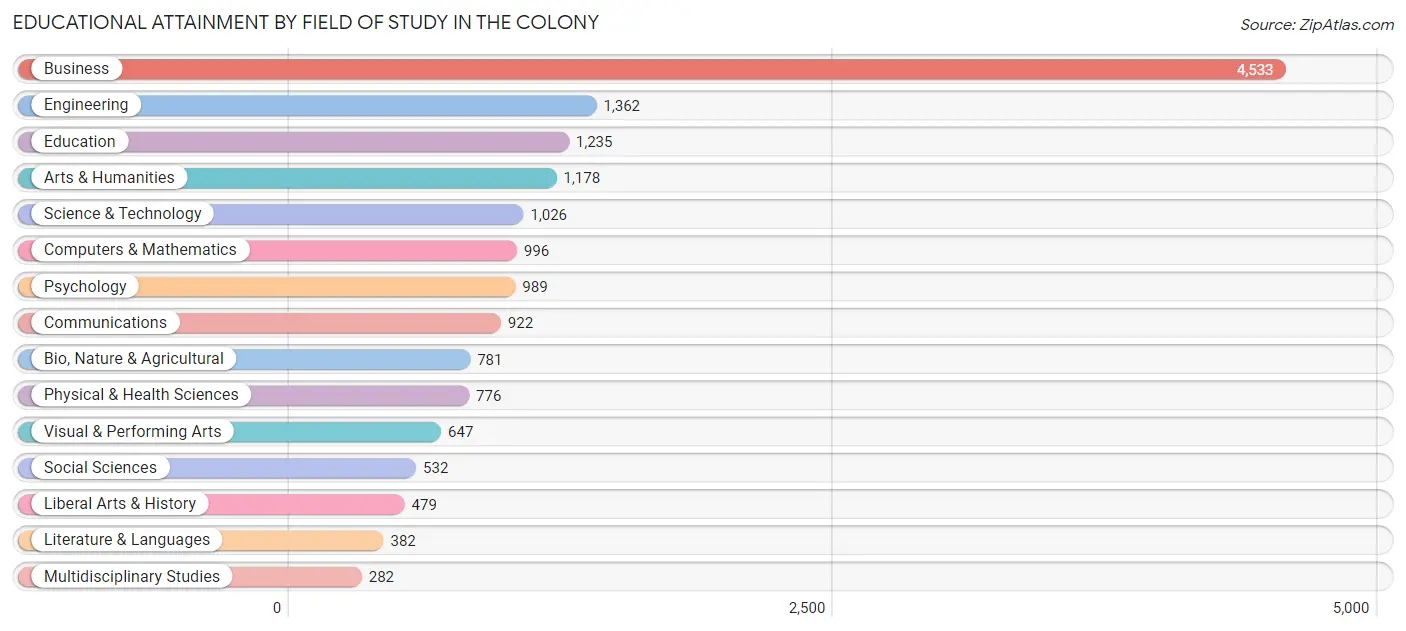
| Field of Study | # Graduates | % Graduates |
| Computers & Mathematics | 996 | 6.2% |
| Bio, Nature & Agricultural | 781 | 4.8% |
| Physical & Health Sciences | 776 | 4.8% |
| Psychology | 989 | 6.1% |
| Social Sciences | 532 | 3.3% |
| Engineering | 1,362 | 8.5% |
| Multidisciplinary Studies | 282 | 1.8% |
| Science & Technology | 1,026 | 6.4% |
| Business | 4,533 | 28.1% |
| Education | 1,235 | 7.7% |
| Literature & Languages | 382 | 2.4% |
| Liberal Arts & History | 479 | 3.0% |
| Visual & Performing Arts | 647 | 4.0% |
| Communications | 922 | 5.7% |
| Arts & Humanities | 1,178 | 7.3% |
| Total | 16,120 | 100.0% |
Transportation & Commute in The Colony
Vehicle Availability by Sex in The Colony
The most prevalent vehicle ownership categories in The Colony are males with 2 vehicles (7,188, accounting for 48.8%) and females with 2 vehicles (5,872, making up 58.1%).
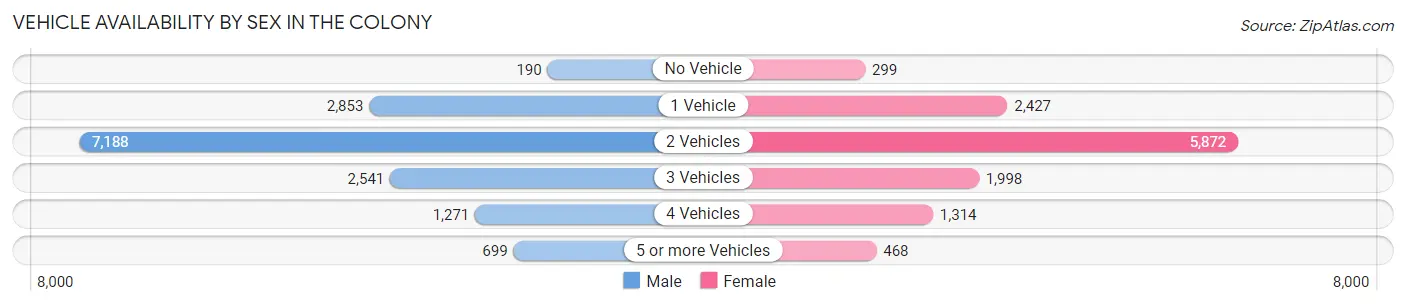
| Vehicles Available | Male | Female |
| No Vehicle | 190 (1.3%) | 299 (2.4%) |
| 1 Vehicle | 2,853 (19.4%) | 2,427 (19.6%) |
| 2 Vehicles | 7,188 (48.8%) | 5,872 (47.4%) |
| 3 Vehicles | 2,541 (17.2%) | 1,998 (16.1%) |
| 4 Vehicles | 1,271 (8.6%) | 1,314 (10.6%) |
| 5 or more Vehicles | 699 (4.7%) | 468 (3.8%) |
| Total | 14,742 (100.0%) | 12,378 (100.0%) |
Commute Time in The Colony
The most frequently occuring commute durations in The Colony are 30 to 34 minutes (3,731 commuters, 17.1%), 20 to 24 minutes (3,649 commuters, 16.7%), and 15 to 19 minutes (3,026 commuters, 13.8%).
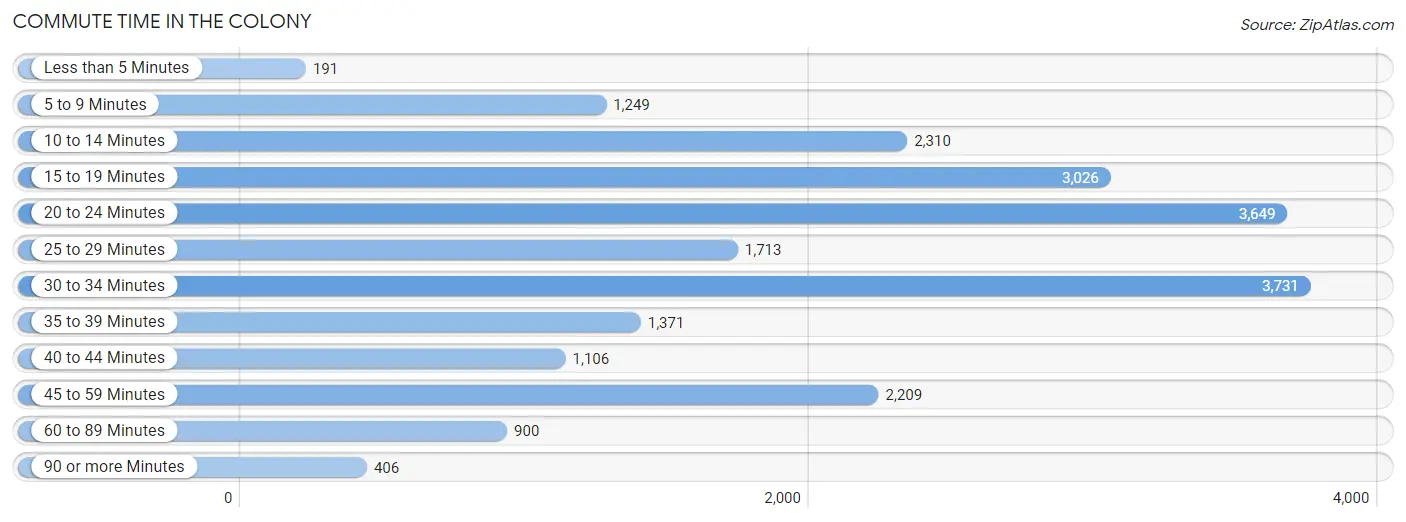
| Commute Time | # Commuters | % Commuters |
| Less than 5 Minutes | 191 | 0.9% |
| 5 to 9 Minutes | 1,249 | 5.7% |
| 10 to 14 Minutes | 2,310 | 10.6% |
| 15 to 19 Minutes | 3,026 | 13.8% |
| 20 to 24 Minutes | 3,649 | 16.7% |
| 25 to 29 Minutes | 1,713 | 7.8% |
| 30 to 34 Minutes | 3,731 | 17.1% |
| 35 to 39 Minutes | 1,371 | 6.3% |
| 40 to 44 Minutes | 1,106 | 5.1% |
| 45 to 59 Minutes | 2,209 | 10.1% |
| 60 to 89 Minutes | 900 | 4.1% |
| 90 or more Minutes | 406 | 1.9% |
Commute Time by Sex in The Colony
The most common commute times in The Colony are 30 to 34 minutes (2,217 commuters, 18.7%) for males and 20 to 24 minutes (1,877 commuters, 18.7%) for females.
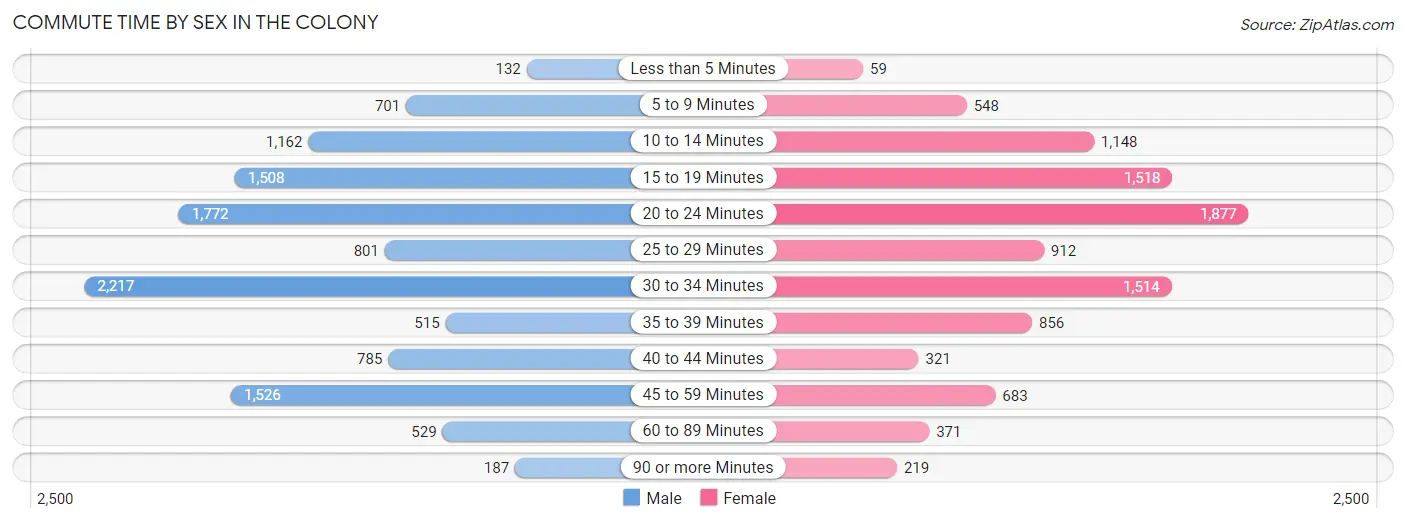
| Commute Time | Male | Female |
| Less than 5 Minutes | 132 (1.1%) | 59 (0.6%) |
| 5 to 9 Minutes | 701 (5.9%) | 548 (5.5%) |
| 10 to 14 Minutes | 1,162 (9.8%) | 1,148 (11.5%) |
| 15 to 19 Minutes | 1,508 (12.7%) | 1,518 (15.1%) |
| 20 to 24 Minutes | 1,772 (15.0%) | 1,877 (18.7%) |
| 25 to 29 Minutes | 801 (6.8%) | 912 (9.1%) |
| 30 to 34 Minutes | 2,217 (18.7%) | 1,514 (15.1%) |
| 35 to 39 Minutes | 515 (4.3%) | 856 (8.5%) |
| 40 to 44 Minutes | 785 (6.6%) | 321 (3.2%) |
| 45 to 59 Minutes | 1,526 (12.9%) | 683 (6.8%) |
| 60 to 89 Minutes | 529 (4.5%) | 371 (3.7%) |
| 90 or more Minutes | 187 (1.6%) | 219 (2.2%) |
Time of Departure to Work by Sex in The Colony
The most frequent times of departure to work in The Colony are 7:30 AM to 7:59 AM (1,774, 15.0%) for males and 8:00 AM to 8:29 AM (1,462, 14.6%) for females.
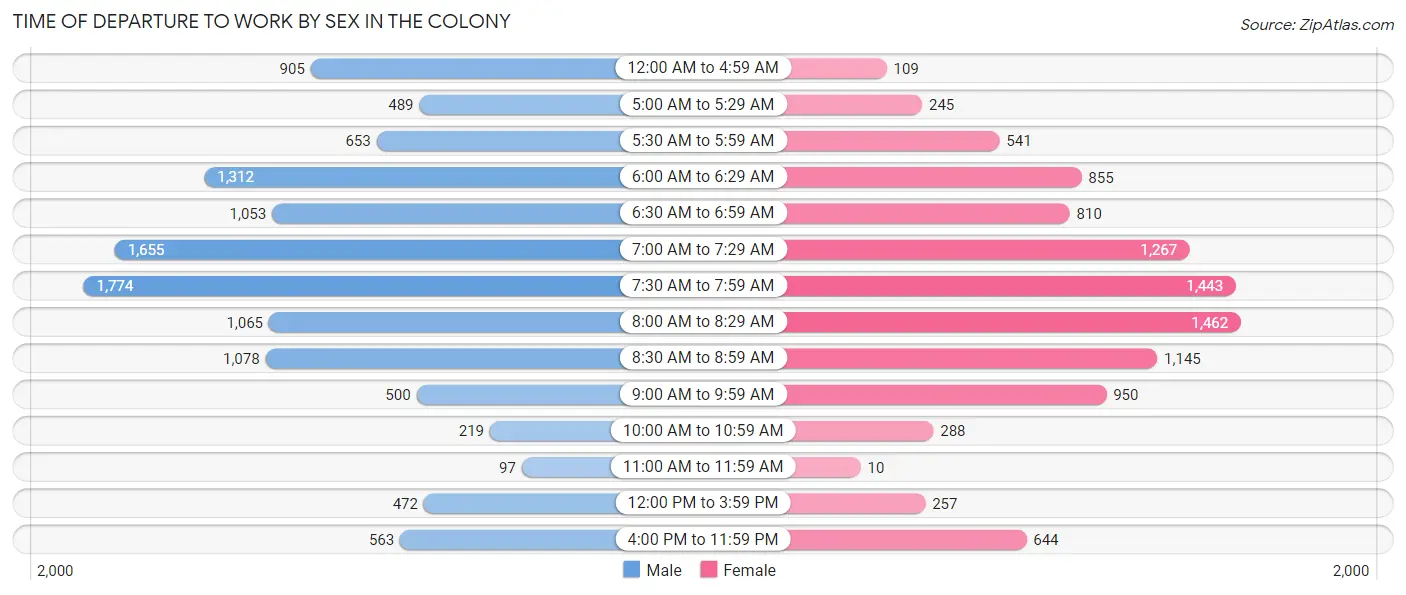
| Time of Departure | Male | Female |
| 12:00 AM to 4:59 AM | 905 (7.6%) | 109 (1.1%) |
| 5:00 AM to 5:29 AM | 489 (4.1%) | 245 (2.4%) |
| 5:30 AM to 5:59 AM | 653 (5.5%) | 541 (5.4%) |
| 6:00 AM to 6:29 AM | 1,312 (11.1%) | 855 (8.5%) |
| 6:30 AM to 6:59 AM | 1,053 (8.9%) | 810 (8.1%) |
| 7:00 AM to 7:29 AM | 1,655 (14.0%) | 1,267 (12.6%) |
| 7:30 AM to 7:59 AM | 1,774 (15.0%) | 1,443 (14.4%) |
| 8:00 AM to 8:29 AM | 1,065 (9.0%) | 1,462 (14.6%) |
| 8:30 AM to 8:59 AM | 1,078 (9.1%) | 1,145 (11.4%) |
| 9:00 AM to 9:59 AM | 500 (4.2%) | 950 (9.5%) |
| 10:00 AM to 10:59 AM | 219 (1.8%) | 288 (2.9%) |
| 11:00 AM to 11:59 AM | 97 (0.8%) | 10 (0.1%) |
| 12:00 PM to 3:59 PM | 472 (4.0%) | 257 (2.6%) |
| 4:00 PM to 11:59 PM | 563 (4.8%) | 644 (6.4%) |
| Total | 11,835 (100.0%) | 10,026 (100.0%) |
Housing Occupancy in The Colony
Occupancy by Ownership in The Colony
Of the total 18,113 dwellings in The Colony, owner-occupied units account for 10,950 (60.5%), while renter-occupied units make up 7,163 (39.6%).
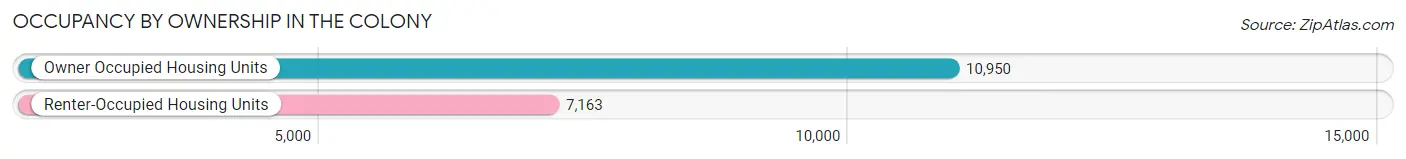
| Occupancy | # Housing Units | % Housing Units |
| Owner Occupied Housing Units | 10,950 | 60.5% |
| Renter-Occupied Housing Units | 7,163 | 39.6% |
| Total Occupied Housing Units | 18,113 | 100.0% |
Occupancy by Household Size in The Colony
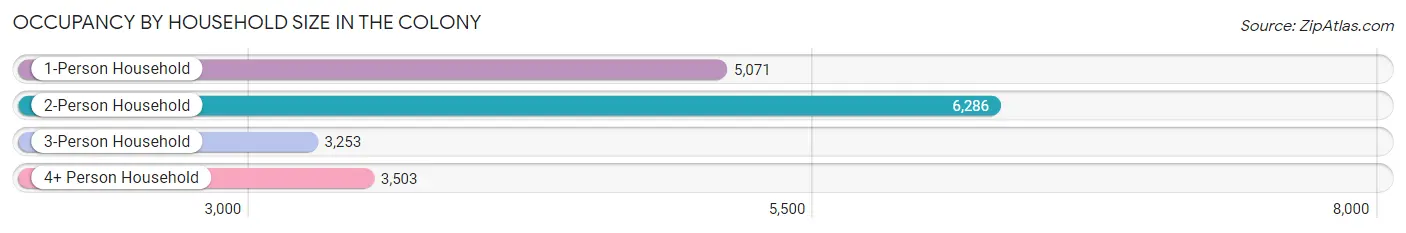
| Household Size | # Housing Units | % Housing Units |
| 1-Person Household | 5,071 | 28.0% |
| 2-Person Household | 6,286 | 34.7% |
| 3-Person Household | 3,253 | 18.0% |
| 4+ Person Household | 3,503 | 19.3% |
| Total Housing Units | 18,113 | 100.0% |
Occupancy by Ownership by Household Size in The Colony
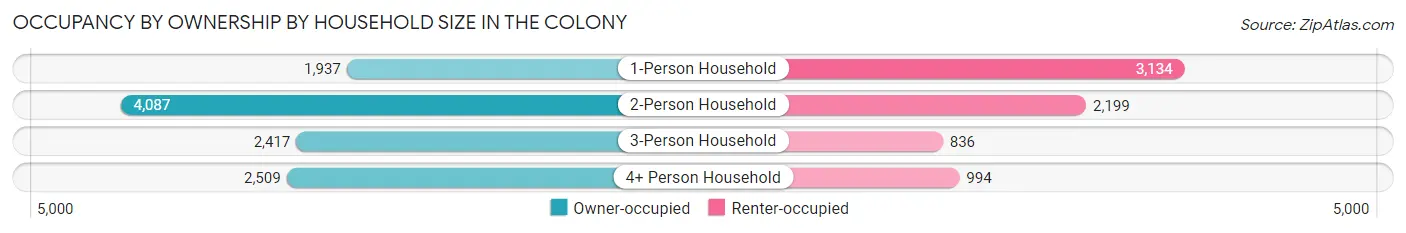
| Household Size | Owner-occupied | Renter-occupied |
| 1-Person Household | 1,937 (38.2%) | 3,134 (61.8%) |
| 2-Person Household | 4,087 (65.0%) | 2,199 (35.0%) |
| 3-Person Household | 2,417 (74.3%) | 836 (25.7%) |
| 4+ Person Household | 2,509 (71.6%) | 994 (28.4%) |
| Total Housing Units | 10,950 (60.5%) | 7,163 (39.6%) |
Occupancy by Educational Attainment in The Colony
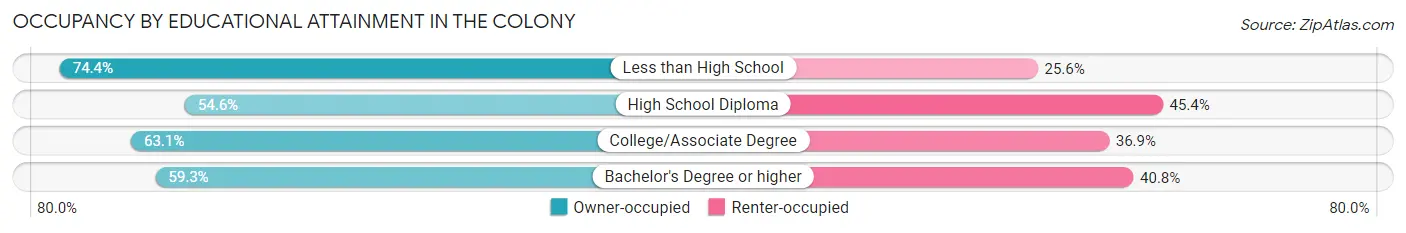
| Household Size | Owner-occupied | Renter-occupied |
| Less than High School | 602 (74.4%) | 207 (25.6%) |
| High School Diploma | 1,384 (54.6%) | 1,152 (45.4%) |
| College/Associate Degree | 3,495 (63.1%) | 2,043 (36.9%) |
| Bachelor's Degree or higher | 5,469 (59.3%) | 3,761 (40.7%) |
Occupancy by Age of Householder in The Colony
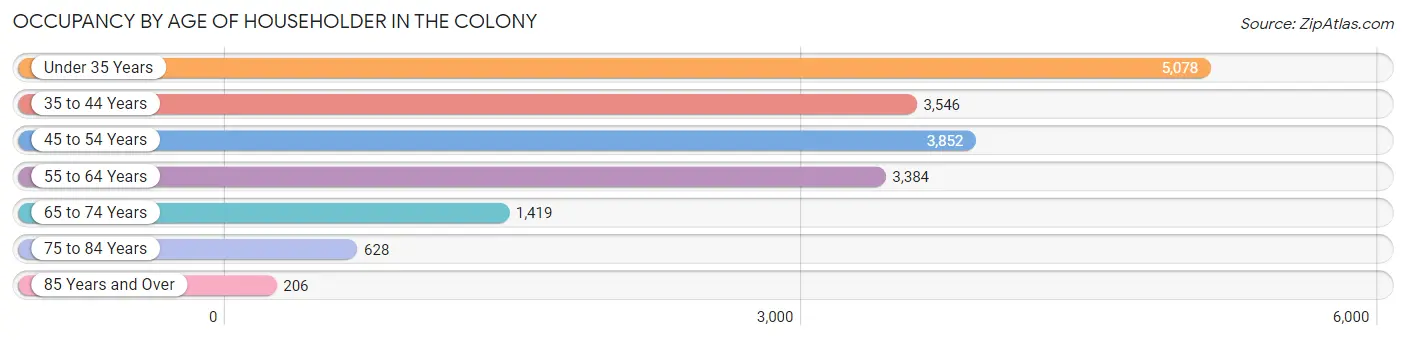
| Age Bracket | # Households | % Households |
| Under 35 Years | 5,078 | 28.0% |
| 35 to 44 Years | 3,546 | 19.6% |
| 45 to 54 Years | 3,852 | 21.3% |
| 55 to 64 Years | 3,384 | 18.7% |
| 65 to 74 Years | 1,419 | 7.8% |
| 75 to 84 Years | 628 | 3.5% |
| 85 Years and Over | 206 | 1.1% |
| Total | 18,113 | 100.0% |
Housing Finances in The Colony
Median Income by Occupancy in The Colony
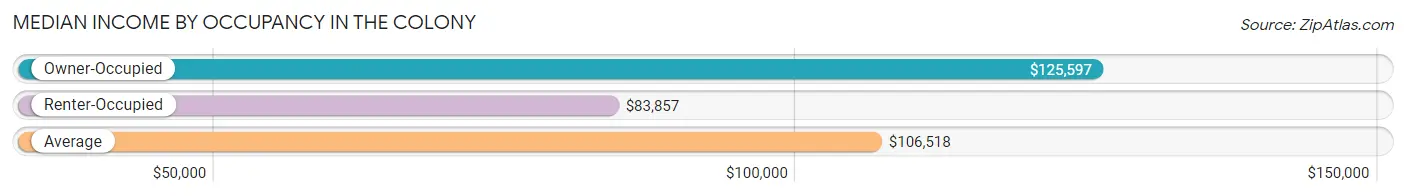
| Occupancy Type | # Households | Median Income |
| Owner-Occupied | 10,950 (60.5%) | $125,597 |
| Renter-Occupied | 7,163 (39.6%) | $83,857 |
| Average | 18,113 (100.0%) | $106,518 |
Occupancy by Householder Income Bracket in The Colony
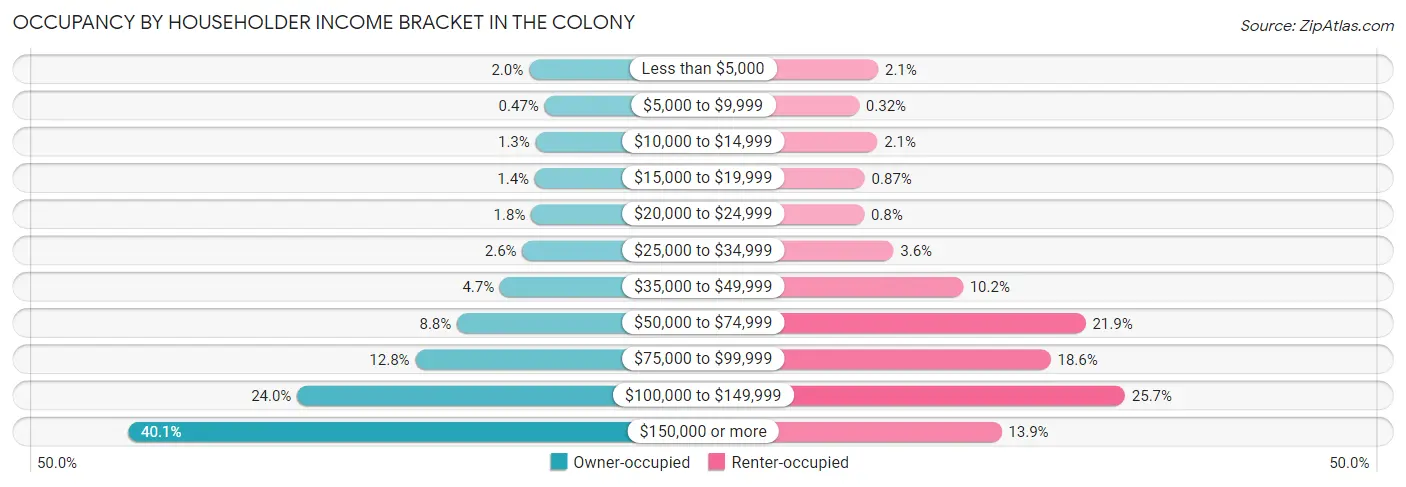
| Income Bracket | Owner-occupied | Renter-occupied |
| Less than $5,000 | 215 (2.0%) | 153 (2.1%) |
| $5,000 to $9,999 | 52 (0.5%) | 23 (0.3%) |
| $10,000 to $14,999 | 146 (1.3%) | 148 (2.1%) |
| $15,000 to $19,999 | 153 (1.4%) | 62 (0.9%) |
| $20,000 to $24,999 | 192 (1.8%) | 57 (0.8%) |
| $25,000 to $34,999 | 284 (2.6%) | 258 (3.6%) |
| $35,000 to $49,999 | 517 (4.7%) | 731 (10.2%) |
| $50,000 to $74,999 | 965 (8.8%) | 1,569 (21.9%) |
| $75,000 to $99,999 | 1,399 (12.8%) | 1,330 (18.6%) |
| $100,000 to $149,999 | 2,632 (24.0%) | 1,837 (25.7%) |
| $150,000 or more | 4,395 (40.1%) | 995 (13.9%) |
| Total | 10,950 (100.0%) | 7,163 (100.0%) |
Monthly Housing Cost Tiers in The Colony
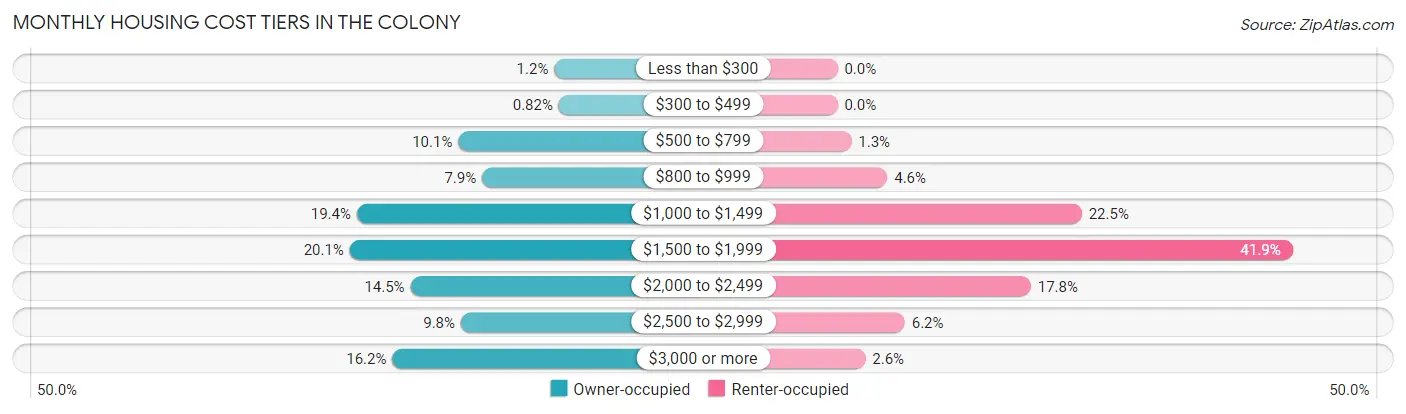
| Monthly Cost | Owner-occupied | Renter-occupied |
| Less than $300 | 136 (1.2%) | 0 (0.0%) |
| $300 to $499 | 90 (0.8%) | 0 (0.0%) |
| $500 to $799 | 1,104 (10.1%) | 92 (1.3%) |
| $800 to $999 | 864 (7.9%) | 329 (4.6%) |
| $1,000 to $1,499 | 2,127 (19.4%) | 1,611 (22.5%) |
| $1,500 to $1,999 | 2,198 (20.1%) | 3,001 (41.9%) |
| $2,000 to $2,499 | 1,586 (14.5%) | 1,275 (17.8%) |
| $2,500 to $2,999 | 1,077 (9.8%) | 444 (6.2%) |
| $3,000 or more | 1,768 (16.2%) | 184 (2.6%) |
| Total | 10,950 (100.0%) | 7,163 (100.0%) |
Physical Housing Characteristics in The Colony
Housing Structures in The Colony
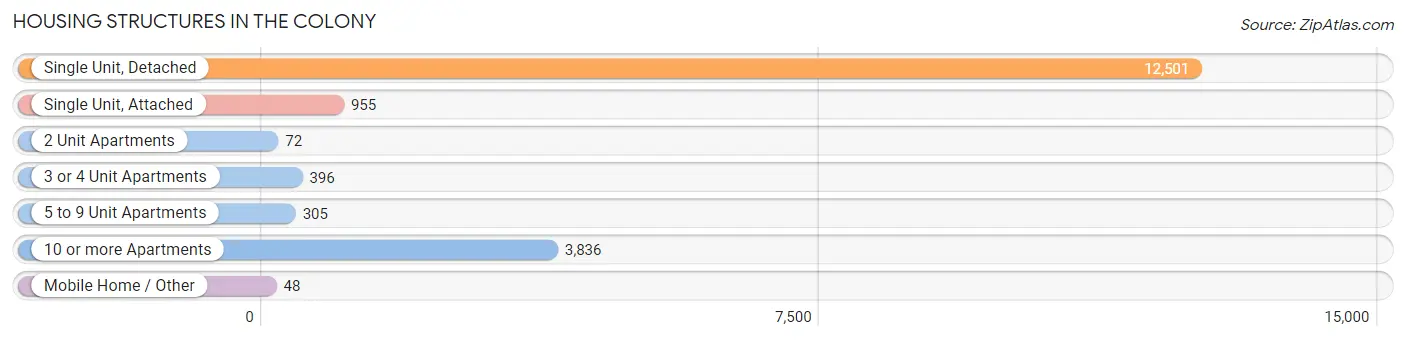
| Structure Type | # Housing Units | % Housing Units |
| Single Unit, Detached | 12,501 | 69.0% |
| Single Unit, Attached | 955 | 5.3% |
| 2 Unit Apartments | 72 | 0.4% |
| 3 or 4 Unit Apartments | 396 | 2.2% |
| 5 to 9 Unit Apartments | 305 | 1.7% |
| 10 or more Apartments | 3,836 | 21.2% |
| Mobile Home / Other | 48 | 0.3% |
| Total | 18,113 | 100.0% |
Housing Structures by Occupancy in The Colony
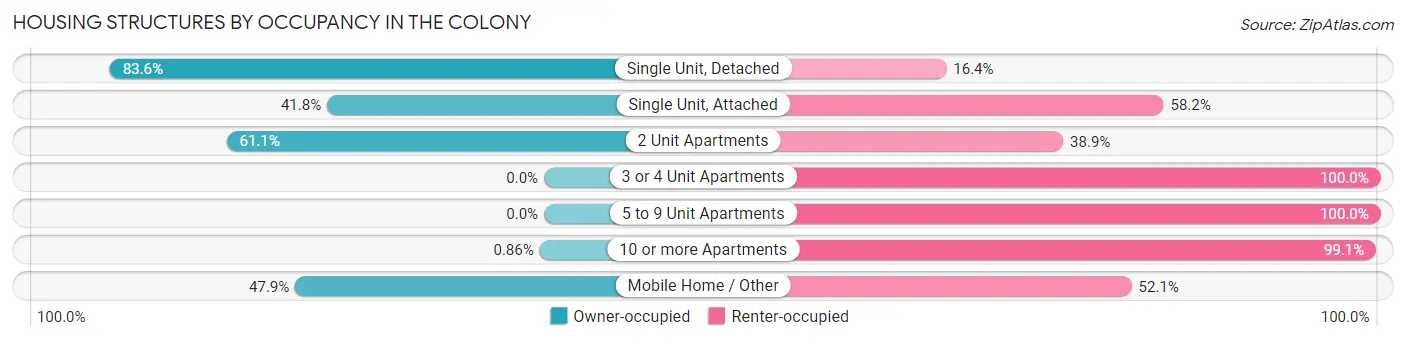
| Structure Type | Owner-occupied | Renter-occupied |
| Single Unit, Detached | 10,451 (83.6%) | 2,050 (16.4%) |
| Single Unit, Attached | 399 (41.8%) | 556 (58.2%) |
| 2 Unit Apartments | 44 (61.1%) | 28 (38.9%) |
| 3 or 4 Unit Apartments | 0 (0.0%) | 396 (100.0%) |
| 5 to 9 Unit Apartments | 0 (0.0%) | 305 (100.0%) |
| 10 or more Apartments | 33 (0.9%) | 3,803 (99.1%) |
| Mobile Home / Other | 23 (47.9%) | 25 (52.1%) |
| Total | 10,950 (60.5%) | 7,163 (39.6%) |
Housing Structures by Number of Rooms in The Colony
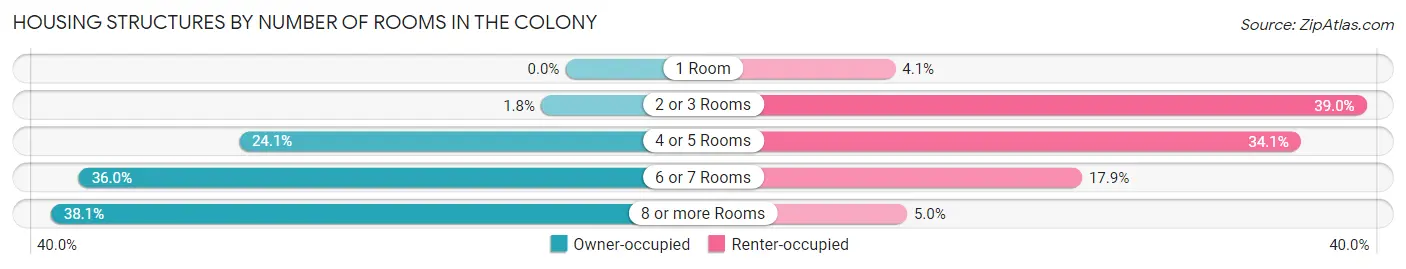
| Number of Rooms | Owner-occupied | Renter-occupied |
| 1 Room | 0 (0.0%) | 294 (4.1%) |
| 2 or 3 Rooms | 198 (1.8%) | 2,790 (39.0%) |
| 4 or 5 Rooms | 2,643 (24.1%) | 2,441 (34.1%) |
| 6 or 7 Rooms | 3,941 (36.0%) | 1,283 (17.9%) |
| 8 or more Rooms | 4,168 (38.1%) | 355 (5.0%) |
| Total | 10,950 (100.0%) | 7,163 (100.0%) |
Housing Structure by Heating Type in The Colony
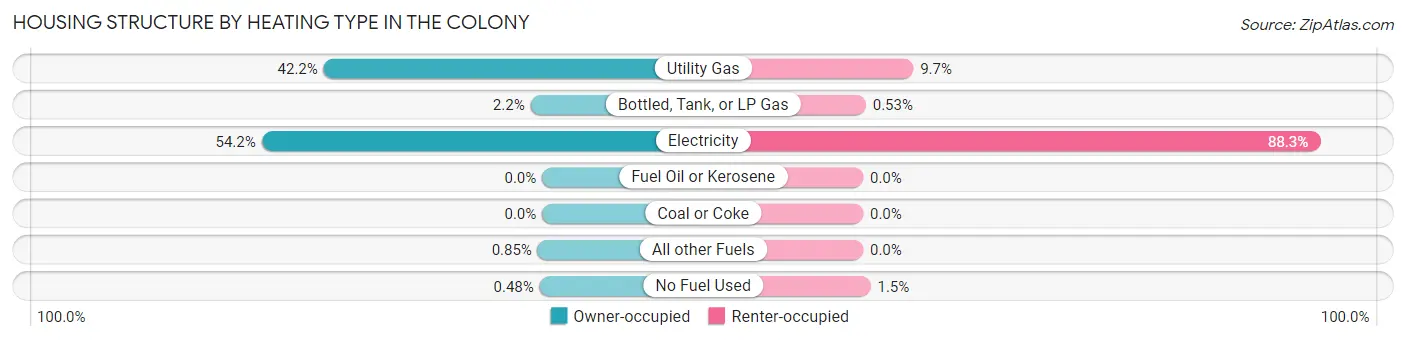
| Heating Type | Owner-occupied | Renter-occupied |
| Utility Gas | 4,623 (42.2%) | 695 (9.7%) |
| Bottled, Tank, or LP Gas | 245 (2.2%) | 38 (0.5%) |
| Electricity | 5,936 (54.2%) | 6,326 (88.3%) |
| Fuel Oil or Kerosene | 0 (0.0%) | 0 (0.0%) |
| Coal or Coke | 0 (0.0%) | 0 (0.0%) |
| All other Fuels | 93 (0.9%) | 0 (0.0%) |
| No Fuel Used | 53 (0.5%) | 104 (1.5%) |
| Total | 10,950 (100.0%) | 7,163 (100.0%) |
Household Vehicle Usage in The Colony
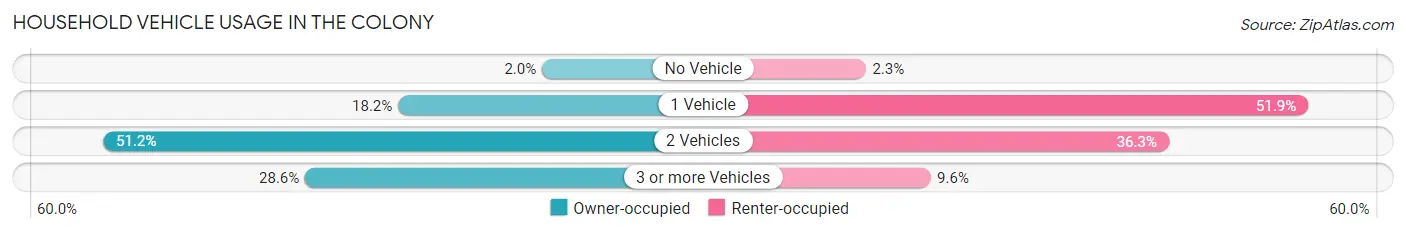
| Vehicles per Household | Owner-occupied | Renter-occupied |
| No Vehicle | 223 (2.0%) | 165 (2.3%) |
| 1 Vehicle | 1,989 (18.2%) | 3,716 (51.9%) |
| 2 Vehicles | 5,608 (51.2%) | 2,598 (36.3%) |
| 3 or more Vehicles | 3,130 (28.6%) | 684 (9.6%) |
| Total | 10,950 (100.0%) | 7,163 (100.0%) |
Real Estate & Mortgages in The Colony
Real Estate and Mortgage Overview in The Colony
| Characteristic | Without Mortgage | With Mortgage |
| Housing Units | 3,274 | 7,676 |
| Median Property Value | $313,400 | $330,900 |
| Median Household Income | $110,071 | $3,321 |
| Monthly Housing Costs | $893 | $1,768 |
| Real Estate Taxes | $5,188 | $72 |
Property Value by Mortgage Status in The Colony
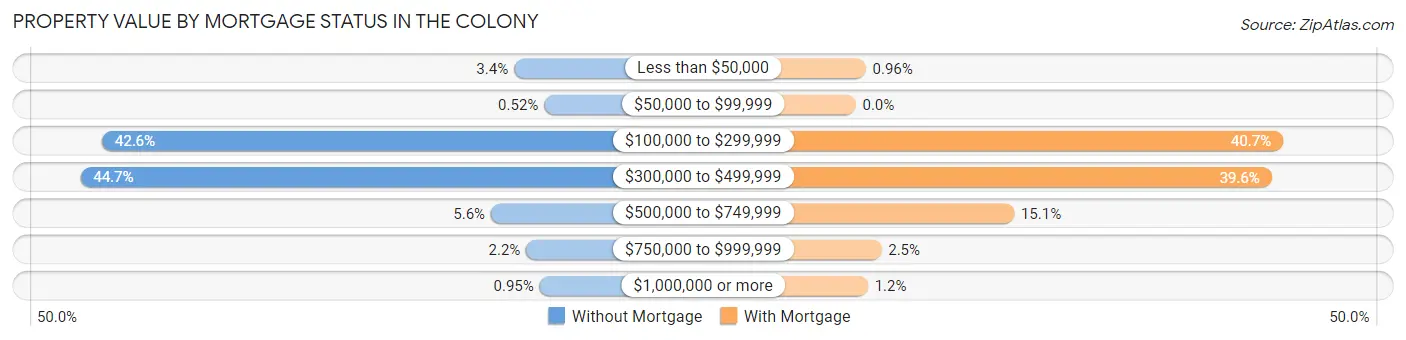
| Property Value | Without Mortgage | With Mortgage |
| Less than $50,000 | 111 (3.4%) | 74 (1.0%) |
| $50,000 to $99,999 | 17 (0.5%) | 0 (0.0%) |
| $100,000 to $299,999 | 1,396 (42.6%) | 3,125 (40.7%) |
| $300,000 to $499,999 | 1,463 (44.7%) | 3,042 (39.6%) |
| $500,000 to $749,999 | 183 (5.6%) | 1,158 (15.1%) |
| $750,000 to $999,999 | 73 (2.2%) | 188 (2.5%) |
| $1,000,000 or more | 31 (0.9%) | 89 (1.2%) |
| Total | 3,274 (100.0%) | 7,676 (100.0%) |
Household Income by Mortgage Status in The Colony
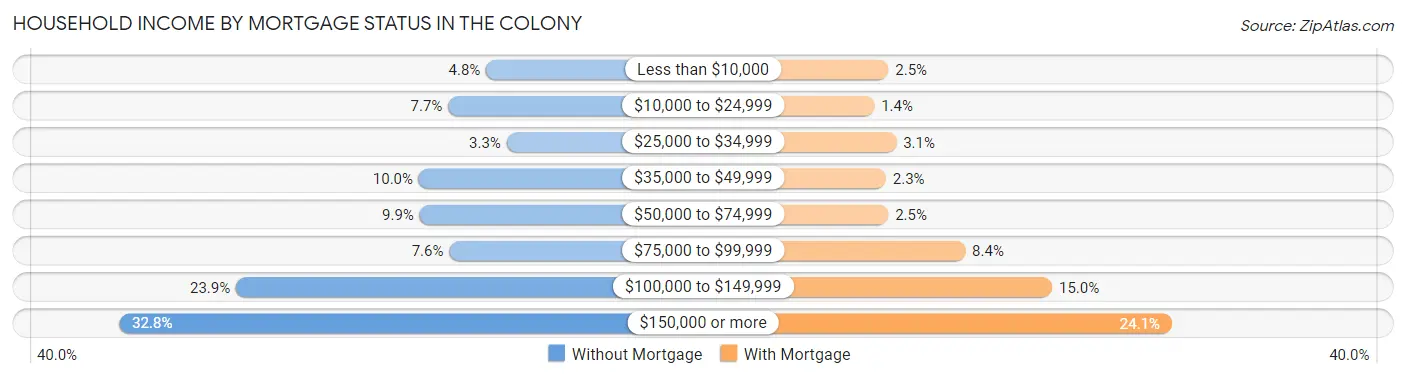
| Household Income | Without Mortgage | With Mortgage |
| Less than $10,000 | 158 (4.8%) | 192 (2.5%) |
| $10,000 to $24,999 | 253 (7.7%) | 109 (1.4%) |
| $25,000 to $34,999 | 107 (3.3%) | 238 (3.1%) |
| $35,000 to $49,999 | 326 (10.0%) | 177 (2.3%) |
| $50,000 to $74,999 | 324 (9.9%) | 191 (2.5%) |
| $75,000 to $99,999 | 250 (7.6%) | 641 (8.4%) |
| $100,000 to $149,999 | 782 (23.9%) | 1,149 (15.0%) |
| $150,000 or more | 1,074 (32.8%) | 1,850 (24.1%) |
| Total | 3,274 (100.0%) | 7,676 (100.0%) |
Property Value to Household Income Ratio in The Colony
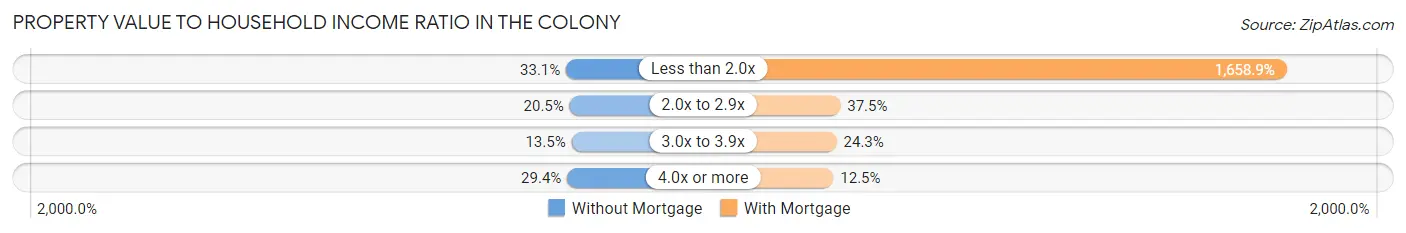
| Value-to-Income Ratio | Without Mortgage | With Mortgage |
| Less than 2.0x | 1,084 (33.1%) | 127,338 (1,658.9%) |
| 2.0x to 2.9x | 671 (20.5%) | 2,881 (37.5%) |
| 3.0x to 3.9x | 443 (13.5%) | 1,867 (24.3%) |
| 4.0x or more | 961 (29.3%) | 957 (12.5%) |
| Total | 3,274 (100.0%) | 7,676 (100.0%) |
Real Estate Taxes by Mortgage Status in The Colony

| Property Taxes | Without Mortgage | With Mortgage |
| Less than $800 | 82 (2.5%) | 75 (1.0%) |
| $800 to $1,499 | 94 (2.9%) | 23 (0.3%) |
| $800 to $1,499 | 2,964 (90.5%) | 40 (0.5%) |
| Total | 3,274 (100.0%) | 7,676 (100.0%) |
Health & Disability in The Colony
Health Insurance Coverage by Age in The Colony
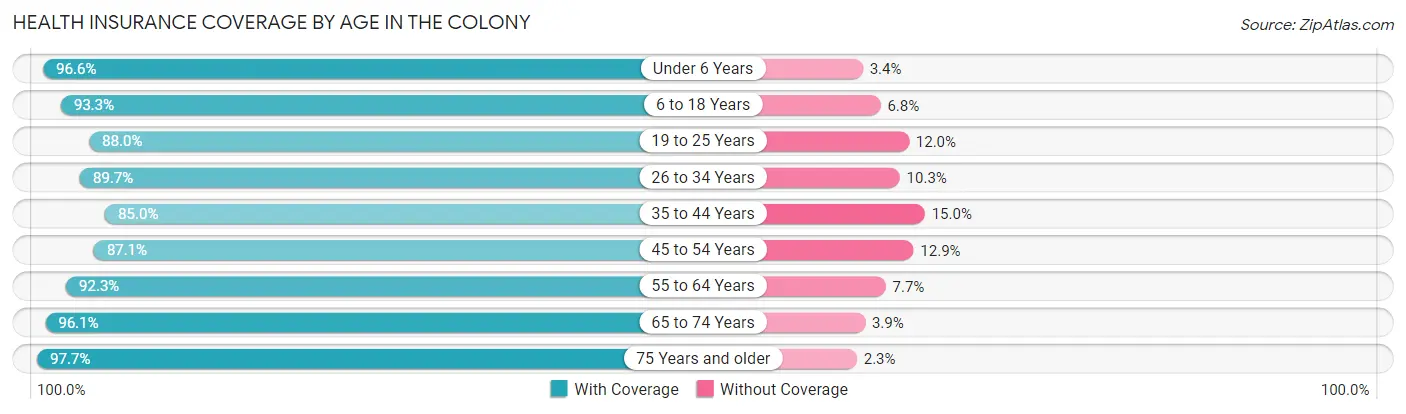
| Age Bracket | With Coverage | Without Coverage |
| Under 6 Years | 3,254 (96.6%) | 116 (3.4%) |
| 6 to 18 Years | 5,277 (93.2%) | 382 (6.8%) |
| 19 to 25 Years | 2,821 (88.0%) | 386 (12.0%) |
| 26 to 34 Years | 7,096 (89.7%) | 817 (10.3%) |
| 35 to 44 Years | 5,980 (85.0%) | 1,055 (15.0%) |
| 45 to 54 Years | 6,292 (87.1%) | 931 (12.9%) |
| 55 to 64 Years | 5,445 (92.3%) | 455 (7.7%) |
| 65 to 74 Years | 2,414 (96.1%) | 97 (3.9%) |
| 75 Years and older | 1,470 (97.7%) | 35 (2.3%) |
| Total | 40,049 (90.4%) | 4,274 (9.6%) |
Health Insurance Coverage by Citizenship Status in The Colony
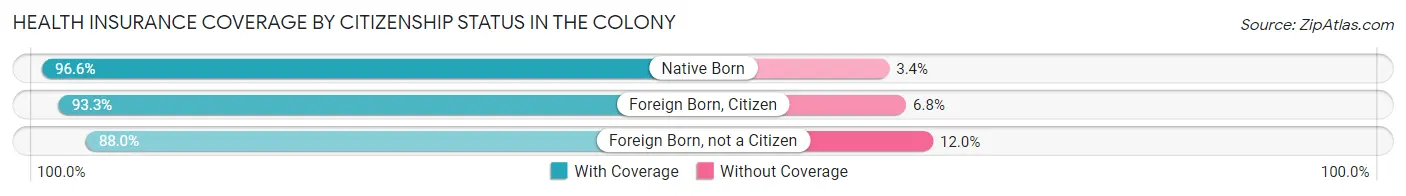
| Citizenship Status | With Coverage | Without Coverage |
| Native Born | 3,254 (96.6%) | 116 (3.4%) |
| Foreign Born, Citizen | 5,277 (93.2%) | 382 (6.8%) |
| Foreign Born, not a Citizen | 2,821 (88.0%) | 386 (12.0%) |
Health Insurance Coverage by Household Income in The Colony
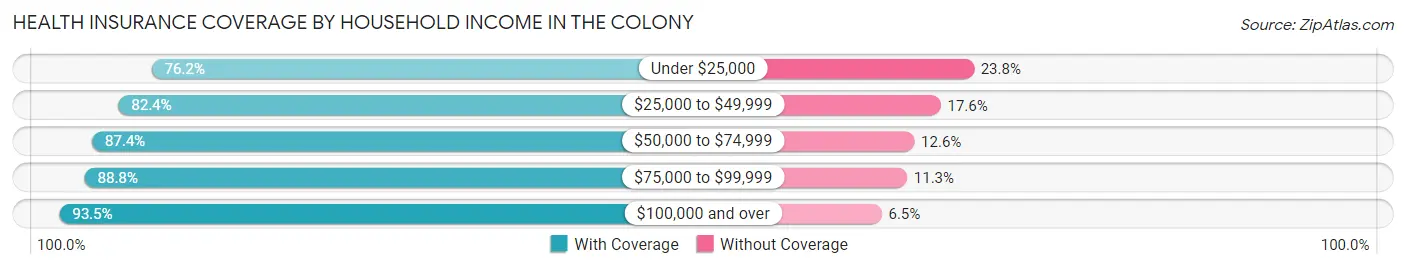
| Household Income | With Coverage | Without Coverage |
| Under $25,000 | 1,936 (76.2%) | 604 (23.8%) |
| $25,000 to $49,999 | 2,763 (82.4%) | 589 (17.6%) |
| $50,000 to $74,999 | 3,786 (87.4%) | 547 (12.6%) |
| $75,000 to $99,999 | 5,891 (88.7%) | 747 (11.3%) |
| $100,000 and over | 25,673 (93.5%) | 1,787 (6.5%) |
Public vs Private Health Insurance Coverage by Age in The Colony
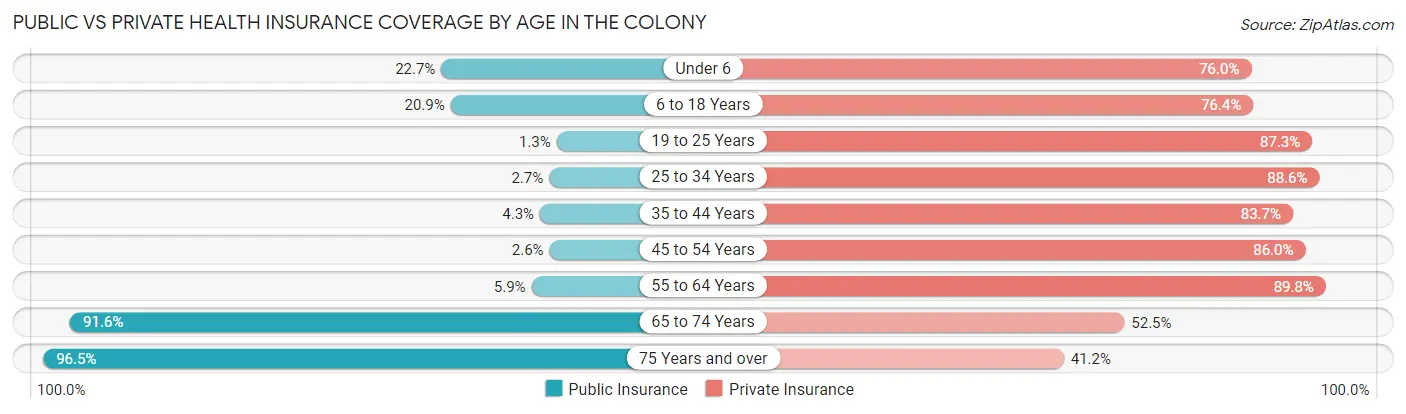
| Age Bracket | Public Insurance | Private Insurance |
| Under 6 | 764 (22.7%) | 2,561 (76.0%) |
| 6 to 18 Years | 1,185 (20.9%) | 4,321 (76.4%) |
| 19 to 25 Years | 40 (1.3%) | 2,799 (87.3%) |
| 25 to 34 Years | 210 (2.6%) | 7,014 (88.6%) |
| 35 to 44 Years | 305 (4.3%) | 5,888 (83.7%) |
| 45 to 54 Years | 187 (2.6%) | 6,214 (86.0%) |
| 55 to 64 Years | 349 (5.9%) | 5,299 (89.8%) |
| 65 to 74 Years | 2,299 (91.6%) | 1,317 (52.4%) |
| 75 Years and over | 1,453 (96.5%) | 620 (41.2%) |
| Total | 6,792 (15.3%) | 36,033 (81.3%) |
Disability Status by Sex by Age in The Colony
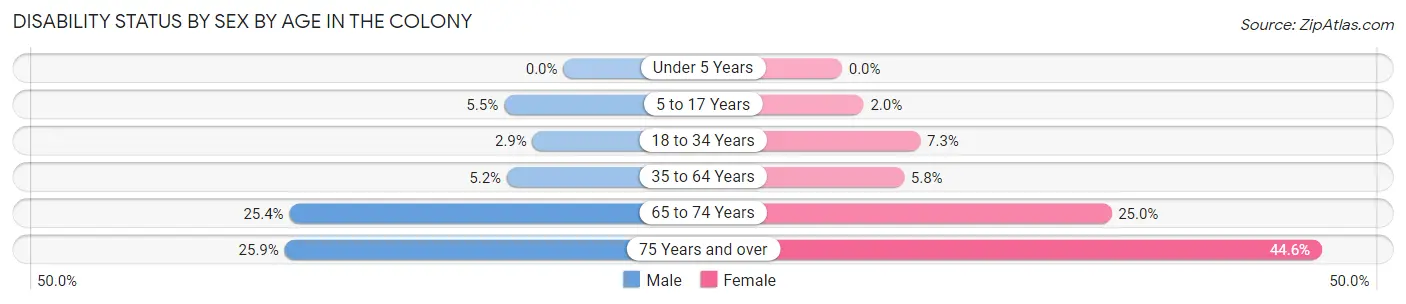
| Age Bracket | Male | Female |
| Under 5 Years | 0 (0.0%) | 0 (0.0%) |
| 5 to 17 Years | 152 (5.5%) | 55 (2.0%) |
| 18 to 34 Years | 167 (2.9%) | 418 (7.3%) |
| 35 to 64 Years | 542 (5.2%) | 566 (5.8%) |
| 65 to 74 Years | 320 (25.4%) | 313 (25.0%) |
| 75 Years and over | 142 (25.9%) | 426 (44.6%) |
Disability Class by Sex by Age in The Colony
Disability Class: Hearing Difficulty
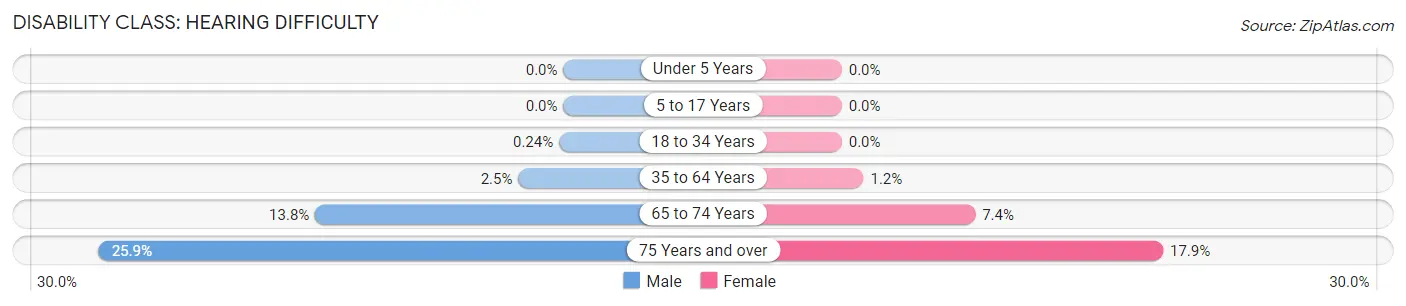
| Age Bracket | Male | Female |
| Under 5 Years | 0 (0.0%) | 0 (0.0%) |
| 5 to 17 Years | 0 (0.0%) | 0 (0.0%) |
| 18 to 34 Years | 14 (0.2%) | 0 (0.0%) |
| 35 to 64 Years | 259 (2.5%) | 119 (1.2%) |
| 65 to 74 Years | 174 (13.8%) | 93 (7.4%) |
| 75 Years and over | 142 (25.9%) | 171 (17.9%) |
Disability Class: Vision Difficulty
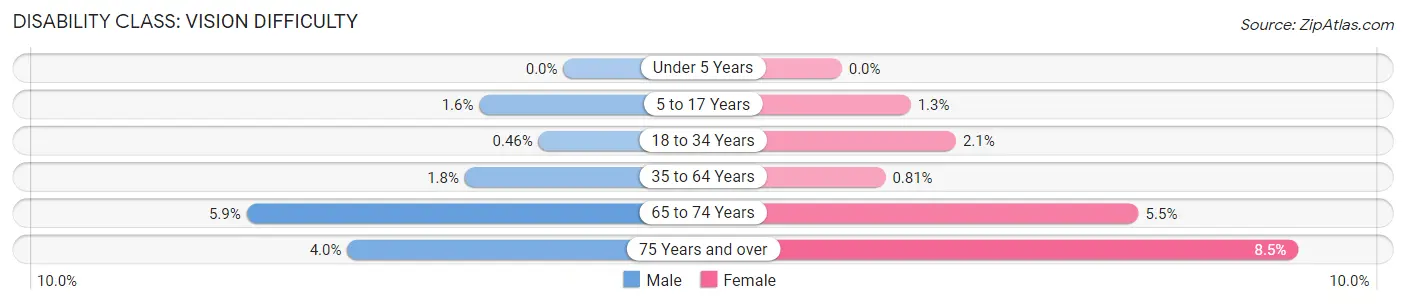
| Age Bracket | Male | Female |
| Under 5 Years | 0 (0.0%) | 0 (0.0%) |
| 5 to 17 Years | 43 (1.6%) | 35 (1.3%) |
| 18 to 34 Years | 27 (0.5%) | 122 (2.1%) |
| 35 to 64 Years | 189 (1.8%) | 80 (0.8%) |
| 65 to 74 Years | 74 (5.9%) | 69 (5.5%) |
| 75 Years and over | 22 (4.0%) | 81 (8.5%) |
Disability Class: Cognitive Difficulty
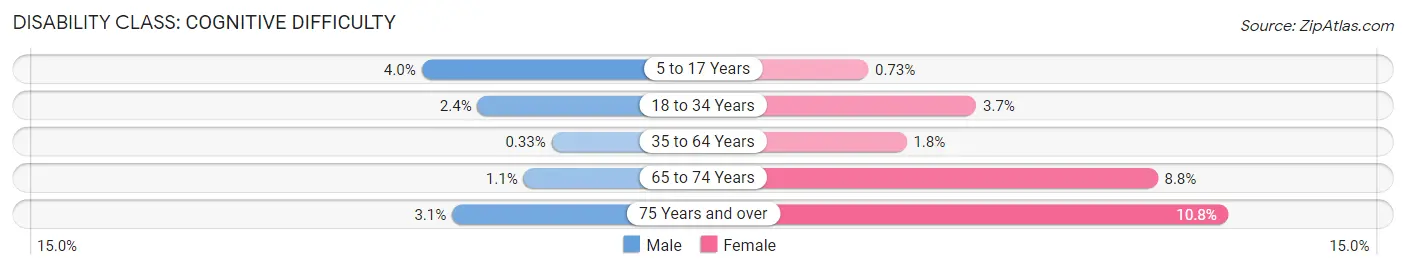
| Age Bracket | Male | Female |
| 5 to 17 Years | 109 (4.0%) | 20 (0.7%) |
| 18 to 34 Years | 140 (2.4%) | 215 (3.7%) |
| 35 to 64 Years | 34 (0.3%) | 177 (1.8%) |
| 65 to 74 Years | 14 (1.1%) | 110 (8.8%) |
| 75 Years and over | 17 (3.1%) | 103 (10.8%) |
Disability Class: Ambulatory Difficulty
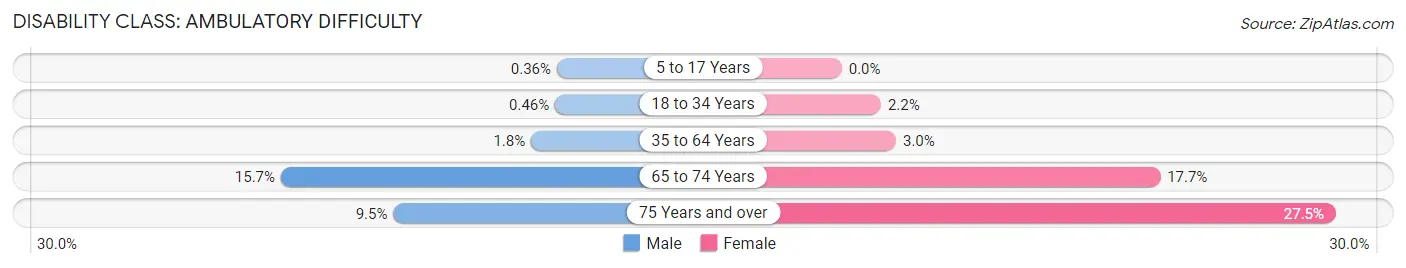
| Age Bracket | Male | Female |
| 5 to 17 Years | 10 (0.4%) | 0 (0.0%) |
| 18 to 34 Years | 27 (0.5%) | 125 (2.2%) |
| 35 to 64 Years | 186 (1.8%) | 297 (3.0%) |
| 65 to 74 Years | 198 (15.7%) | 222 (17.7%) |
| 75 Years and over | 52 (9.5%) | 263 (27.5%) |
Disability Class: Self-Care Difficulty
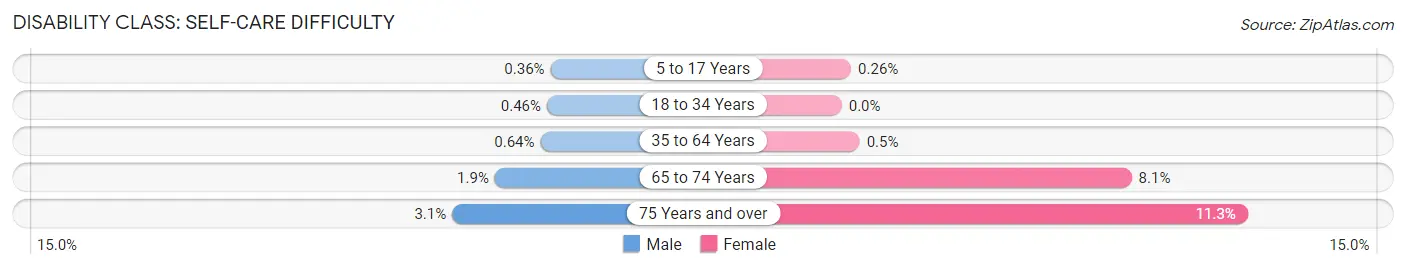
| Age Bracket | Male | Female |
| 5 to 17 Years | 10 (0.4%) | 7 (0.3%) |
| 18 to 34 Years | 27 (0.5%) | 0 (0.0%) |
| 35 to 64 Years | 66 (0.6%) | 49 (0.5%) |
| 65 to 74 Years | 24 (1.9%) | 101 (8.1%) |
| 75 Years and over | 17 (3.1%) | 108 (11.3%) |
Technology Access in The Colony
Computing Device Access in The Colony
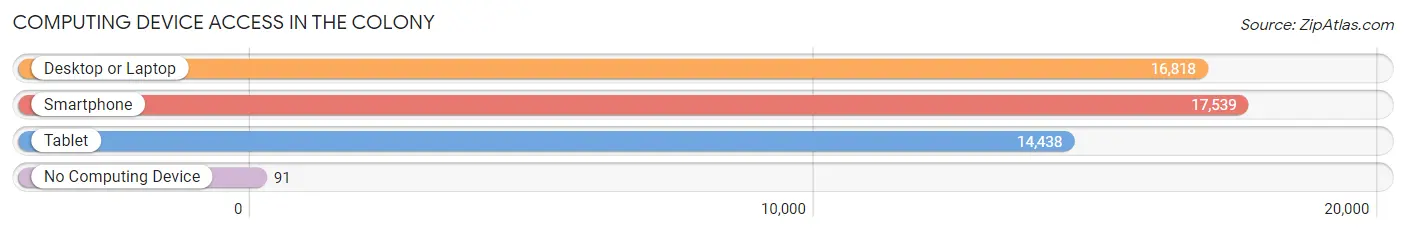
| Device Type | # Households | % Households |
| Desktop or Laptop | 16,818 | 92.8% |
| Smartphone | 17,539 | 96.8% |
| Tablet | 14,438 | 79.7% |
| No Computing Device | 91 | 0.5% |
| Total | 18,113 | 100.0% |
Internet Access in The Colony
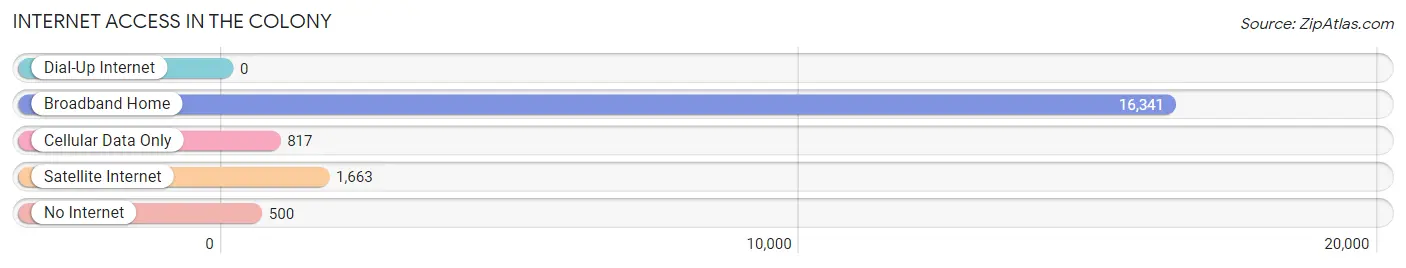
| Internet Type | # Households | % Households |
| Dial-Up Internet | 0 | 0.0% |
| Broadband Home | 16,341 | 90.2% |
| Cellular Data Only | 817 | 4.5% |
| Satellite Internet | 1,663 | 9.2% |
| No Internet | 500 | 2.8% |
| Total | 18,113 | 100.0% |
The Colony Summary
The Colony is a city located in Denton County, Texas, United States. It is a suburb of Dallas and is part of the Dallas-Fort Worth metropolitan area. The city was founded in 1873 and incorporated in 1977. As of the 2010 census, the city had a population of 36,328.
History
The Colony was founded in 1873 by a group of settlers from Kentucky and Tennessee. The settlers were attracted to the area by the abundance of timber and the availability of land. The area was originally known as Peters Colony, named after William S. Peters, who was the leader of the group of settlers. The settlers established a post office in 1876 and the town was officially named The Colony in 1877.
The Colony was a farming community for many years, with cotton and corn being the main crops. In the early 1900s, the town began to grow as the railroad came through and the population increased. The town was incorporated in 1977 and has since grown rapidly.
Geography
The Colony is located in Denton County, Texas, about 25 miles north of Dallas. It is situated on the eastern shore of Lewisville Lake, a reservoir on the Elm Fork of the Trinity River. The city has a total area of 24.2 square miles, of which 22.7 square miles is land and 1.5 square miles is water.
Economy
The Colony is a rapidly growing city with a diverse economy. The city is home to several large companies, including Pizza Hut, Frito-Lay, and Dr Pepper Snapple Group. The city also has a thriving retail sector, with several shopping centers and retail outlets. The city is also home to several corporate headquarters, including Pizza Hut, Frito-Lay, and Dr Pepper Snapple Group.
The city is also home to several educational institutions, including The Colony High School, The Colony Middle School, and The Colony Elementary School. The city is also home to several parks and recreational facilities, including The Colony Aquatic Park, The Colony Skate Park, and The Colony Nature Preserve.
Demographics
As of the 2010 census, The Colony had a population of 36,328. The racial makeup of the city was 73.3% White, 11.3% African American, 0.7% Native American, 4.2% Asian, 0.1% Pacific Islander, 7.2% from other races, and 3.2% from two or more races. Hispanic or Latino of any race were 18.2% of the population.
The median income for a household in The Colony was $63,945, and the median income for a family was $71,945. The per capita income for the city was $27,945. About 5.2% of families and 6.7% of the population were below the poverty line, including 8.2% of those under age 18 and 5.2% of those age 65 or over.
The Colony is a rapidly growing city with a diverse population and economy. The city is home to several large companies, educational institutions, and recreational facilities. The city has a strong retail sector and is home to several corporate headquarters. The city has a median income that is higher than the national average and a poverty rate that is lower than the national average. The city is a great place to live, work, and play.
Common Questions
What is Per Capita Income in The Colony?
Per Capita income in The Colony is $55,951.
What is the Median Family Income in The Colony?
Median Family Income in The Colony is $125,855.
What is the Median Household income in The Colony?
Median Household Income in The Colony is $106,518.
What is Income or Wage Gap in The Colony?
Income or Wage Gap in The Colony is 16.4%.
Women in The Colony earn 83.6 cents for every dollar earned by a man.
What is Inequality or Gini Index in The Colony?
Inequality or Gini Index in The Colony is 0.40.
What is the Total Population of The Colony?
Total Population of The Colony is 44,323.
What is the Total Male Population of The Colony?
Total Male Population of The Colony is 22,108.
What is the Total Female Population of The Colony?
Total Female Population of The Colony is 22,215.
What is the Ratio of Males per 100 Females in The Colony?
There are 99.52 Males per 100 Females in The Colony.
What is the Ratio of Females per 100 Males in The Colony?
There are 100.48 Females per 100 Males in The Colony.
What is the Median Population Age in The Colony?
Median Population Age in The Colony is 37.2 Years.
What is the Average Family Size in The Colony
Average Family Size in The Colony is 3.0 People.
What is the Average Household Size in The Colony
Average Household Size in The Colony is 2.5 People.
How Large is the Labor Force in The Colony?
There are 28,822 People in the Labor Forcein in The Colony.
What is the Percentage of People in the Labor Force in The Colony?
78.9% of People are in the Labor Force in The Colony.
What is the Unemployment Rate in The Colony?
Unemployment Rate in The Colony is 4.1%.