Waller, TX Map & Demographics
Waller Map
Waller Overview
$23,874
PER CAPITA INCOME
$62,903
AVG FAMILY INCOME
$36,160
AVG HOUSEHOLD INCOME
28.8%
WAGE / INCOME GAP [ % ]
71.2¢/ $1
WAGE / INCOME GAP [ $ ]
$7,953
FAMILY INCOME DEFICIT
0.45
INEQUALITY / GINI INDEX
3,257
TOTAL POPULATION
1,333
MALE POPULATION
1,924
FEMALE POPULATION
69.28
MALES / 100 FEMALES
144.34
FEMALES / 100 MALES
25.6
MEDIAN AGE
3.4
AVG FAMILY SIZE
2.6
AVG HOUSEHOLD SIZE
1,836
LABOR FORCE [ PEOPLE ]
65.0%
PERCENT IN LABOR FORCE
2.0%
UNEMPLOYMENT RATE
Waller Zip Codes
Waller Area Codes
Income in Waller
Income Overview in Waller
Per Capita Income in Waller is $23,874, while median incomes of families and households are $62,903 and $36,160 respectively.
| Characteristic | Number | Measure |
| Per Capita Income | 3,257 | $23,874 |
| Median Family Income | 658 | $62,903 |
| Mean Family Income | 658 | $79,526 |
| Median Household Income | 1,239 | $36,160 |
| Mean Household Income | 1,239 | $59,437 |
| Income Deficit | 658 | $7,953 |
| Wage / Income Gap (%) | 3,257 | 28.76% |
| Wage / Income Gap ($) | 3,257 | 71.24¢ per $1 |
| Gini / Inequality Index | 3,257 | 0.45 |
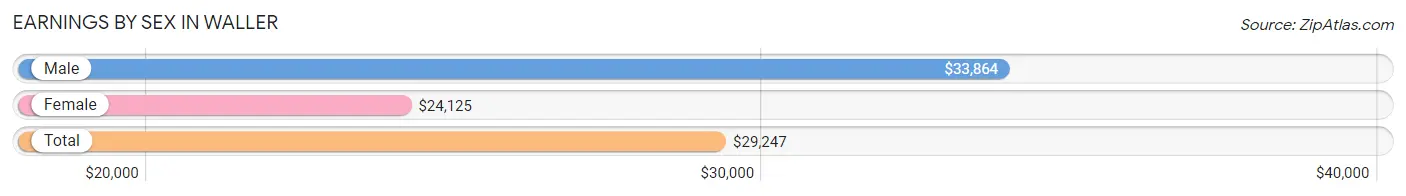
Earnings by Sex in Waller
Average Earnings in Waller are $29,247, $33,864 for men and $24,125 for women, a difference of 28.8%.
| Sex | Number | Average Earnings |
| Male | 836 (43.6%) | $33,864 |
| Female | 1,080 (56.4%) | $24,125 |
| Total | 1,916 (100.0%) | $29,247 |
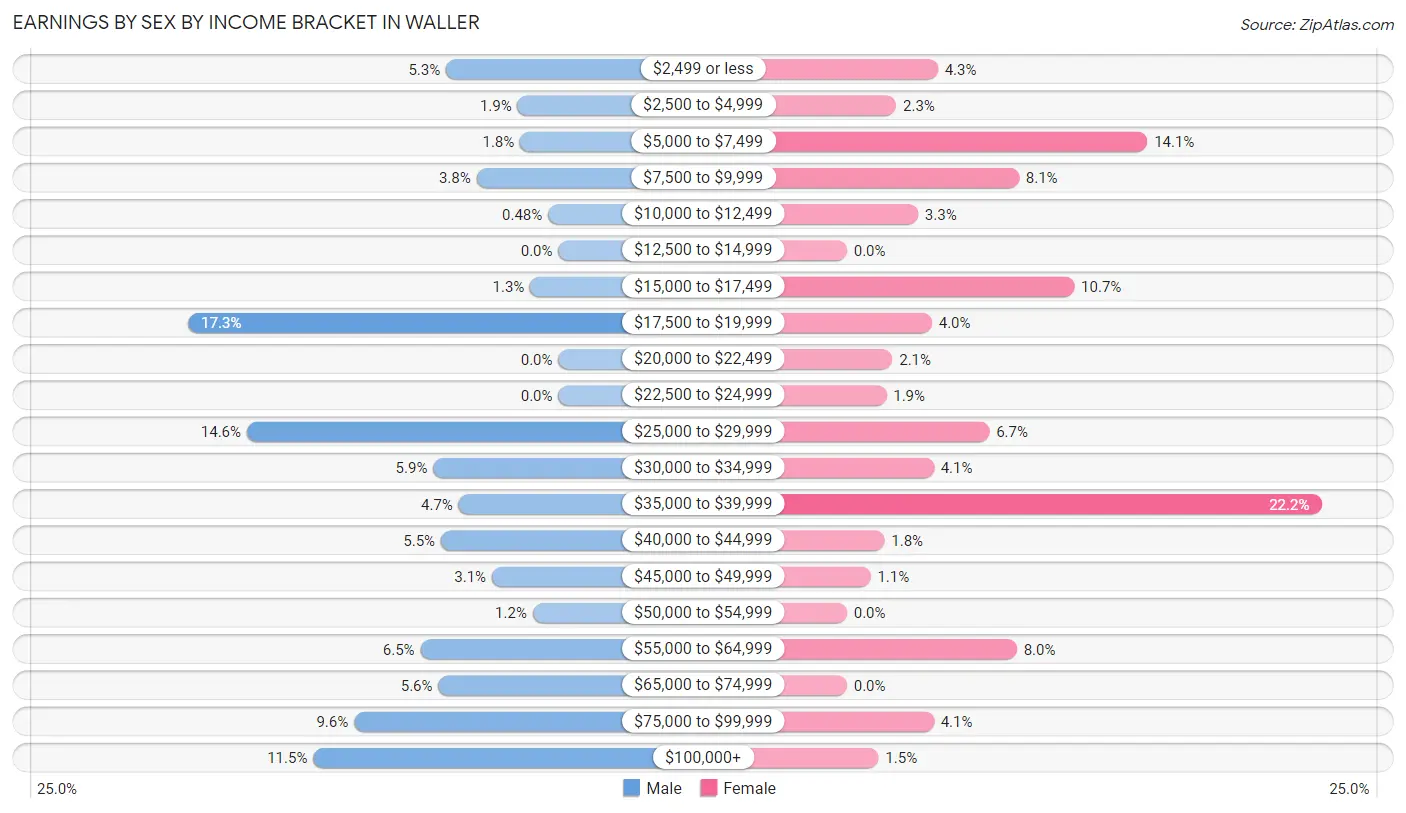
Earnings by Sex by Income Bracket in Waller
The most common earnings brackets in Waller are $17,500 to $19,999 for men (145 | 17.3%) and $35,000 to $39,999 for women (240 | 22.2%).
| Income | Male | Female |
| $2,499 or less | 44 (5.3%) | 46 (4.3%) |
| $2,500 to $4,999 | 16 (1.9%) | 25 (2.3%) |
| $5,000 to $7,499 | 15 (1.8%) | 152 (14.1%) |
| $7,500 to $9,999 | 32 (3.8%) | 87 (8.1%) |
| $10,000 to $12,499 | 4 (0.5%) | 36 (3.3%) |
| $12,500 to $14,999 | 0 (0.0%) | 0 (0.0%) |
| $15,000 to $17,499 | 11 (1.3%) | 115 (10.6%) |
| $17,500 to $19,999 | 145 (17.3%) | 43 (4.0%) |
| $20,000 to $22,499 | 0 (0.0%) | 23 (2.1%) |
| $22,500 to $24,999 | 0 (0.0%) | 20 (1.8%) |
| $25,000 to $29,999 | 122 (14.6%) | 72 (6.7%) |
| $30,000 to $34,999 | 49 (5.9%) | 44 (4.1%) |
| $35,000 to $39,999 | 39 (4.7%) | 240 (22.2%) |
| $40,000 to $44,999 | 46 (5.5%) | 19 (1.8%) |
| $45,000 to $49,999 | 26 (3.1%) | 12 (1.1%) |
| $50,000 to $54,999 | 10 (1.2%) | 0 (0.0%) |
| $55,000 to $64,999 | 54 (6.5%) | 86 (8.0%) |
| $65,000 to $74,999 | 47 (5.6%) | 0 (0.0%) |
| $75,000 to $99,999 | 80 (9.6%) | 44 (4.1%) |
| $100,000+ | 96 (11.5%) | 16 (1.5%) |
| Total | 836 (100.0%) | 1,080 (100.0%) |
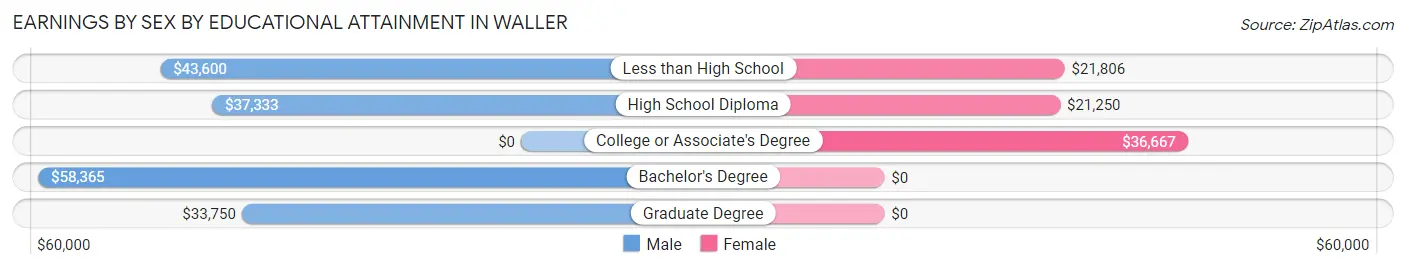
Earnings by Sex by Educational Attainment in Waller
Average earnings in Waller are $40,595 for men and $27,784 for women, a difference of 31.6%. Men with an educational attainment of bachelor's degree enjoy the highest average annual earnings of $58,365, while those with graduate degree education earn the least with $33,750. Women with an educational attainment of college or associate's degree earn the most with the average annual earnings of $36,667, while those with high school diploma education have the smallest earnings of $21,250.
| Educational Attainment | Male Income | Female Income |
| Less than High School | $43,600 | $21,806 |
| High School Diploma | $37,333 | $21,250 |
| College or Associate's Degree | - | - |
| Bachelor's Degree | $58,365 | $0 |
| Graduate Degree | $33,750 | $0 |
| Total | $40,595 | $27,784 |
Family Income in Waller
Family Income Brackets in Waller
According to the Waller family income data, there are 157 families falling into the $25,000 to $34,999 income range, which is the most common income bracket and makes up 23.9% of all families.
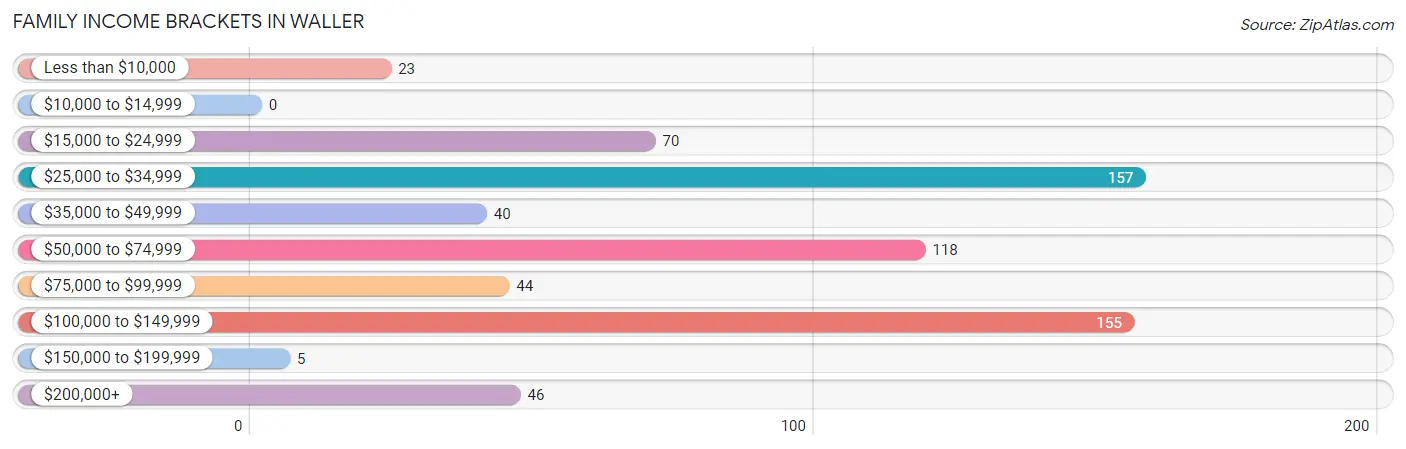
| Income Bracket | # Families | % Families |
| Less than $10,000 | 23 | 3.5% |
| $10,000 to $14,999 | 0 | 0.0% |
| $15,000 to $24,999 | 70 | 10.6% |
| $25,000 to $34,999 | 157 | 23.9% |
| $35,000 to $49,999 | 40 | 6.1% |
| $50,000 to $74,999 | 118 | 17.9% |
| $75,000 to $99,999 | 44 | 6.7% |
| $100,000 to $149,999 | 155 | 23.6% |
| $150,000 to $199,999 | 5 | 0.8% |
| $200,000+ | 46 | 7.0% |
Family Income by Famaliy Size in Waller
5-person families (30 | 4.6%) account for the highest median family income in Waller with $92,500 per family, while 3-person families (146 | 22.2%) have the highest median income of $22,738 per family member.
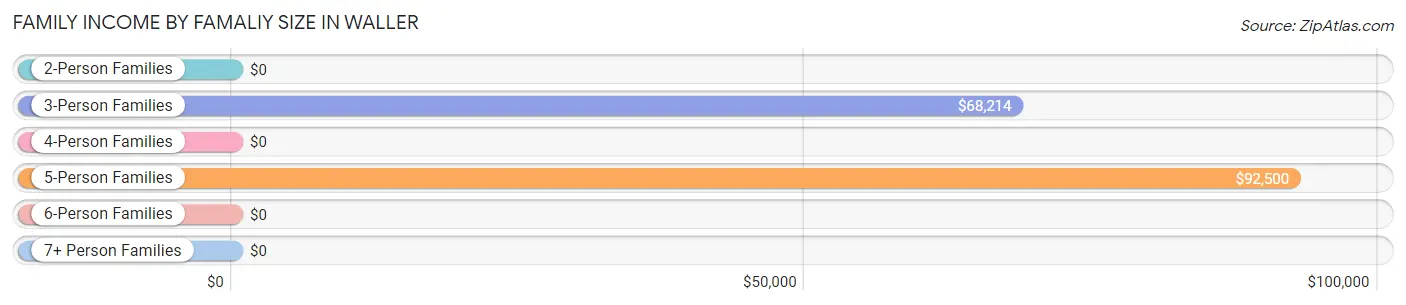
| Income Bracket | # Families | Median Income |
| 2-Person Families | 331 (50.3%) | $0 |
| 3-Person Families | 146 (22.2%) | $68,214 |
| 4-Person Families | 151 (23.0%) | $0 |
| 5-Person Families | 30 (4.6%) | $92,500 |
| 6-Person Families | 0 (0.0%) | $0 |
| 7+ Person Families | 0 (0.0%) | $0 |
| Total | 658 (100.0%) | $62,903 |
Family Income by Number of Earners in Waller
The median family income in Waller is $62,903, with families comprising 2 earners (262) having the highest median family income of $111,111, while families with no earners (48) have the lowest median family income of $21,538, accounting for 39.8% and 7.3% of families, respectively.
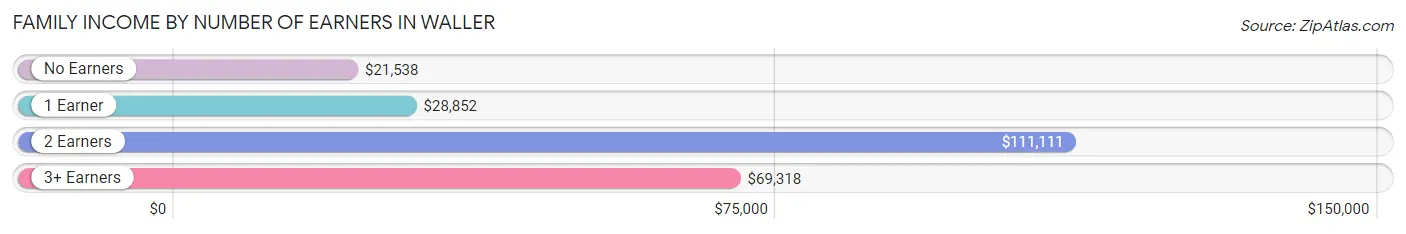
| Number of Earners | # Families | Median Income |
| No Earners | 48 (7.3%) | $21,538 |
| 1 Earner | 248 (37.7%) | $28,852 |
| 2 Earners | 262 (39.8%) | $111,111 |
| 3+ Earners | 100 (15.2%) | $69,318 |
| Total | 658 (100.0%) | $62,903 |
Household Income in Waller
Household Income Brackets in Waller
With 273 households falling in the category, the $35,000 to $49,999 income range is the most frequent in Waller, accounting for 22.0% of all households.
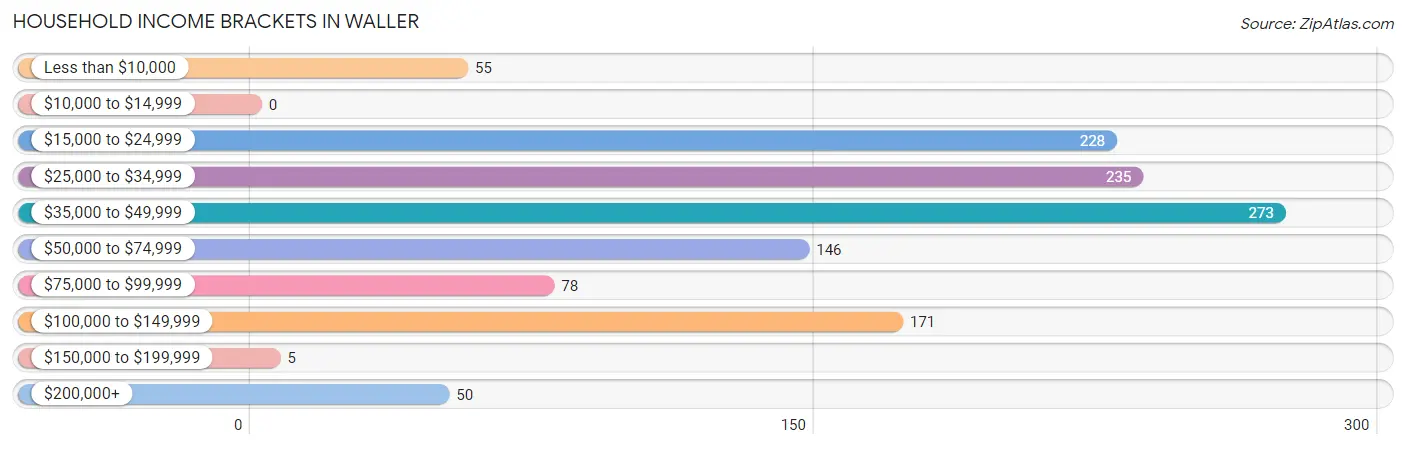
| Income Bracket | # Households | % Households |
| Less than $10,000 | 55 | 4.4% |
| $10,000 to $14,999 | 0 | 0.0% |
| $15,000 to $24,999 | 228 | 18.4% |
| $25,000 to $34,999 | 235 | 19.0% |
| $35,000 to $49,999 | 273 | 22.0% |
| $50,000 to $74,999 | 146 | 11.8% |
| $75,000 to $99,999 | 78 | 6.3% |
| $100,000 to $149,999 | 171 | 13.8% |
| $150,000 to $199,999 | 5 | 0.4% |
| $200,000+ | 50 | 4.0% |
Household Income by Householder Age in Waller
The median household income in Waller is $36,160, with the highest median household income of $73,250 found in the 45 to 64 years age bracket for the primary householder. A total of 294 households (23.7%) fall into this category. Meanwhile, the 15 to 24 years age bracket for the primary householder has the lowest median household income of $0, with 164 households (13.2%) in this group.
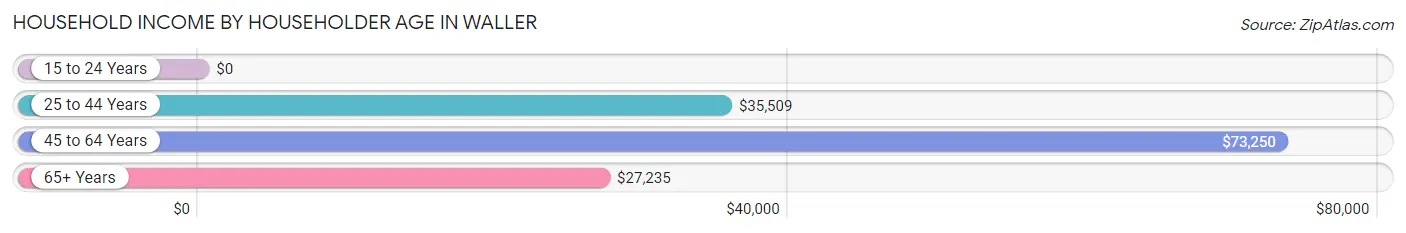
| Income Bracket | # Households | Median Income |
| 15 to 24 Years | 164 (13.2%) | $0 |
| 25 to 44 Years | 636 (51.3%) | $35,509 |
| 45 to 64 Years | 294 (23.7%) | $73,250 |
| 65+ Years | 145 (11.7%) | $27,235 |
| Total | 1,239 (100.0%) | $36,160 |
Poverty in Waller
Income Below Poverty by Sex and Age in Waller
With 10.4% poverty level for males and 29.8% for females among the residents of Waller, 6 to 11 year old males and 25 to 34 year old females are the most vulnerable to poverty, with 16 males (53.3%) and 298 females (76.6%) in their respective age groups living below the poverty level.
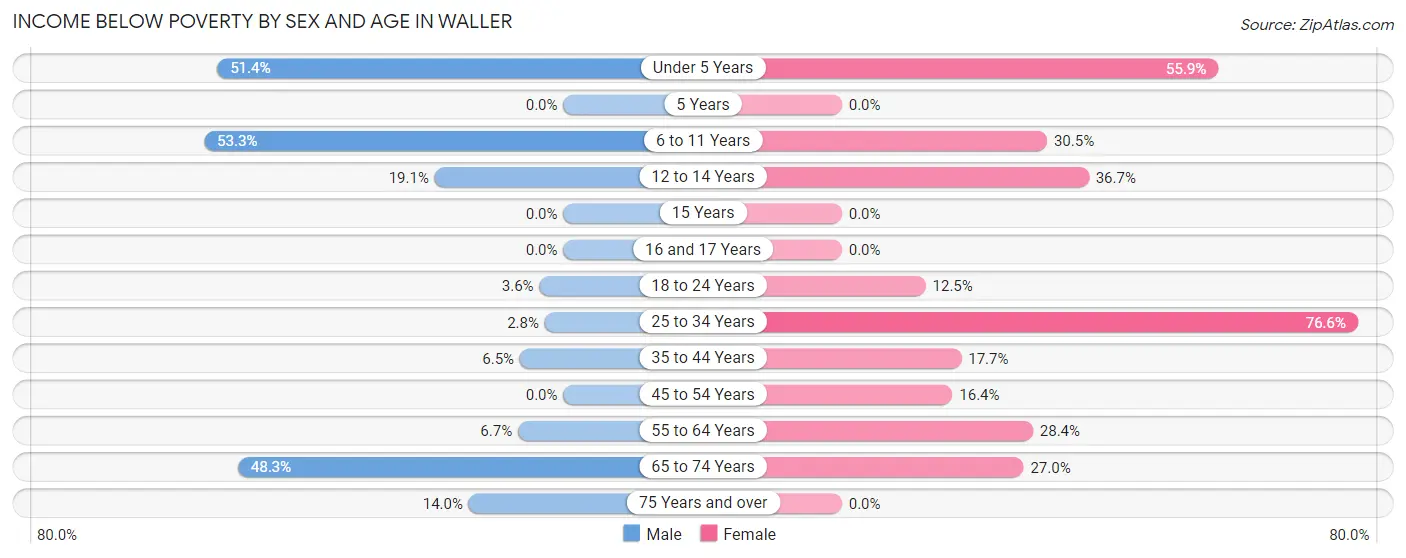
| Age Bracket | Male | Female |
| Under 5 Years | 37 (51.4%) | 19 (55.9%) |
| 5 Years | 0 (0.0%) | 0 (0.0%) |
| 6 to 11 Years | 16 (53.3%) | 39 (30.5%) |
| 12 to 14 Years | 17 (19.1%) | 11 (36.7%) |
| 15 Years | 0 (0.0%) | 0 (0.0%) |
| 16 and 17 Years | 0 (0.0%) | 0 (0.0%) |
| 18 to 24 Years | 10 (3.5%) | 90 (12.4%) |
| 25 to 34 Years | 12 (2.8%) | 298 (76.6%) |
| 35 to 44 Years | 4 (6.5%) | 33 (17.7%) |
| 45 to 54 Years | 0 (0.0%) | 22 (16.4%) |
| 55 to 64 Years | 6 (6.7%) | 40 (28.4%) |
| 65 to 74 Years | 29 (48.3%) | 17 (27.0%) |
| 75 Years and over | 8 (14.0%) | 0 (0.0%) |
| Total | 139 (10.4%) | 569 (29.8%) |
Income Above Poverty by Sex and Age in Waller
According to the poverty statistics in Waller, males aged 5 years and females aged 5 years are the age groups that are most secure financially, with 100.0% of males and 100.0% of females in these age groups living above the poverty line.
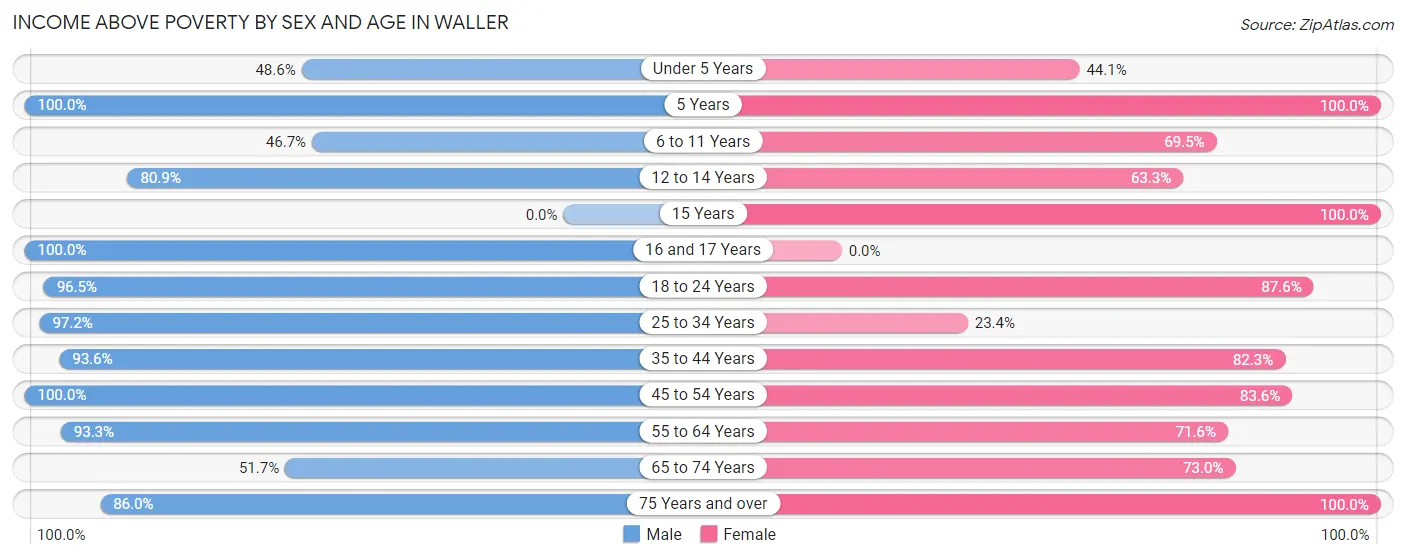
| Age Bracket | Male | Female |
| Under 5 Years | 35 (48.6%) | 15 (44.1%) |
| 5 Years | 24 (100.0%) | 5 (100.0%) |
| 6 to 11 Years | 14 (46.7%) | 89 (69.5%) |
| 12 to 14 Years | 72 (80.9%) | 19 (63.3%) |
| 15 Years | 0 (0.0%) | 21 (100.0%) |
| 16 and 17 Years | 36 (100.0%) | 0 (0.0%) |
| 18 to 24 Years | 272 (96.5%) | 633 (87.5%) |
| 25 to 34 Years | 423 (97.2%) | 91 (23.4%) |
| 35 to 44 Years | 58 (93.5%) | 153 (82.3%) |
| 45 to 54 Years | 97 (100.0%) | 112 (83.6%) |
| 55 to 64 Years | 83 (93.3%) | 101 (71.6%) |
| 65 to 74 Years | 31 (51.7%) | 46 (73.0%) |
| 75 Years and over | 49 (86.0%) | 55 (100.0%) |
| Total | 1,194 (89.6%) | 1,340 (70.2%) |
Income Below Poverty Among Married-Couple Families in Waller
The poverty statistics for married-couple families in Waller show that 12.1% or 47 of the total 388 families live below the poverty line. Families with 1 or 2 children have the highest poverty rate of 26.3%, comprising of 25 families. On the other hand, families with 3 or 4 children have the lowest poverty rate of 0.0%, which includes 0 families.
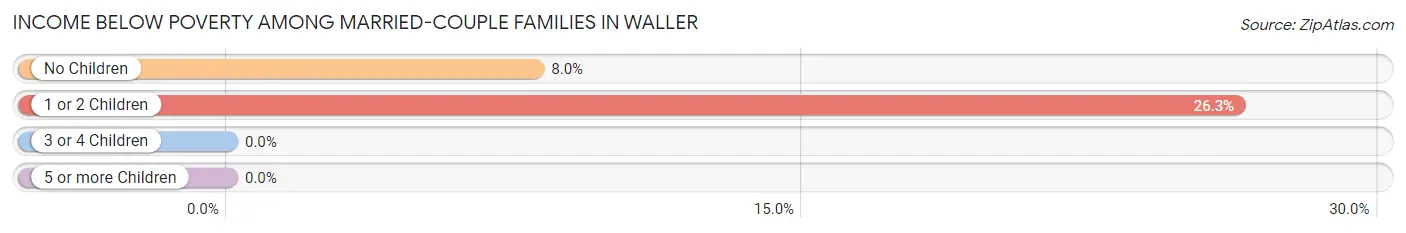
| Children | Above Poverty | Below Poverty |
| No Children | 253 (92.0%) | 22 (8.0%) |
| 1 or 2 Children | 70 (73.7%) | 25 (26.3%) |
| 3 or 4 Children | 18 (100.0%) | 0 (0.0%) |
| 5 or more Children | 0 (0.0%) | 0 (0.0%) |
| Total | 341 (87.9%) | 47 (12.1%) |
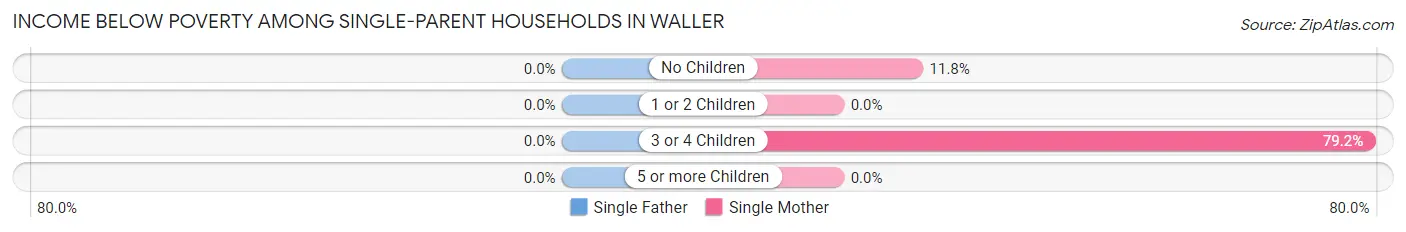
Income Below Poverty Among Single-Parent Households in Waller
| Children | Single Father | Single Mother |
| No Children | 0 (0.0%) | 4 (11.8%) |
| 1 or 2 Children | 0 (0.0%) | 0 (0.0%) |
| 3 or 4 Children | 0 (0.0%) | 38 (79.2%) |
| 5 or more Children | 0 (0.0%) | 0 (0.0%) |
| Total | 0 (0.0%) | 42 (30.7%) |
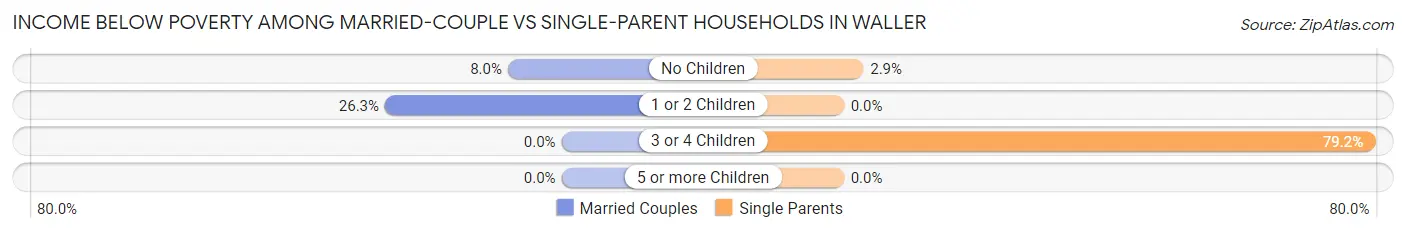
Income Below Poverty Among Married-Couple vs Single-Parent Households in Waller
The poverty data for Waller shows that 47 of the married-couple family households (12.1%) and 42 of the single-parent households (15.6%) are living below the poverty level. Within the married-couple family households, those with 1 or 2 children have the highest poverty rate, with 25 households (26.3%) falling below the poverty line. Among the single-parent households, those with 3 or 4 children have the highest poverty rate, with 38 household (79.2%) living below poverty.
| Children | Married-Couple Families | Single-Parent Households |
| No Children | 22 (8.0%) | 4 (2.9%) |
| 1 or 2 Children | 25 (26.3%) | 0 (0.0%) |
| 3 or 4 Children | 0 (0.0%) | 38 (79.2%) |
| 5 or more Children | 0 (0.0%) | 0 (0.0%) |
| Total | 47 (12.1%) | 42 (15.6%) |
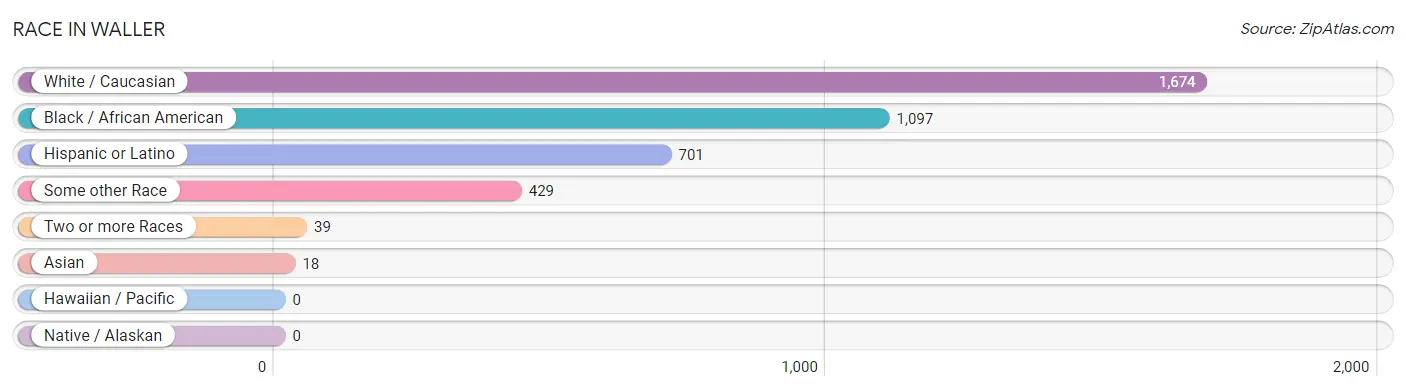
Race in Waller
The most populous races in Waller are White / Caucasian (1,674 | 51.4%), Black / African American (1,097 | 33.7%), and Hispanic or Latino (701 | 21.5%).
| Race | # Population | % Population |
| Asian | 18 | 0.5% |
| Black / African American | 1,097 | 33.7% |
| Hawaiian / Pacific | 0 | 0.0% |
| Hispanic or Latino | 701 | 21.5% |
| Native / Alaskan | 0 | 0.0% |
| White / Caucasian | 1,674 | 51.4% |
| Two or more Races | 39 | 1.2% |
| Some other Race | 429 | 13.2% |
| Total | 3,257 | 100.0% |
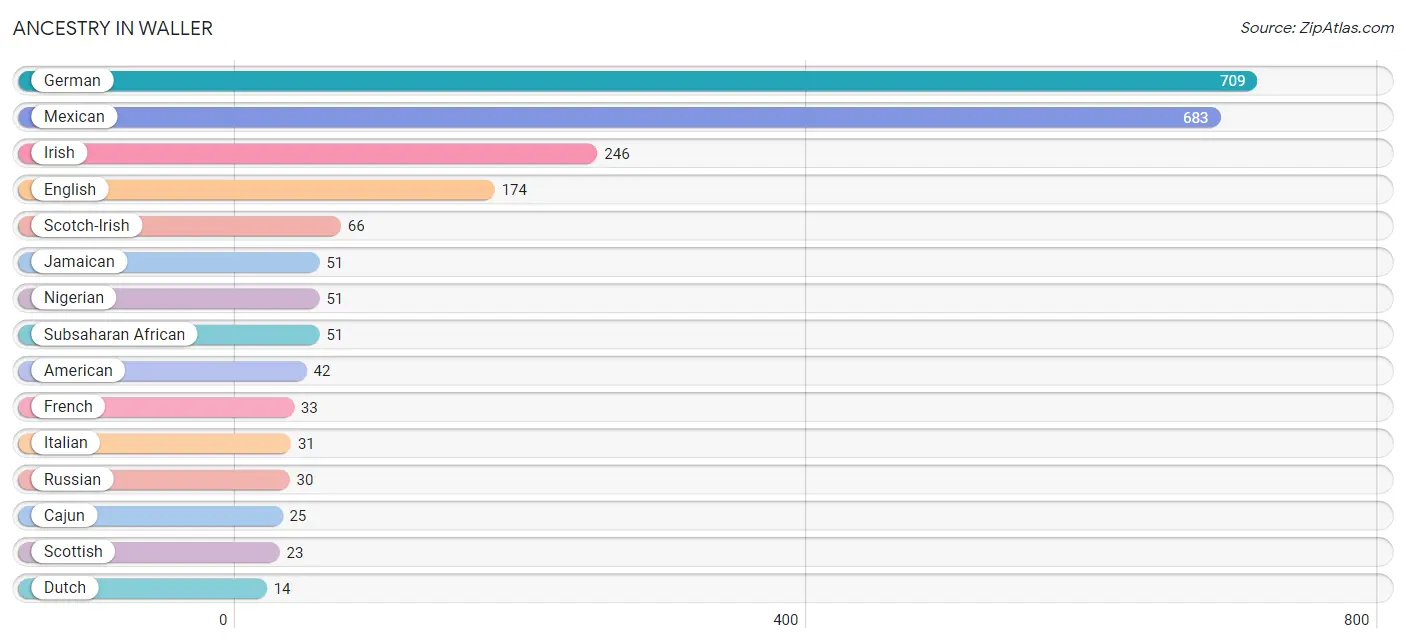
Ancestry in Waller
The most populous ancestries reported in Waller are German (709 | 21.8%), Mexican (683 | 21.0%), Irish (246 | 7.5%), English (174 | 5.3%), and Scotch-Irish (66 | 2.0%), together accounting for 57.7% of all Waller residents.
| Ancestry | # Population | % Population |
| American | 42 | 1.3% |
| British | 6 | 0.2% |
| Cajun | 25 | 0.8% |
| Chilean | 4 | 0.1% |
| Czech | 8 | 0.3% |
| Dutch | 14 | 0.4% |
| English | 174 | 5.3% |
| European | 6 | 0.2% |
| French | 33 | 1.0% |
| German | 709 | 21.8% |
| Irish | 246 | 7.5% |
| Italian | 31 | 0.9% |
| Jamaican | 51 | 1.6% |
| Mexican | 683 | 21.0% |
| Nigerian | 51 | 1.6% |
| Portuguese | 11 | 0.3% |
| Puerto Rican | 14 | 0.4% |
| Russian | 30 | 0.9% |
| Scotch-Irish | 66 | 2.0% |
| Scottish | 23 | 0.7% |
| South American | 4 | 0.1% |
| Subsaharan African | 51 | 1.6% | View All 22 Rows |
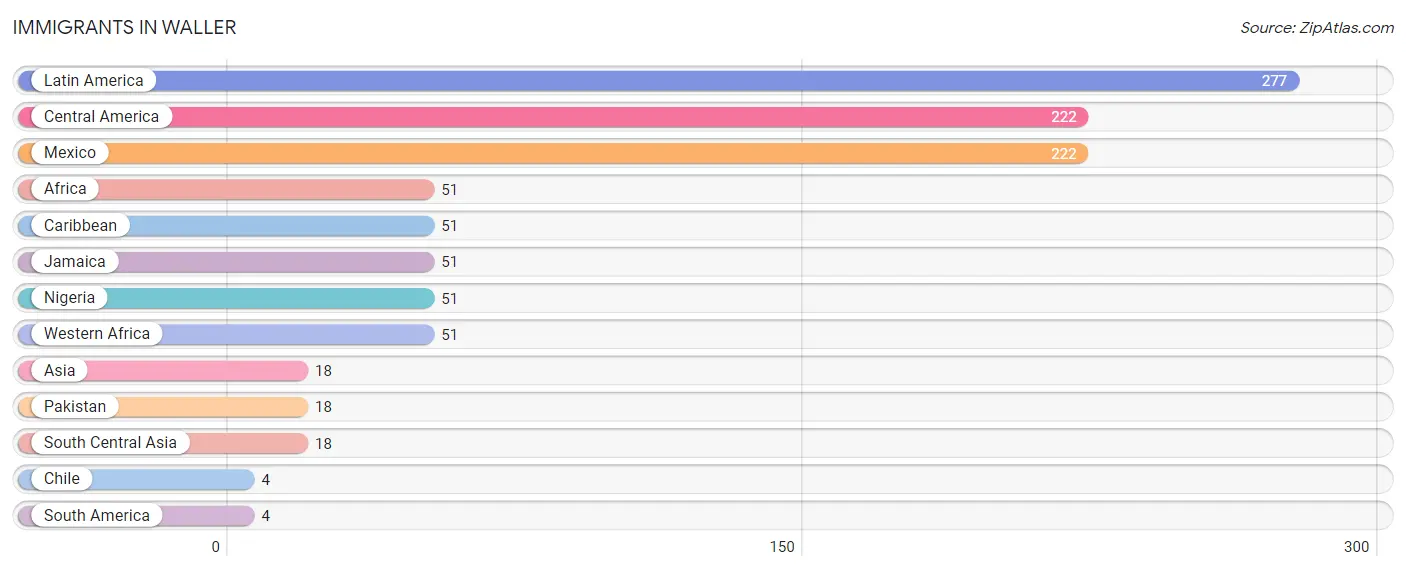
Immigrants in Waller
The most numerous immigrant groups reported in Waller came from Latin America (277 | 8.5%), Central America (222 | 6.8%), Mexico (222 | 6.8%), Africa (51 | 1.6%), and Caribbean (51 | 1.6%), together accounting for 25.3% of all Waller residents.
| Immigration Origin | # Population | % Population |
| Africa | 51 | 1.6% |
| Asia | 18 | 0.5% |
| Caribbean | 51 | 1.6% |
| Central America | 222 | 6.8% |
| Chile | 4 | 0.1% |
| Jamaica | 51 | 1.6% |
| Latin America | 277 | 8.5% |
| Mexico | 222 | 6.8% |
| Nigeria | 51 | 1.6% |
| Pakistan | 18 | 0.5% |
| South America | 4 | 0.1% |
| South Central Asia | 18 | 0.5% |
| Western Africa | 51 | 1.6% | View All 13 Rows |
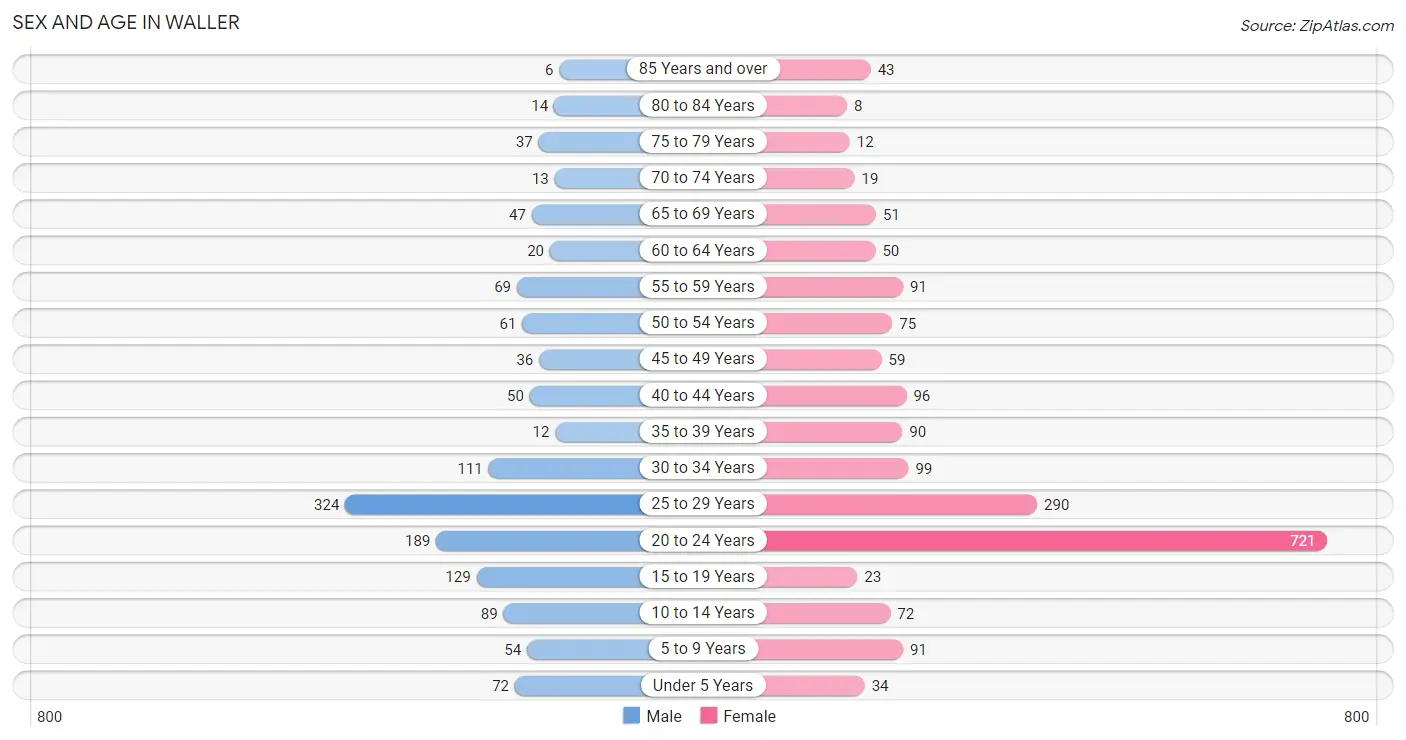
Sex and Age in Waller
Sex and Age in Waller
The most populous age groups in Waller are 25 to 29 Years (324 | 24.3%) for men and 20 to 24 Years (721 | 37.5%) for women.
| Age Bracket | Male | Female |
| Under 5 Years | 72 (5.4%) | 34 (1.8%) |
| 5 to 9 Years | 54 (4.1%) | 91 (4.7%) |
| 10 to 14 Years | 89 (6.7%) | 72 (3.7%) |
| 15 to 19 Years | 129 (9.7%) | 23 (1.2%) |
| 20 to 24 Years | 189 (14.2%) | 721 (37.5%) |
| 25 to 29 Years | 324 (24.3%) | 290 (15.1%) |
| 30 to 34 Years | 111 (8.3%) | 99 (5.1%) |
| 35 to 39 Years | 12 (0.9%) | 90 (4.7%) |
| 40 to 44 Years | 50 (3.7%) | 96 (5.0%) |
| 45 to 49 Years | 36 (2.7%) | 59 (3.1%) |
| 50 to 54 Years | 61 (4.6%) | 75 (3.9%) |
| 55 to 59 Years | 69 (5.2%) | 91 (4.7%) |
| 60 to 64 Years | 20 (1.5%) | 50 (2.6%) |
| 65 to 69 Years | 47 (3.5%) | 51 (2.6%) |
| 70 to 74 Years | 13 (1.0%) | 19 (1.0%) |
| 75 to 79 Years | 37 (2.8%) | 12 (0.6%) |
| 80 to 84 Years | 14 (1.1%) | 8 (0.4%) |
| 85 Years and over | 6 (0.4%) | 43 (2.2%) |
| Total | 1,333 (100.0%) | 1,924 (100.0%) |
Families and Households in Waller
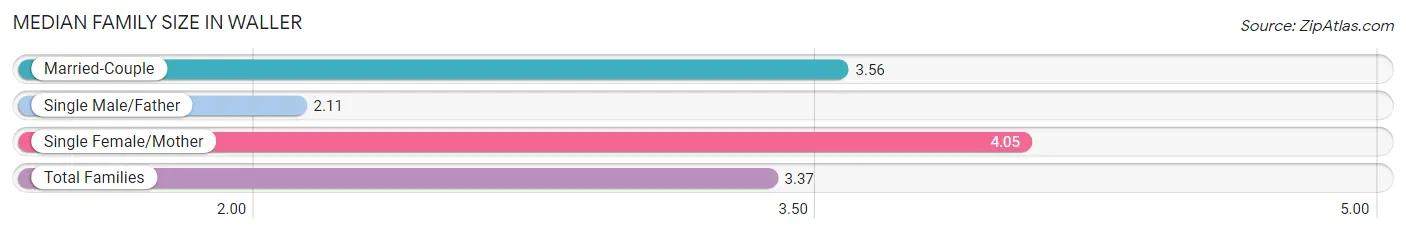
Median Family Size in Waller
The median family size in Waller is 3.37 persons per family, with single female/mother families (137 | 20.8%) accounting for the largest median family size of 4.05 persons per family. On the other hand, single male/father families (133 | 20.2%) represent the smallest median family size with 2.11 persons per family.
| Family Type | # Families | Family Size |
| Married-Couple | 388 (59.0%) | 3.56 |
| Single Male/Father | 133 (20.2%) | 2.11 |
| Single Female/Mother | 137 (20.8%) | 4.05 |
| Total Families | 658 (100.0%) | 3.37 |
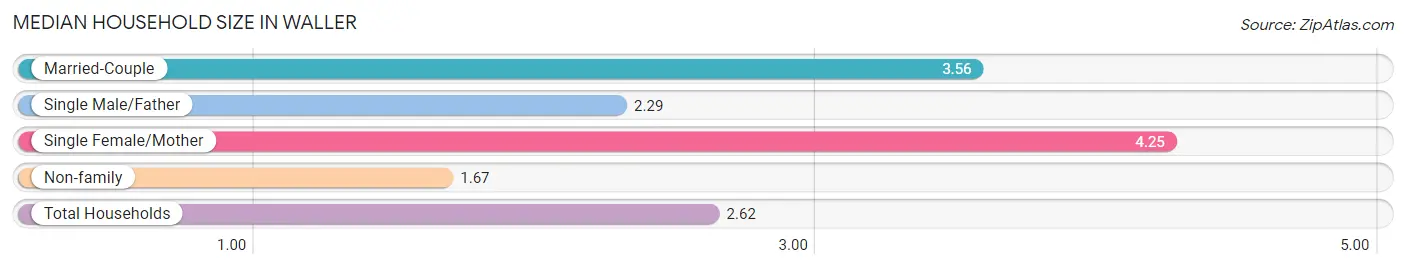
Median Household Size in Waller
The median household size in Waller is 2.62 persons per household, with single female/mother households (137 | 11.1%) accounting for the largest median household size of 4.25 persons per household. non-family households (581 | 46.9%) represent the smallest median household size with 1.67 persons per household.
| Household Type | # Households | Household Size |
| Married-Couple | 388 (31.3%) | 3.56 |
| Single Male/Father | 133 (10.7%) | 2.29 |
| Single Female/Mother | 137 (11.1%) | 4.25 |
| Non-family | 581 (46.9%) | 1.67 |
| Total Households | 1,239 (100.0%) | 2.62 |
Household Size by Marriage Status in Waller
Out of a total of 1,239 households in Waller, 658 (53.1%) are family households, while 581 (46.9%) are nonfamily households. The most numerous type of family households are 2-person households, comprising 299, and the most common type of nonfamily households are 2-person households, comprising 367.
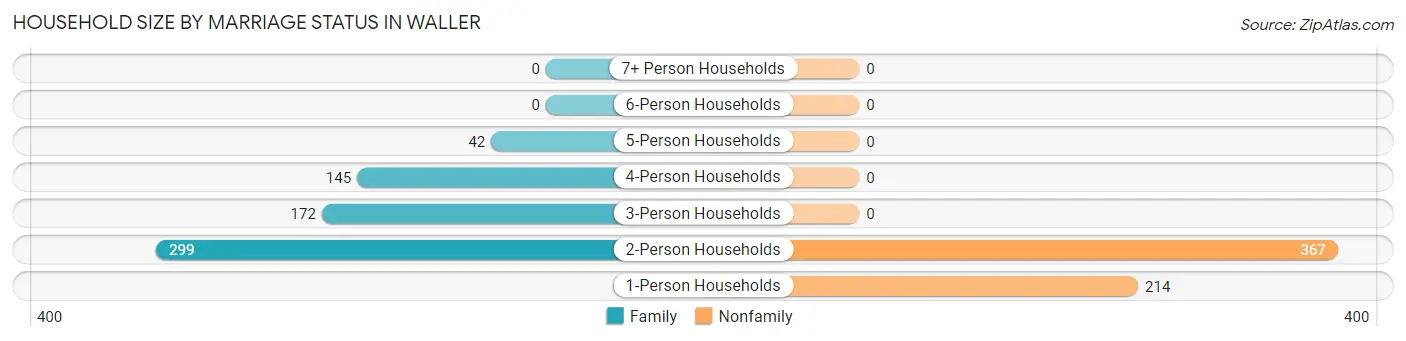
| Household Size | Family Households | Nonfamily Households |
| 1-Person Households | - | 214 (17.3%) |
| 2-Person Households | 299 (24.1%) | 367 (29.6%) |
| 3-Person Households | 172 (13.9%) | 0 (0.0%) |
| 4-Person Households | 145 (11.7%) | 0 (0.0%) |
| 5-Person Households | 42 (3.4%) | 0 (0.0%) |
| 6-Person Households | 0 (0.0%) | 0 (0.0%) |
| 7+ Person Households | 0 (0.0%) | 0 (0.0%) |
| Total | 658 (53.1%) | 581 (46.9%) |
Female Fertility in Waller
Fertility by Age in Waller
| Age Bracket | Women with Births | Births / 1,000 Women |
| 15 to 19 years | 0 (0.0%) | 0.0 |
| 20 to 34 years | 0 (0.0%) | 0.0 |
| 35 to 50 years | 0 (0.0%) | 0.0 |
| Total | 0 (0.0%) | 0.0 |
Fertility by Age by Marriage Status in Waller
| Age Bracket | Married | Unmarried |
| 15 to 19 years | 0 (0.0%) | 0 (0.0%) |
| 20 to 34 years | 0 (0.0%) | 0 (0.0%) |
| 35 to 50 years | 0 (0.0%) | 0 (0.0%) |
| Total | 0 (0.0%) | 0 (0.0%) |
Fertility by Education in Waller
| Educational Attainment | Women with Births | Births / 1,000 Women |
| Less than High School | 0 (0.0%) | 0.0 |
| High School Diploma | 0 (0.0%) | 0.0 |
| College or Associate's Degree | 0 (0.0%) | 0.0 |
| Bachelor's Degree | 0 (0.0%) | 0.0 |
| Graduate Degree | 0 (0.0%) | 0.0 |
| Total | 0 (0.0%) | 0.0 |
Fertility by Education by Marriage Status in Waller
| Educational Attainment | Married | Unmarried |
| Less than High School | 0 (0.0%) | 0 (0.0%) |
| High School Diploma | 0 (0.0%) | 0 (0.0%) |
| College or Associate's Degree | 0 (0.0%) | 0 (0.0%) |
| Bachelor's Degree | 0 (0.0%) | 0 (0.0%) |
| Graduate Degree | 0 (0.0%) | 0 (0.0%) |
| Total | 0 (0.0%) | 0 (0.0%) |
Employment Characteristics in Waller
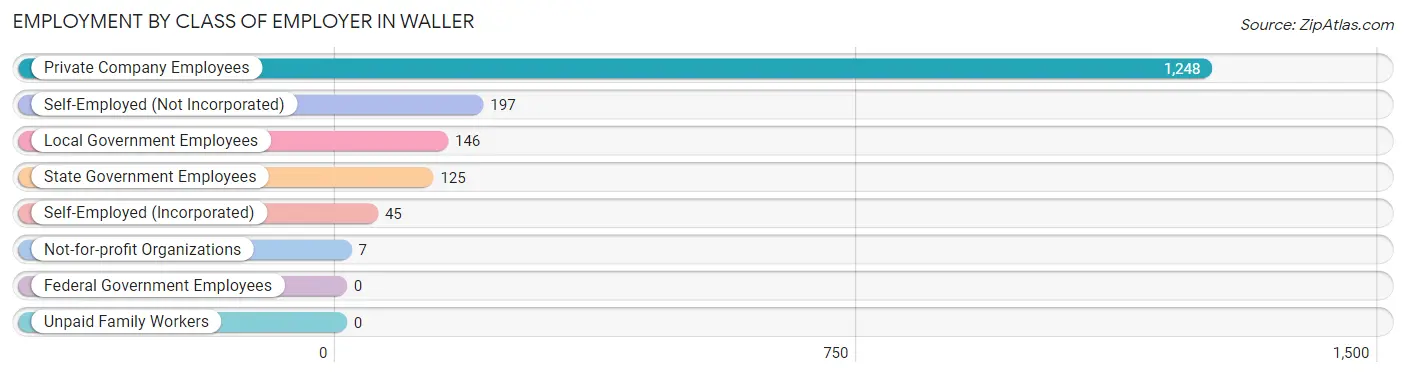
Employment by Class of Employer in Waller
Among the 1,768 employed individuals in Waller, private company employees (1,248 | 70.6%), self-employed (not incorporated) (197 | 11.1%), and local government employees (146 | 8.3%) make up the most common classes of employment.
| Employer Class | # Employees | % Employees |
| Private Company Employees | 1,248 | 70.6% |
| Self-Employed (Incorporated) | 45 | 2.5% |
| Self-Employed (Not Incorporated) | 197 | 11.1% |
| Not-for-profit Organizations | 7 | 0.4% |
| Local Government Employees | 146 | 8.3% |
| State Government Employees | 125 | 7.1% |
| Federal Government Employees | 0 | 0.0% |
| Unpaid Family Workers | 0 | 0.0% |
| Total | 1,768 | 100.0% |
Employment Status by Age in Waller
According to the labor force statistics for Waller, out of the total population over 16 years of age (2,824), 65.0% or 1,836 individuals are in the labor force, with 2.0% or 37 of them unemployed. The age group with the highest labor force participation rate is 45 to 54 years, with 94.8% or 219 individuals in the labor force. Within the labor force, the 65 to 74 years age range has the highest percentage of unemployed individuals, with 8.3% or 4 of them being unemployed.
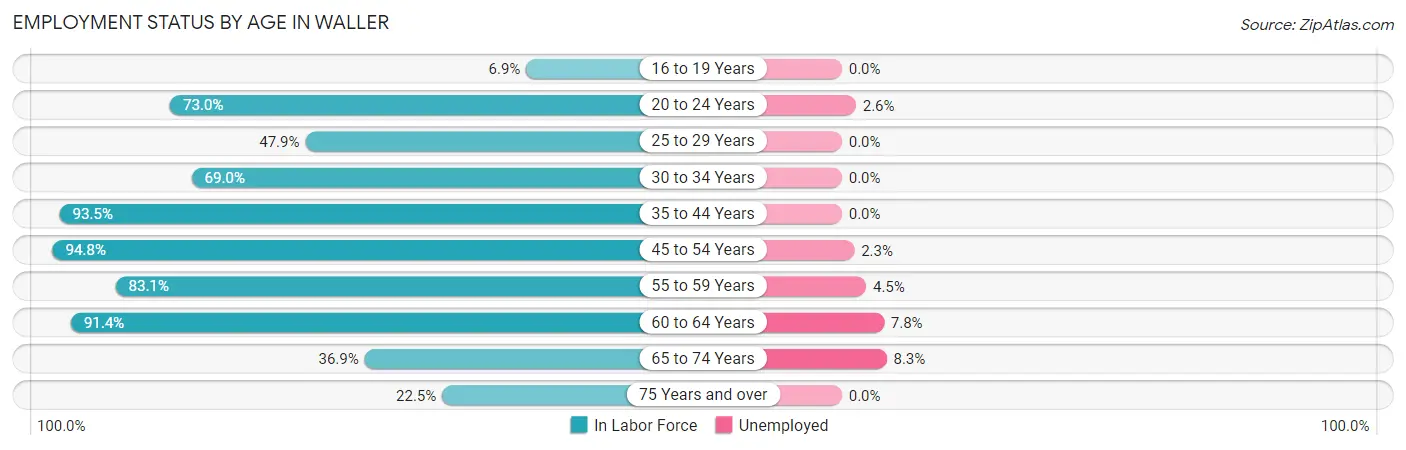
| Age Bracket | In Labor Force | Unemployed |
| 16 to 19 Years | 9 (6.9%) | 0 (0.0%) |
| 20 to 24 Years | 664 (73.0%) | 17 (2.6%) |
| 25 to 29 Years | 294 (47.9%) | 0 (0.0%) |
| 30 to 34 Years | 145 (69.0%) | 0 (0.0%) |
| 35 to 44 Years | 232 (93.5%) | 0 (0.0%) |
| 45 to 54 Years | 219 (94.8%) | 5 (2.3%) |
| 55 to 59 Years | 133 (83.1%) | 6 (4.5%) |
| 60 to 64 Years | 64 (91.4%) | 5 (7.8%) |
| 65 to 74 Years | 48 (36.9%) | 4 (8.3%) |
| 75 Years and over | 27 (22.5%) | 0 (0.0%) |
| Total | 1,836 (65.0%) | 37 (2.0%) |
Employment Status by Educational Attainment in Waller
According to labor force statistics for Waller, 70.9% of individuals (1,087) out of the total population between 25 and 64 years of age (1,533) are in the labor force, with 1.5% or 16 of them being unemployed. The group with the highest labor force participation rate are those with the educational attainment of bachelor's degree or higher, with 94.8% or 109 individuals in the labor force. Within the labor force, individuals with high school diploma education have the highest percentage of unemployment, with 2.7% or 11 of them being unemployed.
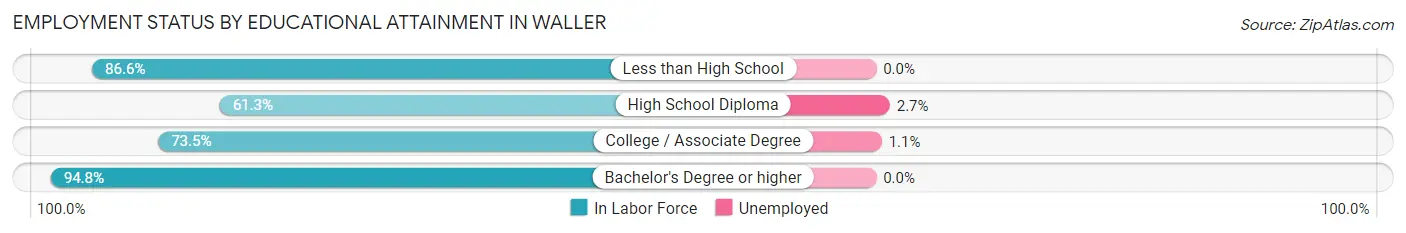
| Educational Attainment | In Labor Force | Unemployed |
| Less than High School | 116 (86.6%) | 0 (0.0%) |
| High School Diploma | 411 (61.3%) | 18 (2.7%) |
| College / Associate Degree | 451 (73.5%) | 7 (1.1%) |
| Bachelor's Degree or higher | 109 (94.8%) | 0 (0.0%) |
| Total | 1,087 (70.9%) | 23 (1.5%) |
Employment Occupations by Sex in Waller
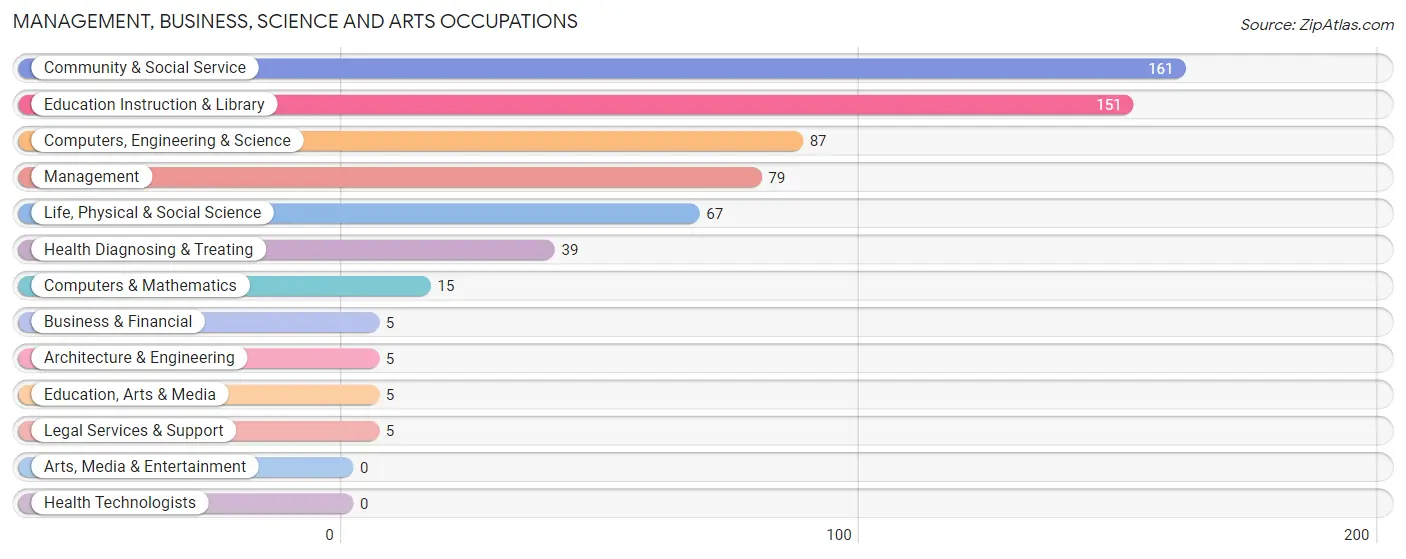
Management, Business, Science and Arts Occupations
The most common Management, Business, Science and Arts occupations in Waller are Community & Social Service (161 | 8.9%), Education Instruction & Library (151 | 8.4%), Computers, Engineering & Science (87 | 4.8%), Management (79 | 4.4%), and Life, Physical & Social Science (67 | 3.7%).
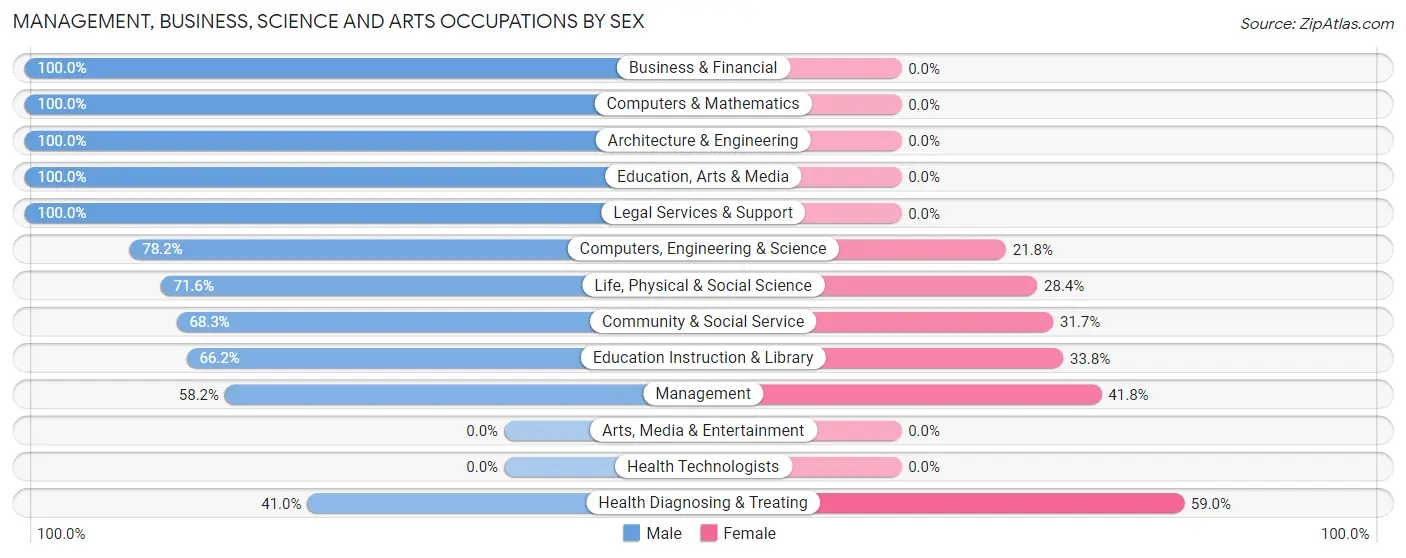
Management, Business, Science and Arts Occupations by Sex
Within the Management, Business, Science and Arts occupations in Waller, the most male-oriented occupations are Business & Financial (100.0%), Computers & Mathematics (100.0%), and Architecture & Engineering (100.0%), while the most female-oriented occupations are Health Diagnosing & Treating (59.0%), Management (41.8%), and Education Instruction & Library (33.8%).
| Occupation | Male | Female |
| Management | 46 (58.2%) | 33 (41.8%) |
| Business & Financial | 5 (100.0%) | 0 (0.0%) |
| Computers, Engineering & Science | 68 (78.2%) | 19 (21.8%) |
| Computers & Mathematics | 15 (100.0%) | 0 (0.0%) |
| Architecture & Engineering | 5 (100.0%) | 0 (0.0%) |
| Life, Physical & Social Science | 48 (71.6%) | 19 (28.4%) |
| Community & Social Service | 110 (68.3%) | 51 (31.7%) |
| Education, Arts & Media | 5 (100.0%) | 0 (0.0%) |
| Legal Services & Support | 5 (100.0%) | 0 (0.0%) |
| Education Instruction & Library | 100 (66.2%) | 51 (33.8%) |
| Arts, Media & Entertainment | 0 (0.0%) | 0 (0.0%) |
| Health Diagnosing & Treating | 16 (41.0%) | 23 (59.0%) |
| Health Technologists | 0 (0.0%) | 0 (0.0%) |
| Total (Category) | 245 (66.0%) | 126 (34.0%) |
| Total (Overall) | 793 (44.1%) | 1,005 (55.9%) |
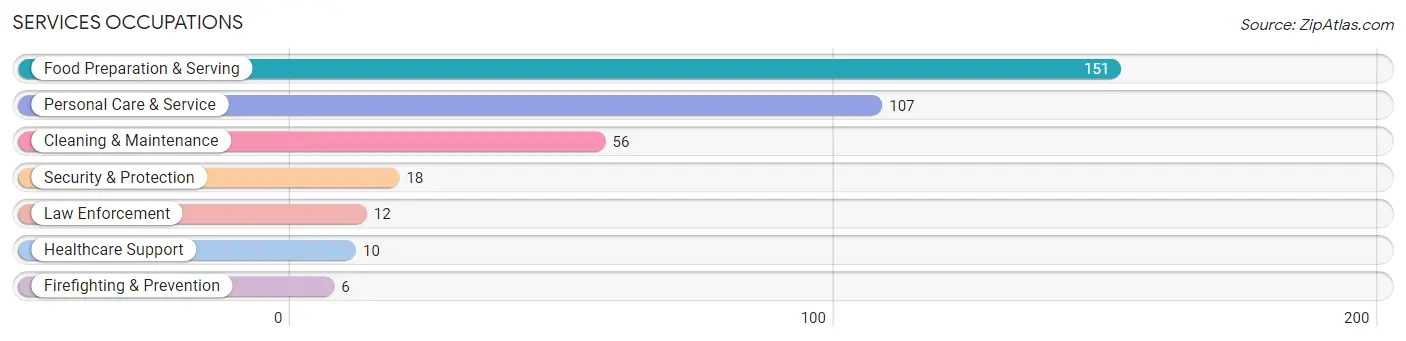
Services Occupations
The most common Services occupations in Waller are Food Preparation & Serving (151 | 8.4%), Personal Care & Service (107 | 5.9%), Cleaning & Maintenance (56 | 3.1%), Security & Protection (18 | 1.0%), and Law Enforcement (12 | 0.7%).
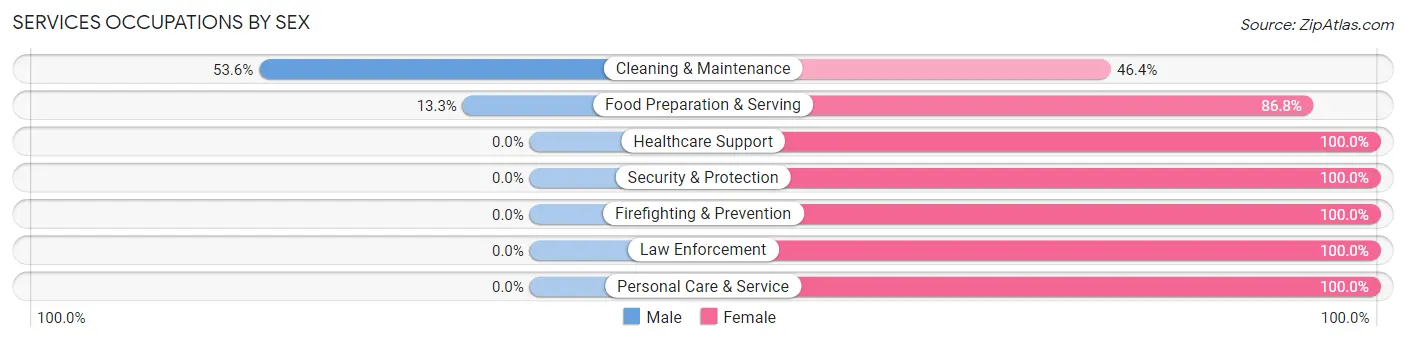
Services Occupations by Sex
Within the Services occupations in Waller, the most male-oriented occupations are Cleaning & Maintenance (53.6%), and Food Preparation & Serving (13.3%), while the most female-oriented occupations are Healthcare Support (100.0%), Security & Protection (100.0%), and Firefighting & Prevention (100.0%).
| Occupation | Male | Female |
| Healthcare Support | 0 (0.0%) | 10 (100.0%) |
| Security & Protection | 0 (0.0%) | 18 (100.0%) |
| Firefighting & Prevention | 0 (0.0%) | 6 (100.0%) |
| Law Enforcement | 0 (0.0%) | 12 (100.0%) |
| Food Preparation & Serving | 20 (13.3%) | 131 (86.8%) |
| Cleaning & Maintenance | 30 (53.6%) | 26 (46.4%) |
| Personal Care & Service | 0 (0.0%) | 107 (100.0%) |
| Total (Category) | 50 (14.6%) | 292 (85.4%) |
| Total (Overall) | 793 (44.1%) | 1,005 (55.9%) |
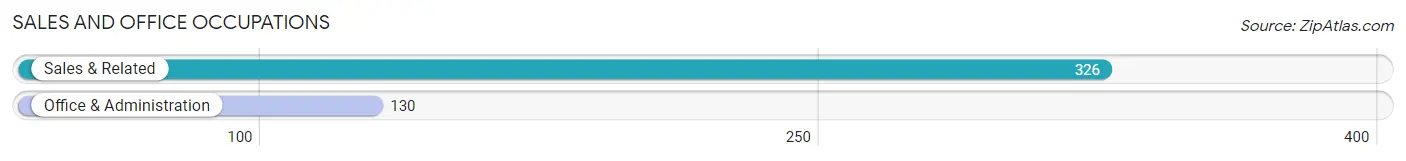
Sales and Office Occupations
The most common Sales and Office occupations in Waller are Sales & Related (326 | 18.1%), and Office & Administration (130 | 7.2%).
Sales and Office Occupations by Sex
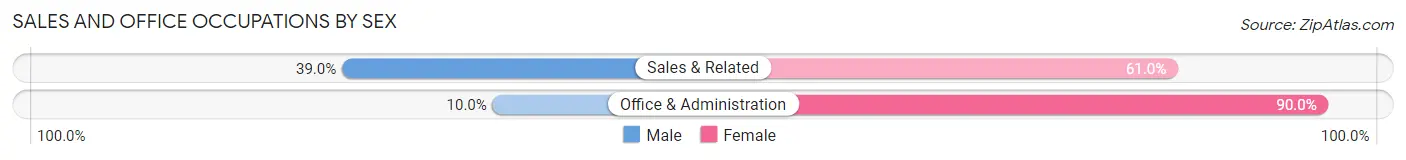
| Occupation | Male | Female |
| Sales & Related | 127 (39.0%) | 199 (61.0%) |
| Office & Administration | 13 (10.0%) | 117 (90.0%) |
| Total (Category) | 140 (30.7%) | 316 (69.3%) |
| Total (Overall) | 793 (44.1%) | 1,005 (55.9%) |
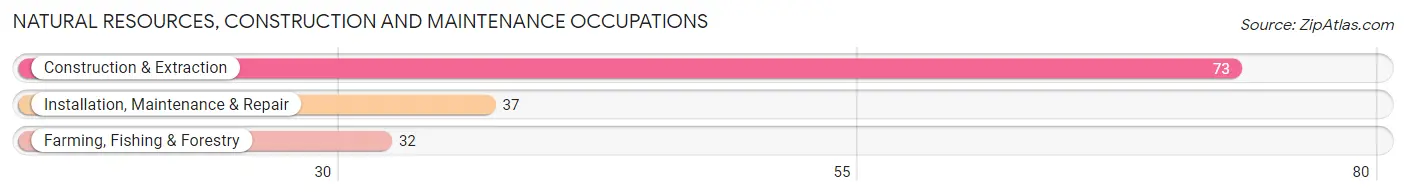
Natural Resources, Construction and Maintenance Occupations
The most common Natural Resources, Construction and Maintenance occupations in Waller are Construction & Extraction (73 | 4.1%), Installation, Maintenance & Repair (37 | 2.1%), and Farming, Fishing & Forestry (32 | 1.8%).
Natural Resources, Construction and Maintenance Occupations by Sex
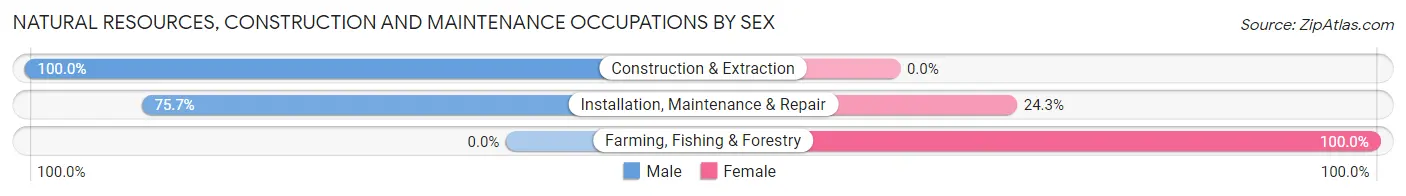
| Occupation | Male | Female |
| Farming, Fishing & Forestry | 0 (0.0%) | 32 (100.0%) |
| Construction & Extraction | 73 (100.0%) | 0 (0.0%) |
| Installation, Maintenance & Repair | 28 (75.7%) | 9 (24.3%) |
| Total (Category) | 101 (71.1%) | 41 (28.9%) |
| Total (Overall) | 793 (44.1%) | 1,005 (55.9%) |
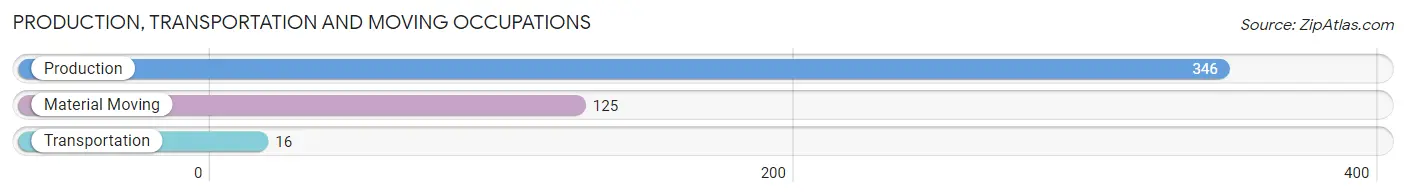
Production, Transportation and Moving Occupations
The most common Production, Transportation and Moving occupations in Waller are Production (346 | 19.2%), Material Moving (125 | 7.0%), and Transportation (16 | 0.9%).
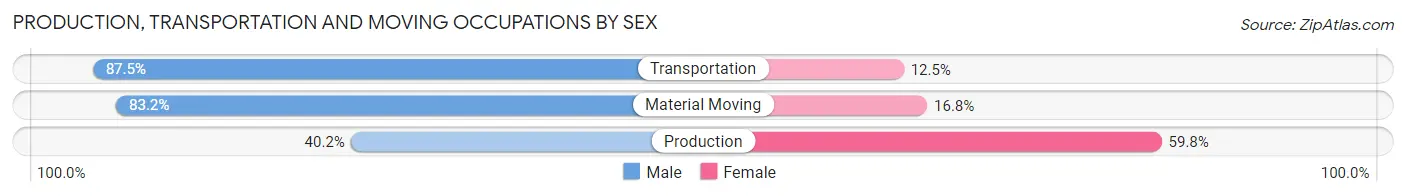
Production, Transportation and Moving Occupations by Sex
| Occupation | Male | Female |
| Production | 139 (40.2%) | 207 (59.8%) |
| Transportation | 14 (87.5%) | 2 (12.5%) |
| Material Moving | 104 (83.2%) | 21 (16.8%) |
| Total (Category) | 257 (52.8%) | 230 (47.2%) |
| Total (Overall) | 793 (44.1%) | 1,005 (55.9%) |
Employment Industries by Sex in Waller
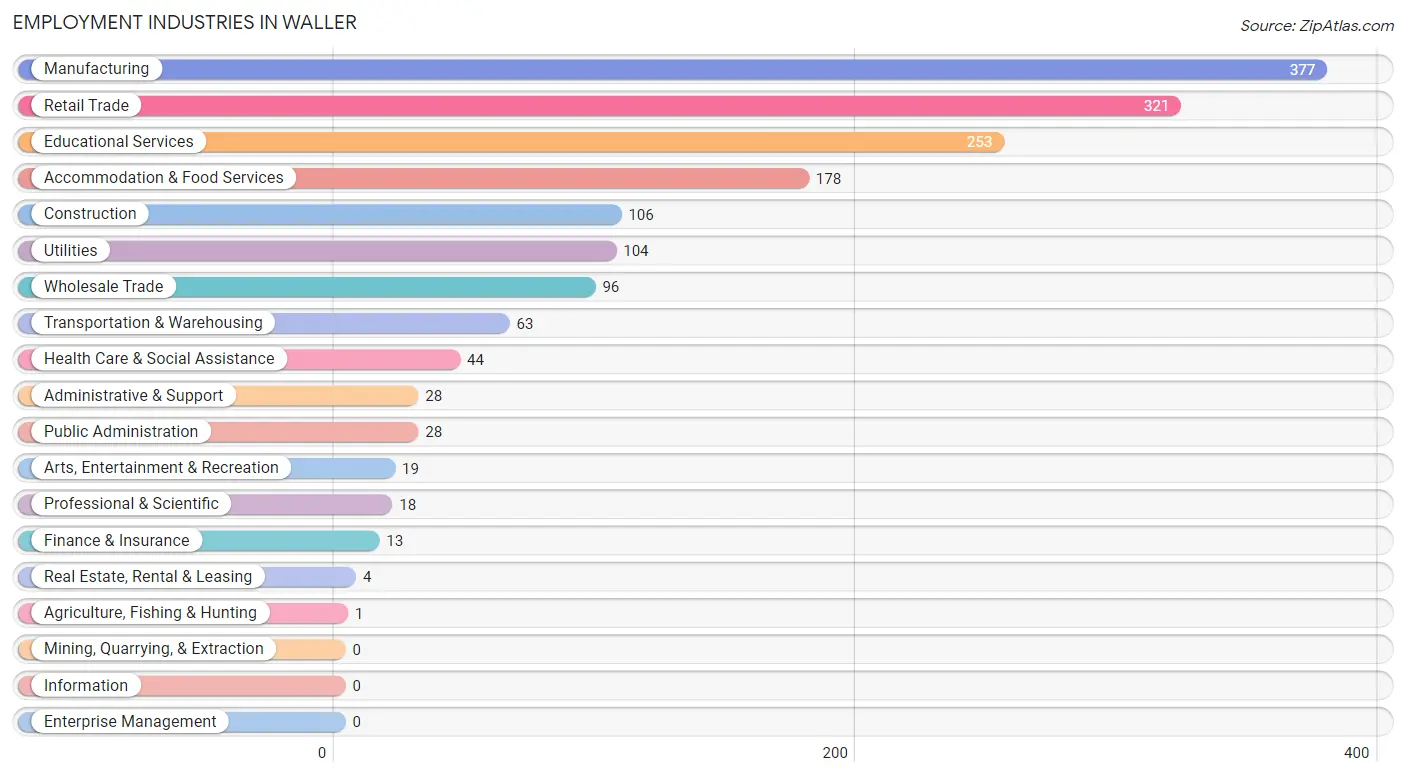
Employment Industries in Waller
The major employment industries in Waller include Manufacturing (377 | 21.0%), Retail Trade (321 | 17.8%), Educational Services (253 | 14.1%), Accommodation & Food Services (178 | 9.9%), and Construction (106 | 5.9%).
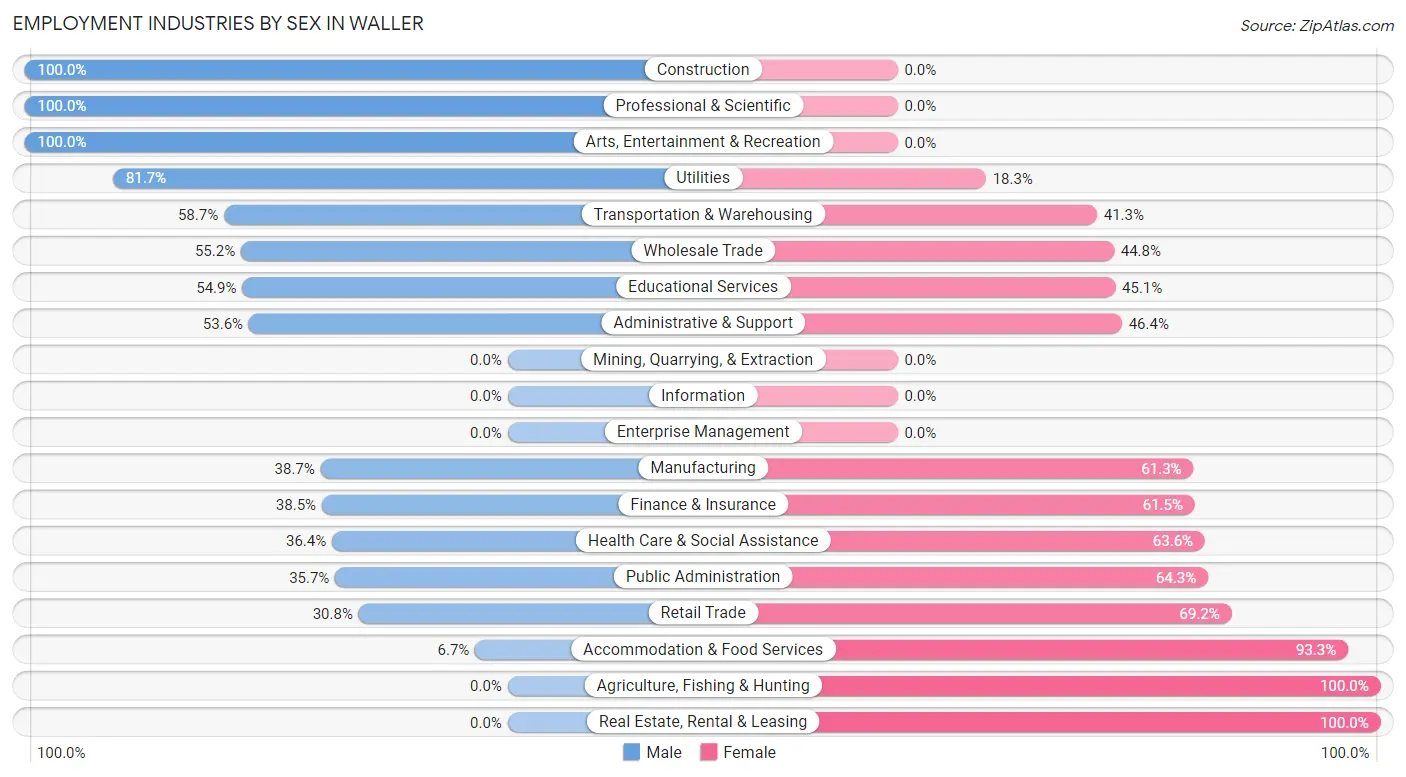
Employment Industries by Sex in Waller
The Waller industries that see more men than women are Construction (100.0%), Professional & Scientific (100.0%), and Arts, Entertainment & Recreation (100.0%), whereas the industries that tend to have a higher number of women are Agriculture, Fishing & Hunting (100.0%), Real Estate, Rental & Leasing (100.0%), and Accommodation & Food Services (93.3%).
| Industry | Male | Female |
| Agriculture, Fishing & Hunting | 0 (0.0%) | 1 (100.0%) |
| Mining, Quarrying, & Extraction | 0 (0.0%) | 0 (0.0%) |
| Construction | 106 (100.0%) | 0 (0.0%) |
| Manufacturing | 146 (38.7%) | 231 (61.3%) |
| Wholesale Trade | 53 (55.2%) | 43 (44.8%) |
| Retail Trade | 99 (30.8%) | 222 (69.2%) |
| Transportation & Warehousing | 37 (58.7%) | 26 (41.3%) |
| Utilities | 85 (81.7%) | 19 (18.3%) |
| Information | 0 (0.0%) | 0 (0.0%) |
| Finance & Insurance | 5 (38.5%) | 8 (61.5%) |
| Real Estate, Rental & Leasing | 0 (0.0%) | 4 (100.0%) |
| Professional & Scientific | 18 (100.0%) | 0 (0.0%) |
| Enterprise Management | 0 (0.0%) | 0 (0.0%) |
| Administrative & Support | 15 (53.6%) | 13 (46.4%) |
| Educational Services | 139 (54.9%) | 114 (45.1%) |
| Health Care & Social Assistance | 16 (36.4%) | 28 (63.6%) |
| Arts, Entertainment & Recreation | 19 (100.0%) | 0 (0.0%) |
| Accommodation & Food Services | 12 (6.7%) | 166 (93.3%) |
| Public Administration | 10 (35.7%) | 18 (64.3%) |
| Total | 793 (44.1%) | 1,005 (55.9%) |
Education in Waller
School Enrollment in Waller
The most common levels of schooling among the 1,171 students in Waller are college / undergraduate (709 | 60.6%), high school (129 | 11.0%), and elementary school (115 | 9.8%).
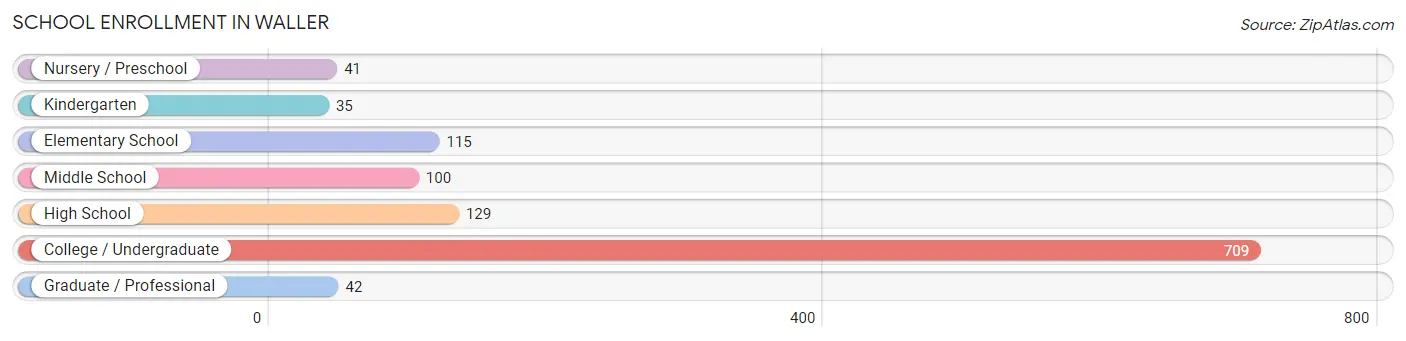
| School Level | # Students | % Students |
| Nursery / Preschool | 41 | 3.5% |
| Kindergarten | 35 | 3.0% |
| Elementary School | 115 | 9.8% |
| Middle School | 100 | 8.5% |
| High School | 129 | 11.0% |
| College / Undergraduate | 709 | 60.6% |
| Graduate / Professional | 42 | 3.6% |
| Total | 1,171 | 100.0% |
School Enrollment by Age by Funding Source in Waller
Out of a total of 1,171 students who are enrolled in schools in Waller, 234 (20.0%) attend a private institution, while the remaining 937 (80.0%) are enrolled in public schools. The age group of 25 to 34 year olds has the highest likelihood of being enrolled in private schools, with 184 (72.2% in the age bracket) enrolled. Conversely, the age group of 15 to 17 year olds has the lowest likelihood of being enrolled in a private school, with 57 (100.0% in the age bracket) attending a public institution.
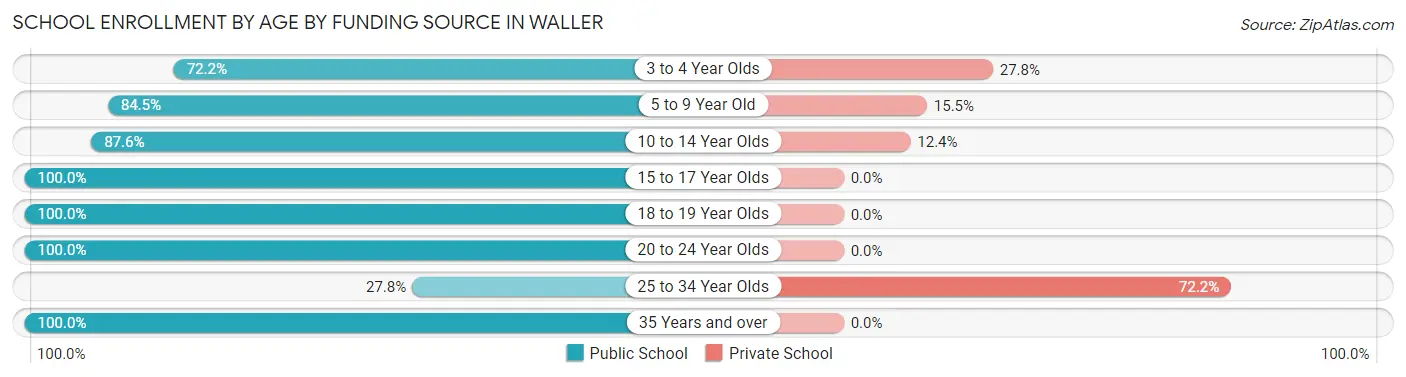
| Age Bracket | Public School | Private School |
| 3 to 4 Year Olds | 26 (72.2%) | 10 (27.8%) |
| 5 to 9 Year Old | 109 (84.5%) | 20 (15.5%) |
| 10 to 14 Year Olds | 141 (87.6%) | 20 (12.4%) |
| 15 to 17 Year Olds | 57 (100.0%) | 0 (0.0%) |
| 18 to 19 Year Olds | 95 (100.0%) | 0 (0.0%) |
| 20 to 24 Year Olds | 420 (100.0%) | 0 (0.0%) |
| 25 to 34 Year Olds | 71 (27.8%) | 184 (72.2%) |
| 35 Years and over | 18 (100.0%) | 0 (0.0%) |
| Total | 937 (80.0%) | 234 (20.0%) |
Educational Attainment by Field of Study in Waller
Business (64 | 31.4%), education (51 | 25.0%), science & technology (21 | 10.3%), bio, nature & agricultural (19 | 9.3%), and multidisciplinary studies (17 | 8.3%) are the most common fields of study among 204 individuals in Waller who have obtained a bachelor's degree or higher.
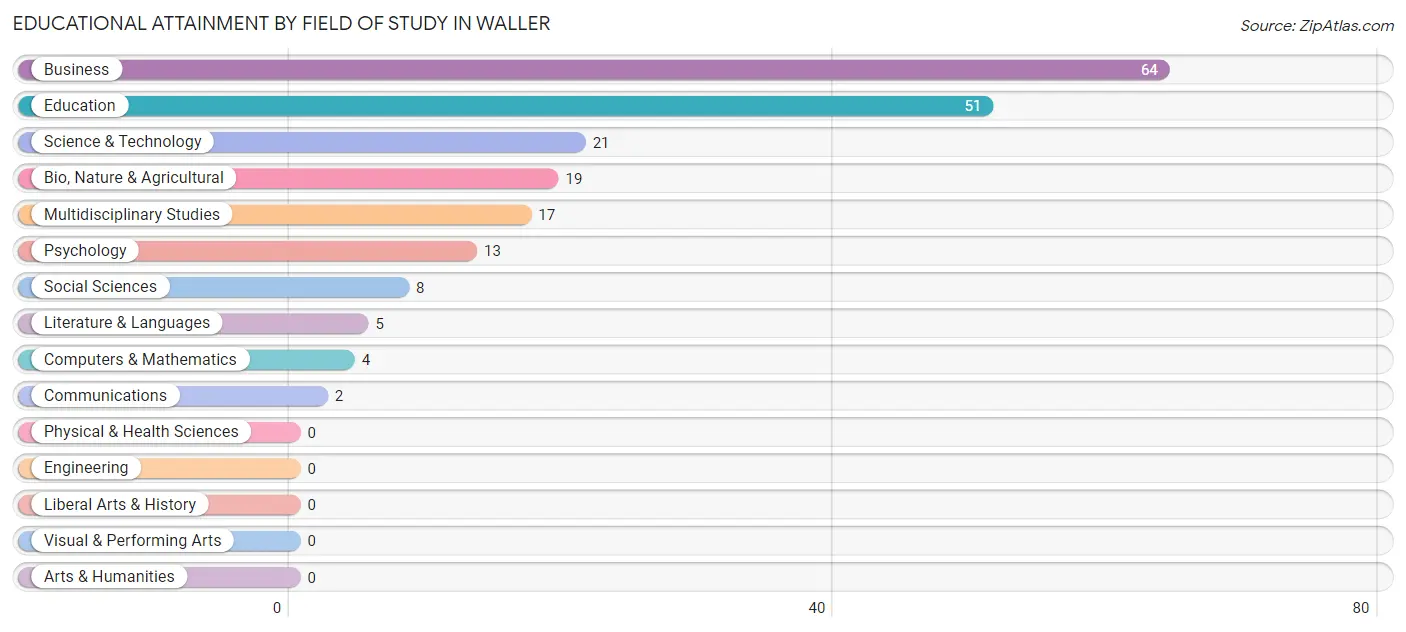
| Field of Study | # Graduates | % Graduates |
| Computers & Mathematics | 4 | 2.0% |
| Bio, Nature & Agricultural | 19 | 9.3% |
| Physical & Health Sciences | 0 | 0.0% |
| Psychology | 13 | 6.4% |
| Social Sciences | 8 | 3.9% |
| Engineering | 0 | 0.0% |
| Multidisciplinary Studies | 17 | 8.3% |
| Science & Technology | 21 | 10.3% |
| Business | 64 | 31.4% |
| Education | 51 | 25.0% |
| Literature & Languages | 5 | 2.5% |
| Liberal Arts & History | 0 | 0.0% |
| Visual & Performing Arts | 0 | 0.0% |
| Communications | 2 | 1.0% |
| Arts & Humanities | 0 | 0.0% |
| Total | 204 | 100.0% |
Transportation & Commute in Waller
Vehicle Availability by Sex in Waller
The most prevalent vehicle ownership categories in Waller are males with 2 vehicles (344, accounting for 43.9%) and females with 2 vehicles (594, making up 34.9%).
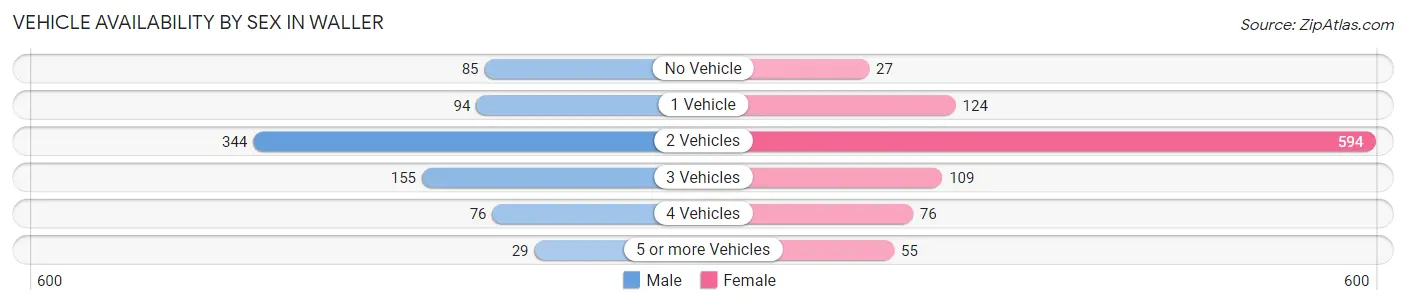
| Vehicles Available | Male | Female |
| No Vehicle | 85 (10.9%) | 27 (2.7%) |
| 1 Vehicle | 94 (12.0%) | 124 (12.6%) |
| 2 Vehicles | 344 (43.9%) | 594 (60.3%) |
| 3 Vehicles | 155 (19.8%) | 109 (11.1%) |
| 4 Vehicles | 76 (9.7%) | 76 (7.7%) |
| 5 or more Vehicles | 29 (3.7%) | 55 (5.6%) |
| Total | 783 (100.0%) | 985 (100.0%) |
Commute Time in Waller
The most frequently occuring commute durations in Waller are 60 to 89 minutes (387 commuters, 22.2%), 20 to 24 minutes (260 commuters, 14.9%), and 10 to 14 minutes (246 commuters, 14.1%).
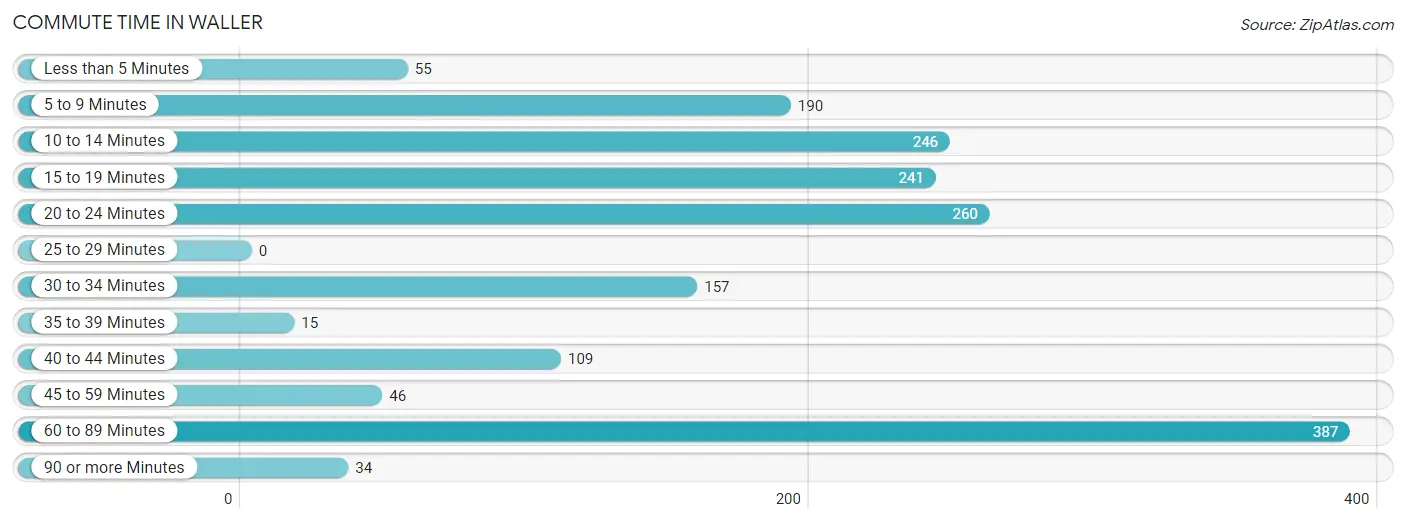
| Commute Time | # Commuters | % Commuters |
| Less than 5 Minutes | 55 | 3.2% |
| 5 to 9 Minutes | 190 | 10.9% |
| 10 to 14 Minutes | 246 | 14.1% |
| 15 to 19 Minutes | 241 | 13.9% |
| 20 to 24 Minutes | 260 | 14.9% |
| 25 to 29 Minutes | 0 | 0.0% |
| 30 to 34 Minutes | 157 | 9.0% |
| 35 to 39 Minutes | 15 | 0.9% |
| 40 to 44 Minutes | 109 | 6.3% |
| 45 to 59 Minutes | 46 | 2.6% |
| 60 to 89 Minutes | 387 | 22.2% |
| 90 or more Minutes | 34 | 1.9% |
Commute Time by Sex in Waller
The most common commute times in Waller are 5 to 9 minutes (141 commuters, 18.6%) for males and 60 to 89 minutes (249 commuters, 25.4%) for females.
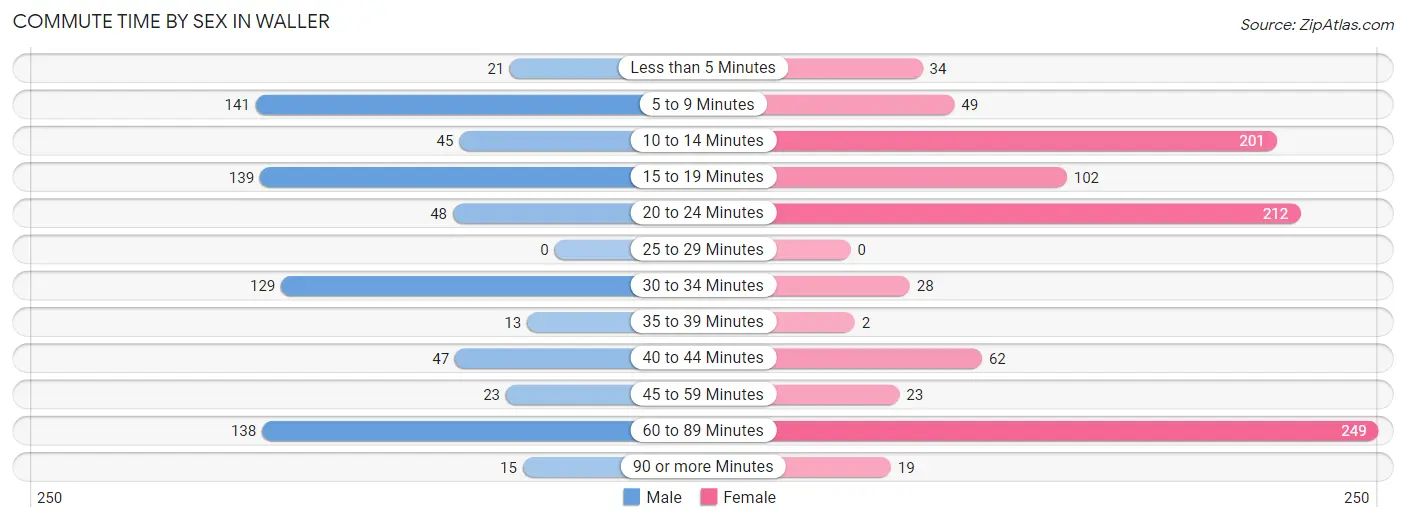
| Commute Time | Male | Female |
| Less than 5 Minutes | 21 (2.8%) | 34 (3.5%) |
| 5 to 9 Minutes | 141 (18.6%) | 49 (5.0%) |
| 10 to 14 Minutes | 45 (5.9%) | 201 (20.5%) |
| 15 to 19 Minutes | 139 (18.3%) | 102 (10.4%) |
| 20 to 24 Minutes | 48 (6.3%) | 212 (21.6%) |
| 25 to 29 Minutes | 0 (0.0%) | 0 (0.0%) |
| 30 to 34 Minutes | 129 (17.0%) | 28 (2.9%) |
| 35 to 39 Minutes | 13 (1.7%) | 2 (0.2%) |
| 40 to 44 Minutes | 47 (6.2%) | 62 (6.3%) |
| 45 to 59 Minutes | 23 (3.0%) | 23 (2.3%) |
| 60 to 89 Minutes | 138 (18.2%) | 249 (25.4%) |
| 90 or more Minutes | 15 (2.0%) | 19 (1.9%) |
Time of Departure to Work by Sex in Waller
The most frequent times of departure to work in Waller are 6:00 AM to 6:29 AM (252, 33.2%) for males and 11:00 AM to 11:59 AM (270, 27.5%) for females.
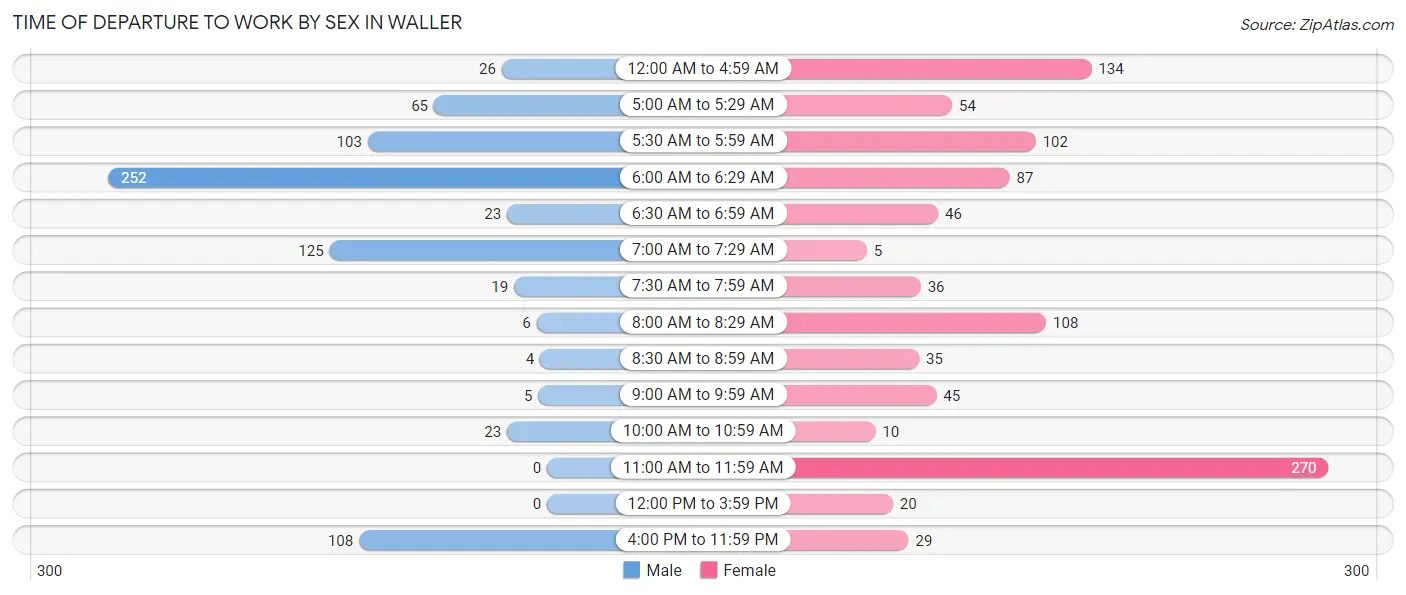
| Time of Departure | Male | Female |
| 12:00 AM to 4:59 AM | 26 (3.4%) | 134 (13.7%) |
| 5:00 AM to 5:29 AM | 65 (8.6%) | 54 (5.5%) |
| 5:30 AM to 5:59 AM | 103 (13.6%) | 102 (10.4%) |
| 6:00 AM to 6:29 AM | 252 (33.2%) | 87 (8.9%) |
| 6:30 AM to 6:59 AM | 23 (3.0%) | 46 (4.7%) |
| 7:00 AM to 7:29 AM | 125 (16.5%) | 5 (0.5%) |
| 7:30 AM to 7:59 AM | 19 (2.5%) | 36 (3.7%) |
| 8:00 AM to 8:29 AM | 6 (0.8%) | 108 (11.0%) |
| 8:30 AM to 8:59 AM | 4 (0.5%) | 35 (3.6%) |
| 9:00 AM to 9:59 AM | 5 (0.7%) | 45 (4.6%) |
| 10:00 AM to 10:59 AM | 23 (3.0%) | 10 (1.0%) |
| 11:00 AM to 11:59 AM | 0 (0.0%) | 270 (27.5%) |
| 12:00 PM to 3:59 PM | 0 (0.0%) | 20 (2.0%) |
| 4:00 PM to 11:59 PM | 108 (14.2%) | 29 (3.0%) |
| Total | 759 (100.0%) | 981 (100.0%) |
Housing Occupancy in Waller
Occupancy by Ownership in Waller
Of the total 1,239 dwellings in Waller, owner-occupied units account for 357 (28.8%), while renter-occupied units make up 882 (71.2%).
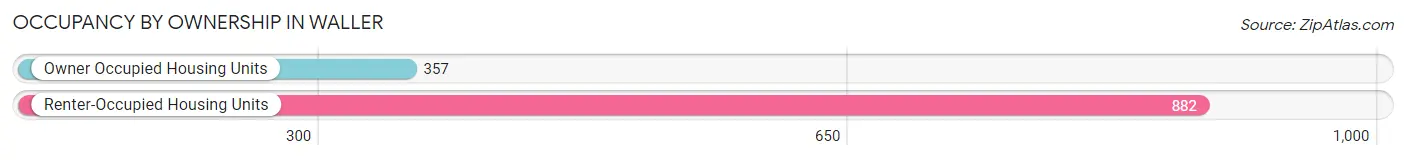
| Occupancy | # Housing Units | % Housing Units |
| Owner Occupied Housing Units | 357 | 28.8% |
| Renter-Occupied Housing Units | 882 | 71.2% |
| Total Occupied Housing Units | 1,239 | 100.0% |
Occupancy by Household Size in Waller
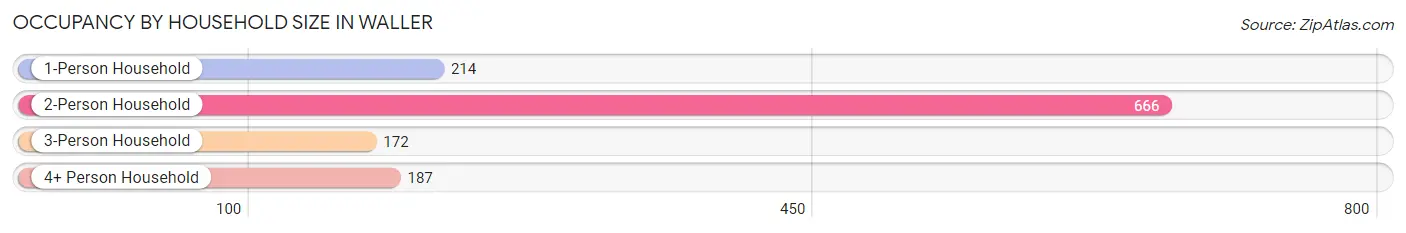
| Household Size | # Housing Units | % Housing Units |
| 1-Person Household | 214 | 17.3% |
| 2-Person Household | 666 | 53.7% |
| 3-Person Household | 172 | 13.9% |
| 4+ Person Household | 187 | 15.1% |
| Total Housing Units | 1,239 | 100.0% |
Occupancy by Ownership by Household Size in Waller
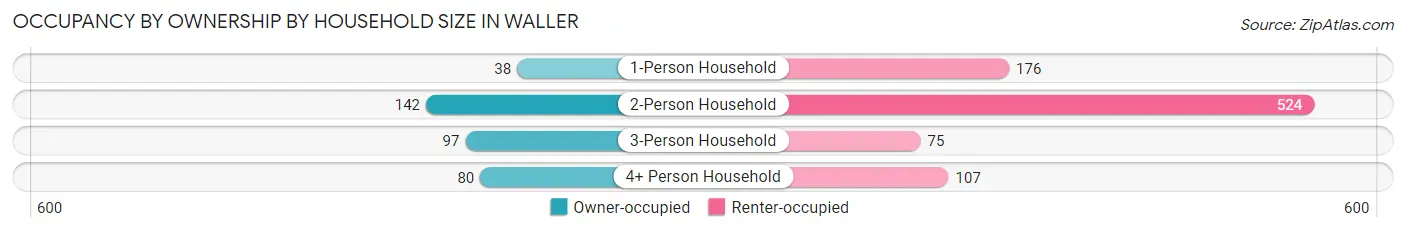
| Household Size | Owner-occupied | Renter-occupied |
| 1-Person Household | 38 (17.8%) | 176 (82.2%) |
| 2-Person Household | 142 (21.3%) | 524 (78.7%) |
| 3-Person Household | 97 (56.4%) | 75 (43.6%) |
| 4+ Person Household | 80 (42.8%) | 107 (57.2%) |
| Total Housing Units | 357 (28.8%) | 882 (71.2%) |
Occupancy by Educational Attainment in Waller
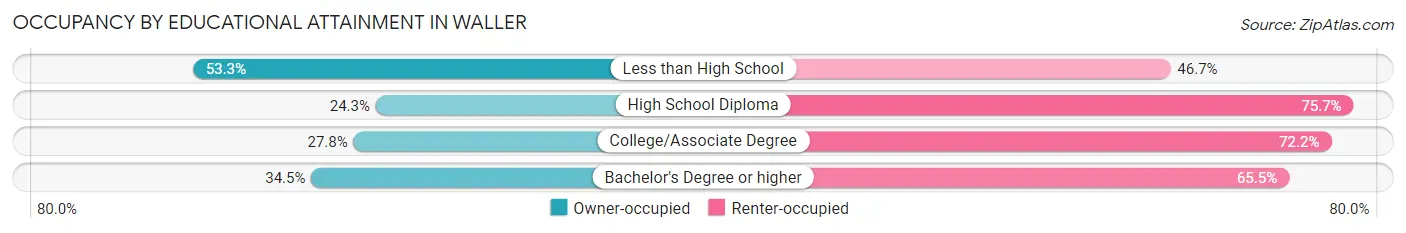
| Household Size | Owner-occupied | Renter-occupied |
| Less than High School | 48 (53.3%) | 42 (46.7%) |
| High School Diploma | 138 (24.3%) | 430 (75.7%) |
| College/Associate Degree | 123 (27.8%) | 319 (72.2%) |
| Bachelor's Degree or higher | 48 (34.5%) | 91 (65.5%) |
Occupancy by Age of Householder in Waller
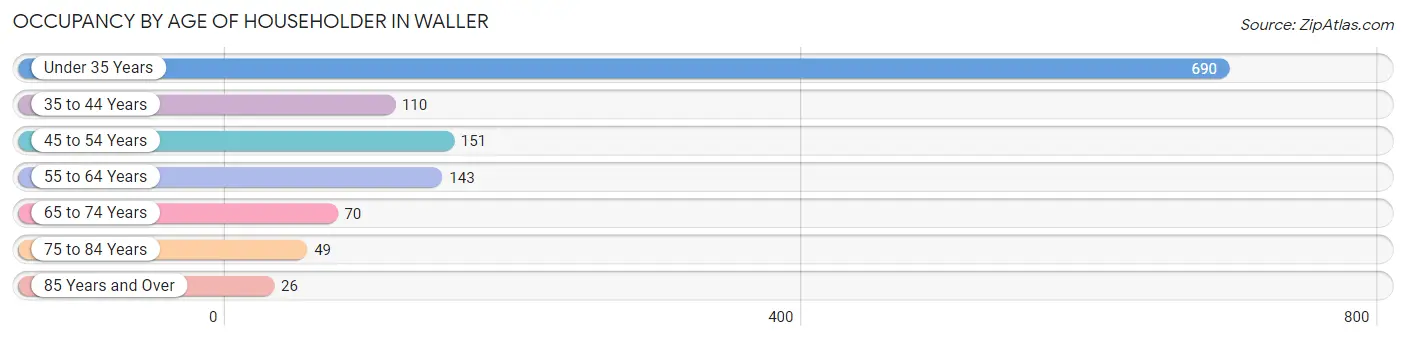
| Age Bracket | # Households | % Households |
| Under 35 Years | 690 | 55.7% |
| 35 to 44 Years | 110 | 8.9% |
| 45 to 54 Years | 151 | 12.2% |
| 55 to 64 Years | 143 | 11.5% |
| 65 to 74 Years | 70 | 5.7% |
| 75 to 84 Years | 49 | 4.0% |
| 85 Years and Over | 26 | 2.1% |
| Total | 1,239 | 100.0% |
Housing Finances in Waller
Median Income by Occupancy in Waller
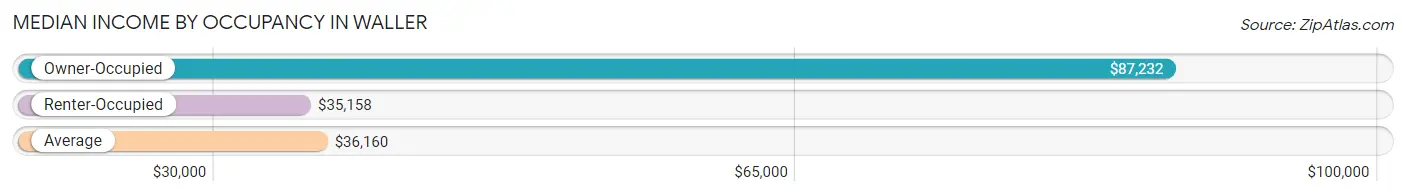
| Occupancy Type | # Households | Median Income |
| Owner-Occupied | 357 (28.8%) | $87,232 |
| Renter-Occupied | 882 (71.2%) | $35,158 |
| Average | 1,239 (100.0%) | $36,160 |
Occupancy by Householder Income Bracket in Waller
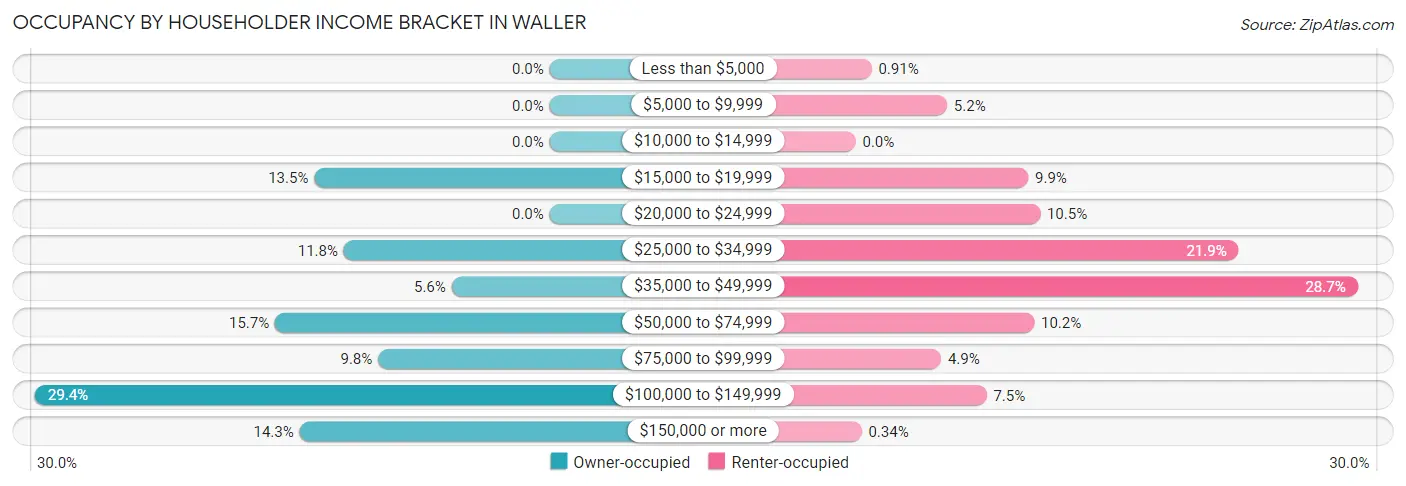
| Income Bracket | Owner-occupied | Renter-occupied |
| Less than $5,000 | 0 (0.0%) | 8 (0.9%) |
| $5,000 to $9,999 | 0 (0.0%) | 46 (5.2%) |
| $10,000 to $14,999 | 0 (0.0%) | 0 (0.0%) |
| $15,000 to $19,999 | 48 (13.5%) | 87 (9.9%) |
| $20,000 to $24,999 | 0 (0.0%) | 93 (10.5%) |
| $25,000 to $34,999 | 42 (11.8%) | 193 (21.9%) |
| $35,000 to $49,999 | 20 (5.6%) | 253 (28.7%) |
| $50,000 to $74,999 | 56 (15.7%) | 90 (10.2%) |
| $75,000 to $99,999 | 35 (9.8%) | 43 (4.9%) |
| $100,000 to $149,999 | 105 (29.4%) | 66 (7.5%) |
| $150,000 or more | 51 (14.3%) | 3 (0.3%) |
| Total | 357 (100.0%) | 882 (100.0%) |
Monthly Housing Cost Tiers in Waller
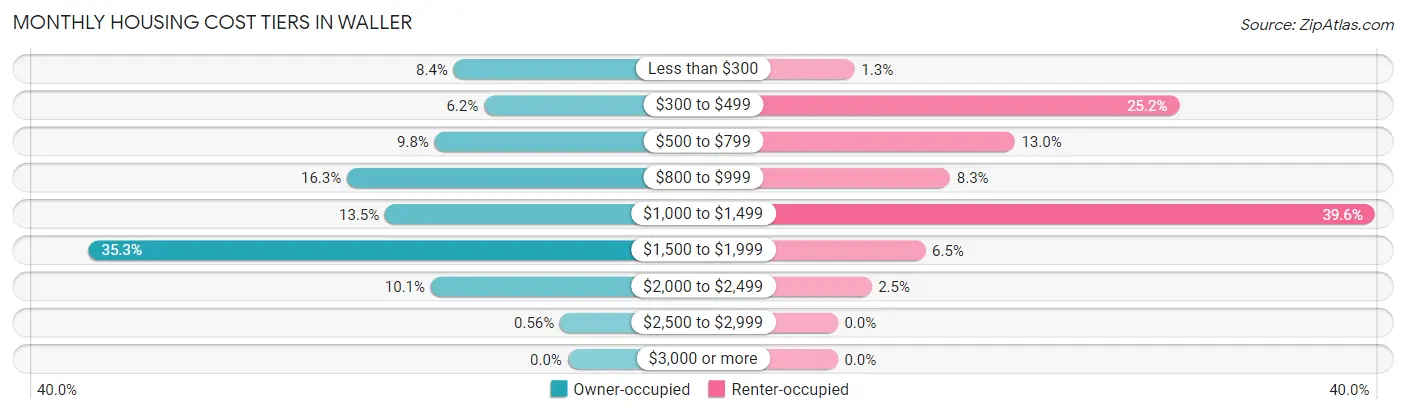
| Monthly Cost | Owner-occupied | Renter-occupied |
| Less than $300 | 30 (8.4%) | 11 (1.3%) |
| $300 to $499 | 22 (6.2%) | 222 (25.2%) |
| $500 to $799 | 35 (9.8%) | 115 (13.0%) |
| $800 to $999 | 58 (16.3%) | 73 (8.3%) |
| $1,000 to $1,499 | 48 (13.5%) | 349 (39.6%) |
| $1,500 to $1,999 | 126 (35.3%) | 57 (6.5%) |
| $2,000 to $2,499 | 36 (10.1%) | 22 (2.5%) |
| $2,500 to $2,999 | 2 (0.6%) | 0 (0.0%) |
| $3,000 or more | 0 (0.0%) | 0 (0.0%) |
| Total | 357 (100.0%) | 882 (100.0%) |
Physical Housing Characteristics in Waller
Housing Structures in Waller
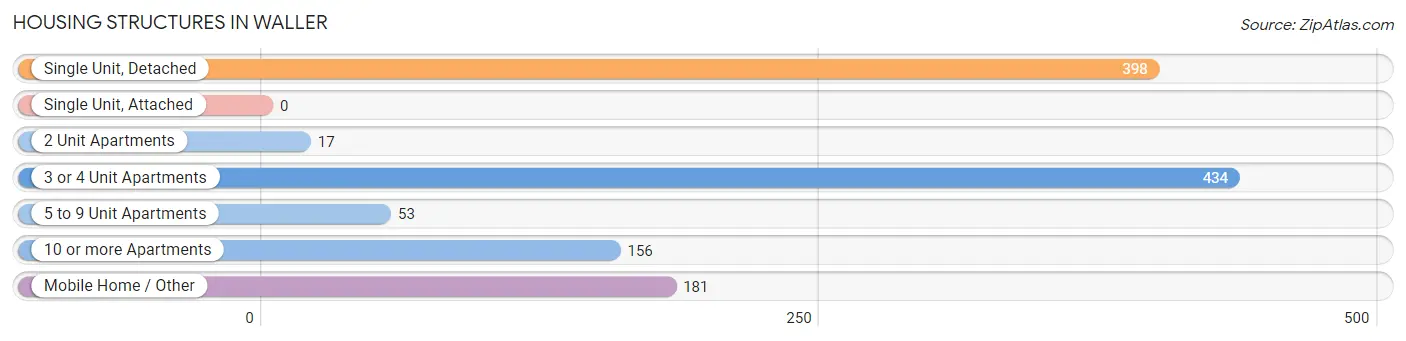
| Structure Type | # Housing Units | % Housing Units |
| Single Unit, Detached | 398 | 32.1% |
| Single Unit, Attached | 0 | 0.0% |
| 2 Unit Apartments | 17 | 1.4% |
| 3 or 4 Unit Apartments | 434 | 35.0% |
| 5 to 9 Unit Apartments | 53 | 4.3% |
| 10 or more Apartments | 156 | 12.6% |
| Mobile Home / Other | 181 | 14.6% |
| Total | 1,239 | 100.0% |
Housing Structures by Occupancy in Waller
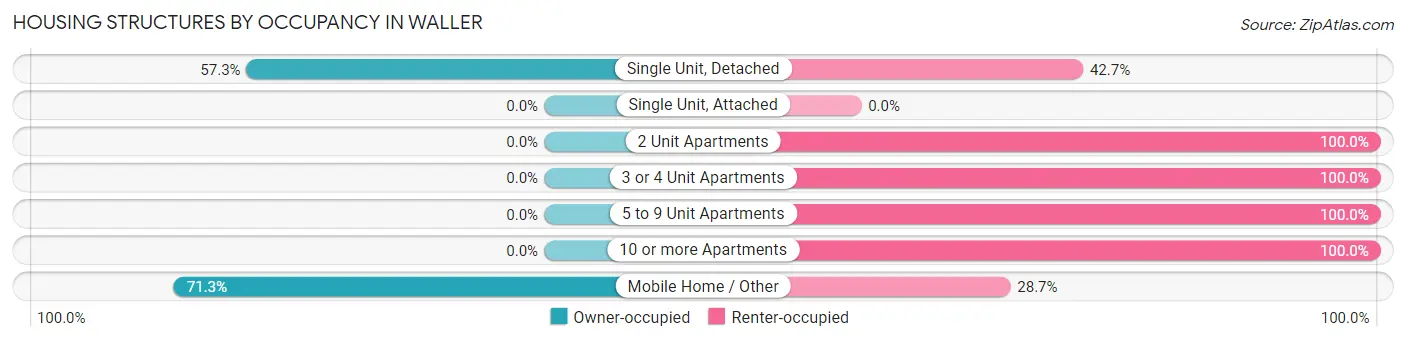
| Structure Type | Owner-occupied | Renter-occupied |
| Single Unit, Detached | 228 (57.3%) | 170 (42.7%) |
| Single Unit, Attached | 0 (0.0%) | 0 (0.0%) |
| 2 Unit Apartments | 0 (0.0%) | 17 (100.0%) |
| 3 or 4 Unit Apartments | 0 (0.0%) | 434 (100.0%) |
| 5 to 9 Unit Apartments | 0 (0.0%) | 53 (100.0%) |
| 10 or more Apartments | 0 (0.0%) | 156 (100.0%) |
| Mobile Home / Other | 129 (71.3%) | 52 (28.7%) |
| Total | 357 (28.8%) | 882 (71.2%) |
Housing Structures by Number of Rooms in Waller
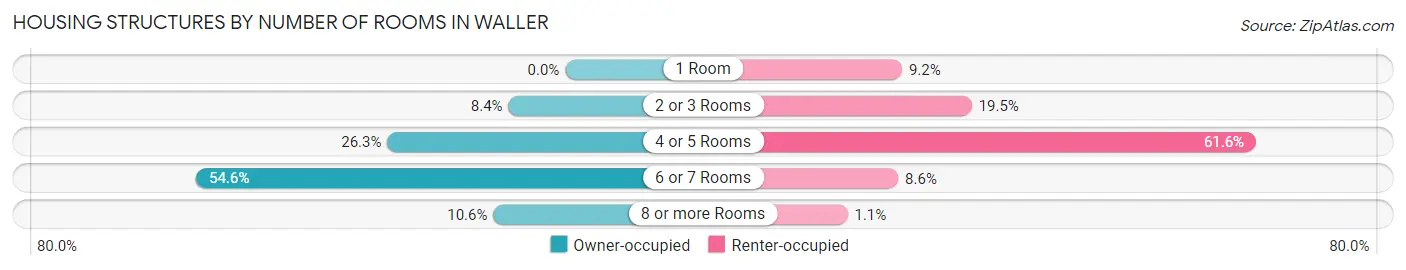
| Number of Rooms | Owner-occupied | Renter-occupied |
| 1 Room | 0 (0.0%) | 81 (9.2%) |
| 2 or 3 Rooms | 30 (8.4%) | 172 (19.5%) |
| 4 or 5 Rooms | 94 (26.3%) | 543 (61.6%) |
| 6 or 7 Rooms | 195 (54.6%) | 76 (8.6%) |
| 8 or more Rooms | 38 (10.6%) | 10 (1.1%) |
| Total | 357 (100.0%) | 882 (100.0%) |
Housing Structure by Heating Type in Waller
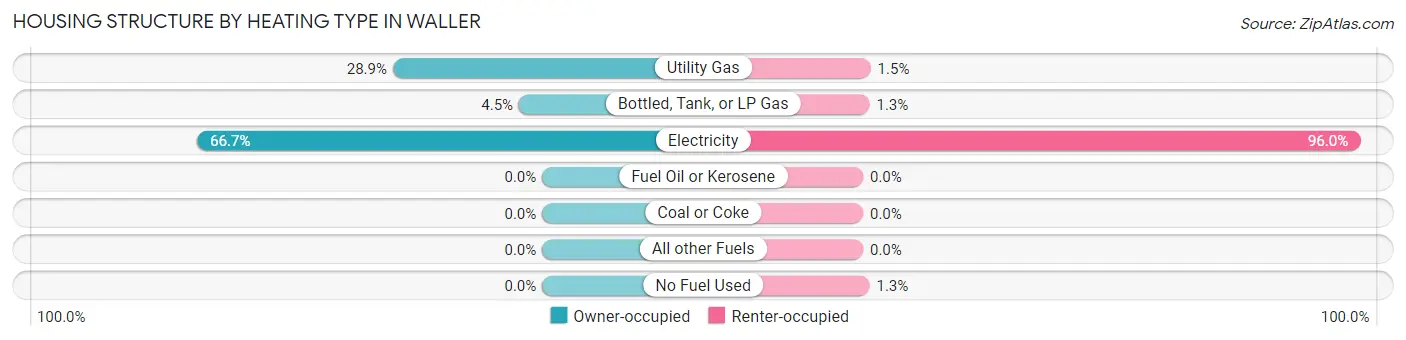
| Heating Type | Owner-occupied | Renter-occupied |
| Utility Gas | 103 (28.8%) | 13 (1.5%) |
| Bottled, Tank, or LP Gas | 16 (4.5%) | 11 (1.3%) |
| Electricity | 238 (66.7%) | 847 (96.0%) |
| Fuel Oil or Kerosene | 0 (0.0%) | 0 (0.0%) |
| Coal or Coke | 0 (0.0%) | 0 (0.0%) |
| All other Fuels | 0 (0.0%) | 0 (0.0%) |
| No Fuel Used | 0 (0.0%) | 11 (1.3%) |
| Total | 357 (100.0%) | 882 (100.0%) |
Household Vehicle Usage in Waller
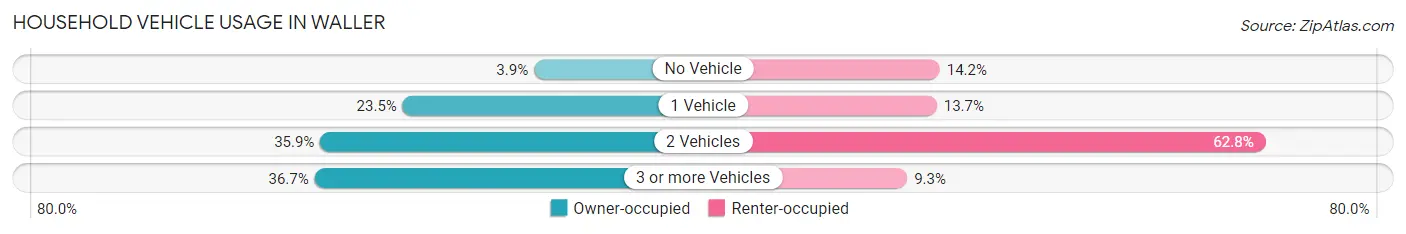
| Vehicles per Household | Owner-occupied | Renter-occupied |
| No Vehicle | 14 (3.9%) | 125 (14.2%) |
| 1 Vehicle | 84 (23.5%) | 121 (13.7%) |
| 2 Vehicles | 128 (35.8%) | 554 (62.8%) |
| 3 or more Vehicles | 131 (36.7%) | 82 (9.3%) |
| Total | 357 (100.0%) | 882 (100.0%) |
Real Estate & Mortgages in Waller
Real Estate and Mortgage Overview in Waller
| Characteristic | Without Mortgage | With Mortgage |
| Housing Units | 162 | 195 |
| Median Property Value | $107,600 | $196,000 |
| Median Household Income | $46,250 | $51 |
| Monthly Housing Costs | $673 | $0 |
| Real Estate Taxes | - | - |
Property Value by Mortgage Status in Waller
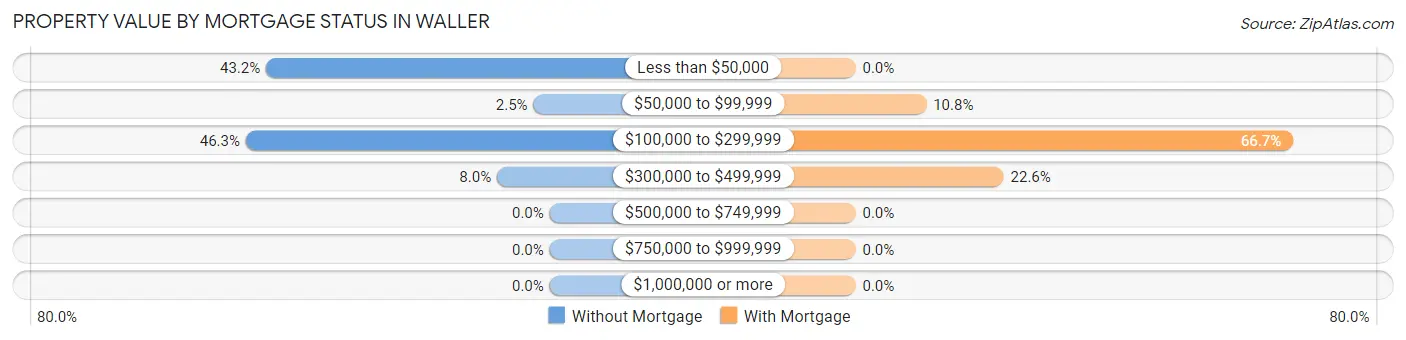
| Property Value | Without Mortgage | With Mortgage |
| Less than $50,000 | 70 (43.2%) | 0 (0.0%) |
| $50,000 to $99,999 | 4 (2.5%) | 21 (10.8%) |
| $100,000 to $299,999 | 75 (46.3%) | 130 (66.7%) |
| $300,000 to $499,999 | 13 (8.0%) | 44 (22.6%) |
| $500,000 to $749,999 | 0 (0.0%) | 0 (0.0%) |
| $750,000 to $999,999 | 0 (0.0%) | 0 (0.0%) |
| $1,000,000 or more | 0 (0.0%) | 0 (0.0%) |
| Total | 162 (100.0%) | 195 (100.0%) |
Household Income by Mortgage Status in Waller
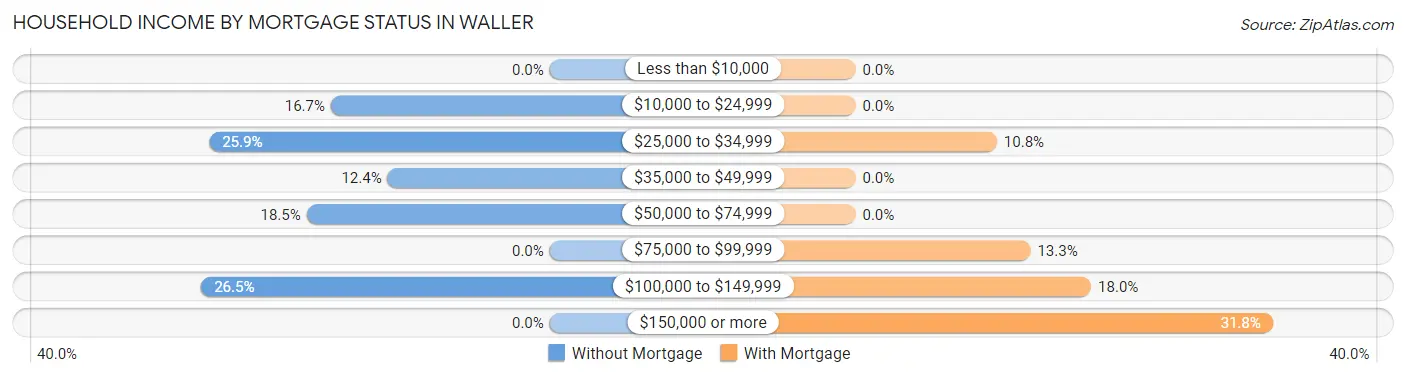
| Household Income | Without Mortgage | With Mortgage |
| Less than $10,000 | 0 (0.0%) | 0 (0.0%) |
| $10,000 to $24,999 | 27 (16.7%) | 0 (0.0%) |
| $25,000 to $34,999 | 42 (25.9%) | 21 (10.8%) |
| $35,000 to $49,999 | 20 (12.3%) | 0 (0.0%) |
| $50,000 to $74,999 | 30 (18.5%) | 0 (0.0%) |
| $75,000 to $99,999 | 0 (0.0%) | 26 (13.3%) |
| $100,000 to $149,999 | 43 (26.5%) | 35 (17.9%) |
| $150,000 or more | 0 (0.0%) | 62 (31.8%) |
| Total | 162 (100.0%) | 195 (100.0%) |
Property Value to Household Income Ratio in Waller
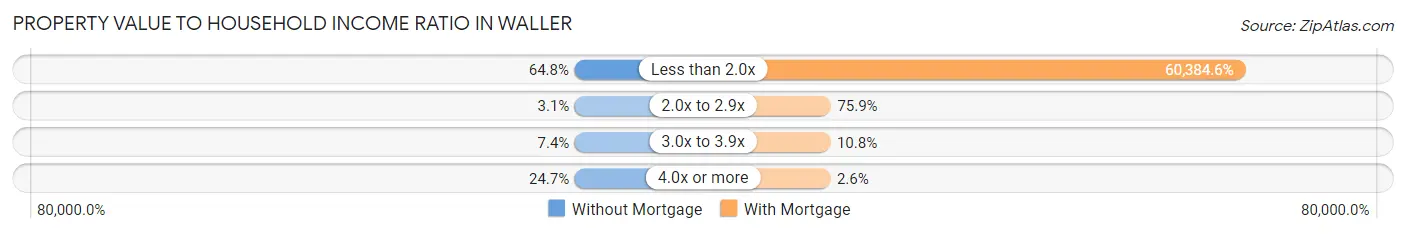
| Value-to-Income Ratio | Without Mortgage | With Mortgage |
| Less than 2.0x | 105 (64.8%) | 117,750 (60,384.6%) |
| 2.0x to 2.9x | 5 (3.1%) | 148 (75.9%) |
| 3.0x to 3.9x | 12 (7.4%) | 21 (10.8%) |
| 4.0x or more | 40 (24.7%) | 5 (2.6%) |
| Total | 162 (100.0%) | 195 (100.0%) |
Real Estate Taxes by Mortgage Status in Waller
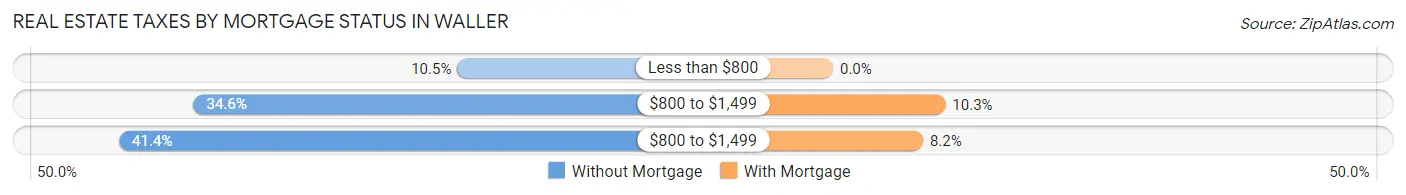
| Property Taxes | Without Mortgage | With Mortgage |
| Less than $800 | 17 (10.5%) | 0 (0.0%) |
| $800 to $1,499 | 56 (34.6%) | 20 (10.3%) |
| $800 to $1,499 | 67 (41.4%) | 16 (8.2%) |
| Total | 162 (100.0%) | 195 (100.0%) |
Health & Disability in Waller
Health Insurance Coverage by Age in Waller
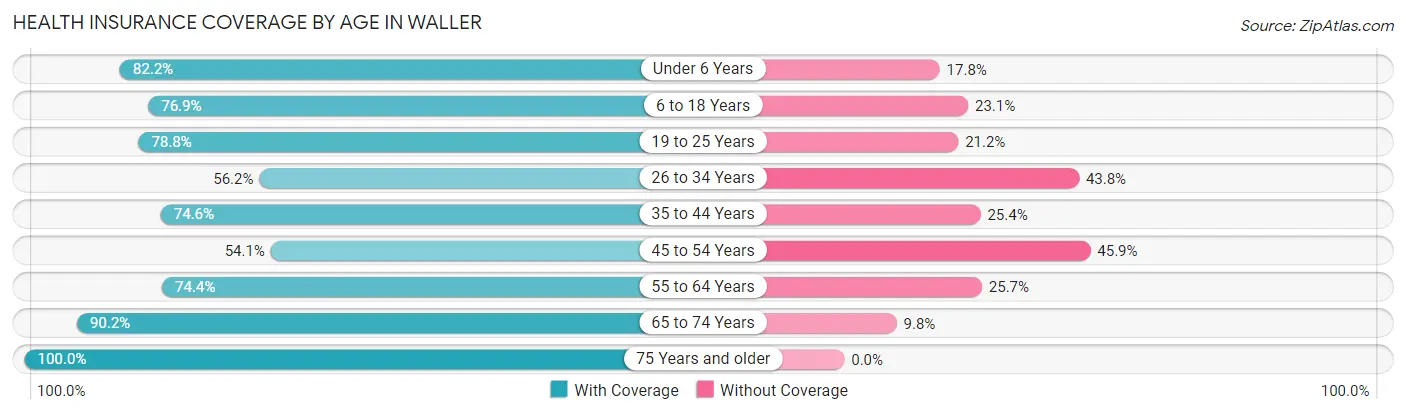
| Age Bracket | With Coverage | Without Coverage |
| Under 6 Years | 111 (82.2%) | 24 (17.8%) |
| 6 to 18 Years | 330 (76.9%) | 99 (23.1%) |
| 19 to 25 Years | 905 (78.8%) | 244 (21.2%) |
| 26 to 34 Years | 329 (56.2%) | 256 (43.8%) |
| 35 to 44 Years | 185 (74.6%) | 63 (25.4%) |
| 45 to 54 Years | 125 (54.1%) | 106 (45.9%) |
| 55 to 64 Years | 171 (74.4%) | 59 (25.7%) |
| 65 to 74 Years | 111 (90.2%) | 12 (9.8%) |
| 75 Years and older | 112 (100.0%) | 0 (0.0%) |
| Total | 2,379 (73.4%) | 863 (26.6%) |
Health Insurance Coverage by Citizenship Status in Waller
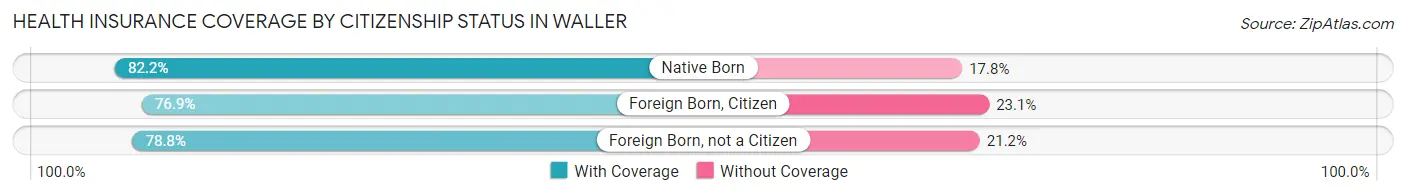
| Citizenship Status | With Coverage | Without Coverage |
| Native Born | 111 (82.2%) | 24 (17.8%) |
| Foreign Born, Citizen | 330 (76.9%) | 99 (23.1%) |
| Foreign Born, not a Citizen | 905 (78.8%) | 244 (21.2%) |
Health Insurance Coverage by Household Income in Waller
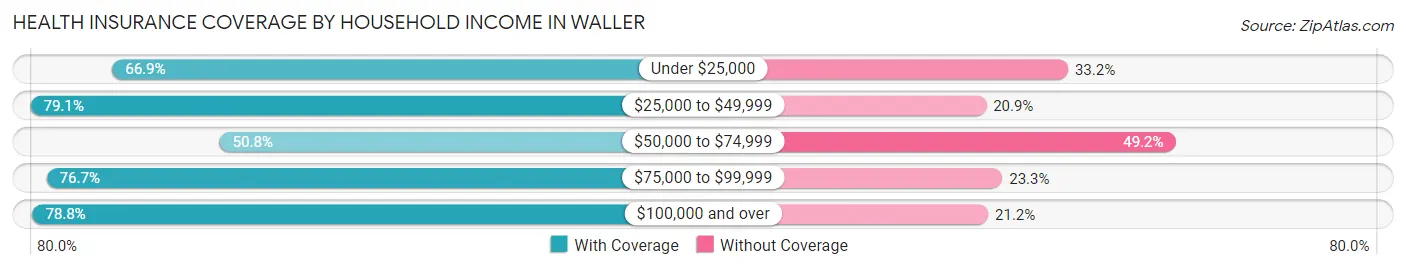
| Household Income | With Coverage | Without Coverage |
| Under $25,000 | 355 (66.8%) | 176 (33.2%) |
| $25,000 to $49,999 | 920 (79.1%) | 243 (20.9%) |
| $50,000 to $74,999 | 201 (50.8%) | 195 (49.2%) |
| $75,000 to $99,999 | 181 (76.7%) | 55 (23.3%) |
| $100,000 and over | 722 (78.8%) | 194 (21.2%) |
Public vs Private Health Insurance Coverage by Age in Waller
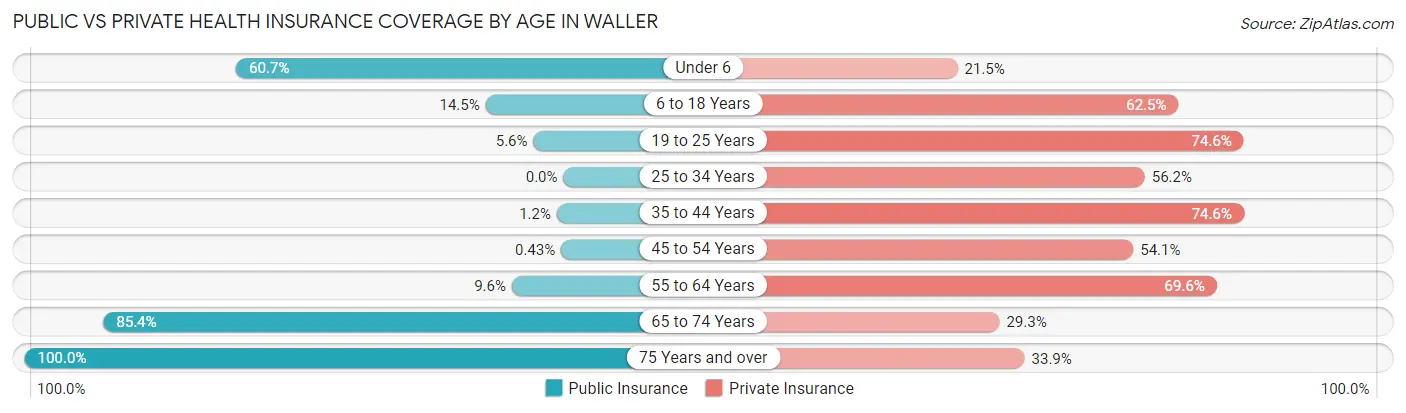
| Age Bracket | Public Insurance | Private Insurance |
| Under 6 | 82 (60.7%) | 29 (21.5%) |
| 6 to 18 Years | 62 (14.4%) | 268 (62.5%) |
| 19 to 25 Years | 64 (5.6%) | 857 (74.6%) |
| 25 to 34 Years | 0 (0.0%) | 329 (56.2%) |
| 35 to 44 Years | 3 (1.2%) | 185 (74.6%) |
| 45 to 54 Years | 1 (0.4%) | 125 (54.1%) |
| 55 to 64 Years | 22 (9.6%) | 160 (69.6%) |
| 65 to 74 Years | 105 (85.4%) | 36 (29.3%) |
| 75 Years and over | 112 (100.0%) | 38 (33.9%) |
| Total | 451 (13.9%) | 2,027 (62.5%) |
Disability Status by Sex by Age in Waller
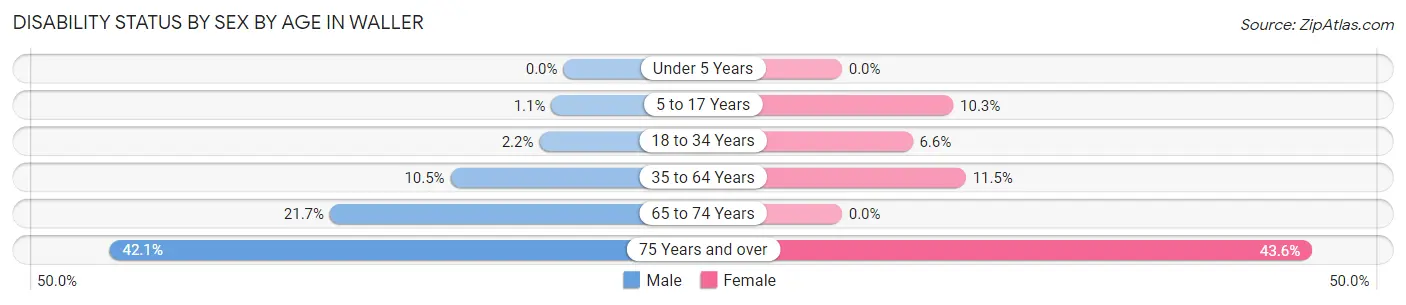
| Age Bracket | Male | Female |
| Under 5 Years | 0 (0.0%) | 0 (0.0%) |
| 5 to 17 Years | 2 (1.1%) | 19 (10.3%) |
| 18 to 34 Years | 16 (2.2%) | 73 (6.6%) |
| 35 to 64 Years | 26 (10.5%) | 53 (11.5%) |
| 65 to 74 Years | 13 (21.7%) | 0 (0.0%) |
| 75 Years and over | 24 (42.1%) | 24 (43.6%) |
Disability Class by Sex by Age in Waller
Disability Class: Hearing Difficulty
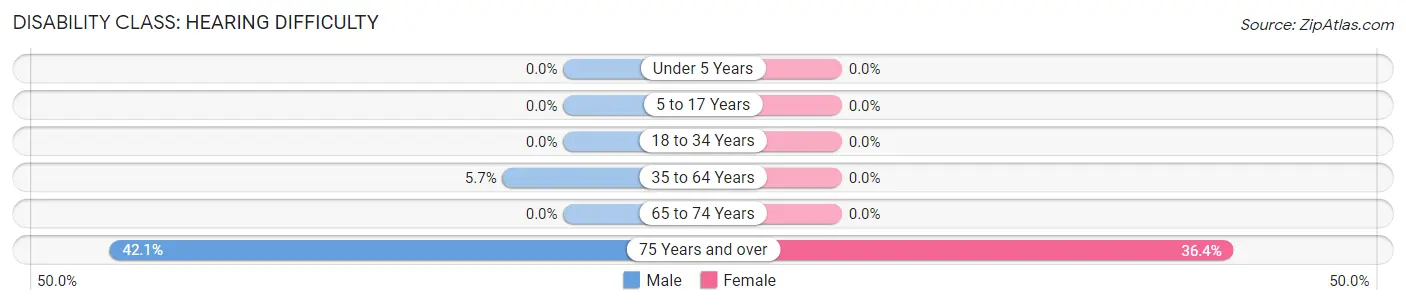
| Age Bracket | Male | Female |
| Under 5 Years | 0 (0.0%) | 0 (0.0%) |
| 5 to 17 Years | 0 (0.0%) | 0 (0.0%) |
| 18 to 34 Years | 0 (0.0%) | 0 (0.0%) |
| 35 to 64 Years | 14 (5.7%) | 0 (0.0%) |
| 65 to 74 Years | 0 (0.0%) | 0 (0.0%) |
| 75 Years and over | 24 (42.1%) | 20 (36.4%) |
Disability Class: Vision Difficulty
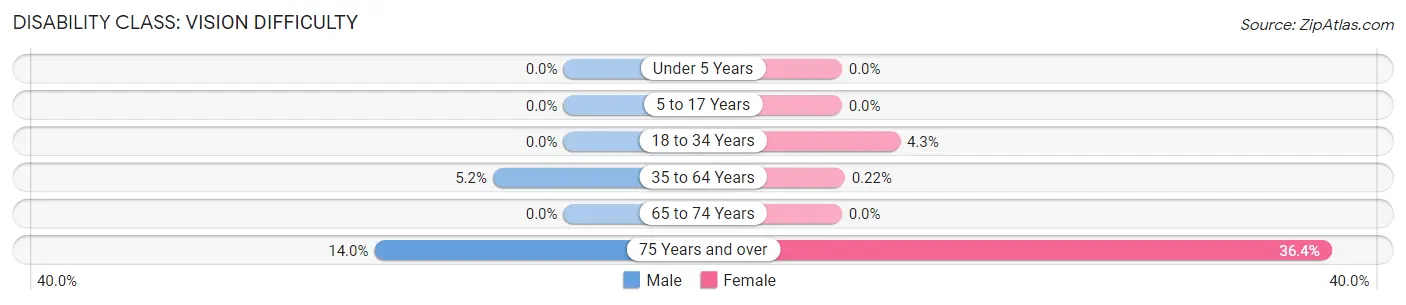
| Age Bracket | Male | Female |
| Under 5 Years | 0 (0.0%) | 0 (0.0%) |
| 5 to 17 Years | 0 (0.0%) | 0 (0.0%) |
| 18 to 34 Years | 0 (0.0%) | 48 (4.3%) |
| 35 to 64 Years | 13 (5.2%) | 1 (0.2%) |
| 65 to 74 Years | 0 (0.0%) | 0 (0.0%) |
| 75 Years and over | 8 (14.0%) | 20 (36.4%) |
Disability Class: Cognitive Difficulty
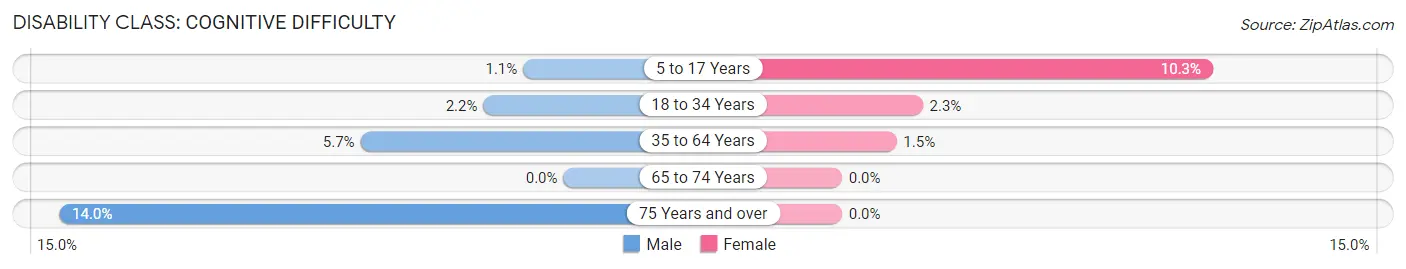
| Age Bracket | Male | Female |
| 5 to 17 Years | 2 (1.1%) | 19 (10.3%) |
| 18 to 34 Years | 16 (2.2%) | 25 (2.2%) |
| 35 to 64 Years | 14 (5.7%) | 7 (1.5%) |
| 65 to 74 Years | 0 (0.0%) | 0 (0.0%) |
| 75 Years and over | 8 (14.0%) | 0 (0.0%) |
Disability Class: Ambulatory Difficulty
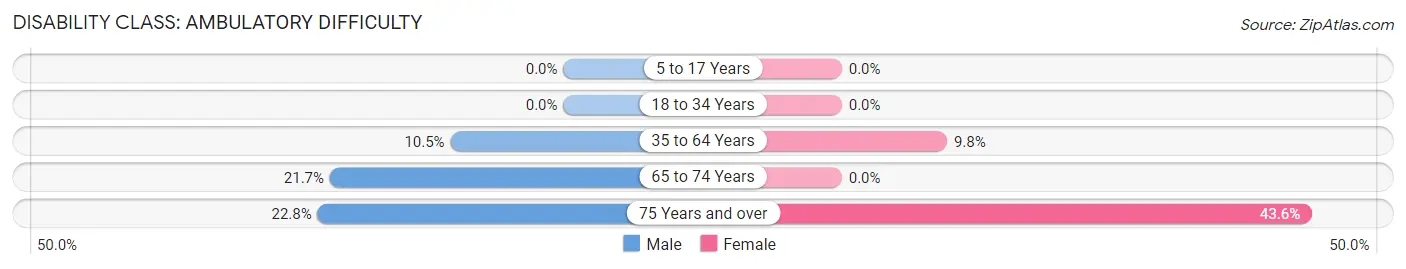
| Age Bracket | Male | Female |
| 5 to 17 Years | 0 (0.0%) | 0 (0.0%) |
| 18 to 34 Years | 0 (0.0%) | 0 (0.0%) |
| 35 to 64 Years | 26 (10.5%) | 45 (9.8%) |
| 65 to 74 Years | 13 (21.7%) | 0 (0.0%) |
| 75 Years and over | 13 (22.8%) | 24 (43.6%) |
Disability Class: Self-Care Difficulty
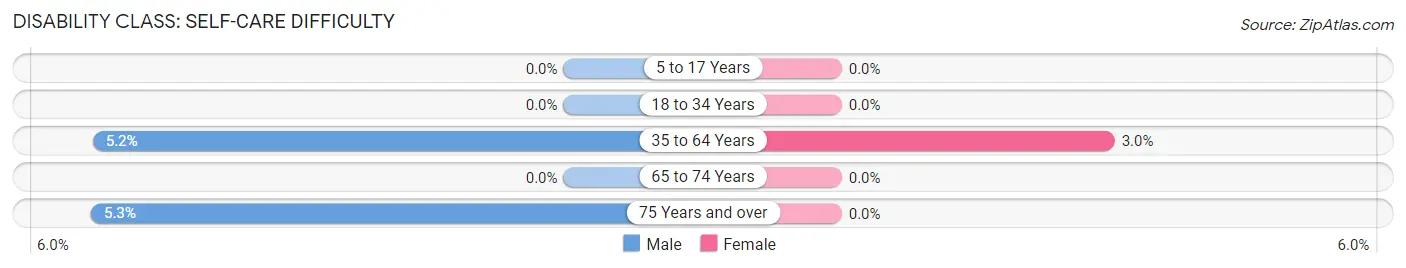
| Age Bracket | Male | Female |
| 5 to 17 Years | 0 (0.0%) | 0 (0.0%) |
| 18 to 34 Years | 0 (0.0%) | 0 (0.0%) |
| 35 to 64 Years | 13 (5.2%) | 14 (3.0%) |
| 65 to 74 Years | 0 (0.0%) | 0 (0.0%) |
| 75 Years and over | 3 (5.3%) | 0 (0.0%) |
Technology Access in Waller
Computing Device Access in Waller
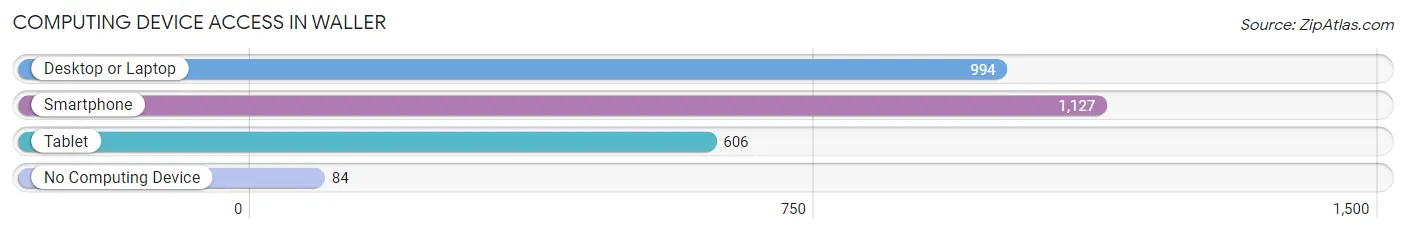
| Device Type | # Households | % Households |
| Desktop or Laptop | 994 | 80.2% |
| Smartphone | 1,127 | 91.0% |
| Tablet | 606 | 48.9% |
| No Computing Device | 84 | 6.8% |
| Total | 1,239 | 100.0% |
Internet Access in Waller
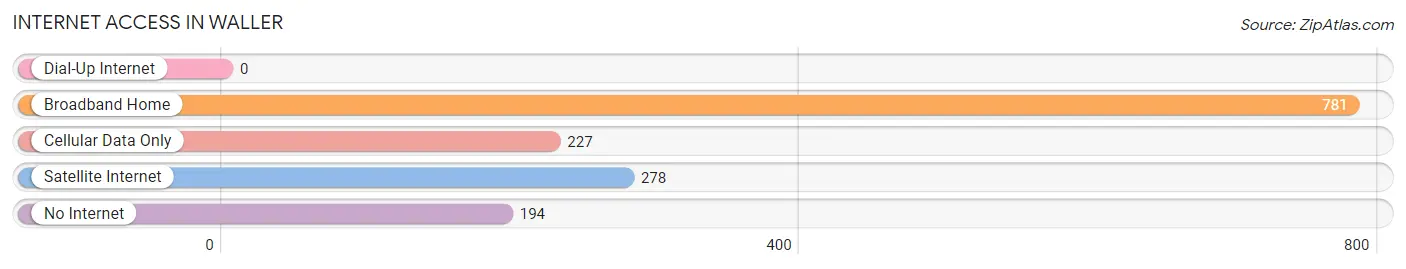
| Internet Type | # Households | % Households |
| Dial-Up Internet | 0 | 0.0% |
| Broadband Home | 781 | 63.0% |
| Cellular Data Only | 227 | 18.3% |
| Satellite Internet | 278 | 22.4% |
| No Internet | 194 | 15.7% |
| Total | 1,239 | 100.0% |
Waller Summary
Waller, Texas is a small town located in Waller County, Texas, about 40 miles northwest of Houston. The town was founded in 1873 and named after Edwin Waller, a signer of the Texas Declaration of Independence. The population of Waller was 2,326 at the 2010 census.
History
Waller was founded in 1873 by a group of settlers from the nearby town of Hempstead. The town was named after Edwin Waller, a signer of the Texas Declaration of Independence. The town was originally a farming community, but in the early 1900s, the town began to grow as the Houston and Texas Central Railway was built through the area. The railroad brought new businesses and industries to the area, and the town began to grow.
In the 1920s, Waller was a thriving community with a population of over 1,000 people. The town had several stores, a bank, a hotel, a movie theater, and a school. The town also had a cotton gin and a lumber mill.
In the 1950s, the population of Waller began to decline as people moved away to larger cities. The town was hit hard by the Great Depression and the Dust Bowl, and many of the businesses in town closed. The population of Waller continued to decline until the 1980s, when the town began to experience a resurgence.
Geography
Waller is located in Waller County, Texas, about 40 miles northwest of Houston. The town is situated on the banks of the Brazos River, and is surrounded by rolling hills and farmland. The climate in Waller is hot and humid in the summer, and mild in the winter.
Economy
The economy of Waller is largely based on agriculture. The town is home to several farms, and the surrounding area is known for its production of cotton, corn, and hay. The town also has several small businesses, including restaurants, retail stores, and service providers.
The town is also home to several manufacturing companies, including a plastics factory and a metal fabrication plant. The town is also home to a large oil refinery, which provides jobs to many of the town's residents.
Demographics
As of the 2010 census, the population of Waller was 2,326. The racial makeup of the town was 79.3% White, 15.2% Hispanic or Latino, 2.2% African American, 0.7% Native American, 0.3% Asian, and 2.5% from other races.
The median household income in Waller was $41,944, and the median family income was $50,917. The per capita income in Waller was $20,845. About 16.3% of the population was below the poverty line.
Conclusion
Waller, Texas is a small town located in Waller County, Texas, about 40 miles northwest of Houston. The town was founded in 1873 and named after Edwin Waller, a signer of the Texas Declaration of Independence. The population of Waller was 2,326 at the 2010 census. The economy of Waller is largely based on agriculture, and the town is also home to several manufacturing companies and a large oil refinery. The racial makeup of the town was 79.3% White, 15.2% Hispanic or Latino, 2.2% African American, 0.7% Native American, 0.3% Asian, and 2.5% from other races. The median household income in Waller was $41,944, and the median family income was $50,917. The per capita income in Waller was $20,845. About 16.3% of the population was below the poverty line.
Common Questions
What is Per Capita Income in Waller?
Per Capita income in Waller is $23,874.
What is the Median Family Income in Waller?
Median Family Income in Waller is $62,903.
What is the Median Household income in Waller?
Median Household Income in Waller is $36,160.
What is Income or Wage Gap in Waller?
Income or Wage Gap in Waller is 28.8%.
Women in Waller earn 71.2 cents for every dollar earned by a man.
What is Family Income Deficit in Waller?
Family Income Deficit in Waller is $7,953.
Families that are below poverty line in Waller earn $7,953 less on average than the poverty threshold level.
What is Inequality or Gini Index in Waller?
Inequality or Gini Index in Waller is 0.45.
What is the Total Population of Waller?
Total Population of Waller is 3,257.
What is the Total Male Population of Waller?
Total Male Population of Waller is 1,333.
What is the Total Female Population of Waller?
Total Female Population of Waller is 1,924.
What is the Ratio of Males per 100 Females in Waller?
There are 69.28 Males per 100 Females in Waller.
What is the Ratio of Females per 100 Males in Waller?
There are 144.34 Females per 100 Males in Waller.
What is the Median Population Age in Waller?
Median Population Age in Waller is 25.6 Years.
What is the Average Family Size in Waller
Average Family Size in Waller is 3.4 People.
What is the Average Household Size in Waller
Average Household Size in Waller is 2.6 People.
How Large is the Labor Force in Waller?
There are 1,836 People in the Labor Forcein in Waller.
What is the Percentage of People in the Labor Force in Waller?
65.0% of People are in the Labor Force in Waller.
What is the Unemployment Rate in Waller?
Unemployment Rate in Waller is 2.0%.