La Villa, TX Map & Demographics
La Villa Map
La Villa Overview
$14,939
PER CAPITA INCOME
$95,921
AVG FAMILY INCOME
$59,167
AVG HOUSEHOLD INCOME
8.8%
WAGE / INCOME GAP [ % ]
91.2¢/ $1
WAGE / INCOME GAP [ $ ]
0.47
INEQUALITY / GINI INDEX
2,872
TOTAL POPULATION
1,681
MALE POPULATION
1,191
FEMALE POPULATION
141.14
MALES / 100 FEMALES
70.85
FEMALES / 100 MALES
30.9
MEDIAN AGE
5.2
AVG FAMILY SIZE
3.7
AVG HOUSEHOLD SIZE
802
LABOR FORCE [ PEOPLE ]
34.3%
PERCENT IN LABOR FORCE
1.6%
UNEMPLOYMENT RATE
La Villa Zip Codes
La Villa Area Codes
Income in La Villa
Income Overview in La Villa
Per Capita Income in La Villa is $14,939, while median incomes of families and households are $95,921 and $59,167 respectively.
| Characteristic | Number | Measure |
| Per Capita Income | 2,872 | $14,939 |
| Median Family Income | 302 | $95,921 |
| Mean Family Income | 302 | $103,866 |
| Median Household Income | 476 | $59,167 |
| Mean Household Income | 476 | $74,471 |
| Income Deficit | 302 | $0 |
| Wage / Income Gap (%) | 2,872 | 8.77% |
| Wage / Income Gap ($) | 2,872 | 91.23¢ per $1 |
| Gini / Inequality Index | 2,872 | 0.47 |
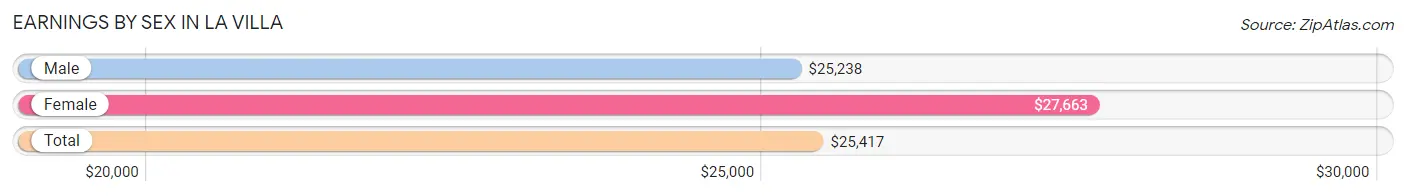
Earnings by Sex in La Villa
Average Earnings in La Villa are $25,417, $25,238 for men and $27,663 for women, a difference of 8.8%.
| Sex | Number | Average Earnings |
| Male | 702 (60.9%) | $25,238 |
| Female | 451 (39.1%) | $27,663 |
| Total | 1,153 (100.0%) | $25,417 |
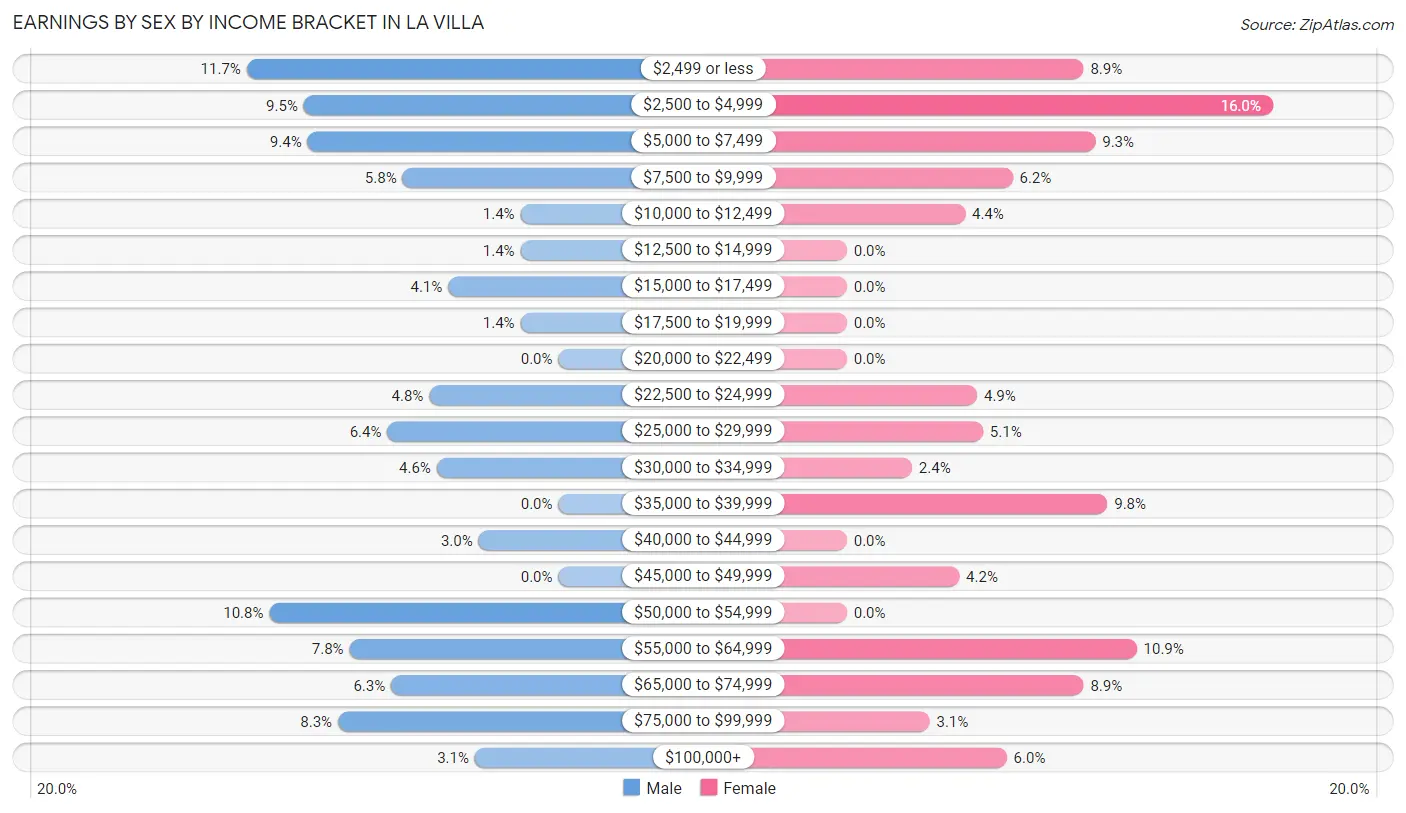
Earnings by Sex by Income Bracket in La Villa
The most common earnings brackets in La Villa are $2,499 or less for men (82 | 11.7%) and $2,500 to $4,999 for women (72 | 16.0%).
| Income | Male | Female |
| $2,499 or less | 82 (11.7%) | 40 (8.9%) |
| $2,500 to $4,999 | 67 (9.5%) | 72 (16.0%) |
| $5,000 to $7,499 | 66 (9.4%) | 42 (9.3%) |
| $7,500 to $9,999 | 41 (5.8%) | 28 (6.2%) |
| $10,000 to $12,499 | 10 (1.4%) | 20 (4.4%) |
| $12,500 to $14,999 | 10 (1.4%) | 0 (0.0%) |
| $15,000 to $17,499 | 29 (4.1%) | 0 (0.0%) |
| $17,500 to $19,999 | 10 (1.4%) | 0 (0.0%) |
| $20,000 to $22,499 | 0 (0.0%) | 0 (0.0%) |
| $22,500 to $24,999 | 34 (4.8%) | 22 (4.9%) |
| $25,000 to $29,999 | 45 (6.4%) | 23 (5.1%) |
| $30,000 to $34,999 | 32 (4.6%) | 11 (2.4%) |
| $35,000 to $39,999 | 0 (0.0%) | 44 (9.8%) |
| $40,000 to $44,999 | 21 (3.0%) | 0 (0.0%) |
| $45,000 to $49,999 | 0 (0.0%) | 19 (4.2%) |
| $50,000 to $54,999 | 76 (10.8%) | 0 (0.0%) |
| $55,000 to $64,999 | 55 (7.8%) | 49 (10.9%) |
| $65,000 to $74,999 | 44 (6.3%) | 40 (8.9%) |
| $75,000 to $99,999 | 58 (8.3%) | 14 (3.1%) |
| $100,000+ | 22 (3.1%) | 27 (6.0%) |
| Total | 702 (100.0%) | 451 (100.0%) |
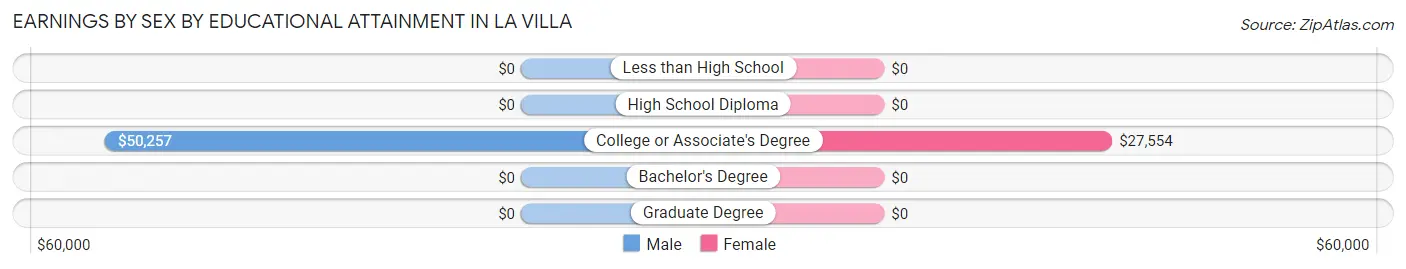
Earnings by Sex by Educational Attainment in La Villa
Average earnings in La Villa are $29,531 for men and $29,674 for women, a difference of 0.5%. Men with an educational attainment of college or associate's degree enjoy the highest average annual earnings of $50,257, while those with college or associate's degree education earn the least with $50,257. Women with an educational attainment of college or associate's degree earn the most with the average annual earnings of $27,554, while those with college or associate's degree education have the smallest earnings of $27,554.
| Educational Attainment | Male Income | Female Income |
| Less than High School | - | - |
| High School Diploma | - | - |
| College or Associate's Degree | $50,257 | $27,554 |
| Bachelor's Degree | - | - |
| Graduate Degree | - | - |
| Total | $29,531 | $29,674 |
Family Income in La Villa
Family Income Brackets in La Villa
According to the La Villa family income data, there are 86 families falling into the $75,000 to $99,999 income range, which is the most common income bracket and makes up 28.5% of all families.
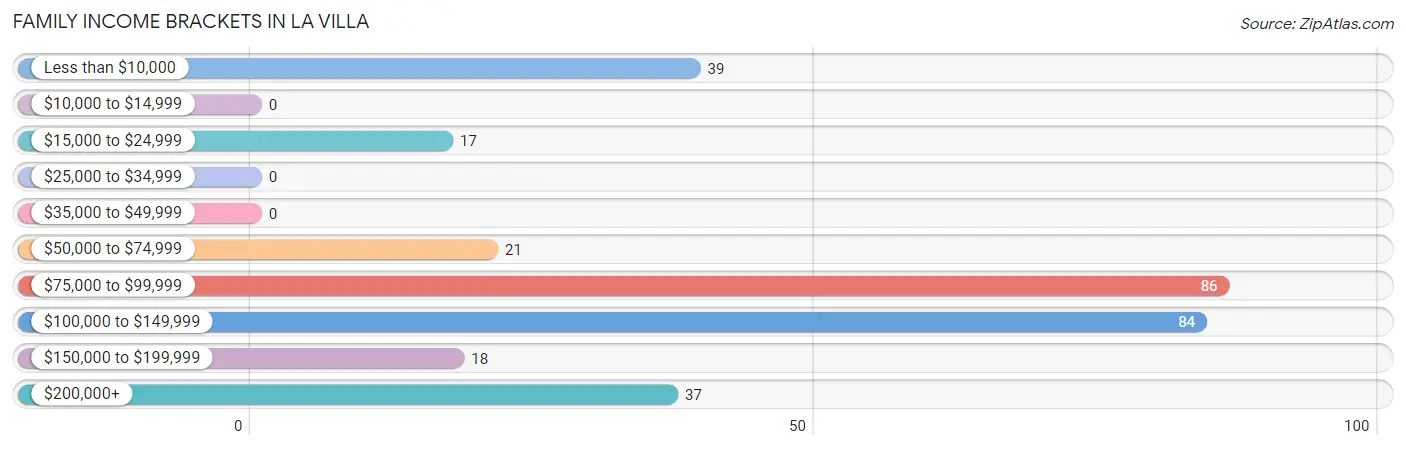
| Income Bracket | # Families | % Families |
| Less than $10,000 | 39 | 12.9% |
| $10,000 to $14,999 | 0 | 0.0% |
| $15,000 to $24,999 | 17 | 5.6% |
| $25,000 to $34,999 | 0 | 0.0% |
| $35,000 to $49,999 | 0 | 0.0% |
| $50,000 to $74,999 | 21 | 7.0% |
| $75,000 to $99,999 | 86 | 28.5% |
| $100,000 to $149,999 | 84 | 27.8% |
| $150,000 to $199,999 | 18 | 6.0% |
| $200,000+ | 37 | 12.3% |
Family Income by Famaliy Size in La Villa
7+ person families (54 | 17.9%) account for the highest median family income in La Villa with $196,389 per family, while 3-person families (94 | 31.1%) have the highest median income of $29,167 per family member.
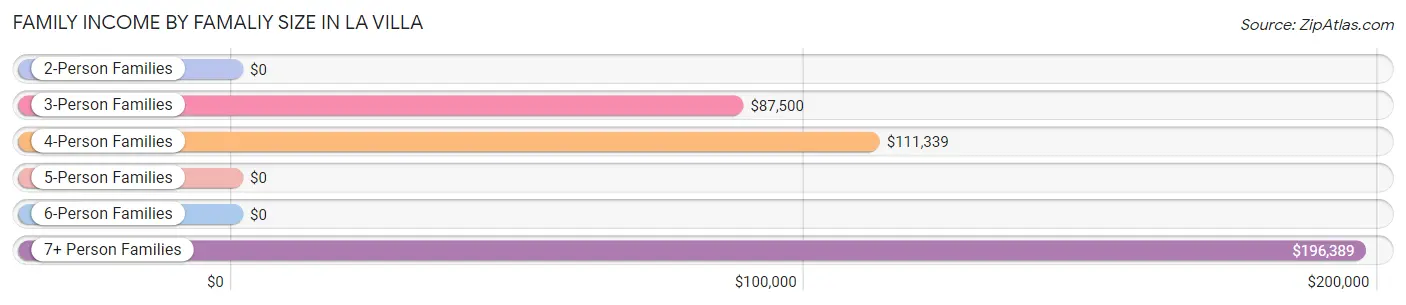
| Income Bracket | # Families | Median Income |
| 2-Person Families | 0 (0.0%) | $0 |
| 3-Person Families | 94 (31.1%) | $87,500 |
| 4-Person Families | 97 (32.1%) | $111,339 |
| 5-Person Families | 17 (5.6%) | $0 |
| 6-Person Families | 40 (13.3%) | $0 |
| 7+ Person Families | 54 (17.9%) | $196,389 |
| Total | 302 (100.0%) | $95,921 |
Family Income by Number of Earners in La Villa
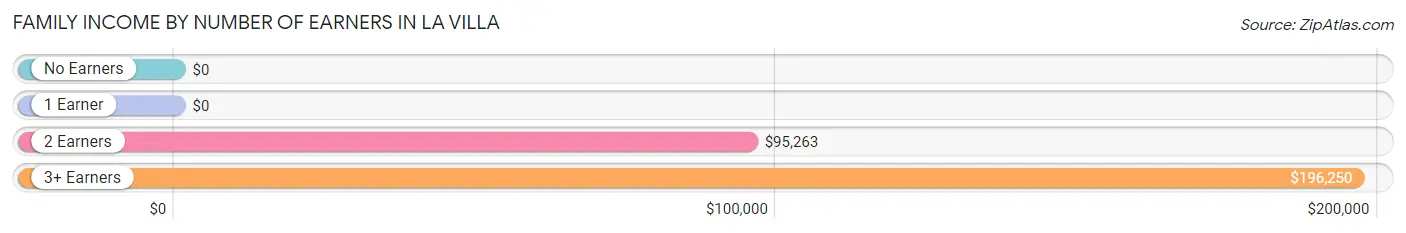
| Number of Earners | # Families | Median Income |
| No Earners | 0 (0.0%) | $0 |
| 1 Earner | 36 (11.9%) | $0 |
| 2 Earners | 174 (57.6%) | $95,263 |
| 3+ Earners | 92 (30.5%) | $196,250 |
| Total | 302 (100.0%) | $95,921 |
Household Income in La Villa
Household Income Brackets in La Villa
With 101 households falling in the category, the $15,000 to $24,999 income range is the most frequent in La Villa, accounting for 21.2% of all households.
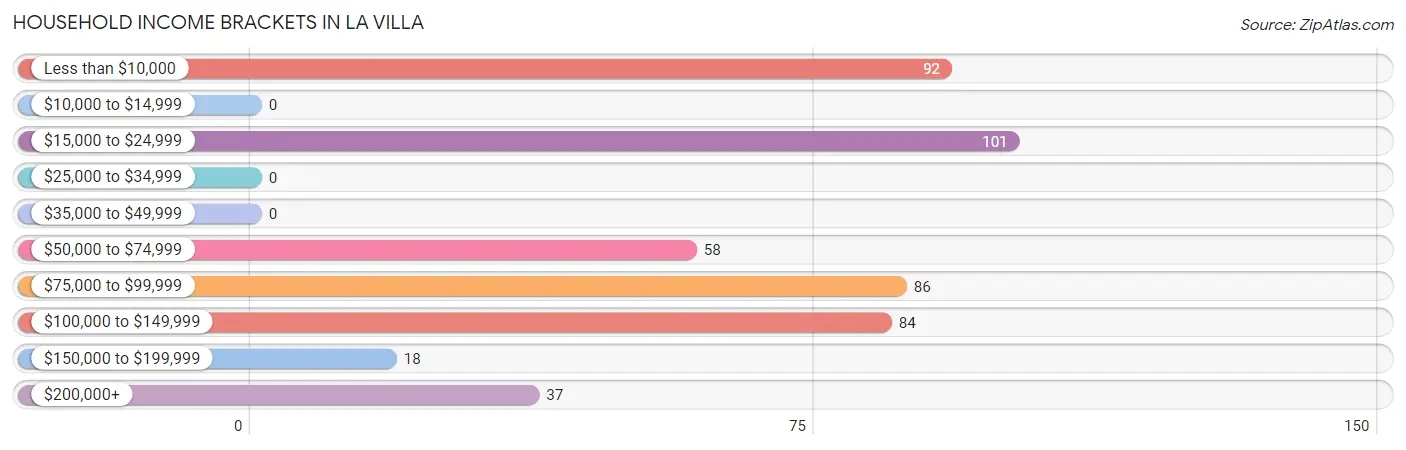
| Income Bracket | # Households | % Households |
| Less than $10,000 | 92 | 19.3% |
| $10,000 to $14,999 | 0 | 0.0% |
| $15,000 to $24,999 | 101 | 21.2% |
| $25,000 to $34,999 | 0 | 0.0% |
| $35,000 to $49,999 | 0 | 0.0% |
| $50,000 to $74,999 | 58 | 12.2% |
| $75,000 to $99,999 | 86 | 18.1% |
| $100,000 to $149,999 | 84 | 17.6% |
| $150,000 to $199,999 | 18 | 3.8% |
| $200,000+ | 37 | 7.8% |
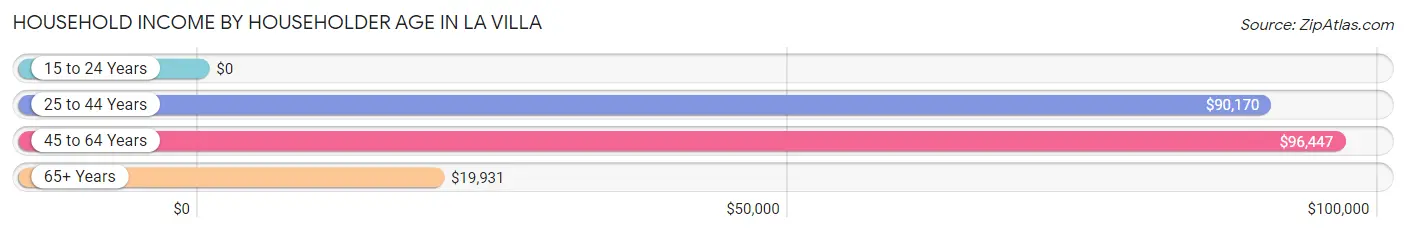
Household Income by Householder Age in La Villa
The median household income in La Villa is $59,167, with the highest median household income of $96,447 found in the 45 to 64 years age bracket for the primary householder. A total of 172 households (36.1%) fall into this category.
| Income Bracket | # Households | Median Income |
| 15 to 24 Years | 0 (0.0%) | $0 |
| 25 to 44 Years | 163 (34.2%) | $90,170 |
| 45 to 64 Years | 172 (36.1%) | $96,447 |
| 65+ Years | 141 (29.6%) | $19,931 |
| Total | 476 (100.0%) | $59,167 |
Poverty in La Villa
Income Below Poverty by Sex and Age in La Villa
With 9.0% poverty level for males and 32.3% for females among the residents of La Villa, 12 to 14 year old males and under 5 year old females are the most vulnerable to poverty, with 19 males (33.3%) and 67 females (72.0%) in their respective age groups living below the poverty level.
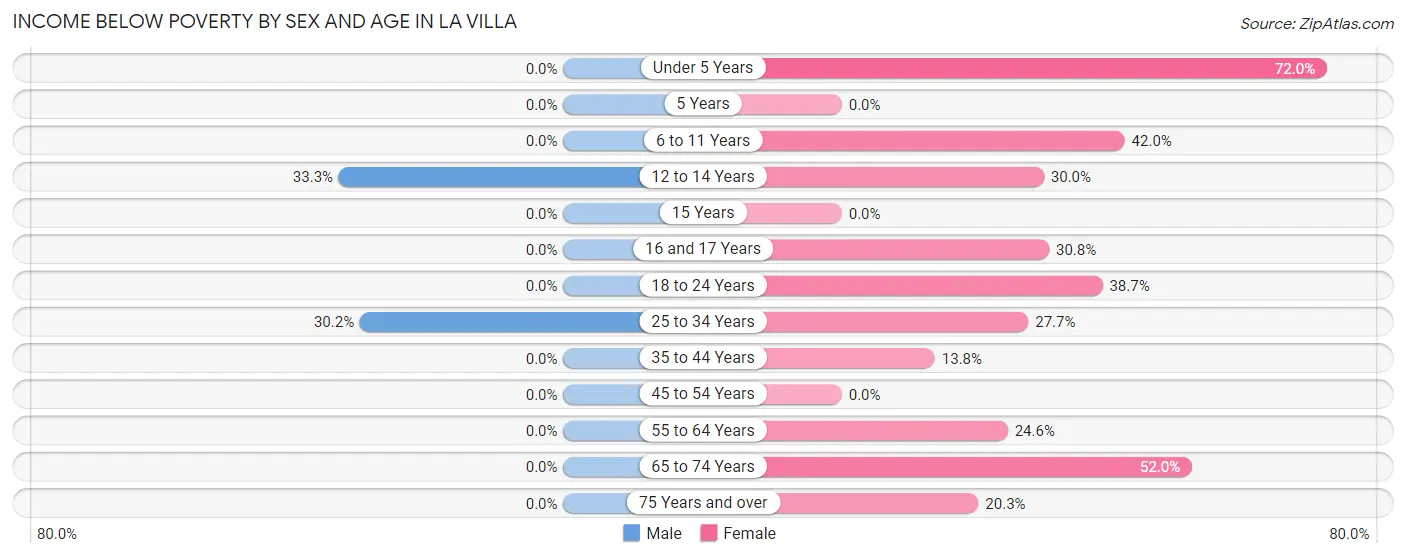
| Age Bracket | Male | Female |
| Under 5 Years | 0 (0.0%) | 67 (72.0%) |
| 5 Years | 0 (0.0%) | 0 (0.0%) |
| 6 to 11 Years | 0 (0.0%) | 42 (42.0%) |
| 12 to 14 Years | 19 (33.3%) | 18 (30.0%) |
| 15 Years | 0 (0.0%) | 0 (0.0%) |
| 16 and 17 Years | 0 (0.0%) | 36 (30.8%) |
| 18 to 24 Years | 0 (0.0%) | 48 (38.7%) |
| 25 to 34 Years | 45 (30.2%) | 41 (27.7%) |
| 35 to 44 Years | 0 (0.0%) | 17 (13.8%) |
| 45 to 54 Years | 0 (0.0%) | 0 (0.0%) |
| 55 to 64 Years | 0 (0.0%) | 17 (24.6%) |
| 65 to 74 Years | 0 (0.0%) | 39 (52.0%) |
| 75 Years and over | 0 (0.0%) | 14 (20.3%) |
| Total | 64 (9.0%) | 339 (32.3%) |
Income Above Poverty by Sex and Age in La Villa
According to the poverty statistics in La Villa, males aged under 5 years and females aged 15 years are the age groups that are most secure financially, with 100.0% of males and 100.0% of females in these age groups living above the poverty line.
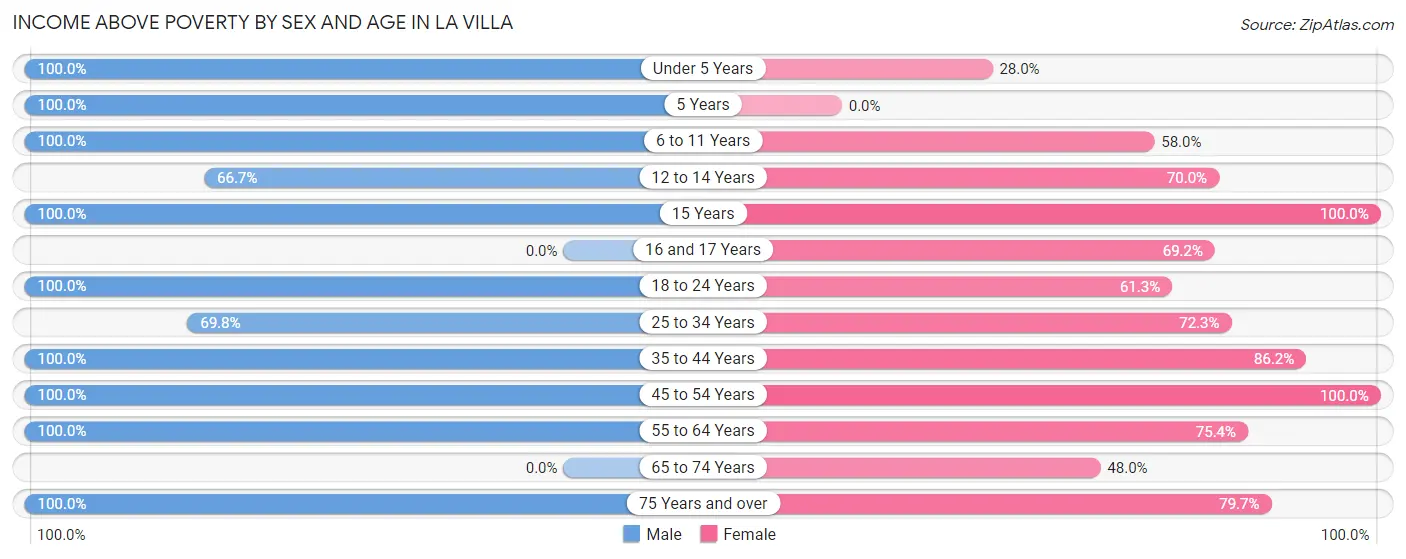
| Age Bracket | Male | Female |
| Under 5 Years | 71 (100.0%) | 26 (28.0%) |
| 5 Years | 22 (100.0%) | 0 (0.0%) |
| 6 to 11 Years | 100 (100.0%) | 58 (58.0%) |
| 12 to 14 Years | 38 (66.7%) | 42 (70.0%) |
| 15 Years | 18 (100.0%) | 12 (100.0%) |
| 16 and 17 Years | 0 (0.0%) | 81 (69.2%) |
| 18 to 24 Years | 66 (100.0%) | 76 (61.3%) |
| 25 to 34 Years | 104 (69.8%) | 107 (72.3%) |
| 35 to 44 Years | 145 (100.0%) | 106 (86.2%) |
| 45 to 54 Years | 44 (100.0%) | 59 (100.0%) |
| 55 to 64 Years | 21 (100.0%) | 52 (75.4%) |
| 65 to 74 Years | 0 (0.0%) | 36 (48.0%) |
| 75 Years and over | 14 (100.0%) | 55 (79.7%) |
| Total | 643 (90.9%) | 710 (67.7%) |
Income Below Poverty Among Married-Couple Families in La Villa
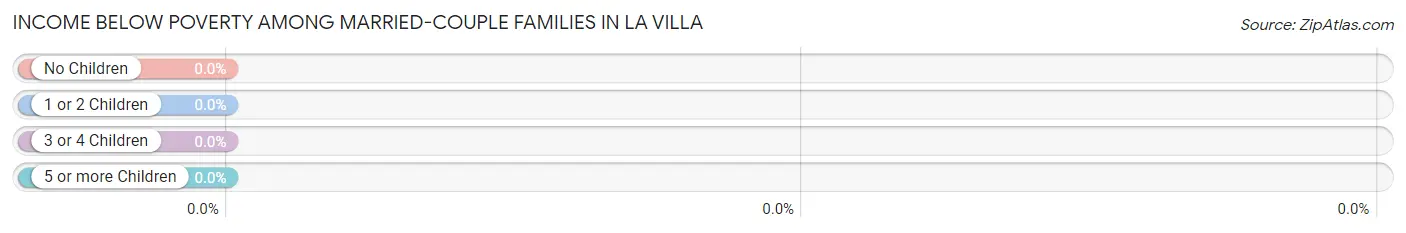
| Children | Above Poverty | Below Poverty |
| No Children | 0 (0.0%) | 0 (0.0%) |
| 1 or 2 Children | 126 (100.0%) | 0 (0.0%) |
| 3 or 4 Children | 40 (100.0%) | 0 (0.0%) |
| 5 or more Children | 0 (0.0%) | 0 (0.0%) |
| Total | 166 (100.0%) | 0 (0.0%) |
Income Below Poverty Among Single-Parent Households in La Villa
According to the poverty data in La Villa, 100.0% or 22 single-father households and 29.8% or 34 single-mother households are living below the poverty line. Among single-father households, those with 1 or 2 children have the highest poverty rate, with 22 households (100.0%) experiencing poverty. Likewise, among single-mother households, those with 3 or 4 children have the highest poverty rate, with 34 households (100.0%) falling below the poverty line.
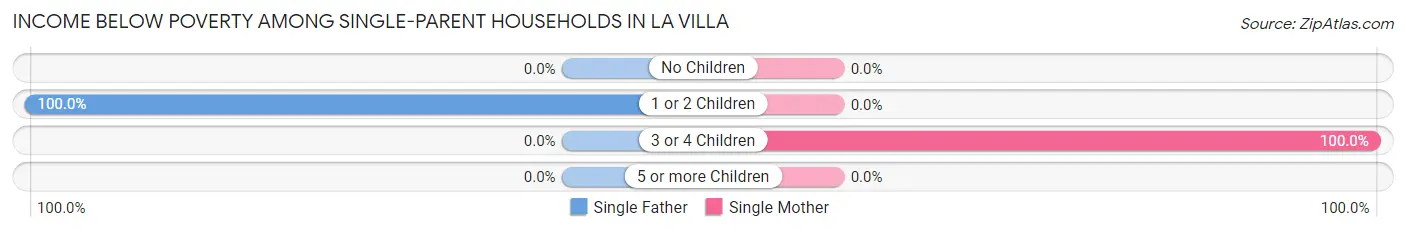
| Children | Single Father | Single Mother |
| No Children | 0 (0.0%) | 0 (0.0%) |
| 1 or 2 Children | 22 (100.0%) | 0 (0.0%) |
| 3 or 4 Children | 0 (0.0%) | 34 (100.0%) |
| 5 or more Children | 0 (0.0%) | 0 (0.0%) |
| Total | 22 (100.0%) | 34 (29.8%) |
Income Below Poverty Among Married-Couple vs Single-Parent Households in La Villa
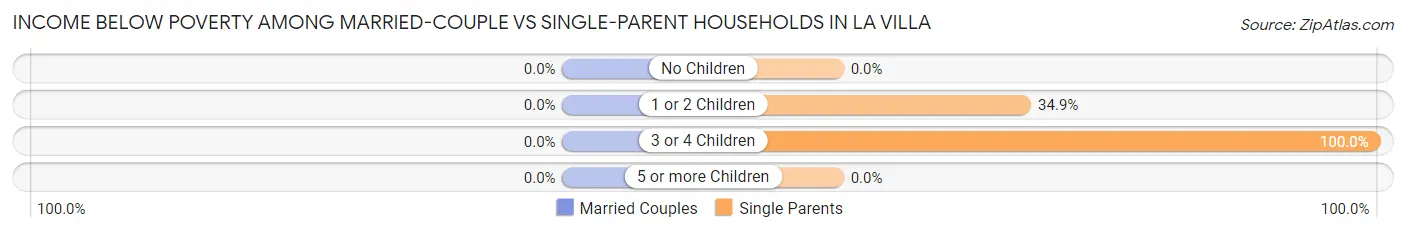
| Children | Married-Couple Families | Single-Parent Households |
| No Children | 0 (0.0%) | 0 (0.0%) |
| 1 or 2 Children | 0 (0.0%) | 22 (34.9%) |
| 3 or 4 Children | 0 (0.0%) | 34 (100.0%) |
| 5 or more Children | 0 (0.0%) | 0 (0.0%) |
| Total | 0 (0.0%) | 56 (41.2%) |
Race in La Villa
The most populous races in La Villa are Hispanic or Latino (2,852 | 99.3%), White / Caucasian (1,580 | 55.0%), and Two or more Races (770 | 26.8%).
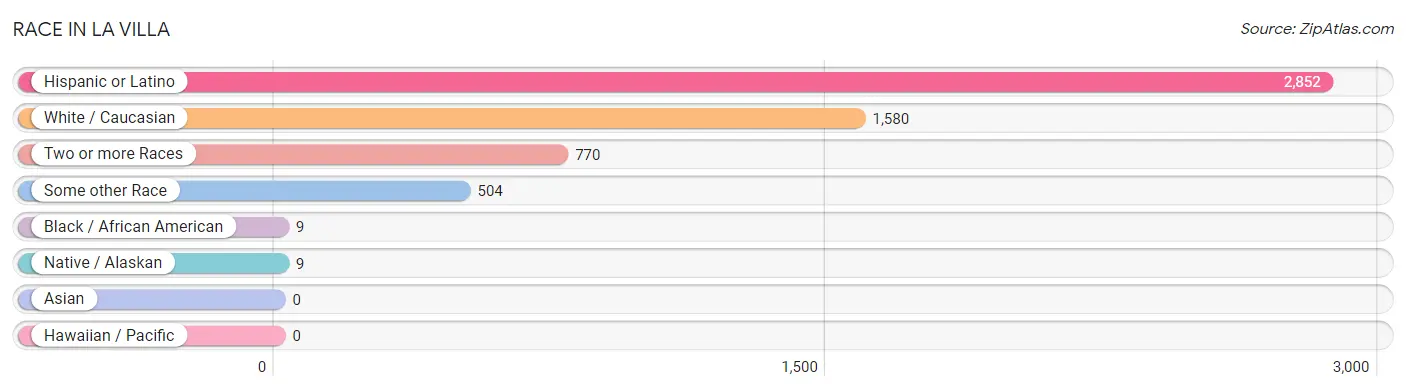
| Race | # Population | % Population |
| Asian | 0 | 0.0% |
| Black / African American | 9 | 0.3% |
| Hawaiian / Pacific | 0 | 0.0% |
| Hispanic or Latino | 2,852 | 99.3% |
| Native / Alaskan | 9 | 0.3% |
| White / Caucasian | 1,580 | 55.0% |
| Two or more Races | 770 | 26.8% |
| Some other Race | 504 | 17.5% |
| Total | 2,872 | 100.0% |
Ancestry in La Villa
The most populous ancestries reported in La Villa are Mexican (2,516 | 87.6%), Central American (211 | 7.3%), Honduran (90 | 3.1%), Guatemalan (71 | 2.5%), and Salvadoran (50 | 1.7%), together accounting for 102.3% of all La Villa residents.
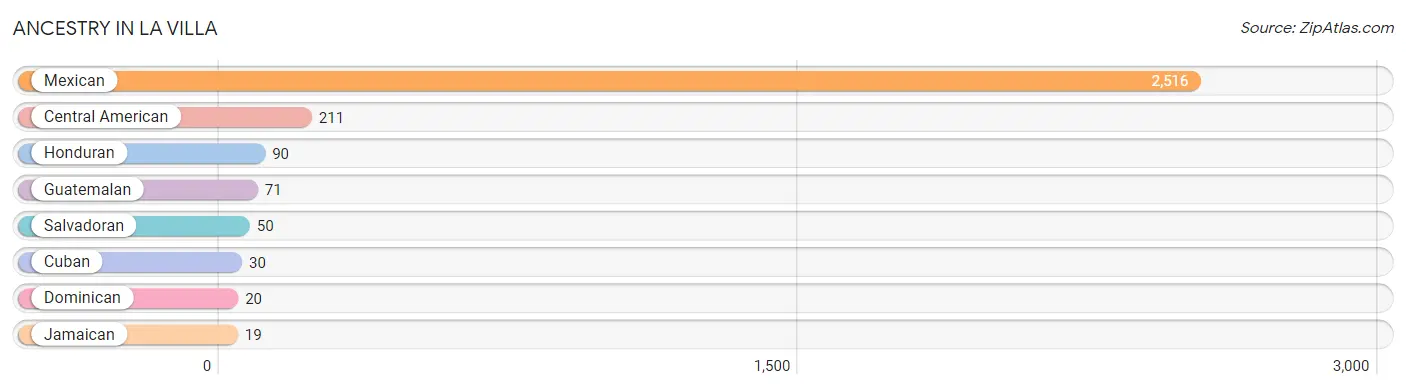
| Ancestry | # Population | % Population |
| Central American | 211 | 7.3% |
| Cuban | 30 | 1.0% |
| Dominican | 20 | 0.7% |
| Guatemalan | 71 | 2.5% |
| Honduran | 90 | 3.1% |
| Jamaican | 19 | 0.7% |
| Mexican | 2,516 | 87.6% |
| Salvadoran | 50 | 1.7% | View All 8 Rows |
Immigrants in La Villa
The most numerous immigrant groups reported in La Villa came from Latin America (934 | 32.5%), Central America (885 | 30.8%), Mexico (655 | 22.8%), Honduras (91 | 3.2%), and Guatemala (71 | 2.5%), together accounting for 91.8% of all La Villa residents.
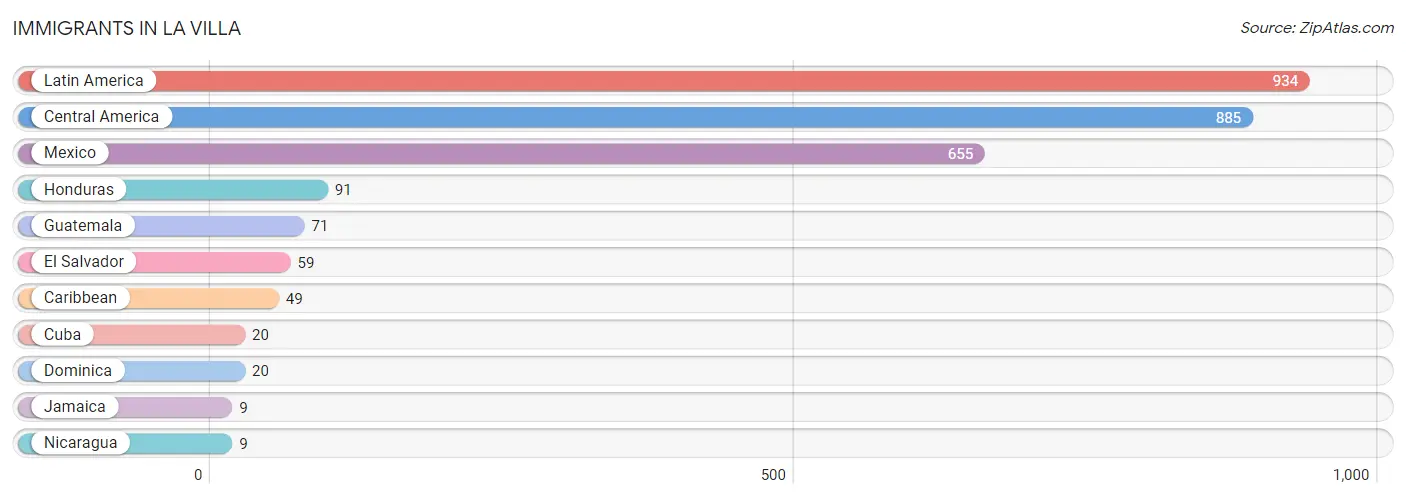
| Immigration Origin | # Population | % Population |
| Caribbean | 49 | 1.7% |
| Central America | 885 | 30.8% |
| Cuba | 20 | 0.7% |
| Dominica | 20 | 0.7% |
| El Salvador | 59 | 2.1% |
| Guatemala | 71 | 2.5% |
| Honduras | 91 | 3.2% |
| Jamaica | 9 | 0.3% |
| Latin America | 934 | 32.5% |
| Mexico | 655 | 22.8% |
| Nicaragua | 9 | 0.3% | View All 11 Rows |
Sex and Age in La Villa
Sex and Age in La Villa
The most populous age groups in La Villa are 40 to 44 Years (250 | 14.9%) for men and 15 to 19 Years (178 | 14.9%) for women.
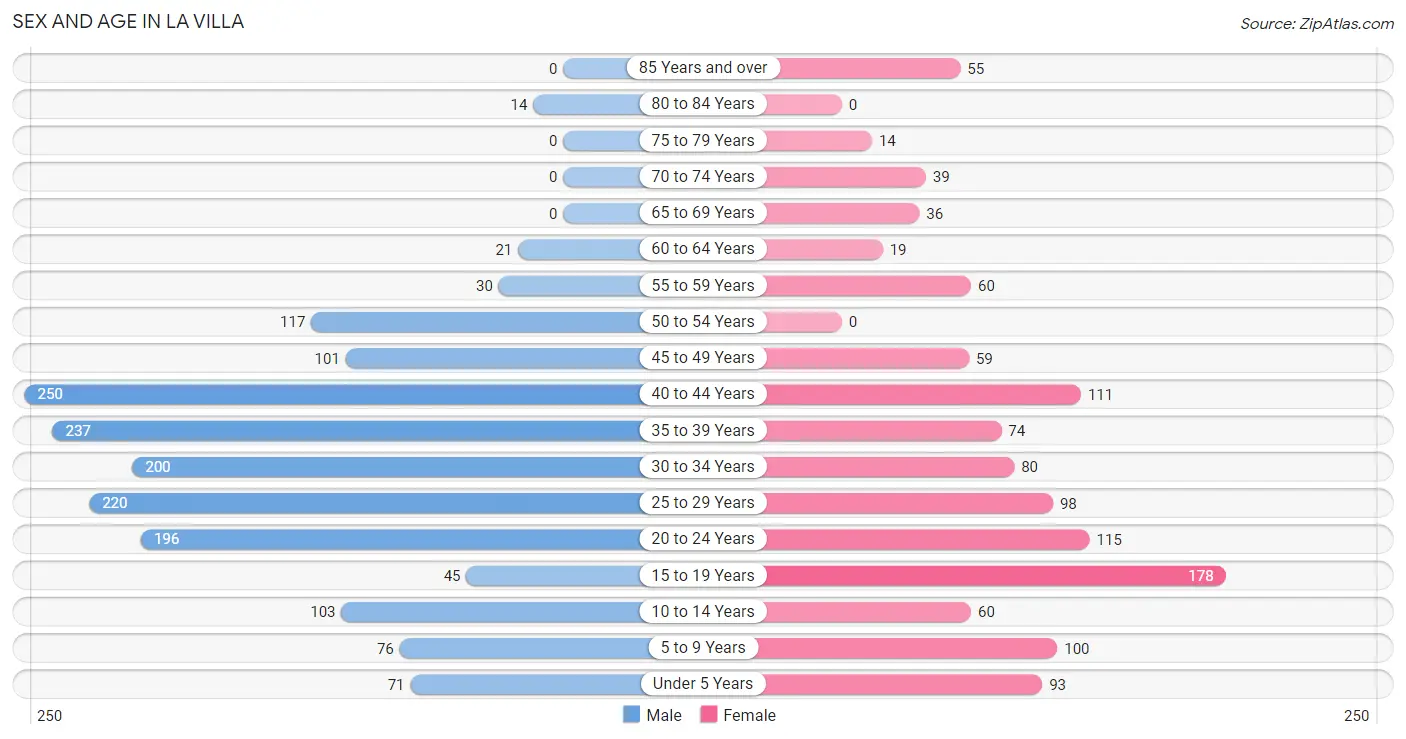
| Age Bracket | Male | Female |
| Under 5 Years | 71 (4.2%) | 93 (7.8%) |
| 5 to 9 Years | 76 (4.5%) | 100 (8.4%) |
| 10 to 14 Years | 103 (6.1%) | 60 (5.0%) |
| 15 to 19 Years | 45 (2.7%) | 178 (14.9%) |
| 20 to 24 Years | 196 (11.7%) | 115 (9.7%) |
| 25 to 29 Years | 220 (13.1%) | 98 (8.2%) |
| 30 to 34 Years | 200 (11.9%) | 80 (6.7%) |
| 35 to 39 Years | 237 (14.1%) | 74 (6.2%) |
| 40 to 44 Years | 250 (14.9%) | 111 (9.3%) |
| 45 to 49 Years | 101 (6.0%) | 59 (5.0%) |
| 50 to 54 Years | 117 (7.0%) | 0 (0.0%) |
| 55 to 59 Years | 30 (1.8%) | 60 (5.0%) |
| 60 to 64 Years | 21 (1.3%) | 19 (1.6%) |
| 65 to 69 Years | 0 (0.0%) | 36 (3.0%) |
| 70 to 74 Years | 0 (0.0%) | 39 (3.3%) |
| 75 to 79 Years | 0 (0.0%) | 14 (1.2%) |
| 80 to 84 Years | 14 (0.8%) | 0 (0.0%) |
| 85 Years and over | 0 (0.0%) | 55 (4.6%) |
| Total | 1,681 (100.0%) | 1,191 (100.0%) |
Families and Households in La Villa
Median Family Size in La Villa
The median family size in La Villa is 5.15 persons per family, with single female/mother families (114 | 37.8%) accounting for the largest median family size of 5.89 persons per family. On the other hand, single male/father families (22 | 7.3%) represent the smallest median family size with 3.14 persons per family.
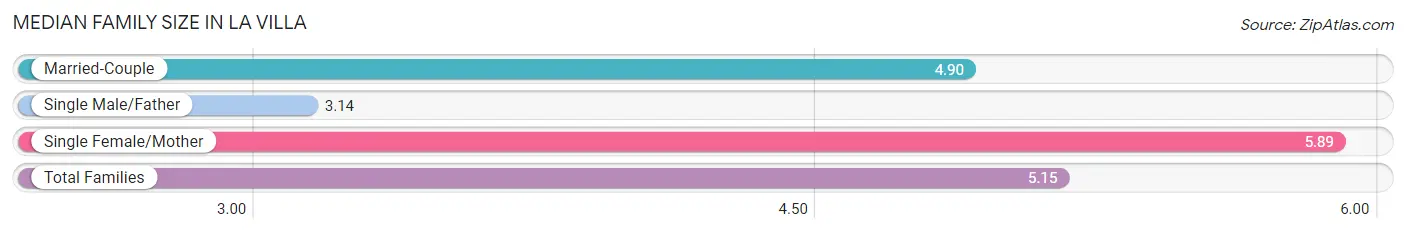
| Family Type | # Families | Family Size |
| Married-Couple | 166 (55.0%) | 4.90 |
| Single Male/Father | 22 (7.3%) | 3.14 |
| Single Female/Mother | 114 (37.8%) | 5.89 |
| Total Families | 302 (100.0%) | 5.15 |
Median Household Size in La Villa
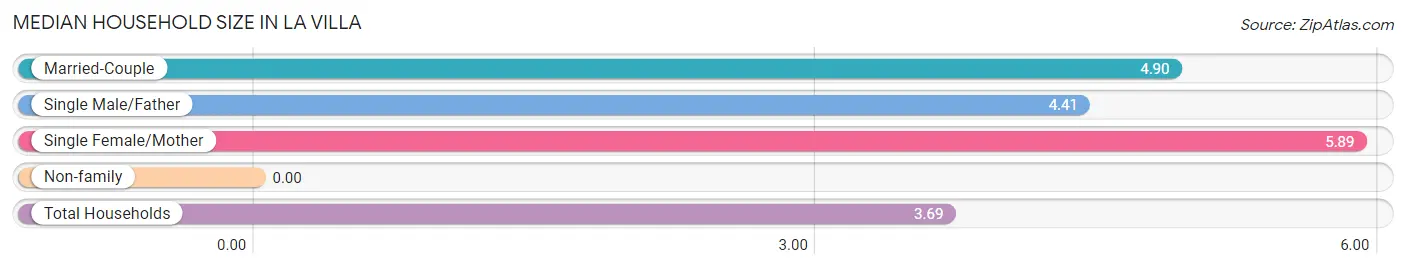
| Household Type | # Households | Household Size |
| Married-Couple | 166 (34.9%) | 4.90 |
| Single Male/Father | 22 (4.6%) | 4.41 |
| Single Female/Mother | 114 (23.9%) | 5.89 |
| Non-family | 174 (36.5%) | - |
| Total Households | 476 (100.0%) | 3.69 |
Household Size by Marriage Status in La Villa
Out of a total of 476 households in La Villa, 302 (63.4%) are family households, while 174 (36.5%) are nonfamily households. The most numerous type of family households are 4-person households, comprising 119, and the most common type of nonfamily households are 1-person households, comprising 174.
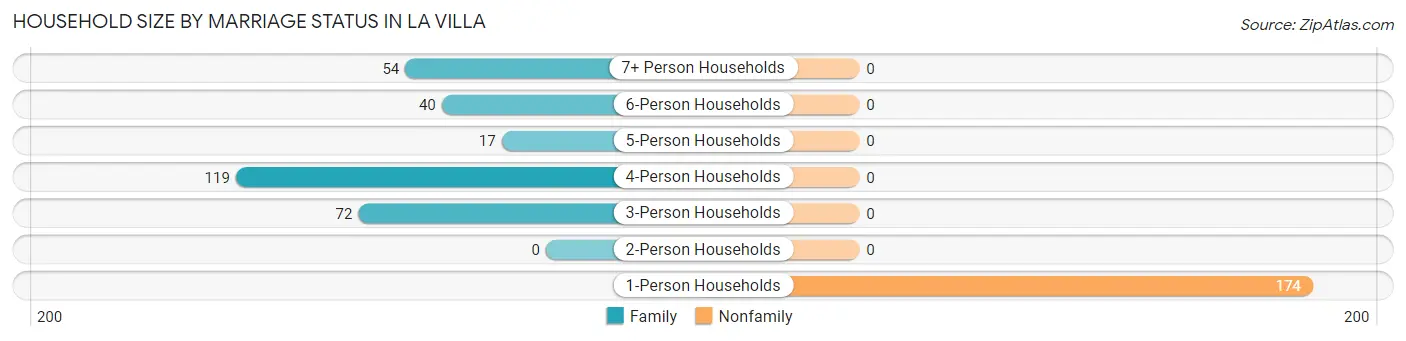
| Household Size | Family Households | Nonfamily Households |
| 1-Person Households | - | 174 (36.5%) |
| 2-Person Households | 0 (0.0%) | 0 (0.0%) |
| 3-Person Households | 72 (15.1%) | 0 (0.0%) |
| 4-Person Households | 119 (25.0%) | 0 (0.0%) |
| 5-Person Households | 17 (3.6%) | 0 (0.0%) |
| 6-Person Households | 40 (8.4%) | 0 (0.0%) |
| 7+ Person Households | 54 (11.3%) | 0 (0.0%) |
| Total | 302 (63.4%) | 174 (36.5%) |
Female Fertility in La Villa
Fertility by Age in La Villa
| Age Bracket | Women with Births | Births / 1,000 Women |
| 15 to 19 years | 0 (0.0%) | 0.0 |
| 20 to 34 years | 0 (0.0%) | 0.0 |
| 35 to 50 years | 0 (0.0%) | 0.0 |
| Total | 0 (0.0%) | 0.0 |
Fertility by Age by Marriage Status in La Villa
| Age Bracket | Married | Unmarried |
| 15 to 19 years | 0 (0.0%) | 0 (0.0%) |
| 20 to 34 years | 0 (0.0%) | 0 (0.0%) |
| 35 to 50 years | 0 (0.0%) | 0 (0.0%) |
| Total | 0 (0.0%) | 0 (0.0%) |
Fertility by Education in La Villa
| Educational Attainment | Women with Births | Births / 1,000 Women |
| Less than High School | 0 (0.0%) | 0.0 |
| High School Diploma | 0 (0.0%) | 0.0 |
| College or Associate's Degree | 0 (0.0%) | 0.0 |
| Bachelor's Degree | 0 (0.0%) | 0.0 |
| Graduate Degree | 0 (0.0%) | 0.0 |
| Total | 0 (0.0%) | 0.0 |
Fertility by Education by Marriage Status in La Villa
| Educational Attainment | Married | Unmarried |
| Less than High School | 0 (0.0%) | 0 (0.0%) |
| High School Diploma | 0 (0.0%) | 0 (0.0%) |
| College or Associate's Degree | 0 (0.0%) | 0 (0.0%) |
| Bachelor's Degree | 0 (0.0%) | 0 (0.0%) |
| Graduate Degree | 0 (0.0%) | 0 (0.0%) |
| Total | 0 (0.0%) | 0 (0.0%) |
Employment Characteristics in La Villa
Employment by Class of Employer in La Villa
Among the 789 employed individuals in La Villa, private company employees (459 | 58.2%), state government employees (87 | 11.0%), and self-employed (not incorporated) (84 | 10.6%) make up the most common classes of employment.
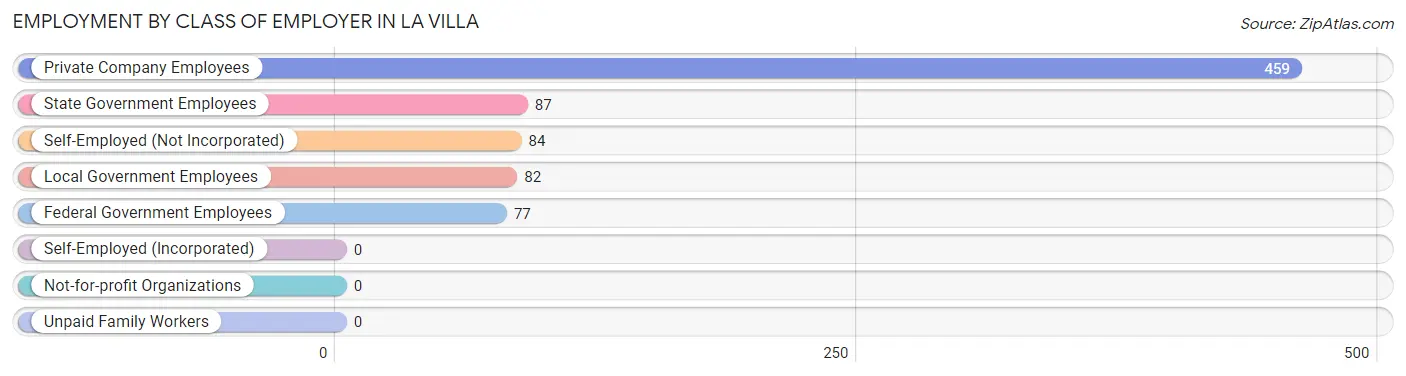
| Employer Class | # Employees | % Employees |
| Private Company Employees | 459 | 58.2% |
| Self-Employed (Incorporated) | 0 | 0.0% |
| Self-Employed (Not Incorporated) | 84 | 10.6% |
| Not-for-profit Organizations | 0 | 0.0% |
| Local Government Employees | 82 | 10.4% |
| State Government Employees | 87 | 11.0% |
| Federal Government Employees | 77 | 9.8% |
| Unpaid Family Workers | 0 | 0.0% |
| Total | 789 | 100.0% |
Employment Status by Age in La Villa
According to the labor force statistics for La Villa, out of the total population over 16 years of age (2,339), 34.3% or 802 individuals are in the labor force, with 1.6% or 13 of them unemployed. The age group with the highest labor force participation rate is 25 to 29 years, with 61.3% or 195 individuals in the labor force. Within the labor force, the 20 to 24 years age range has the highest percentage of unemployed individuals, with 9.8% or 13 of them being unemployed.
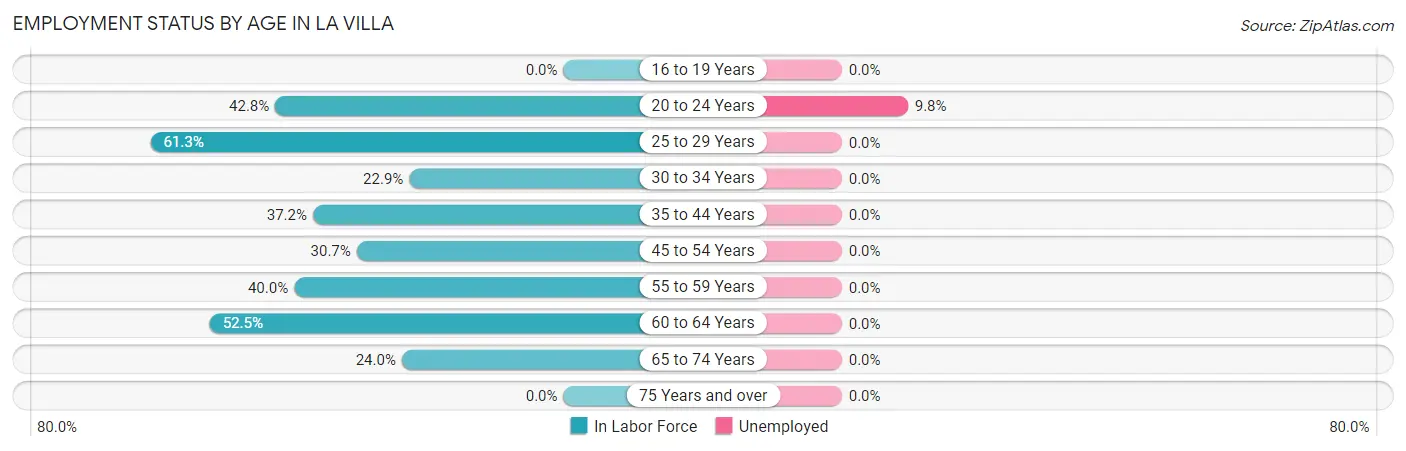
| Age Bracket | In Labor Force | Unemployed |
| 16 to 19 Years | 0 (0.0%) | 0 (0.0%) |
| 20 to 24 Years | 133 (42.8%) | 13 (9.8%) |
| 25 to 29 Years | 195 (61.3%) | 0 (0.0%) |
| 30 to 34 Years | 64 (22.9%) | 0 (0.0%) |
| 35 to 44 Years | 250 (37.2%) | 0 (0.0%) |
| 45 to 54 Years | 85 (30.7%) | 0 (0.0%) |
| 55 to 59 Years | 36 (40.0%) | 0 (0.0%) |
| 60 to 64 Years | 21 (52.5%) | 0 (0.0%) |
| 65 to 74 Years | 18 (24.0%) | 0 (0.0%) |
| 75 Years and over | 0 (0.0%) | 0 (0.0%) |
| Total | 802 (34.3%) | 13 (1.6%) |
Employment Status by Educational Attainment in La Villa
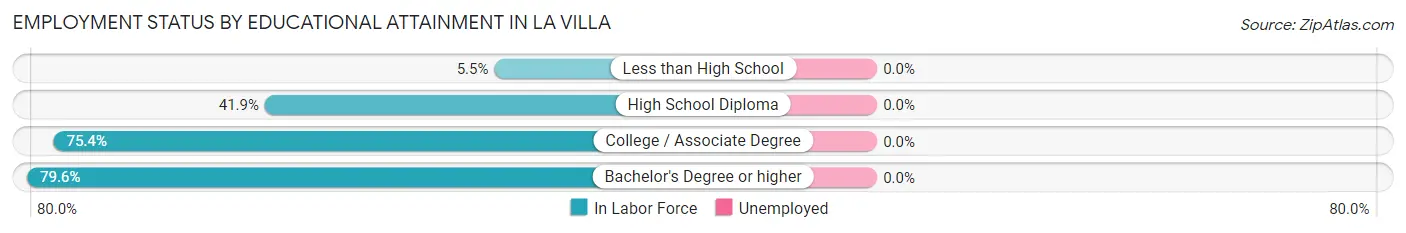
| Educational Attainment | In Labor Force | Unemployed |
| Less than High School | 38 (5.5%) | 0 (0.0%) |
| High School Diploma | 171 (41.9%) | 0 (0.0%) |
| College / Associate Degree | 321 (75.4%) | 0 (0.0%) |
| Bachelor's Degree or higher | 121 (79.6%) | 0 (0.0%) |
| Total | 651 (38.8%) | 0 (0.0%) |
Employment Occupations by Sex in La Villa
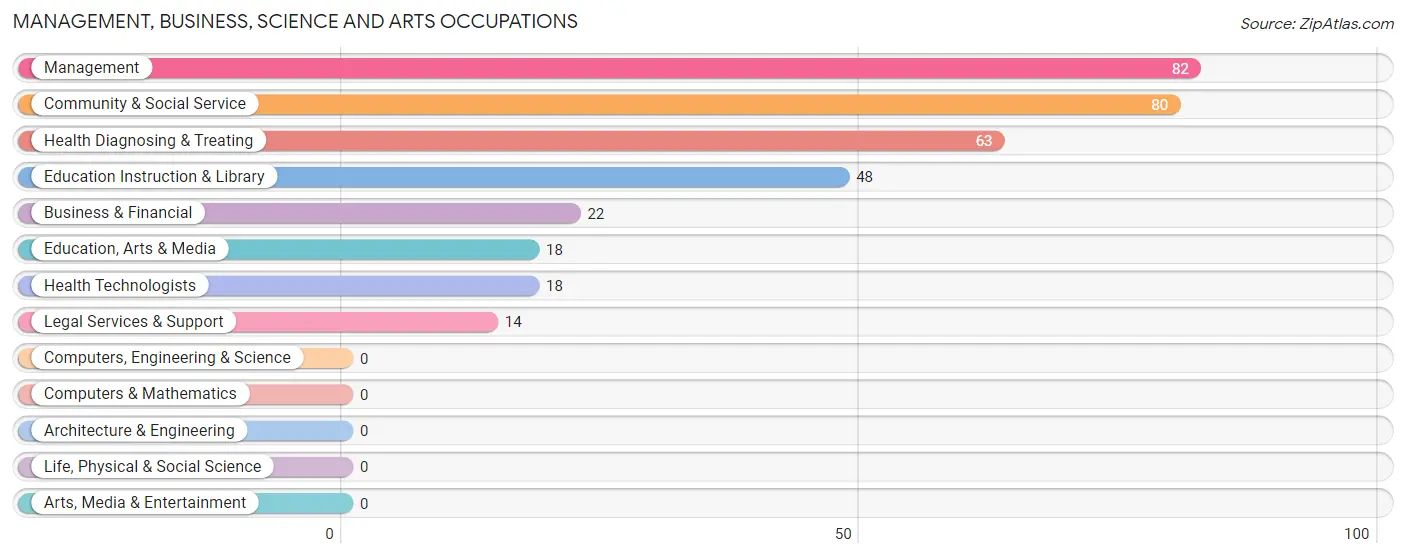
Management, Business, Science and Arts Occupations
The most common Management, Business, Science and Arts occupations in La Villa are Management (82 | 10.4%), Community & Social Service (80 | 10.1%), Health Diagnosing & Treating (63 | 8.0%), Education Instruction & Library (48 | 6.1%), and Business & Financial (22 | 2.8%).
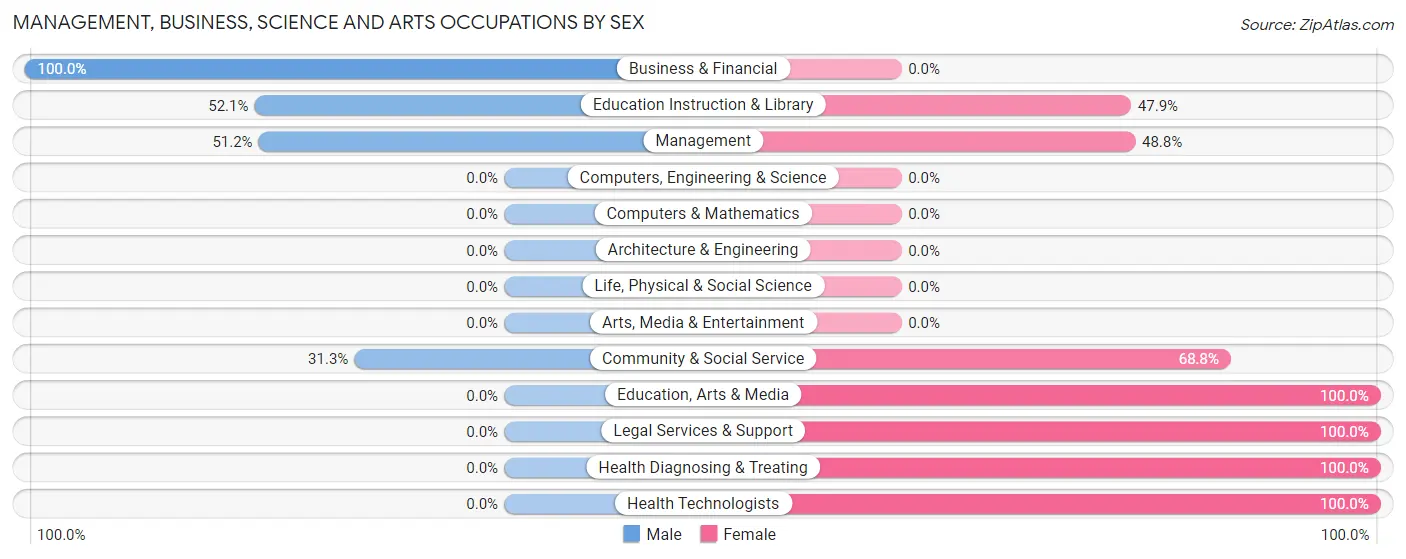
Management, Business, Science and Arts Occupations by Sex
Within the Management, Business, Science and Arts occupations in La Villa, the most male-oriented occupations are Business & Financial (100.0%), Education Instruction & Library (52.1%), and Management (51.2%), while the most female-oriented occupations are Education, Arts & Media (100.0%), Legal Services & Support (100.0%), and Health Diagnosing & Treating (100.0%).
| Occupation | Male | Female |
| Management | 42 (51.2%) | 40 (48.8%) |
| Business & Financial | 22 (100.0%) | 0 (0.0%) |
| Computers, Engineering & Science | 0 (0.0%) | 0 (0.0%) |
| Computers & Mathematics | 0 (0.0%) | 0 (0.0%) |
| Architecture & Engineering | 0 (0.0%) | 0 (0.0%) |
| Life, Physical & Social Science | 0 (0.0%) | 0 (0.0%) |
| Community & Social Service | 25 (31.2%) | 55 (68.8%) |
| Education, Arts & Media | 0 (0.0%) | 18 (100.0%) |
| Legal Services & Support | 0 (0.0%) | 14 (100.0%) |
| Education Instruction & Library | 25 (52.1%) | 23 (47.9%) |
| Arts, Media & Entertainment | 0 (0.0%) | 0 (0.0%) |
| Health Diagnosing & Treating | 0 (0.0%) | 63 (100.0%) |
| Health Technologists | 0 (0.0%) | 18 (100.0%) |
| Total (Category) | 89 (36.0%) | 158 (64.0%) |
| Total (Overall) | 412 (52.2%) | 377 (47.8%) |
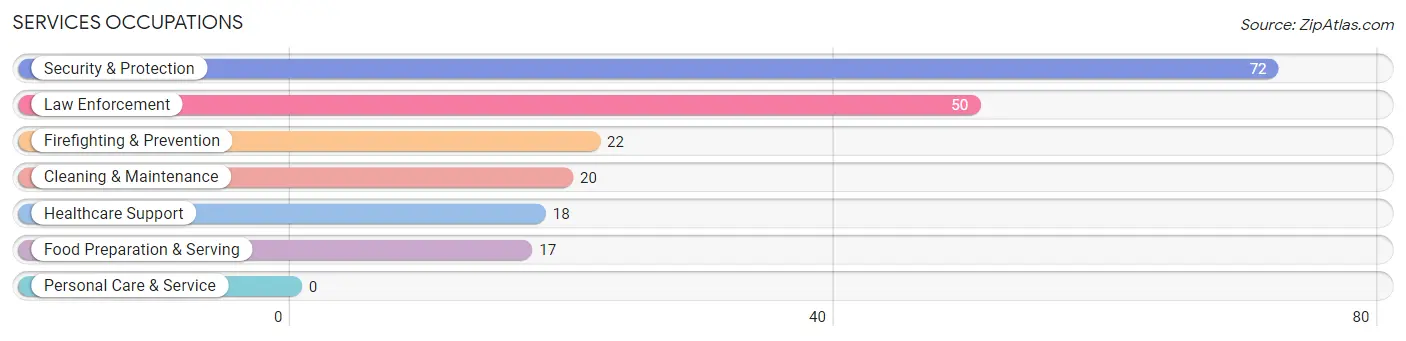
Services Occupations
The most common Services occupations in La Villa are Security & Protection (72 | 9.1%), Law Enforcement (50 | 6.3%), Firefighting & Prevention (22 | 2.8%), Cleaning & Maintenance (20 | 2.5%), and Healthcare Support (18 | 2.3%).
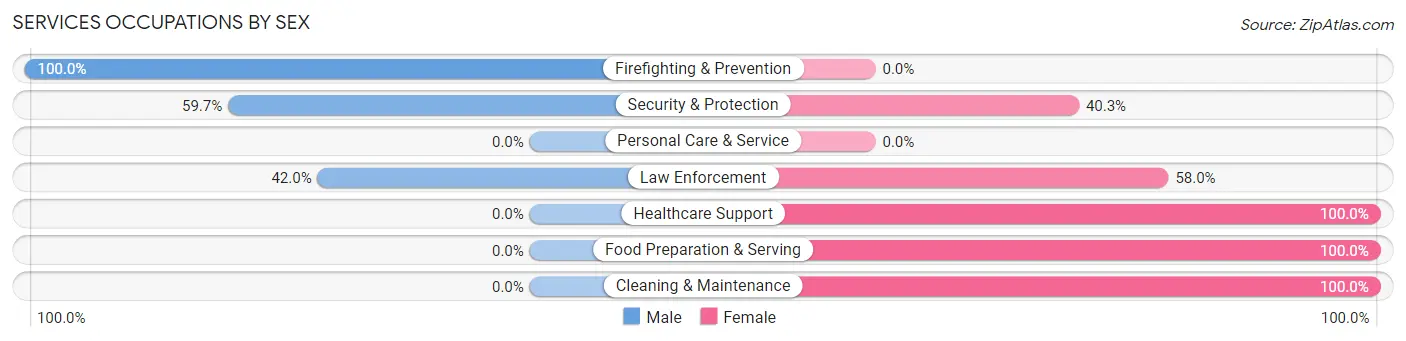
Services Occupations by Sex
Within the Services occupations in La Villa, the most male-oriented occupations are Firefighting & Prevention (100.0%), Security & Protection (59.7%), and Law Enforcement (42.0%), while the most female-oriented occupations are Healthcare Support (100.0%), Food Preparation & Serving (100.0%), and Cleaning & Maintenance (100.0%).
| Occupation | Male | Female |
| Healthcare Support | 0 (0.0%) | 18 (100.0%) |
| Security & Protection | 43 (59.7%) | 29 (40.3%) |
| Firefighting & Prevention | 22 (100.0%) | 0 (0.0%) |
| Law Enforcement | 21 (42.0%) | 29 (58.0%) |
| Food Preparation & Serving | 0 (0.0%) | 17 (100.0%) |
| Cleaning & Maintenance | 0 (0.0%) | 20 (100.0%) |
| Personal Care & Service | 0 (0.0%) | 0 (0.0%) |
| Total (Category) | 43 (33.9%) | 84 (66.1%) |
| Total (Overall) | 412 (52.2%) | 377 (47.8%) |
Sales and Office Occupations
The most common Sales and Office occupations in La Villa are Sales & Related (126 | 16.0%), and Office & Administration (48 | 6.1%).

Sales and Office Occupations by Sex
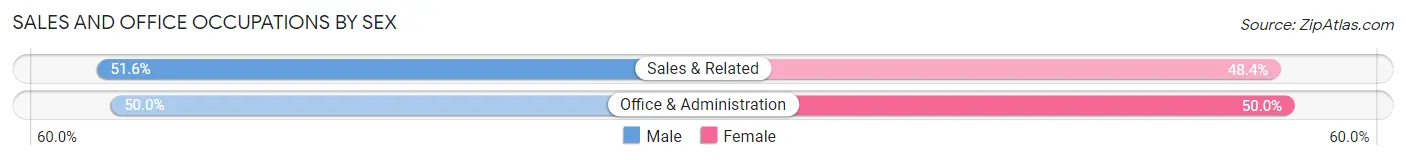
| Occupation | Male | Female |
| Sales & Related | 65 (51.6%) | 61 (48.4%) |
| Office & Administration | 24 (50.0%) | 24 (50.0%) |
| Total (Category) | 89 (51.1%) | 85 (48.8%) |
| Total (Overall) | 412 (52.2%) | 377 (47.8%) |
Natural Resources, Construction and Maintenance Occupations
The most common Natural Resources, Construction and Maintenance occupations in La Villa are Installation, Maintenance & Repair (92 | 11.7%), Farming, Fishing & Forestry (30 | 3.8%), and Construction & Extraction (22 | 2.8%).
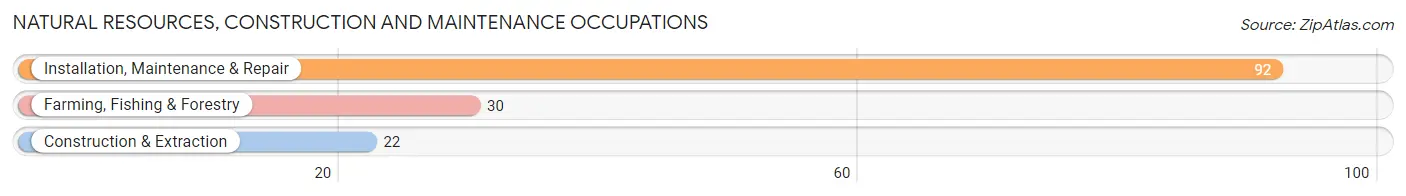
Natural Resources, Construction and Maintenance Occupations by Sex

| Occupation | Male | Female |
| Farming, Fishing & Forestry | 30 (100.0%) | 0 (0.0%) |
| Construction & Extraction | 22 (100.0%) | 0 (0.0%) |
| Installation, Maintenance & Repair | 61 (66.3%) | 31 (33.7%) |
| Total (Category) | 113 (78.5%) | 31 (21.5%) |
| Total (Overall) | 412 (52.2%) | 377 (47.8%) |
Production, Transportation and Moving Occupations
The most common Production, Transportation and Moving occupations in La Villa are , and Transportation (97 | 12.3%).
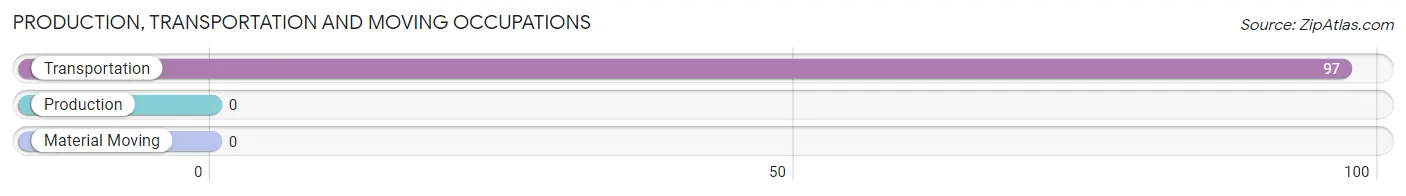
Production, Transportation and Moving Occupations by Sex
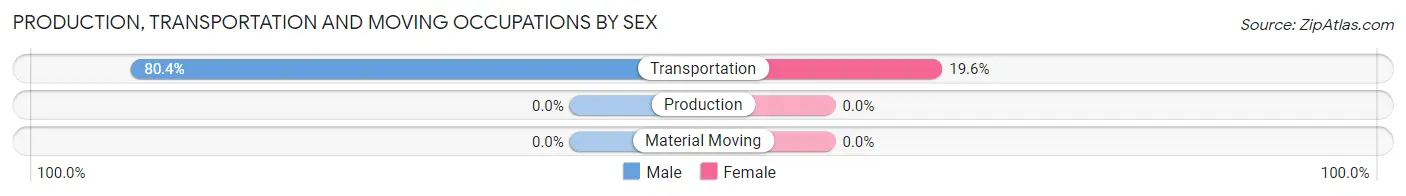
| Occupation | Male | Female |
| Production | 0 (0.0%) | 0 (0.0%) |
| Transportation | 78 (80.4%) | 19 (19.6%) |
| Material Moving | 0 (0.0%) | 0 (0.0%) |
| Total (Category) | 78 (80.4%) | 19 (19.6%) |
| Total (Overall) | 412 (52.2%) | 377 (47.8%) |
Employment Industries by Sex in La Villa
Employment Industries in La Villa
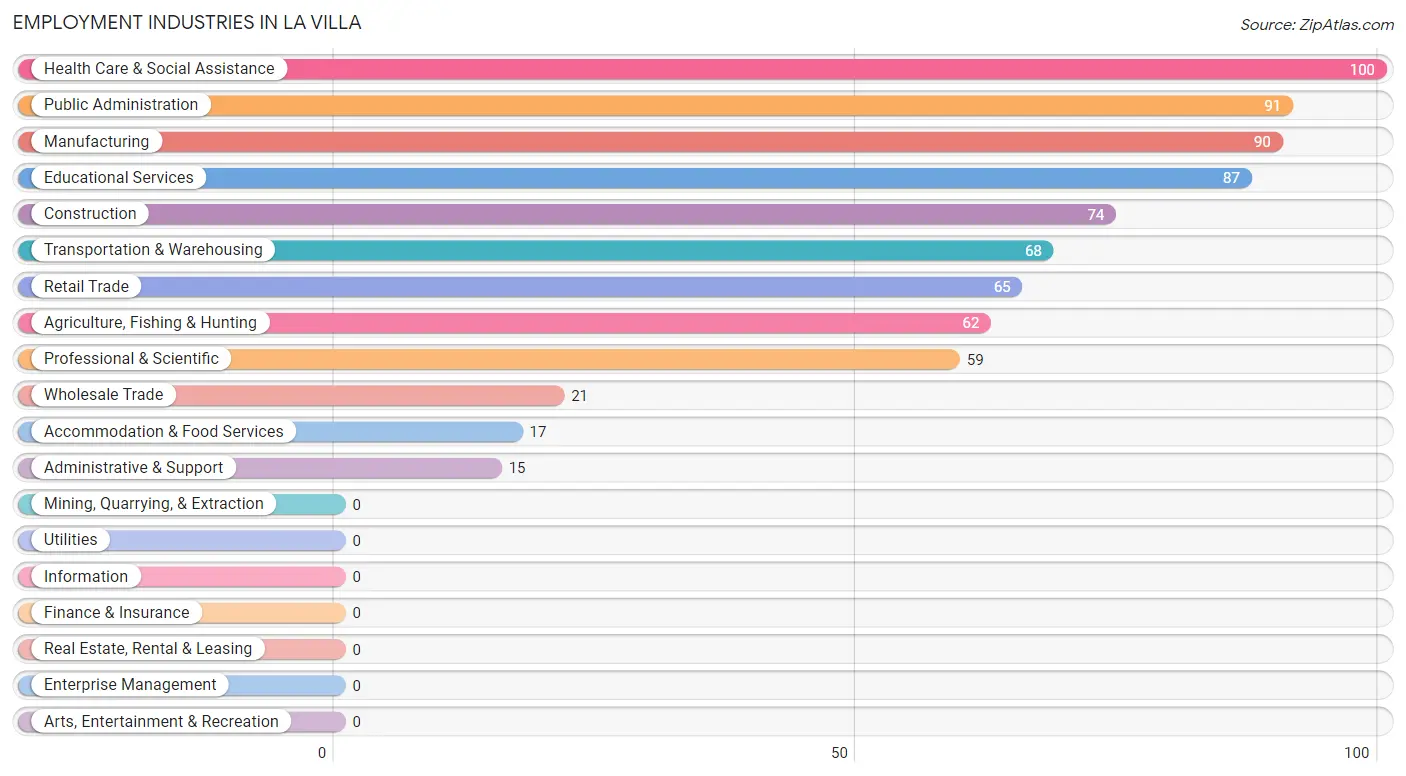
The major employment industries in La Villa include Health Care & Social Assistance (100 | 12.7%), Public Administration (91 | 11.5%), Manufacturing (90 | 11.4%), Educational Services (87 | 11.0%), and Construction (74 | 9.4%).
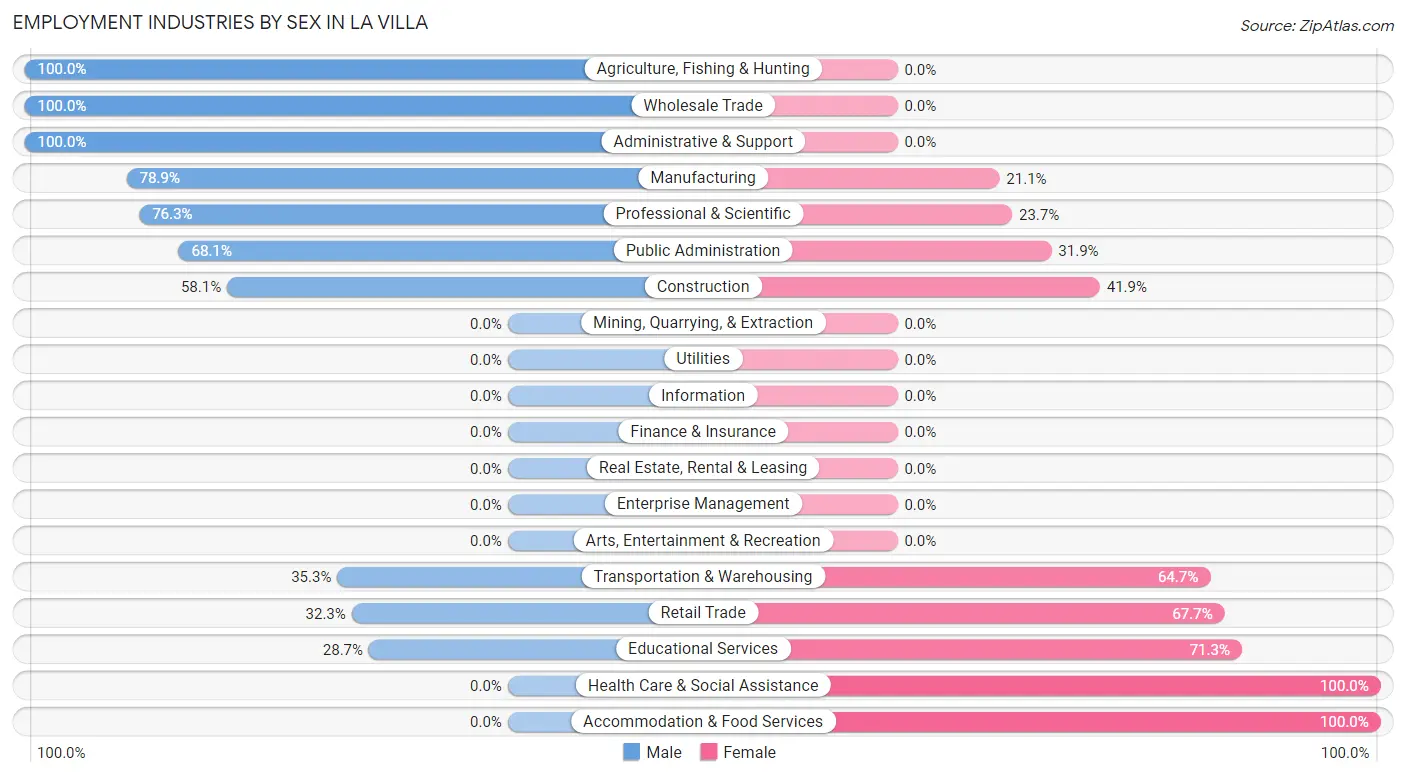
Employment Industries by Sex in La Villa
The La Villa industries that see more men than women are Agriculture, Fishing & Hunting (100.0%), Wholesale Trade (100.0%), and Administrative & Support (100.0%), whereas the industries that tend to have a higher number of women are Health Care & Social Assistance (100.0%), Accommodation & Food Services (100.0%), and Educational Services (71.3%).
| Industry | Male | Female |
| Agriculture, Fishing & Hunting | 62 (100.0%) | 0 (0.0%) |
| Mining, Quarrying, & Extraction | 0 (0.0%) | 0 (0.0%) |
| Construction | 43 (58.1%) | 31 (41.9%) |
| Manufacturing | 71 (78.9%) | 19 (21.1%) |
| Wholesale Trade | 21 (100.0%) | 0 (0.0%) |
| Retail Trade | 21 (32.3%) | 44 (67.7%) |
| Transportation & Warehousing | 24 (35.3%) | 44 (64.7%) |
| Utilities | 0 (0.0%) | 0 (0.0%) |
| Information | 0 (0.0%) | 0 (0.0%) |
| Finance & Insurance | 0 (0.0%) | 0 (0.0%) |
| Real Estate, Rental & Leasing | 0 (0.0%) | 0 (0.0%) |
| Professional & Scientific | 45 (76.3%) | 14 (23.7%) |
| Enterprise Management | 0 (0.0%) | 0 (0.0%) |
| Administrative & Support | 15 (100.0%) | 0 (0.0%) |
| Educational Services | 25 (28.7%) | 62 (71.3%) |
| Health Care & Social Assistance | 0 (0.0%) | 100 (100.0%) |
| Arts, Entertainment & Recreation | 0 (0.0%) | 0 (0.0%) |
| Accommodation & Food Services | 0 (0.0%) | 17 (100.0%) |
| Public Administration | 62 (68.1%) | 29 (31.9%) |
| Total | 412 (52.2%) | 377 (47.8%) |
Education in La Villa
School Enrollment in La Villa
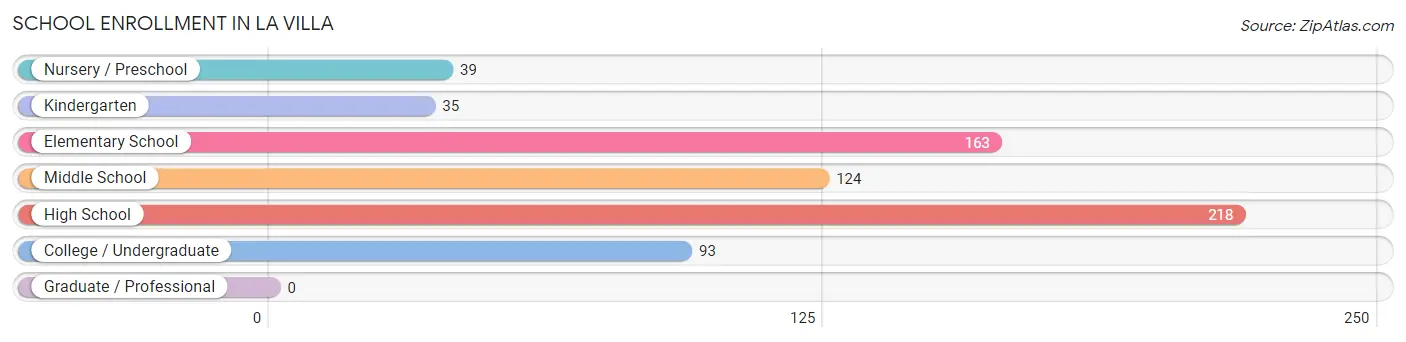
The most common levels of schooling among the 672 students in La Villa are high school (218 | 32.4%), elementary school (163 | 24.3%), and middle school (124 | 18.4%).
| School Level | # Students | % Students |
| Nursery / Preschool | 39 | 5.8% |
| Kindergarten | 35 | 5.2% |
| Elementary School | 163 | 24.3% |
| Middle School | 124 | 18.4% |
| High School | 218 | 32.4% |
| College / Undergraduate | 93 | 13.8% |
| Graduate / Professional | 0 | 0.0% |
| Total | 672 | 100.0% |
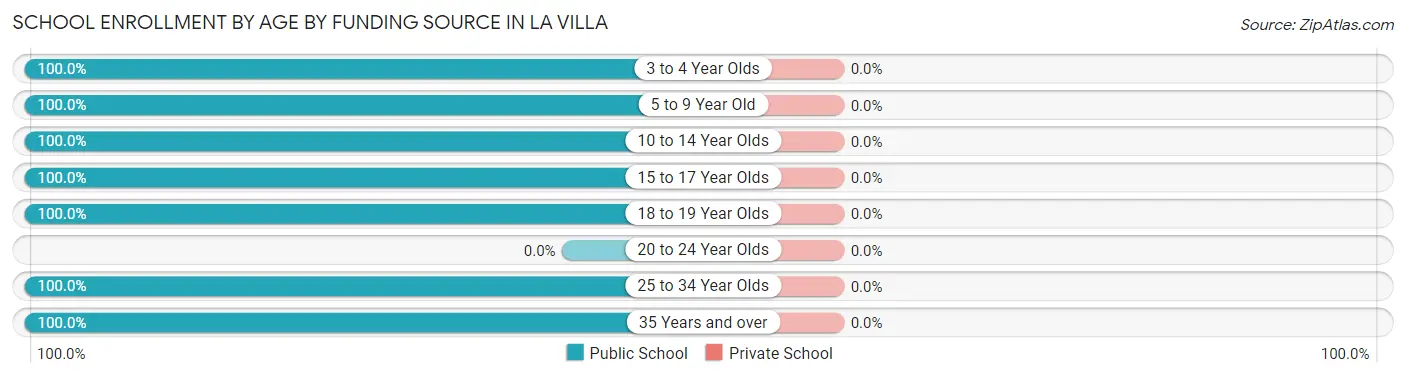
School Enrollment by Age by Funding Source in La Villa
| Age Bracket | Public School | Private School |
| 3 to 4 Year Olds | 39 (100.0%) | 0 (0.0%) |
| 5 to 9 Year Old | 176 (100.0%) | 0 (0.0%) |
| 10 to 14 Year Olds | 163 (100.0%) | 0 (0.0%) |
| 15 to 17 Year Olds | 147 (100.0%) | 0 (0.0%) |
| 18 to 19 Year Olds | 38 (100.0%) | 0 (0.0%) |
| 20 to 24 Year Olds | 0 (0.0%) | 0 (0.0%) |
| 25 to 34 Year Olds | 44 (100.0%) | 0 (0.0%) |
| 35 Years and over | 65 (100.0%) | 0 (0.0%) |
| Total | 672 (100.0%) | 0 (0.0%) |
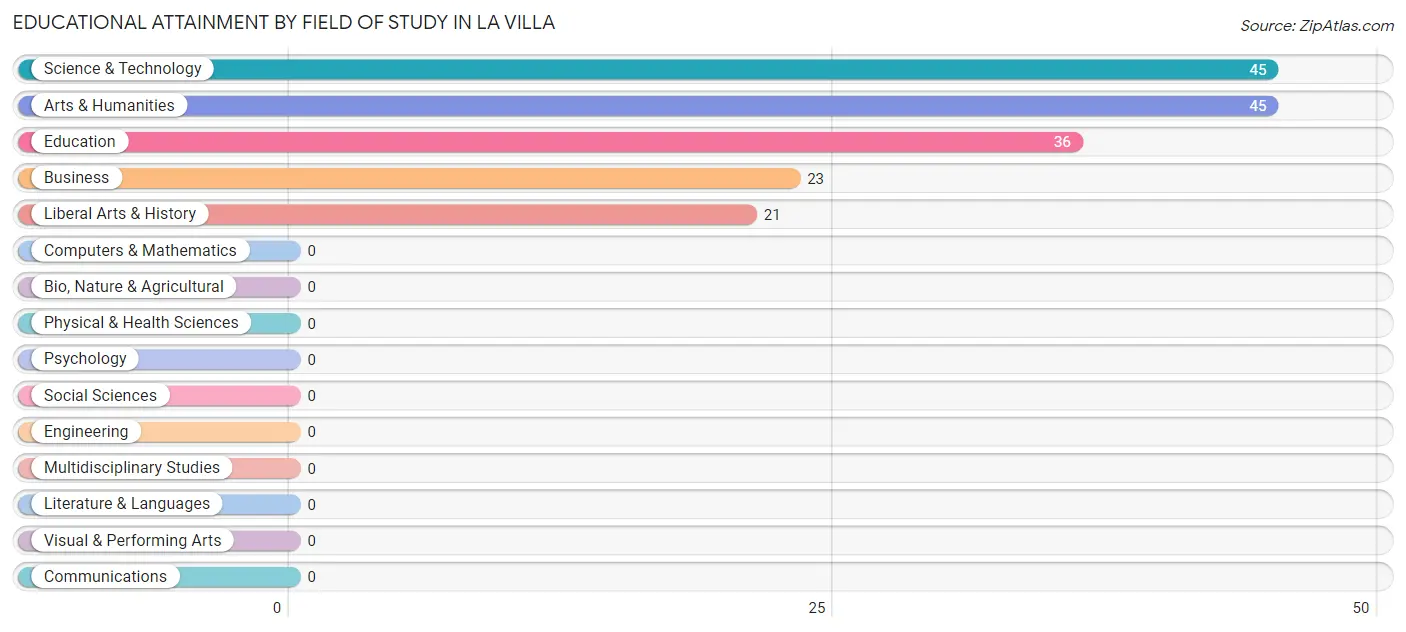
Educational Attainment by Field of Study in La Villa
Science & technology (45 | 26.5%), arts & humanities (45 | 26.5%), education (36 | 21.2%), business (23 | 13.5%), and liberal arts & history (21 | 12.3%) are the most common fields of study among 170 individuals in La Villa who have obtained a bachelor's degree or higher.
| Field of Study | # Graduates | % Graduates |
| Computers & Mathematics | 0 | 0.0% |
| Bio, Nature & Agricultural | 0 | 0.0% |
| Physical & Health Sciences | 0 | 0.0% |
| Psychology | 0 | 0.0% |
| Social Sciences | 0 | 0.0% |
| Engineering | 0 | 0.0% |
| Multidisciplinary Studies | 0 | 0.0% |
| Science & Technology | 45 | 26.5% |
| Business | 23 | 13.5% |
| Education | 36 | 21.2% |
| Literature & Languages | 0 | 0.0% |
| Liberal Arts & History | 21 | 12.3% |
| Visual & Performing Arts | 0 | 0.0% |
| Communications | 0 | 0.0% |
| Arts & Humanities | 45 | 26.5% |
| Total | 170 | 100.0% |
Transportation & Commute in La Villa
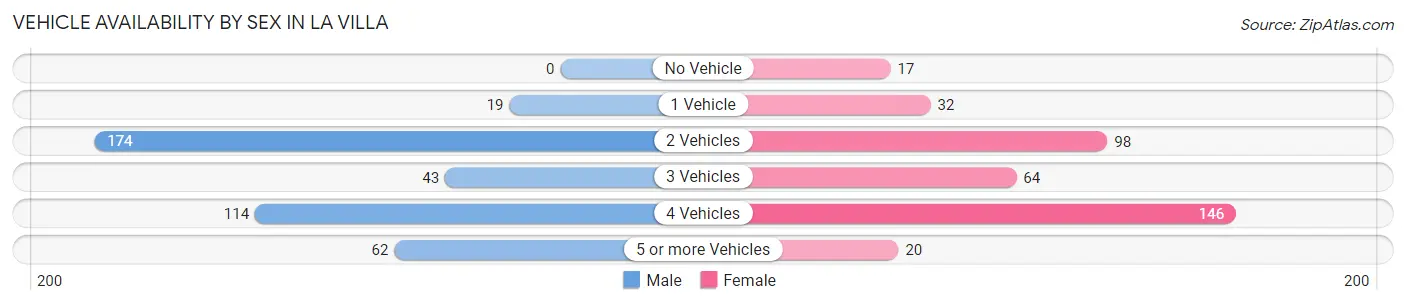
Vehicle Availability by Sex in La Villa
The most prevalent vehicle ownership categories in La Villa are males with 2 vehicles (174, accounting for 42.2%) and females with 2 vehicles (98, making up 46.2%).
| Vehicles Available | Male | Female |
| No Vehicle | 0 (0.0%) | 17 (4.5%) |
| 1 Vehicle | 19 (4.6%) | 32 (8.5%) |
| 2 Vehicles | 174 (42.2%) | 98 (26.0%) |
| 3 Vehicles | 43 (10.4%) | 64 (17.0%) |
| 4 Vehicles | 114 (27.7%) | 146 (38.7%) |
| 5 or more Vehicles | 62 (15.0%) | 20 (5.3%) |
| Total | 412 (100.0%) | 377 (100.0%) |
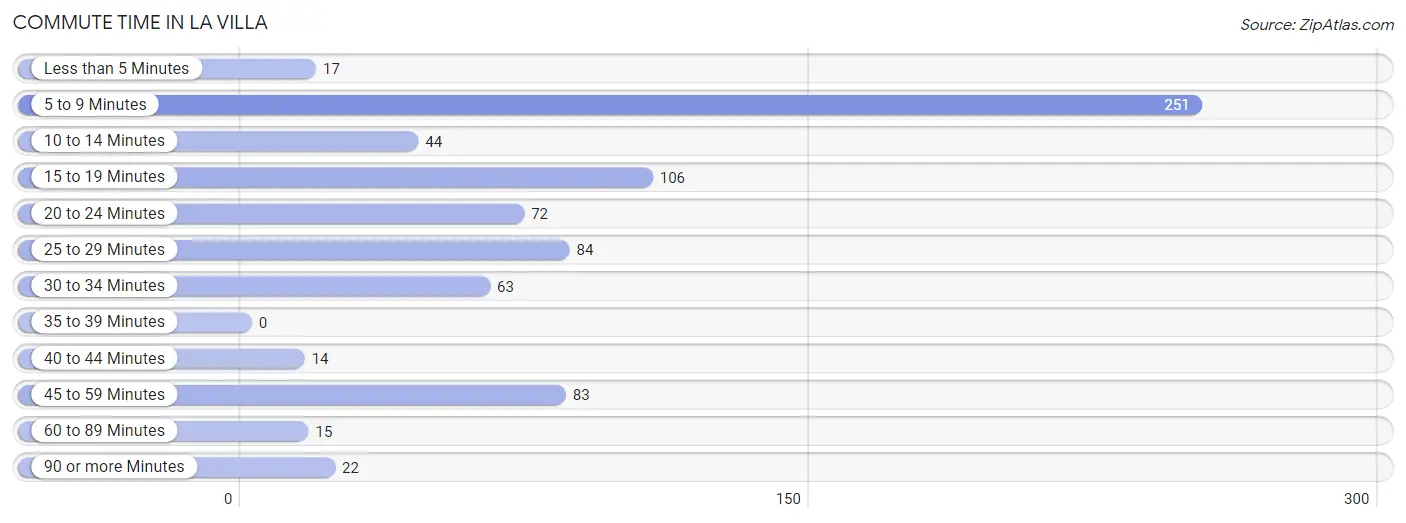
Commute Time in La Villa
The most frequently occuring commute durations in La Villa are 5 to 9 minutes (251 commuters, 32.6%), 15 to 19 minutes (106 commuters, 13.8%), and 25 to 29 minutes (84 commuters, 10.9%).
| Commute Time | # Commuters | % Commuters |
| Less than 5 Minutes | 17 | 2.2% |
| 5 to 9 Minutes | 251 | 32.6% |
| 10 to 14 Minutes | 44 | 5.7% |
| 15 to 19 Minutes | 106 | 13.8% |
| 20 to 24 Minutes | 72 | 9.3% |
| 25 to 29 Minutes | 84 | 10.9% |
| 30 to 34 Minutes | 63 | 8.2% |
| 35 to 39 Minutes | 0 | 0.0% |
| 40 to 44 Minutes | 14 | 1.8% |
| 45 to 59 Minutes | 83 | 10.8% |
| 60 to 89 Minutes | 15 | 1.9% |
| 90 or more Minutes | 22 | 2.9% |
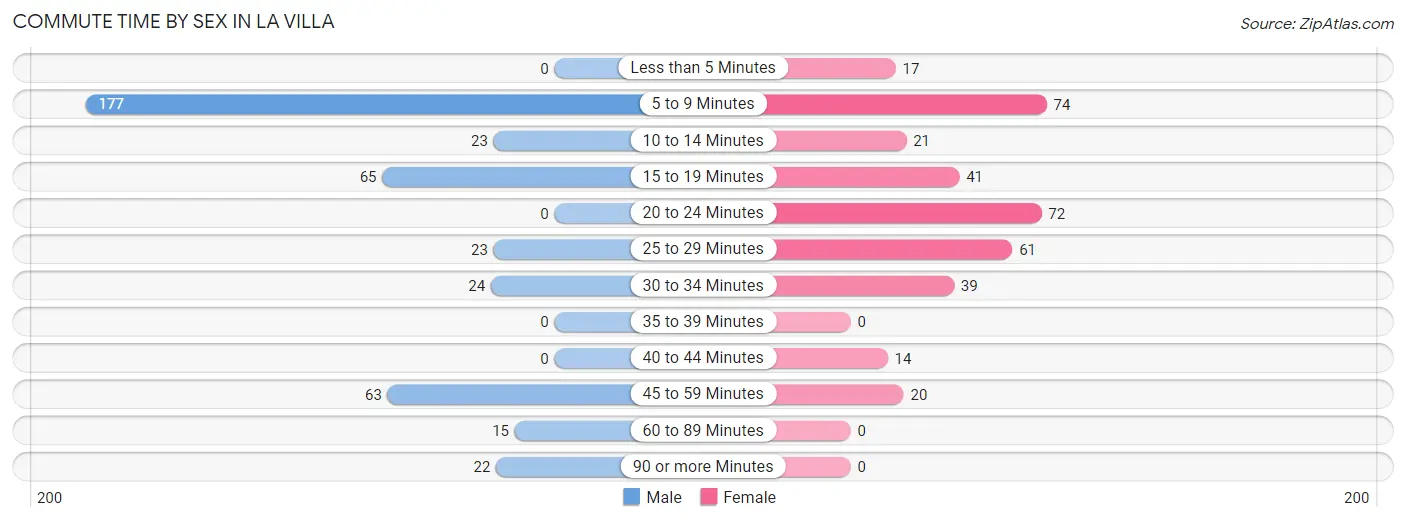
Commute Time by Sex in La Villa
The most common commute times in La Villa are 5 to 9 minutes (177 commuters, 43.0%) for males and 5 to 9 minutes (74 commuters, 20.6%) for females.
| Commute Time | Male | Female |
| Less than 5 Minutes | 0 (0.0%) | 17 (4.7%) |
| 5 to 9 Minutes | 177 (43.0%) | 74 (20.6%) |
| 10 to 14 Minutes | 23 (5.6%) | 21 (5.9%) |
| 15 to 19 Minutes | 65 (15.8%) | 41 (11.4%) |
| 20 to 24 Minutes | 0 (0.0%) | 72 (20.1%) |
| 25 to 29 Minutes | 23 (5.6%) | 61 (17.0%) |
| 30 to 34 Minutes | 24 (5.8%) | 39 (10.9%) |
| 35 to 39 Minutes | 0 (0.0%) | 0 (0.0%) |
| 40 to 44 Minutes | 0 (0.0%) | 14 (3.9%) |
| 45 to 59 Minutes | 63 (15.3%) | 20 (5.6%) |
| 60 to 89 Minutes | 15 (3.6%) | 0 (0.0%) |
| 90 or more Minutes | 22 (5.3%) | 0 (0.0%) |
Time of Departure to Work by Sex in La Villa
The most frequent times of departure to work in La Villa are 5:30 AM to 5:59 AM (86, 20.9%) for males and 7:00 AM to 7:29 AM (92, 25.6%) for females.
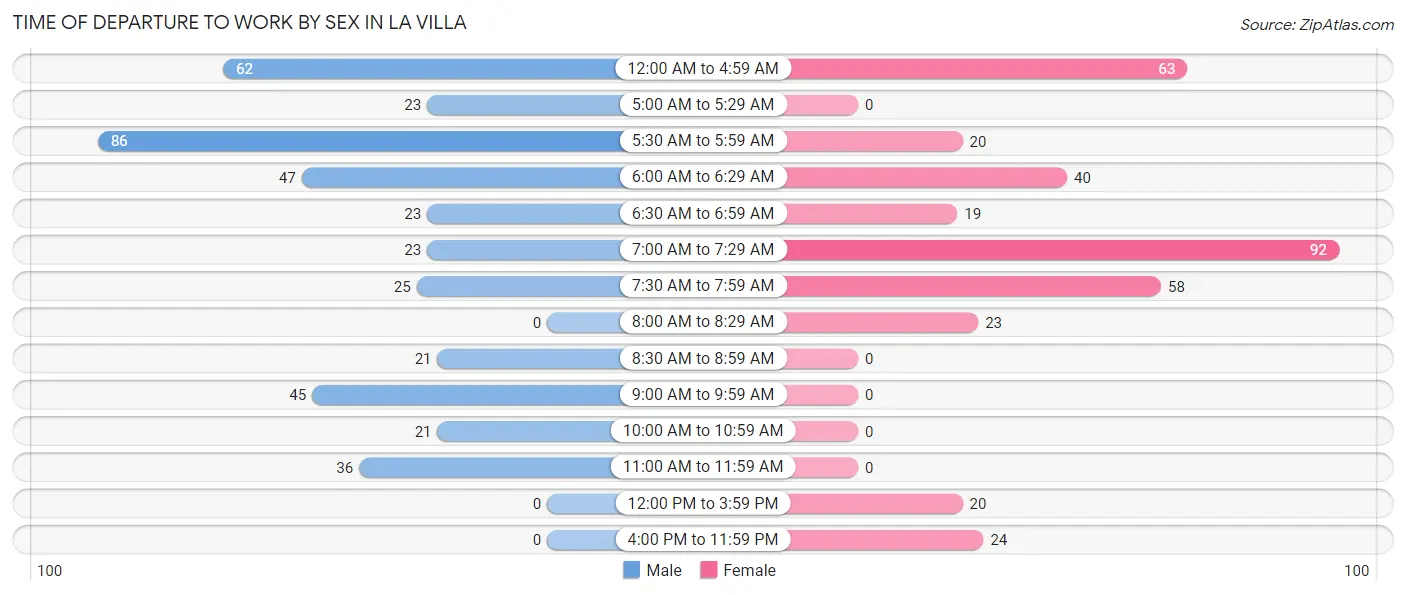
| Time of Departure | Male | Female |
| 12:00 AM to 4:59 AM | 62 (15.0%) | 63 (17.5%) |
| 5:00 AM to 5:29 AM | 23 (5.6%) | 0 (0.0%) |
| 5:30 AM to 5:59 AM | 86 (20.9%) | 20 (5.6%) |
| 6:00 AM to 6:29 AM | 47 (11.4%) | 40 (11.1%) |
| 6:30 AM to 6:59 AM | 23 (5.6%) | 19 (5.3%) |
| 7:00 AM to 7:29 AM | 23 (5.6%) | 92 (25.6%) |
| 7:30 AM to 7:59 AM | 25 (6.1%) | 58 (16.2%) |
| 8:00 AM to 8:29 AM | 0 (0.0%) | 23 (6.4%) |
| 8:30 AM to 8:59 AM | 21 (5.1%) | 0 (0.0%) |
| 9:00 AM to 9:59 AM | 45 (10.9%) | 0 (0.0%) |
| 10:00 AM to 10:59 AM | 21 (5.1%) | 0 (0.0%) |
| 11:00 AM to 11:59 AM | 36 (8.7%) | 0 (0.0%) |
| 12:00 PM to 3:59 PM | 0 (0.0%) | 20 (5.6%) |
| 4:00 PM to 11:59 PM | 0 (0.0%) | 24 (6.7%) |
| Total | 412 (100.0%) | 359 (100.0%) |
Housing Occupancy in La Villa
Occupancy by Ownership in La Villa
Of the total 476 dwellings in La Villa, owner-occupied units account for 380 (79.8%), while renter-occupied units make up 96 (20.2%).
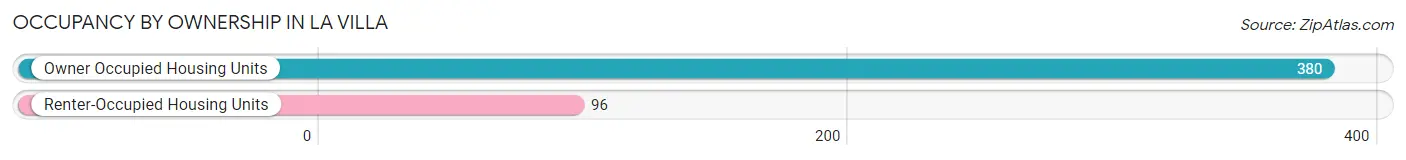
| Occupancy | # Housing Units | % Housing Units |
| Owner Occupied Housing Units | 380 | 79.8% |
| Renter-Occupied Housing Units | 96 | 20.2% |
| Total Occupied Housing Units | 476 | 100.0% |
Occupancy by Household Size in La Villa
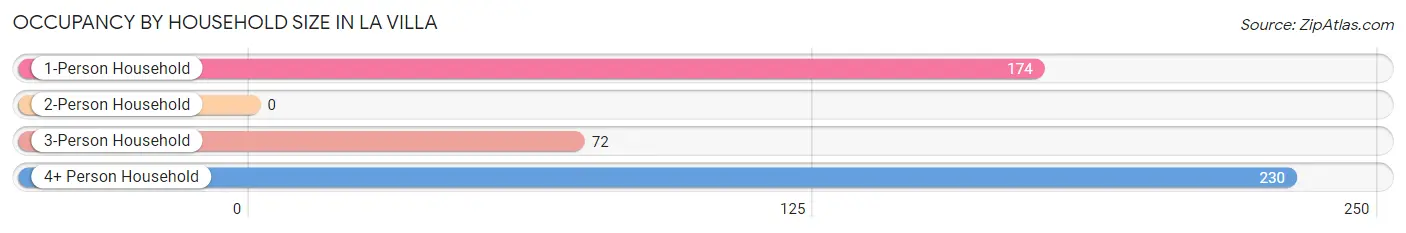
| Household Size | # Housing Units | % Housing Units |
| 1-Person Household | 174 | 36.5% |
| 2-Person Household | 0 | 0.0% |
| 3-Person Household | 72 | 15.1% |
| 4+ Person Household | 230 | 48.3% |
| Total Housing Units | 476 | 100.0% |
Occupancy by Ownership by Household Size in La Villa
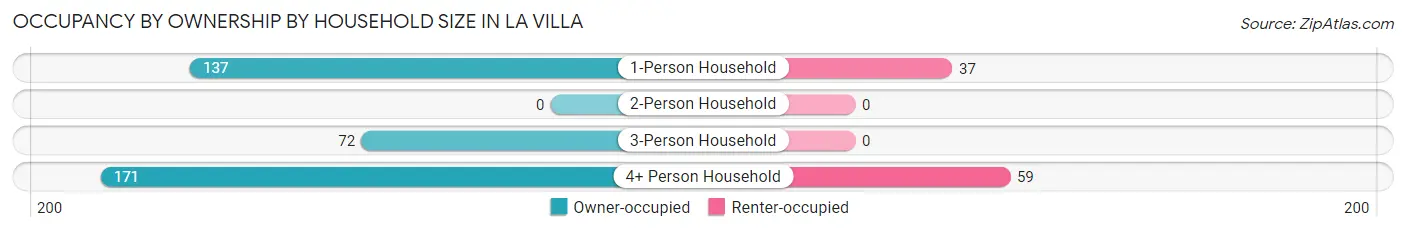
| Household Size | Owner-occupied | Renter-occupied |
| 1-Person Household | 137 (78.7%) | 37 (21.3%) |
| 2-Person Household | 0 (0.0%) | 0 (0.0%) |
| 3-Person Household | 72 (100.0%) | 0 (0.0%) |
| 4+ Person Household | 171 (74.4%) | 59 (25.7%) |
| Total Housing Units | 380 (79.8%) | 96 (20.2%) |
Occupancy by Educational Attainment in La Villa
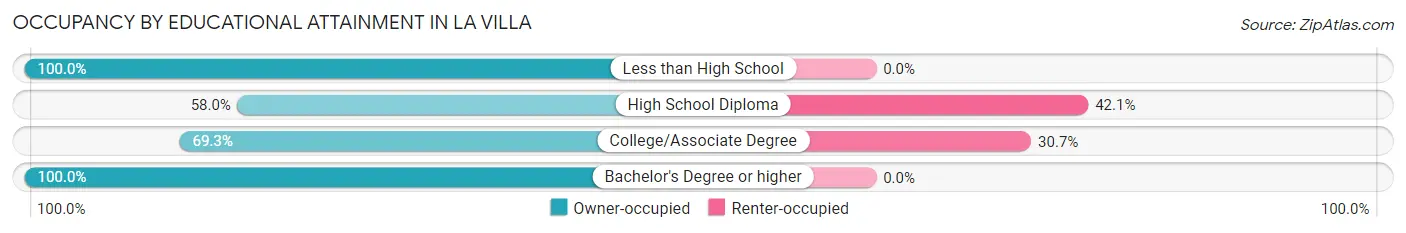
| Household Size | Owner-occupied | Renter-occupied |
| Less than High School | 122 (100.0%) | 0 (0.0%) |
| High School Diploma | 51 (58.0%) | 37 (42.0%) |
| College/Associate Degree | 133 (69.3%) | 59 (30.7%) |
| Bachelor's Degree or higher | 74 (100.0%) | 0 (0.0%) |
Occupancy by Age of Householder in La Villa
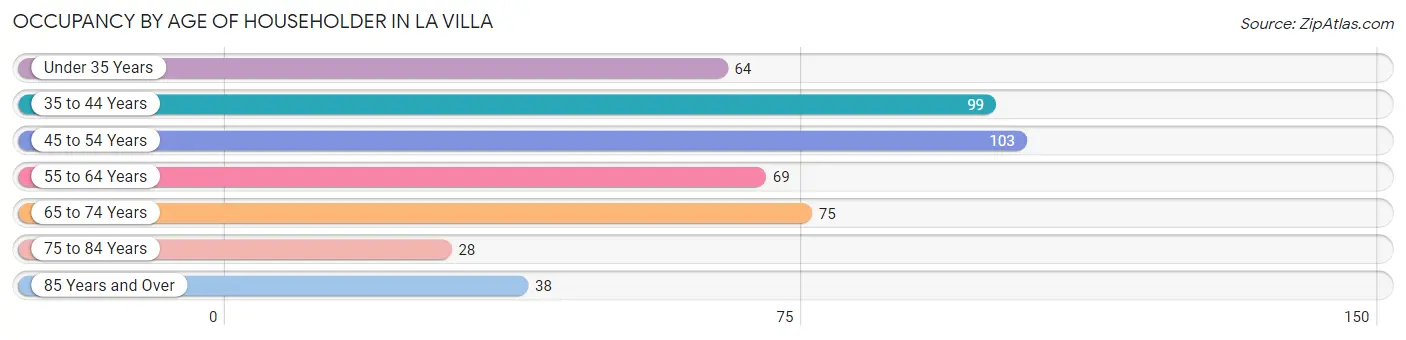
| Age Bracket | # Households | % Households |
| Under 35 Years | 64 | 13.5% |
| 35 to 44 Years | 99 | 20.8% |
| 45 to 54 Years | 103 | 21.6% |
| 55 to 64 Years | 69 | 14.5% |
| 65 to 74 Years | 75 | 15.8% |
| 75 to 84 Years | 28 | 5.9% |
| 85 Years and Over | 38 | 8.0% |
| Total | 476 | 100.0% |
Housing Finances in La Villa
Median Income by Occupancy in La Villa
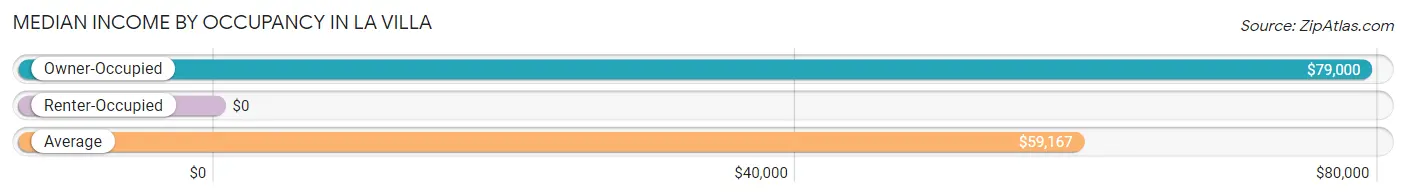
| Occupancy Type | # Households | Median Income |
| Owner-Occupied | 380 (79.8%) | $79,000 |
| Renter-Occupied | 96 (20.2%) | $0 |
| Average | 476 (100.0%) | $59,167 |
Occupancy by Householder Income Bracket in La Villa
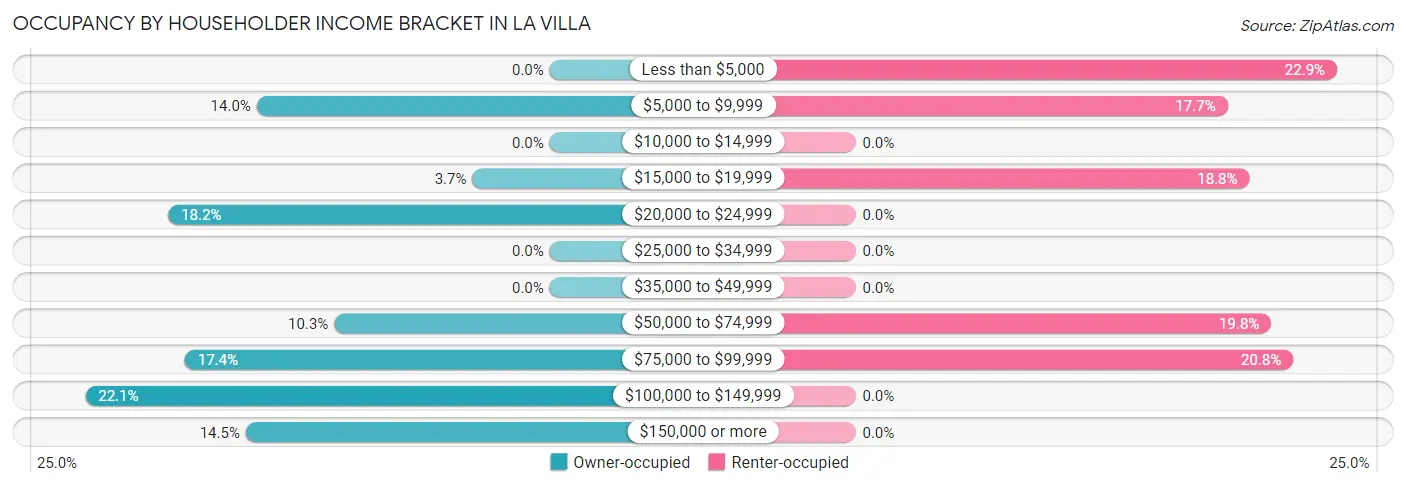
| Income Bracket | Owner-occupied | Renter-occupied |
| Less than $5,000 | 0 (0.0%) | 22 (22.9%) |
| $5,000 to $9,999 | 53 (14.0%) | 17 (17.7%) |
| $10,000 to $14,999 | 0 (0.0%) | 0 (0.0%) |
| $15,000 to $19,999 | 14 (3.7%) | 18 (18.8%) |
| $20,000 to $24,999 | 69 (18.2%) | 0 (0.0%) |
| $25,000 to $34,999 | 0 (0.0%) | 0 (0.0%) |
| $35,000 to $49,999 | 0 (0.0%) | 0 (0.0%) |
| $50,000 to $74,999 | 39 (10.3%) | 19 (19.8%) |
| $75,000 to $99,999 | 66 (17.4%) | 20 (20.8%) |
| $100,000 to $149,999 | 84 (22.1%) | 0 (0.0%) |
| $150,000 or more | 55 (14.5%) | 0 (0.0%) |
| Total | 380 (100.0%) | 96 (100.0%) |
Monthly Housing Cost Tiers in La Villa
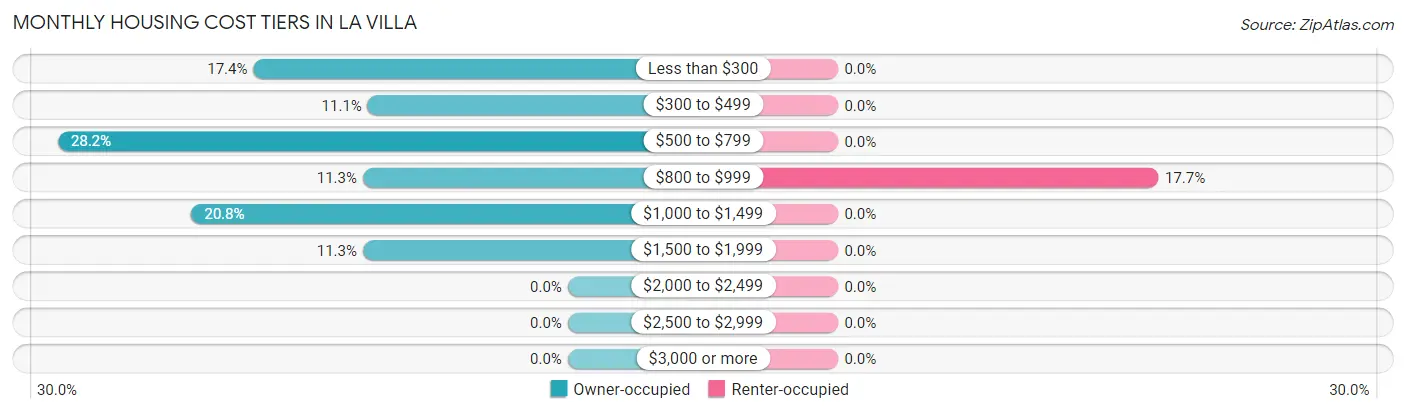
| Monthly Cost | Owner-occupied | Renter-occupied |
| Less than $300 | 66 (17.4%) | 0 (0.0%) |
| $300 to $499 | 42 (11.1%) | 0 (0.0%) |
| $500 to $799 | 107 (28.2%) | 0 (0.0%) |
| $800 to $999 | 43 (11.3%) | 17 (17.7%) |
| $1,000 to $1,499 | 79 (20.8%) | 0 (0.0%) |
| $1,500 to $1,999 | 43 (11.3%) | 0 (0.0%) |
| $2,000 to $2,499 | 0 (0.0%) | 0 (0.0%) |
| $2,500 to $2,999 | 0 (0.0%) | 0 (0.0%) |
| $3,000 or more | 0 (0.0%) | 0 (0.0%) |
| Total | 380 (100.0%) | 96 (100.0%) |
Physical Housing Characteristics in La Villa
Housing Structures in La Villa
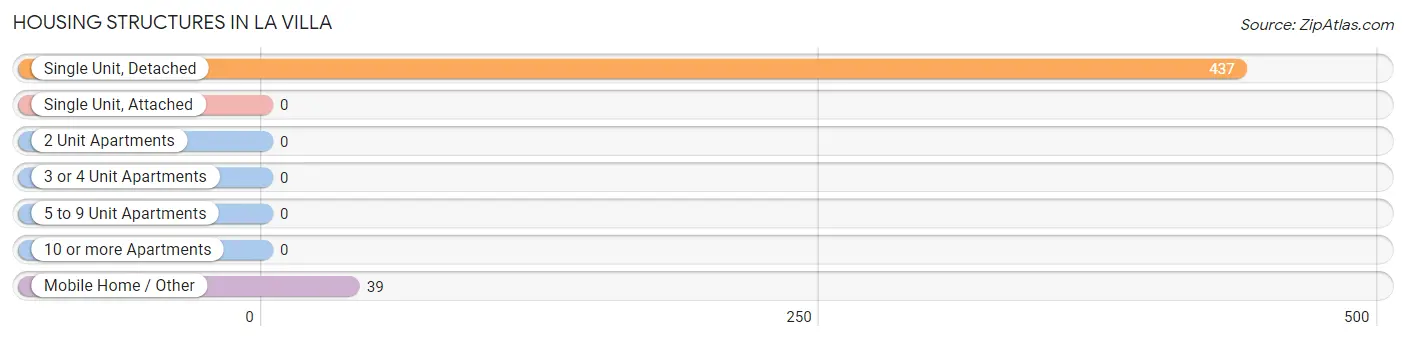
| Structure Type | # Housing Units | % Housing Units |
| Single Unit, Detached | 437 | 91.8% |
| Single Unit, Attached | 0 | 0.0% |
| 2 Unit Apartments | 0 | 0.0% |
| 3 or 4 Unit Apartments | 0 | 0.0% |
| 5 to 9 Unit Apartments | 0 | 0.0% |
| 10 or more Apartments | 0 | 0.0% |
| Mobile Home / Other | 39 | 8.2% |
| Total | 476 | 100.0% |
Housing Structures by Occupancy in La Villa
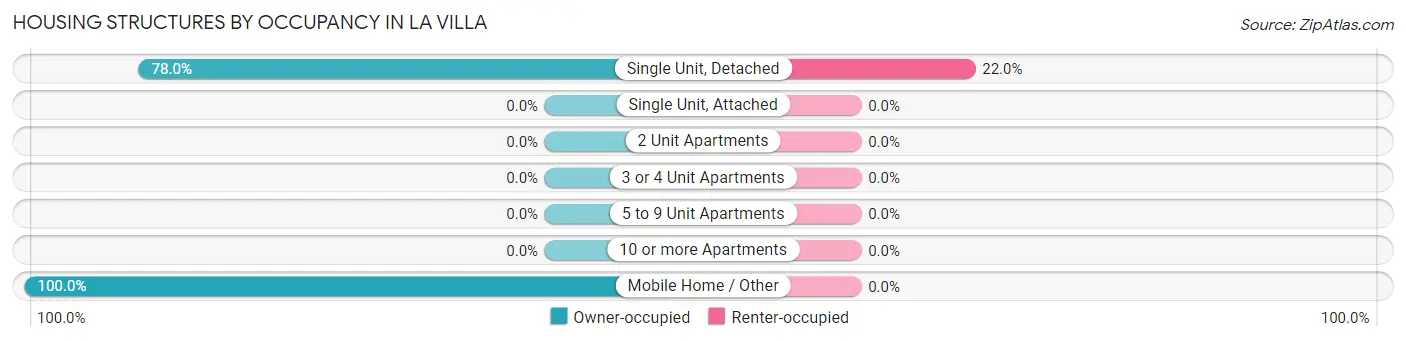
| Structure Type | Owner-occupied | Renter-occupied |
| Single Unit, Detached | 341 (78.0%) | 96 (22.0%) |
| Single Unit, Attached | 0 (0.0%) | 0 (0.0%) |
| 2 Unit Apartments | 0 (0.0%) | 0 (0.0%) |
| 3 or 4 Unit Apartments | 0 (0.0%) | 0 (0.0%) |
| 5 to 9 Unit Apartments | 0 (0.0%) | 0 (0.0%) |
| 10 or more Apartments | 0 (0.0%) | 0 (0.0%) |
| Mobile Home / Other | 39 (100.0%) | 0 (0.0%) |
| Total | 380 (79.8%) | 96 (20.2%) |
Housing Structures by Number of Rooms in La Villa
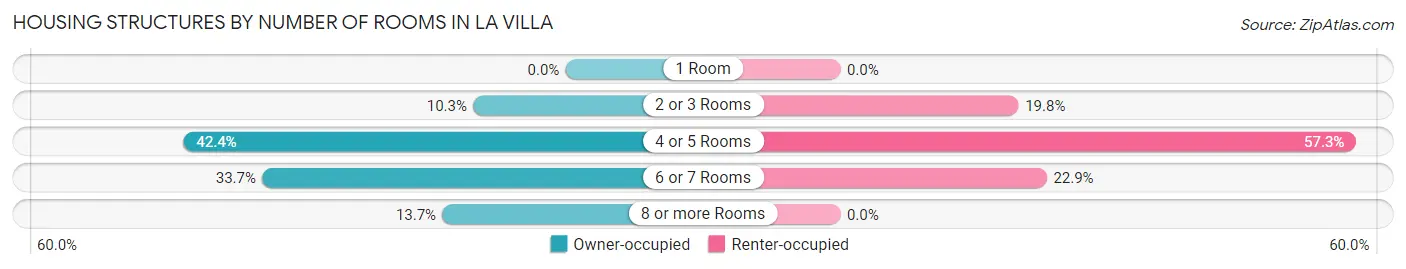
| Number of Rooms | Owner-occupied | Renter-occupied |
| 1 Room | 0 (0.0%) | 0 (0.0%) |
| 2 or 3 Rooms | 39 (10.3%) | 19 (19.8%) |
| 4 or 5 Rooms | 161 (42.4%) | 55 (57.3%) |
| 6 or 7 Rooms | 128 (33.7%) | 22 (22.9%) |
| 8 or more Rooms | 52 (13.7%) | 0 (0.0%) |
| Total | 380 (100.0%) | 96 (100.0%) |
Housing Structure by Heating Type in La Villa
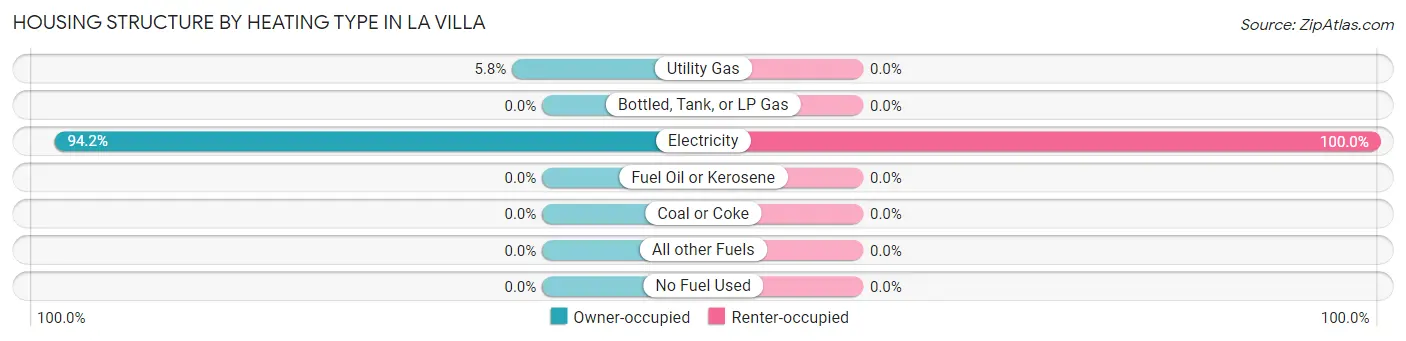
| Heating Type | Owner-occupied | Renter-occupied |
| Utility Gas | 22 (5.8%) | 0 (0.0%) |
| Bottled, Tank, or LP Gas | 0 (0.0%) | 0 (0.0%) |
| Electricity | 358 (94.2%) | 96 (100.0%) |
| Fuel Oil or Kerosene | 0 (0.0%) | 0 (0.0%) |
| Coal or Coke | 0 (0.0%) | 0 (0.0%) |
| All other Fuels | 0 (0.0%) | 0 (0.0%) |
| No Fuel Used | 0 (0.0%) | 0 (0.0%) |
| Total | 380 (100.0%) | 96 (100.0%) |
Household Vehicle Usage in La Villa
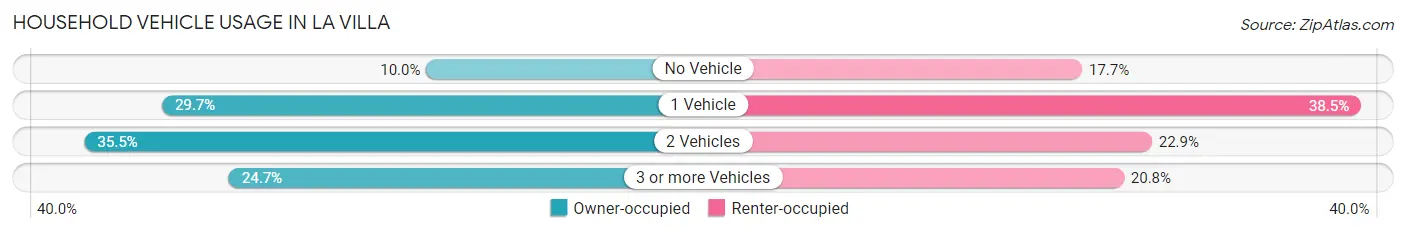
| Vehicles per Household | Owner-occupied | Renter-occupied |
| No Vehicle | 38 (10.0%) | 17 (17.7%) |
| 1 Vehicle | 113 (29.7%) | 37 (38.5%) |
| 2 Vehicles | 135 (35.5%) | 22 (22.9%) |
| 3 or more Vehicles | 94 (24.7%) | 20 (20.8%) |
| Total | 380 (100.0%) | 96 (100.0%) |
Real Estate & Mortgages in La Villa
Real Estate and Mortgage Overview in La Villa
| Characteristic | Without Mortgage | With Mortgage |
| Housing Units | 233 | 147 |
| Median Property Value | $92,200 | $131,800 |
| Median Household Income | - | - |
| Monthly Housing Costs | $522 | $0 |
| Real Estate Taxes | $1,293 | $0 |
Property Value by Mortgage Status in La Villa
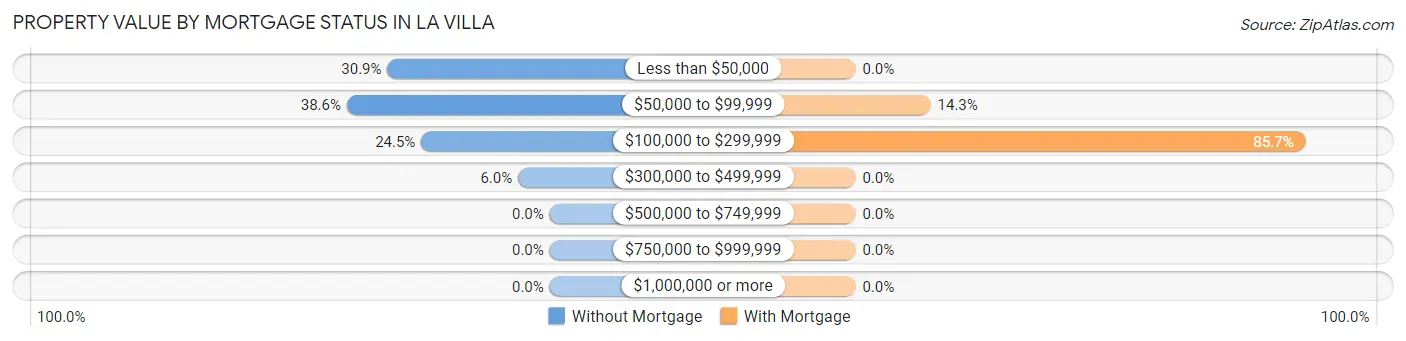
| Property Value | Without Mortgage | With Mortgage |
| Less than $50,000 | 72 (30.9%) | 0 (0.0%) |
| $50,000 to $99,999 | 90 (38.6%) | 21 (14.3%) |
| $100,000 to $299,999 | 57 (24.5%) | 126 (85.7%) |
| $300,000 to $499,999 | 14 (6.0%) | 0 (0.0%) |
| $500,000 to $749,999 | 0 (0.0%) | 0 (0.0%) |
| $750,000 to $999,999 | 0 (0.0%) | 0 (0.0%) |
| $1,000,000 or more | 0 (0.0%) | 0 (0.0%) |
| Total | 233 (100.0%) | 147 (100.0%) |
Household Income by Mortgage Status in La Villa
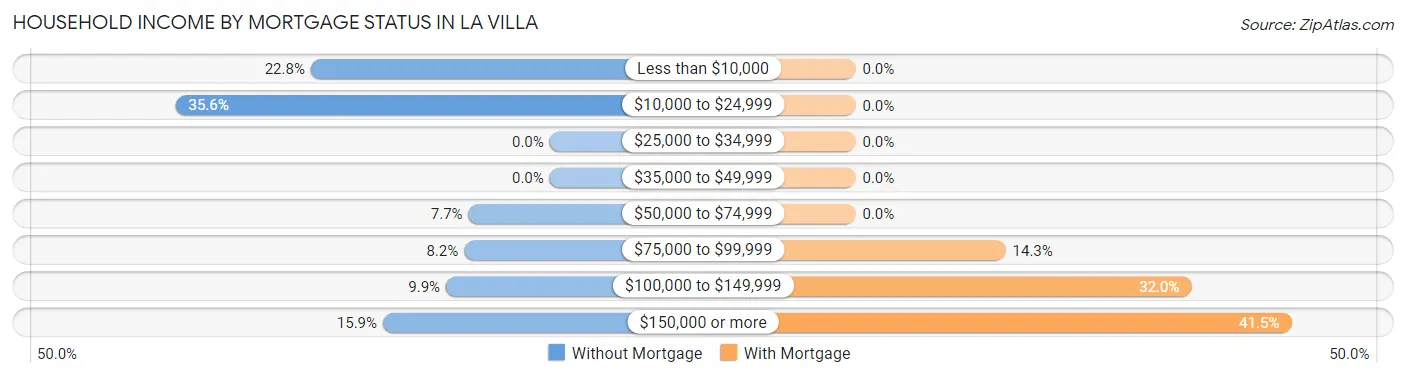
| Household Income | Without Mortgage | With Mortgage |
| Less than $10,000 | 53 (22.8%) | 0 (0.0%) |
| $10,000 to $24,999 | 83 (35.6%) | 0 (0.0%) |
| $25,000 to $34,999 | 0 (0.0%) | 0 (0.0%) |
| $35,000 to $49,999 | 0 (0.0%) | 0 (0.0%) |
| $50,000 to $74,999 | 18 (7.7%) | 0 (0.0%) |
| $75,000 to $99,999 | 19 (8.2%) | 21 (14.3%) |
| $100,000 to $149,999 | 23 (9.9%) | 47 (32.0%) |
| $150,000 or more | 37 (15.9%) | 61 (41.5%) |
| Total | 233 (100.0%) | 147 (100.0%) |
Property Value to Household Income Ratio in La Villa
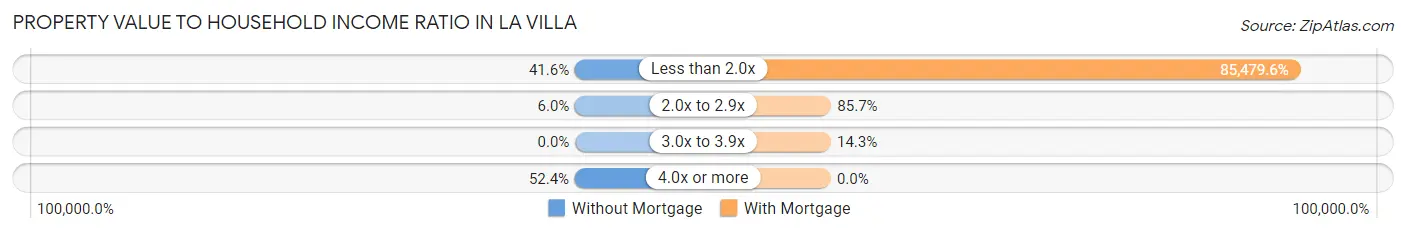
| Value-to-Income Ratio | Without Mortgage | With Mortgage |
| Less than 2.0x | 97 (41.6%) | 125,655 (85,479.6%) |
| 2.0x to 2.9x | 14 (6.0%) | 126 (85.7%) |
| 3.0x to 3.9x | 0 (0.0%) | 21 (14.3%) |
| 4.0x or more | 122 (52.4%) | 0 (0.0%) |
| Total | 233 (100.0%) | 147 (100.0%) |
Real Estate Taxes by Mortgage Status in La Villa
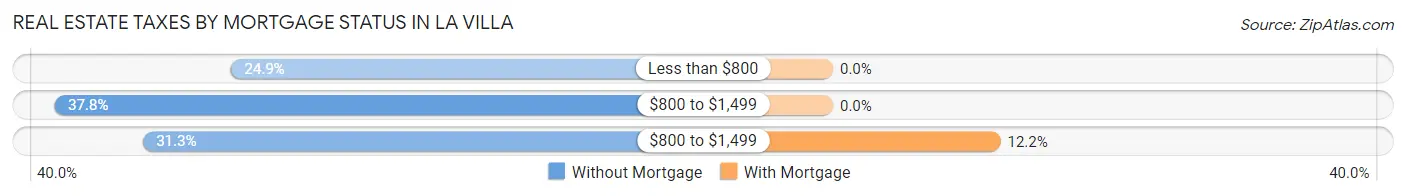
| Property Taxes | Without Mortgage | With Mortgage |
| Less than $800 | 58 (24.9%) | 0 (0.0%) |
| $800 to $1,499 | 88 (37.8%) | 0 (0.0%) |
| $800 to $1,499 | 73 (31.3%) | 18 (12.2%) |
| Total | 233 (100.0%) | 147 (100.0%) |
Health & Disability in La Villa
Health Insurance Coverage by Age in La Villa
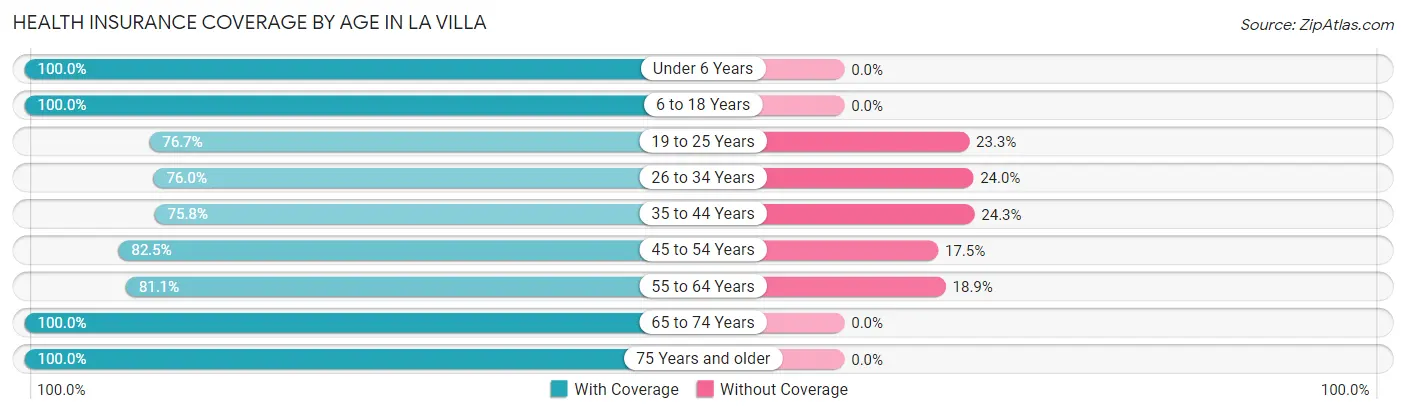
| Age Bracket | With Coverage | Without Coverage |
| Under 6 Years | 186 (100.0%) | 0 (0.0%) |
| 6 to 18 Years | 493 (100.0%) | 0 (0.0%) |
| 19 to 25 Years | 211 (76.7%) | 64 (23.3%) |
| 26 to 34 Years | 139 (76.0%) | 44 (24.0%) |
| 35 to 44 Years | 203 (75.7%) | 65 (24.2%) |
| 45 to 54 Years | 85 (82.5%) | 18 (17.5%) |
| 55 to 64 Years | 73 (81.1%) | 17 (18.9%) |
| 65 to 74 Years | 75 (100.0%) | 0 (0.0%) |
| 75 Years and older | 83 (100.0%) | 0 (0.0%) |
| Total | 1,548 (88.1%) | 208 (11.8%) |
Health Insurance Coverage by Citizenship Status in La Villa
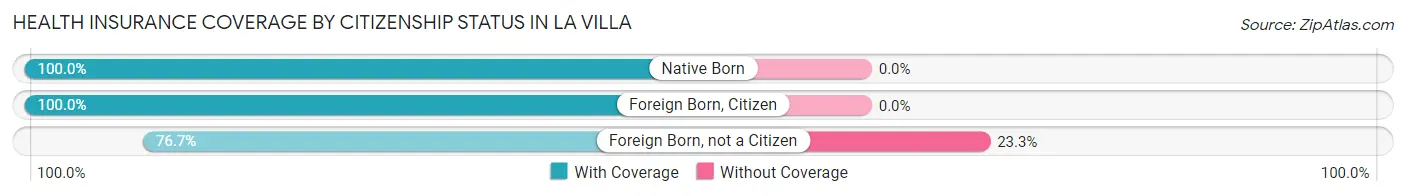
| Citizenship Status | With Coverage | Without Coverage |
| Native Born | 186 (100.0%) | 0 (0.0%) |
| Foreign Born, Citizen | 493 (100.0%) | 0 (0.0%) |
| Foreign Born, not a Citizen | 211 (76.7%) | 64 (23.3%) |
Health Insurance Coverage by Household Income in La Villa
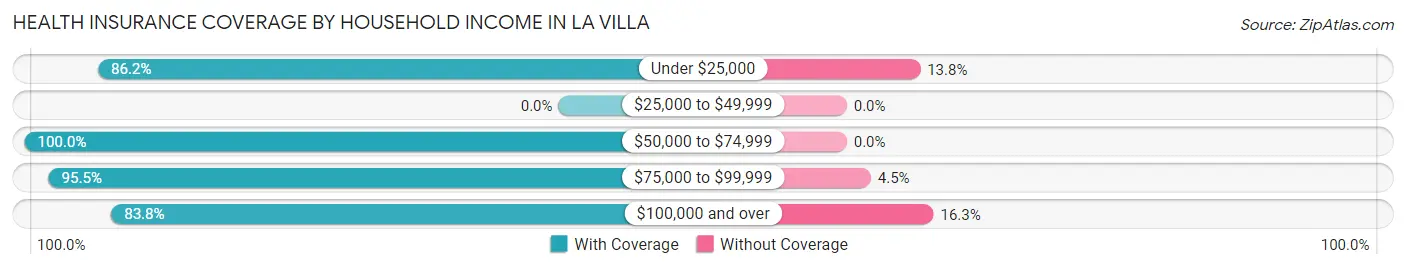
| Household Income | With Coverage | Without Coverage |
| Under $25,000 | 420 (86.2%) | 67 (13.8%) |
| $25,000 to $49,999 | 0 (0.0%) | 0 (0.0%) |
| $50,000 to $74,999 | 113 (100.0%) | 0 (0.0%) |
| $75,000 to $99,999 | 381 (95.5%) | 18 (4.5%) |
| $100,000 and over | 634 (83.8%) | 123 (16.3%) |
Public vs Private Health Insurance Coverage by Age in La Villa
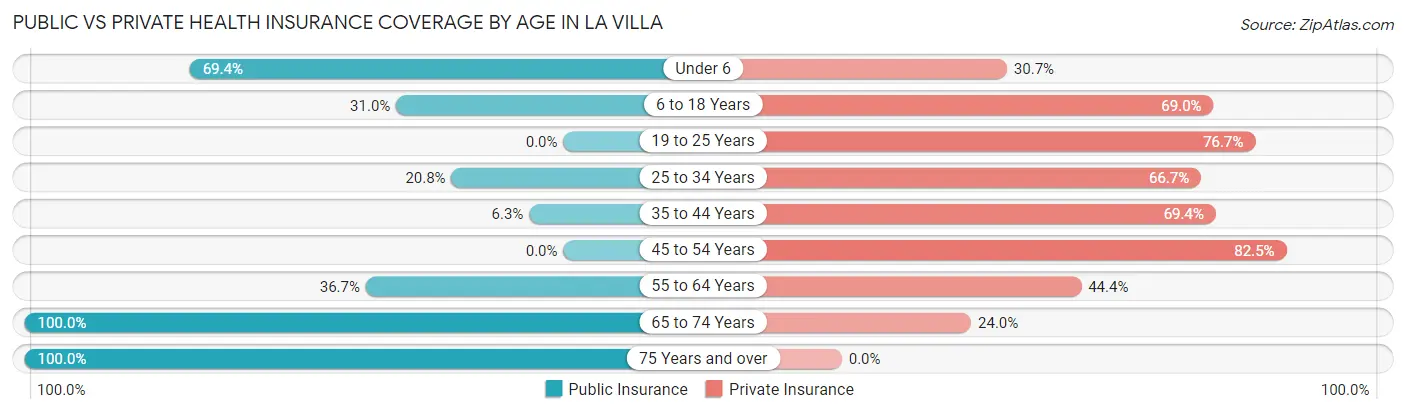
| Age Bracket | Public Insurance | Private Insurance |
| Under 6 | 129 (69.4%) | 57 (30.6%) |
| 6 to 18 Years | 153 (31.0%) | 340 (69.0%) |
| 19 to 25 Years | 0 (0.0%) | 211 (76.7%) |
| 25 to 34 Years | 38 (20.8%) | 122 (66.7%) |
| 35 to 44 Years | 17 (6.3%) | 186 (69.4%) |
| 45 to 54 Years | 0 (0.0%) | 85 (82.5%) |
| 55 to 64 Years | 33 (36.7%) | 40 (44.4%) |
| 65 to 74 Years | 75 (100.0%) | 18 (24.0%) |
| 75 Years and over | 83 (100.0%) | 0 (0.0%) |
| Total | 528 (30.1%) | 1,059 (60.3%) |
Disability Status by Sex by Age in La Villa
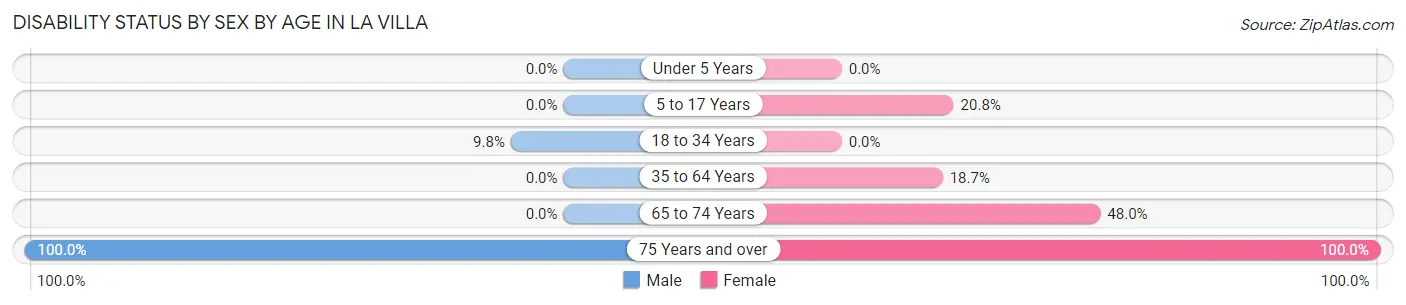
| Age Bracket | Male | Female |
| Under 5 Years | 0 (0.0%) | 0 (0.0%) |
| 5 to 17 Years | 0 (0.0%) | 60 (20.8%) |
| 18 to 34 Years | 21 (9.8%) | 0 (0.0%) |
| 35 to 64 Years | 0 (0.0%) | 47 (18.7%) |
| 65 to 74 Years | 0 (0.0%) | 36 (48.0%) |
| 75 Years and over | 14 (100.0%) | 69 (100.0%) |
Disability Class by Sex by Age in La Villa
Disability Class: Hearing Difficulty
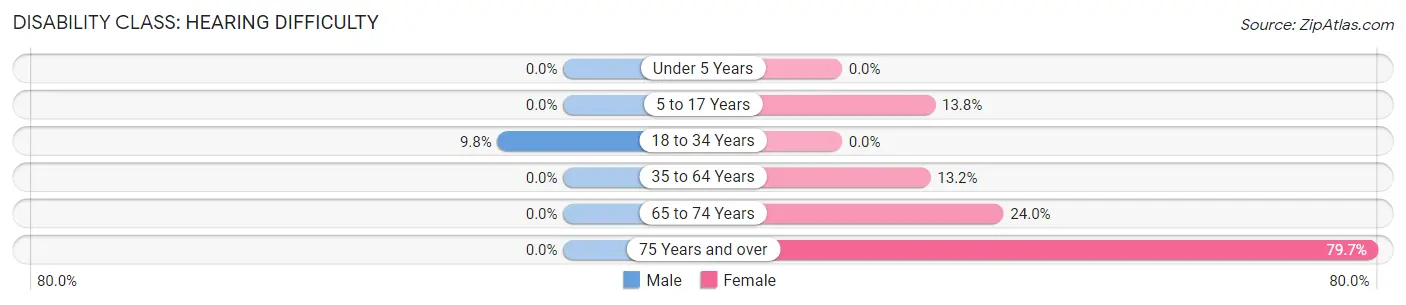
| Age Bracket | Male | Female |
| Under 5 Years | 0 (0.0%) | 0 (0.0%) |
| 5 to 17 Years | 0 (0.0%) | 40 (13.8%) |
| 18 to 34 Years | 21 (9.8%) | 0 (0.0%) |
| 35 to 64 Years | 0 (0.0%) | 33 (13.2%) |
| 65 to 74 Years | 0 (0.0%) | 18 (24.0%) |
| 75 Years and over | 0 (0.0%) | 55 (79.7%) |
Disability Class: Vision Difficulty
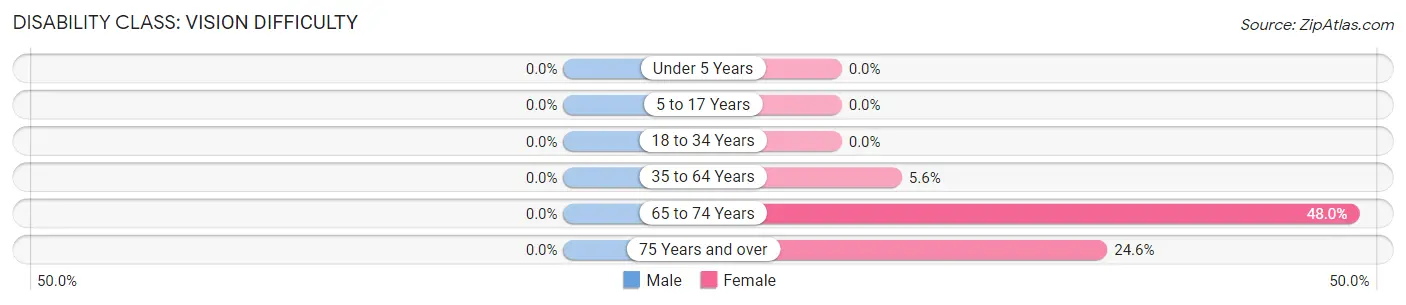
| Age Bracket | Male | Female |
| Under 5 Years | 0 (0.0%) | 0 (0.0%) |
| 5 to 17 Years | 0 (0.0%) | 0 (0.0%) |
| 18 to 34 Years | 0 (0.0%) | 0 (0.0%) |
| 35 to 64 Years | 0 (0.0%) | 14 (5.6%) |
| 65 to 74 Years | 0 (0.0%) | 36 (48.0%) |
| 75 Years and over | 0 (0.0%) | 17 (24.6%) |
Disability Class: Cognitive Difficulty
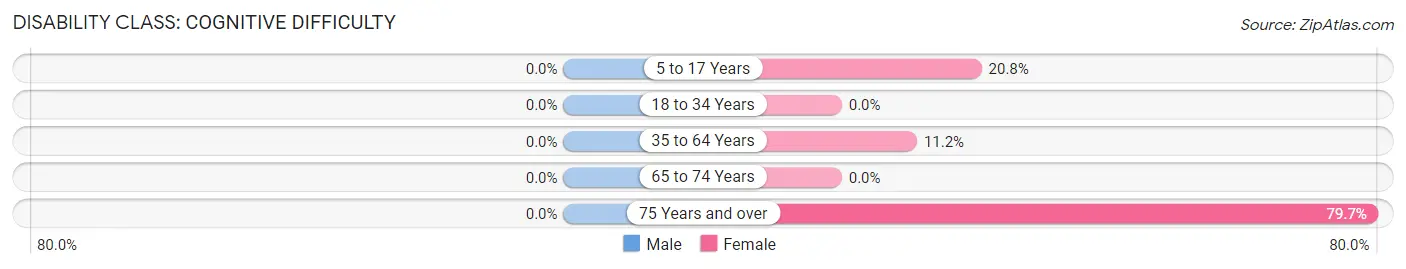
| Age Bracket | Male | Female |
| 5 to 17 Years | 0 (0.0%) | 60 (20.8%) |
| 18 to 34 Years | 0 (0.0%) | 0 (0.0%) |
| 35 to 64 Years | 0 (0.0%) | 28 (11.2%) |
| 65 to 74 Years | 0 (0.0%) | 0 (0.0%) |
| 75 Years and over | 0 (0.0%) | 55 (79.7%) |
Disability Class: Ambulatory Difficulty
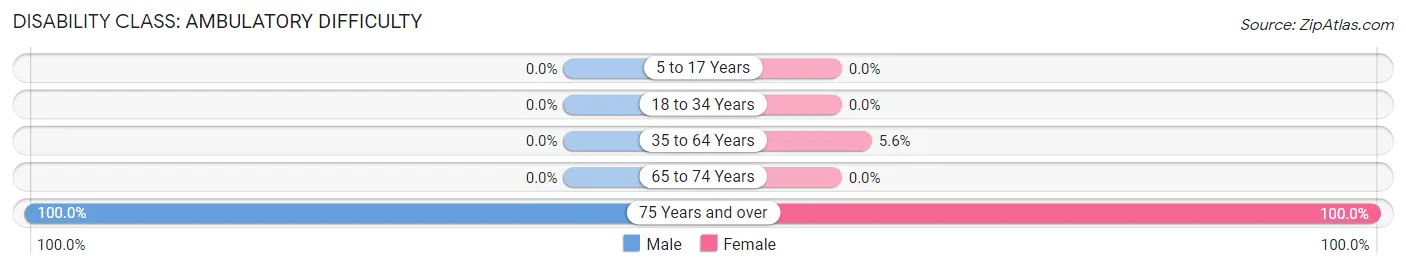
| Age Bracket | Male | Female |
| 5 to 17 Years | 0 (0.0%) | 0 (0.0%) |
| 18 to 34 Years | 0 (0.0%) | 0 (0.0%) |
| 35 to 64 Years | 0 (0.0%) | 14 (5.6%) |
| 65 to 74 Years | 0 (0.0%) | 0 (0.0%) |
| 75 Years and over | 14 (100.0%) | 69 (100.0%) |
Disability Class: Self-Care Difficulty
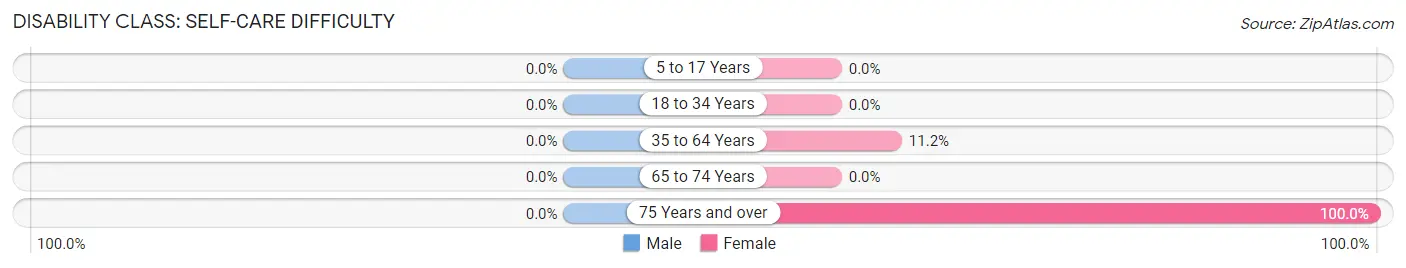
| Age Bracket | Male | Female |
| 5 to 17 Years | 0 (0.0%) | 0 (0.0%) |
| 18 to 34 Years | 0 (0.0%) | 0 (0.0%) |
| 35 to 64 Years | 0 (0.0%) | 28 (11.2%) |
| 65 to 74 Years | 0 (0.0%) | 0 (0.0%) |
| 75 Years and over | 0 (0.0%) | 69 (100.0%) |
Technology Access in La Villa
Computing Device Access in La Villa
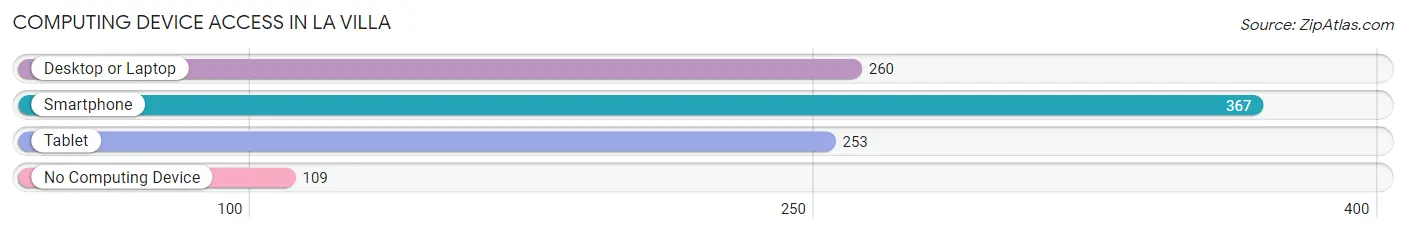
| Device Type | # Households | % Households |
| Desktop or Laptop | 260 | 54.6% |
| Smartphone | 367 | 77.1% |
| Tablet | 253 | 53.1% |
| No Computing Device | 109 | 22.9% |
| Total | 476 | 100.0% |
Internet Access in La Villa
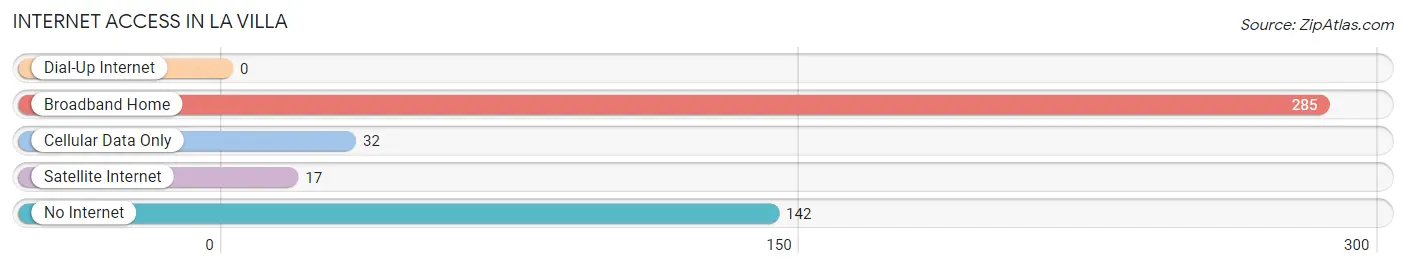
| Internet Type | # Households | % Households |
| Dial-Up Internet | 0 | 0.0% |
| Broadband Home | 285 | 59.9% |
| Cellular Data Only | 32 | 6.7% |
| Satellite Internet | 17 | 3.6% |
| No Internet | 142 | 29.8% |
| Total | 476 | 100.0% |
La Villa Summary
Villa, Texas is a small town located in the Rio Grande Valley of South Texas. It is situated in Hidalgo County, approximately 20 miles west of McAllen and 30 miles east of Mission. The population of Villa was estimated to be 1,845 in 2019.
History
Villa was founded in 1848 by a group of Mexican settlers who were fleeing the Mexican-American War. The town was originally named La Villa de San Juan Bautista, after the patron saint of the settlers. The settlers built a chapel and a school, and the town quickly grew. In 1852, the town was officially incorporated as La Villa.
In the late 19th century, the town began to experience a period of growth and prosperity. The railroad arrived in 1881, and the town became a major shipping center for the region. The population of La Villa grew to over 1,000 by the turn of the century.
In the early 20th century, La Villa experienced a period of decline. The railroad was abandoned in the 1920s, and the population began to decline. The Great Depression further exacerbated the decline, and by 1940 the population had dropped to just over 500.
Geography
Villa is located in the Rio Grande Valley of South Texas. It is situated in Hidalgo County, approximately 20 miles west of McAllen and 30 miles east of Mission. The town is located on the banks of the Rio Grande River, and is surrounded by agricultural fields.
The climate in Villa is subtropical, with hot summers and mild winters. The average annual temperature is 73°F (23°C), and the average annual precipitation is 22 inches (56 cm).
Economy
The economy of Villa is largely based on agriculture. The town is surrounded by agricultural fields, and the main crops grown in the area are cotton, corn, sorghum, and vegetables. The town is also home to several small businesses, including restaurants, grocery stores, and retail stores.
Demographics
As of 2019, the population of Villa was estimated to be 1,845. The racial makeup of the town is predominantly Hispanic, with 95.3% of the population identifying as Hispanic or Latino. The median household income in Villa is $25,972, and the median age is 28.
Conclusion
Villa, Texas is a small town located in the Rio Grande Valley of South Texas. It was founded in 1848 by a group of Mexican settlers, and has since experienced periods of growth and decline. The economy of Villa is largely based on agriculture, and the town is predominantly Hispanic. The population of Villa was estimated to be 1,845 in 2019.
Common Questions
What is Per Capita Income in La Villa?
Per Capita income in La Villa is $14,939.
What is the Median Family Income in La Villa?
Median Family Income in La Villa is $95,921.
What is the Median Household income in La Villa?
Median Household Income in La Villa is $59,167.
What is Income or Wage Gap in La Villa?
Income or Wage Gap in La Villa is 8.8%.
Women in La Villa earn 91.2 cents for every dollar earned by a man.
What is Inequality or Gini Index in La Villa?
Inequality or Gini Index in La Villa is 0.47.
What is the Total Population of La Villa?
Total Population of La Villa is 2,872.
What is the Total Male Population of La Villa?
Total Male Population of La Villa is 1,681.
What is the Total Female Population of La Villa?
Total Female Population of La Villa is 1,191.
What is the Ratio of Males per 100 Females in La Villa?
There are 141.14 Males per 100 Females in La Villa.
What is the Ratio of Females per 100 Males in La Villa?
There are 70.85 Females per 100 Males in La Villa.
What is the Median Population Age in La Villa?
Median Population Age in La Villa is 30.9 Years.
What is the Average Family Size in La Villa
Average Family Size in La Villa is 5.2 People.
What is the Average Household Size in La Villa
Average Household Size in La Villa is 3.7 People.
How Large is the Labor Force in La Villa?
There are 802 People in the Labor Forcein in La Villa.
What is the Percentage of People in the Labor Force in La Villa?
34.3% of People are in the Labor Force in La Villa.
What is the Unemployment Rate in La Villa?
Unemployment Rate in La Villa is 1.6%.