Cities with the Highest Percentage of Population Employed in Transportation & Warehousing in North Carolina
RELATED REPORTS & OPTIONS
Transportation & Warehousing
North Carolina
Compare Cities
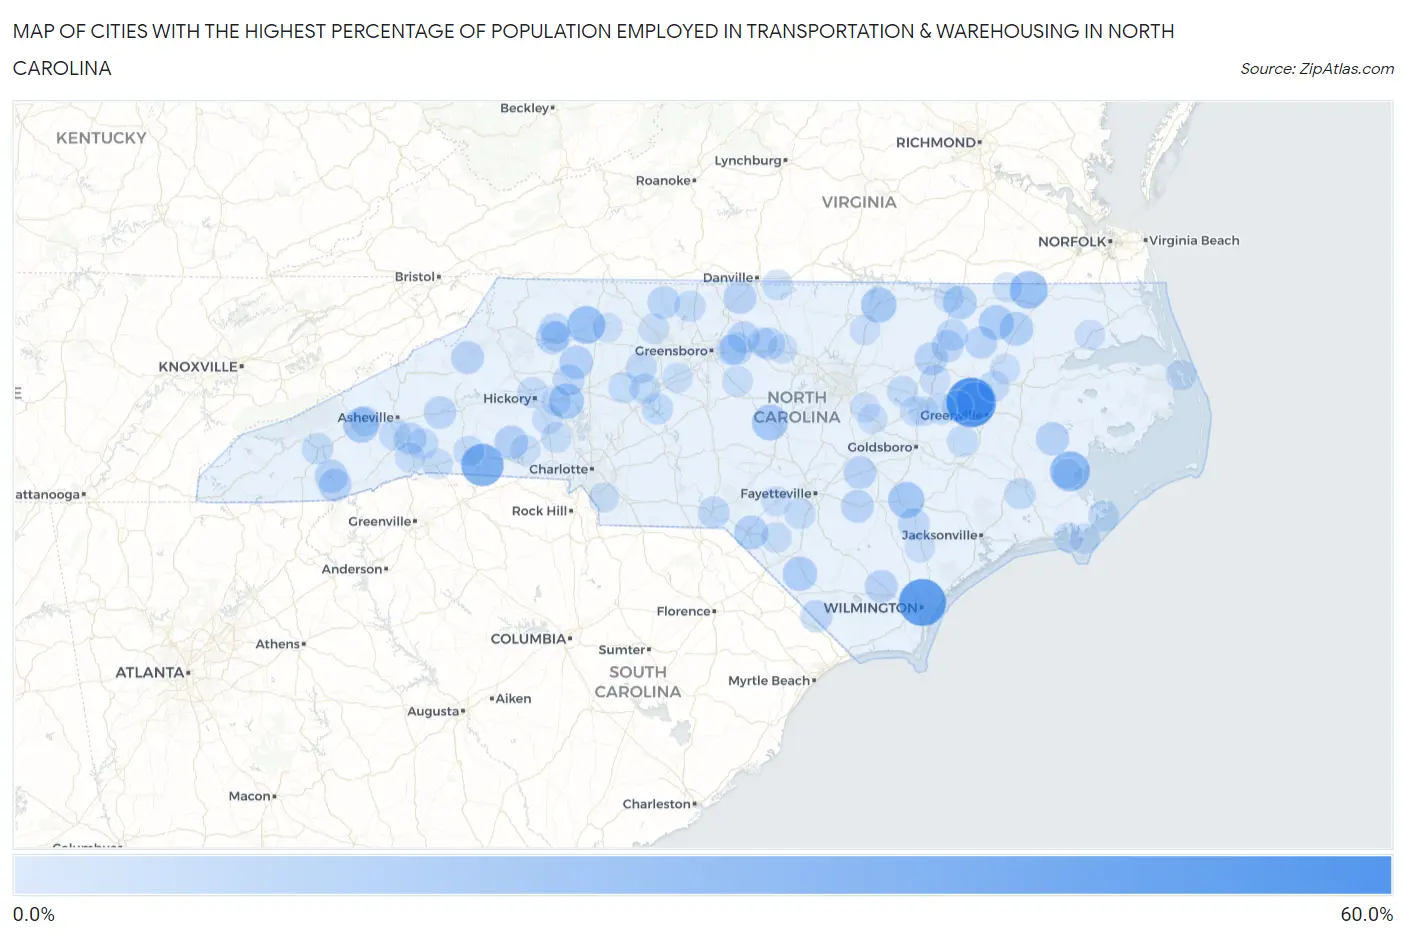
Map of Cities with the Highest Percentage of Population Employed in Transportation & Warehousing in North Carolina
0.0%
60.0%
Cities with the Highest Percentage of Population Employed in Transportation & Warehousing in North Carolina
| City | % Employed | vs State | vs National | |
| 1. | Yadkin College | 58.2% | 4.3%(+53.8)#1 | 4.9%(+53.2)#75 |
| 2. | Falkland | 55.5% | 4.3%(+51.1)#2 | 4.9%(+50.5)#89 |
| 3. | Hightsville | 49.6% | 4.3%(+45.3)#3 | 4.9%(+44.7)#130 |
| 4. | Henrietta | 37.5% | 4.3%(+33.2)#4 | 4.9%(+32.6)#215 |
| 5. | Mesic | 31.3% | 4.3%(+27.0)#5 | 4.9%(+26.4)#341 |
| 6. | Smithtown | 29.5% | 4.3%(+25.2)#6 | 4.9%(+24.6)#378 |
| 7. | Belvoir | 28.4% | 4.3%(+24.1)#7 | 4.9%(+23.5)#411 |
| 8. | Pleasant Hill | 26.3% | 4.3%(+22.0)#8 | 4.9%(+21.4)#483 |
| 9. | Como | 26.1% | 4.3%(+21.7)#9 | 4.9%(+21.1)#493 |
| 10. | Warsaw | 22.4% | 4.3%(+18.0)#10 | 4.9%(+17.4)#667 |
| 11. | Gulf | 21.7% | 4.3%(+17.4)#11 | 4.9%(+16.8)#710 |
| 12. | West Canton | 20.8% | 4.3%(+16.5)#12 | 4.9%(+15.9)#772 |
| 13. | Catawba | 20.6% | 4.3%(+16.2)#13 | 4.9%(+15.6)#785 |
| 14. | Middleburg | 20.5% | 4.3%(+16.2)#14 | 4.9%(+15.6)#792 |
| 15. | Rich Square | 19.1% | 4.3%(+14.7)#15 | 4.9%(+14.1)#899 |
| 16. | Orrum | 18.2% | 4.3%(+13.8)#16 | 4.9%(+13.2)#998 |
| 17. | Aulander | 17.4% | 4.3%(+13.0)#17 | 4.9%(+12.4)#1,108 |
| 18. | East Laurinburg | 17.2% | 4.3%(+12.9)#18 | 4.9%(+12.3)#1,128 |
| 19. | South Weldon | 16.8% | 4.3%(+12.4)#19 | 4.9%(+11.8)#1,202 |
| 20. | Love Valley | 16.3% | 4.3%(+11.9)#20 | 4.9%(+11.3)#1,297 |
| 21. | Lawndale | 16.3% | 4.3%(+11.9)#21 | 4.9%(+11.3)#1,304 |
| 22. | Brandywine Bay | 16.1% | 4.3%(+11.8)#22 | 4.9%(+11.2)#1,322 |
| 23. | Bayview | 15.6% | 4.3%(+11.2)#23 | 4.9%(+10.6)#1,419 |
| 24. | Glenville | 15.1% | 4.3%(+10.7)#24 | 4.9%(+10.1)#1,522 |
| 25. | Ruffin | 14.9% | 4.3%(+10.5)#25 | 4.9%(+9.93)#1,565 |
| 26. | Cricket | 14.8% | 4.3%(+10.5)#26 | 4.9%(+9.90)#1,573 |
| 27. | Crossnore | 14.8% | 4.3%(+10.5)#27 | 4.9%(+9.87)#1,580 |
| 28. | Cashiers | 14.8% | 4.3%(+10.4)#28 | 4.9%(+9.85)#1,592 |
| 29. | Dortches | 14.6% | 4.3%(+10.3)#29 | 4.9%(+9.67)#1,633 |
| 30. | Spivey S Corner | 14.5% | 4.3%(+10.1)#30 | 4.9%(+9.52)#1,663 |
| 31. | Whitsett | 14.4% | 4.3%(+10.1)#31 | 4.9%(+9.50)#1,671 |
| 32. | Sandyfield | 14.4% | 4.3%(+10.0)#32 | 4.9%(+9.44)#1,683 |
| 33. | Roseboro | 14.3% | 4.3%(+9.98)#33 | 4.9%(+9.38)#1,695 |
| 34. | Danbury | 14.0% | 4.3%(+9.64)#34 | 4.9%(+9.04)#1,794 |
| 35. | Old Fort | 14.0% | 4.3%(+9.62)#35 | 4.9%(+9.02)#1,799 |
| 36. | Scotland Neck | 13.7% | 4.3%(+9.37)#36 | 4.9%(+8.77)#1,869 |
| 37. | Woodlawn | 13.4% | 4.3%(+9.03)#37 | 4.9%(+8.43)#1,955 |
| 38. | Alexis | 13.1% | 4.3%(+8.78)#38 | 4.9%(+8.18)#2,040 |
| 39. | Ossipee | 13.1% | 4.3%(+8.76)#39 | 4.9%(+8.16)#2,045 |
| 40. | Roberdel | 13.0% | 4.3%(+8.62)#40 | 4.9%(+8.02)#2,098 |
| 41. | Whitakers | 12.9% | 4.3%(+8.57)#41 | 4.9%(+7.97)#2,111 |
| 42. | Hoopers Creek | 12.9% | 4.3%(+8.53)#42 | 4.9%(+7.93)#2,125 |
| 43. | Tabor City | 12.8% | 4.3%(+8.41)#43 | 4.9%(+7.81)#2,165 |
| 44. | East Rockingham | 12.4% | 4.3%(+8.04)#44 | 4.9%(+7.44)#2,310 |
| 45. | Stony Point | 12.1% | 4.3%(+7.75)#45 | 4.9%(+7.15)#2,429 |
| 46. | Enfield | 11.8% | 4.3%(+7.50)#46 | 4.9%(+6.90)#2,519 |
| 47. | Rose Hill | 11.8% | 4.3%(+7.43)#47 | 4.9%(+6.83)#2,548 |
| 48. | Dillsboro | 11.7% | 4.3%(+7.32)#48 | 4.9%(+6.72)#2,607 |
| 49. | Avery Creek | 11.6% | 4.3%(+7.21)#49 | 4.9%(+6.61)#2,660 |
| 50. | Fountain | 11.5% | 4.3%(+7.19)#50 | 4.9%(+6.59)#2,668 |
| 51. | Edneyville | 11.3% | 4.3%(+6.98)#51 | 4.9%(+6.38)#2,786 |
| 52. | Southmont | 11.3% | 4.3%(+6.95)#52 | 4.9%(+6.35)#2,802 |
| 53. | Brices Creek | 11.2% | 4.3%(+6.86)#53 | 4.9%(+6.26)#2,850 |
| 54. | Mulberry | 11.1% | 4.3%(+6.73)#54 | 4.9%(+6.13)#2,921 |
| 55. | Advance | 11.0% | 4.3%(+6.65)#55 | 4.9%(+6.05)#2,949 |
| 56. | Atlantic | 10.9% | 4.3%(+6.55)#56 | 4.9%(+5.95)#3,001 |
| 57. | Saratoga | 10.9% | 4.3%(+6.51)#57 | 4.9%(+5.91)#3,021 |
| 58. | Madison | 10.7% | 4.3%(+6.39)#58 | 4.9%(+5.79)#3,088 |
| 59. | Hookerton | 10.7% | 4.3%(+6.37)#59 | 4.9%(+5.77)#3,097 |
| 60. | Parkton | 10.6% | 4.3%(+6.26)#60 | 4.9%(+5.66)#3,159 |
| 61. | Bailey | 10.5% | 4.3%(+6.18)#61 | 4.9%(+5.58)#3,196 |
| 62. | Cooleemee | 10.5% | 4.3%(+6.17)#62 | 4.9%(+5.57)#3,217 |
| 63. | Parmele | 10.4% | 4.3%(+6.09)#63 | 4.9%(+5.49)#3,255 |
| 64. | Tyro | 10.4% | 4.3%(+6.07)#64 | 4.9%(+5.47)#3,269 |
| 65. | Sedalia | 10.4% | 4.3%(+6.01)#65 | 4.9%(+5.41)#3,306 |
| 66. | Spindale | 10.3% | 4.3%(+5.99)#66 | 4.9%(+5.39)#3,325 |
| 67. | Northlakes | 10.0% | 4.3%(+5.61)#67 | 4.9%(+5.01)#3,570 |
| 68. | Manteo | 9.9% | 4.3%(+5.59)#68 | 4.9%(+4.99)#3,584 |
| 69. | Liberty | 9.9% | 4.3%(+5.56)#69 | 4.9%(+4.96)#3,604 |
| 70. | Milton | 9.8% | 4.3%(+5.49)#70 | 4.9%(+4.89)#3,657 |
| 71. | Columbus | 9.8% | 4.3%(+5.41)#71 | 4.9%(+4.81)#3,711 |
| 72. | Canton | 9.6% | 4.3%(+5.26)#72 | 4.9%(+4.66)#3,821 |
| 73. | Maiden | 9.6% | 4.3%(+5.22)#73 | 4.9%(+4.62)#3,866 |
| 74. | Iron Station | 9.5% | 4.3%(+5.20)#74 | 4.9%(+4.60)#3,875 |
| 75. | Prospect | 9.4% | 4.3%(+5.04)#75 | 4.9%(+4.44)#4,001 |
| 76. | North Wilkesboro | 9.3% | 4.3%(+5.00)#76 | 4.9%(+4.39)#4,037 |
| 77. | Rural Hall | 9.2% | 4.3%(+4.85)#77 | 4.9%(+4.25)#4,138 |
| 78. | Marshallberg | 9.1% | 4.3%(+4.78)#78 | 4.9%(+4.18)#4,192 |
| 79. | Silver City | 8.9% | 4.3%(+4.60)#79 | 4.9%(+4.00)#4,361 |
| 80. | Kittrell | 8.9% | 4.3%(+4.58)#80 | 4.9%(+3.98)#4,377 |
| 81. | Waco | 8.8% | 4.3%(+4.48)#81 | 4.9%(+3.88)#4,470 |
| 82. | Sharpsburg | 8.8% | 4.3%(+4.47)#82 | 4.9%(+3.87)#4,481 |
| 83. | Watha | 8.7% | 4.3%(+4.40)#83 | 4.9%(+3.80)#4,541 |
| 84. | Thomasville | 8.7% | 4.3%(+4.36)#84 | 4.9%(+3.76)#4,585 |
| 85. | Severn | 8.7% | 4.3%(+4.35)#85 | 4.9%(+3.75)#4,603 |
| 86. | Hertford | 8.6% | 4.3%(+4.26)#86 | 4.9%(+3.66)#4,700 |
| 87. | Hamilton | 8.6% | 4.3%(+4.23)#87 | 4.9%(+3.63)#4,733 |
| 88. | Weddington | 8.5% | 4.3%(+4.18)#88 | 4.9%(+3.58)#4,774 |
| 89. | Green Level | 8.4% | 4.3%(+4.09)#89 | 4.9%(+3.49)#4,866 |
| 90. | Barker Heights | 8.4% | 4.3%(+4.02)#90 | 4.9%(+3.42)#4,936 |
| 91. | Vandemere | 8.3% | 4.3%(+3.99)#91 | 4.9%(+3.39)#4,980 |
| 92. | Black Creek | 8.1% | 4.3%(+3.79)#92 | 4.9%(+3.19)#5,197 |
| 93. | Clayton | 8.1% | 4.3%(+3.79)#93 | 4.9%(+3.19)#5,200 |
| 94. | South Rosemary | 8.1% | 4.3%(+3.74)#94 | 4.9%(+3.14)#5,255 |
| 95. | Wilson S Mills | 8.1% | 4.3%(+3.73)#95 | 4.9%(+3.13)#5,269 |
| 96. | Lucama | 8.0% | 4.3%(+3.69)#96 | 4.9%(+3.09)#5,318 |
| 97. | Claremont | 8.0% | 4.3%(+3.69)#97 | 4.9%(+3.09)#5,323 |
| 98. | Efland | 7.9% | 4.3%(+3.60)#98 | 4.9%(+3.00)#5,419 |
| 99. | Beaufort | 7.9% | 4.3%(+3.59)#99 | 4.9%(+2.99)#5,432 |
| 100. | Boonville | 7.9% | 4.3%(+3.55)#100 | 4.9%(+2.95)#5,489 |
Common Questions
What are the Top 10 Cities with the Highest Percentage of Population Employed in Transportation & Warehousing in North Carolina?
Top 10 Cities with the Highest Percentage of Population Employed in Transportation & Warehousing in North Carolina are:
#1
55.5%
#2
49.6%
#3
37.5%
#4
31.3%
#5
28.4%
#6
26.3%
#7
26.1%
#8
22.4%
#9
21.7%
#10
20.8%
What city has the Highest Percentage of Population Employed in Transportation & Warehousing in North Carolina?
Falkland has the Highest Percentage of Population Employed in Transportation & Warehousing in North Carolina with 55.5%.
What is the Percentage of Population Employed in Transportation & Warehousing in the State of North Carolina?
Percentage of Population Employed in Transportation & Warehousing in North Carolina is 4.3%.
What is the Percentage of Population Employed in Transportation & Warehousing in the United States?
Percentage of Population Employed in Transportation & Warehousing in the United States is 4.9%.