Saratoga, NC Map & Demographics
Saratoga Map
Saratoga Overview
$24,825
PER CAPITA INCOME
$64,063
AVG FAMILY INCOME
$31,250
AVG HOUSEHOLD INCOME
0.45
INEQUALITY / GINI INDEX
345
TOTAL POPULATION
160
MALE POPULATION
185
FEMALE POPULATION
86.49
MALES / 100 FEMALES
115.62
FEMALES / 100 MALES
44.7
MEDIAN AGE
2.9
AVG FAMILY SIZE
2.1
AVG HOUSEHOLD SIZE
196
LABOR FORCE [ PEOPLE ]
64.5%
PERCENT IN LABOR FORCE
10.7%
UNEMPLOYMENT RATE
Saratoga Zip Codes
Saratoga Area Codes
Income in Saratoga
Income Overview in Saratoga
Per Capita Income in Saratoga is $24,825, while median incomes of families and households are $64,063 and $31,250 respectively.
| Characteristic | Number | Measure |
| Per Capita Income | 345 | $24,825 |
| Median Family Income | 95 | $64,063 |
| Mean Family Income | 95 | $74,999 |
| Median Household Income | 163 | $31,250 |
| Mean Household Income | 163 | $51,763 |
| Income Deficit | 95 | $0 |
| Wage / Income Gap (%) | 345 | 0.00% |
| Wage / Income Gap ($) | 345 | 100.00¢ per $1 |
| Gini / Inequality Index | 345 | 0.45 |
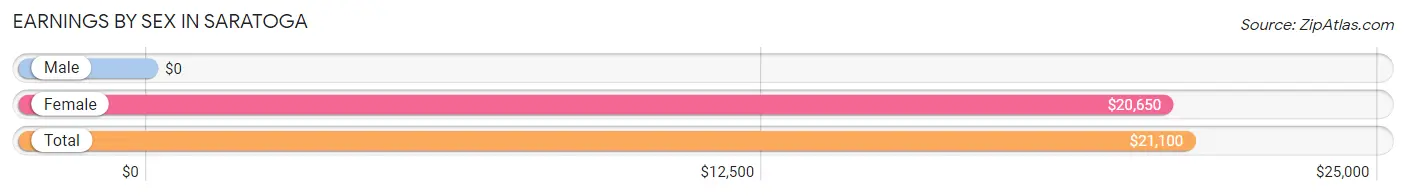
Earnings by Sex in Saratoga
| Sex | Number | Average Earnings |
| Male | 81 (42.2%) | $0 |
| Female | 111 (57.8%) | $20,650 |
| Total | 192 (100.0%) | $21,100 |
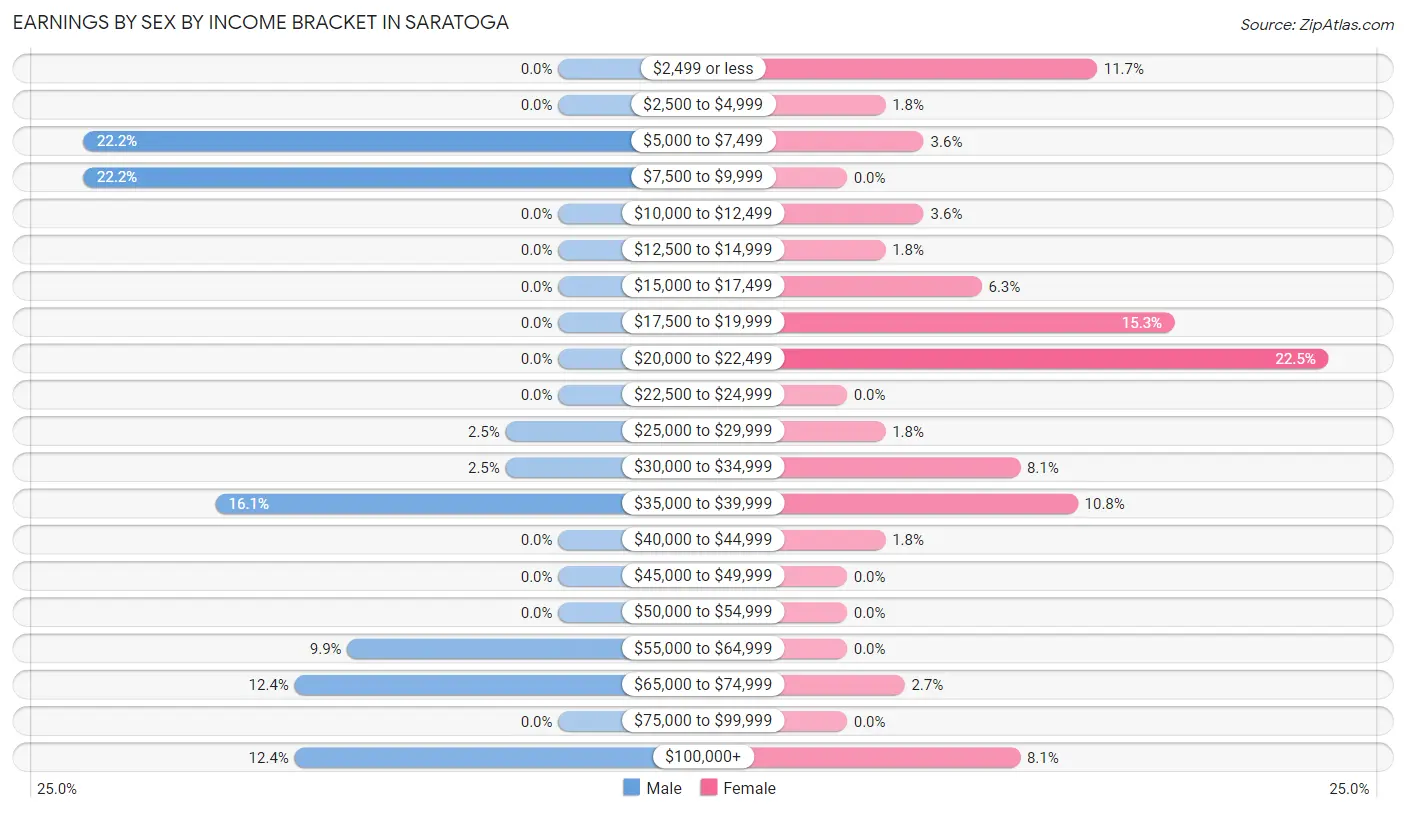
Earnings by Sex by Income Bracket in Saratoga
The most common earnings brackets in Saratoga are $5,000 to $7,499 for men (18 | 22.2%) and $20,000 to $22,499 for women (25 | 22.5%).
| Income | Male | Female |
| $2,499 or less | 0 (0.0%) | 13 (11.7%) |
| $2,500 to $4,999 | 0 (0.0%) | 2 (1.8%) |
| $5,000 to $7,499 | 18 (22.2%) | 4 (3.6%) |
| $7,500 to $9,999 | 18 (22.2%) | 0 (0.0%) |
| $10,000 to $12,499 | 0 (0.0%) | 4 (3.6%) |
| $12,500 to $14,999 | 0 (0.0%) | 2 (1.8%) |
| $15,000 to $17,499 | 0 (0.0%) | 7 (6.3%) |
| $17,500 to $19,999 | 0 (0.0%) | 17 (15.3%) |
| $20,000 to $22,499 | 0 (0.0%) | 25 (22.5%) |
| $22,500 to $24,999 | 0 (0.0%) | 0 (0.0%) |
| $25,000 to $29,999 | 2 (2.5%) | 2 (1.8%) |
| $30,000 to $34,999 | 2 (2.5%) | 9 (8.1%) |
| $35,000 to $39,999 | 13 (16.1%) | 12 (10.8%) |
| $40,000 to $44,999 | 0 (0.0%) | 2 (1.8%) |
| $45,000 to $49,999 | 0 (0.0%) | 0 (0.0%) |
| $50,000 to $54,999 | 0 (0.0%) | 0 (0.0%) |
| $55,000 to $64,999 | 8 (9.9%) | 0 (0.0%) |
| $65,000 to $74,999 | 10 (12.3%) | 3 (2.7%) |
| $75,000 to $99,999 | 0 (0.0%) | 0 (0.0%) |
| $100,000+ | 10 (12.3%) | 9 (8.1%) |
| Total | 81 (100.0%) | 111 (100.0%) |
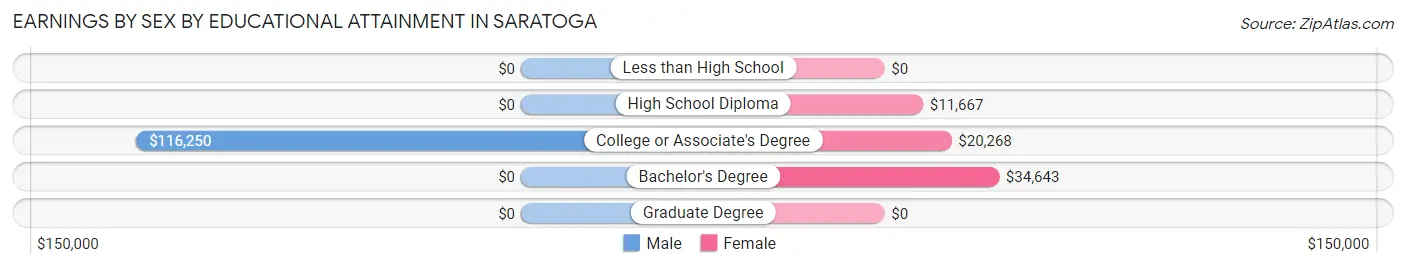
Earnings by Sex by Educational Attainment in Saratoga
| Educational Attainment | Male Income | Female Income |
| Less than High School | - | - |
| High School Diploma | - | - |
| College or Associate's Degree | $116,250 | $20,268 |
| Bachelor's Degree | - | - |
| Graduate Degree | - | - |
| Total | - | - |
Family Income in Saratoga
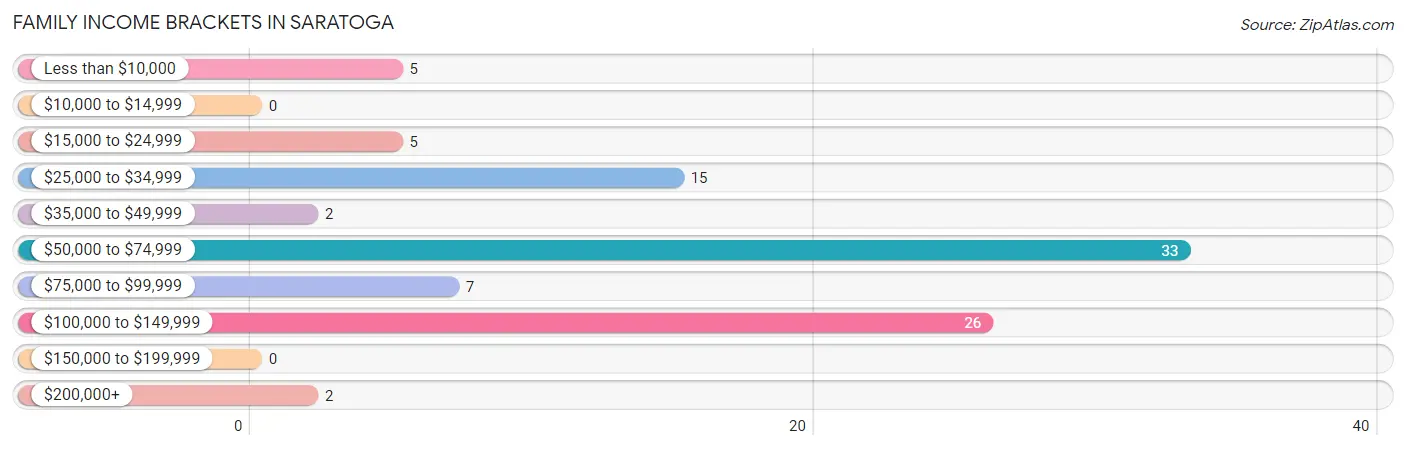
Family Income Brackets in Saratoga
According to the Saratoga family income data, there are 33 families falling into the $50,000 to $74,999 income range, which is the most common income bracket and makes up 34.7% of all families.
| Income Bracket | # Families | % Families |
| Less than $10,000 | 5 | 5.3% |
| $10,000 to $14,999 | 0 | 0.0% |
| $15,000 to $24,999 | 5 | 5.3% |
| $25,000 to $34,999 | 15 | 15.8% |
| $35,000 to $49,999 | 2 | 2.1% |
| $50,000 to $74,999 | 33 | 34.7% |
| $75,000 to $99,999 | 7 | 7.4% |
| $100,000 to $149,999 | 26 | 27.4% |
| $150,000 to $199,999 | 0 | 0.0% |
| $200,000+ | 2 | 2.1% |
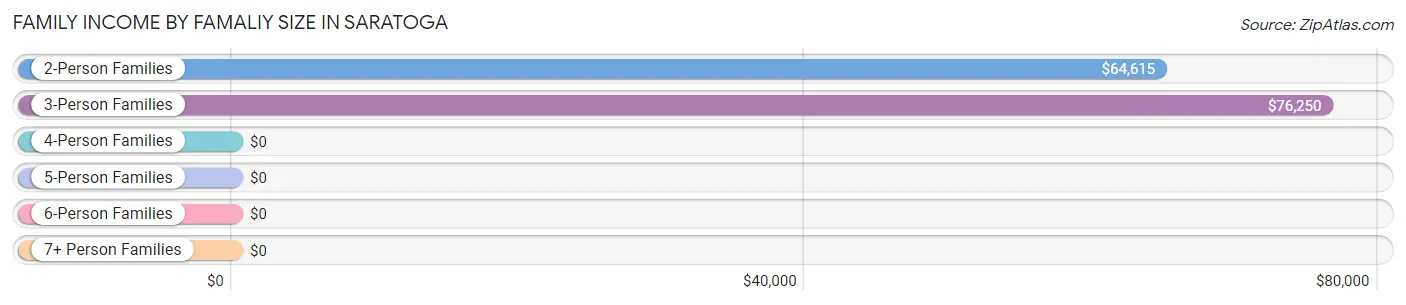
Family Income by Famaliy Size in Saratoga
3-person families (30 | 31.6%) account for the highest median family income in Saratoga with $76,250 per family, while 2-person families (44 | 46.3%) have the highest median income of $32,308 per family member.
| Income Bracket | # Families | Median Income |
| 2-Person Families | 44 (46.3%) | $64,615 |
| 3-Person Families | 30 (31.6%) | $76,250 |
| 4-Person Families | 3 (3.2%) | $0 |
| 5-Person Families | 18 (19.0%) | $0 |
| 6-Person Families | 0 (0.0%) | $0 |
| 7+ Person Families | 0 (0.0%) | $0 |
| Total | 95 (100.0%) | $64,063 |
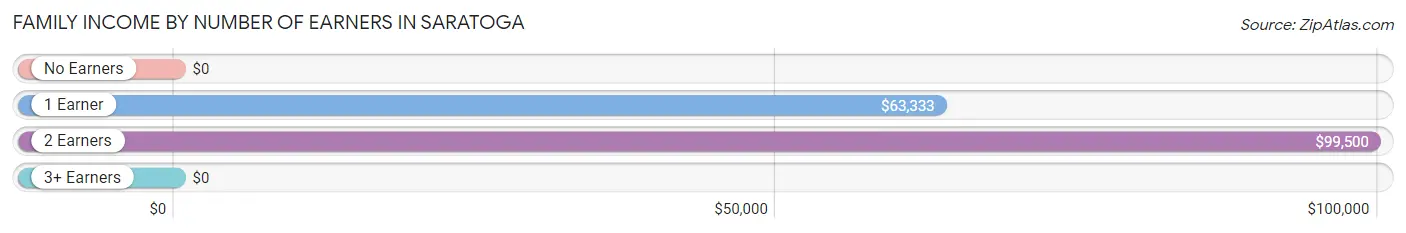
Family Income by Number of Earners in Saratoga
| Number of Earners | # Families | Median Income |
| No Earners | 10 (10.5%) | $0 |
| 1 Earner | 32 (33.7%) | $63,333 |
| 2 Earners | 38 (40.0%) | $99,500 |
| 3+ Earners | 15 (15.8%) | $0 |
| Total | 95 (100.0%) | $64,063 |
Household Income in Saratoga
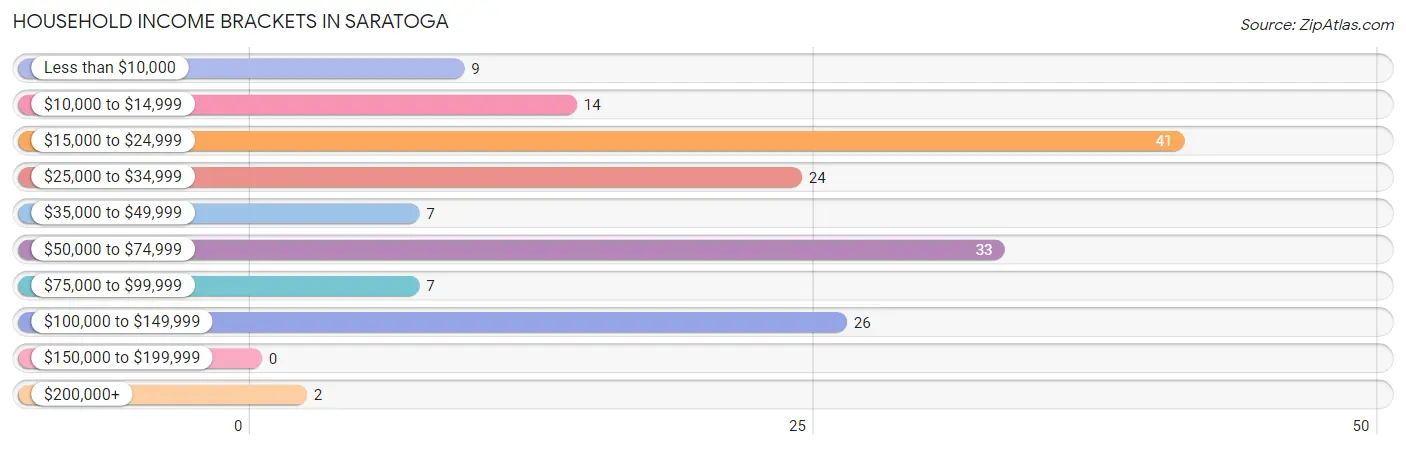
Household Income Brackets in Saratoga
With 41 households falling in the category, the $15,000 to $24,999 income range is the most frequent in Saratoga, accounting for 25.2% of all households.
| Income Bracket | # Households | % Households |
| Less than $10,000 | 9 | 5.5% |
| $10,000 to $14,999 | 14 | 8.6% |
| $15,000 to $24,999 | 41 | 25.2% |
| $25,000 to $34,999 | 24 | 14.7% |
| $35,000 to $49,999 | 7 | 4.3% |
| $50,000 to $74,999 | 33 | 20.2% |
| $75,000 to $99,999 | 7 | 4.3% |
| $100,000 to $149,999 | 26 | 16.0% |
| $150,000 to $199,999 | 0 | 0.0% |
| $200,000+ | 2 | 1.2% |
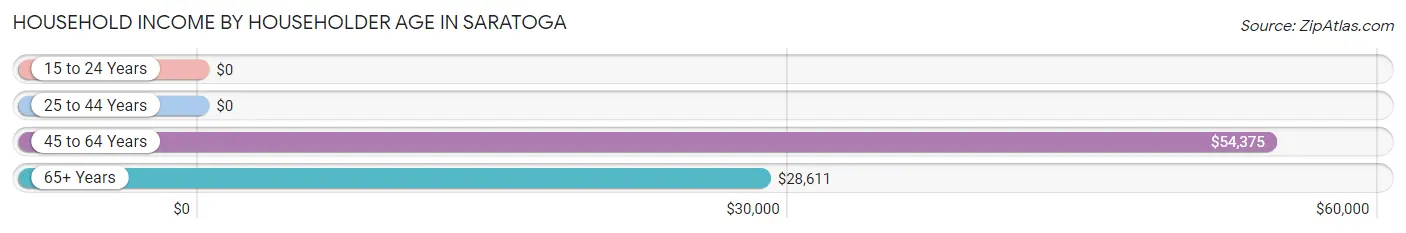
Household Income by Householder Age in Saratoga
The median household income in Saratoga is $31,250, with the highest median household income of $54,375 found in the 45 to 64 years age bracket for the primary householder. A total of 87 households (53.4%) fall into this category.
| Income Bracket | # Households | Median Income |
| 15 to 24 Years | 0 (0.0%) | $0 |
| 25 to 44 Years | 38 (23.3%) | $0 |
| 45 to 64 Years | 87 (53.4%) | $54,375 |
| 65+ Years | 38 (23.3%) | $28,611 |
| Total | 163 (100.0%) | $31,250 |
Poverty in Saratoga
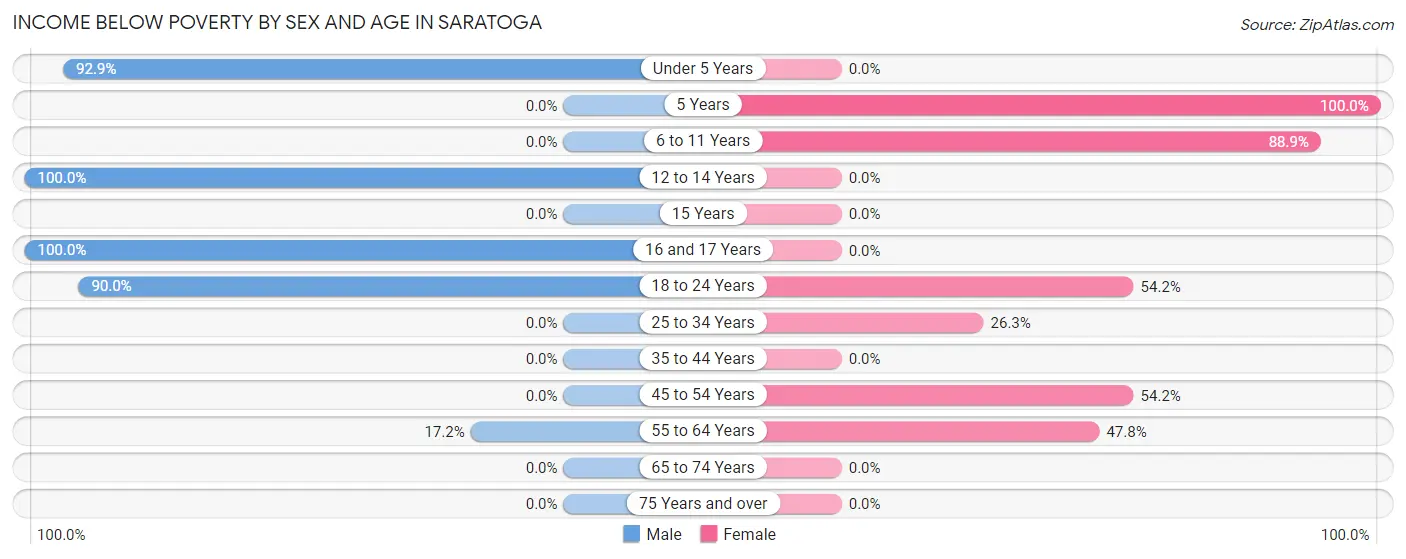
Income Below Poverty by Sex and Age in Saratoga
With 33.1% poverty level for males and 35.1% for females among the residents of Saratoga, 12 to 14 year old males and 5 year old females are the most vulnerable to poverty, with 3 males (100.0%) and 4 females (100.0%) in their respective age groups living below the poverty level.
| Age Bracket | Male | Female |
| Under 5 Years | 13 (92.9%) | 0 (0.0%) |
| 5 Years | 0 (0.0%) | 4 (100.0%) |
| 6 to 11 Years | 0 (0.0%) | 8 (88.9%) |
| 12 to 14 Years | 3 (100.0%) | 0 (0.0%) |
| 15 Years | 0 (0.0%) | 0 (0.0%) |
| 16 and 17 Years | 14 (100.0%) | 0 (0.0%) |
| 18 to 24 Years | 18 (90.0%) | 13 (54.2%) |
| 25 to 34 Years | 0 (0.0%) | 5 (26.3%) |
| 35 to 44 Years | 0 (0.0%) | 0 (0.0%) |
| 45 to 54 Years | 0 (0.0%) | 13 (54.2%) |
| 55 to 64 Years | 5 (17.2%) | 22 (47.8%) |
| 65 to 74 Years | 0 (0.0%) | 0 (0.0%) |
| 75 Years and over | 0 (0.0%) | 0 (0.0%) |
| Total | 53 (33.1%) | 65 (35.1%) |
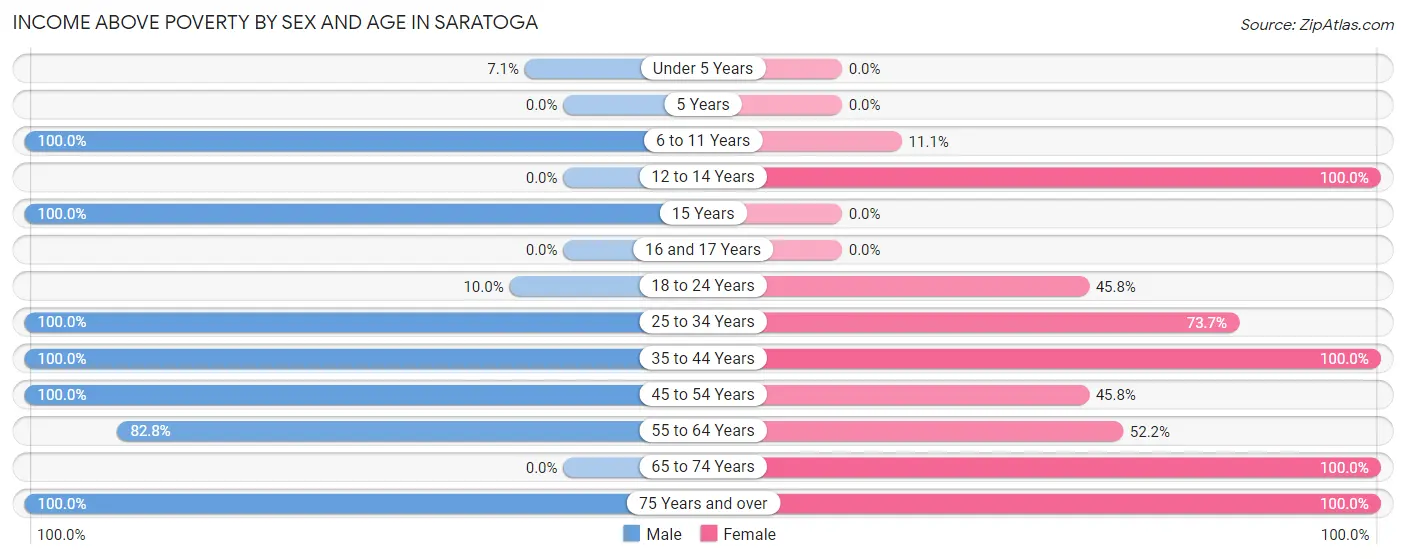
Income Above Poverty by Sex and Age in Saratoga
According to the poverty statistics in Saratoga, males aged 6 to 11 years and females aged 12 to 14 years are the age groups that are most secure financially, with 100.0% of males and 100.0% of females in these age groups living above the poverty line.
| Age Bracket | Male | Female |
| Under 5 Years | 1 (7.1%) | 0 (0.0%) |
| 5 Years | 0 (0.0%) | 0 (0.0%) |
| 6 to 11 Years | 7 (100.0%) | 1 (11.1%) |
| 12 to 14 Years | 0 (0.0%) | 2 (100.0%) |
| 15 Years | 2 (100.0%) | 0 (0.0%) |
| 16 and 17 Years | 0 (0.0%) | 0 (0.0%) |
| 18 to 24 Years | 2 (10.0%) | 11 (45.8%) |
| 25 to 34 Years | 20 (100.0%) | 14 (73.7%) |
| 35 to 44 Years | 12 (100.0%) | 28 (100.0%) |
| 45 to 54 Years | 18 (100.0%) | 11 (45.8%) |
| 55 to 64 Years | 24 (82.8%) | 24 (52.2%) |
| 65 to 74 Years | 0 (0.0%) | 9 (100.0%) |
| 75 Years and over | 21 (100.0%) | 20 (100.0%) |
| Total | 107 (66.9%) | 120 (64.9%) |
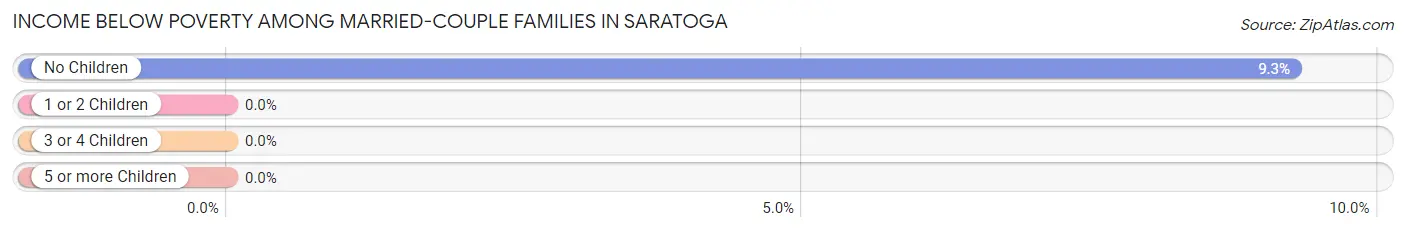
Income Below Poverty Among Married-Couple Families in Saratoga
The poverty statistics for married-couple families in Saratoga show that 8.5% or 5 of the total 59 families live below the poverty line. Families with no children have the highest poverty rate of 9.3%, comprising of 5 families. On the other hand, families with 1 or 2 children have the lowest poverty rate of 0.0%, which includes 0 families.
| Children | Above Poverty | Below Poverty |
| No Children | 49 (90.7%) | 5 (9.3%) |
| 1 or 2 Children | 5 (100.0%) | 0 (0.0%) |
| 3 or 4 Children | 0 (0.0%) | 0 (0.0%) |
| 5 or more Children | 0 (0.0%) | 0 (0.0%) |
| Total | 54 (91.5%) | 5 (8.5%) |
Income Below Poverty Among Single-Parent Households in Saratoga
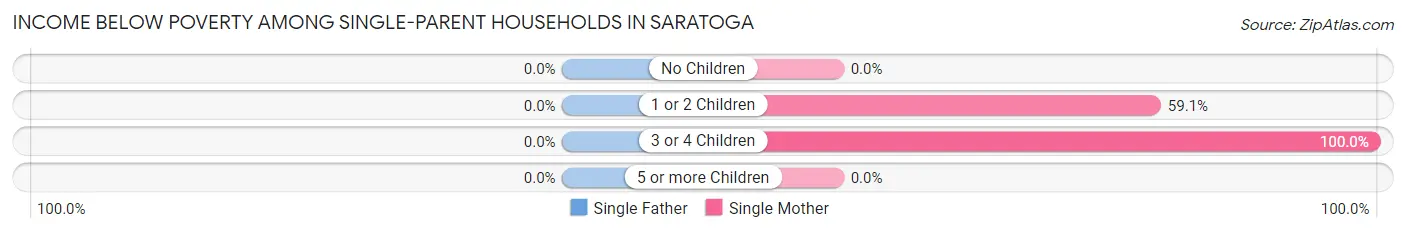
| Children | Single Father | Single Mother |
| No Children | 0 (0.0%) | 0 (0.0%) |
| 1 or 2 Children | 0 (0.0%) | 13 (59.1%) |
| 3 or 4 Children | 0 (0.0%) | 5 (100.0%) |
| 5 or more Children | 0 (0.0%) | 0 (0.0%) |
| Total | 0 (0.0%) | 18 (50.0%) |
Income Below Poverty Among Married-Couple vs Single-Parent Households in Saratoga
The poverty data for Saratoga shows that 5 of the married-couple family households (8.5%) and 18 of the single-parent households (50.0%) are living below the poverty level. Within the married-couple family households, those with no children have the highest poverty rate, with 5 households (9.3%) falling below the poverty line. Among the single-parent households, those with 3 or 4 children have the highest poverty rate, with 5 household (100.0%) living below poverty.
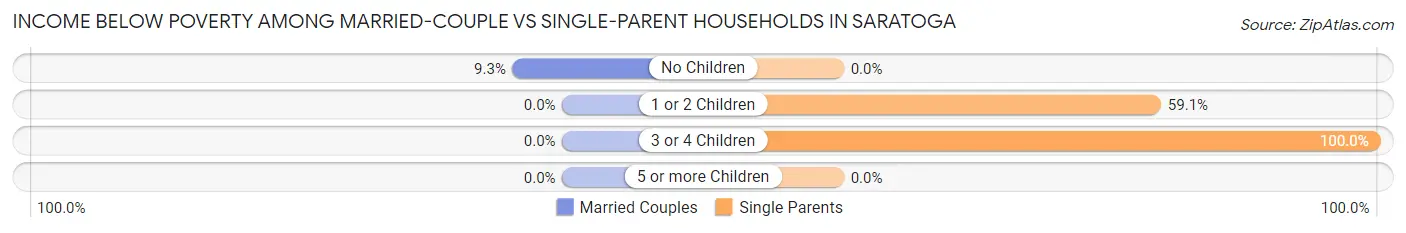
| Children | Married-Couple Families | Single-Parent Households |
| No Children | 5 (9.3%) | 0 (0.0%) |
| 1 or 2 Children | 0 (0.0%) | 13 (59.1%) |
| 3 or 4 Children | 0 (0.0%) | 5 (100.0%) |
| 5 or more Children | 0 (0.0%) | 0 (0.0%) |
| Total | 5 (8.5%) | 18 (50.0%) |
Race in Saratoga
The most populous races in Saratoga are Black / African American (224 | 64.9%), White / Caucasian (90 | 26.1%), and Two or more Races (27 | 7.8%).
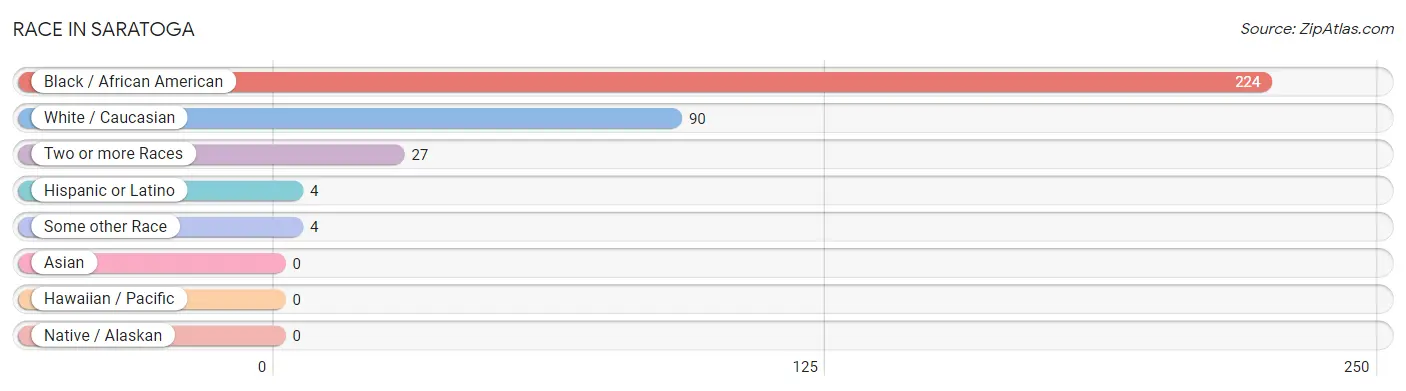
| Race | # Population | % Population |
| Asian | 0 | 0.0% |
| Black / African American | 224 | 64.9% |
| Hawaiian / Pacific | 0 | 0.0% |
| Hispanic or Latino | 4 | 1.2% |
| Native / Alaskan | 0 | 0.0% |
| White / Caucasian | 90 | 26.1% |
| Two or more Races | 27 | 7.8% |
| Some other Race | 4 | 1.2% |
| Total | 345 | 100.0% |
Ancestry in Saratoga
The most populous ancestries reported in Saratoga are American (29 | 8.4%), Lumbee (14 | 4.1%), English (12 | 3.5%), German (12 | 3.5%), and Korean (8 | 2.3%), together accounting for 21.7% of all Saratoga residents.
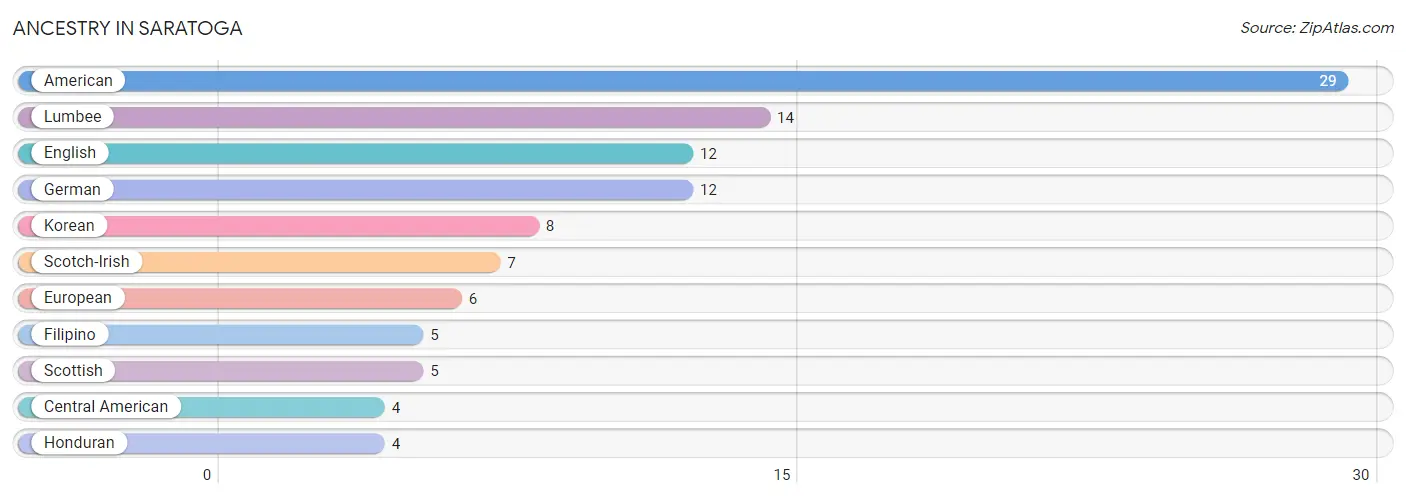
| Ancestry | # Population | % Population |
| American | 29 | 8.4% |
| Central American | 4 | 1.2% |
| English | 12 | 3.5% |
| European | 6 | 1.7% |
| Filipino | 5 | 1.5% |
| German | 12 | 3.5% |
| Honduran | 4 | 1.2% |
| Korean | 8 | 2.3% |
| Lumbee | 14 | 4.1% |
| Scotch-Irish | 7 | 2.0% |
| Scottish | 5 | 1.5% | View All 11 Rows |
Immigrants in Saratoga
The most numerous immigrant groups reported in Saratoga came from Central America (4 | 1.2%), Honduras (4 | 1.2%), and Latin America (4 | 1.2%), together accounting for 3.5% of all Saratoga residents.
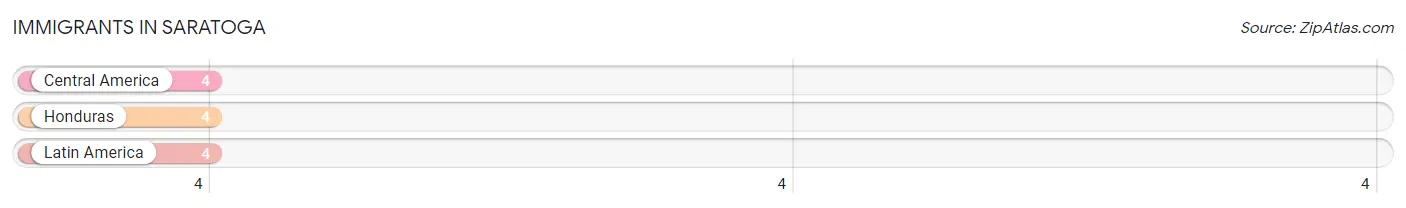
| Immigration Origin | # Population | % Population |
| Central America | 4 | 1.2% |
| Honduras | 4 | 1.2% |
| Latin America | 4 | 1.2% | View All 3 Rows |
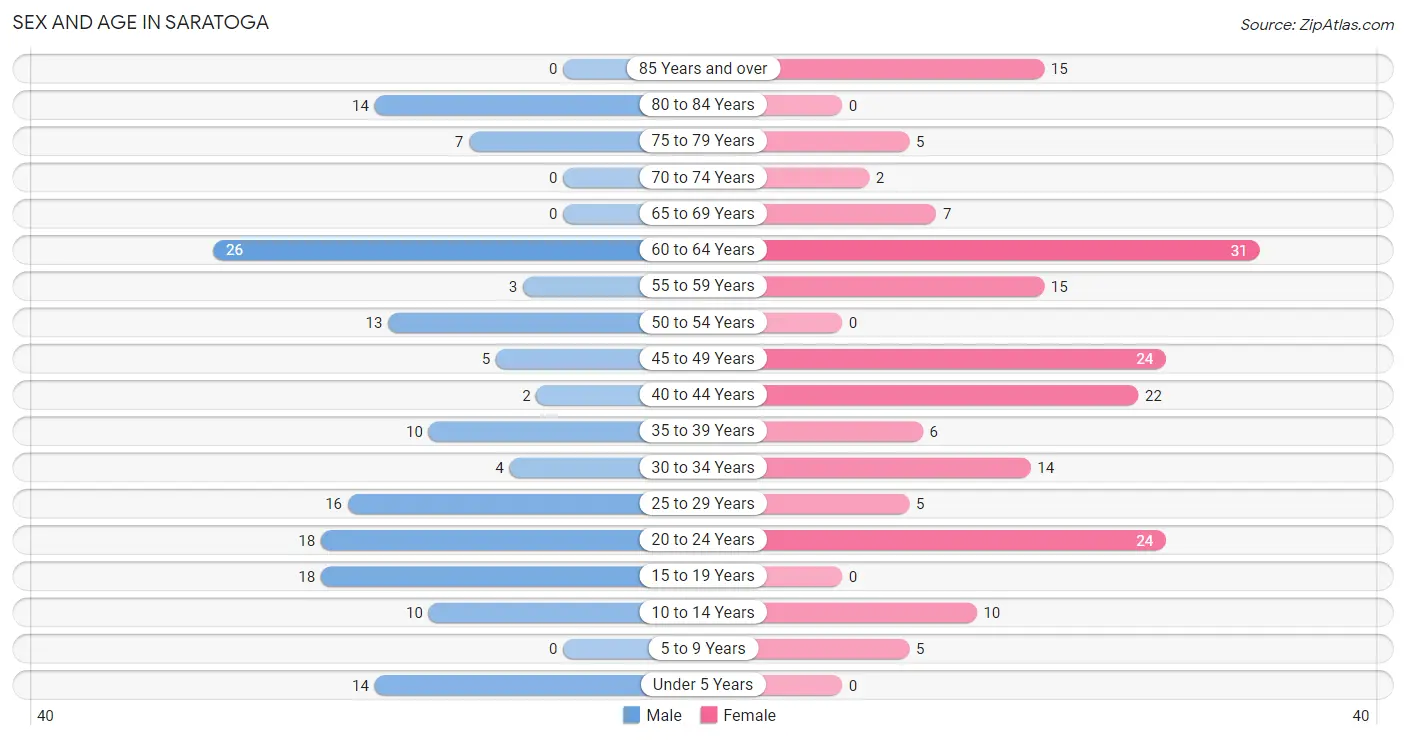
Sex and Age in Saratoga
Sex and Age in Saratoga
The most populous age groups in Saratoga are 60 to 64 Years (26 | 16.3%) for men and 60 to 64 Years (31 | 16.8%) for women.
| Age Bracket | Male | Female |
| Under 5 Years | 14 (8.7%) | 0 (0.0%) |
| 5 to 9 Years | 0 (0.0%) | 5 (2.7%) |
| 10 to 14 Years | 10 (6.2%) | 10 (5.4%) |
| 15 to 19 Years | 18 (11.3%) | 0 (0.0%) |
| 20 to 24 Years | 18 (11.3%) | 24 (13.0%) |
| 25 to 29 Years | 16 (10.0%) | 5 (2.7%) |
| 30 to 34 Years | 4 (2.5%) | 14 (7.6%) |
| 35 to 39 Years | 10 (6.2%) | 6 (3.2%) |
| 40 to 44 Years | 2 (1.3%) | 22 (11.9%) |
| 45 to 49 Years | 5 (3.1%) | 24 (13.0%) |
| 50 to 54 Years | 13 (8.1%) | 0 (0.0%) |
| 55 to 59 Years | 3 (1.9%) | 15 (8.1%) |
| 60 to 64 Years | 26 (16.3%) | 31 (16.8%) |
| 65 to 69 Years | 0 (0.0%) | 7 (3.8%) |
| 70 to 74 Years | 0 (0.0%) | 2 (1.1%) |
| 75 to 79 Years | 7 (4.4%) | 5 (2.7%) |
| 80 to 84 Years | 14 (8.7%) | 0 (0.0%) |
| 85 Years and over | 0 (0.0%) | 15 (8.1%) |
| Total | 160 (100.0%) | 185 (100.0%) |
Families and Households in Saratoga
Median Family Size in Saratoga
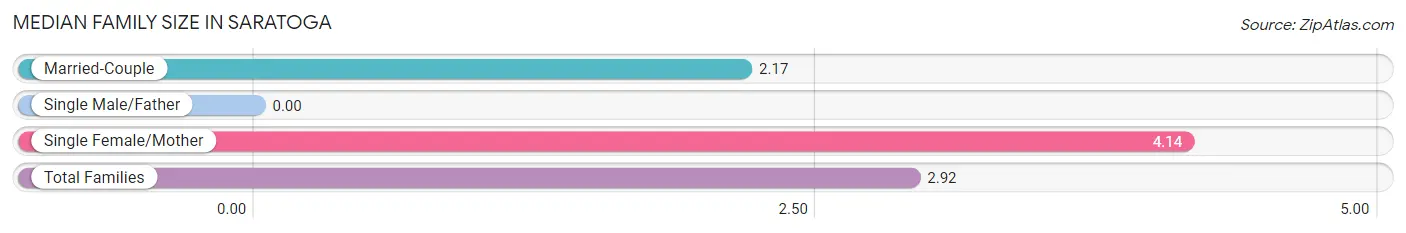
| Family Type | # Families | Family Size |
| Married-Couple | 59 (62.1%) | 2.17 |
| Single Male/Father | 0 (0.0%) | - |
| Single Female/Mother | 36 (37.9%) | 4.14 |
| Total Families | 95 (100.0%) | 2.92 |
Median Household Size in Saratoga
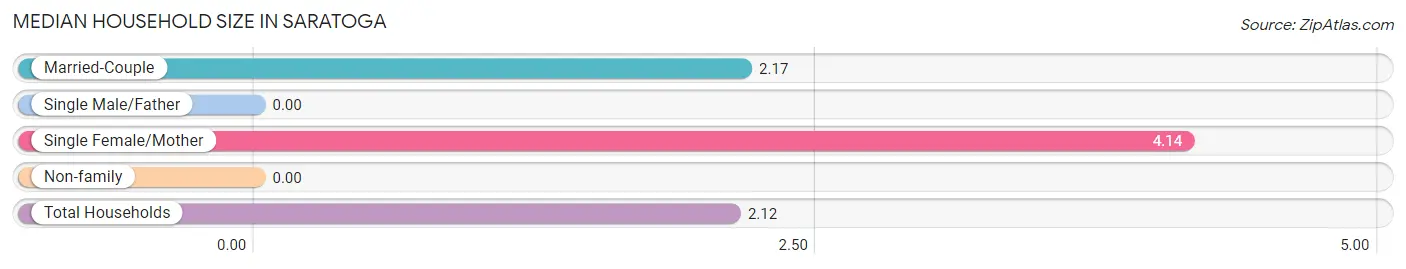
| Household Type | # Households | Household Size |
| Married-Couple | 59 (36.2%) | 2.17 |
| Single Male/Father | 0 (0.0%) | - |
| Single Female/Mother | 36 (22.1%) | 4.14 |
| Non-family | 68 (41.7%) | - |
| Total Households | 163 (100.0%) | 2.12 |
Household Size by Marriage Status in Saratoga
Out of a total of 163 households in Saratoga, 95 (58.3%) are family households, while 68 (41.7%) are nonfamily households. The most numerous type of family households are 2-person households, comprising 44, and the most common type of nonfamily households are 1-person households, comprising 68.
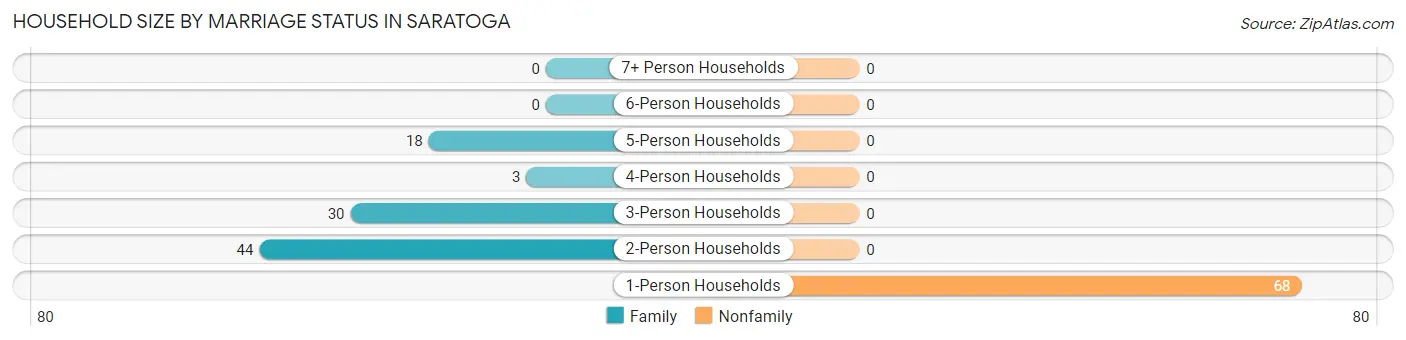
| Household Size | Family Households | Nonfamily Households |
| 1-Person Households | - | 68 (41.7%) |
| 2-Person Households | 44 (27.0%) | 0 (0.0%) |
| 3-Person Households | 30 (18.4%) | 0 (0.0%) |
| 4-Person Households | 3 (1.8%) | 0 (0.0%) |
| 5-Person Households | 18 (11.0%) | 0 (0.0%) |
| 6-Person Households | 0 (0.0%) | 0 (0.0%) |
| 7+ Person Households | 0 (0.0%) | 0 (0.0%) |
| Total | 95 (58.3%) | 68 (41.7%) |
Female Fertility in Saratoga
Fertility by Age in Saratoga
Average fertility rate in Saratoga is 137.0 births per 1,000 women. Women in the age bracket of 20 to 34 years have the highest fertility rate with 302.0 births per 1,000 women. Women in the age bracket of 20 to 34 years acount for 100.0% of all women with births.
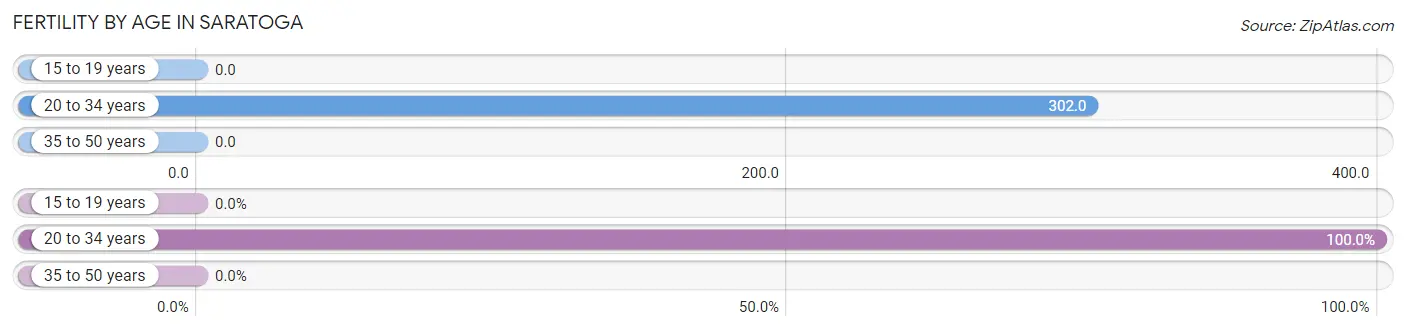
| Age Bracket | Women with Births | Births / 1,000 Women |
| 15 to 19 years | 0 (0.0%) | 0.0 |
| 20 to 34 years | 13 (100.0%) | 302.0 |
| 35 to 50 years | 0 (0.0%) | 0.0 |
| Total | 13 (100.0%) | 137.0 |
Fertility by Age by Marriage Status in Saratoga
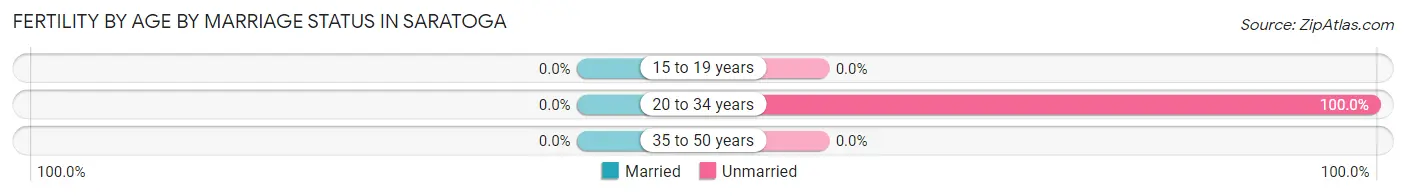
| Age Bracket | Married | Unmarried |
| 15 to 19 years | 0 (0.0%) | 0 (0.0%) |
| 20 to 34 years | 0 (0.0%) | 13 (100.0%) |
| 35 to 50 years | 0 (0.0%) | 0 (0.0%) |
| Total | 0 (0.0%) | 13 (100.0%) |
Fertility by Education in Saratoga
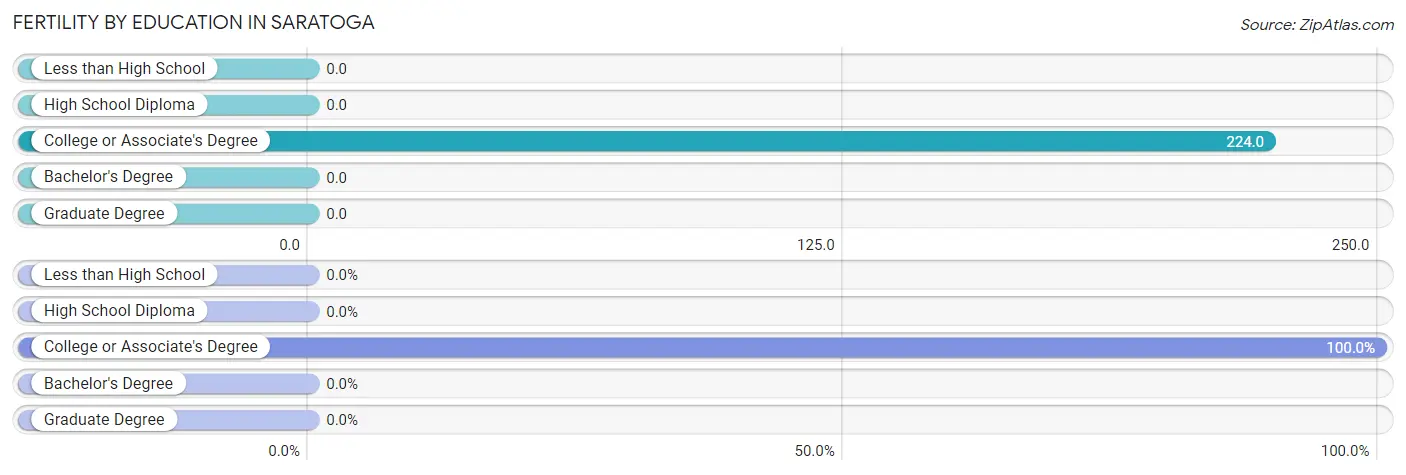
| Educational Attainment | Women with Births | Births / 1,000 Women |
| Less than High School | 0 (0.0%) | 0.0 |
| High School Diploma | 0 (0.0%) | 0.0 |
| College or Associate's Degree | 13 (100.0%) | 224.0 |
| Bachelor's Degree | 0 (0.0%) | 0.0 |
| Graduate Degree | 0 (0.0%) | 0.0 |
| Total | 13 (100.0%) | 137.0 |
Fertility by Education by Marriage Status in Saratoga
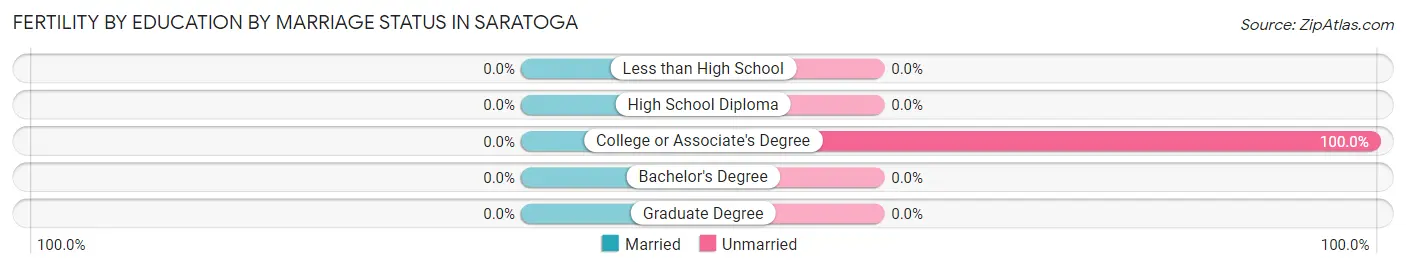
| Educational Attainment | Married | Unmarried |
| Less than High School | 0 (0.0%) | 0 (0.0%) |
| High School Diploma | 0 (0.0%) | 0 (0.0%) |
| College or Associate's Degree | 0 (0.0%) | 13 (100.0%) |
| Bachelor's Degree | 0 (0.0%) | 0 (0.0%) |
| Graduate Degree | 0 (0.0%) | 0 (0.0%) |
| Total | 0 (0.0%) | 13 (100.0%) |
Employment Characteristics in Saratoga
Employment by Class of Employer in Saratoga
Among the 175 employed individuals in Saratoga, private company employees (94 | 53.7%), local government employees (39 | 22.3%), and state government employees (16 | 9.1%) make up the most common classes of employment.
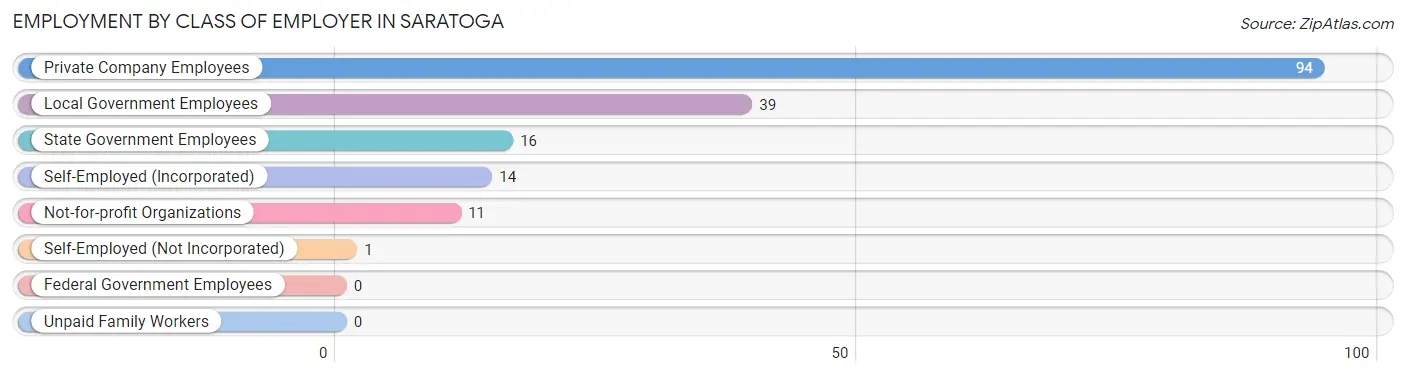
| Employer Class | # Employees | % Employees |
| Private Company Employees | 94 | 53.7% |
| Self-Employed (Incorporated) | 14 | 8.0% |
| Self-Employed (Not Incorporated) | 1 | 0.6% |
| Not-for-profit Organizations | 11 | 6.3% |
| Local Government Employees | 39 | 22.3% |
| State Government Employees | 16 | 9.1% |
| Federal Government Employees | 0 | 0.0% |
| Unpaid Family Workers | 0 | 0.0% |
| Total | 175 | 100.0% |
Employment Status by Age in Saratoga
According to the labor force statistics for Saratoga, out of the total population over 16 years of age (304), 64.5% or 196 individuals are in the labor force, with 10.7% or 21 of them unemployed. The age group with the highest labor force participation rate is 16 to 19 years, with 100.0% or 16 individuals in the labor force. Within the labor force, the 16 to 19 years age range has the highest percentage of unemployed individuals, with 100.0% or 16 of them being unemployed.
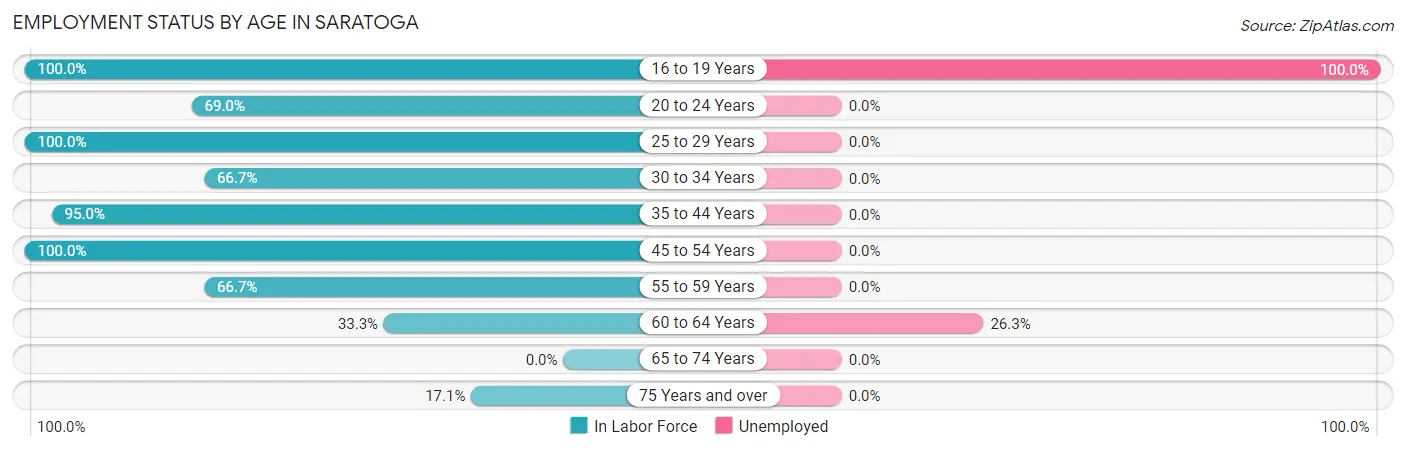
| Age Bracket | In Labor Force | Unemployed |
| 16 to 19 Years | 16 (100.0%) | 16 (100.0%) |
| 20 to 24 Years | 29 (69.0%) | 0 (0.0%) |
| 25 to 29 Years | 21 (100.0%) | 0 (0.0%) |
| 30 to 34 Years | 12 (66.7%) | 0 (0.0%) |
| 35 to 44 Years | 38 (95.0%) | 0 (0.0%) |
| 45 to 54 Years | 42 (100.0%) | 0 (0.0%) |
| 55 to 59 Years | 12 (66.7%) | 0 (0.0%) |
| 60 to 64 Years | 19 (33.3%) | 5 (26.3%) |
| 65 to 74 Years | 0 (0.0%) | 0 (0.0%) |
| 75 Years and over | 7 (17.1%) | 0 (0.0%) |
| Total | 196 (64.5%) | 21 (10.7%) |
Employment Status by Educational Attainment in Saratoga
According to labor force statistics for Saratoga, 73.5% of individuals (144) out of the total population between 25 and 64 years of age (196) are in the labor force, with 3.5% or 5 of them being unemployed. The group with the highest labor force participation rate are those with the educational attainment of less than high school, with 100.0% or 6 individuals in the labor force. Within the labor force, individuals with less than high school education have the highest percentage of unemployment, with 83.3% or 5 of them being unemployed.
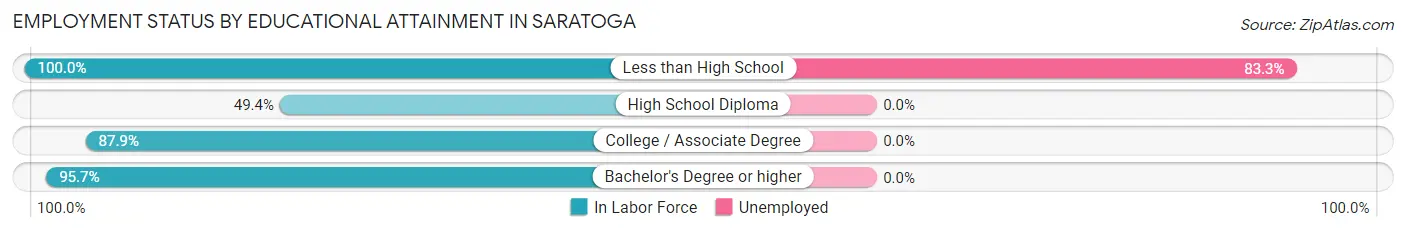
| Educational Attainment | In Labor Force | Unemployed |
| Less than High School | 6 (100.0%) | 5 (83.3%) |
| High School Diploma | 42 (49.4%) | 0 (0.0%) |
| College / Associate Degree | 51 (87.9%) | 0 (0.0%) |
| Bachelor's Degree or higher | 45 (95.7%) | 0 (0.0%) |
| Total | 144 (73.5%) | 7 (3.5%) |
Employment Occupations by Sex in Saratoga
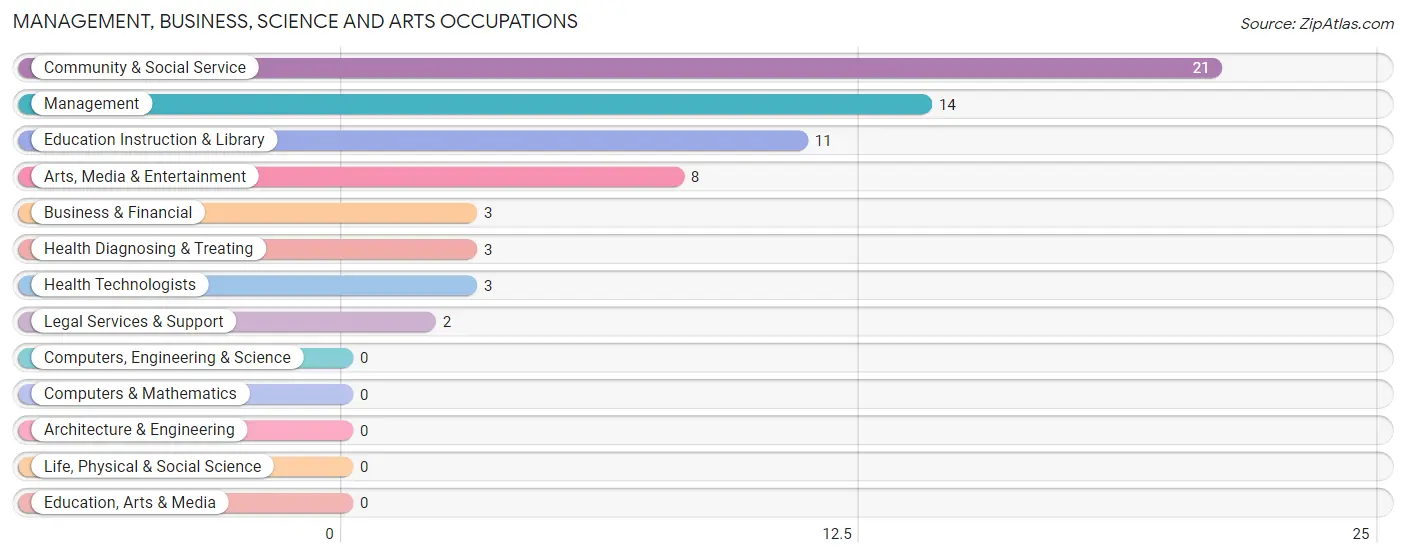
Management, Business, Science and Arts Occupations
The most common Management, Business, Science and Arts occupations in Saratoga are Community & Social Service (21 | 12.0%), Management (14 | 8.0%), Education Instruction & Library (11 | 6.3%), Arts, Media & Entertainment (8 | 4.6%), and Business & Financial (3 | 1.7%).
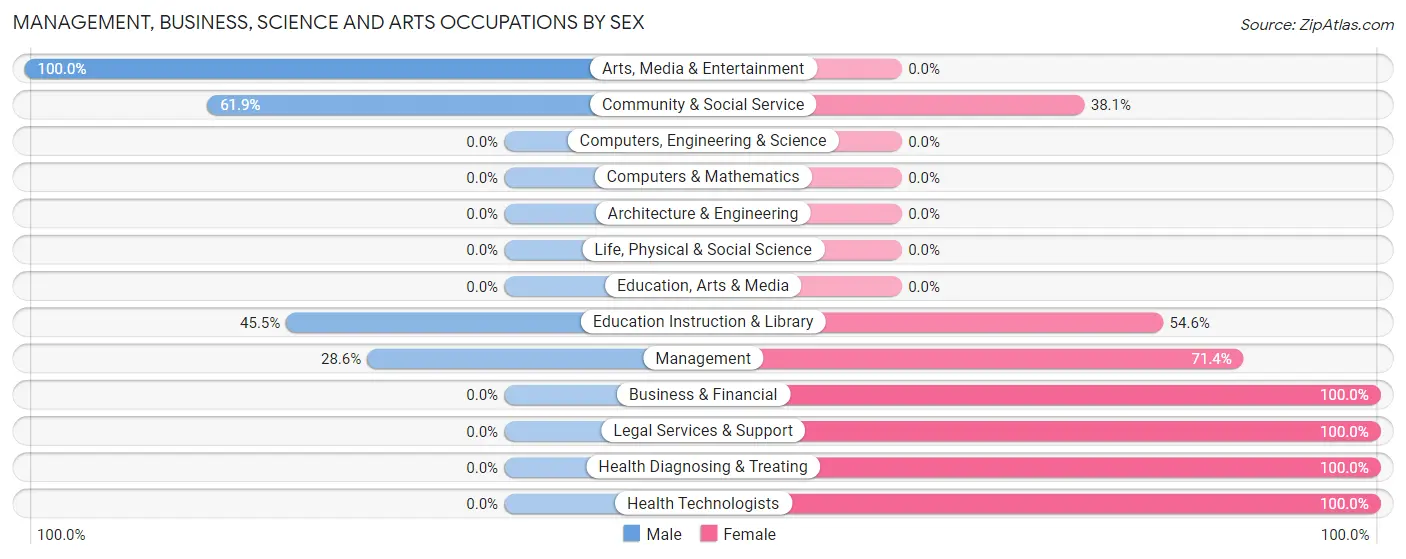
Management, Business, Science and Arts Occupations by Sex
Within the Management, Business, Science and Arts occupations in Saratoga, the most male-oriented occupations are Arts, Media & Entertainment (100.0%), Community & Social Service (61.9%), and Education Instruction & Library (45.5%), while the most female-oriented occupations are Business & Financial (100.0%), Legal Services & Support (100.0%), and Health Diagnosing & Treating (100.0%).
| Occupation | Male | Female |
| Management | 4 (28.6%) | 10 (71.4%) |
| Business & Financial | 0 (0.0%) | 3 (100.0%) |
| Computers, Engineering & Science | 0 (0.0%) | 0 (0.0%) |
| Computers & Mathematics | 0 (0.0%) | 0 (0.0%) |
| Architecture & Engineering | 0 (0.0%) | 0 (0.0%) |
| Life, Physical & Social Science | 0 (0.0%) | 0 (0.0%) |
| Community & Social Service | 13 (61.9%) | 8 (38.1%) |
| Education, Arts & Media | 0 (0.0%) | 0 (0.0%) |
| Legal Services & Support | 0 (0.0%) | 2 (100.0%) |
| Education Instruction & Library | 5 (45.5%) | 6 (54.5%) |
| Arts, Media & Entertainment | 8 (100.0%) | 0 (0.0%) |
| Health Diagnosing & Treating | 0 (0.0%) | 3 (100.0%) |
| Health Technologists | 0 (0.0%) | 3 (100.0%) |
| Total (Category) | 17 (41.5%) | 24 (58.5%) |
| Total (Overall) | 81 (46.3%) | 94 (53.7%) |
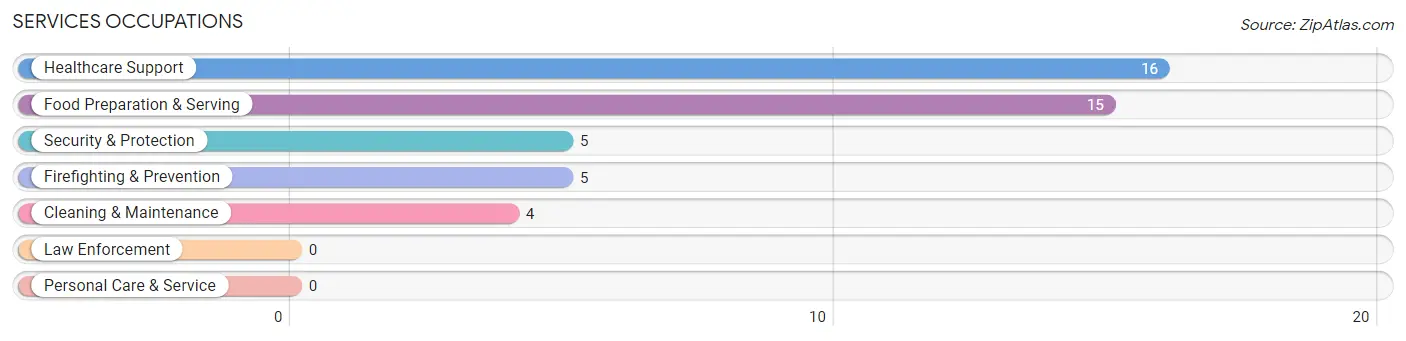
Services Occupations
The most common Services occupations in Saratoga are Healthcare Support (16 | 9.1%), Food Preparation & Serving (15 | 8.6%), Security & Protection (5 | 2.9%), Firefighting & Prevention (5 | 2.9%), and Cleaning & Maintenance (4 | 2.3%).
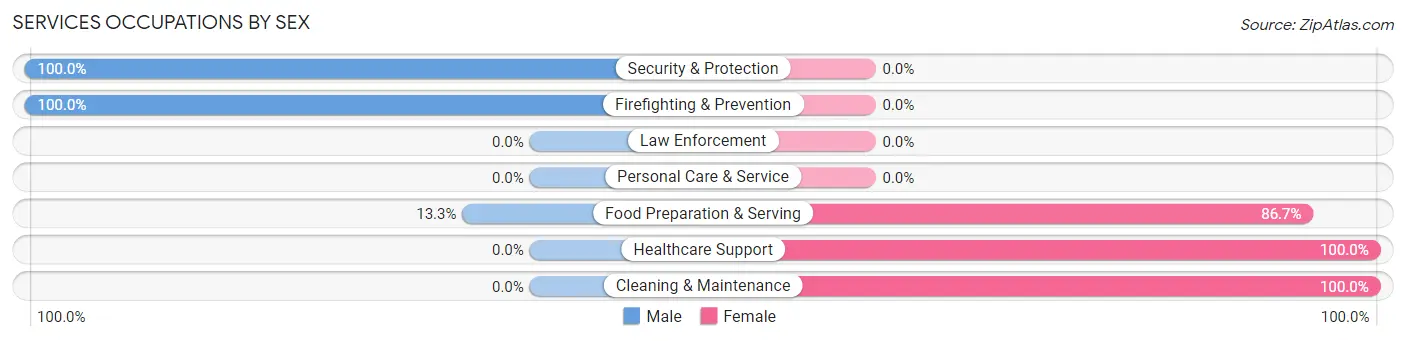
Services Occupations by Sex
Within the Services occupations in Saratoga, the most male-oriented occupations are Security & Protection (100.0%), Firefighting & Prevention (100.0%), and Food Preparation & Serving (13.3%), while the most female-oriented occupations are Healthcare Support (100.0%), Cleaning & Maintenance (100.0%), and Food Preparation & Serving (86.7%).
| Occupation | Male | Female |
| Healthcare Support | 0 (0.0%) | 16 (100.0%) |
| Security & Protection | 5 (100.0%) | 0 (0.0%) |
| Firefighting & Prevention | 5 (100.0%) | 0 (0.0%) |
| Law Enforcement | 0 (0.0%) | 0 (0.0%) |
| Food Preparation & Serving | 2 (13.3%) | 13 (86.7%) |
| Cleaning & Maintenance | 0 (0.0%) | 4 (100.0%) |
| Personal Care & Service | 0 (0.0%) | 0 (0.0%) |
| Total (Category) | 7 (17.5%) | 33 (82.5%) |
| Total (Overall) | 81 (46.3%) | 94 (53.7%) |
Sales and Office Occupations
The most common Sales and Office occupations in Saratoga are , and Office & Administration (31 | 17.7%).
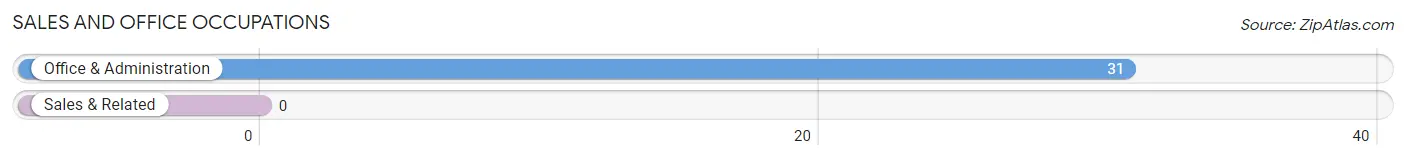
Sales and Office Occupations by Sex
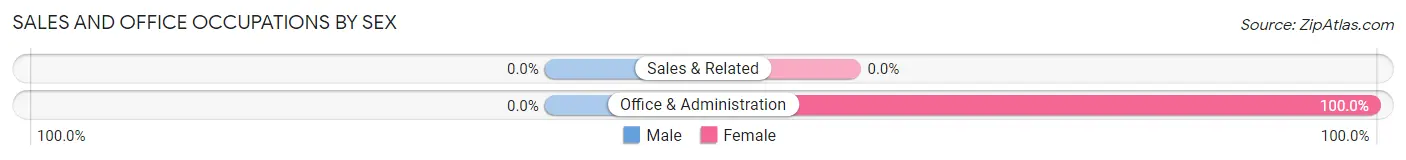
| Occupation | Male | Female |
| Sales & Related | 0 (0.0%) | 0 (0.0%) |
| Office & Administration | 0 (0.0%) | 31 (100.0%) |
| Total (Category) | 0 (0.0%) | 31 (100.0%) |
| Total (Overall) | 81 (46.3%) | 94 (53.7%) |
Natural Resources, Construction and Maintenance Occupations
The most common Natural Resources, Construction and Maintenance occupations in Saratoga are Farming, Fishing & Forestry (5 | 2.9%), and Installation, Maintenance & Repair (3 | 1.7%).
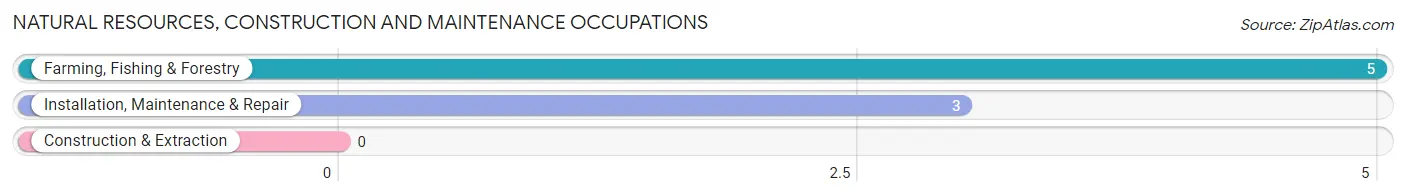
Natural Resources, Construction and Maintenance Occupations by Sex
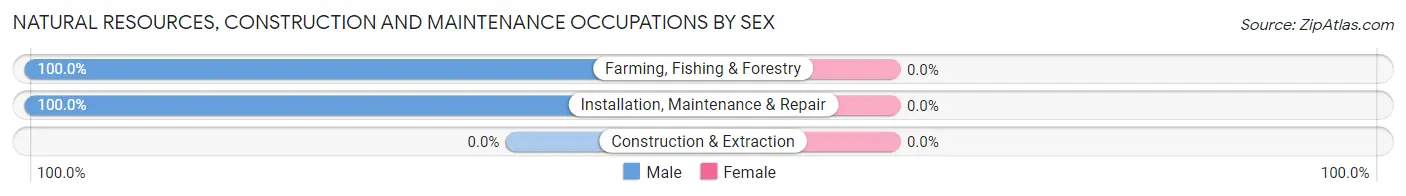
| Occupation | Male | Female |
| Farming, Fishing & Forestry | 5 (100.0%) | 0 (0.0%) |
| Construction & Extraction | 0 (0.0%) | 0 (0.0%) |
| Installation, Maintenance & Repair | 3 (100.0%) | 0 (0.0%) |
| Total (Category) | 8 (100.0%) | 0 (0.0%) |
| Total (Overall) | 81 (46.3%) | 94 (53.7%) |
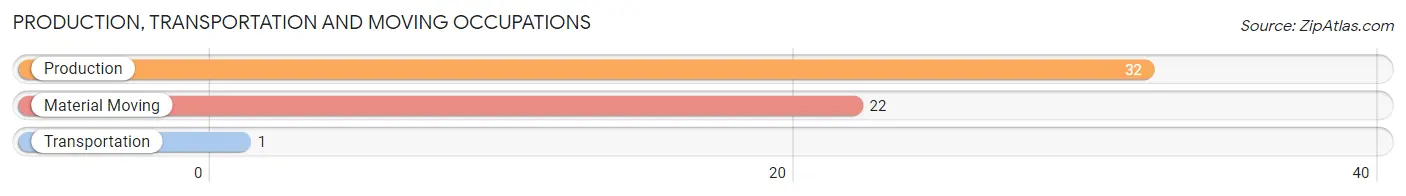
Production, Transportation and Moving Occupations
The most common Production, Transportation and Moving occupations in Saratoga are Production (32 | 18.3%), Material Moving (22 | 12.6%), and Transportation (1 | 0.6%).
Production, Transportation and Moving Occupations by Sex
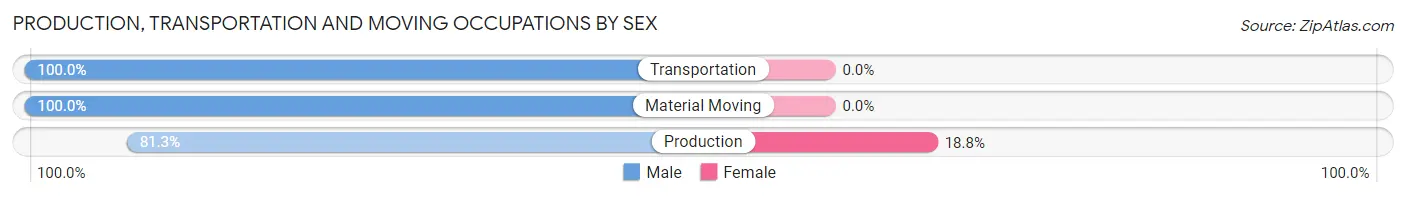
| Occupation | Male | Female |
| Production | 26 (81.2%) | 6 (18.8%) |
| Transportation | 1 (100.0%) | 0 (0.0%) |
| Material Moving | 22 (100.0%) | 0 (0.0%) |
| Total (Category) | 49 (89.1%) | 6 (10.9%) |
| Total (Overall) | 81 (46.3%) | 94 (53.7%) |
Employment Industries by Sex in Saratoga
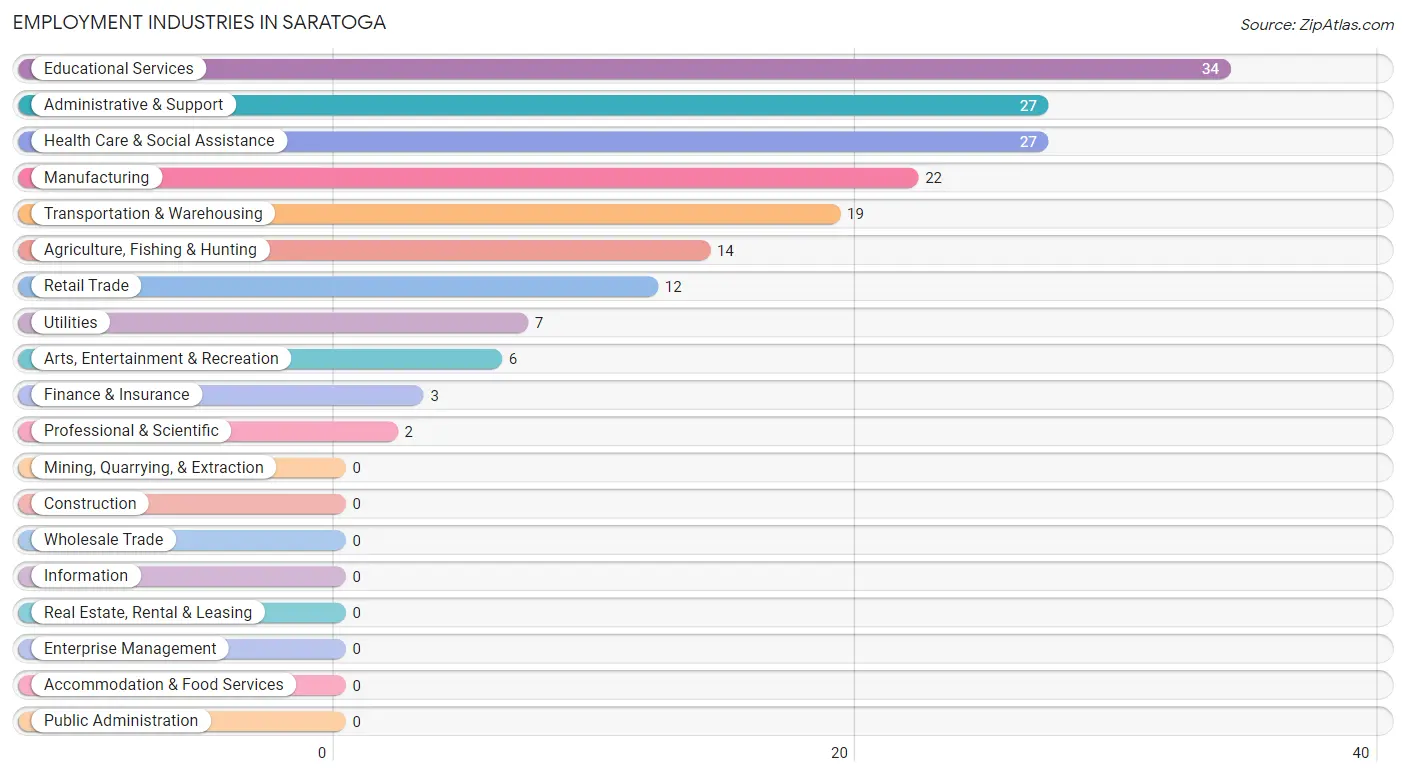
Employment Industries in Saratoga
The major employment industries in Saratoga include Educational Services (34 | 19.4%), Administrative & Support (27 | 15.4%), Health Care & Social Assistance (27 | 15.4%), Manufacturing (22 | 12.6%), and Transportation & Warehousing (19 | 10.9%).
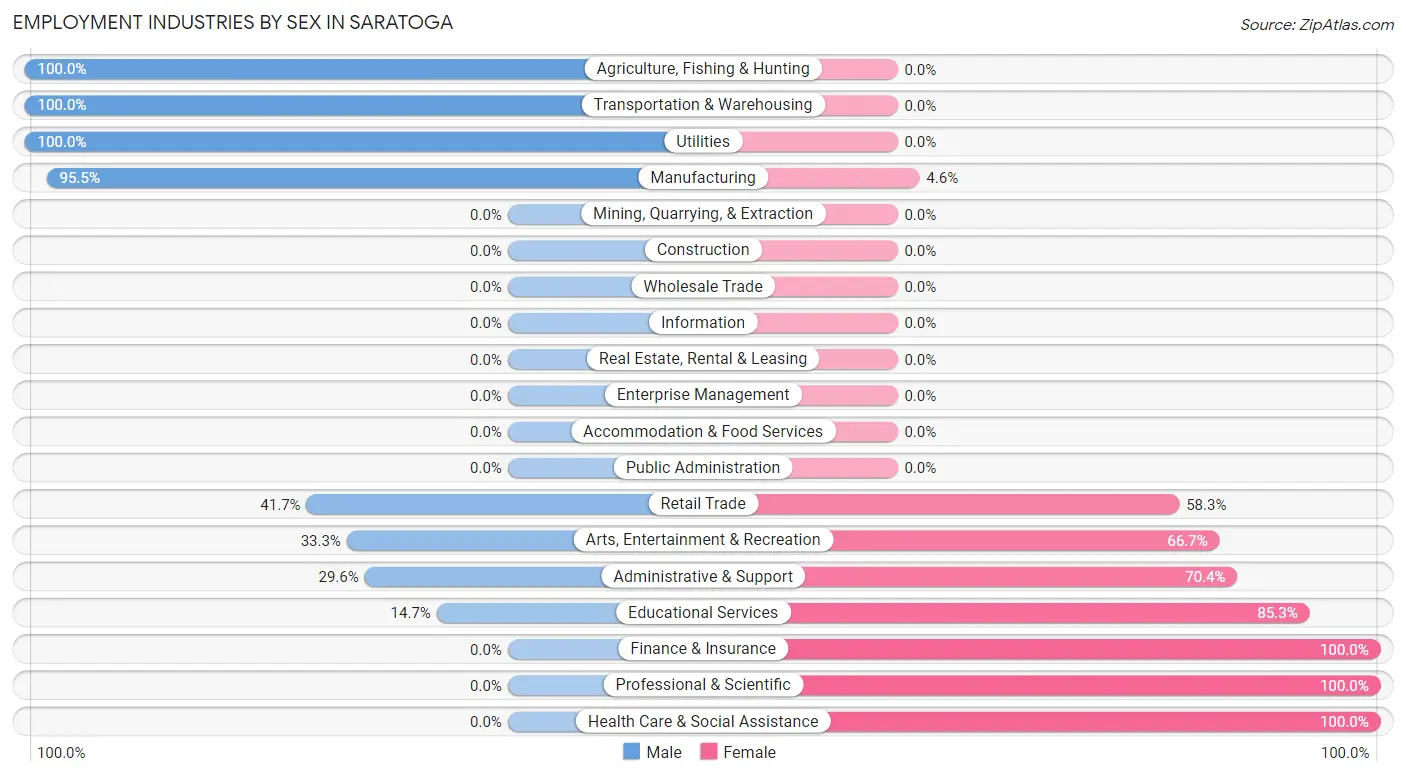
Employment Industries by Sex in Saratoga
The Saratoga industries that see more men than women are Agriculture, Fishing & Hunting (100.0%), Transportation & Warehousing (100.0%), and Utilities (100.0%), whereas the industries that tend to have a higher number of women are Finance & Insurance (100.0%), Professional & Scientific (100.0%), and Health Care & Social Assistance (100.0%).
| Industry | Male | Female |
| Agriculture, Fishing & Hunting | 14 (100.0%) | 0 (0.0%) |
| Mining, Quarrying, & Extraction | 0 (0.0%) | 0 (0.0%) |
| Construction | 0 (0.0%) | 0 (0.0%) |
| Manufacturing | 21 (95.5%) | 1 (4.5%) |
| Wholesale Trade | 0 (0.0%) | 0 (0.0%) |
| Retail Trade | 5 (41.7%) | 7 (58.3%) |
| Transportation & Warehousing | 19 (100.0%) | 0 (0.0%) |
| Utilities | 7 (100.0%) | 0 (0.0%) |
| Information | 0 (0.0%) | 0 (0.0%) |
| Finance & Insurance | 0 (0.0%) | 3 (100.0%) |
| Real Estate, Rental & Leasing | 0 (0.0%) | 0 (0.0%) |
| Professional & Scientific | 0 (0.0%) | 2 (100.0%) |
| Enterprise Management | 0 (0.0%) | 0 (0.0%) |
| Administrative & Support | 8 (29.6%) | 19 (70.4%) |
| Educational Services | 5 (14.7%) | 29 (85.3%) |
| Health Care & Social Assistance | 0 (0.0%) | 27 (100.0%) |
| Arts, Entertainment & Recreation | 2 (33.3%) | 4 (66.7%) |
| Accommodation & Food Services | 0 (0.0%) | 0 (0.0%) |
| Public Administration | 0 (0.0%) | 0 (0.0%) |
| Total | 81 (46.3%) | 94 (53.7%) |
Education in Saratoga
School Enrollment in Saratoga
The most common levels of schooling among the 81 students in Saratoga are college / undergraduate (35 | 43.2%), high school (18 | 22.2%), and elementary school (11 | 13.6%).
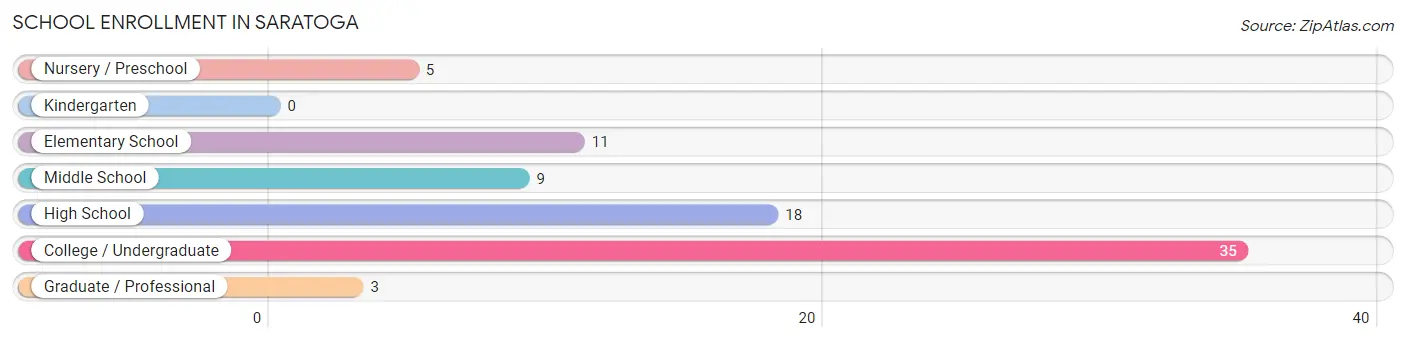
| School Level | # Students | % Students |
| Nursery / Preschool | 5 | 6.2% |
| Kindergarten | 0 | 0.0% |
| Elementary School | 11 | 13.6% |
| Middle School | 9 | 11.1% |
| High School | 18 | 22.2% |
| College / Undergraduate | 35 | 43.2% |
| Graduate / Professional | 3 | 3.7% |
| Total | 81 | 100.0% |
School Enrollment by Age by Funding Source in Saratoga
Out of a total of 81 students who are enrolled in schools in Saratoga, 28 (34.6%) attend a private institution, while the remaining 53 (65.4%) are enrolled in public schools. The age group of 5 to 9 year old has the highest likelihood of being enrolled in private schools, with 4 (100.0% in the age bracket) enrolled. Conversely, the age group of 3 to 4 year olds has the lowest likelihood of being enrolled in a private school, with 1 (100.0% in the age bracket) attending a public institution.
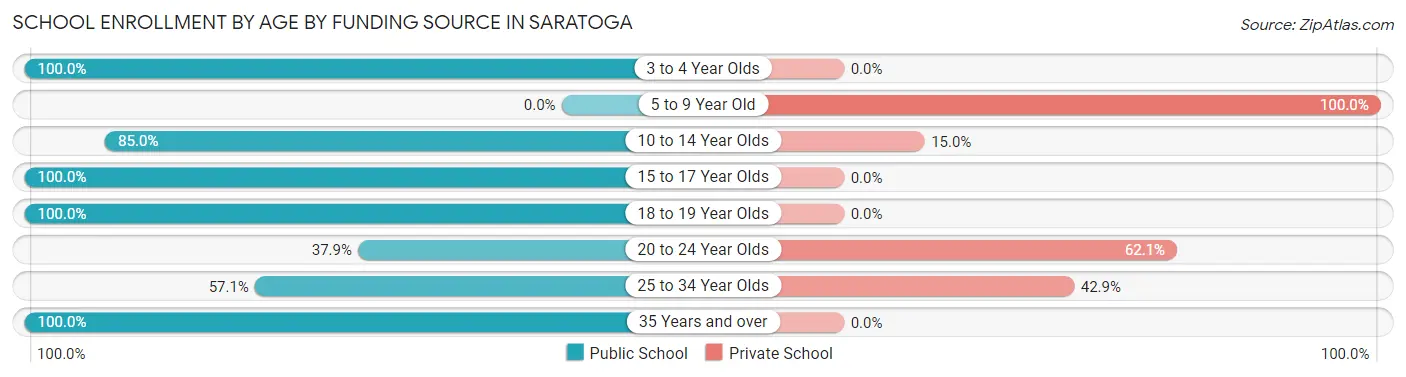
| Age Bracket | Public School | Private School |
| 3 to 4 Year Olds | 1 (100.0%) | 0 (0.0%) |
| 5 to 9 Year Old | 0 (0.0%) | 4 (100.0%) |
| 10 to 14 Year Olds | 17 (85.0%) | 3 (15.0%) |
| 15 to 17 Year Olds | 16 (100.0%) | 0 (0.0%) |
| 18 to 19 Year Olds | 2 (100.0%) | 0 (0.0%) |
| 20 to 24 Year Olds | 11 (37.9%) | 18 (62.1%) |
| 25 to 34 Year Olds | 4 (57.1%) | 3 (42.9%) |
| 35 Years and over | 2 (100.0%) | 0 (0.0%) |
| Total | 53 (65.4%) | 28 (34.6%) |
Educational Attainment by Field of Study in Saratoga
Psychology (17 | 24.6%), physical & health sciences (12 | 17.4%), computers & mathematics (7 | 10.1%), social sciences (7 | 10.1%), and business (7 | 10.1%) are the most common fields of study among 69 individuals in Saratoga who have obtained a bachelor's degree or higher.
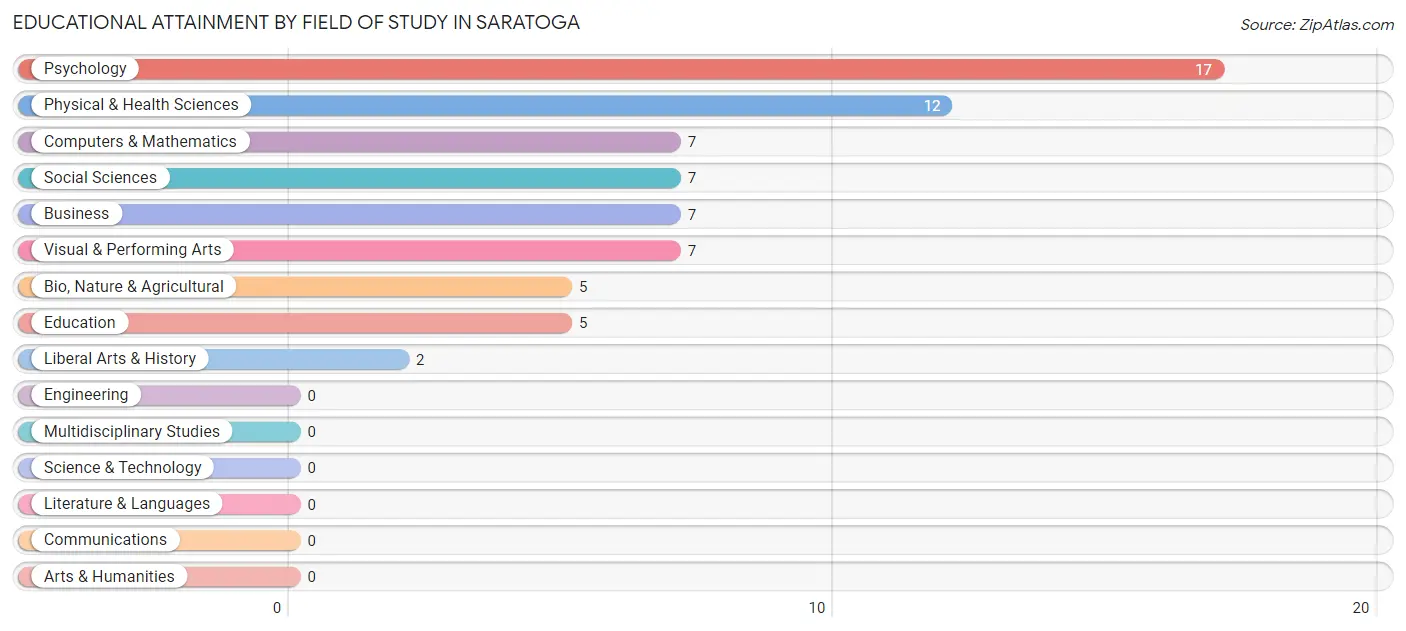
| Field of Study | # Graduates | % Graduates |
| Computers & Mathematics | 7 | 10.1% |
| Bio, Nature & Agricultural | 5 | 7.2% |
| Physical & Health Sciences | 12 | 17.4% |
| Psychology | 17 | 24.6% |
| Social Sciences | 7 | 10.1% |
| Engineering | 0 | 0.0% |
| Multidisciplinary Studies | 0 | 0.0% |
| Science & Technology | 0 | 0.0% |
| Business | 7 | 10.1% |
| Education | 5 | 7.2% |
| Literature & Languages | 0 | 0.0% |
| Liberal Arts & History | 2 | 2.9% |
| Visual & Performing Arts | 7 | 10.1% |
| Communications | 0 | 0.0% |
| Arts & Humanities | 0 | 0.0% |
| Total | 69 | 100.0% |
Transportation & Commute in Saratoga
Vehicle Availability by Sex in Saratoga
The most prevalent vehicle ownership categories in Saratoga are males with 2 vehicles (41, accounting for 50.6%) and females with 2 vehicles (21, making up 43.6%).
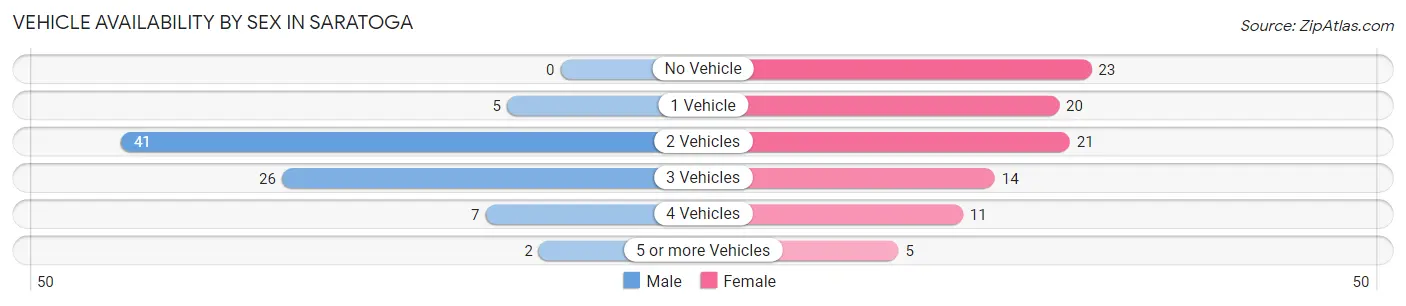
| Vehicles Available | Male | Female |
| No Vehicle | 0 (0.0%) | 23 (24.5%) |
| 1 Vehicle | 5 (6.2%) | 20 (21.3%) |
| 2 Vehicles | 41 (50.6%) | 21 (22.3%) |
| 3 Vehicles | 26 (32.1%) | 14 (14.9%) |
| 4 Vehicles | 7 (8.6%) | 11 (11.7%) |
| 5 or more Vehicles | 2 (2.5%) | 5 (5.3%) |
| Total | 81 (100.0%) | 94 (100.0%) |
Commute Time in Saratoga
The most frequently occuring commute durations in Saratoga are 30 to 34 minutes (39 commuters, 25.3%), 45 to 59 minutes (24 commuters, 15.6%), and 10 to 14 minutes (18 commuters, 11.7%).
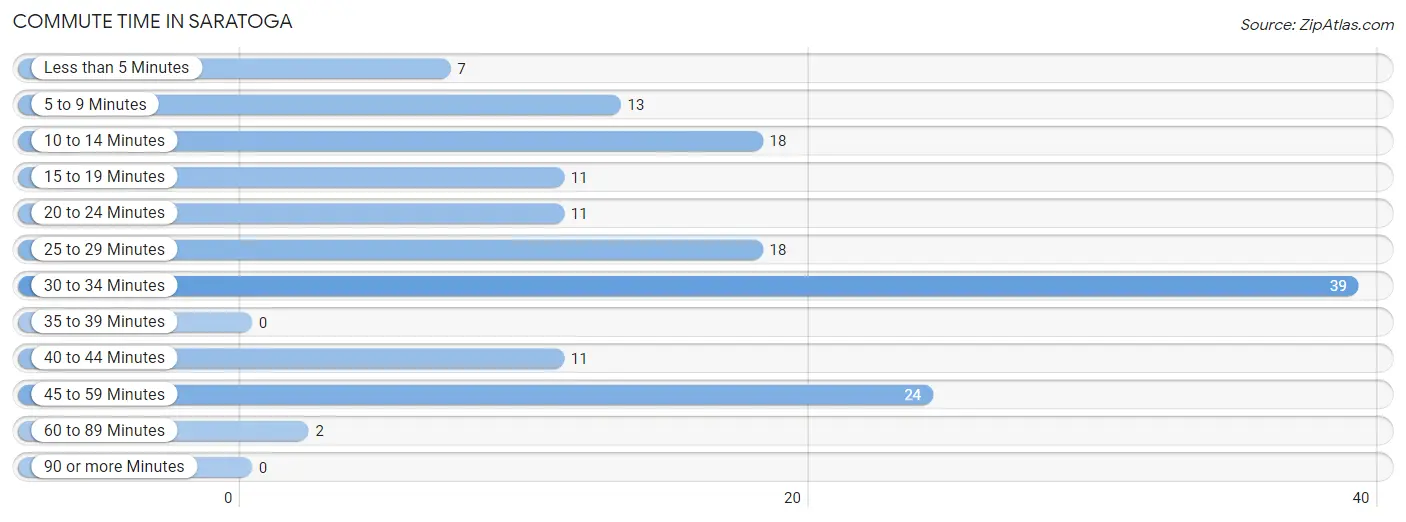
| Commute Time | # Commuters | % Commuters |
| Less than 5 Minutes | 7 | 4.5% |
| 5 to 9 Minutes | 13 | 8.4% |
| 10 to 14 Minutes | 18 | 11.7% |
| 15 to 19 Minutes | 11 | 7.1% |
| 20 to 24 Minutes | 11 | 7.1% |
| 25 to 29 Minutes | 18 | 11.7% |
| 30 to 34 Minutes | 39 | 25.3% |
| 35 to 39 Minutes | 0 | 0.0% |
| 40 to 44 Minutes | 11 | 7.1% |
| 45 to 59 Minutes | 24 | 15.6% |
| 60 to 89 Minutes | 2 | 1.3% |
| 90 or more Minutes | 0 | 0.0% |
Commute Time by Sex in Saratoga
The most common commute times in Saratoga are 30 to 34 minutes (35 commuters, 43.2%) for males and 25 to 29 minutes (18 commuters, 24.7%) for females.
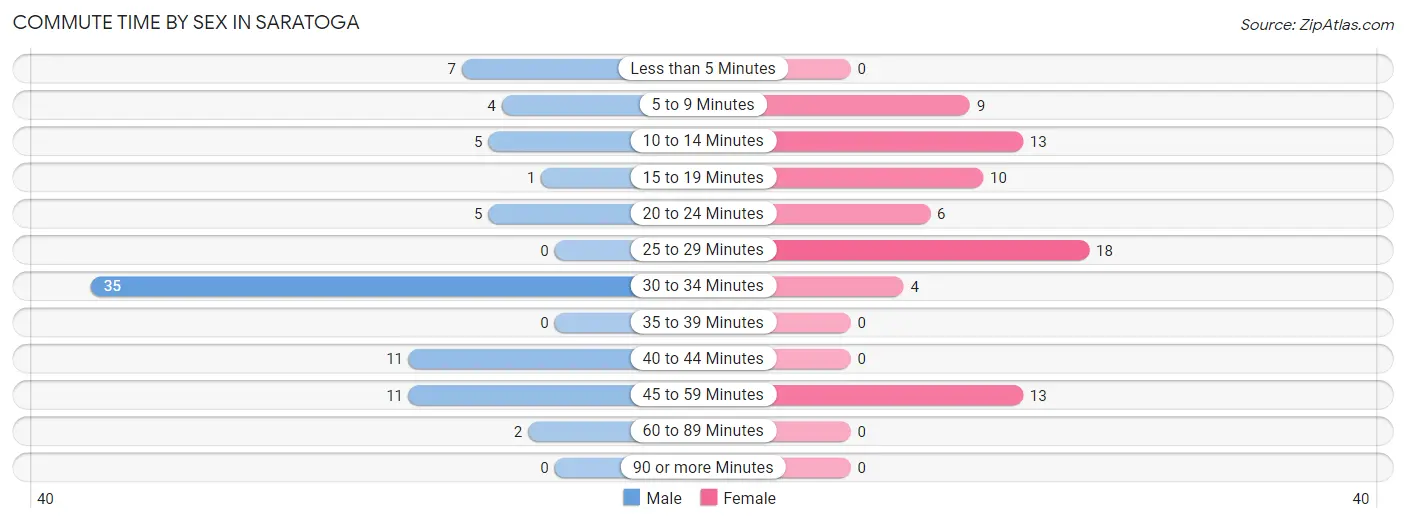
| Commute Time | Male | Female |
| Less than 5 Minutes | 7 (8.6%) | 0 (0.0%) |
| 5 to 9 Minutes | 4 (4.9%) | 9 (12.3%) |
| 10 to 14 Minutes | 5 (6.2%) | 13 (17.8%) |
| 15 to 19 Minutes | 1 (1.2%) | 10 (13.7%) |
| 20 to 24 Minutes | 5 (6.2%) | 6 (8.2%) |
| 25 to 29 Minutes | 0 (0.0%) | 18 (24.7%) |
| 30 to 34 Minutes | 35 (43.2%) | 4 (5.5%) |
| 35 to 39 Minutes | 0 (0.0%) | 0 (0.0%) |
| 40 to 44 Minutes | 11 (13.6%) | 0 (0.0%) |
| 45 to 59 Minutes | 11 (13.6%) | 13 (17.8%) |
| 60 to 89 Minutes | 2 (2.5%) | 0 (0.0%) |
| 90 or more Minutes | 0 (0.0%) | 0 (0.0%) |
Time of Departure to Work by Sex in Saratoga
The most frequent times of departure to work in Saratoga are 6:00 AM to 6:29 AM (33, 40.7%) for males and 6:00 AM to 6:29 AM (22, 30.1%) for females.
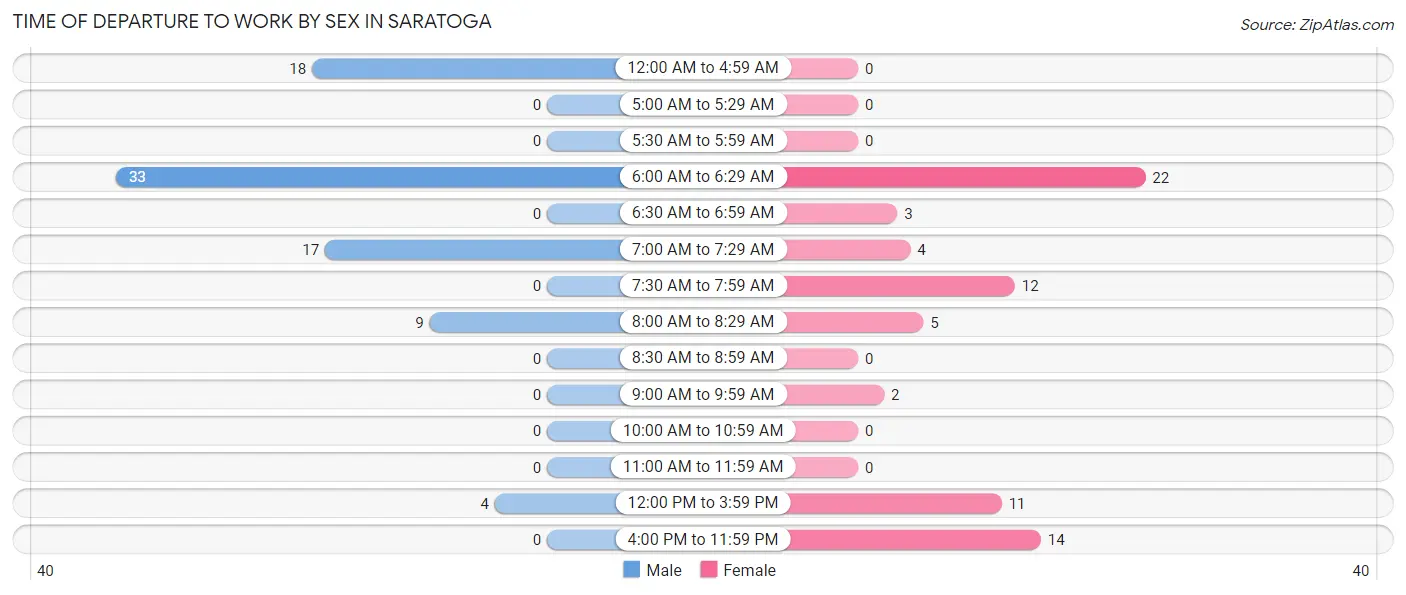
| Time of Departure | Male | Female |
| 12:00 AM to 4:59 AM | 18 (22.2%) | 0 (0.0%) |
| 5:00 AM to 5:29 AM | 0 (0.0%) | 0 (0.0%) |
| 5:30 AM to 5:59 AM | 0 (0.0%) | 0 (0.0%) |
| 6:00 AM to 6:29 AM | 33 (40.7%) | 22 (30.1%) |
| 6:30 AM to 6:59 AM | 0 (0.0%) | 3 (4.1%) |
| 7:00 AM to 7:29 AM | 17 (21.0%) | 4 (5.5%) |
| 7:30 AM to 7:59 AM | 0 (0.0%) | 12 (16.4%) |
| 8:00 AM to 8:29 AM | 9 (11.1%) | 5 (6.9%) |
| 8:30 AM to 8:59 AM | 0 (0.0%) | 0 (0.0%) |
| 9:00 AM to 9:59 AM | 0 (0.0%) | 2 (2.7%) |
| 10:00 AM to 10:59 AM | 0 (0.0%) | 0 (0.0%) |
| 11:00 AM to 11:59 AM | 0 (0.0%) | 0 (0.0%) |
| 12:00 PM to 3:59 PM | 4 (4.9%) | 11 (15.1%) |
| 4:00 PM to 11:59 PM | 0 (0.0%) | 14 (19.2%) |
| Total | 81 (100.0%) | 73 (100.0%) |
Housing Occupancy in Saratoga
Occupancy by Ownership in Saratoga
Of the total 163 dwellings in Saratoga, owner-occupied units account for 116 (71.2%), while renter-occupied units make up 47 (28.8%).
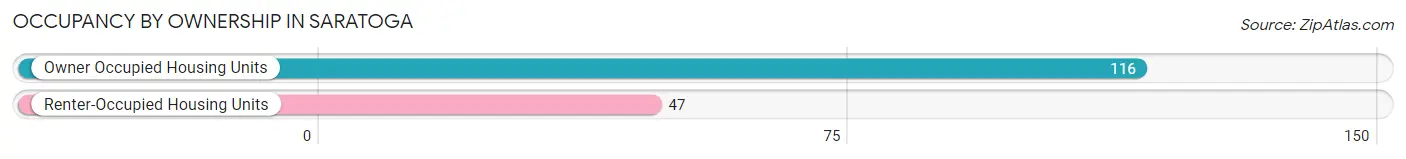
| Occupancy | # Housing Units | % Housing Units |
| Owner Occupied Housing Units | 116 | 71.2% |
| Renter-Occupied Housing Units | 47 | 28.8% |
| Total Occupied Housing Units | 163 | 100.0% |
Occupancy by Household Size in Saratoga
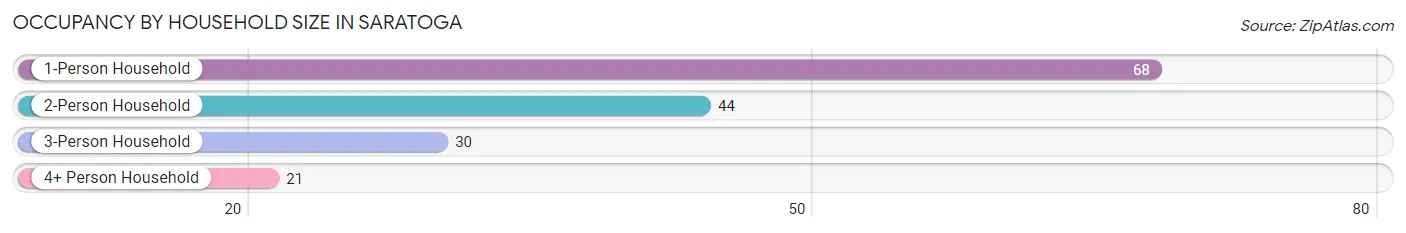
| Household Size | # Housing Units | % Housing Units |
| 1-Person Household | 68 | 41.7% |
| 2-Person Household | 44 | 27.0% |
| 3-Person Household | 30 | 18.4% |
| 4+ Person Household | 21 | 12.9% |
| Total Housing Units | 163 | 100.0% |
Occupancy by Ownership by Household Size in Saratoga
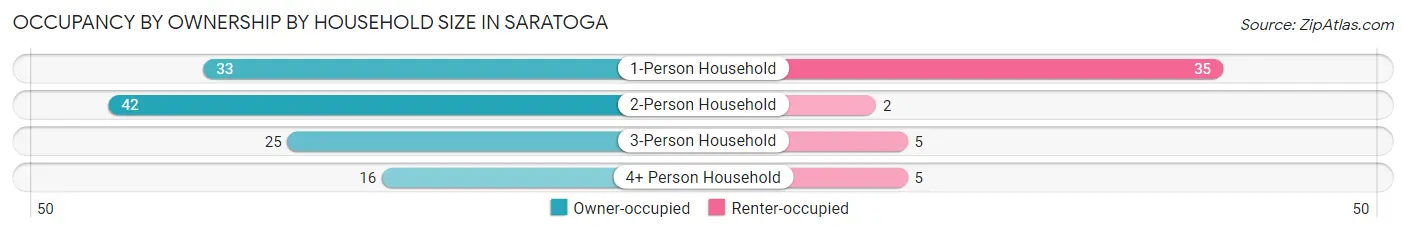
| Household Size | Owner-occupied | Renter-occupied |
| 1-Person Household | 33 (48.5%) | 35 (51.5%) |
| 2-Person Household | 42 (95.5%) | 2 (4.5%) |
| 3-Person Household | 25 (83.3%) | 5 (16.7%) |
| 4+ Person Household | 16 (76.2%) | 5 (23.8%) |
| Total Housing Units | 116 (71.2%) | 47 (28.8%) |
Occupancy by Educational Attainment in Saratoga
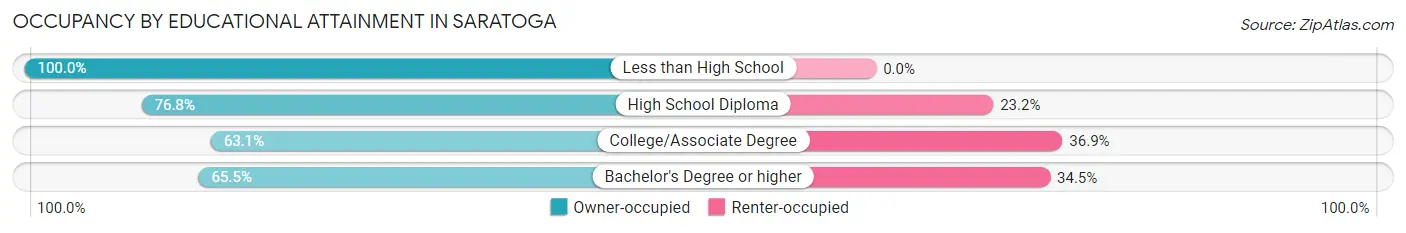
| Household Size | Owner-occupied | Renter-occupied |
| Less than High School | 13 (100.0%) | 0 (0.0%) |
| High School Diploma | 43 (76.8%) | 13 (23.2%) |
| College/Associate Degree | 41 (63.1%) | 24 (36.9%) |
| Bachelor's Degree or higher | 19 (65.5%) | 10 (34.5%) |
Occupancy by Age of Householder in Saratoga
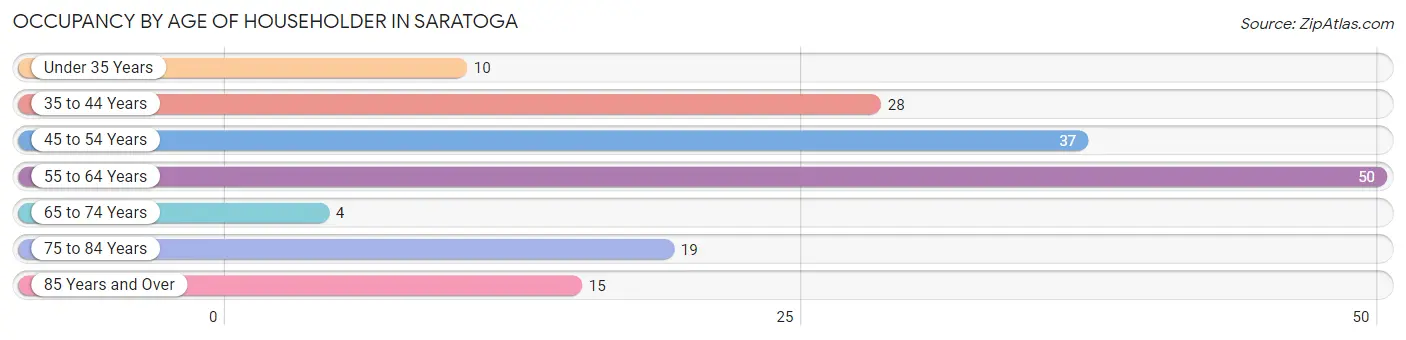
| Age Bracket | # Households | % Households |
| Under 35 Years | 10 | 6.1% |
| 35 to 44 Years | 28 | 17.2% |
| 45 to 54 Years | 37 | 22.7% |
| 55 to 64 Years | 50 | 30.7% |
| 65 to 74 Years | 4 | 2.5% |
| 75 to 84 Years | 19 | 11.7% |
| 85 Years and Over | 15 | 9.2% |
| Total | 163 | 100.0% |
Housing Finances in Saratoga
Median Income by Occupancy in Saratoga
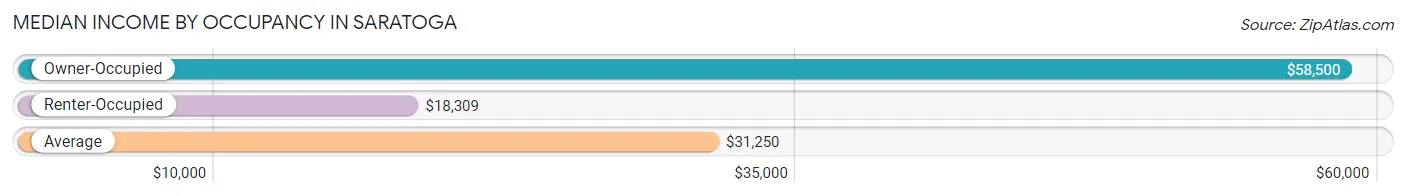
| Occupancy Type | # Households | Median Income |
| Owner-Occupied | 116 (71.2%) | $58,500 |
| Renter-Occupied | 47 (28.8%) | $18,309 |
| Average | 163 (100.0%) | $31,250 |
Occupancy by Householder Income Bracket in Saratoga
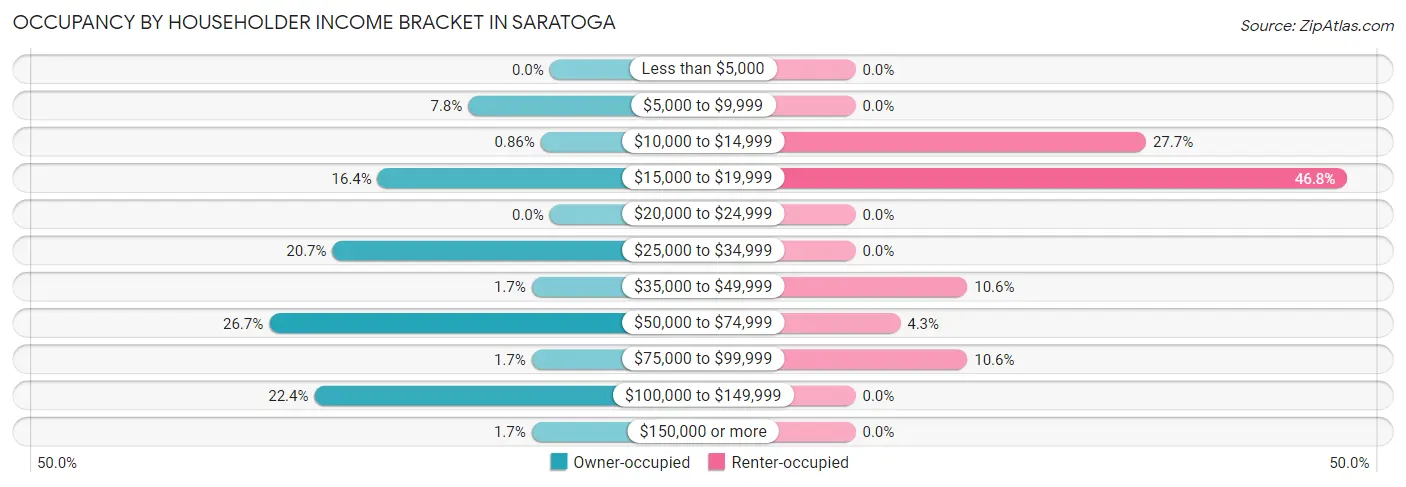
| Income Bracket | Owner-occupied | Renter-occupied |
| Less than $5,000 | 0 (0.0%) | 0 (0.0%) |
| $5,000 to $9,999 | 9 (7.8%) | 0 (0.0%) |
| $10,000 to $14,999 | 1 (0.9%) | 13 (27.7%) |
| $15,000 to $19,999 | 19 (16.4%) | 22 (46.8%) |
| $20,000 to $24,999 | 0 (0.0%) | 0 (0.0%) |
| $25,000 to $34,999 | 24 (20.7%) | 0 (0.0%) |
| $35,000 to $49,999 | 2 (1.7%) | 5 (10.6%) |
| $50,000 to $74,999 | 31 (26.7%) | 2 (4.3%) |
| $75,000 to $99,999 | 2 (1.7%) | 5 (10.6%) |
| $100,000 to $149,999 | 26 (22.4%) | 0 (0.0%) |
| $150,000 or more | 2 (1.7%) | 0 (0.0%) |
| Total | 116 (100.0%) | 47 (100.0%) |
Monthly Housing Cost Tiers in Saratoga
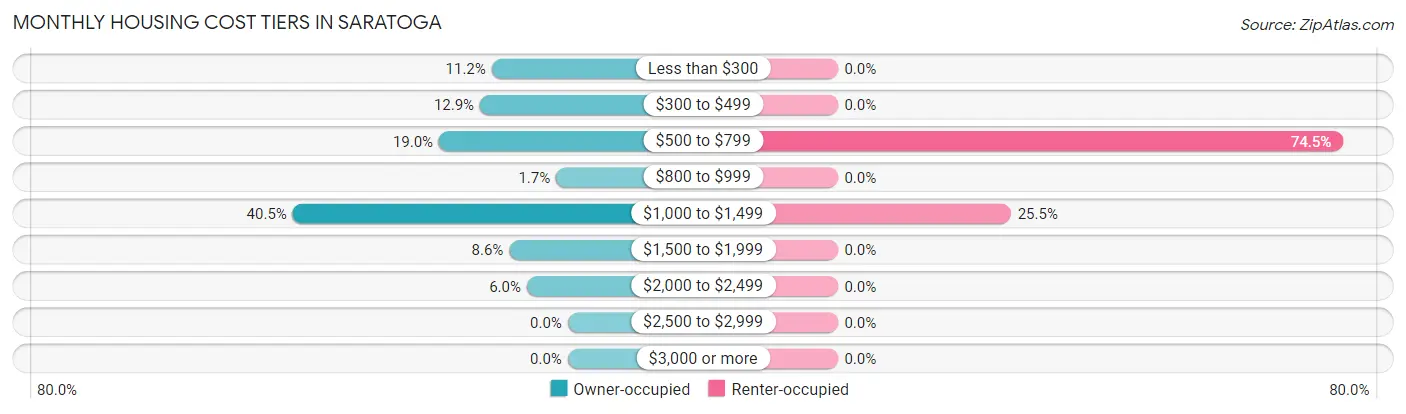
| Monthly Cost | Owner-occupied | Renter-occupied |
| Less than $300 | 13 (11.2%) | 0 (0.0%) |
| $300 to $499 | 15 (12.9%) | 0 (0.0%) |
| $500 to $799 | 22 (19.0%) | 35 (74.5%) |
| $800 to $999 | 2 (1.7%) | 0 (0.0%) |
| $1,000 to $1,499 | 47 (40.5%) | 12 (25.5%) |
| $1,500 to $1,999 | 10 (8.6%) | 0 (0.0%) |
| $2,000 to $2,499 | 7 (6.0%) | 0 (0.0%) |
| $2,500 to $2,999 | 0 (0.0%) | 0 (0.0%) |
| $3,000 or more | 0 (0.0%) | 0 (0.0%) |
| Total | 116 (100.0%) | 47 (100.0%) |
Physical Housing Characteristics in Saratoga
Housing Structures in Saratoga
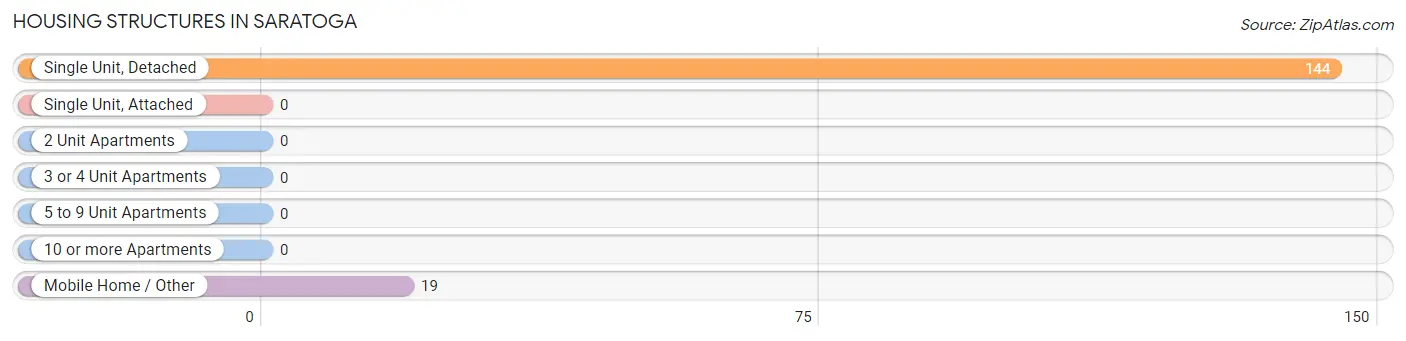
| Structure Type | # Housing Units | % Housing Units |
| Single Unit, Detached | 144 | 88.3% |
| Single Unit, Attached | 0 | 0.0% |
| 2 Unit Apartments | 0 | 0.0% |
| 3 or 4 Unit Apartments | 0 | 0.0% |
| 5 to 9 Unit Apartments | 0 | 0.0% |
| 10 or more Apartments | 0 | 0.0% |
| Mobile Home / Other | 19 | 11.7% |
| Total | 163 | 100.0% |
Housing Structures by Occupancy in Saratoga
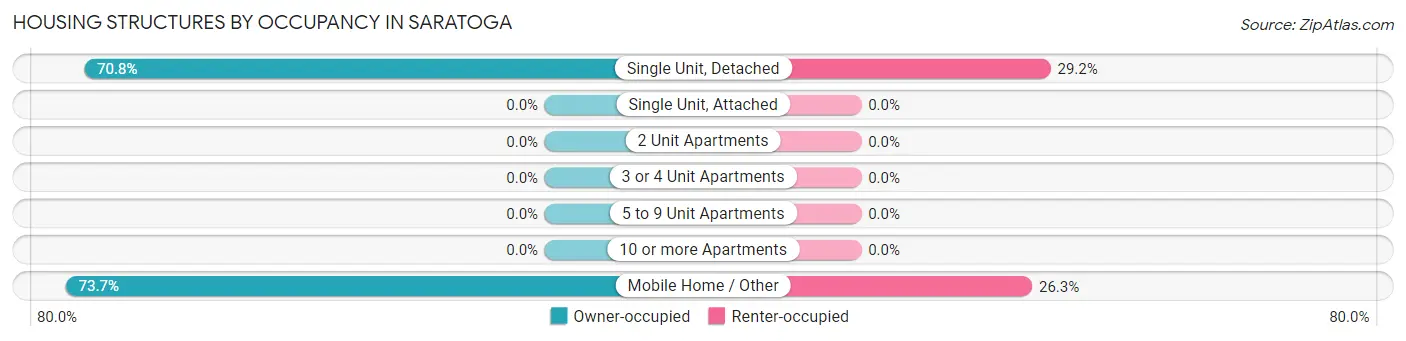
| Structure Type | Owner-occupied | Renter-occupied |
| Single Unit, Detached | 102 (70.8%) | 42 (29.2%) |
| Single Unit, Attached | 0 (0.0%) | 0 (0.0%) |
| 2 Unit Apartments | 0 (0.0%) | 0 (0.0%) |
| 3 or 4 Unit Apartments | 0 (0.0%) | 0 (0.0%) |
| 5 to 9 Unit Apartments | 0 (0.0%) | 0 (0.0%) |
| 10 or more Apartments | 0 (0.0%) | 0 (0.0%) |
| Mobile Home / Other | 14 (73.7%) | 5 (26.3%) |
| Total | 116 (71.2%) | 47 (28.8%) |
Housing Structures by Number of Rooms in Saratoga
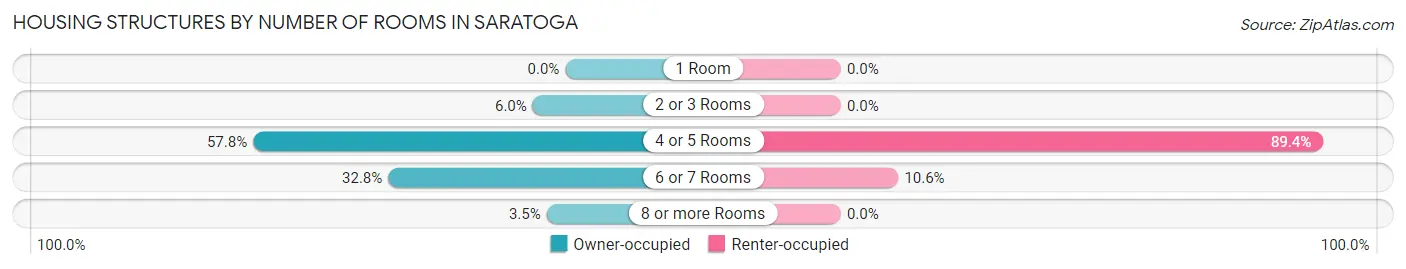
| Number of Rooms | Owner-occupied | Renter-occupied |
| 1 Room | 0 (0.0%) | 0 (0.0%) |
| 2 or 3 Rooms | 7 (6.0%) | 0 (0.0%) |
| 4 or 5 Rooms | 67 (57.8%) | 42 (89.4%) |
| 6 or 7 Rooms | 38 (32.8%) | 5 (10.6%) |
| 8 or more Rooms | 4 (3.5%) | 0 (0.0%) |
| Total | 116 (100.0%) | 47 (100.0%) |
Housing Structure by Heating Type in Saratoga
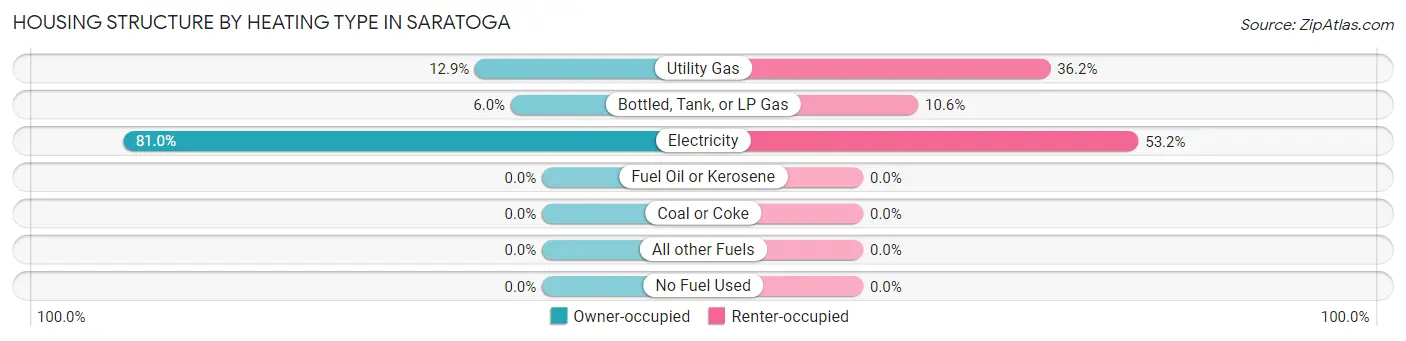
| Heating Type | Owner-occupied | Renter-occupied |
| Utility Gas | 15 (12.9%) | 17 (36.2%) |
| Bottled, Tank, or LP Gas | 7 (6.0%) | 5 (10.6%) |
| Electricity | 94 (81.0%) | 25 (53.2%) |
| Fuel Oil or Kerosene | 0 (0.0%) | 0 (0.0%) |
| Coal or Coke | 0 (0.0%) | 0 (0.0%) |
| All other Fuels | 0 (0.0%) | 0 (0.0%) |
| No Fuel Used | 0 (0.0%) | 0 (0.0%) |
| Total | 116 (100.0%) | 47 (100.0%) |
Household Vehicle Usage in Saratoga
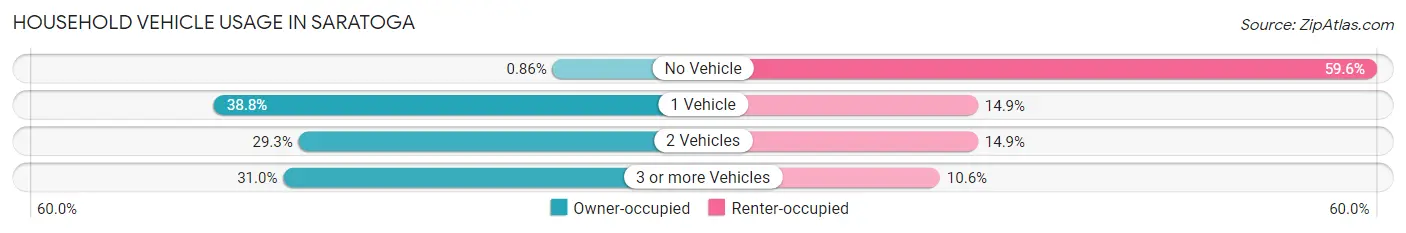
| Vehicles per Household | Owner-occupied | Renter-occupied |
| No Vehicle | 1 (0.9%) | 28 (59.6%) |
| 1 Vehicle | 45 (38.8%) | 7 (14.9%) |
| 2 Vehicles | 34 (29.3%) | 7 (14.9%) |
| 3 or more Vehicles | 36 (31.0%) | 5 (10.6%) |
| Total | 116 (100.0%) | 47 (100.0%) |
Real Estate & Mortgages in Saratoga
Real Estate and Mortgage Overview in Saratoga
| Characteristic | Without Mortgage | With Mortgage |
| Housing Units | 28 | 88 |
| Median Property Value | - | - |
| Median Household Income | - | - |
| Monthly Housing Costs | $307 | $0 |
| Real Estate Taxes | $1,111 | $0 |
Property Value by Mortgage Status in Saratoga
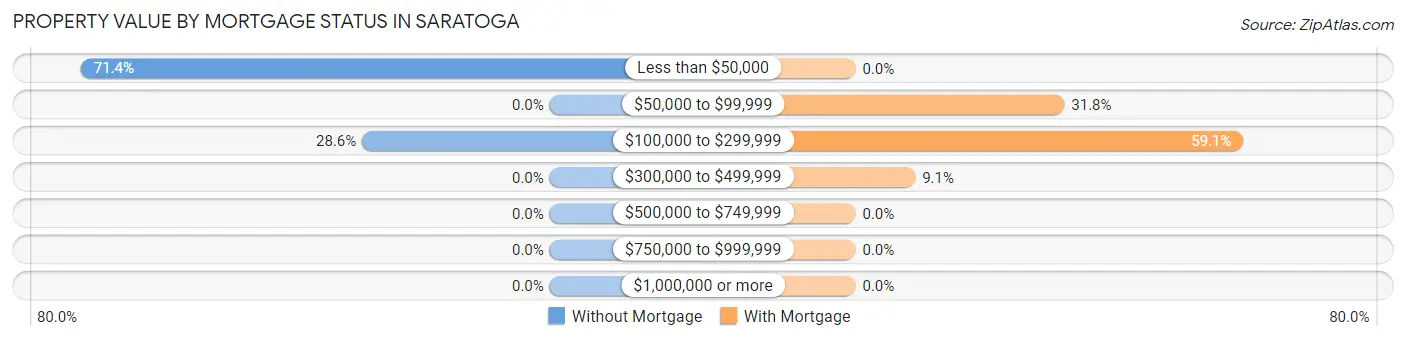
| Property Value | Without Mortgage | With Mortgage |
| Less than $50,000 | 20 (71.4%) | 0 (0.0%) |
| $50,000 to $99,999 | 0 (0.0%) | 28 (31.8%) |
| $100,000 to $299,999 | 8 (28.6%) | 52 (59.1%) |
| $300,000 to $499,999 | 0 (0.0%) | 8 (9.1%) |
| $500,000 to $749,999 | 0 (0.0%) | 0 (0.0%) |
| $750,000 to $999,999 | 0 (0.0%) | 0 (0.0%) |
| $1,000,000 or more | 0 (0.0%) | 0 (0.0%) |
| Total | 28 (100.0%) | 88 (100.0%) |
Household Income by Mortgage Status in Saratoga
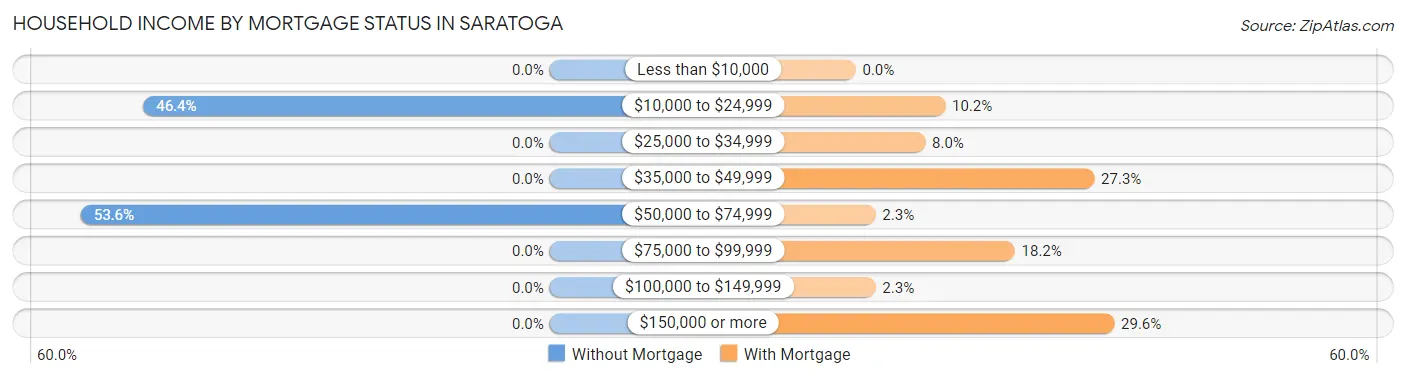
| Household Income | Without Mortgage | With Mortgage |
| Less than $10,000 | 0 (0.0%) | 0 (0.0%) |
| $10,000 to $24,999 | 13 (46.4%) | 9 (10.2%) |
| $25,000 to $34,999 | 0 (0.0%) | 7 (8.0%) |
| $35,000 to $49,999 | 0 (0.0%) | 24 (27.3%) |
| $50,000 to $74,999 | 15 (53.6%) | 2 (2.3%) |
| $75,000 to $99,999 | 0 (0.0%) | 16 (18.2%) |
| $100,000 to $149,999 | 0 (0.0%) | 2 (2.3%) |
| $150,000 or more | 0 (0.0%) | 26 (29.5%) |
| Total | 28 (100.0%) | 88 (100.0%) |
Property Value to Household Income Ratio in Saratoga
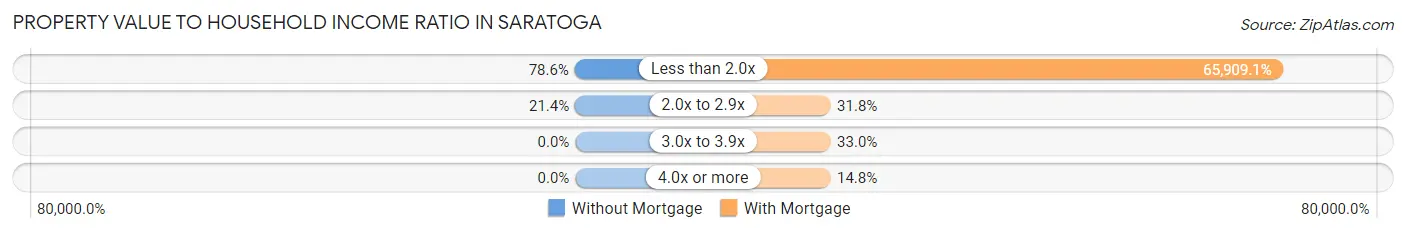
| Value-to-Income Ratio | Without Mortgage | With Mortgage |
| Less than 2.0x | 22 (78.6%) | 58,000 (65,909.1%) |
| 2.0x to 2.9x | 6 (21.4%) | 28 (31.8%) |
| 3.0x to 3.9x | 0 (0.0%) | 29 (33.0%) |
| 4.0x or more | 0 (0.0%) | 13 (14.8%) |
| Total | 28 (100.0%) | 88 (100.0%) |
Real Estate Taxes by Mortgage Status in Saratoga
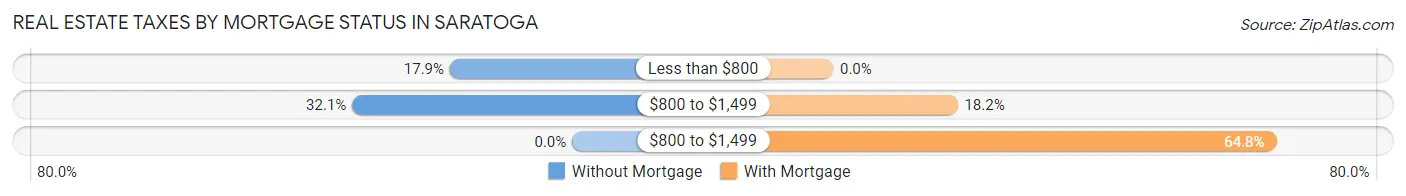
| Property Taxes | Without Mortgage | With Mortgage |
| Less than $800 | 5 (17.9%) | 0 (0.0%) |
| $800 to $1,499 | 9 (32.1%) | 16 (18.2%) |
| $800 to $1,499 | 0 (0.0%) | 57 (64.8%) |
| Total | 28 (100.0%) | 88 (100.0%) |
Health & Disability in Saratoga
Health Insurance Coverage by Age in Saratoga
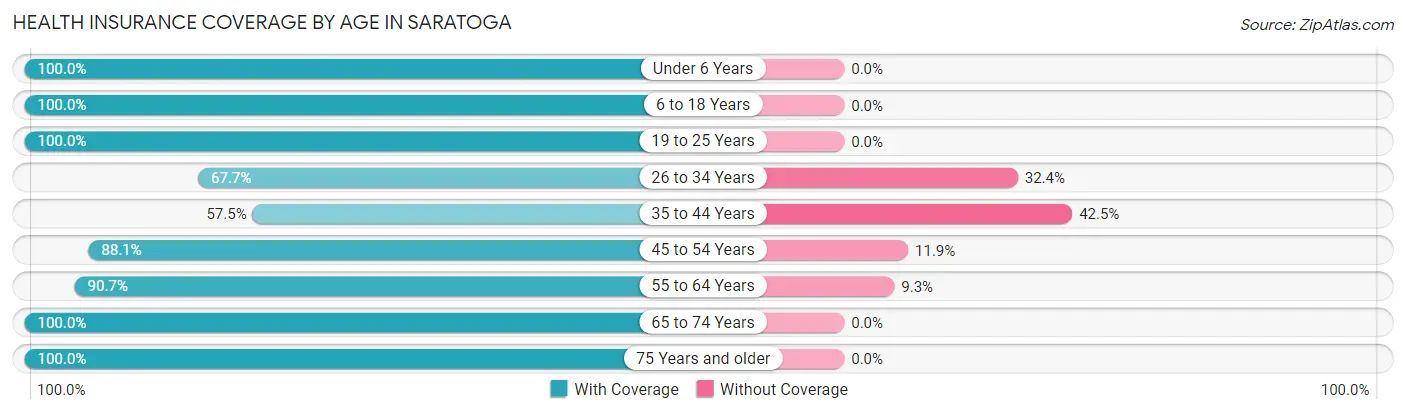
| Age Bracket | With Coverage | Without Coverage |
| Under 6 Years | 18 (100.0%) | 0 (0.0%) |
| 6 to 18 Years | 39 (100.0%) | 0 (0.0%) |
| 19 to 25 Years | 47 (100.0%) | 0 (0.0%) |
| 26 to 34 Years | 23 (67.6%) | 11 (32.4%) |
| 35 to 44 Years | 23 (57.5%) | 17 (42.5%) |
| 45 to 54 Years | 37 (88.1%) | 5 (11.9%) |
| 55 to 64 Years | 68 (90.7%) | 7 (9.3%) |
| 65 to 74 Years | 9 (100.0%) | 0 (0.0%) |
| 75 Years and older | 41 (100.0%) | 0 (0.0%) |
| Total | 305 (88.4%) | 40 (11.6%) |
Health Insurance Coverage by Citizenship Status in Saratoga
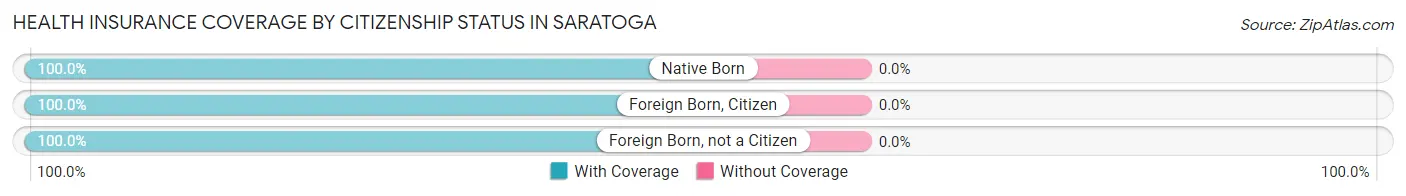
| Citizenship Status | With Coverage | Without Coverage |
| Native Born | 18 (100.0%) | 0 (0.0%) |
| Foreign Born, Citizen | 39 (100.0%) | 0 (0.0%) |
| Foreign Born, not a Citizen | 47 (100.0%) | 0 (0.0%) |
Health Insurance Coverage by Household Income in Saratoga
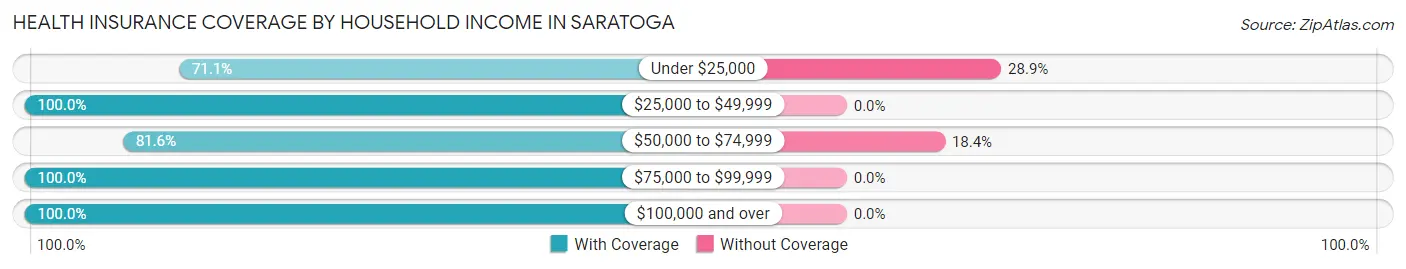
| Household Income | With Coverage | Without Coverage |
| Under $25,000 | 59 (71.1%) | 24 (28.9%) |
| $25,000 to $49,999 | 93 (100.0%) | 0 (0.0%) |
| $50,000 to $74,999 | 71 (81.6%) | 16 (18.4%) |
| $75,000 to $99,999 | 16 (100.0%) | 0 (0.0%) |
| $100,000 and over | 66 (100.0%) | 0 (0.0%) |
Public vs Private Health Insurance Coverage by Age in Saratoga
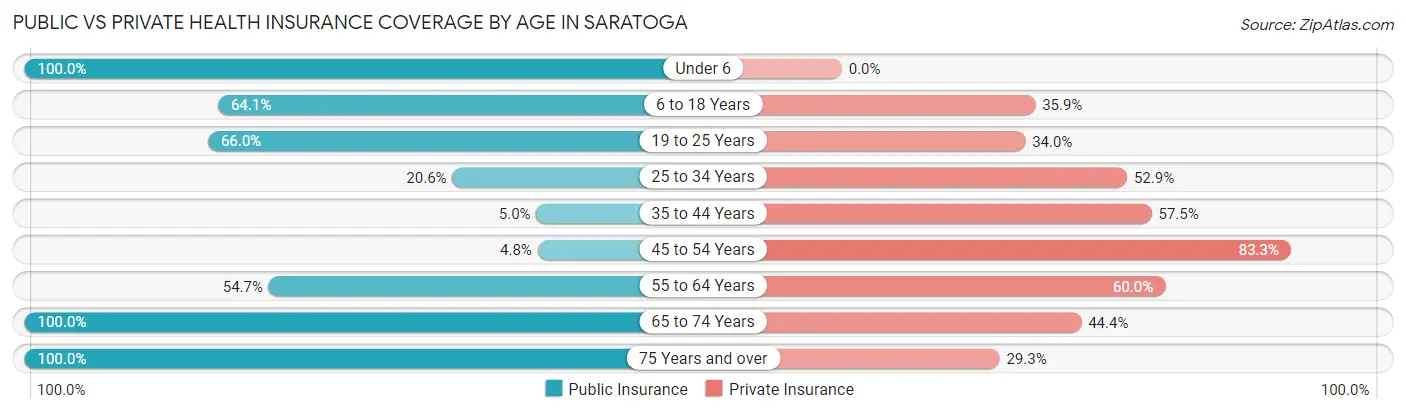
| Age Bracket | Public Insurance | Private Insurance |
| Under 6 | 18 (100.0%) | 0 (0.0%) |
| 6 to 18 Years | 25 (64.1%) | 14 (35.9%) |
| 19 to 25 Years | 31 (66.0%) | 16 (34.0%) |
| 25 to 34 Years | 7 (20.6%) | 18 (52.9%) |
| 35 to 44 Years | 2 (5.0%) | 23 (57.5%) |
| 45 to 54 Years | 2 (4.8%) | 35 (83.3%) |
| 55 to 64 Years | 41 (54.7%) | 45 (60.0%) |
| 65 to 74 Years | 9 (100.0%) | 4 (44.4%) |
| 75 Years and over | 41 (100.0%) | 12 (29.3%) |
| Total | 176 (51.0%) | 167 (48.4%) |
Disability Status by Sex by Age in Saratoga
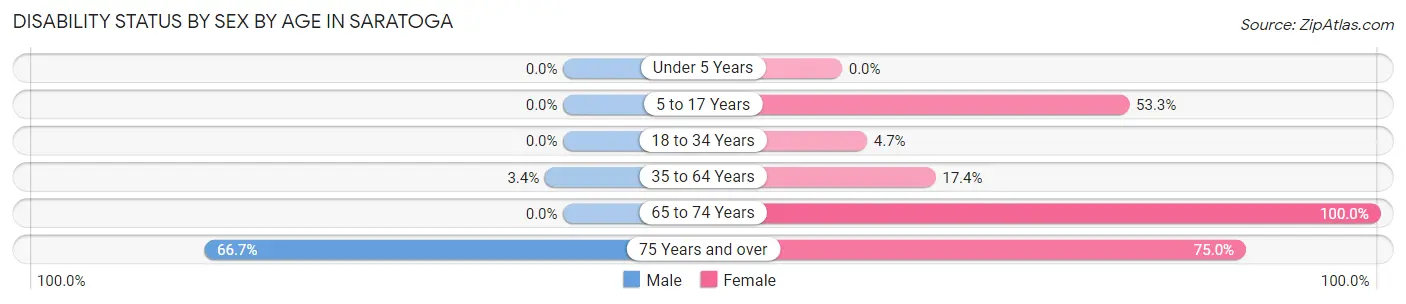
| Age Bracket | Male | Female |
| Under 5 Years | 0 (0.0%) | 0 (0.0%) |
| 5 to 17 Years | 0 (0.0%) | 8 (53.3%) |
| 18 to 34 Years | 0 (0.0%) | 2 (4.6%) |
| 35 to 64 Years | 2 (3.4%) | 17 (17.3%) |
| 65 to 74 Years | 0 (0.0%) | 9 (100.0%) |
| 75 Years and over | 14 (66.7%) | 15 (75.0%) |
Disability Class by Sex by Age in Saratoga
Disability Class: Hearing Difficulty
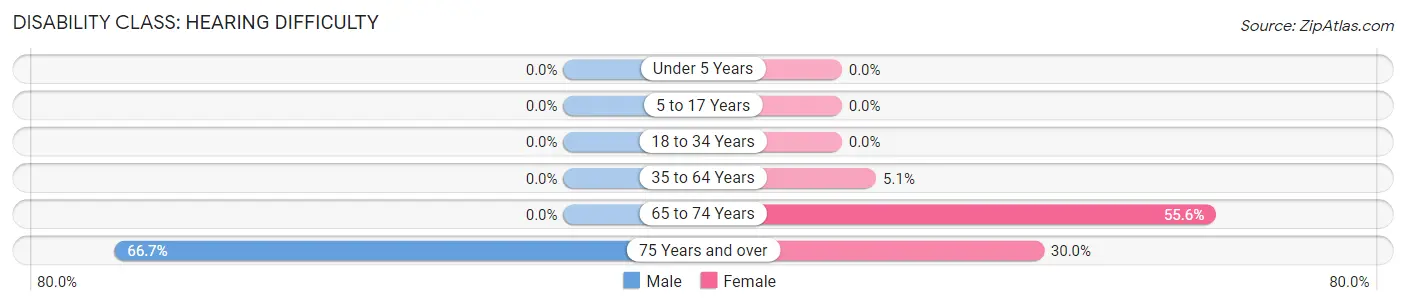
| Age Bracket | Male | Female |
| Under 5 Years | 0 (0.0%) | 0 (0.0%) |
| 5 to 17 Years | 0 (0.0%) | 0 (0.0%) |
| 18 to 34 Years | 0 (0.0%) | 0 (0.0%) |
| 35 to 64 Years | 0 (0.0%) | 5 (5.1%) |
| 65 to 74 Years | 0 (0.0%) | 5 (55.6%) |
| 75 Years and over | 14 (66.7%) | 6 (30.0%) |
Disability Class: Vision Difficulty
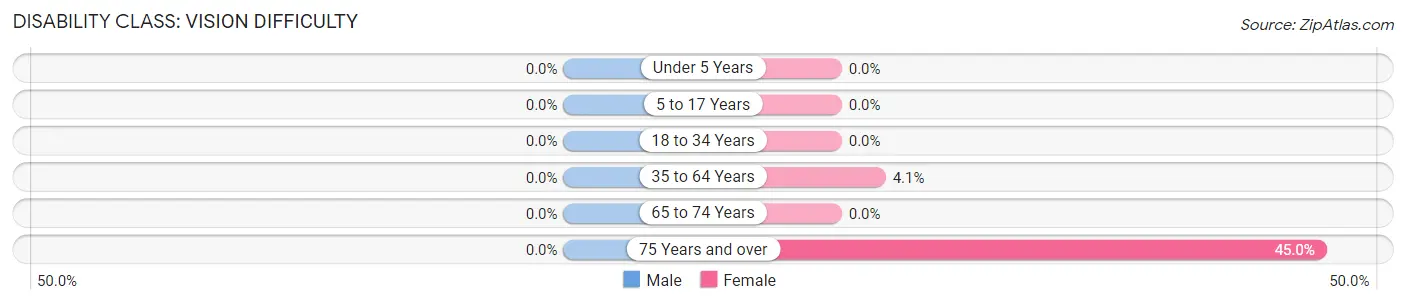
| Age Bracket | Male | Female |
| Under 5 Years | 0 (0.0%) | 0 (0.0%) |
| 5 to 17 Years | 0 (0.0%) | 0 (0.0%) |
| 18 to 34 Years | 0 (0.0%) | 0 (0.0%) |
| 35 to 64 Years | 0 (0.0%) | 4 (4.1%) |
| 65 to 74 Years | 0 (0.0%) | 0 (0.0%) |
| 75 Years and over | 0 (0.0%) | 9 (45.0%) |
Disability Class: Cognitive Difficulty
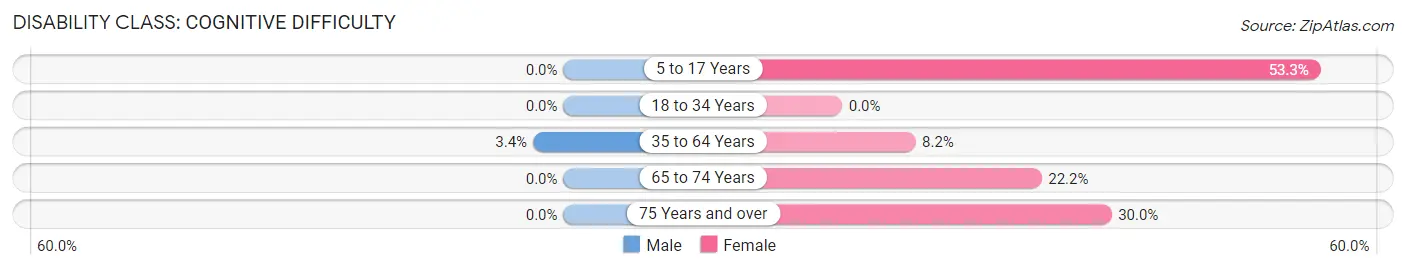
| Age Bracket | Male | Female |
| 5 to 17 Years | 0 (0.0%) | 8 (53.3%) |
| 18 to 34 Years | 0 (0.0%) | 0 (0.0%) |
| 35 to 64 Years | 2 (3.4%) | 8 (8.2%) |
| 65 to 74 Years | 0 (0.0%) | 2 (22.2%) |
| 75 Years and over | 0 (0.0%) | 6 (30.0%) |
Disability Class: Ambulatory Difficulty
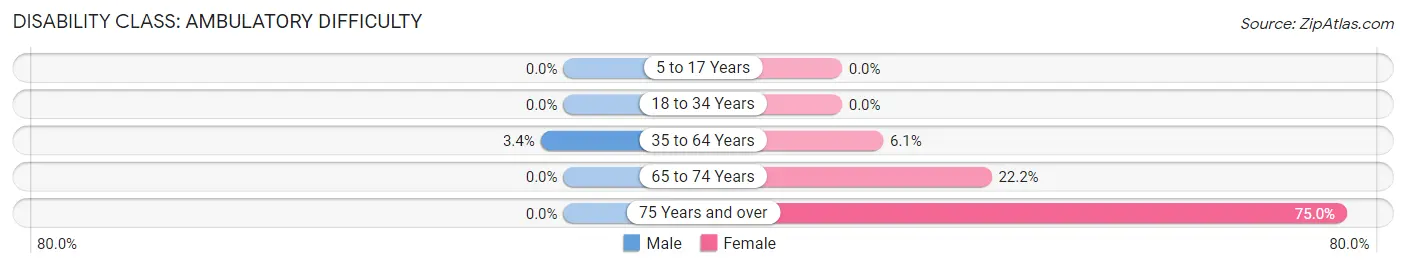
| Age Bracket | Male | Female |
| 5 to 17 Years | 0 (0.0%) | 0 (0.0%) |
| 18 to 34 Years | 0 (0.0%) | 0 (0.0%) |
| 35 to 64 Years | 2 (3.4%) | 6 (6.1%) |
| 65 to 74 Years | 0 (0.0%) | 2 (22.2%) |
| 75 Years and over | 0 (0.0%) | 15 (75.0%) |
Disability Class: Self-Care Difficulty
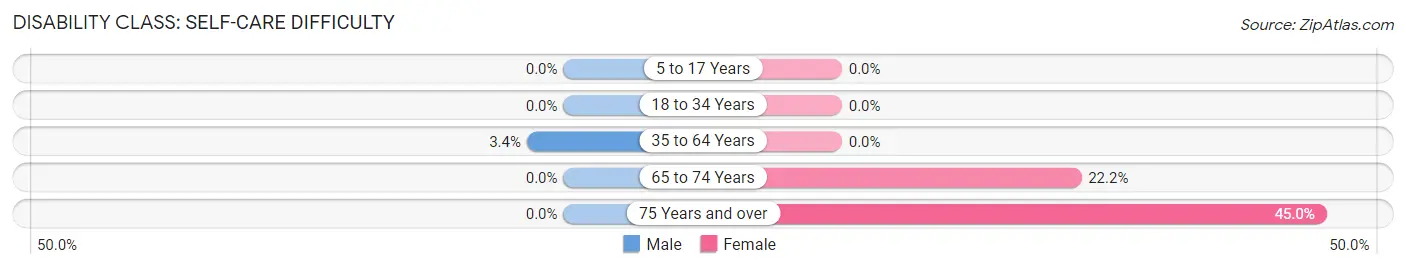
| Age Bracket | Male | Female |
| 5 to 17 Years | 0 (0.0%) | 0 (0.0%) |
| 18 to 34 Years | 0 (0.0%) | 0 (0.0%) |
| 35 to 64 Years | 2 (3.4%) | 0 (0.0%) |
| 65 to 74 Years | 0 (0.0%) | 2 (22.2%) |
| 75 Years and over | 0 (0.0%) | 9 (45.0%) |
Technology Access in Saratoga
Computing Device Access in Saratoga
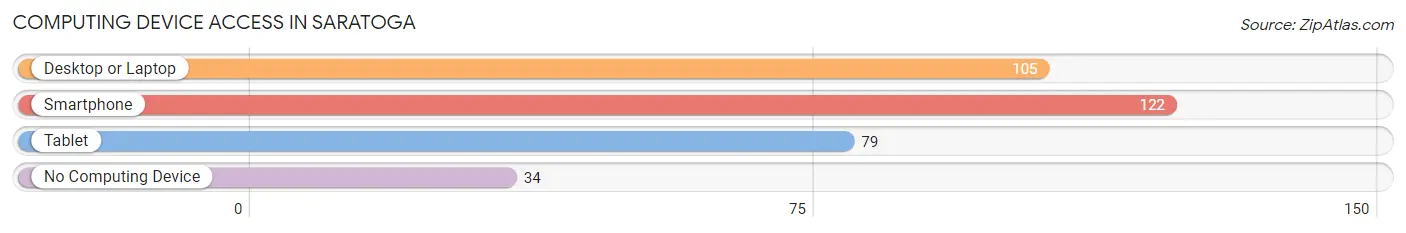
| Device Type | # Households | % Households |
| Desktop or Laptop | 105 | 64.4% |
| Smartphone | 122 | 74.9% |
| Tablet | 79 | 48.5% |
| No Computing Device | 34 | 20.9% |
| Total | 163 | 100.0% |
Internet Access in Saratoga
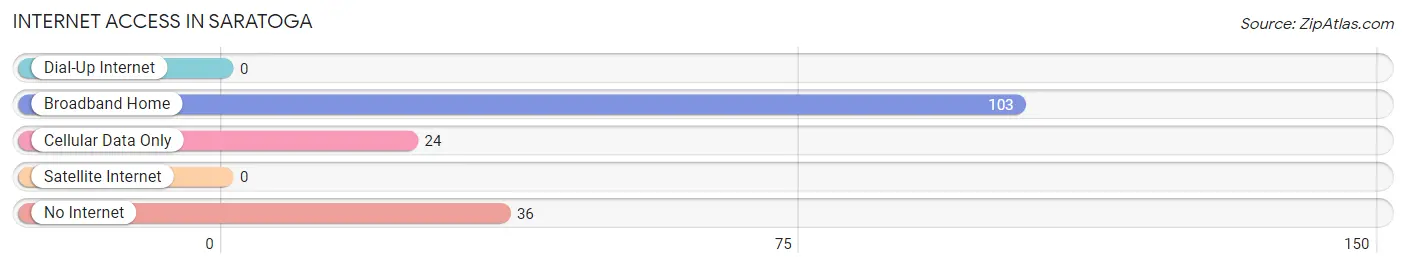
| Internet Type | # Households | % Households |
| Dial-Up Internet | 0 | 0.0% |
| Broadband Home | 103 | 63.2% |
| Cellular Data Only | 24 | 14.7% |
| Satellite Internet | 0 | 0.0% |
| No Internet | 36 | 22.1% |
| Total | 163 | 100.0% |
Saratoga Summary
Saratoga is a small unincorporated community located in Moore County, North Carolina. It is situated in the Sandhills region of the state, approximately 20 miles south of Pinehurst and 15 miles north of Carthage. The community is home to a population of approximately 1,000 people and is known for its rural charm and small-town atmosphere.
History
Saratoga was first settled in the early 1800s by a group of settlers from Scotland. The community was named after the Battle of Saratoga, which was fought during the American Revolutionary War. The settlers were attracted to the area due to its fertile soil and abundant natural resources.
The first post office in Saratoga was established in 1845 and the community was officially incorporated in 1887. During the late 19th century, the town was a thriving agricultural center, with cotton, corn, and tobacco being the primary crops.
In the early 20th century, the town began to experience a decline in population as many of the younger residents moved away in search of better economic opportunities. This trend continued until the 1950s when the town began to experience a resurgence in population growth.
Geography
Saratoga is located in the Sandhills region of North Carolina, approximately 20 miles south of Pinehurst and 15 miles north of Carthage. The town is situated on the banks of the Little River, which flows through the center of town. The town is surrounded by rolling hills and lush forests, making it a popular destination for outdoor recreation.
The climate in Saratoga is mild and humid, with temperatures ranging from the mid-50s in the winter to the mid-80s in the summer. The town receives an average of 48 inches of rain per year, with the majority of precipitation occurring in the spring and summer months.
Economy
The economy of Saratoga is largely based on agriculture and tourism. The town is home to several farms that produce a variety of crops, including cotton, corn, and tobacco. The town is also home to several small businesses, including restaurants, retail stores, and service providers.
Tourism is a major contributor to the local economy, with many visitors coming to the area to enjoy the town’s rural charm and outdoor recreation opportunities. The town is home to several popular attractions, including the Saratoga Museum and the Little River Nature Preserve.
Demographics
As of the 2010 census, the population of Saratoga was 1,000. The racial makeup of the town was 95.2% White, 2.2% African American, 0.7% Native American, 0.3% Asian, and 1.6% from other races. The median household income was $37,500 and the median age was 44.
Saratoga is a small, rural community with a strong sense of community and a commitment to preserving its rural charm. The town is home to a diverse population of people from all walks of life, making it a great place to live and work.
Common Questions
What is Per Capita Income in Saratoga?
Per Capita income in Saratoga is $24,825.
What is the Median Family Income in Saratoga?
Median Family Income in Saratoga is $64,063.
What is the Median Household income in Saratoga?
Median Household Income in Saratoga is $31,250.
What is Inequality or Gini Index in Saratoga?
Inequality or Gini Index in Saratoga is 0.45.
What is the Total Population of Saratoga?
Total Population of Saratoga is 345.
What is the Total Male Population of Saratoga?
Total Male Population of Saratoga is 160.
What is the Total Female Population of Saratoga?
Total Female Population of Saratoga is 185.
What is the Ratio of Males per 100 Females in Saratoga?
There are 86.49 Males per 100 Females in Saratoga.
What is the Ratio of Females per 100 Males in Saratoga?
There are 115.62 Females per 100 Males in Saratoga.
What is the Median Population Age in Saratoga?
Median Population Age in Saratoga is 44.7 Years.
What is the Average Family Size in Saratoga
Average Family Size in Saratoga is 2.9 People.
What is the Average Household Size in Saratoga
Average Household Size in Saratoga is 2.1 People.
How Large is the Labor Force in Saratoga?
There are 196 People in the Labor Forcein in Saratoga.
What is the Percentage of People in the Labor Force in Saratoga?
64.5% of People are in the Labor Force in Saratoga.
What is the Unemployment Rate in Saratoga?
Unemployment Rate in Saratoga is 10.7%.