Maiden, NC Map & Demographics
Maiden Map
Maiden Overview
$28,735
PER CAPITA INCOME
$75,226
AVG FAMILY INCOME
$62,765
AVG HOUSEHOLD INCOME
10.5%
WAGE / INCOME GAP [ % ]
89.5¢/ $1
WAGE / INCOME GAP [ $ ]
0.42
INEQUALITY / GINI INDEX
3,727
TOTAL POPULATION
1,902
MALE POPULATION
1,825
FEMALE POPULATION
104.22
MALES / 100 FEMALES
95.95
FEMALES / 100 MALES
45.1
MEDIAN AGE
2.9
AVG FAMILY SIZE
2.4
AVG HOUSEHOLD SIZE
2,008
LABOR FORCE [ PEOPLE ]
61.8%
PERCENT IN LABOR FORCE
4.2%
UNEMPLOYMENT RATE
Maiden Zip Codes
Maiden Area Codes
Income in Maiden
Income Overview in Maiden
Per Capita Income in Maiden is $28,735, while median incomes of families and households are $75,226 and $62,765 respectively.
| Characteristic | Number | Measure |
| Per Capita Income | 3,727 | $28,735 |
| Median Family Income | 1,019 | $75,226 |
| Mean Family Income | 1,019 | $85,775 |
| Median Household Income | 1,401 | $62,765 |
| Mean Household Income | 1,401 | $72,015 |
| Income Deficit | 1,019 | $0 |
| Wage / Income Gap (%) | 3,727 | 10.48% |
| Wage / Income Gap ($) | 3,727 | 89.52¢ per $1 |
| Gini / Inequality Index | 3,727 | 0.42 |
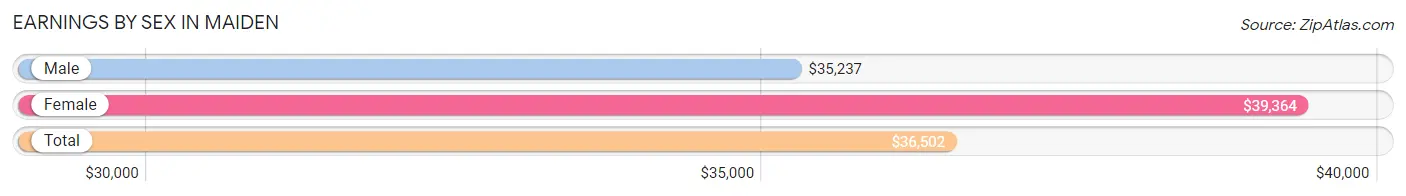
Earnings by Sex in Maiden
Average Earnings in Maiden are $36,502, $35,237 for men and $39,364 for women, a difference of 10.5%.
| Sex | Number | Average Earnings |
| Male | 1,296 (59.6%) | $35,237 |
| Female | 879 (40.4%) | $39,364 |
| Total | 2,175 (100.0%) | $36,502 |
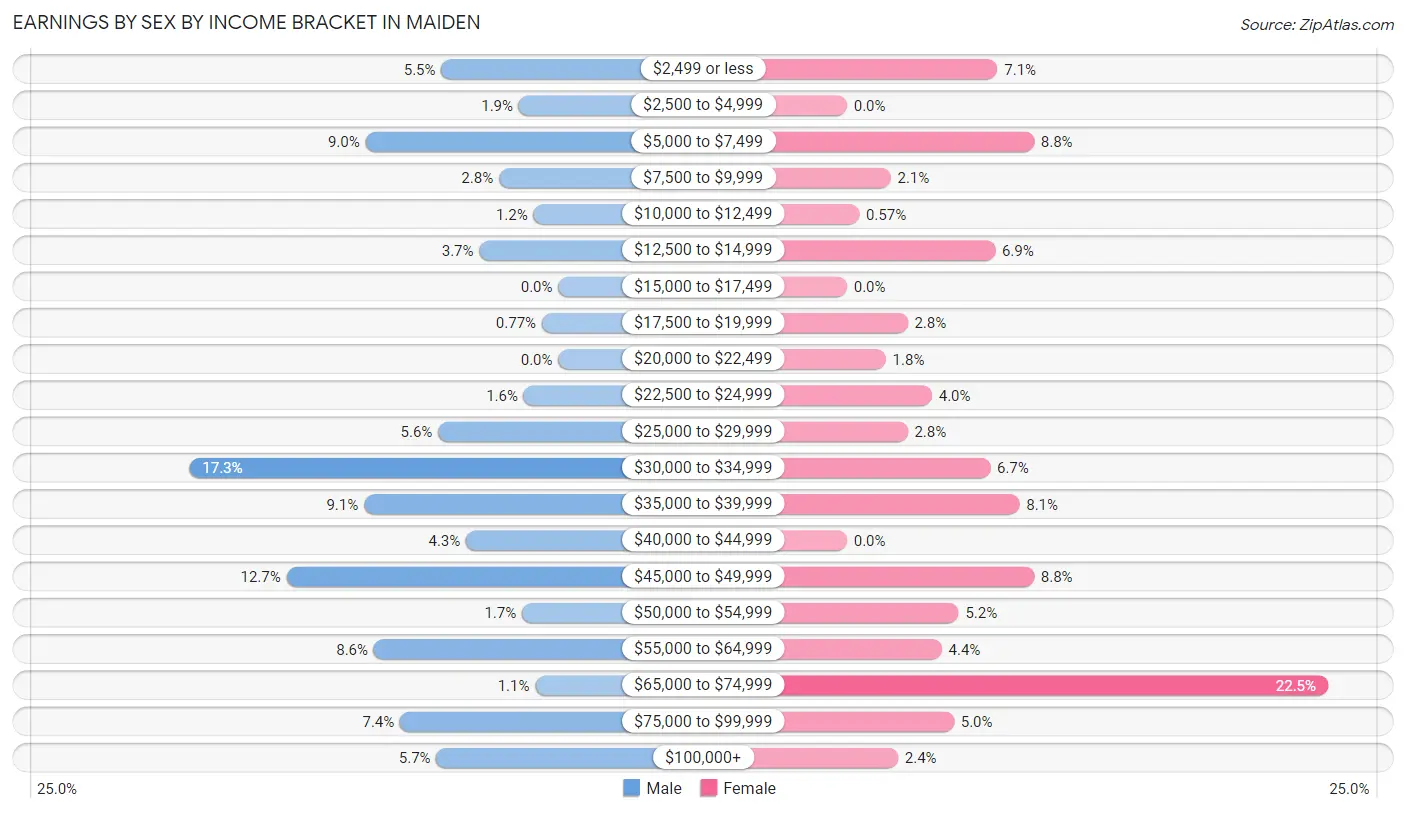
Earnings by Sex by Income Bracket in Maiden
The most common earnings brackets in Maiden are $30,000 to $34,999 for men (224 | 17.3%) and $65,000 to $74,999 for women (198 | 22.5%).
| Income | Male | Female |
| $2,499 or less | 71 (5.5%) | 62 (7.0%) |
| $2,500 to $4,999 | 24 (1.8%) | 0 (0.0%) |
| $5,000 to $7,499 | 117 (9.0%) | 77 (8.8%) |
| $7,500 to $9,999 | 36 (2.8%) | 18 (2.1%) |
| $10,000 to $12,499 | 15 (1.2%) | 5 (0.6%) |
| $12,500 to $14,999 | 48 (3.7%) | 61 (6.9%) |
| $15,000 to $17,499 | 0 (0.0%) | 0 (0.0%) |
| $17,500 to $19,999 | 10 (0.8%) | 25 (2.8%) |
| $20,000 to $22,499 | 0 (0.0%) | 16 (1.8%) |
| $22,500 to $24,999 | 21 (1.6%) | 35 (4.0%) |
| $25,000 to $29,999 | 73 (5.6%) | 25 (2.8%) |
| $30,000 to $34,999 | 224 (17.3%) | 59 (6.7%) |
| $35,000 to $39,999 | 118 (9.1%) | 71 (8.1%) |
| $40,000 to $44,999 | 56 (4.3%) | 0 (0.0%) |
| $45,000 to $49,999 | 165 (12.7%) | 77 (8.8%) |
| $50,000 to $54,999 | 22 (1.7%) | 46 (5.2%) |
| $55,000 to $64,999 | 112 (8.6%) | 39 (4.4%) |
| $65,000 to $74,999 | 14 (1.1%) | 198 (22.5%) |
| $75,000 to $99,999 | 96 (7.4%) | 44 (5.0%) |
| $100,000+ | 74 (5.7%) | 21 (2.4%) |
| Total | 1,296 (100.0%) | 879 (100.0%) |
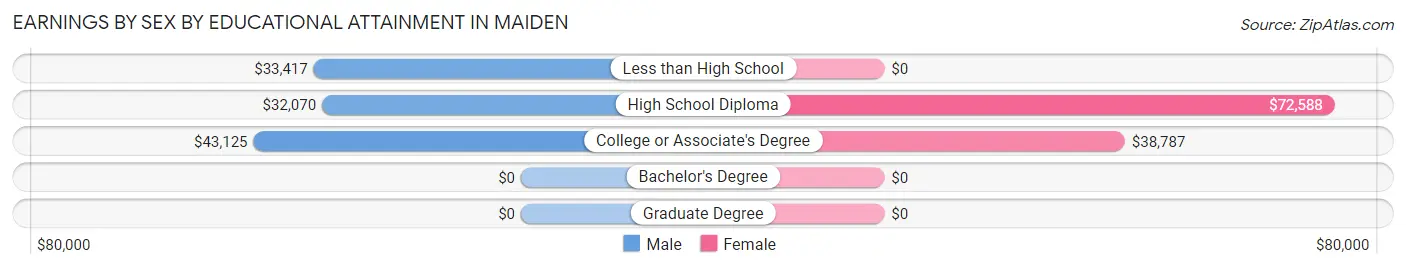
Earnings by Sex by Educational Attainment in Maiden
Average earnings in Maiden are $35,421 for men and $45,828 for women, a difference of 22.7%. Men with an educational attainment of college or associate's degree enjoy the highest average annual earnings of $43,125, while those with high school diploma education earn the least with $32,070. Women with an educational attainment of high school diploma earn the most with the average annual earnings of $72,588, while those with college or associate's degree education have the smallest earnings of $38,787.
| Educational Attainment | Male Income | Female Income |
| Less than High School | $33,417 | $0 |
| High School Diploma | $32,070 | $72,588 |
| College or Associate's Degree | $43,125 | $38,787 |
| Bachelor's Degree | - | - |
| Graduate Degree | - | - |
| Total | $35,421 | $45,828 |
Family Income in Maiden
Family Income Brackets in Maiden
According to the Maiden family income data, there are 237 families falling into the $100,000 to $149,999 income range, which is the most common income bracket and makes up 23.3% of all families.
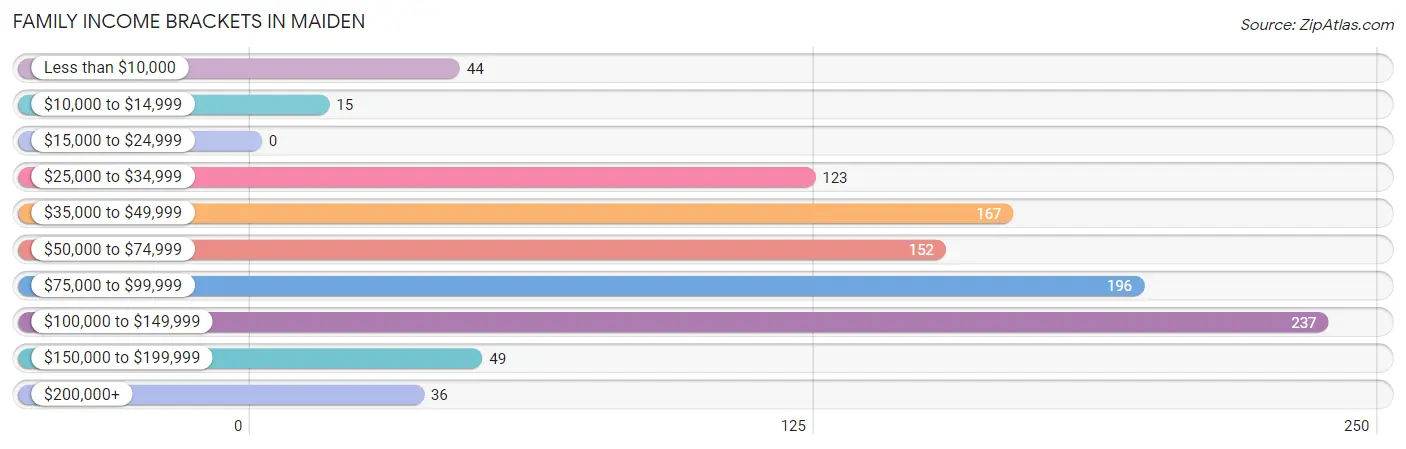
| Income Bracket | # Families | % Families |
| Less than $10,000 | 44 | 4.3% |
| $10,000 to $14,999 | 15 | 1.5% |
| $15,000 to $24,999 | 0 | 0.0% |
| $25,000 to $34,999 | 123 | 12.1% |
| $35,000 to $49,999 | 167 | 16.4% |
| $50,000 to $74,999 | 152 | 14.9% |
| $75,000 to $99,999 | 196 | 19.2% |
| $100,000 to $149,999 | 237 | 23.3% |
| $150,000 to $199,999 | 49 | 4.8% |
| $200,000+ | 36 | 3.5% |
Family Income by Famaliy Size in Maiden
4-person families (199 | 19.5%) account for the highest median family income in Maiden with $92,596 per family, while 2-person families (446 | 43.8%) have the highest median income of $36,767 per family member.
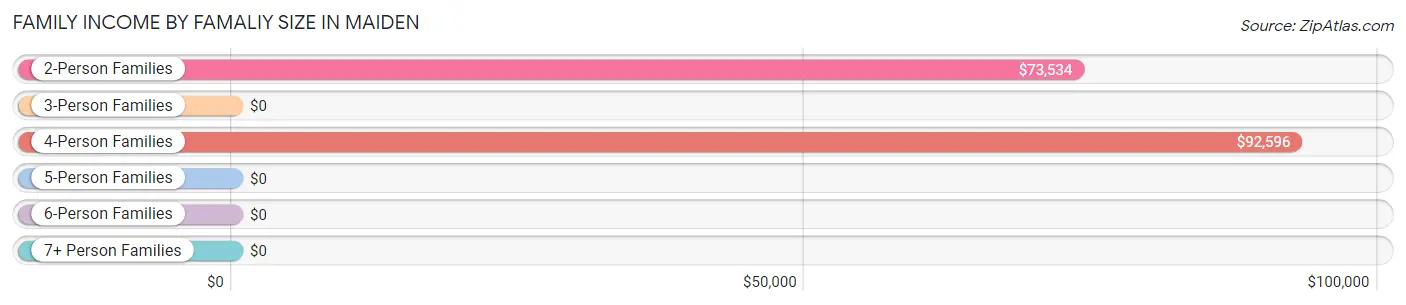
| Income Bracket | # Families | Median Income |
| 2-Person Families | 446 (43.8%) | $73,534 |
| 3-Person Families | 327 (32.1%) | $0 |
| 4-Person Families | 199 (19.5%) | $92,596 |
| 5-Person Families | 47 (4.6%) | $0 |
| 6-Person Families | 0 (0.0%) | $0 |
| 7+ Person Families | 0 (0.0%) | $0 |
| Total | 1,019 (100.0%) | $75,226 |
Family Income by Number of Earners in Maiden
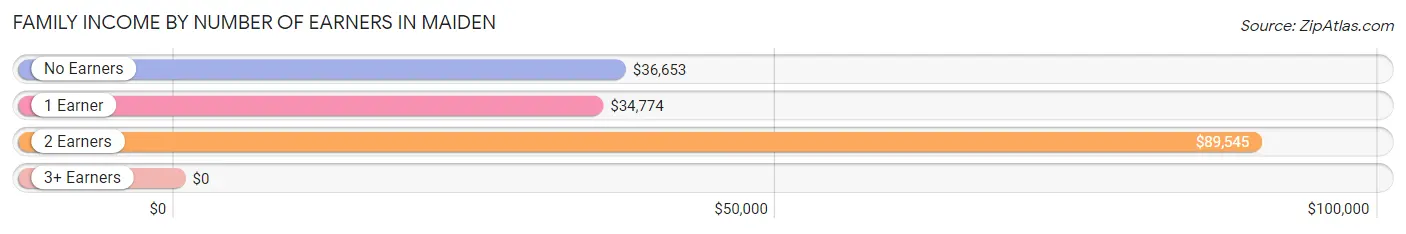
| Number of Earners | # Families | Median Income |
| No Earners | 113 (11.1%) | $36,653 |
| 1 Earner | 237 (23.3%) | $34,774 |
| 2 Earners | 542 (53.2%) | $89,545 |
| 3+ Earners | 127 (12.5%) | $0 |
| Total | 1,019 (100.0%) | $75,226 |
Household Income in Maiden
Household Income Brackets in Maiden
With 270 households falling in the category, the $100,000 to $149,999 income range is the most frequent in Maiden, accounting for 19.3% of all households. In contrast, only 28 households (2.0%) fall into the $10,000 to $14,999 income bracket, making it the least populous group.
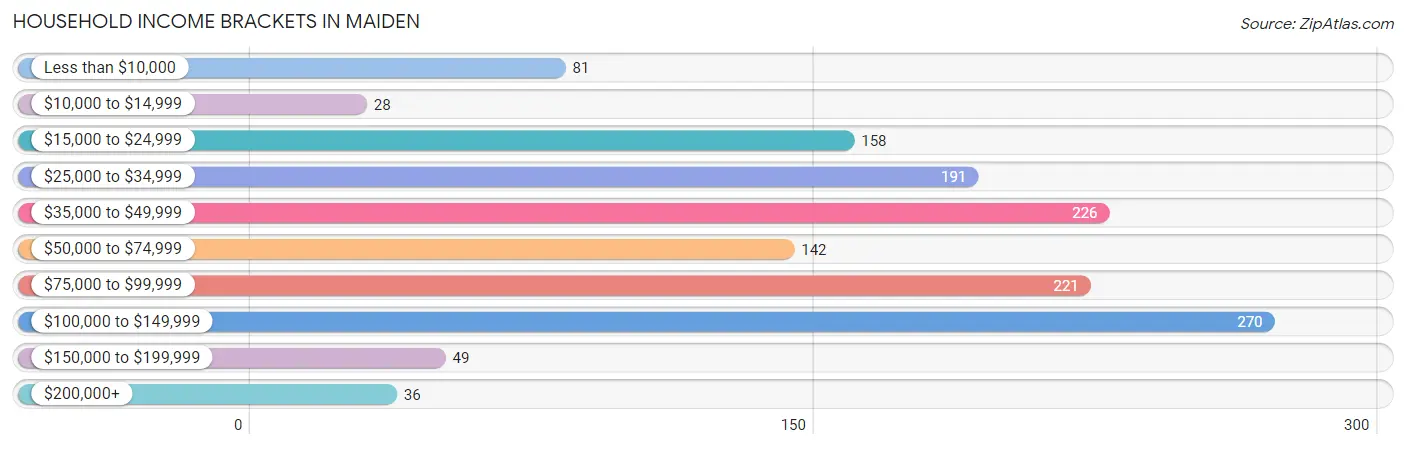
| Income Bracket | # Households | % Households |
| Less than $10,000 | 81 | 5.8% |
| $10,000 to $14,999 | 28 | 2.0% |
| $15,000 to $24,999 | 158 | 11.3% |
| $25,000 to $34,999 | 191 | 13.6% |
| $35,000 to $49,999 | 226 | 16.1% |
| $50,000 to $74,999 | 142 | 10.1% |
| $75,000 to $99,999 | 221 | 15.8% |
| $100,000 to $149,999 | 270 | 19.3% |
| $150,000 to $199,999 | 49 | 3.5% |
| $200,000+ | 36 | 2.6% |
Household Income by Householder Age in Maiden
The median household income in Maiden is $62,765, with the highest median household income of $92,784 found in the 45 to 64 years age bracket for the primary householder. A total of 593 households (42.3%) fall into this category. Meanwhile, the 15 to 24 years age bracket for the primary householder has the lowest median household income of $0, with 25 households (1.8%) in this group.
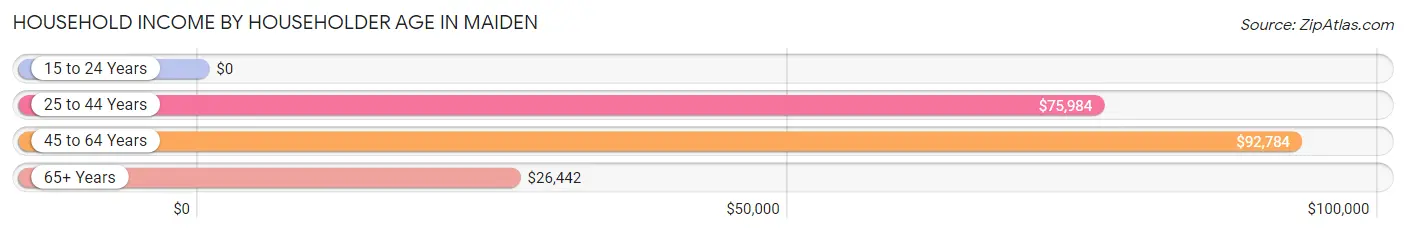
| Income Bracket | # Households | Median Income |
| 15 to 24 Years | 25 (1.8%) | $0 |
| 25 to 44 Years | 362 (25.8%) | $75,984 |
| 45 to 64 Years | 593 (42.3%) | $92,784 |
| 65+ Years | 421 (30.0%) | $26,442 |
| Total | 1,401 (100.0%) | $62,765 |
Poverty in Maiden
Income Below Poverty by Sex and Age in Maiden
With 7.0% poverty level for males and 5.6% for females among the residents of Maiden, 75 year old and over males and 75 year old and over females are the most vulnerable to poverty, with 42 males (36.2%) and 21 females (15.9%) in their respective age groups living below the poverty level.
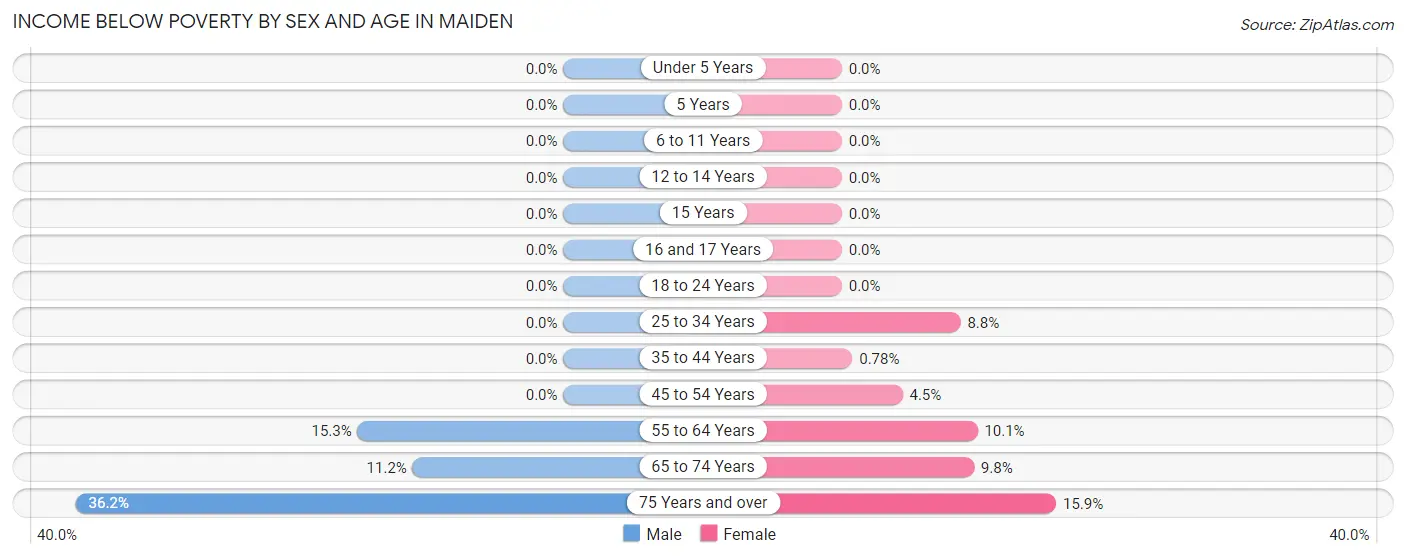
| Age Bracket | Male | Female |
| Under 5 Years | 0 (0.0%) | 0 (0.0%) |
| 5 Years | 0 (0.0%) | 0 (0.0%) |
| 6 to 11 Years | 0 (0.0%) | 0 (0.0%) |
| 12 to 14 Years | 0 (0.0%) | 0 (0.0%) |
| 15 Years | 0 (0.0%) | 0 (0.0%) |
| 16 and 17 Years | 0 (0.0%) | 0 (0.0%) |
| 18 to 24 Years | 0 (0.0%) | 0 (0.0%) |
| 25 to 34 Years | 0 (0.0%) | 14 (8.8%) |
| 35 to 44 Years | 0 (0.0%) | 2 (0.8%) |
| 45 to 54 Years | 0 (0.0%) | 13 (4.5%) |
| 55 to 64 Years | 55 (15.3%) | 29 (10.1%) |
| 65 to 74 Years | 16 (11.2%) | 21 (9.8%) |
| 75 Years and over | 42 (36.2%) | 21 (15.9%) |
| Total | 113 (7.0%) | 100 (5.6%) |
Income Above Poverty by Sex and Age in Maiden
According to the poverty statistics in Maiden, males aged under 5 years and females aged under 5 years are the age groups that are most secure financially, with 100.0% of males and 100.0% of females in these age groups living above the poverty line.
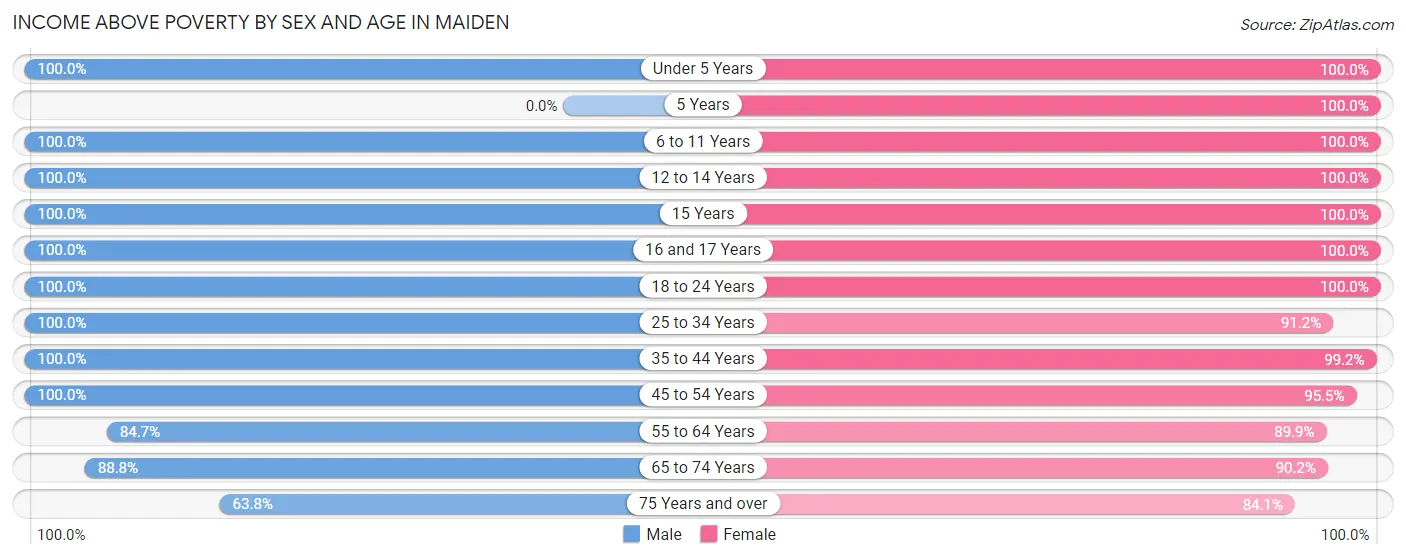
| Age Bracket | Male | Female |
| Under 5 Years | 23 (100.0%) | 16 (100.0%) |
| 5 Years | 0 (0.0%) | 54 (100.0%) |
| 6 to 11 Years | 36 (100.0%) | 49 (100.0%) |
| 12 to 14 Years | 64 (100.0%) | 191 (100.0%) |
| 15 Years | 24 (100.0%) | 21 (100.0%) |
| 16 and 17 Years | 67 (100.0%) | 88 (100.0%) |
| 18 to 24 Years | 126 (100.0%) | 26 (100.0%) |
| 25 to 34 Years | 103 (100.0%) | 145 (91.2%) |
| 35 to 44 Years | 323 (100.0%) | 255 (99.2%) |
| 45 to 54 Years | 232 (100.0%) | 275 (95.5%) |
| 55 to 64 Years | 305 (84.7%) | 259 (89.9%) |
| 65 to 74 Years | 127 (88.8%) | 193 (90.2%) |
| 75 Years and over | 74 (63.8%) | 111 (84.1%) |
| Total | 1,504 (93.0%) | 1,683 (94.4%) |
Income Below Poverty Among Married-Couple Families in Maiden
The poverty statistics for married-couple families in Maiden show that 5.0% or 44 of the total 882 families live below the poverty line. Families with no children have the highest poverty rate of 9.3%, comprising of 44 families. On the other hand, families with 1 or 2 children have the lowest poverty rate of 0.0%, which includes 0 families.
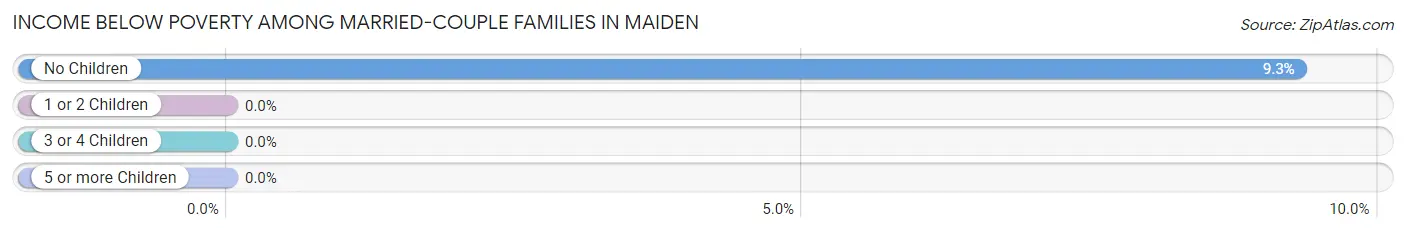
| Children | Above Poverty | Below Poverty |
| No Children | 429 (90.7%) | 44 (9.3%) |
| 1 or 2 Children | 377 (100.0%) | 0 (0.0%) |
| 3 or 4 Children | 32 (100.0%) | 0 (0.0%) |
| 5 or more Children | 0 (0.0%) | 0 (0.0%) |
| Total | 838 (95.0%) | 44 (5.0%) |
Income Below Poverty Among Single-Parent Households in Maiden
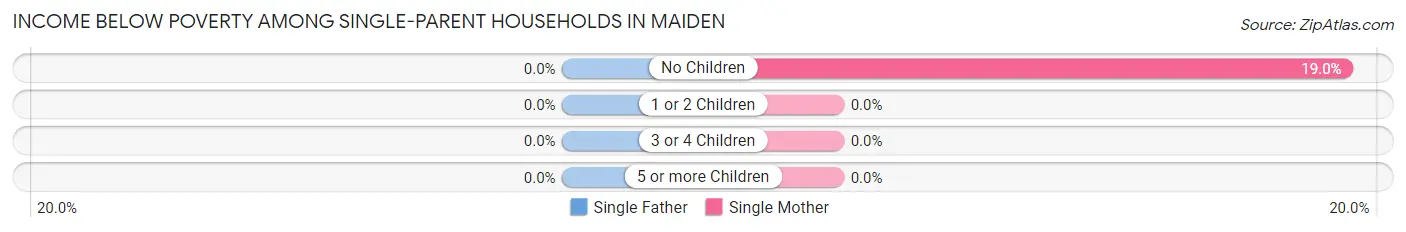
| Children | Single Father | Single Mother |
| No Children | 0 (0.0%) | 15 (19.0%) |
| 1 or 2 Children | 0 (0.0%) | 0 (0.0%) |
| 3 or 4 Children | 0 (0.0%) | 0 (0.0%) |
| 5 or more Children | 0 (0.0%) | 0 (0.0%) |
| Total | 0 (0.0%) | 15 (11.0%) |
Income Below Poverty Among Married-Couple vs Single-Parent Households in Maiden
The poverty data for Maiden shows that 44 of the married-couple family households (5.0%) and 15 of the single-parent households (11.0%) are living below the poverty level. Within the married-couple family households, those with no children have the highest poverty rate, with 44 households (9.3%) falling below the poverty line. Among the single-parent households, those with no children have the highest poverty rate, with 15 household (19.0%) living below poverty.
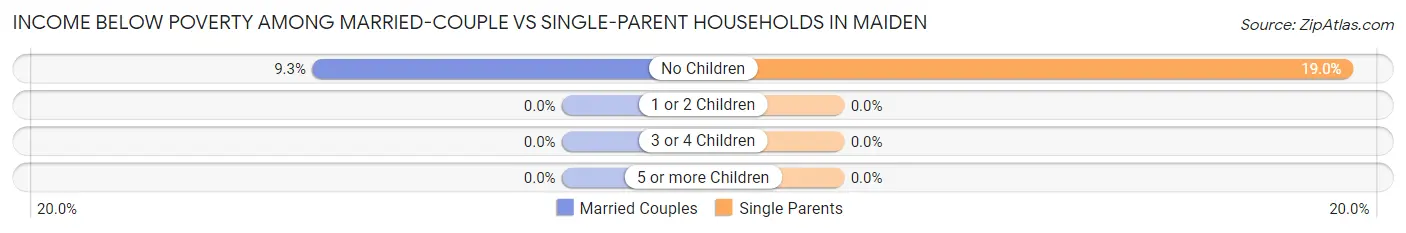
| Children | Married-Couple Families | Single-Parent Households |
| No Children | 44 (9.3%) | 15 (19.0%) |
| 1 or 2 Children | 0 (0.0%) | 0 (0.0%) |
| 3 or 4 Children | 0 (0.0%) | 0 (0.0%) |
| 5 or more Children | 0 (0.0%) | 0 (0.0%) |
| Total | 44 (5.0%) | 15 (11.0%) |
Race in Maiden
The most populous races in Maiden are White / Caucasian (3,366 | 90.3%), Black / African American (327 | 8.8%), and Hispanic or Latino (276 | 7.4%).
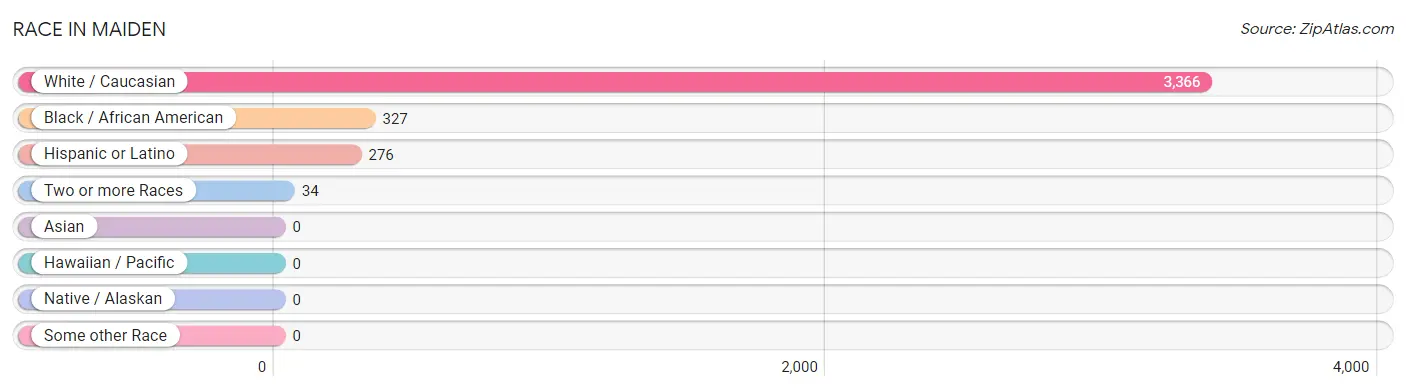
| Race | # Population | % Population |
| Asian | 0 | 0.0% |
| Black / African American | 327 | 8.8% |
| Hawaiian / Pacific | 0 | 0.0% |
| Hispanic or Latino | 276 | 7.4% |
| Native / Alaskan | 0 | 0.0% |
| White / Caucasian | 3,366 | 90.3% |
| Two or more Races | 34 | 0.9% |
| Some other Race | 0 | 0.0% |
| Total | 3,727 | 100.0% |
Ancestry in Maiden
The most populous ancestries reported in Maiden are American (473 | 12.7%), German (436 | 11.7%), Irish (277 | 7.4%), Puerto Rican (265 | 7.1%), and European (199 | 5.3%), together accounting for 44.3% of all Maiden residents.
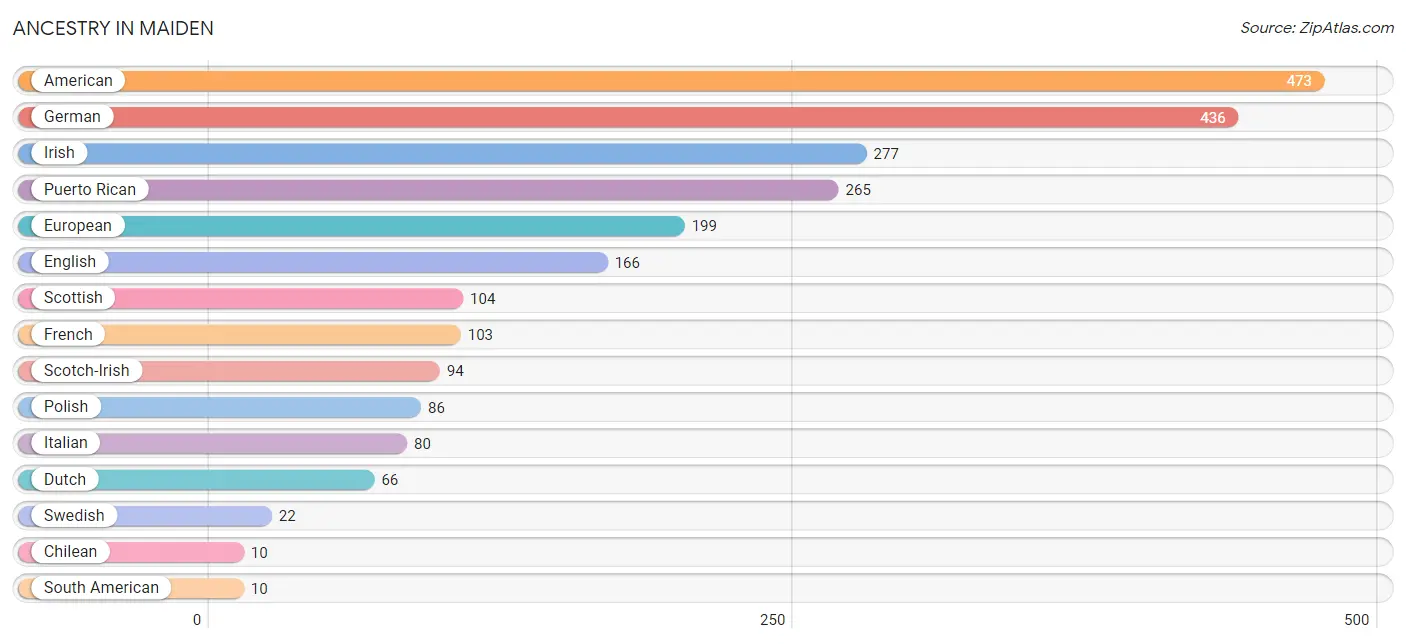
| Ancestry | # Population | % Population |
| American | 473 | 12.7% |
| Cherokee | 7 | 0.2% |
| Chilean | 10 | 0.3% |
| Dutch | 66 | 1.8% |
| English | 166 | 4.4% |
| European | 199 | 5.3% |
| French | 103 | 2.8% |
| German | 436 | 11.7% |
| Irish | 277 | 7.4% |
| Italian | 80 | 2.1% |
| Polish | 86 | 2.3% |
| Puerto Rican | 265 | 7.1% |
| Scotch-Irish | 94 | 2.5% |
| Scottish | 104 | 2.8% |
| South American | 10 | 0.3% |
| Spaniard | 1 | 0.0% |
| Swedish | 22 | 0.6% | View All 17 Rows |
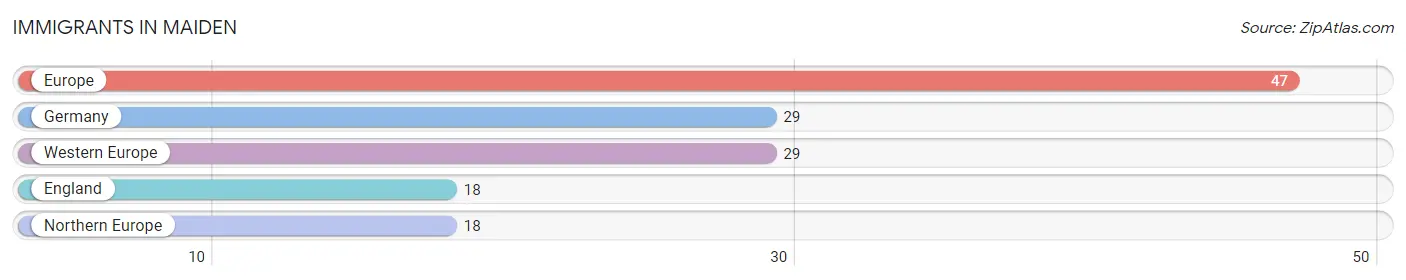
Immigrants in Maiden
The most numerous immigrant groups reported in Maiden came from Europe (47 | 1.3%), Germany (29 | 0.8%), Western Europe (29 | 0.8%), England (18 | 0.5%), and Northern Europe (18 | 0.5%), together accounting for 3.8% of all Maiden residents.
| Immigration Origin | # Population | % Population |
| England | 18 | 0.5% |
| Europe | 47 | 1.3% |
| Germany | 29 | 0.8% |
| Northern Europe | 18 | 0.5% |
| Western Europe | 29 | 0.8% | View All 5 Rows |
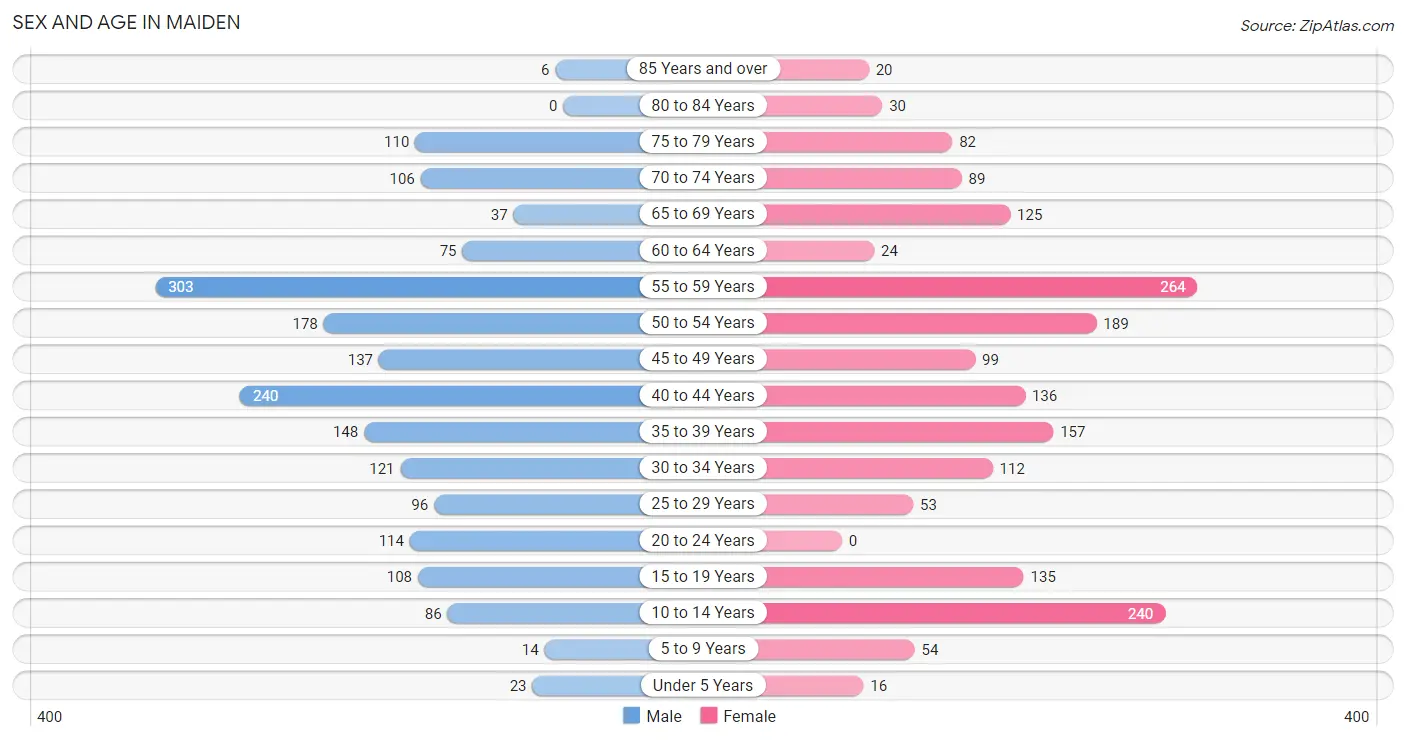
Sex and Age in Maiden
Sex and Age in Maiden
The most populous age groups in Maiden are 55 to 59 Years (303 | 15.9%) for men and 55 to 59 Years (264 | 14.5%) for women.
| Age Bracket | Male | Female |
| Under 5 Years | 23 (1.2%) | 16 (0.9%) |
| 5 to 9 Years | 14 (0.7%) | 54 (3.0%) |
| 10 to 14 Years | 86 (4.5%) | 240 (13.2%) |
| 15 to 19 Years | 108 (5.7%) | 135 (7.4%) |
| 20 to 24 Years | 114 (6.0%) | 0 (0.0%) |
| 25 to 29 Years | 96 (5.1%) | 53 (2.9%) |
| 30 to 34 Years | 121 (6.4%) | 112 (6.1%) |
| 35 to 39 Years | 148 (7.8%) | 157 (8.6%) |
| 40 to 44 Years | 240 (12.6%) | 136 (7.4%) |
| 45 to 49 Years | 137 (7.2%) | 99 (5.4%) |
| 50 to 54 Years | 178 (9.4%) | 189 (10.4%) |
| 55 to 59 Years | 303 (15.9%) | 264 (14.5%) |
| 60 to 64 Years | 75 (3.9%) | 24 (1.3%) |
| 65 to 69 Years | 37 (1.9%) | 125 (6.9%) |
| 70 to 74 Years | 106 (5.6%) | 89 (4.9%) |
| 75 to 79 Years | 110 (5.8%) | 82 (4.5%) |
| 80 to 84 Years | 0 (0.0%) | 30 (1.6%) |
| 85 Years and over | 6 (0.3%) | 20 (1.1%) |
| Total | 1,902 (100.0%) | 1,825 (100.0%) |
Families and Households in Maiden
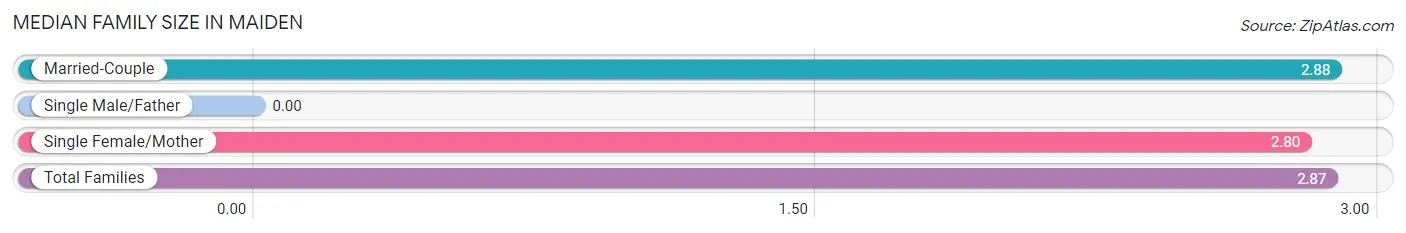
Median Family Size in Maiden
| Family Type | # Families | Family Size |
| Married-Couple | 882 (86.6%) | 2.88 |
| Single Male/Father | 0 (0.0%) | - |
| Single Female/Mother | 137 (13.4%) | 2.80 |
| Total Families | 1,019 (100.0%) | 2.87 |
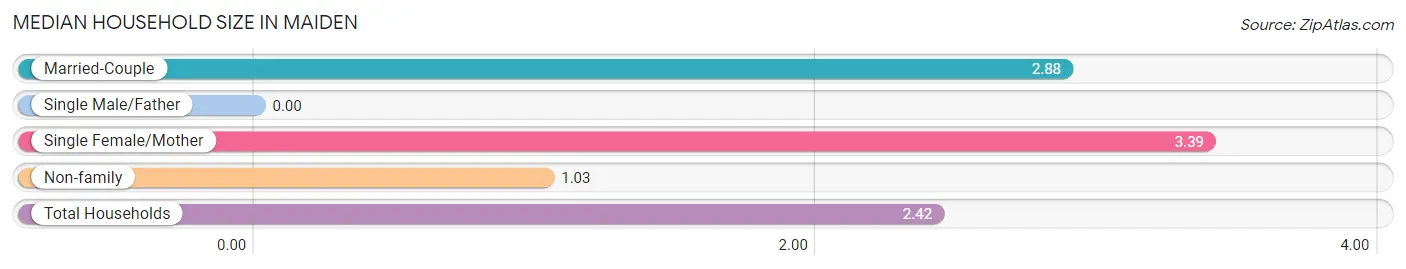
Median Household Size in Maiden
| Household Type | # Households | Household Size |
| Married-Couple | 882 (63.0%) | 2.88 |
| Single Male/Father | 0 (0.0%) | - |
| Single Female/Mother | 137 (9.8%) | 3.39 |
| Non-family | 382 (27.3%) | 1.03 |
| Total Households | 1,401 (100.0%) | 2.42 |
Household Size by Marriage Status in Maiden
Out of a total of 1,401 households in Maiden, 1,019 (72.7%) are family households, while 382 (27.3%) are nonfamily households. The most numerous type of family households are 2-person households, comprising 446, and the most common type of nonfamily households are 1-person households, comprising 369.
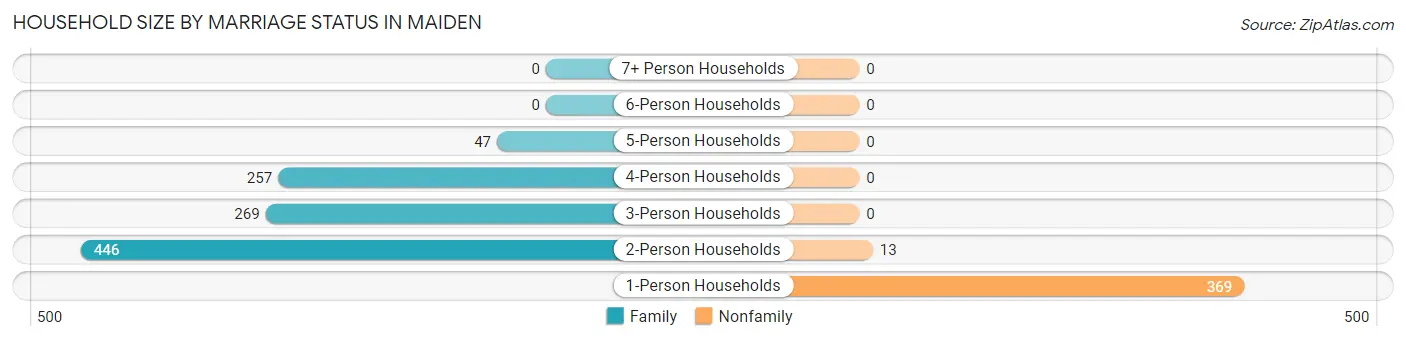
| Household Size | Family Households | Nonfamily Households |
| 1-Person Households | - | 369 (26.3%) |
| 2-Person Households | 446 (31.8%) | 13 (0.9%) |
| 3-Person Households | 269 (19.2%) | 0 (0.0%) |
| 4-Person Households | 257 (18.3%) | 0 (0.0%) |
| 5-Person Households | 47 (3.4%) | 0 (0.0%) |
| 6-Person Households | 0 (0.0%) | 0 (0.0%) |
| 7+ Person Households | 0 (0.0%) | 0 (0.0%) |
| Total | 1,019 (72.7%) | 382 (27.3%) |
Female Fertility in Maiden
Fertility by Age in Maiden
Average fertility rate in Maiden is 33.0 births per 1,000 women. Women in the age bracket of 35 to 50 years have the highest fertility rate with 59.0 births per 1,000 women. Women in the age bracket of 35 to 50 years acount for 100.0% of all women with births.
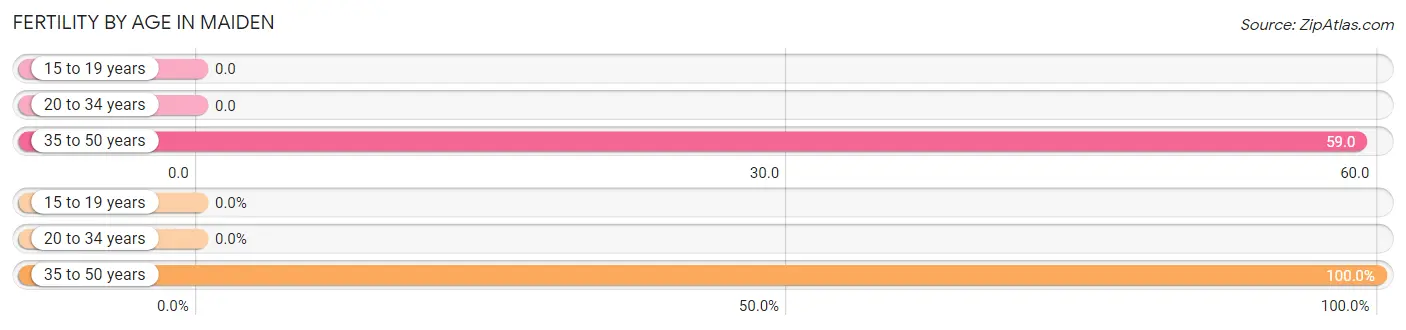
| Age Bracket | Women with Births | Births / 1,000 Women |
| 15 to 19 years | 0 (0.0%) | 0.0 |
| 20 to 34 years | 0 (0.0%) | 0.0 |
| 35 to 50 years | 23 (100.0%) | 59.0 |
| Total | 23 (100.0%) | 33.0 |
Fertility by Age by Marriage Status in Maiden
95.7% of women with births (23) in Maiden are married. The highest percentage of unmarried women with births falls into 35 to 50 years age bracket with 4.3% of them unmarried at the time of birth, while the lowest percentage of unmarried women with births belong to 35 to 50 years age bracket with 4.3% of them unmarried.
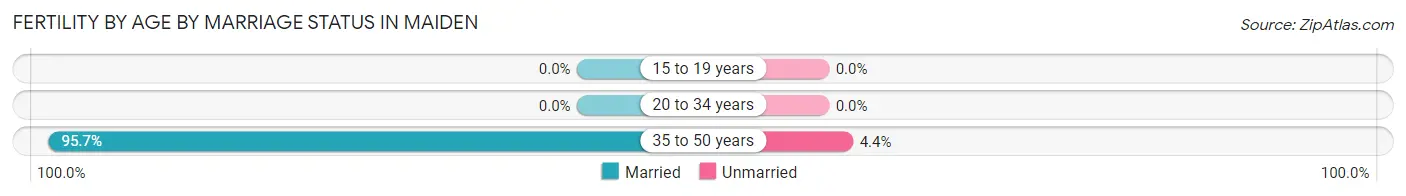
| Age Bracket | Married | Unmarried |
| 15 to 19 years | 0 (0.0%) | 0 (0.0%) |
| 20 to 34 years | 0 (0.0%) | 0 (0.0%) |
| 35 to 50 years | 22 (95.7%) | 1 (4.3%) |
| Total | 22 (95.7%) | 1 (4.3%) |
Fertility by Education in Maiden
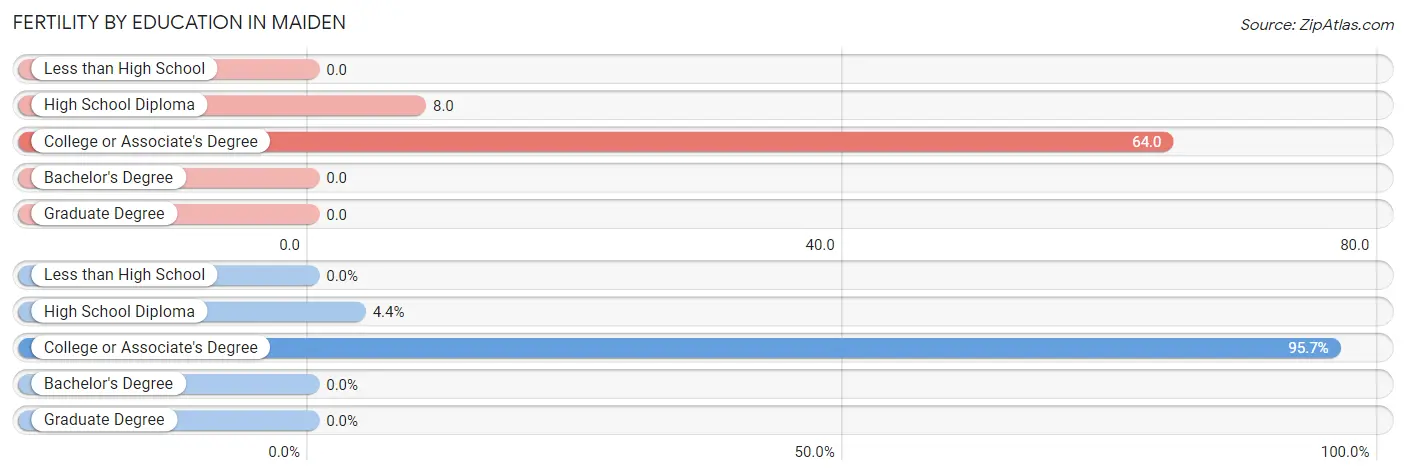
| Educational Attainment | Women with Births | Births / 1,000 Women |
| Less than High School | 0 (0.0%) | 0.0 |
| High School Diploma | 1 (4.3%) | 8.0 |
| College or Associate's Degree | 22 (95.7%) | 64.0 |
| Bachelor's Degree | 0 (0.0%) | 0.0 |
| Graduate Degree | 0 (0.0%) | 0.0 |
| Total | 23 (100.0%) | 33.0 |
Fertility by Education by Marriage Status in Maiden
4.3% of women with births in Maiden are unmarried. Women with the educational attainment of college or associate's degree are most likely to be married with 100.0% of them married at childbirth, while women with the educational attainment of high school diploma are least likely to be married with 100.0% of them unmarried at childbirth.
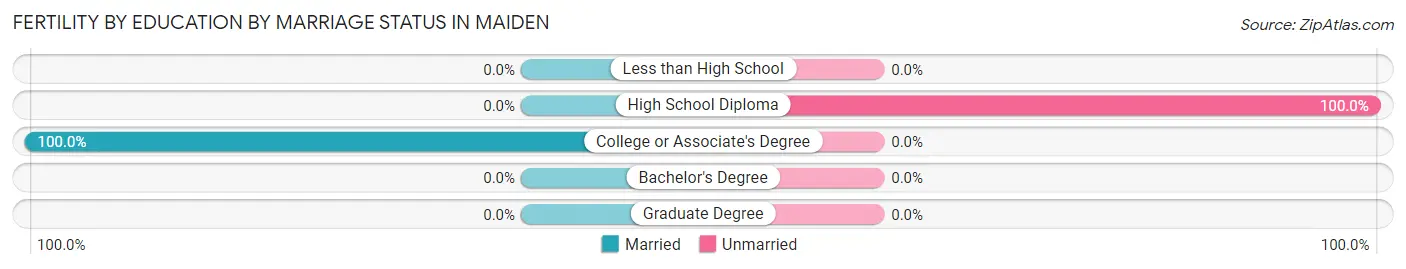
| Educational Attainment | Married | Unmarried |
| Less than High School | 0 (0.0%) | 0 (0.0%) |
| High School Diploma | 0 (0.0%) | 1 (100.0%) |
| College or Associate's Degree | 22 (100.0%) | 0 (0.0%) |
| Bachelor's Degree | 0 (0.0%) | 0 (0.0%) |
| Graduate Degree | 0 (0.0%) | 0 (0.0%) |
| Total | 22 (95.7%) | 1 (4.3%) |
Employment Characteristics in Maiden
Employment by Class of Employer in Maiden
Among the 1,891 employed individuals in Maiden, private company employees (1,311 | 69.3%), self-employed (not incorporated) (175 | 9.2%), and federal government employees (142 | 7.5%) make up the most common classes of employment.
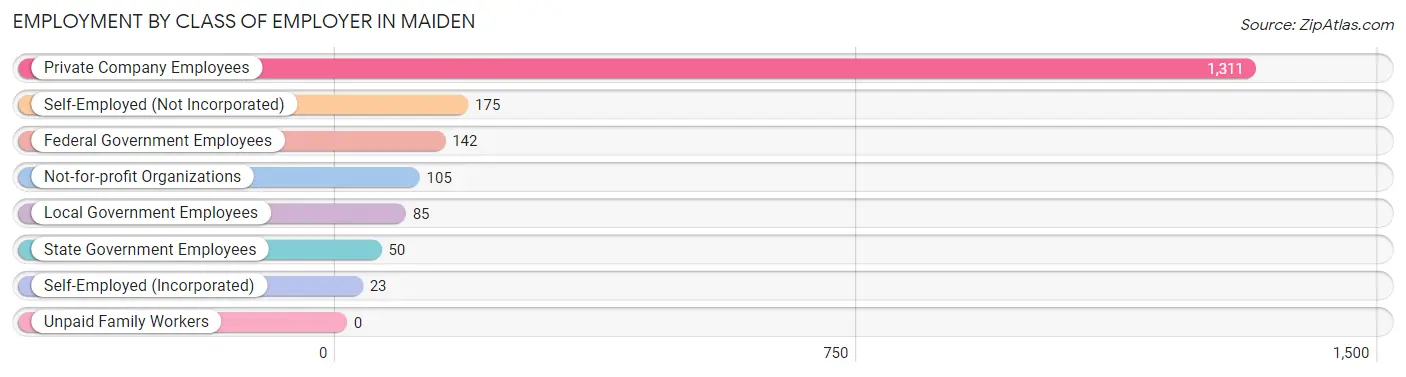
| Employer Class | # Employees | % Employees |
| Private Company Employees | 1,311 | 69.3% |
| Self-Employed (Incorporated) | 23 | 1.2% |
| Self-Employed (Not Incorporated) | 175 | 9.2% |
| Not-for-profit Organizations | 105 | 5.6% |
| Local Government Employees | 85 | 4.5% |
| State Government Employees | 50 | 2.6% |
| Federal Government Employees | 142 | 7.5% |
| Unpaid Family Workers | 0 | 0.0% |
| Total | 1,891 | 100.0% |
Employment Status by Age in Maiden
According to the labor force statistics for Maiden, out of the total population over 16 years of age (3,249), 61.8% or 2,008 individuals are in the labor force, with 4.2% or 84 of them unemployed. The age group with the highest labor force participation rate is 20 to 24 years, with 95.6% or 109 individuals in the labor force. Within the labor force, the 16 to 19 years age range has the highest percentage of unemployed individuals, with 45.2% or 56 of them being unemployed.
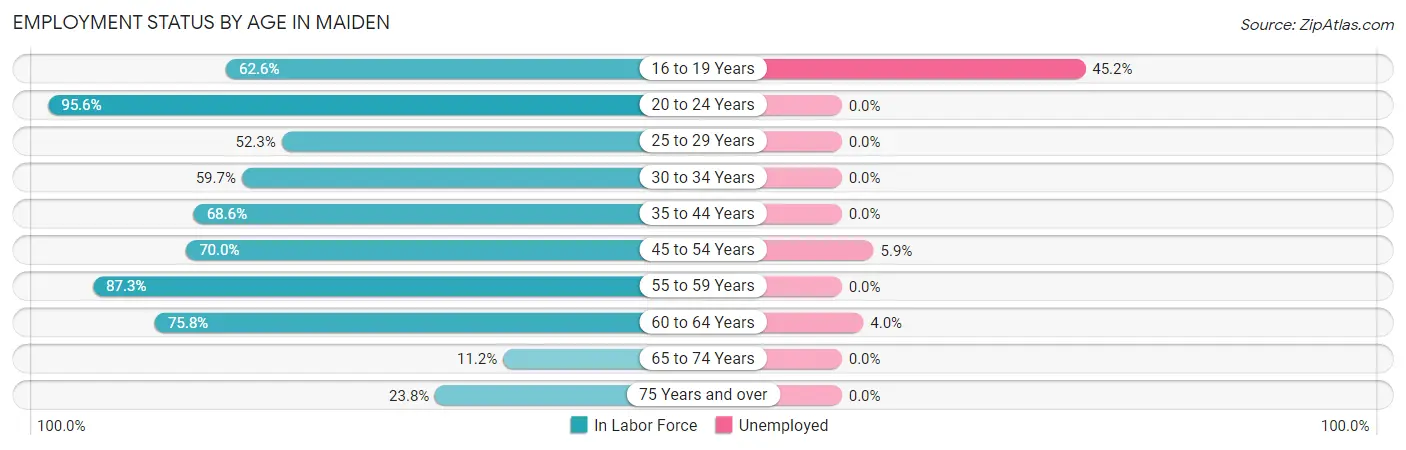
| Age Bracket | In Labor Force | Unemployed |
| 16 to 19 Years | 124 (62.6%) | 56 (45.2%) |
| 20 to 24 Years | 109 (95.6%) | 0 (0.0%) |
| 25 to 29 Years | 78 (52.3%) | 0 (0.0%) |
| 30 to 34 Years | 139 (59.7%) | 0 (0.0%) |
| 35 to 44 Years | 467 (68.6%) | 0 (0.0%) |
| 45 to 54 Years | 422 (70.0%) | 25 (5.9%) |
| 55 to 59 Years | 495 (87.3%) | 0 (0.0%) |
| 60 to 64 Years | 75 (75.8%) | 3 (4.0%) |
| 65 to 74 Years | 40 (11.2%) | 0 (0.0%) |
| 75 Years and over | 59 (23.8%) | 0 (0.0%) |
| Total | 2,008 (61.8%) | 84 (4.2%) |
Employment Status by Educational Attainment in Maiden
According to labor force statistics for Maiden, 71.9% of individuals (1,677) out of the total population between 25 and 64 years of age (2,332) are in the labor force, with 1.7% or 29 of them being unemployed. The group with the highest labor force participation rate are those with the educational attainment of bachelor's degree or higher, with 87.4% or 292 individuals in the labor force. Within the labor force, individuals with high school diploma education have the highest percentage of unemployment, with 4.3% or 28 of them being unemployed.
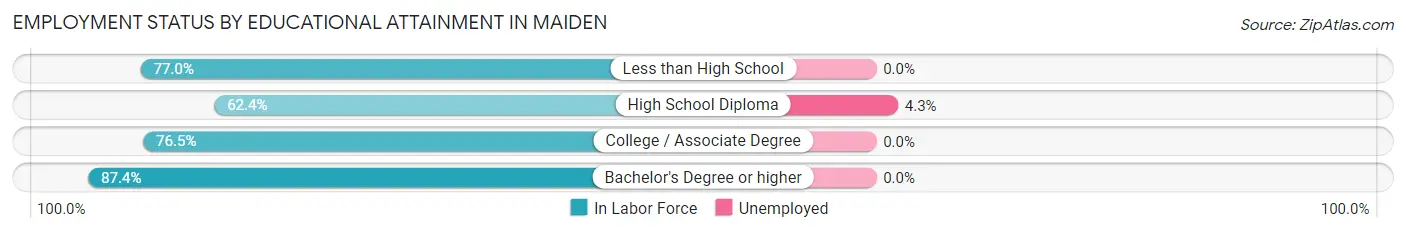
| Educational Attainment | In Labor Force | Unemployed |
| Less than High School | 157 (77.0%) | 0 (0.0%) |
| High School Diploma | 646 (62.4%) | 45 (4.3%) |
| College / Associate Degree | 581 (76.5%) | 0 (0.0%) |
| Bachelor's Degree or higher | 292 (87.4%) | 0 (0.0%) |
| Total | 1,677 (71.9%) | 40 (1.7%) |
Employment Occupations by Sex in Maiden
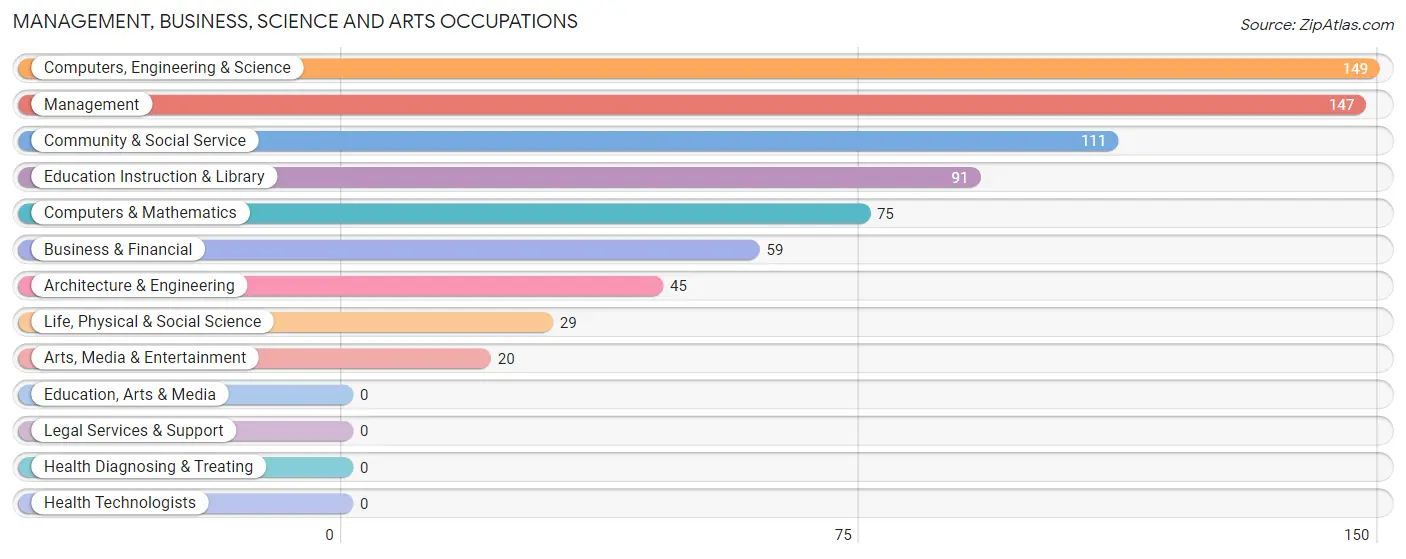
Management, Business, Science and Arts Occupations
The most common Management, Business, Science and Arts occupations in Maiden are Computers, Engineering & Science (149 | 7.7%), Management (147 | 7.6%), Community & Social Service (111 | 5.8%), Education Instruction & Library (91 | 4.7%), and Computers & Mathematics (75 | 3.9%).
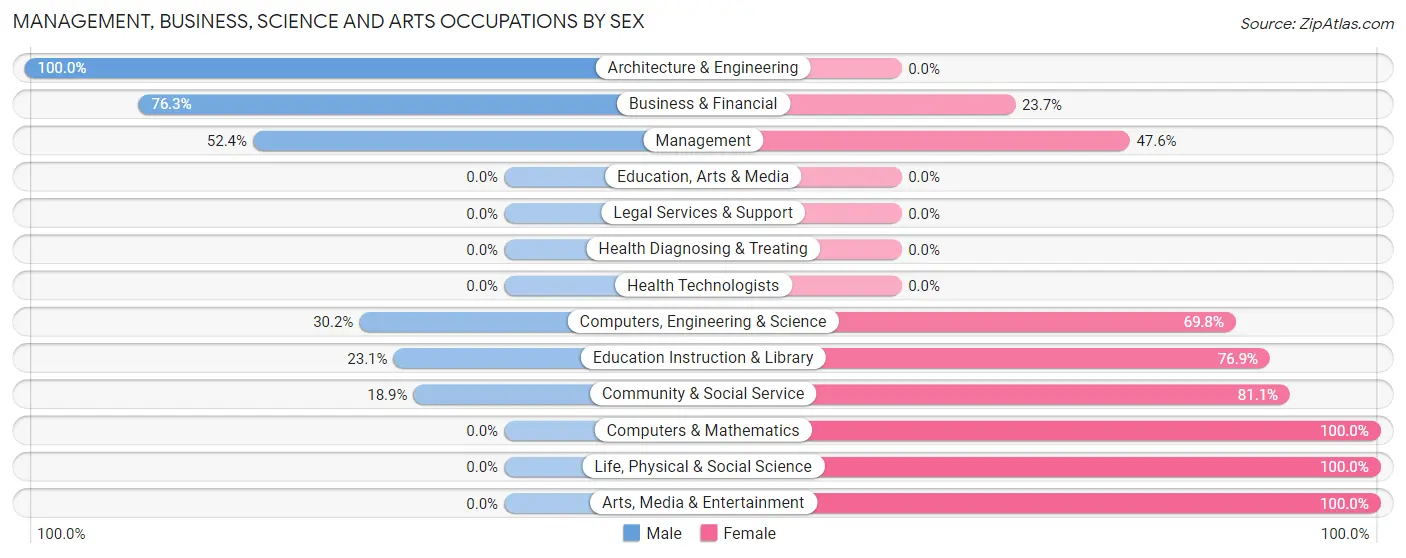
Management, Business, Science and Arts Occupations by Sex
Within the Management, Business, Science and Arts occupations in Maiden, the most male-oriented occupations are Architecture & Engineering (100.0%), Business & Financial (76.3%), and Management (52.4%), while the most female-oriented occupations are Computers & Mathematics (100.0%), Life, Physical & Social Science (100.0%), and Arts, Media & Entertainment (100.0%).
| Occupation | Male | Female |
| Management | 77 (52.4%) | 70 (47.6%) |
| Business & Financial | 45 (76.3%) | 14 (23.7%) |
| Computers, Engineering & Science | 45 (30.2%) | 104 (69.8%) |
| Computers & Mathematics | 0 (0.0%) | 75 (100.0%) |
| Architecture & Engineering | 45 (100.0%) | 0 (0.0%) |
| Life, Physical & Social Science | 0 (0.0%) | 29 (100.0%) |
| Community & Social Service | 21 (18.9%) | 90 (81.1%) |
| Education, Arts & Media | 0 (0.0%) | 0 (0.0%) |
| Legal Services & Support | 0 (0.0%) | 0 (0.0%) |
| Education Instruction & Library | 21 (23.1%) | 70 (76.9%) |
| Arts, Media & Entertainment | 0 (0.0%) | 20 (100.0%) |
| Health Diagnosing & Treating | 0 (0.0%) | 0 (0.0%) |
| Health Technologists | 0 (0.0%) | 0 (0.0%) |
| Total (Category) | 188 (40.3%) | 278 (59.7%) |
| Total (Overall) | 1,143 (59.4%) | 781 (40.6%) |
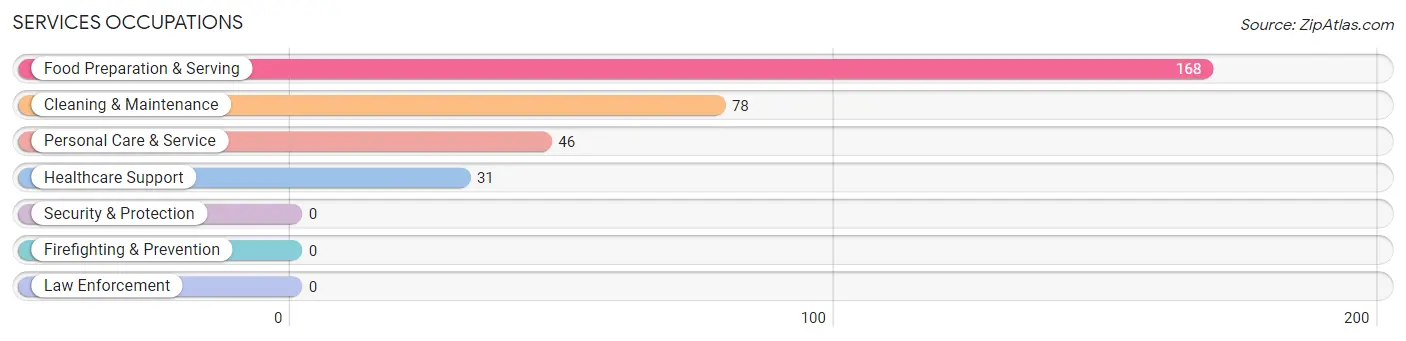
Services Occupations
The most common Services occupations in Maiden are Food Preparation & Serving (168 | 8.7%), Cleaning & Maintenance (78 | 4.1%), Personal Care & Service (46 | 2.4%), and Healthcare Support (31 | 1.6%).
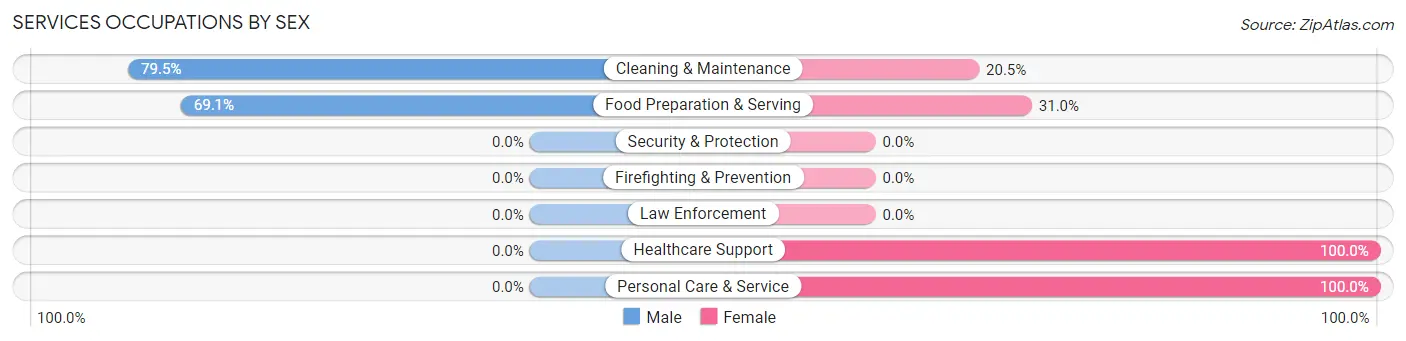
Services Occupations by Sex
Within the Services occupations in Maiden, the most male-oriented occupations are Cleaning & Maintenance (79.5%), and Food Preparation & Serving (69.1%), while the most female-oriented occupations are Healthcare Support (100.0%), Personal Care & Service (100.0%), and Food Preparation & Serving (30.9%).
| Occupation | Male | Female |
| Healthcare Support | 0 (0.0%) | 31 (100.0%) |
| Security & Protection | 0 (0.0%) | 0 (0.0%) |
| Firefighting & Prevention | 0 (0.0%) | 0 (0.0%) |
| Law Enforcement | 0 (0.0%) | 0 (0.0%) |
| Food Preparation & Serving | 116 (69.1%) | 52 (30.9%) |
| Cleaning & Maintenance | 62 (79.5%) | 16 (20.5%) |
| Personal Care & Service | 0 (0.0%) | 46 (100.0%) |
| Total (Category) | 178 (55.1%) | 145 (44.9%) |
| Total (Overall) | 1,143 (59.4%) | 781 (40.6%) |
Sales and Office Occupations
The most common Sales and Office occupations in Maiden are Office & Administration (286 | 14.9%), and Sales & Related (99 | 5.1%).
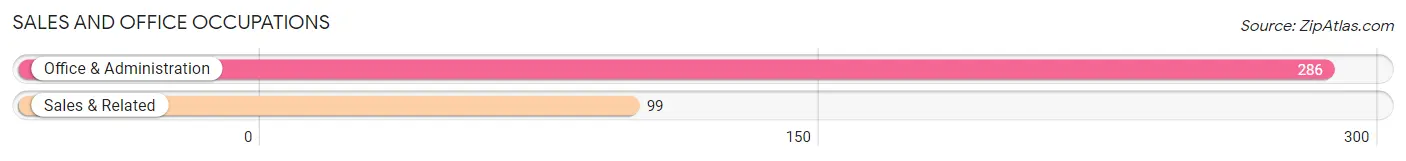
Sales and Office Occupations by Sex
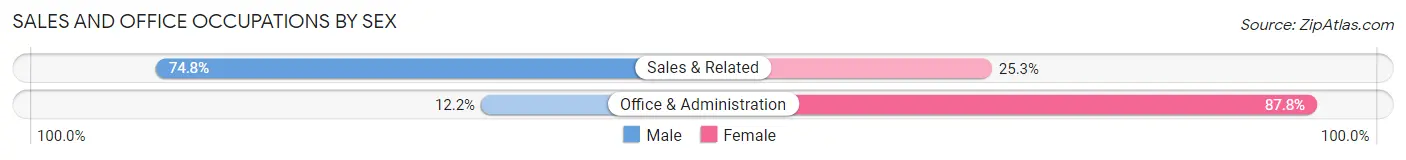
| Occupation | Male | Female |
| Sales & Related | 74 (74.8%) | 25 (25.3%) |
| Office & Administration | 35 (12.2%) | 251 (87.8%) |
| Total (Category) | 109 (28.3%) | 276 (71.7%) |
| Total (Overall) | 1,143 (59.4%) | 781 (40.6%) |
Natural Resources, Construction and Maintenance Occupations
The most common Natural Resources, Construction and Maintenance occupations in Maiden are Installation, Maintenance & Repair (41 | 2.1%), and Construction & Extraction (37 | 1.9%).
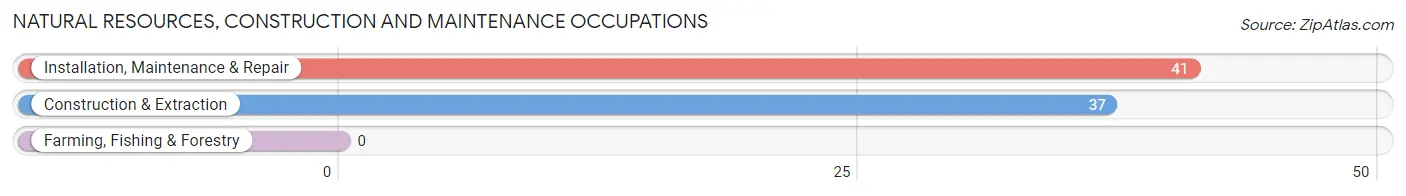
Natural Resources, Construction and Maintenance Occupations by Sex
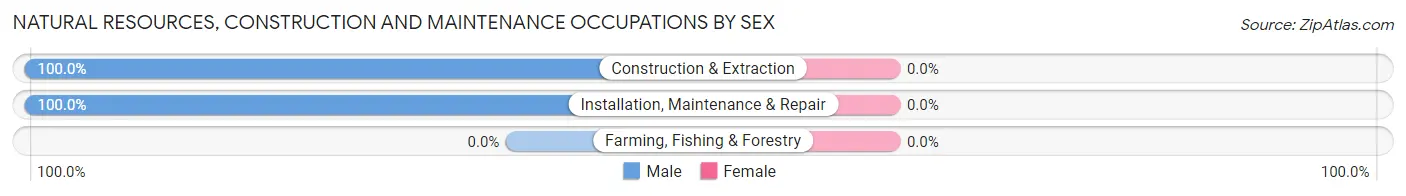
| Occupation | Male | Female |
| Farming, Fishing & Forestry | 0 (0.0%) | 0 (0.0%) |
| Construction & Extraction | 37 (100.0%) | 0 (0.0%) |
| Installation, Maintenance & Repair | 41 (100.0%) | 0 (0.0%) |
| Total (Category) | 78 (100.0%) | 0 (0.0%) |
| Total (Overall) | 1,143 (59.4%) | 781 (40.6%) |
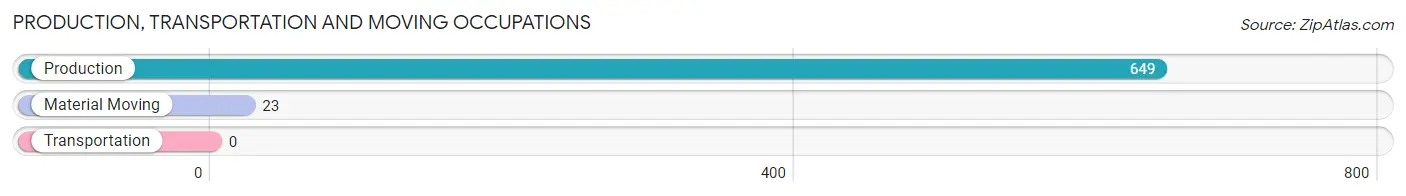
Production, Transportation and Moving Occupations
The most common Production, Transportation and Moving occupations in Maiden are Production (649 | 33.7%), and Material Moving (23 | 1.2%).
Production, Transportation and Moving Occupations by Sex
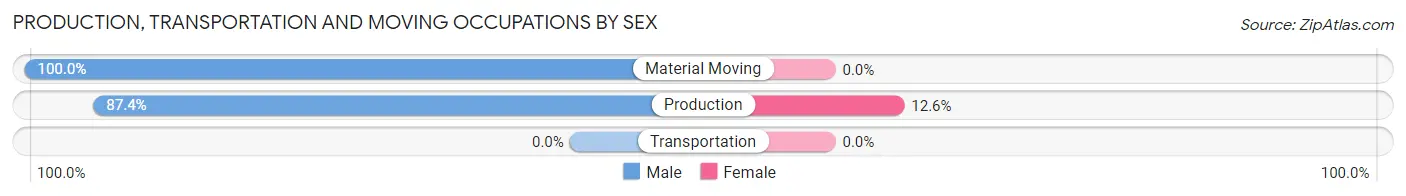
| Occupation | Male | Female |
| Production | 567 (87.4%) | 82 (12.6%) |
| Transportation | 0 (0.0%) | 0 (0.0%) |
| Material Moving | 23 (100.0%) | 0 (0.0%) |
| Total (Category) | 590 (87.8%) | 82 (12.2%) |
| Total (Overall) | 1,143 (59.4%) | 781 (40.6%) |
Employment Industries by Sex in Maiden
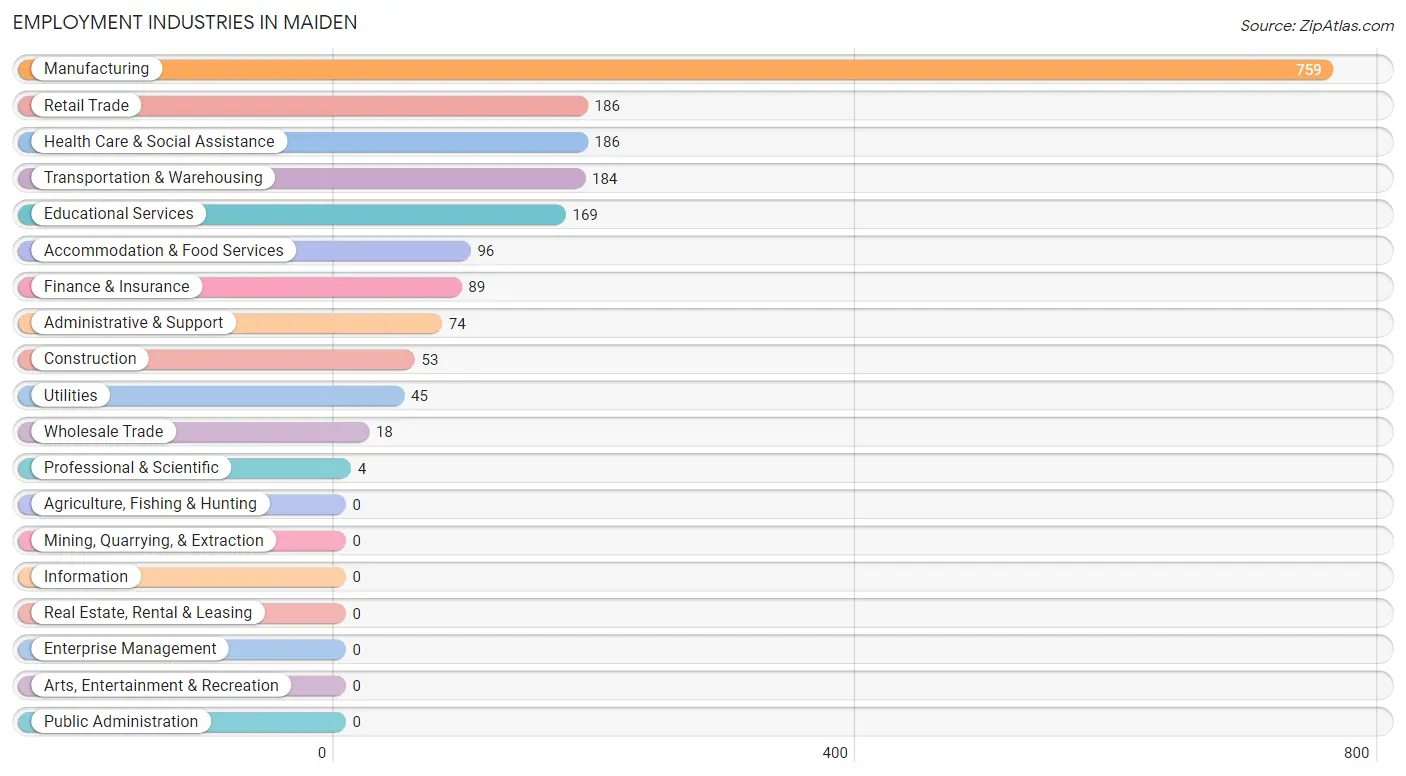
Employment Industries in Maiden
The major employment industries in Maiden include Manufacturing (759 | 39.5%), Retail Trade (186 | 9.7%), Health Care & Social Assistance (186 | 9.7%), Transportation & Warehousing (184 | 9.6%), and Educational Services (169 | 8.8%).
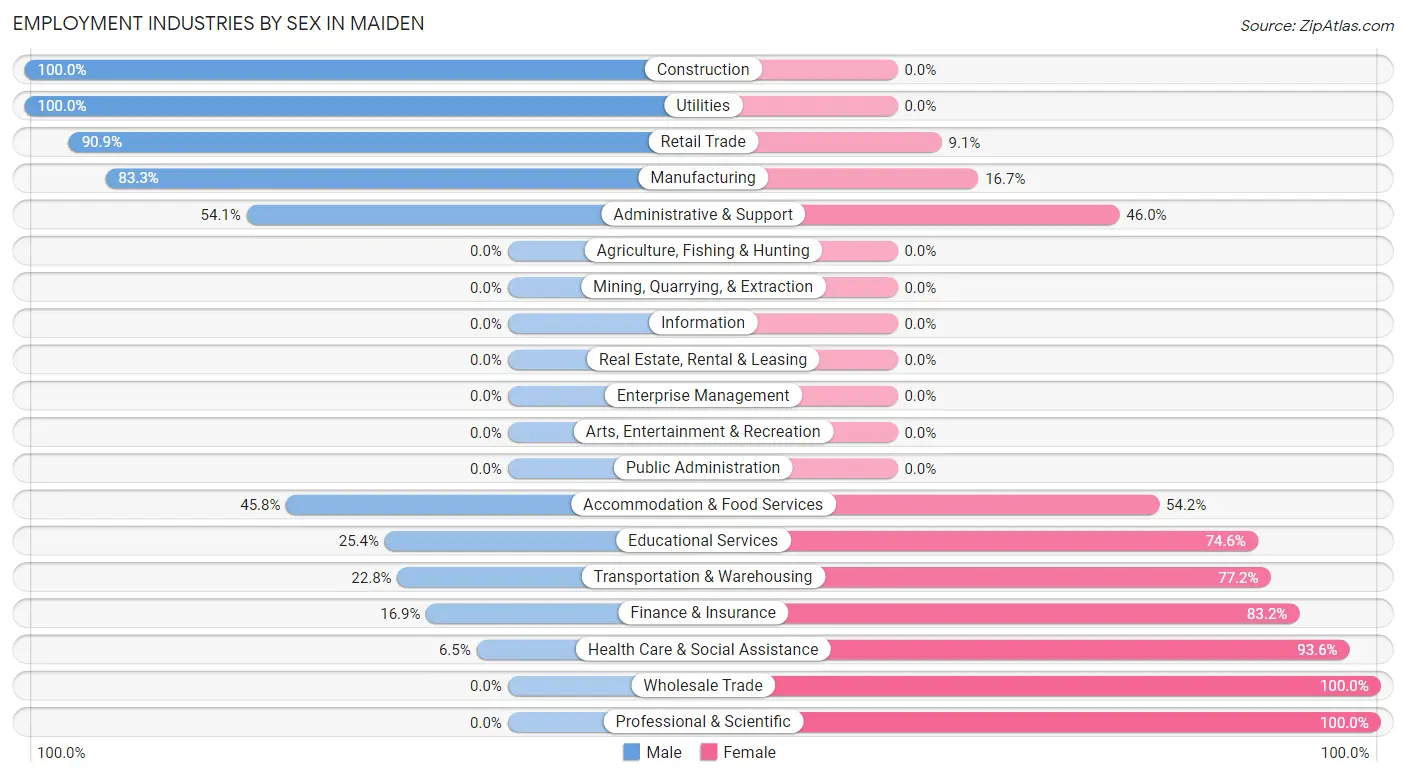
Employment Industries by Sex in Maiden
The Maiden industries that see more men than women are Construction (100.0%), Utilities (100.0%), and Retail Trade (90.9%), whereas the industries that tend to have a higher number of women are Wholesale Trade (100.0%), Professional & Scientific (100.0%), and Health Care & Social Assistance (93.5%).
| Industry | Male | Female |
| Agriculture, Fishing & Hunting | 0 (0.0%) | 0 (0.0%) |
| Mining, Quarrying, & Extraction | 0 (0.0%) | 0 (0.0%) |
| Construction | 53 (100.0%) | 0 (0.0%) |
| Manufacturing | 632 (83.3%) | 127 (16.7%) |
| Wholesale Trade | 0 (0.0%) | 18 (100.0%) |
| Retail Trade | 169 (90.9%) | 17 (9.1%) |
| Transportation & Warehousing | 42 (22.8%) | 142 (77.2%) |
| Utilities | 45 (100.0%) | 0 (0.0%) |
| Information | 0 (0.0%) | 0 (0.0%) |
| Finance & Insurance | 15 (16.9%) | 74 (83.2%) |
| Real Estate, Rental & Leasing | 0 (0.0%) | 0 (0.0%) |
| Professional & Scientific | 0 (0.0%) | 4 (100.0%) |
| Enterprise Management | 0 (0.0%) | 0 (0.0%) |
| Administrative & Support | 40 (54.0%) | 34 (46.0%) |
| Educational Services | 43 (25.4%) | 126 (74.6%) |
| Health Care & Social Assistance | 12 (6.5%) | 174 (93.5%) |
| Arts, Entertainment & Recreation | 0 (0.0%) | 0 (0.0%) |
| Accommodation & Food Services | 44 (45.8%) | 52 (54.2%) |
| Public Administration | 0 (0.0%) | 0 (0.0%) |
| Total | 1,143 (59.4%) | 781 (40.6%) |
Education in Maiden
School Enrollment in Maiden
The most common levels of schooling among the 742 students in Maiden are high school (439 | 59.2%), middle school (153 | 20.6%), and college / undergraduate (65 | 8.8%).
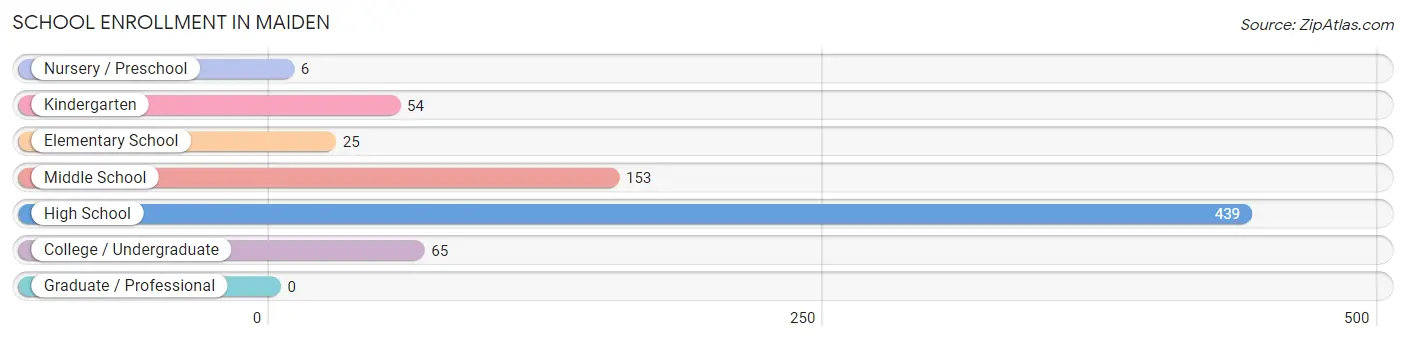
| School Level | # Students | % Students |
| Nursery / Preschool | 6 | 0.8% |
| Kindergarten | 54 | 7.3% |
| Elementary School | 25 | 3.4% |
| Middle School | 153 | 20.6% |
| High School | 439 | 59.2% |
| College / Undergraduate | 65 | 8.8% |
| Graduate / Professional | 0 | 0.0% |
| Total | 742 | 100.0% |
School Enrollment by Age by Funding Source in Maiden
Out of a total of 742 students who are enrolled in schools in Maiden, 38 (5.1%) attend a private institution, while the remaining 704 (94.9%) are enrolled in public schools. The age group of 3 to 4 year olds has the highest likelihood of being enrolled in private schools, with 6 (100.0% in the age bracket) enrolled. Conversely, the age group of 5 to 9 year old has the lowest likelihood of being enrolled in a private school, with 54 (100.0% in the age bracket) attending a public institution.
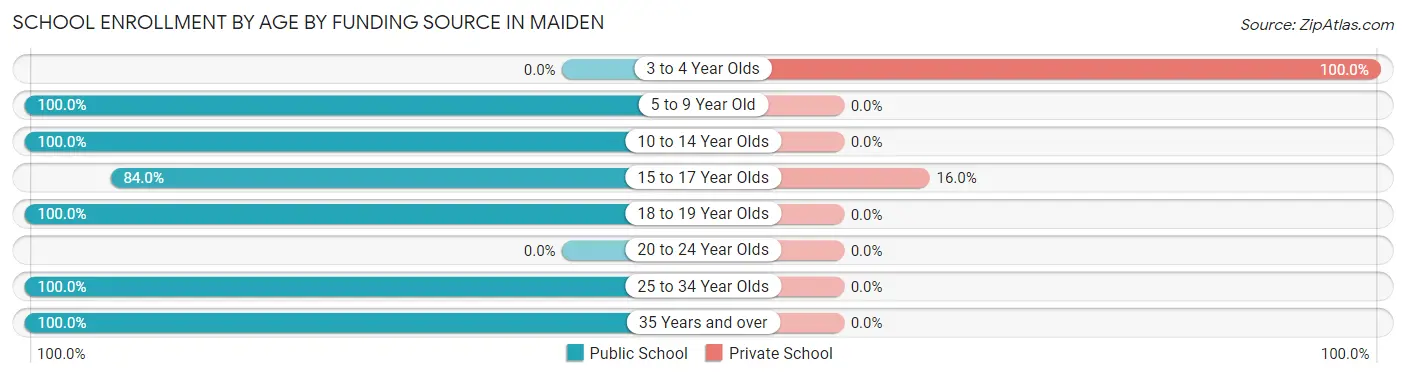
| Age Bracket | Public School | Private School |
| 3 to 4 Year Olds | 0 (0.0%) | 6 (100.0%) |
| 5 to 9 Year Old | 54 (100.0%) | 0 (0.0%) |
| 10 to 14 Year Olds | 312 (100.0%) | 0 (0.0%) |
| 15 to 17 Year Olds | 168 (84.0%) | 32 (16.0%) |
| 18 to 19 Year Olds | 26 (100.0%) | 0 (0.0%) |
| 20 to 24 Year Olds | 0 (0.0%) | 0 (0.0%) |
| 25 to 34 Year Olds | 34 (100.0%) | 0 (0.0%) |
| 35 Years and over | 110 (100.0%) | 0 (0.0%) |
| Total | 704 (94.9%) | 38 (5.1%) |
Educational Attainment by Field of Study in Maiden
Business (66 | 18.6%), education (65 | 18.4%), engineering (51 | 14.4%), science & technology (31 | 8.8%), and physical & health sciences (29 | 8.2%) are the most common fields of study among 354 individuals in Maiden who have obtained a bachelor's degree or higher.
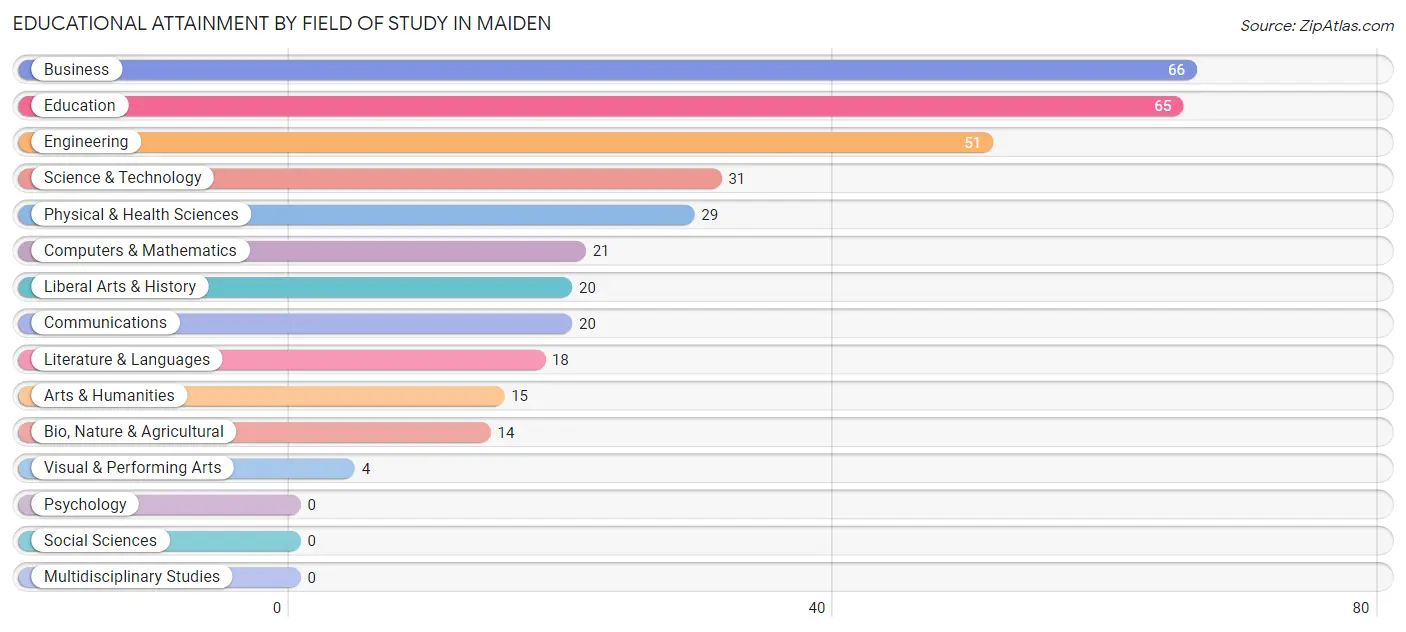
| Field of Study | # Graduates | % Graduates |
| Computers & Mathematics | 21 | 5.9% |
| Bio, Nature & Agricultural | 14 | 4.0% |
| Physical & Health Sciences | 29 | 8.2% |
| Psychology | 0 | 0.0% |
| Social Sciences | 0 | 0.0% |
| Engineering | 51 | 14.4% |
| Multidisciplinary Studies | 0 | 0.0% |
| Science & Technology | 31 | 8.8% |
| Business | 66 | 18.6% |
| Education | 65 | 18.4% |
| Literature & Languages | 18 | 5.1% |
| Liberal Arts & History | 20 | 5.7% |
| Visual & Performing Arts | 4 | 1.1% |
| Communications | 20 | 5.7% |
| Arts & Humanities | 15 | 4.2% |
| Total | 354 | 100.0% |
Transportation & Commute in Maiden
Vehicle Availability by Sex in Maiden
The most prevalent vehicle ownership categories in Maiden are males with 2 vehicles (488, accounting for 43.5%) and females with 2 vehicles (328, making up 63.5%).
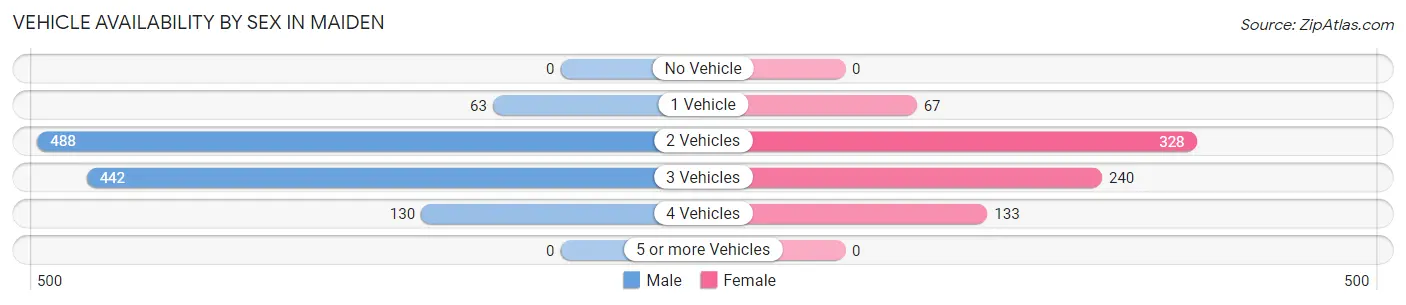
| Vehicles Available | Male | Female |
| No Vehicle | 0 (0.0%) | 0 (0.0%) |
| 1 Vehicle | 63 (5.6%) | 67 (8.7%) |
| 2 Vehicles | 488 (43.5%) | 328 (42.7%) |
| 3 Vehicles | 442 (39.4%) | 240 (31.2%) |
| 4 Vehicles | 130 (11.6%) | 133 (17.3%) |
| 5 or more Vehicles | 0 (0.0%) | 0 (0.0%) |
| Total | 1,123 (100.0%) | 768 (100.0%) |
Commute Time in Maiden
The most frequently occuring commute durations in Maiden are 20 to 24 minutes (518 commuters, 28.5%), 15 to 19 minutes (362 commuters, 19.9%), and 25 to 29 minutes (275 commuters, 15.1%).
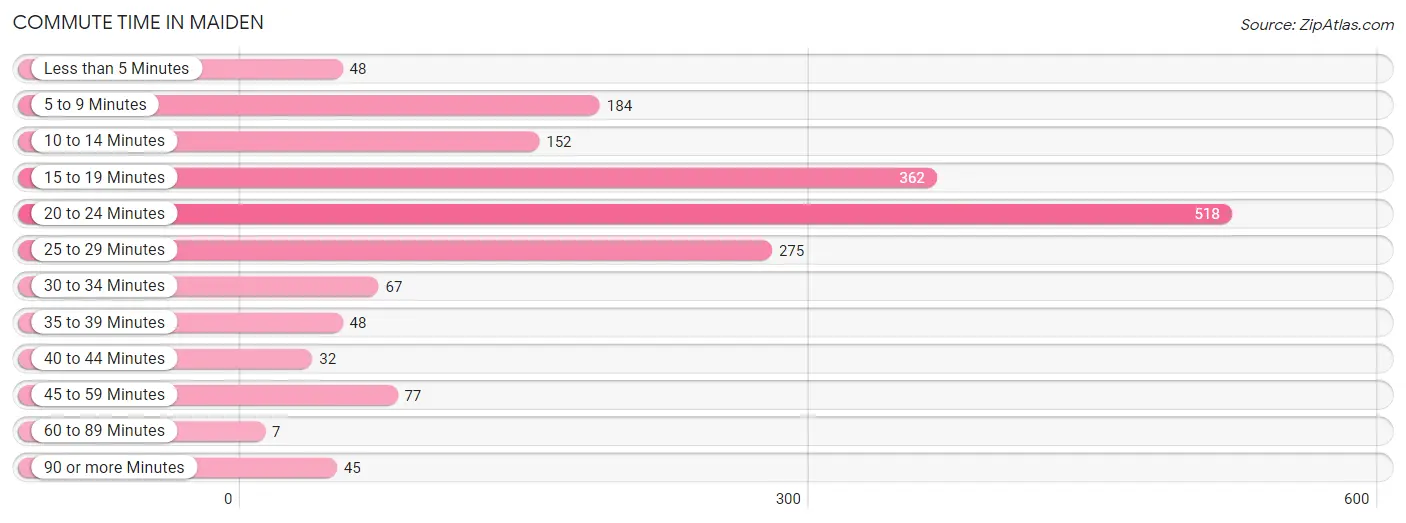
| Commute Time | # Commuters | % Commuters |
| Less than 5 Minutes | 48 | 2.6% |
| 5 to 9 Minutes | 184 | 10.1% |
| 10 to 14 Minutes | 152 | 8.4% |
| 15 to 19 Minutes | 362 | 19.9% |
| 20 to 24 Minutes | 518 | 28.5% |
| 25 to 29 Minutes | 275 | 15.1% |
| 30 to 34 Minutes | 67 | 3.7% |
| 35 to 39 Minutes | 48 | 2.6% |
| 40 to 44 Minutes | 32 | 1.8% |
| 45 to 59 Minutes | 77 | 4.2% |
| 60 to 89 Minutes | 7 | 0.4% |
| 90 or more Minutes | 45 | 2.5% |
Commute Time by Sex in Maiden
The most common commute times in Maiden are 20 to 24 minutes (389 commuters, 34.6%) for males and 15 to 19 minutes (288 commuters, 41.6%) for females.
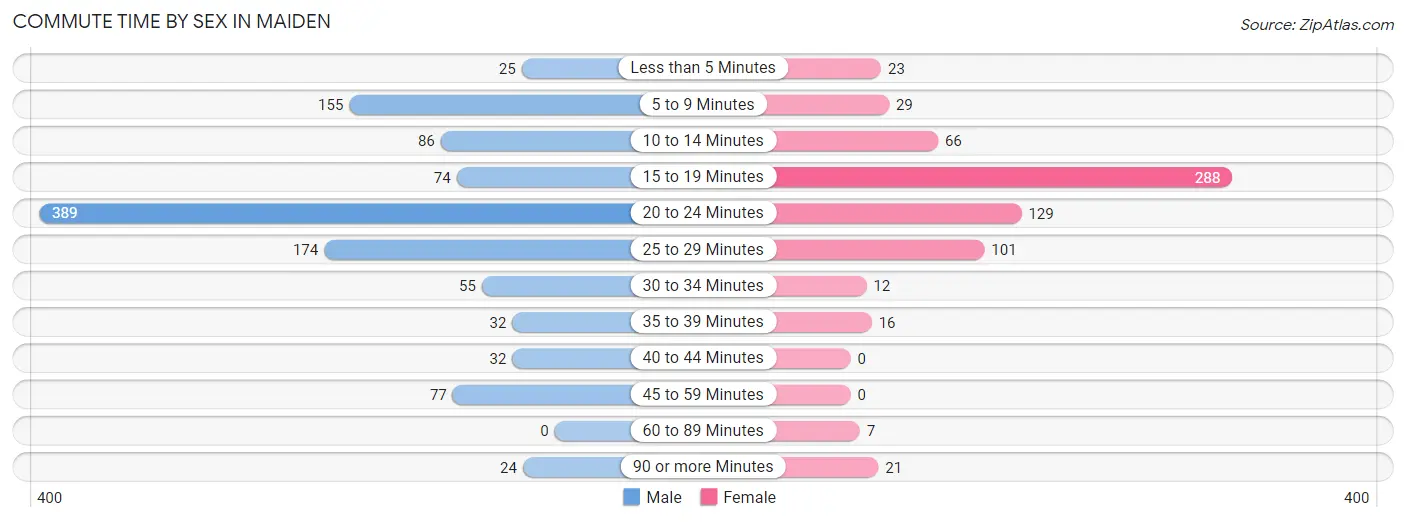
| Commute Time | Male | Female |
| Less than 5 Minutes | 25 (2.2%) | 23 (3.3%) |
| 5 to 9 Minutes | 155 (13.8%) | 29 (4.2%) |
| 10 to 14 Minutes | 86 (7.7%) | 66 (9.5%) |
| 15 to 19 Minutes | 74 (6.6%) | 288 (41.6%) |
| 20 to 24 Minutes | 389 (34.6%) | 129 (18.6%) |
| 25 to 29 Minutes | 174 (15.5%) | 101 (14.6%) |
| 30 to 34 Minutes | 55 (4.9%) | 12 (1.7%) |
| 35 to 39 Minutes | 32 (2.9%) | 16 (2.3%) |
| 40 to 44 Minutes | 32 (2.9%) | 0 (0.0%) |
| 45 to 59 Minutes | 77 (6.9%) | 0 (0.0%) |
| 60 to 89 Minutes | 0 (0.0%) | 7 (1.0%) |
| 90 or more Minutes | 24 (2.1%) | 21 (3.0%) |
Time of Departure to Work by Sex in Maiden
The most frequent times of departure to work in Maiden are 6:00 AM to 6:29 AM (254, 22.6%) for males and 10:00 AM to 10:59 AM (142, 20.5%) for females.
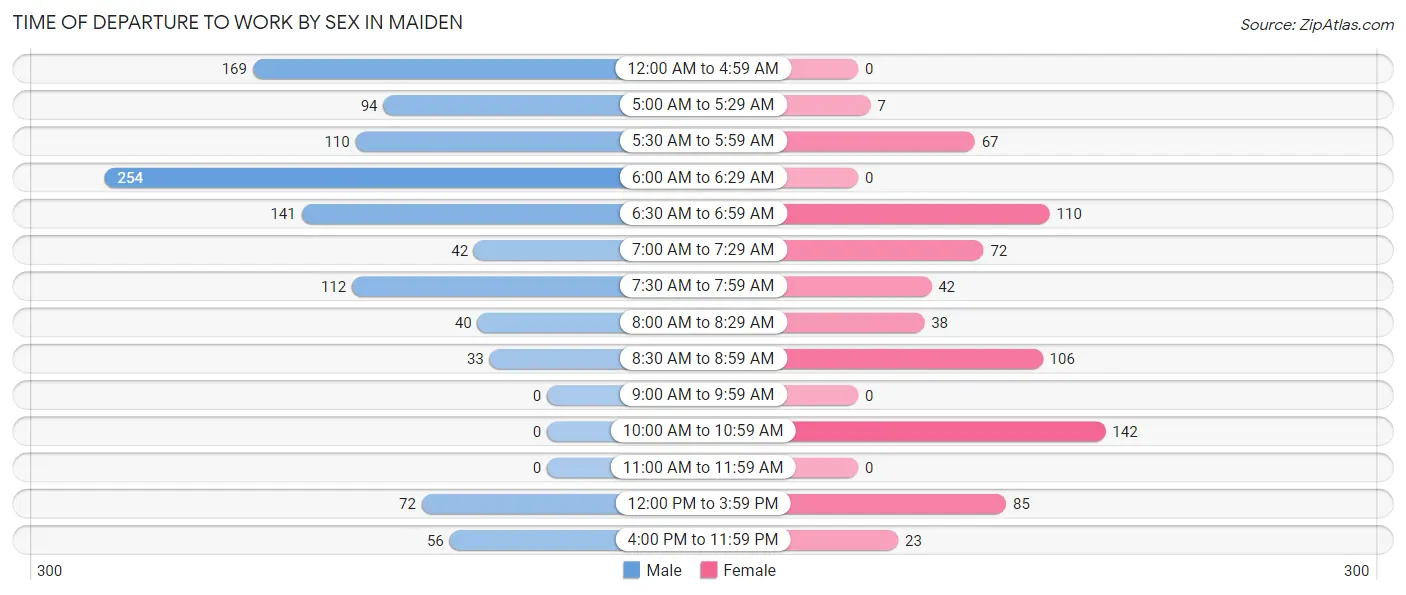
| Time of Departure | Male | Female |
| 12:00 AM to 4:59 AM | 169 (15.0%) | 0 (0.0%) |
| 5:00 AM to 5:29 AM | 94 (8.4%) | 7 (1.0%) |
| 5:30 AM to 5:59 AM | 110 (9.8%) | 67 (9.7%) |
| 6:00 AM to 6:29 AM | 254 (22.6%) | 0 (0.0%) |
| 6:30 AM to 6:59 AM | 141 (12.6%) | 110 (15.9%) |
| 7:00 AM to 7:29 AM | 42 (3.7%) | 72 (10.4%) |
| 7:30 AM to 7:59 AM | 112 (10.0%) | 42 (6.1%) |
| 8:00 AM to 8:29 AM | 40 (3.6%) | 38 (5.5%) |
| 8:30 AM to 8:59 AM | 33 (2.9%) | 106 (15.3%) |
| 9:00 AM to 9:59 AM | 0 (0.0%) | 0 (0.0%) |
| 10:00 AM to 10:59 AM | 0 (0.0%) | 142 (20.5%) |
| 11:00 AM to 11:59 AM | 0 (0.0%) | 0 (0.0%) |
| 12:00 PM to 3:59 PM | 72 (6.4%) | 85 (12.3%) |
| 4:00 PM to 11:59 PM | 56 (5.0%) | 23 (3.3%) |
| Total | 1,123 (100.0%) | 692 (100.0%) |
Housing Occupancy in Maiden
Occupancy by Ownership in Maiden
Of the total 1,401 dwellings in Maiden, owner-occupied units account for 1,056 (75.4%), while renter-occupied units make up 345 (24.6%).
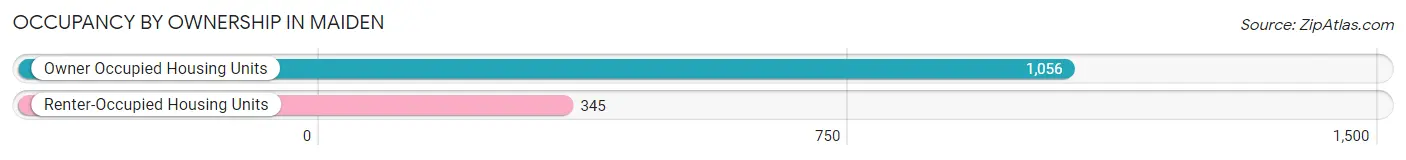
| Occupancy | # Housing Units | % Housing Units |
| Owner Occupied Housing Units | 1,056 | 75.4% |
| Renter-Occupied Housing Units | 345 | 24.6% |
| Total Occupied Housing Units | 1,401 | 100.0% |
Occupancy by Household Size in Maiden
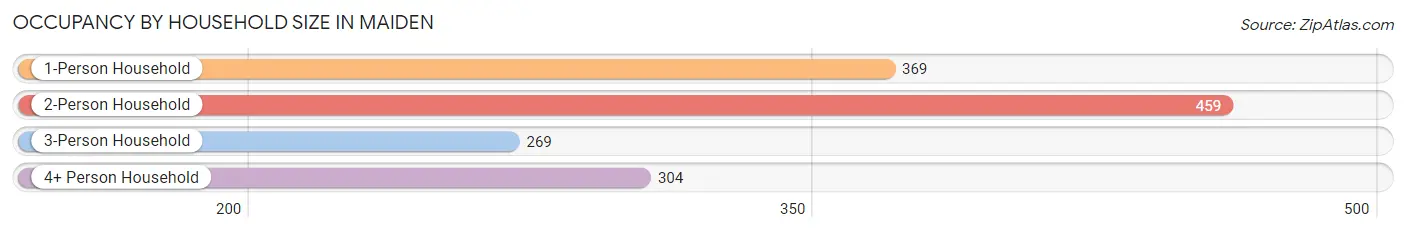
| Household Size | # Housing Units | % Housing Units |
| 1-Person Household | 369 | 26.3% |
| 2-Person Household | 459 | 32.8% |
| 3-Person Household | 269 | 19.2% |
| 4+ Person Household | 304 | 21.7% |
| Total Housing Units | 1,401 | 100.0% |
Occupancy by Ownership by Household Size in Maiden
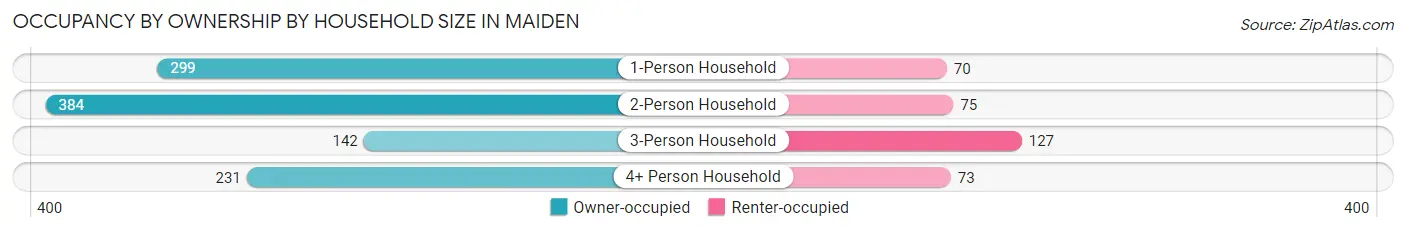
| Household Size | Owner-occupied | Renter-occupied |
| 1-Person Household | 299 (81.0%) | 70 (19.0%) |
| 2-Person Household | 384 (83.7%) | 75 (16.3%) |
| 3-Person Household | 142 (52.8%) | 127 (47.2%) |
| 4+ Person Household | 231 (76.0%) | 73 (24.0%) |
| Total Housing Units | 1,056 (75.4%) | 345 (24.6%) |
Occupancy by Educational Attainment in Maiden
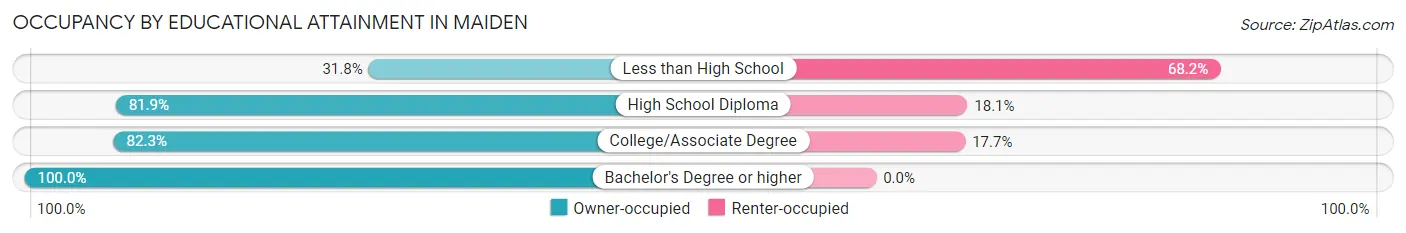
| Household Size | Owner-occupied | Renter-occupied |
| Less than High School | 84 (31.8%) | 180 (68.2%) |
| High School Diploma | 426 (81.9%) | 94 (18.1%) |
| College/Associate Degree | 331 (82.3%) | 71 (17.7%) |
| Bachelor's Degree or higher | 215 (100.0%) | 0 (0.0%) |
Occupancy by Age of Householder in Maiden
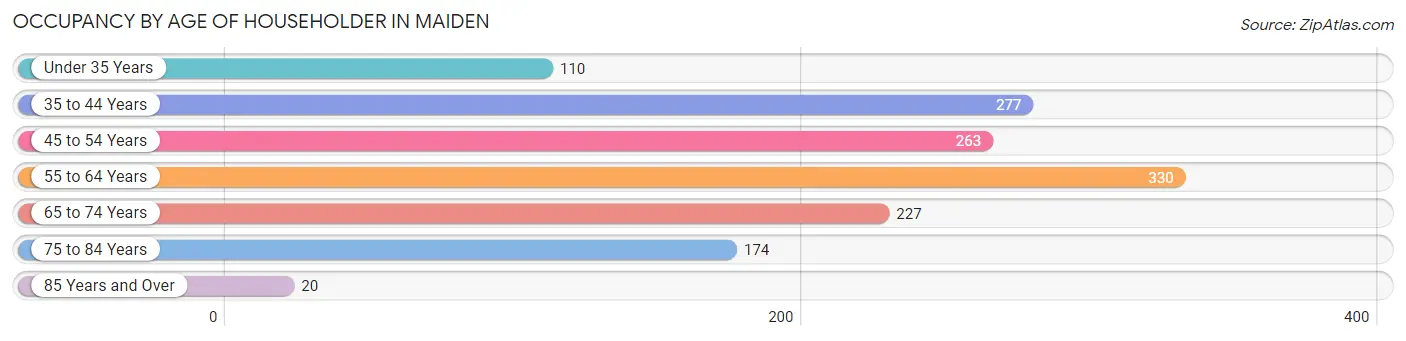
| Age Bracket | # Households | % Households |
| Under 35 Years | 110 | 7.9% |
| 35 to 44 Years | 277 | 19.8% |
| 45 to 54 Years | 263 | 18.8% |
| 55 to 64 Years | 330 | 23.5% |
| 65 to 74 Years | 227 | 16.2% |
| 75 to 84 Years | 174 | 12.4% |
| 85 Years and Over | 20 | 1.4% |
| Total | 1,401 | 100.0% |
Housing Finances in Maiden
Median Income by Occupancy in Maiden
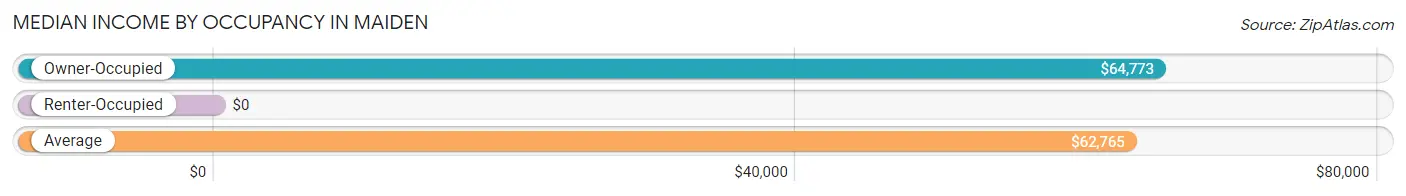
| Occupancy Type | # Households | Median Income |
| Owner-Occupied | 1,056 (75.4%) | $64,773 |
| Renter-Occupied | 345 (24.6%) | $0 |
| Average | 1,401 (100.0%) | $62,765 |
Occupancy by Householder Income Bracket in Maiden
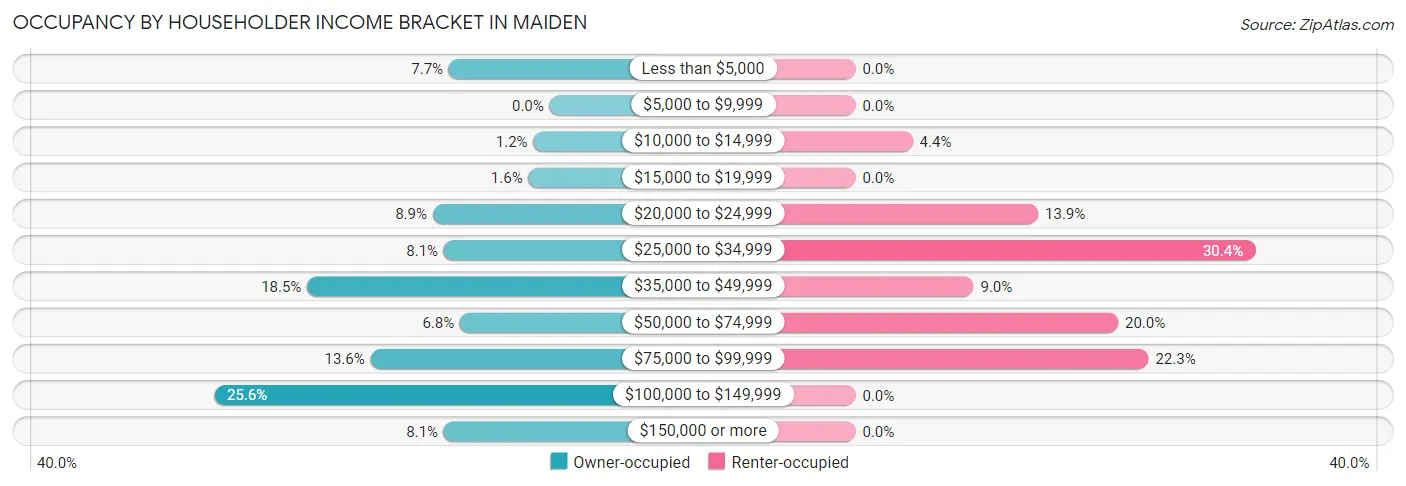
| Income Bracket | Owner-occupied | Renter-occupied |
| Less than $5,000 | 81 (7.7%) | 0 (0.0%) |
| $5,000 to $9,999 | 0 (0.0%) | 0 (0.0%) |
| $10,000 to $14,999 | 13 (1.2%) | 15 (4.3%) |
| $15,000 to $19,999 | 17 (1.6%) | 0 (0.0%) |
| $20,000 to $24,999 | 94 (8.9%) | 48 (13.9%) |
| $25,000 to $34,999 | 85 (8.1%) | 105 (30.4%) |
| $35,000 to $49,999 | 195 (18.5%) | 31 (9.0%) |
| $50,000 to $74,999 | 72 (6.8%) | 69 (20.0%) |
| $75,000 to $99,999 | 144 (13.6%) | 77 (22.3%) |
| $100,000 to $149,999 | 270 (25.6%) | 0 (0.0%) |
| $150,000 or more | 85 (8.1%) | 0 (0.0%) |
| Total | 1,056 (100.0%) | 345 (100.0%) |
Monthly Housing Cost Tiers in Maiden
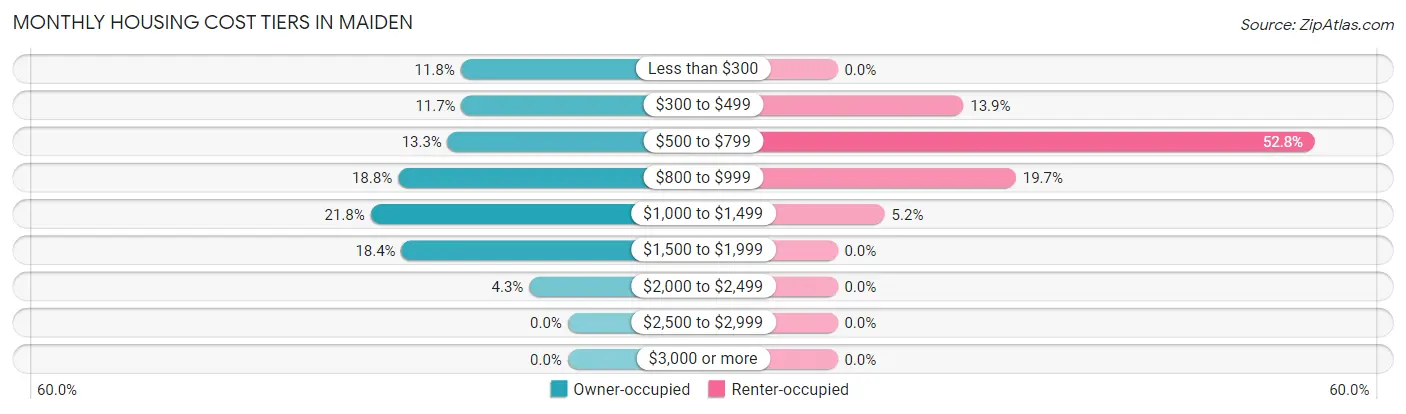
| Monthly Cost | Owner-occupied | Renter-occupied |
| Less than $300 | 125 (11.8%) | 0 (0.0%) |
| $300 to $499 | 124 (11.7%) | 48 (13.9%) |
| $500 to $799 | 140 (13.3%) | 182 (52.7%) |
| $800 to $999 | 198 (18.8%) | 68 (19.7%) |
| $1,000 to $1,499 | 230 (21.8%) | 18 (5.2%) |
| $1,500 to $1,999 | 194 (18.4%) | 0 (0.0%) |
| $2,000 to $2,499 | 45 (4.3%) | 0 (0.0%) |
| $2,500 to $2,999 | 0 (0.0%) | 0 (0.0%) |
| $3,000 or more | 0 (0.0%) | 0 (0.0%) |
| Total | 1,056 (100.0%) | 345 (100.0%) |
Physical Housing Characteristics in Maiden
Housing Structures in Maiden
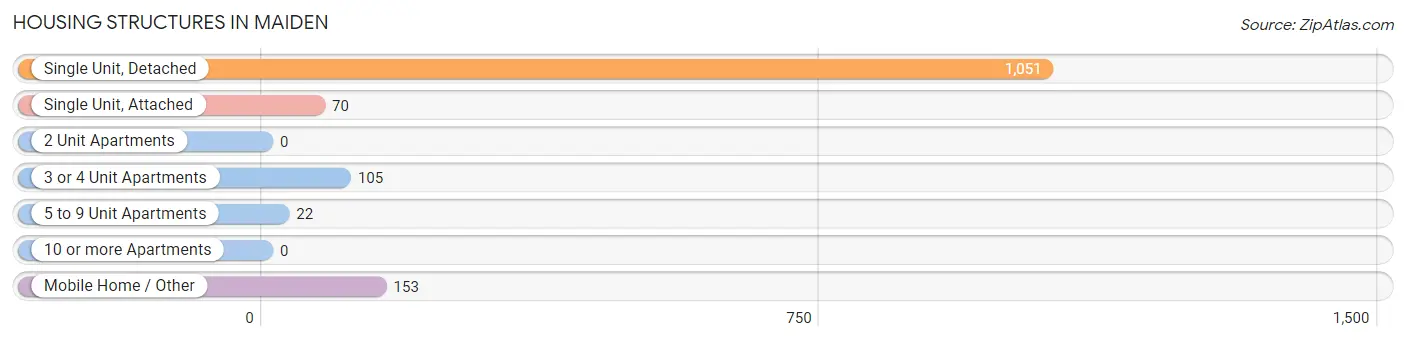
| Structure Type | # Housing Units | % Housing Units |
| Single Unit, Detached | 1,051 | 75.0% |
| Single Unit, Attached | 70 | 5.0% |
| 2 Unit Apartments | 0 | 0.0% |
| 3 or 4 Unit Apartments | 105 | 7.5% |
| 5 to 9 Unit Apartments | 22 | 1.6% |
| 10 or more Apartments | 0 | 0.0% |
| Mobile Home / Other | 153 | 10.9% |
| Total | 1,401 | 100.0% |
Housing Structures by Occupancy in Maiden
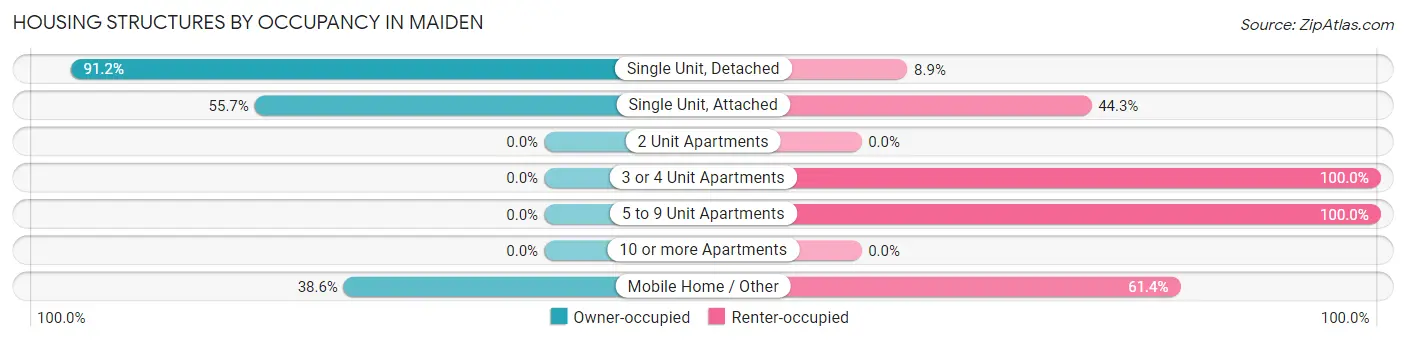
| Structure Type | Owner-occupied | Renter-occupied |
| Single Unit, Detached | 958 (91.1%) | 93 (8.8%) |
| Single Unit, Attached | 39 (55.7%) | 31 (44.3%) |
| 2 Unit Apartments | 0 (0.0%) | 0 (0.0%) |
| 3 or 4 Unit Apartments | 0 (0.0%) | 105 (100.0%) |
| 5 to 9 Unit Apartments | 0 (0.0%) | 22 (100.0%) |
| 10 or more Apartments | 0 (0.0%) | 0 (0.0%) |
| Mobile Home / Other | 59 (38.6%) | 94 (61.4%) |
| Total | 1,056 (75.4%) | 345 (24.6%) |
Housing Structures by Number of Rooms in Maiden
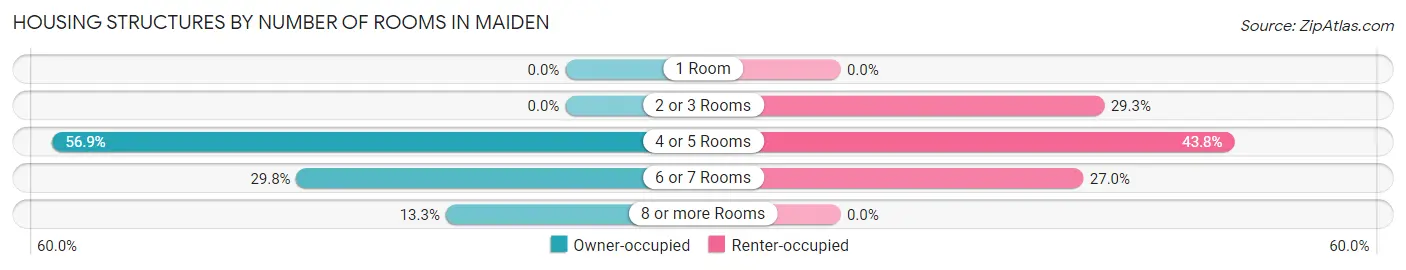
| Number of Rooms | Owner-occupied | Renter-occupied |
| 1 Room | 0 (0.0%) | 0 (0.0%) |
| 2 or 3 Rooms | 0 (0.0%) | 101 (29.3%) |
| 4 or 5 Rooms | 601 (56.9%) | 151 (43.8%) |
| 6 or 7 Rooms | 315 (29.8%) | 93 (27.0%) |
| 8 or more Rooms | 140 (13.3%) | 0 (0.0%) |
| Total | 1,056 (100.0%) | 345 (100.0%) |
Housing Structure by Heating Type in Maiden
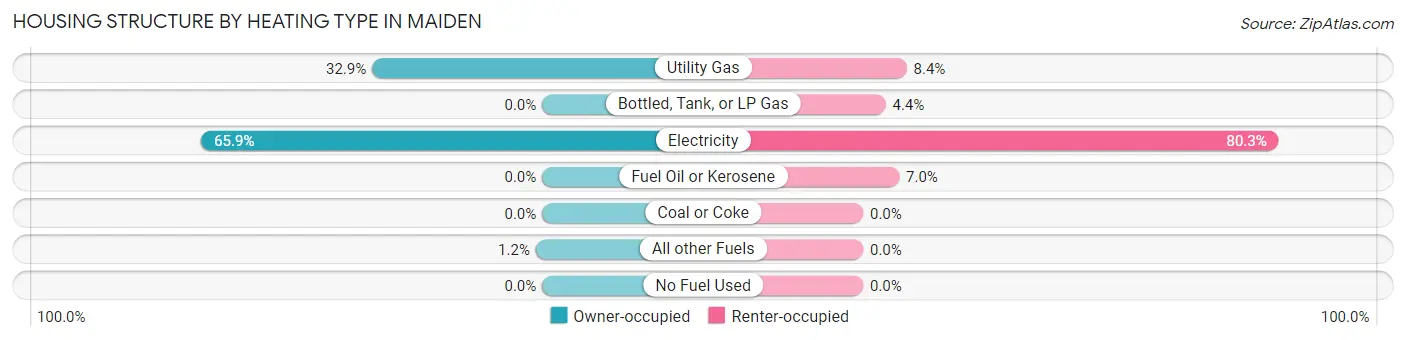
| Heating Type | Owner-occupied | Renter-occupied |
| Utility Gas | 347 (32.9%) | 29 (8.4%) |
| Bottled, Tank, or LP Gas | 0 (0.0%) | 15 (4.3%) |
| Electricity | 696 (65.9%) | 277 (80.3%) |
| Fuel Oil or Kerosene | 0 (0.0%) | 24 (7.0%) |
| Coal or Coke | 0 (0.0%) | 0 (0.0%) |
| All other Fuels | 13 (1.2%) | 0 (0.0%) |
| No Fuel Used | 0 (0.0%) | 0 (0.0%) |
| Total | 1,056 (100.0%) | 345 (100.0%) |
Household Vehicle Usage in Maiden
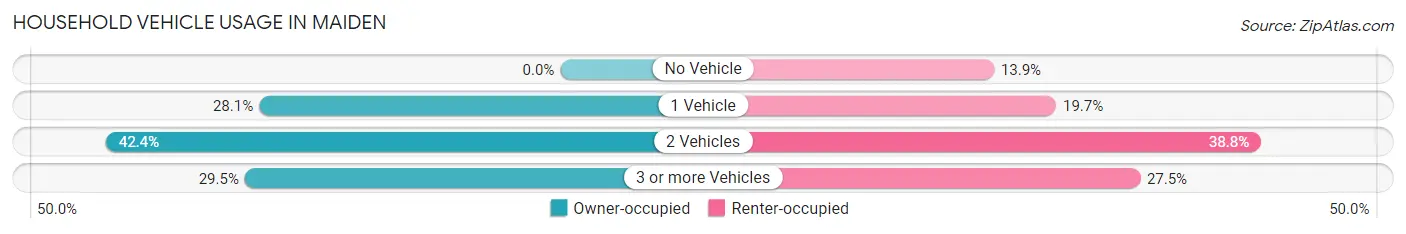
| Vehicles per Household | Owner-occupied | Renter-occupied |
| No Vehicle | 0 (0.0%) | 48 (13.9%) |
| 1 Vehicle | 297 (28.1%) | 68 (19.7%) |
| 2 Vehicles | 448 (42.4%) | 134 (38.8%) |
| 3 or more Vehicles | 311 (29.4%) | 95 (27.5%) |
| Total | 1,056 (100.0%) | 345 (100.0%) |
Real Estate & Mortgages in Maiden
Real Estate and Mortgage Overview in Maiden
| Characteristic | Without Mortgage | With Mortgage |
| Housing Units | 323 | 733 |
| Median Property Value | $152,200 | $209,900 |
| Median Household Income | $38,361 | $64 |
| Monthly Housing Costs | $365 | $0 |
| Real Estate Taxes | $1,072 | $0 |
Property Value by Mortgage Status in Maiden
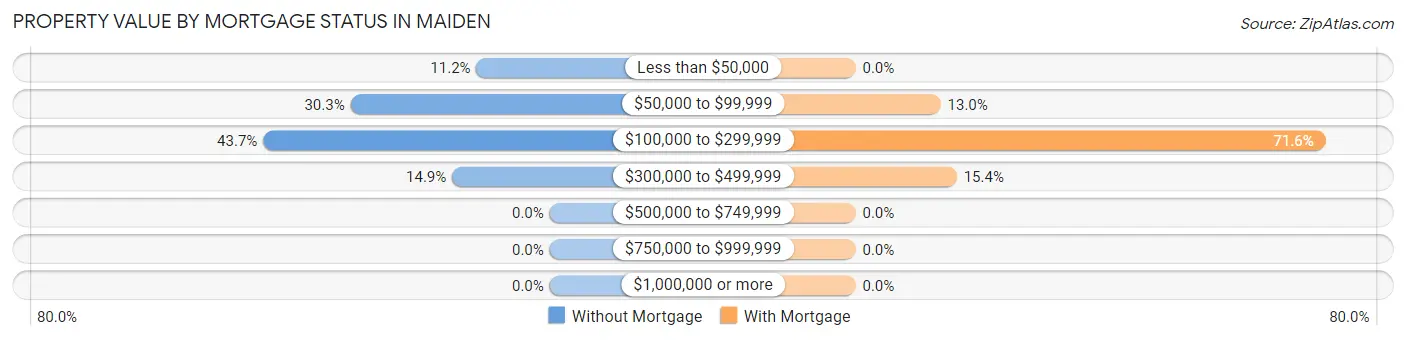
| Property Value | Without Mortgage | With Mortgage |
| Less than $50,000 | 36 (11.2%) | 0 (0.0%) |
| $50,000 to $99,999 | 98 (30.3%) | 95 (13.0%) |
| $100,000 to $299,999 | 141 (43.6%) | 525 (71.6%) |
| $300,000 to $499,999 | 48 (14.9%) | 113 (15.4%) |
| $500,000 to $749,999 | 0 (0.0%) | 0 (0.0%) |
| $750,000 to $999,999 | 0 (0.0%) | 0 (0.0%) |
| $1,000,000 or more | 0 (0.0%) | 0 (0.0%) |
| Total | 323 (100.0%) | 733 (100.0%) |
Household Income by Mortgage Status in Maiden
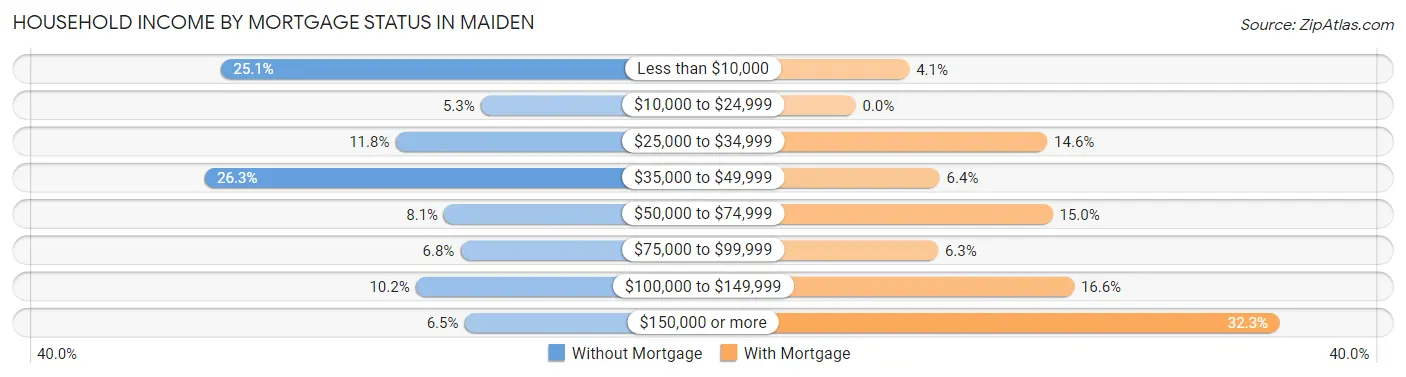
| Household Income | Without Mortgage | With Mortgage |
| Less than $10,000 | 81 (25.1%) | 30 (4.1%) |
| $10,000 to $24,999 | 17 (5.3%) | 0 (0.0%) |
| $25,000 to $34,999 | 38 (11.8%) | 107 (14.6%) |
| $35,000 to $49,999 | 85 (26.3%) | 47 (6.4%) |
| $50,000 to $74,999 | 26 (8.1%) | 110 (15.0%) |
| $75,000 to $99,999 | 22 (6.8%) | 46 (6.3%) |
| $100,000 to $149,999 | 33 (10.2%) | 122 (16.6%) |
| $150,000 or more | 21 (6.5%) | 237 (32.3%) |
| Total | 323 (100.0%) | 733 (100.0%) |
Property Value to Household Income Ratio in Maiden
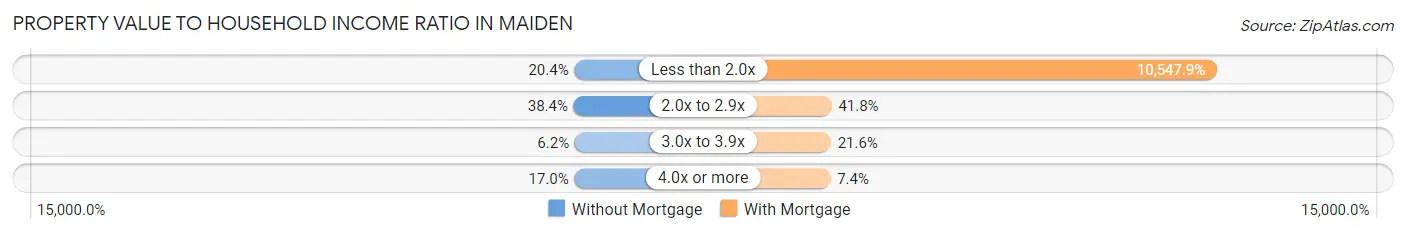
| Value-to-Income Ratio | Without Mortgage | With Mortgage |
| Less than 2.0x | 66 (20.4%) | 77,316 (10,547.9%) |
| 2.0x to 2.9x | 124 (38.4%) | 306 (41.7%) |
| 3.0x to 3.9x | 20 (6.2%) | 158 (21.6%) |
| 4.0x or more | 55 (17.0%) | 54 (7.4%) |
| Total | 323 (100.0%) | 733 (100.0%) |
Real Estate Taxes by Mortgage Status in Maiden
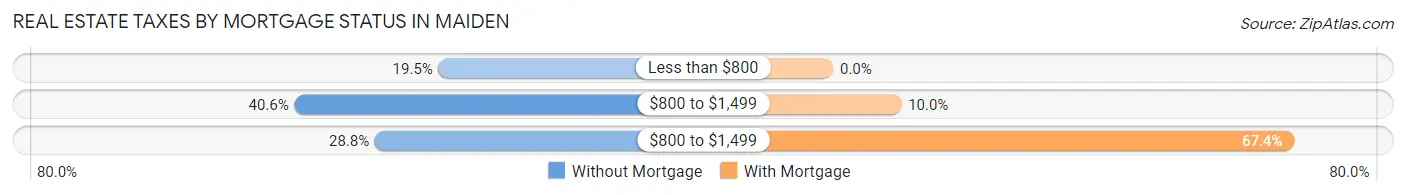
| Property Taxes | Without Mortgage | With Mortgage |
| Less than $800 | 63 (19.5%) | 0 (0.0%) |
| $800 to $1,499 | 131 (40.6%) | 73 (10.0%) |
| $800 to $1,499 | 93 (28.8%) | 494 (67.4%) |
| Total | 323 (100.0%) | 733 (100.0%) |
Health & Disability in Maiden
Health Insurance Coverage by Age in Maiden
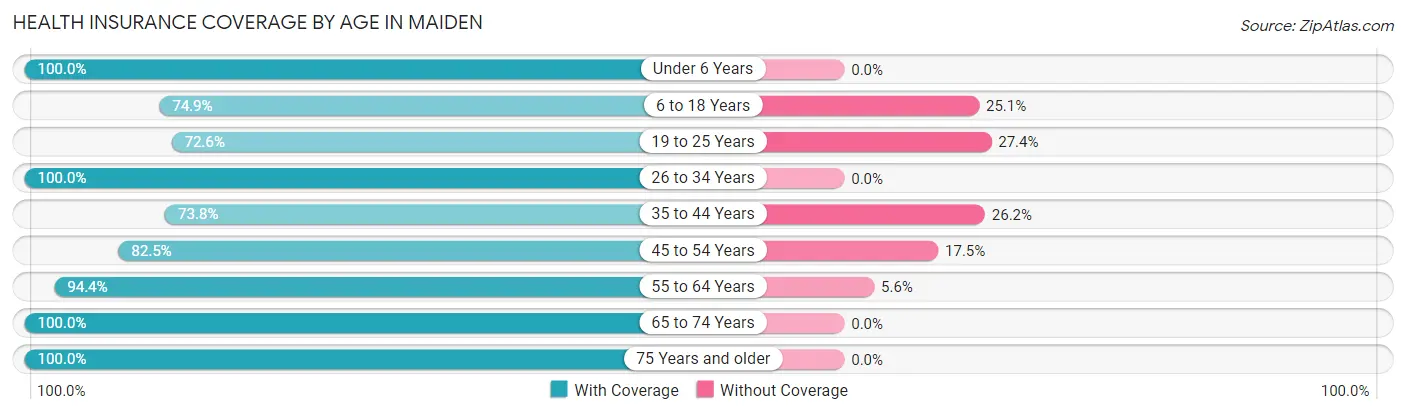
| Age Bracket | With Coverage | Without Coverage |
| Under 6 Years | 93 (100.0%) | 0 (0.0%) |
| 6 to 18 Years | 417 (74.9%) | 140 (25.1%) |
| 19 to 25 Years | 98 (72.6%) | 37 (27.4%) |
| 26 to 34 Years | 262 (100.0%) | 0 (0.0%) |
| 35 to 44 Years | 428 (73.8%) | 152 (26.2%) |
| 45 to 54 Years | 429 (82.5%) | 91 (17.5%) |
| 55 to 64 Years | 612 (94.4%) | 36 (5.6%) |
| 65 to 74 Years | 357 (100.0%) | 0 (0.0%) |
| 75 Years and older | 248 (100.0%) | 0 (0.0%) |
| Total | 2,944 (86.6%) | 456 (13.4%) |
Health Insurance Coverage by Citizenship Status in Maiden
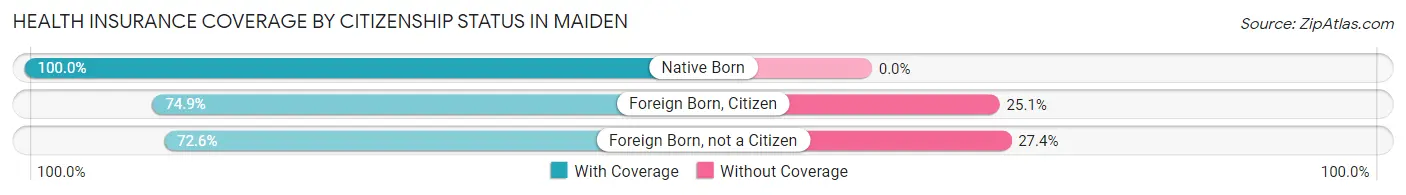
| Citizenship Status | With Coverage | Without Coverage |
| Native Born | 93 (100.0%) | 0 (0.0%) |
| Foreign Born, Citizen | 417 (74.9%) | 140 (25.1%) |
| Foreign Born, not a Citizen | 98 (72.6%) | 37 (27.4%) |
Health Insurance Coverage by Household Income in Maiden
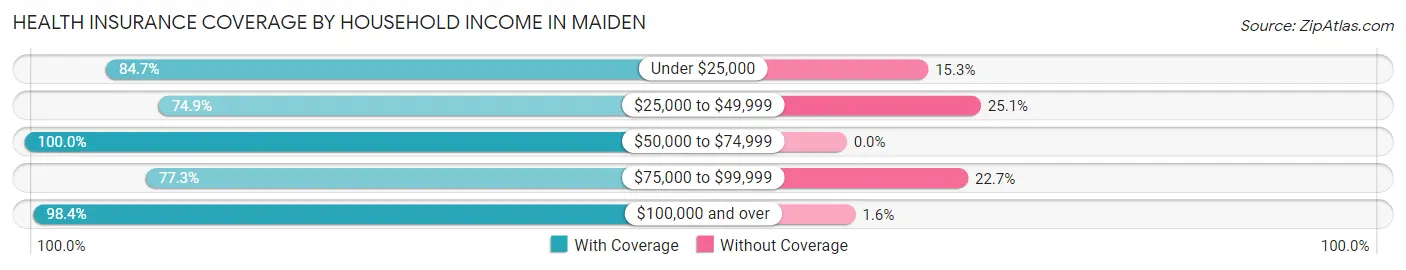
| Household Income | With Coverage | Without Coverage |
| Under $25,000 | 272 (84.7%) | 49 (15.3%) |
| $25,000 to $49,999 | 700 (74.9%) | 235 (25.1%) |
| $50,000 to $74,999 | 358 (100.0%) | 0 (0.0%) |
| $75,000 to $99,999 | 524 (77.3%) | 154 (22.7%) |
| $100,000 and over | 1,086 (98.4%) | 18 (1.6%) |
Public vs Private Health Insurance Coverage by Age in Maiden
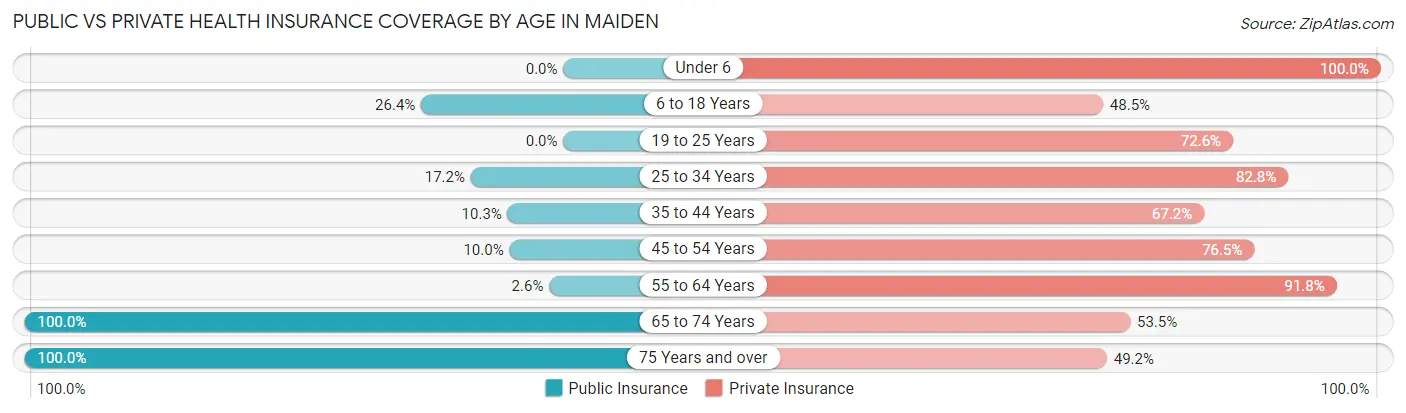
| Age Bracket | Public Insurance | Private Insurance |
| Under 6 | 0 (0.0%) | 93 (100.0%) |
| 6 to 18 Years | 147 (26.4%) | 270 (48.5%) |
| 19 to 25 Years | 0 (0.0%) | 98 (72.6%) |
| 25 to 34 Years | 45 (17.2%) | 217 (82.8%) |
| 35 to 44 Years | 60 (10.3%) | 390 (67.2%) |
| 45 to 54 Years | 52 (10.0%) | 398 (76.5%) |
| 55 to 64 Years | 17 (2.6%) | 595 (91.8%) |
| 65 to 74 Years | 357 (100.0%) | 191 (53.5%) |
| 75 Years and over | 248 (100.0%) | 122 (49.2%) |
| Total | 926 (27.2%) | 2,374 (69.8%) |
Disability Status by Sex by Age in Maiden
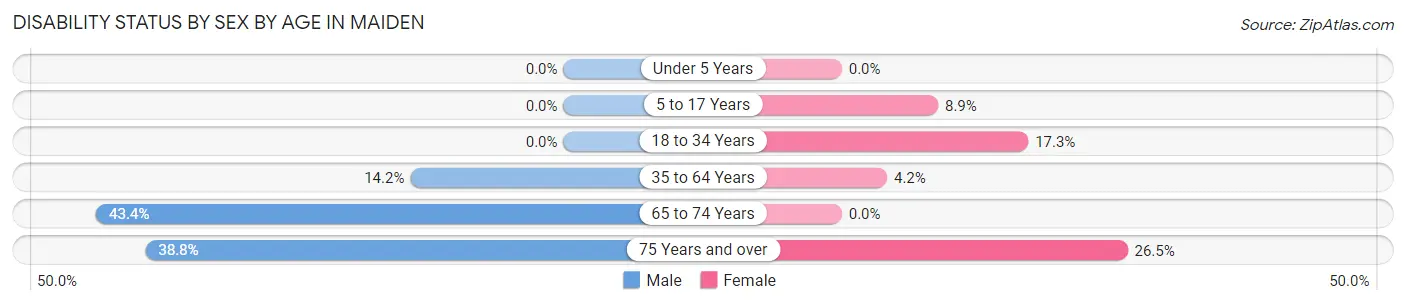
| Age Bracket | Male | Female |
| Under 5 Years | 0 (0.0%) | 0 (0.0%) |
| 5 to 17 Years | 0 (0.0%) | 36 (8.9%) |
| 18 to 34 Years | 0 (0.0%) | 32 (17.3%) |
| 35 to 64 Years | 130 (14.2%) | 35 (4.2%) |
| 65 to 74 Years | 62 (43.4%) | 0 (0.0%) |
| 75 Years and over | 45 (38.8%) | 35 (26.5%) |
Disability Class by Sex by Age in Maiden
Disability Class: Hearing Difficulty
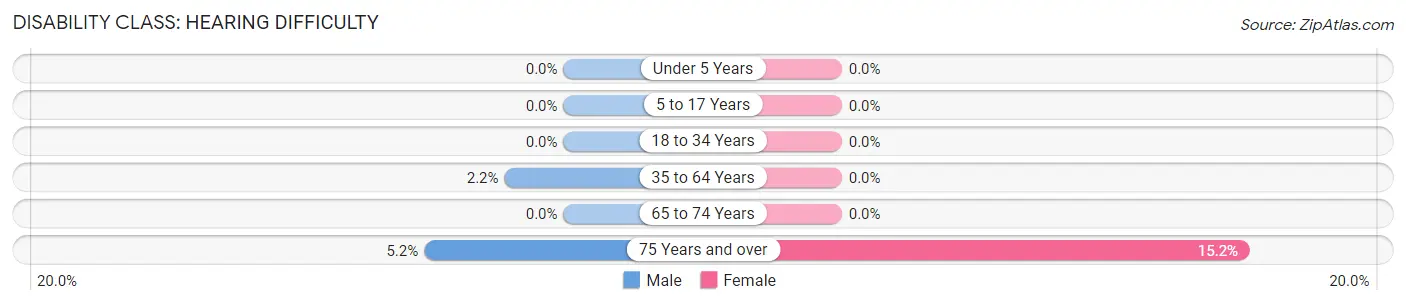
| Age Bracket | Male | Female |
| Under 5 Years | 0 (0.0%) | 0 (0.0%) |
| 5 to 17 Years | 0 (0.0%) | 0 (0.0%) |
| 18 to 34 Years | 0 (0.0%) | 0 (0.0%) |
| 35 to 64 Years | 20 (2.2%) | 0 (0.0%) |
| 65 to 74 Years | 0 (0.0%) | 0 (0.0%) |
| 75 Years and over | 6 (5.2%) | 20 (15.1%) |
Disability Class: Vision Difficulty
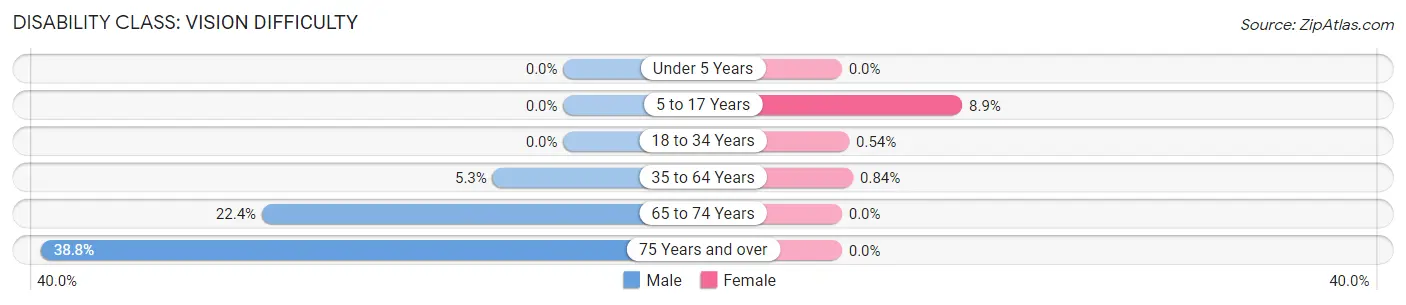
| Age Bracket | Male | Female |
| Under 5 Years | 0 (0.0%) | 0 (0.0%) |
| 5 to 17 Years | 0 (0.0%) | 36 (8.9%) |
| 18 to 34 Years | 0 (0.0%) | 1 (0.5%) |
| 35 to 64 Years | 48 (5.2%) | 7 (0.8%) |
| 65 to 74 Years | 32 (22.4%) | 0 (0.0%) |
| 75 Years and over | 45 (38.8%) | 0 (0.0%) |
Disability Class: Cognitive Difficulty
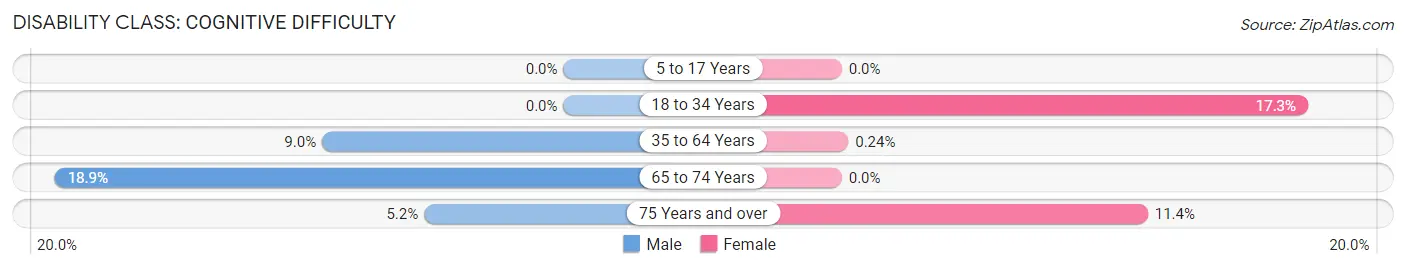
| Age Bracket | Male | Female |
| 5 to 17 Years | 0 (0.0%) | 0 (0.0%) |
| 18 to 34 Years | 0 (0.0%) | 32 (17.3%) |
| 35 to 64 Years | 82 (9.0%) | 2 (0.2%) |
| 65 to 74 Years | 27 (18.9%) | 0 (0.0%) |
| 75 Years and over | 6 (5.2%) | 15 (11.4%) |
Disability Class: Ambulatory Difficulty
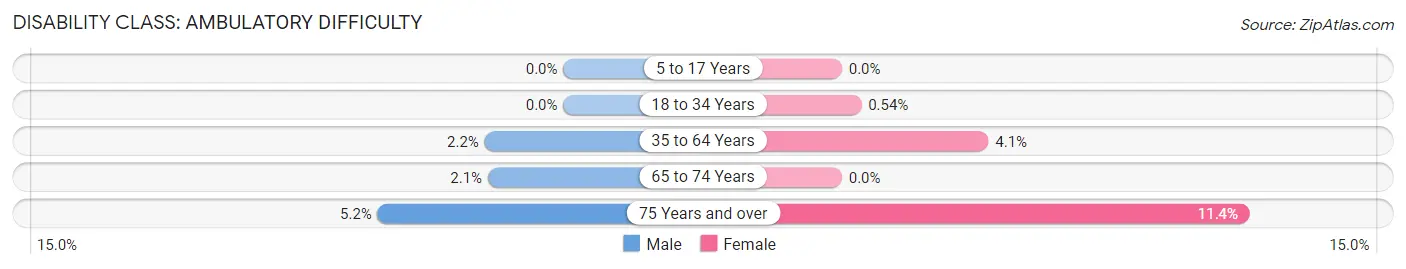
| Age Bracket | Male | Female |
| 5 to 17 Years | 0 (0.0%) | 0 (0.0%) |
| 18 to 34 Years | 0 (0.0%) | 1 (0.5%) |
| 35 to 64 Years | 20 (2.2%) | 34 (4.1%) |
| 65 to 74 Years | 3 (2.1%) | 0 (0.0%) |
| 75 Years and over | 6 (5.2%) | 15 (11.4%) |
Disability Class: Self-Care Difficulty
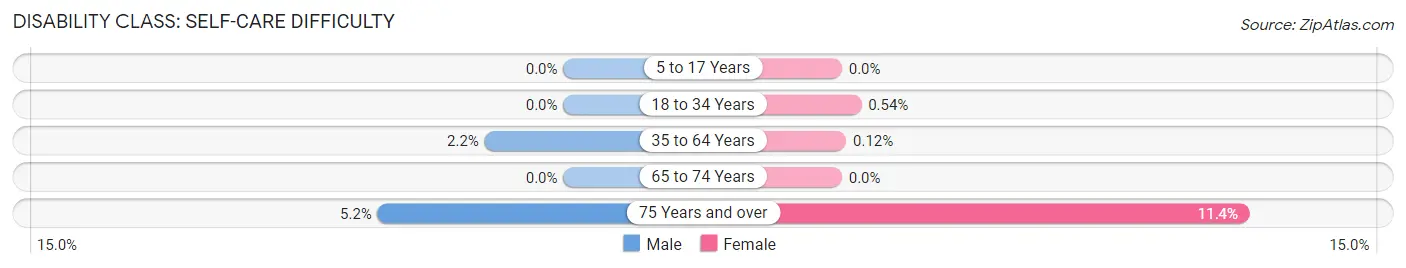
| Age Bracket | Male | Female |
| 5 to 17 Years | 0 (0.0%) | 0 (0.0%) |
| 18 to 34 Years | 0 (0.0%) | 1 (0.5%) |
| 35 to 64 Years | 20 (2.2%) | 1 (0.1%) |
| 65 to 74 Years | 0 (0.0%) | 0 (0.0%) |
| 75 Years and over | 6 (5.2%) | 15 (11.4%) |
Technology Access in Maiden
Computing Device Access in Maiden
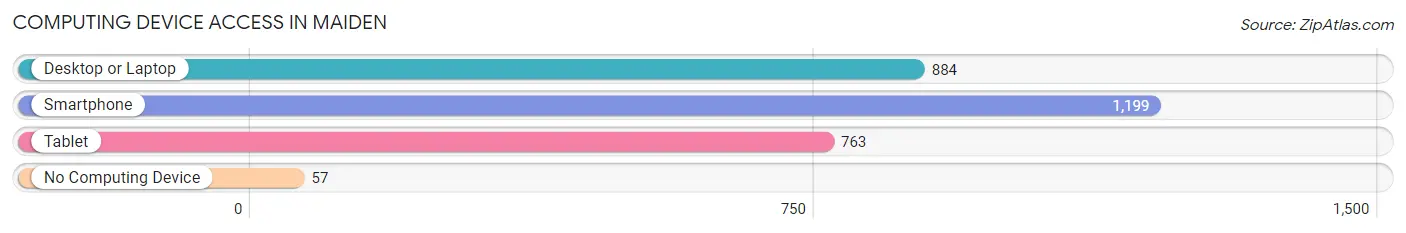
| Device Type | # Households | % Households |
| Desktop or Laptop | 884 | 63.1% |
| Smartphone | 1,199 | 85.6% |
| Tablet | 763 | 54.5% |
| No Computing Device | 57 | 4.1% |
| Total | 1,401 | 100.0% |
Internet Access in Maiden
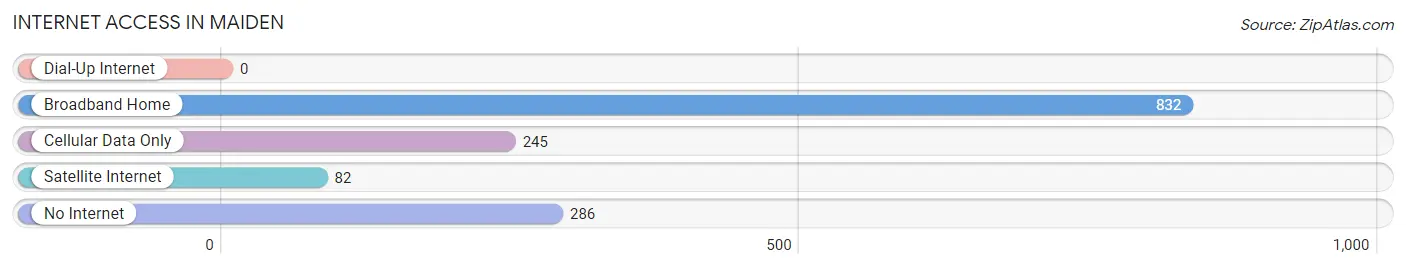
| Internet Type | # Households | % Households |
| Dial-Up Internet | 0 | 0.0% |
| Broadband Home | 832 | 59.4% |
| Cellular Data Only | 245 | 17.5% |
| Satellite Internet | 82 | 5.9% |
| No Internet | 286 | 20.4% |
| Total | 1,401 | 100.0% |
Maiden Summary
Maiden is a small town located in Catawba County, North Carolina. It is situated in the foothills of the Blue Ridge Mountains, about 25 miles northwest of Charlotte. The town has a population of approximately 3,500 people and is known for its small-town charm and friendly atmosphere.
Geography
Maiden is located in the foothills of the Blue Ridge Mountains, about 25 miles northwest of Charlotte. The town is situated on the Catawba River, which provides a scenic backdrop for the town. The town is surrounded by rolling hills and lush forests, making it a popular destination for outdoor activities such as hiking, camping, and fishing.
The climate in Maiden is mild and humid, with temperatures ranging from the mid-50s in the winter to the mid-80s in the summer. The town receives an average of 48 inches of rain per year, with most of the precipitation occurring in the spring and summer months.
Economy
Maiden’s economy is largely based on agriculture and manufacturing. The town is home to several large farms, which produce a variety of crops such as corn, soybeans, and tobacco. The town also has several manufacturing plants, which produce a variety of products such as furniture, textiles, and automotive parts.
The town is also home to several small businesses, including restaurants, shops, and services. The town is also home to a number of tourist attractions, such as the Catawba River, the Catawba Valley Railroad, and the Catawba Valley Museum.
Demographics
As of the 2010 census, the population of Maiden was 3,521. The racial makeup of the town was 87.3% White, 8.2% African American, 0.3% Native American, 0.7% Asian, 0.1% Pacific Islander, and 2.4% from other races. The median household income was $35,945, and the median family income was $41,944.
The town is served by the Catawba County School System, which includes two elementary schools, one middle school, and one high school. The town is also home to a number of churches, including Baptist, Methodist, and Presbyterian.
Conclusion
Maiden is a small town located in Catawba County, North Carolina. It is situated in the foothills of the Blue Ridge Mountains, about 25 miles northwest of Charlotte. The town has a population of approximately 3,500 people and is known for its small-town charm and friendly atmosphere. The town’s economy is largely based on agriculture and manufacturing, and the town is home to several tourist attractions. The town is served by the Catawba County School System, and is home to a number of churches. Maiden is a great place to live, work, and play, and is a great example of small-town life in North Carolina.
Common Questions
What is Per Capita Income in Maiden?
Per Capita income in Maiden is $28,735.
What is the Median Family Income in Maiden?
Median Family Income in Maiden is $75,226.
What is the Median Household income in Maiden?
Median Household Income in Maiden is $62,765.
What is Income or Wage Gap in Maiden?
Income or Wage Gap in Maiden is 10.5%.
Women in Maiden earn 89.5 cents for every dollar earned by a man.
What is Inequality or Gini Index in Maiden?
Inequality or Gini Index in Maiden is 0.42.
What is the Total Population of Maiden?
Total Population of Maiden is 3,727.
What is the Total Male Population of Maiden?
Total Male Population of Maiden is 1,902.
What is the Total Female Population of Maiden?
Total Female Population of Maiden is 1,825.
What is the Ratio of Males per 100 Females in Maiden?
There are 104.22 Males per 100 Females in Maiden.
What is the Ratio of Females per 100 Males in Maiden?
There are 95.95 Females per 100 Males in Maiden.
What is the Median Population Age in Maiden?
Median Population Age in Maiden is 45.1 Years.
What is the Average Family Size in Maiden
Average Family Size in Maiden is 2.9 People.
What is the Average Household Size in Maiden
Average Household Size in Maiden is 2.4 People.
How Large is the Labor Force in Maiden?
There are 2,008 People in the Labor Forcein in Maiden.
What is the Percentage of People in the Labor Force in Maiden?
61.8% of People are in the Labor Force in Maiden.
What is the Unemployment Rate in Maiden?
Unemployment Rate in Maiden is 4.2%.