Ruffin, NC Map & Demographics
Ruffin Map
Ruffin Overview
$41,726
PER CAPITA INCOME
22.4%
WAGE / INCOME GAP [ % ]
77.6¢/ $1
WAGE / INCOME GAP [ $ ]
0.39
INEQUALITY / GINI INDEX
437
TOTAL POPULATION
216
MALE POPULATION
221
FEMALE POPULATION
97.74
MALES / 100 FEMALES
102.31
FEMALES / 100 MALES
38.2
MEDIAN AGE
2.1
AVG FAMILY SIZE
2.0
AVG HOUSEHOLD SIZE
257
LABOR FORCE [ PEOPLE ]
72.6%
PERCENT IN LABOR FORCE
5.8%
UNEMPLOYMENT RATE
Ruffin Zip Codes
Ruffin Area Codes
Income in Ruffin
Income Overview in Ruffin
| Characteristic | Number | Measure |
| Per Capita Income | 437 | $41,726 |
| Median Family Income | 197 | $0 |
| Mean Family Income | 197 | $101,663 |
| Median Household Income | 216 | $0 |
| Mean Household Income | 216 | $94,272 |
| Income Deficit | 197 | $0 |
| Wage / Income Gap (%) | 437 | 22.44% |
| Wage / Income Gap ($) | 437 | 77.56¢ per $1 |
| Gini / Inequality Index | 437 | 0.39 |
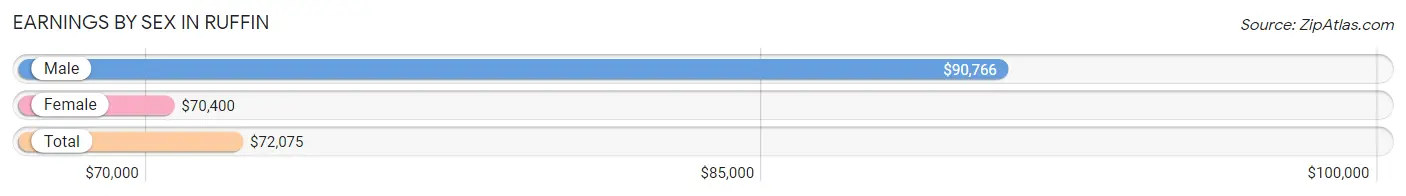
Earnings by Sex in Ruffin
Average Earnings in Ruffin are $72,075, $90,766 for men and $70,400 for women, a difference of 22.4%.
| Sex | Number | Average Earnings |
| Male | 133 (52.2%) | $90,766 |
| Female | 122 (47.8%) | $70,400 |
| Total | 255 (100.0%) | $72,075 |
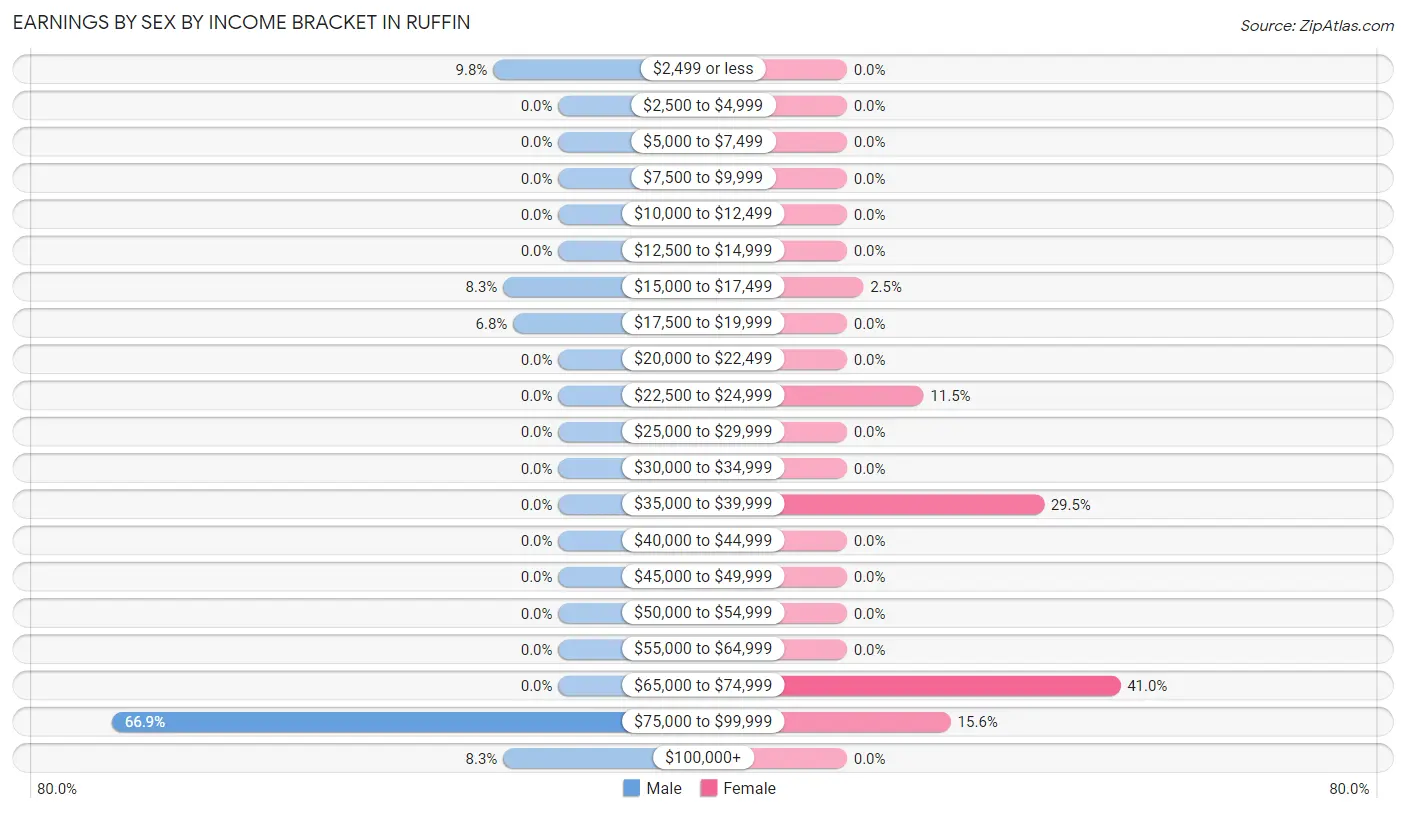
Earnings by Sex by Income Bracket in Ruffin
The most common earnings brackets in Ruffin are $75,000 to $99,999 for men (89 | 66.9%) and $65,000 to $74,999 for women (50 | 41.0%).
| Income | Male | Female |
| $2,499 or less | 13 (9.8%) | 0 (0.0%) |
| $2,500 to $4,999 | 0 (0.0%) | 0 (0.0%) |
| $5,000 to $7,499 | 0 (0.0%) | 0 (0.0%) |
| $7,500 to $9,999 | 0 (0.0%) | 0 (0.0%) |
| $10,000 to $12,499 | 0 (0.0%) | 0 (0.0%) |
| $12,500 to $14,999 | 0 (0.0%) | 0 (0.0%) |
| $15,000 to $17,499 | 11 (8.3%) | 3 (2.5%) |
| $17,500 to $19,999 | 9 (6.8%) | 0 (0.0%) |
| $20,000 to $22,499 | 0 (0.0%) | 0 (0.0%) |
| $22,500 to $24,999 | 0 (0.0%) | 14 (11.5%) |
| $25,000 to $29,999 | 0 (0.0%) | 0 (0.0%) |
| $30,000 to $34,999 | 0 (0.0%) | 0 (0.0%) |
| $35,000 to $39,999 | 0 (0.0%) | 36 (29.5%) |
| $40,000 to $44,999 | 0 (0.0%) | 0 (0.0%) |
| $45,000 to $49,999 | 0 (0.0%) | 0 (0.0%) |
| $50,000 to $54,999 | 0 (0.0%) | 0 (0.0%) |
| $55,000 to $64,999 | 0 (0.0%) | 0 (0.0%) |
| $65,000 to $74,999 | 0 (0.0%) | 50 (41.0%) |
| $75,000 to $99,999 | 89 (66.9%) | 19 (15.6%) |
| $100,000+ | 11 (8.3%) | 0 (0.0%) |
| Total | 133 (100.0%) | 122 (100.0%) |
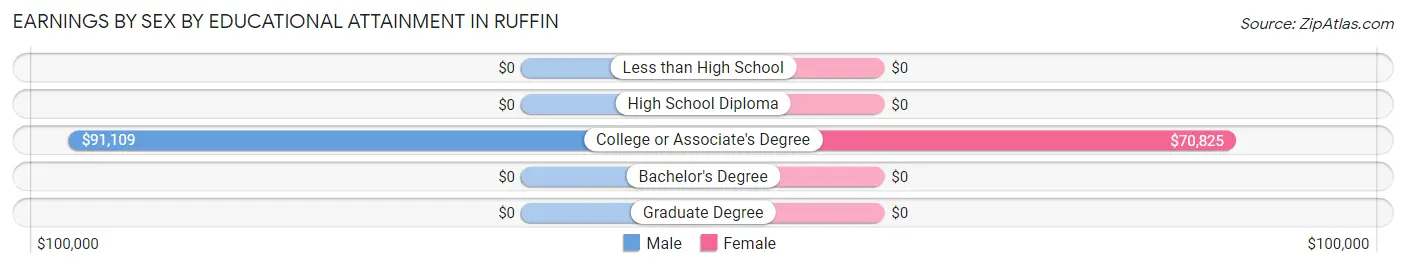
Earnings by Sex by Educational Attainment in Ruffin
Average earnings in Ruffin are $90,969 for men and $70,400 for women, a difference of 22.6%. Men with an educational attainment of college or associate's degree enjoy the highest average annual earnings of $91,109, while those with college or associate's degree education earn the least with $91,109. Women with an educational attainment of college or associate's degree earn the most with the average annual earnings of $70,825, while those with college or associate's degree education have the smallest earnings of $70,825.
| Educational Attainment | Male Income | Female Income |
| Less than High School | - | - |
| High School Diploma | - | - |
| College or Associate's Degree | $91,109 | $70,825 |
| Bachelor's Degree | - | - |
| Graduate Degree | - | - |
| Total | $90,969 | $70,400 |
Family Income in Ruffin
Family Income Brackets in Ruffin
According to the Ruffin family income data, there are 90 families falling into the $150,000 to $199,999 income range, which is the most common income bracket and makes up 45.7% of all families.
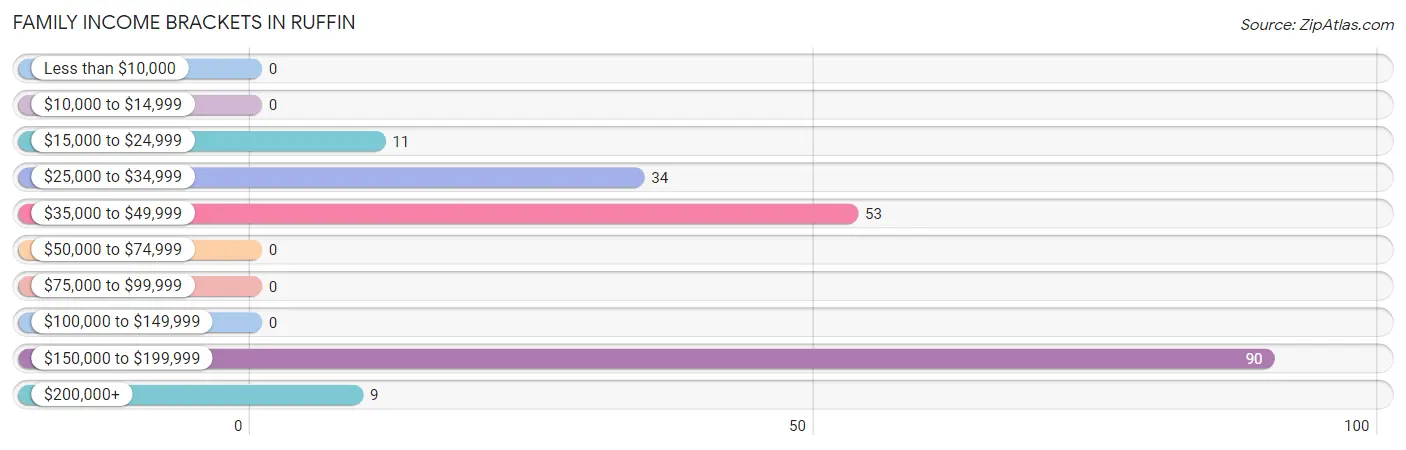
| Income Bracket | # Families | % Families |
| Less than $10,000 | 0 | 0.0% |
| $10,000 to $14,999 | 0 | 0.0% |
| $15,000 to $24,999 | 11 | 5.6% |
| $25,000 to $34,999 | 34 | 17.3% |
| $35,000 to $49,999 | 53 | 26.9% |
| $50,000 to $74,999 | 0 | 0.0% |
| $75,000 to $99,999 | 0 | 0.0% |
| $100,000 to $149,999 | 0 | 0.0% |
| $150,000 to $199,999 | 90 | 45.7% |
| $200,000+ | 9 | 4.6% |
Family Income by Famaliy Size in Ruffin
2-person families (134 | 68.0%) account for the highest median family income in Ruffin with $160,688 per family, while 2-person families (134 | 68.0%) have the highest median income of $80,344 per family member.
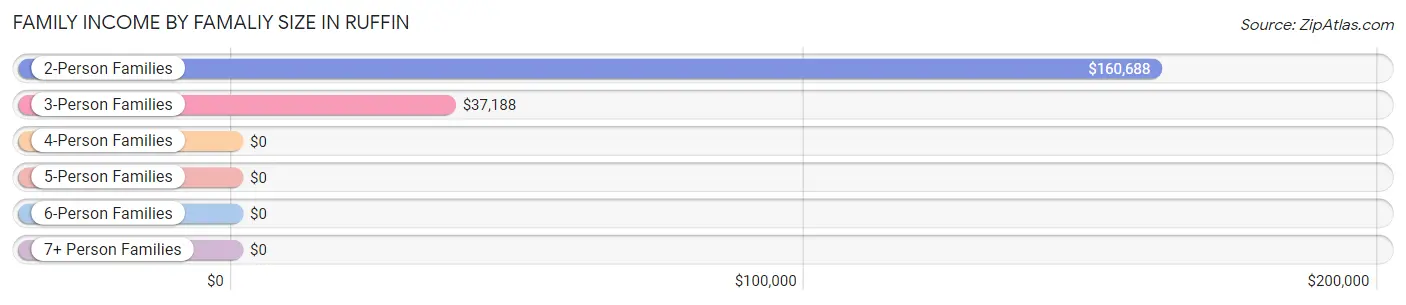
| Income Bracket | # Families | Median Income |
| 2-Person Families | 134 (68.0%) | $160,688 |
| 3-Person Families | 63 (32.0%) | $37,188 |
| 4-Person Families | 0 (0.0%) | $0 |
| 5-Person Families | 0 (0.0%) | $0 |
| 6-Person Families | 0 (0.0%) | $0 |
| 7+ Person Families | 0 (0.0%) | $0 |
| Total | 197 (100.0%) | $0 |
Family Income by Number of Earners in Ruffin
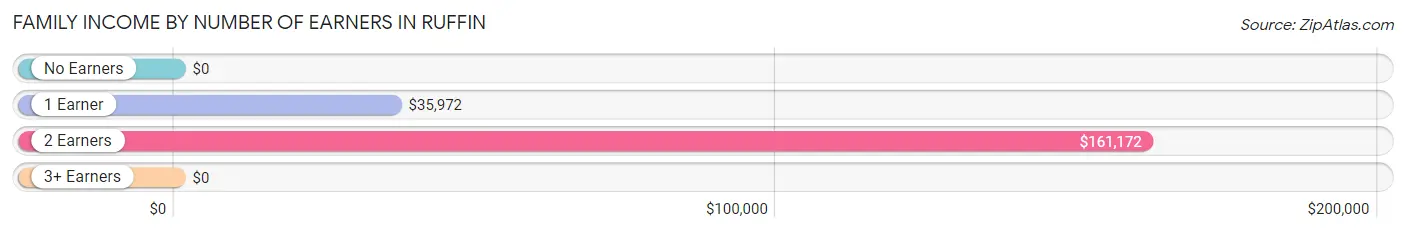
| Number of Earners | # Families | Median Income |
| No Earners | 34 (17.3%) | $0 |
| 1 Earner | 50 (25.4%) | $35,972 |
| 2 Earners | 103 (52.3%) | $161,172 |
| 3+ Earners | 10 (5.1%) | $0 |
| Total | 197 (100.0%) | $0 |
Household Income in Ruffin
Household Income Brackets in Ruffin
With 90 households falling in the category, the $150,000 to $199,999 income range is the most frequent in Ruffin, accounting for 41.7% of all households.
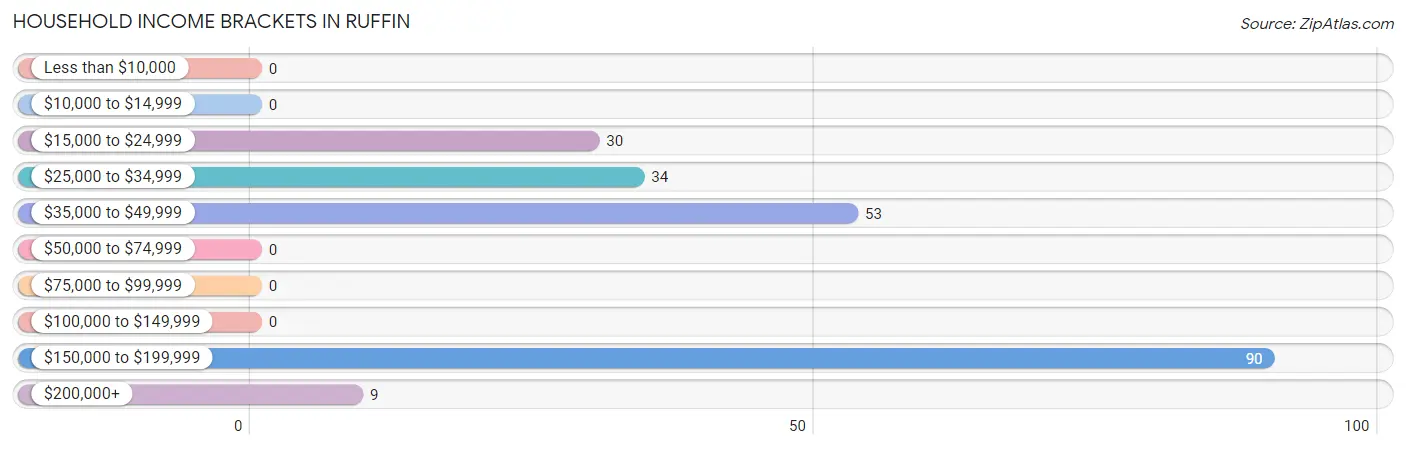
| Income Bracket | # Households | % Households |
| Less than $10,000 | 0 | 0.0% |
| $10,000 to $14,999 | 0 | 0.0% |
| $15,000 to $24,999 | 30 | 13.9% |
| $25,000 to $34,999 | 34 | 15.7% |
| $35,000 to $49,999 | 53 | 24.5% |
| $50,000 to $74,999 | 0 | 0.0% |
| $75,000 to $99,999 | 0 | 0.0% |
| $100,000 to $149,999 | 0 | 0.0% |
| $150,000 to $199,999 | 90 | 41.7% |
| $200,000+ | 9 | 4.2% |
Household Income by Householder Age in Ruffin
The median household income in Ruffin is $0, with the highest median household income of $192,000 found in the 45 to 64 years age bracket for the primary householder. A total of 22 households (10.2%) fall into this category.
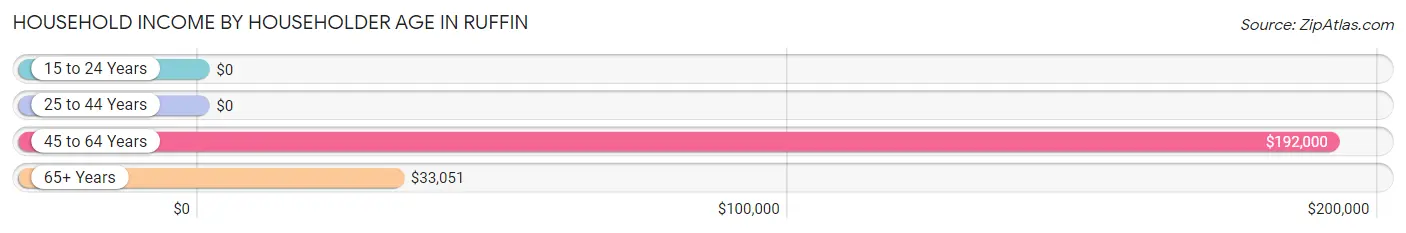
| Income Bracket | # Households | Median Income |
| 15 to 24 Years | 0 (0.0%) | $0 |
| 25 to 44 Years | 141 (65.3%) | $0 |
| 45 to 64 Years | 22 (10.2%) | $192,000 |
| 65+ Years | 53 (24.5%) | $33,051 |
| Total | 216 (100.0%) | $0 |
Poverty in Ruffin
Income Below Poverty by Sex and Age in Ruffin
With 5.1% poverty level for males and 6.8% for females among the residents of Ruffin, 35 to 44 year old males and 25 to 34 year old females are the most vulnerable to poverty, with 11 males (8.6%) and 15 females (51.7%) in their respective age groups living below the poverty level.
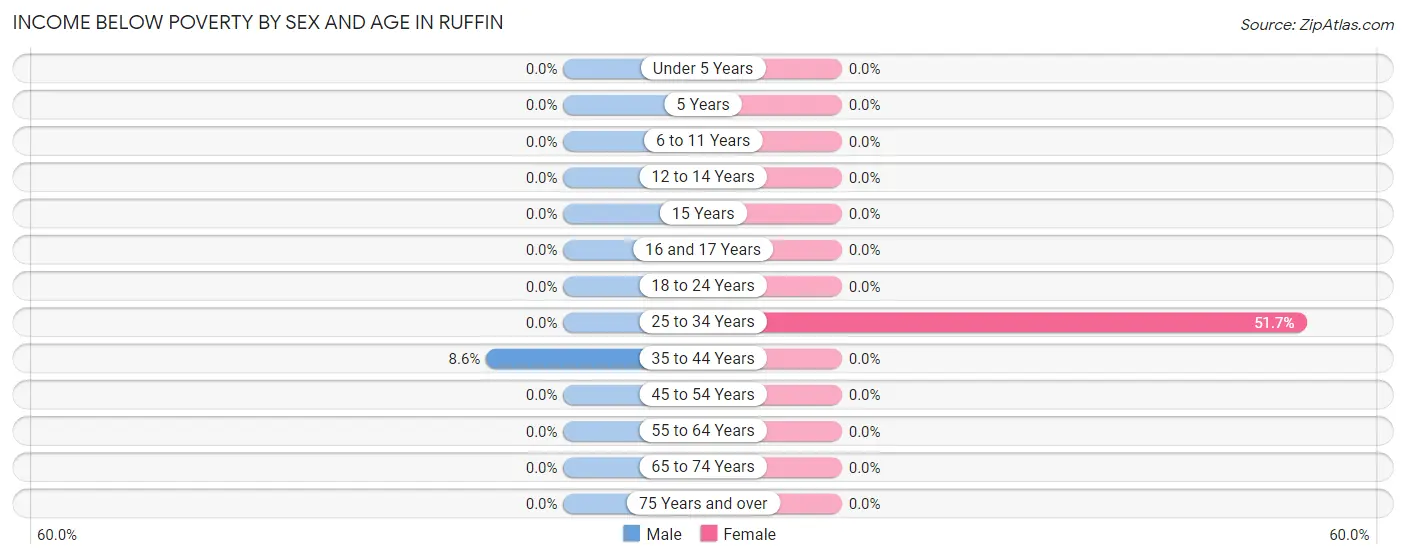
| Age Bracket | Male | Female |
| Under 5 Years | 0 (0.0%) | 0 (0.0%) |
| 5 Years | 0 (0.0%) | 0 (0.0%) |
| 6 to 11 Years | 0 (0.0%) | 0 (0.0%) |
| 12 to 14 Years | 0 (0.0%) | 0 (0.0%) |
| 15 Years | 0 (0.0%) | 0 (0.0%) |
| 16 and 17 Years | 0 (0.0%) | 0 (0.0%) |
| 18 to 24 Years | 0 (0.0%) | 0 (0.0%) |
| 25 to 34 Years | 0 (0.0%) | 15 (51.7%) |
| 35 to 44 Years | 11 (8.6%) | 0 (0.0%) |
| 45 to 54 Years | 0 (0.0%) | 0 (0.0%) |
| 55 to 64 Years | 0 (0.0%) | 0 (0.0%) |
| 65 to 74 Years | 0 (0.0%) | 0 (0.0%) |
| 75 Years and over | 0 (0.0%) | 0 (0.0%) |
| Total | 11 (5.1%) | 15 (6.8%) |
Income Above Poverty by Sex and Age in Ruffin
According to the poverty statistics in Ruffin, males aged 6 to 11 years and females aged under 5 years are the age groups that are most secure financially, with 100.0% of males and 100.0% of females in these age groups living above the poverty line.
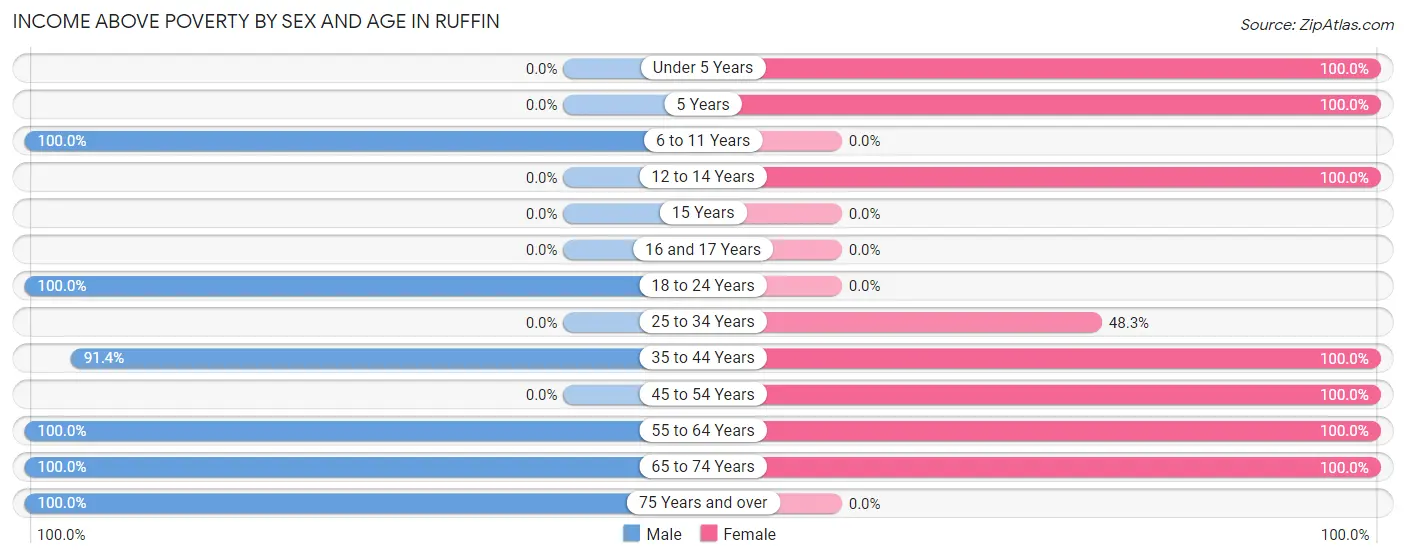
| Age Bracket | Male | Female |
| Under 5 Years | 0 (0.0%) | 10 (100.0%) |
| 5 Years | 0 (0.0%) | 3 (100.0%) |
| 6 to 11 Years | 36 (100.0%) | 0 (0.0%) |
| 12 to 14 Years | 0 (0.0%) | 34 (100.0%) |
| 15 Years | 0 (0.0%) | 0 (0.0%) |
| 16 and 17 Years | 0 (0.0%) | 0 (0.0%) |
| 18 to 24 Years | 13 (100.0%) | 0 (0.0%) |
| 25 to 34 Years | 0 (0.0%) | 14 (48.3%) |
| 35 to 44 Years | 117 (91.4%) | 89 (100.0%) |
| 45 to 54 Years | 0 (0.0%) | 10 (100.0%) |
| 55 to 64 Years | 20 (100.0%) | 12 (100.0%) |
| 65 to 74 Years | 9 (100.0%) | 34 (100.0%) |
| 75 Years and over | 10 (100.0%) | 0 (0.0%) |
| Total | 205 (94.9%) | 206 (93.2%) |
Income Below Poverty Among Married-Couple Families in Ruffin
The poverty statistics for married-couple families in Ruffin show that 8.9% or 11 of the total 124 families live below the poverty line. Families with no children have the highest poverty rate of 10.0%, comprising of 11 families. On the other hand, families with 1 or 2 children have the lowest poverty rate of 0.0%, which includes 0 families.
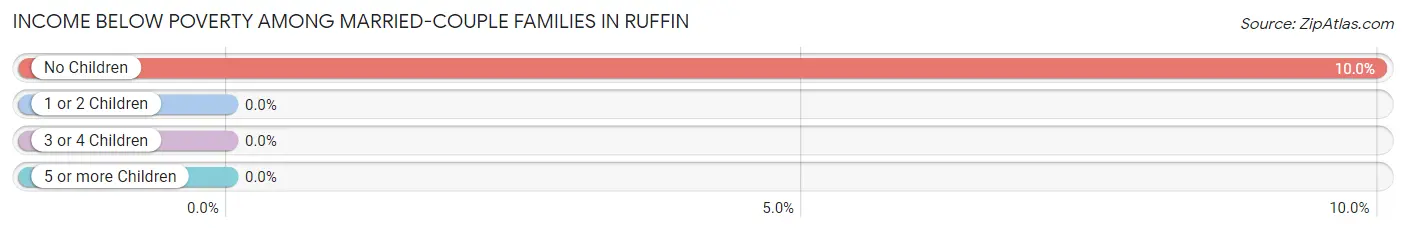
| Children | Above Poverty | Below Poverty |
| No Children | 99 (90.0%) | 11 (10.0%) |
| 1 or 2 Children | 14 (100.0%) | 0 (0.0%) |
| 3 or 4 Children | 0 (0.0%) | 0 (0.0%) |
| 5 or more Children | 0 (0.0%) | 0 (0.0%) |
| Total | 113 (91.1%) | 11 (8.9%) |
Income Below Poverty Among Single-Parent Households in Ruffin
| Children | Single Father | Single Mother |
| No Children | 0 (0.0%) | 0 (0.0%) |
| 1 or 2 Children | 0 (0.0%) | 0 (0.0%) |
| 3 or 4 Children | 0 (0.0%) | 0 (0.0%) |
| 5 or more Children | 0 (0.0%) | 0 (0.0%) |
| Total | 0 (0.0%) | 0 (0.0%) |
Income Below Poverty Among Married-Couple vs Single-Parent Households in Ruffin
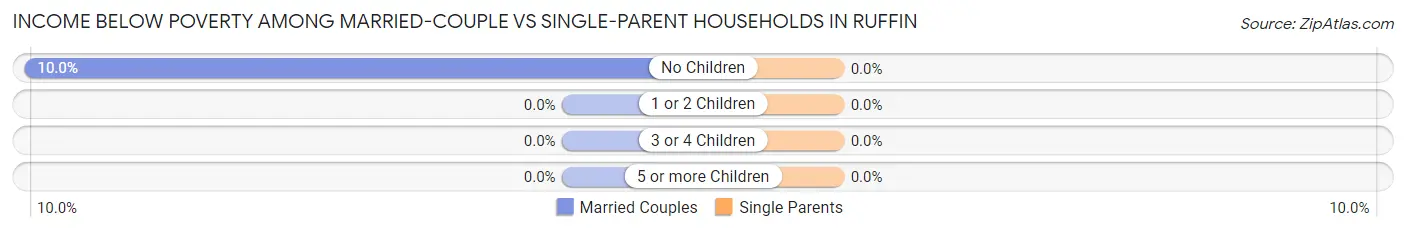
| Children | Married-Couple Families | Single-Parent Households |
| No Children | 11 (10.0%) | 0 (0.0%) |
| 1 or 2 Children | 0 (0.0%) | 0 (0.0%) |
| 3 or 4 Children | 0 (0.0%) | 0 (0.0%) |
| 5 or more Children | 0 (0.0%) | 0 (0.0%) |
| Total | 11 (8.9%) | 0 (0.0%) |
Race in Ruffin
The most populous races in Ruffin are White / Caucasian (304 | 69.6%), and Two or more Races (133 | 30.4%).
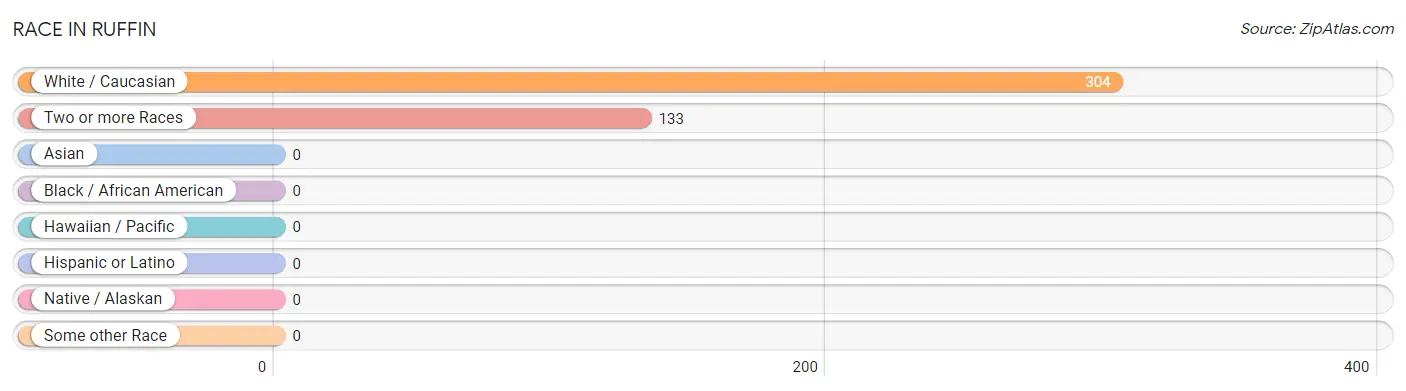
| Race | # Population | % Population |
| Asian | 0 | 0.0% |
| Black / African American | 0 | 0.0% |
| Hawaiian / Pacific | 0 | 0.0% |
| Hispanic or Latino | 0 | 0.0% |
| Native / Alaskan | 0 | 0.0% |
| White / Caucasian | 304 | 69.6% |
| Two or more Races | 133 | 30.4% |
| Some other Race | 0 | 0.0% |
| Total | 437 | 100.0% |
Ancestry in Ruffin
The most populous ancestries reported in Ruffin are American (168 | 38.4%), English (42 | 9.6%), Scotch-Irish (32 | 7.3%), and Irish (19 | 4.3%), together accounting for 59.7% of all Ruffin residents.
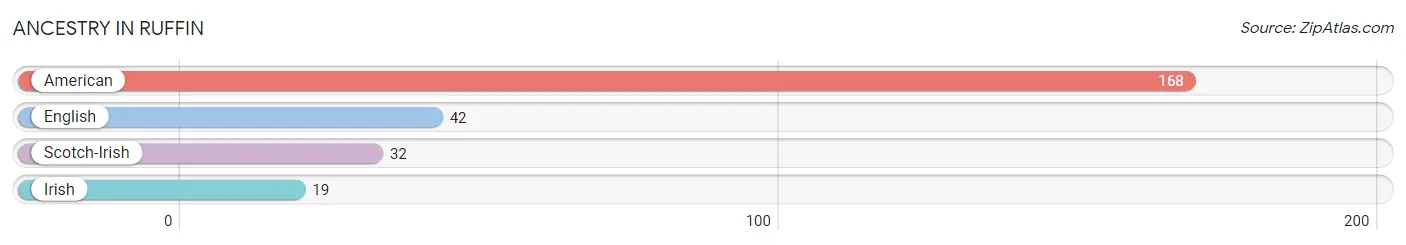
| Ancestry | # Population | % Population |
| American | 168 | 38.4% |
| English | 42 | 9.6% |
| Irish | 19 | 4.3% |
| Scotch-Irish | 32 | 7.3% | View All 4 Rows |
Immigrants in Ruffin

| Immigration Origin | # Population | % Population | View All 0 Rows |
Sex and Age in Ruffin
Sex and Age in Ruffin
The most populous age groups in Ruffin are 35 to 39 Years (117 | 54.2%) for men and 35 to 39 Years (53 | 24.0%) for women.
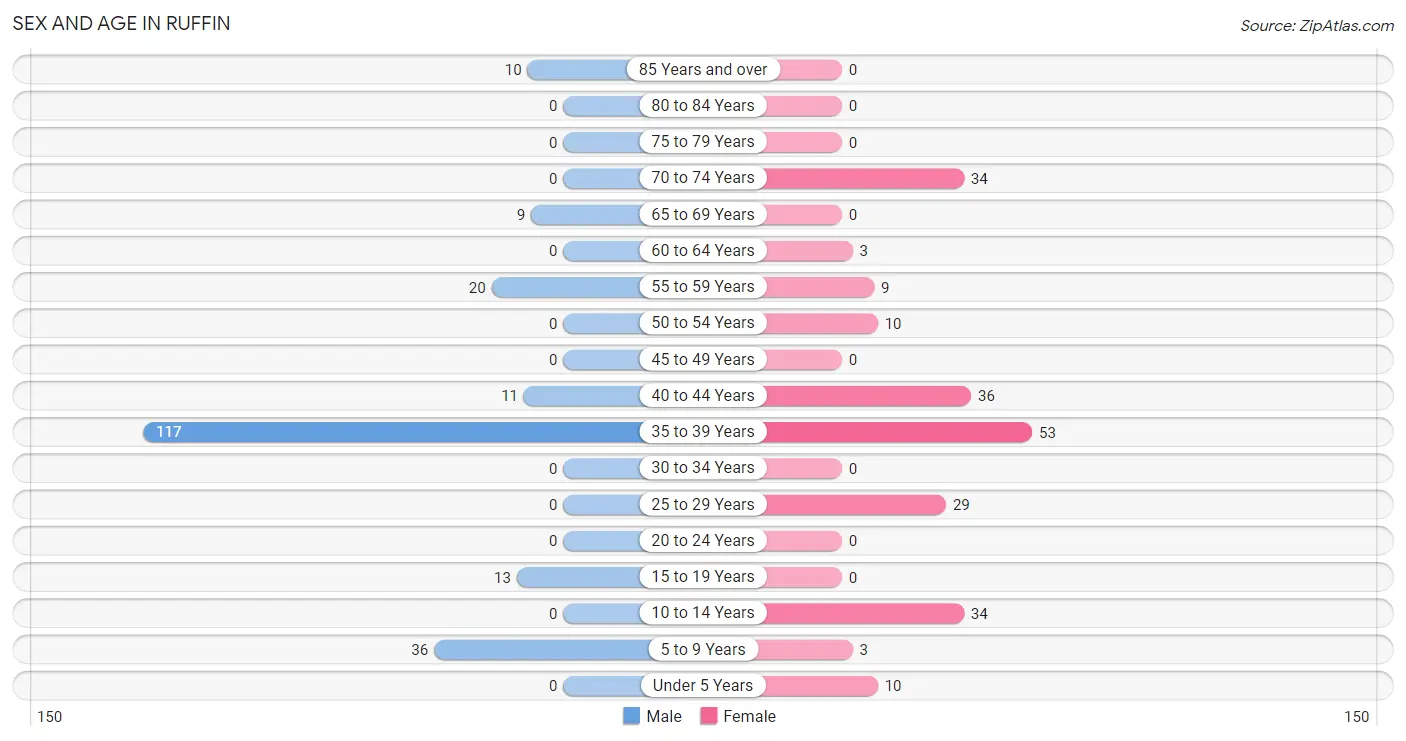
| Age Bracket | Male | Female |
| Under 5 Years | 0 (0.0%) | 10 (4.5%) |
| 5 to 9 Years | 36 (16.7%) | 3 (1.4%) |
| 10 to 14 Years | 0 (0.0%) | 34 (15.4%) |
| 15 to 19 Years | 13 (6.0%) | 0 (0.0%) |
| 20 to 24 Years | 0 (0.0%) | 0 (0.0%) |
| 25 to 29 Years | 0 (0.0%) | 29 (13.1%) |
| 30 to 34 Years | 0 (0.0%) | 0 (0.0%) |
| 35 to 39 Years | 117 (54.2%) | 53 (24.0%) |
| 40 to 44 Years | 11 (5.1%) | 36 (16.3%) |
| 45 to 49 Years | 0 (0.0%) | 0 (0.0%) |
| 50 to 54 Years | 0 (0.0%) | 10 (4.5%) |
| 55 to 59 Years | 20 (9.3%) | 9 (4.1%) |
| 60 to 64 Years | 0 (0.0%) | 3 (1.4%) |
| 65 to 69 Years | 9 (4.2%) | 0 (0.0%) |
| 70 to 74 Years | 0 (0.0%) | 34 (15.4%) |
| 75 to 79 Years | 0 (0.0%) | 0 (0.0%) |
| 80 to 84 Years | 0 (0.0%) | 0 (0.0%) |
| 85 Years and over | 10 (4.6%) | 0 (0.0%) |
| Total | 216 (100.0%) | 221 (100.0%) |
Families and Households in Ruffin
Median Family Size in Ruffin
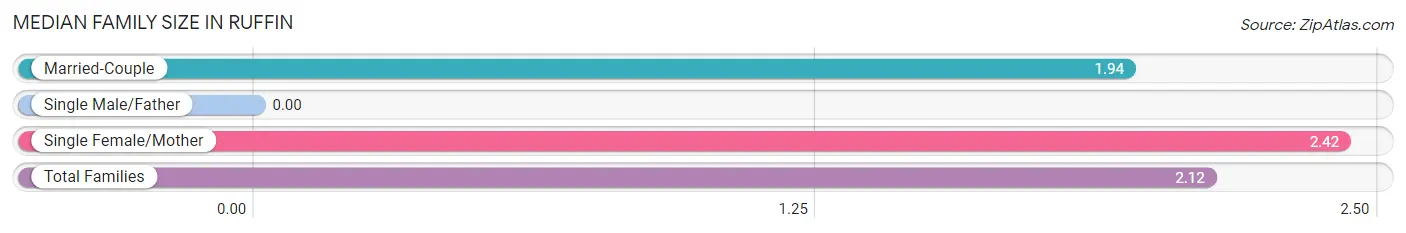
| Family Type | # Families | Family Size |
| Married-Couple | 124 (62.9%) | 1.94 |
| Single Male/Father | 0 (0.0%) | - |
| Single Female/Mother | 73 (37.1%) | 2.42 |
| Total Families | 197 (100.0%) | 2.12 |
Median Household Size in Ruffin
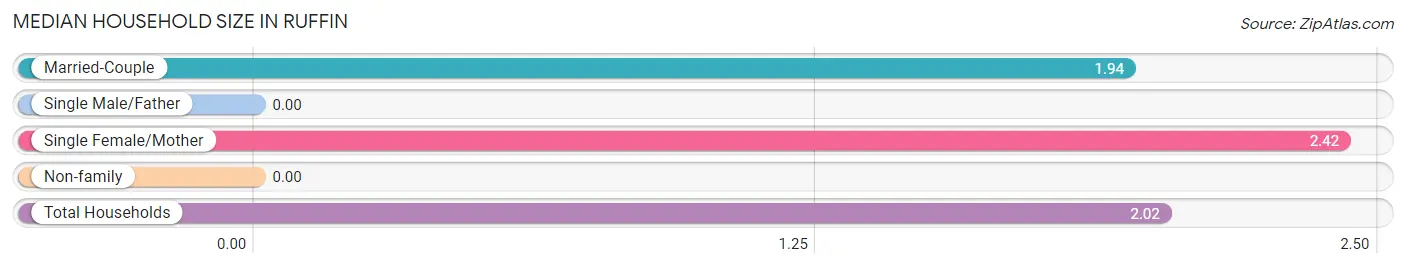
| Household Type | # Households | Household Size |
| Married-Couple | 124 (57.4%) | 1.94 |
| Single Male/Father | 0 (0.0%) | - |
| Single Female/Mother | 73 (33.8%) | 2.42 |
| Non-family | 19 (8.8%) | - |
| Total Households | 216 (100.0%) | 2.02 |
Household Size by Marriage Status in Ruffin
Out of a total of 216 households in Ruffin, 197 (91.2%) are family households, while 19 (8.8%) are nonfamily households. The most numerous type of family households are 2-person households, comprising 134, and the most common type of nonfamily households are 1-person households, comprising 19.
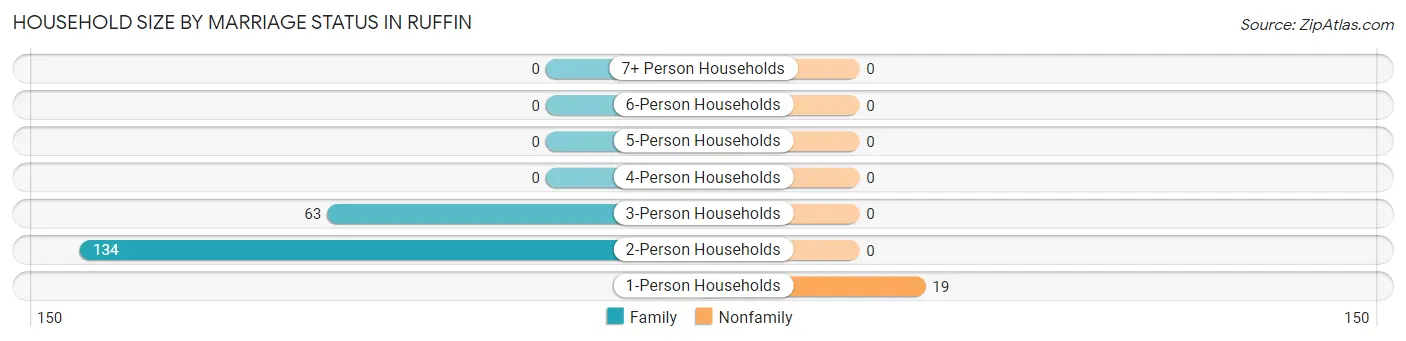
| Household Size | Family Households | Nonfamily Households |
| 1-Person Households | - | 19 (8.8%) |
| 2-Person Households | 134 (62.0%) | 0 (0.0%) |
| 3-Person Households | 63 (29.2%) | 0 (0.0%) |
| 4-Person Households | 0 (0.0%) | 0 (0.0%) |
| 5-Person Households | 0 (0.0%) | 0 (0.0%) |
| 6-Person Households | 0 (0.0%) | 0 (0.0%) |
| 7+ Person Households | 0 (0.0%) | 0 (0.0%) |
| Total | 197 (91.2%) | 19 (8.8%) |
Female Fertility in Ruffin
Fertility by Age in Ruffin
| Age Bracket | Women with Births | Births / 1,000 Women |
| 15 to 19 years | 0 (0.0%) | 0.0 |
| 20 to 34 years | 0 (0.0%) | 0.0 |
| 35 to 50 years | 0 (0.0%) | 0.0 |
| Total | 0 (0.0%) | 0.0 |
Fertility by Age by Marriage Status in Ruffin
| Age Bracket | Married | Unmarried |
| 15 to 19 years | 0 (0.0%) | 0 (0.0%) |
| 20 to 34 years | 0 (0.0%) | 0 (0.0%) |
| 35 to 50 years | 0 (0.0%) | 0 (0.0%) |
| Total | 0 (0.0%) | 0 (0.0%) |
Fertility by Education in Ruffin
| Educational Attainment | Women with Births | Births / 1,000 Women |
| Less than High School | 0 (0.0%) | 0.0 |
| High School Diploma | 0 (0.0%) | 0.0 |
| College or Associate's Degree | 0 (0.0%) | 0.0 |
| Bachelor's Degree | 0 (0.0%) | 0.0 |
| Graduate Degree | 0 (0.0%) | 0.0 |
| Total | 0 (0.0%) | 0.0 |
Fertility by Education by Marriage Status in Ruffin
| Educational Attainment | Married | Unmarried |
| Less than High School | 0 (0.0%) | 0 (0.0%) |
| High School Diploma | 0 (0.0%) | 0 (0.0%) |
| College or Associate's Degree | 0 (0.0%) | 0 (0.0%) |
| Bachelor's Degree | 0 (0.0%) | 0 (0.0%) |
| Graduate Degree | 0 (0.0%) | 0 (0.0%) |
| Total | 0 (0.0%) | 0 (0.0%) |
Employment Characteristics in Ruffin
Employment by Class of Employer in Ruffin
Among the 242 employed individuals in Ruffin, self-employed (incorporated) (130 | 53.7%), private company employees (76 | 31.4%), and federal government employees (36 | 14.9%) make up the most common classes of employment.
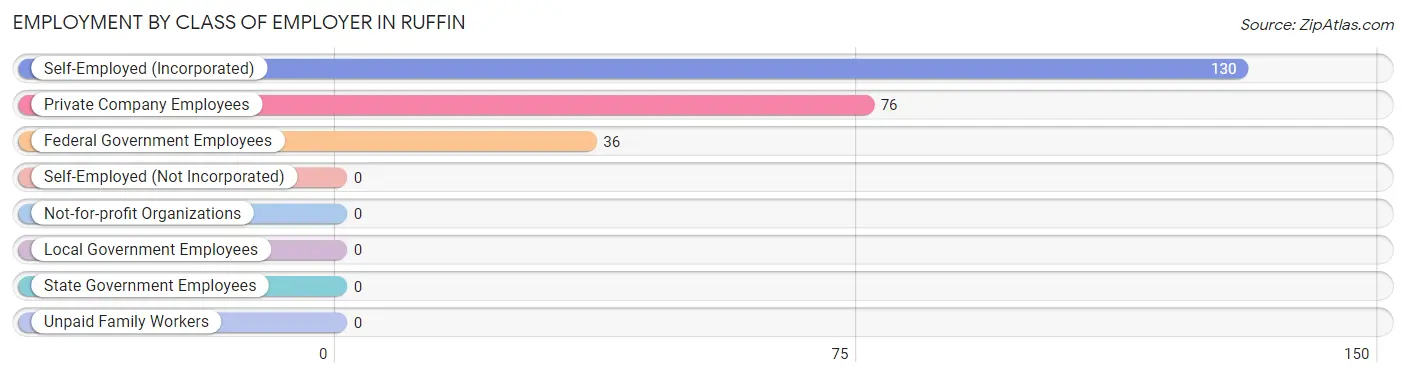
| Employer Class | # Employees | % Employees |
| Private Company Employees | 76 | 31.4% |
| Self-Employed (Incorporated) | 130 | 53.7% |
| Self-Employed (Not Incorporated) | 0 | 0.0% |
| Not-for-profit Organizations | 0 | 0.0% |
| Local Government Employees | 0 | 0.0% |
| State Government Employees | 0 | 0.0% |
| Federal Government Employees | 36 | 14.9% |
| Unpaid Family Workers | 0 | 0.0% |
| Total | 242 | 100.0% |
Employment Status by Age in Ruffin
According to the labor force statistics for Ruffin, out of the total population over 16 years of age (354), 72.6% or 257 individuals are in the labor force, with 5.8% or 15 of them unemployed. The age group with the highest labor force participation rate is 25 to 29 years, with 100.0% or 29 individuals in the labor force. Within the labor force, the 25 to 29 years age range has the highest percentage of unemployed individuals, with 51.7% or 15 of them being unemployed.
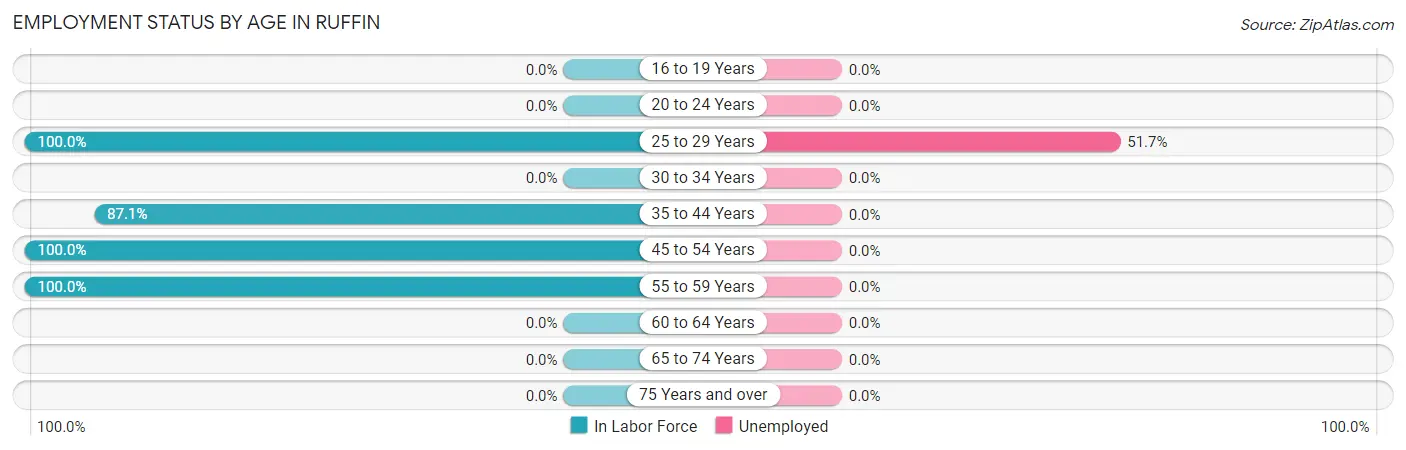
| Age Bracket | In Labor Force | Unemployed |
| 16 to 19 Years | 0 (0.0%) | 0 (0.0%) |
| 20 to 24 Years | 0 (0.0%) | 0 (0.0%) |
| 25 to 29 Years | 29 (100.0%) | 15 (51.7%) |
| 30 to 34 Years | 0 (0.0%) | 0 (0.0%) |
| 35 to 44 Years | 189 (87.1%) | 0 (0.0%) |
| 45 to 54 Years | 10 (100.0%) | 0 (0.0%) |
| 55 to 59 Years | 29 (100.0%) | 0 (0.0%) |
| 60 to 64 Years | 0 (0.0%) | 0 (0.0%) |
| 65 to 74 Years | 0 (0.0%) | 0 (0.0%) |
| 75 Years and over | 0 (0.0%) | 0 (0.0%) |
| Total | 257 (72.6%) | 15 (5.8%) |
Employment Status by Educational Attainment in Ruffin
According to labor force statistics for Ruffin, 89.2% of individuals (257) out of the total population between 25 and 64 years of age (288) are in the labor force, with 5.8% or 15 of them being unemployed. The group with the highest labor force participation rate are those with the educational attainment of college / associate degree, with 100.0% or 231 individuals in the labor force. Within the labor force, individuals with college / associate degree education have the highest percentage of unemployment, with 6.5% or 15 of them being unemployed.
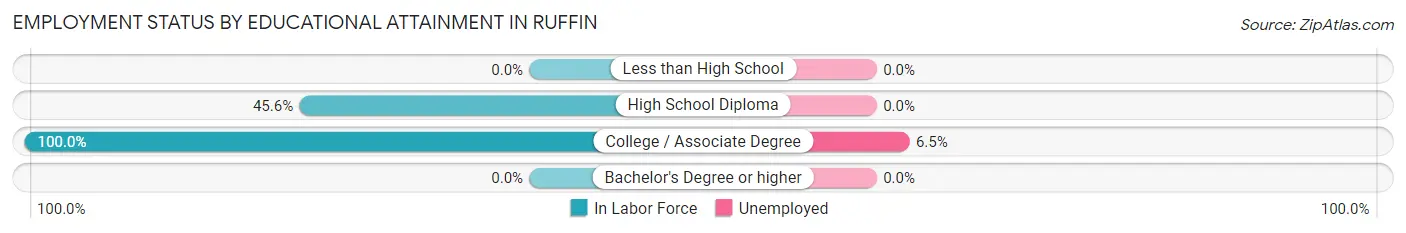
| Educational Attainment | In Labor Force | Unemployed |
| Less than High School | 0 (0.0%) | 0 (0.0%) |
| High School Diploma | 26 (45.6%) | 0 (0.0%) |
| College / Associate Degree | 231 (100.0%) | 15 (6.5%) |
| Bachelor's Degree or higher | 0 (0.0%) | 0 (0.0%) |
| Total | 257 (89.2%) | 17 (5.8%) |
Employment Occupations by Sex in Ruffin
Management, Business, Science and Arts Occupations
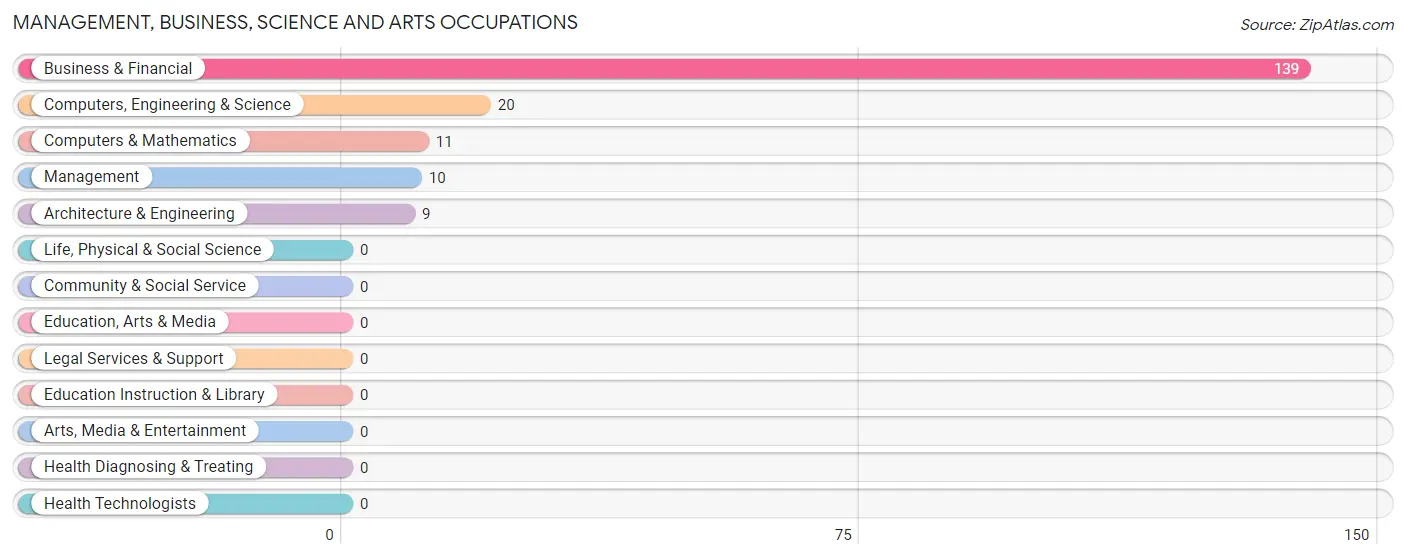
The most common Management, Business, Science and Arts occupations in Ruffin are Business & Financial (139 | 57.4%), Computers, Engineering & Science (20 | 8.3%), Computers & Mathematics (11 | 4.5%), Management (10 | 4.1%), and Architecture & Engineering (9 | 3.7%).
Management, Business, Science and Arts Occupations by Sex
Within the Management, Business, Science and Arts occupations in Ruffin, the most male-oriented occupations are Computers, Engineering & Science (100.0%), Computers & Mathematics (100.0%), and Architecture & Engineering (100.0%), while the most female-oriented occupations are Management (100.0%), and Business & Financial (42.4%).
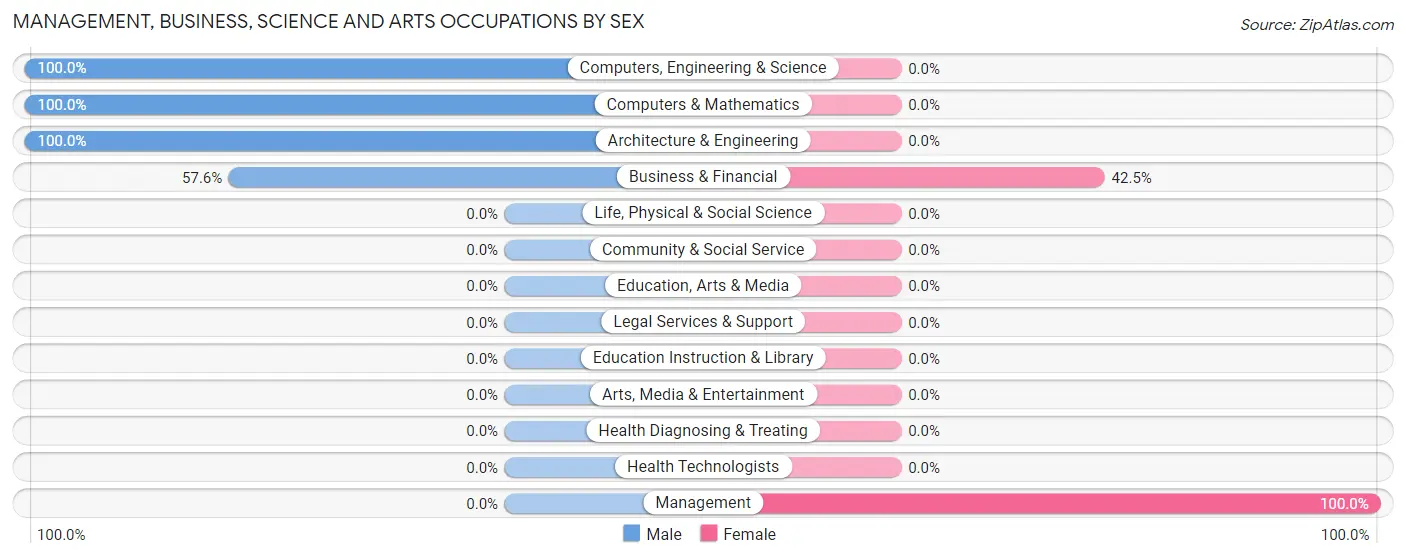
| Occupation | Male | Female |
| Management | 0 (0.0%) | 10 (100.0%) |
| Business & Financial | 80 (57.6%) | 59 (42.4%) |
| Computers, Engineering & Science | 20 (100.0%) | 0 (0.0%) |
| Computers & Mathematics | 11 (100.0%) | 0 (0.0%) |
| Architecture & Engineering | 9 (100.0%) | 0 (0.0%) |
| Life, Physical & Social Science | 0 (0.0%) | 0 (0.0%) |
| Community & Social Service | 0 (0.0%) | 0 (0.0%) |
| Education, Arts & Media | 0 (0.0%) | 0 (0.0%) |
| Legal Services & Support | 0 (0.0%) | 0 (0.0%) |
| Education Instruction & Library | 0 (0.0%) | 0 (0.0%) |
| Arts, Media & Entertainment | 0 (0.0%) | 0 (0.0%) |
| Health Diagnosing & Treating | 0 (0.0%) | 0 (0.0%) |
| Health Technologists | 0 (0.0%) | 0 (0.0%) |
| Total (Category) | 100 (59.2%) | 69 (40.8%) |
| Total (Overall) | 120 (49.6%) | 122 (50.4%) |
Services Occupations
The most common Services occupations in Ruffin are , and Food Preparation & Serving (37 | 15.3%).
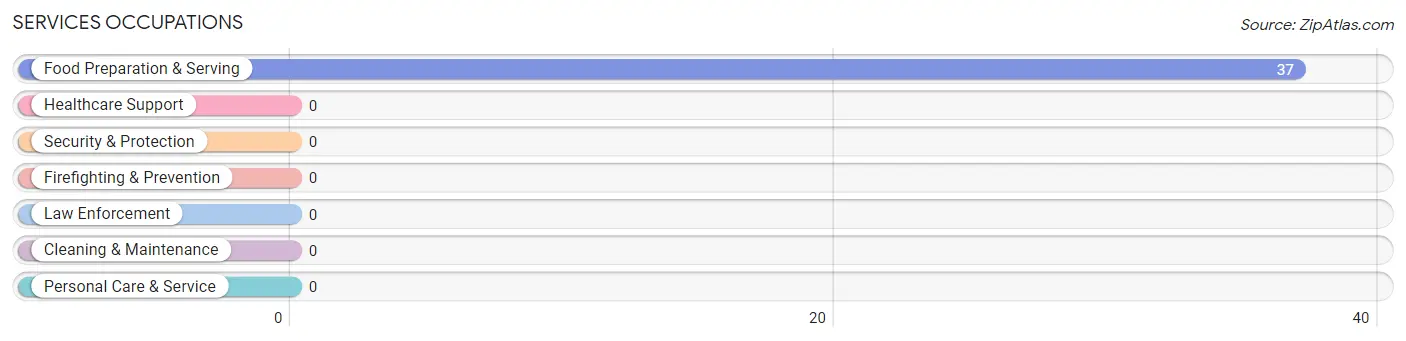
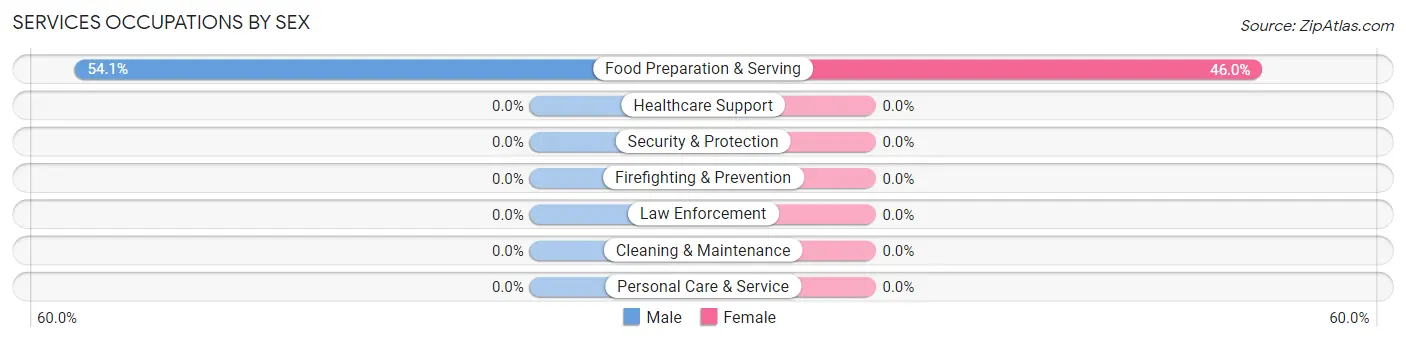
Services Occupations by Sex
| Occupation | Male | Female |
| Healthcare Support | 0 (0.0%) | 0 (0.0%) |
| Security & Protection | 0 (0.0%) | 0 (0.0%) |
| Firefighting & Prevention | 0 (0.0%) | 0 (0.0%) |
| Law Enforcement | 0 (0.0%) | 0 (0.0%) |
| Food Preparation & Serving | 20 (54.0%) | 17 (46.0%) |
| Cleaning & Maintenance | 0 (0.0%) | 0 (0.0%) |
| Personal Care & Service | 0 (0.0%) | 0 (0.0%) |
| Total (Category) | 20 (54.0%) | 17 (46.0%) |
| Total (Overall) | 120 (49.6%) | 122 (50.4%) |
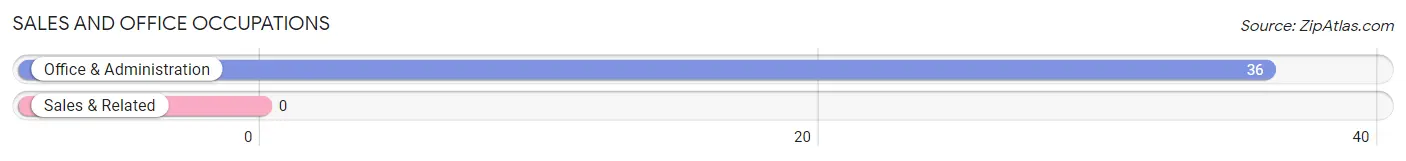
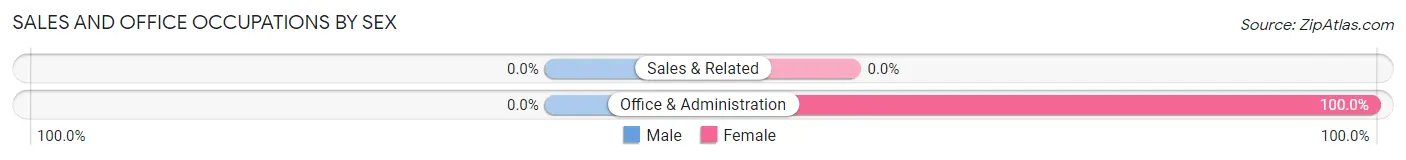
Sales and Office Occupations
The most common Sales and Office occupations in Ruffin are , and Office & Administration (36 | 14.9%).
Sales and Office Occupations by Sex
| Occupation | Male | Female |
| Sales & Related | 0 (0.0%) | 0 (0.0%) |
| Office & Administration | 0 (0.0%) | 36 (100.0%) |
| Total (Category) | 0 (0.0%) | 36 (100.0%) |
| Total (Overall) | 120 (49.6%) | 122 (50.4%) |
Natural Resources, Construction and Maintenance Occupations
Natural Resources, Construction and Maintenance Occupations by Sex
| Occupation | Male | Female |
| Farming, Fishing & Forestry | 0 (0.0%) | 0 (0.0%) |
| Construction & Extraction | 0 (0.0%) | 0 (0.0%) |
| Installation, Maintenance & Repair | 0 (0.0%) | 0 (0.0%) |
| Total (Category) | 0 (0.0%) | 0 (0.0%) |
| Total (Overall) | 120 (49.6%) | 122 (50.4%) |
Production, Transportation and Moving Occupations
Production, Transportation and Moving Occupations by Sex
| Occupation | Male | Female |
| Production | 0 (0.0%) | 0 (0.0%) |
| Transportation | 0 (0.0%) | 0 (0.0%) |
| Material Moving | 0 (0.0%) | 0 (0.0%) |
| Total (Category) | 0 (0.0%) | 0 (0.0%) |
| Total (Overall) | 120 (49.6%) | 122 (50.4%) |
Employment Industries by Sex in Ruffin
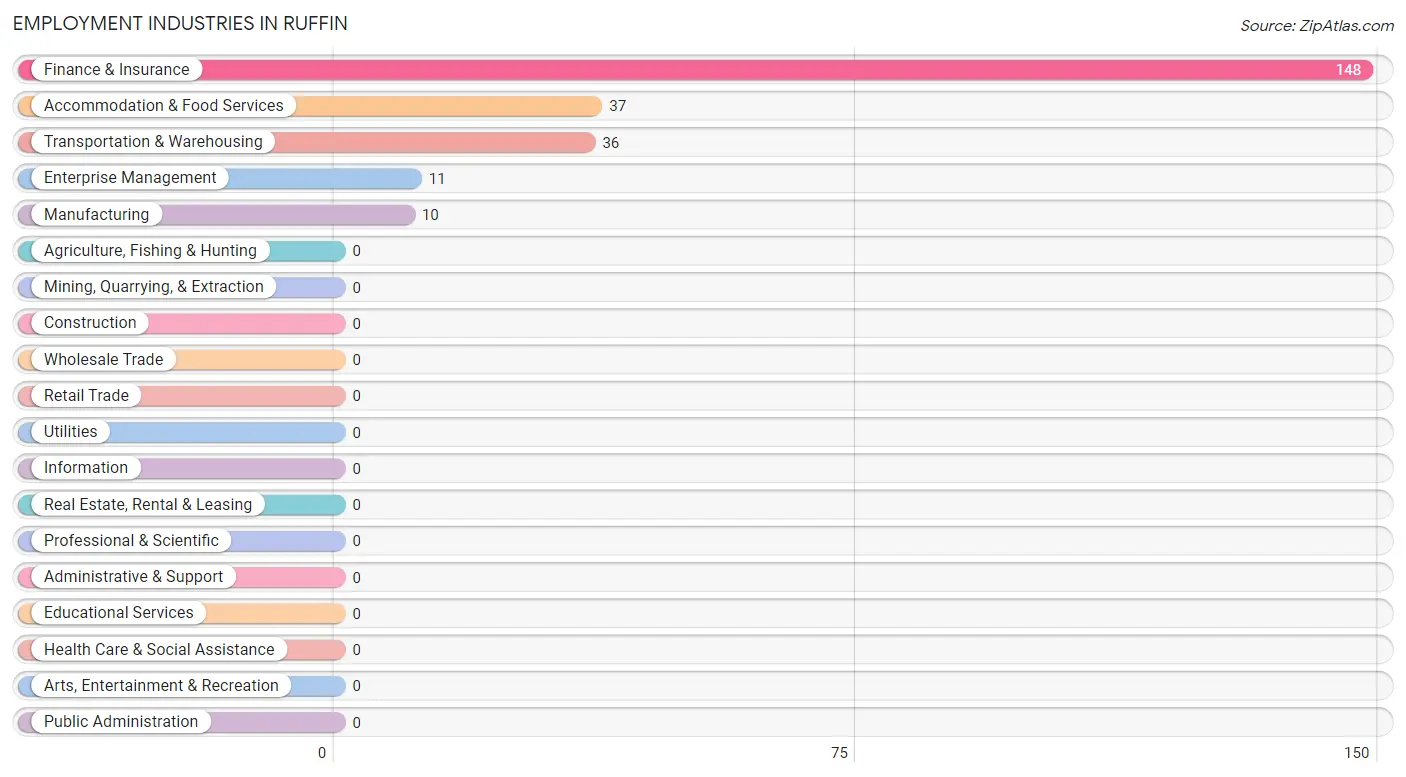
Employment Industries in Ruffin
The major employment industries in Ruffin include Finance & Insurance (148 | 61.2%), Accommodation & Food Services (37 | 15.3%), Transportation & Warehousing (36 | 14.9%), Enterprise Management (11 | 4.5%), and Manufacturing (10 | 4.1%).
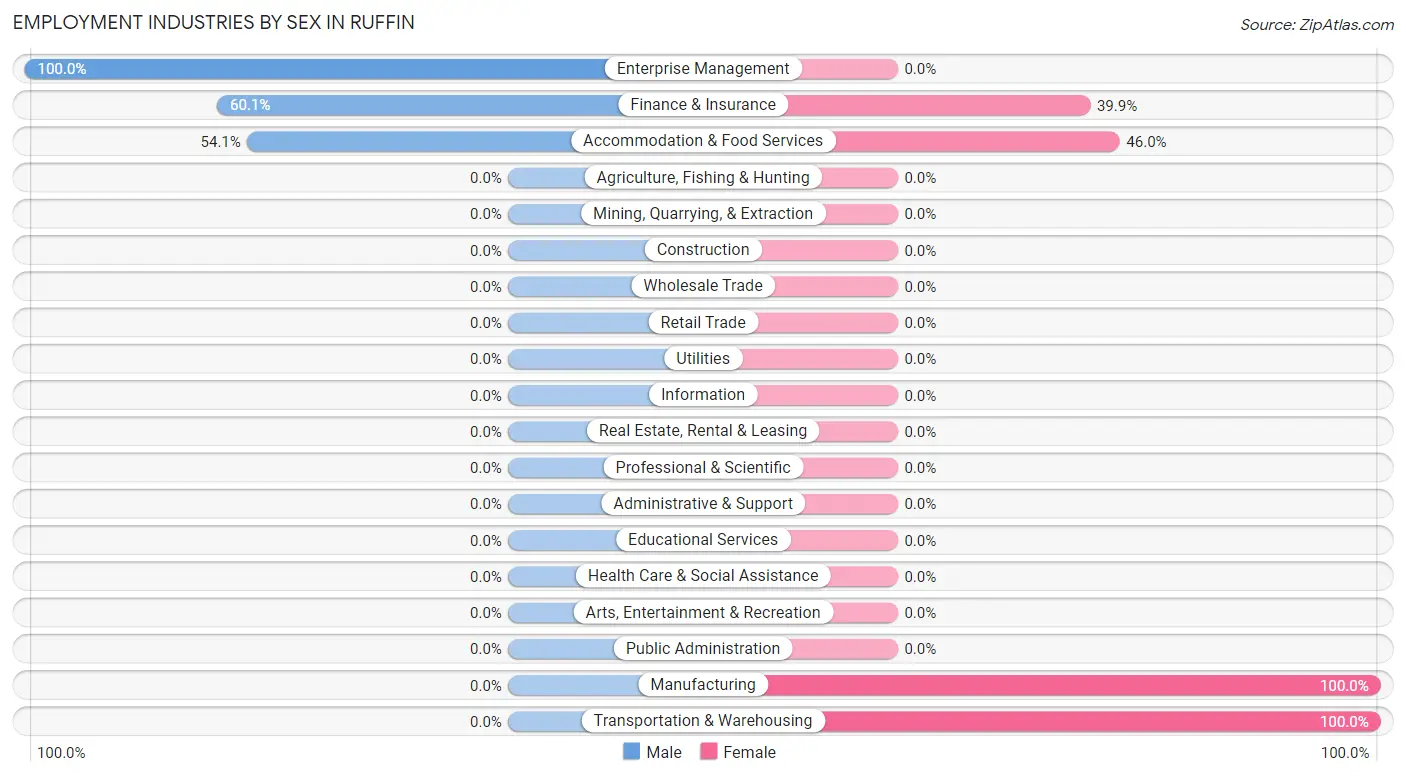
Employment Industries by Sex in Ruffin
The Ruffin industries that see more men than women are Enterprise Management (100.0%), Finance & Insurance (60.1%), and Accommodation & Food Services (54.0%), whereas the industries that tend to have a higher number of women are Manufacturing (100.0%), Transportation & Warehousing (100.0%), and Accommodation & Food Services (46.0%).
| Industry | Male | Female |
| Agriculture, Fishing & Hunting | 0 (0.0%) | 0 (0.0%) |
| Mining, Quarrying, & Extraction | 0 (0.0%) | 0 (0.0%) |
| Construction | 0 (0.0%) | 0 (0.0%) |
| Manufacturing | 0 (0.0%) | 10 (100.0%) |
| Wholesale Trade | 0 (0.0%) | 0 (0.0%) |
| Retail Trade | 0 (0.0%) | 0 (0.0%) |
| Transportation & Warehousing | 0 (0.0%) | 36 (100.0%) |
| Utilities | 0 (0.0%) | 0 (0.0%) |
| Information | 0 (0.0%) | 0 (0.0%) |
| Finance & Insurance | 89 (60.1%) | 59 (39.9%) |
| Real Estate, Rental & Leasing | 0 (0.0%) | 0 (0.0%) |
| Professional & Scientific | 0 (0.0%) | 0 (0.0%) |
| Enterprise Management | 11 (100.0%) | 0 (0.0%) |
| Administrative & Support | 0 (0.0%) | 0 (0.0%) |
| Educational Services | 0 (0.0%) | 0 (0.0%) |
| Health Care & Social Assistance | 0 (0.0%) | 0 (0.0%) |
| Arts, Entertainment & Recreation | 0 (0.0%) | 0 (0.0%) |
| Accommodation & Food Services | 20 (54.0%) | 17 (46.0%) |
| Public Administration | 0 (0.0%) | 0 (0.0%) |
| Total | 120 (49.6%) | 122 (50.4%) |
Education in Ruffin
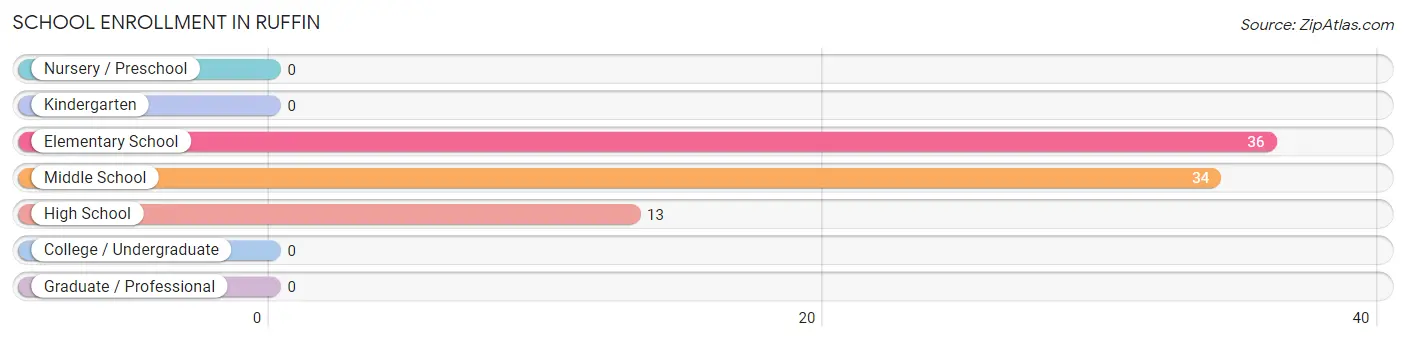
School Enrollment in Ruffin
The most common levels of schooling among the 83 students in Ruffin are elementary school (36 | 43.4%), middle school (34 | 41.0%), and high school (13 | 15.7%).
| School Level | # Students | % Students |
| Nursery / Preschool | 0 | 0.0% |
| Kindergarten | 0 | 0.0% |
| Elementary School | 36 | 43.4% |
| Middle School | 34 | 41.0% |
| High School | 13 | 15.7% |
| College / Undergraduate | 0 | 0.0% |
| Graduate / Professional | 0 | 0.0% |
| Total | 83 | 100.0% |
School Enrollment by Age by Funding Source in Ruffin
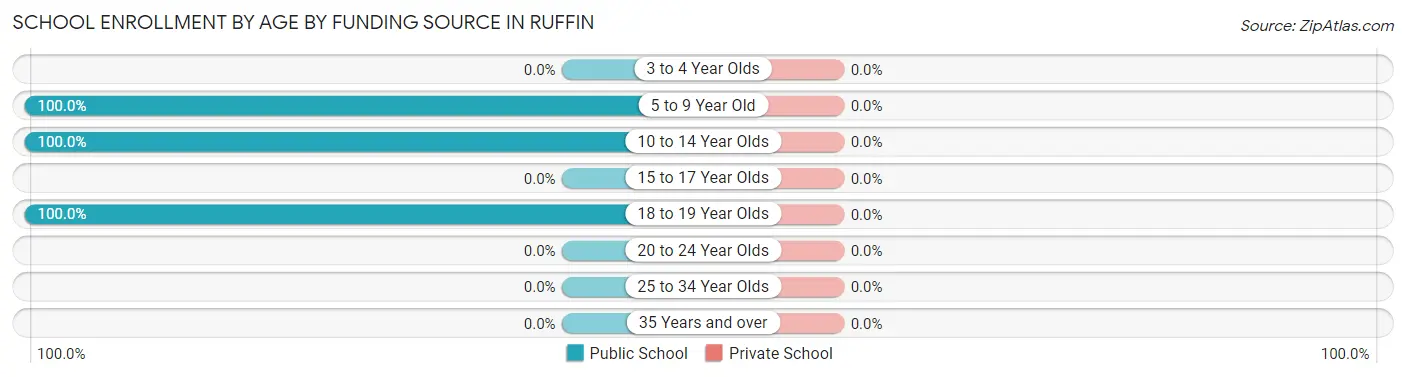
| Age Bracket | Public School | Private School |
| 3 to 4 Year Olds | 0 (0.0%) | 0 (0.0%) |
| 5 to 9 Year Old | 36 (100.0%) | 0 (0.0%) |
| 10 to 14 Year Olds | 34 (100.0%) | 0 (0.0%) |
| 15 to 17 Year Olds | 0 (0.0%) | 0 (0.0%) |
| 18 to 19 Year Olds | 13 (100.0%) | 0 (0.0%) |
| 20 to 24 Year Olds | 0 (0.0%) | 0 (0.0%) |
| 25 to 34 Year Olds | 0 (0.0%) | 0 (0.0%) |
| 35 Years and over | 0 (0.0%) | 0 (0.0%) |
| Total | 83 (100.0%) | 0 (0.0%) |
Educational Attainment by Field of Study in Ruffin
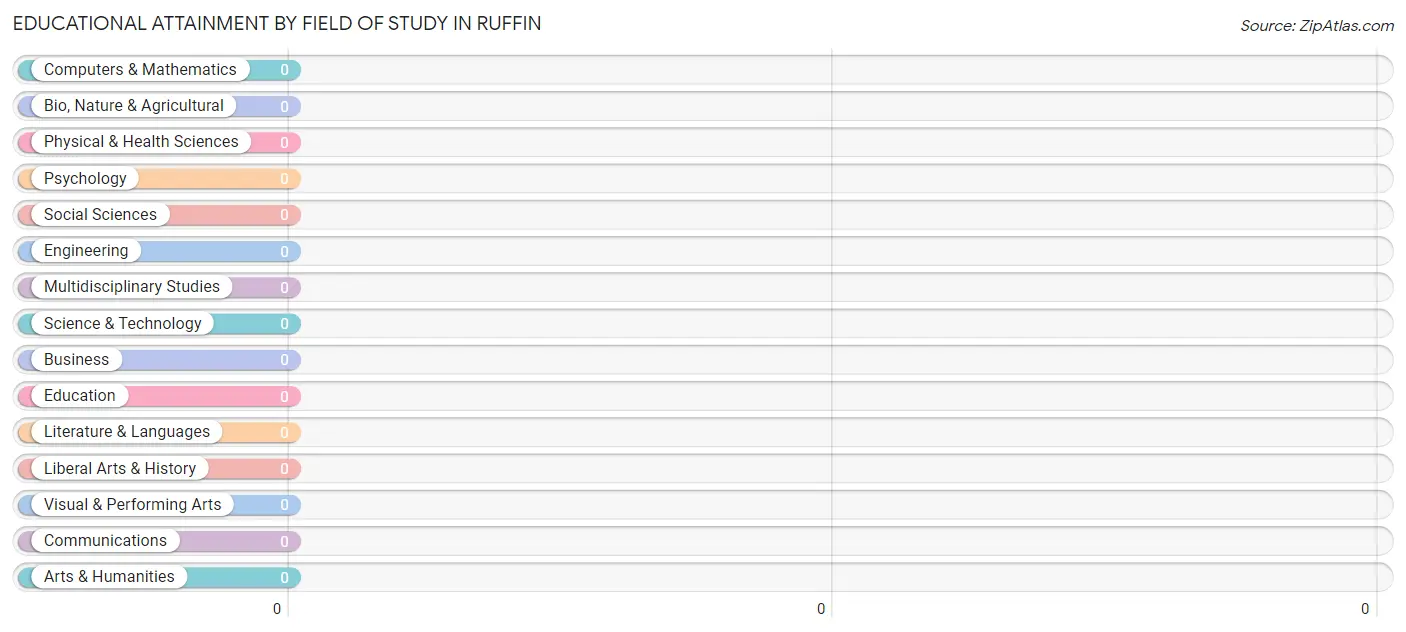
| Field of Study | # Graduates | % Graduates |
| Computers & Mathematics | 0 | 0.0% |
| Bio, Nature & Agricultural | 0 | 0.0% |
| Physical & Health Sciences | 0 | 0.0% |
| Psychology | 0 | 0.0% |
| Social Sciences | 0 | 0.0% |
| Engineering | 0 | 0.0% |
| Multidisciplinary Studies | 0 | 0.0% |
| Science & Technology | 0 | 0.0% |
| Business | 0 | 0.0% |
| Education | 0 | 0.0% |
| Literature & Languages | 0 | 0.0% |
| Liberal Arts & History | 0 | 0.0% |
| Visual & Performing Arts | 0 | 0.0% |
| Communications | 0 | 0.0% |
| Arts & Humanities | 0 | 0.0% |
| Total | 0 | 0.0% |
Transportation & Commute in Ruffin
Vehicle Availability by Sex in Ruffin
The most prevalent vehicle ownership categories in Ruffin are males with 2 vehicles (80, accounting for 66.7%) and females with 2 vehicles (50, making up 65.6%).
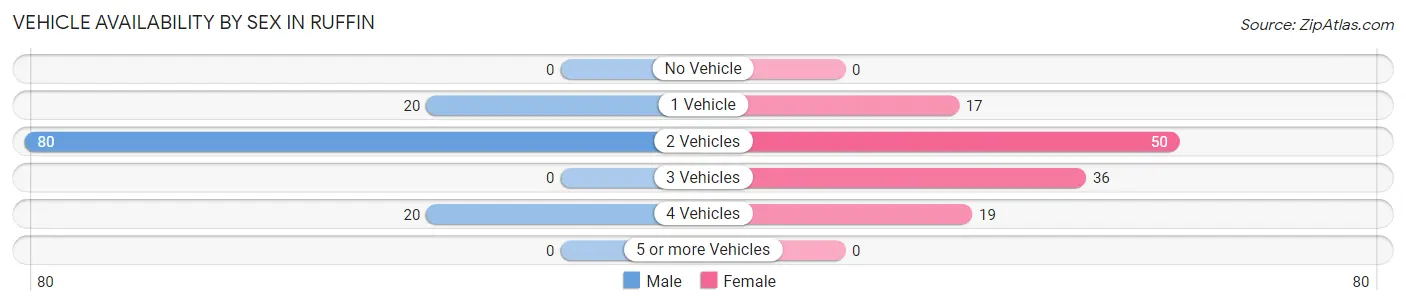
| Vehicles Available | Male | Female |
| No Vehicle | 0 (0.0%) | 0 (0.0%) |
| 1 Vehicle | 20 (16.7%) | 17 (13.9%) |
| 2 Vehicles | 80 (66.7%) | 50 (41.0%) |
| 3 Vehicles | 0 (0.0%) | 36 (29.5%) |
| 4 Vehicles | 20 (16.7%) | 19 (15.6%) |
| 5 or more Vehicles | 0 (0.0%) | 0 (0.0%) |
| Total | 120 (100.0%) | 122 (100.0%) |
Commute Time in Ruffin
The most frequently occuring commute durations in Ruffin are 30 to 34 minutes (83 commuters, 37.4%), 20 to 24 minutes (59 commuters, 26.6%), and less than 5 minutes (36 commuters, 16.2%).
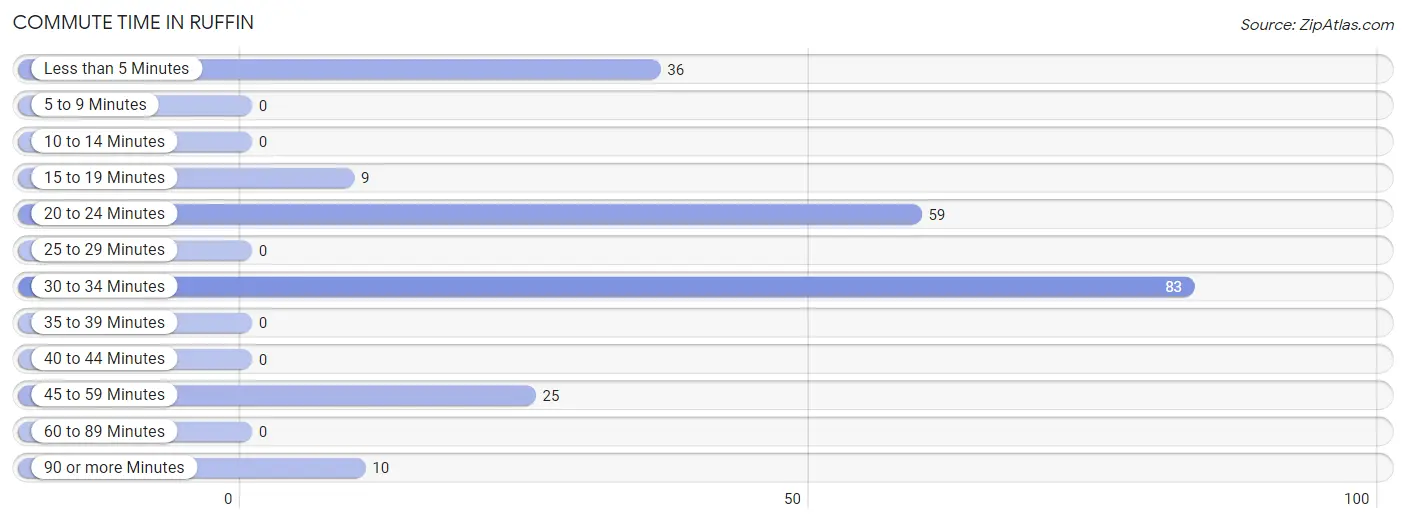
| Commute Time | # Commuters | % Commuters |
| Less than 5 Minutes | 36 | 16.2% |
| 5 to 9 Minutes | 0 | 0.0% |
| 10 to 14 Minutes | 0 | 0.0% |
| 15 to 19 Minutes | 9 | 4.1% |
| 20 to 24 Minutes | 59 | 26.6% |
| 25 to 29 Minutes | 0 | 0.0% |
| 30 to 34 Minutes | 83 | 37.4% |
| 35 to 39 Minutes | 0 | 0.0% |
| 40 to 44 Minutes | 0 | 0.0% |
| 45 to 59 Minutes | 25 | 11.3% |
| 60 to 89 Minutes | 0 | 0.0% |
| 90 or more Minutes | 10 | 4.5% |
Commute Time by Sex in Ruffin
The most common commute times in Ruffin are 30 to 34 minutes (80 commuters, 73.4%) for males and 20 to 24 minutes (50 commuters, 44.3%) for females.
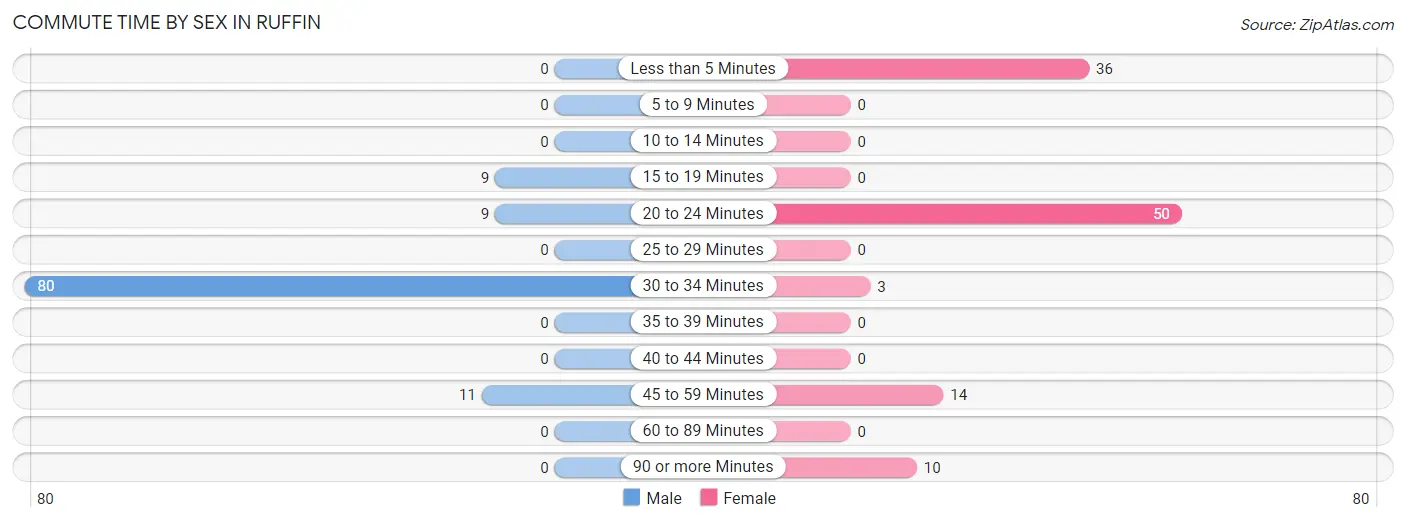
| Commute Time | Male | Female |
| Less than 5 Minutes | 0 (0.0%) | 36 (31.9%) |
| 5 to 9 Minutes | 0 (0.0%) | 0 (0.0%) |
| 10 to 14 Minutes | 0 (0.0%) | 0 (0.0%) |
| 15 to 19 Minutes | 9 (8.3%) | 0 (0.0%) |
| 20 to 24 Minutes | 9 (8.3%) | 50 (44.3%) |
| 25 to 29 Minutes | 0 (0.0%) | 0 (0.0%) |
| 30 to 34 Minutes | 80 (73.4%) | 3 (2.6%) |
| 35 to 39 Minutes | 0 (0.0%) | 0 (0.0%) |
| 40 to 44 Minutes | 0 (0.0%) | 0 (0.0%) |
| 45 to 59 Minutes | 11 (10.1%) | 14 (12.4%) |
| 60 to 89 Minutes | 0 (0.0%) | 0 (0.0%) |
| 90 or more Minutes | 0 (0.0%) | 10 (8.8%) |
Time of Departure to Work by Sex in Ruffin
The most frequent times of departure to work in Ruffin are 4:00 PM to 11:59 PM (80, 73.4%) for males and 7:30 AM to 7:59 AM (50, 44.3%) for females.
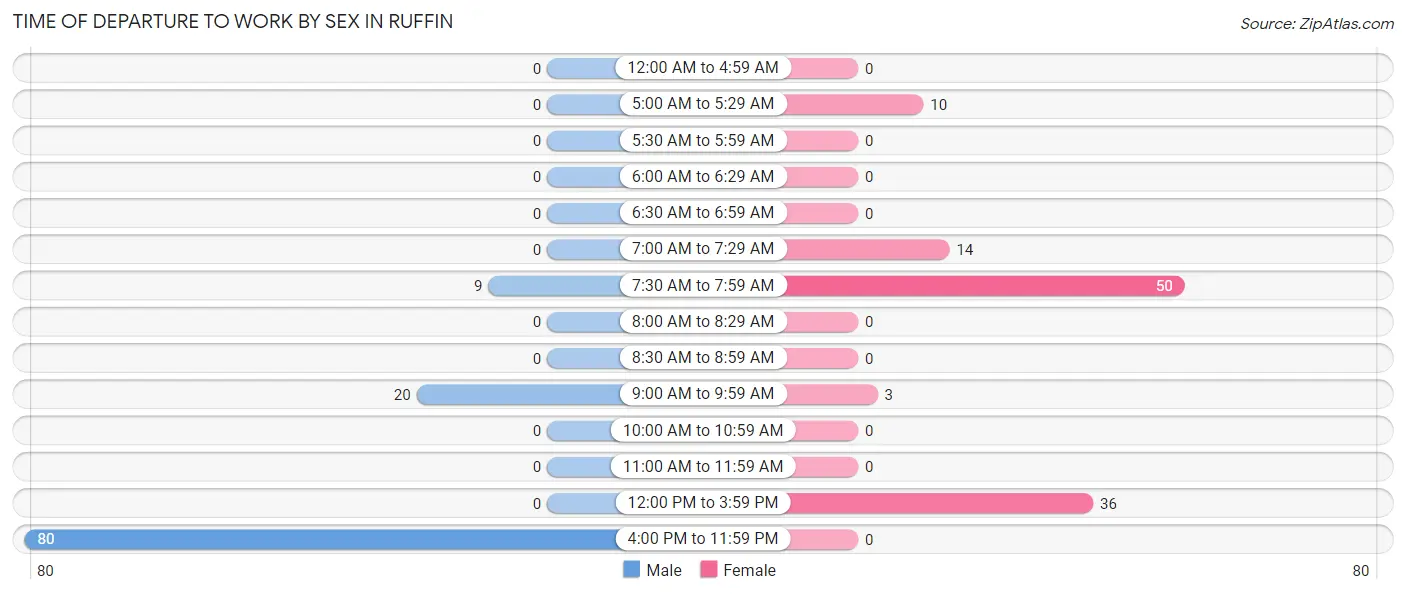
| Time of Departure | Male | Female |
| 12:00 AM to 4:59 AM | 0 (0.0%) | 0 (0.0%) |
| 5:00 AM to 5:29 AM | 0 (0.0%) | 10 (8.8%) |
| 5:30 AM to 5:59 AM | 0 (0.0%) | 0 (0.0%) |
| 6:00 AM to 6:29 AM | 0 (0.0%) | 0 (0.0%) |
| 6:30 AM to 6:59 AM | 0 (0.0%) | 0 (0.0%) |
| 7:00 AM to 7:29 AM | 0 (0.0%) | 14 (12.4%) |
| 7:30 AM to 7:59 AM | 9 (8.3%) | 50 (44.3%) |
| 8:00 AM to 8:29 AM | 0 (0.0%) | 0 (0.0%) |
| 8:30 AM to 8:59 AM | 0 (0.0%) | 0 (0.0%) |
| 9:00 AM to 9:59 AM | 20 (18.3%) | 3 (2.6%) |
| 10:00 AM to 10:59 AM | 0 (0.0%) | 0 (0.0%) |
| 11:00 AM to 11:59 AM | 0 (0.0%) | 0 (0.0%) |
| 12:00 PM to 3:59 PM | 0 (0.0%) | 36 (31.9%) |
| 4:00 PM to 11:59 PM | 80 (73.4%) | 0 (0.0%) |
| Total | 109 (100.0%) | 113 (100.0%) |
Housing Occupancy in Ruffin
Occupancy by Ownership in Ruffin
Of the total 216 dwellings in Ruffin, owner-occupied units account for 155 (71.8%), while renter-occupied units make up 61 (28.2%).
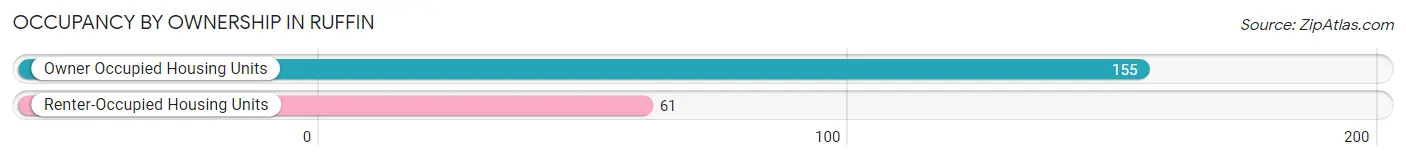
| Occupancy | # Housing Units | % Housing Units |
| Owner Occupied Housing Units | 155 | 71.8% |
| Renter-Occupied Housing Units | 61 | 28.2% |
| Total Occupied Housing Units | 216 | 100.0% |
Occupancy by Household Size in Ruffin
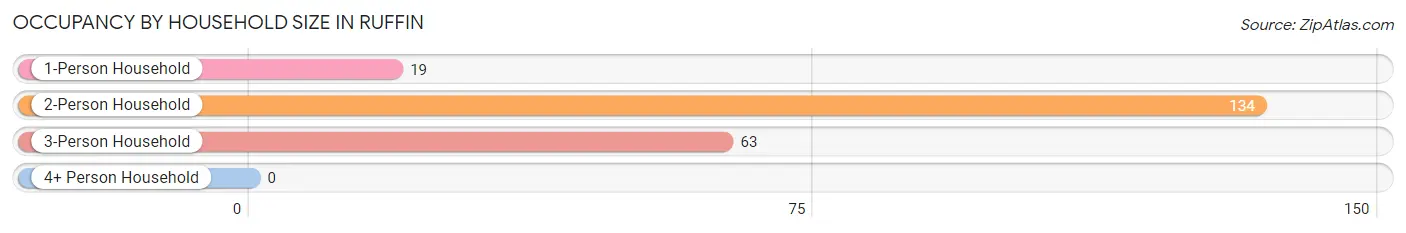
| Household Size | # Housing Units | % Housing Units |
| 1-Person Household | 19 | 8.8% |
| 2-Person Household | 134 | 62.0% |
| 3-Person Household | 63 | 29.2% |
| 4+ Person Household | 0 | 0.0% |
| Total Housing Units | 216 | 100.0% |
Occupancy by Ownership by Household Size in Ruffin
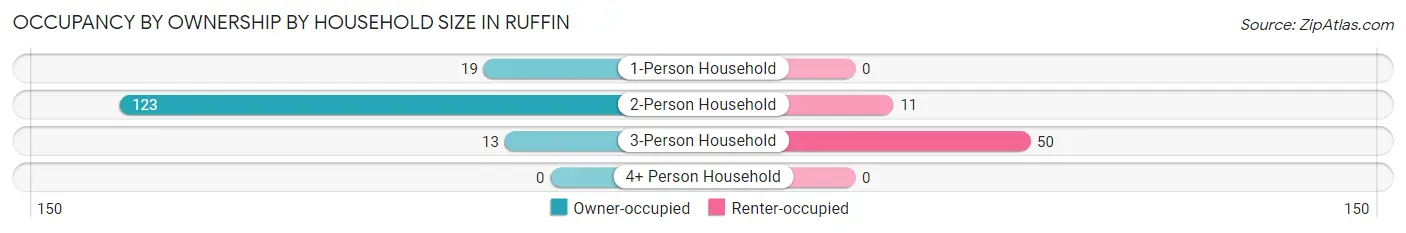
| Household Size | Owner-occupied | Renter-occupied |
| 1-Person Household | 19 (100.0%) | 0 (0.0%) |
| 2-Person Household | 123 (91.8%) | 11 (8.2%) |
| 3-Person Household | 13 (20.6%) | 50 (79.4%) |
| 4+ Person Household | 0 (0.0%) | 0 (0.0%) |
| Total Housing Units | 155 (71.8%) | 61 (28.2%) |
Occupancy by Educational Attainment in Ruffin
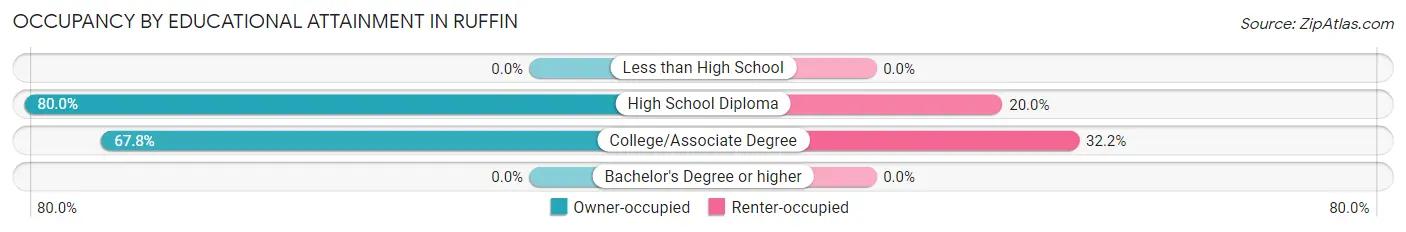
| Household Size | Owner-occupied | Renter-occupied |
| Less than High School | 0 (0.0%) | 0 (0.0%) |
| High School Diploma | 56 (80.0%) | 14 (20.0%) |
| College/Associate Degree | 99 (67.8%) | 47 (32.2%) |
| Bachelor's Degree or higher | 0 (0.0%) | 0 (0.0%) |
Occupancy by Age of Householder in Ruffin
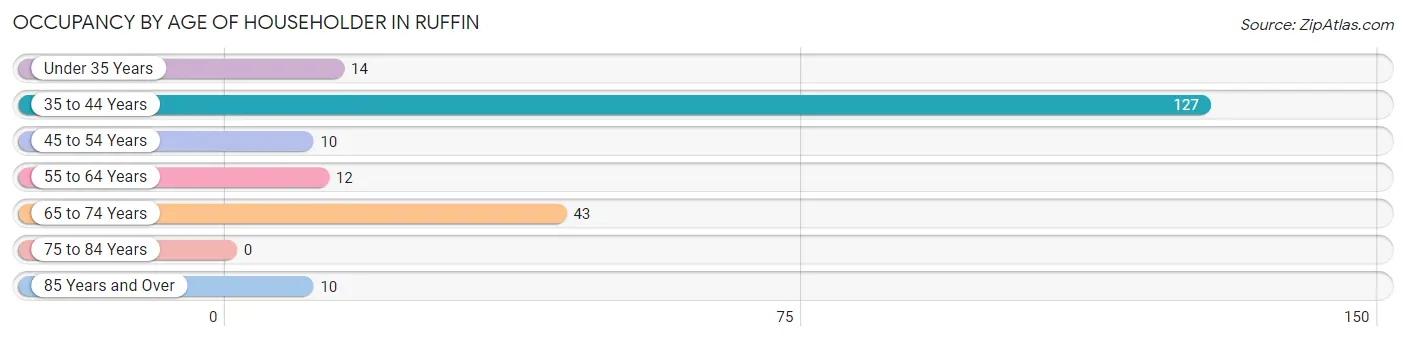
| Age Bracket | # Households | % Households |
| Under 35 Years | 14 | 6.5% |
| 35 to 44 Years | 127 | 58.8% |
| 45 to 54 Years | 10 | 4.6% |
| 55 to 64 Years | 12 | 5.6% |
| 65 to 74 Years | 43 | 19.9% |
| 75 to 84 Years | 0 | 0.0% |
| 85 Years and Over | 10 | 4.6% |
| Total | 216 | 100.0% |
Housing Finances in Ruffin
Median Income by Occupancy in Ruffin
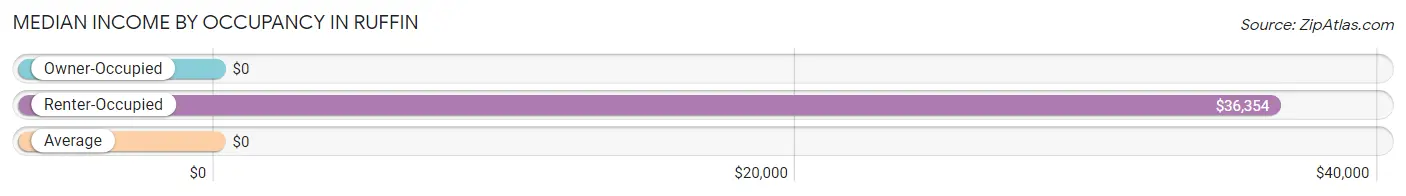
| Occupancy Type | # Households | Median Income |
| Owner-Occupied | 155 (71.8%) | $0 |
| Renter-Occupied | 61 (28.2%) | $36,354 |
| Average | 216 (100.0%) | $0 |
Occupancy by Householder Income Bracket in Ruffin
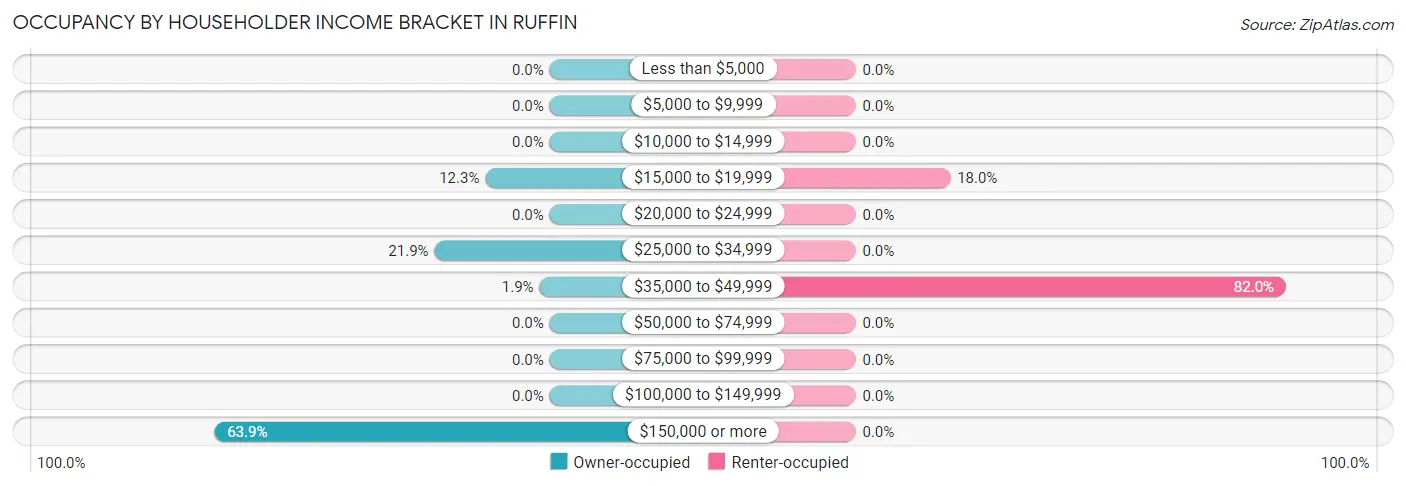
| Income Bracket | Owner-occupied | Renter-occupied |
| Less than $5,000 | 0 (0.0%) | 0 (0.0%) |
| $5,000 to $9,999 | 0 (0.0%) | 0 (0.0%) |
| $10,000 to $14,999 | 0 (0.0%) | 0 (0.0%) |
| $15,000 to $19,999 | 19 (12.3%) | 11 (18.0%) |
| $20,000 to $24,999 | 0 (0.0%) | 0 (0.0%) |
| $25,000 to $34,999 | 34 (21.9%) | 0 (0.0%) |
| $35,000 to $49,999 | 3 (1.9%) | 50 (82.0%) |
| $50,000 to $74,999 | 0 (0.0%) | 0 (0.0%) |
| $75,000 to $99,999 | 0 (0.0%) | 0 (0.0%) |
| $100,000 to $149,999 | 0 (0.0%) | 0 (0.0%) |
| $150,000 or more | 99 (63.9%) | 0 (0.0%) |
| Total | 155 (100.0%) | 61 (100.0%) |
Monthly Housing Cost Tiers in Ruffin
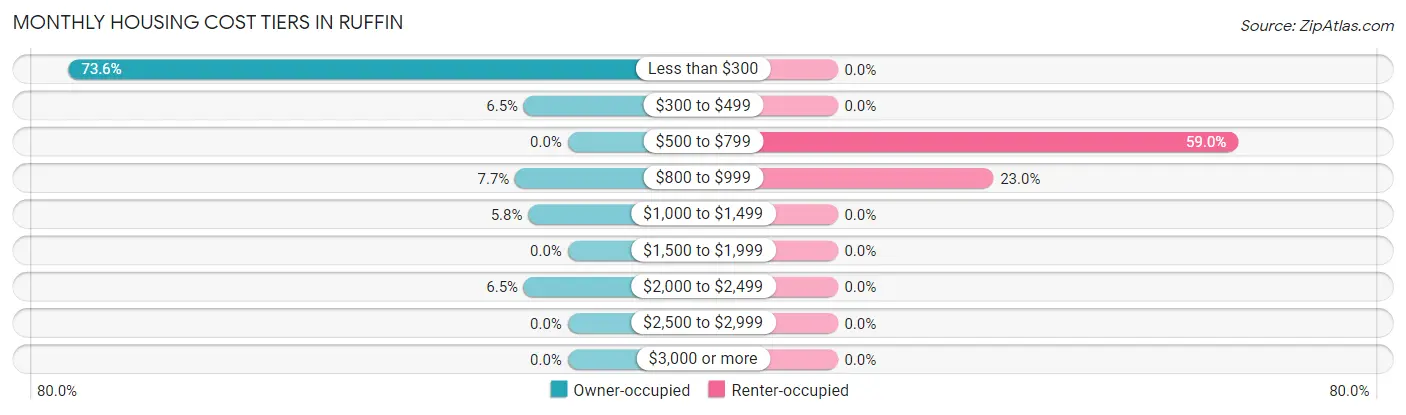
| Monthly Cost | Owner-occupied | Renter-occupied |
| Less than $300 | 114 (73.6%) | 0 (0.0%) |
| $300 to $499 | 10 (6.5%) | 0 (0.0%) |
| $500 to $799 | 0 (0.0%) | 36 (59.0%) |
| $800 to $999 | 12 (7.7%) | 14 (23.0%) |
| $1,000 to $1,499 | 9 (5.8%) | 0 (0.0%) |
| $1,500 to $1,999 | 0 (0.0%) | 0 (0.0%) |
| $2,000 to $2,499 | 10 (6.5%) | 0 (0.0%) |
| $2,500 to $2,999 | 0 (0.0%) | 0 (0.0%) |
| $3,000 or more | 0 (0.0%) | 0 (0.0%) |
| Total | 155 (100.0%) | 61 (100.0%) |
Physical Housing Characteristics in Ruffin
Housing Structures in Ruffin
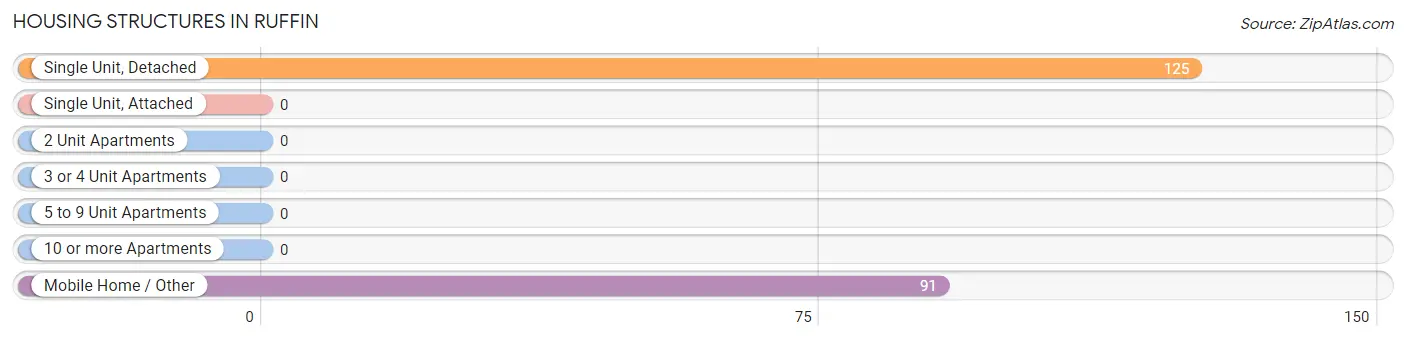
| Structure Type | # Housing Units | % Housing Units |
| Single Unit, Detached | 125 | 57.9% |
| Single Unit, Attached | 0 | 0.0% |
| 2 Unit Apartments | 0 | 0.0% |
| 3 or 4 Unit Apartments | 0 | 0.0% |
| 5 to 9 Unit Apartments | 0 | 0.0% |
| 10 or more Apartments | 0 | 0.0% |
| Mobile Home / Other | 91 | 42.1% |
| Total | 216 | 100.0% |
Housing Structures by Occupancy in Ruffin
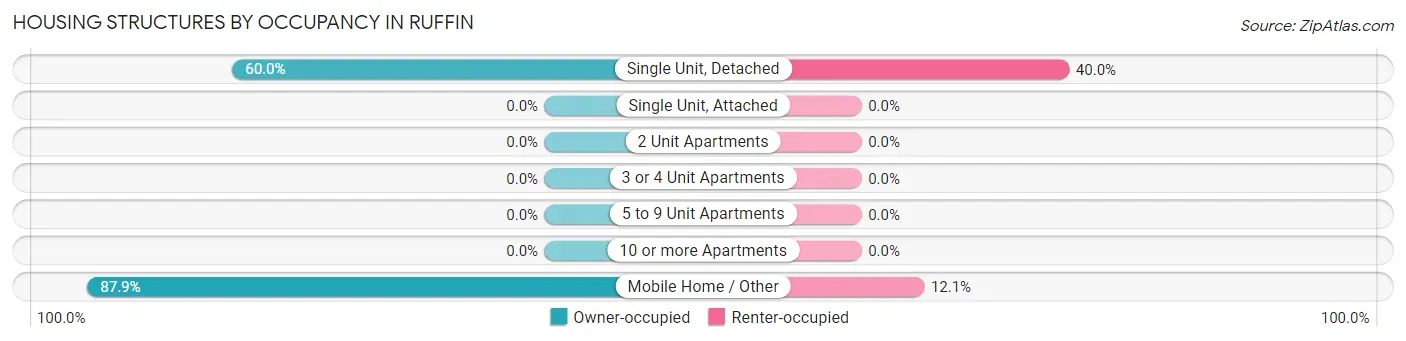
| Structure Type | Owner-occupied | Renter-occupied |
| Single Unit, Detached | 75 (60.0%) | 50 (40.0%) |
| Single Unit, Attached | 0 (0.0%) | 0 (0.0%) |
| 2 Unit Apartments | 0 (0.0%) | 0 (0.0%) |
| 3 or 4 Unit Apartments | 0 (0.0%) | 0 (0.0%) |
| 5 to 9 Unit Apartments | 0 (0.0%) | 0 (0.0%) |
| 10 or more Apartments | 0 (0.0%) | 0 (0.0%) |
| Mobile Home / Other | 80 (87.9%) | 11 (12.1%) |
| Total | 155 (71.8%) | 61 (28.2%) |
Housing Structures by Number of Rooms in Ruffin
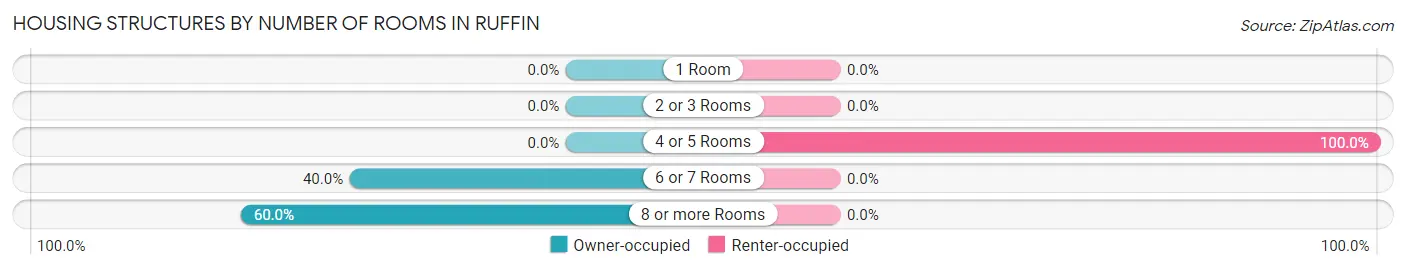
| Number of Rooms | Owner-occupied | Renter-occupied |
| 1 Room | 0 (0.0%) | 0 (0.0%) |
| 2 or 3 Rooms | 0 (0.0%) | 0 (0.0%) |
| 4 or 5 Rooms | 0 (0.0%) | 61 (100.0%) |
| 6 or 7 Rooms | 62 (40.0%) | 0 (0.0%) |
| 8 or more Rooms | 93 (60.0%) | 0 (0.0%) |
| Total | 155 (100.0%) | 61 (100.0%) |
Housing Structure by Heating Type in Ruffin
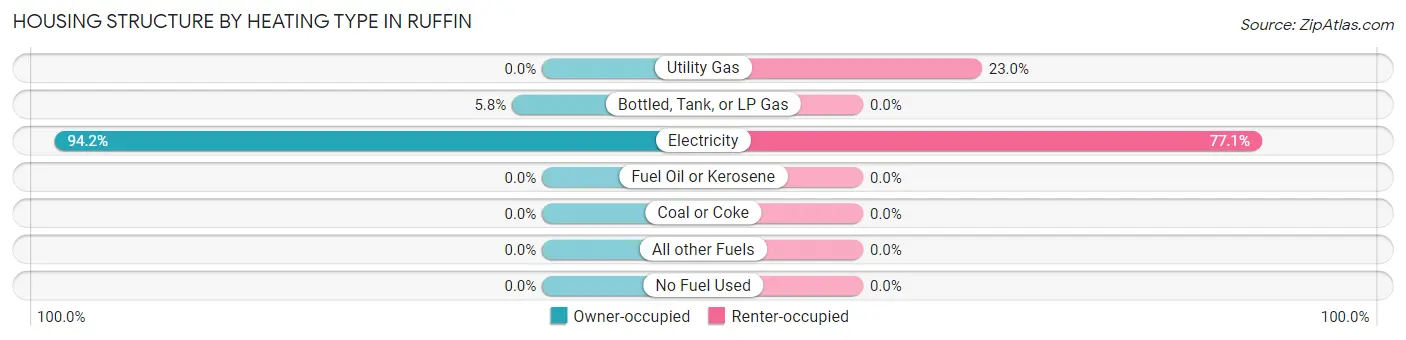
| Heating Type | Owner-occupied | Renter-occupied |
| Utility Gas | 0 (0.0%) | 14 (23.0%) |
| Bottled, Tank, or LP Gas | 9 (5.8%) | 0 (0.0%) |
| Electricity | 146 (94.2%) | 47 (77.0%) |
| Fuel Oil or Kerosene | 0 (0.0%) | 0 (0.0%) |
| Coal or Coke | 0 (0.0%) | 0 (0.0%) |
| All other Fuels | 0 (0.0%) | 0 (0.0%) |
| No Fuel Used | 0 (0.0%) | 0 (0.0%) |
| Total | 155 (100.0%) | 61 (100.0%) |
Household Vehicle Usage in Ruffin
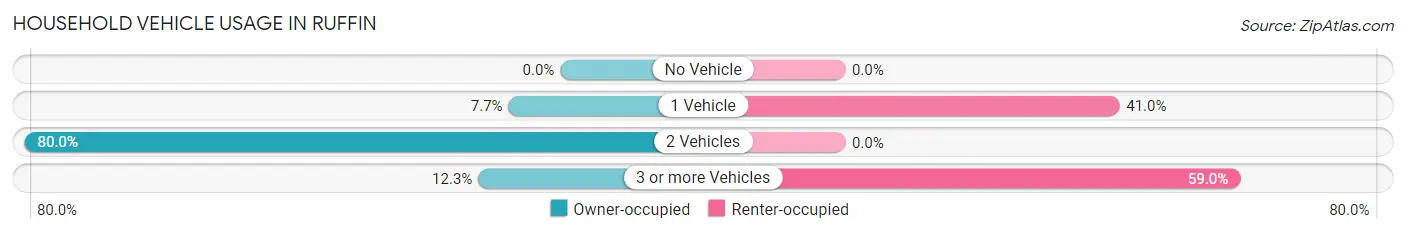
| Vehicles per Household | Owner-occupied | Renter-occupied |
| No Vehicle | 0 (0.0%) | 0 (0.0%) |
| 1 Vehicle | 12 (7.7%) | 25 (41.0%) |
| 2 Vehicles | 124 (80.0%) | 0 (0.0%) |
| 3 or more Vehicles | 19 (12.3%) | 36 (59.0%) |
| Total | 155 (100.0%) | 61 (100.0%) |
Real Estate & Mortgages in Ruffin
Real Estate and Mortgage Overview in Ruffin
| Characteristic | Without Mortgage | With Mortgage |
| Housing Units | 124 | 31 |
| Median Property Value | $113,600 | $227,100 |
| Median Household Income | - | - |
| Monthly Housing Costs | $218 | $0 |
| Real Estate Taxes | - | - |
Property Value by Mortgage Status in Ruffin
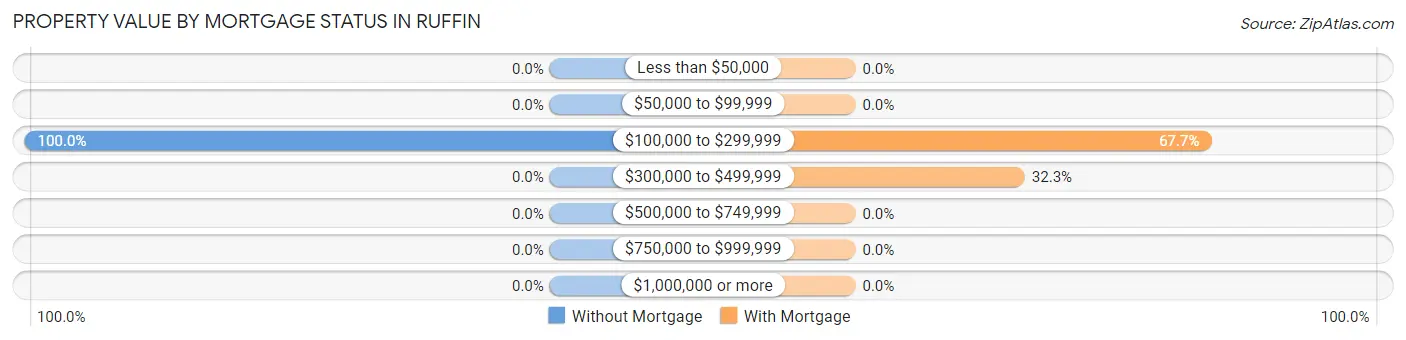
| Property Value | Without Mortgage | With Mortgage |
| Less than $50,000 | 0 (0.0%) | 0 (0.0%) |
| $50,000 to $99,999 | 0 (0.0%) | 0 (0.0%) |
| $100,000 to $299,999 | 124 (100.0%) | 21 (67.7%) |
| $300,000 to $499,999 | 0 (0.0%) | 10 (32.3%) |
| $500,000 to $749,999 | 0 (0.0%) | 0 (0.0%) |
| $750,000 to $999,999 | 0 (0.0%) | 0 (0.0%) |
| $1,000,000 or more | 0 (0.0%) | 0 (0.0%) |
| Total | 124 (100.0%) | 31 (100.0%) |
Household Income by Mortgage Status in Ruffin
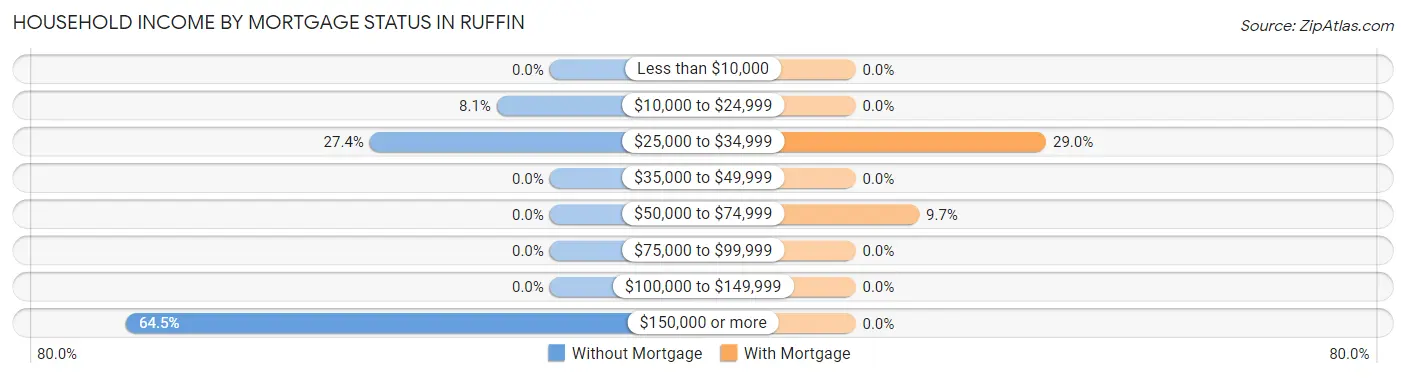
| Household Income | Without Mortgage | With Mortgage |
| Less than $10,000 | 0 (0.0%) | 0 (0.0%) |
| $10,000 to $24,999 | 10 (8.1%) | 0 (0.0%) |
| $25,000 to $34,999 | 34 (27.4%) | 9 (29.0%) |
| $35,000 to $49,999 | 0 (0.0%) | 0 (0.0%) |
| $50,000 to $74,999 | 0 (0.0%) | 3 (9.7%) |
| $75,000 to $99,999 | 0 (0.0%) | 0 (0.0%) |
| $100,000 to $149,999 | 0 (0.0%) | 0 (0.0%) |
| $150,000 or more | 80 (64.5%) | 0 (0.0%) |
| Total | 124 (100.0%) | 31 (100.0%) |
Property Value to Household Income Ratio in Ruffin
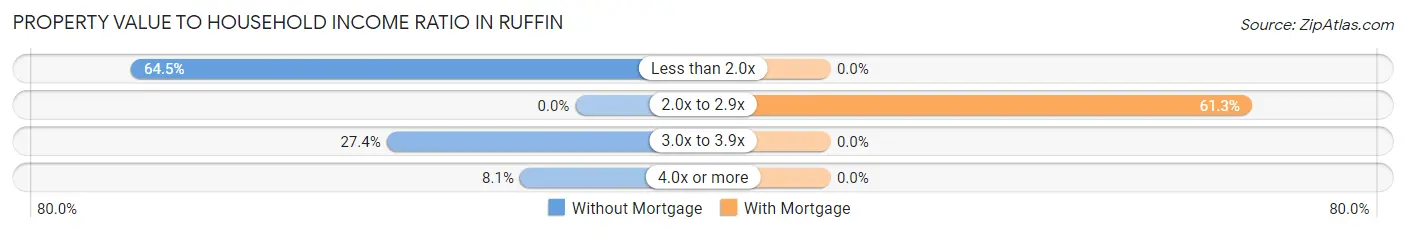
| Value-to-Income Ratio | Without Mortgage | With Mortgage |
| Less than 2.0x | 80 (64.5%) | 0 (0.0%) |
| 2.0x to 2.9x | 0 (0.0%) | 19 (61.3%) |
| 3.0x to 3.9x | 34 (27.4%) | 0 (0.0%) |
| 4.0x or more | 10 (8.1%) | 0 (0.0%) |
| Total | 124 (100.0%) | 31 (100.0%) |
Real Estate Taxes by Mortgage Status in Ruffin
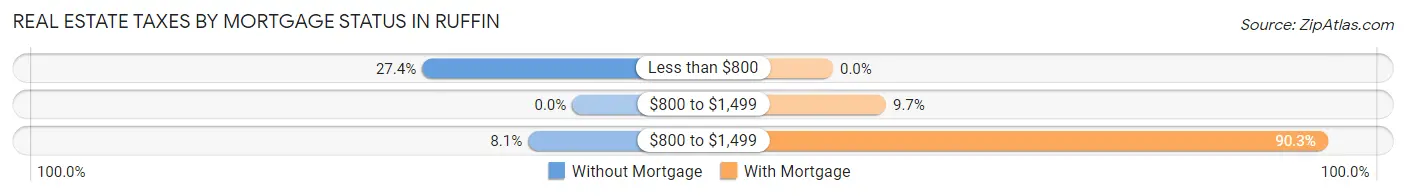
| Property Taxes | Without Mortgage | With Mortgage |
| Less than $800 | 34 (27.4%) | 0 (0.0%) |
| $800 to $1,499 | 0 (0.0%) | 3 (9.7%) |
| $800 to $1,499 | 10 (8.1%) | 28 (90.3%) |
| Total | 124 (100.0%) | 31 (100.0%) |
Health & Disability in Ruffin
Health Insurance Coverage by Age in Ruffin
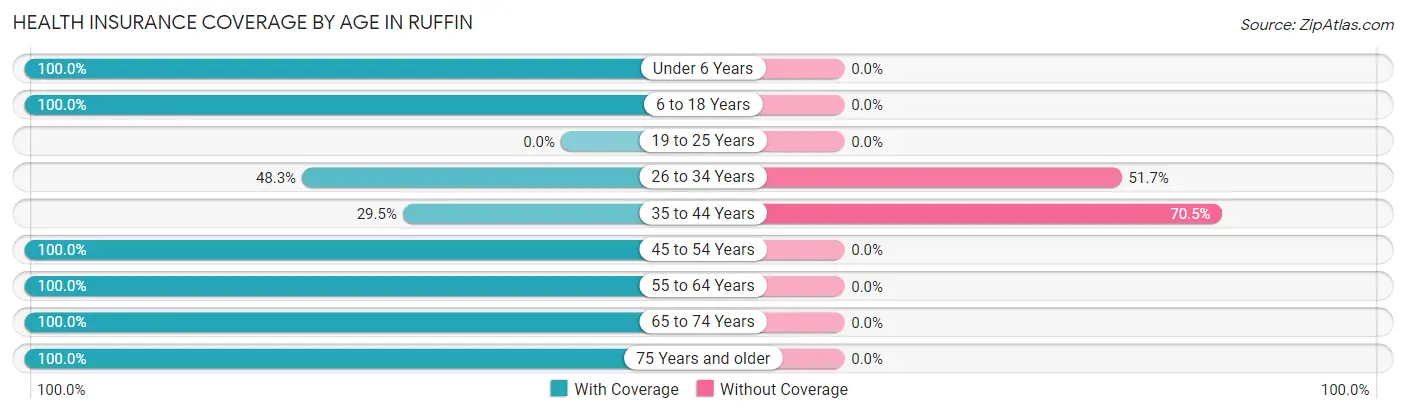
| Age Bracket | With Coverage | Without Coverage |
| Under 6 Years | 13 (100.0%) | 0 (0.0%) |
| 6 to 18 Years | 83 (100.0%) | 0 (0.0%) |
| 19 to 25 Years | 0 (0.0%) | 0 (0.0%) |
| 26 to 34 Years | 14 (48.3%) | 15 (51.7%) |
| 35 to 44 Years | 64 (29.5%) | 153 (70.5%) |
| 45 to 54 Years | 10 (100.0%) | 0 (0.0%) |
| 55 to 64 Years | 32 (100.0%) | 0 (0.0%) |
| 65 to 74 Years | 43 (100.0%) | 0 (0.0%) |
| 75 Years and older | 10 (100.0%) | 0 (0.0%) |
| Total | 269 (61.6%) | 168 (38.4%) |
Health Insurance Coverage by Citizenship Status in Ruffin
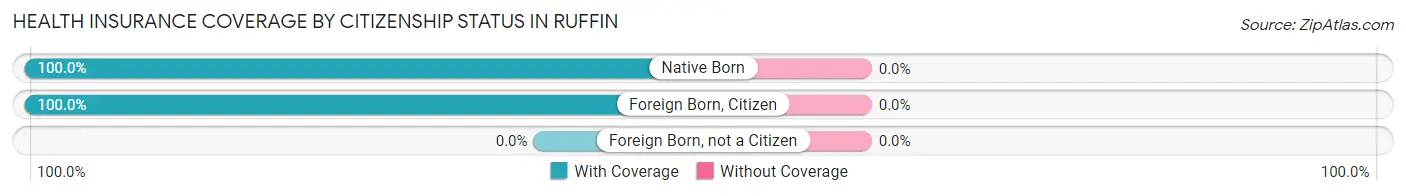
| Citizenship Status | With Coverage | Without Coverage |
| Native Born | 13 (100.0%) | 0 (0.0%) |
| Foreign Born, Citizen | 83 (100.0%) | 0 (0.0%) |
| Foreign Born, not a Citizen | 0 (0.0%) | 0 (0.0%) |
Health Insurance Coverage by Household Income in Ruffin
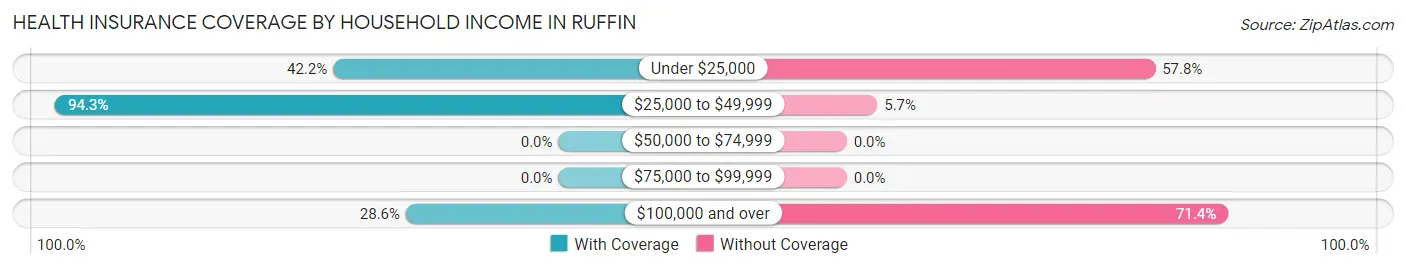
| Household Income | With Coverage | Without Coverage |
| Under $25,000 | 19 (42.2%) | 26 (57.8%) |
| $25,000 to $49,999 | 198 (94.3%) | 12 (5.7%) |
| $50,000 to $74,999 | 0 (0.0%) | 0 (0.0%) |
| $75,000 to $99,999 | 0 (0.0%) | 0 (0.0%) |
| $100,000 and over | 52 (28.6%) | 130 (71.4%) |
Public vs Private Health Insurance Coverage by Age in Ruffin
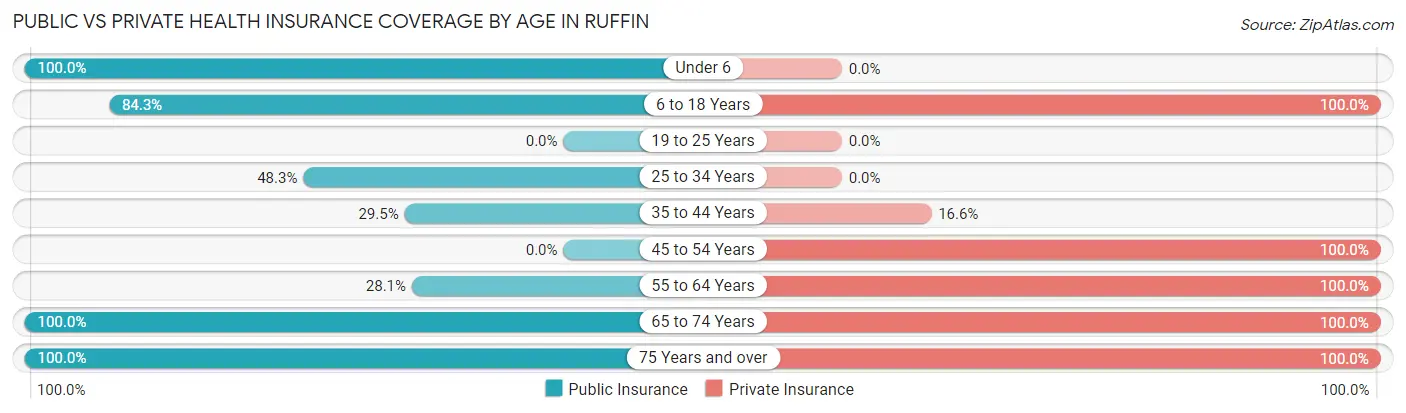
| Age Bracket | Public Insurance | Private Insurance |
| Under 6 | 13 (100.0%) | 0 (0.0%) |
| 6 to 18 Years | 70 (84.3%) | 83 (100.0%) |
| 19 to 25 Years | 0 (0.0%) | 0 (0.0%) |
| 25 to 34 Years | 14 (48.3%) | 0 (0.0%) |
| 35 to 44 Years | 64 (29.5%) | 36 (16.6%) |
| 45 to 54 Years | 0 (0.0%) | 10 (100.0%) |
| 55 to 64 Years | 9 (28.1%) | 32 (100.0%) |
| 65 to 74 Years | 43 (100.0%) | 43 (100.0%) |
| 75 Years and over | 10 (100.0%) | 10 (100.0%) |
| Total | 223 (51.0%) | 214 (49.0%) |
Disability Status by Sex by Age in Ruffin
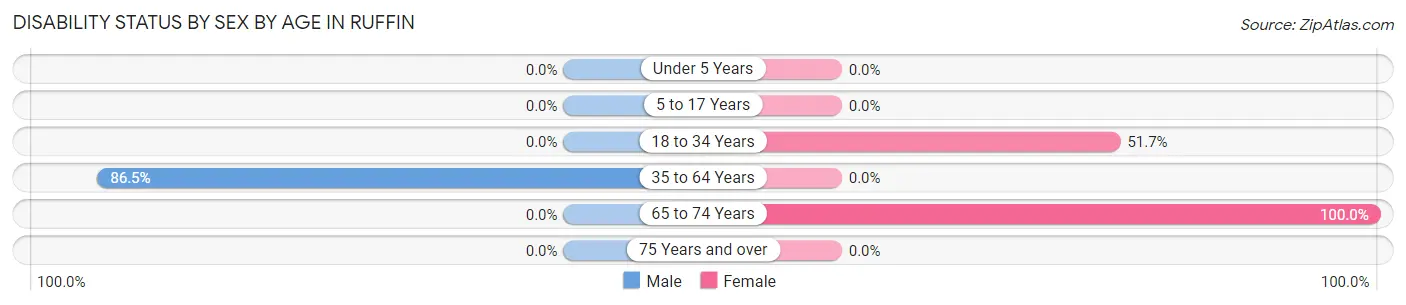
| Age Bracket | Male | Female |
| Under 5 Years | 0 (0.0%) | 0 (0.0%) |
| 5 to 17 Years | 0 (0.0%) | 0 (0.0%) |
| 18 to 34 Years | 0 (0.0%) | 15 (51.7%) |
| 35 to 64 Years | 128 (86.5%) | 0 (0.0%) |
| 65 to 74 Years | 0 (0.0%) | 34 (100.0%) |
| 75 Years and over | 0 (0.0%) | 0 (0.0%) |
Disability Class by Sex by Age in Ruffin
Disability Class: Hearing Difficulty
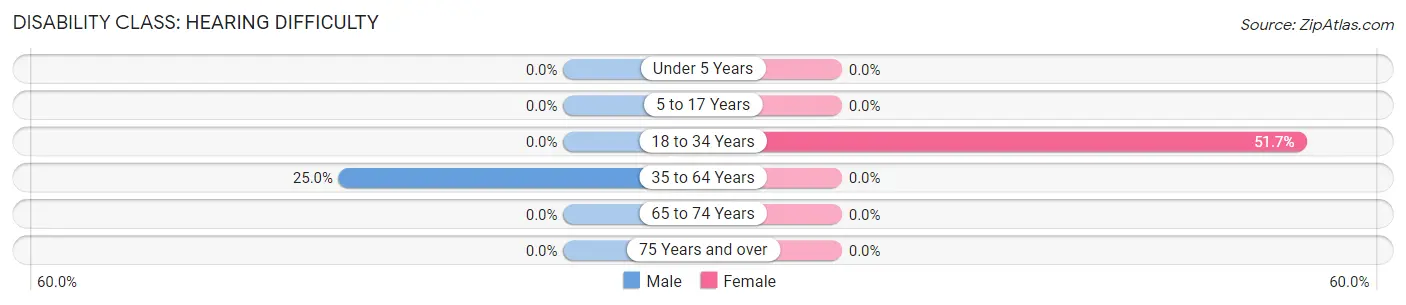
| Age Bracket | Male | Female |
| Under 5 Years | 0 (0.0%) | 0 (0.0%) |
| 5 to 17 Years | 0 (0.0%) | 0 (0.0%) |
| 18 to 34 Years | 0 (0.0%) | 15 (51.7%) |
| 35 to 64 Years | 37 (25.0%) | 0 (0.0%) |
| 65 to 74 Years | 0 (0.0%) | 0 (0.0%) |
| 75 Years and over | 0 (0.0%) | 0 (0.0%) |
Disability Class: Vision Difficulty
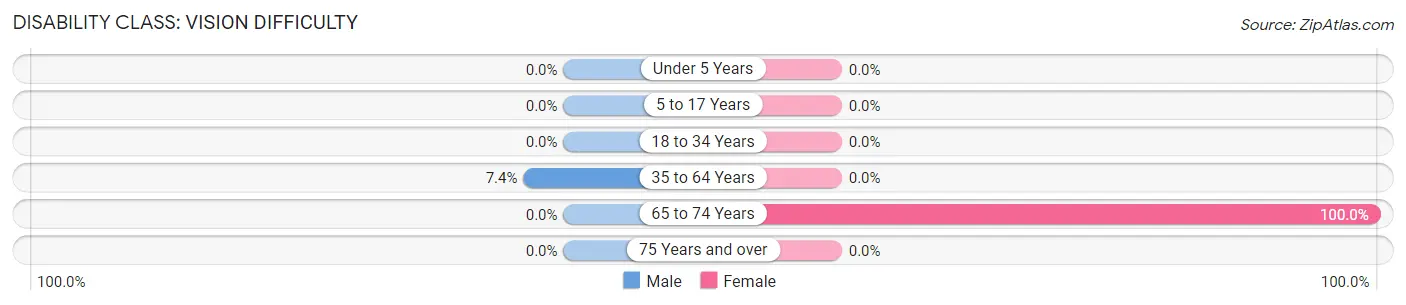
| Age Bracket | Male | Female |
| Under 5 Years | 0 (0.0%) | 0 (0.0%) |
| 5 to 17 Years | 0 (0.0%) | 0 (0.0%) |
| 18 to 34 Years | 0 (0.0%) | 0 (0.0%) |
| 35 to 64 Years | 11 (7.4%) | 0 (0.0%) |
| 65 to 74 Years | 0 (0.0%) | 34 (100.0%) |
| 75 Years and over | 0 (0.0%) | 0 (0.0%) |
Disability Class: Cognitive Difficulty
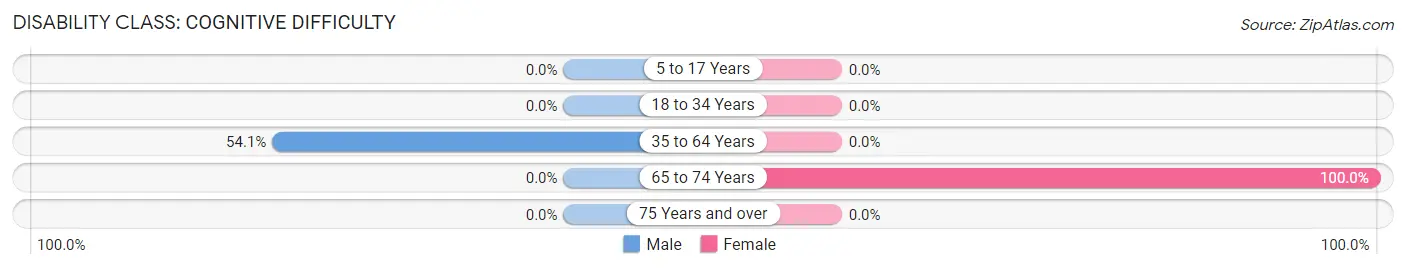
| Age Bracket | Male | Female |
| 5 to 17 Years | 0 (0.0%) | 0 (0.0%) |
| 18 to 34 Years | 0 (0.0%) | 0 (0.0%) |
| 35 to 64 Years | 80 (54.0%) | 0 (0.0%) |
| 65 to 74 Years | 0 (0.0%) | 34 (100.0%) |
| 75 Years and over | 0 (0.0%) | 0 (0.0%) |
Disability Class: Ambulatory Difficulty
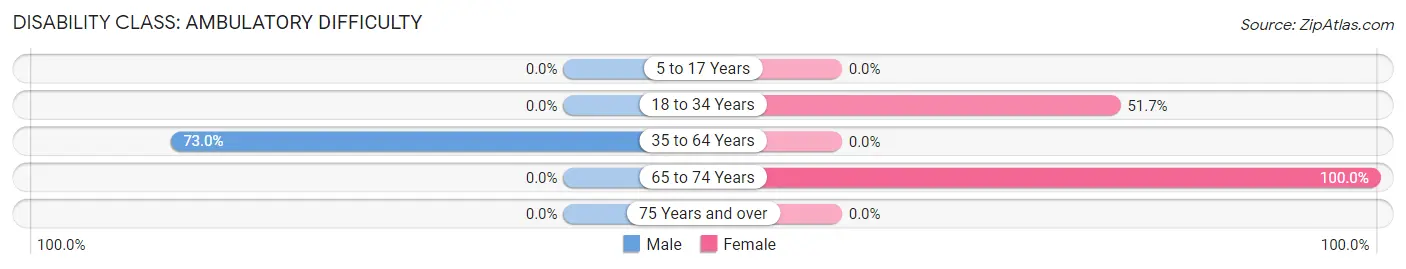
| Age Bracket | Male | Female |
| 5 to 17 Years | 0 (0.0%) | 0 (0.0%) |
| 18 to 34 Years | 0 (0.0%) | 15 (51.7%) |
| 35 to 64 Years | 108 (73.0%) | 0 (0.0%) |
| 65 to 74 Years | 0 (0.0%) | 34 (100.0%) |
| 75 Years and over | 0 (0.0%) | 0 (0.0%) |
Disability Class: Self-Care Difficulty

| Age Bracket | Male | Female |
| 5 to 17 Years | 0 (0.0%) | 0 (0.0%) |
| 18 to 34 Years | 0 (0.0%) | 0 (0.0%) |
| 35 to 64 Years | 80 (54.0%) | 0 (0.0%) |
| 65 to 74 Years | 0 (0.0%) | 34 (100.0%) |
| 75 Years and over | 0 (0.0%) | 0 (0.0%) |
Technology Access in Ruffin
Computing Device Access in Ruffin
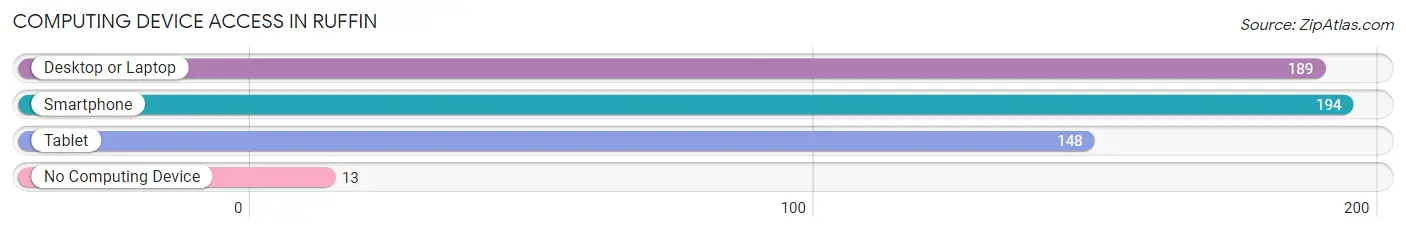
| Device Type | # Households | % Households |
| Desktop or Laptop | 189 | 87.5% |
| Smartphone | 194 | 89.8% |
| Tablet | 148 | 68.5% |
| No Computing Device | 13 | 6.0% |
| Total | 216 | 100.0% |
Internet Access in Ruffin
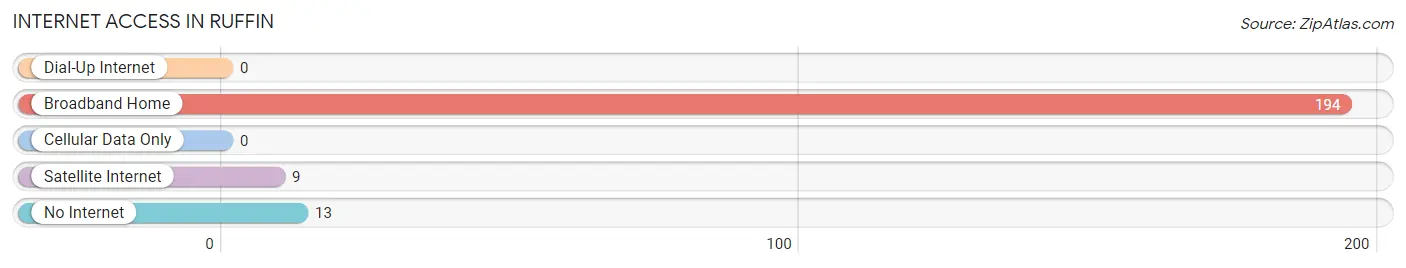
| Internet Type | # Households | % Households |
| Dial-Up Internet | 0 | 0.0% |
| Broadband Home | 194 | 89.8% |
| Cellular Data Only | 0 | 0.0% |
| Satellite Internet | 9 | 4.2% |
| No Internet | 13 | 6.0% |
| Total | 216 | 100.0% |
Ruffin Summary
Ruffin is a small town located in Rockingham County, North Carolina. It is situated in the northern part of the state, about 25 miles east of Greensboro. The town was founded in 1883 and has a population of approximately 1,000 people.
Geography
Ruffin is located in the Piedmont region of North Carolina, which is characterized by rolling hills and valleys. The town is situated on the banks of the Dan River, which is a tributary of the Roanoke River. The town is surrounded by farmland and is home to several small lakes. The climate in Ruffin is mild, with temperatures ranging from the mid-50s in the winter to the mid-80s in the summer.
Economy
Ruffin’s economy is largely based on agriculture. The town is home to several farms, which produce a variety of crops, including corn, soybeans, and tobacco. The town also has a few small businesses, including a grocery store, a hardware store, and a few restaurants.
Demographics
Ruffin is a predominantly white town, with approximately 90% of the population being Caucasian. The remaining 10% of the population is made up of African Americans, Hispanics, and other ethnicities. The median household income in Ruffin is $35,000, and the median home value is $90,000.
Education
Ruffin is served by the Rockingham County School District. The town has one elementary school, one middle school, and one high school. The schools are well-regarded and offer a variety of educational opportunities for students.
Conclusion
Ruffin is a small town located in Rockingham County, North Carolina. It is situated in the northern part of the state, about 25 miles east of Greensboro. The town was founded in 1883 and has a population of approximately 1,000 people. The economy of Ruffin is largely based on agriculture, and the town is served by the Rockingham County School District. The town is predominantly white, with approximately 90% of the population being Caucasian. The median household income in Ruffin is $35,000, and the median home value is $90,000.
Common Questions
What is Per Capita Income in Ruffin?
Per Capita income in Ruffin is $41,726.
What is Income or Wage Gap in Ruffin?
Income or Wage Gap in Ruffin is 22.4%.
Women in Ruffin earn 77.6 cents for every dollar earned by a man.
What is Inequality or Gini Index in Ruffin?
Inequality or Gini Index in Ruffin is 0.39.
What is the Total Population of Ruffin?
Total Population of Ruffin is 437.
What is the Total Male Population of Ruffin?
Total Male Population of Ruffin is 216.
What is the Total Female Population of Ruffin?
Total Female Population of Ruffin is 221.
What is the Ratio of Males per 100 Females in Ruffin?
There are 97.74 Males per 100 Females in Ruffin.
What is the Ratio of Females per 100 Males in Ruffin?
There are 102.31 Females per 100 Males in Ruffin.
What is the Median Population Age in Ruffin?
Median Population Age in Ruffin is 38.2 Years.
What is the Average Family Size in Ruffin
Average Family Size in Ruffin is 2.1 People.
What is the Average Household Size in Ruffin
Average Household Size in Ruffin is 2.0 People.
How Large is the Labor Force in Ruffin?
There are 257 People in the Labor Forcein in Ruffin.
What is the Percentage of People in the Labor Force in Ruffin?
72.6% of People are in the Labor Force in Ruffin.
What is the Unemployment Rate in Ruffin?
Unemployment Rate in Ruffin is 5.8%.