Columbus, NC Map & Demographics
Columbus Map
Columbus Overview
$25,308
PER CAPITA INCOME
$63,495
AVG FAMILY INCOME
$53,333
AVG HOUSEHOLD INCOME
32.5%
WAGE / INCOME GAP [ % ]
67.5¢/ $1
WAGE / INCOME GAP [ $ ]
0.42
INEQUALITY / GINI INDEX
1,087
TOTAL POPULATION
468
MALE POPULATION
619
FEMALE POPULATION
75.61
MALES / 100 FEMALES
132.26
FEMALES / 100 MALES
49.2
MEDIAN AGE
2.9
AVG FAMILY SIZE
2.1
AVG HOUSEHOLD SIZE
466
LABOR FORCE [ PEOPLE ]
49.9%
PERCENT IN LABOR FORCE
3.2%
UNEMPLOYMENT RATE
Columbus Zip Codes
Columbus Area Codes
Income in Columbus
Income Overview in Columbus
Per Capita Income in Columbus is $25,308, while median incomes of families and households are $63,495 and $53,333 respectively.
| Characteristic | Number | Measure |
| Per Capita Income | 1,087 | $25,308 |
| Median Family Income | 295 | $63,495 |
| Mean Family Income | 295 | $69,762 |
| Median Household Income | 488 | $53,333 |
| Mean Household Income | 488 | $54,053 |
| Income Deficit | 295 | $0 |
| Wage / Income Gap (%) | 1,087 | 32.51% |
| Wage / Income Gap ($) | 1,087 | 67.49¢ per $1 |
| Gini / Inequality Index | 1,087 | 0.42 |
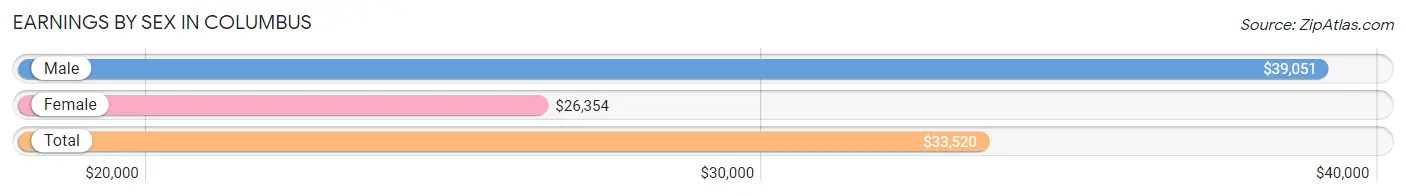
Earnings by Sex in Columbus
Average Earnings in Columbus are $33,520, $39,051 for men and $26,354 for women, a difference of 32.5%.
| Sex | Number | Average Earnings |
| Male | 245 (48.8%) | $39,051 |
| Female | 257 (51.2%) | $26,354 |
| Total | 502 (100.0%) | $33,520 |
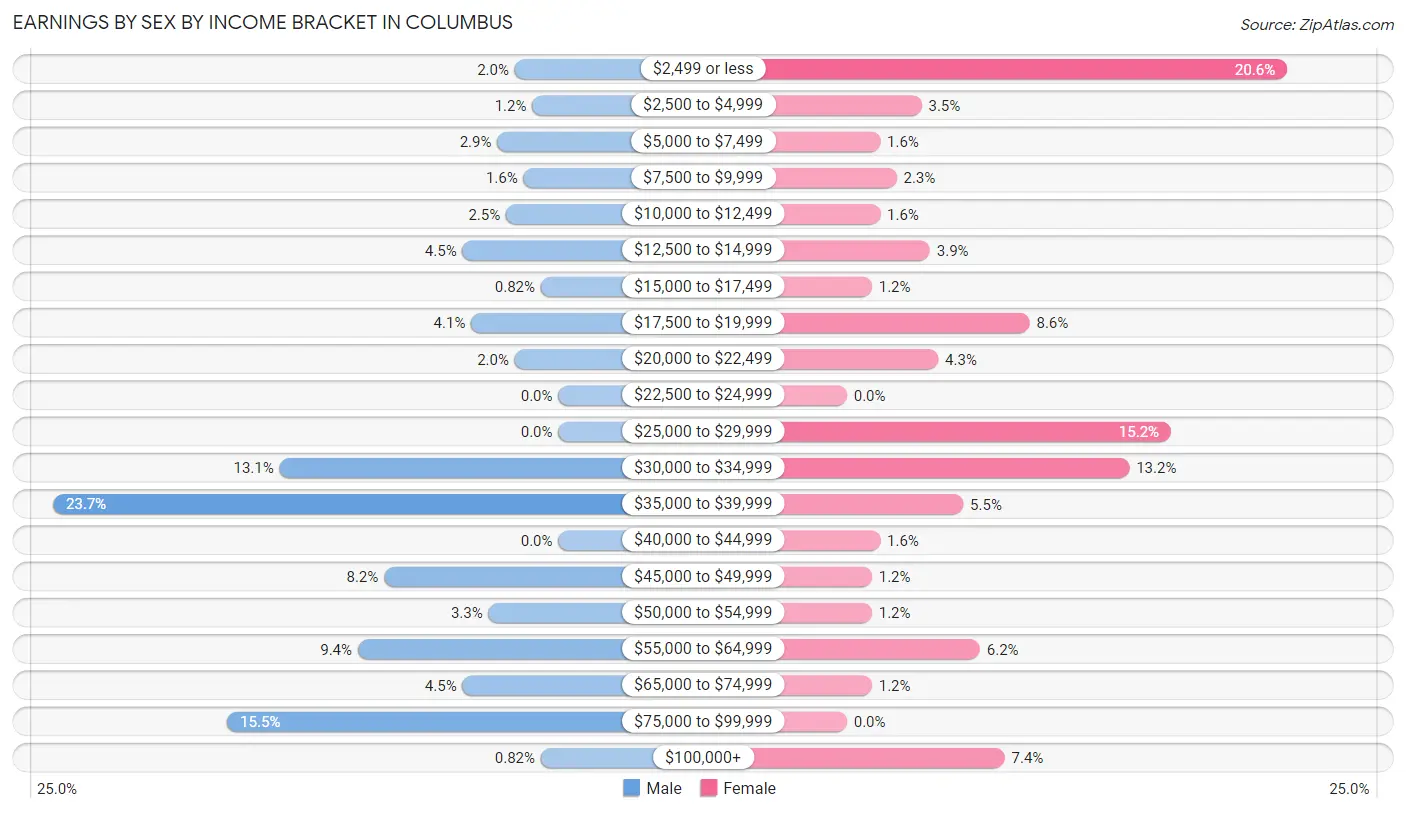
Earnings by Sex by Income Bracket in Columbus
The most common earnings brackets in Columbus are $35,000 to $39,999 for men (58 | 23.7%) and $2,499 or less for women (53 | 20.6%).
| Income | Male | Female |
| $2,499 or less | 5 (2.0%) | 53 (20.6%) |
| $2,500 to $4,999 | 3 (1.2%) | 9 (3.5%) |
| $5,000 to $7,499 | 7 (2.9%) | 4 (1.6%) |
| $7,500 to $9,999 | 4 (1.6%) | 6 (2.3%) |
| $10,000 to $12,499 | 6 (2.5%) | 4 (1.6%) |
| $12,500 to $14,999 | 11 (4.5%) | 10 (3.9%) |
| $15,000 to $17,499 | 2 (0.8%) | 3 (1.2%) |
| $17,500 to $19,999 | 10 (4.1%) | 22 (8.6%) |
| $20,000 to $22,499 | 5 (2.0%) | 11 (4.3%) |
| $22,500 to $24,999 | 0 (0.0%) | 0 (0.0%) |
| $25,000 to $29,999 | 0 (0.0%) | 39 (15.2%) |
| $30,000 to $34,999 | 32 (13.1%) | 34 (13.2%) |
| $35,000 to $39,999 | 58 (23.7%) | 14 (5.4%) |
| $40,000 to $44,999 | 0 (0.0%) | 4 (1.6%) |
| $45,000 to $49,999 | 20 (8.2%) | 3 (1.2%) |
| $50,000 to $54,999 | 8 (3.3%) | 3 (1.2%) |
| $55,000 to $64,999 | 23 (9.4%) | 16 (6.2%) |
| $65,000 to $74,999 | 11 (4.5%) | 3 (1.2%) |
| $75,000 to $99,999 | 38 (15.5%) | 0 (0.0%) |
| $100,000+ | 2 (0.8%) | 19 (7.4%) |
| Total | 245 (100.0%) | 257 (100.0%) |
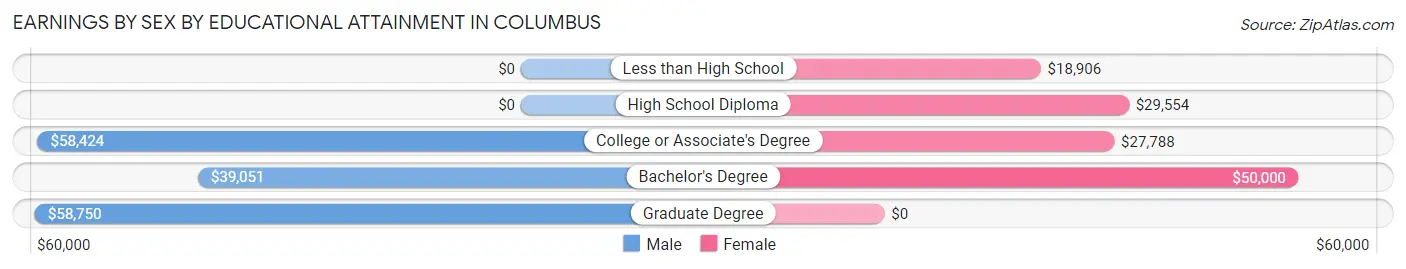
Earnings by Sex by Educational Attainment in Columbus
Average earnings in Columbus are $39,444 for men and $28,241 for women, a difference of 28.4%. Men with an educational attainment of graduate degree enjoy the highest average annual earnings of $58,750, while those with bachelor's degree education earn the least with $39,051. Women with an educational attainment of bachelor's degree earn the most with the average annual earnings of $50,000, while those with less than high school education have the smallest earnings of $18,906.
| Educational Attainment | Male Income | Female Income |
| Less than High School | - | - |
| High School Diploma | - | - |
| College or Associate's Degree | $58,424 | $27,788 |
| Bachelor's Degree | $39,051 | $50,000 |
| Graduate Degree | $58,750 | $0 |
| Total | $39,444 | $28,241 |
Family Income in Columbus
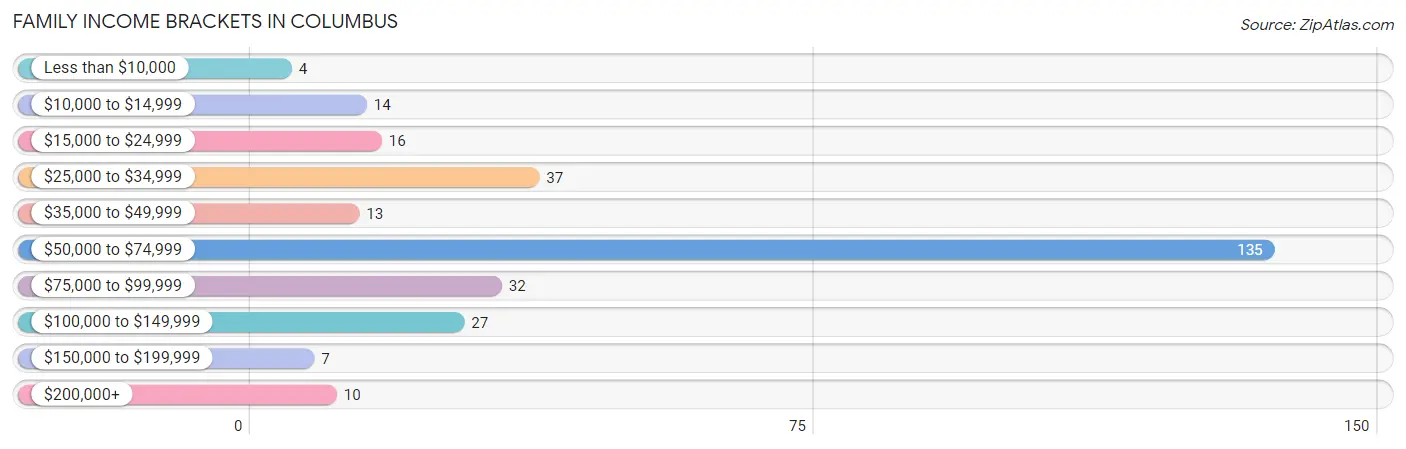
Family Income Brackets in Columbus
According to the Columbus family income data, there are 135 families falling into the $50,000 to $74,999 income range, which is the most common income bracket and makes up 45.8% of all families. Conversely, the less than $10,000 income bracket is the least frequent group with only 4 families (1.4%) belonging to this category.
| Income Bracket | # Families | % Families |
| Less than $10,000 | 4 | 1.4% |
| $10,000 to $14,999 | 14 | 4.7% |
| $15,000 to $24,999 | 16 | 5.4% |
| $25,000 to $34,999 | 37 | 12.5% |
| $35,000 to $49,999 | 13 | 4.4% |
| $50,000 to $74,999 | 135 | 45.8% |
| $75,000 to $99,999 | 32 | 10.8% |
| $100,000 to $149,999 | 27 | 9.2% |
| $150,000 to $199,999 | 7 | 2.4% |
| $200,000+ | 10 | 3.4% |
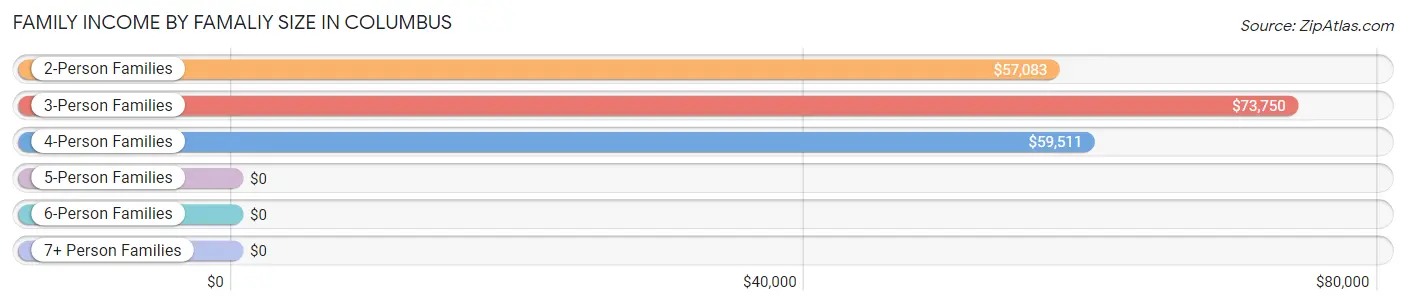
Family Income by Famaliy Size in Columbus
3-person families (69 | 23.4%) account for the highest median family income in Columbus with $73,750 per family, while 2-person families (153 | 51.9%) have the highest median income of $28,542 per family member.
| Income Bracket | # Families | Median Income |
| 2-Person Families | 153 (51.9%) | $57,083 |
| 3-Person Families | 69 (23.4%) | $73,750 |
| 4-Person Families | 43 (14.6%) | $59,511 |
| 5-Person Families | 22 (7.5%) | $0 |
| 6-Person Families | 8 (2.7%) | $0 |
| 7+ Person Families | 0 (0.0%) | $0 |
| Total | 295 (100.0%) | $63,495 |
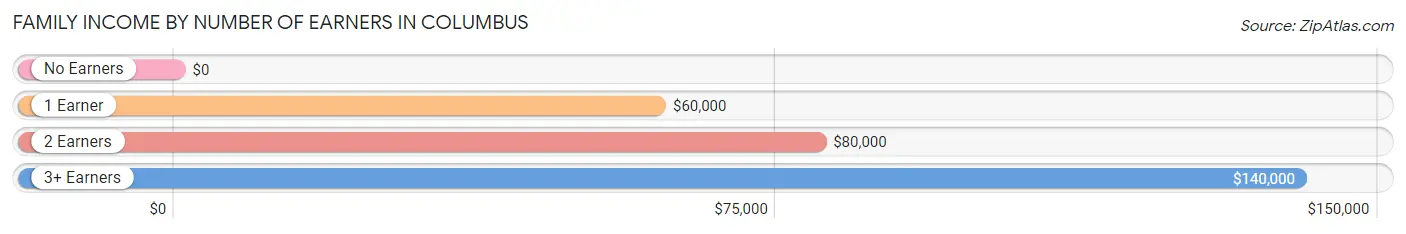
Family Income by Number of Earners in Columbus
| Number of Earners | # Families | Median Income |
| No Earners | 39 (13.2%) | $0 |
| 1 Earner | 162 (54.9%) | $60,000 |
| 2 Earners | 76 (25.8%) | $80,000 |
| 3+ Earners | 18 (6.1%) | $140,000 |
| Total | 295 (100.0%) | $63,495 |
Household Income in Columbus
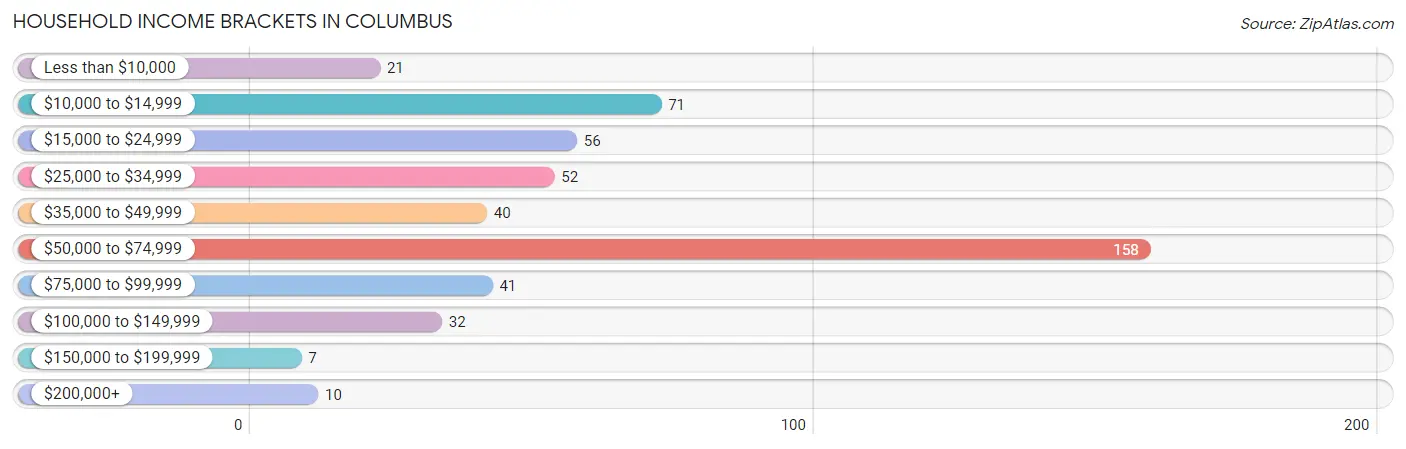
Household Income Brackets in Columbus
With 158 households falling in the category, the $50,000 to $74,999 income range is the most frequent in Columbus, accounting for 32.4% of all households. In contrast, only 7 households (1.4%) fall into the $150,000 to $199,999 income bracket, making it the least populous group.
| Income Bracket | # Households | % Households |
| Less than $10,000 | 21 | 4.3% |
| $10,000 to $14,999 | 71 | 14.5% |
| $15,000 to $24,999 | 56 | 11.5% |
| $25,000 to $34,999 | 52 | 10.7% |
| $35,000 to $49,999 | 40 | 8.2% |
| $50,000 to $74,999 | 158 | 32.4% |
| $75,000 to $99,999 | 41 | 8.4% |
| $100,000 to $149,999 | 32 | 6.6% |
| $150,000 to $199,999 | 7 | 1.4% |
| $200,000+ | 10 | 2.0% |
Household Income by Householder Age in Columbus
The median household income in Columbus is $53,333, with the highest median household income of $72,738 found in the 45 to 64 years age bracket for the primary householder. A total of 116 households (23.8%) fall into this category. Meanwhile, the 15 to 24 years age bracket for the primary householder has the lowest median household income of $0, with 35 households (7.2%) in this group.
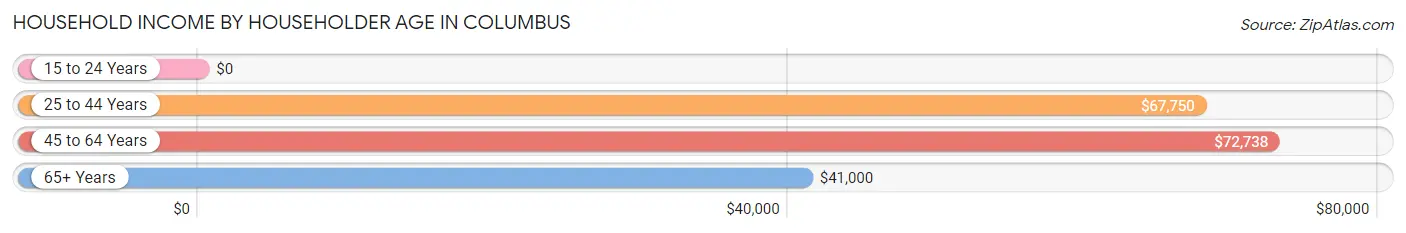
| Income Bracket | # Households | Median Income |
| 15 to 24 Years | 35 (7.2%) | $0 |
| 25 to 44 Years | 87 (17.8%) | $67,750 |
| 45 to 64 Years | 116 (23.8%) | $72,738 |
| 65+ Years | 250 (51.2%) | $41,000 |
| Total | 488 (100.0%) | $53,333 |
Poverty in Columbus
Income Below Poverty by Sex and Age in Columbus
With 8.7% poverty level for males and 22.7% for females among the residents of Columbus, 12 to 14 year old males and 12 to 14 year old females are the most vulnerable to poverty, with 3 males (100.0%) and 36 females (66.7%) in their respective age groups living below the poverty level.
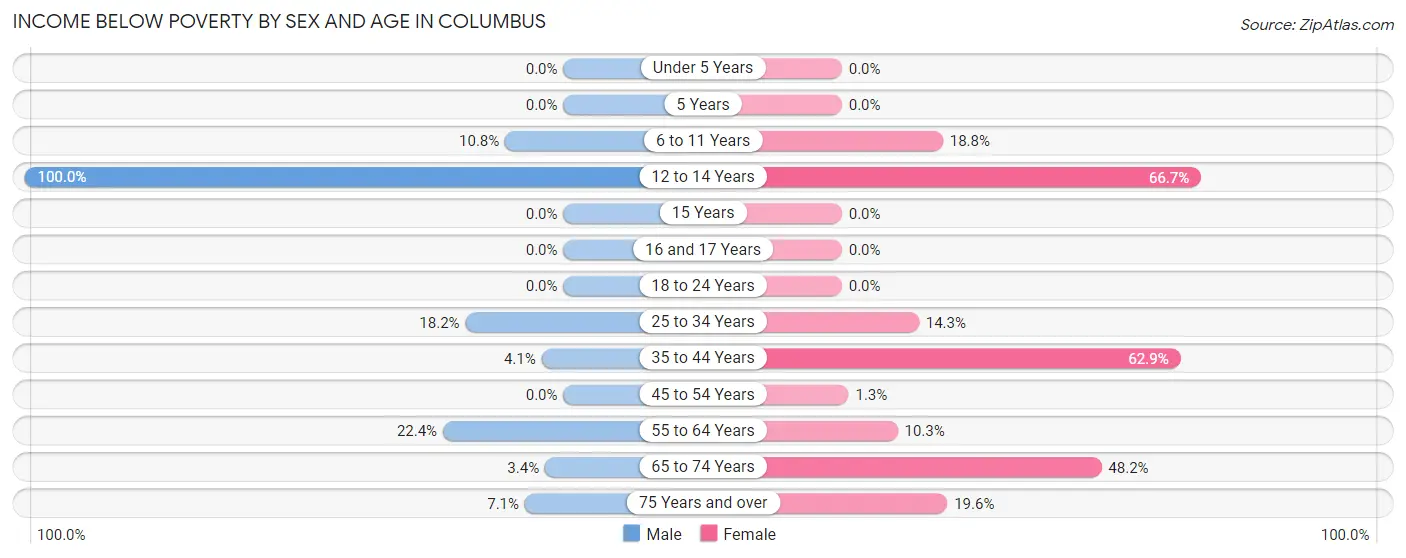
| Age Bracket | Male | Female |
| Under 5 Years | 0 (0.0%) | 0 (0.0%) |
| 5 Years | 0 (0.0%) | 0 (0.0%) |
| 6 to 11 Years | 4 (10.8%) | 3 (18.8%) |
| 12 to 14 Years | 3 (100.0%) | 36 (66.7%) |
| 15 Years | 0 (0.0%) | 0 (0.0%) |
| 16 and 17 Years | 0 (0.0%) | 0 (0.0%) |
| 18 to 24 Years | 0 (0.0%) | 0 (0.0%) |
| 25 to 34 Years | 4 (18.2%) | 8 (14.3%) |
| 35 to 44 Years | 3 (4.1%) | 22 (62.9%) |
| 45 to 54 Years | 0 (0.0%) | 1 (1.3%) |
| 55 to 64 Years | 19 (22.4%) | 9 (10.3%) |
| 65 to 74 Years | 3 (3.4%) | 40 (48.2%) |
| 75 Years and over | 3 (7.1%) | 18 (19.6%) |
| Total | 39 (8.7%) | 137 (22.7%) |
Income Above Poverty by Sex and Age in Columbus
According to the poverty statistics in Columbus, males aged under 5 years and females aged under 5 years are the age groups that are most secure financially, with 100.0% of males and 100.0% of females in these age groups living above the poverty line.
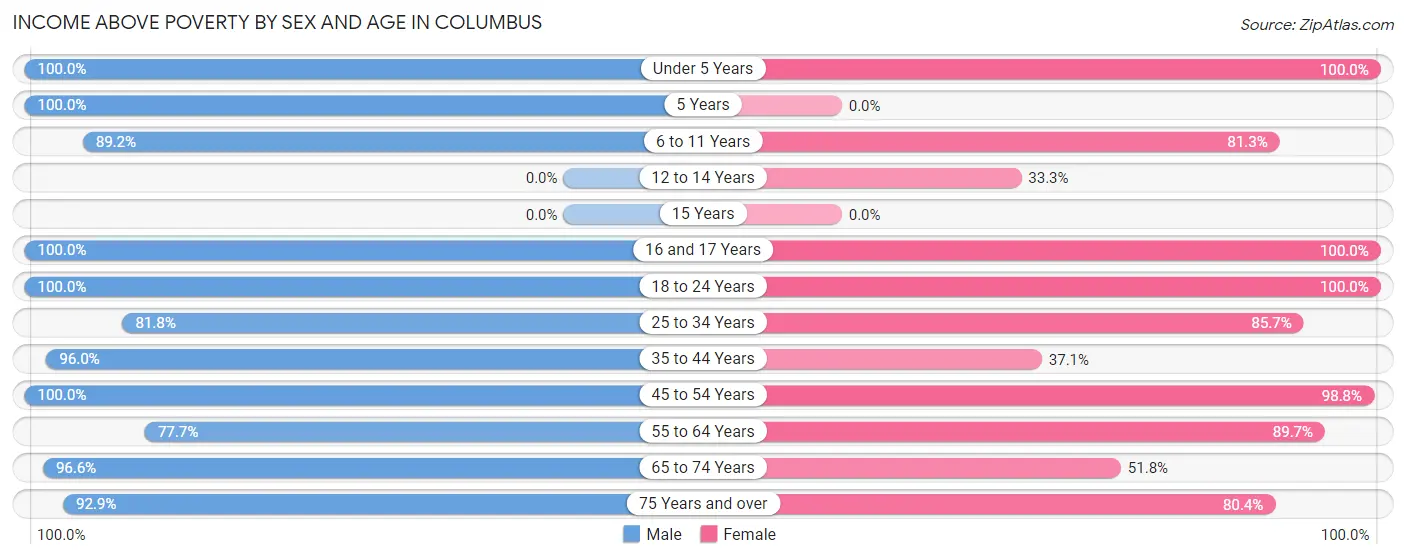
| Age Bracket | Male | Female |
| Under 5 Years | 21 (100.0%) | 16 (100.0%) |
| 5 Years | 6 (100.0%) | 0 (0.0%) |
| 6 to 11 Years | 33 (89.2%) | 13 (81.2%) |
| 12 to 14 Years | 0 (0.0%) | 18 (33.3%) |
| 15 Years | 0 (0.0%) | 0 (0.0%) |
| 16 and 17 Years | 25 (100.0%) | 21 (100.0%) |
| 18 to 24 Years | 17 (100.0%) | 64 (100.0%) |
| 25 to 34 Years | 18 (81.8%) | 48 (85.7%) |
| 35 to 44 Years | 71 (96.0%) | 13 (37.1%) |
| 45 to 54 Years | 27 (100.0%) | 79 (98.8%) |
| 55 to 64 Years | 66 (77.6%) | 78 (89.7%) |
| 65 to 74 Years | 85 (96.6%) | 43 (51.8%) |
| 75 Years and over | 39 (92.9%) | 74 (80.4%) |
| Total | 408 (91.3%) | 467 (77.3%) |
Income Below Poverty Among Married-Couple Families in Columbus
The poverty statistics for married-couple families in Columbus show that 7.1% or 18 of the total 253 families live below the poverty line. Families with 3 or 4 children have the highest poverty rate of 66.7%, comprising of 8 families. On the other hand, families with 1 or 2 children have the lowest poverty rate of 0.0%, which includes 0 families.
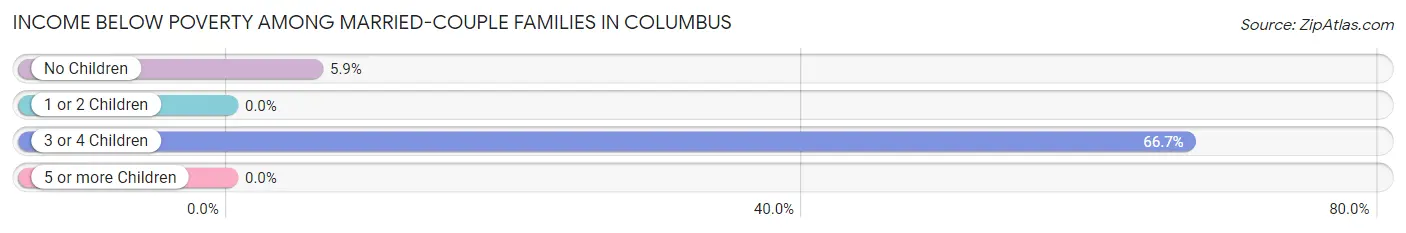
| Children | Above Poverty | Below Poverty |
| No Children | 159 (94.1%) | 10 (5.9%) |
| 1 or 2 Children | 72 (100.0%) | 0 (0.0%) |
| 3 or 4 Children | 4 (33.3%) | 8 (66.7%) |
| 5 or more Children | 0 (0.0%) | 0 (0.0%) |
| Total | 235 (92.9%) | 18 (7.1%) |
Income Below Poverty Among Single-Parent Households in Columbus
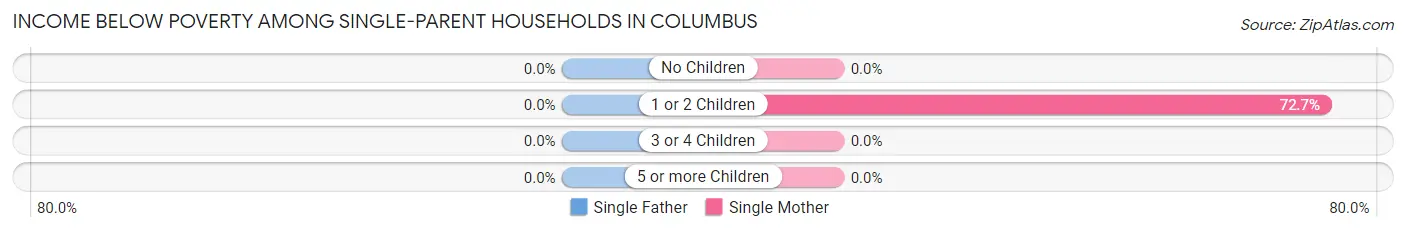
| Children | Single Father | Single Mother |
| No Children | 0 (0.0%) | 0 (0.0%) |
| 1 or 2 Children | 0 (0.0%) | 16 (72.7%) |
| 3 or 4 Children | 0 (0.0%) | 0 (0.0%) |
| 5 or more Children | 0 (0.0%) | 0 (0.0%) |
| Total | 0 (0.0%) | 16 (53.3%) |
Income Below Poverty Among Married-Couple vs Single-Parent Households in Columbus
The poverty data for Columbus shows that 18 of the married-couple family households (7.1%) and 16 of the single-parent households (38.1%) are living below the poverty level. Within the married-couple family households, those with 3 or 4 children have the highest poverty rate, with 8 households (66.7%) falling below the poverty line. Among the single-parent households, those with 1 or 2 children have the highest poverty rate, with 16 household (72.7%) living below poverty.
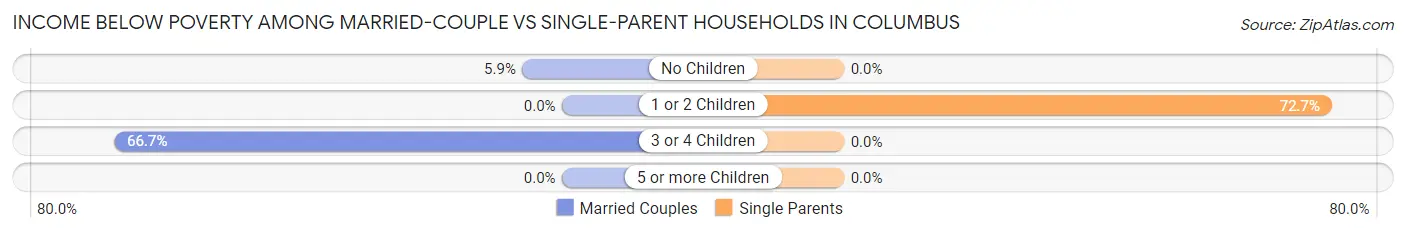
| Children | Married-Couple Families | Single-Parent Households |
| No Children | 10 (5.9%) | 0 (0.0%) |
| 1 or 2 Children | 0 (0.0%) | 16 (72.7%) |
| 3 or 4 Children | 8 (66.7%) | 0 (0.0%) |
| 5 or more Children | 0 (0.0%) | 0 (0.0%) |
| Total | 18 (7.1%) | 16 (38.1%) |
Race in Columbus
The most populous races in Columbus are White / Caucasian (832 | 76.5%), Hispanic or Latino (238 | 21.9%), and Two or more Races (180 | 16.6%).
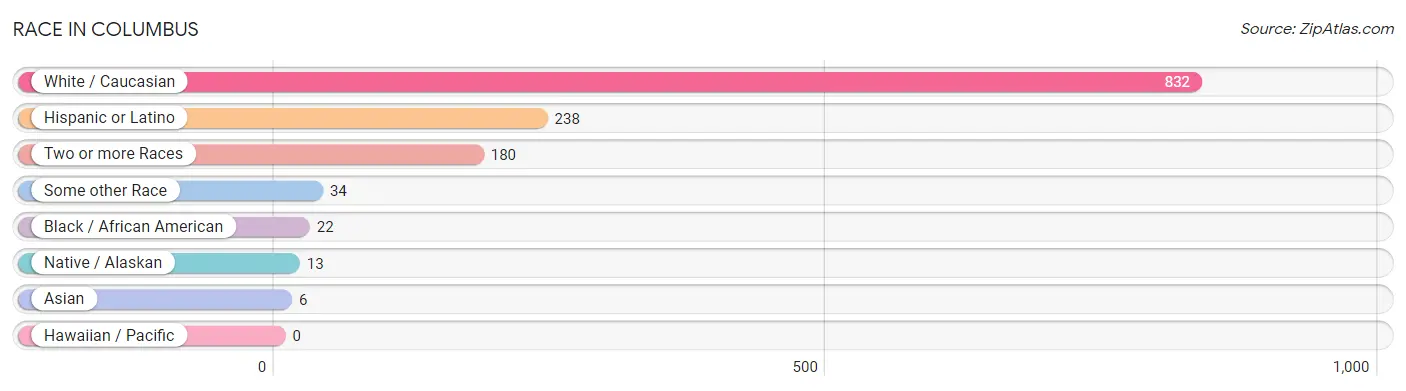
| Race | # Population | % Population |
| Asian | 6 | 0.5% |
| Black / African American | 22 | 2.0% |
| Hawaiian / Pacific | 0 | 0.0% |
| Hispanic or Latino | 238 | 21.9% |
| Native / Alaskan | 13 | 1.2% |
| White / Caucasian | 832 | 76.5% |
| Two or more Races | 180 | 16.6% |
| Some other Race | 34 | 3.1% |
| Total | 1,087 | 100.0% |
Ancestry in Columbus
The most populous ancestries reported in Columbus are Mexican (173 | 15.9%), German (170 | 15.6%), Scottish (145 | 13.3%), Irish (132 | 12.1%), and English (109 | 10.0%), together accounting for 67.1% of all Columbus residents.
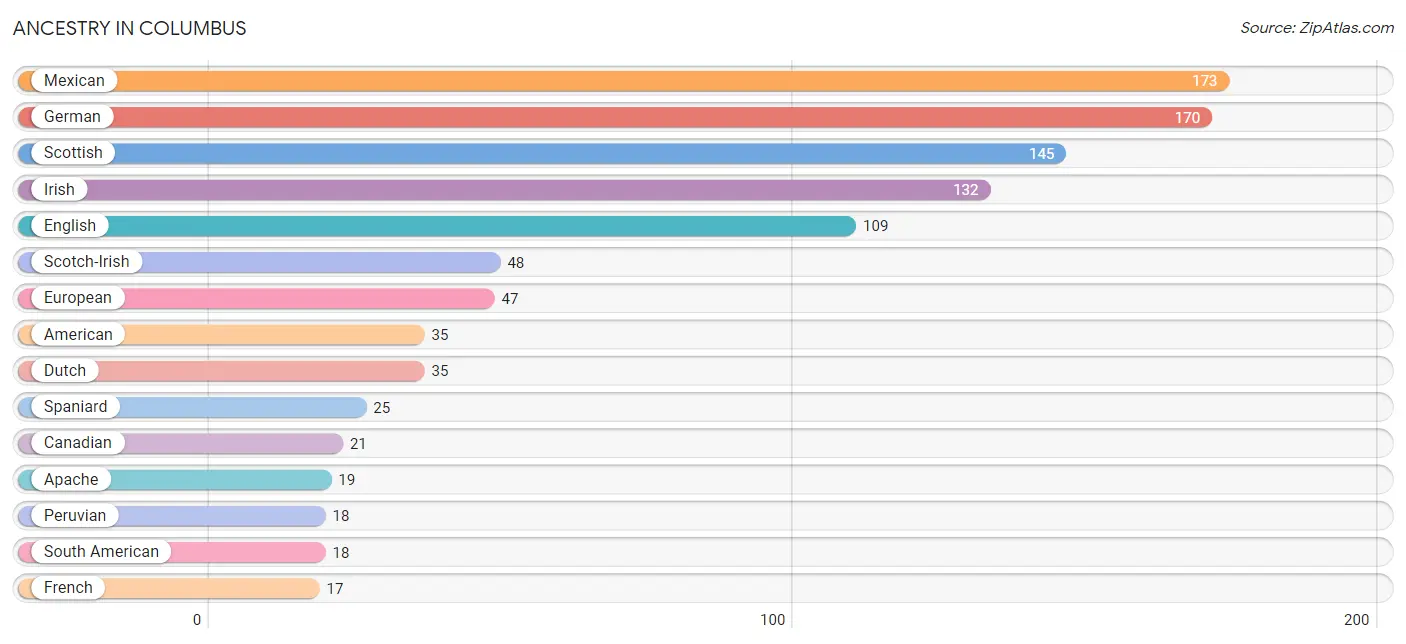
| Ancestry | # Population | % Population |
| African | 4 | 0.4% |
| American | 35 | 3.2% |
| Apache | 19 | 1.8% |
| Bhutanese | 6 | 0.5% |
| Brazilian | 4 | 0.4% |
| British | 3 | 0.3% |
| Canadian | 21 | 1.9% |
| Celtic | 1 | 0.1% |
| Central American Indian | 2 | 0.2% |
| Creek | 4 | 0.4% |
| Danish | 9 | 0.8% |
| Dutch | 35 | 3.2% |
| English | 109 | 10.0% |
| European | 47 | 4.3% |
| French | 17 | 1.6% |
| French Canadian | 2 | 0.2% |
| German | 170 | 15.6% |
| Greek | 2 | 0.2% |
| Hungarian | 3 | 0.3% |
| Indian (Asian) | 6 | 0.5% |
| Irish | 132 | 12.1% |
| Iroquois | 13 | 1.2% |
| Italian | 7 | 0.6% |
| Lumbee | 13 | 1.2% |
| Mexican | 173 | 15.9% |
| Norwegian | 9 | 0.8% |
| Pakistani | 9 | 0.8% |
| Peruvian | 18 | 1.7% |
| Polish | 11 | 1.0% |
| Puerto Rican | 11 | 1.0% |
| Russian | 5 | 0.5% |
| Scotch-Irish | 48 | 4.4% |
| Scottish | 145 | 13.3% |
| Serbian | 10 | 0.9% |
| Slovak | 5 | 0.5% |
| South American | 18 | 1.7% |
| Spaniard | 25 | 2.3% |
| Spanish | 11 | 1.0% |
| Subsaharan African | 4 | 0.4% |
| Swedish | 3 | 0.3% |
| Swiss | 3 | 0.3% |
| Thai | 14 | 1.3% |
| Welsh | 3 | 0.3% | View All 43 Rows |
Immigrants in Columbus
The most numerous immigrant groups reported in Columbus came from Latin America (103 | 9.5%), Central America (81 | 7.4%), Mexico (81 | 7.4%), South America (22 | 2.0%), and Peru (18 | 1.7%), together accounting for 28.1% of all Columbus residents.
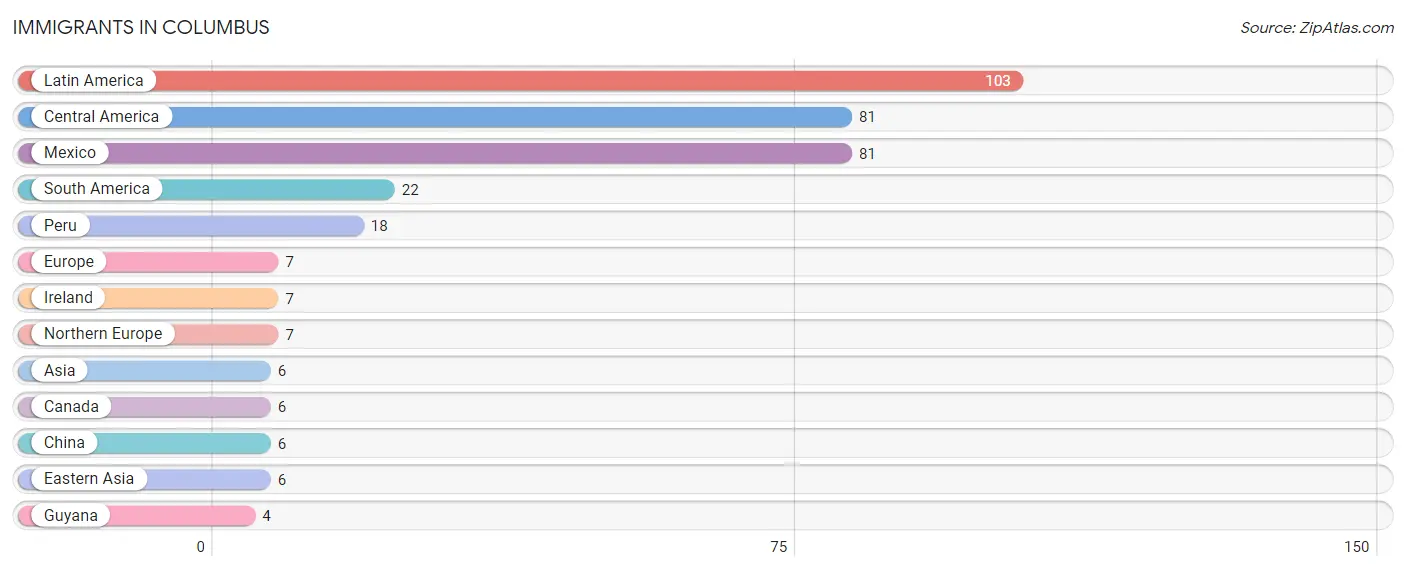
| Immigration Origin | # Population | % Population |
| Asia | 6 | 0.5% |
| Canada | 6 | 0.5% |
| Central America | 81 | 7.4% |
| China | 6 | 0.5% |
| Eastern Asia | 6 | 0.5% |
| Europe | 7 | 0.6% |
| Guyana | 4 | 0.4% |
| Ireland | 7 | 0.6% |
| Latin America | 103 | 9.5% |
| Mexico | 81 | 7.4% |
| Northern Europe | 7 | 0.6% |
| Peru | 18 | 1.7% |
| South America | 22 | 2.0% | View All 13 Rows |
Sex and Age in Columbus
Sex and Age in Columbus
The most populous age groups in Columbus are 70 to 74 Years (75 | 16.0%) for men and 60 to 64 Years (65 | 10.5%) for women.
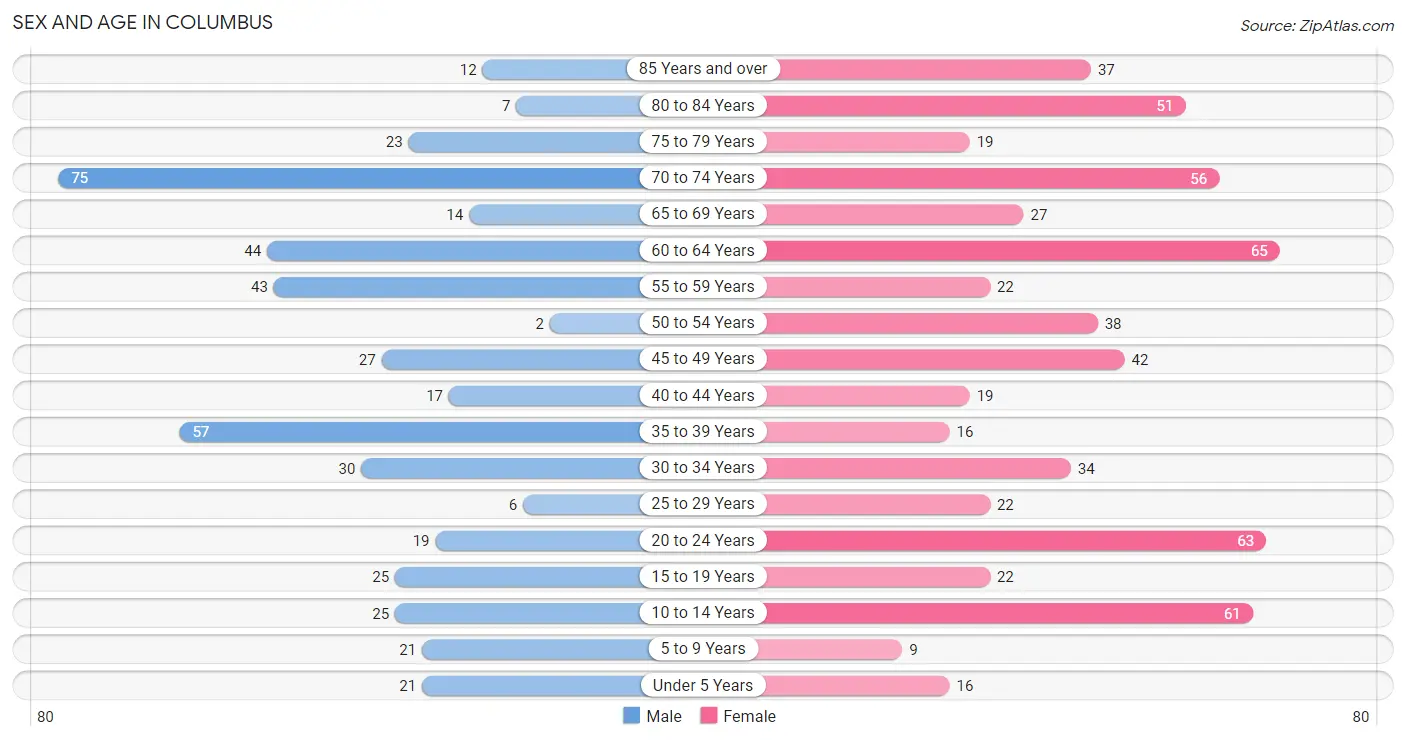
| Age Bracket | Male | Female |
| Under 5 Years | 21 (4.5%) | 16 (2.6%) |
| 5 to 9 Years | 21 (4.5%) | 9 (1.5%) |
| 10 to 14 Years | 25 (5.3%) | 61 (9.9%) |
| 15 to 19 Years | 25 (5.3%) | 22 (3.5%) |
| 20 to 24 Years | 19 (4.1%) | 63 (10.2%) |
| 25 to 29 Years | 6 (1.3%) | 22 (3.5%) |
| 30 to 34 Years | 30 (6.4%) | 34 (5.5%) |
| 35 to 39 Years | 57 (12.2%) | 16 (2.6%) |
| 40 to 44 Years | 17 (3.6%) | 19 (3.1%) |
| 45 to 49 Years | 27 (5.8%) | 42 (6.8%) |
| 50 to 54 Years | 2 (0.4%) | 38 (6.1%) |
| 55 to 59 Years | 43 (9.2%) | 22 (3.5%) |
| 60 to 64 Years | 44 (9.4%) | 65 (10.5%) |
| 65 to 69 Years | 14 (3.0%) | 27 (4.4%) |
| 70 to 74 Years | 75 (16.0%) | 56 (9.0%) |
| 75 to 79 Years | 23 (4.9%) | 19 (3.1%) |
| 80 to 84 Years | 7 (1.5%) | 51 (8.2%) |
| 85 Years and over | 12 (2.6%) | 37 (6.0%) |
| Total | 468 (100.0%) | 619 (100.0%) |
Families and Households in Columbus
Median Family Size in Columbus
The median family size in Columbus is 2.86 persons per family, with single female/mother families (30 | 10.2%) accounting for the largest median family size of 3.7 persons per family. On the other hand, single male/father families (12 | 4.1%) represent the smallest median family size with 2.00 persons per family.
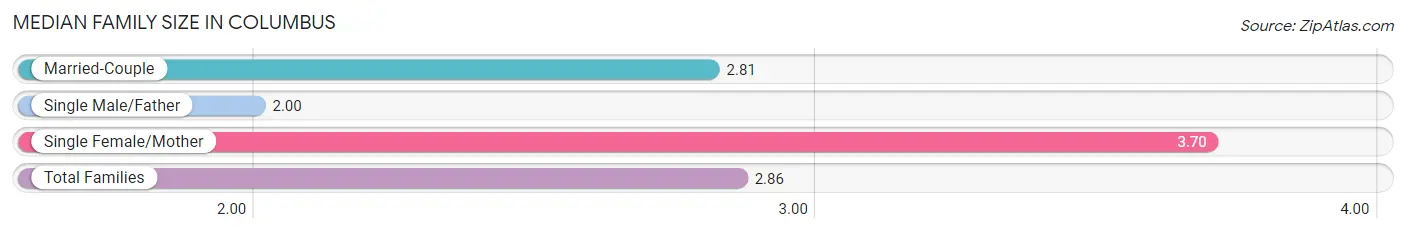
| Family Type | # Families | Family Size |
| Married-Couple | 253 (85.8%) | 2.81 |
| Single Male/Father | 12 (4.1%) | 2.00 |
| Single Female/Mother | 30 (10.2%) | 3.70 |
| Total Families | 295 (100.0%) | 2.86 |
Median Household Size in Columbus
The median household size in Columbus is 2.15 persons per household, with single female/mother households (30 | 6.1%) accounting for the largest median household size of 3.7 persons per household. non-family households (193 | 39.6%) represent the smallest median household size with 1.07 persons per household.
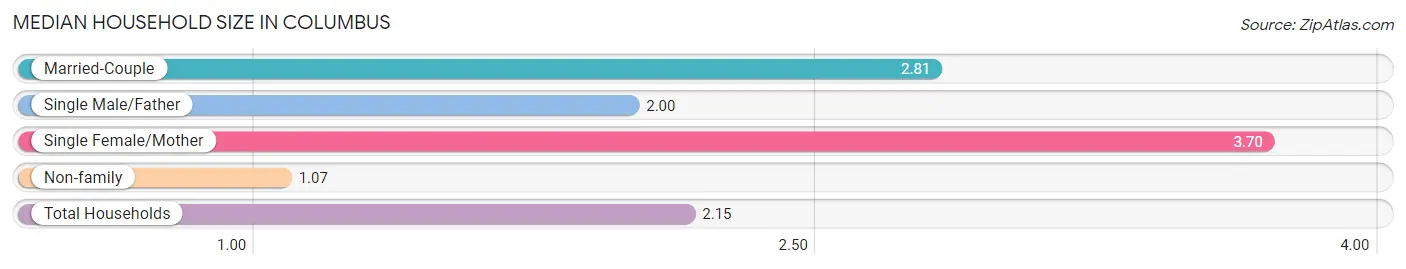
| Household Type | # Households | Household Size |
| Married-Couple | 253 (51.8%) | 2.81 |
| Single Male/Father | 12 (2.5%) | 2.00 |
| Single Female/Mother | 30 (6.1%) | 3.70 |
| Non-family | 193 (39.6%) | 1.07 |
| Total Households | 488 (100.0%) | 2.15 |
Household Size by Marriage Status in Columbus
Out of a total of 488 households in Columbus, 295 (60.5%) are family households, while 193 (39.6%) are nonfamily households. The most numerous type of family households are 2-person households, comprising 153, and the most common type of nonfamily households are 1-person households, comprising 187.
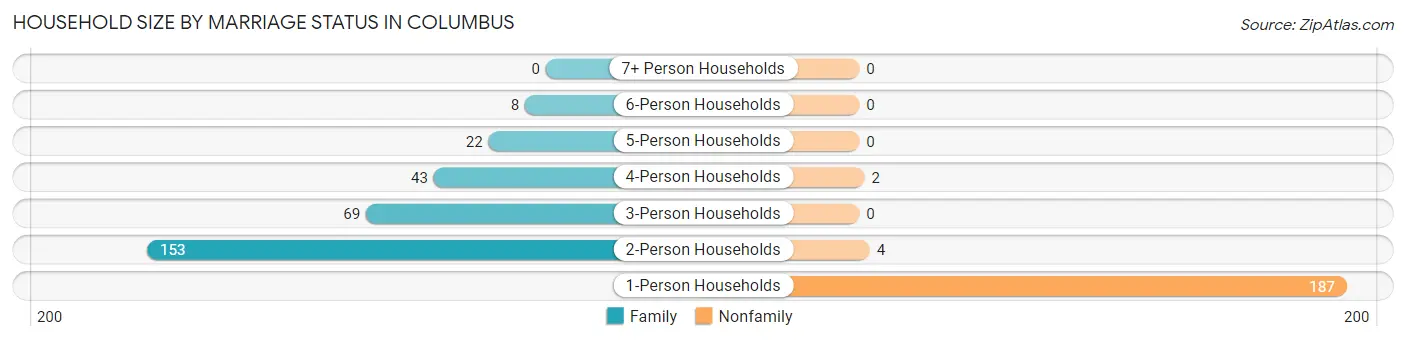
| Household Size | Family Households | Nonfamily Households |
| 1-Person Households | - | 187 (38.3%) |
| 2-Person Households | 153 (31.4%) | 4 (0.8%) |
| 3-Person Households | 69 (14.1%) | 0 (0.0%) |
| 4-Person Households | 43 (8.8%) | 2 (0.4%) |
| 5-Person Households | 22 (4.5%) | 0 (0.0%) |
| 6-Person Households | 8 (1.6%) | 0 (0.0%) |
| 7+ Person Households | 0 (0.0%) | 0 (0.0%) |
| Total | 295 (60.5%) | 193 (39.6%) |
Female Fertility in Columbus
Fertility by Age in Columbus
Average fertility rate in Columbus is 31.0 births per 1,000 women. Women in the age bracket of 20 to 34 years have the highest fertility rate with 59.0 births per 1,000 women. Women in the age bracket of 20 to 34 years acount for 100.0% of all women with births.
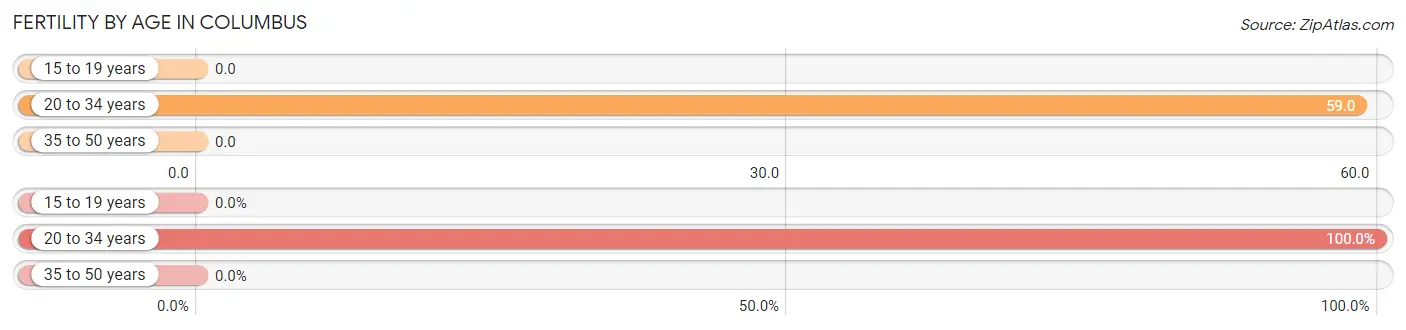
| Age Bracket | Women with Births | Births / 1,000 Women |
| 15 to 19 years | 0 (0.0%) | 0.0 |
| 20 to 34 years | 7 (100.0%) | 59.0 |
| 35 to 50 years | 0 (0.0%) | 0.0 |
| Total | 7 (100.0%) | 31.0 |
Fertility by Age by Marriage Status in Columbus
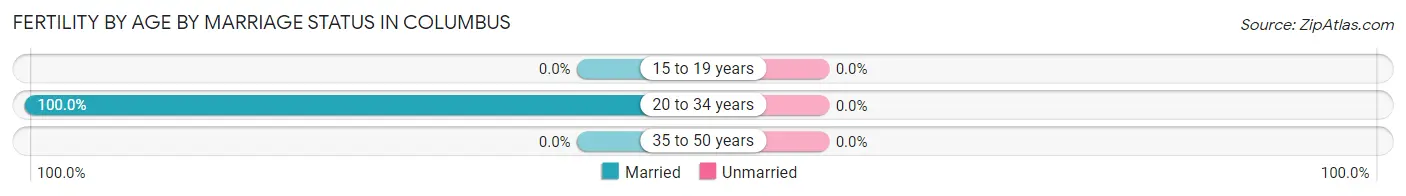
| Age Bracket | Married | Unmarried |
| 15 to 19 years | 0 (0.0%) | 0 (0.0%) |
| 20 to 34 years | 7 (100.0%) | 0 (0.0%) |
| 35 to 50 years | 0 (0.0%) | 0 (0.0%) |
| Total | 7 (100.0%) | 0 (0.0%) |
Fertility by Education in Columbus
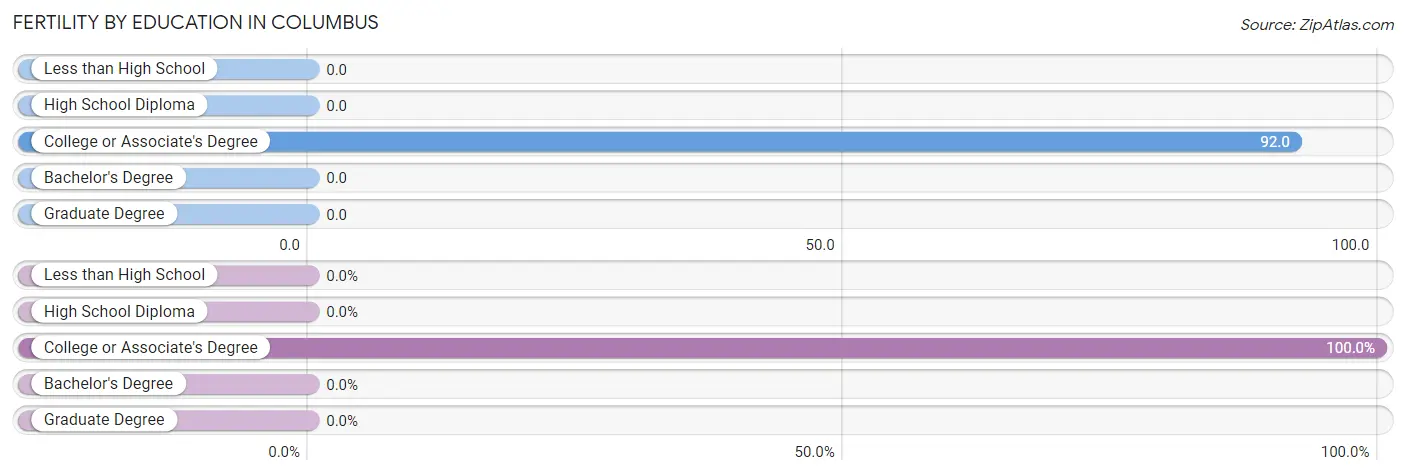
| Educational Attainment | Women with Births | Births / 1,000 Women |
| Less than High School | 0 (0.0%) | 0.0 |
| High School Diploma | 0 (0.0%) | 0.0 |
| College or Associate's Degree | 7 (100.0%) | 92.0 |
| Bachelor's Degree | 0 (0.0%) | 0.0 |
| Graduate Degree | 0 (0.0%) | 0.0 |
| Total | 7 (100.0%) | 31.0 |
Fertility by Education by Marriage Status in Columbus
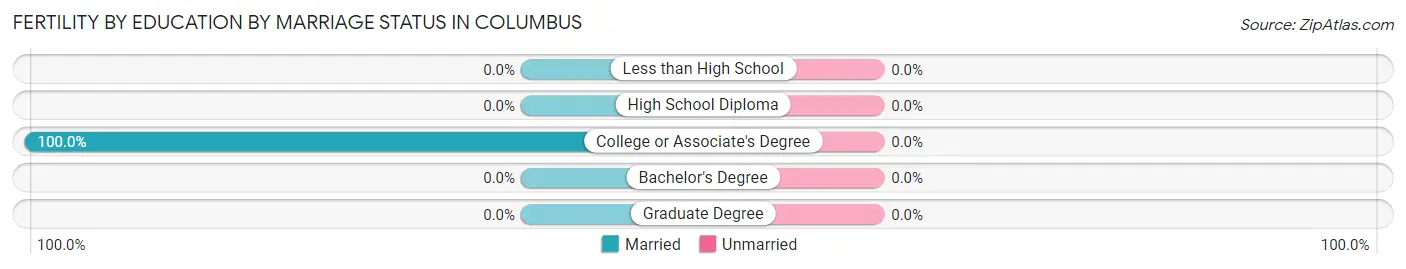
| Educational Attainment | Married | Unmarried |
| Less than High School | 0 (0.0%) | 0 (0.0%) |
| High School Diploma | 0 (0.0%) | 0 (0.0%) |
| College or Associate's Degree | 7 (100.0%) | 0 (0.0%) |
| Bachelor's Degree | 0 (0.0%) | 0 (0.0%) |
| Graduate Degree | 0 (0.0%) | 0 (0.0%) |
| Total | 7 (100.0%) | 0 (0.0%) |
Employment Characteristics in Columbus
Employment by Class of Employer in Columbus
Among the 443 employed individuals in Columbus, private company employees (288 | 65.0%), not-for-profit organizations (63 | 14.2%), and self-employed (not incorporated) (35 | 7.9%) make up the most common classes of employment.
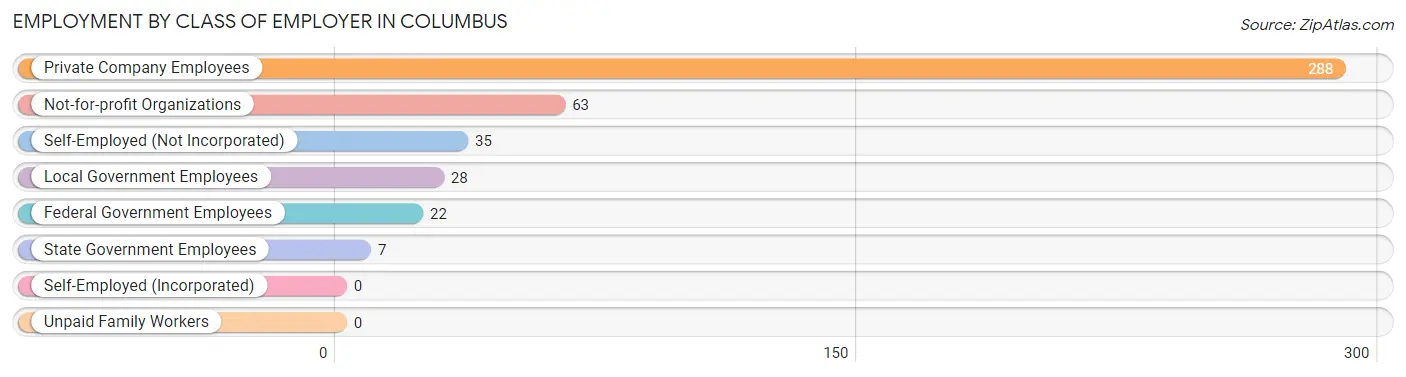
| Employer Class | # Employees | % Employees |
| Private Company Employees | 288 | 65.0% |
| Self-Employed (Incorporated) | 0 | 0.0% |
| Self-Employed (Not Incorporated) | 35 | 7.9% |
| Not-for-profit Organizations | 63 | 14.2% |
| Local Government Employees | 28 | 6.3% |
| State Government Employees | 7 | 1.6% |
| Federal Government Employees | 22 | 5.0% |
| Unpaid Family Workers | 0 | 0.0% |
| Total | 443 | 100.0% |
Employment Status by Age in Columbus
According to the labor force statistics for Columbus, out of the total population over 16 years of age (934), 49.9% or 466 individuals are in the labor force, with 3.2% or 15 of them unemployed. The age group with the highest labor force participation rate is 35 to 44 years, with 94.5% or 103 individuals in the labor force. Within the labor force, the 30 to 34 years age range has the highest percentage of unemployed individuals, with 26.2% or 11 of them being unemployed.
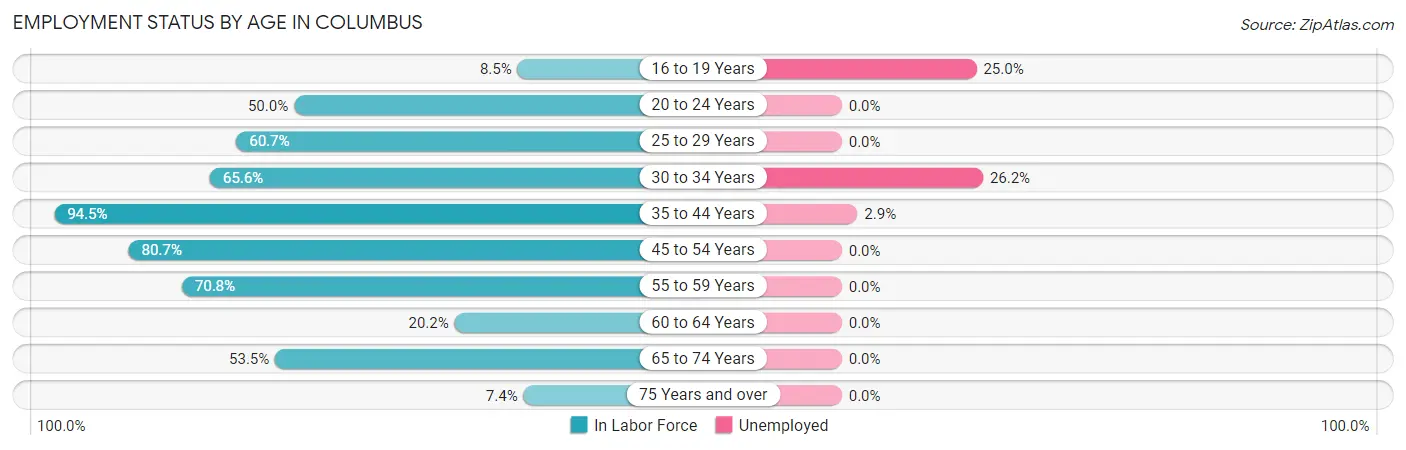
| Age Bracket | In Labor Force | Unemployed |
| 16 to 19 Years | 4 (8.5%) | 1 (25.0%) |
| 20 to 24 Years | 41 (50.0%) | 0 (0.0%) |
| 25 to 29 Years | 17 (60.7%) | 0 (0.0%) |
| 30 to 34 Years | 42 (65.6%) | 11 (26.2%) |
| 35 to 44 Years | 103 (94.5%) | 3 (2.9%) |
| 45 to 54 Years | 88 (80.7%) | 0 (0.0%) |
| 55 to 59 Years | 46 (70.8%) | 0 (0.0%) |
| 60 to 64 Years | 22 (20.2%) | 0 (0.0%) |
| 65 to 74 Years | 92 (53.5%) | 0 (0.0%) |
| 75 Years and over | 11 (7.4%) | 0 (0.0%) |
| Total | 466 (49.9%) | 15 (3.2%) |
Employment Status by Educational Attainment in Columbus
According to labor force statistics for Columbus, 65.7% of individuals (318) out of the total population between 25 and 64 years of age (484) are in the labor force, with 4.4% or 14 of them being unemployed. The group with the highest labor force participation rate are those with the educational attainment of bachelor's degree or higher, with 87.0% or 100 individuals in the labor force. Within the labor force, individuals with bachelor's degree or higher education have the highest percentage of unemployment, with 8.0% or 8 of them being unemployed.
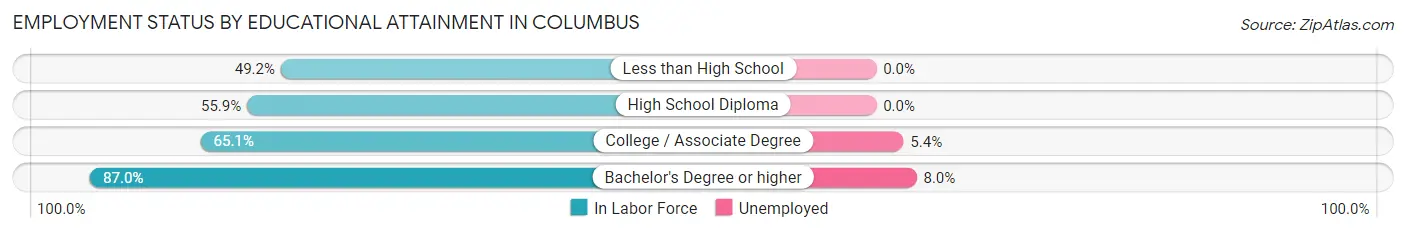
| Educational Attainment | In Labor Force | Unemployed |
| Less than High School | 30 (49.2%) | 0 (0.0%) |
| High School Diploma | 76 (55.9%) | 0 (0.0%) |
| College / Associate Degree | 112 (65.1%) | 9 (5.4%) |
| Bachelor's Degree or higher | 100 (87.0%) | 9 (8.0%) |
| Total | 318 (65.7%) | 21 (4.4%) |
Employment Occupations by Sex in Columbus
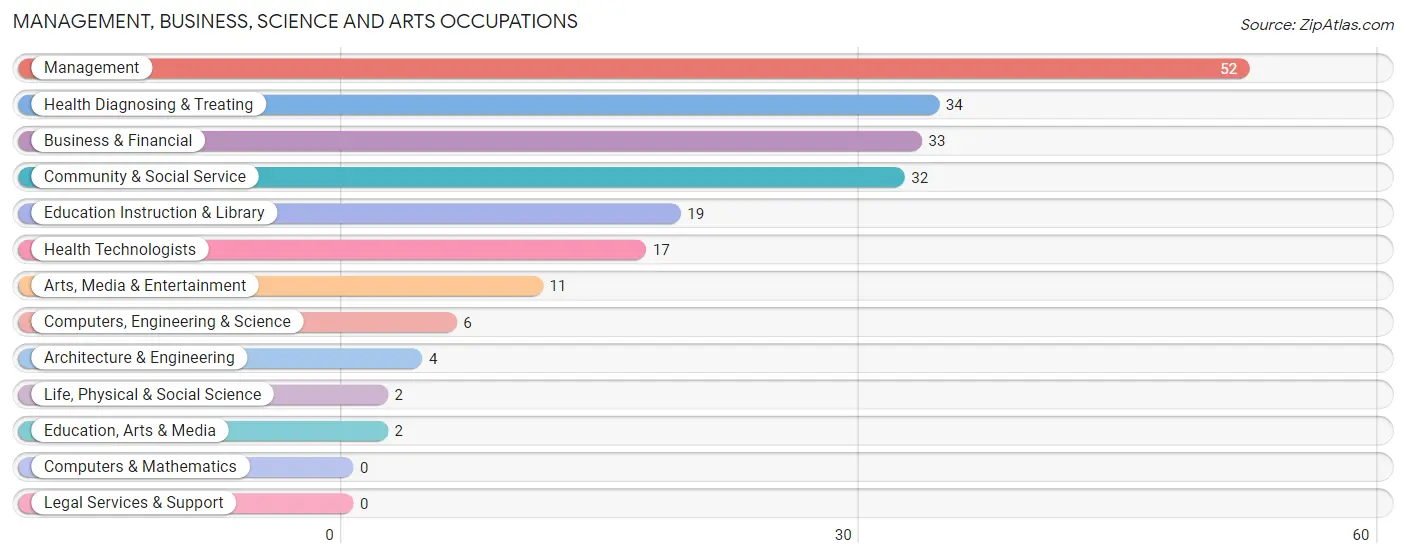
Management, Business, Science and Arts Occupations
The most common Management, Business, Science and Arts occupations in Columbus are Management (52 | 11.5%), Health Diagnosing & Treating (34 | 7.5%), Business & Financial (33 | 7.3%), Community & Social Service (32 | 7.1%), and Education Instruction & Library (19 | 4.2%).
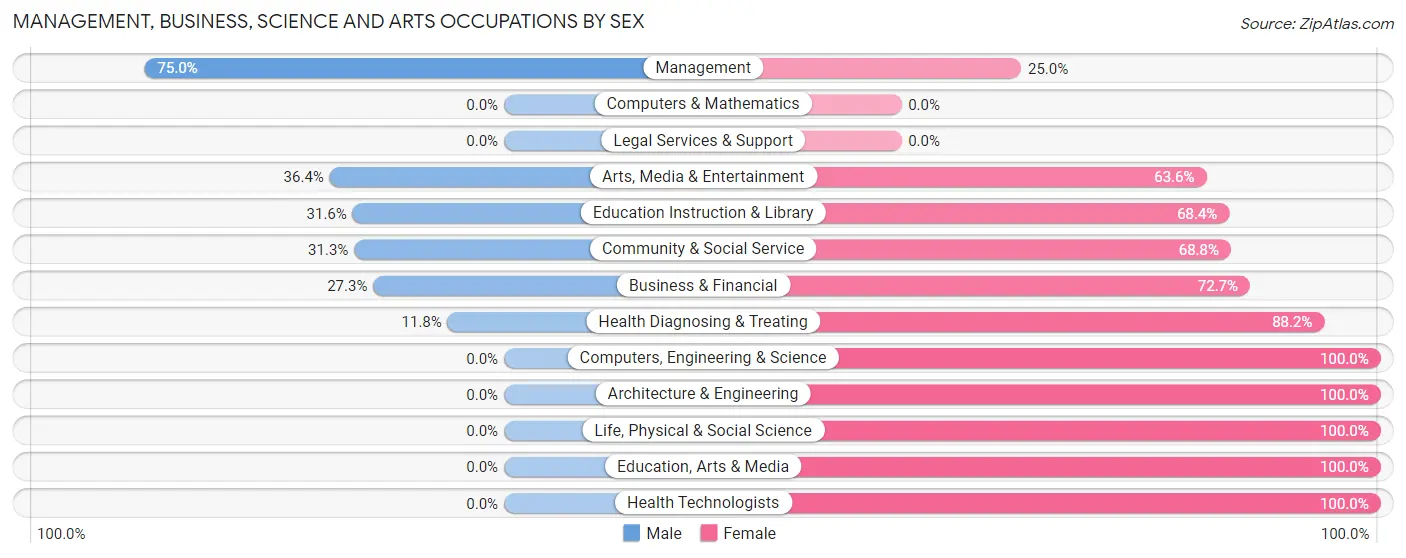
Management, Business, Science and Arts Occupations by Sex
Within the Management, Business, Science and Arts occupations in Columbus, the most male-oriented occupations are Management (75.0%), Arts, Media & Entertainment (36.4%), and Education Instruction & Library (31.6%), while the most female-oriented occupations are Computers, Engineering & Science (100.0%), Architecture & Engineering (100.0%), and Life, Physical & Social Science (100.0%).
| Occupation | Male | Female |
| Management | 39 (75.0%) | 13 (25.0%) |
| Business & Financial | 9 (27.3%) | 24 (72.7%) |
| Computers, Engineering & Science | 0 (0.0%) | 6 (100.0%) |
| Computers & Mathematics | 0 (0.0%) | 0 (0.0%) |
| Architecture & Engineering | 0 (0.0%) | 4 (100.0%) |
| Life, Physical & Social Science | 0 (0.0%) | 2 (100.0%) |
| Community & Social Service | 10 (31.2%) | 22 (68.8%) |
| Education, Arts & Media | 0 (0.0%) | 2 (100.0%) |
| Legal Services & Support | 0 (0.0%) | 0 (0.0%) |
| Education Instruction & Library | 6 (31.6%) | 13 (68.4%) |
| Arts, Media & Entertainment | 4 (36.4%) | 7 (63.6%) |
| Health Diagnosing & Treating | 4 (11.8%) | 30 (88.2%) |
| Health Technologists | 0 (0.0%) | 17 (100.0%) |
| Total (Category) | 62 (39.5%) | 95 (60.5%) |
| Total (Overall) | 233 (51.7%) | 218 (48.3%) |
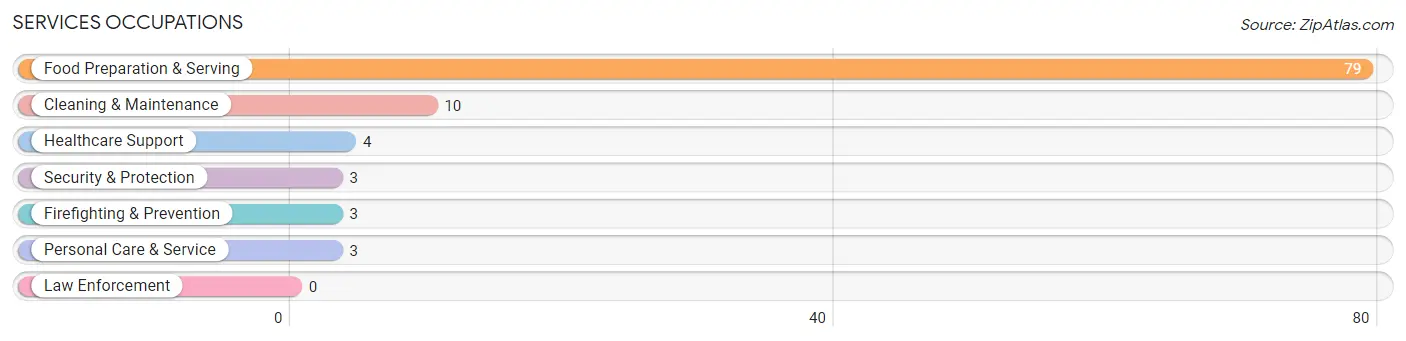
Services Occupations
The most common Services occupations in Columbus are Food Preparation & Serving (79 | 17.5%), Cleaning & Maintenance (10 | 2.2%), Healthcare Support (4 | 0.9%), Security & Protection (3 | 0.7%), and Firefighting & Prevention (3 | 0.7%).
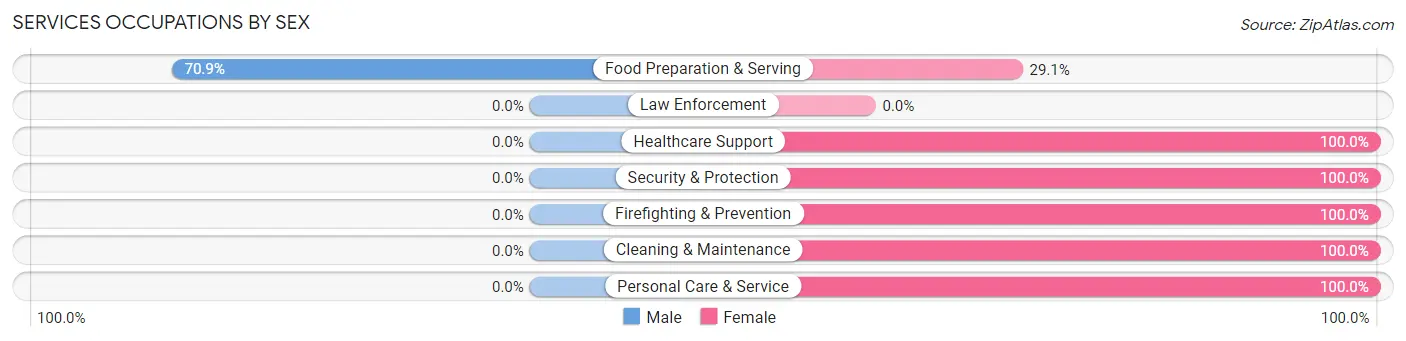
Services Occupations by Sex
| Occupation | Male | Female |
| Healthcare Support | 0 (0.0%) | 4 (100.0%) |
| Security & Protection | 0 (0.0%) | 3 (100.0%) |
| Firefighting & Prevention | 0 (0.0%) | 3 (100.0%) |
| Law Enforcement | 0 (0.0%) | 0 (0.0%) |
| Food Preparation & Serving | 56 (70.9%) | 23 (29.1%) |
| Cleaning & Maintenance | 0 (0.0%) | 10 (100.0%) |
| Personal Care & Service | 0 (0.0%) | 3 (100.0%) |
| Total (Category) | 56 (56.6%) | 43 (43.4%) |
| Total (Overall) | 233 (51.7%) | 218 (48.3%) |
Sales and Office Occupations
The most common Sales and Office occupations in Columbus are Office & Administration (63 | 14.0%), and Sales & Related (16 | 3.5%).
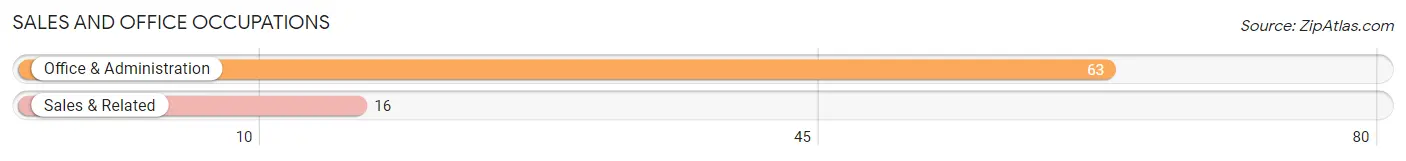
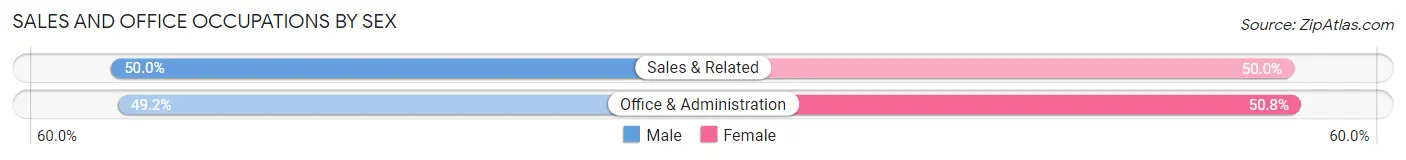
Sales and Office Occupations by Sex
| Occupation | Male | Female |
| Sales & Related | 8 (50.0%) | 8 (50.0%) |
| Office & Administration | 31 (49.2%) | 32 (50.8%) |
| Total (Category) | 39 (49.4%) | 40 (50.6%) |
| Total (Overall) | 233 (51.7%) | 218 (48.3%) |
Natural Resources, Construction and Maintenance Occupations
The most common Natural Resources, Construction and Maintenance occupations in Columbus are Construction & Extraction (19 | 4.2%), and Installation, Maintenance & Repair (10 | 2.2%).
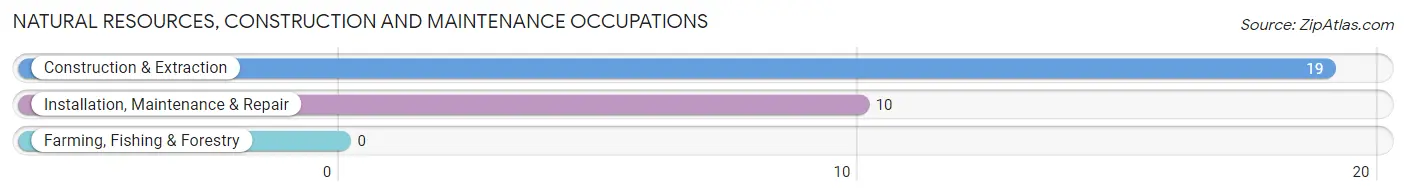
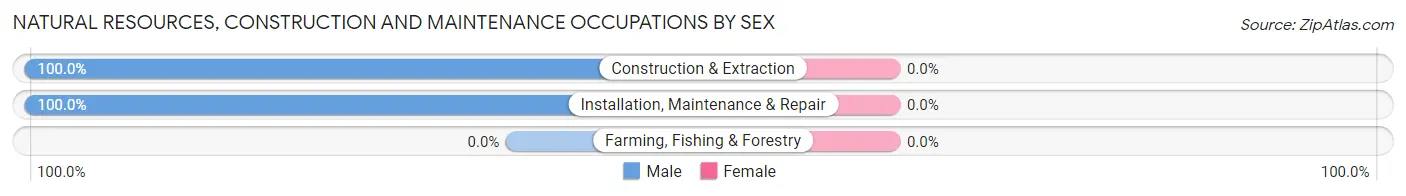
Natural Resources, Construction and Maintenance Occupations by Sex
| Occupation | Male | Female |
| Farming, Fishing & Forestry | 0 (0.0%) | 0 (0.0%) |
| Construction & Extraction | 19 (100.0%) | 0 (0.0%) |
| Installation, Maintenance & Repair | 10 (100.0%) | 0 (0.0%) |
| Total (Category) | 29 (100.0%) | 0 (0.0%) |
| Total (Overall) | 233 (51.7%) | 218 (48.3%) |
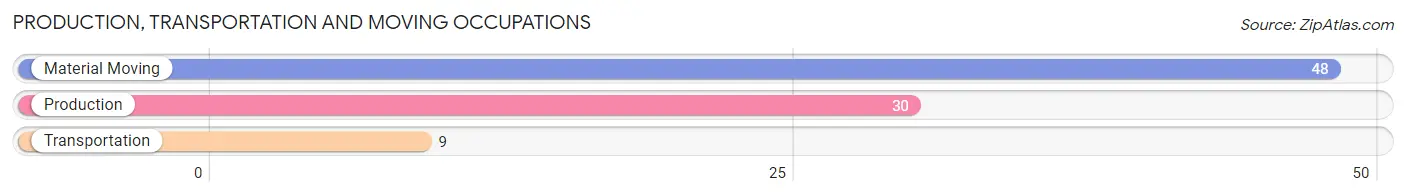
Production, Transportation and Moving Occupations
The most common Production, Transportation and Moving occupations in Columbus are Material Moving (48 | 10.6%), Production (30 | 6.7%), and Transportation (9 | 2.0%).
Production, Transportation and Moving Occupations by Sex
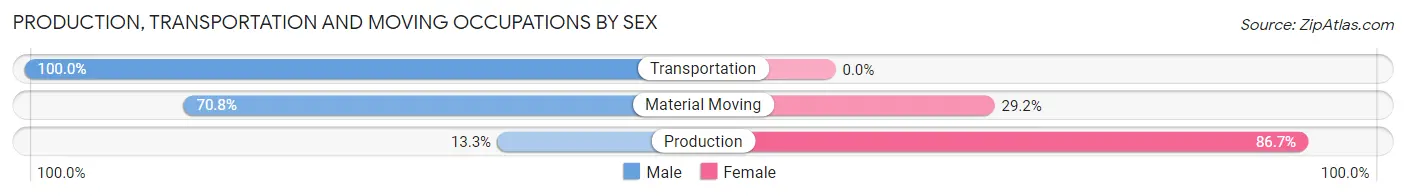
| Occupation | Male | Female |
| Production | 4 (13.3%) | 26 (86.7%) |
| Transportation | 9 (100.0%) | 0 (0.0%) |
| Material Moving | 34 (70.8%) | 14 (29.2%) |
| Total (Category) | 47 (54.0%) | 40 (46.0%) |
| Total (Overall) | 233 (51.7%) | 218 (48.3%) |
Employment Industries by Sex in Columbus
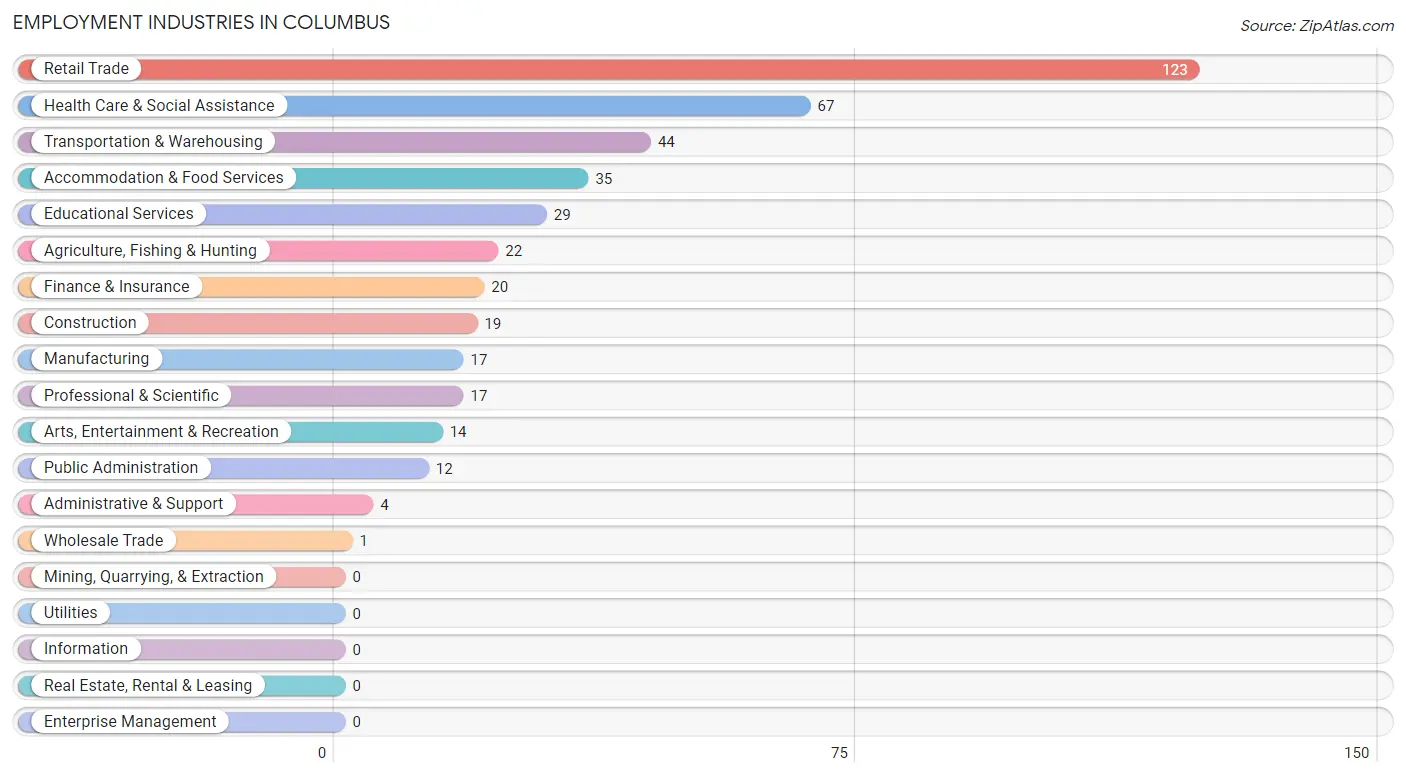
Employment Industries in Columbus
The major employment industries in Columbus include Retail Trade (123 | 27.3%), Health Care & Social Assistance (67 | 14.9%), Transportation & Warehousing (44 | 9.8%), Accommodation & Food Services (35 | 7.8%), and Educational Services (29 | 6.4%).
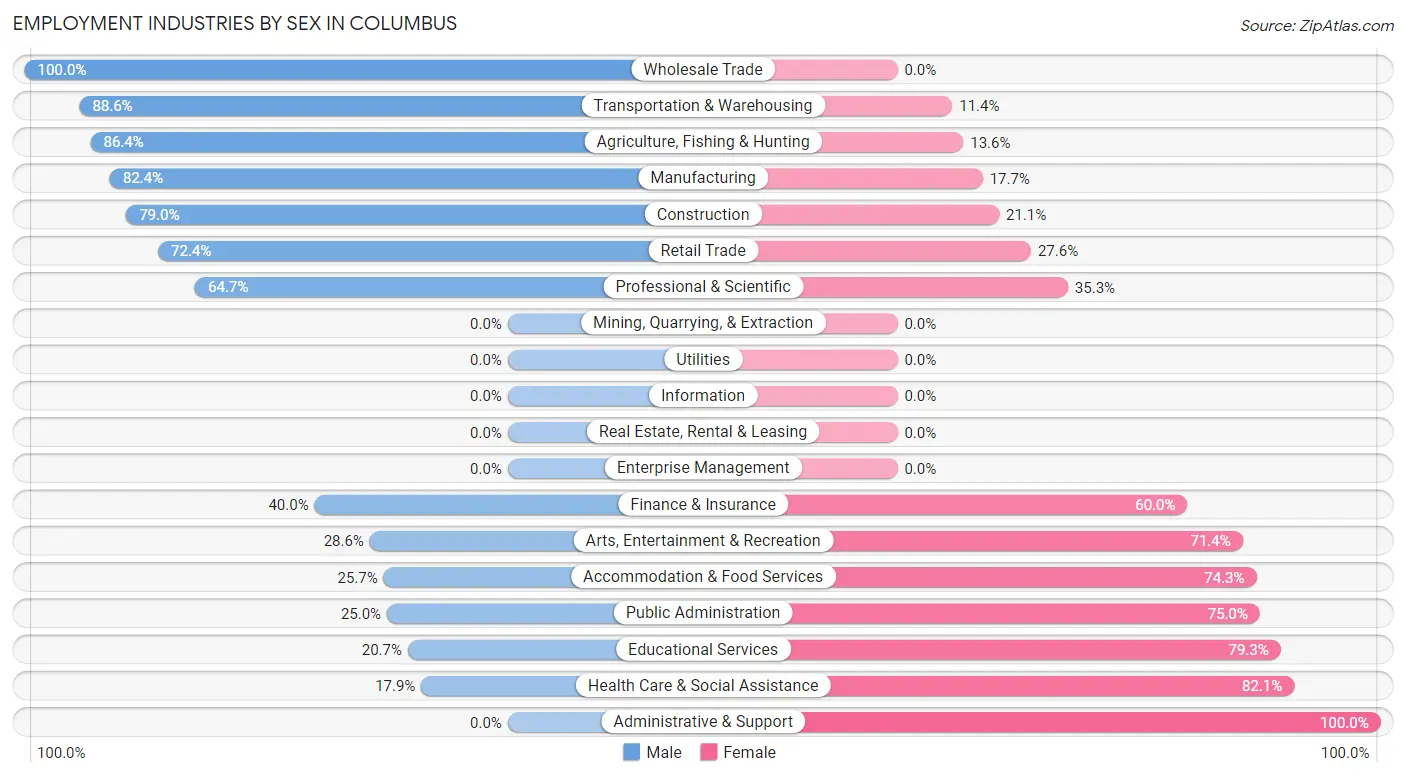
Employment Industries by Sex in Columbus
The Columbus industries that see more men than women are Wholesale Trade (100.0%), Transportation & Warehousing (88.6%), and Agriculture, Fishing & Hunting (86.4%), whereas the industries that tend to have a higher number of women are Administrative & Support (100.0%), Health Care & Social Assistance (82.1%), and Educational Services (79.3%).
| Industry | Male | Female |
| Agriculture, Fishing & Hunting | 19 (86.4%) | 3 (13.6%) |
| Mining, Quarrying, & Extraction | 0 (0.0%) | 0 (0.0%) |
| Construction | 15 (78.9%) | 4 (21.0%) |
| Manufacturing | 14 (82.4%) | 3 (17.6%) |
| Wholesale Trade | 1 (100.0%) | 0 (0.0%) |
| Retail Trade | 89 (72.4%) | 34 (27.6%) |
| Transportation & Warehousing | 39 (88.6%) | 5 (11.4%) |
| Utilities | 0 (0.0%) | 0 (0.0%) |
| Information | 0 (0.0%) | 0 (0.0%) |
| Finance & Insurance | 8 (40.0%) | 12 (60.0%) |
| Real Estate, Rental & Leasing | 0 (0.0%) | 0 (0.0%) |
| Professional & Scientific | 11 (64.7%) | 6 (35.3%) |
| Enterprise Management | 0 (0.0%) | 0 (0.0%) |
| Administrative & Support | 0 (0.0%) | 4 (100.0%) |
| Educational Services | 6 (20.7%) | 23 (79.3%) |
| Health Care & Social Assistance | 12 (17.9%) | 55 (82.1%) |
| Arts, Entertainment & Recreation | 4 (28.6%) | 10 (71.4%) |
| Accommodation & Food Services | 9 (25.7%) | 26 (74.3%) |
| Public Administration | 3 (25.0%) | 9 (75.0%) |
| Total | 233 (51.7%) | 218 (48.3%) |
Education in Columbus
School Enrollment in Columbus
The most common levels of schooling among the 144 students in Columbus are middle school (60 | 41.7%), elementary school (28 | 19.4%), and high school (27 | 18.8%).

| School Level | # Students | % Students |
| Nursery / Preschool | 2 | 1.4% |
| Kindergarten | 3 | 2.1% |
| Elementary School | 28 | 19.4% |
| Middle School | 60 | 41.7% |
| High School | 27 | 18.8% |
| College / Undergraduate | 24 | 16.7% |
| Graduate / Professional | 0 | 0.0% |
| Total | 144 | 100.0% |
School Enrollment by Age by Funding Source in Columbus
Out of a total of 144 students who are enrolled in schools in Columbus, 24 (16.7%) attend a private institution, while the remaining 120 (83.3%) are enrolled in public schools. The age group of 20 to 24 year olds has the highest likelihood of being enrolled in private schools, with 11 (100.0% in the age bracket) enrolled. Conversely, the age group of 3 to 4 year olds has the lowest likelihood of being enrolled in a private school, with 2 (100.0% in the age bracket) attending a public institution.
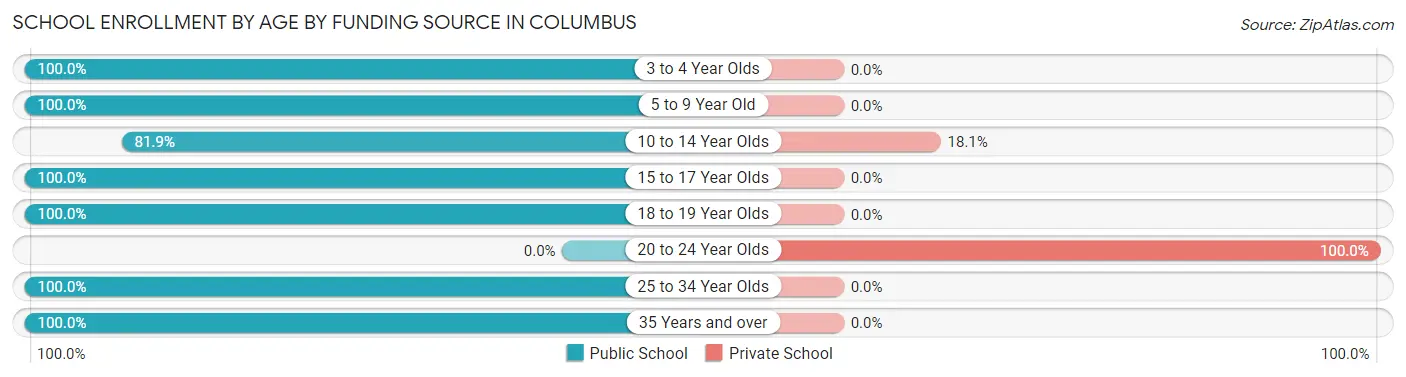
| Age Bracket | Public School | Private School |
| 3 to 4 Year Olds | 2 (100.0%) | 0 (0.0%) |
| 5 to 9 Year Old | 24 (100.0%) | 0 (0.0%) |
| 10 to 14 Year Olds | 59 (81.9%) | 13 (18.1%) |
| 15 to 17 Year Olds | 22 (100.0%) | 0 (0.0%) |
| 18 to 19 Year Olds | 1 (100.0%) | 0 (0.0%) |
| 20 to 24 Year Olds | 0 (0.0%) | 11 (100.0%) |
| 25 to 34 Year Olds | 9 (100.0%) | 0 (0.0%) |
| 35 Years and over | 3 (100.0%) | 0 (0.0%) |
| Total | 120 (83.3%) | 24 (16.7%) |
Educational Attainment by Field of Study in Columbus
Literature & languages (85 | 38.1%), liberal arts & history (33 | 14.8%), arts & humanities (26 | 11.7%), business (25 | 11.2%), and science & technology (17 | 7.6%) are the most common fields of study among 223 individuals in Columbus who have obtained a bachelor's degree or higher.
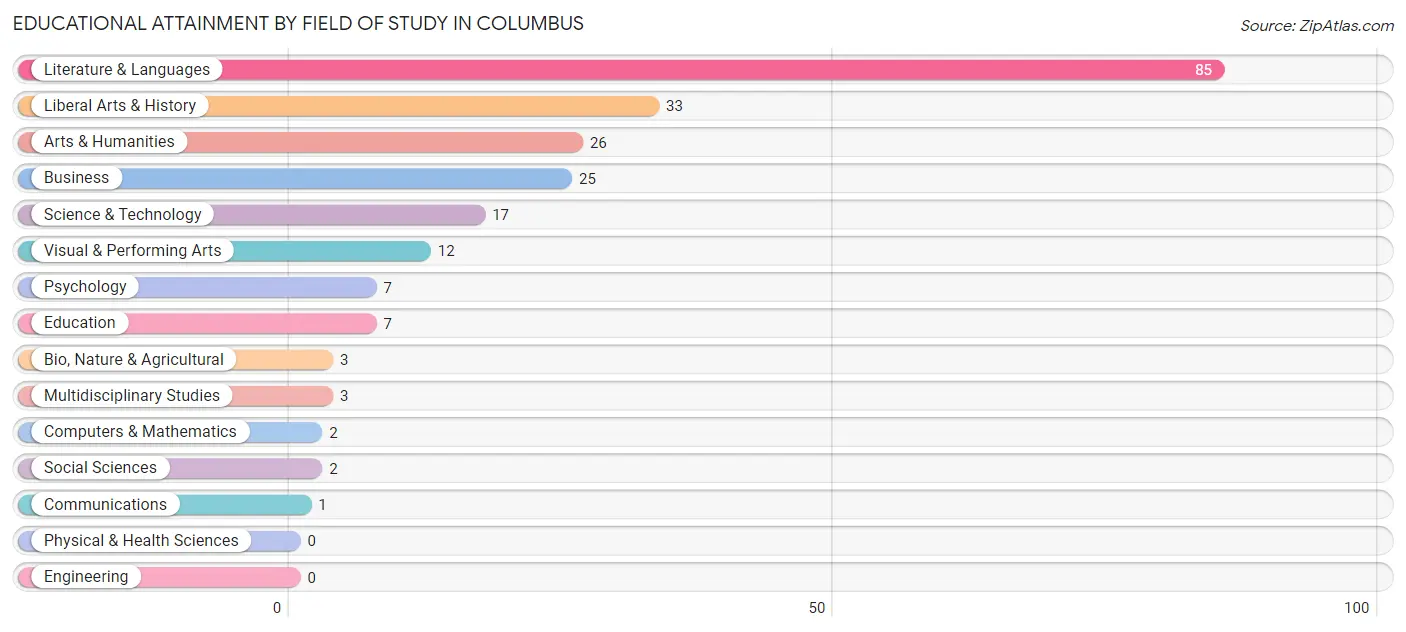
| Field of Study | # Graduates | % Graduates |
| Computers & Mathematics | 2 | 0.9% |
| Bio, Nature & Agricultural | 3 | 1.3% |
| Physical & Health Sciences | 0 | 0.0% |
| Psychology | 7 | 3.1% |
| Social Sciences | 2 | 0.9% |
| Engineering | 0 | 0.0% |
| Multidisciplinary Studies | 3 | 1.3% |
| Science & Technology | 17 | 7.6% |
| Business | 25 | 11.2% |
| Education | 7 | 3.1% |
| Literature & Languages | 85 | 38.1% |
| Liberal Arts & History | 33 | 14.8% |
| Visual & Performing Arts | 12 | 5.4% |
| Communications | 1 | 0.4% |
| Arts & Humanities | 26 | 11.7% |
| Total | 223 | 100.0% |
Transportation & Commute in Columbus
Vehicle Availability by Sex in Columbus
The most prevalent vehicle ownership categories in Columbus are males with 2 vehicles (123, accounting for 54.7%) and females with 2 vehicles (55, making up 56.4%).
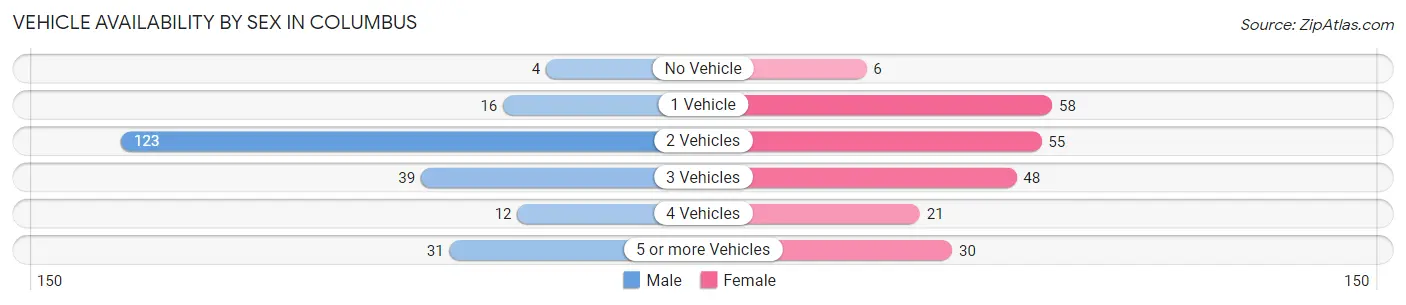
| Vehicles Available | Male | Female |
| No Vehicle | 4 (1.8%) | 6 (2.8%) |
| 1 Vehicle | 16 (7.1%) | 58 (26.6%) |
| 2 Vehicles | 123 (54.7%) | 55 (25.2%) |
| 3 Vehicles | 39 (17.3%) | 48 (22.0%) |
| 4 Vehicles | 12 (5.3%) | 21 (9.6%) |
| 5 or more Vehicles | 31 (13.8%) | 30 (13.8%) |
| Total | 225 (100.0%) | 218 (100.0%) |
Commute Time in Columbus
The most frequently occuring commute durations in Columbus are 5 to 9 minutes (144 commuters, 35.9%), 20 to 24 minutes (69 commuters, 17.2%), and 30 to 34 minutes (44 commuters, 11.0%).
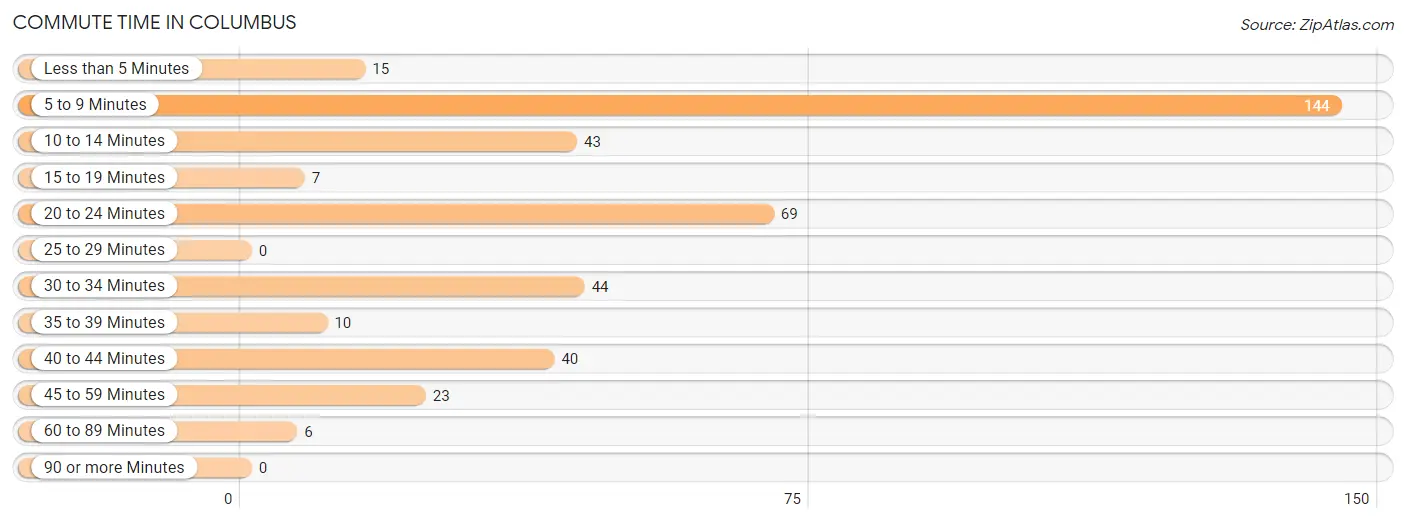
| Commute Time | # Commuters | % Commuters |
| Less than 5 Minutes | 15 | 3.7% |
| 5 to 9 Minutes | 144 | 35.9% |
| 10 to 14 Minutes | 43 | 10.7% |
| 15 to 19 Minutes | 7 | 1.8% |
| 20 to 24 Minutes | 69 | 17.2% |
| 25 to 29 Minutes | 0 | 0.0% |
| 30 to 34 Minutes | 44 | 11.0% |
| 35 to 39 Minutes | 10 | 2.5% |
| 40 to 44 Minutes | 40 | 10.0% |
| 45 to 59 Minutes | 23 | 5.7% |
| 60 to 89 Minutes | 6 | 1.5% |
| 90 or more Minutes | 0 | 0.0% |
Commute Time by Sex in Columbus
The most common commute times in Columbus are 5 to 9 minutes (78 commuters, 38.6%) for males and 5 to 9 minutes (66 commuters, 33.2%) for females.
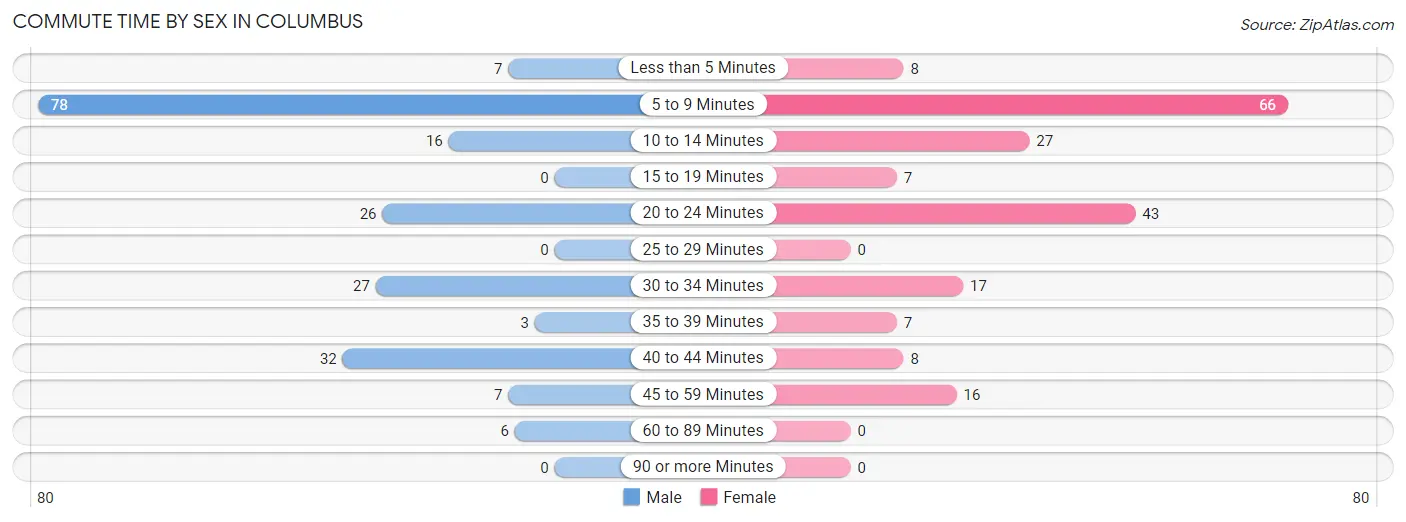
| Commute Time | Male | Female |
| Less than 5 Minutes | 7 (3.5%) | 8 (4.0%) |
| 5 to 9 Minutes | 78 (38.6%) | 66 (33.2%) |
| 10 to 14 Minutes | 16 (7.9%) | 27 (13.6%) |
| 15 to 19 Minutes | 0 (0.0%) | 7 (3.5%) |
| 20 to 24 Minutes | 26 (12.9%) | 43 (21.6%) |
| 25 to 29 Minutes | 0 (0.0%) | 0 (0.0%) |
| 30 to 34 Minutes | 27 (13.4%) | 17 (8.5%) |
| 35 to 39 Minutes | 3 (1.5%) | 7 (3.5%) |
| 40 to 44 Minutes | 32 (15.8%) | 8 (4.0%) |
| 45 to 59 Minutes | 7 (3.5%) | 16 (8.0%) |
| 60 to 89 Minutes | 6 (3.0%) | 0 (0.0%) |
| 90 or more Minutes | 0 (0.0%) | 0 (0.0%) |
Time of Departure to Work by Sex in Columbus
The most frequent times of departure to work in Columbus are 9:00 AM to 9:59 AM (60, 29.7%) for males and 6:00 AM to 6:29 AM (46, 23.1%) for females.
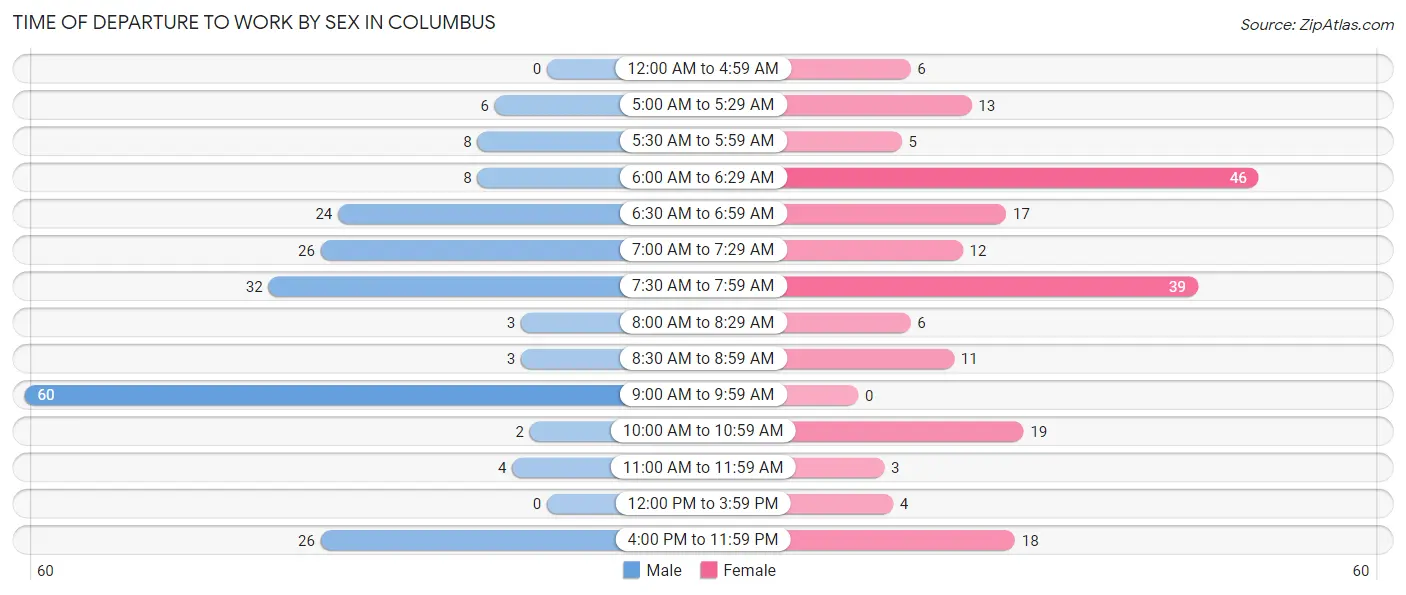
| Time of Departure | Male | Female |
| 12:00 AM to 4:59 AM | 0 (0.0%) | 6 (3.0%) |
| 5:00 AM to 5:29 AM | 6 (3.0%) | 13 (6.5%) |
| 5:30 AM to 5:59 AM | 8 (4.0%) | 5 (2.5%) |
| 6:00 AM to 6:29 AM | 8 (4.0%) | 46 (23.1%) |
| 6:30 AM to 6:59 AM | 24 (11.9%) | 17 (8.5%) |
| 7:00 AM to 7:29 AM | 26 (12.9%) | 12 (6.0%) |
| 7:30 AM to 7:59 AM | 32 (15.8%) | 39 (19.6%) |
| 8:00 AM to 8:29 AM | 3 (1.5%) | 6 (3.0%) |
| 8:30 AM to 8:59 AM | 3 (1.5%) | 11 (5.5%) |
| 9:00 AM to 9:59 AM | 60 (29.7%) | 0 (0.0%) |
| 10:00 AM to 10:59 AM | 2 (1.0%) | 19 (9.6%) |
| 11:00 AM to 11:59 AM | 4 (2.0%) | 3 (1.5%) |
| 12:00 PM to 3:59 PM | 0 (0.0%) | 4 (2.0%) |
| 4:00 PM to 11:59 PM | 26 (12.9%) | 18 (9.0%) |
| Total | 202 (100.0%) | 199 (100.0%) |
Housing Occupancy in Columbus
Occupancy by Ownership in Columbus
Of the total 488 dwellings in Columbus, owner-occupied units account for 289 (59.2%), while renter-occupied units make up 199 (40.8%).
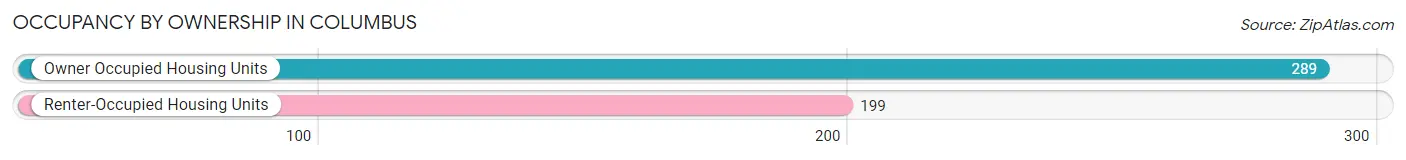
| Occupancy | # Housing Units | % Housing Units |
| Owner Occupied Housing Units | 289 | 59.2% |
| Renter-Occupied Housing Units | 199 | 40.8% |
| Total Occupied Housing Units | 488 | 100.0% |
Occupancy by Household Size in Columbus
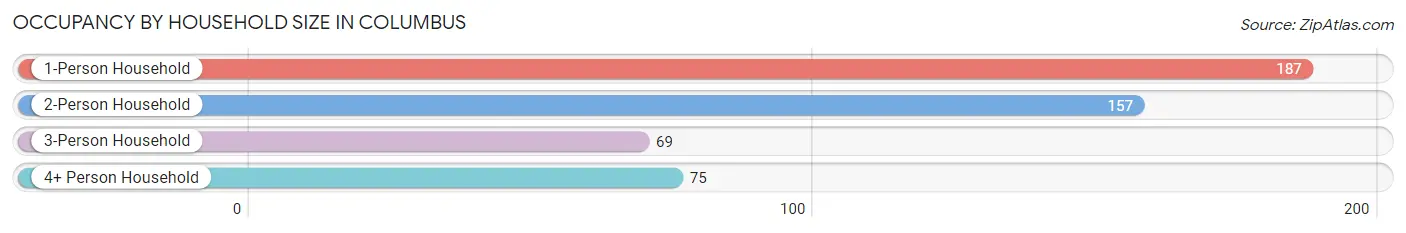
| Household Size | # Housing Units | % Housing Units |
| 1-Person Household | 187 | 38.3% |
| 2-Person Household | 157 | 32.2% |
| 3-Person Household | 69 | 14.1% |
| 4+ Person Household | 75 | 15.4% |
| Total Housing Units | 488 | 100.0% |
Occupancy by Ownership by Household Size in Columbus
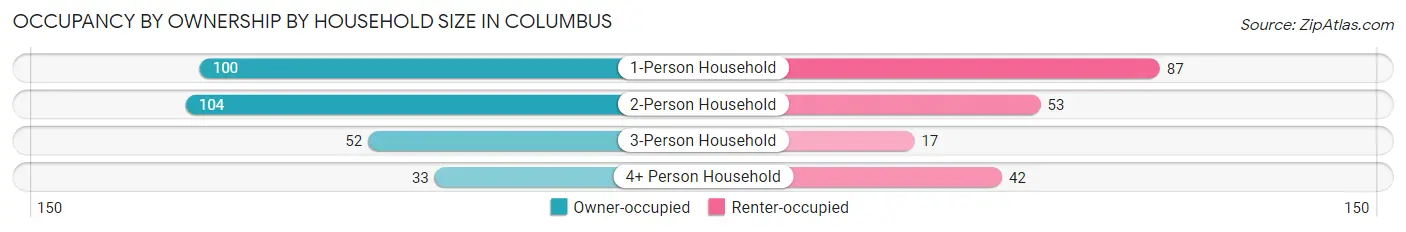
| Household Size | Owner-occupied | Renter-occupied |
| 1-Person Household | 100 (53.5%) | 87 (46.5%) |
| 2-Person Household | 104 (66.2%) | 53 (33.8%) |
| 3-Person Household | 52 (75.4%) | 17 (24.6%) |
| 4+ Person Household | 33 (44.0%) | 42 (56.0%) |
| Total Housing Units | 289 (59.2%) | 199 (40.8%) |
Occupancy by Educational Attainment in Columbus
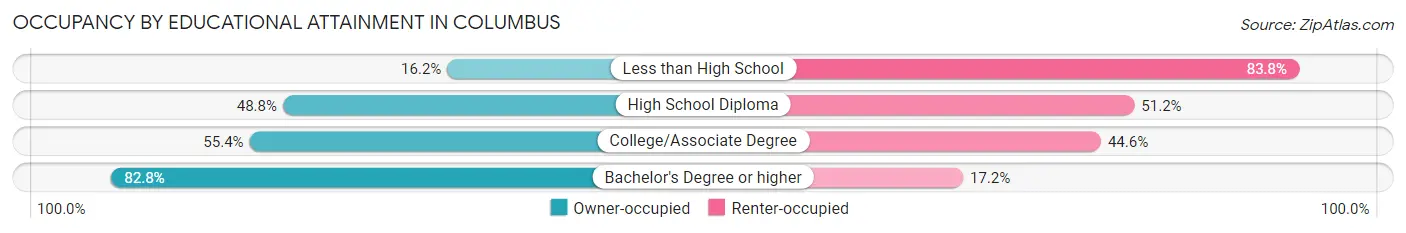
| Household Size | Owner-occupied | Renter-occupied |
| Less than High School | 6 (16.2%) | 31 (83.8%) |
| High School Diploma | 61 (48.8%) | 64 (51.2%) |
| College/Associate Degree | 97 (55.4%) | 78 (44.6%) |
| Bachelor's Degree or higher | 125 (82.8%) | 26 (17.2%) |
Occupancy by Age of Householder in Columbus
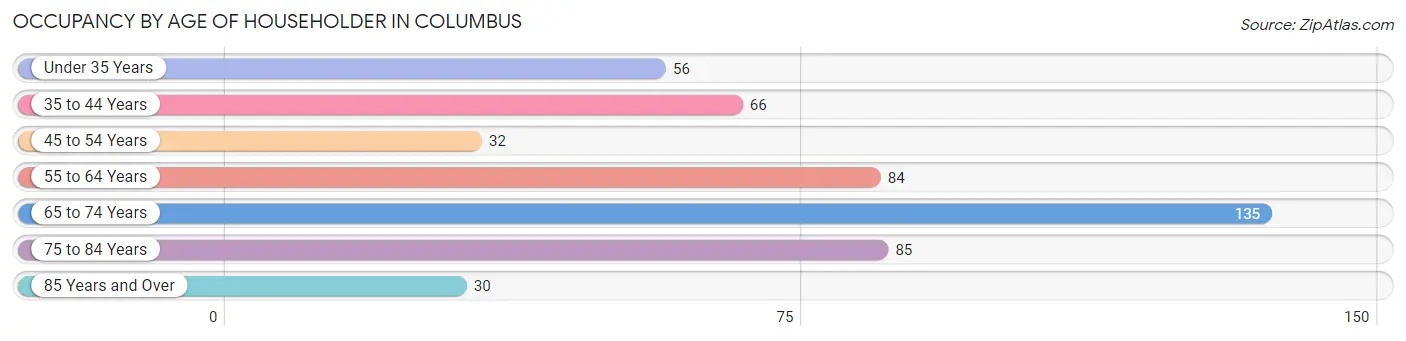
| Age Bracket | # Households | % Households |
| Under 35 Years | 56 | 11.5% |
| 35 to 44 Years | 66 | 13.5% |
| 45 to 54 Years | 32 | 6.6% |
| 55 to 64 Years | 84 | 17.2% |
| 65 to 74 Years | 135 | 27.7% |
| 75 to 84 Years | 85 | 17.4% |
| 85 Years and Over | 30 | 6.1% |
| Total | 488 | 100.0% |
Housing Finances in Columbus
Median Income by Occupancy in Columbus
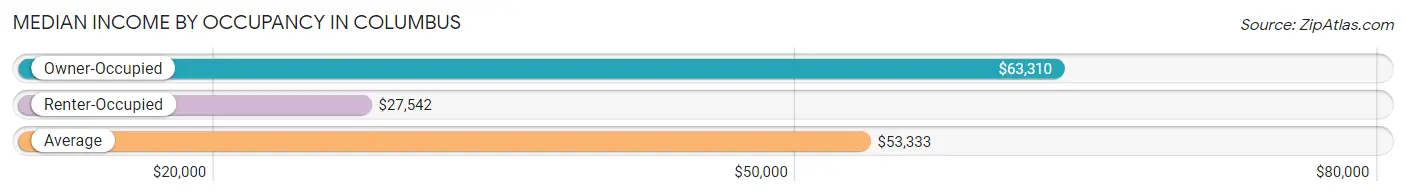
| Occupancy Type | # Households | Median Income |
| Owner-Occupied | 289 (59.2%) | $63,310 |
| Renter-Occupied | 199 (40.8%) | $27,542 |
| Average | 488 (100.0%) | $53,333 |
Occupancy by Householder Income Bracket in Columbus
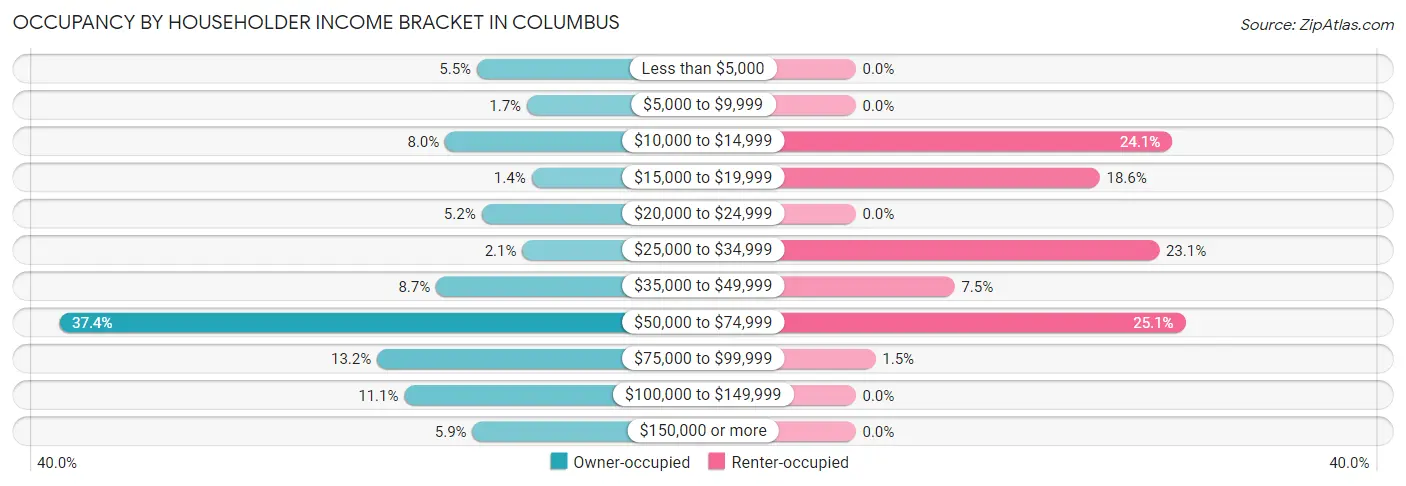
| Income Bracket | Owner-occupied | Renter-occupied |
| Less than $5,000 | 16 (5.5%) | 0 (0.0%) |
| $5,000 to $9,999 | 5 (1.7%) | 0 (0.0%) |
| $10,000 to $14,999 | 23 (8.0%) | 48 (24.1%) |
| $15,000 to $19,999 | 4 (1.4%) | 37 (18.6%) |
| $20,000 to $24,999 | 15 (5.2%) | 0 (0.0%) |
| $25,000 to $34,999 | 6 (2.1%) | 46 (23.1%) |
| $35,000 to $49,999 | 25 (8.6%) | 15 (7.5%) |
| $50,000 to $74,999 | 108 (37.4%) | 50 (25.1%) |
| $75,000 to $99,999 | 38 (13.2%) | 3 (1.5%) |
| $100,000 to $149,999 | 32 (11.1%) | 0 (0.0%) |
| $150,000 or more | 17 (5.9%) | 0 (0.0%) |
| Total | 289 (100.0%) | 199 (100.0%) |
Monthly Housing Cost Tiers in Columbus
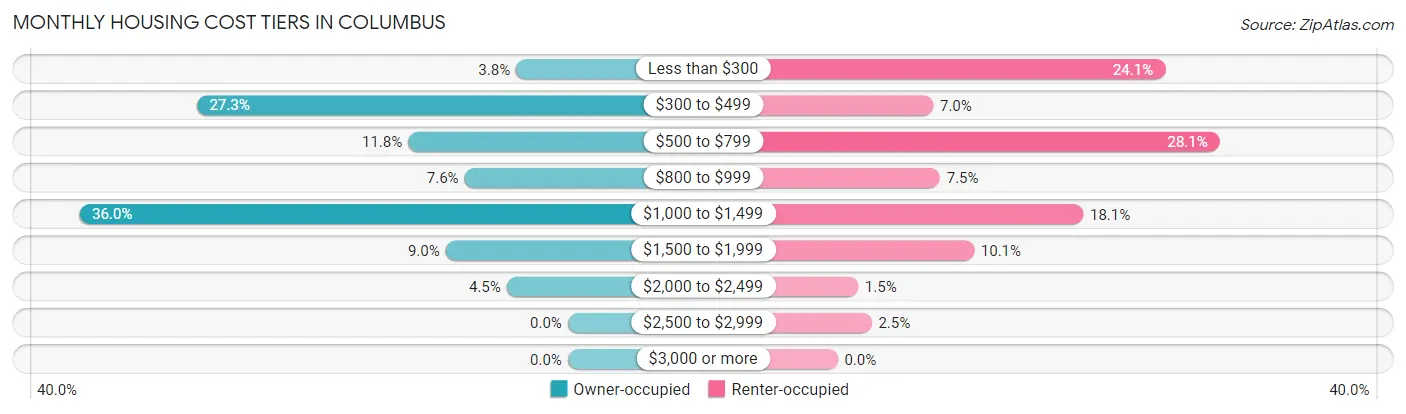
| Monthly Cost | Owner-occupied | Renter-occupied |
| Less than $300 | 11 (3.8%) | 48 (24.1%) |
| $300 to $499 | 79 (27.3%) | 14 (7.0%) |
| $500 to $799 | 34 (11.8%) | 56 (28.1%) |
| $800 to $999 | 22 (7.6%) | 15 (7.5%) |
| $1,000 to $1,499 | 104 (36.0%) | 36 (18.1%) |
| $1,500 to $1,999 | 26 (9.0%) | 20 (10.1%) |
| $2,000 to $2,499 | 13 (4.5%) | 3 (1.5%) |
| $2,500 to $2,999 | 0 (0.0%) | 5 (2.5%) |
| $3,000 or more | 0 (0.0%) | 0 (0.0%) |
| Total | 289 (100.0%) | 199 (100.0%) |
Physical Housing Characteristics in Columbus
Housing Structures in Columbus
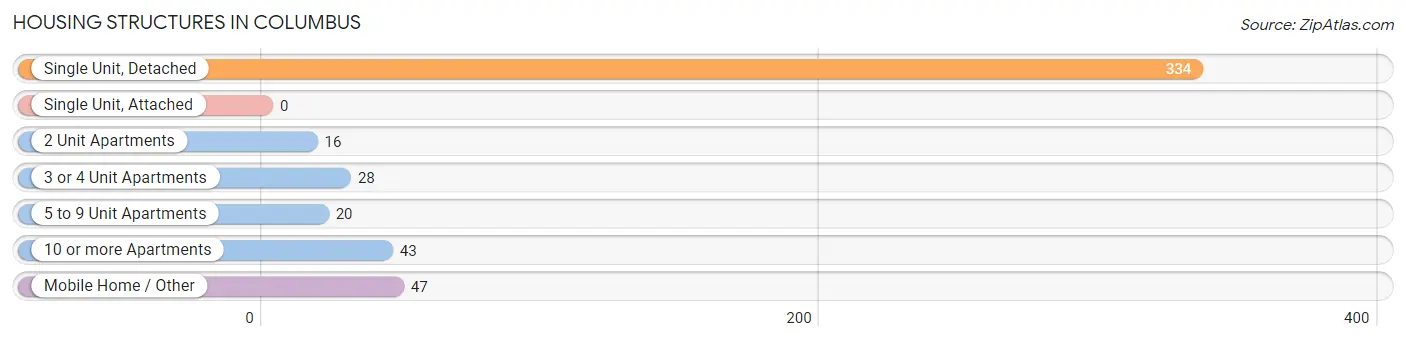
| Structure Type | # Housing Units | % Housing Units |
| Single Unit, Detached | 334 | 68.4% |
| Single Unit, Attached | 0 | 0.0% |
| 2 Unit Apartments | 16 | 3.3% |
| 3 or 4 Unit Apartments | 28 | 5.7% |
| 5 to 9 Unit Apartments | 20 | 4.1% |
| 10 or more Apartments | 43 | 8.8% |
| Mobile Home / Other | 47 | 9.6% |
| Total | 488 | 100.0% |
Housing Structures by Occupancy in Columbus
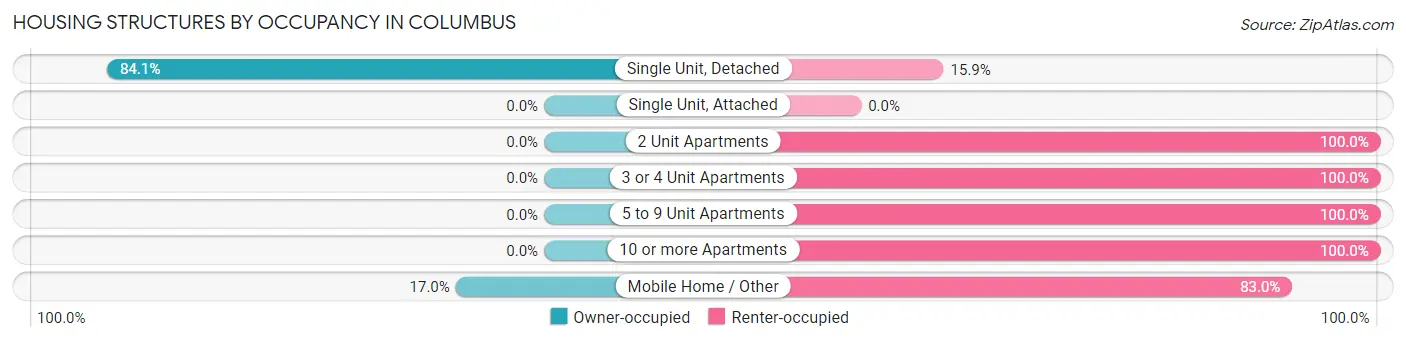
| Structure Type | Owner-occupied | Renter-occupied |
| Single Unit, Detached | 281 (84.1%) | 53 (15.9%) |
| Single Unit, Attached | 0 (0.0%) | 0 (0.0%) |
| 2 Unit Apartments | 0 (0.0%) | 16 (100.0%) |
| 3 or 4 Unit Apartments | 0 (0.0%) | 28 (100.0%) |
| 5 to 9 Unit Apartments | 0 (0.0%) | 20 (100.0%) |
| 10 or more Apartments | 0 (0.0%) | 43 (100.0%) |
| Mobile Home / Other | 8 (17.0%) | 39 (83.0%) |
| Total | 289 (59.2%) | 199 (40.8%) |
Housing Structures by Number of Rooms in Columbus
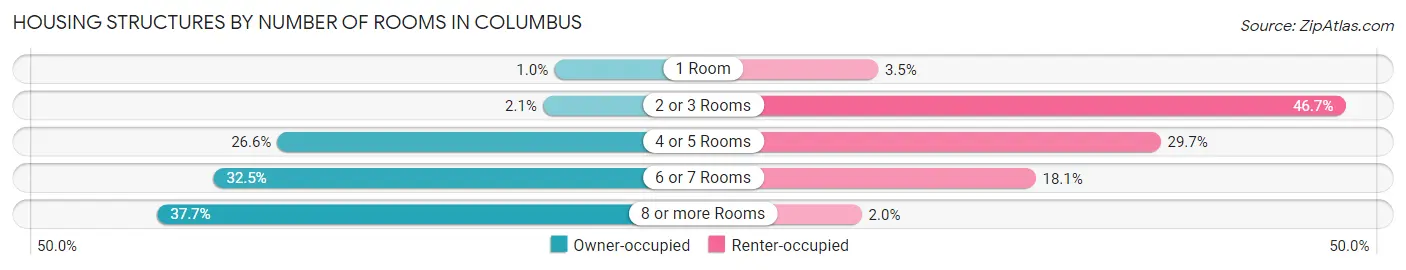
| Number of Rooms | Owner-occupied | Renter-occupied |
| 1 Room | 3 (1.0%) | 7 (3.5%) |
| 2 or 3 Rooms | 6 (2.1%) | 93 (46.7%) |
| 4 or 5 Rooms | 77 (26.6%) | 59 (29.6%) |
| 6 or 7 Rooms | 94 (32.5%) | 36 (18.1%) |
| 8 or more Rooms | 109 (37.7%) | 4 (2.0%) |
| Total | 289 (100.0%) | 199 (100.0%) |
Housing Structure by Heating Type in Columbus
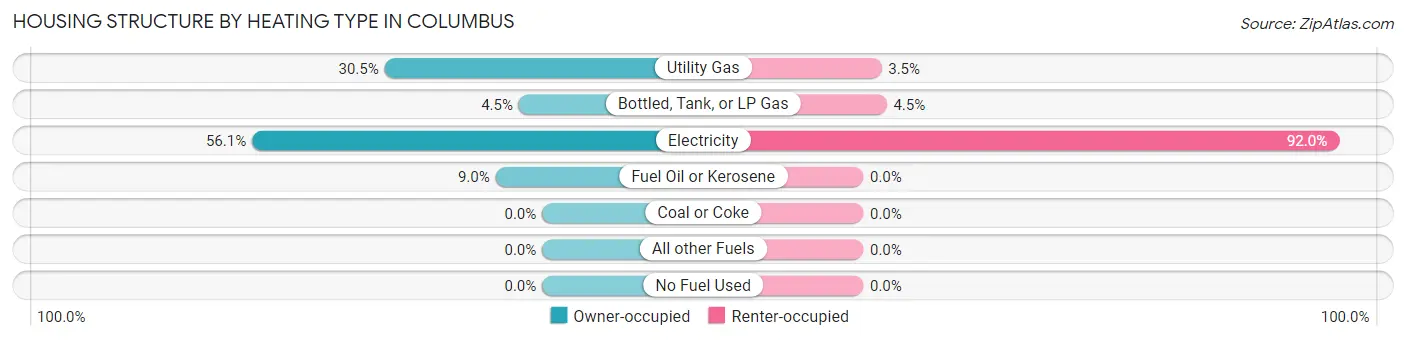
| Heating Type | Owner-occupied | Renter-occupied |
| Utility Gas | 88 (30.4%) | 7 (3.5%) |
| Bottled, Tank, or LP Gas | 13 (4.5%) | 9 (4.5%) |
| Electricity | 162 (56.1%) | 183 (92.0%) |
| Fuel Oil or Kerosene | 26 (9.0%) | 0 (0.0%) |
| Coal or Coke | 0 (0.0%) | 0 (0.0%) |
| All other Fuels | 0 (0.0%) | 0 (0.0%) |
| No Fuel Used | 0 (0.0%) | 0 (0.0%) |
| Total | 289 (100.0%) | 199 (100.0%) |
Household Vehicle Usage in Columbus
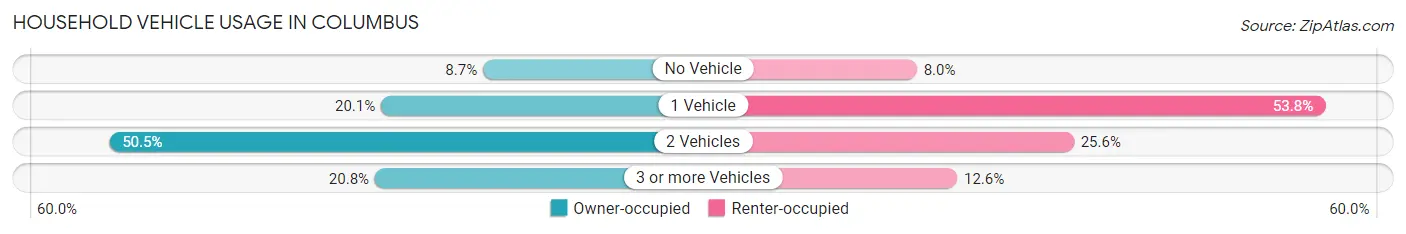
| Vehicles per Household | Owner-occupied | Renter-occupied |
| No Vehicle | 25 (8.6%) | 16 (8.0%) |
| 1 Vehicle | 58 (20.1%) | 107 (53.8%) |
| 2 Vehicles | 146 (50.5%) | 51 (25.6%) |
| 3 or more Vehicles | 60 (20.8%) | 25 (12.6%) |
| Total | 289 (100.0%) | 199 (100.0%) |
Real Estate & Mortgages in Columbus
Real Estate and Mortgage Overview in Columbus
| Characteristic | Without Mortgage | With Mortgage |
| Housing Units | 118 | 171 |
| Median Property Value | $213,800 | $193,000 |
| Median Household Income | $37,727 | $12 |
| Monthly Housing Costs | $382 | $0 |
| Real Estate Taxes | $1,543 | $0 |
Property Value by Mortgage Status in Columbus
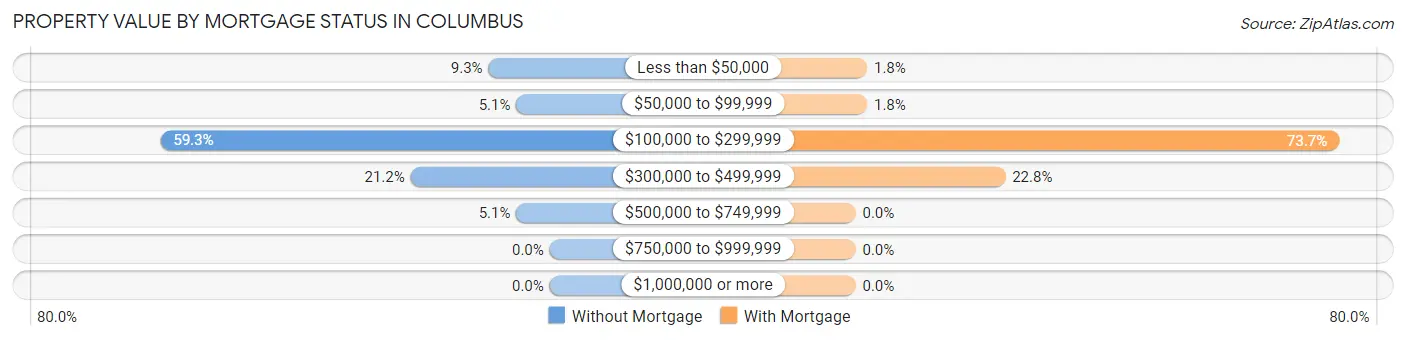
| Property Value | Without Mortgage | With Mortgage |
| Less than $50,000 | 11 (9.3%) | 3 (1.8%) |
| $50,000 to $99,999 | 6 (5.1%) | 3 (1.8%) |
| $100,000 to $299,999 | 70 (59.3%) | 126 (73.7%) |
| $300,000 to $499,999 | 25 (21.2%) | 39 (22.8%) |
| $500,000 to $749,999 | 6 (5.1%) | 0 (0.0%) |
| $750,000 to $999,999 | 0 (0.0%) | 0 (0.0%) |
| $1,000,000 or more | 0 (0.0%) | 0 (0.0%) |
| Total | 118 (100.0%) | 171 (100.0%) |
Household Income by Mortgage Status in Columbus
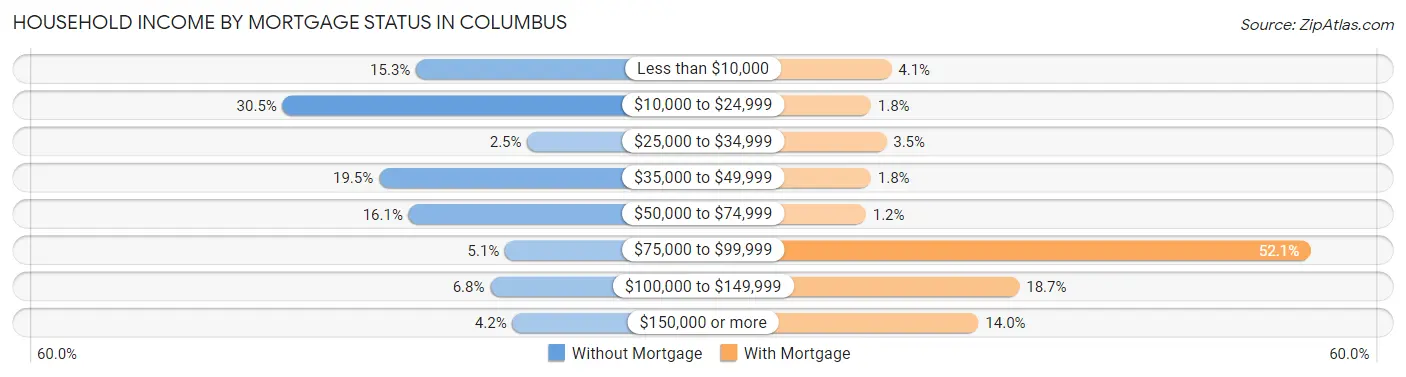
| Household Income | Without Mortgage | With Mortgage |
| Less than $10,000 | 18 (15.2%) | 7 (4.1%) |
| $10,000 to $24,999 | 36 (30.5%) | 3 (1.8%) |
| $25,000 to $34,999 | 3 (2.5%) | 6 (3.5%) |
| $35,000 to $49,999 | 23 (19.5%) | 3 (1.8%) |
| $50,000 to $74,999 | 19 (16.1%) | 2 (1.2%) |
| $75,000 to $99,999 | 6 (5.1%) | 89 (52.0%) |
| $100,000 to $149,999 | 8 (6.8%) | 32 (18.7%) |
| $150,000 or more | 5 (4.2%) | 24 (14.0%) |
| Total | 118 (100.0%) | 171 (100.0%) |
Property Value to Household Income Ratio in Columbus
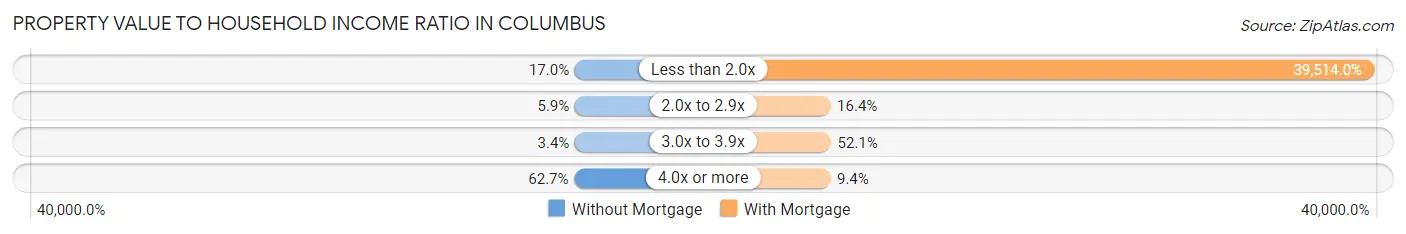
| Value-to-Income Ratio | Without Mortgage | With Mortgage |
| Less than 2.0x | 20 (17.0%) | 67,569 (39,514.0%) |
| 2.0x to 2.9x | 7 (5.9%) | 28 (16.4%) |
| 3.0x to 3.9x | 4 (3.4%) | 89 (52.0%) |
| 4.0x or more | 74 (62.7%) | 16 (9.4%) |
| Total | 118 (100.0%) | 171 (100.0%) |
Real Estate Taxes by Mortgage Status in Columbus
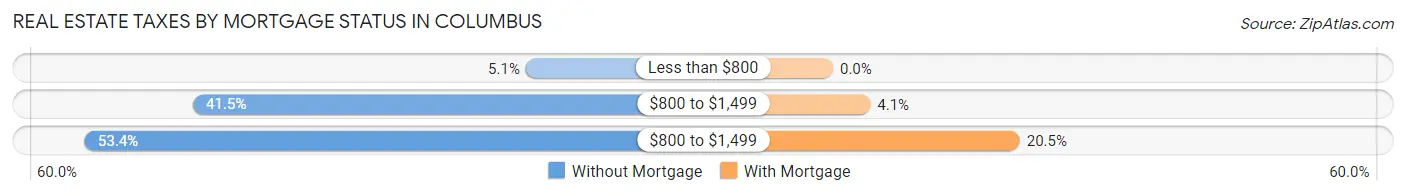
| Property Taxes | Without Mortgage | With Mortgage |
| Less than $800 | 6 (5.1%) | 0 (0.0%) |
| $800 to $1,499 | 49 (41.5%) | 7 (4.1%) |
| $800 to $1,499 | 63 (53.4%) | 35 (20.5%) |
| Total | 118 (100.0%) | 171 (100.0%) |
Health & Disability in Columbus
Health Insurance Coverage by Age in Columbus
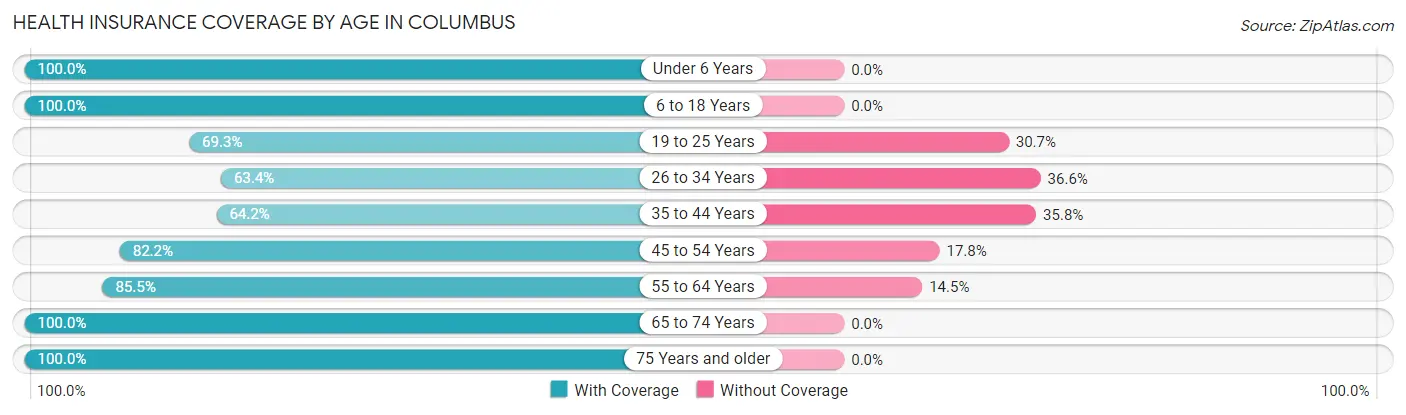
| Age Bracket | With Coverage | Without Coverage |
| Under 6 Years | 43 (100.0%) | 0 (0.0%) |
| 6 to 18 Years | 156 (100.0%) | 0 (0.0%) |
| 19 to 25 Years | 61 (69.3%) | 27 (30.7%) |
| 26 to 34 Years | 45 (63.4%) | 26 (36.6%) |
| 35 to 44 Years | 70 (64.2%) | 39 (35.8%) |
| 45 to 54 Years | 88 (82.2%) | 19 (17.8%) |
| 55 to 64 Years | 147 (85.5%) | 25 (14.5%) |
| 65 to 74 Years | 171 (100.0%) | 0 (0.0%) |
| 75 Years and older | 134 (100.0%) | 0 (0.0%) |
| Total | 915 (87.1%) | 136 (12.9%) |
Health Insurance Coverage by Citizenship Status in Columbus
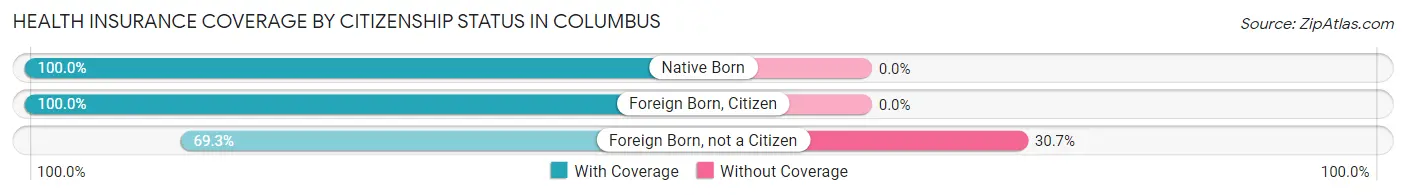
| Citizenship Status | With Coverage | Without Coverage |
| Native Born | 43 (100.0%) | 0 (0.0%) |
| Foreign Born, Citizen | 156 (100.0%) | 0 (0.0%) |
| Foreign Born, not a Citizen | 61 (69.3%) | 27 (30.7%) |
Health Insurance Coverage by Household Income in Columbus
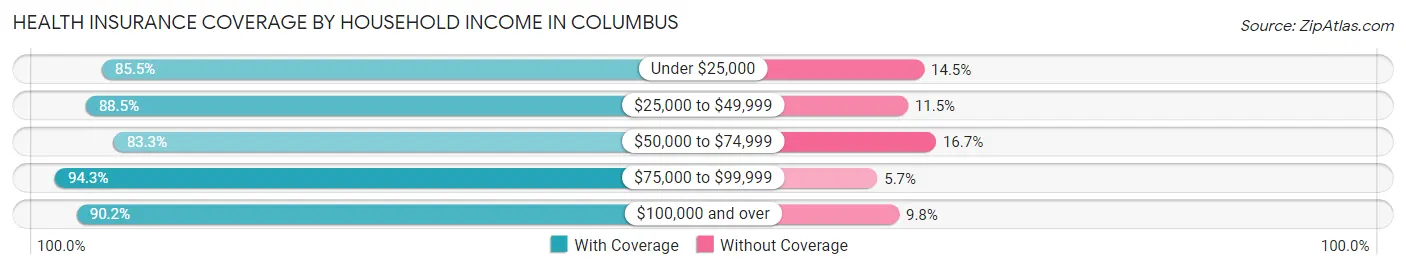
| Household Income | With Coverage | Without Coverage |
| Under $25,000 | 177 (85.5%) | 30 (14.5%) |
| $25,000 to $49,999 | 170 (88.5%) | 22 (11.5%) |
| $50,000 to $74,999 | 294 (83.3%) | 59 (16.7%) |
| $75,000 to $99,999 | 99 (94.3%) | 6 (5.7%) |
| $100,000 and over | 175 (90.2%) | 19 (9.8%) |
Public vs Private Health Insurance Coverage by Age in Columbus
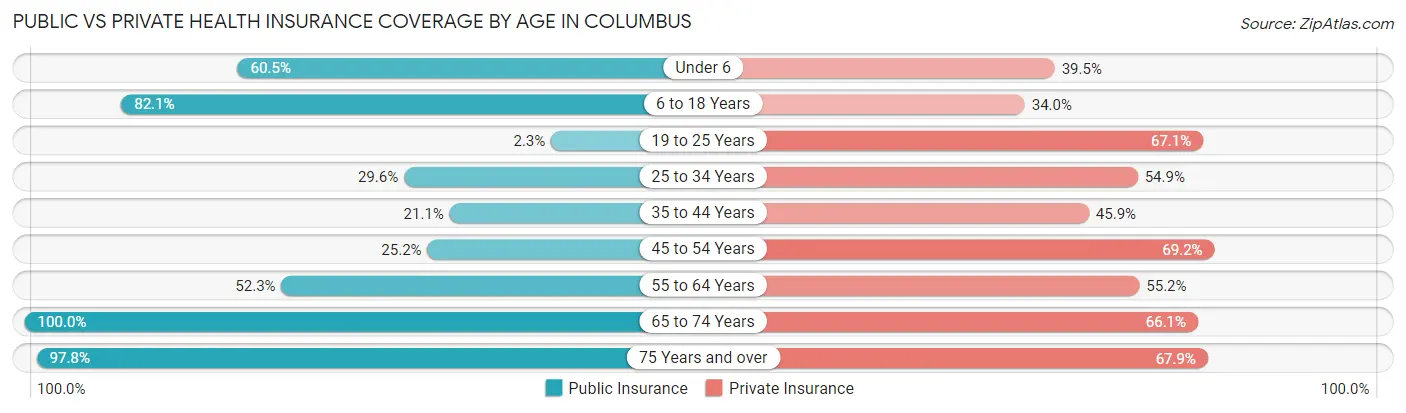
| Age Bracket | Public Insurance | Private Insurance |
| Under 6 | 26 (60.5%) | 17 (39.5%) |
| 6 to 18 Years | 128 (82.1%) | 53 (34.0%) |
| 19 to 25 Years | 2 (2.3%) | 59 (67.0%) |
| 25 to 34 Years | 21 (29.6%) | 39 (54.9%) |
| 35 to 44 Years | 23 (21.1%) | 50 (45.9%) |
| 45 to 54 Years | 27 (25.2%) | 74 (69.2%) |
| 55 to 64 Years | 90 (52.3%) | 95 (55.2%) |
| 65 to 74 Years | 171 (100.0%) | 113 (66.1%) |
| 75 Years and over | 131 (97.8%) | 91 (67.9%) |
| Total | 619 (58.9%) | 591 (56.2%) |
Disability Status by Sex by Age in Columbus
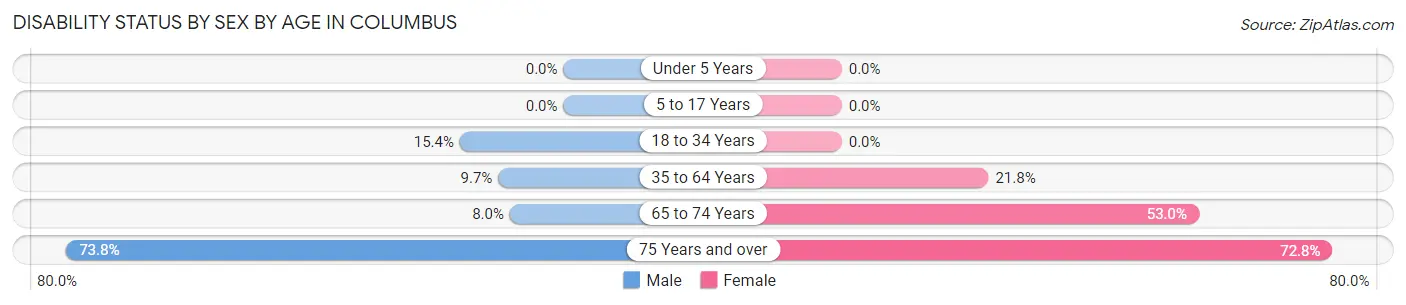
| Age Bracket | Male | Female |
| Under 5 Years | 0 (0.0%) | 0 (0.0%) |
| 5 to 17 Years | 0 (0.0%) | 0 (0.0%) |
| 18 to 34 Years | 6 (15.4%) | 0 (0.0%) |
| 35 to 64 Years | 18 (9.7%) | 44 (21.8%) |
| 65 to 74 Years | 7 (8.0%) | 44 (53.0%) |
| 75 Years and over | 31 (73.8%) | 67 (72.8%) |
Disability Class by Sex by Age in Columbus
Disability Class: Hearing Difficulty
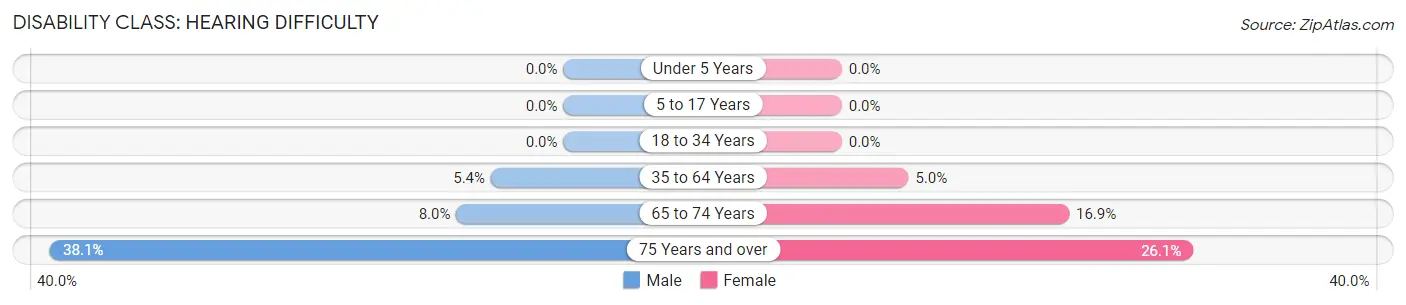
| Age Bracket | Male | Female |
| Under 5 Years | 0 (0.0%) | 0 (0.0%) |
| 5 to 17 Years | 0 (0.0%) | 0 (0.0%) |
| 18 to 34 Years | 0 (0.0%) | 0 (0.0%) |
| 35 to 64 Years | 10 (5.4%) | 10 (5.0%) |
| 65 to 74 Years | 7 (8.0%) | 14 (16.9%) |
| 75 Years and over | 16 (38.1%) | 24 (26.1%) |
Disability Class: Vision Difficulty
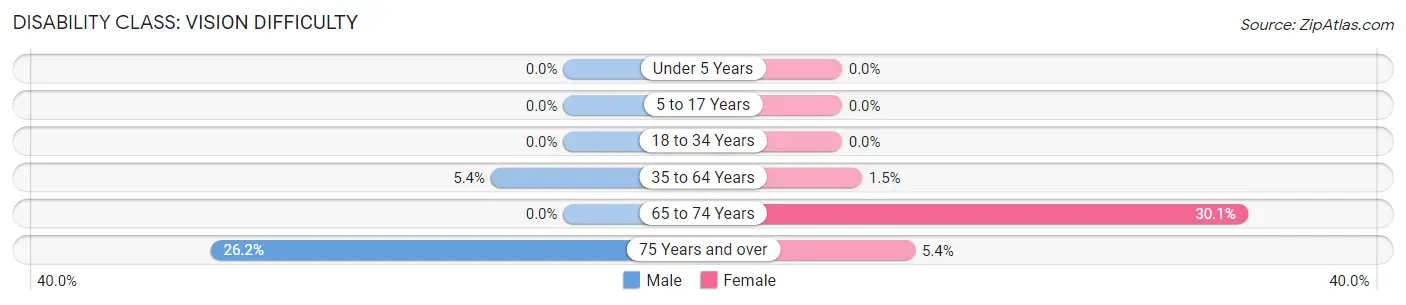
| Age Bracket | Male | Female |
| Under 5 Years | 0 (0.0%) | 0 (0.0%) |
| 5 to 17 Years | 0 (0.0%) | 0 (0.0%) |
| 18 to 34 Years | 0 (0.0%) | 0 (0.0%) |
| 35 to 64 Years | 10 (5.4%) | 3 (1.5%) |
| 65 to 74 Years | 0 (0.0%) | 25 (30.1%) |
| 75 Years and over | 11 (26.2%) | 5 (5.4%) |
Disability Class: Cognitive Difficulty
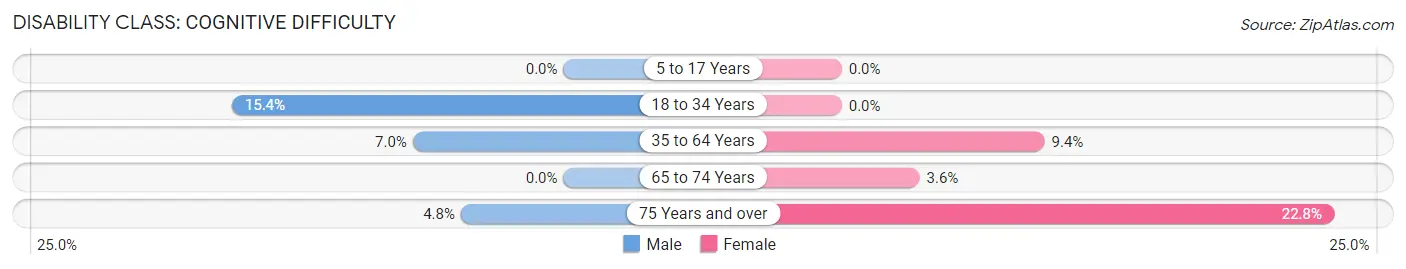
| Age Bracket | Male | Female |
| 5 to 17 Years | 0 (0.0%) | 0 (0.0%) |
| 18 to 34 Years | 6 (15.4%) | 0 (0.0%) |
| 35 to 64 Years | 13 (7.0%) | 19 (9.4%) |
| 65 to 74 Years | 0 (0.0%) | 3 (3.6%) |
| 75 Years and over | 2 (4.8%) | 21 (22.8%) |
Disability Class: Ambulatory Difficulty
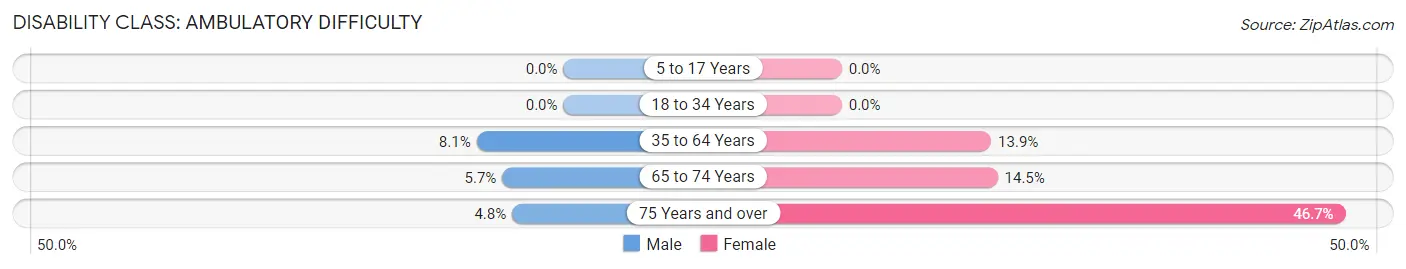
| Age Bracket | Male | Female |
| 5 to 17 Years | 0 (0.0%) | 0 (0.0%) |
| 18 to 34 Years | 0 (0.0%) | 0 (0.0%) |
| 35 to 64 Years | 15 (8.1%) | 28 (13.9%) |
| 65 to 74 Years | 5 (5.7%) | 12 (14.5%) |
| 75 Years and over | 2 (4.8%) | 43 (46.7%) |
Disability Class: Self-Care Difficulty
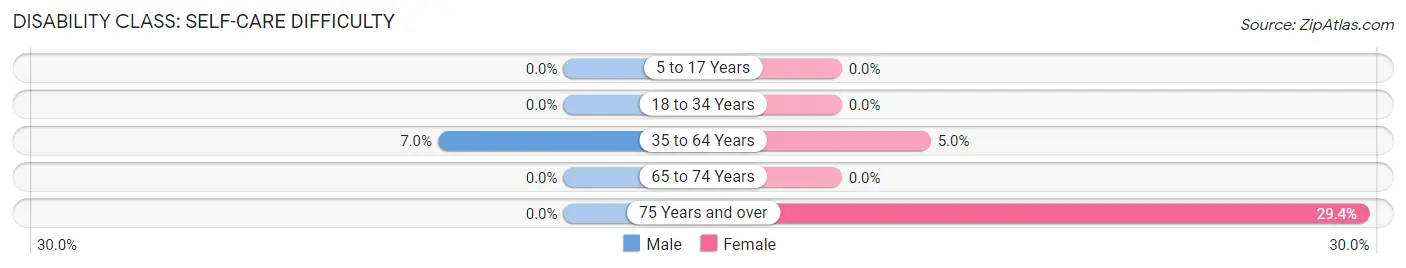
| Age Bracket | Male | Female |
| 5 to 17 Years | 0 (0.0%) | 0 (0.0%) |
| 18 to 34 Years | 0 (0.0%) | 0 (0.0%) |
| 35 to 64 Years | 13 (7.0%) | 10 (5.0%) |
| 65 to 74 Years | 0 (0.0%) | 0 (0.0%) |
| 75 Years and over | 0 (0.0%) | 27 (29.3%) |
Technology Access in Columbus
Computing Device Access in Columbus
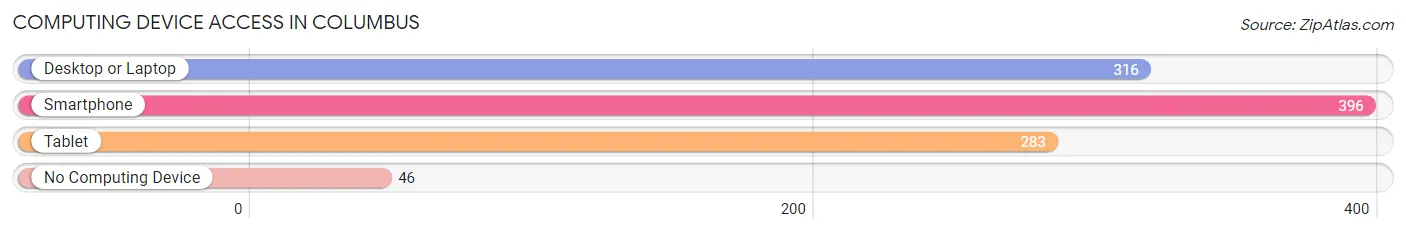
| Device Type | # Households | % Households |
| Desktop or Laptop | 316 | 64.7% |
| Smartphone | 396 | 81.1% |
| Tablet | 283 | 58.0% |
| No Computing Device | 46 | 9.4% |
| Total | 488 | 100.0% |
Internet Access in Columbus
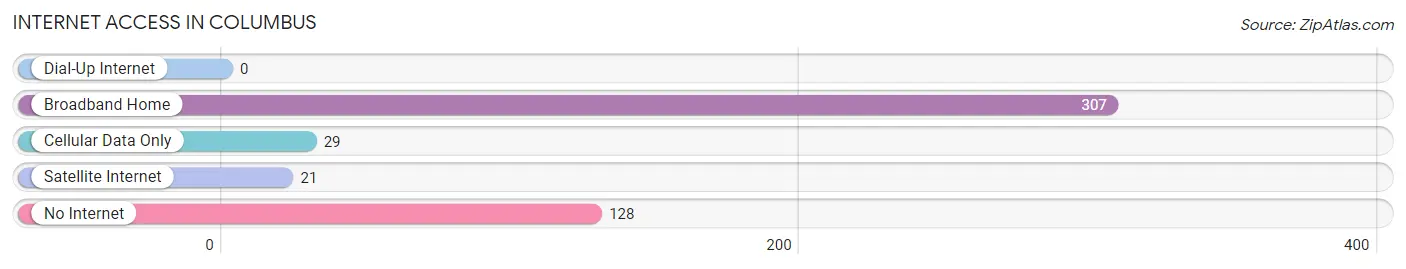
| Internet Type | # Households | % Households |
| Dial-Up Internet | 0 | 0.0% |
| Broadband Home | 307 | 62.9% |
| Cellular Data Only | 29 | 5.9% |
| Satellite Internet | 21 | 4.3% |
| No Internet | 128 | 26.2% |
| Total | 488 | 100.0% |
Columbus Summary
Columbus, North Carolina is a small town located in Polk County, North Carolina. It is situated in the foothills of the Blue Ridge Mountains, and is part of the Tryon-Columbus Metropolitan Statistical Area. The town has a population of approximately 1,500 people, and is the county seat of Polk County.
Geography
Columbus is located in the foothills of the Blue Ridge Mountains, and is situated in the Tryon-Columbus Metropolitan Statistical Area. The town is located at the intersection of US Highway 74 and NC Highway 108. The town is surrounded by the towns of Tryon, Saluda, and Mill Spring. The town is located at an elevation of 1,400 feet, and is approximately 30 miles from Asheville, North Carolina.
The town is located in a temperate climate, with mild winters and warm summers. The average annual temperature is around 60 degrees Fahrenheit, and the average annual precipitation is around 45 inches.
History
Columbus was founded in 1855, and was named after Christopher Columbus. The town was originally a farming community, and was home to many small businesses. In the late 19th century, the town became a popular tourist destination, and was home to several resorts.
In the early 20th century, the town began to experience a decline in population, as many of the businesses and resorts closed. In the late 20th century, the town began to experience a resurgence, as new businesses and industries moved into the area.
Economy
The economy of Columbus is largely based on tourism and agriculture. The town is home to several small businesses, including restaurants, retail stores, and service providers. The town is also home to several manufacturing companies, including a furniture factory and a textile mill.
The town is also home to several farms, which produce a variety of crops, including corn, soybeans, and hay. The town is also home to several wineries, which produce a variety of wines.
Demographics
As of the 2010 census, the population of Columbus was 1,500 people. The racial makeup of the town was 94.7% White, 2.7% African American, 0.7% Native American, 0.3% Asian, and 1.7% from other races. The median household income was $31,250, and the median family income was $37,500.
Conclusion
Columbus, North Carolina is a small town located in Polk County, North Carolina. It is situated in the foothills of the Blue Ridge Mountains, and is part of the Tryon-Columbus Metropolitan Statistical Area. The town has a population of approximately 1,500 people, and is the county seat of Polk County. The economy of Columbus is largely based on tourism and agriculture, and the town is home to several small businesses, manufacturing companies, farms, and wineries. The population of Columbus is predominantly White, with a small percentage of African American, Native American, and Asian residents.
Common Questions
What is Per Capita Income in Columbus?
Per Capita income in Columbus is $25,308.
What is the Median Family Income in Columbus?
Median Family Income in Columbus is $63,495.
What is the Median Household income in Columbus?
Median Household Income in Columbus is $53,333.
What is Income or Wage Gap in Columbus?
Income or Wage Gap in Columbus is 32.5%.
Women in Columbus earn 67.5 cents for every dollar earned by a man.
What is Inequality or Gini Index in Columbus?
Inequality or Gini Index in Columbus is 0.42.
What is the Total Population of Columbus?
Total Population of Columbus is 1,087.
What is the Total Male Population of Columbus?
Total Male Population of Columbus is 468.
What is the Total Female Population of Columbus?
Total Female Population of Columbus is 619.
What is the Ratio of Males per 100 Females in Columbus?
There are 75.61 Males per 100 Females in Columbus.
What is the Ratio of Females per 100 Males in Columbus?
There are 132.26 Females per 100 Males in Columbus.
What is the Median Population Age in Columbus?
Median Population Age in Columbus is 49.2 Years.
What is the Average Family Size in Columbus
Average Family Size in Columbus is 2.9 People.
What is the Average Household Size in Columbus
Average Household Size in Columbus is 2.1 People.
How Large is the Labor Force in Columbus?
There are 466 People in the Labor Forcein in Columbus.
What is the Percentage of People in the Labor Force in Columbus?
49.9% of People are in the Labor Force in Columbus.
What is the Unemployment Rate in Columbus?
Unemployment Rate in Columbus is 3.2%.