Hertford, NC Map & Demographics
Hertford Map
Hertford Overview
$27,163
PER CAPITA INCOME
$55,833
AVG FAMILY INCOME
$43,696
AVG HOUSEHOLD INCOME
33.3%
WAGE / INCOME GAP [ % ]
66.7¢/ $1
WAGE / INCOME GAP [ $ ]
0.43
INEQUALITY / GINI INDEX
2,045
TOTAL POPULATION
866
MALE POPULATION
1,179
FEMALE POPULATION
73.45
MALES / 100 FEMALES
136.14
FEMALES / 100 MALES
43.0
MEDIAN AGE
3.1
AVG FAMILY SIZE
2.4
AVG HOUSEHOLD SIZE
944
LABOR FORCE [ PEOPLE ]
57.2%
PERCENT IN LABOR FORCE
13.3%
UNEMPLOYMENT RATE
Hertford Zip Codes
Hertford Area Codes
Income in Hertford
Income Overview in Hertford
Per Capita Income in Hertford is $27,163, while median incomes of families and households are $55,833 and $43,696 respectively.
| Characteristic | Number | Measure |
| Per Capita Income | 2,045 | $27,163 |
| Median Family Income | 508 | $55,833 |
| Mean Family Income | 508 | $60,881 |
| Median Household Income | 834 | $43,696 |
| Mean Household Income | 834 | $55,959 |
| Income Deficit | 508 | $0 |
| Wage / Income Gap (%) | 2,045 | 33.33% |
| Wage / Income Gap ($) | 2,045 | 66.67¢ per $1 |
| Gini / Inequality Index | 2,045 | 0.43 |
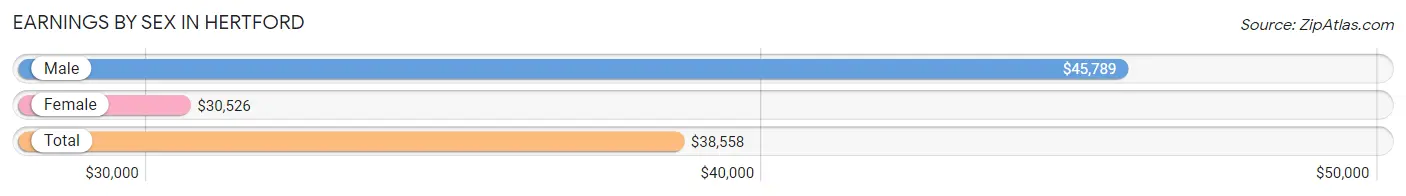
Earnings by Sex in Hertford
Average Earnings in Hertford are $38,558, $45,789 for men and $30,526 for women, a difference of 33.3%.
| Sex | Number | Average Earnings |
| Male | 499 (52.5%) | $45,789 |
| Female | 452 (47.5%) | $30,526 |
| Total | 951 (100.0%) | $38,558 |
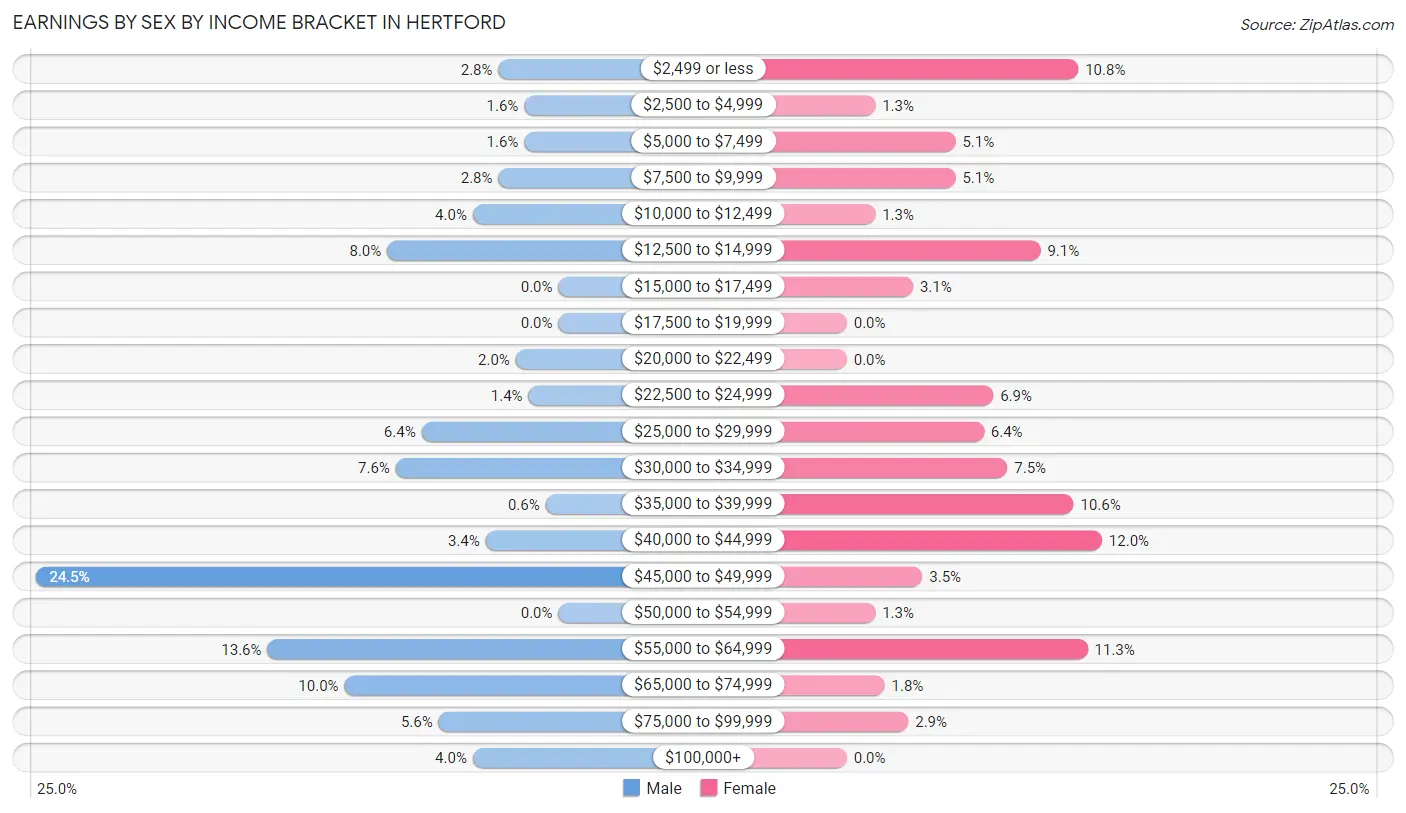
Earnings by Sex by Income Bracket in Hertford
The most common earnings brackets in Hertford are $45,000 to $49,999 for men (122 | 24.4%) and $40,000 to $44,999 for women (54 | 11.9%).
| Income | Male | Female |
| $2,499 or less | 14 (2.8%) | 49 (10.8%) |
| $2,500 to $4,999 | 8 (1.6%) | 6 (1.3%) |
| $5,000 to $7,499 | 8 (1.6%) | 23 (5.1%) |
| $7,500 to $9,999 | 14 (2.8%) | 23 (5.1%) |
| $10,000 to $12,499 | 20 (4.0%) | 6 (1.3%) |
| $12,500 to $14,999 | 40 (8.0%) | 41 (9.1%) |
| $15,000 to $17,499 | 0 (0.0%) | 14 (3.1%) |
| $17,500 to $19,999 | 0 (0.0%) | 0 (0.0%) |
| $20,000 to $22,499 | 10 (2.0%) | 0 (0.0%) |
| $22,500 to $24,999 | 7 (1.4%) | 31 (6.9%) |
| $25,000 to $29,999 | 32 (6.4%) | 29 (6.4%) |
| $30,000 to $34,999 | 38 (7.6%) | 34 (7.5%) |
| $35,000 to $39,999 | 3 (0.6%) | 48 (10.6%) |
| $40,000 to $44,999 | 17 (3.4%) | 54 (11.9%) |
| $45,000 to $49,999 | 122 (24.4%) | 16 (3.5%) |
| $50,000 to $54,999 | 0 (0.0%) | 6 (1.3%) |
| $55,000 to $64,999 | 68 (13.6%) | 51 (11.3%) |
| $65,000 to $74,999 | 50 (10.0%) | 8 (1.8%) |
| $75,000 to $99,999 | 28 (5.6%) | 13 (2.9%) |
| $100,000+ | 20 (4.0%) | 0 (0.0%) |
| Total | 499 (100.0%) | 452 (100.0%) |
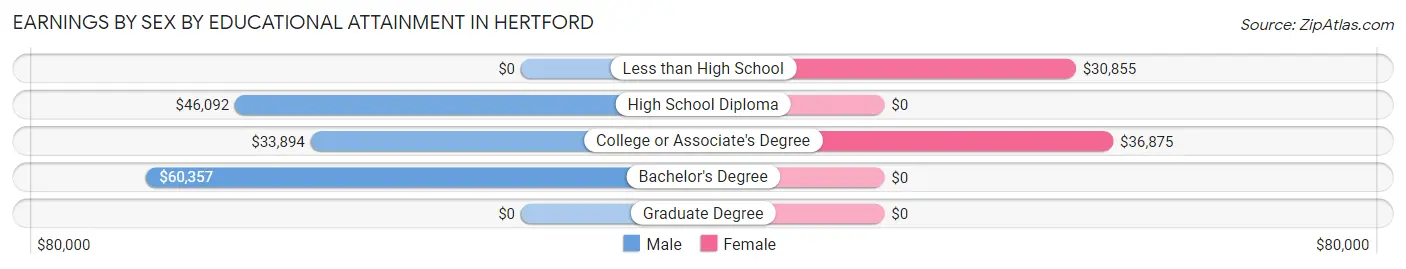
Earnings by Sex by Educational Attainment in Hertford
Average earnings in Hertford are $46,250 for men and $34,250 for women, a difference of 26.0%. Men with an educational attainment of bachelor's degree enjoy the highest average annual earnings of $60,357, while those with college or associate's degree education earn the least with $33,894. Women with an educational attainment of college or associate's degree earn the most with the average annual earnings of $36,875, while those with less than high school education have the smallest earnings of $30,855.
| Educational Attainment | Male Income | Female Income |
| Less than High School | - | - |
| High School Diploma | $46,092 | $0 |
| College or Associate's Degree | $33,894 | $36,875 |
| Bachelor's Degree | $60,357 | $0 |
| Graduate Degree | - | - |
| Total | $46,250 | $34,250 |
Family Income in Hertford
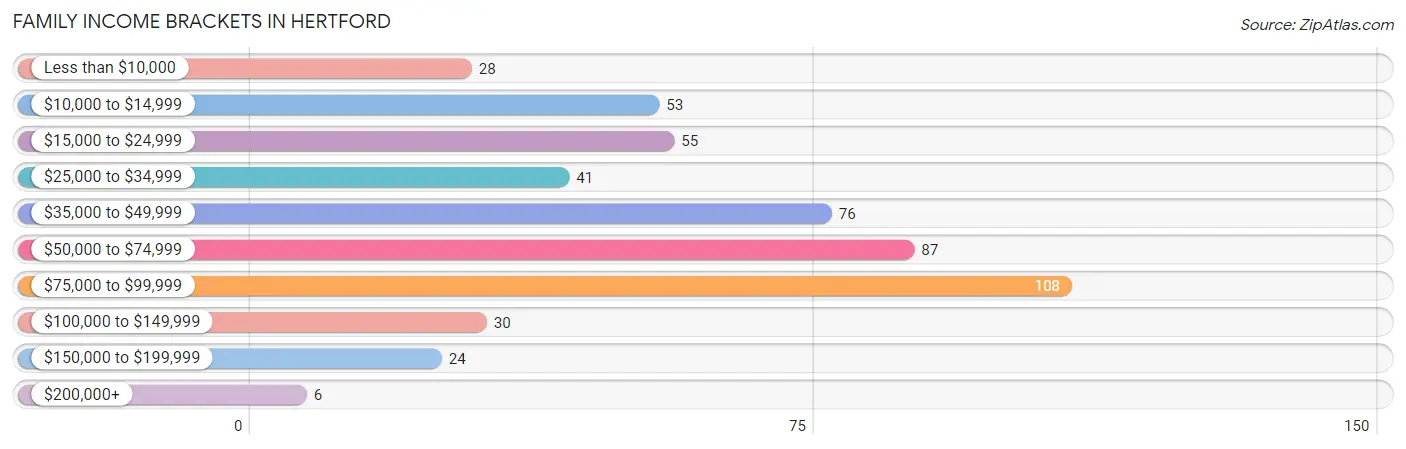
Family Income Brackets in Hertford
According to the Hertford family income data, there are 108 families falling into the $75,000 to $99,999 income range, which is the most common income bracket and makes up 21.3% of all families. Conversely, the $200,000+ income bracket is the least frequent group with only 6 families (1.2%) belonging to this category.
| Income Bracket | # Families | % Families |
| Less than $10,000 | 28 | 5.5% |
| $10,000 to $14,999 | 53 | 10.4% |
| $15,000 to $24,999 | 55 | 10.8% |
| $25,000 to $34,999 | 41 | 8.1% |
| $35,000 to $49,999 | 76 | 15.0% |
| $50,000 to $74,999 | 87 | 17.1% |
| $75,000 to $99,999 | 108 | 21.3% |
| $100,000 to $149,999 | 30 | 5.9% |
| $150,000 to $199,999 | 24 | 4.7% |
| $200,000+ | 6 | 1.2% |
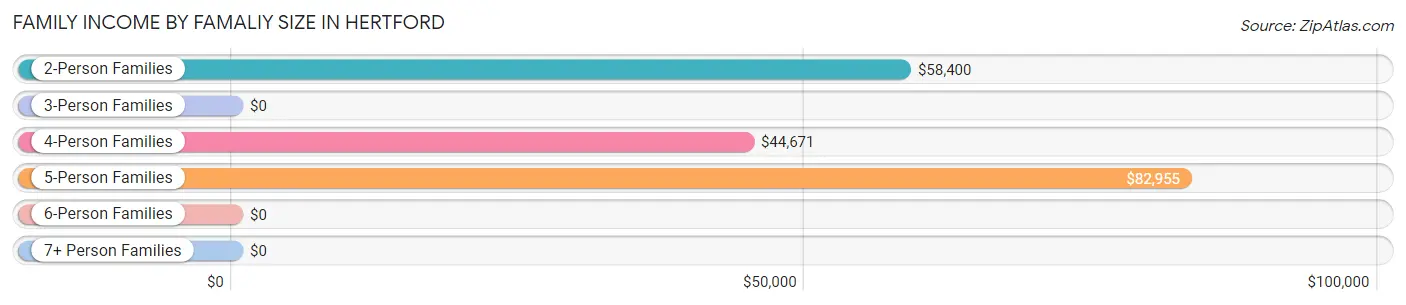
Family Income by Famaliy Size in Hertford
5-person families (38 | 7.5%) account for the highest median family income in Hertford with $82,955 per family, while 2-person families (254 | 50.0%) have the highest median income of $29,200 per family member.
| Income Bracket | # Families | Median Income |
| 2-Person Families | 254 (50.0%) | $58,400 |
| 3-Person Families | 131 (25.8%) | $0 |
| 4-Person Families | 66 (13.0%) | $44,671 |
| 5-Person Families | 38 (7.5%) | $82,955 |
| 6-Person Families | 19 (3.7%) | $0 |
| 7+ Person Families | 0 (0.0%) | $0 |
| Total | 508 (100.0%) | $55,833 |
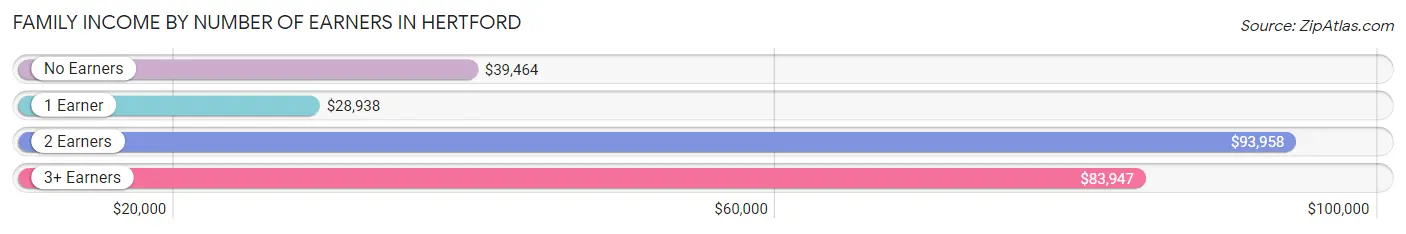
Family Income by Number of Earners in Hertford
The median family income in Hertford is $55,833, with families comprising 2 earners (105) having the highest median family income of $93,958, while families with 1 earner (269) have the lowest median family income of $28,938, accounting for 20.7% and 52.9% of families, respectively.
| Number of Earners | # Families | Median Income |
| No Earners | 78 (15.3%) | $39,464 |
| 1 Earner | 269 (52.9%) | $28,938 |
| 2 Earners | 105 (20.7%) | $93,958 |
| 3+ Earners | 56 (11.0%) | $83,947 |
| Total | 508 (100.0%) | $55,833 |
Household Income in Hertford
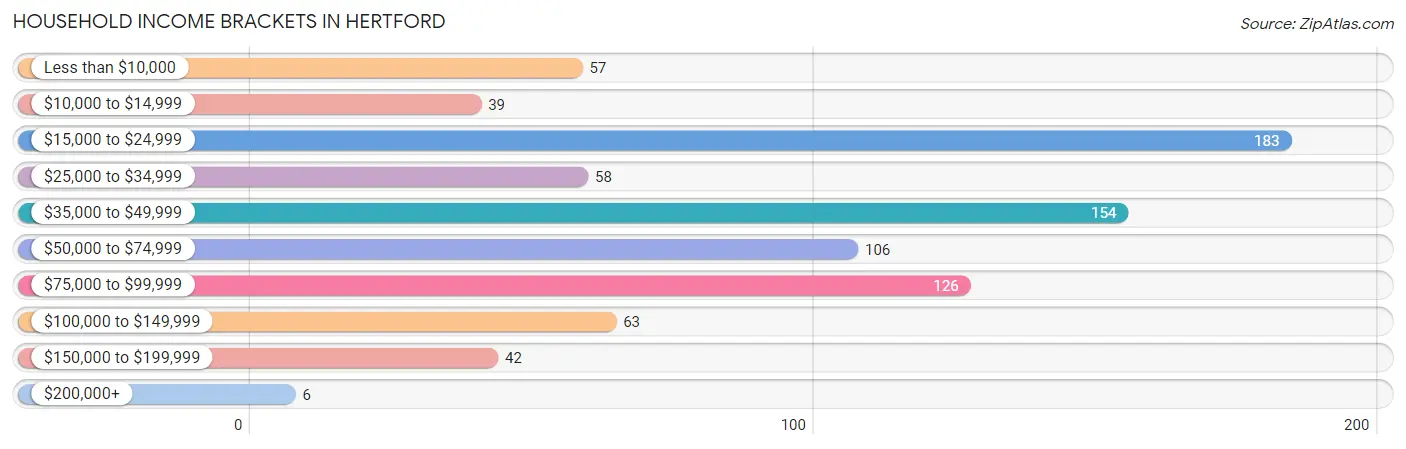
Household Income Brackets in Hertford
With 183 households falling in the category, the $15,000 to $24,999 income range is the most frequent in Hertford, accounting for 21.9% of all households. In contrast, only 6 households (0.7%) fall into the $200,000+ income bracket, making it the least populous group.
| Income Bracket | # Households | % Households |
| Less than $10,000 | 57 | 6.8% |
| $10,000 to $14,999 | 39 | 4.7% |
| $15,000 to $24,999 | 183 | 21.9% |
| $25,000 to $34,999 | 58 | 7.0% |
| $35,000 to $49,999 | 154 | 18.5% |
| $50,000 to $74,999 | 106 | 12.7% |
| $75,000 to $99,999 | 126 | 15.1% |
| $100,000 to $149,999 | 63 | 7.6% |
| $150,000 to $199,999 | 42 | 5.0% |
| $200,000+ | 6 | 0.7% |
Household Income by Householder Age in Hertford
The median household income in Hertford is $43,696, with the highest median household income of $54,821 found in the 45 to 64 years age bracket for the primary householder. A total of 219 households (26.3%) fall into this category. Meanwhile, the 15 to 24 years age bracket for the primary householder has the lowest median household income of $0, with 5 households (0.6%) in this group.
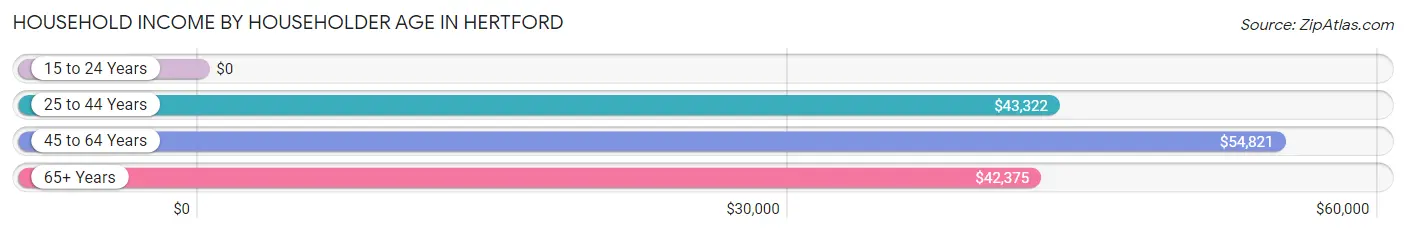
| Income Bracket | # Households | Median Income |
| 15 to 24 Years | 5 (0.6%) | $0 |
| 25 to 44 Years | 295 (35.4%) | $43,322 |
| 45 to 64 Years | 219 (26.3%) | $54,821 |
| 65+ Years | 315 (37.8%) | $42,375 |
| Total | 834 (100.0%) | $43,696 |
Poverty in Hertford
Income Below Poverty by Sex and Age in Hertford
With 12.9% poverty level for males and 28.0% for females among the residents of Hertford, 16 and 17 year old males and 12 to 14 year old females are the most vulnerable to poverty, with 3 males (100.0%) and 25 females (100.0%) in their respective age groups living below the poverty level.
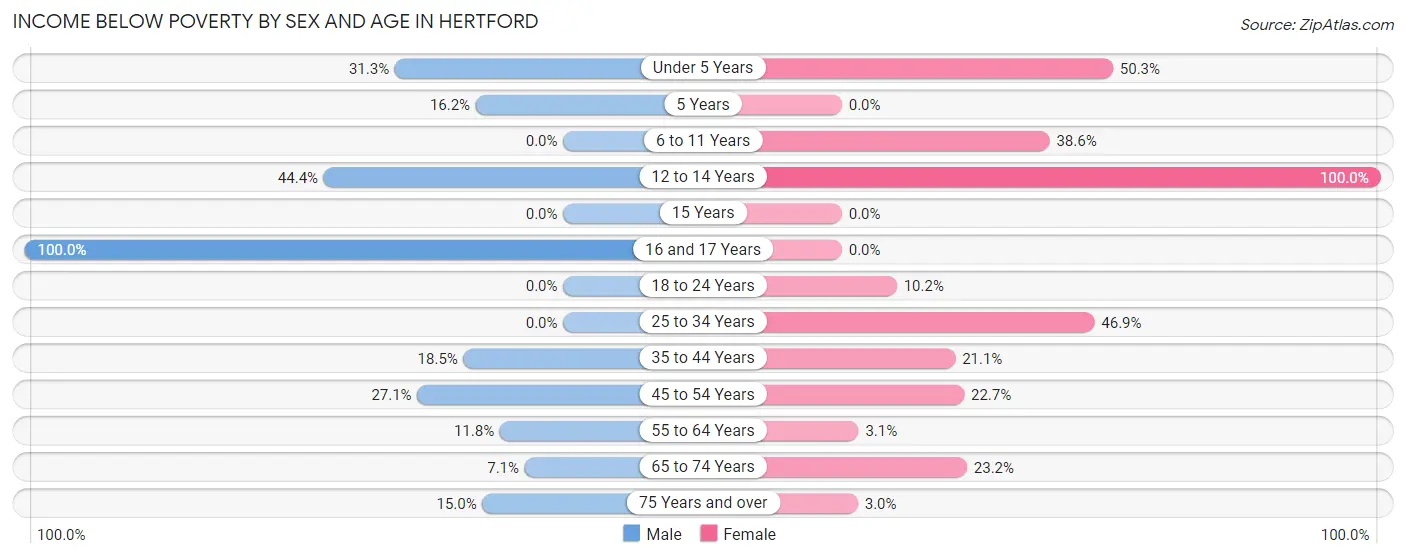
| Age Bracket | Male | Female |
| Under 5 Years | 5 (31.2%) | 82 (50.3%) |
| 5 Years | 6 (16.2%) | 0 (0.0%) |
| 6 to 11 Years | 0 (0.0%) | 32 (38.6%) |
| 12 to 14 Years | 4 (44.4%) | 25 (100.0%) |
| 15 Years | 0 (0.0%) | 0 (0.0%) |
| 16 and 17 Years | 3 (100.0%) | 0 (0.0%) |
| 18 to 24 Years | 0 (0.0%) | 5 (10.2%) |
| 25 to 34 Years | 0 (0.0%) | 90 (46.9%) |
| 35 to 44 Years | 47 (18.5%) | 20 (21.0%) |
| 45 to 54 Years | 13 (27.1%) | 27 (22.7%) |
| 55 to 64 Years | 16 (11.8%) | 4 (3.1%) |
| 65 to 74 Years | 4 (7.1%) | 39 (23.2%) |
| 75 Years and over | 12 (15.0%) | 3 (3.0%) |
| Total | 110 (12.9%) | 327 (28.0%) |
Income Above Poverty by Sex and Age in Hertford
According to the poverty statistics in Hertford, males aged 6 to 11 years and females aged 16 and 17 years are the age groups that are most secure financially, with 100.0% of males and 100.0% of females in these age groups living above the poverty line.
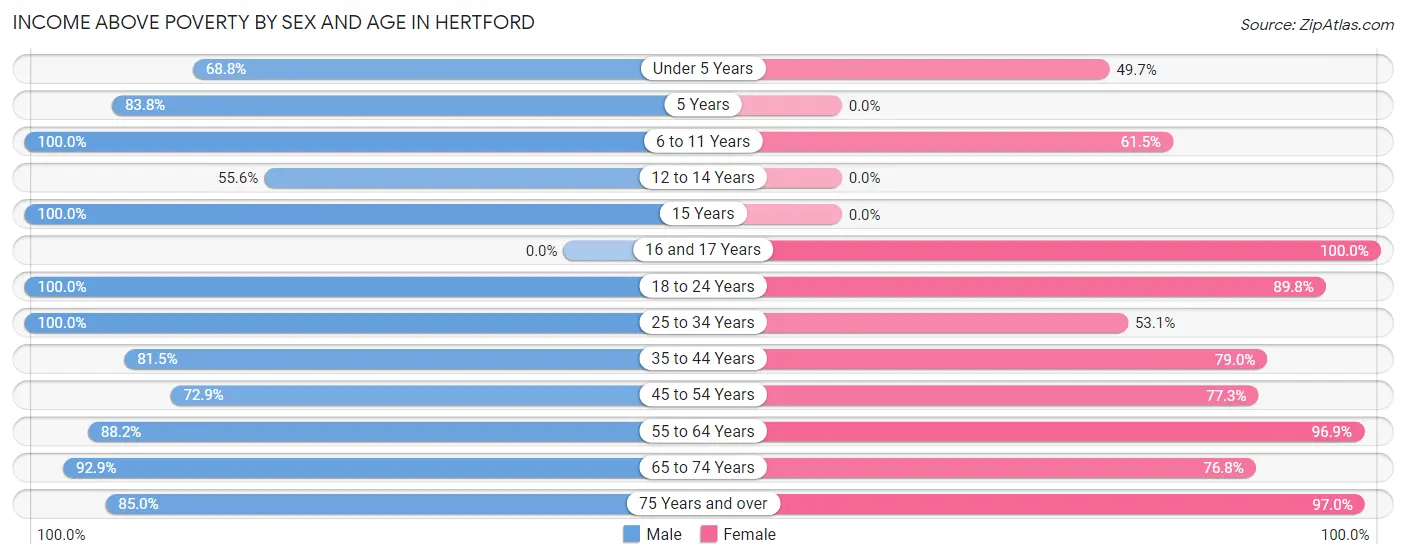
| Age Bracket | Male | Female |
| Under 5 Years | 11 (68.8%) | 81 (49.7%) |
| 5 Years | 31 (83.8%) | 0 (0.0%) |
| 6 to 11 Years | 37 (100.0%) | 51 (61.5%) |
| 12 to 14 Years | 5 (55.6%) | 0 (0.0%) |
| 15 Years | 25 (100.0%) | 0 (0.0%) |
| 16 and 17 Years | 0 (0.0%) | 42 (100.0%) |
| 18 to 24 Years | 78 (100.0%) | 44 (89.8%) |
| 25 to 34 Years | 73 (100.0%) | 102 (53.1%) |
| 35 to 44 Years | 207 (81.5%) | 75 (78.9%) |
| 45 to 54 Years | 35 (72.9%) | 92 (77.3%) |
| 55 to 64 Years | 120 (88.2%) | 125 (96.9%) |
| 65 to 74 Years | 52 (92.9%) | 129 (76.8%) |
| 75 Years and over | 68 (85.0%) | 98 (97.0%) |
| Total | 742 (87.1%) | 839 (72.0%) |
Income Below Poverty Among Married-Couple Families in Hertford
The poverty statistics for married-couple families in Hertford show that 4.8% or 12 of the total 249 families live below the poverty line. Families with no children have the highest poverty rate of 5.6%, comprising of 8 families. On the other hand, families with 1 or 2 children have the lowest poverty rate of 3.8%, which includes 4 families.
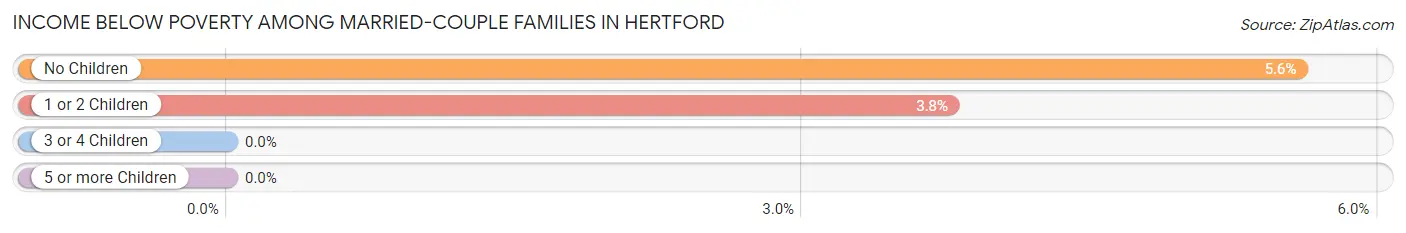
| Children | Above Poverty | Below Poverty |
| No Children | 135 (94.4%) | 8 (5.6%) |
| 1 or 2 Children | 102 (96.2%) | 4 (3.8%) |
| 3 or 4 Children | 0 (0.0%) | 0 (0.0%) |
| 5 or more Children | 0 (0.0%) | 0 (0.0%) |
| Total | 237 (95.2%) | 12 (4.8%) |
Income Below Poverty Among Single-Parent Households in Hertford
According to the poverty data in Hertford, 63.5% or 40 single-father households and 37.8% or 74 single-mother households are living below the poverty line. Among single-father households, those with 1 or 2 children have the highest poverty rate, with 40 households (100.0%) experiencing poverty. Likewise, among single-mother households, those with 1 or 2 children have the highest poverty rate, with 61 households (51.3%) falling below the poverty line.
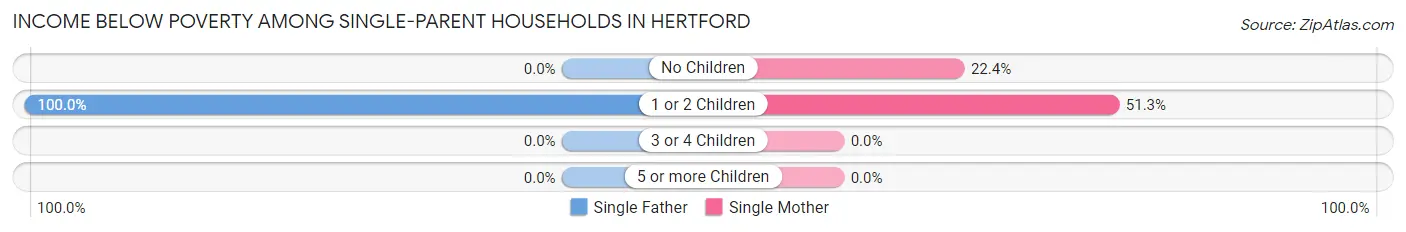
| Children | Single Father | Single Mother |
| No Children | 0 (0.0%) | 13 (22.4%) |
| 1 or 2 Children | 40 (100.0%) | 61 (51.3%) |
| 3 or 4 Children | 0 (0.0%) | 0 (0.0%) |
| 5 or more Children | 0 (0.0%) | 0 (0.0%) |
| Total | 40 (63.5%) | 74 (37.8%) |
Income Below Poverty Among Married-Couple vs Single-Parent Households in Hertford
The poverty data for Hertford shows that 12 of the married-couple family households (4.8%) and 114 of the single-parent households (44.0%) are living below the poverty level. Within the married-couple family households, those with no children have the highest poverty rate, with 8 households (5.6%) falling below the poverty line. Among the single-parent households, those with 1 or 2 children have the highest poverty rate, with 101 household (63.5%) living below poverty.
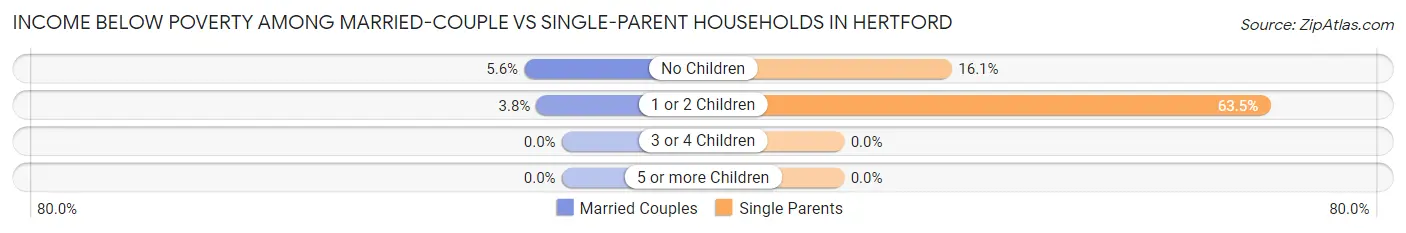
| Children | Married-Couple Families | Single-Parent Households |
| No Children | 8 (5.6%) | 13 (16.1%) |
| 1 or 2 Children | 4 (3.8%) | 101 (63.5%) |
| 3 or 4 Children | 0 (0.0%) | 0 (0.0%) |
| 5 or more Children | 0 (0.0%) | 0 (0.0%) |
| Total | 12 (4.8%) | 114 (44.0%) |
Race in Hertford
The most populous races in Hertford are Black / African American (1,000 | 48.9%), White / Caucasian (959 | 46.9%), and Hispanic or Latino (64 | 3.1%).
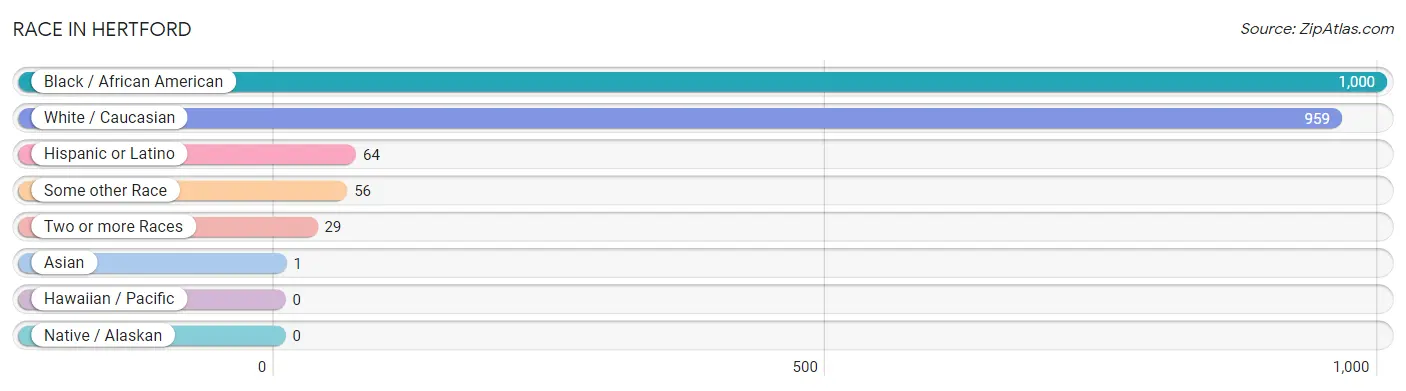
| Race | # Population | % Population |
| Asian | 1 | 0.1% |
| Black / African American | 1,000 | 48.9% |
| Hawaiian / Pacific | 0 | 0.0% |
| Hispanic or Latino | 64 | 3.1% |
| Native / Alaskan | 0 | 0.0% |
| White / Caucasian | 959 | 46.9% |
| Two or more Races | 29 | 1.4% |
| Some other Race | 56 | 2.7% |
| Total | 2,045 | 100.0% |
Ancestry in Hertford
The most populous ancestries reported in Hertford are English (233 | 11.4%), Irish (159 | 7.8%), Italian (102 | 5.0%), German (101 | 4.9%), and American (71 | 3.5%), together accounting for 32.6% of all Hertford residents.
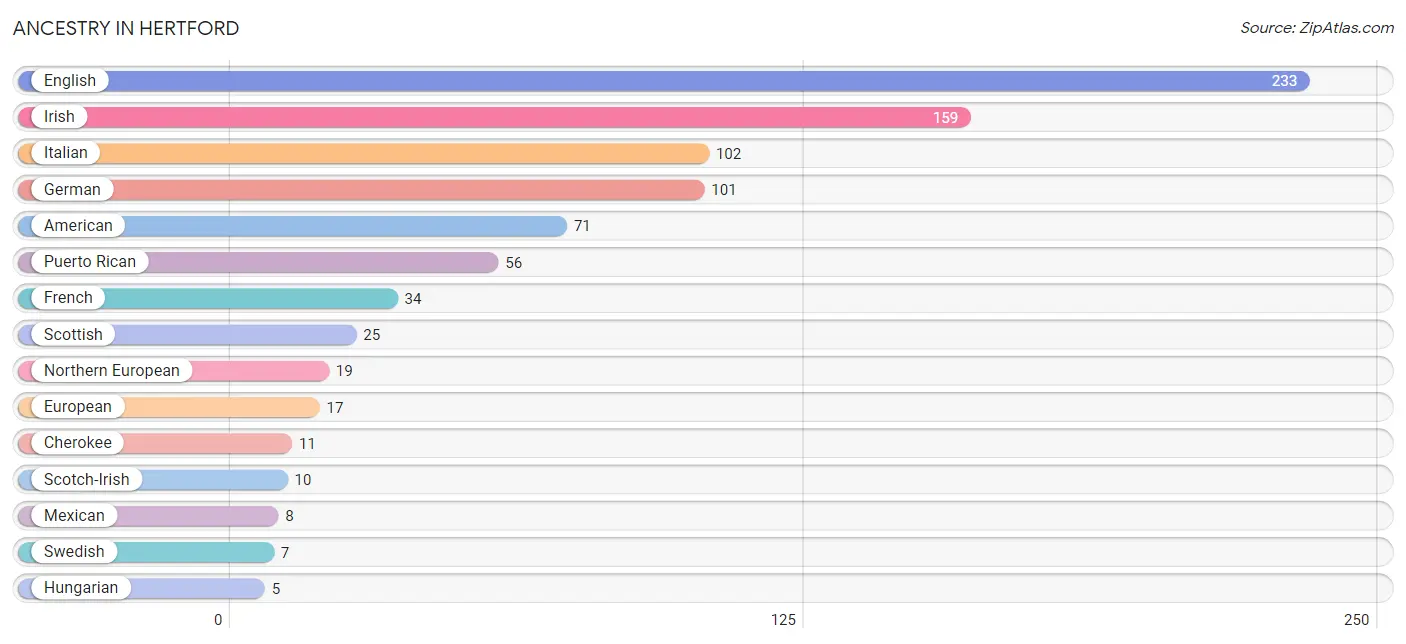
| Ancestry | # Population | % Population |
| African | 3 | 0.2% |
| American | 71 | 3.5% |
| Cherokee | 11 | 0.5% |
| English | 233 | 11.4% |
| European | 17 | 0.8% |
| Finnish | 3 | 0.2% |
| French | 34 | 1.7% |
| German | 101 | 4.9% |
| Hungarian | 5 | 0.2% |
| Irish | 159 | 7.8% |
| Italian | 102 | 5.0% |
| Mexican | 8 | 0.4% |
| Northern European | 19 | 0.9% |
| Norwegian | 5 | 0.2% |
| Puerto Rican | 56 | 2.7% |
| Scotch-Irish | 10 | 0.5% |
| Scottish | 25 | 1.2% |
| Slovak | 3 | 0.2% |
| Sri Lankan | 1 | 0.1% |
| Subsaharan African | 3 | 0.2% |
| Swedish | 7 | 0.3% |
| Welsh | 5 | 0.2% | View All 22 Rows |
Immigrants in Hertford
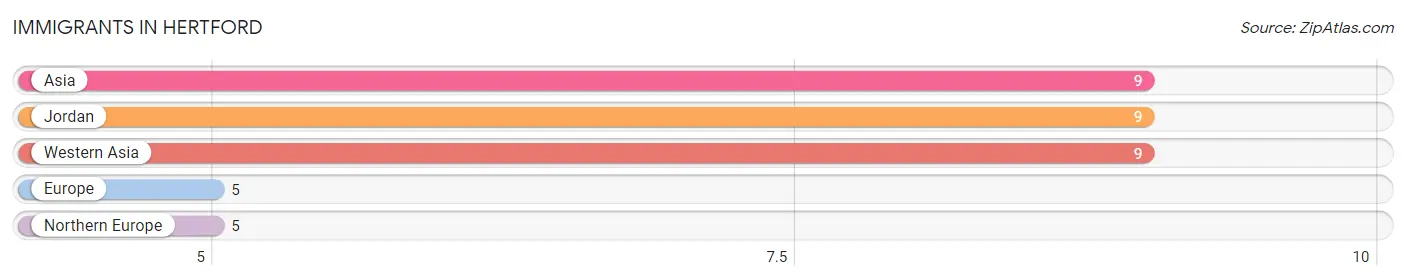
The most numerous immigrant groups reported in Hertford came from Asia (9 | 0.4%), Jordan (9 | 0.4%), Western Asia (9 | 0.4%), Europe (5 | 0.2%), and Northern Europe (5 | 0.2%), together accounting for 1.8% of all Hertford residents.
| Immigration Origin | # Population | % Population |
| Asia | 9 | 0.4% |
| Europe | 5 | 0.2% |
| Jordan | 9 | 0.4% |
| Northern Europe | 5 | 0.2% |
| Western Asia | 9 | 0.4% | View All 5 Rows |
Sex and Age in Hertford
Sex and Age in Hertford
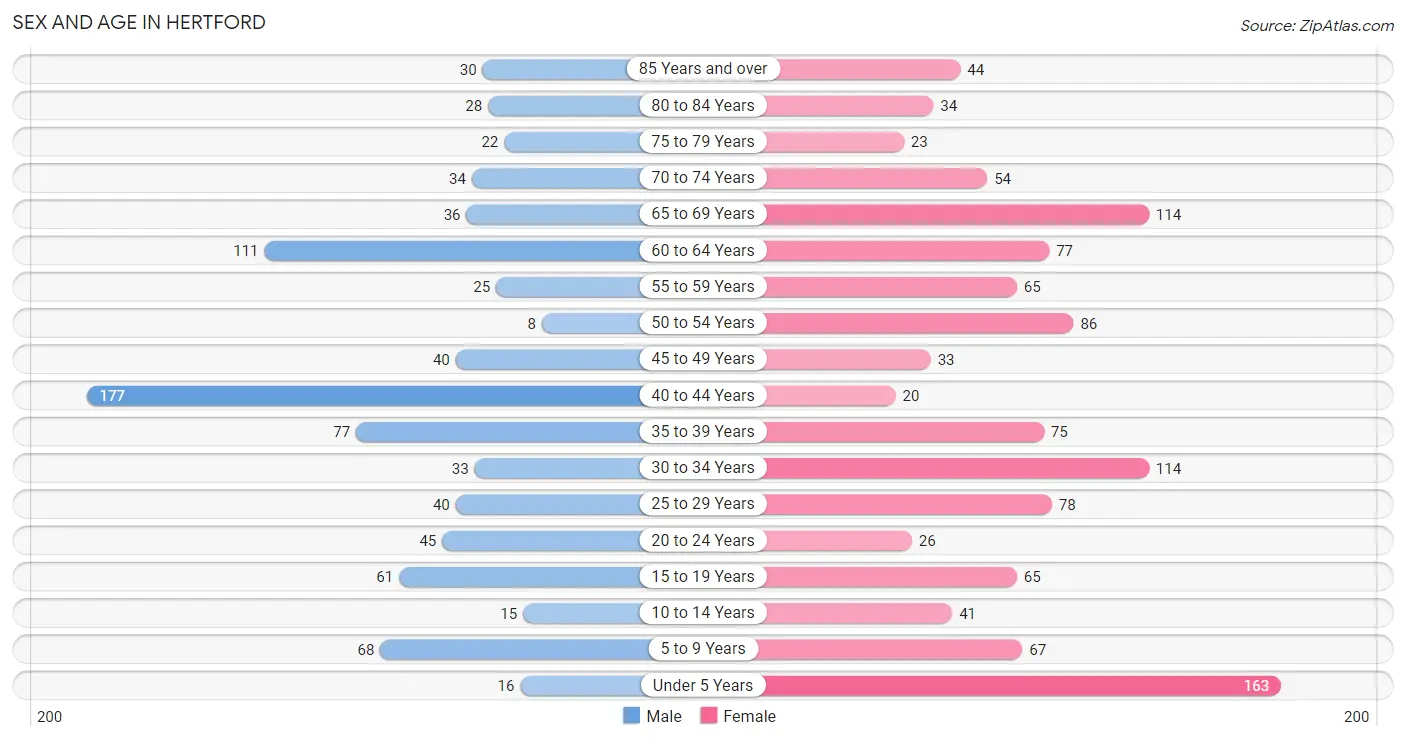
The most populous age groups in Hertford are 40 to 44 Years (177 | 20.4%) for men and Under 5 Years (163 | 13.8%) for women.
| Age Bracket | Male | Female |
| Under 5 Years | 16 (1.8%) | 163 (13.8%) |
| 5 to 9 Years | 68 (7.9%) | 67 (5.7%) |
| 10 to 14 Years | 15 (1.7%) | 41 (3.5%) |
| 15 to 19 Years | 61 (7.0%) | 65 (5.5%) |
| 20 to 24 Years | 45 (5.2%) | 26 (2.2%) |
| 25 to 29 Years | 40 (4.6%) | 78 (6.6%) |
| 30 to 34 Years | 33 (3.8%) | 114 (9.7%) |
| 35 to 39 Years | 77 (8.9%) | 75 (6.4%) |
| 40 to 44 Years | 177 (20.4%) | 20 (1.7%) |
| 45 to 49 Years | 40 (4.6%) | 33 (2.8%) |
| 50 to 54 Years | 8 (0.9%) | 86 (7.3%) |
| 55 to 59 Years | 25 (2.9%) | 65 (5.5%) |
| 60 to 64 Years | 111 (12.8%) | 77 (6.5%) |
| 65 to 69 Years | 36 (4.2%) | 114 (9.7%) |
| 70 to 74 Years | 34 (3.9%) | 54 (4.6%) |
| 75 to 79 Years | 22 (2.5%) | 23 (1.9%) |
| 80 to 84 Years | 28 (3.2%) | 34 (2.9%) |
| 85 Years and over | 30 (3.5%) | 44 (3.7%) |
| Total | 866 (100.0%) | 1,179 (100.0%) |
Families and Households in Hertford
Median Family Size in Hertford
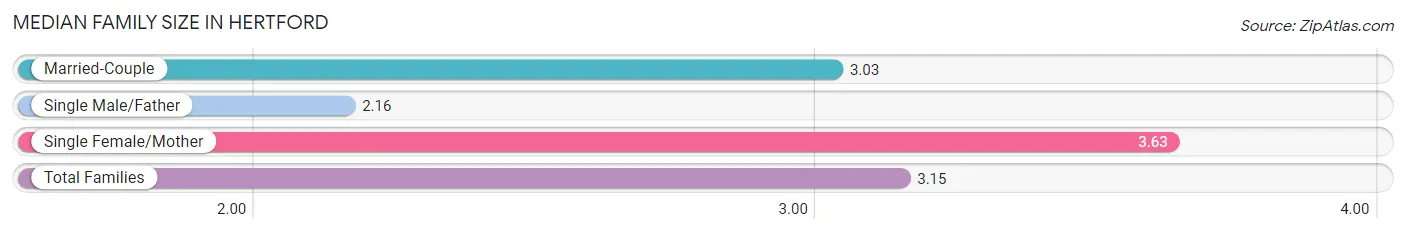
The median family size in Hertford is 3.15 persons per family, with single female/mother families (196 | 38.6%) accounting for the largest median family size of 3.63 persons per family. On the other hand, single male/father families (63 | 12.4%) represent the smallest median family size with 2.16 persons per family.
| Family Type | # Families | Family Size |
| Married-Couple | 249 (49.0%) | 3.03 |
| Single Male/Father | 63 (12.4%) | 2.16 |
| Single Female/Mother | 196 (38.6%) | 3.63 |
| Total Families | 508 (100.0%) | 3.15 |
Median Household Size in Hertford
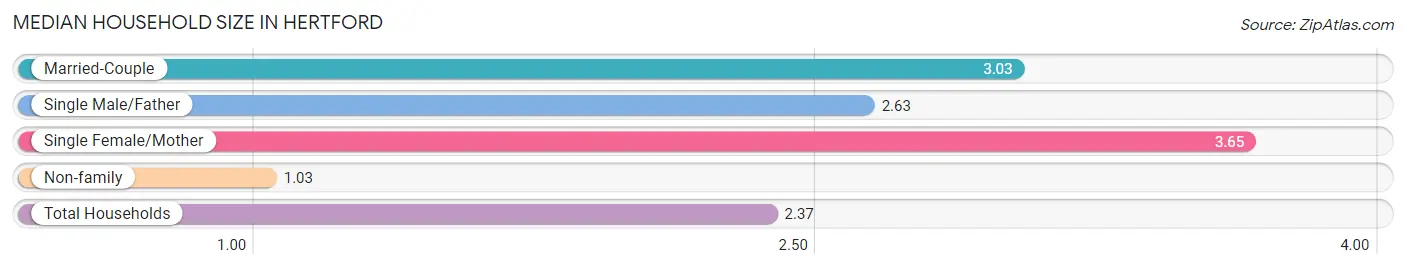
The median household size in Hertford is 2.37 persons per household, with single female/mother households (196 | 23.5%) accounting for the largest median household size of 3.65 persons per household. non-family households (326 | 39.1%) represent the smallest median household size with 1.03 persons per household.
| Household Type | # Households | Household Size |
| Married-Couple | 249 (29.9%) | 3.03 |
| Single Male/Father | 63 (7.5%) | 2.63 |
| Single Female/Mother | 196 (23.5%) | 3.65 |
| Non-family | 326 (39.1%) | 1.03 |
| Total Households | 834 (100.0%) | 2.37 |
Household Size by Marriage Status in Hertford
Out of a total of 834 households in Hertford, 508 (60.9%) are family households, while 326 (39.1%) are nonfamily households. The most numerous type of family households are 2-person households, comprising 246, and the most common type of nonfamily households are 1-person households, comprising 317.
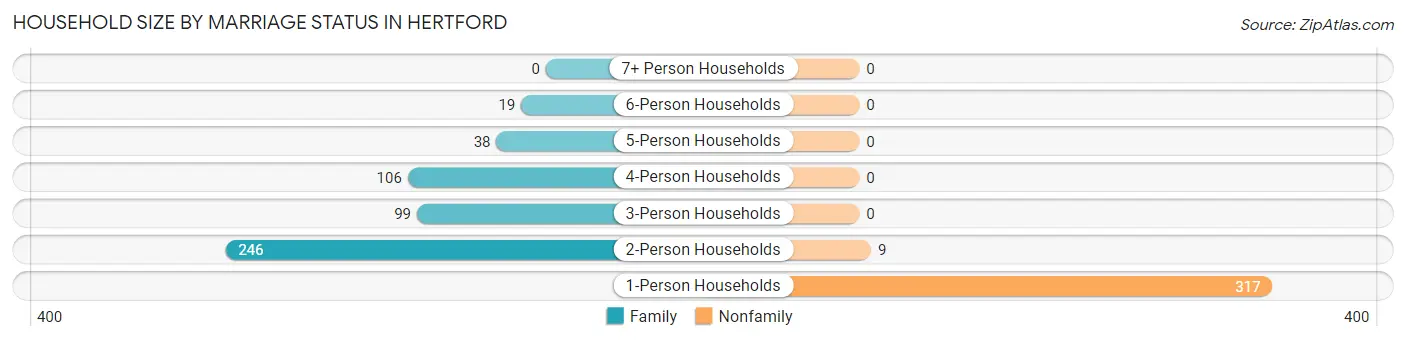
| Household Size | Family Households | Nonfamily Households |
| 1-Person Households | - | 317 (38.0%) |
| 2-Person Households | 246 (29.5%) | 9 (1.1%) |
| 3-Person Households | 99 (11.9%) | 0 (0.0%) |
| 4-Person Households | 106 (12.7%) | 0 (0.0%) |
| 5-Person Households | 38 (4.6%) | 0 (0.0%) |
| 6-Person Households | 19 (2.3%) | 0 (0.0%) |
| 7+ Person Households | 0 (0.0%) | 0 (0.0%) |
| Total | 508 (60.9%) | 326 (39.1%) |
Female Fertility in Hertford
Fertility by Age in Hertford
Average fertility rate in Hertford is 14.0 births per 1,000 women. Women in the age bracket of 20 to 34 years have the highest fertility rate with 28.0 births per 1,000 women. Women in the age bracket of 20 to 34 years acount for 100.0% of all women with births.
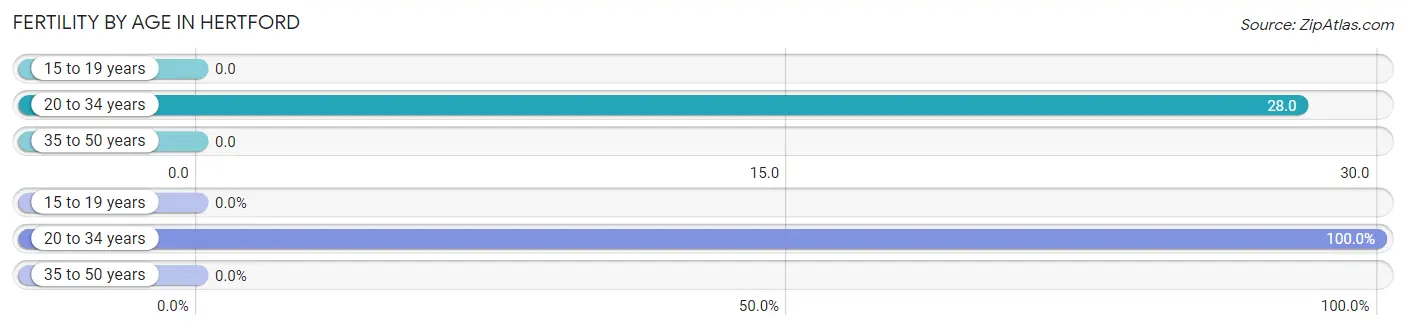
| Age Bracket | Women with Births | Births / 1,000 Women |
| 15 to 19 years | 0 (0.0%) | 0.0 |
| 20 to 34 years | 6 (100.0%) | 28.0 |
| 35 to 50 years | 0 (0.0%) | 0.0 |
| Total | 6 (100.0%) | 14.0 |
Fertility by Age by Marriage Status in Hertford
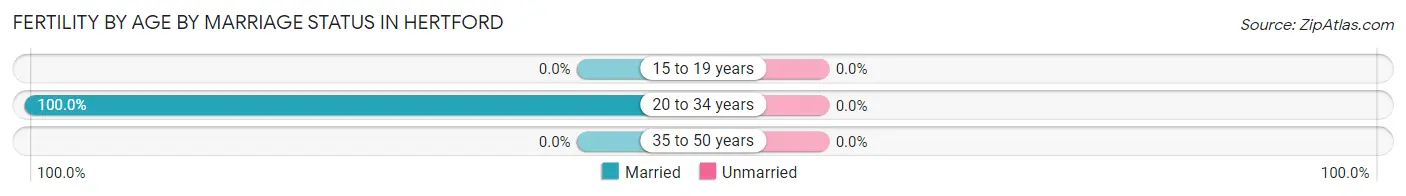
| Age Bracket | Married | Unmarried |
| 15 to 19 years | 0 (0.0%) | 0 (0.0%) |
| 20 to 34 years | 6 (100.0%) | 0 (0.0%) |
| 35 to 50 years | 0 (0.0%) | 0 (0.0%) |
| Total | 6 (100.0%) | 0 (0.0%) |
Fertility by Education in Hertford
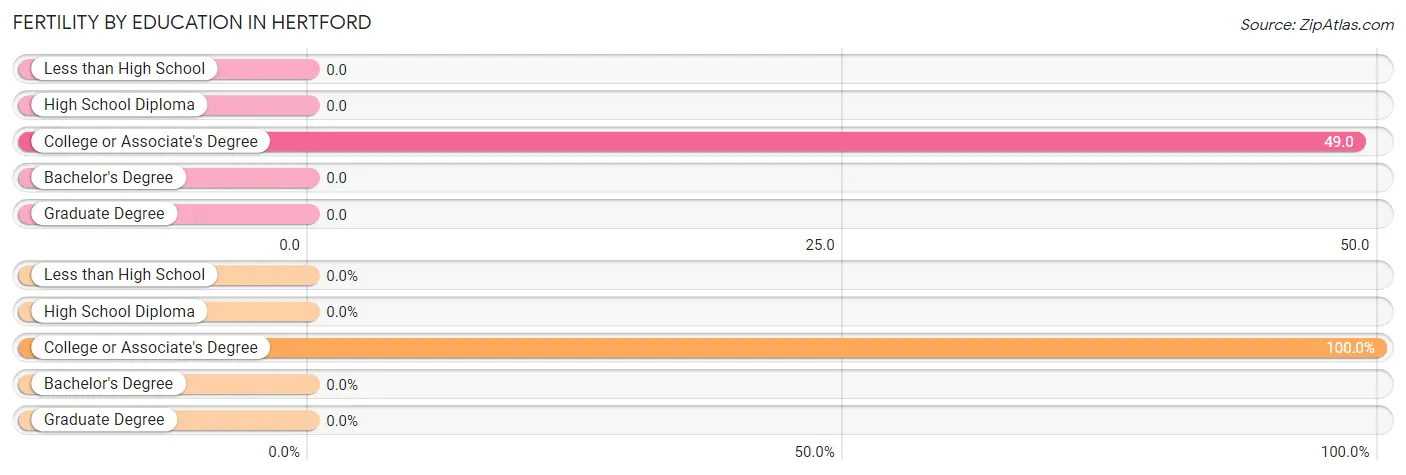
| Educational Attainment | Women with Births | Births / 1,000 Women |
| Less than High School | 0 (0.0%) | 0.0 |
| High School Diploma | 0 (0.0%) | 0.0 |
| College or Associate's Degree | 6 (100.0%) | 49.0 |
| Bachelor's Degree | 0 (0.0%) | 0.0 |
| Graduate Degree | 0 (0.0%) | 0.0 |
| Total | 6 (100.0%) | 14.0 |
Fertility by Education by Marriage Status in Hertford
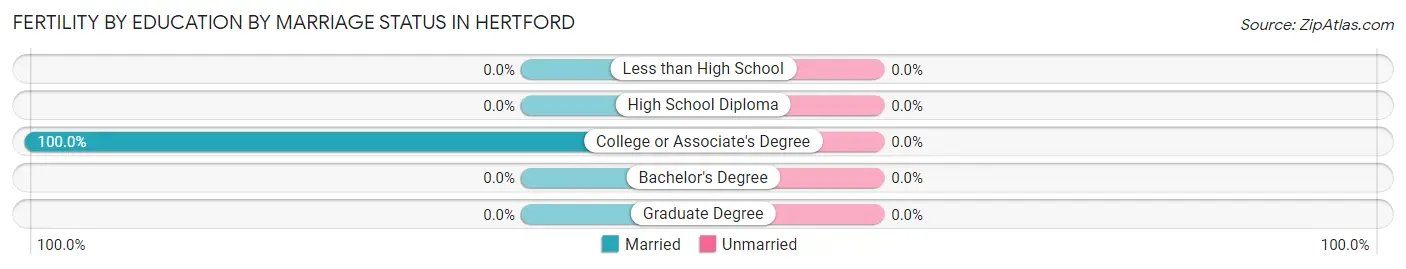
| Educational Attainment | Married | Unmarried |
| Less than High School | 0 (0.0%) | 0 (0.0%) |
| High School Diploma | 0 (0.0%) | 0 (0.0%) |
| College or Associate's Degree | 6 (100.0%) | 0 (0.0%) |
| Bachelor's Degree | 0 (0.0%) | 0 (0.0%) |
| Graduate Degree | 0 (0.0%) | 0 (0.0%) |
| Total | 6 (100.0%) | 0 (0.0%) |
Employment Characteristics in Hertford
Employment by Class of Employer in Hertford
Among the 819 employed individuals in Hertford, private company employees (391 | 47.7%), self-employed (incorporated) (162 | 19.8%), and state government employees (73 | 8.9%) make up the most common classes of employment.
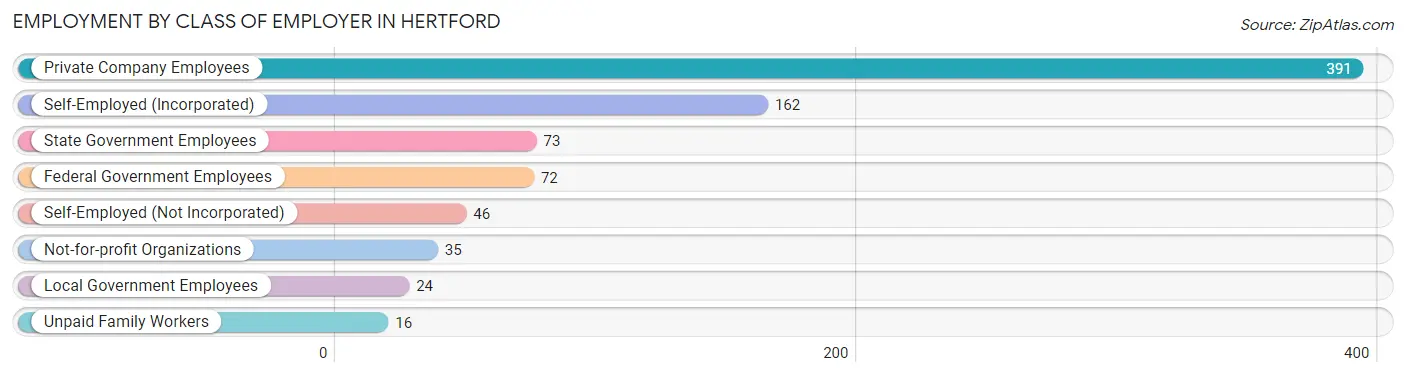
| Employer Class | # Employees | % Employees |
| Private Company Employees | 391 | 47.7% |
| Self-Employed (Incorporated) | 162 | 19.8% |
| Self-Employed (Not Incorporated) | 46 | 5.6% |
| Not-for-profit Organizations | 35 | 4.3% |
| Local Government Employees | 24 | 2.9% |
| State Government Employees | 73 | 8.9% |
| Federal Government Employees | 72 | 8.8% |
| Unpaid Family Workers | 16 | 1.9% |
| Total | 819 | 100.0% |
Employment Status by Age in Hertford
According to the labor force statistics for Hertford, out of the total population over 16 years of age (1,650), 57.2% or 944 individuals are in the labor force, with 13.3% or 126 of them unemployed. The age group with the highest labor force participation rate is 25 to 29 years, with 100.0% or 118 individuals in the labor force. Within the labor force, the 16 to 19 years age range has the highest percentage of unemployed individuals, with 50.0% or 33 of them being unemployed.
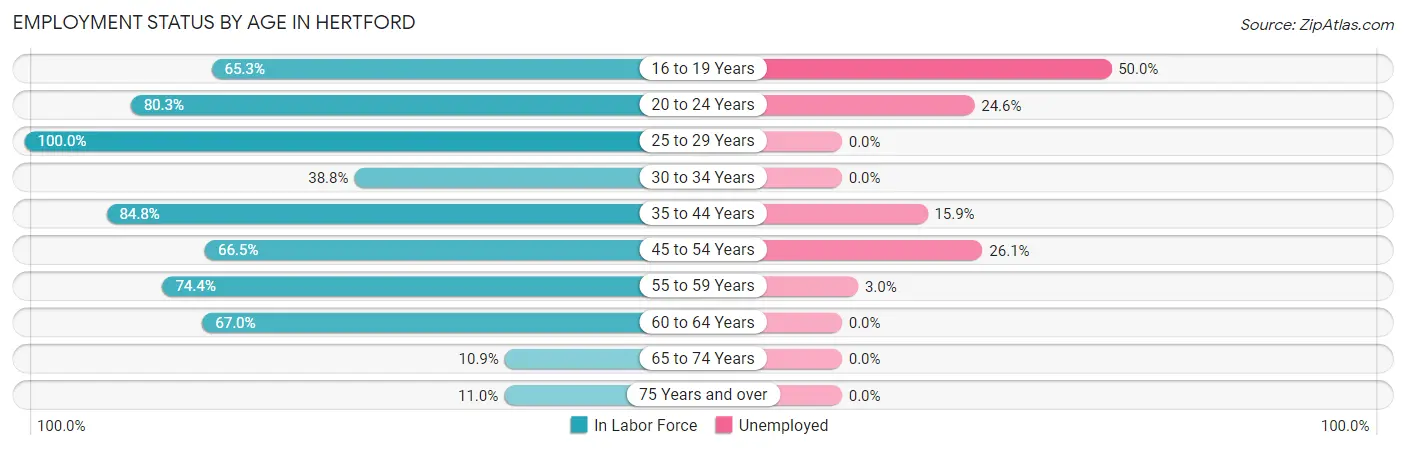
| Age Bracket | In Labor Force | Unemployed |
| 16 to 19 Years | 66 (65.3%) | 33 (50.0%) |
| 20 to 24 Years | 57 (80.3%) | 14 (24.6%) |
| 25 to 29 Years | 118 (100.0%) | 0 (0.0%) |
| 30 to 34 Years | 57 (38.8%) | 0 (0.0%) |
| 35 to 44 Years | 296 (84.8%) | 47 (15.9%) |
| 45 to 54 Years | 111 (66.5%) | 29 (26.1%) |
| 55 to 59 Years | 67 (74.4%) | 2 (3.0%) |
| 60 to 64 Years | 126 (67.0%) | 0 (0.0%) |
| 65 to 74 Years | 26 (10.9%) | 0 (0.0%) |
| 75 Years and over | 20 (11.0%) | 0 (0.0%) |
| Total | 944 (57.2%) | 126 (13.3%) |
Employment Status by Educational Attainment in Hertford
According to labor force statistics for Hertford, 73.2% of individuals (775) out of the total population between 25 and 64 years of age (1,059) are in the labor force, with 10.1% or 78 of them being unemployed. The group with the highest labor force participation rate are those with the educational attainment of bachelor's degree or higher, with 94.4% or 102 individuals in the labor force. Within the labor force, individuals with college / associate degree education have the highest percentage of unemployment, with 17.2% or 48 of them being unemployed.
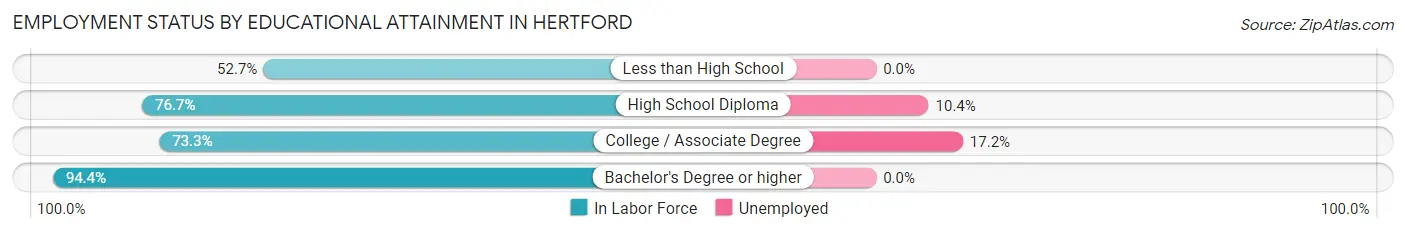
| Educational Attainment | In Labor Force | Unemployed |
| Less than High School | 96 (52.7%) | 0 (0.0%) |
| High School Diploma | 297 (76.7%) | 40 (10.4%) |
| College / Associate Degree | 280 (73.3%) | 66 (17.2%) |
| Bachelor's Degree or higher | 102 (94.4%) | 0 (0.0%) |
| Total | 775 (73.2%) | 107 (10.1%) |
Employment Occupations by Sex in Hertford
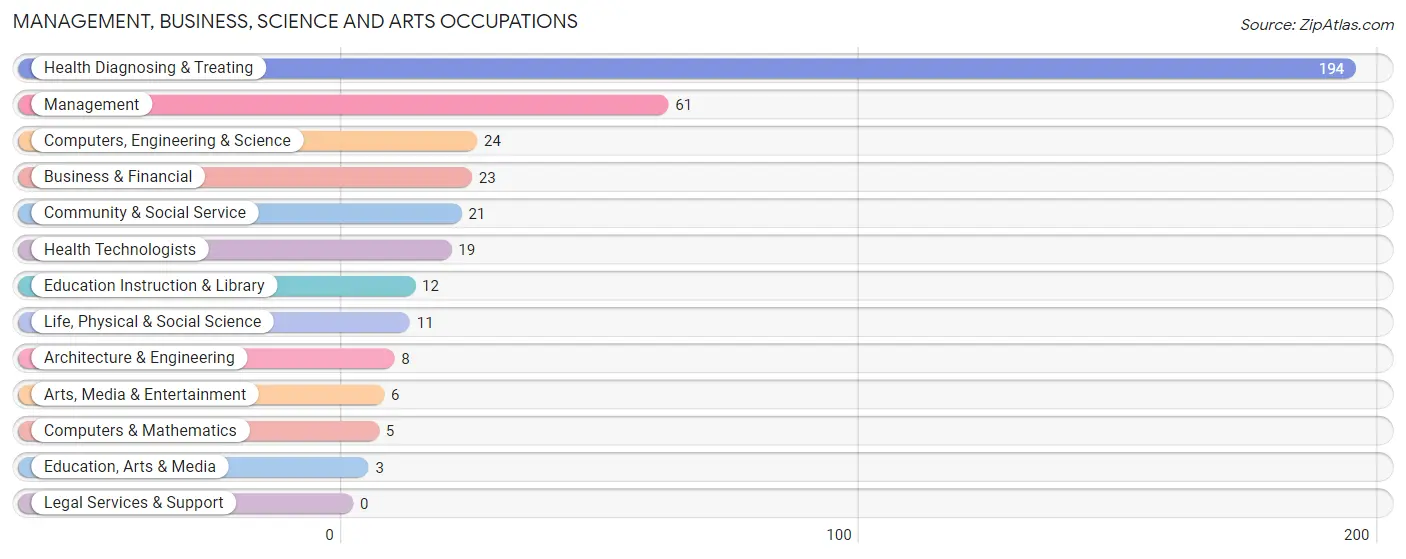
Management, Business, Science and Arts Occupations
The most common Management, Business, Science and Arts occupations in Hertford are Health Diagnosing & Treating (194 | 23.9%), Management (61 | 7.5%), Computers, Engineering & Science (24 | 2.9%), Business & Financial (23 | 2.8%), and Community & Social Service (21 | 2.6%).
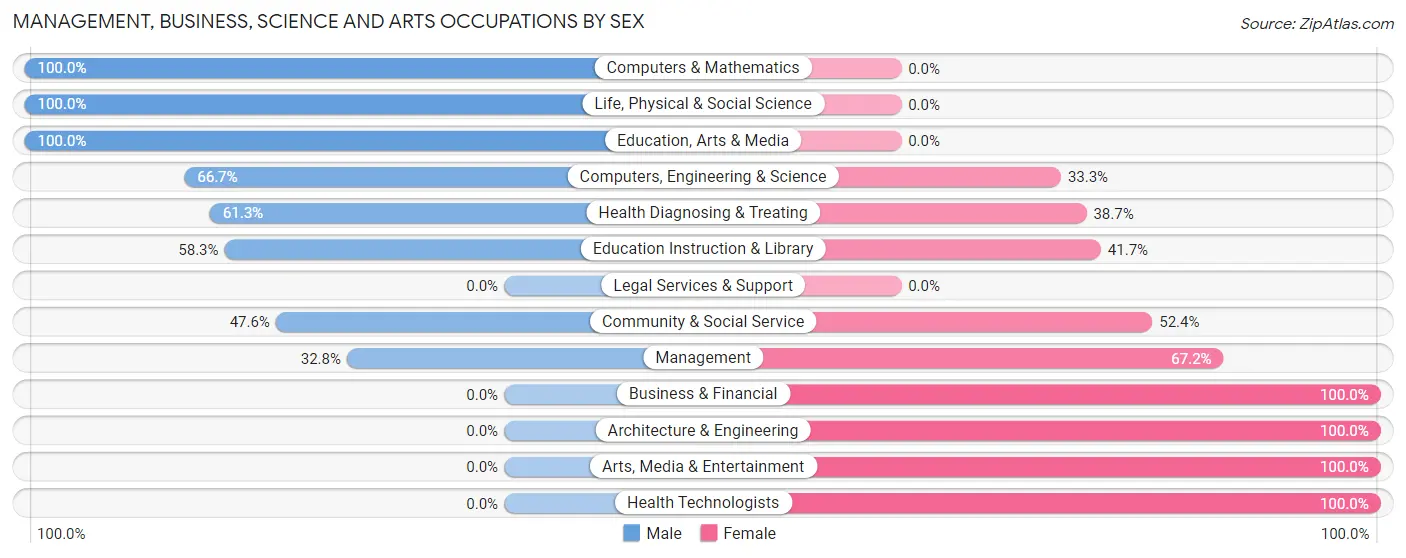
Management, Business, Science and Arts Occupations by Sex
Within the Management, Business, Science and Arts occupations in Hertford, the most male-oriented occupations are Computers & Mathematics (100.0%), Life, Physical & Social Science (100.0%), and Education, Arts & Media (100.0%), while the most female-oriented occupations are Business & Financial (100.0%), Architecture & Engineering (100.0%), and Arts, Media & Entertainment (100.0%).
| Occupation | Male | Female |
| Management | 20 (32.8%) | 41 (67.2%) |
| Business & Financial | 0 (0.0%) | 23 (100.0%) |
| Computers, Engineering & Science | 16 (66.7%) | 8 (33.3%) |
| Computers & Mathematics | 5 (100.0%) | 0 (0.0%) |
| Architecture & Engineering | 0 (0.0%) | 8 (100.0%) |
| Life, Physical & Social Science | 11 (100.0%) | 0 (0.0%) |
| Community & Social Service | 10 (47.6%) | 11 (52.4%) |
| Education, Arts & Media | 3 (100.0%) | 0 (0.0%) |
| Legal Services & Support | 0 (0.0%) | 0 (0.0%) |
| Education Instruction & Library | 7 (58.3%) | 5 (41.7%) |
| Arts, Media & Entertainment | 0 (0.0%) | 6 (100.0%) |
| Health Diagnosing & Treating | 119 (61.3%) | 75 (38.7%) |
| Health Technologists | 0 (0.0%) | 19 (100.0%) |
| Total (Category) | 165 (51.1%) | 158 (48.9%) |
| Total (Overall) | 379 (46.6%) | 434 (53.4%) |
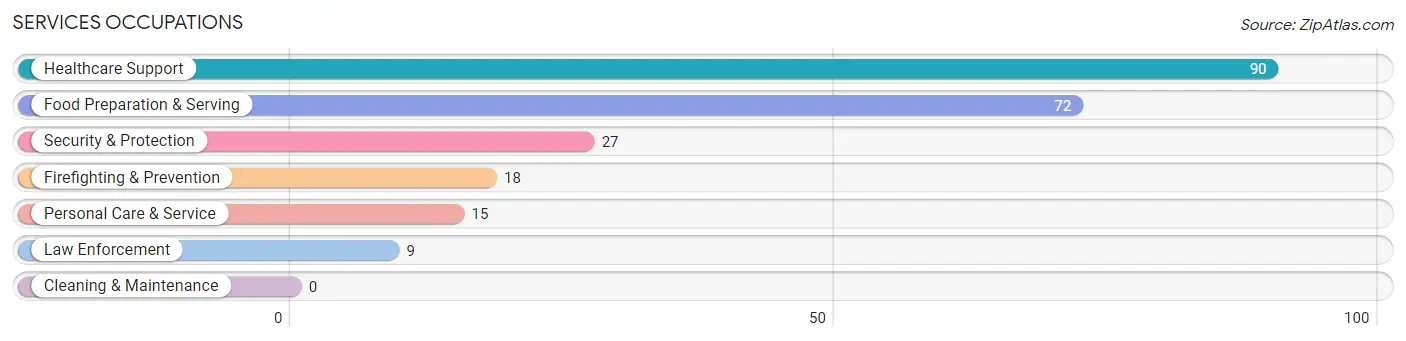
Services Occupations
The most common Services occupations in Hertford are Healthcare Support (90 | 11.1%), Food Preparation & Serving (72 | 8.9%), Security & Protection (27 | 3.3%), Firefighting & Prevention (18 | 2.2%), and Personal Care & Service (15 | 1.8%).
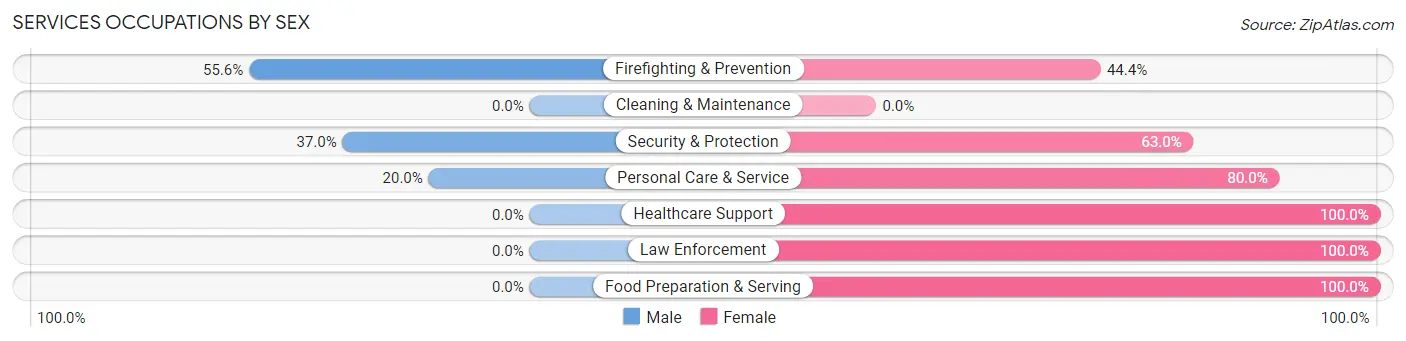
Services Occupations by Sex
Within the Services occupations in Hertford, the most male-oriented occupations are Firefighting & Prevention (55.6%), Security & Protection (37.0%), and Personal Care & Service (20.0%), while the most female-oriented occupations are Healthcare Support (100.0%), Law Enforcement (100.0%), and Food Preparation & Serving (100.0%).
| Occupation | Male | Female |
| Healthcare Support | 0 (0.0%) | 90 (100.0%) |
| Security & Protection | 10 (37.0%) | 17 (63.0%) |
| Firefighting & Prevention | 10 (55.6%) | 8 (44.4%) |
| Law Enforcement | 0 (0.0%) | 9 (100.0%) |
| Food Preparation & Serving | 0 (0.0%) | 72 (100.0%) |
| Cleaning & Maintenance | 0 (0.0%) | 0 (0.0%) |
| Personal Care & Service | 3 (20.0%) | 12 (80.0%) |
| Total (Category) | 13 (6.4%) | 191 (93.6%) |
| Total (Overall) | 379 (46.6%) | 434 (53.4%) |
Sales and Office Occupations
The most common Sales and Office occupations in Hertford are Office & Administration (106 | 13.0%), and Sales & Related (65 | 8.0%).
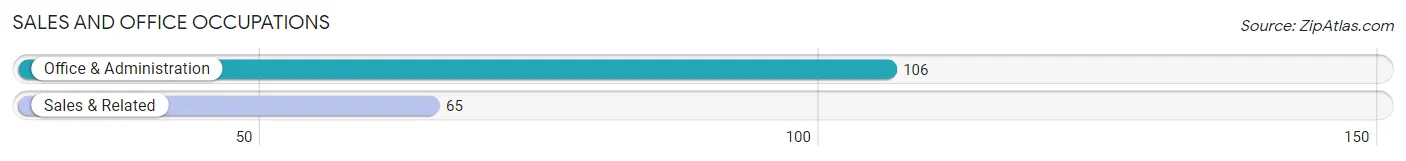
Sales and Office Occupations by Sex
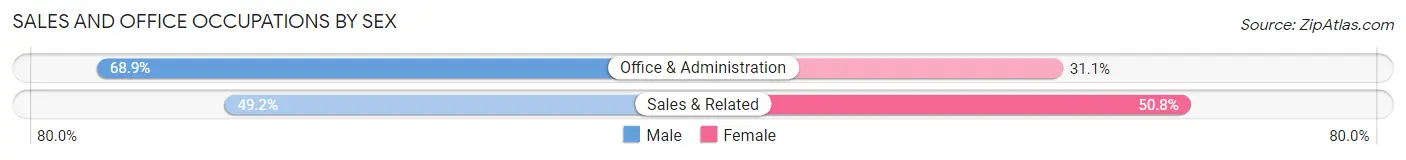
| Occupation | Male | Female |
| Sales & Related | 32 (49.2%) | 33 (50.8%) |
| Office & Administration | 73 (68.9%) | 33 (31.1%) |
| Total (Category) | 105 (61.4%) | 66 (38.6%) |
| Total (Overall) | 379 (46.6%) | 434 (53.4%) |
Natural Resources, Construction and Maintenance Occupations
The most common Natural Resources, Construction and Maintenance occupations in Hertford are Construction & Extraction (53 | 6.5%), Installation, Maintenance & Repair (31 | 3.8%), and Farming, Fishing & Forestry (6 | 0.7%).
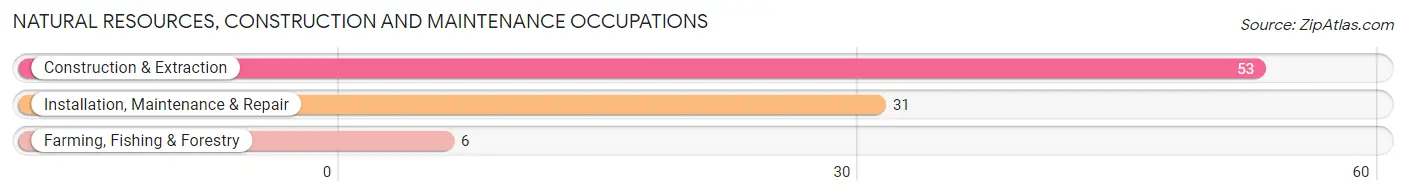
Natural Resources, Construction and Maintenance Occupations by Sex
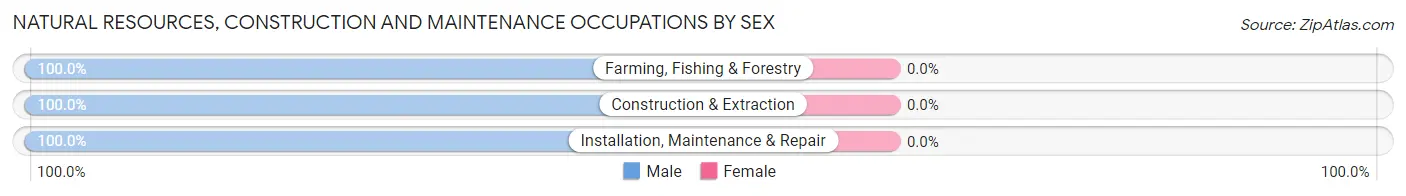
| Occupation | Male | Female |
| Farming, Fishing & Forestry | 6 (100.0%) | 0 (0.0%) |
| Construction & Extraction | 53 (100.0%) | 0 (0.0%) |
| Installation, Maintenance & Repair | 31 (100.0%) | 0 (0.0%) |
| Total (Category) | 90 (100.0%) | 0 (0.0%) |
| Total (Overall) | 379 (46.6%) | 434 (53.4%) |
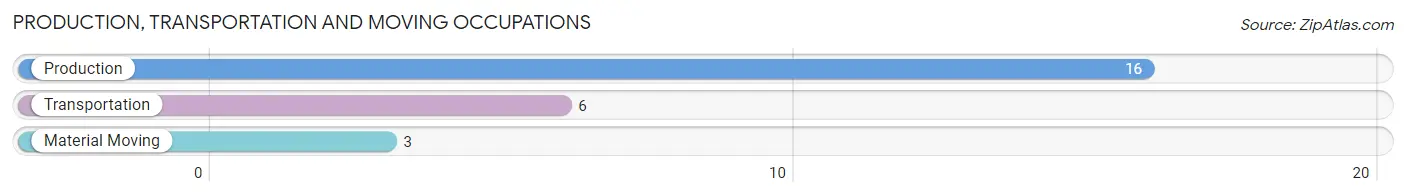
Production, Transportation and Moving Occupations
The most common Production, Transportation and Moving occupations in Hertford are Production (16 | 2.0%), Transportation (6 | 0.7%), and Material Moving (3 | 0.4%).
Production, Transportation and Moving Occupations by Sex
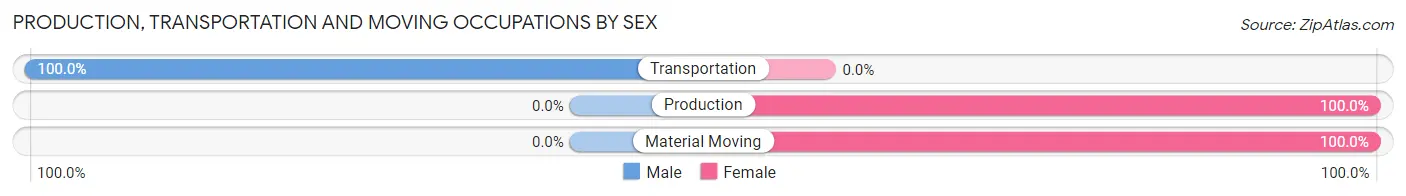
| Occupation | Male | Female |
| Production | 0 (0.0%) | 16 (100.0%) |
| Transportation | 6 (100.0%) | 0 (0.0%) |
| Material Moving | 0 (0.0%) | 3 (100.0%) |
| Total (Category) | 6 (24.0%) | 19 (76.0%) |
| Total (Overall) | 379 (46.6%) | 434 (53.4%) |
Employment Industries by Sex in Hertford
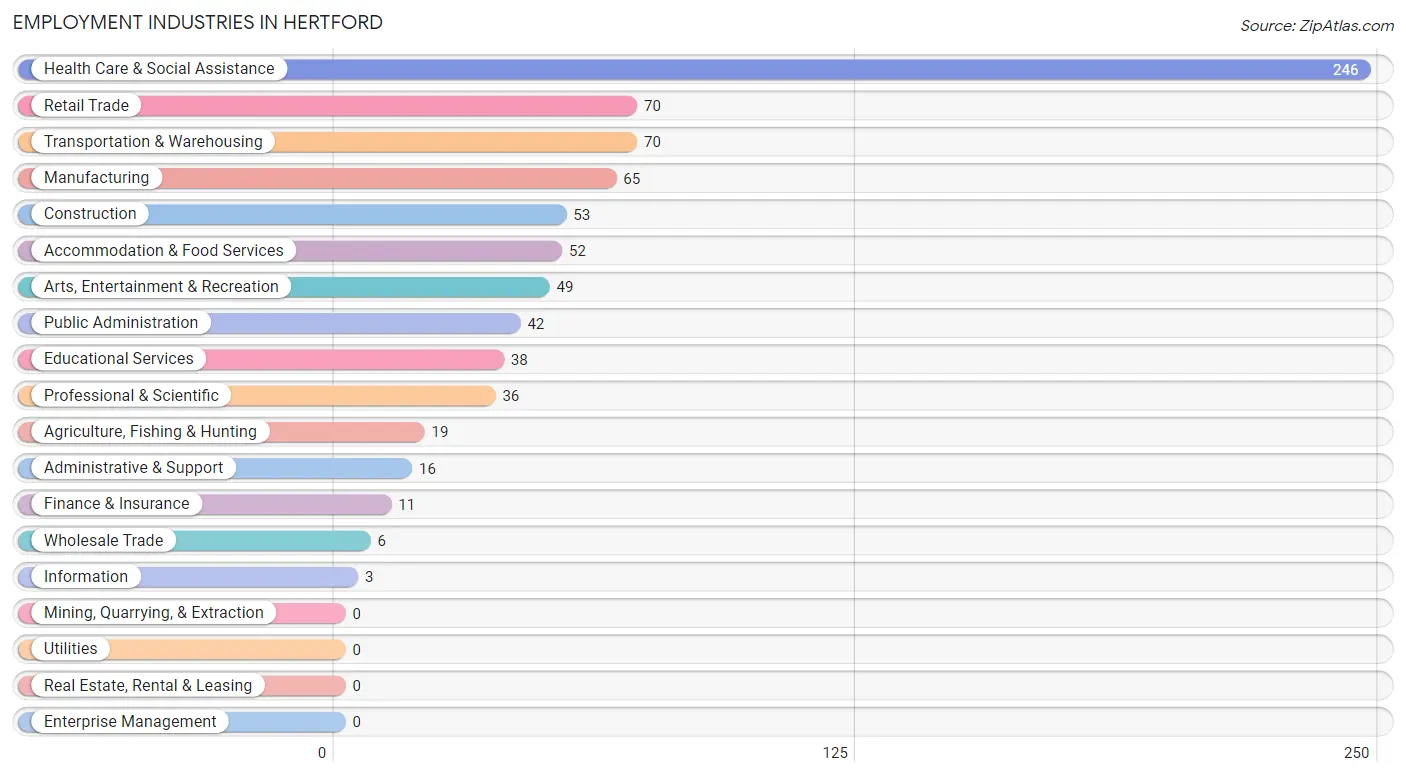
Employment Industries in Hertford
The major employment industries in Hertford include Health Care & Social Assistance (246 | 30.3%), Retail Trade (70 | 8.6%), Transportation & Warehousing (70 | 8.6%), Manufacturing (65 | 8.0%), and Construction (53 | 6.5%).
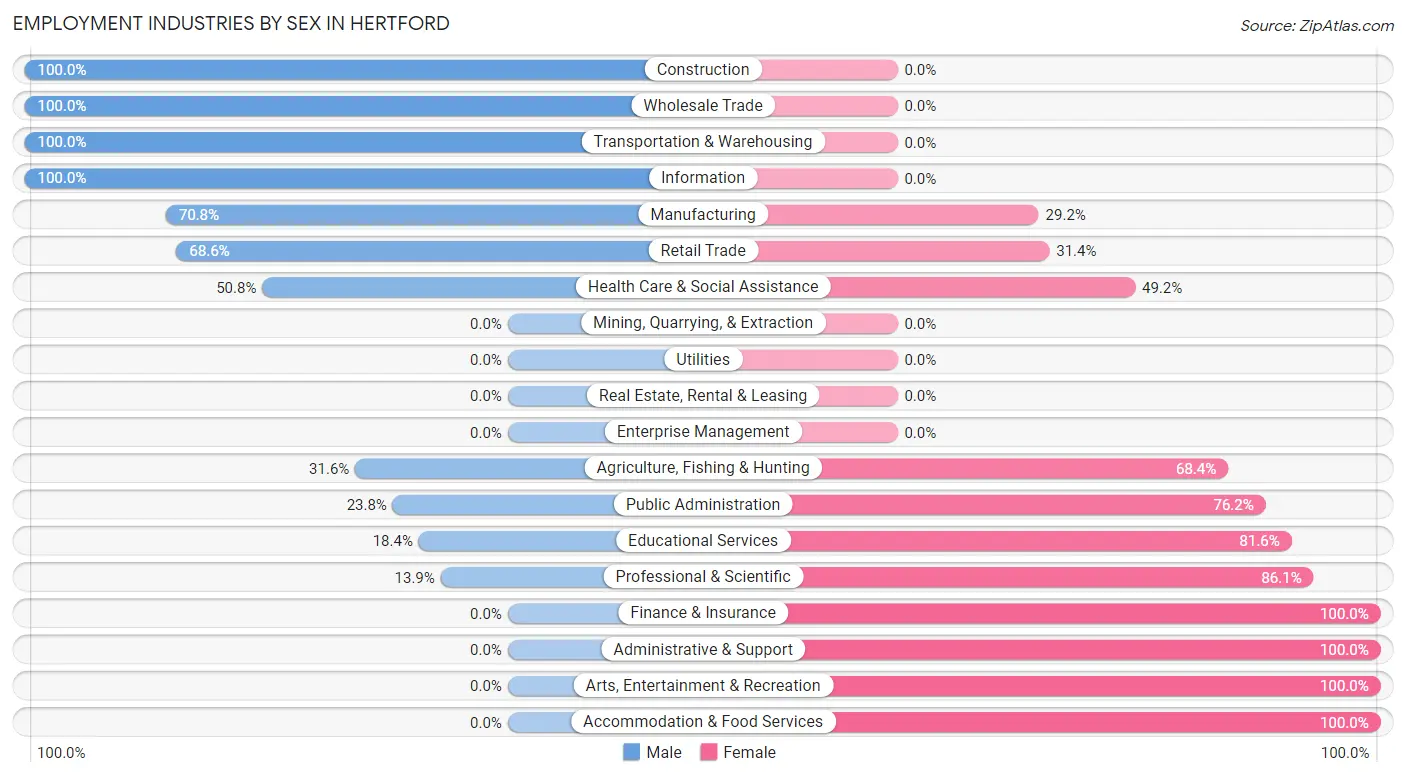
Employment Industries by Sex in Hertford
The Hertford industries that see more men than women are Construction (100.0%), Wholesale Trade (100.0%), and Transportation & Warehousing (100.0%), whereas the industries that tend to have a higher number of women are Finance & Insurance (100.0%), Administrative & Support (100.0%), and Arts, Entertainment & Recreation (100.0%).
| Industry | Male | Female |
| Agriculture, Fishing & Hunting | 6 (31.6%) | 13 (68.4%) |
| Mining, Quarrying, & Extraction | 0 (0.0%) | 0 (0.0%) |
| Construction | 53 (100.0%) | 0 (0.0%) |
| Manufacturing | 46 (70.8%) | 19 (29.2%) |
| Wholesale Trade | 6 (100.0%) | 0 (0.0%) |
| Retail Trade | 48 (68.6%) | 22 (31.4%) |
| Transportation & Warehousing | 70 (100.0%) | 0 (0.0%) |
| Utilities | 0 (0.0%) | 0 (0.0%) |
| Information | 3 (100.0%) | 0 (0.0%) |
| Finance & Insurance | 0 (0.0%) | 11 (100.0%) |
| Real Estate, Rental & Leasing | 0 (0.0%) | 0 (0.0%) |
| Professional & Scientific | 5 (13.9%) | 31 (86.1%) |
| Enterprise Management | 0 (0.0%) | 0 (0.0%) |
| Administrative & Support | 0 (0.0%) | 16 (100.0%) |
| Educational Services | 7 (18.4%) | 31 (81.6%) |
| Health Care & Social Assistance | 125 (50.8%) | 121 (49.2%) |
| Arts, Entertainment & Recreation | 0 (0.0%) | 49 (100.0%) |
| Accommodation & Food Services | 0 (0.0%) | 52 (100.0%) |
| Public Administration | 10 (23.8%) | 32 (76.2%) |
| Total | 379 (46.6%) | 434 (53.4%) |
Education in Hertford
School Enrollment in Hertford
The most common levels of schooling among the 394 students in Hertford are college / undergraduate (92 | 23.4%), elementary school (89 | 22.6%), and high school (83 | 21.1%).
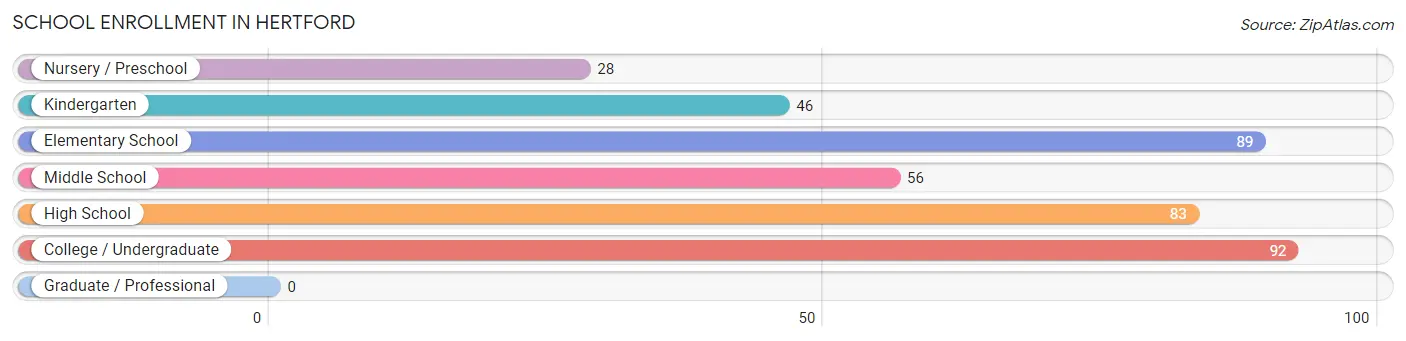
| School Level | # Students | % Students |
| Nursery / Preschool | 28 | 7.1% |
| Kindergarten | 46 | 11.7% |
| Elementary School | 89 | 22.6% |
| Middle School | 56 | 14.2% |
| High School | 83 | 21.1% |
| College / Undergraduate | 92 | 23.4% |
| Graduate / Professional | 0 | 0.0% |
| Total | 394 | 100.0% |
School Enrollment by Age by Funding Source in Hertford
Out of a total of 394 students who are enrolled in schools in Hertford, 28 (7.1%) attend a private institution, while the remaining 366 (92.9%) are enrolled in public schools. The age group of 3 to 4 year olds has the highest likelihood of being enrolled in private schools, with 28 (100.0% in the age bracket) enrolled. Conversely, the age group of 5 to 9 year old has the lowest likelihood of being enrolled in a private school, with 135 (100.0% in the age bracket) attending a public institution.
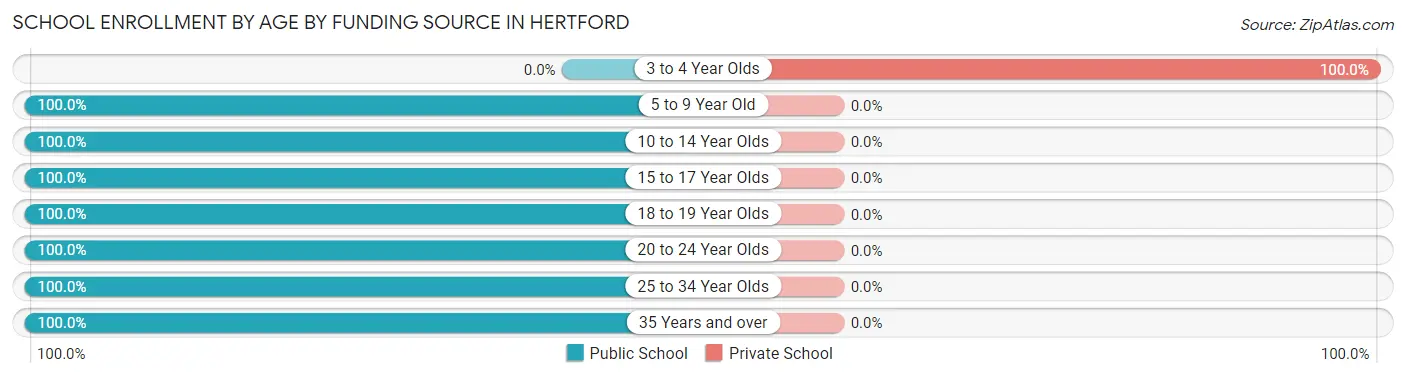
| Age Bracket | Public School | Private School |
| 3 to 4 Year Olds | 0 (0.0%) | 28 (100.0%) |
| 5 to 9 Year Old | 135 (100.0%) | 0 (0.0%) |
| 10 to 14 Year Olds | 56 (100.0%) | 0 (0.0%) |
| 15 to 17 Year Olds | 70 (100.0%) | 0 (0.0%) |
| 18 to 19 Year Olds | 33 (100.0%) | 0 (0.0%) |
| 20 to 24 Year Olds | 21 (100.0%) | 0 (0.0%) |
| 25 to 34 Year Olds | 45 (100.0%) | 0 (0.0%) |
| 35 Years and over | 6 (100.0%) | 0 (0.0%) |
| Total | 366 (92.9%) | 28 (7.1%) |
Educational Attainment by Field of Study in Hertford
Business (44 | 26.5%), science & technology (41 | 24.7%), computers & mathematics (18 | 10.8%), bio, nature & agricultural (13 | 7.8%), and arts & humanities (12 | 7.2%) are the most common fields of study among 166 individuals in Hertford who have obtained a bachelor's degree or higher.
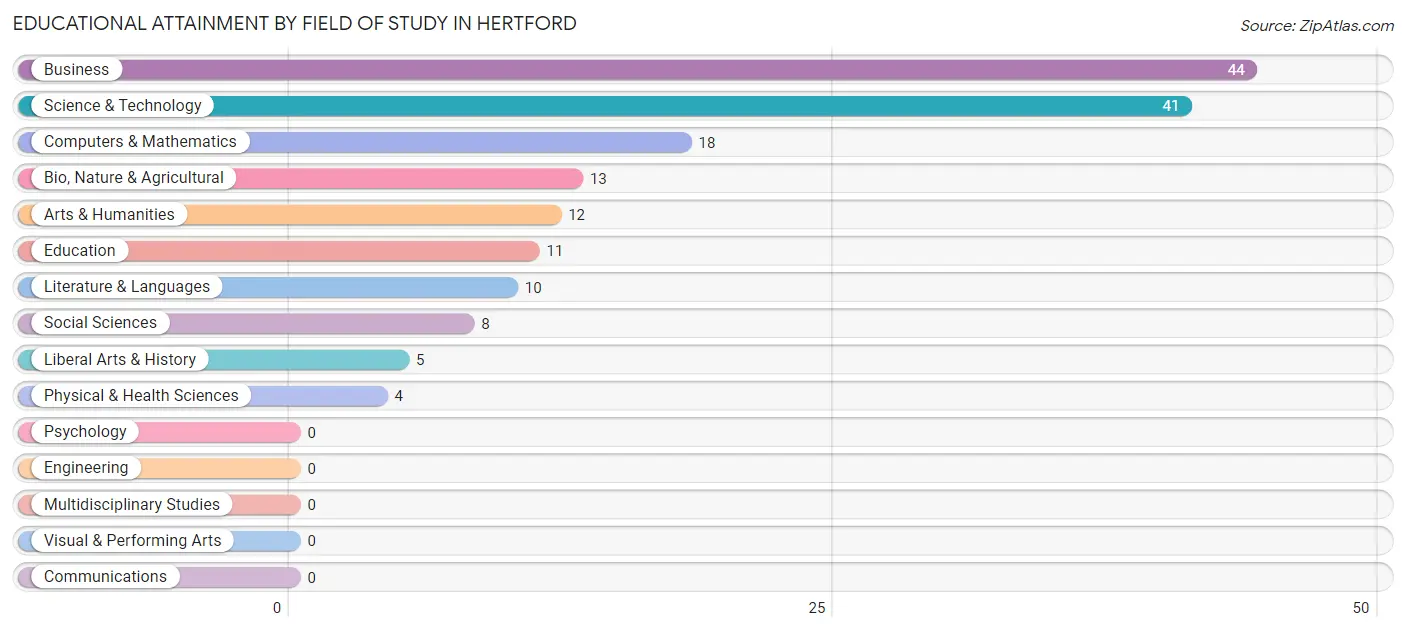
| Field of Study | # Graduates | % Graduates |
| Computers & Mathematics | 18 | 10.8% |
| Bio, Nature & Agricultural | 13 | 7.8% |
| Physical & Health Sciences | 4 | 2.4% |
| Psychology | 0 | 0.0% |
| Social Sciences | 8 | 4.8% |
| Engineering | 0 | 0.0% |
| Multidisciplinary Studies | 0 | 0.0% |
| Science & Technology | 41 | 24.7% |
| Business | 44 | 26.5% |
| Education | 11 | 6.6% |
| Literature & Languages | 10 | 6.0% |
| Liberal Arts & History | 5 | 3.0% |
| Visual & Performing Arts | 0 | 0.0% |
| Communications | 0 | 0.0% |
| Arts & Humanities | 12 | 7.2% |
| Total | 166 | 100.0% |
Transportation & Commute in Hertford
Vehicle Availability by Sex in Hertford
The most prevalent vehicle ownership categories in Hertford are males with 1 vehicle (183, accounting for 47.9%) and females with 1 vehicle (118, making up 42.2%).
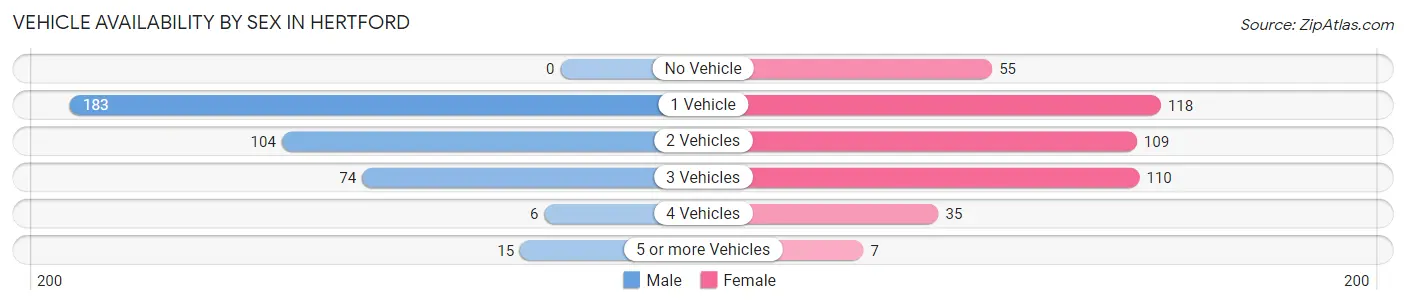
| Vehicles Available | Male | Female |
| No Vehicle | 0 (0.0%) | 55 (12.7%) |
| 1 Vehicle | 183 (47.9%) | 118 (27.2%) |
| 2 Vehicles | 104 (27.2%) | 109 (25.1%) |
| 3 Vehicles | 74 (19.4%) | 110 (25.4%) |
| 4 Vehicles | 6 (1.6%) | 35 (8.1%) |
| 5 or more Vehicles | 15 (3.9%) | 7 (1.6%) |
| Total | 382 (100.0%) | 434 (100.0%) |
Commute Time in Hertford
The most frequently occuring commute durations in Hertford are 60 to 89 minutes (210 commuters, 26.5%), less than 5 minutes (136 commuters, 17.2%), and 5 to 9 minutes (114 commuters, 14.4%).
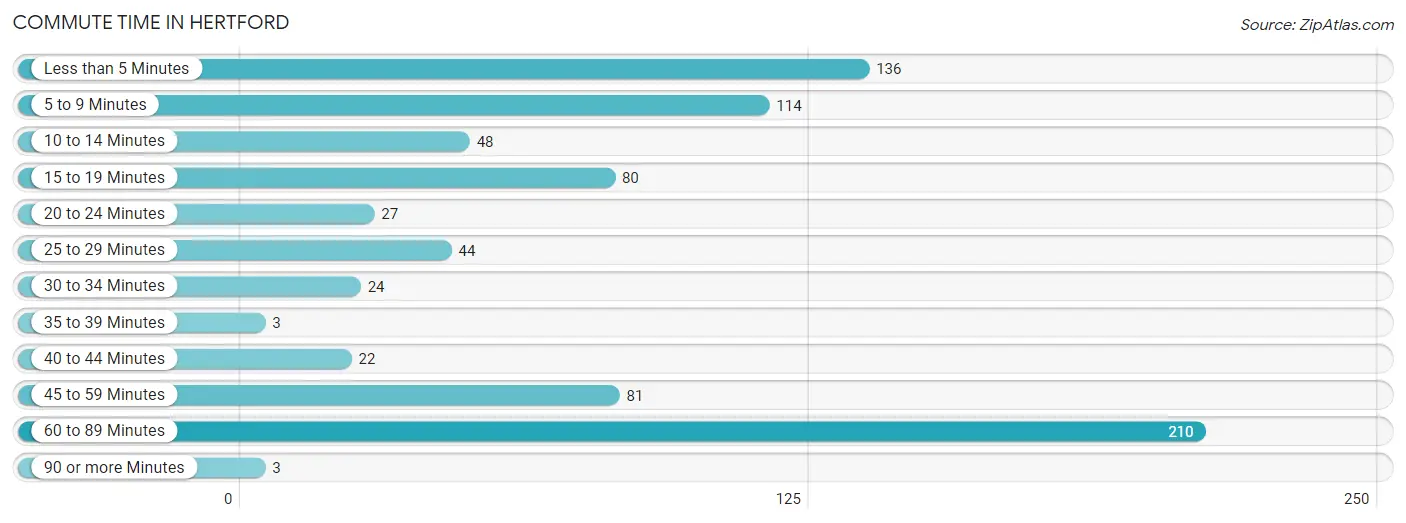
| Commute Time | # Commuters | % Commuters |
| Less than 5 Minutes | 136 | 17.2% |
| 5 to 9 Minutes | 114 | 14.4% |
| 10 to 14 Minutes | 48 | 6.1% |
| 15 to 19 Minutes | 80 | 10.1% |
| 20 to 24 Minutes | 27 | 3.4% |
| 25 to 29 Minutes | 44 | 5.6% |
| 30 to 34 Minutes | 24 | 3.0% |
| 35 to 39 Minutes | 3 | 0.4% |
| 40 to 44 Minutes | 22 | 2.8% |
| 45 to 59 Minutes | 81 | 10.2% |
| 60 to 89 Minutes | 210 | 26.5% |
| 90 or more Minutes | 3 | 0.4% |
Commute Time by Sex in Hertford
The most common commute times in Hertford are 60 to 89 minutes (125 commuters, 34.3%) for males and 60 to 89 minutes (85 commuters, 19.9%) for females.
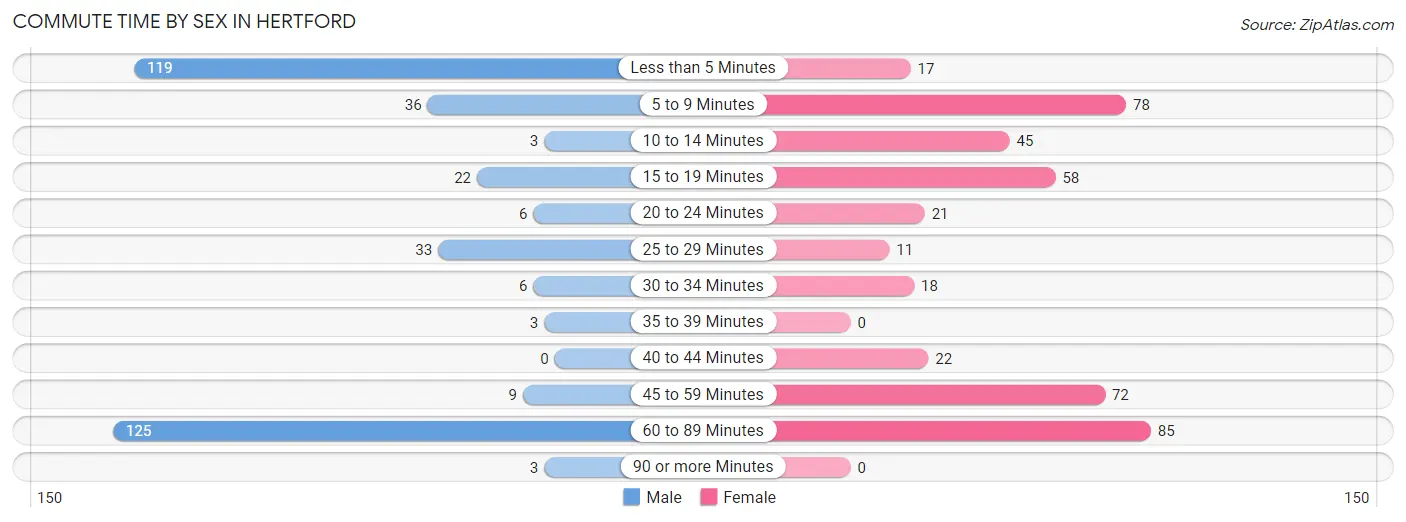
| Commute Time | Male | Female |
| Less than 5 Minutes | 119 (32.6%) | 17 (4.0%) |
| 5 to 9 Minutes | 36 (9.9%) | 78 (18.3%) |
| 10 to 14 Minutes | 3 (0.8%) | 45 (10.5%) |
| 15 to 19 Minutes | 22 (6.0%) | 58 (13.6%) |
| 20 to 24 Minutes | 6 (1.6%) | 21 (4.9%) |
| 25 to 29 Minutes | 33 (9.0%) | 11 (2.6%) |
| 30 to 34 Minutes | 6 (1.6%) | 18 (4.2%) |
| 35 to 39 Minutes | 3 (0.8%) | 0 (0.0%) |
| 40 to 44 Minutes | 0 (0.0%) | 22 (5.1%) |
| 45 to 59 Minutes | 9 (2.5%) | 72 (16.9%) |
| 60 to 89 Minutes | 125 (34.3%) | 85 (19.9%) |
| 90 or more Minutes | 3 (0.8%) | 0 (0.0%) |
Time of Departure to Work by Sex in Hertford
The most frequent times of departure to work in Hertford are 12:00 AM to 4:59 AM (172, 47.1%) for males and 7:30 AM to 7:59 AM (92, 21.5%) for females.
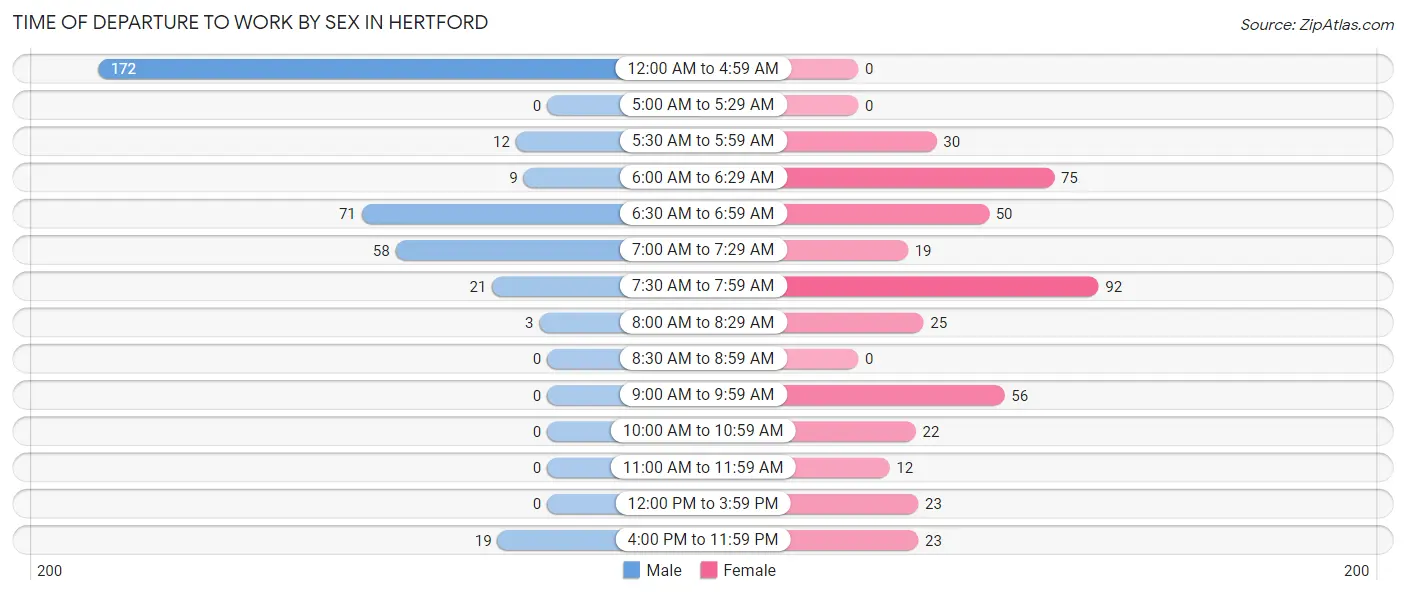
| Time of Departure | Male | Female |
| 12:00 AM to 4:59 AM | 172 (47.1%) | 0 (0.0%) |
| 5:00 AM to 5:29 AM | 0 (0.0%) | 0 (0.0%) |
| 5:30 AM to 5:59 AM | 12 (3.3%) | 30 (7.0%) |
| 6:00 AM to 6:29 AM | 9 (2.5%) | 75 (17.6%) |
| 6:30 AM to 6:59 AM | 71 (19.5%) | 50 (11.7%) |
| 7:00 AM to 7:29 AM | 58 (15.9%) | 19 (4.4%) |
| 7:30 AM to 7:59 AM | 21 (5.8%) | 92 (21.5%) |
| 8:00 AM to 8:29 AM | 3 (0.8%) | 25 (5.9%) |
| 8:30 AM to 8:59 AM | 0 (0.0%) | 0 (0.0%) |
| 9:00 AM to 9:59 AM | 0 (0.0%) | 56 (13.1%) |
| 10:00 AM to 10:59 AM | 0 (0.0%) | 22 (5.1%) |
| 11:00 AM to 11:59 AM | 0 (0.0%) | 12 (2.8%) |
| 12:00 PM to 3:59 PM | 0 (0.0%) | 23 (5.4%) |
| 4:00 PM to 11:59 PM | 19 (5.2%) | 23 (5.4%) |
| Total | 365 (100.0%) | 427 (100.0%) |
Housing Occupancy in Hertford
Occupancy by Ownership in Hertford
Of the total 834 dwellings in Hertford, owner-occupied units account for 512 (61.4%), while renter-occupied units make up 322 (38.6%).
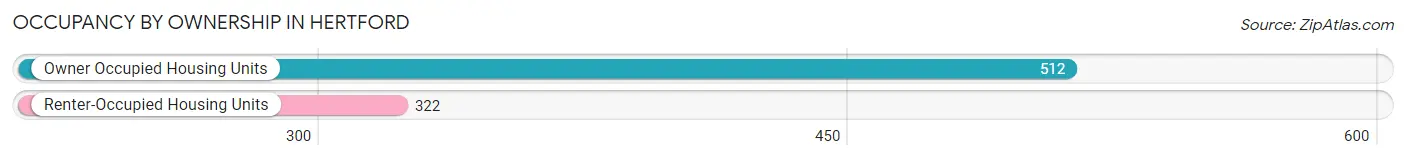
| Occupancy | # Housing Units | % Housing Units |
| Owner Occupied Housing Units | 512 | 61.4% |
| Renter-Occupied Housing Units | 322 | 38.6% |
| Total Occupied Housing Units | 834 | 100.0% |
Occupancy by Household Size in Hertford
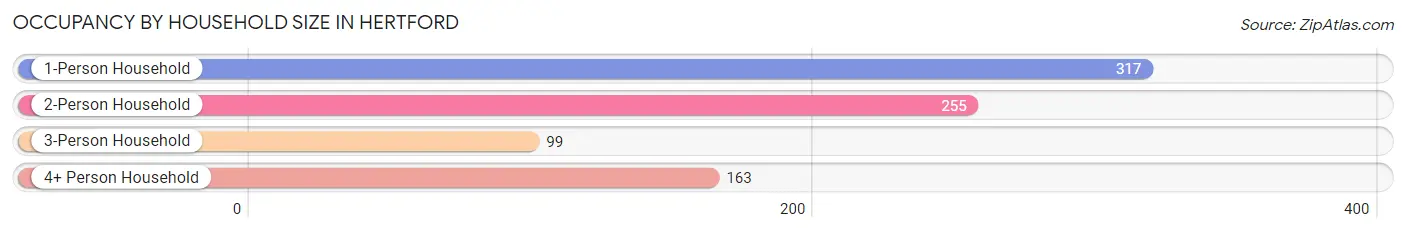
| Household Size | # Housing Units | % Housing Units |
| 1-Person Household | 317 | 38.0% |
| 2-Person Household | 255 | 30.6% |
| 3-Person Household | 99 | 11.9% |
| 4+ Person Household | 163 | 19.5% |
| Total Housing Units | 834 | 100.0% |
Occupancy by Ownership by Household Size in Hertford
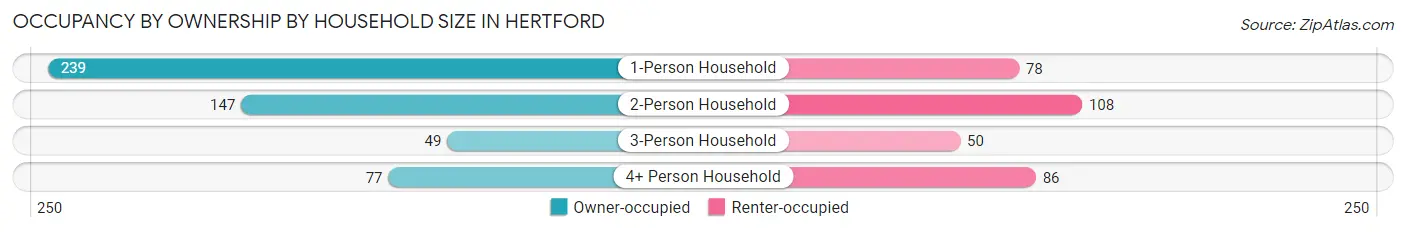
| Household Size | Owner-occupied | Renter-occupied |
| 1-Person Household | 239 (75.4%) | 78 (24.6%) |
| 2-Person Household | 147 (57.7%) | 108 (42.3%) |
| 3-Person Household | 49 (49.5%) | 50 (50.5%) |
| 4+ Person Household | 77 (47.2%) | 86 (52.8%) |
| Total Housing Units | 512 (61.4%) | 322 (38.6%) |
Occupancy by Educational Attainment in Hertford
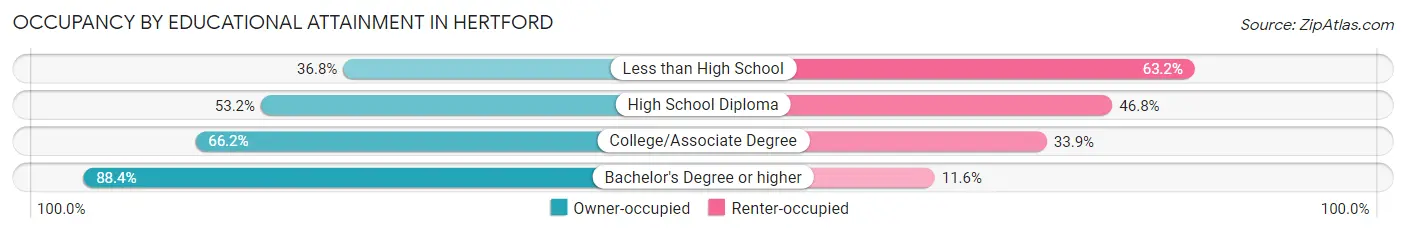
| Household Size | Owner-occupied | Renter-occupied |
| Less than High School | 42 (36.8%) | 72 (63.2%) |
| High School Diploma | 143 (53.2%) | 126 (46.8%) |
| College/Associate Degree | 213 (66.1%) | 109 (33.9%) |
| Bachelor's Degree or higher | 114 (88.4%) | 15 (11.6%) |
Occupancy by Age of Householder in Hertford
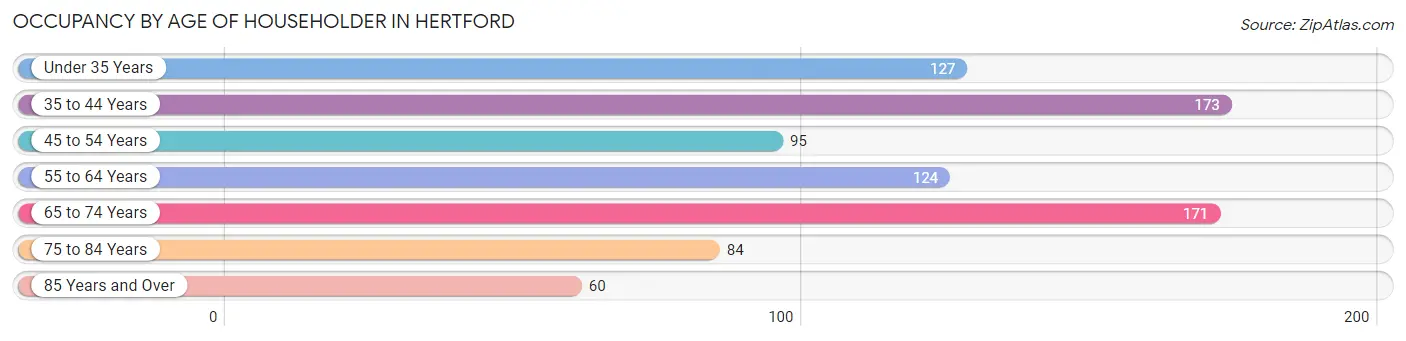
| Age Bracket | # Households | % Households |
| Under 35 Years | 127 | 15.2% |
| 35 to 44 Years | 173 | 20.7% |
| 45 to 54 Years | 95 | 11.4% |
| 55 to 64 Years | 124 | 14.9% |
| 65 to 74 Years | 171 | 20.5% |
| 75 to 84 Years | 84 | 10.1% |
| 85 Years and Over | 60 | 7.2% |
| Total | 834 | 100.0% |
Housing Finances in Hertford
Median Income by Occupancy in Hertford
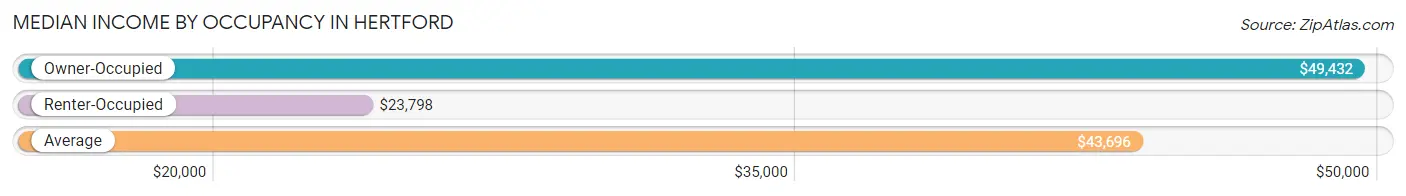
| Occupancy Type | # Households | Median Income |
| Owner-Occupied | 512 (61.4%) | $49,432 |
| Renter-Occupied | 322 (38.6%) | $23,798 |
| Average | 834 (100.0%) | $43,696 |
Occupancy by Householder Income Bracket in Hertford
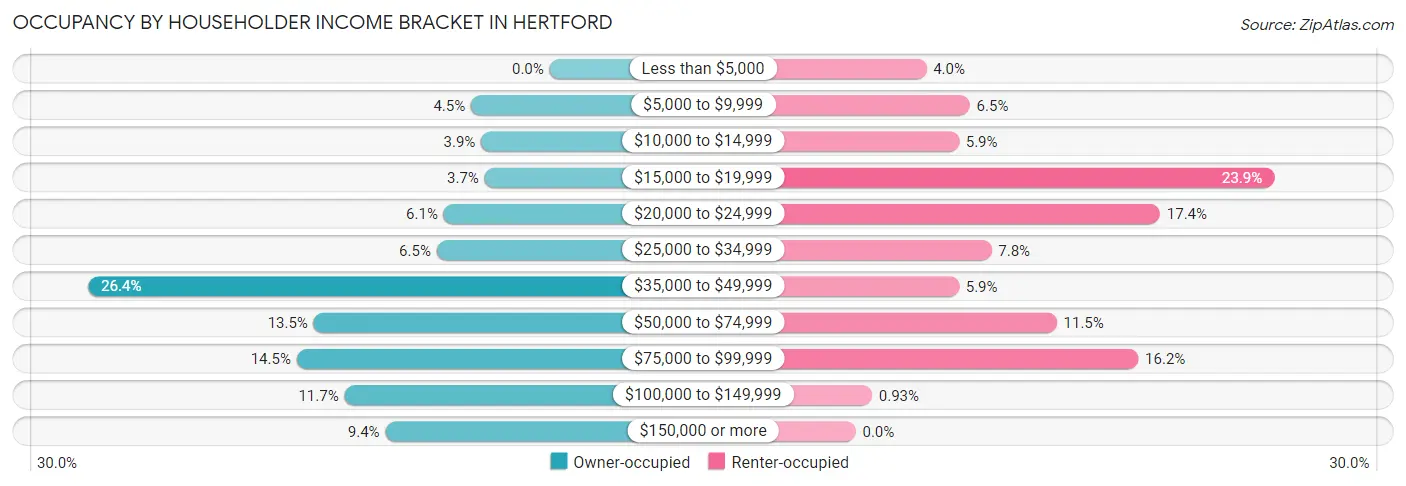
| Income Bracket | Owner-occupied | Renter-occupied |
| Less than $5,000 | 0 (0.0%) | 13 (4.0%) |
| $5,000 to $9,999 | 23 (4.5%) | 21 (6.5%) |
| $10,000 to $14,999 | 20 (3.9%) | 19 (5.9%) |
| $15,000 to $19,999 | 19 (3.7%) | 77 (23.9%) |
| $20,000 to $24,999 | 31 (6.0%) | 56 (17.4%) |
| $25,000 to $34,999 | 33 (6.5%) | 25 (7.8%) |
| $35,000 to $49,999 | 135 (26.4%) | 19 (5.9%) |
| $50,000 to $74,999 | 69 (13.5%) | 37 (11.5%) |
| $75,000 to $99,999 | 74 (14.4%) | 52 (16.2%) |
| $100,000 to $149,999 | 60 (11.7%) | 3 (0.9%) |
| $150,000 or more | 48 (9.4%) | 0 (0.0%) |
| Total | 512 (100.0%) | 322 (100.0%) |
Monthly Housing Cost Tiers in Hertford
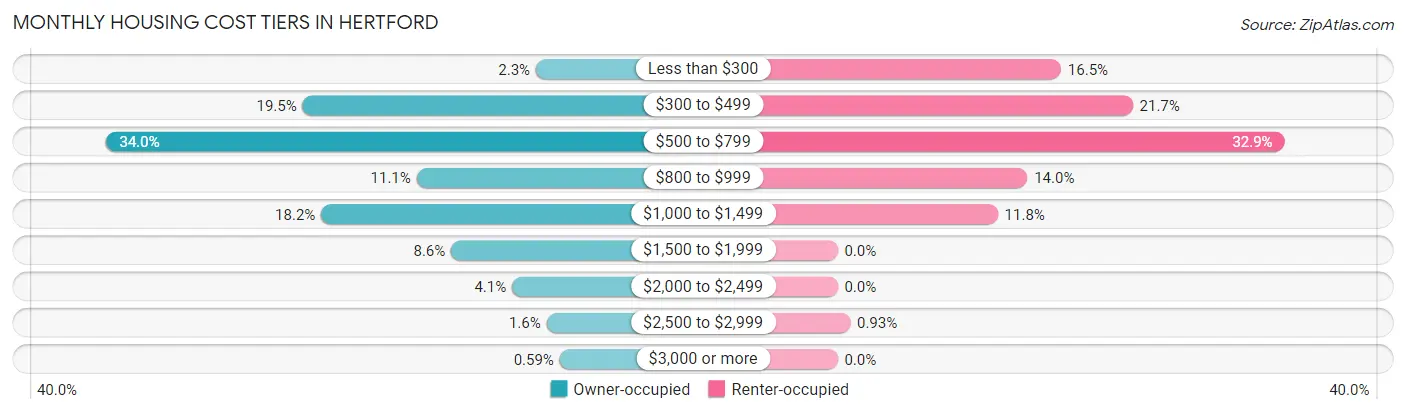
| Monthly Cost | Owner-occupied | Renter-occupied |
| Less than $300 | 12 (2.3%) | 53 (16.5%) |
| $300 to $499 | 100 (19.5%) | 70 (21.7%) |
| $500 to $799 | 174 (34.0%) | 106 (32.9%) |
| $800 to $999 | 57 (11.1%) | 45 (14.0%) |
| $1,000 to $1,499 | 93 (18.2%) | 38 (11.8%) |
| $1,500 to $1,999 | 44 (8.6%) | 0 (0.0%) |
| $2,000 to $2,499 | 21 (4.1%) | 0 (0.0%) |
| $2,500 to $2,999 | 8 (1.6%) | 3 (0.9%) |
| $3,000 or more | 3 (0.6%) | 0 (0.0%) |
| Total | 512 (100.0%) | 322 (100.0%) |
Physical Housing Characteristics in Hertford
Housing Structures in Hertford
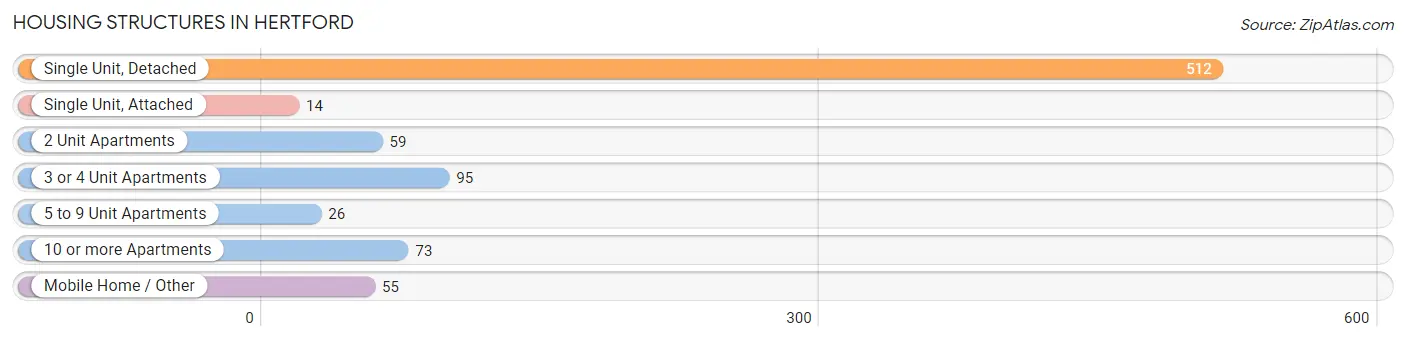
| Structure Type | # Housing Units | % Housing Units |
| Single Unit, Detached | 512 | 61.4% |
| Single Unit, Attached | 14 | 1.7% |
| 2 Unit Apartments | 59 | 7.1% |
| 3 or 4 Unit Apartments | 95 | 11.4% |
| 5 to 9 Unit Apartments | 26 | 3.1% |
| 10 or more Apartments | 73 | 8.7% |
| Mobile Home / Other | 55 | 6.6% |
| Total | 834 | 100.0% |
Housing Structures by Occupancy in Hertford
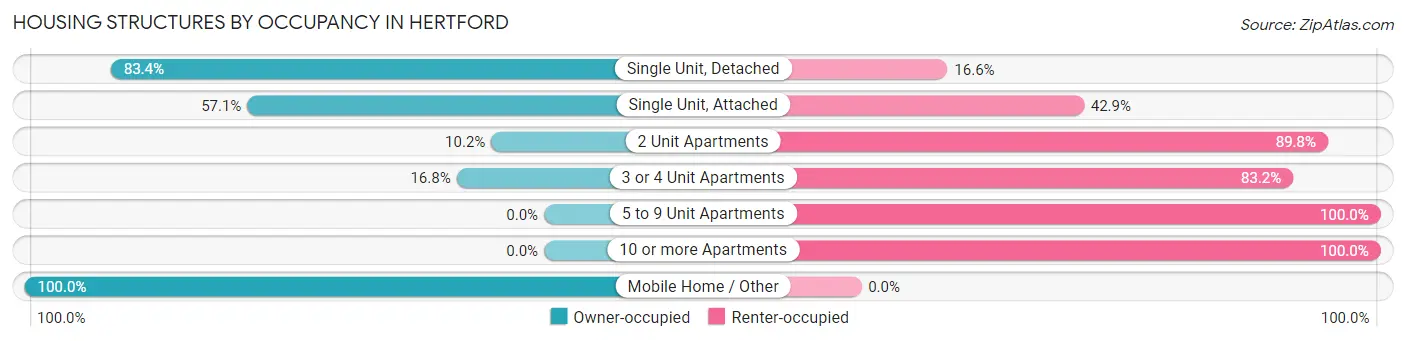
| Structure Type | Owner-occupied | Renter-occupied |
| Single Unit, Detached | 427 (83.4%) | 85 (16.6%) |
| Single Unit, Attached | 8 (57.1%) | 6 (42.9%) |
| 2 Unit Apartments | 6 (10.2%) | 53 (89.8%) |
| 3 or 4 Unit Apartments | 16 (16.8%) | 79 (83.2%) |
| 5 to 9 Unit Apartments | 0 (0.0%) | 26 (100.0%) |
| 10 or more Apartments | 0 (0.0%) | 73 (100.0%) |
| Mobile Home / Other | 55 (100.0%) | 0 (0.0%) |
| Total | 512 (61.4%) | 322 (38.6%) |
Housing Structures by Number of Rooms in Hertford
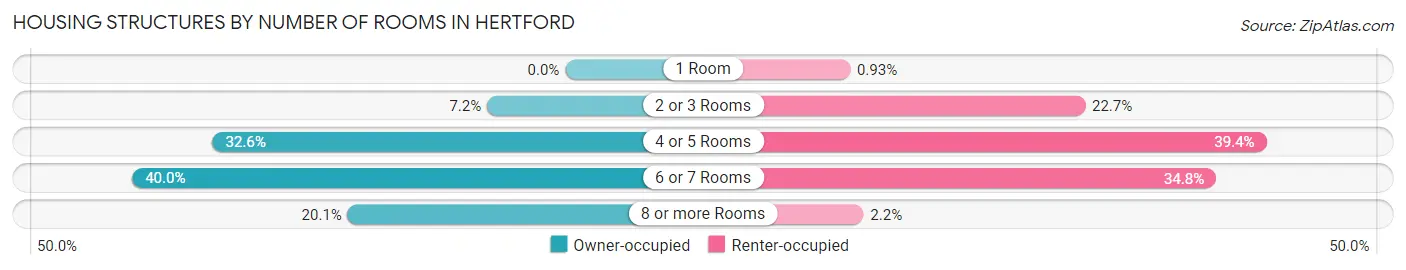
| Number of Rooms | Owner-occupied | Renter-occupied |
| 1 Room | 0 (0.0%) | 3 (0.9%) |
| 2 or 3 Rooms | 37 (7.2%) | 73 (22.7%) |
| 4 or 5 Rooms | 167 (32.6%) | 127 (39.4%) |
| 6 or 7 Rooms | 205 (40.0%) | 112 (34.8%) |
| 8 or more Rooms | 103 (20.1%) | 7 (2.2%) |
| Total | 512 (100.0%) | 322 (100.0%) |
Housing Structure by Heating Type in Hertford
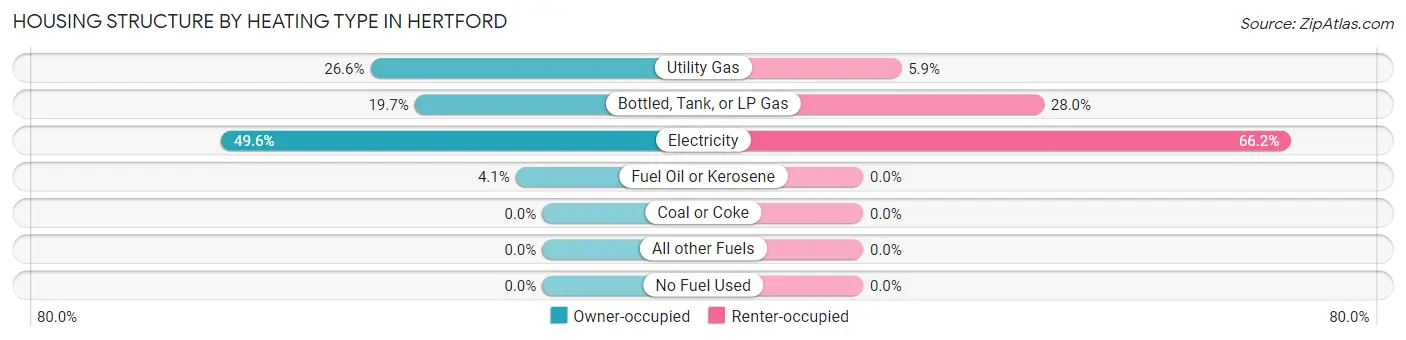
| Heating Type | Owner-occupied | Renter-occupied |
| Utility Gas | 136 (26.6%) | 19 (5.9%) |
| Bottled, Tank, or LP Gas | 101 (19.7%) | 90 (28.0%) |
| Electricity | 254 (49.6%) | 213 (66.1%) |
| Fuel Oil or Kerosene | 21 (4.1%) | 0 (0.0%) |
| Coal or Coke | 0 (0.0%) | 0 (0.0%) |
| All other Fuels | 0 (0.0%) | 0 (0.0%) |
| No Fuel Used | 0 (0.0%) | 0 (0.0%) |
| Total | 512 (100.0%) | 322 (100.0%) |
Household Vehicle Usage in Hertford
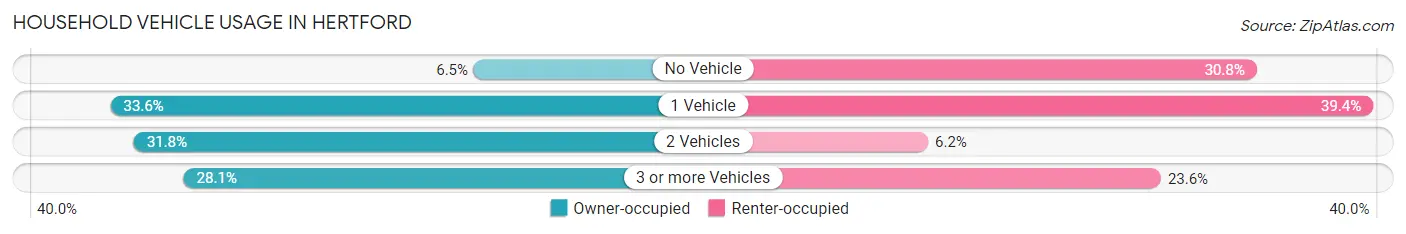
| Vehicles per Household | Owner-occupied | Renter-occupied |
| No Vehicle | 33 (6.5%) | 99 (30.7%) |
| 1 Vehicle | 172 (33.6%) | 127 (39.4%) |
| 2 Vehicles | 163 (31.8%) | 20 (6.2%) |
| 3 or more Vehicles | 144 (28.1%) | 76 (23.6%) |
| Total | 512 (100.0%) | 322 (100.0%) |
Real Estate & Mortgages in Hertford
Real Estate and Mortgage Overview in Hertford
| Characteristic | Without Mortgage | With Mortgage |
| Housing Units | 309 | 203 |
| Median Property Value | $183,700 | $184,700 |
| Median Household Income | $45,170 | $21 |
| Monthly Housing Costs | $546 | $3 |
| Real Estate Taxes | $1,039 | $0 |
Property Value by Mortgage Status in Hertford
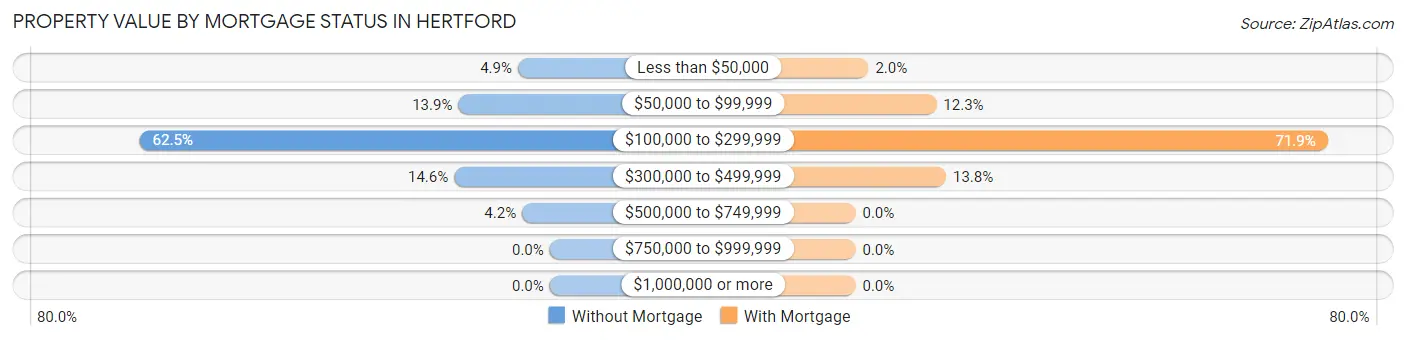
| Property Value | Without Mortgage | With Mortgage |
| Less than $50,000 | 15 (4.9%) | 4 (2.0%) |
| $50,000 to $99,999 | 43 (13.9%) | 25 (12.3%) |
| $100,000 to $299,999 | 193 (62.5%) | 146 (71.9%) |
| $300,000 to $499,999 | 45 (14.6%) | 28 (13.8%) |
| $500,000 to $749,999 | 13 (4.2%) | 0 (0.0%) |
| $750,000 to $999,999 | 0 (0.0%) | 0 (0.0%) |
| $1,000,000 or more | 0 (0.0%) | 0 (0.0%) |
| Total | 309 (100.0%) | 203 (100.0%) |
Household Income by Mortgage Status in Hertford
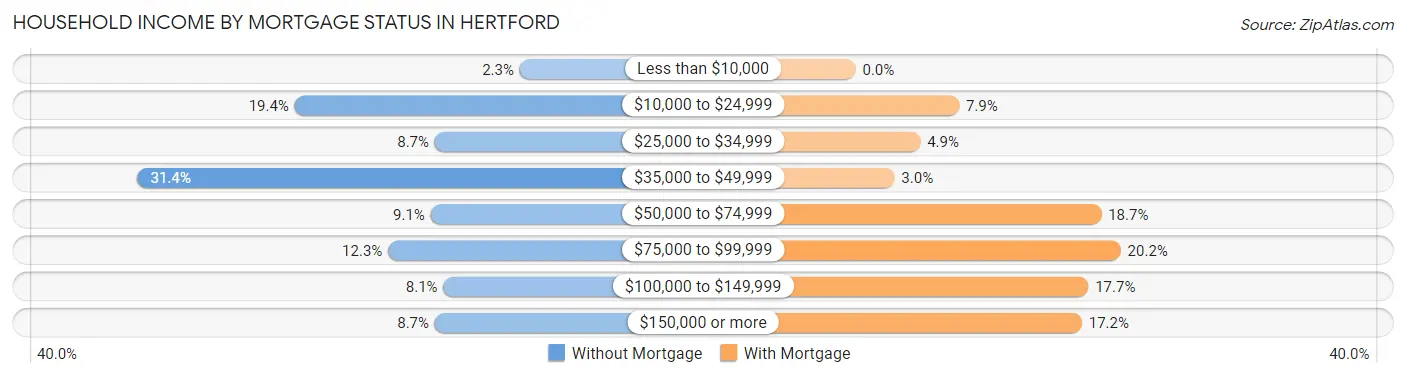
| Household Income | Without Mortgage | With Mortgage |
| Less than $10,000 | 7 (2.3%) | 0 (0.0%) |
| $10,000 to $24,999 | 60 (19.4%) | 16 (7.9%) |
| $25,000 to $34,999 | 27 (8.7%) | 10 (4.9%) |
| $35,000 to $49,999 | 97 (31.4%) | 6 (3.0%) |
| $50,000 to $74,999 | 28 (9.1%) | 38 (18.7%) |
| $75,000 to $99,999 | 38 (12.3%) | 41 (20.2%) |
| $100,000 to $149,999 | 25 (8.1%) | 36 (17.7%) |
| $150,000 or more | 27 (8.7%) | 35 (17.2%) |
| Total | 309 (100.0%) | 203 (100.0%) |
Property Value to Household Income Ratio in Hertford
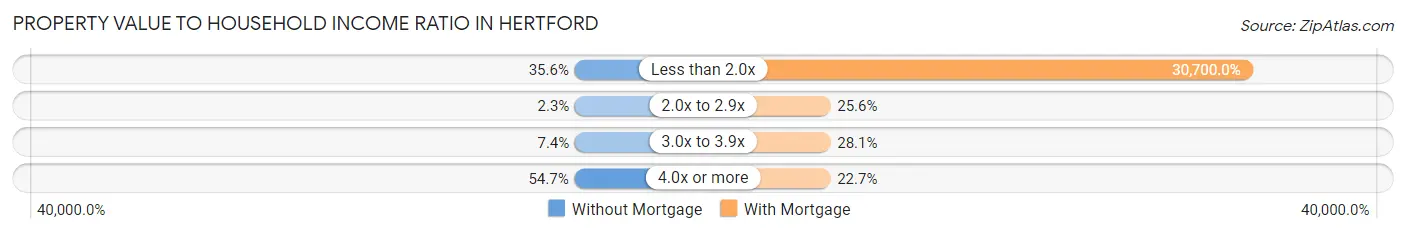
| Value-to-Income Ratio | Without Mortgage | With Mortgage |
| Less than 2.0x | 110 (35.6%) | 62,321 (30,700.0%) |
| 2.0x to 2.9x | 7 (2.3%) | 52 (25.6%) |
| 3.0x to 3.9x | 23 (7.4%) | 57 (28.1%) |
| 4.0x or more | 169 (54.7%) | 46 (22.7%) |
| Total | 309 (100.0%) | 203 (100.0%) |
Real Estate Taxes by Mortgage Status in Hertford
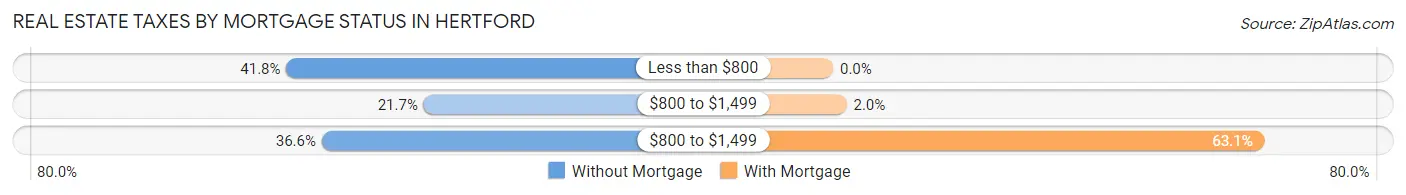
| Property Taxes | Without Mortgage | With Mortgage |
| Less than $800 | 129 (41.7%) | 0 (0.0%) |
| $800 to $1,499 | 67 (21.7%) | 4 (2.0%) |
| $800 to $1,499 | 113 (36.6%) | 128 (63.0%) |
| Total | 309 (100.0%) | 203 (100.0%) |
Health & Disability in Hertford
Health Insurance Coverage by Age in Hertford
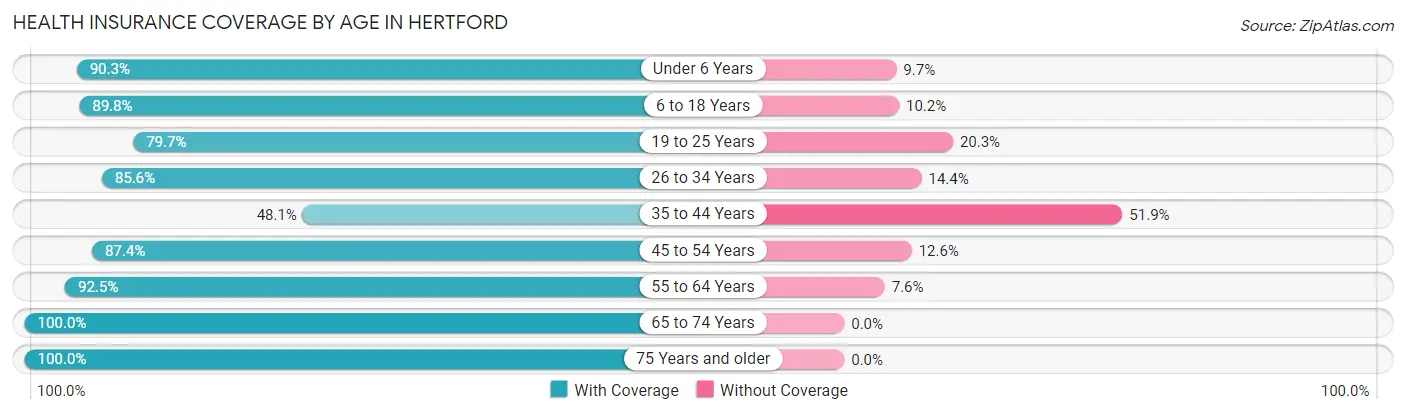
| Age Bracket | With Coverage | Without Coverage |
| Under 6 Years | 195 (90.3%) | 21 (9.7%) |
| 6 to 18 Years | 211 (89.8%) | 24 (10.2%) |
| 19 to 25 Years | 122 (79.7%) | 31 (20.3%) |
| 26 to 34 Years | 190 (85.6%) | 32 (14.4%) |
| 35 to 44 Years | 168 (48.1%) | 181 (51.9%) |
| 45 to 54 Years | 146 (87.4%) | 21 (12.6%) |
| 55 to 64 Years | 245 (92.4%) | 20 (7.5%) |
| 65 to 74 Years | 224 (100.0%) | 0 (0.0%) |
| 75 Years and older | 181 (100.0%) | 0 (0.0%) |
| Total | 1,682 (83.6%) | 330 (16.4%) |
Health Insurance Coverage by Citizenship Status in Hertford
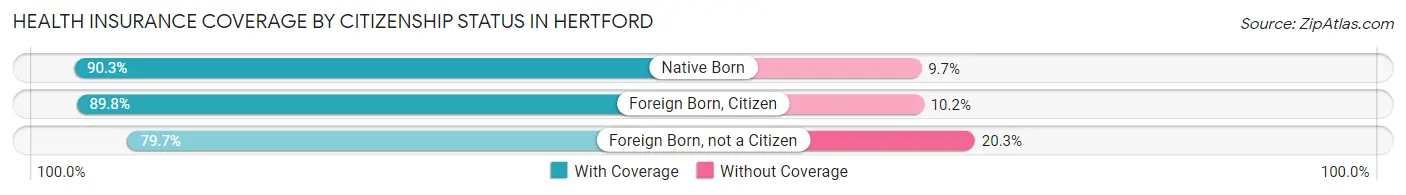
| Citizenship Status | With Coverage | Without Coverage |
| Native Born | 195 (90.3%) | 21 (9.7%) |
| Foreign Born, Citizen | 211 (89.8%) | 24 (10.2%) |
| Foreign Born, not a Citizen | 122 (79.7%) | 31 (20.3%) |
Health Insurance Coverage by Household Income in Hertford
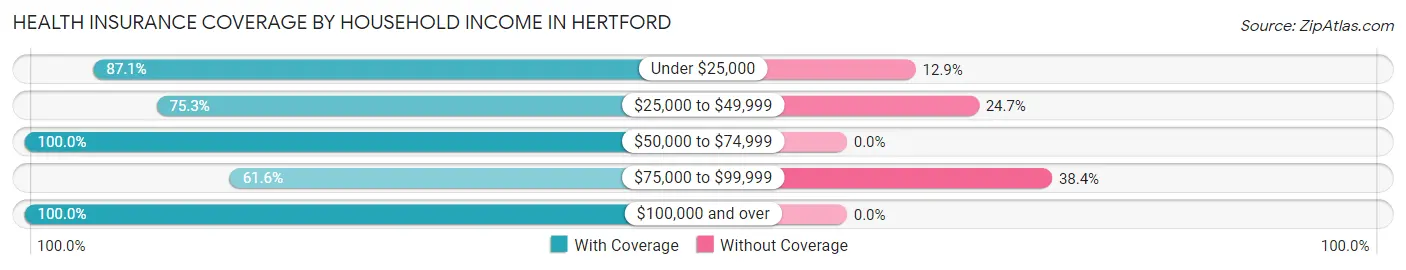
| Household Income | With Coverage | Without Coverage |
| Under $25,000 | 446 (87.1%) | 66 (12.9%) |
| $25,000 to $49,999 | 329 (75.3%) | 108 (24.7%) |
| $50,000 to $74,999 | 257 (100.0%) | 0 (0.0%) |
| $75,000 to $99,999 | 245 (61.6%) | 153 (38.4%) |
| $100,000 and over | 363 (100.0%) | 0 (0.0%) |
Public vs Private Health Insurance Coverage by Age in Hertford
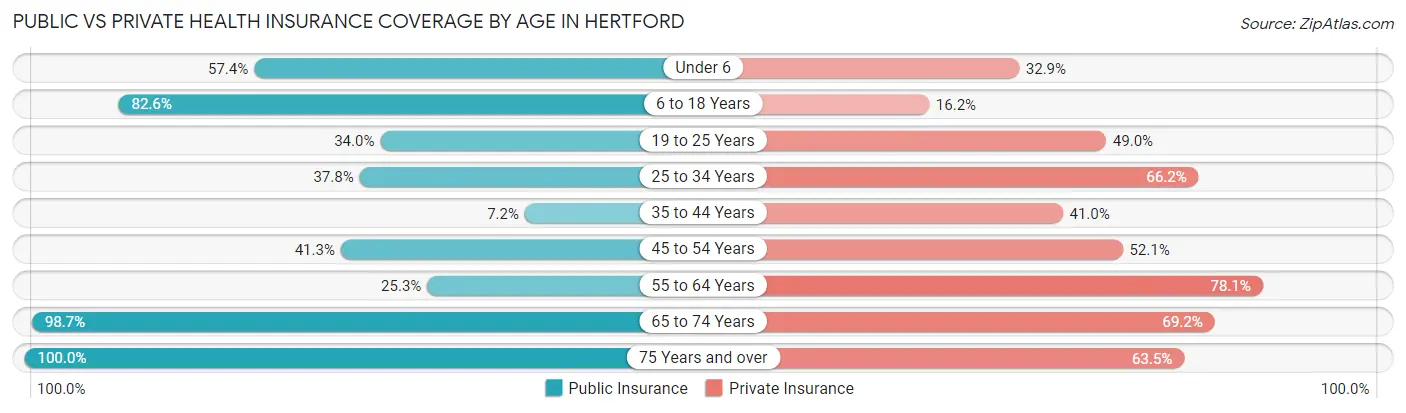
| Age Bracket | Public Insurance | Private Insurance |
| Under 6 | 124 (57.4%) | 71 (32.9%) |
| 6 to 18 Years | 194 (82.6%) | 38 (16.2%) |
| 19 to 25 Years | 52 (34.0%) | 75 (49.0%) |
| 25 to 34 Years | 84 (37.8%) | 147 (66.2%) |
| 35 to 44 Years | 25 (7.2%) | 143 (41.0%) |
| 45 to 54 Years | 69 (41.3%) | 87 (52.1%) |
| 55 to 64 Years | 67 (25.3%) | 207 (78.1%) |
| 65 to 74 Years | 221 (98.7%) | 155 (69.2%) |
| 75 Years and over | 181 (100.0%) | 115 (63.5%) |
| Total | 1,017 (50.5%) | 1,038 (51.6%) |
Disability Status by Sex by Age in Hertford
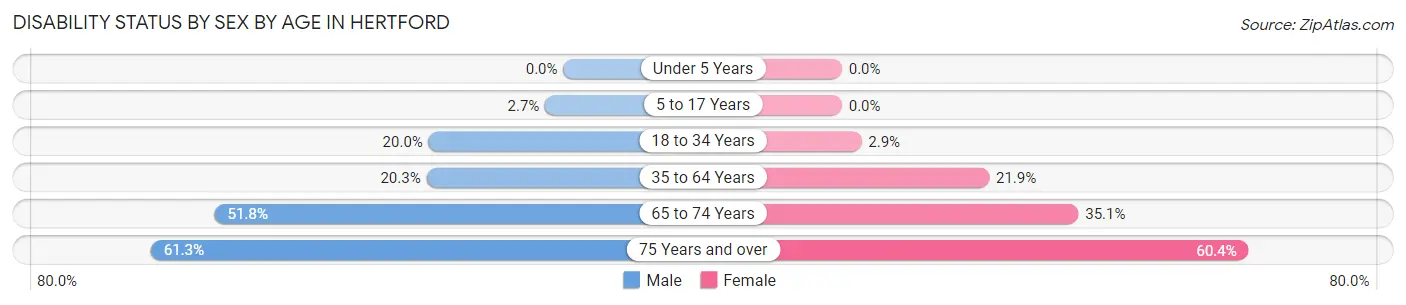
| Age Bracket | Male | Female |
| Under 5 Years | 0 (0.0%) | 0 (0.0%) |
| 5 to 17 Years | 3 (2.7%) | 0 (0.0%) |
| 18 to 34 Years | 29 (20.0%) | 7 (2.9%) |
| 35 to 64 Years | 89 (20.3%) | 75 (21.9%) |
| 65 to 74 Years | 29 (51.8%) | 59 (35.1%) |
| 75 Years and over | 49 (61.3%) | 61 (60.4%) |
Disability Class by Sex by Age in Hertford
Disability Class: Hearing Difficulty
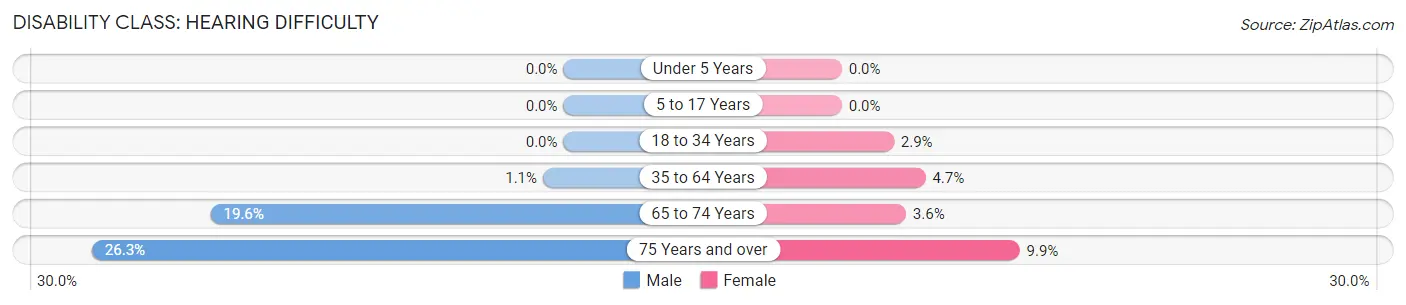
| Age Bracket | Male | Female |
| Under 5 Years | 0 (0.0%) | 0 (0.0%) |
| 5 to 17 Years | 0 (0.0%) | 0 (0.0%) |
| 18 to 34 Years | 0 (0.0%) | 7 (2.9%) |
| 35 to 64 Years | 5 (1.1%) | 16 (4.7%) |
| 65 to 74 Years | 11 (19.6%) | 6 (3.6%) |
| 75 Years and over | 21 (26.3%) | 10 (9.9%) |
Disability Class: Vision Difficulty
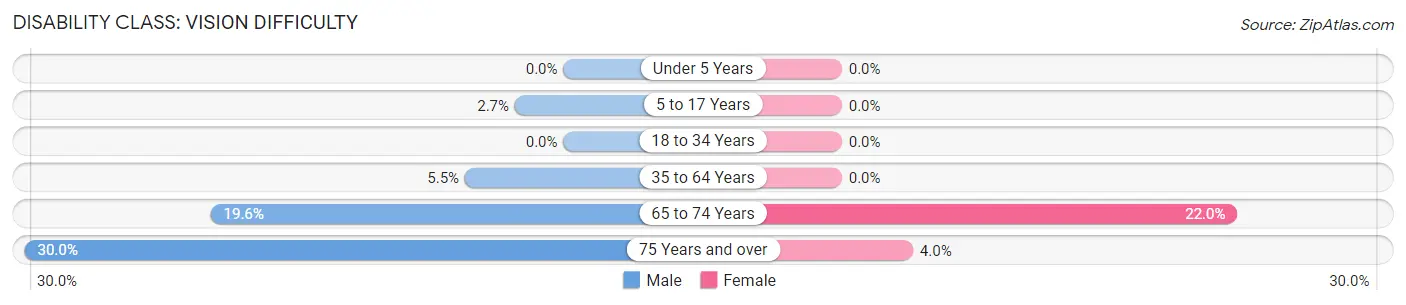
| Age Bracket | Male | Female |
| Under 5 Years | 0 (0.0%) | 0 (0.0%) |
| 5 to 17 Years | 3 (2.7%) | 0 (0.0%) |
| 18 to 34 Years | 0 (0.0%) | 0 (0.0%) |
| 35 to 64 Years | 24 (5.5%) | 0 (0.0%) |
| 65 to 74 Years | 11 (19.6%) | 37 (22.0%) |
| 75 Years and over | 24 (30.0%) | 4 (4.0%) |
Disability Class: Cognitive Difficulty
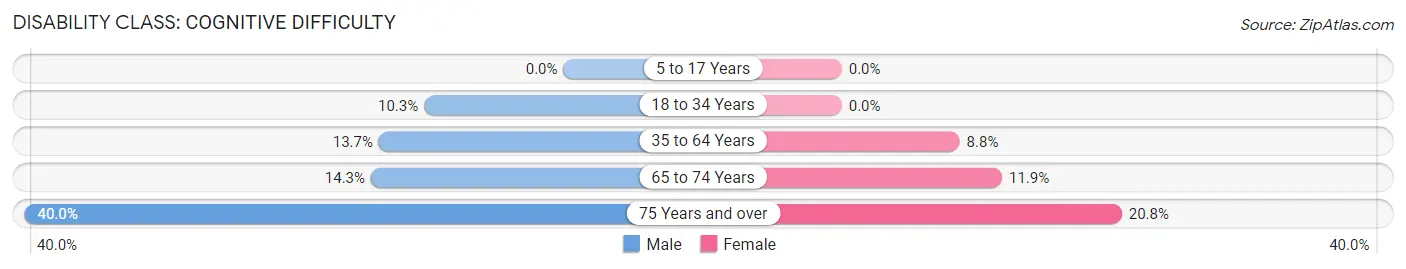
| Age Bracket | Male | Female |
| 5 to 17 Years | 0 (0.0%) | 0 (0.0%) |
| 18 to 34 Years | 15 (10.3%) | 0 (0.0%) |
| 35 to 64 Years | 60 (13.7%) | 30 (8.7%) |
| 65 to 74 Years | 8 (14.3%) | 20 (11.9%) |
| 75 Years and over | 32 (40.0%) | 21 (20.8%) |
Disability Class: Ambulatory Difficulty
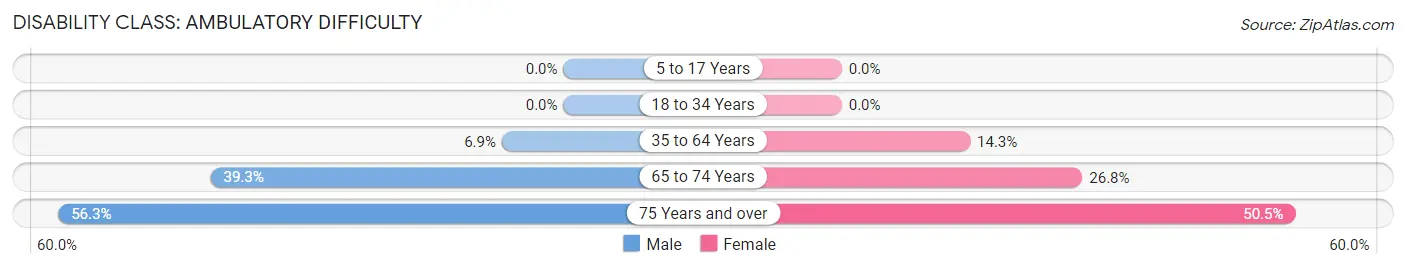
| Age Bracket | Male | Female |
| 5 to 17 Years | 0 (0.0%) | 0 (0.0%) |
| 18 to 34 Years | 0 (0.0%) | 0 (0.0%) |
| 35 to 64 Years | 30 (6.9%) | 49 (14.3%) |
| 65 to 74 Years | 22 (39.3%) | 45 (26.8%) |
| 75 Years and over | 45 (56.2%) | 51 (50.5%) |
Disability Class: Self-Care Difficulty
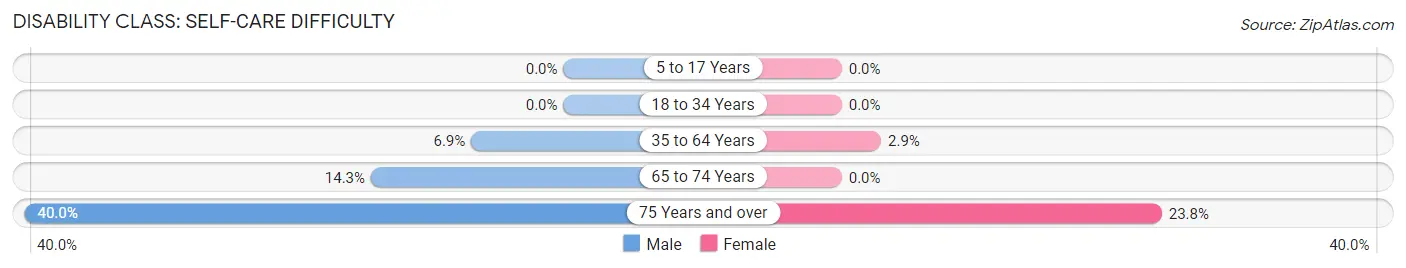
| Age Bracket | Male | Female |
| 5 to 17 Years | 0 (0.0%) | 0 (0.0%) |
| 18 to 34 Years | 0 (0.0%) | 0 (0.0%) |
| 35 to 64 Years | 30 (6.9%) | 10 (2.9%) |
| 65 to 74 Years | 8 (14.3%) | 0 (0.0%) |
| 75 Years and over | 32 (40.0%) | 24 (23.8%) |
Technology Access in Hertford
Computing Device Access in Hertford
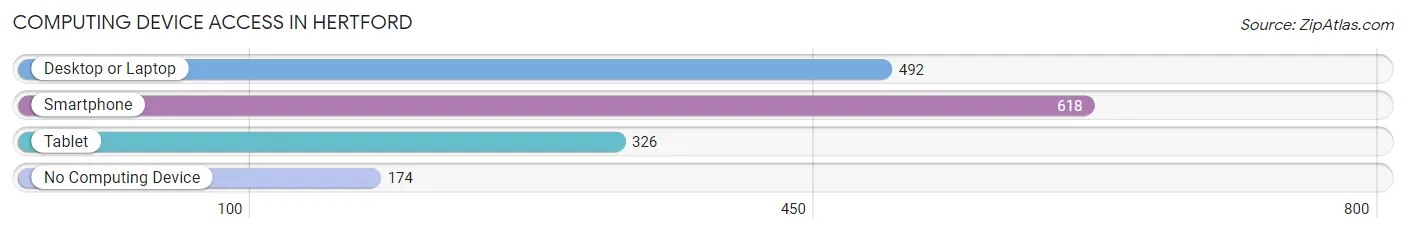
| Device Type | # Households | % Households |
| Desktop or Laptop | 492 | 59.0% |
| Smartphone | 618 | 74.1% |
| Tablet | 326 | 39.1% |
| No Computing Device | 174 | 20.9% |
| Total | 834 | 100.0% |
Internet Access in Hertford
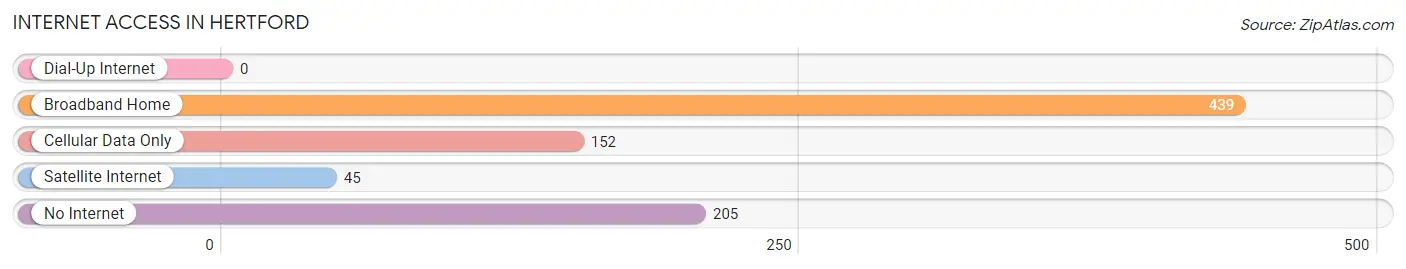
| Internet Type | # Households | % Households |
| Dial-Up Internet | 0 | 0.0% |
| Broadband Home | 439 | 52.6% |
| Cellular Data Only | 152 | 18.2% |
| Satellite Internet | 45 | 5.4% |
| No Internet | 205 | 24.6% |
| Total | 834 | 100.0% |
Hertford Summary
Hertford is a small town located in Perquimans County, North Carolina. It is situated on the banks of the Perquimans River, about 40 miles south of Norfolk, Virginia. The town has a population of 2,143 as of the 2010 census.
History
Hertford was founded in 1758 by a group of Quakers from Nansemond County, Virginia. The town was named after the Earl of Hertford, who was a patron of the Quakers. The town was incorporated in 1759 and was the county seat of Perquimans County until 1776. During the American Revolution, the town was the site of a major battle between the British and American forces.
In the 19th century, Hertford was a major port for the export of naval stores, such as tar, pitch, and turpentine. The town was also a major center for shipbuilding. The town was home to several shipyards, including the Perquimans Shipyard, which built the USS Monitor, the first ironclad warship.
Geography
Hertford is located in the northeastern corner of North Carolina, on the banks of the Perquimans River. The town is situated at an elevation of 16 feet above sea level. The town is located about 40 miles south of Norfolk, Virginia, and about 60 miles east of Raleigh, North Carolina.
The town is located in a humid subtropical climate zone, with hot, humid summers and mild winters. The average annual temperature is around 68 degrees Fahrenheit. The average annual precipitation is around 45 inches.
Economy
Hertford’s economy is largely based on agriculture and tourism. The town is home to several farms, which produce a variety of crops, including corn, soybeans, wheat, and cotton. The town is also home to several seafood processing plants, which process local seafood, such as oysters, clams, and shrimp.
The town is also a popular tourist destination, with several historic sites, such as the Perquimans County Courthouse, the Perquimans County Jail, and the Perquimans County Museum. The town is also home to several festivals, such as the Hertford Waterfowl Festival and the Hertford County Fair.
Demographics
As of the 2010 census, Hertford had a population of 2,143. The racial makeup of the town was 79.3% White, 17.2% African American, 0.7% Native American, 0.3% Asian, 0.1% Pacific Islander, and 2.4% from other races. The median household income was $30,938, and the median family income was $37,917. The per capita income was $17,845.
Conclusion
Hertford is a small town located in Perquimans County, North Carolina. It was founded in 1758 by a group of Quakers and was the county seat of Perquimans County until 1776. The town is situated on the banks of the Perquimans River and is home to several farms and seafood processing plants. The town is also a popular tourist destination, with several historic sites and festivals. As of the 2010 census, Hertford had a population of 2,143, with a median household income of $30,938.
Common Questions
What is Per Capita Income in Hertford?
Per Capita income in Hertford is $27,163.
What is the Median Family Income in Hertford?
Median Family Income in Hertford is $55,833.
What is the Median Household income in Hertford?
Median Household Income in Hertford is $43,696.
What is Income or Wage Gap in Hertford?
Income or Wage Gap in Hertford is 33.3%.
Women in Hertford earn 66.7 cents for every dollar earned by a man.
What is Inequality or Gini Index in Hertford?
Inequality or Gini Index in Hertford is 0.43.
What is the Total Population of Hertford?
Total Population of Hertford is 2,045.
What is the Total Male Population of Hertford?
Total Male Population of Hertford is 866.
What is the Total Female Population of Hertford?
Total Female Population of Hertford is 1,179.
What is the Ratio of Males per 100 Females in Hertford?
There are 73.45 Males per 100 Females in Hertford.
What is the Ratio of Females per 100 Males in Hertford?
There are 136.14 Females per 100 Males in Hertford.
What is the Median Population Age in Hertford?
Median Population Age in Hertford is 43.0 Years.
What is the Average Family Size in Hertford
Average Family Size in Hertford is 3.1 People.
What is the Average Household Size in Hertford
Average Household Size in Hertford is 2.4 People.
How Large is the Labor Force in Hertford?
There are 944 People in the Labor Forcein in Hertford.
What is the Percentage of People in the Labor Force in Hertford?
57.2% of People are in the Labor Force in Hertford.
What is the Unemployment Rate in Hertford?
Unemployment Rate in Hertford is 13.3%.