Madison, NC Map & Demographics
Madison Map
Madison Overview
$29,806
PER CAPITA INCOME
$61,613
AVG FAMILY INCOME
$51,150
AVG HOUSEHOLD INCOME
5.4%
WAGE / INCOME GAP [ % ]
94.6¢/ $1
WAGE / INCOME GAP [ $ ]
0.41
INEQUALITY / GINI INDEX
2,185
TOTAL POPULATION
1,068
MALE POPULATION
1,117
FEMALE POPULATION
95.61
MALES / 100 FEMALES
104.59
FEMALES / 100 MALES
47.7
MEDIAN AGE
2.9
AVG FAMILY SIZE
2.1
AVG HOUSEHOLD SIZE
1,119
LABOR FORCE [ PEOPLE ]
59.1%
PERCENT IN LABOR FORCE
7.6%
UNEMPLOYMENT RATE
Madison Zip Codes
Madison Area Codes
Income in Madison
Income Overview in Madison
Per Capita Income in Madison is $29,806, while median incomes of families and households are $61,613 and $51,150 respectively.
| Characteristic | Number | Measure |
| Per Capita Income | 2,185 | $29,806 |
| Median Family Income | 572 | $61,613 |
| Mean Family Income | 572 | $72,799 |
| Median Household Income | 1,013 | $51,150 |
| Mean Household Income | 1,013 | $62,477 |
| Income Deficit | 572 | $0 |
| Wage / Income Gap (%) | 2,185 | 5.42% |
| Wage / Income Gap ($) | 2,185 | 94.58¢ per $1 |
| Gini / Inequality Index | 2,185 | 0.41 |
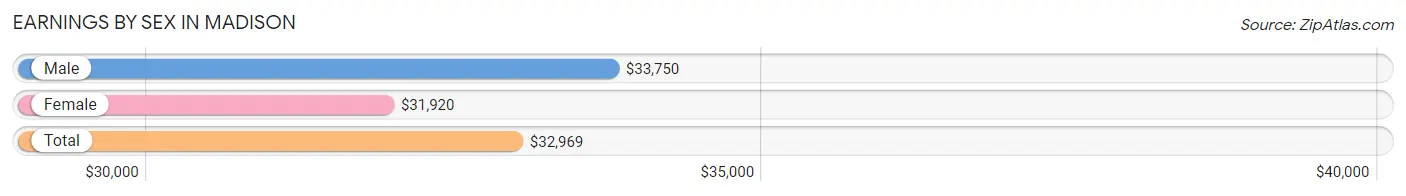
Earnings by Sex in Madison
Average Earnings in Madison are $32,969, $33,750 for men and $31,920 for women, a difference of 5.4%.
| Sex | Number | Average Earnings |
| Male | 699 (57.8%) | $33,750 |
| Female | 511 (42.2%) | $31,920 |
| Total | 1,210 (100.0%) | $32,969 |
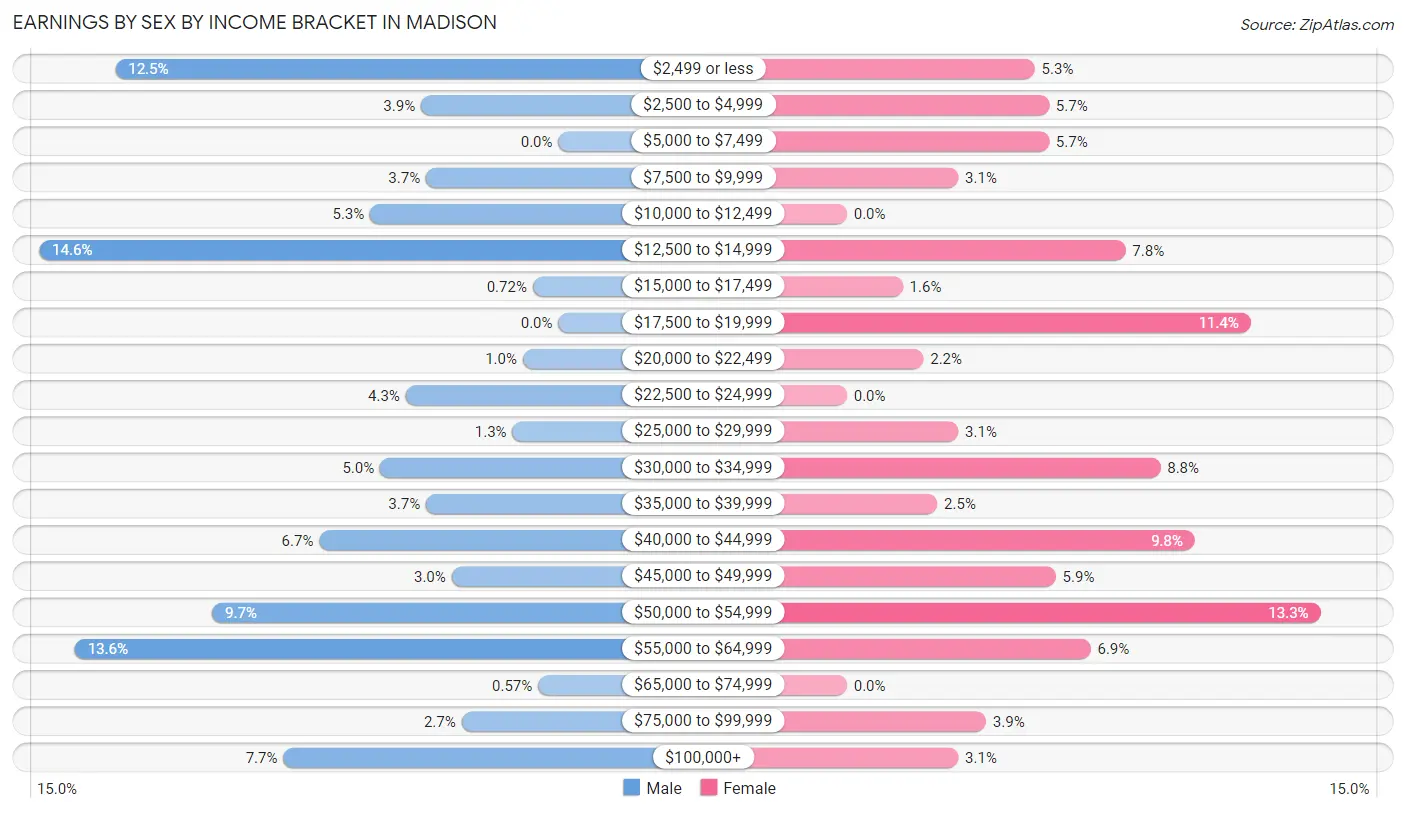
Earnings by Sex by Income Bracket in Madison
The most common earnings brackets in Madison are $12,500 to $14,999 for men (102 | 14.6%) and $50,000 to $54,999 for women (68 | 13.3%).
| Income | Male | Female |
| $2,499 or less | 87 (12.4%) | 27 (5.3%) |
| $2,500 to $4,999 | 27 (3.9%) | 29 (5.7%) |
| $5,000 to $7,499 | 0 (0.0%) | 29 (5.7%) |
| $7,500 to $9,999 | 26 (3.7%) | 16 (3.1%) |
| $10,000 to $12,499 | 37 (5.3%) | 0 (0.0%) |
| $12,500 to $14,999 | 102 (14.6%) | 40 (7.8%) |
| $15,000 to $17,499 | 5 (0.7%) | 8 (1.6%) |
| $17,500 to $19,999 | 0 (0.0%) | 58 (11.4%) |
| $20,000 to $22,499 | 7 (1.0%) | 11 (2.1%) |
| $22,500 to $24,999 | 30 (4.3%) | 0 (0.0%) |
| $25,000 to $29,999 | 9 (1.3%) | 16 (3.1%) |
| $30,000 to $34,999 | 35 (5.0%) | 45 (8.8%) |
| $35,000 to $39,999 | 26 (3.7%) | 13 (2.5%) |
| $40,000 to $44,999 | 47 (6.7%) | 50 (9.8%) |
| $45,000 to $49,999 | 21 (3.0%) | 30 (5.9%) |
| $50,000 to $54,999 | 68 (9.7%) | 68 (13.3%) |
| $55,000 to $64,999 | 95 (13.6%) | 35 (6.9%) |
| $65,000 to $74,999 | 4 (0.6%) | 0 (0.0%) |
| $75,000 to $99,999 | 19 (2.7%) | 20 (3.9%) |
| $100,000+ | 54 (7.7%) | 16 (3.1%) |
| Total | 699 (100.0%) | 511 (100.0%) |
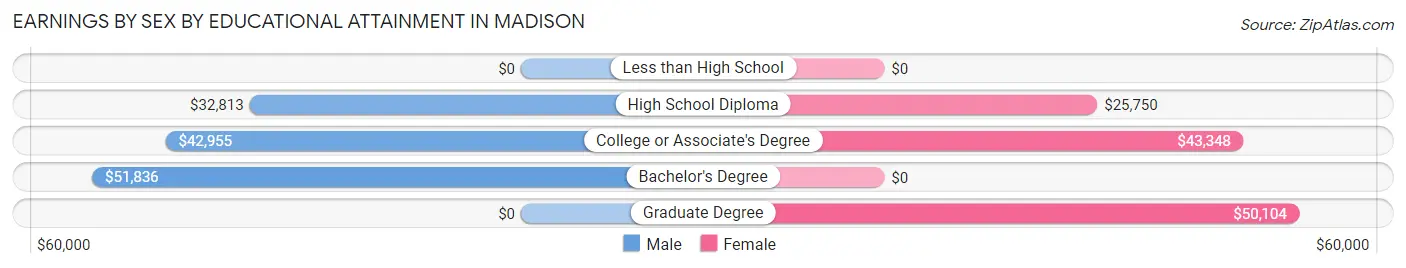
Earnings by Sex by Educational Attainment in Madison
Average earnings in Madison are $40,833 for men and $33,971 for women, a difference of 16.8%. Men with an educational attainment of bachelor's degree enjoy the highest average annual earnings of $51,836, while those with high school diploma education earn the least with $32,813. Women with an educational attainment of graduate degree earn the most with the average annual earnings of $50,104, while those with high school diploma education have the smallest earnings of $25,750.
| Educational Attainment | Male Income | Female Income |
| Less than High School | - | - |
| High School Diploma | $32,813 | $25,750 |
| College or Associate's Degree | $42,955 | $43,348 |
| Bachelor's Degree | $51,836 | $0 |
| Graduate Degree | - | - |
| Total | $40,833 | $33,971 |
Family Income in Madison
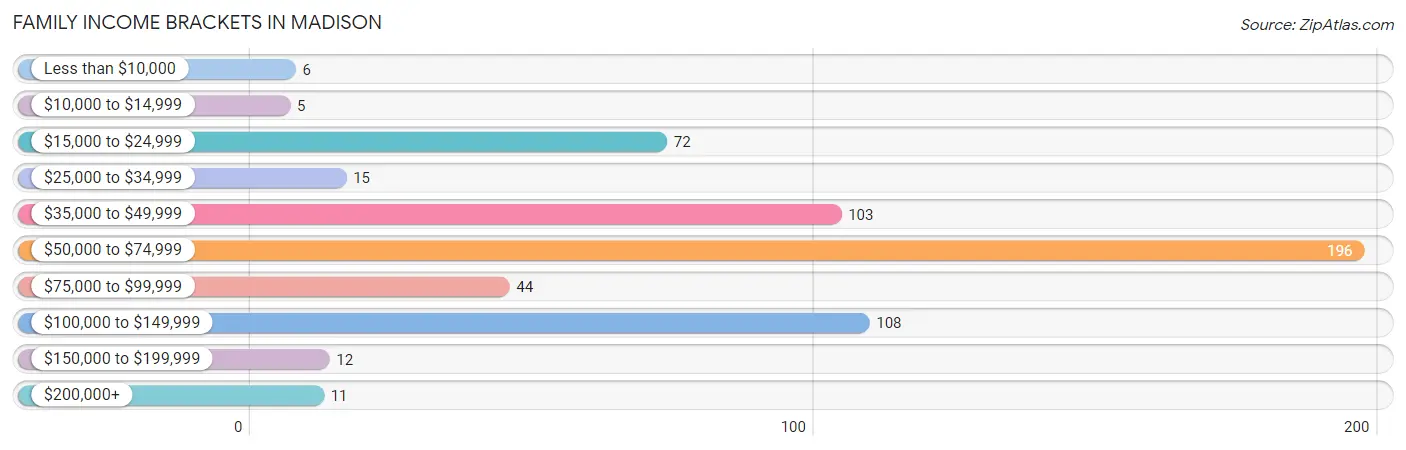
Family Income Brackets in Madison
According to the Madison family income data, there are 196 families falling into the $50,000 to $74,999 income range, which is the most common income bracket and makes up 34.3% of all families. Conversely, the $10,000 to $14,999 income bracket is the least frequent group with only 5 families (0.9%) belonging to this category.
| Income Bracket | # Families | % Families |
| Less than $10,000 | 6 | 1.0% |
| $10,000 to $14,999 | 5 | 0.9% |
| $15,000 to $24,999 | 72 | 12.6% |
| $25,000 to $34,999 | 15 | 2.6% |
| $35,000 to $49,999 | 103 | 18.0% |
| $50,000 to $74,999 | 196 | 34.3% |
| $75,000 to $99,999 | 44 | 7.7% |
| $100,000 to $149,999 | 108 | 18.9% |
| $150,000 to $199,999 | 12 | 2.1% |
| $200,000+ | 11 | 1.9% |
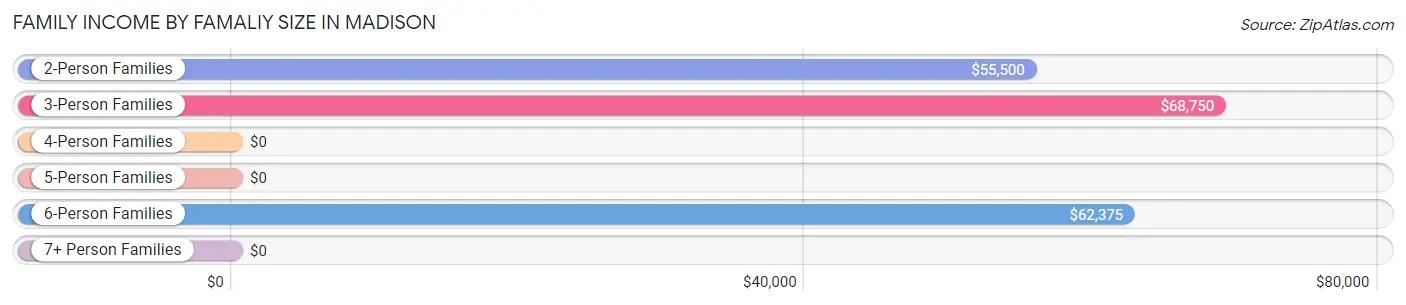
Family Income by Famaliy Size in Madison
3-person families (136 | 23.8%) account for the highest median family income in Madison with $68,750 per family, while 2-person families (312 | 54.5%) have the highest median income of $27,750 per family member.
| Income Bracket | # Families | Median Income |
| 2-Person Families | 312 (54.5%) | $55,500 |
| 3-Person Families | 136 (23.8%) | $68,750 |
| 4-Person Families | 76 (13.3%) | $0 |
| 5-Person Families | 6 (1.1%) | $0 |
| 6-Person Families | 33 (5.8%) | $62,375 |
| 7+ Person Families | 9 (1.6%) | $0 |
| Total | 572 (100.0%) | $61,613 |
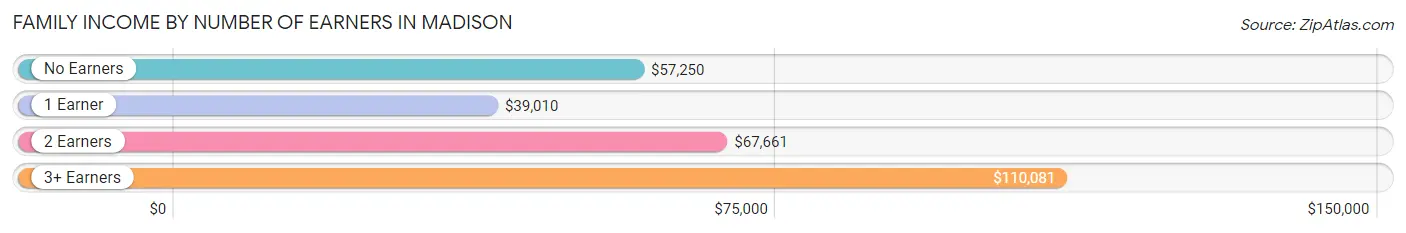
Family Income by Number of Earners in Madison
The median family income in Madison is $61,613, with families comprising 3+ earners (60) having the highest median family income of $110,081, while families with 1 earner (203) have the lowest median family income of $39,010, accounting for 10.5% and 35.5% of families, respectively.
| Number of Earners | # Families | Median Income |
| No Earners | 85 (14.9%) | $57,250 |
| 1 Earner | 203 (35.5%) | $39,010 |
| 2 Earners | 224 (39.2%) | $67,661 |
| 3+ Earners | 60 (10.5%) | $110,081 |
| Total | 572 (100.0%) | $61,613 |
Household Income in Madison
Household Income Brackets in Madison
With 263 households falling in the category, the $50,000 to $74,999 income range is the most frequent in Madison, accounting for 26.0% of all households. In contrast, only 16 households (1.6%) fall into the $150,000 to $199,999 income bracket, making it the least populous group.

| Income Bracket | # Households | % Households |
| Less than $10,000 | 62 | 6.1% |
| $10,000 to $14,999 | 49 | 4.8% |
| $15,000 to $24,999 | 112 | 11.1% |
| $25,000 to $34,999 | 66 | 6.5% |
| $35,000 to $49,999 | 206 | 20.3% |
| $50,000 to $74,999 | 263 | 26.0% |
| $75,000 to $99,999 | 83 | 8.2% |
| $100,000 to $149,999 | 132 | 13.0% |
| $150,000 to $199,999 | 16 | 1.6% |
| $200,000+ | 24 | 2.4% |
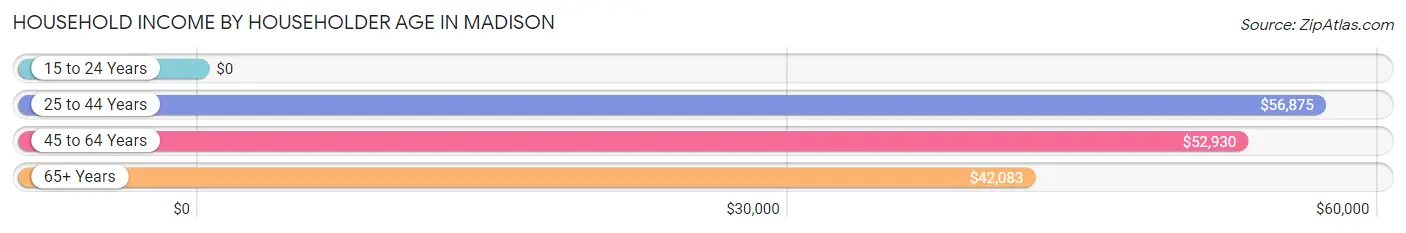
Household Income by Householder Age in Madison
The median household income in Madison is $51,150, with the highest median household income of $56,875 found in the 25 to 44 years age bracket for the primary householder. A total of 203 households (20.0%) fall into this category. Meanwhile, the 15 to 24 years age bracket for the primary householder has the lowest median household income of $0, with 23 households (2.3%) in this group.
| Income Bracket | # Households | Median Income |
| 15 to 24 Years | 23 (2.3%) | $0 |
| 25 to 44 Years | 203 (20.0%) | $56,875 |
| 45 to 64 Years | 491 (48.5%) | $52,930 |
| 65+ Years | 296 (29.2%) | $42,083 |
| Total | 1,013 (100.0%) | $51,150 |
Poverty in Madison
Income Below Poverty by Sex and Age in Madison
With 10.7% poverty level for males and 9.9% for females among the residents of Madison, 5 year old males and 75 year old and over females are the most vulnerable to poverty, with 11 males (78.6%) and 31 females (21.8%) in their respective age groups living below the poverty level.
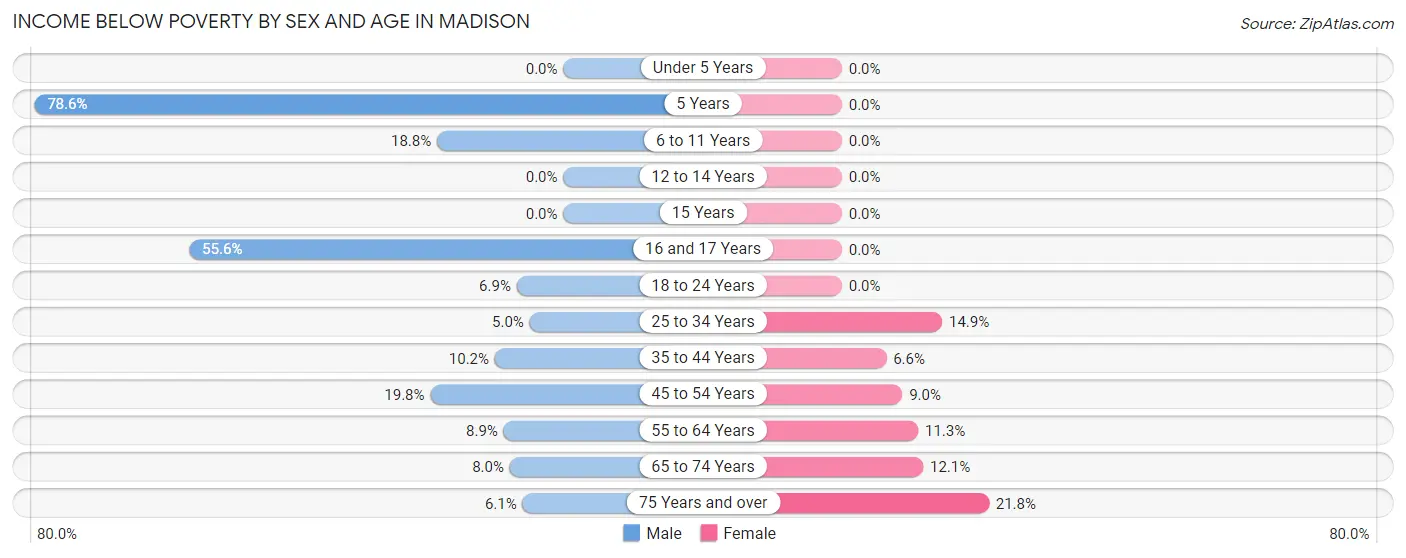
| Age Bracket | Male | Female |
| Under 5 Years | 0 (0.0%) | 0 (0.0%) |
| 5 Years | 11 (78.6%) | 0 (0.0%) |
| 6 to 11 Years | 9 (18.8%) | 0 (0.0%) |
| 12 to 14 Years | 0 (0.0%) | 0 (0.0%) |
| 15 Years | 0 (0.0%) | 0 (0.0%) |
| 16 and 17 Years | 5 (55.6%) | 0 (0.0%) |
| 18 to 24 Years | 11 (6.9%) | 0 (0.0%) |
| 25 to 34 Years | 7 (5.0%) | 14 (14.9%) |
| 35 to 44 Years | 12 (10.2%) | 7 (6.6%) |
| 45 to 54 Years | 32 (19.8%) | 14 (9.0%) |
| 55 to 64 Years | 14 (8.9%) | 30 (11.3%) |
| 65 to 74 Years | 7 (8.0%) | 14 (12.1%) |
| 75 Years and over | 6 (6.1%) | 31 (21.8%) |
| Total | 114 (10.7%) | 110 (9.9%) |
Income Above Poverty by Sex and Age in Madison
According to the poverty statistics in Madison, males aged under 5 years and females aged under 5 years are the age groups that are most secure financially, with 100.0% of males and 100.0% of females in these age groups living above the poverty line.
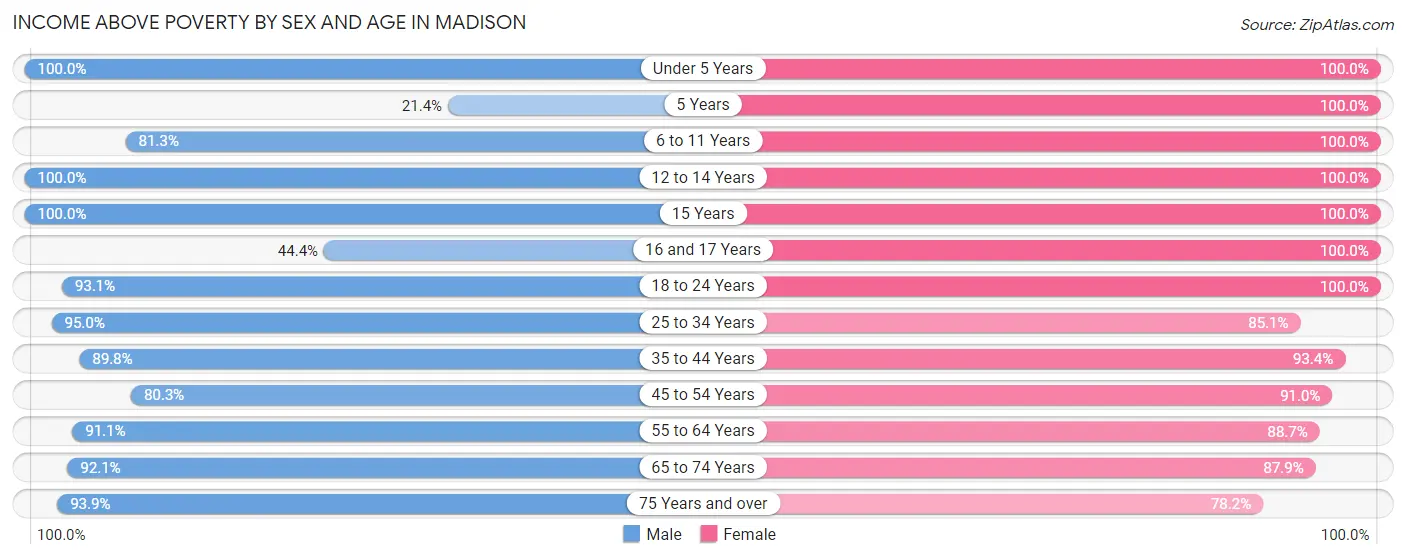
| Age Bracket | Male | Female |
| Under 5 Years | 20 (100.0%) | 50 (100.0%) |
| 5 Years | 3 (21.4%) | 30 (100.0%) |
| 6 to 11 Years | 39 (81.2%) | 57 (100.0%) |
| 12 to 14 Years | 44 (100.0%) | 15 (100.0%) |
| 15 Years | 9 (100.0%) | 4 (100.0%) |
| 16 and 17 Years | 4 (44.4%) | 27 (100.0%) |
| 18 to 24 Years | 148 (93.1%) | 55 (100.0%) |
| 25 to 34 Years | 133 (95.0%) | 80 (85.1%) |
| 35 to 44 Years | 106 (89.8%) | 99 (93.4%) |
| 45 to 54 Years | 130 (80.2%) | 142 (91.0%) |
| 55 to 64 Years | 144 (91.1%) | 235 (88.7%) |
| 65 to 74 Years | 81 (92.0%) | 102 (87.9%) |
| 75 Years and over | 93 (93.9%) | 111 (78.2%) |
| Total | 954 (89.3%) | 1,007 (90.1%) |
Income Below Poverty Among Married-Couple Families in Madison
The poverty statistics for married-couple families in Madison show that 3.6% or 15 of the total 411 families live below the poverty line. Families with 3 or 4 children have the highest poverty rate of 34.6%, comprising of 9 families. On the other hand, families with 1 or 2 children have the lowest poverty rate of 0.0%, which includes 0 families.
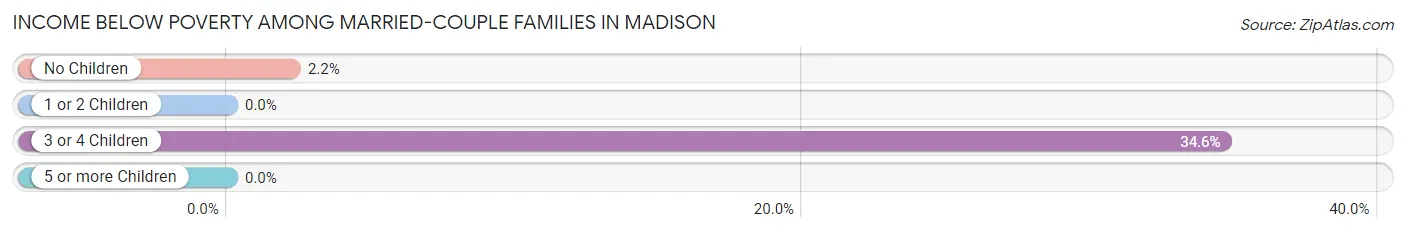
| Children | Above Poverty | Below Poverty |
| No Children | 268 (97.8%) | 6 (2.2%) |
| 1 or 2 Children | 111 (100.0%) | 0 (0.0%) |
| 3 or 4 Children | 17 (65.4%) | 9 (34.6%) |
| 5 or more Children | 0 (0.0%) | 0 (0.0%) |
| Total | 396 (96.4%) | 15 (3.6%) |
Income Below Poverty Among Single-Parent Households in Madison
According to the poverty data in Madison, 2.3% or 1 single-father households and 11.1% or 13 single-mother households are living below the poverty line. Among single-father households, those with no children have the highest poverty rate, with 1 households (5.9%) experiencing poverty. Likewise, among single-mother households, those with 1 or 2 children have the highest poverty rate, with 9 households (26.5%) falling below the poverty line.
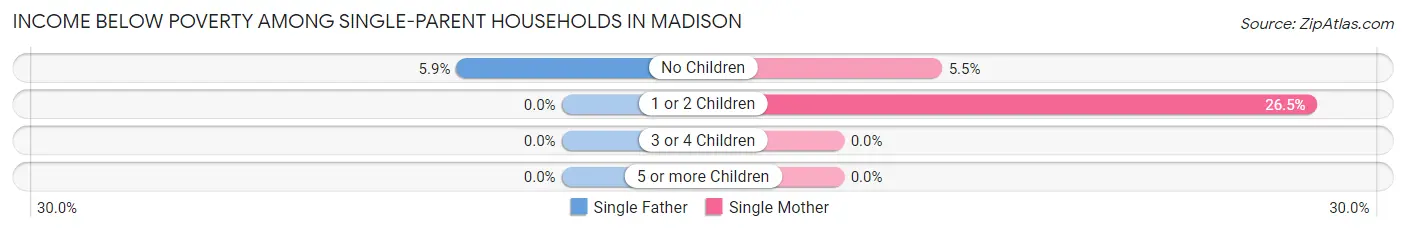
| Children | Single Father | Single Mother |
| No Children | 1 (5.9%) | 4 (5.5%) |
| 1 or 2 Children | 0 (0.0%) | 9 (26.5%) |
| 3 or 4 Children | 0 (0.0%) | 0 (0.0%) |
| 5 or more Children | 0 (0.0%) | 0 (0.0%) |
| Total | 1 (2.3%) | 13 (11.1%) |
Income Below Poverty Among Married-Couple vs Single-Parent Households in Madison
The poverty data for Madison shows that 15 of the married-couple family households (3.6%) and 14 of the single-parent households (8.7%) are living below the poverty level. Within the married-couple family households, those with 3 or 4 children have the highest poverty rate, with 9 households (34.6%) falling below the poverty line. Among the single-parent households, those with 1 or 2 children have the highest poverty rate, with 9 household (14.7%) living below poverty.
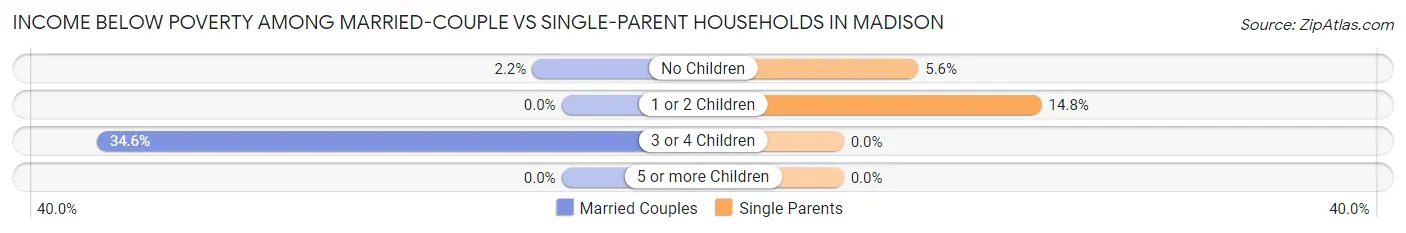
| Children | Married-Couple Families | Single-Parent Households |
| No Children | 6 (2.2%) | 5 (5.6%) |
| 1 or 2 Children | 0 (0.0%) | 9 (14.7%) |
| 3 or 4 Children | 9 (34.6%) | 0 (0.0%) |
| 5 or more Children | 0 (0.0%) | 0 (0.0%) |
| Total | 15 (3.6%) | 14 (8.7%) |
Race in Madison
The most populous races in Madison are White / Caucasian (1,537 | 70.3%), Black / African American (410 | 18.8%), and Hispanic or Latino (166 | 7.6%).
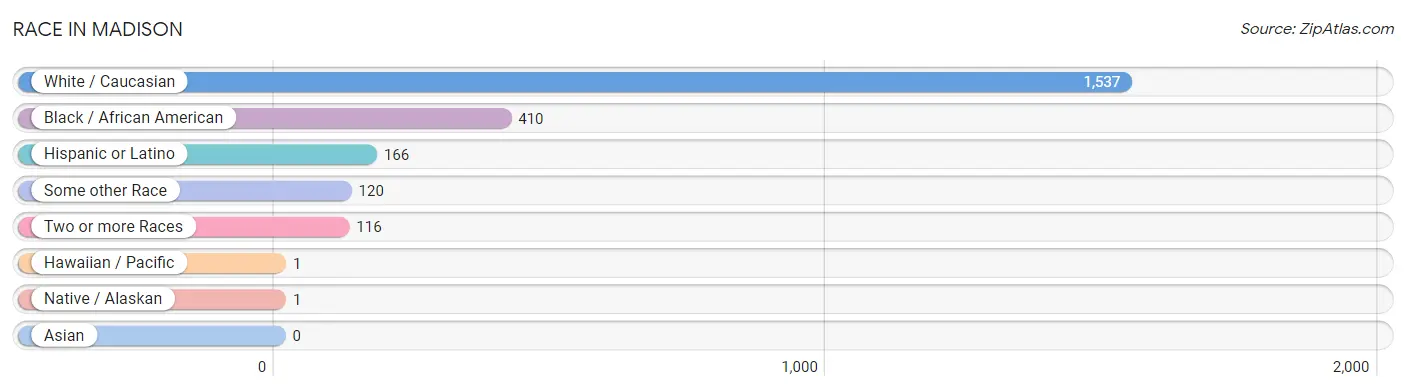
| Race | # Population | % Population |
| Asian | 0 | 0.0% |
| Black / African American | 410 | 18.8% |
| Hawaiian / Pacific | 1 | 0.1% |
| Hispanic or Latino | 166 | 7.6% |
| Native / Alaskan | 1 | 0.1% |
| White / Caucasian | 1,537 | 70.3% |
| Two or more Races | 116 | 5.3% |
| Some other Race | 120 | 5.5% |
| Total | 2,185 | 100.0% |
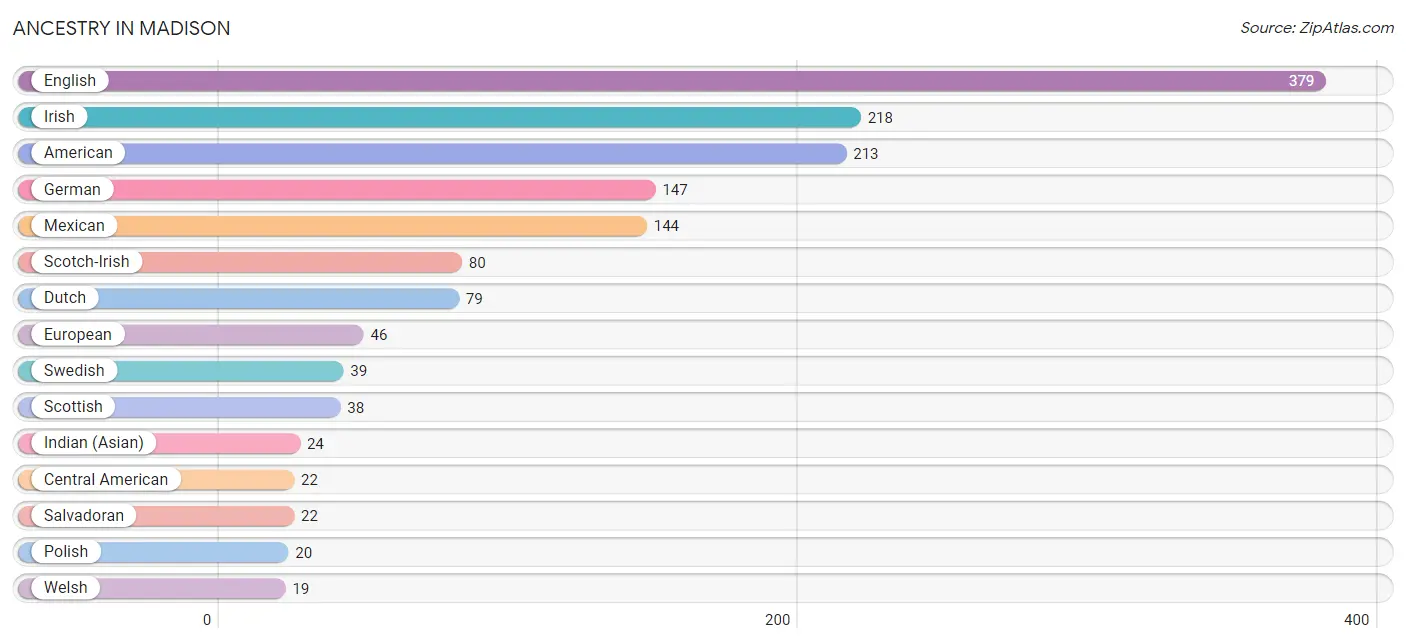
Ancestry in Madison
The most populous ancestries reported in Madison are English (379 | 17.3%), Irish (218 | 10.0%), American (213 | 9.8%), German (147 | 6.7%), and Mexican (144 | 6.6%), together accounting for 50.4% of all Madison residents.
| Ancestry | # Population | % Population |
| American | 213 | 9.8% |
| Central American | 22 | 1.0% |
| Cherokee | 16 | 0.7% |
| Dutch | 79 | 3.6% |
| English | 379 | 17.3% |
| European | 46 | 2.1% |
| French | 13 | 0.6% |
| German | 147 | 6.7% |
| Indian (Asian) | 24 | 1.1% |
| Iranian | 7 | 0.3% |
| Irish | 218 | 10.0% |
| Mexican | 144 | 6.6% |
| Native Hawaiian | 1 | 0.1% |
| Navajo | 13 | 0.6% |
| Northern European | 4 | 0.2% |
| Norwegian | 10 | 0.5% |
| Polish | 20 | 0.9% |
| Salvadoran | 22 | 1.0% |
| Scandinavian | 6 | 0.3% |
| Scotch-Irish | 80 | 3.7% |
| Scottish | 38 | 1.7% |
| Swedish | 39 | 1.8% |
| Welsh | 19 | 0.9% | View All 23 Rows |
Immigrants in Madison
The most numerous immigrant groups reported in Madison came from Central America (67 | 3.1%), Latin America (67 | 3.1%), Mexico (61 | 2.8%), El Salvador (6 | 0.3%), and Europe (6 | 0.3%), together accounting for 9.5% of all Madison residents.
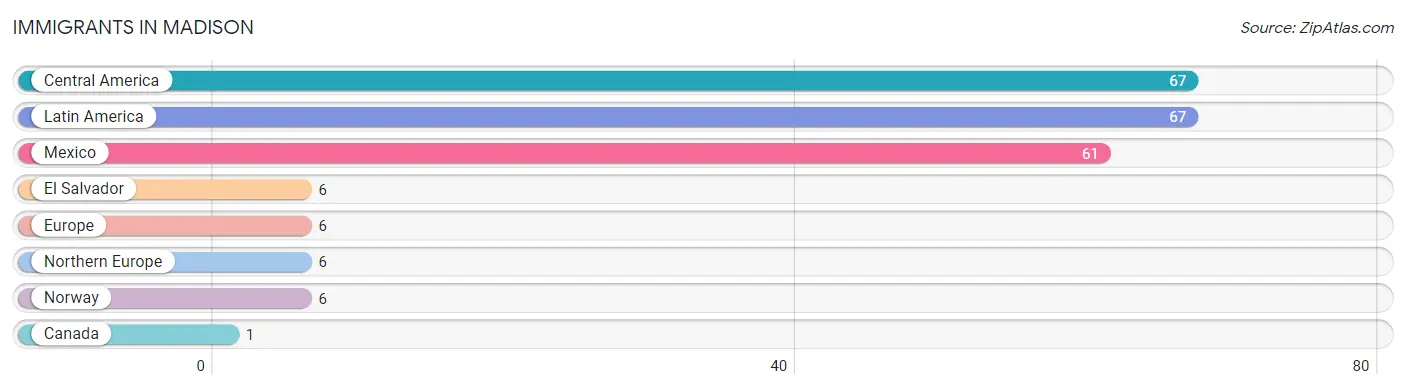
| Immigration Origin | # Population | % Population |
| Canada | 1 | 0.1% |
| Central America | 67 | 3.1% |
| El Salvador | 6 | 0.3% |
| Europe | 6 | 0.3% |
| Latin America | 67 | 3.1% |
| Mexico | 61 | 2.8% |
| Northern Europe | 6 | 0.3% |
| Norway | 6 | 0.3% | View All 8 Rows |
Sex and Age in Madison
Sex and Age in Madison
The most populous age groups in Madison are 20 to 24 Years (129 | 12.1%) for men and 55 to 59 Years (159 | 14.2%) for women.
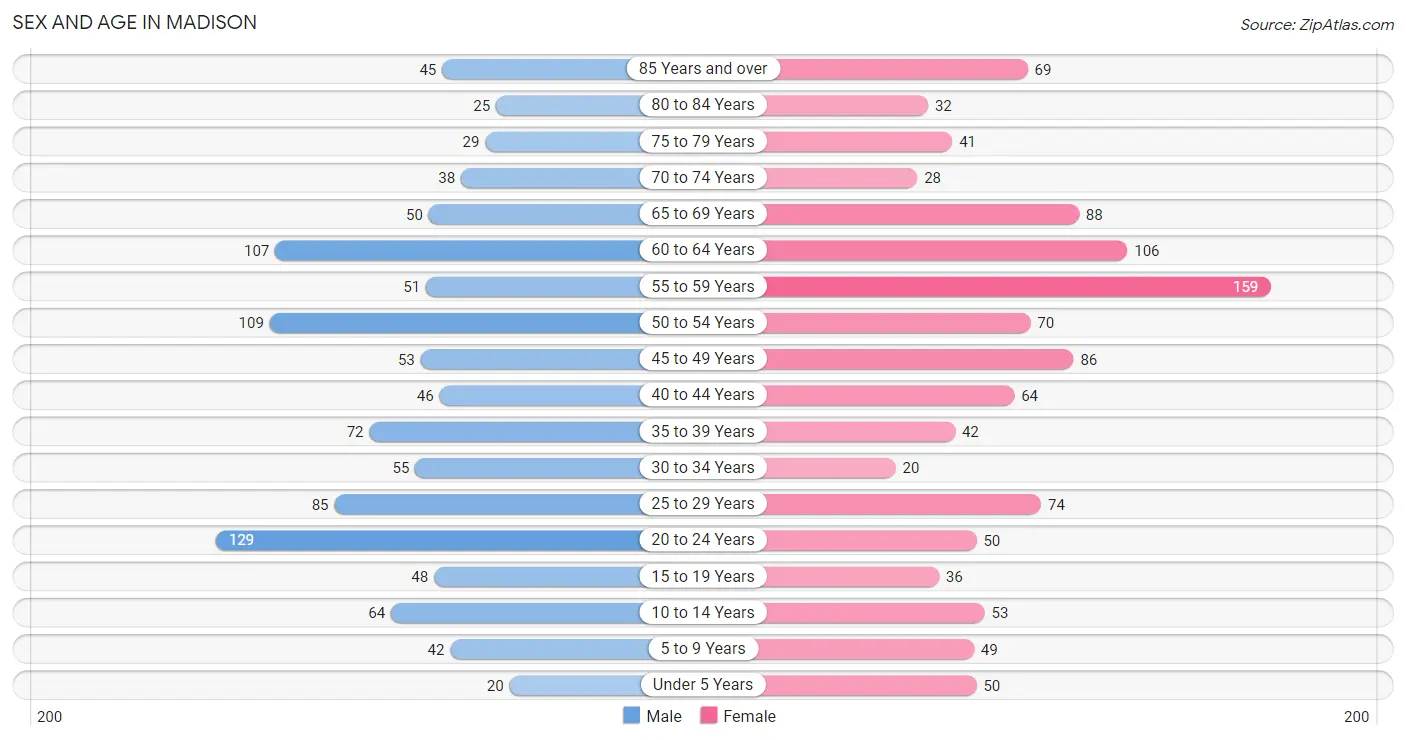
| Age Bracket | Male | Female |
| Under 5 Years | 20 (1.9%) | 50 (4.5%) |
| 5 to 9 Years | 42 (3.9%) | 49 (4.4%) |
| 10 to 14 Years | 64 (6.0%) | 53 (4.7%) |
| 15 to 19 Years | 48 (4.5%) | 36 (3.2%) |
| 20 to 24 Years | 129 (12.1%) | 50 (4.5%) |
| 25 to 29 Years | 85 (8.0%) | 74 (6.6%) |
| 30 to 34 Years | 55 (5.1%) | 20 (1.8%) |
| 35 to 39 Years | 72 (6.7%) | 42 (3.8%) |
| 40 to 44 Years | 46 (4.3%) | 64 (5.7%) |
| 45 to 49 Years | 53 (5.0%) | 86 (7.7%) |
| 50 to 54 Years | 109 (10.2%) | 70 (6.3%) |
| 55 to 59 Years | 51 (4.8%) | 159 (14.2%) |
| 60 to 64 Years | 107 (10.0%) | 106 (9.5%) |
| 65 to 69 Years | 50 (4.7%) | 88 (7.9%) |
| 70 to 74 Years | 38 (3.6%) | 28 (2.5%) |
| 75 to 79 Years | 29 (2.7%) | 41 (3.7%) |
| 80 to 84 Years | 25 (2.3%) | 32 (2.9%) |
| 85 Years and over | 45 (4.2%) | 69 (6.2%) |
| Total | 1,068 (100.0%) | 1,117 (100.0%) |
Families and Households in Madison
Median Family Size in Madison
The median family size in Madison is 2.92 persons per family, with married-couple families (411 | 71.9%) accounting for the largest median family size of 3.1 persons per family. On the other hand, single male/father families (44 | 7.7%) represent the smallest median family size with 2.05 persons per family.
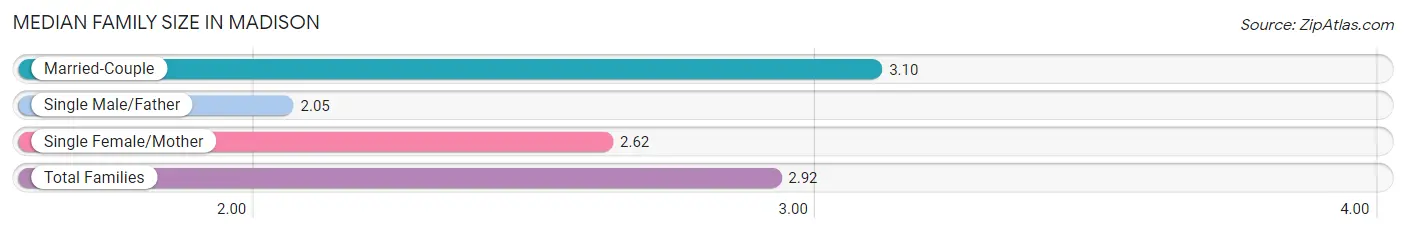
| Family Type | # Families | Family Size |
| Married-Couple | 411 (71.9%) | 3.10 |
| Single Male/Father | 44 (7.7%) | 2.05 |
| Single Female/Mother | 117 (20.4%) | 2.62 |
| Total Families | 572 (100.0%) | 2.92 |
Median Household Size in Madison
The median household size in Madison is 2.15 persons per household, with married-couple households (411 | 40.6%) accounting for the largest median household size of 3.1 persons per household. non-family households (441 | 43.5%) represent the smallest median household size with 1.09 persons per household.
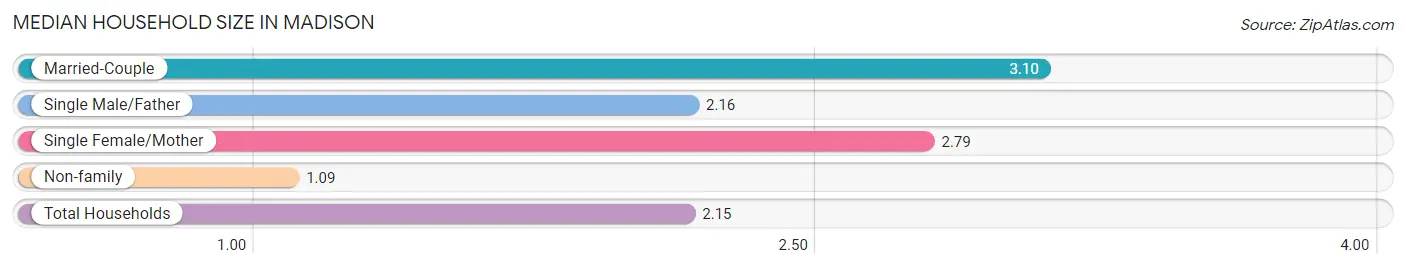
| Household Type | # Households | Household Size |
| Married-Couple | 411 (40.6%) | 3.10 |
| Single Male/Father | 44 (4.3%) | 2.16 |
| Single Female/Mother | 117 (11.6%) | 2.79 |
| Non-family | 441 (43.5%) | 1.09 |
| Total Households | 1,013 (100.0%) | 2.15 |
Household Size by Marriage Status in Madison
Out of a total of 1,013 households in Madison, 572 (56.5%) are family households, while 441 (43.5%) are nonfamily households. The most numerous type of family households are 2-person households, comprising 308, and the most common type of nonfamily households are 1-person households, comprising 392.
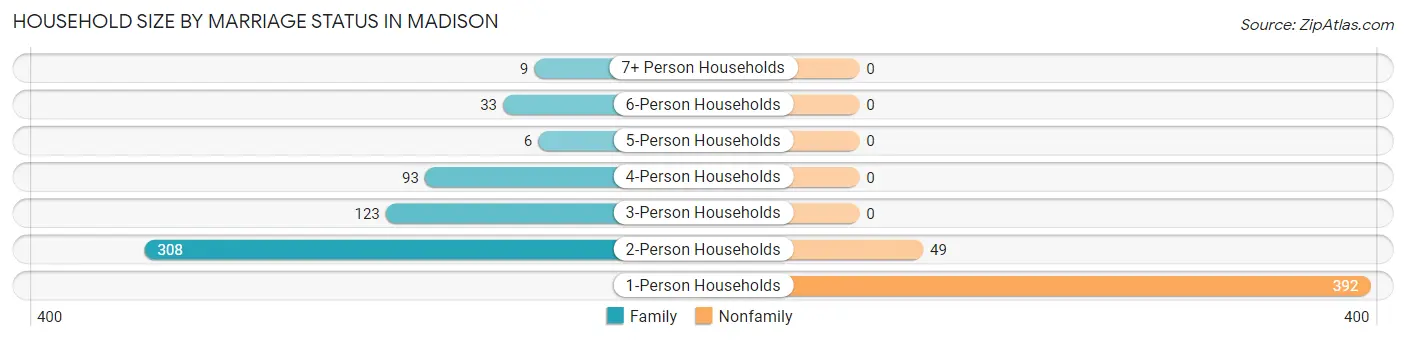
| Household Size | Family Households | Nonfamily Households |
| 1-Person Households | - | 392 (38.7%) |
| 2-Person Households | 308 (30.4%) | 49 (4.8%) |
| 3-Person Households | 123 (12.1%) | 0 (0.0%) |
| 4-Person Households | 93 (9.2%) | 0 (0.0%) |
| 5-Person Households | 6 (0.6%) | 0 (0.0%) |
| 6-Person Households | 33 (3.3%) | 0 (0.0%) |
| 7+ Person Households | 9 (0.9%) | 0 (0.0%) |
| Total | 572 (56.5%) | 441 (43.5%) |
Female Fertility in Madison
Fertility by Age in Madison
Average fertility rate in Madison is 56.0 births per 1,000 women. Women in the age bracket of 20 to 34 years have the highest fertility rate with 69.0 births per 1,000 women. Women in the age bracket of 35 to 50 years acount for 54.5% of all women with births.
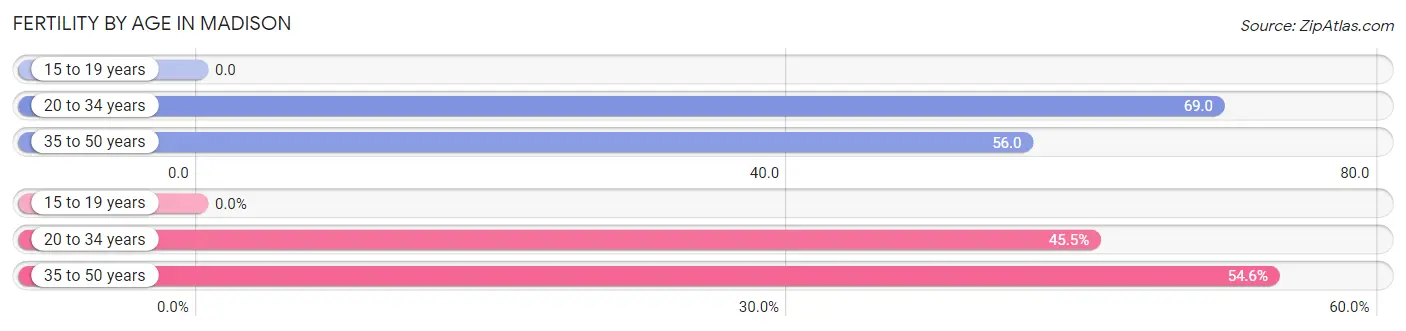
| Age Bracket | Women with Births | Births / 1,000 Women |
| 15 to 19 years | 0 (0.0%) | 0.0 |
| 20 to 34 years | 10 (45.5%) | 69.0 |
| 35 to 50 years | 12 (54.5%) | 56.0 |
| Total | 22 (100.0%) | 56.0 |
Fertility by Age by Marriage Status in Madison
54.5% of women with births (22) in Madison are married. The highest percentage of unmarried women with births falls into 20 to 34 years age bracket with 100.0% of them unmarried at the time of birth, while the lowest percentage of unmarried women with births belong to 35 to 50 years age bracket with 0.0% of them unmarried.
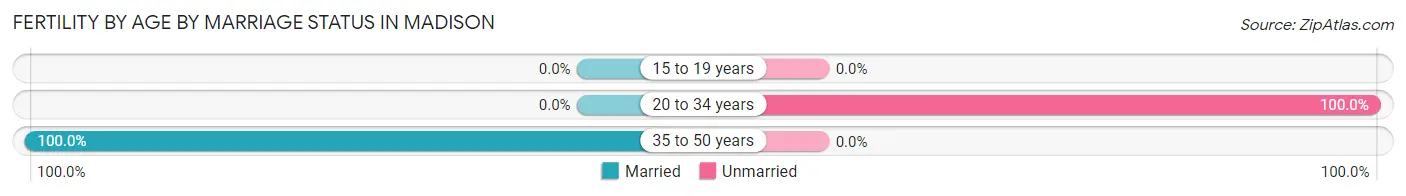
| Age Bracket | Married | Unmarried |
| 15 to 19 years | 0 (0.0%) | 0 (0.0%) |
| 20 to 34 years | 0 (0.0%) | 10 (100.0%) |
| 35 to 50 years | 12 (100.0%) | 0 (0.0%) |
| Total | 12 (54.5%) | 10 (45.5%) |
Fertility by Education in Madison
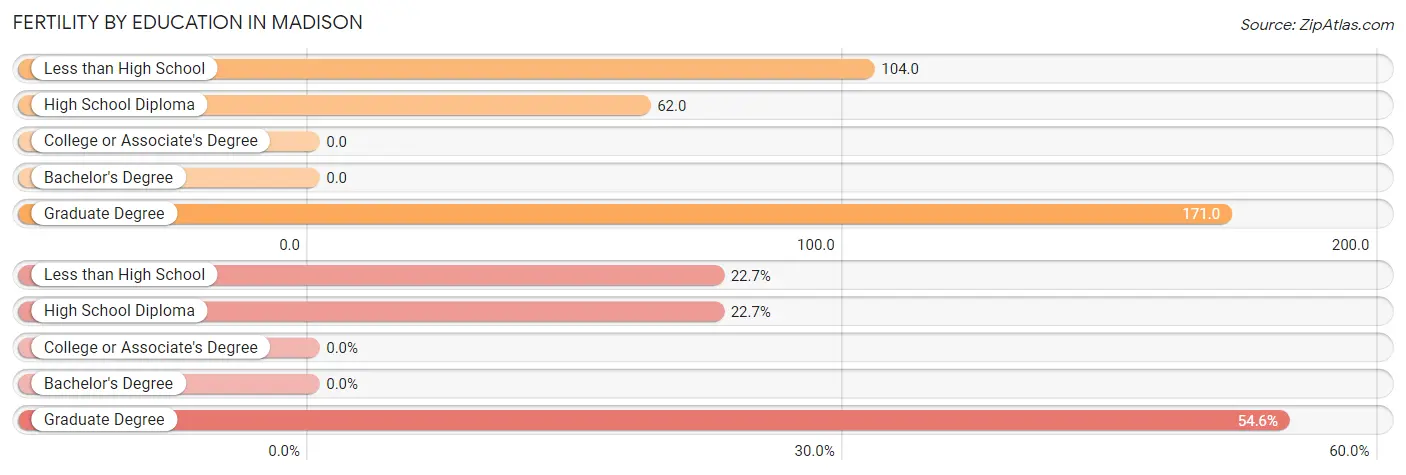
| Educational Attainment | Women with Births | Births / 1,000 Women |
| Less than High School | 5 (22.7%) | 104.0 |
| High School Diploma | 5 (22.7%) | 62.0 |
| College or Associate's Degree | 0 (0.0%) | 0.0 |
| Bachelor's Degree | 0 (0.0%) | 0.0 |
| Graduate Degree | 12 (54.5%) | 171.0 |
| Total | 22 (100.0%) | 56.0 |
Fertility by Education by Marriage Status in Madison
45.5% of women with births in Madison are unmarried. Women with the educational attainment of graduate degree are most likely to be married with 100.0% of them married at childbirth, while women with the educational attainment of less than high school are least likely to be married with 100.0% of them unmarried at childbirth.
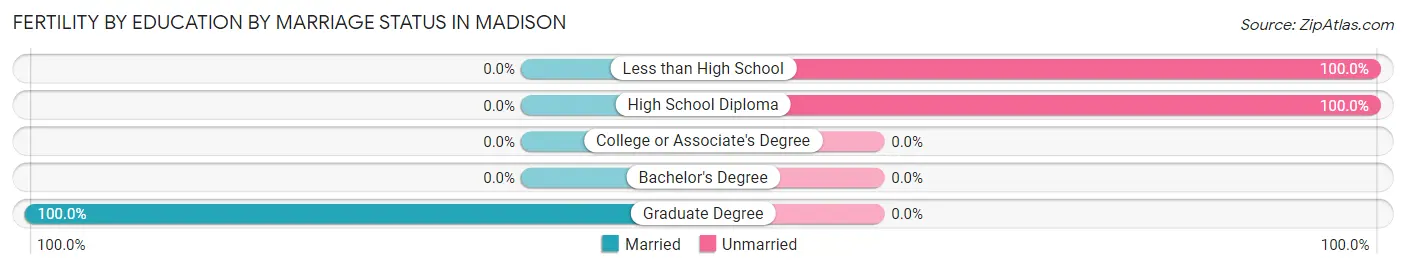
| Educational Attainment | Married | Unmarried |
| Less than High School | 0 (0.0%) | 5 (100.0%) |
| High School Diploma | 0 (0.0%) | 5 (100.0%) |
| College or Associate's Degree | 0 (0.0%) | 0 (0.0%) |
| Bachelor's Degree | 0 (0.0%) | 0 (0.0%) |
| Graduate Degree | 12 (100.0%) | 0 (0.0%) |
| Total | 12 (54.5%) | 10 (45.5%) |
Employment Characteristics in Madison
Employment by Class of Employer in Madison
Among the 1,024 employed individuals in Madison, private company employees (759 | 74.1%), local government employees (79 | 7.7%), and self-employed (not incorporated) (69 | 6.7%) make up the most common classes of employment.
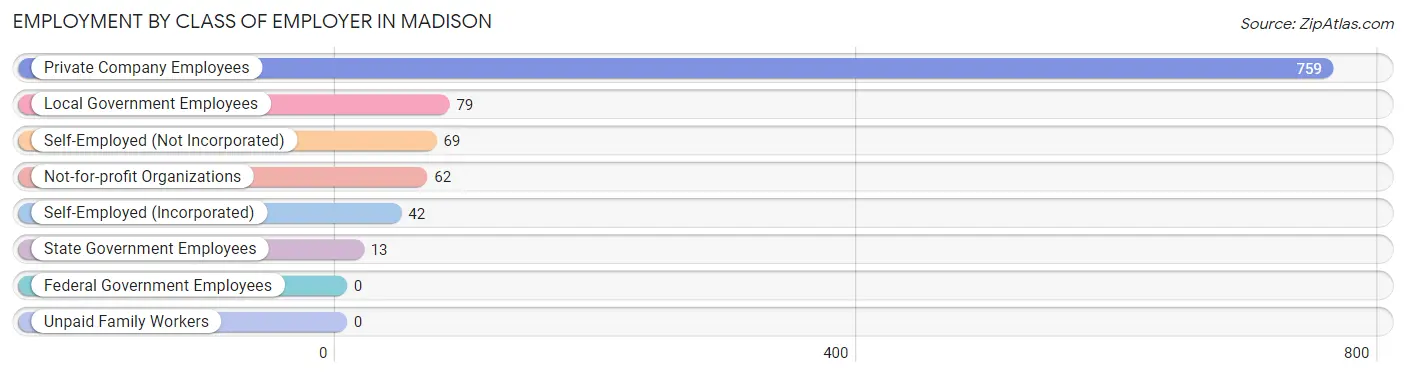
| Employer Class | # Employees | % Employees |
| Private Company Employees | 759 | 74.1% |
| Self-Employed (Incorporated) | 42 | 4.1% |
| Self-Employed (Not Incorporated) | 69 | 6.7% |
| Not-for-profit Organizations | 62 | 6.0% |
| Local Government Employees | 79 | 7.7% |
| State Government Employees | 13 | 1.3% |
| Federal Government Employees | 0 | 0.0% |
| Unpaid Family Workers | 0 | 0.0% |
| Total | 1,024 | 100.0% |
Employment Status by Age in Madison
According to the labor force statistics for Madison, out of the total population over 16 years of age (1,894), 59.1% or 1,119 individuals are in the labor force, with 7.6% or 85 of them unemployed. The age group with the highest labor force participation rate is 20 to 24 years, with 96.6% or 173 individuals in the labor force. Within the labor force, the 20 to 24 years age range has the highest percentage of unemployed individuals, with 38.7% or 67 of them being unemployed.
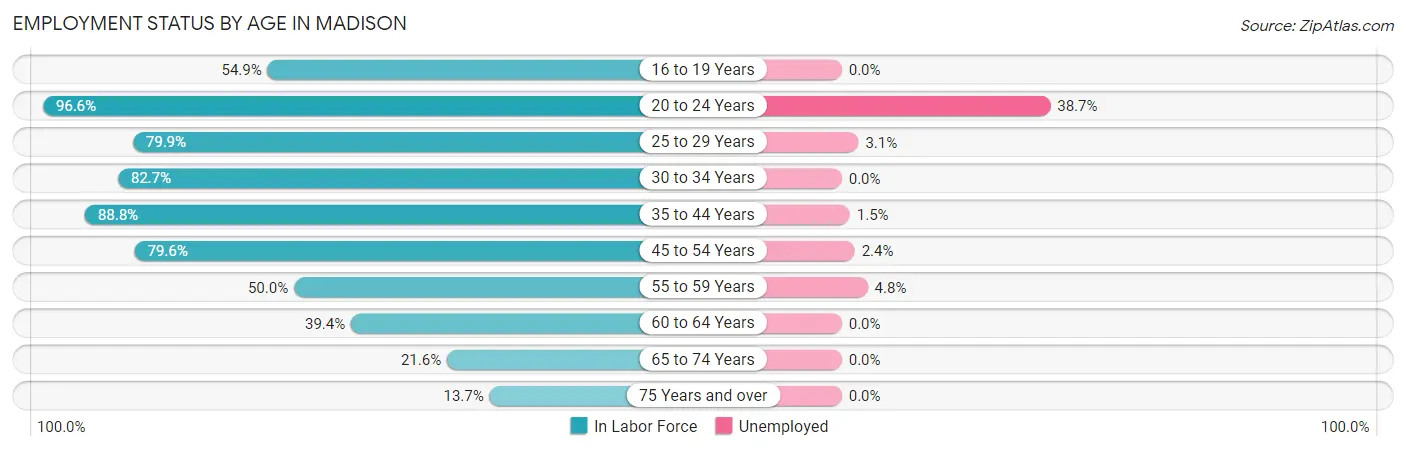
| Age Bracket | In Labor Force | Unemployed |
| 16 to 19 Years | 39 (54.9%) | 0 (0.0%) |
| 20 to 24 Years | 173 (96.6%) | 67 (38.7%) |
| 25 to 29 Years | 127 (79.9%) | 4 (3.1%) |
| 30 to 34 Years | 62 (82.7%) | 0 (0.0%) |
| 35 to 44 Years | 199 (88.8%) | 3 (1.5%) |
| 45 to 54 Years | 253 (79.6%) | 6 (2.4%) |
| 55 to 59 Years | 105 (50.0%) | 5 (4.8%) |
| 60 to 64 Years | 84 (39.4%) | 0 (0.0%) |
| 65 to 74 Years | 44 (21.6%) | 0 (0.0%) |
| 75 Years and over | 33 (13.7%) | 0 (0.0%) |
| Total | 1,119 (59.1%) | 85 (7.6%) |
Employment Status by Educational Attainment in Madison
According to labor force statistics for Madison, 69.2% of individuals (830) out of the total population between 25 and 64 years of age (1,199) are in the labor force, with 2.2% or 18 of them being unemployed. The group with the highest labor force participation rate are those with the educational attainment of less than high school, with 77.3% or 85 individuals in the labor force. Within the labor force, individuals with bachelor's degree or higher education have the highest percentage of unemployment, with 3.9% or 7 of them being unemployed.
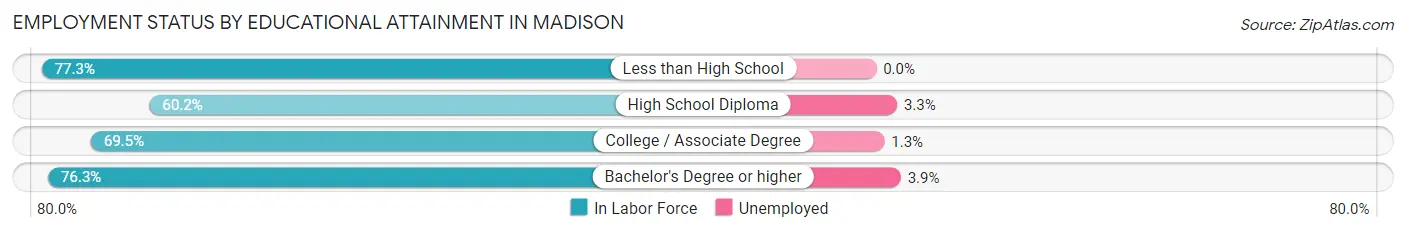
| Educational Attainment | In Labor Force | Unemployed |
| Less than High School | 85 (77.3%) | 0 (0.0%) |
| High School Diploma | 180 (60.2%) | 10 (3.3%) |
| College / Associate Degree | 385 (69.5%) | 7 (1.3%) |
| Bachelor's Degree or higher | 180 (76.3%) | 9 (3.9%) |
| Total | 830 (69.2%) | 26 (2.2%) |
Employment Occupations by Sex in Madison
Management, Business, Science and Arts Occupations
The most common Management, Business, Science and Arts occupations in Madison are Business & Financial (96 | 9.3%), Community & Social Service (92 | 8.9%), Management (64 | 6.2%), Health Diagnosing & Treating (53 | 5.1%), and Education Instruction & Library (39 | 3.8%).
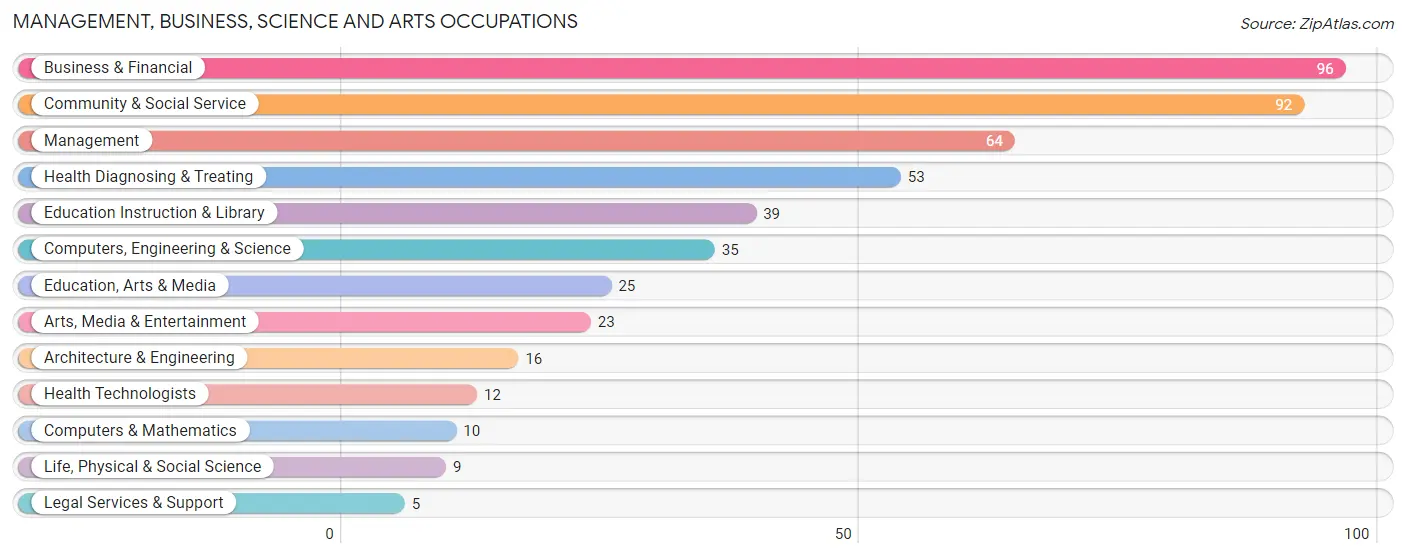
Management, Business, Science and Arts Occupations by Sex
Within the Management, Business, Science and Arts occupations in Madison, the most male-oriented occupations are Computers & Mathematics (100.0%), Life, Physical & Social Science (100.0%), and Legal Services & Support (100.0%), while the most female-oriented occupations are Education Instruction & Library (87.2%), Community & Social Service (63.0%), and Health Technologists (58.3%).
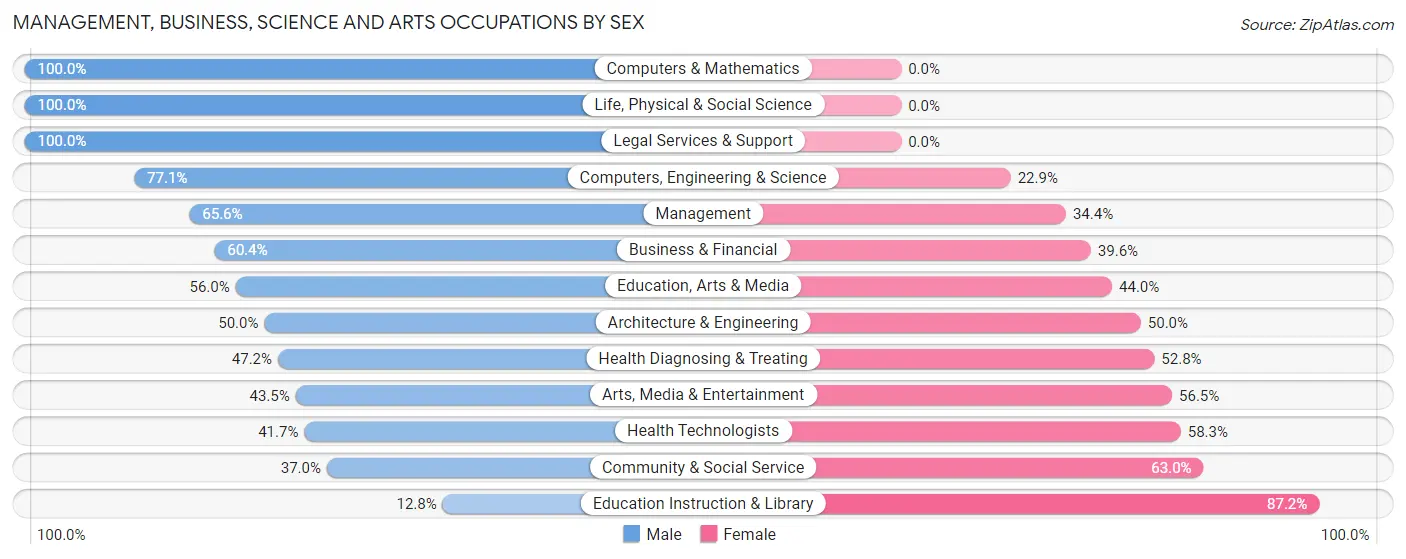
| Occupation | Male | Female |
| Management | 42 (65.6%) | 22 (34.4%) |
| Business & Financial | 58 (60.4%) | 38 (39.6%) |
| Computers, Engineering & Science | 27 (77.1%) | 8 (22.9%) |
| Computers & Mathematics | 10 (100.0%) | 0 (0.0%) |
| Architecture & Engineering | 8 (50.0%) | 8 (50.0%) |
| Life, Physical & Social Science | 9 (100.0%) | 0 (0.0%) |
| Community & Social Service | 34 (37.0%) | 58 (63.0%) |
| Education, Arts & Media | 14 (56.0%) | 11 (44.0%) |
| Legal Services & Support | 5 (100.0%) | 0 (0.0%) |
| Education Instruction & Library | 5 (12.8%) | 34 (87.2%) |
| Arts, Media & Entertainment | 10 (43.5%) | 13 (56.5%) |
| Health Diagnosing & Treating | 25 (47.2%) | 28 (52.8%) |
| Health Technologists | 5 (41.7%) | 7 (58.3%) |
| Total (Category) | 186 (54.7%) | 154 (45.3%) |
| Total (Overall) | 562 (54.3%) | 472 (45.7%) |
Services Occupations
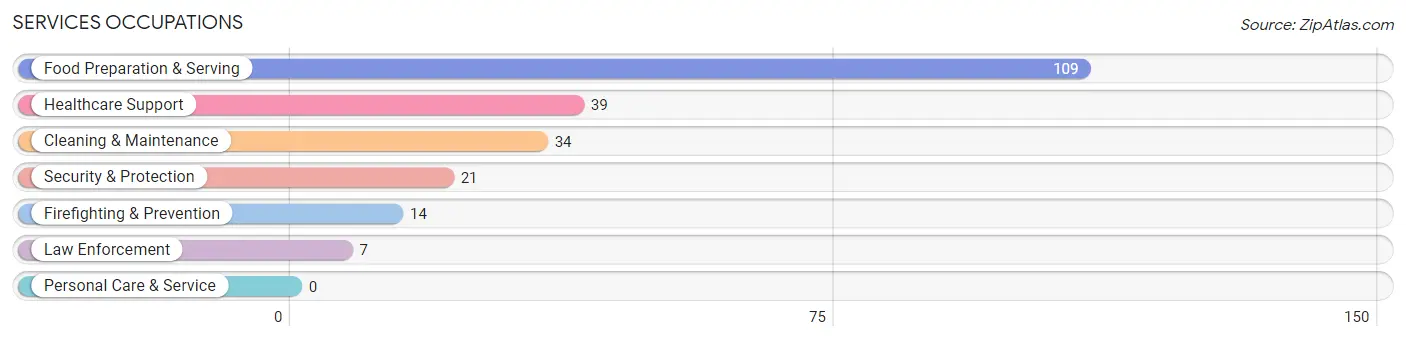
The most common Services occupations in Madison are Food Preparation & Serving (109 | 10.5%), Healthcare Support (39 | 3.8%), Cleaning & Maintenance (34 | 3.3%), Security & Protection (21 | 2.0%), and Firefighting & Prevention (14 | 1.3%).
Services Occupations by Sex
Within the Services occupations in Madison, the most male-oriented occupations are Security & Protection (100.0%), Firefighting & Prevention (100.0%), and Law Enforcement (100.0%), while the most female-oriented occupations are Healthcare Support (100.0%), Food Preparation & Serving (77.1%), and Cleaning & Maintenance (70.6%).
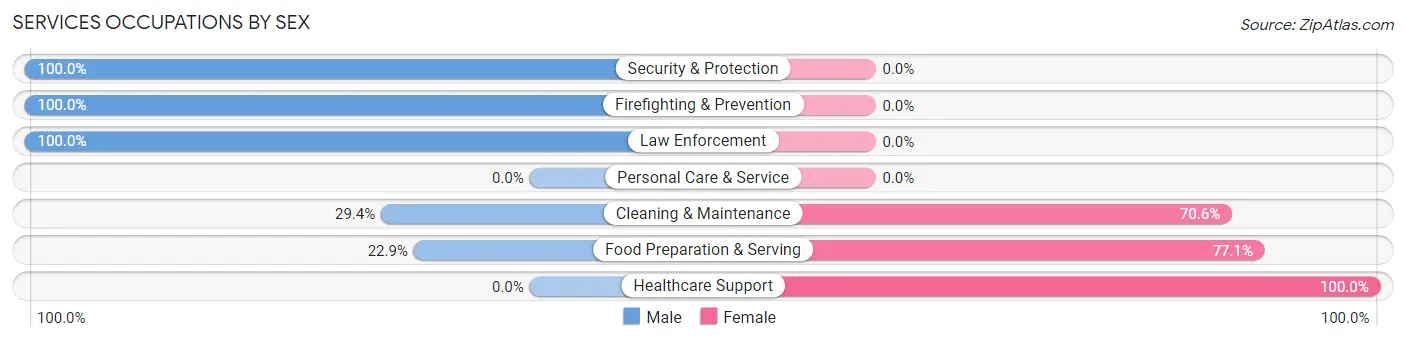
| Occupation | Male | Female |
| Healthcare Support | 0 (0.0%) | 39 (100.0%) |
| Security & Protection | 21 (100.0%) | 0 (0.0%) |
| Firefighting & Prevention | 14 (100.0%) | 0 (0.0%) |
| Law Enforcement | 7 (100.0%) | 0 (0.0%) |
| Food Preparation & Serving | 25 (22.9%) | 84 (77.1%) |
| Cleaning & Maintenance | 10 (29.4%) | 24 (70.6%) |
| Personal Care & Service | 0 (0.0%) | 0 (0.0%) |
| Total (Category) | 56 (27.6%) | 147 (72.4%) |
| Total (Overall) | 562 (54.3%) | 472 (45.7%) |
Sales and Office Occupations
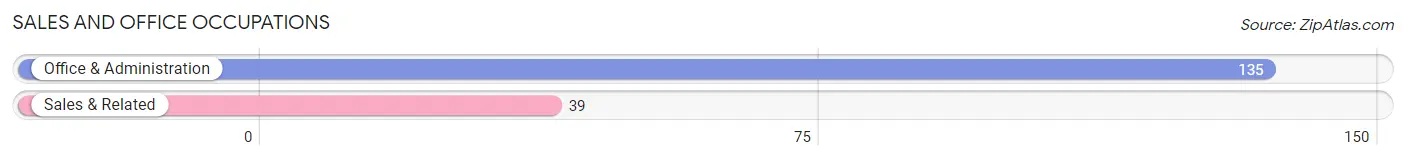
The most common Sales and Office occupations in Madison are Office & Administration (135 | 13.1%), and Sales & Related (39 | 3.8%).
Sales and Office Occupations by Sex
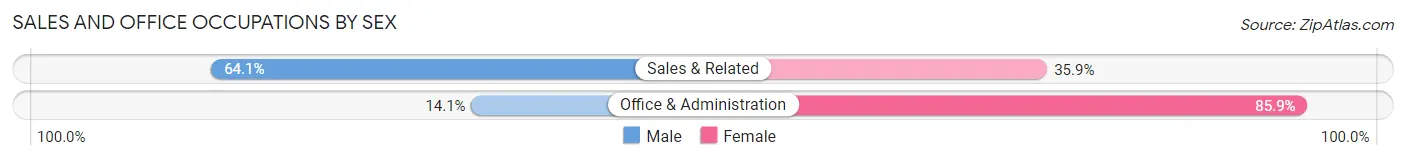
| Occupation | Male | Female |
| Sales & Related | 25 (64.1%) | 14 (35.9%) |
| Office & Administration | 19 (14.1%) | 116 (85.9%) |
| Total (Category) | 44 (25.3%) | 130 (74.7%) |
| Total (Overall) | 562 (54.3%) | 472 (45.7%) |
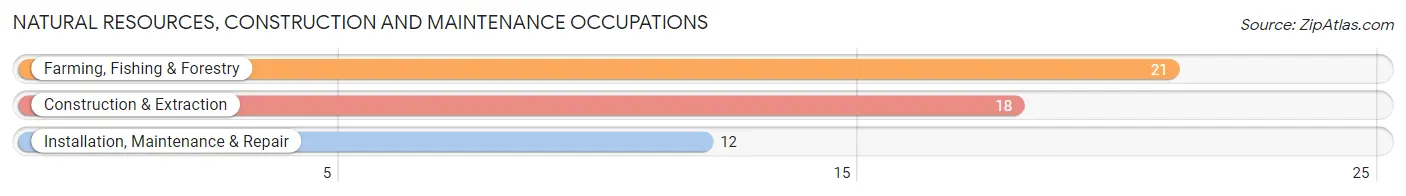
Natural Resources, Construction and Maintenance Occupations
The most common Natural Resources, Construction and Maintenance occupations in Madison are Farming, Fishing & Forestry (21 | 2.0%), Construction & Extraction (18 | 1.7%), and Installation, Maintenance & Repair (12 | 1.2%).
Natural Resources, Construction and Maintenance Occupations by Sex
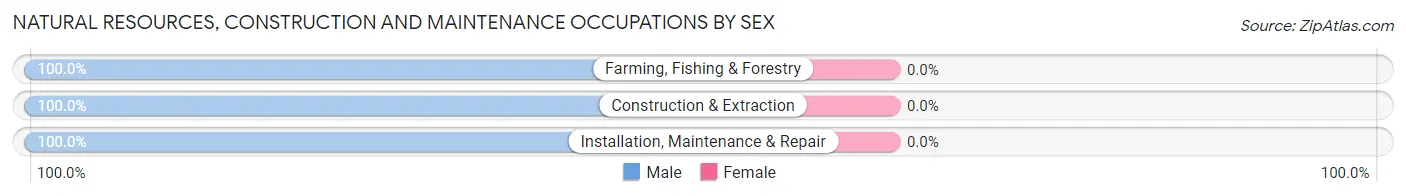
| Occupation | Male | Female |
| Farming, Fishing & Forestry | 21 (100.0%) | 0 (0.0%) |
| Construction & Extraction | 18 (100.0%) | 0 (0.0%) |
| Installation, Maintenance & Repair | 12 (100.0%) | 0 (0.0%) |
| Total (Category) | 51 (100.0%) | 0 (0.0%) |
| Total (Overall) | 562 (54.3%) | 472 (45.7%) |
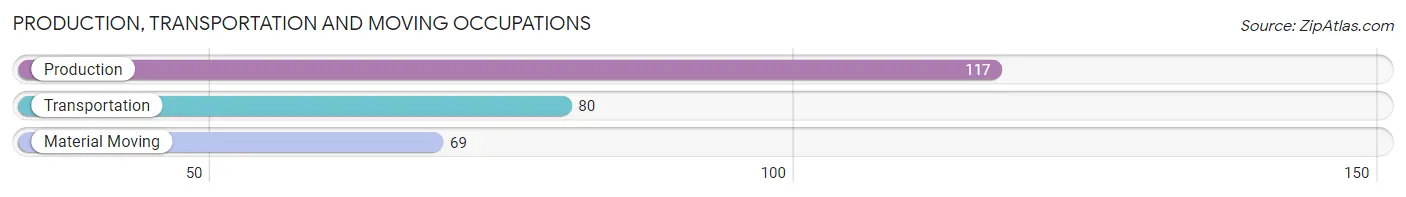
Production, Transportation and Moving Occupations
The most common Production, Transportation and Moving occupations in Madison are Production (117 | 11.3%), Transportation (80 | 7.7%), and Material Moving (69 | 6.7%).
Production, Transportation and Moving Occupations by Sex
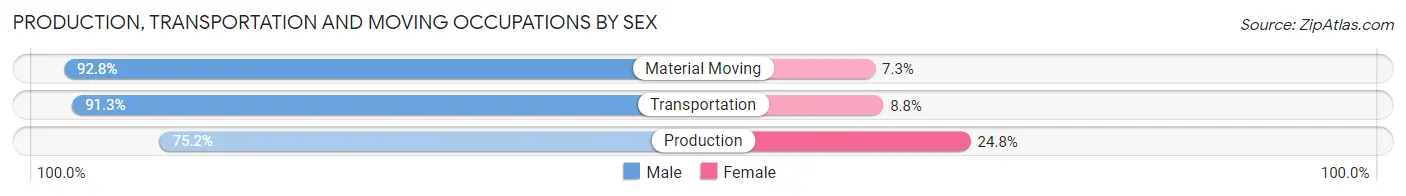
| Occupation | Male | Female |
| Production | 88 (75.2%) | 29 (24.8%) |
| Transportation | 73 (91.2%) | 7 (8.7%) |
| Material Moving | 64 (92.7%) | 5 (7.2%) |
| Total (Category) | 225 (84.6%) | 41 (15.4%) |
| Total (Overall) | 562 (54.3%) | 472 (45.7%) |
Employment Industries by Sex in Madison
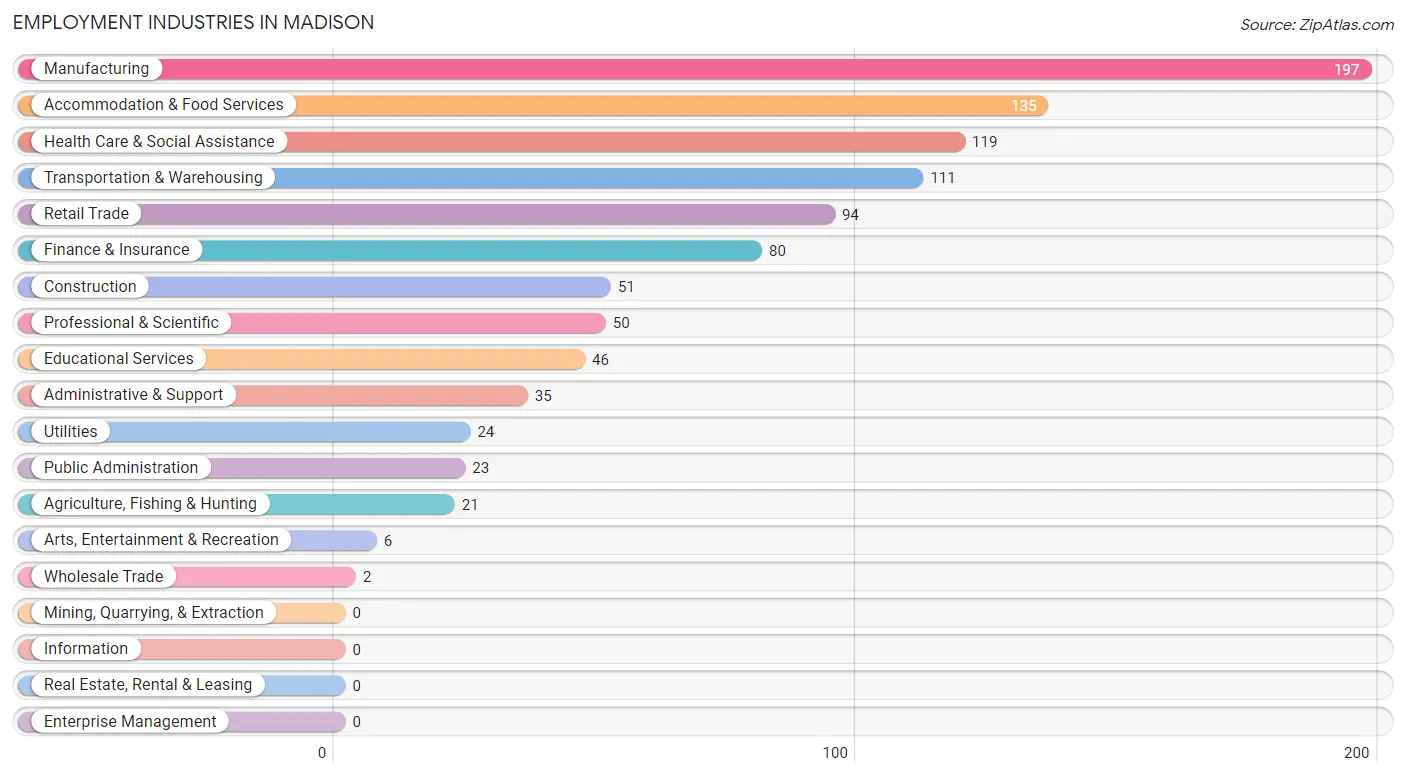
Employment Industries in Madison
The major employment industries in Madison include Manufacturing (197 | 19.1%), Accommodation & Food Services (135 | 13.1%), Health Care & Social Assistance (119 | 11.5%), Transportation & Warehousing (111 | 10.7%), and Retail Trade (94 | 9.1%).
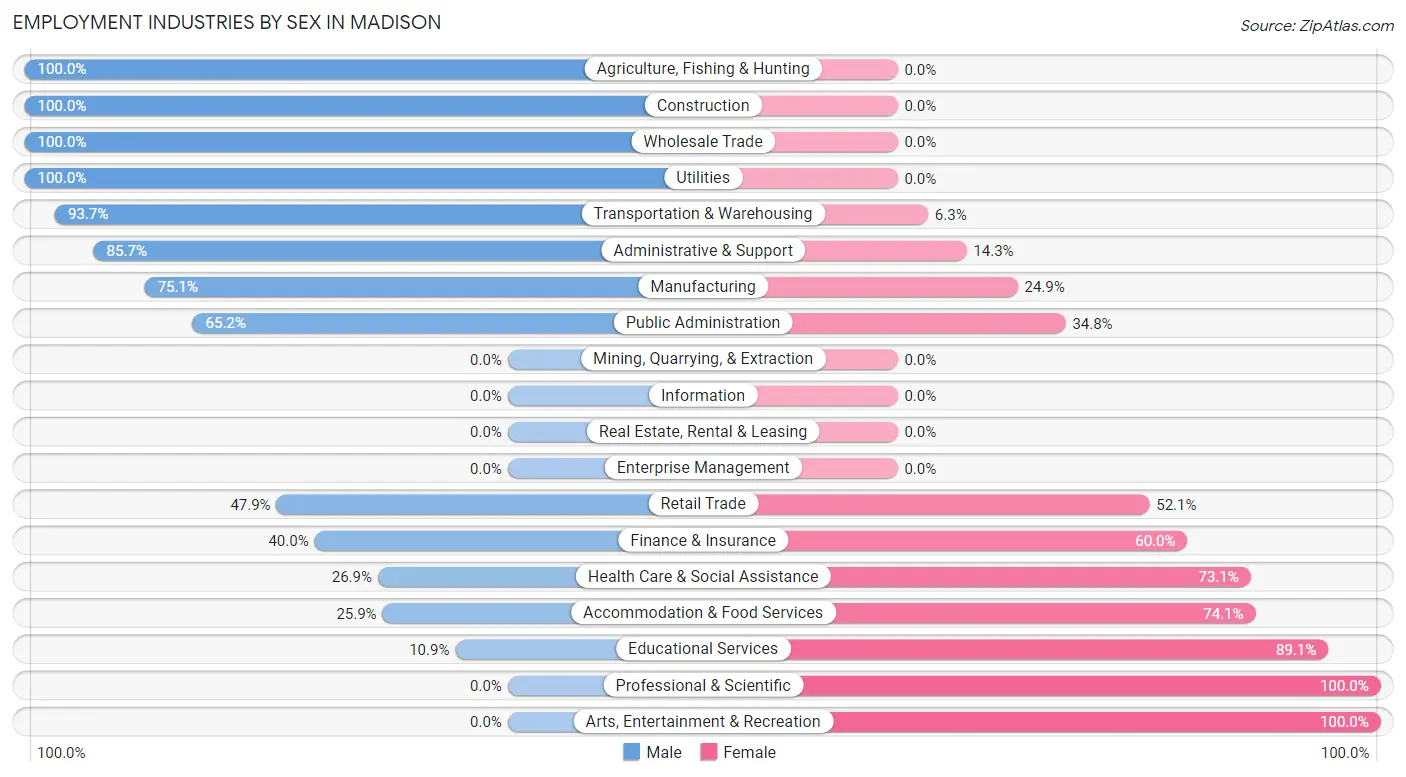
Employment Industries by Sex in Madison
The Madison industries that see more men than women are Agriculture, Fishing & Hunting (100.0%), Construction (100.0%), and Wholesale Trade (100.0%), whereas the industries that tend to have a higher number of women are Professional & Scientific (100.0%), Arts, Entertainment & Recreation (100.0%), and Educational Services (89.1%).
| Industry | Male | Female |
| Agriculture, Fishing & Hunting | 21 (100.0%) | 0 (0.0%) |
| Mining, Quarrying, & Extraction | 0 (0.0%) | 0 (0.0%) |
| Construction | 51 (100.0%) | 0 (0.0%) |
| Manufacturing | 148 (75.1%) | 49 (24.9%) |
| Wholesale Trade | 2 (100.0%) | 0 (0.0%) |
| Retail Trade | 45 (47.9%) | 49 (52.1%) |
| Transportation & Warehousing | 104 (93.7%) | 7 (6.3%) |
| Utilities | 24 (100.0%) | 0 (0.0%) |
| Information | 0 (0.0%) | 0 (0.0%) |
| Finance & Insurance | 32 (40.0%) | 48 (60.0%) |
| Real Estate, Rental & Leasing | 0 (0.0%) | 0 (0.0%) |
| Professional & Scientific | 0 (0.0%) | 50 (100.0%) |
| Enterprise Management | 0 (0.0%) | 0 (0.0%) |
| Administrative & Support | 30 (85.7%) | 5 (14.3%) |
| Educational Services | 5 (10.9%) | 41 (89.1%) |
| Health Care & Social Assistance | 32 (26.9%) | 87 (73.1%) |
| Arts, Entertainment & Recreation | 0 (0.0%) | 6 (100.0%) |
| Accommodation & Food Services | 35 (25.9%) | 100 (74.1%) |
| Public Administration | 15 (65.2%) | 8 (34.8%) |
| Total | 562 (54.3%) | 472 (45.7%) |
Education in Madison
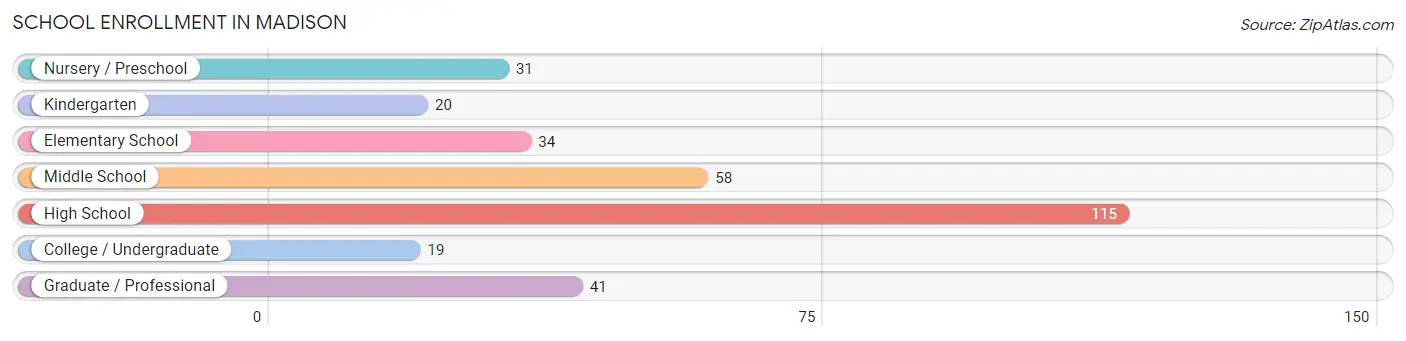
School Enrollment in Madison
The most common levels of schooling among the 318 students in Madison are high school (115 | 36.2%), middle school (58 | 18.2%), and graduate / professional (41 | 12.9%).
| School Level | # Students | % Students |
| Nursery / Preschool | 31 | 9.8% |
| Kindergarten | 20 | 6.3% |
| Elementary School | 34 | 10.7% |
| Middle School | 58 | 18.2% |
| High School | 115 | 36.2% |
| College / Undergraduate | 19 | 6.0% |
| Graduate / Professional | 41 | 12.9% |
| Total | 318 | 100.0% |
School Enrollment by Age by Funding Source in Madison
Out of a total of 318 students who are enrolled in schools in Madison, 42 (13.2%) attend a private institution, while the remaining 276 (86.8%) are enrolled in public schools. The age group of 25 to 34 year olds has the highest likelihood of being enrolled in private schools, with 7 (100.0% in the age bracket) enrolled. Conversely, the age group of 3 to 4 year olds has the lowest likelihood of being enrolled in a private school, with 3 (100.0% in the age bracket) attending a public institution.
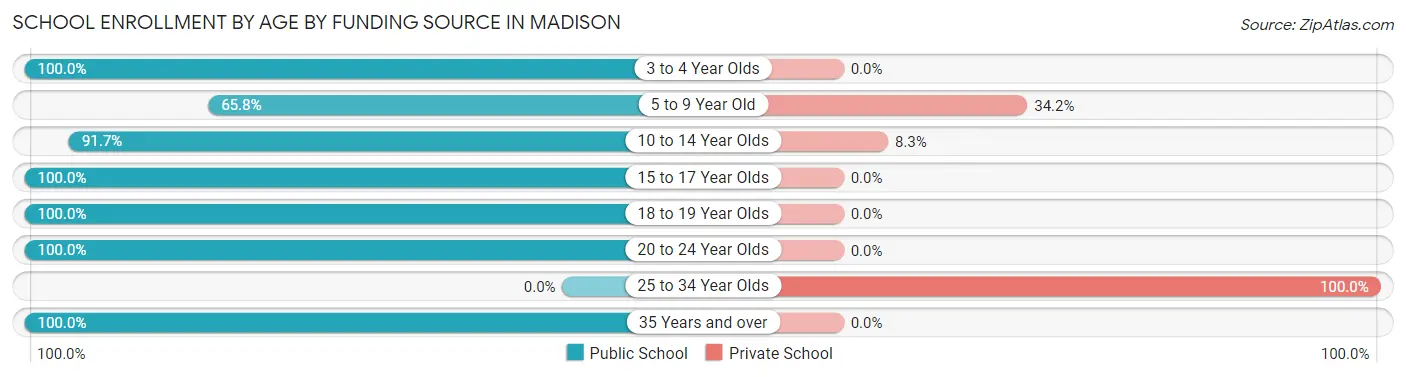
| Age Bracket | Public School | Private School |
| 3 to 4 Year Olds | 3 (100.0%) | 0 (0.0%) |
| 5 to 9 Year Old | 50 (65.8%) | 26 (34.2%) |
| 10 to 14 Year Olds | 100 (91.7%) | 9 (8.3%) |
| 15 to 17 Year Olds | 49 (100.0%) | 0 (0.0%) |
| 18 to 19 Year Olds | 28 (100.0%) | 0 (0.0%) |
| 20 to 24 Year Olds | 41 (100.0%) | 0 (0.0%) |
| 25 to 34 Year Olds | 0 (0.0%) | 7 (100.0%) |
| 35 Years and over | 5 (100.0%) | 0 (0.0%) |
| Total | 276 (86.8%) | 42 (13.2%) |
Educational Attainment by Field of Study in Madison
Liberal arts & history (60 | 17.1%), education (55 | 15.7%), business (35 | 10.0%), science & technology (33 | 9.4%), and visual & performing arts (32 | 9.1%) are the most common fields of study among 351 individuals in Madison who have obtained a bachelor's degree or higher.
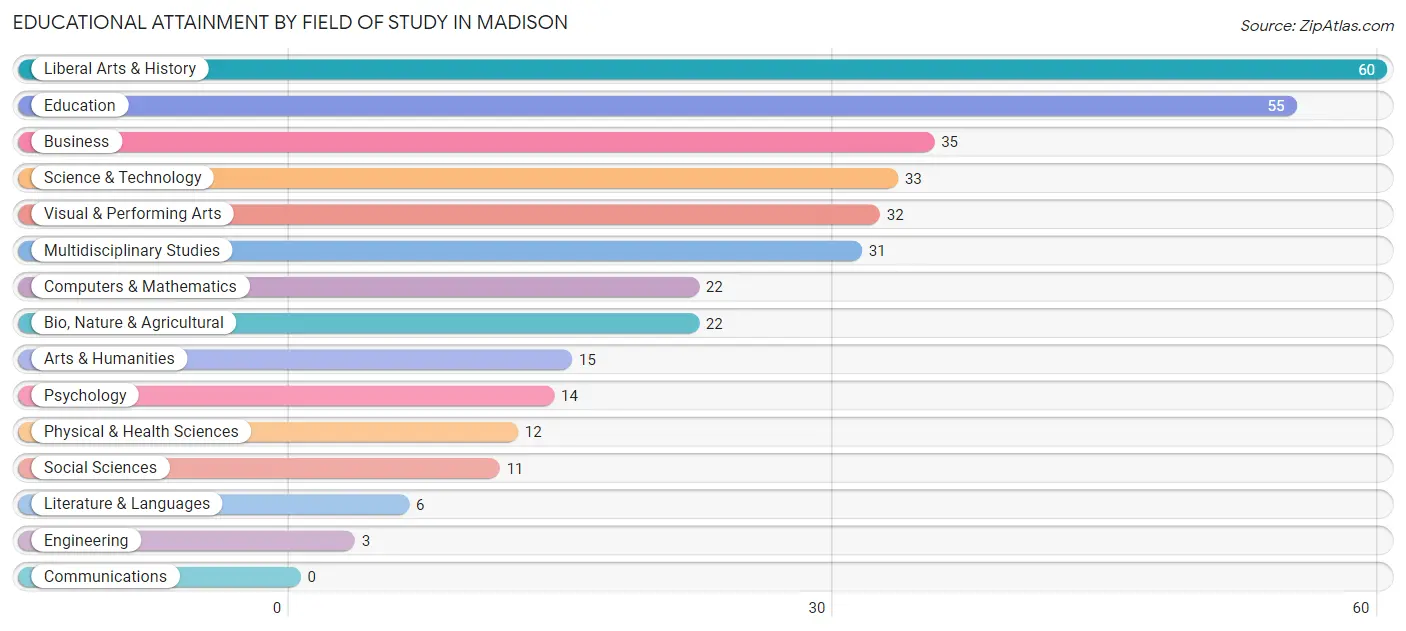
| Field of Study | # Graduates | % Graduates |
| Computers & Mathematics | 22 | 6.3% |
| Bio, Nature & Agricultural | 22 | 6.3% |
| Physical & Health Sciences | 12 | 3.4% |
| Psychology | 14 | 4.0% |
| Social Sciences | 11 | 3.1% |
| Engineering | 3 | 0.9% |
| Multidisciplinary Studies | 31 | 8.8% |
| Science & Technology | 33 | 9.4% |
| Business | 35 | 10.0% |
| Education | 55 | 15.7% |
| Literature & Languages | 6 | 1.7% |
| Liberal Arts & History | 60 | 17.1% |
| Visual & Performing Arts | 32 | 9.1% |
| Communications | 0 | 0.0% |
| Arts & Humanities | 15 | 4.3% |
| Total | 351 | 100.0% |
Transportation & Commute in Madison
Vehicle Availability by Sex in Madison
The most prevalent vehicle ownership categories in Madison are males with 3 vehicles (185, accounting for 33.6%) and females with 3 vehicles (132, making up 39.2%).
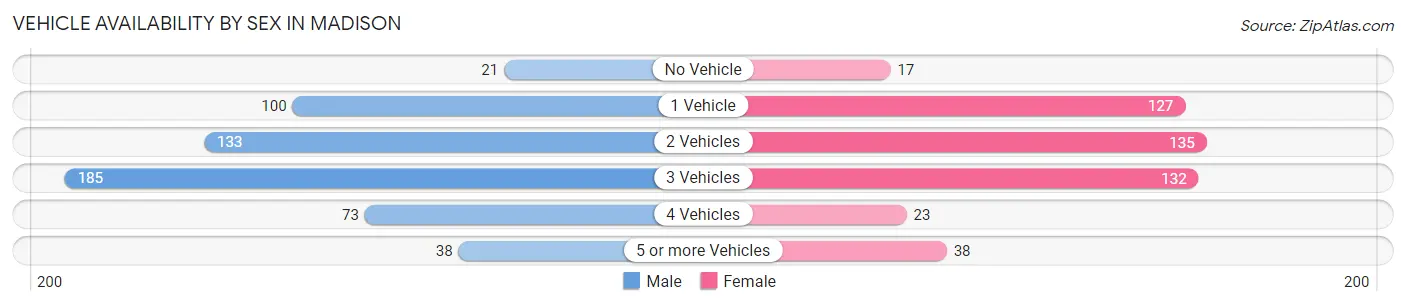
| Vehicles Available | Male | Female |
| No Vehicle | 21 (3.8%) | 17 (3.6%) |
| 1 Vehicle | 100 (18.2%) | 127 (26.9%) |
| 2 Vehicles | 133 (24.2%) | 135 (28.6%) |
| 3 Vehicles | 185 (33.6%) | 132 (28.0%) |
| 4 Vehicles | 73 (13.3%) | 23 (4.9%) |
| 5 or more Vehicles | 38 (6.9%) | 38 (8.1%) |
| Total | 550 (100.0%) | 472 (100.0%) |
Commute Time in Madison
The most frequently occuring commute durations in Madison are 5 to 9 minutes (226 commuters, 24.2%), 10 to 14 minutes (175 commuters, 18.8%), and 45 to 59 minutes (148 commuters, 15.9%).
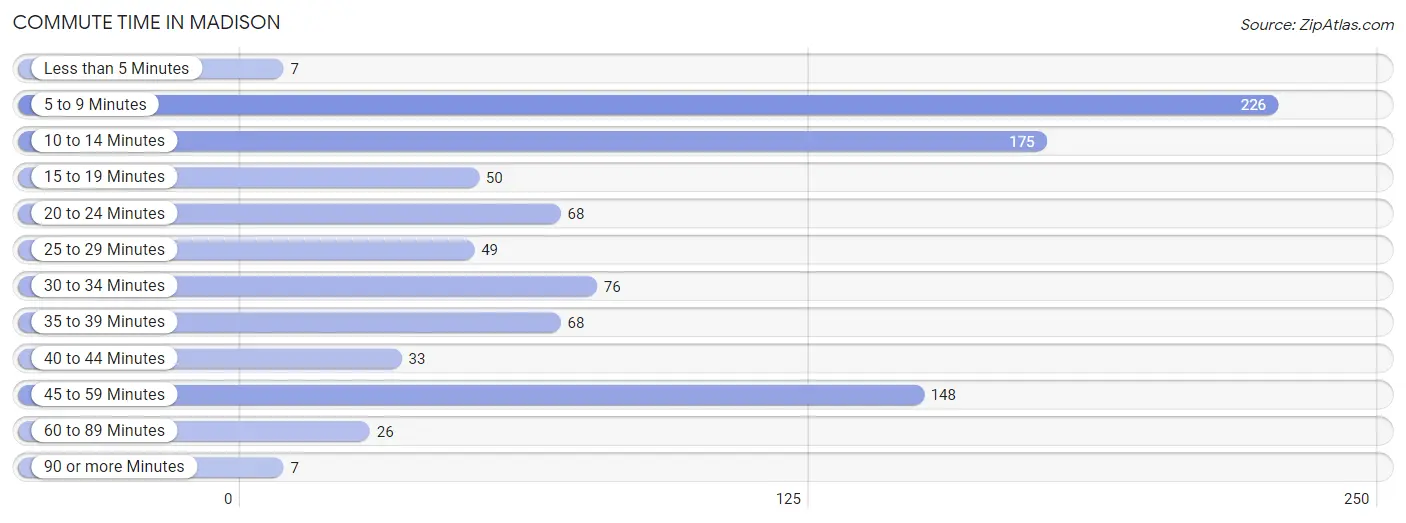
| Commute Time | # Commuters | % Commuters |
| Less than 5 Minutes | 7 | 0.7% |
| 5 to 9 Minutes | 226 | 24.2% |
| 10 to 14 Minutes | 175 | 18.8% |
| 15 to 19 Minutes | 50 | 5.4% |
| 20 to 24 Minutes | 68 | 7.3% |
| 25 to 29 Minutes | 49 | 5.2% |
| 30 to 34 Minutes | 76 | 8.2% |
| 35 to 39 Minutes | 68 | 7.3% |
| 40 to 44 Minutes | 33 | 3.5% |
| 45 to 59 Minutes | 148 | 15.9% |
| 60 to 89 Minutes | 26 | 2.8% |
| 90 or more Minutes | 7 | 0.7% |
Commute Time by Sex in Madison
The most common commute times in Madison are 10 to 14 minutes (149 commuters, 27.9%) for males and 5 to 9 minutes (127 commuters, 31.9%) for females.
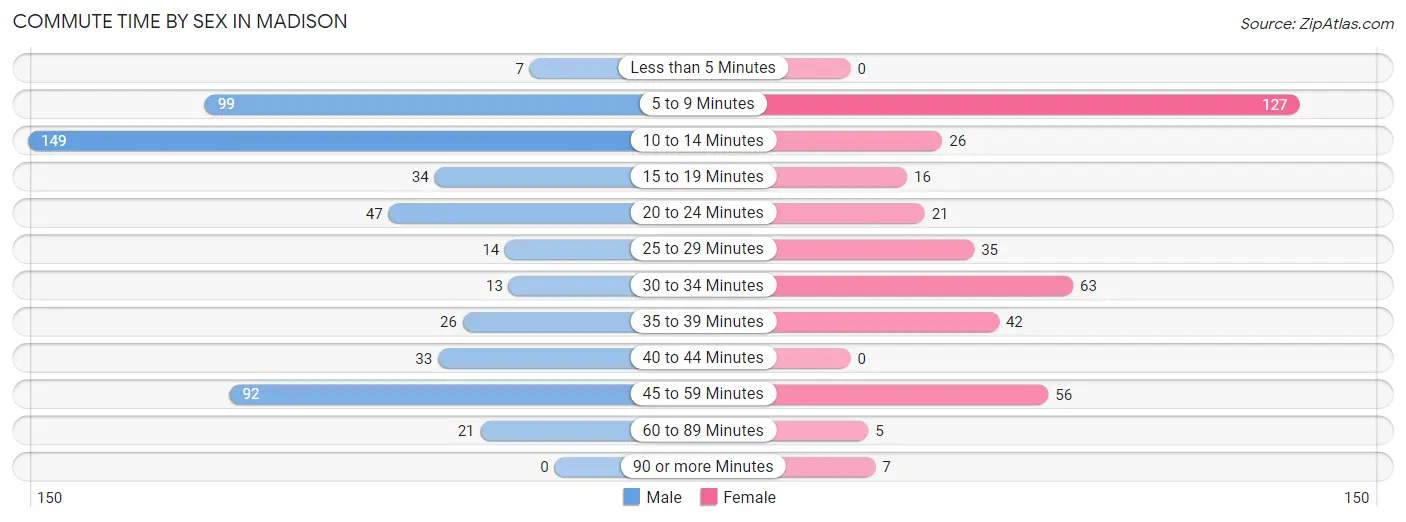
| Commute Time | Male | Female |
| Less than 5 Minutes | 7 (1.3%) | 0 (0.0%) |
| 5 to 9 Minutes | 99 (18.5%) | 127 (31.9%) |
| 10 to 14 Minutes | 149 (27.9%) | 26 (6.5%) |
| 15 to 19 Minutes | 34 (6.4%) | 16 (4.0%) |
| 20 to 24 Minutes | 47 (8.8%) | 21 (5.3%) |
| 25 to 29 Minutes | 14 (2.6%) | 35 (8.8%) |
| 30 to 34 Minutes | 13 (2.4%) | 63 (15.8%) |
| 35 to 39 Minutes | 26 (4.9%) | 42 (10.5%) |
| 40 to 44 Minutes | 33 (6.2%) | 0 (0.0%) |
| 45 to 59 Minutes | 92 (17.2%) | 56 (14.1%) |
| 60 to 89 Minutes | 21 (3.9%) | 5 (1.3%) |
| 90 or more Minutes | 0 (0.0%) | 7 (1.8%) |
Time of Departure to Work by Sex in Madison
The most frequent times of departure to work in Madison are 4:00 PM to 11:59 PM (77, 14.4%) for males and 12:00 PM to 3:59 PM (92, 23.1%) for females.
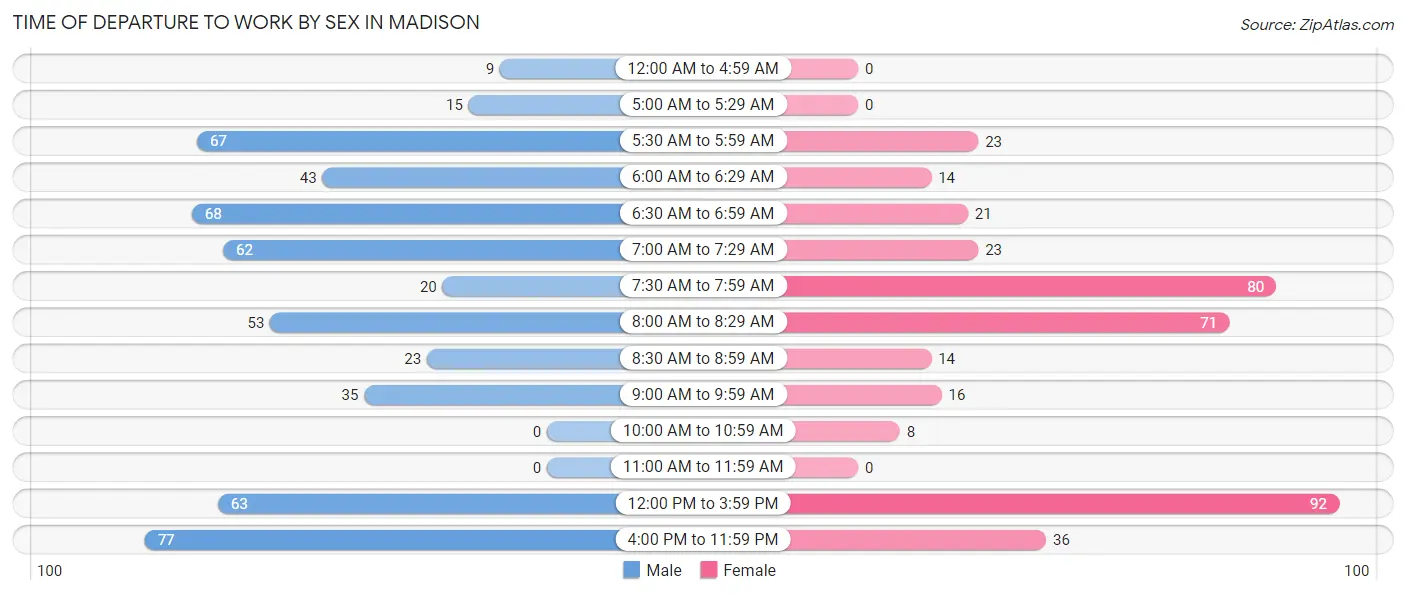
| Time of Departure | Male | Female |
| 12:00 AM to 4:59 AM | 9 (1.7%) | 0 (0.0%) |
| 5:00 AM to 5:29 AM | 15 (2.8%) | 0 (0.0%) |
| 5:30 AM to 5:59 AM | 67 (12.5%) | 23 (5.8%) |
| 6:00 AM to 6:29 AM | 43 (8.0%) | 14 (3.5%) |
| 6:30 AM to 6:59 AM | 68 (12.7%) | 21 (5.3%) |
| 7:00 AM to 7:29 AM | 62 (11.6%) | 23 (5.8%) |
| 7:30 AM to 7:59 AM | 20 (3.7%) | 80 (20.1%) |
| 8:00 AM to 8:29 AM | 53 (9.9%) | 71 (17.8%) |
| 8:30 AM to 8:59 AM | 23 (4.3%) | 14 (3.5%) |
| 9:00 AM to 9:59 AM | 35 (6.5%) | 16 (4.0%) |
| 10:00 AM to 10:59 AM | 0 (0.0%) | 8 (2.0%) |
| 11:00 AM to 11:59 AM | 0 (0.0%) | 0 (0.0%) |
| 12:00 PM to 3:59 PM | 63 (11.8%) | 92 (23.1%) |
| 4:00 PM to 11:59 PM | 77 (14.4%) | 36 (9.0%) |
| Total | 535 (100.0%) | 398 (100.0%) |
Housing Occupancy in Madison
Occupancy by Ownership in Madison
Of the total 1,013 dwellings in Madison, owner-occupied units account for 641 (63.3%), while renter-occupied units make up 372 (36.7%).
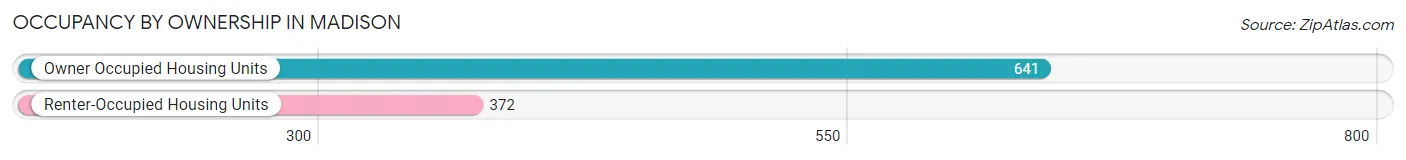
| Occupancy | # Housing Units | % Housing Units |
| Owner Occupied Housing Units | 641 | 63.3% |
| Renter-Occupied Housing Units | 372 | 36.7% |
| Total Occupied Housing Units | 1,013 | 100.0% |
Occupancy by Household Size in Madison
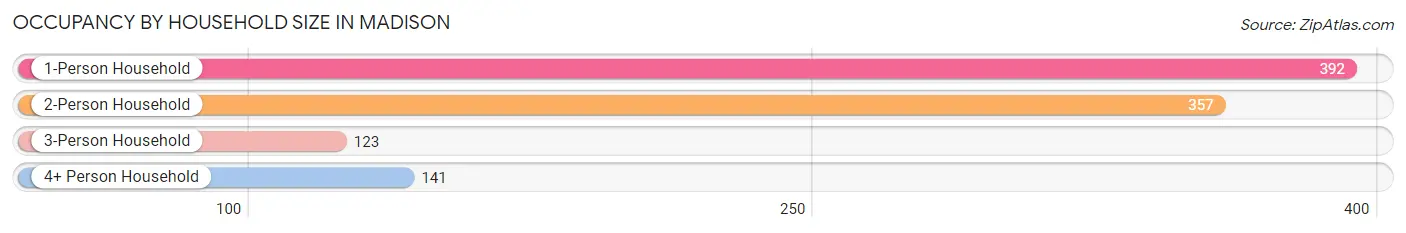
| Household Size | # Housing Units | % Housing Units |
| 1-Person Household | 392 | 38.7% |
| 2-Person Household | 357 | 35.2% |
| 3-Person Household | 123 | 12.1% |
| 4+ Person Household | 141 | 13.9% |
| Total Housing Units | 1,013 | 100.0% |
Occupancy by Ownership by Household Size in Madison
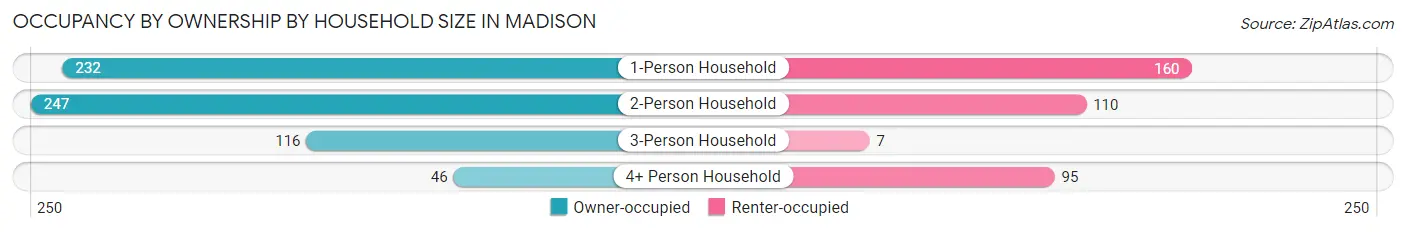
| Household Size | Owner-occupied | Renter-occupied |
| 1-Person Household | 232 (59.2%) | 160 (40.8%) |
| 2-Person Household | 247 (69.2%) | 110 (30.8%) |
| 3-Person Household | 116 (94.3%) | 7 (5.7%) |
| 4+ Person Household | 46 (32.6%) | 95 (67.4%) |
| Total Housing Units | 641 (63.3%) | 372 (36.7%) |
Occupancy by Educational Attainment in Madison
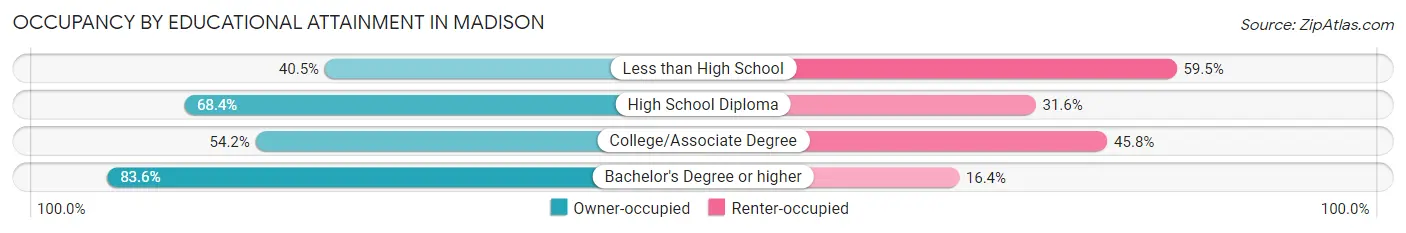
| Household Size | Owner-occupied | Renter-occupied |
| Less than High School | 53 (40.5%) | 78 (59.5%) |
| High School Diploma | 184 (68.4%) | 85 (31.6%) |
| College/Associate Degree | 200 (54.2%) | 169 (45.8%) |
| Bachelor's Degree or higher | 204 (83.6%) | 40 (16.4%) |
Occupancy by Age of Householder in Madison
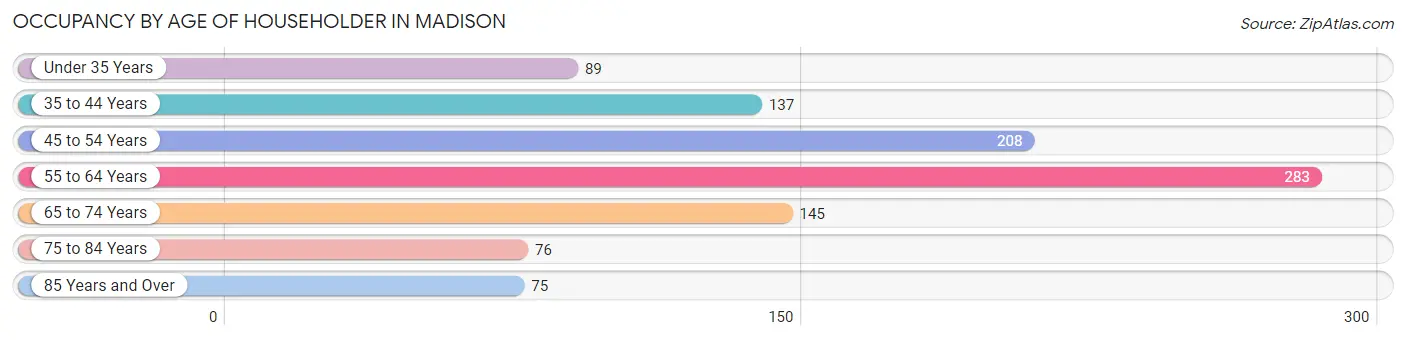
| Age Bracket | # Households | % Households |
| Under 35 Years | 89 | 8.8% |
| 35 to 44 Years | 137 | 13.5% |
| 45 to 54 Years | 208 | 20.5% |
| 55 to 64 Years | 283 | 27.9% |
| 65 to 74 Years | 145 | 14.3% |
| 75 to 84 Years | 76 | 7.5% |
| 85 Years and Over | 75 | 7.4% |
| Total | 1,013 | 100.0% |
Housing Finances in Madison
Median Income by Occupancy in Madison
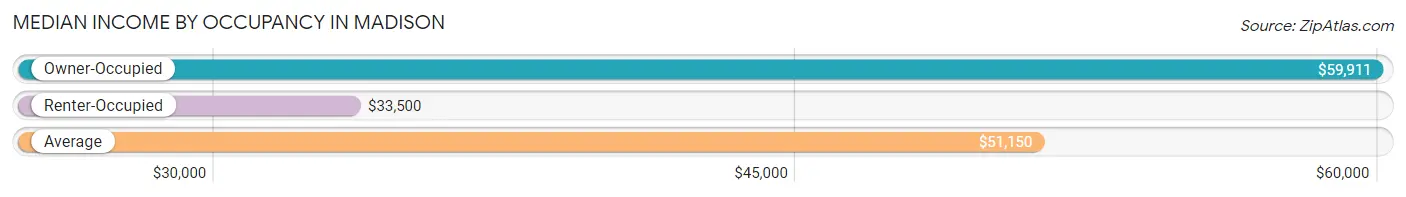
| Occupancy Type | # Households | Median Income |
| Owner-Occupied | 641 (63.3%) | $59,911 |
| Renter-Occupied | 372 (36.7%) | $33,500 |
| Average | 1,013 (100.0%) | $51,150 |
Occupancy by Householder Income Bracket in Madison
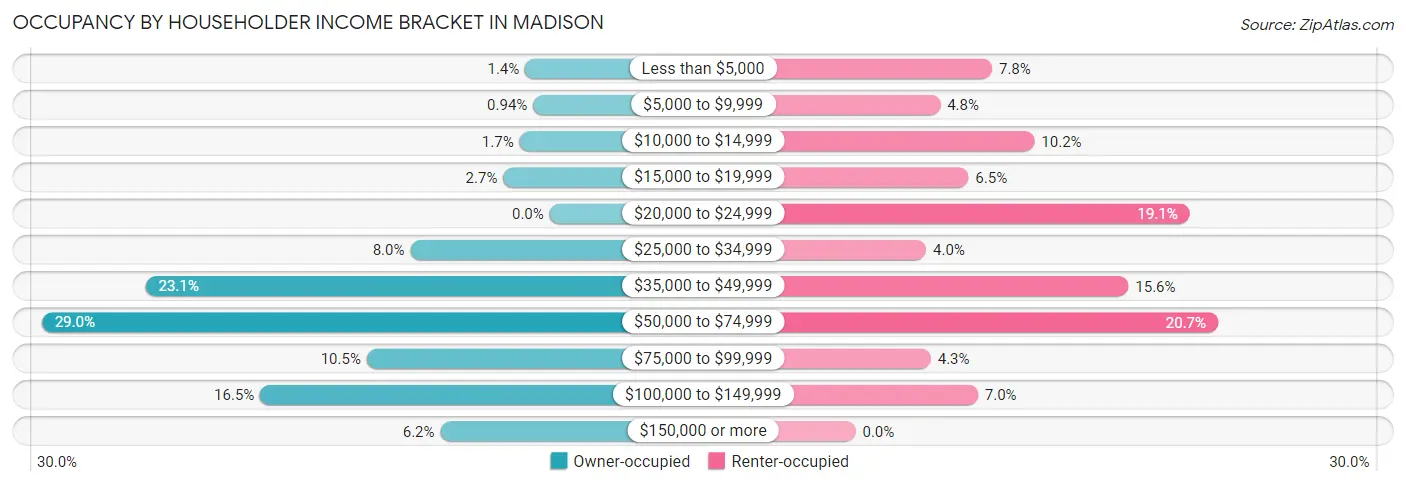
| Income Bracket | Owner-occupied | Renter-occupied |
| Less than $5,000 | 9 (1.4%) | 29 (7.8%) |
| $5,000 to $9,999 | 6 (0.9%) | 18 (4.8%) |
| $10,000 to $14,999 | 11 (1.7%) | 38 (10.2%) |
| $15,000 to $19,999 | 17 (2.6%) | 24 (6.5%) |
| $20,000 to $24,999 | 0 (0.0%) | 71 (19.1%) |
| $25,000 to $34,999 | 51 (8.0%) | 15 (4.0%) |
| $35,000 to $49,999 | 148 (23.1%) | 58 (15.6%) |
| $50,000 to $74,999 | 186 (29.0%) | 77 (20.7%) |
| $75,000 to $99,999 | 67 (10.4%) | 16 (4.3%) |
| $100,000 to $149,999 | 106 (16.5%) | 26 (7.0%) |
| $150,000 or more | 40 (6.2%) | 0 (0.0%) |
| Total | 641 (100.0%) | 372 (100.0%) |
Monthly Housing Cost Tiers in Madison
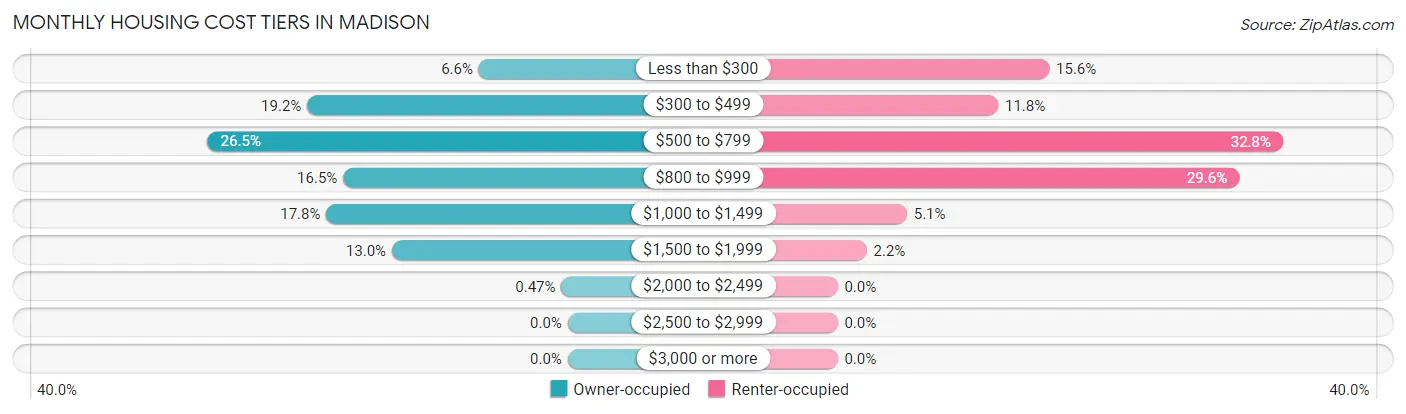
| Monthly Cost | Owner-occupied | Renter-occupied |
| Less than $300 | 42 (6.6%) | 58 (15.6%) |
| $300 to $499 | 123 (19.2%) | 44 (11.8%) |
| $500 to $799 | 170 (26.5%) | 122 (32.8%) |
| $800 to $999 | 106 (16.5%) | 110 (29.6%) |
| $1,000 to $1,499 | 114 (17.8%) | 19 (5.1%) |
| $1,500 to $1,999 | 83 (13.0%) | 8 (2.1%) |
| $2,000 to $2,499 | 3 (0.5%) | 0 (0.0%) |
| $2,500 to $2,999 | 0 (0.0%) | 0 (0.0%) |
| $3,000 or more | 0 (0.0%) | 0 (0.0%) |
| Total | 641 (100.0%) | 372 (100.0%) |
Physical Housing Characteristics in Madison
Housing Structures in Madison
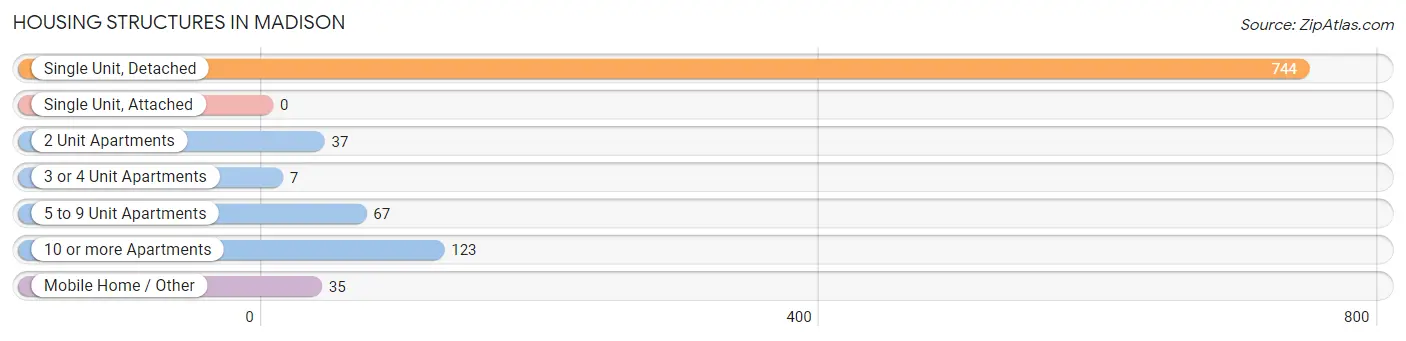
| Structure Type | # Housing Units | % Housing Units |
| Single Unit, Detached | 744 | 73.5% |
| Single Unit, Attached | 0 | 0.0% |
| 2 Unit Apartments | 37 | 3.6% |
| 3 or 4 Unit Apartments | 7 | 0.7% |
| 5 to 9 Unit Apartments | 67 | 6.6% |
| 10 or more Apartments | 123 | 12.1% |
| Mobile Home / Other | 35 | 3.5% |
| Total | 1,013 | 100.0% |
Housing Structures by Occupancy in Madison
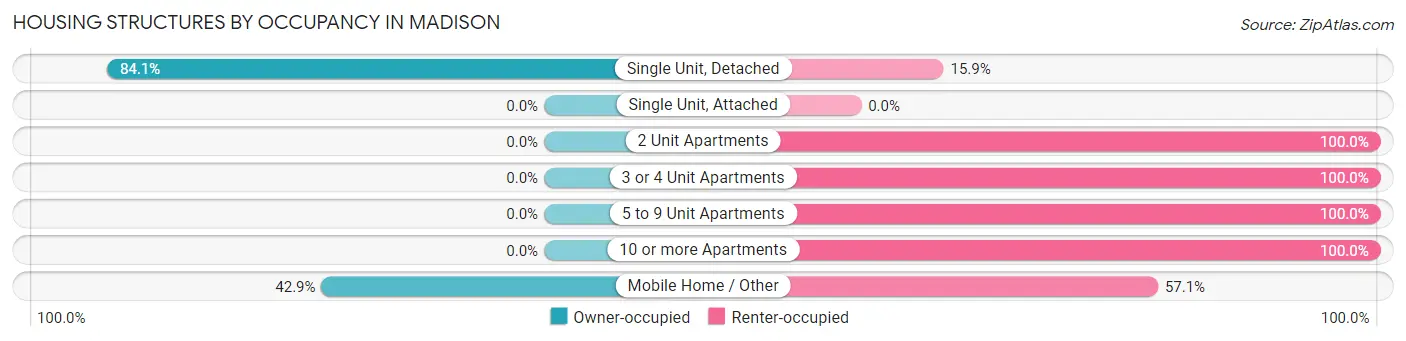
| Structure Type | Owner-occupied | Renter-occupied |
| Single Unit, Detached | 626 (84.1%) | 118 (15.9%) |
| Single Unit, Attached | 0 (0.0%) | 0 (0.0%) |
| 2 Unit Apartments | 0 (0.0%) | 37 (100.0%) |
| 3 or 4 Unit Apartments | 0 (0.0%) | 7 (100.0%) |
| 5 to 9 Unit Apartments | 0 (0.0%) | 67 (100.0%) |
| 10 or more Apartments | 0 (0.0%) | 123 (100.0%) |
| Mobile Home / Other | 15 (42.9%) | 20 (57.1%) |
| Total | 641 (63.3%) | 372 (36.7%) |
Housing Structures by Number of Rooms in Madison
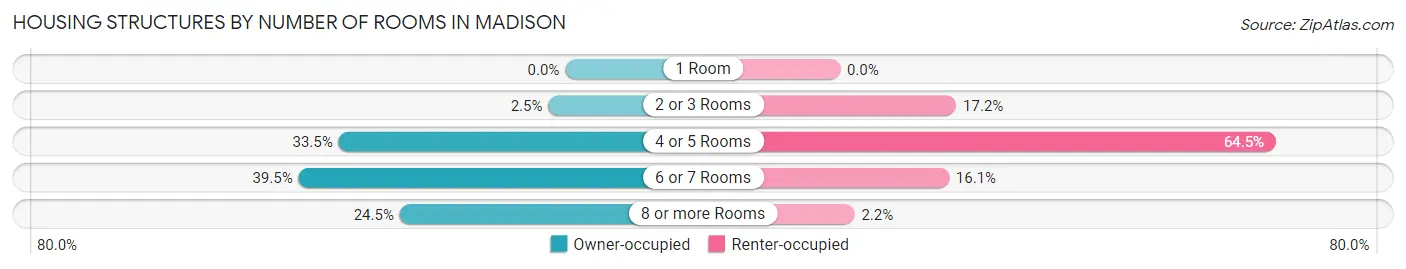
| Number of Rooms | Owner-occupied | Renter-occupied |
| 1 Room | 0 (0.0%) | 0 (0.0%) |
| 2 or 3 Rooms | 16 (2.5%) | 64 (17.2%) |
| 4 or 5 Rooms | 215 (33.5%) | 240 (64.5%) |
| 6 or 7 Rooms | 253 (39.5%) | 60 (16.1%) |
| 8 or more Rooms | 157 (24.5%) | 8 (2.1%) |
| Total | 641 (100.0%) | 372 (100.0%) |
Housing Structure by Heating Type in Madison
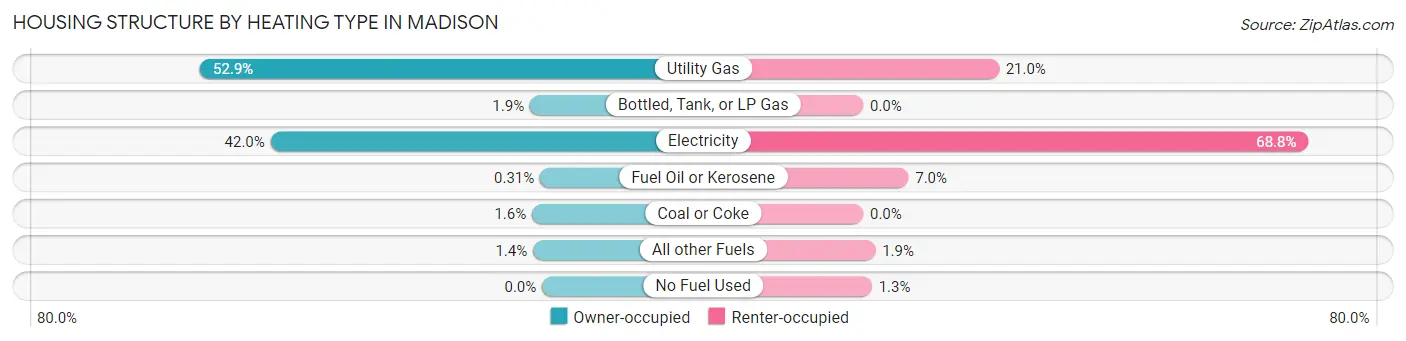
| Heating Type | Owner-occupied | Renter-occupied |
| Utility Gas | 339 (52.9%) | 78 (21.0%) |
| Bottled, Tank, or LP Gas | 12 (1.9%) | 0 (0.0%) |
| Electricity | 269 (42.0%) | 256 (68.8%) |
| Fuel Oil or Kerosene | 2 (0.3%) | 26 (7.0%) |
| Coal or Coke | 10 (1.6%) | 0 (0.0%) |
| All other Fuels | 9 (1.4%) | 7 (1.9%) |
| No Fuel Used | 0 (0.0%) | 5 (1.3%) |
| Total | 641 (100.0%) | 372 (100.0%) |
Household Vehicle Usage in Madison
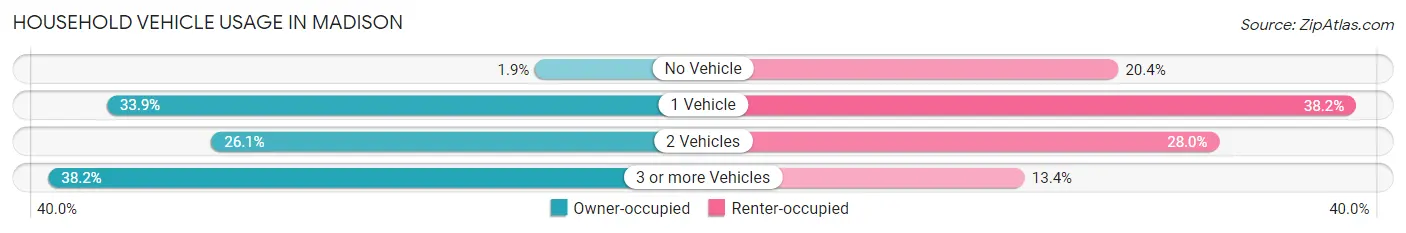
| Vehicles per Household | Owner-occupied | Renter-occupied |
| No Vehicle | 12 (1.9%) | 76 (20.4%) |
| 1 Vehicle | 217 (33.9%) | 142 (38.2%) |
| 2 Vehicles | 167 (26.1%) | 104 (28.0%) |
| 3 or more Vehicles | 245 (38.2%) | 50 (13.4%) |
| Total | 641 (100.0%) | 372 (100.0%) |
Real Estate & Mortgages in Madison
Real Estate and Mortgage Overview in Madison
| Characteristic | Without Mortgage | With Mortgage |
| Housing Units | 244 | 397 |
| Median Property Value | $125,500 | $135,900 |
| Median Household Income | $51,346 | $35 |
| Monthly Housing Costs | $486 | $0 |
| Real Estate Taxes | $1,254 | $4 |
Property Value by Mortgage Status in Madison
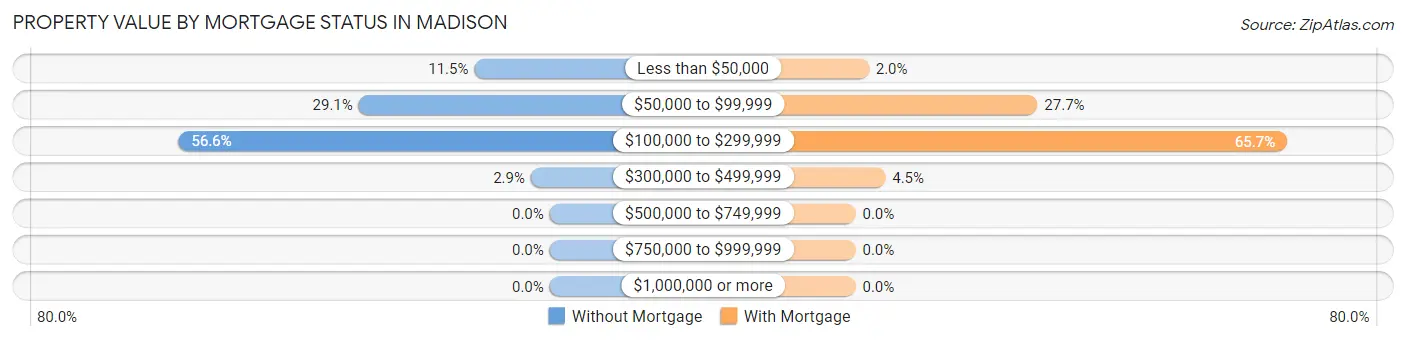
| Property Value | Without Mortgage | With Mortgage |
| Less than $50,000 | 28 (11.5%) | 8 (2.0%) |
| $50,000 to $99,999 | 71 (29.1%) | 110 (27.7%) |
| $100,000 to $299,999 | 138 (56.6%) | 261 (65.7%) |
| $300,000 to $499,999 | 7 (2.9%) | 18 (4.5%) |
| $500,000 to $749,999 | 0 (0.0%) | 0 (0.0%) |
| $750,000 to $999,999 | 0 (0.0%) | 0 (0.0%) |
| $1,000,000 or more | 0 (0.0%) | 0 (0.0%) |
| Total | 244 (100.0%) | 397 (100.0%) |
Household Income by Mortgage Status in Madison
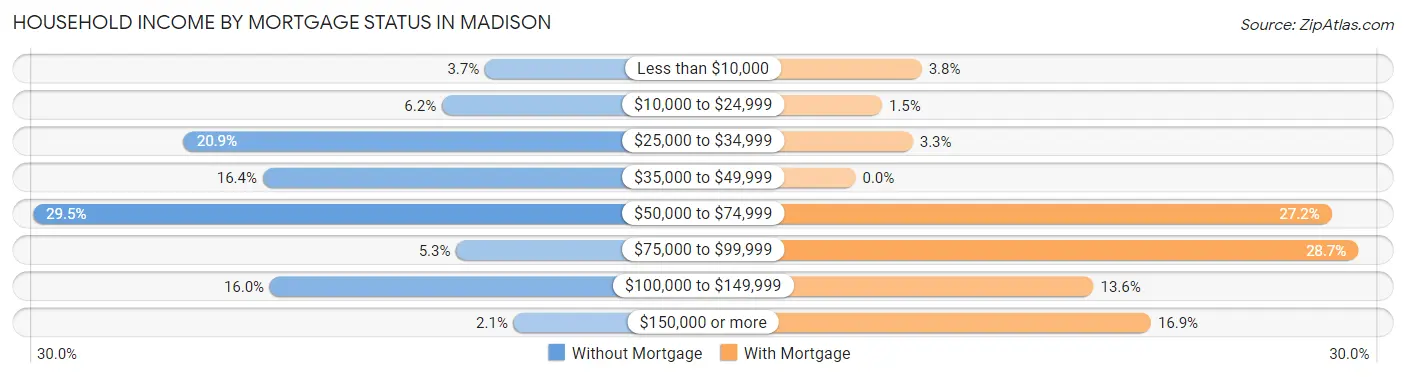
| Household Income | Without Mortgage | With Mortgage |
| Less than $10,000 | 9 (3.7%) | 15 (3.8%) |
| $10,000 to $24,999 | 15 (6.1%) | 6 (1.5%) |
| $25,000 to $34,999 | 51 (20.9%) | 13 (3.3%) |
| $35,000 to $49,999 | 40 (16.4%) | 0 (0.0%) |
| $50,000 to $74,999 | 72 (29.5%) | 108 (27.2%) |
| $75,000 to $99,999 | 13 (5.3%) | 114 (28.7%) |
| $100,000 to $149,999 | 39 (16.0%) | 54 (13.6%) |
| $150,000 or more | 5 (2.1%) | 67 (16.9%) |
| Total | 244 (100.0%) | 397 (100.0%) |
Property Value to Household Income Ratio in Madison
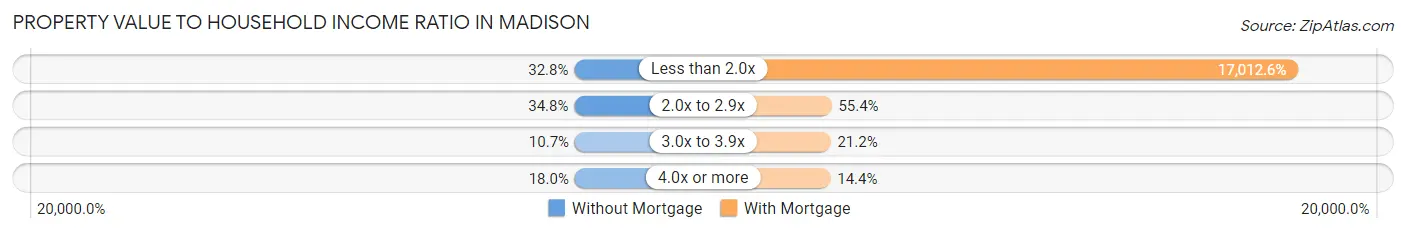
| Value-to-Income Ratio | Without Mortgage | With Mortgage |
| Less than 2.0x | 80 (32.8%) | 67,540 (17,012.6%) |
| 2.0x to 2.9x | 85 (34.8%) | 220 (55.4%) |
| 3.0x to 3.9x | 26 (10.7%) | 84 (21.2%) |
| 4.0x or more | 44 (18.0%) | 57 (14.4%) |
| Total | 244 (100.0%) | 397 (100.0%) |
Real Estate Taxes by Mortgage Status in Madison
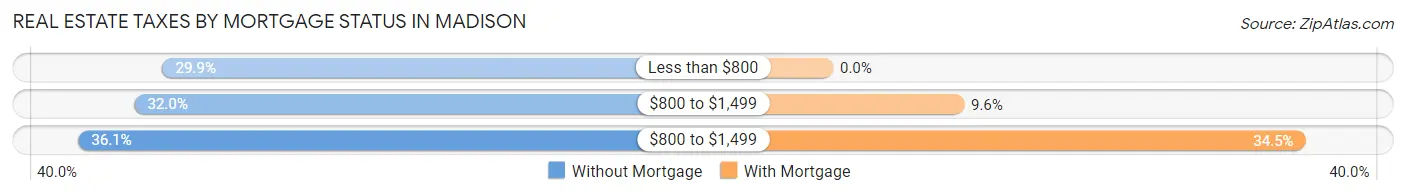
| Property Taxes | Without Mortgage | With Mortgage |
| Less than $800 | 73 (29.9%) | 0 (0.0%) |
| $800 to $1,499 | 78 (32.0%) | 38 (9.6%) |
| $800 to $1,499 | 88 (36.1%) | 137 (34.5%) |
| Total | 244 (100.0%) | 397 (100.0%) |
Health & Disability in Madison
Health Insurance Coverage by Age in Madison
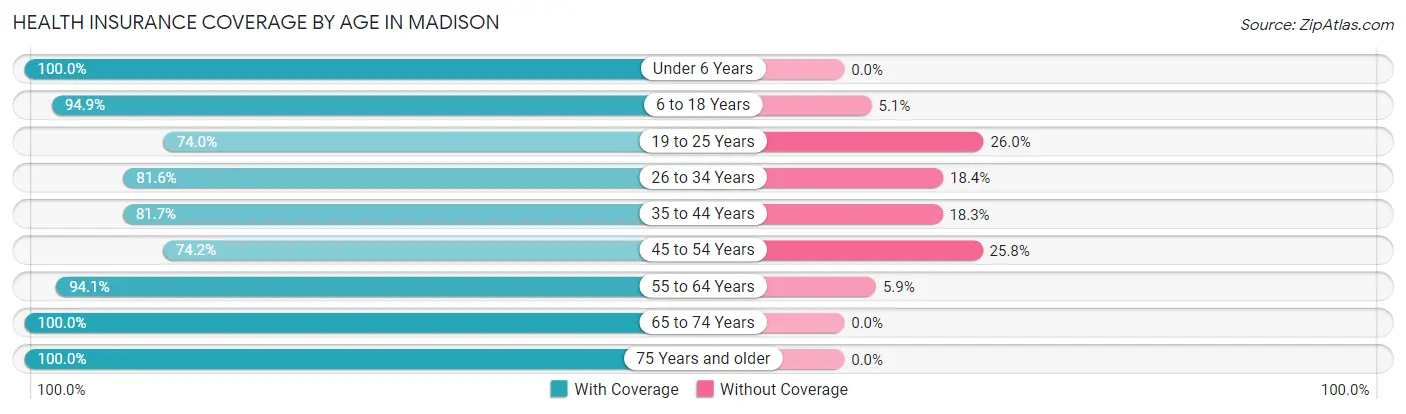
| Age Bracket | With Coverage | Without Coverage |
| Under 6 Years | 114 (100.0%) | 0 (0.0%) |
| 6 to 18 Years | 224 (94.9%) | 12 (5.1%) |
| 19 to 25 Years | 154 (74.0%) | 54 (26.0%) |
| 26 to 34 Years | 177 (81.6%) | 40 (18.4%) |
| 35 to 44 Years | 183 (81.7%) | 41 (18.3%) |
| 45 to 54 Years | 236 (74.2%) | 82 (25.8%) |
| 55 to 64 Years | 398 (94.1%) | 25 (5.9%) |
| 65 to 74 Years | 204 (100.0%) | 0 (0.0%) |
| 75 Years and older | 241 (100.0%) | 0 (0.0%) |
| Total | 1,931 (88.4%) | 254 (11.6%) |
Health Insurance Coverage by Citizenship Status in Madison
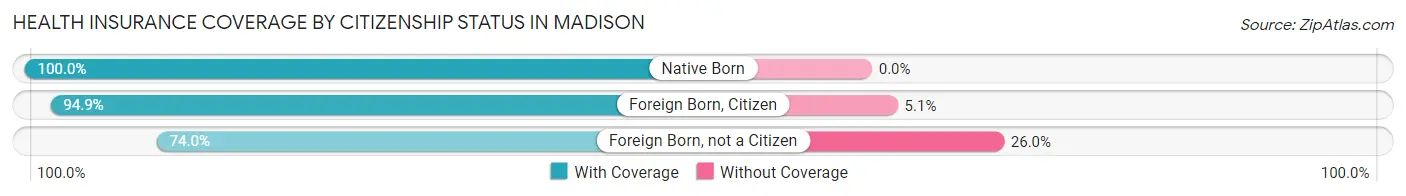
| Citizenship Status | With Coverage | Without Coverage |
| Native Born | 114 (100.0%) | 0 (0.0%) |
| Foreign Born, Citizen | 224 (94.9%) | 12 (5.1%) |
| Foreign Born, not a Citizen | 154 (74.0%) | 54 (26.0%) |
Health Insurance Coverage by Household Income in Madison
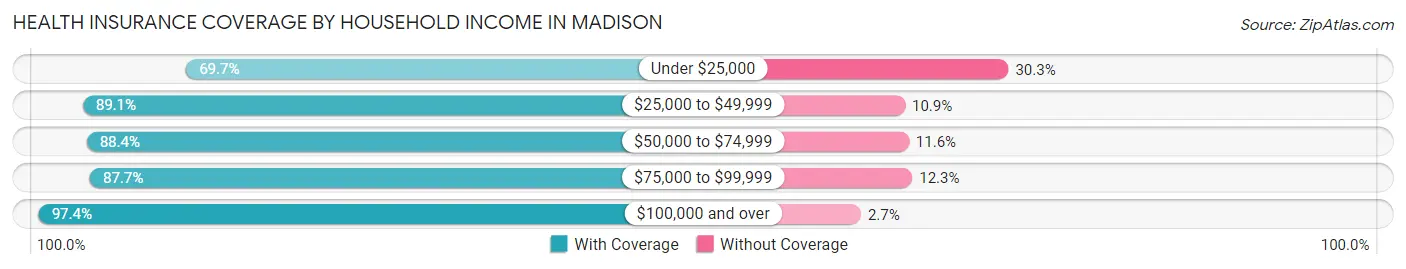
| Household Income | With Coverage | Without Coverage |
| Under $25,000 | 191 (69.7%) | 83 (30.3%) |
| $25,000 to $49,999 | 482 (89.1%) | 59 (10.9%) |
| $50,000 to $74,999 | 592 (88.4%) | 78 (11.6%) |
| $75,000 to $99,999 | 143 (87.7%) | 20 (12.3%) |
| $100,000 and over | 514 (97.4%) | 14 (2.6%) |
Public vs Private Health Insurance Coverage by Age in Madison
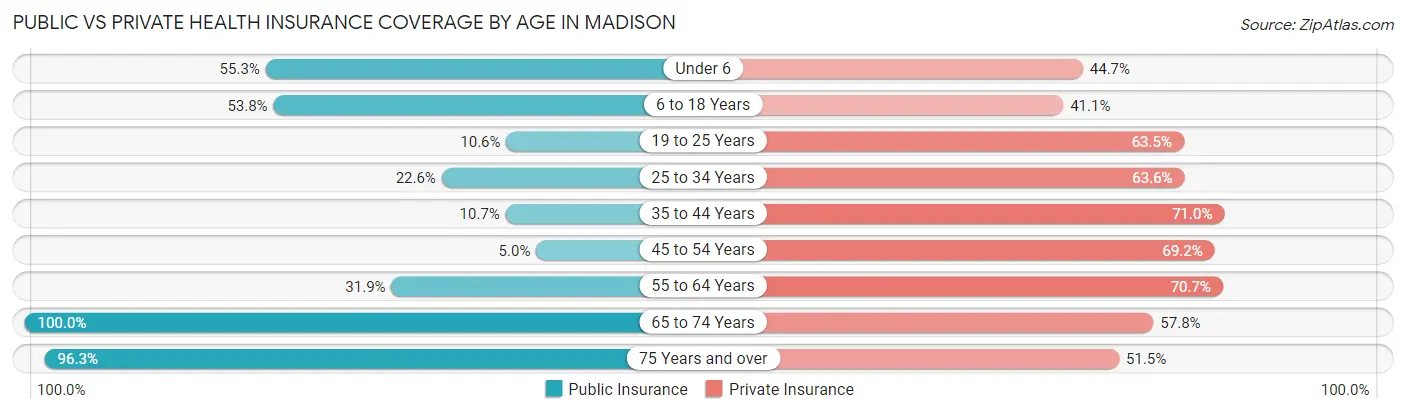
| Age Bracket | Public Insurance | Private Insurance |
| Under 6 | 63 (55.3%) | 51 (44.7%) |
| 6 to 18 Years | 127 (53.8%) | 97 (41.1%) |
| 19 to 25 Years | 22 (10.6%) | 132 (63.5%) |
| 25 to 34 Years | 49 (22.6%) | 138 (63.6%) |
| 35 to 44 Years | 24 (10.7%) | 159 (71.0%) |
| 45 to 54 Years | 16 (5.0%) | 220 (69.2%) |
| 55 to 64 Years | 135 (31.9%) | 299 (70.7%) |
| 65 to 74 Years | 204 (100.0%) | 118 (57.8%) |
| 75 Years and over | 232 (96.3%) | 124 (51.4%) |
| Total | 872 (39.9%) | 1,338 (61.2%) |
Disability Status by Sex by Age in Madison
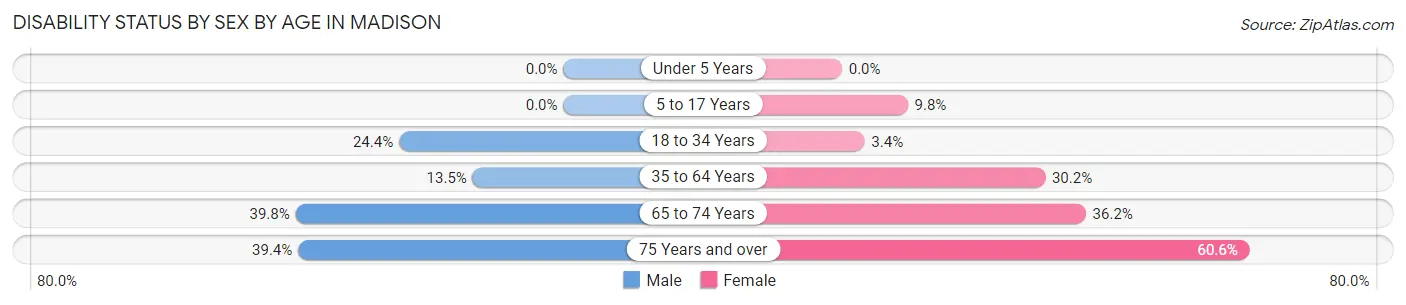
| Age Bracket | Male | Female |
| Under 5 Years | 0 (0.0%) | 0 (0.0%) |
| 5 to 17 Years | 0 (0.0%) | 13 (9.8%) |
| 18 to 34 Years | 73 (24.4%) | 5 (3.4%) |
| 35 to 64 Years | 59 (13.5%) | 159 (30.2%) |
| 65 to 74 Years | 35 (39.8%) | 42 (36.2%) |
| 75 Years and over | 39 (39.4%) | 86 (60.6%) |
Disability Class by Sex by Age in Madison
Disability Class: Hearing Difficulty
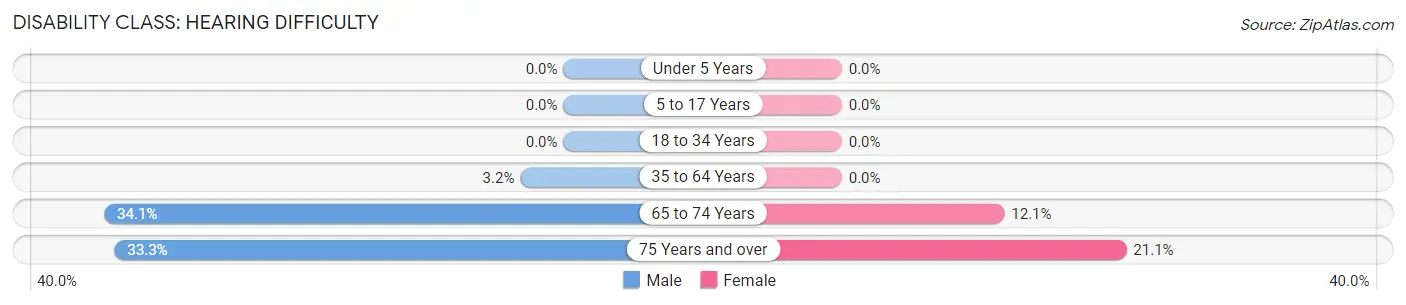
| Age Bracket | Male | Female |
| Under 5 Years | 0 (0.0%) | 0 (0.0%) |
| 5 to 17 Years | 0 (0.0%) | 0 (0.0%) |
| 18 to 34 Years | 0 (0.0%) | 0 (0.0%) |
| 35 to 64 Years | 14 (3.2%) | 0 (0.0%) |
| 65 to 74 Years | 30 (34.1%) | 14 (12.1%) |
| 75 Years and over | 33 (33.3%) | 30 (21.1%) |
Disability Class: Vision Difficulty
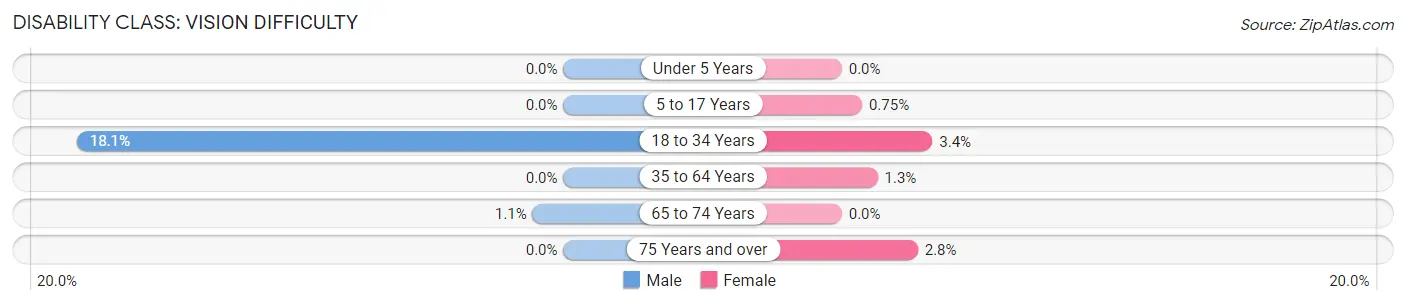
| Age Bracket | Male | Female |
| Under 5 Years | 0 (0.0%) | 0 (0.0%) |
| 5 to 17 Years | 0 (0.0%) | 1 (0.7%) |
| 18 to 34 Years | 54 (18.1%) | 5 (3.4%) |
| 35 to 64 Years | 0 (0.0%) | 7 (1.3%) |
| 65 to 74 Years | 1 (1.1%) | 0 (0.0%) |
| 75 Years and over | 0 (0.0%) | 4 (2.8%) |
Disability Class: Cognitive Difficulty
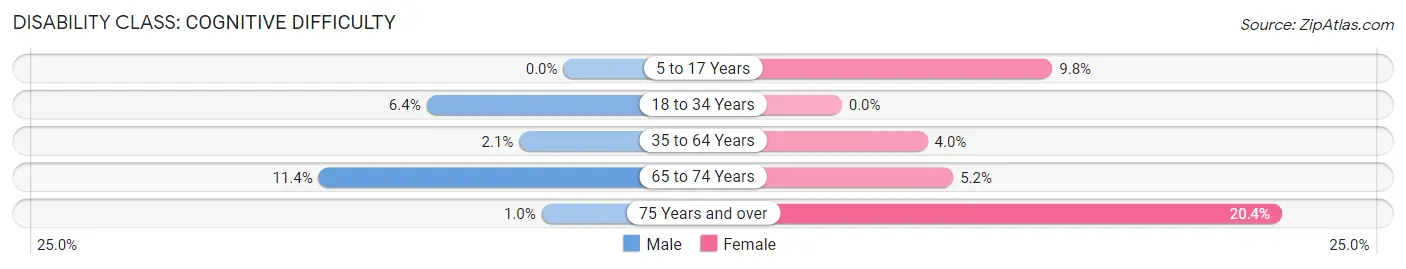
| Age Bracket | Male | Female |
| 5 to 17 Years | 0 (0.0%) | 13 (9.8%) |
| 18 to 34 Years | 19 (6.4%) | 0 (0.0%) |
| 35 to 64 Years | 9 (2.1%) | 21 (4.0%) |
| 65 to 74 Years | 10 (11.4%) | 6 (5.2%) |
| 75 Years and over | 1 (1.0%) | 29 (20.4%) |
Disability Class: Ambulatory Difficulty
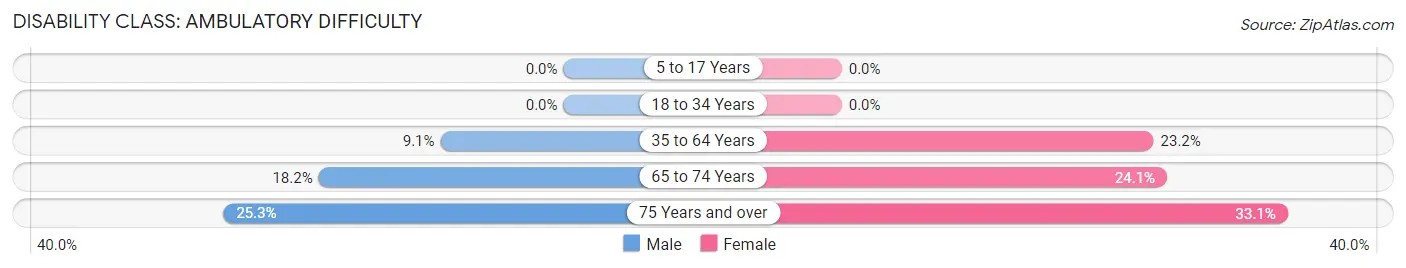
| Age Bracket | Male | Female |
| 5 to 17 Years | 0 (0.0%) | 0 (0.0%) |
| 18 to 34 Years | 0 (0.0%) | 0 (0.0%) |
| 35 to 64 Years | 40 (9.1%) | 122 (23.2%) |
| 65 to 74 Years | 16 (18.2%) | 28 (24.1%) |
| 75 Years and over | 25 (25.3%) | 47 (33.1%) |
Disability Class: Self-Care Difficulty
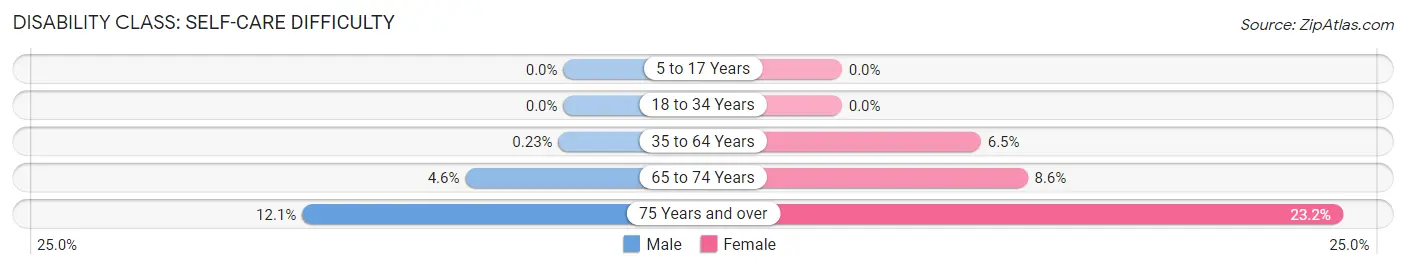
| Age Bracket | Male | Female |
| 5 to 17 Years | 0 (0.0%) | 0 (0.0%) |
| 18 to 34 Years | 0 (0.0%) | 0 (0.0%) |
| 35 to 64 Years | 1 (0.2%) | 34 (6.5%) |
| 65 to 74 Years | 4 (4.5%) | 10 (8.6%) |
| 75 Years and over | 12 (12.1%) | 33 (23.2%) |
Technology Access in Madison
Computing Device Access in Madison
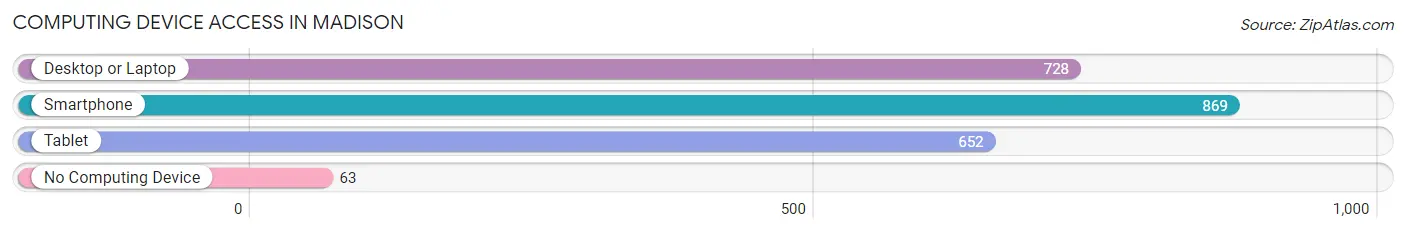
| Device Type | # Households | % Households |
| Desktop or Laptop | 728 | 71.9% |
| Smartphone | 869 | 85.8% |
| Tablet | 652 | 64.4% |
| No Computing Device | 63 | 6.2% |
| Total | 1,013 | 100.0% |
Internet Access in Madison
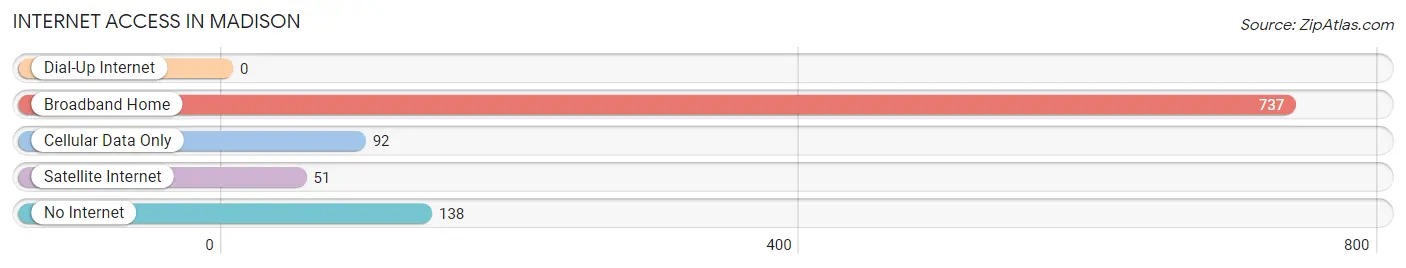
| Internet Type | # Households | % Households |
| Dial-Up Internet | 0 | 0.0% |
| Broadband Home | 737 | 72.8% |
| Cellular Data Only | 92 | 9.1% |
| Satellite Internet | 51 | 5.0% |
| No Internet | 138 | 13.6% |
| Total | 1,013 | 100.0% |
Madison Summary
Madison is a small town located in Rockingham County, North Carolina. It is situated in the Piedmont region of the state, approximately 25 miles north of Greensboro. The town was founded in 1848 and has a population of approximately 1,500 people.
Geography
Madison is located in the Piedmont region of North Carolina, which is characterized by rolling hills and valleys. The town is situated on the banks of the Dan River, which is a tributary of the Roanoke River. The town is surrounded by the towns of Mayodan, Stoneville, and Reidsville. The town is located at an elevation of 845 feet above sea level.
Economy
The economy of Madison is largely based on agriculture and manufacturing. The town is home to several small businesses, including a furniture factory, a textile mill, and a sawmill. The town also has a number of retail stores, restaurants, and other services.
Demographics
As of the 2010 census, the population of Madison was 1,500. The racial makeup of the town was 94.2% White, 3.3% African American, 0.7% Native American, 0.3% Asian, and 1.5% from other races. The median household income was $31,250, and the median family income was $37,500.
History
Madison was founded in 1848 by a group of settlers from Virginia. The town was named after James Madison, the fourth President of the United States. The town was incorporated in 1851 and has remained relatively unchanged since then.
The town was an important stop on the North Carolina Railroad, which ran from Charlotte to Danville, Virginia. The railroad was an important factor in the town's growth and development. The town was also home to several mills, which provided employment for many of the town's residents.
In the late 19th century, Madison was a popular destination for tourists. The town was known for its mineral springs, which were believed to have healing properties. The town also had several hotels and resorts, which attracted visitors from all over the country.
In the early 20th century, Madison was a center of the textile industry. The town was home to several mills, which produced cotton, wool, and other fabrics. The town was also home to several furniture factories, which produced furniture for the local market.
Today, Madison is a small town with a population of approximately 1,500 people. The town is still home to several small businesses, including a furniture factory, a textile mill, and a sawmill. The town also has a number of retail stores, restaurants, and other services. The town is also home to several historic sites, including the Madison-Mayodan Historic District, which is listed on the National Register of Historic Places.
Common Questions
What is Per Capita Income in Madison?
Per Capita income in Madison is $29,806.
What is the Median Family Income in Madison?
Median Family Income in Madison is $61,613.
What is the Median Household income in Madison?
Median Household Income in Madison is $51,150.
What is Income or Wage Gap in Madison?
Income or Wage Gap in Madison is 5.4%.
Women in Madison earn 94.6 cents for every dollar earned by a man.
What is Inequality or Gini Index in Madison?
Inequality or Gini Index in Madison is 0.41.
What is the Total Population of Madison?
Total Population of Madison is 2,185.
What is the Total Male Population of Madison?
Total Male Population of Madison is 1,068.
What is the Total Female Population of Madison?
Total Female Population of Madison is 1,117.
What is the Ratio of Males per 100 Females in Madison?
There are 95.61 Males per 100 Females in Madison.
What is the Ratio of Females per 100 Males in Madison?
There are 104.59 Females per 100 Males in Madison.
What is the Median Population Age in Madison?
Median Population Age in Madison is 47.7 Years.
What is the Average Family Size in Madison
Average Family Size in Madison is 2.9 People.
What is the Average Household Size in Madison
Average Household Size in Madison is 2.1 People.
How Large is the Labor Force in Madison?
There are 1,119 People in the Labor Forcein in Madison.
What is the Percentage of People in the Labor Force in Madison?
59.1% of People are in the Labor Force in Madison.
What is the Unemployment Rate in Madison?
Unemployment Rate in Madison is 7.6%.