Dillsboro, NC Map & Demographics
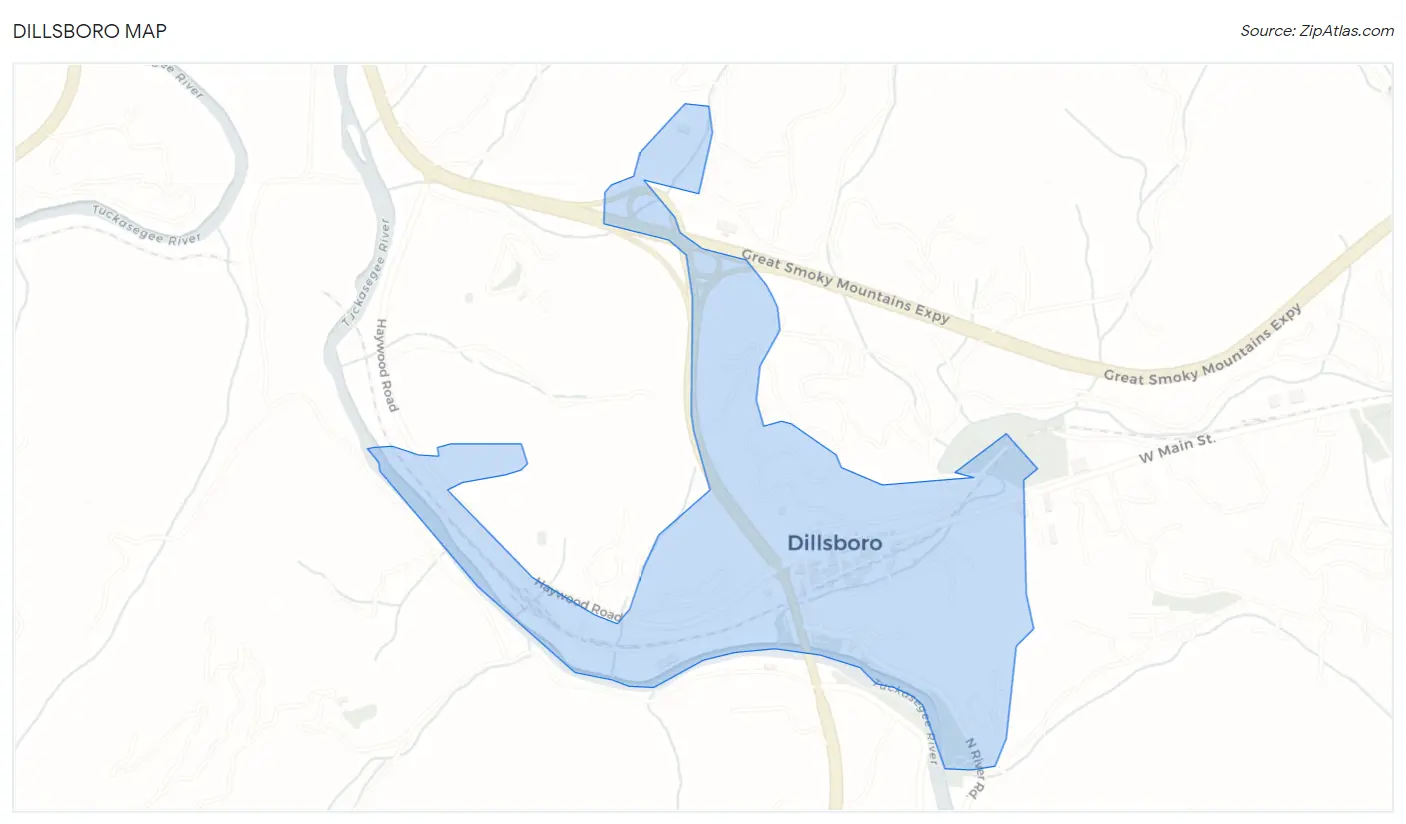
Dillsboro Map
Dillsboro Overview
$34,729
PER CAPITA INCOME
$83,646
AVG FAMILY INCOME
$55,625
AVG HOUSEHOLD INCOME
51.0%
WAGE / INCOME GAP [ % ]
49.0¢/ $1
WAGE / INCOME GAP [ $ ]
0.43
INEQUALITY / GINI INDEX
231
TOTAL POPULATION
89
MALE POPULATION
142
FEMALE POPULATION
62.68
MALES / 100 FEMALES
159.55
FEMALES / 100 MALES
44.5
MEDIAN AGE
2.4
AVG FAMILY SIZE
1.8
AVG HOUSEHOLD SIZE
120
LABOR FORCE [ PEOPLE ]
63.5%
PERCENT IN LABOR FORCE
Dillsboro Zip Codes
Dillsboro Area Codes
Income in Dillsboro
Income Overview in Dillsboro
Per Capita Income in Dillsboro is $34,729, while median incomes of families and households are $83,646 and $55,625 respectively.
| Characteristic | Number | Measure |
| Per Capita Income | 231 | $34,729 |
| Median Family Income | 69 | $83,646 |
| Mean Family Income | 69 | $87,459 |
| Median Household Income | 130 | $55,625 |
| Mean Household Income | 130 | $63,315 |
| Income Deficit | 69 | $0 |
| Wage / Income Gap (%) | 231 | 50.97% |
| Wage / Income Gap ($) | 231 | 49.03¢ per $1 |
| Gini / Inequality Index | 231 | 0.43 |
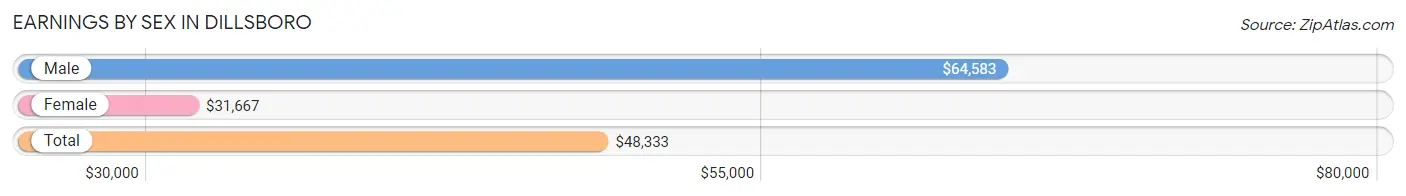
Earnings by Sex in Dillsboro
Average Earnings in Dillsboro are $48,333, $64,583 for men and $31,667 for women, a difference of 51.0%.
| Sex | Number | Average Earnings |
| Male | 66 (48.5%) | $64,583 |
| Female | 70 (51.5%) | $31,667 |
| Total | 136 (100.0%) | $48,333 |
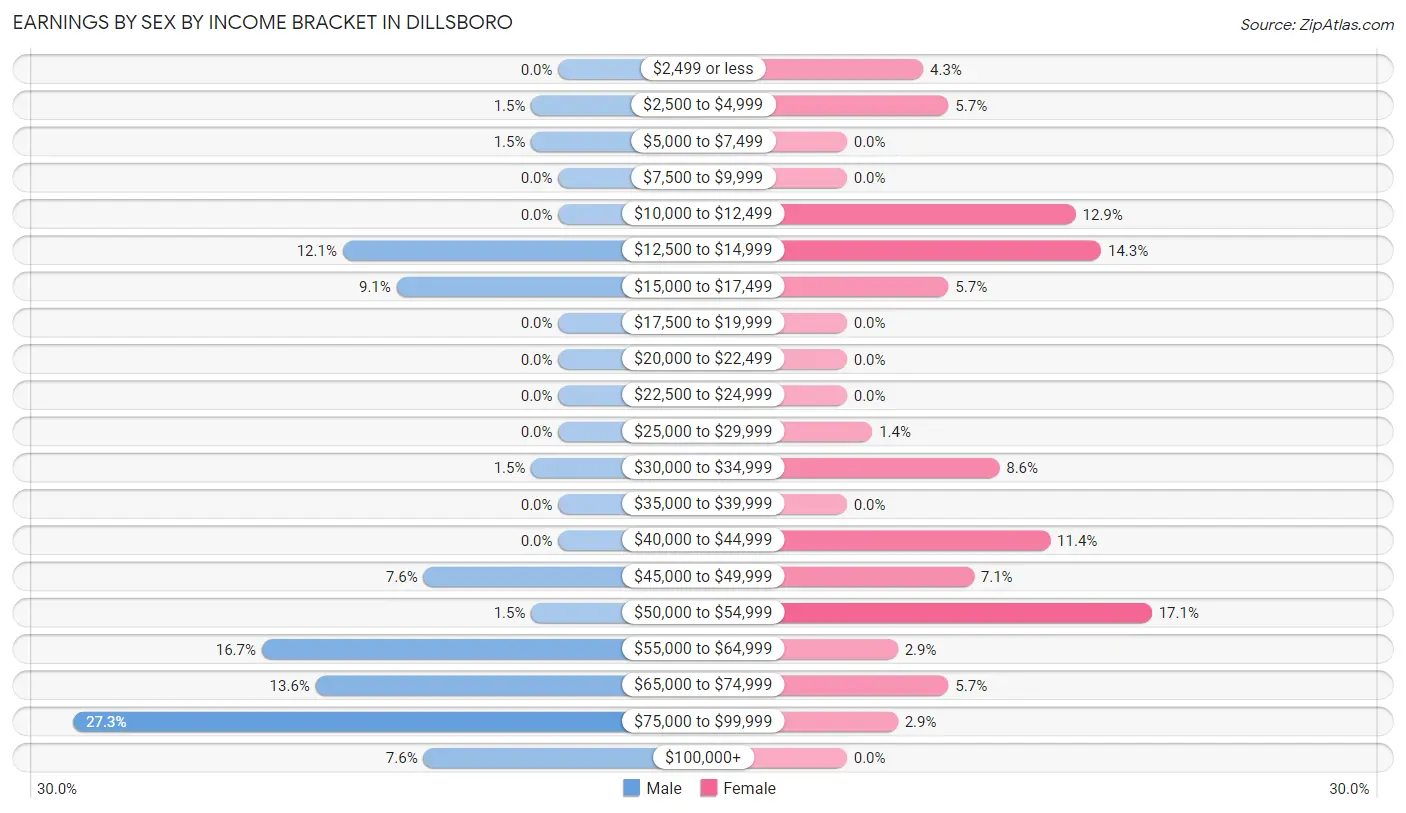
Earnings by Sex by Income Bracket in Dillsboro
The most common earnings brackets in Dillsboro are $75,000 to $99,999 for men (18 | 27.3%) and $50,000 to $54,999 for women (12 | 17.1%).
| Income | Male | Female |
| $2,499 or less | 0 (0.0%) | 3 (4.3%) |
| $2,500 to $4,999 | 1 (1.5%) | 4 (5.7%) |
| $5,000 to $7,499 | 1 (1.5%) | 0 (0.0%) |
| $7,500 to $9,999 | 0 (0.0%) | 0 (0.0%) |
| $10,000 to $12,499 | 0 (0.0%) | 9 (12.9%) |
| $12,500 to $14,999 | 8 (12.1%) | 10 (14.3%) |
| $15,000 to $17,499 | 6 (9.1%) | 4 (5.7%) |
| $17,500 to $19,999 | 0 (0.0%) | 0 (0.0%) |
| $20,000 to $22,499 | 0 (0.0%) | 0 (0.0%) |
| $22,500 to $24,999 | 0 (0.0%) | 0 (0.0%) |
| $25,000 to $29,999 | 0 (0.0%) | 1 (1.4%) |
| $30,000 to $34,999 | 1 (1.5%) | 6 (8.6%) |
| $35,000 to $39,999 | 0 (0.0%) | 0 (0.0%) |
| $40,000 to $44,999 | 0 (0.0%) | 8 (11.4%) |
| $45,000 to $49,999 | 5 (7.6%) | 5 (7.1%) |
| $50,000 to $54,999 | 1 (1.5%) | 12 (17.1%) |
| $55,000 to $64,999 | 11 (16.7%) | 2 (2.9%) |
| $65,000 to $74,999 | 9 (13.6%) | 4 (5.7%) |
| $75,000 to $99,999 | 18 (27.3%) | 2 (2.9%) |
| $100,000+ | 5 (7.6%) | 0 (0.0%) |
| Total | 66 (100.0%) | 70 (100.0%) |
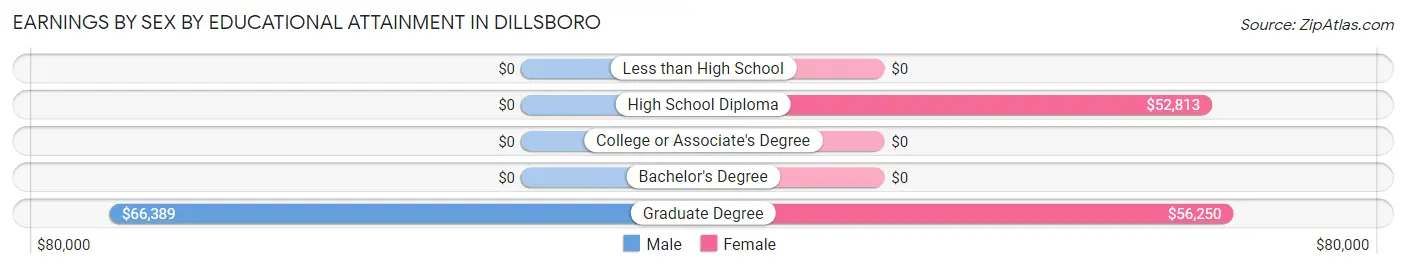
Earnings by Sex by Educational Attainment in Dillsboro
Average earnings in Dillsboro are $65,139 for men and $41,750 for women, a difference of 35.9%. Men with an educational attainment of graduate degree enjoy the highest average annual earnings of $66,389, while those with graduate degree education earn the least with $66,389. Women with an educational attainment of graduate degree earn the most with the average annual earnings of $56,250, while those with high school diploma education have the smallest earnings of $52,813.
| Educational Attainment | Male Income | Female Income |
| Less than High School | - | - |
| High School Diploma | - | - |
| College or Associate's Degree | - | - |
| Bachelor's Degree | - | - |
| Graduate Degree | $66,389 | $56,250 |
| Total | $65,139 | $41,750 |
Family Income in Dillsboro
Family Income Brackets in Dillsboro
According to the Dillsboro family income data, there are 22 families falling into the $75,000 to $99,999 income range, which is the most common income bracket and makes up 31.9% of all families.
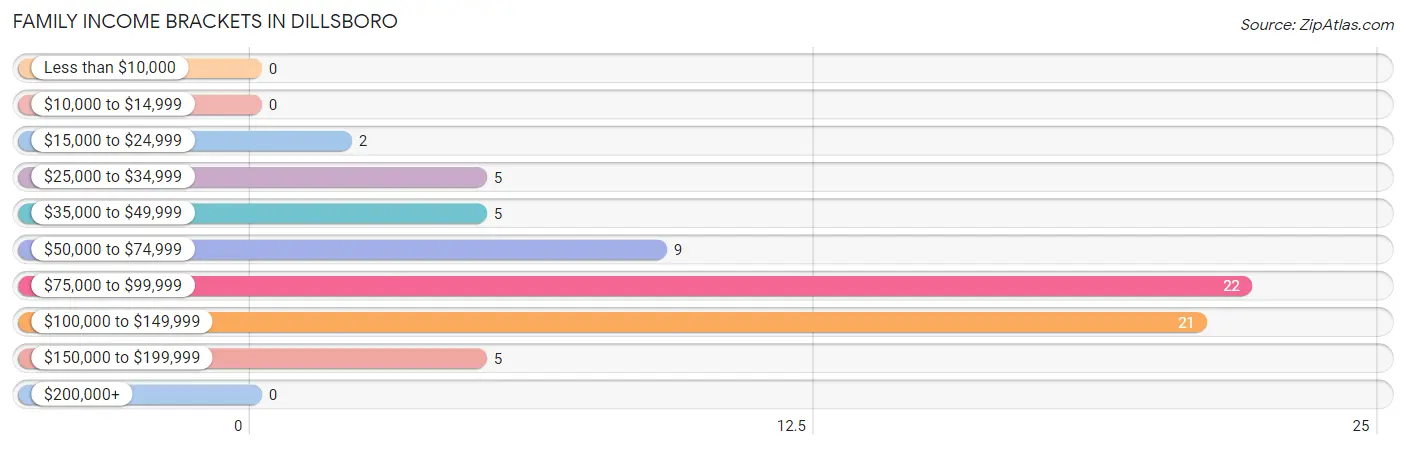
| Income Bracket | # Families | % Families |
| Less than $10,000 | 0 | 0.0% |
| $10,000 to $14,999 | 0 | 0.0% |
| $15,000 to $24,999 | 2 | 2.9% |
| $25,000 to $34,999 | 5 | 7.2% |
| $35,000 to $49,999 | 5 | 7.2% |
| $50,000 to $74,999 | 9 | 13.0% |
| $75,000 to $99,999 | 22 | 31.9% |
| $100,000 to $149,999 | 21 | 30.4% |
| $150,000 to $199,999 | 5 | 7.2% |
| $200,000+ | 0 | 0.0% |
Family Income by Famaliy Size in Dillsboro
2-person families (41 | 59.4%) account for the highest median family income in Dillsboro with $83,854 per family, while 2-person families (41 | 59.4%) have the highest median income of $41,927 per family member.
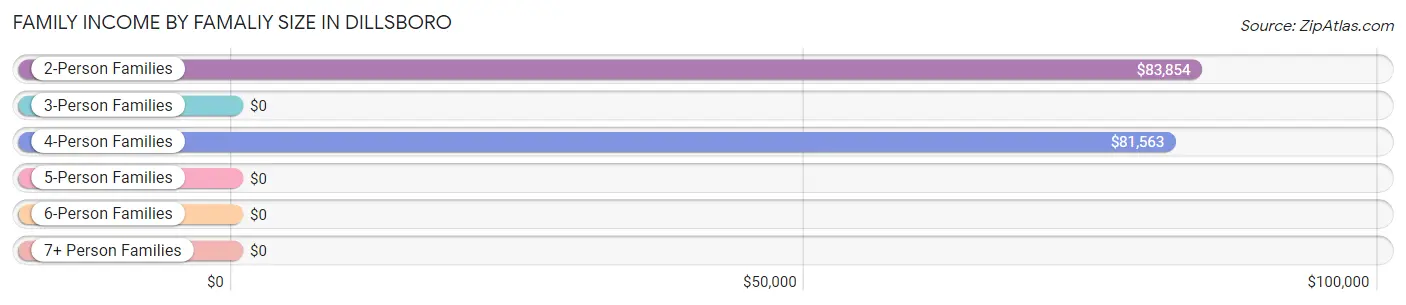
| Income Bracket | # Families | Median Income |
| 2-Person Families | 41 (59.4%) | $83,854 |
| 3-Person Families | 8 (11.6%) | $0 |
| 4-Person Families | 20 (29.0%) | $81,563 |
| 5-Person Families | 0 (0.0%) | $0 |
| 6-Person Families | 0 (0.0%) | $0 |
| 7+ Person Families | 0 (0.0%) | $0 |
| Total | 69 (100.0%) | $83,646 |
Family Income by Number of Earners in Dillsboro
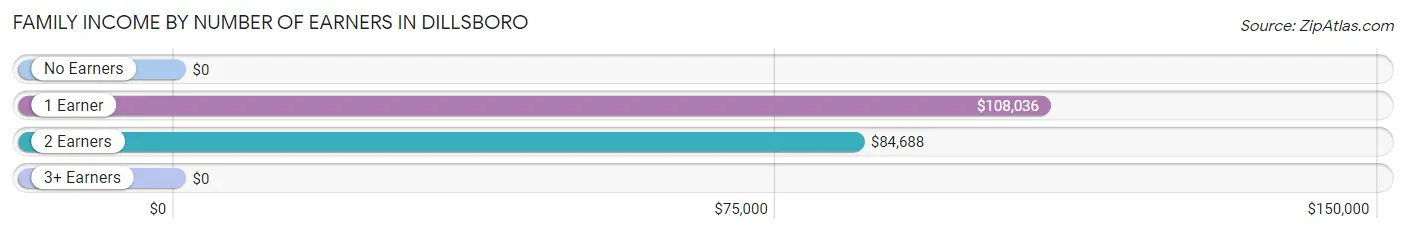
| Number of Earners | # Families | Median Income |
| No Earners | 5 (7.2%) | $0 |
| 1 Earner | 11 (15.9%) | $108,036 |
| 2 Earners | 45 (65.2%) | $84,688 |
| 3+ Earners | 8 (11.6%) | $0 |
| Total | 69 (100.0%) | $83,646 |
Household Income in Dillsboro
Household Income Brackets in Dillsboro
With 25 households falling in the category, the $100,000 to $149,999 income range is the most frequent in Dillsboro, accounting for 19.2% of all households.
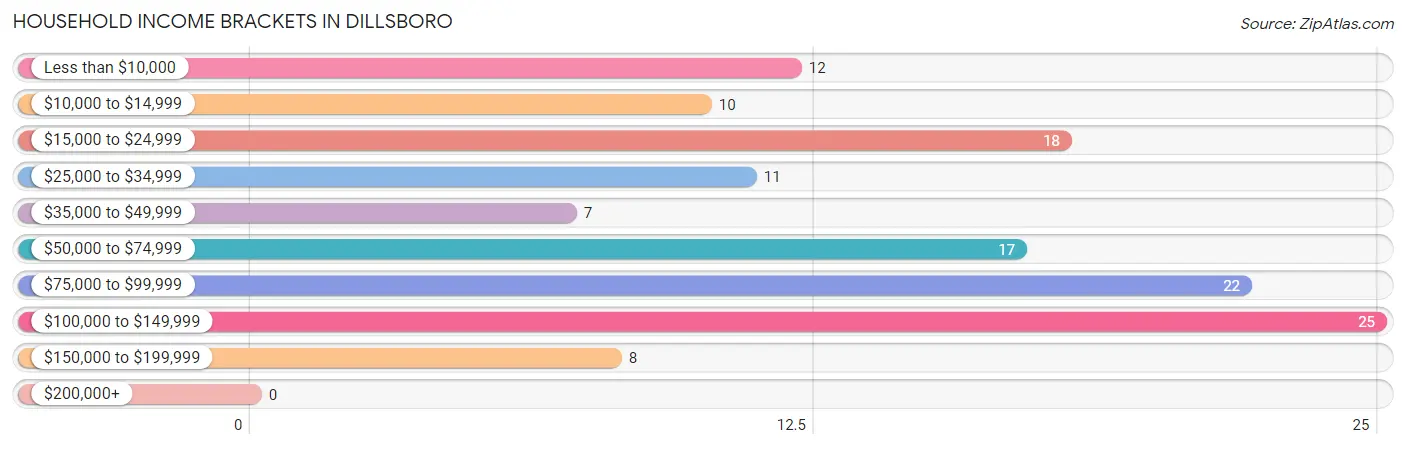
| Income Bracket | # Households | % Households |
| Less than $10,000 | 12 | 9.2% |
| $10,000 to $14,999 | 10 | 7.7% |
| $15,000 to $24,999 | 18 | 13.8% |
| $25,000 to $34,999 | 11 | 8.5% |
| $35,000 to $49,999 | 7 | 5.4% |
| $50,000 to $74,999 | 17 | 13.1% |
| $75,000 to $99,999 | 22 | 16.9% |
| $100,000 to $149,999 | 25 | 19.2% |
| $150,000 to $199,999 | 8 | 6.2% |
| $200,000+ | 0 | 0.0% |
Household Income by Householder Age in Dillsboro
The median household income in Dillsboro is $55,625, with the highest median household income of $80,313 found in the 45 to 64 years age bracket for the primary householder. A total of 46 households (35.4%) fall into this category. Meanwhile, the 15 to 24 years age bracket for the primary householder has the lowest median household income of $0, with 6 households (4.6%) in this group.
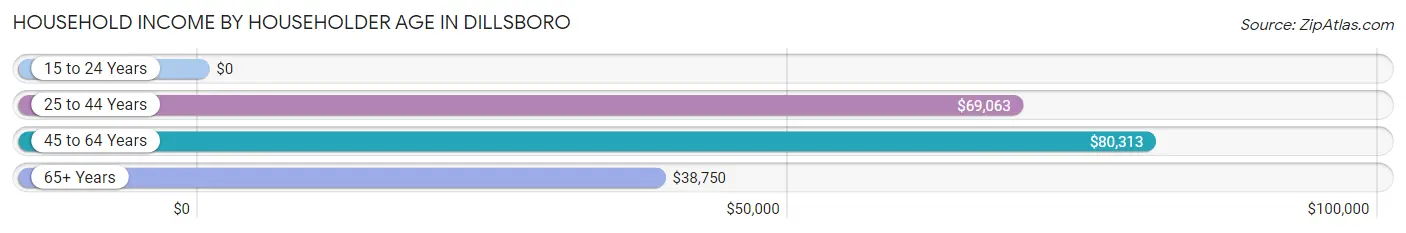
| Income Bracket | # Households | Median Income |
| 15 to 24 Years | 6 (4.6%) | $0 |
| 25 to 44 Years | 37 (28.5%) | $69,063 |
| 45 to 64 Years | 46 (35.4%) | $80,313 |
| 65+ Years | 41 (31.5%) | $38,750 |
| Total | 130 (100.0%) | $55,625 |
Poverty in Dillsboro
Income Below Poverty by Sex and Age in Dillsboro
With 5.6% poverty level for males and 12.7% for females among the residents of Dillsboro, 65 to 74 year old males and 55 to 64 year old females are the most vulnerable to poverty, with 4 males (33.3%) and 10 females (55.6%) in their respective age groups living below the poverty level.
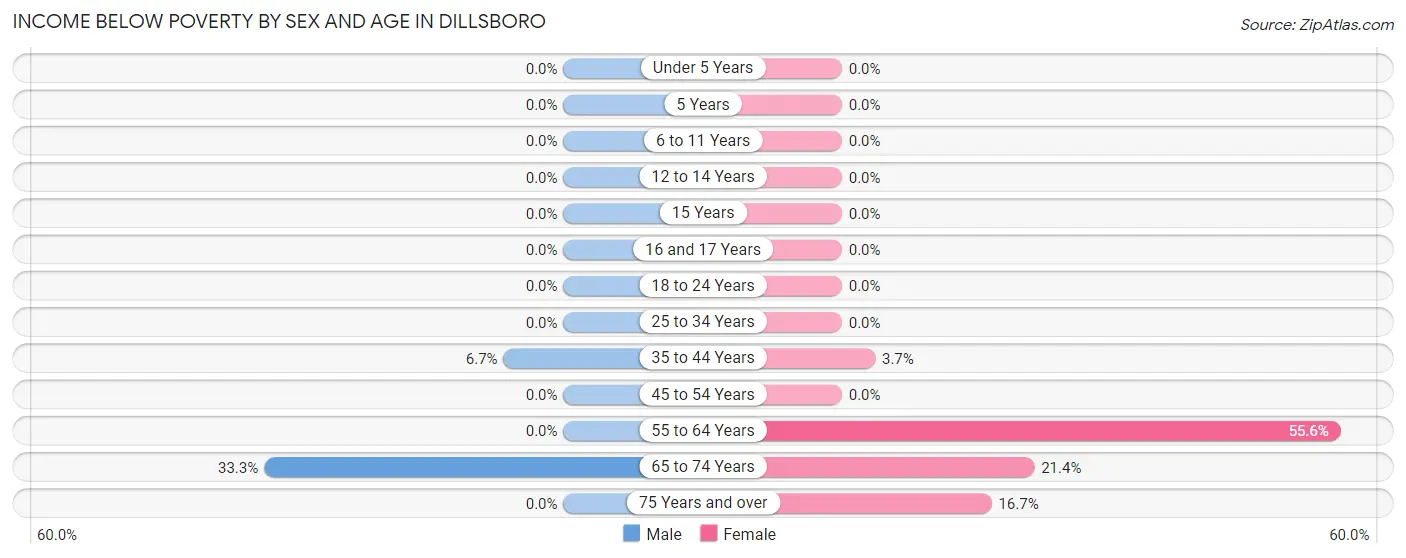
| Age Bracket | Male | Female |
| Under 5 Years | 0 (0.0%) | 0 (0.0%) |
| 5 Years | 0 (0.0%) | 0 (0.0%) |
| 6 to 11 Years | 0 (0.0%) | 0 (0.0%) |
| 12 to 14 Years | 0 (0.0%) | 0 (0.0%) |
| 15 Years | 0 (0.0%) | 0 (0.0%) |
| 16 and 17 Years | 0 (0.0%) | 0 (0.0%) |
| 18 to 24 Years | 0 (0.0%) | 0 (0.0%) |
| 25 to 34 Years | 0 (0.0%) | 0 (0.0%) |
| 35 to 44 Years | 1 (6.7%) | 1 (3.7%) |
| 45 to 54 Years | 0 (0.0%) | 0 (0.0%) |
| 55 to 64 Years | 0 (0.0%) | 10 (55.6%) |
| 65 to 74 Years | 4 (33.3%) | 3 (21.4%) |
| 75 Years and over | 0 (0.0%) | 4 (16.7%) |
| Total | 5 (5.6%) | 18 (12.7%) |
Income Above Poverty by Sex and Age in Dillsboro
According to the poverty statistics in Dillsboro, males aged under 5 years and females aged under 5 years are the age groups that are most secure financially, with 100.0% of males and 100.0% of females in these age groups living above the poverty line.
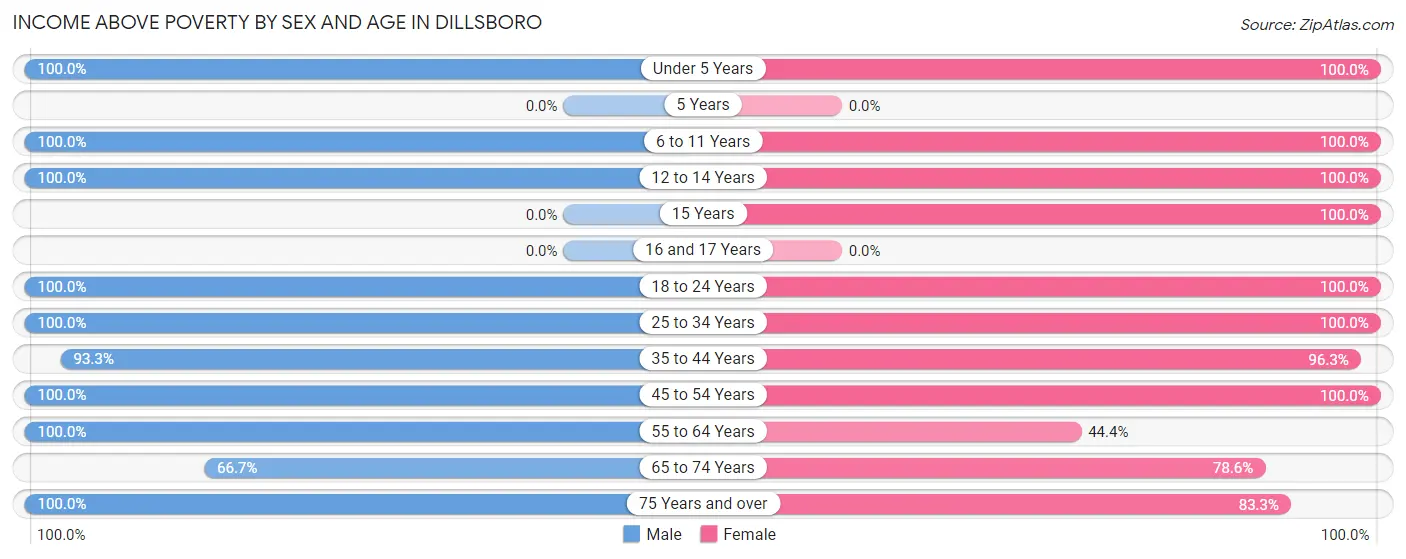
| Age Bracket | Male | Female |
| Under 5 Years | 1 (100.0%) | 6 (100.0%) |
| 5 Years | 0 (0.0%) | 0 (0.0%) |
| 6 to 11 Years | 6 (100.0%) | 6 (100.0%) |
| 12 to 14 Years | 5 (100.0%) | 4 (100.0%) |
| 15 Years | 0 (0.0%) | 14 (100.0%) |
| 16 and 17 Years | 0 (0.0%) | 0 (0.0%) |
| 18 to 24 Years | 3 (100.0%) | 11 (100.0%) |
| 25 to 34 Years | 12 (100.0%) | 14 (100.0%) |
| 35 to 44 Years | 14 (93.3%) | 26 (96.3%) |
| 45 to 54 Years | 20 (100.0%) | 4 (100.0%) |
| 55 to 64 Years | 4 (100.0%) | 8 (44.4%) |
| 65 to 74 Years | 8 (66.7%) | 11 (78.6%) |
| 75 Years and over | 11 (100.0%) | 20 (83.3%) |
| Total | 84 (94.4%) | 124 (87.3%) |
Income Below Poverty Among Married-Couple Families in Dillsboro
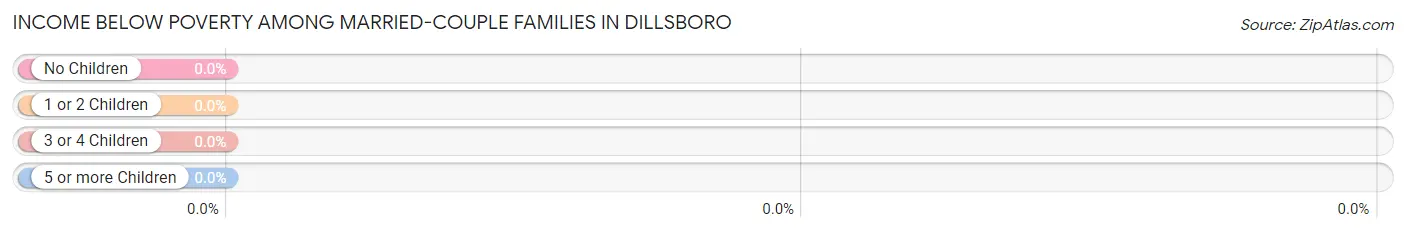
| Children | Above Poverty | Below Poverty |
| No Children | 27 (100.0%) | 0 (0.0%) |
| 1 or 2 Children | 26 (100.0%) | 0 (0.0%) |
| 3 or 4 Children | 0 (0.0%) | 0 (0.0%) |
| 5 or more Children | 0 (0.0%) | 0 (0.0%) |
| Total | 53 (100.0%) | 0 (0.0%) |
Income Below Poverty Among Single-Parent Households in Dillsboro
| Children | Single Father | Single Mother |
| No Children | 0 (0.0%) | 0 (0.0%) |
| 1 or 2 Children | 0 (0.0%) | 0 (0.0%) |
| 3 or 4 Children | 0 (0.0%) | 0 (0.0%) |
| 5 or more Children | 0 (0.0%) | 0 (0.0%) |
| Total | 0 (0.0%) | 0 (0.0%) |
Income Below Poverty Among Married-Couple vs Single-Parent Households in Dillsboro
| Children | Married-Couple Families | Single-Parent Households |
| No Children | 0 (0.0%) | 0 (0.0%) |
| 1 or 2 Children | 0 (0.0%) | 0 (0.0%) |
| 3 or 4 Children | 0 (0.0%) | 0 (0.0%) |
| 5 or more Children | 0 (0.0%) | 0 (0.0%) |
| Total | 0 (0.0%) | 0 (0.0%) |
Race in Dillsboro
The most populous races in Dillsboro are White / Caucasian (180 | 77.9%), Two or more Races (35 | 15.1%), and Native / Alaskan (10 | 4.3%).
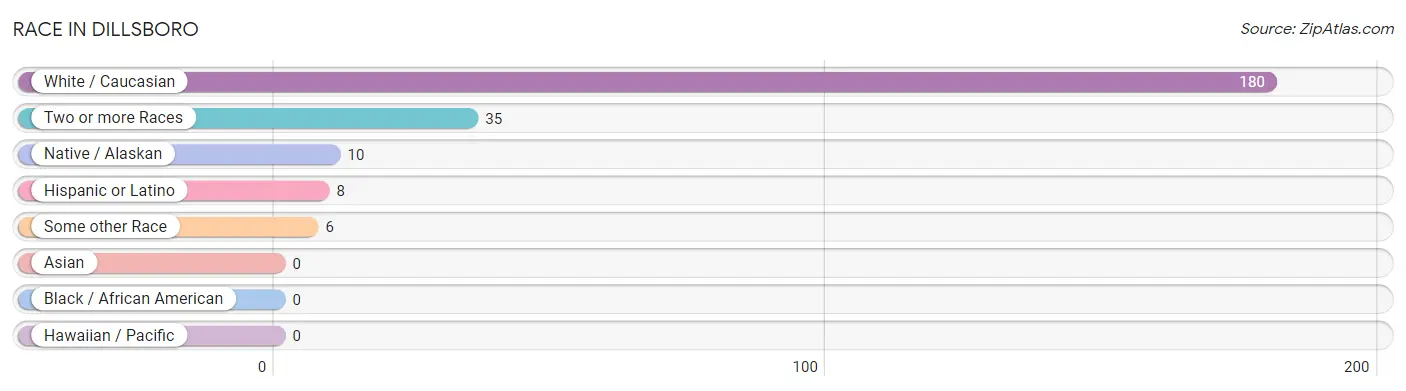
| Race | # Population | % Population |
| Asian | 0 | 0.0% |
| Black / African American | 0 | 0.0% |
| Hawaiian / Pacific | 0 | 0.0% |
| Hispanic or Latino | 8 | 3.5% |
| Native / Alaskan | 10 | 4.3% |
| White / Caucasian | 180 | 77.9% |
| Two or more Races | 35 | 15.1% |
| Some other Race | 6 | 2.6% |
| Total | 231 | 100.0% |
Ancestry in Dillsboro
The most populous ancestries reported in Dillsboro are American (45 | 19.5%), German (34 | 14.7%), Irish (30 | 13.0%), Cherokee (24 | 10.4%), and Scotch-Irish (19 | 8.2%), together accounting for 65.8% of all Dillsboro residents.
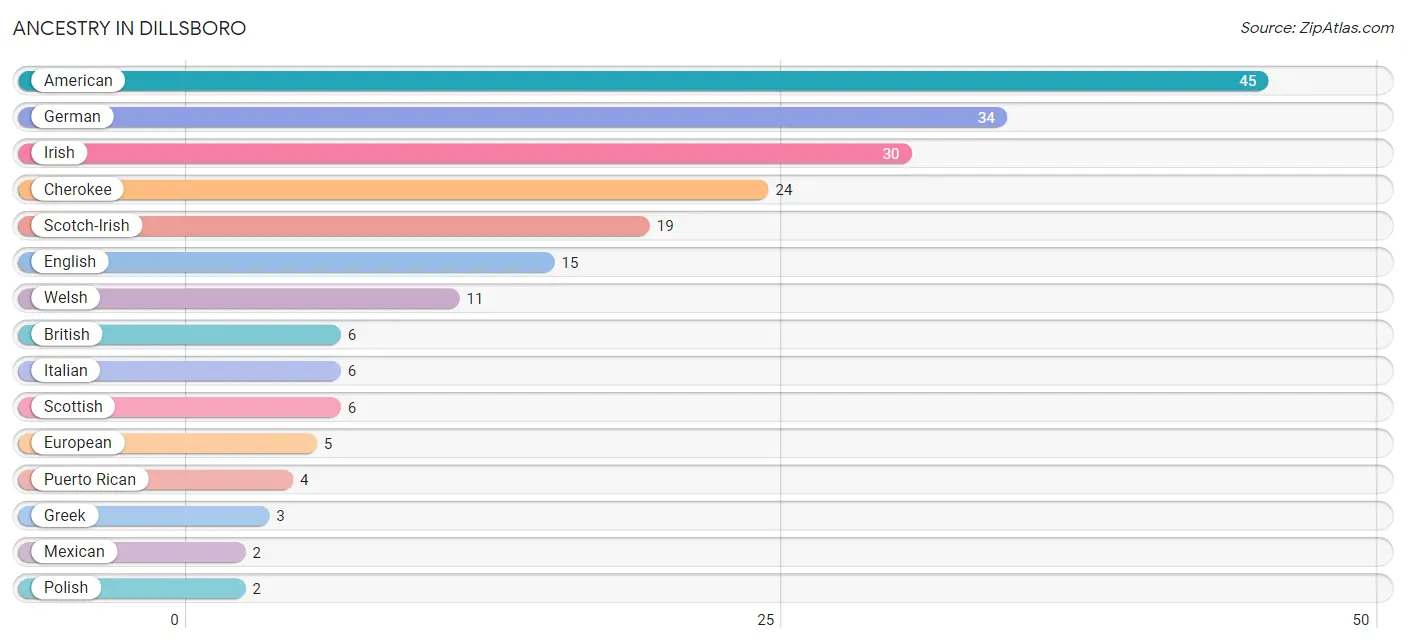
| Ancestry | # Population | % Population |
| American | 45 | 19.5% |
| British | 6 | 2.6% |
| Cherokee | 24 | 10.4% |
| Cuban | 1 | 0.4% |
| English | 15 | 6.5% |
| European | 5 | 2.2% |
| French | 1 | 0.4% |
| German | 34 | 14.7% |
| Greek | 3 | 1.3% |
| Irish | 30 | 13.0% |
| Italian | 6 | 2.6% |
| Mexican | 2 | 0.9% |
| Polish | 2 | 0.9% |
| Puerto Rican | 4 | 1.7% |
| Russian | 1 | 0.4% |
| Scotch-Irish | 19 | 8.2% |
| Scottish | 6 | 2.6% |
| Swedish | 1 | 0.4% |
| Welsh | 11 | 4.8% | View All 19 Rows |
Immigrants in Dillsboro
The most numerous immigrant groups reported in Dillsboro came from Latin America (6 | 2.6%), Ecuador (5 | 2.2%), South America (5 | 2.2%), Central America (1 | 0.4%), and Mexico (1 | 0.4%), together accounting for 7.8% of all Dillsboro residents.
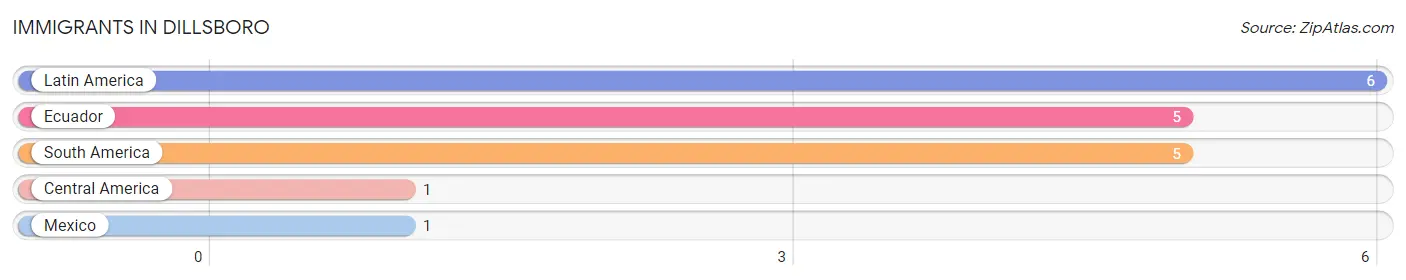
| Immigration Origin | # Population | % Population |
| Central America | 1 | 0.4% |
| Ecuador | 5 | 2.2% |
| Latin America | 6 | 2.6% |
| Mexico | 1 | 0.4% |
| South America | 5 | 2.2% | View All 5 Rows |
Sex and Age in Dillsboro
Sex and Age in Dillsboro
The most populous age groups in Dillsboro are 50 to 54 Years (12 | 13.5%) for men and 15 to 19 Years (21 | 14.8%) for women.
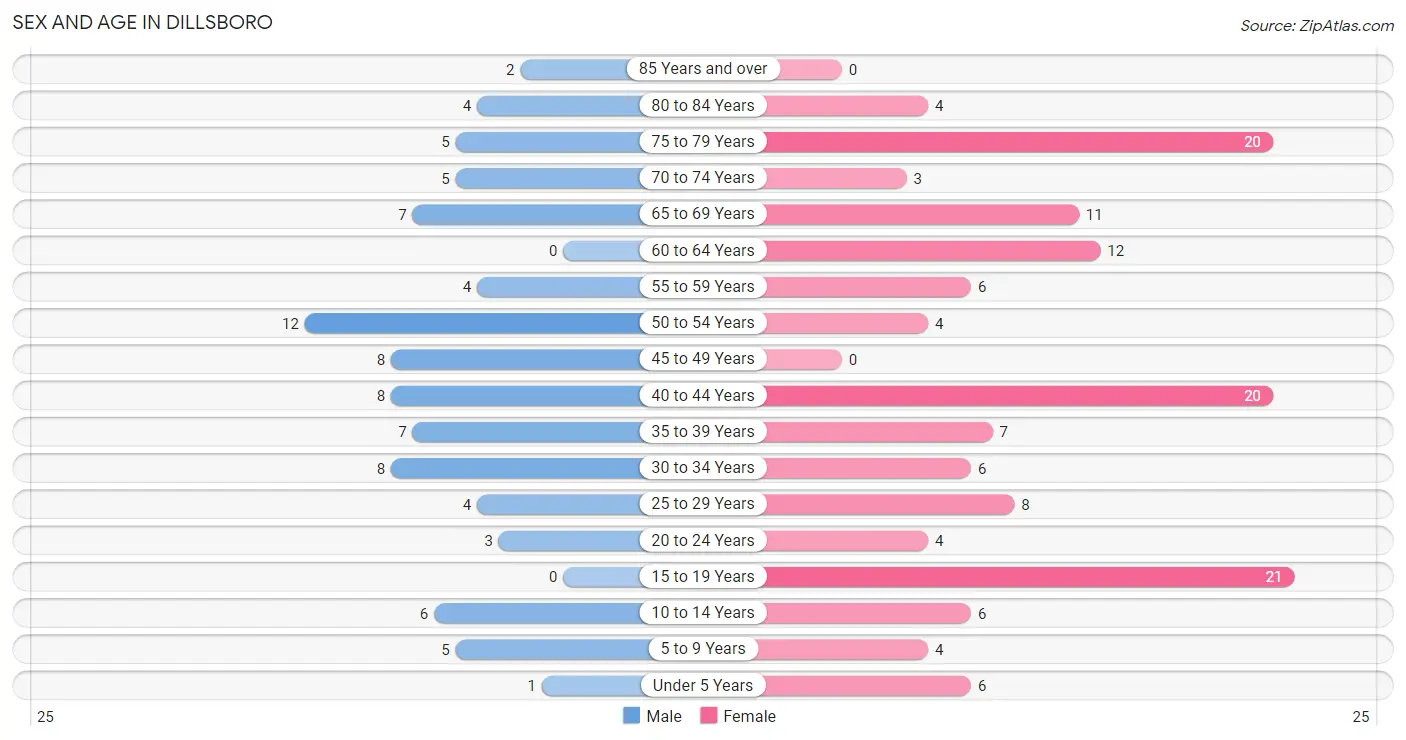
| Age Bracket | Male | Female |
| Under 5 Years | 1 (1.1%) | 6 (4.2%) |
| 5 to 9 Years | 5 (5.6%) | 4 (2.8%) |
| 10 to 14 Years | 6 (6.7%) | 6 (4.2%) |
| 15 to 19 Years | 0 (0.0%) | 21 (14.8%) |
| 20 to 24 Years | 3 (3.4%) | 4 (2.8%) |
| 25 to 29 Years | 4 (4.5%) | 8 (5.6%) |
| 30 to 34 Years | 8 (9.0%) | 6 (4.2%) |
| 35 to 39 Years | 7 (7.9%) | 7 (4.9%) |
| 40 to 44 Years | 8 (9.0%) | 20 (14.1%) |
| 45 to 49 Years | 8 (9.0%) | 0 (0.0%) |
| 50 to 54 Years | 12 (13.5%) | 4 (2.8%) |
| 55 to 59 Years | 4 (4.5%) | 6 (4.2%) |
| 60 to 64 Years | 0 (0.0%) | 12 (8.5%) |
| 65 to 69 Years | 7 (7.9%) | 11 (7.7%) |
| 70 to 74 Years | 5 (5.6%) | 3 (2.1%) |
| 75 to 79 Years | 5 (5.6%) | 20 (14.1%) |
| 80 to 84 Years | 4 (4.5%) | 4 (2.8%) |
| 85 Years and over | 2 (2.2%) | 0 (0.0%) |
| Total | 89 (100.0%) | 142 (100.0%) |
Families and Households in Dillsboro
Median Family Size in Dillsboro
The median family size in Dillsboro is 2.43 persons per family, with married-couple families (53 | 76.8%) accounting for the largest median family size of 2.7 persons per family. On the other hand, single male/father families (12 | 17.4%) represent the smallest median family size with 1.33 persons per family.
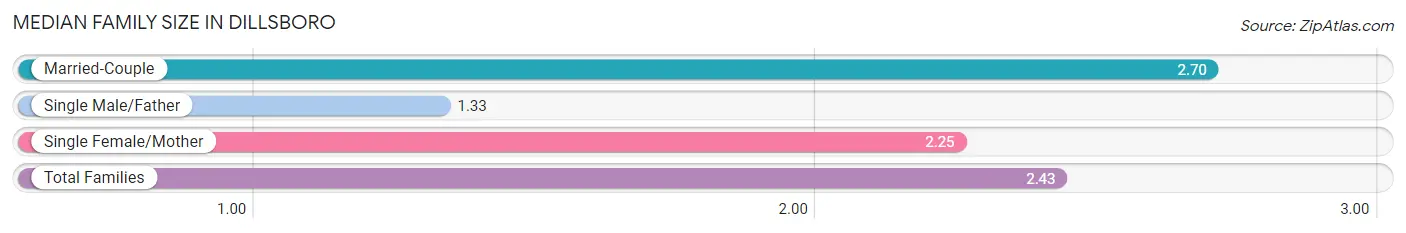
| Family Type | # Families | Family Size |
| Married-Couple | 53 (76.8%) | 2.70 |
| Single Male/Father | 12 (17.4%) | 1.33 |
| Single Female/Mother | 4 (5.8%) | 2.25 |
| Total Families | 69 (100.0%) | 2.43 |
Median Household Size in Dillsboro
The median household size in Dillsboro is 1.78 persons per household, with married-couple households (53 | 40.8%) accounting for the largest median household size of 2.7 persons per household. non-family households (61 | 46.9%) represent the smallest median household size with 1.03 persons per household.
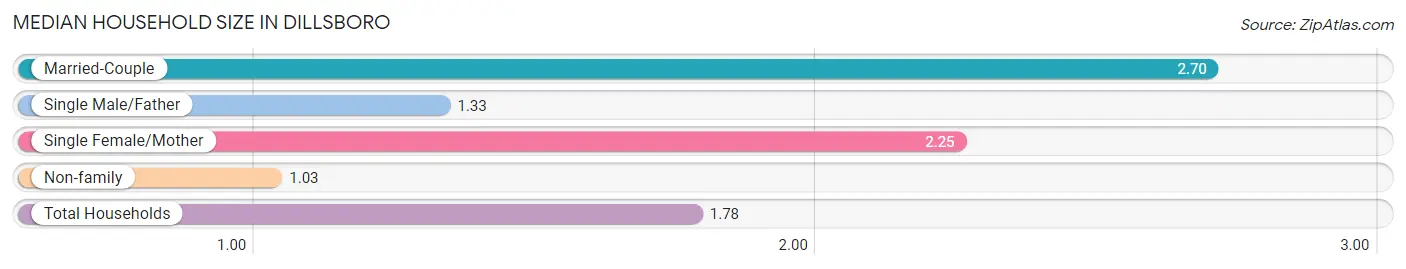
| Household Type | # Households | Household Size |
| Married-Couple | 53 (40.8%) | 2.70 |
| Single Male/Father | 12 (9.2%) | 1.33 |
| Single Female/Mother | 4 (3.1%) | 2.25 |
| Non-family | 61 (46.9%) | 1.03 |
| Total Households | 130 (100.0%) | 1.78 |
Household Size by Marriage Status in Dillsboro
Out of a total of 130 households in Dillsboro, 69 (53.1%) are family households, while 61 (46.9%) are nonfamily households. The most numerous type of family households are 2-person households, comprising 41, and the most common type of nonfamily households are 1-person households, comprising 58.
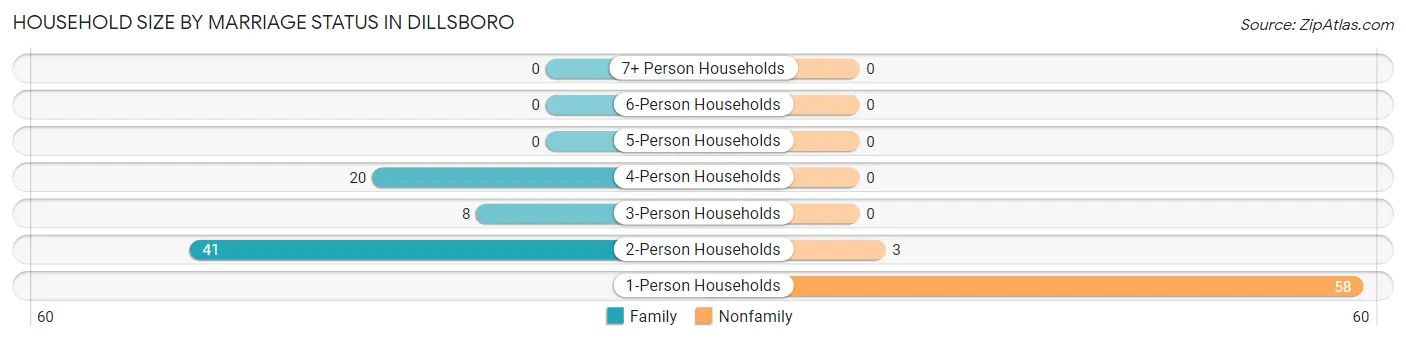
| Household Size | Family Households | Nonfamily Households |
| 1-Person Households | - | 58 (44.6%) |
| 2-Person Households | 41 (31.5%) | 3 (2.3%) |
| 3-Person Households | 8 (6.1%) | 0 (0.0%) |
| 4-Person Households | 20 (15.4%) | 0 (0.0%) |
| 5-Person Households | 0 (0.0%) | 0 (0.0%) |
| 6-Person Households | 0 (0.0%) | 0 (0.0%) |
| 7+ Person Households | 0 (0.0%) | 0 (0.0%) |
| Total | 69 (53.1%) | 61 (46.9%) |
Female Fertility in Dillsboro
Fertility by Age in Dillsboro
| Age Bracket | Women with Births | Births / 1,000 Women |
| 15 to 19 years | 0 (0.0%) | 0.0 |
| 20 to 34 years | 0 (0.0%) | 0.0 |
| 35 to 50 years | 0 (0.0%) | 0.0 |
| Total | 0 (0.0%) | 0.0 |
Fertility by Age by Marriage Status in Dillsboro
| Age Bracket | Married | Unmarried |
| 15 to 19 years | 0 (0.0%) | 0 (0.0%) |
| 20 to 34 years | 0 (0.0%) | 0 (0.0%) |
| 35 to 50 years | 0 (0.0%) | 0 (0.0%) |
| Total | 0 (0.0%) | 0 (0.0%) |
Fertility by Education in Dillsboro
| Educational Attainment | Women with Births | Births / 1,000 Women |
| Less than High School | 0 (0.0%) | 0.0 |
| High School Diploma | 0 (0.0%) | 0.0 |
| College or Associate's Degree | 0 (0.0%) | 0.0 |
| Bachelor's Degree | 0 (0.0%) | 0.0 |
| Graduate Degree | 0 (0.0%) | 0.0 |
| Total | 0 (0.0%) | 0.0 |
Fertility by Education by Marriage Status in Dillsboro
| Educational Attainment | Married | Unmarried |
| Less than High School | 0 (0.0%) | 0 (0.0%) |
| High School Diploma | 0 (0.0%) | 0 (0.0%) |
| College or Associate's Degree | 0 (0.0%) | 0 (0.0%) |
| Bachelor's Degree | 0 (0.0%) | 0 (0.0%) |
| Graduate Degree | 0 (0.0%) | 0 (0.0%) |
| Total | 0 (0.0%) | 0 (0.0%) |
Employment Characteristics in Dillsboro
Employment by Class of Employer in Dillsboro
Among the 116 employed individuals in Dillsboro, private company employees (85 | 73.3%), state government employees (17 | 14.7%), and local government employees (7 | 6.0%) make up the most common classes of employment.
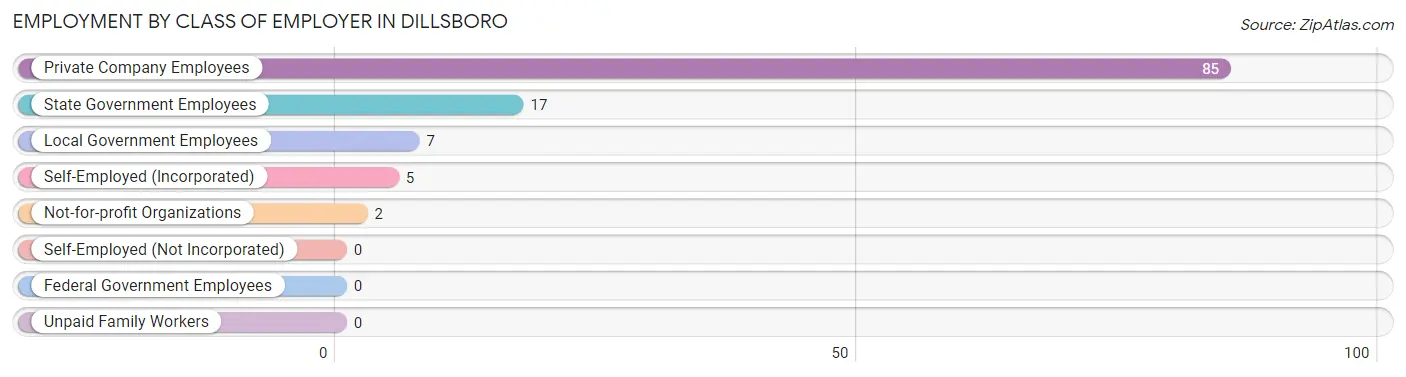
| Employer Class | # Employees | % Employees |
| Private Company Employees | 85 | 73.3% |
| Self-Employed (Incorporated) | 5 | 4.3% |
| Self-Employed (Not Incorporated) | 0 | 0.0% |
| Not-for-profit Organizations | 2 | 1.7% |
| Local Government Employees | 7 | 6.0% |
| State Government Employees | 17 | 14.7% |
| Federal Government Employees | 0 | 0.0% |
| Unpaid Family Workers | 0 | 0.0% |
| Total | 116 | 100.0% |
Employment Status by Age in Dillsboro
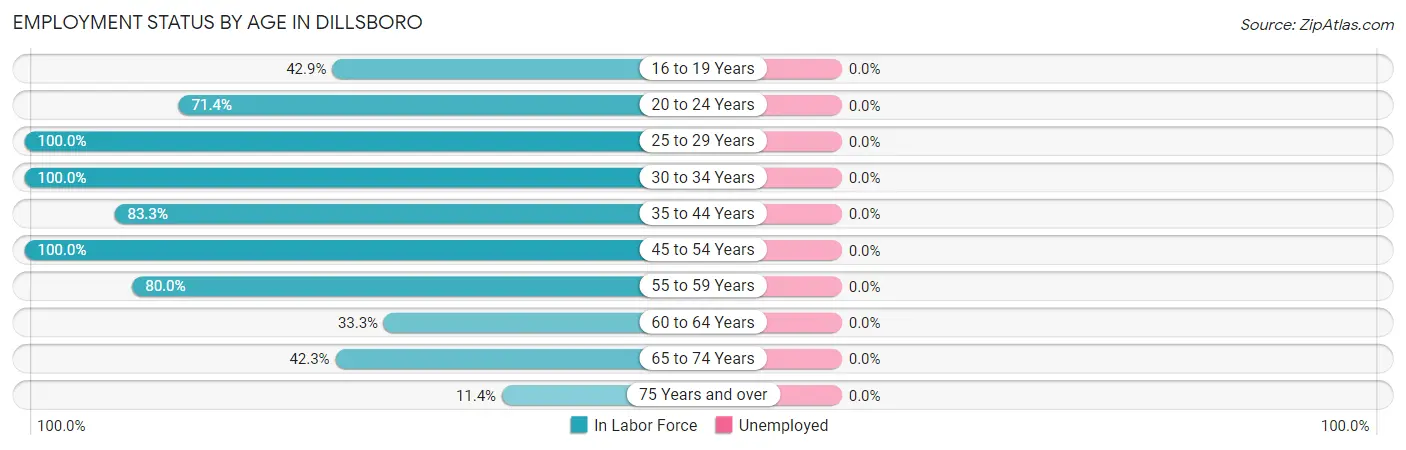
| Age Bracket | In Labor Force | Unemployed |
| 16 to 19 Years | 3 (42.9%) | 0 (0.0%) |
| 20 to 24 Years | 5 (71.4%) | 0 (0.0%) |
| 25 to 29 Years | 12 (100.0%) | 0 (0.0%) |
| 30 to 34 Years | 14 (100.0%) | 0 (0.0%) |
| 35 to 44 Years | 35 (83.3%) | 0 (0.0%) |
| 45 to 54 Years | 24 (100.0%) | 0 (0.0%) |
| 55 to 59 Years | 8 (80.0%) | 0 (0.0%) |
| 60 to 64 Years | 4 (33.3%) | 0 (0.0%) |
| 65 to 74 Years | 11 (42.3%) | 0 (0.0%) |
| 75 Years and over | 4 (11.4%) | 0 (0.0%) |
| Total | 120 (63.5%) | 0 (0.0%) |
Employment Status by Educational Attainment in Dillsboro
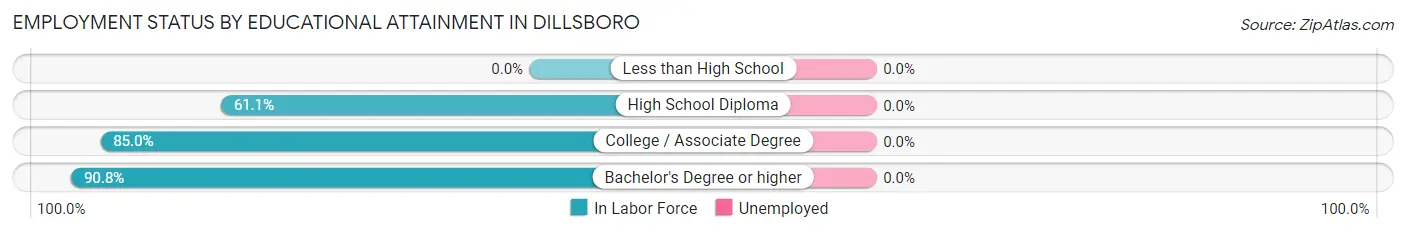
| Educational Attainment | In Labor Force | Unemployed |
| Less than High School | 0 (0.0%) | 0 (0.0%) |
| High School Diploma | 11 (61.1%) | 0 (0.0%) |
| College / Associate Degree | 17 (85.0%) | 0 (0.0%) |
| Bachelor's Degree or higher | 69 (90.8%) | 0 (0.0%) |
| Total | 97 (85.1%) | 0 (0.0%) |
Employment Occupations by Sex in Dillsboro
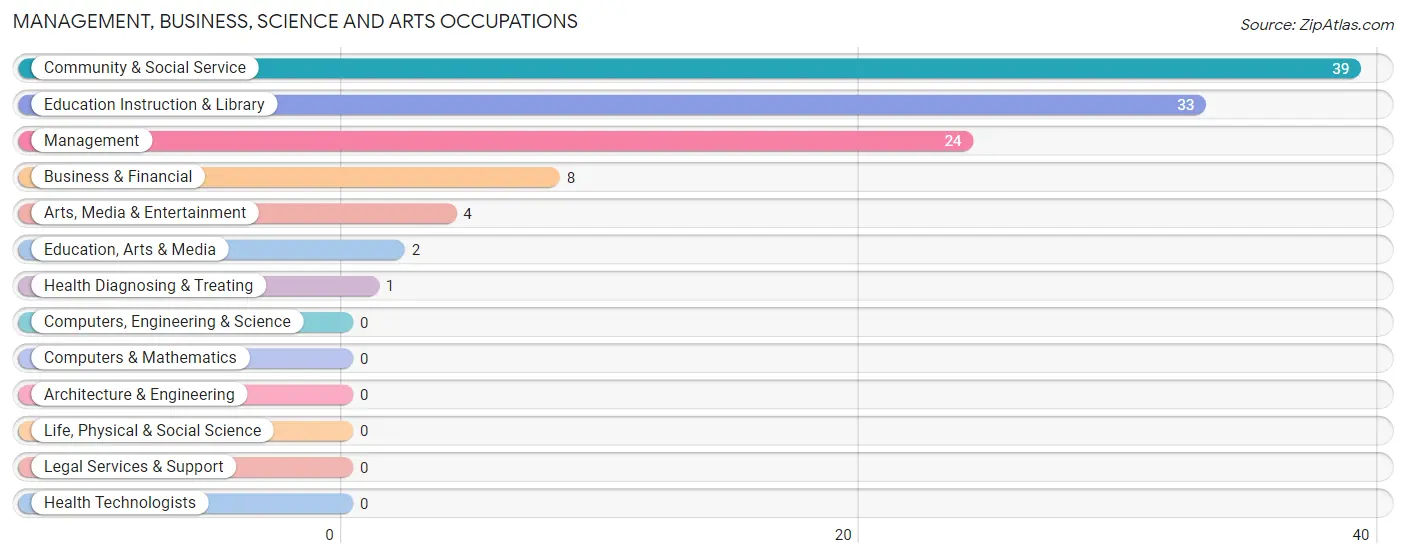
Management, Business, Science and Arts Occupations
The most common Management, Business, Science and Arts occupations in Dillsboro are Community & Social Service (39 | 32.5%), Education Instruction & Library (33 | 27.5%), Management (24 | 20.0%), Business & Financial (8 | 6.7%), and Arts, Media & Entertainment (4 | 3.3%).
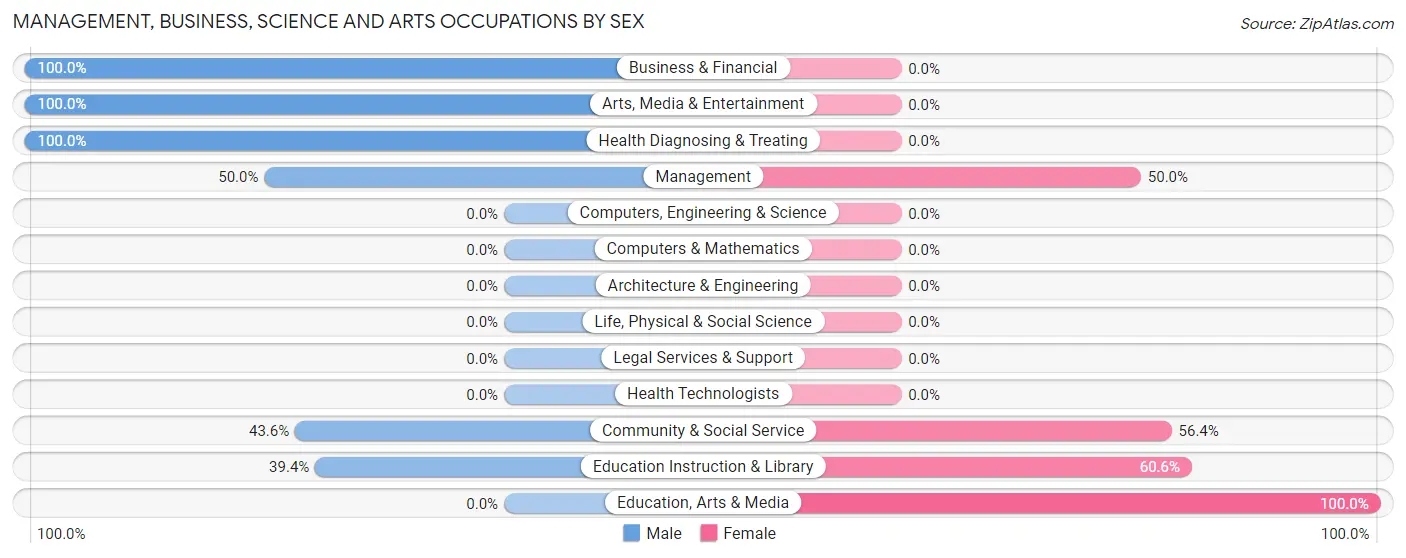
Management, Business, Science and Arts Occupations by Sex
Within the Management, Business, Science and Arts occupations in Dillsboro, the most male-oriented occupations are Business & Financial (100.0%), Arts, Media & Entertainment (100.0%), and Health Diagnosing & Treating (100.0%), while the most female-oriented occupations are Education, Arts & Media (100.0%), Education Instruction & Library (60.6%), and Community & Social Service (56.4%).
| Occupation | Male | Female |
| Management | 12 (50.0%) | 12 (50.0%) |
| Business & Financial | 8 (100.0%) | 0 (0.0%) |
| Computers, Engineering & Science | 0 (0.0%) | 0 (0.0%) |
| Computers & Mathematics | 0 (0.0%) | 0 (0.0%) |
| Architecture & Engineering | 0 (0.0%) | 0 (0.0%) |
| Life, Physical & Social Science | 0 (0.0%) | 0 (0.0%) |
| Community & Social Service | 17 (43.6%) | 22 (56.4%) |
| Education, Arts & Media | 0 (0.0%) | 2 (100.0%) |
| Legal Services & Support | 0 (0.0%) | 0 (0.0%) |
| Education Instruction & Library | 13 (39.4%) | 20 (60.6%) |
| Arts, Media & Entertainment | 4 (100.0%) | 0 (0.0%) |
| Health Diagnosing & Treating | 1 (100.0%) | 0 (0.0%) |
| Health Technologists | 0 (0.0%) | 0 (0.0%) |
| Total (Category) | 38 (52.8%) | 34 (47.2%) |
| Total (Overall) | 61 (50.8%) | 59 (49.2%) |
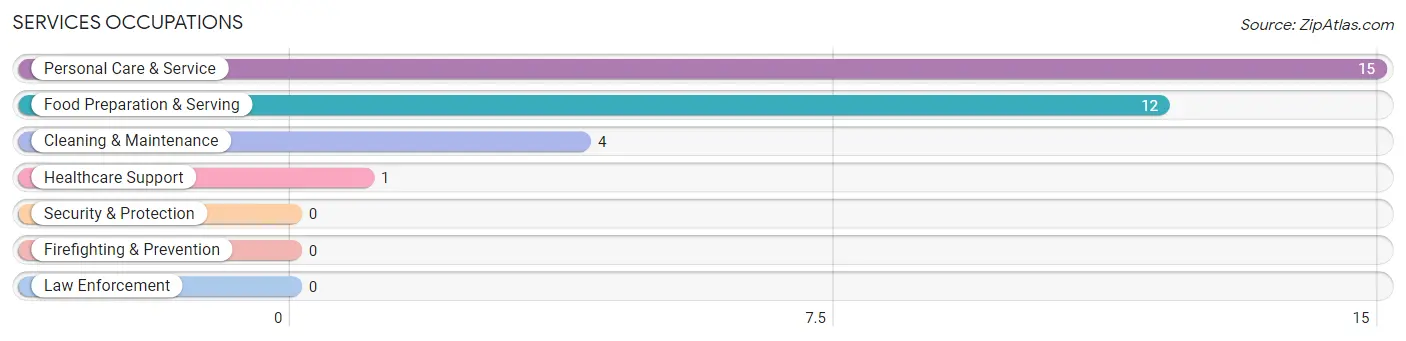
Services Occupations
The most common Services occupations in Dillsboro are Personal Care & Service (15 | 12.5%), Food Preparation & Serving (12 | 10.0%), Cleaning & Maintenance (4 | 3.3%), and Healthcare Support (1 | 0.8%).
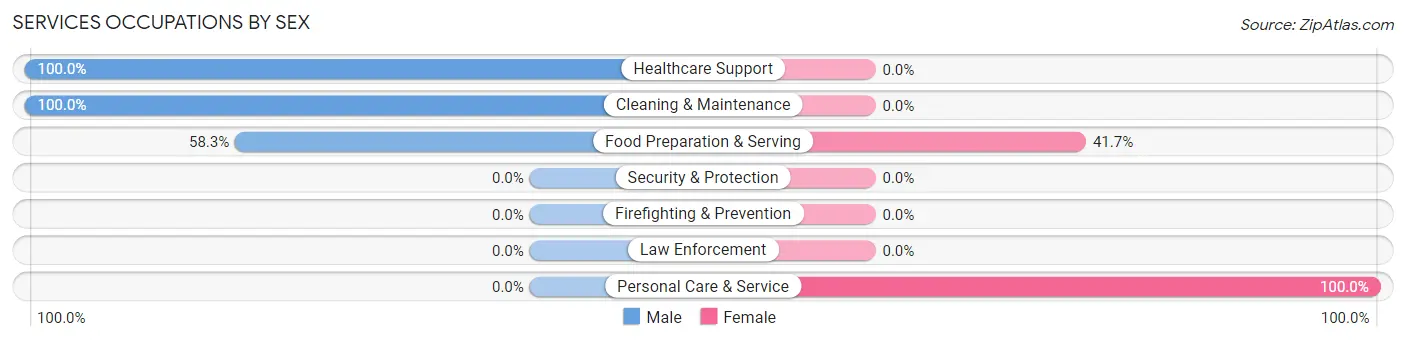
Services Occupations by Sex
Within the Services occupations in Dillsboro, the most male-oriented occupations are Healthcare Support (100.0%), Cleaning & Maintenance (100.0%), and Food Preparation & Serving (58.3%), while the most female-oriented occupations are Personal Care & Service (100.0%), and Food Preparation & Serving (41.7%).
| Occupation | Male | Female |
| Healthcare Support | 1 (100.0%) | 0 (0.0%) |
| Security & Protection | 0 (0.0%) | 0 (0.0%) |
| Firefighting & Prevention | 0 (0.0%) | 0 (0.0%) |
| Law Enforcement | 0 (0.0%) | 0 (0.0%) |
| Food Preparation & Serving | 7 (58.3%) | 5 (41.7%) |
| Cleaning & Maintenance | 4 (100.0%) | 0 (0.0%) |
| Personal Care & Service | 0 (0.0%) | 15 (100.0%) |
| Total (Category) | 12 (37.5%) | 20 (62.5%) |
| Total (Overall) | 61 (50.8%) | 59 (49.2%) |
Sales and Office Occupations
The most common Sales and Office occupations in Dillsboro are Office & Administration (5 | 4.2%), and Sales & Related (4 | 3.3%).
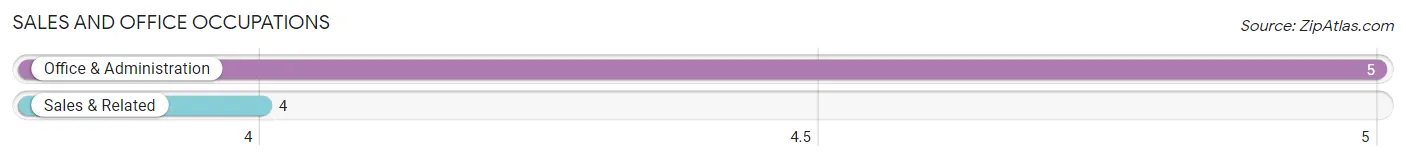
Sales and Office Occupations by Sex

| Occupation | Male | Female |
| Sales & Related | 4 (100.0%) | 0 (0.0%) |
| Office & Administration | 1 (20.0%) | 4 (80.0%) |
| Total (Category) | 5 (55.6%) | 4 (44.4%) |
| Total (Overall) | 61 (50.8%) | 59 (49.2%) |
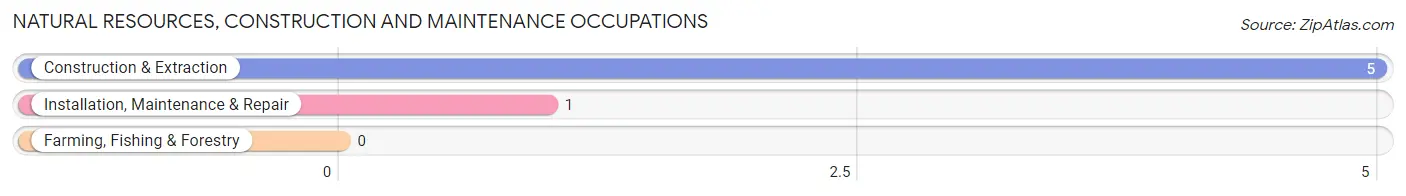
Natural Resources, Construction and Maintenance Occupations
The most common Natural Resources, Construction and Maintenance occupations in Dillsboro are Construction & Extraction (5 | 4.2%), and Installation, Maintenance & Repair (1 | 0.8%).
Natural Resources, Construction and Maintenance Occupations by Sex
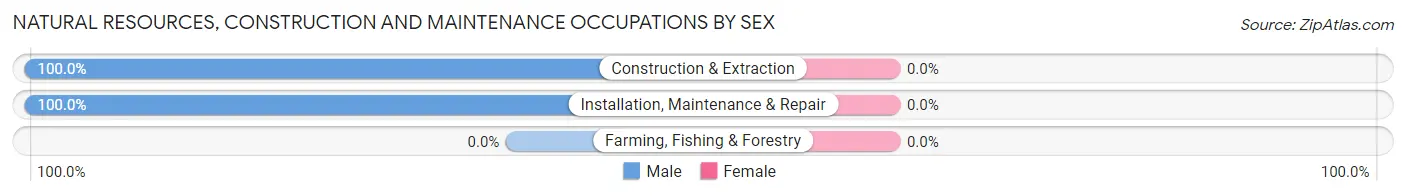
| Occupation | Male | Female |
| Farming, Fishing & Forestry | 0 (0.0%) | 0 (0.0%) |
| Construction & Extraction | 5 (100.0%) | 0 (0.0%) |
| Installation, Maintenance & Repair | 1 (100.0%) | 0 (0.0%) |
| Total (Category) | 6 (100.0%) | 0 (0.0%) |
| Total (Overall) | 61 (50.8%) | 59 (49.2%) |
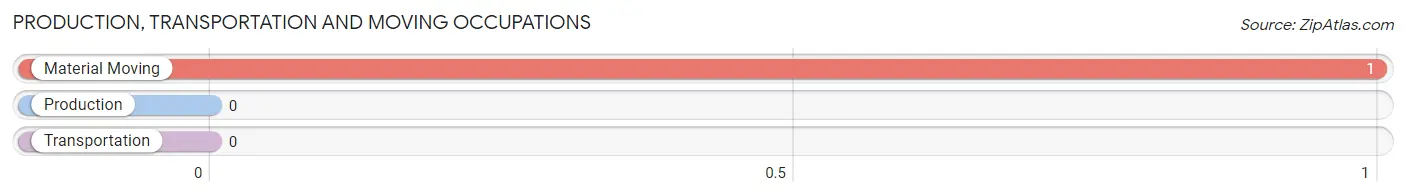
Production, Transportation and Moving Occupations
The most common Production, Transportation and Moving occupations in Dillsboro are , and Material Moving (1 | 0.8%).
Production, Transportation and Moving Occupations by Sex
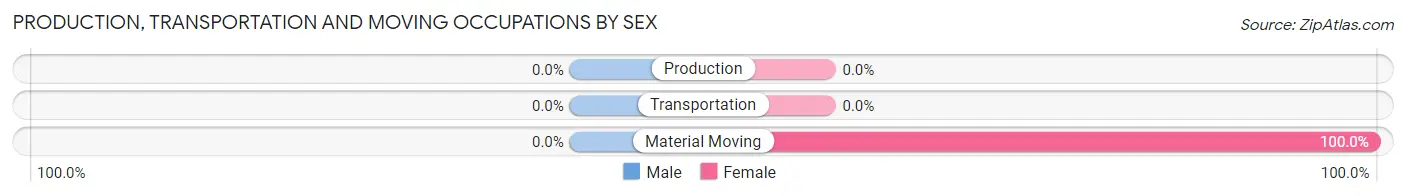
| Occupation | Male | Female |
| Production | 0 (0.0%) | 0 (0.0%) |
| Transportation | 0 (0.0%) | 0 (0.0%) |
| Material Moving | 0 (0.0%) | 1 (100.0%) |
| Total (Category) | 0 (0.0%) | 1 (100.0%) |
| Total (Overall) | 61 (50.8%) | 59 (49.2%) |
Employment Industries by Sex in Dillsboro
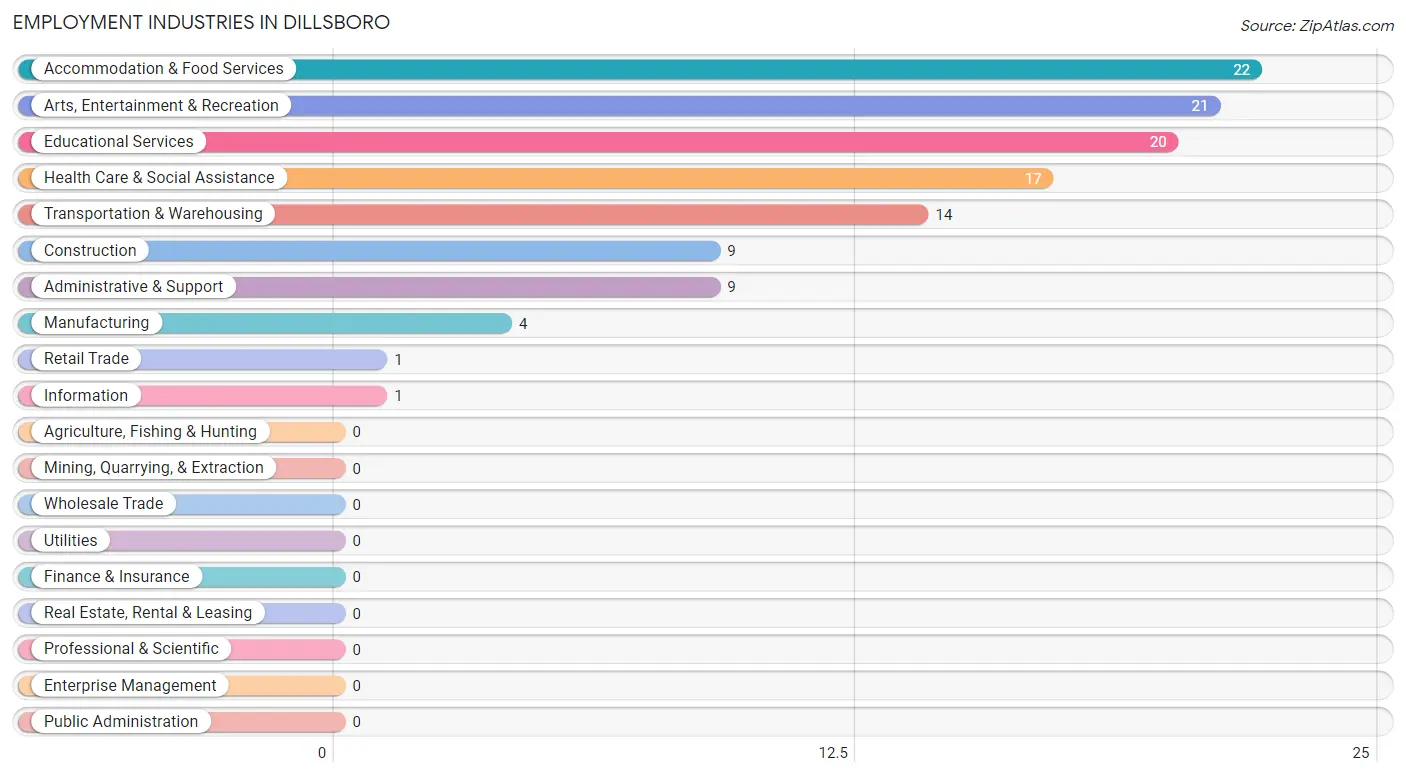
Employment Industries in Dillsboro
The major employment industries in Dillsboro include Accommodation & Food Services (22 | 18.3%), Arts, Entertainment & Recreation (21 | 17.5%), Educational Services (20 | 16.7%), Health Care & Social Assistance (17 | 14.2%), and Transportation & Warehousing (14 | 11.7%).
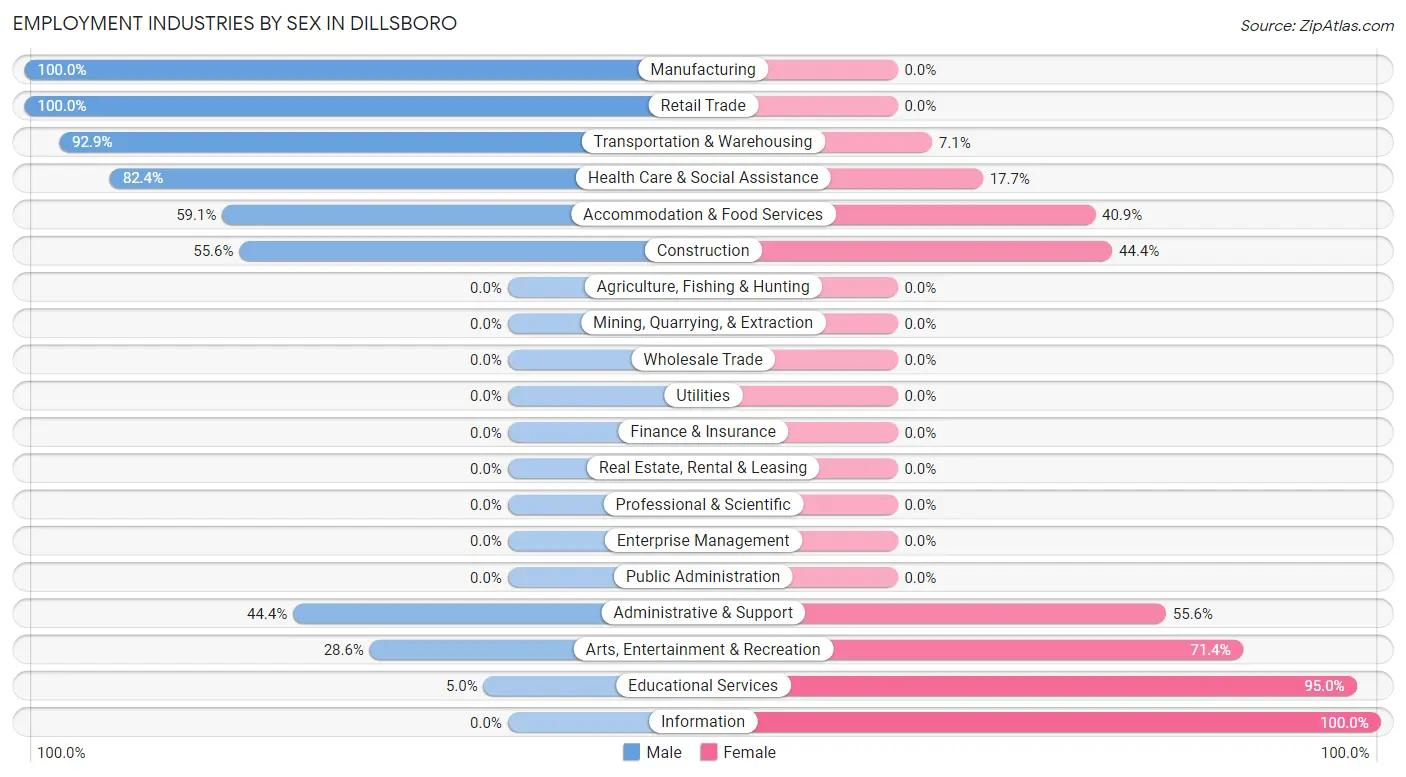
Employment Industries by Sex in Dillsboro
The Dillsboro industries that see more men than women are Manufacturing (100.0%), Retail Trade (100.0%), and Transportation & Warehousing (92.9%), whereas the industries that tend to have a higher number of women are Information (100.0%), Educational Services (95.0%), and Arts, Entertainment & Recreation (71.4%).
| Industry | Male | Female |
| Agriculture, Fishing & Hunting | 0 (0.0%) | 0 (0.0%) |
| Mining, Quarrying, & Extraction | 0 (0.0%) | 0 (0.0%) |
| Construction | 5 (55.6%) | 4 (44.4%) |
| Manufacturing | 4 (100.0%) | 0 (0.0%) |
| Wholesale Trade | 0 (0.0%) | 0 (0.0%) |
| Retail Trade | 1 (100.0%) | 0 (0.0%) |
| Transportation & Warehousing | 13 (92.9%) | 1 (7.1%) |
| Utilities | 0 (0.0%) | 0 (0.0%) |
| Information | 0 (0.0%) | 1 (100.0%) |
| Finance & Insurance | 0 (0.0%) | 0 (0.0%) |
| Real Estate, Rental & Leasing | 0 (0.0%) | 0 (0.0%) |
| Professional & Scientific | 0 (0.0%) | 0 (0.0%) |
| Enterprise Management | 0 (0.0%) | 0 (0.0%) |
| Administrative & Support | 4 (44.4%) | 5 (55.6%) |
| Educational Services | 1 (5.0%) | 19 (95.0%) |
| Health Care & Social Assistance | 14 (82.4%) | 3 (17.6%) |
| Arts, Entertainment & Recreation | 6 (28.6%) | 15 (71.4%) |
| Accommodation & Food Services | 13 (59.1%) | 9 (40.9%) |
| Public Administration | 0 (0.0%) | 0 (0.0%) |
| Total | 61 (50.8%) | 59 (49.2%) |
Education in Dillsboro
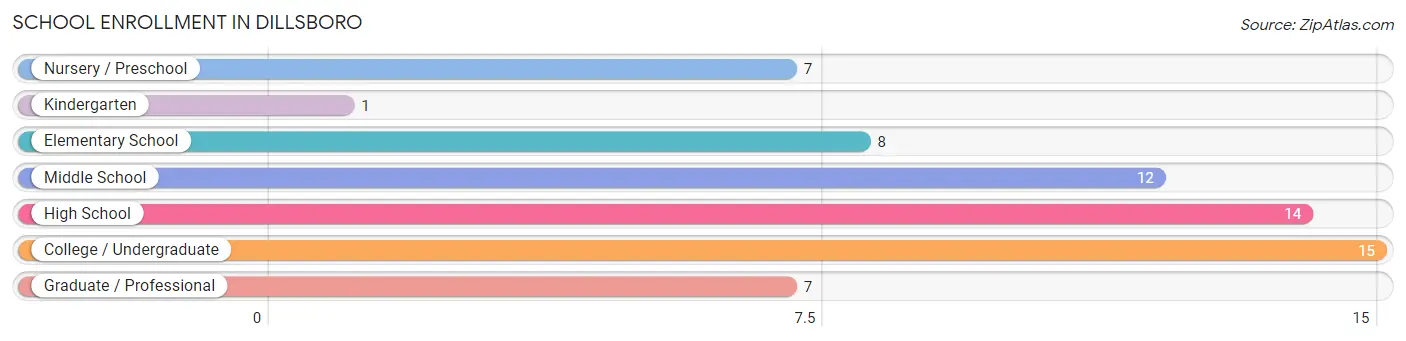
School Enrollment in Dillsboro
The most common levels of schooling among the 64 students in Dillsboro are college / undergraduate (15 | 23.4%), high school (14 | 21.9%), and middle school (12 | 18.8%).
| School Level | # Students | % Students |
| Nursery / Preschool | 7 | 10.9% |
| Kindergarten | 1 | 1.6% |
| Elementary School | 8 | 12.5% |
| Middle School | 12 | 18.8% |
| High School | 14 | 21.9% |
| College / Undergraduate | 15 | 23.4% |
| Graduate / Professional | 7 | 10.9% |
| Total | 64 | 100.0% |
School Enrollment by Age by Funding Source in Dillsboro
Out of a total of 64 students who are enrolled in schools in Dillsboro, 4 (6.3%) attend a private institution, while the remaining 60 (93.7%) are enrolled in public schools. The age group of 18 to 19 year olds has the highest likelihood of being enrolled in private schools, with 3 (42.9% in the age bracket) enrolled. Conversely, the age group of 5 to 9 year old has the lowest likelihood of being enrolled in a private school, with 9 (100.0% in the age bracket) attending a public institution.
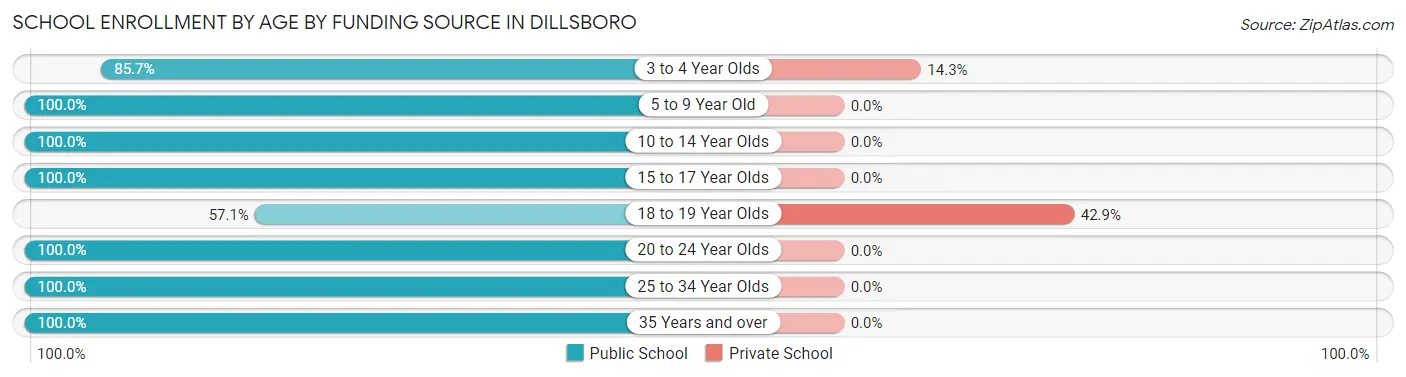
| Age Bracket | Public School | Private School |
| 3 to 4 Year Olds | 6 (85.7%) | 1 (14.3%) |
| 5 to 9 Year Old | 9 (100.0%) | 0 (0.0%) |
| 10 to 14 Year Olds | 12 (100.0%) | 0 (0.0%) |
| 15 to 17 Year Olds | 14 (100.0%) | 0 (0.0%) |
| 18 to 19 Year Olds | 4 (57.1%) | 3 (42.9%) |
| 20 to 24 Year Olds | 3 (100.0%) | 0 (0.0%) |
| 25 to 34 Year Olds | 3 (100.0%) | 0 (0.0%) |
| 35 Years and over | 9 (100.0%) | 0 (0.0%) |
| Total | 60 (93.8%) | 4 (6.3%) |
Educational Attainment by Field of Study in Dillsboro
Science & technology (27 | 27.0%), liberal arts & history (13 | 13.0%), literature & languages (10 | 10.0%), social sciences (9 | 9.0%), and education (9 | 9.0%) are the most common fields of study among 100 individuals in Dillsboro who have obtained a bachelor's degree or higher.
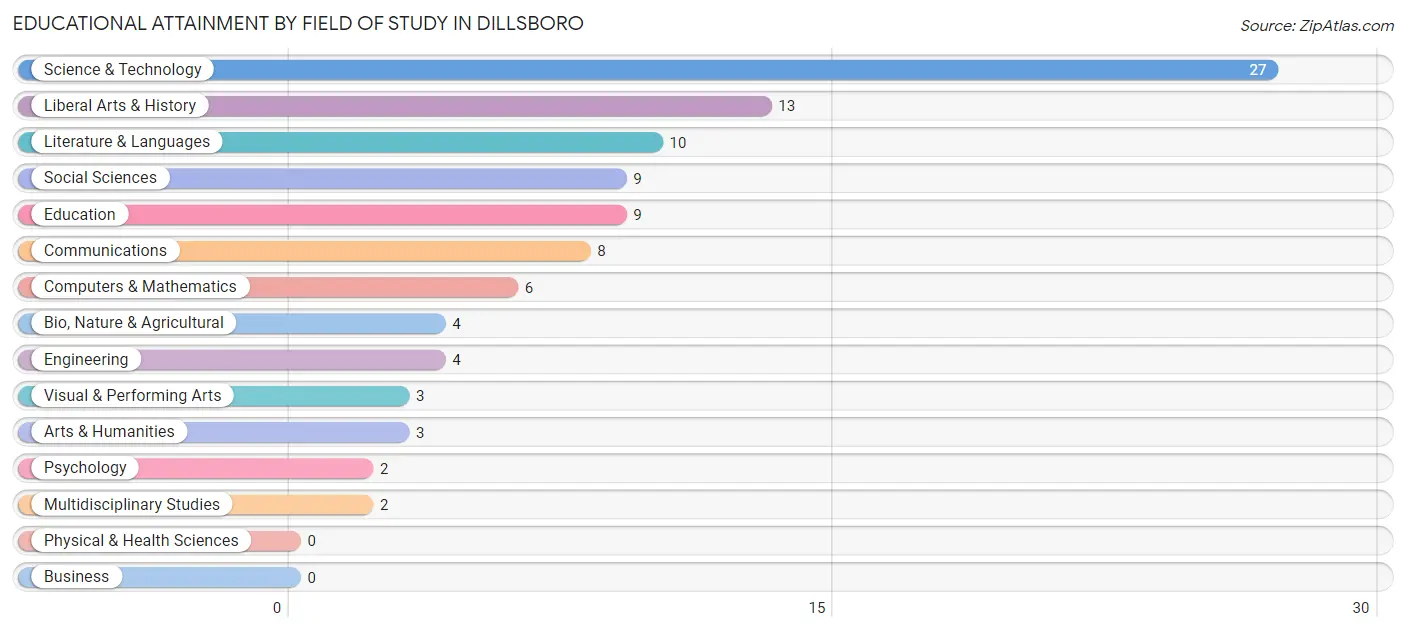
| Field of Study | # Graduates | % Graduates |
| Computers & Mathematics | 6 | 6.0% |
| Bio, Nature & Agricultural | 4 | 4.0% |
| Physical & Health Sciences | 0 | 0.0% |
| Psychology | 2 | 2.0% |
| Social Sciences | 9 | 9.0% |
| Engineering | 4 | 4.0% |
| Multidisciplinary Studies | 2 | 2.0% |
| Science & Technology | 27 | 27.0% |
| Business | 0 | 0.0% |
| Education | 9 | 9.0% |
| Literature & Languages | 10 | 10.0% |
| Liberal Arts & History | 13 | 13.0% |
| Visual & Performing Arts | 3 | 3.0% |
| Communications | 8 | 8.0% |
| Arts & Humanities | 3 | 3.0% |
| Total | 100 | 100.0% |
Transportation & Commute in Dillsboro
Vehicle Availability by Sex in Dillsboro
The most prevalent vehicle ownership categories in Dillsboro are males with 2 vehicles (46, accounting for 80.7%) and females with 2 vehicles (32, making up 78.0%).
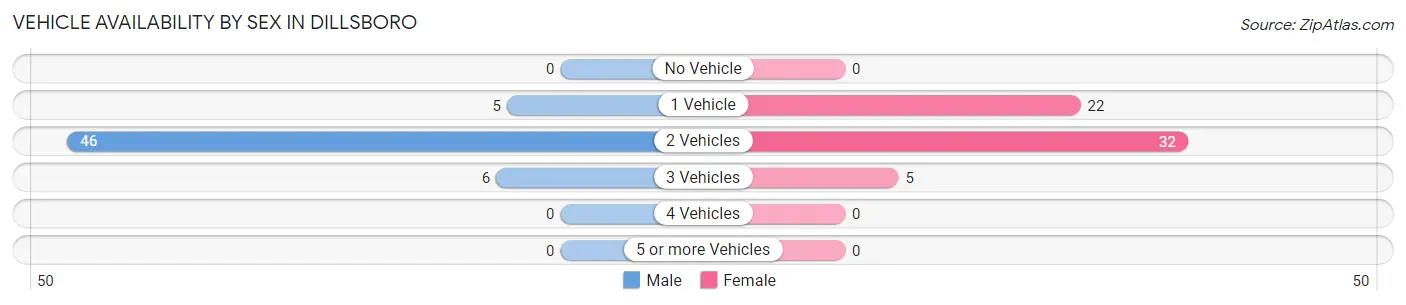
| Vehicles Available | Male | Female |
| No Vehicle | 0 (0.0%) | 0 (0.0%) |
| 1 Vehicle | 5 (8.8%) | 22 (37.3%) |
| 2 Vehicles | 46 (80.7%) | 32 (54.2%) |
| 3 Vehicles | 6 (10.5%) | 5 (8.5%) |
| 4 Vehicles | 0 (0.0%) | 0 (0.0%) |
| 5 or more Vehicles | 0 (0.0%) | 0 (0.0%) |
| Total | 57 (100.0%) | 59 (100.0%) |
Commute Time in Dillsboro
The most frequently occuring commute durations in Dillsboro are 10 to 14 minutes (28 commuters, 25.7%), 20 to 24 minutes (28 commuters, 25.7%), and 15 to 19 minutes (18 commuters, 16.5%).
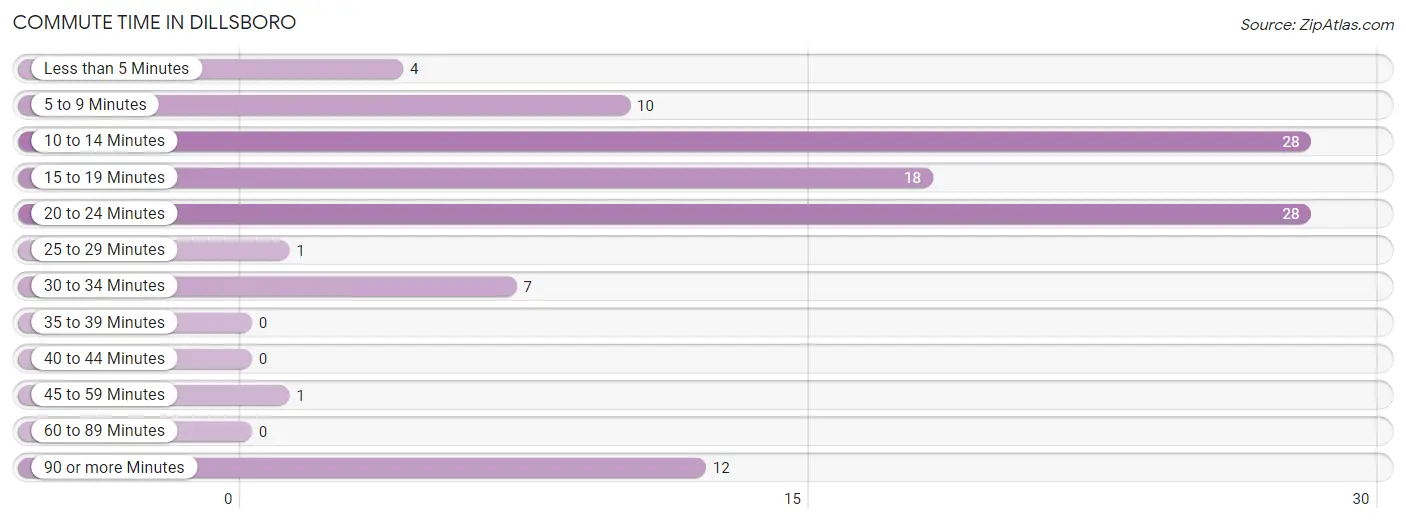
| Commute Time | # Commuters | % Commuters |
| Less than 5 Minutes | 4 | 3.7% |
| 5 to 9 Minutes | 10 | 9.2% |
| 10 to 14 Minutes | 28 | 25.7% |
| 15 to 19 Minutes | 18 | 16.5% |
| 20 to 24 Minutes | 28 | 25.7% |
| 25 to 29 Minutes | 1 | 0.9% |
| 30 to 34 Minutes | 7 | 6.4% |
| 35 to 39 Minutes | 0 | 0.0% |
| 40 to 44 Minutes | 0 | 0.0% |
| 45 to 59 Minutes | 1 | 0.9% |
| 60 to 89 Minutes | 0 | 0.0% |
| 90 or more Minutes | 12 | 11.0% |
Commute Time by Sex in Dillsboro
The most common commute times in Dillsboro are 10 to 14 minutes (21 commuters, 39.6%) for males and 20 to 24 minutes (17 commuters, 30.4%) for females.
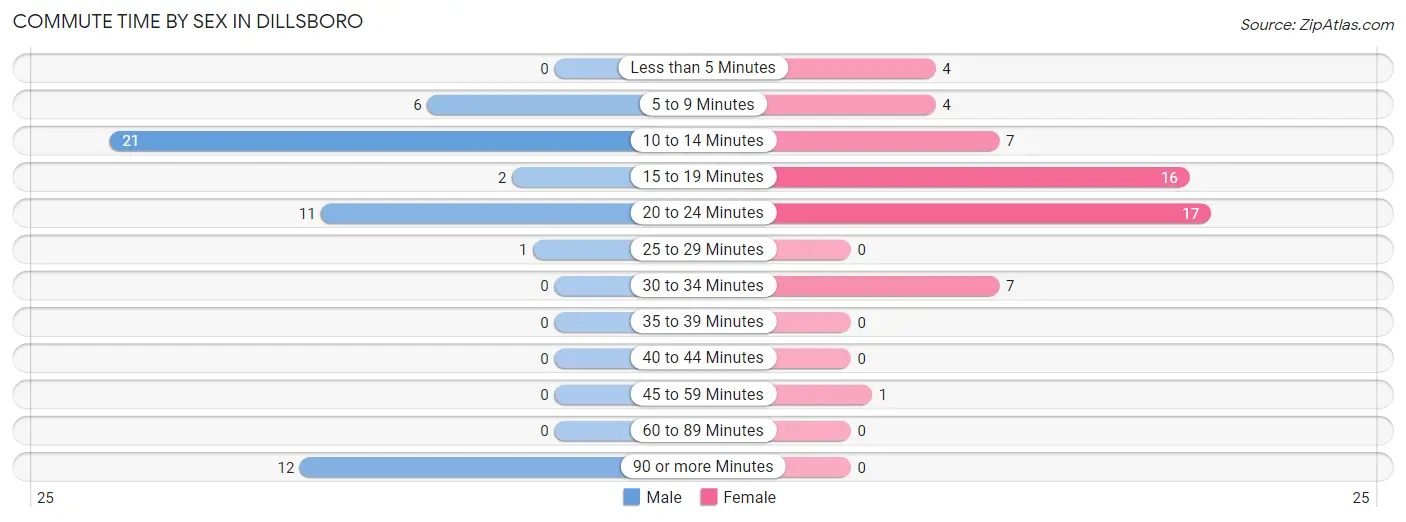
| Commute Time | Male | Female |
| Less than 5 Minutes | 0 (0.0%) | 4 (7.1%) |
| 5 to 9 Minutes | 6 (11.3%) | 4 (7.1%) |
| 10 to 14 Minutes | 21 (39.6%) | 7 (12.5%) |
| 15 to 19 Minutes | 2 (3.8%) | 16 (28.6%) |
| 20 to 24 Minutes | 11 (20.7%) | 17 (30.4%) |
| 25 to 29 Minutes | 1 (1.9%) | 0 (0.0%) |
| 30 to 34 Minutes | 0 (0.0%) | 7 (12.5%) |
| 35 to 39 Minutes | 0 (0.0%) | 0 (0.0%) |
| 40 to 44 Minutes | 0 (0.0%) | 0 (0.0%) |
| 45 to 59 Minutes | 0 (0.0%) | 1 (1.8%) |
| 60 to 89 Minutes | 0 (0.0%) | 0 (0.0%) |
| 90 or more Minutes | 12 (22.6%) | 0 (0.0%) |
Time of Departure to Work by Sex in Dillsboro
The most frequent times of departure to work in Dillsboro are 8:00 AM to 8:29 AM (18, 34.0%) for males and 10:00 AM to 10:59 AM (13, 23.2%) for females.
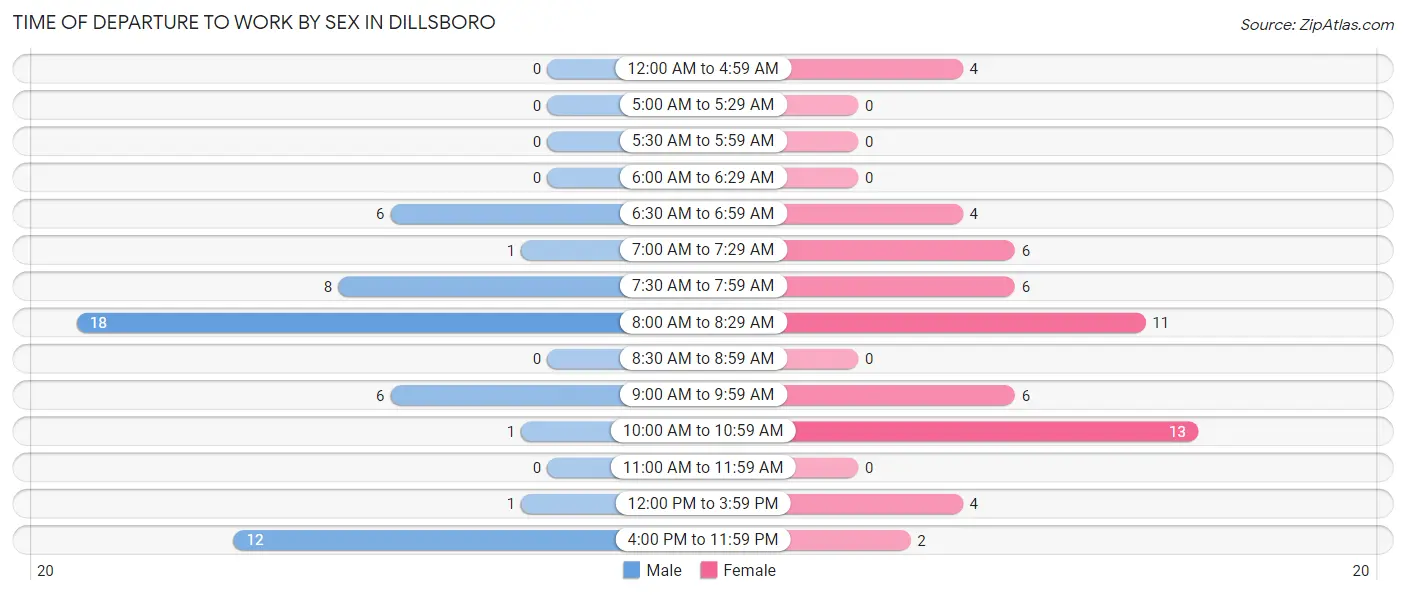
| Time of Departure | Male | Female |
| 12:00 AM to 4:59 AM | 0 (0.0%) | 4 (7.1%) |
| 5:00 AM to 5:29 AM | 0 (0.0%) | 0 (0.0%) |
| 5:30 AM to 5:59 AM | 0 (0.0%) | 0 (0.0%) |
| 6:00 AM to 6:29 AM | 0 (0.0%) | 0 (0.0%) |
| 6:30 AM to 6:59 AM | 6 (11.3%) | 4 (7.1%) |
| 7:00 AM to 7:29 AM | 1 (1.9%) | 6 (10.7%) |
| 7:30 AM to 7:59 AM | 8 (15.1%) | 6 (10.7%) |
| 8:00 AM to 8:29 AM | 18 (34.0%) | 11 (19.6%) |
| 8:30 AM to 8:59 AM | 0 (0.0%) | 0 (0.0%) |
| 9:00 AM to 9:59 AM | 6 (11.3%) | 6 (10.7%) |
| 10:00 AM to 10:59 AM | 1 (1.9%) | 13 (23.2%) |
| 11:00 AM to 11:59 AM | 0 (0.0%) | 0 (0.0%) |
| 12:00 PM to 3:59 PM | 1 (1.9%) | 4 (7.1%) |
| 4:00 PM to 11:59 PM | 12 (22.6%) | 2 (3.6%) |
| Total | 53 (100.0%) | 56 (100.0%) |
Housing Occupancy in Dillsboro
Occupancy by Ownership in Dillsboro
Of the total 130 dwellings in Dillsboro, owner-occupied units account for 60 (46.2%), while renter-occupied units make up 70 (53.8%).
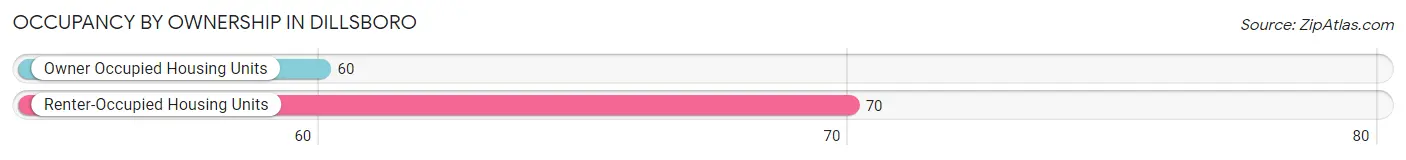
| Occupancy | # Housing Units | % Housing Units |
| Owner Occupied Housing Units | 60 | 46.2% |
| Renter-Occupied Housing Units | 70 | 53.8% |
| Total Occupied Housing Units | 130 | 100.0% |
Occupancy by Household Size in Dillsboro
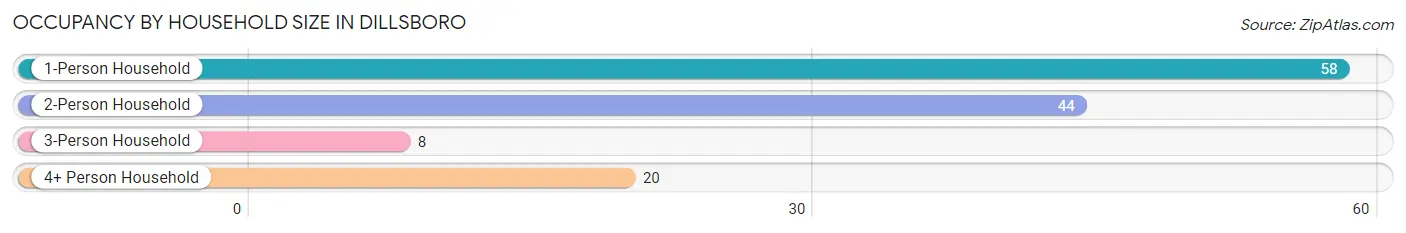
| Household Size | # Housing Units | % Housing Units |
| 1-Person Household | 58 | 44.6% |
| 2-Person Household | 44 | 33.9% |
| 3-Person Household | 8 | 6.1% |
| 4+ Person Household | 20 | 15.4% |
| Total Housing Units | 130 | 100.0% |
Occupancy by Ownership by Household Size in Dillsboro
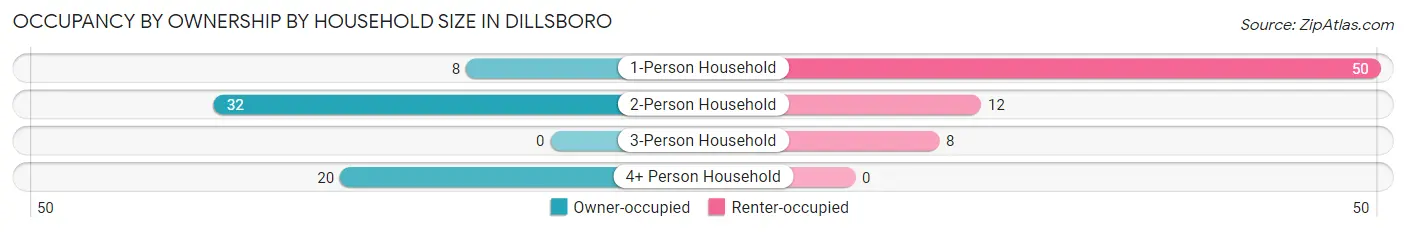
| Household Size | Owner-occupied | Renter-occupied |
| 1-Person Household | 8 (13.8%) | 50 (86.2%) |
| 2-Person Household | 32 (72.7%) | 12 (27.3%) |
| 3-Person Household | 0 (0.0%) | 8 (100.0%) |
| 4+ Person Household | 20 (100.0%) | 0 (0.0%) |
| Total Housing Units | 60 (46.2%) | 70 (53.8%) |
Occupancy by Educational Attainment in Dillsboro
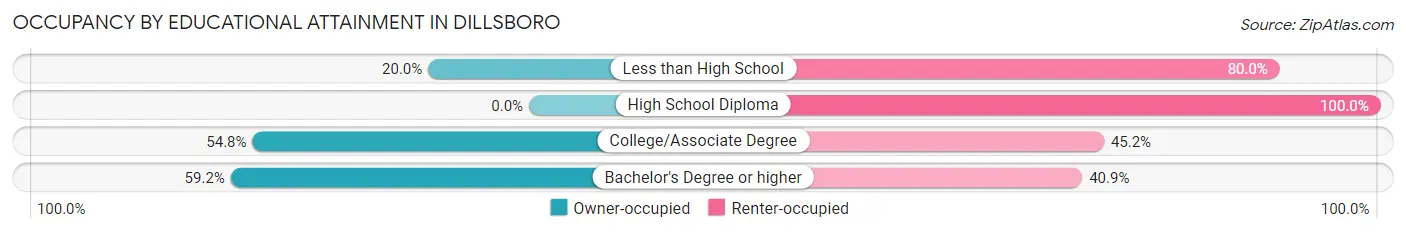
| Household Size | Owner-occupied | Renter-occupied |
| Less than High School | 1 (20.0%) | 4 (80.0%) |
| High School Diploma | 0 (0.0%) | 23 (100.0%) |
| College/Associate Degree | 17 (54.8%) | 14 (45.2%) |
| Bachelor's Degree or higher | 42 (59.2%) | 29 (40.8%) |
Occupancy by Age of Householder in Dillsboro
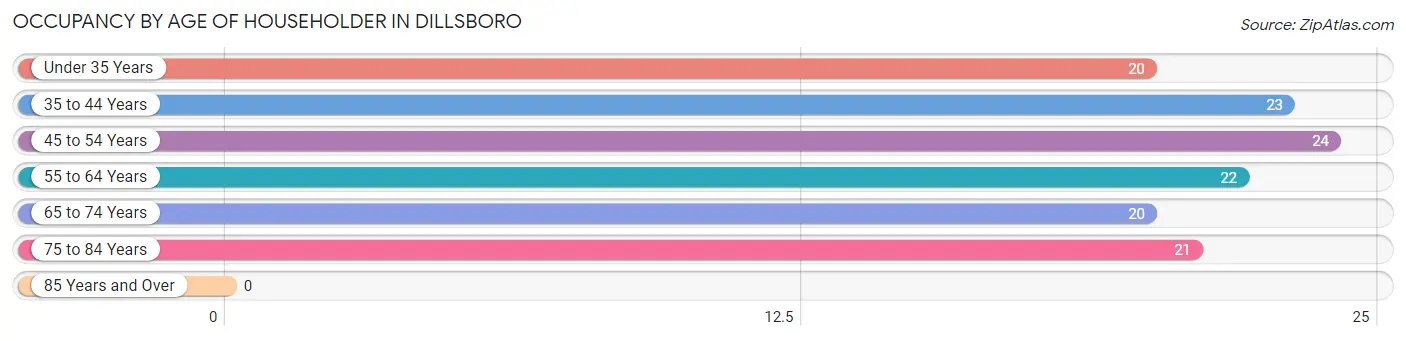
| Age Bracket | # Households | % Households |
| Under 35 Years | 20 | 15.4% |
| 35 to 44 Years | 23 | 17.7% |
| 45 to 54 Years | 24 | 18.5% |
| 55 to 64 Years | 22 | 16.9% |
| 65 to 74 Years | 20 | 15.4% |
| 75 to 84 Years | 21 | 16.2% |
| 85 Years and Over | 0 | 0.0% |
| Total | 130 | 100.0% |
Housing Finances in Dillsboro
Median Income by Occupancy in Dillsboro
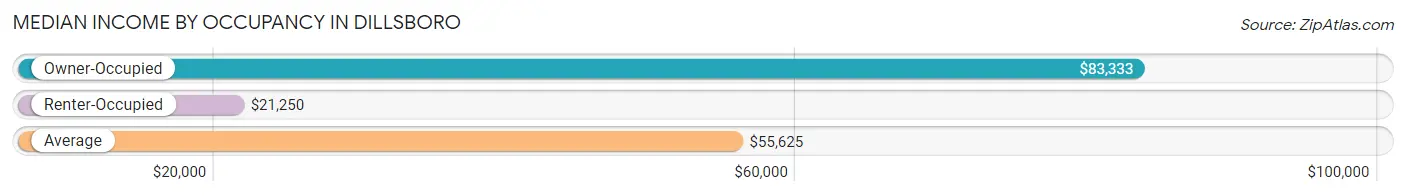
| Occupancy Type | # Households | Median Income |
| Owner-Occupied | 60 (46.2%) | $83,333 |
| Renter-Occupied | 70 (53.8%) | $21,250 |
| Average | 130 (100.0%) | $55,625 |
Occupancy by Householder Income Bracket in Dillsboro
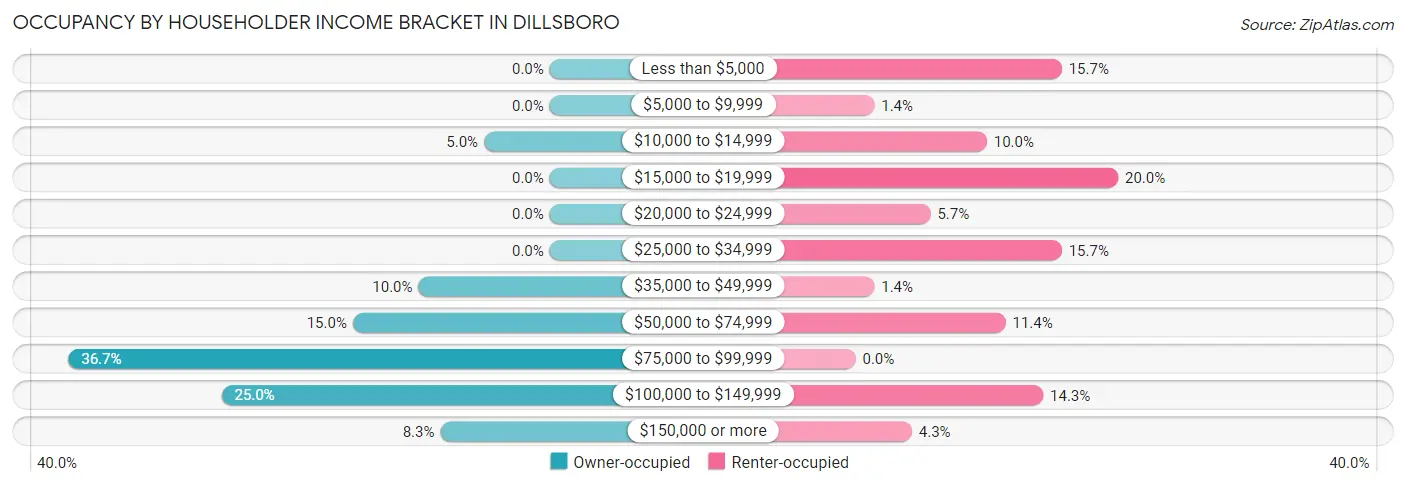
| Income Bracket | Owner-occupied | Renter-occupied |
| Less than $5,000 | 0 (0.0%) | 11 (15.7%) |
| $5,000 to $9,999 | 0 (0.0%) | 1 (1.4%) |
| $10,000 to $14,999 | 3 (5.0%) | 7 (10.0%) |
| $15,000 to $19,999 | 0 (0.0%) | 14 (20.0%) |
| $20,000 to $24,999 | 0 (0.0%) | 4 (5.7%) |
| $25,000 to $34,999 | 0 (0.0%) | 11 (15.7%) |
| $35,000 to $49,999 | 6 (10.0%) | 1 (1.4%) |
| $50,000 to $74,999 | 9 (15.0%) | 8 (11.4%) |
| $75,000 to $99,999 | 22 (36.7%) | 0 (0.0%) |
| $100,000 to $149,999 | 15 (25.0%) | 10 (14.3%) |
| $150,000 or more | 5 (8.3%) | 3 (4.3%) |
| Total | 60 (100.0%) | 70 (100.0%) |
Monthly Housing Cost Tiers in Dillsboro
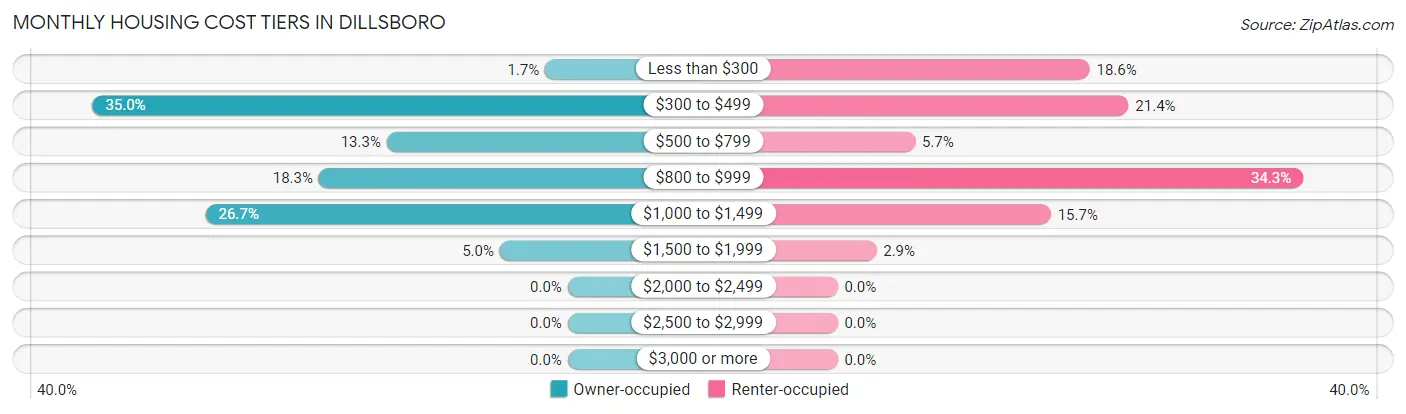
| Monthly Cost | Owner-occupied | Renter-occupied |
| Less than $300 | 1 (1.7%) | 13 (18.6%) |
| $300 to $499 | 21 (35.0%) | 15 (21.4%) |
| $500 to $799 | 8 (13.3%) | 4 (5.7%) |
| $800 to $999 | 11 (18.3%) | 24 (34.3%) |
| $1,000 to $1,499 | 16 (26.7%) | 11 (15.7%) |
| $1,500 to $1,999 | 3 (5.0%) | 2 (2.9%) |
| $2,000 to $2,499 | 0 (0.0%) | 0 (0.0%) |
| $2,500 to $2,999 | 0 (0.0%) | 0 (0.0%) |
| $3,000 or more | 0 (0.0%) | 0 (0.0%) |
| Total | 60 (100.0%) | 70 (100.0%) |
Physical Housing Characteristics in Dillsboro
Housing Structures in Dillsboro
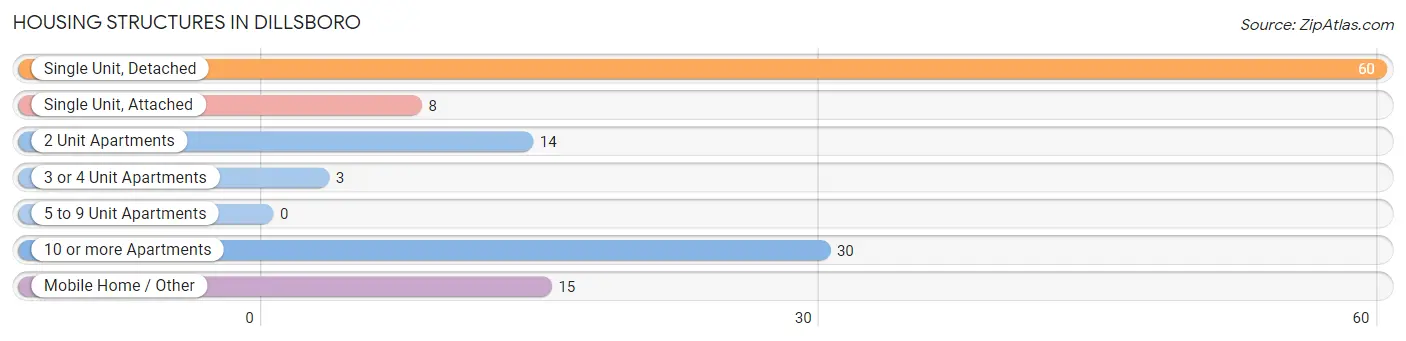
| Structure Type | # Housing Units | % Housing Units |
| Single Unit, Detached | 60 | 46.2% |
| Single Unit, Attached | 8 | 6.1% |
| 2 Unit Apartments | 14 | 10.8% |
| 3 or 4 Unit Apartments | 3 | 2.3% |
| 5 to 9 Unit Apartments | 0 | 0.0% |
| 10 or more Apartments | 30 | 23.1% |
| Mobile Home / Other | 15 | 11.5% |
| Total | 130 | 100.0% |
Housing Structures by Occupancy in Dillsboro
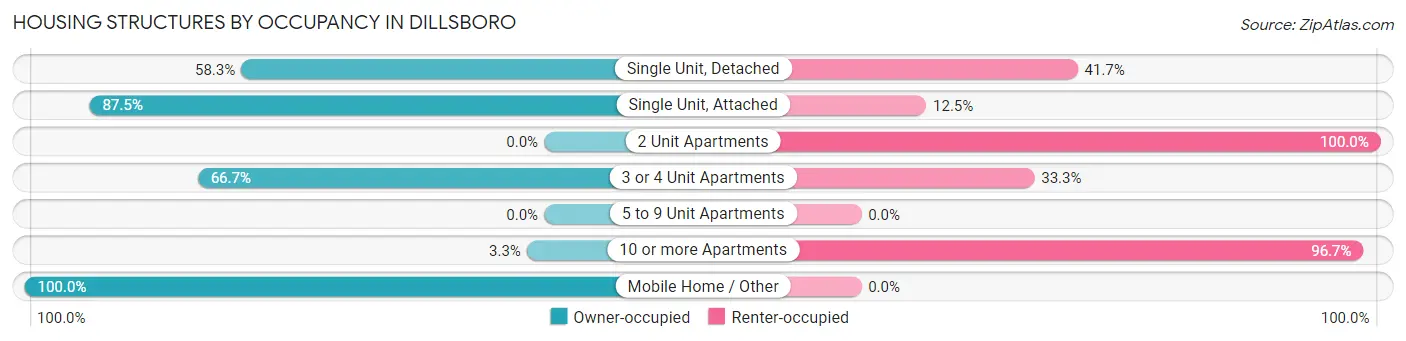
| Structure Type | Owner-occupied | Renter-occupied |
| Single Unit, Detached | 35 (58.3%) | 25 (41.7%) |
| Single Unit, Attached | 7 (87.5%) | 1 (12.5%) |
| 2 Unit Apartments | 0 (0.0%) | 14 (100.0%) |
| 3 or 4 Unit Apartments | 2 (66.7%) | 1 (33.3%) |
| 5 to 9 Unit Apartments | 0 (0.0%) | 0 (0.0%) |
| 10 or more Apartments | 1 (3.3%) | 29 (96.7%) |
| Mobile Home / Other | 15 (100.0%) | 0 (0.0%) |
| Total | 60 (46.2%) | 70 (53.8%) |
Housing Structures by Number of Rooms in Dillsboro
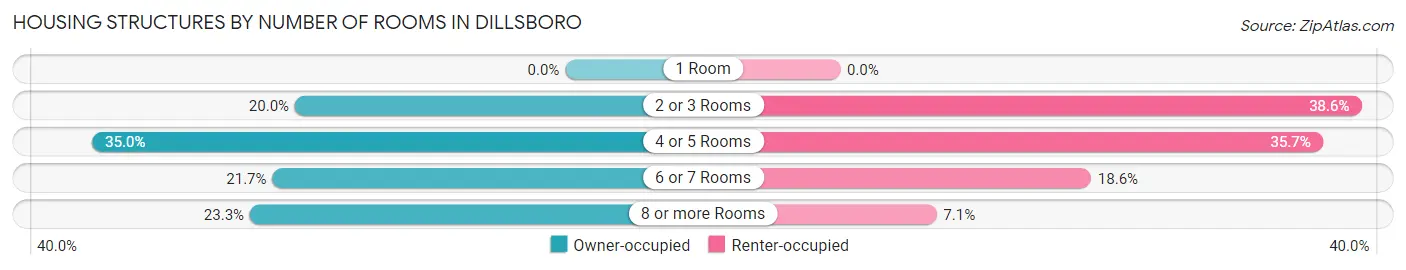
| Number of Rooms | Owner-occupied | Renter-occupied |
| 1 Room | 0 (0.0%) | 0 (0.0%) |
| 2 or 3 Rooms | 12 (20.0%) | 27 (38.6%) |
| 4 or 5 Rooms | 21 (35.0%) | 25 (35.7%) |
| 6 or 7 Rooms | 13 (21.7%) | 13 (18.6%) |
| 8 or more Rooms | 14 (23.3%) | 5 (7.1%) |
| Total | 60 (100.0%) | 70 (100.0%) |
Housing Structure by Heating Type in Dillsboro
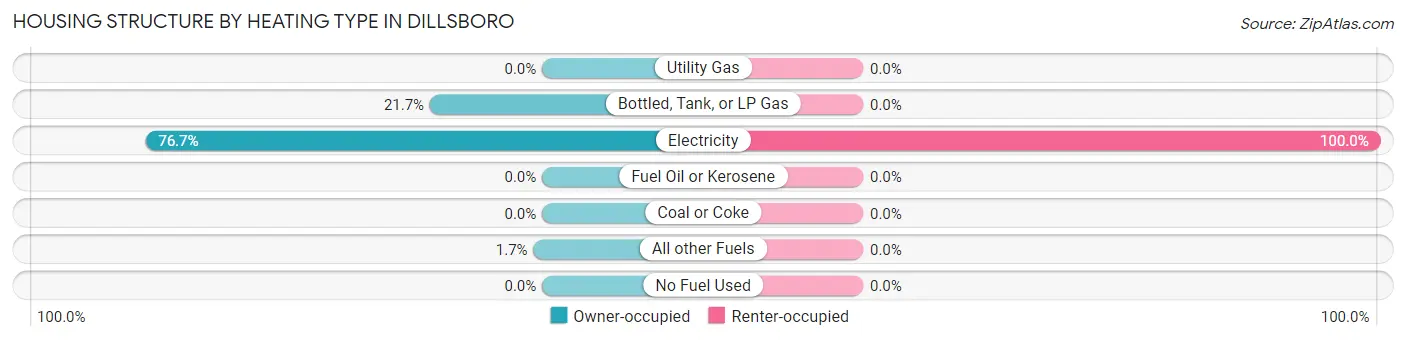
| Heating Type | Owner-occupied | Renter-occupied |
| Utility Gas | 0 (0.0%) | 0 (0.0%) |
| Bottled, Tank, or LP Gas | 13 (21.7%) | 0 (0.0%) |
| Electricity | 46 (76.7%) | 70 (100.0%) |
| Fuel Oil or Kerosene | 0 (0.0%) | 0 (0.0%) |
| Coal or Coke | 0 (0.0%) | 0 (0.0%) |
| All other Fuels | 1 (1.7%) | 0 (0.0%) |
| No Fuel Used | 0 (0.0%) | 0 (0.0%) |
| Total | 60 (100.0%) | 70 (100.0%) |
Household Vehicle Usage in Dillsboro
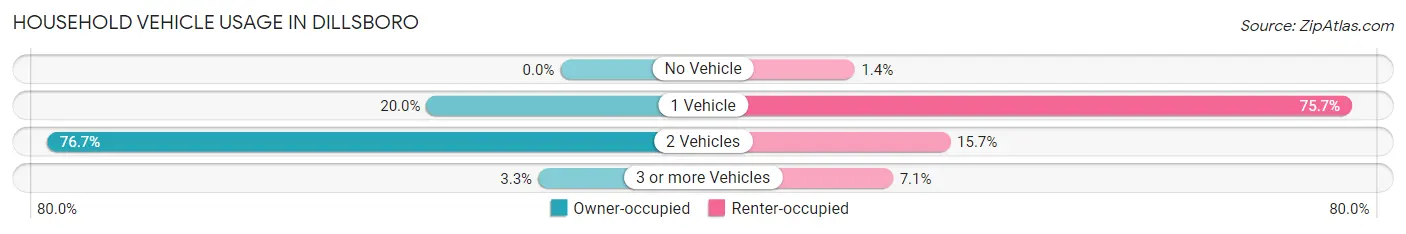
| Vehicles per Household | Owner-occupied | Renter-occupied |
| No Vehicle | 0 (0.0%) | 1 (1.4%) |
| 1 Vehicle | 12 (20.0%) | 53 (75.7%) |
| 2 Vehicles | 46 (76.7%) | 11 (15.7%) |
| 3 or more Vehicles | 2 (3.3%) | 5 (7.1%) |
| Total | 60 (100.0%) | 70 (100.0%) |
Real Estate & Mortgages in Dillsboro
Real Estate and Mortgage Overview in Dillsboro
| Characteristic | Without Mortgage | With Mortgage |
| Housing Units | 31 | 29 |
| Median Property Value | $171,900 | $210,900 |
| Median Household Income | $84,271 | $0 |
| Monthly Housing Costs | $454 | $0 |
| Real Estate Taxes | $850 | $6 |
Property Value by Mortgage Status in Dillsboro
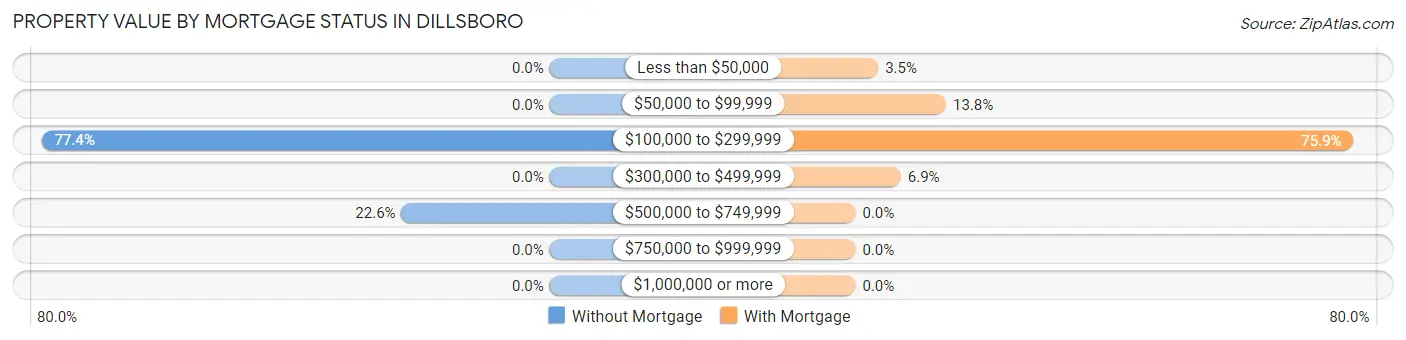
| Property Value | Without Mortgage | With Mortgage |
| Less than $50,000 | 0 (0.0%) | 1 (3.5%) |
| $50,000 to $99,999 | 0 (0.0%) | 4 (13.8%) |
| $100,000 to $299,999 | 24 (77.4%) | 22 (75.9%) |
| $300,000 to $499,999 | 0 (0.0%) | 2 (6.9%) |
| $500,000 to $749,999 | 7 (22.6%) | 0 (0.0%) |
| $750,000 to $999,999 | 0 (0.0%) | 0 (0.0%) |
| $1,000,000 or more | 0 (0.0%) | 0 (0.0%) |
| Total | 31 (100.0%) | 29 (100.0%) |
Household Income by Mortgage Status in Dillsboro
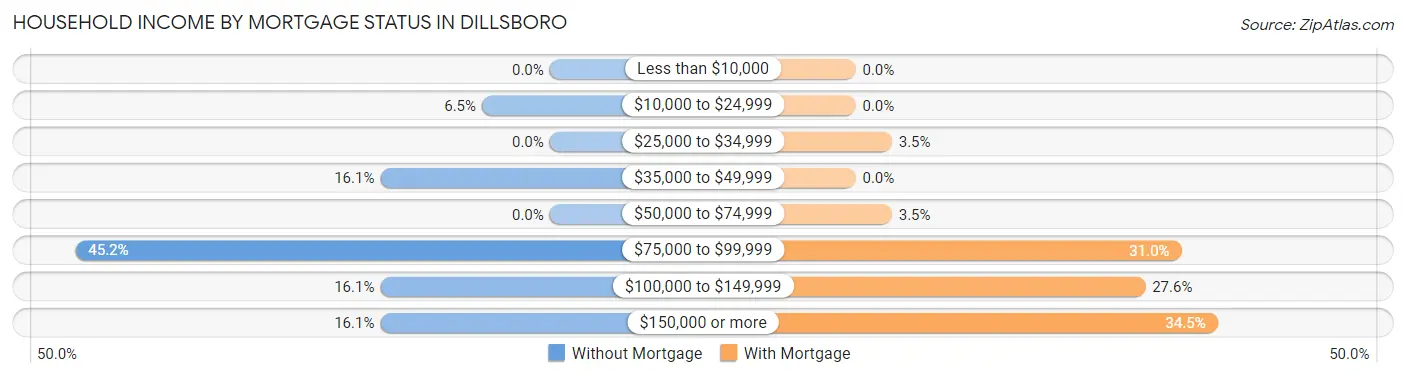
| Household Income | Without Mortgage | With Mortgage |
| Less than $10,000 | 0 (0.0%) | 0 (0.0%) |
| $10,000 to $24,999 | 2 (6.5%) | 0 (0.0%) |
| $25,000 to $34,999 | 0 (0.0%) | 1 (3.5%) |
| $35,000 to $49,999 | 5 (16.1%) | 0 (0.0%) |
| $50,000 to $74,999 | 0 (0.0%) | 1 (3.5%) |
| $75,000 to $99,999 | 14 (45.2%) | 9 (31.0%) |
| $100,000 to $149,999 | 5 (16.1%) | 8 (27.6%) |
| $150,000 or more | 5 (16.1%) | 10 (34.5%) |
| Total | 31 (100.0%) | 29 (100.0%) |
Property Value to Household Income Ratio in Dillsboro
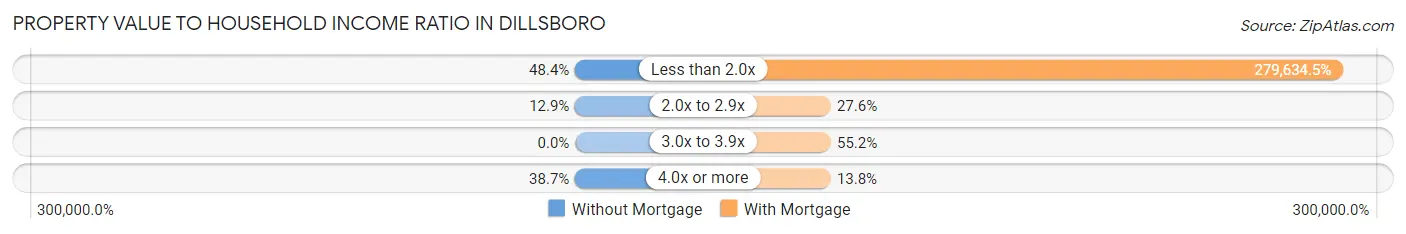
| Value-to-Income Ratio | Without Mortgage | With Mortgage |
| Less than 2.0x | 15 (48.4%) | 81,094 (279,634.5%) |
| 2.0x to 2.9x | 4 (12.9%) | 8 (27.6%) |
| 3.0x to 3.9x | 0 (0.0%) | 16 (55.2%) |
| 4.0x or more | 12 (38.7%) | 4 (13.8%) |
| Total | 31 (100.0%) | 29 (100.0%) |
Real Estate Taxes by Mortgage Status in Dillsboro
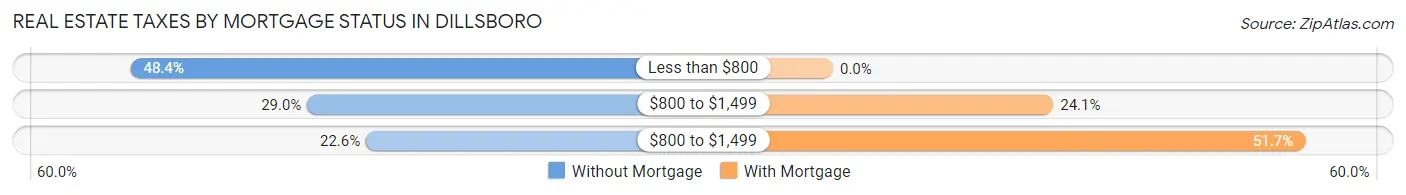
| Property Taxes | Without Mortgage | With Mortgage |
| Less than $800 | 15 (48.4%) | 0 (0.0%) |
| $800 to $1,499 | 9 (29.0%) | 7 (24.1%) |
| $800 to $1,499 | 7 (22.6%) | 15 (51.7%) |
| Total | 31 (100.0%) | 29 (100.0%) |
Health & Disability in Dillsboro
Health Insurance Coverage by Age in Dillsboro
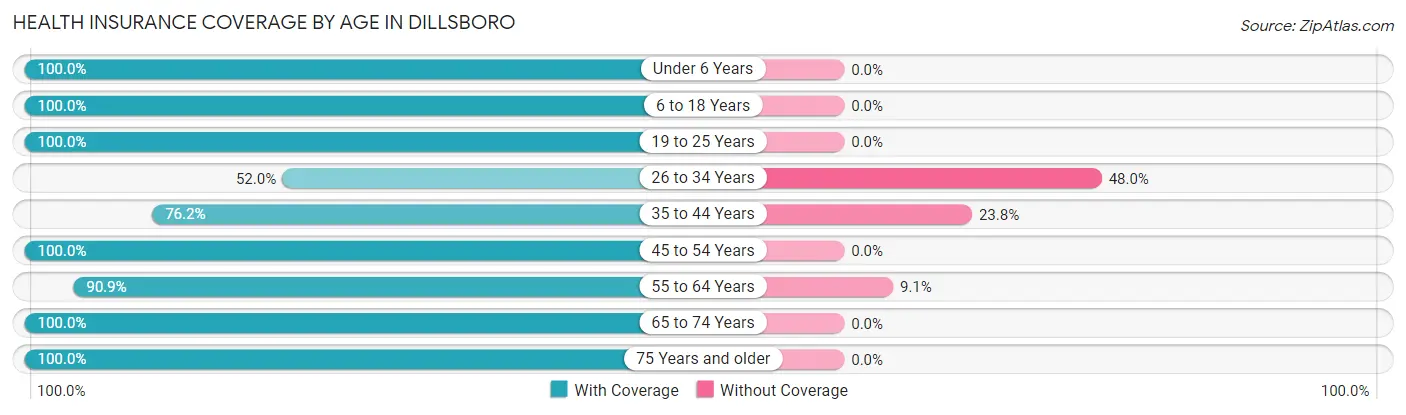
| Age Bracket | With Coverage | Without Coverage |
| Under 6 Years | 7 (100.0%) | 0 (0.0%) |
| 6 to 18 Years | 38 (100.0%) | 0 (0.0%) |
| 19 to 25 Years | 12 (100.0%) | 0 (0.0%) |
| 26 to 34 Years | 13 (52.0%) | 12 (48.0%) |
| 35 to 44 Years | 32 (76.2%) | 10 (23.8%) |
| 45 to 54 Years | 24 (100.0%) | 0 (0.0%) |
| 55 to 64 Years | 20 (90.9%) | 2 (9.1%) |
| 65 to 74 Years | 26 (100.0%) | 0 (0.0%) |
| 75 Years and older | 35 (100.0%) | 0 (0.0%) |
| Total | 207 (89.6%) | 24 (10.4%) |
Health Insurance Coverage by Citizenship Status in Dillsboro
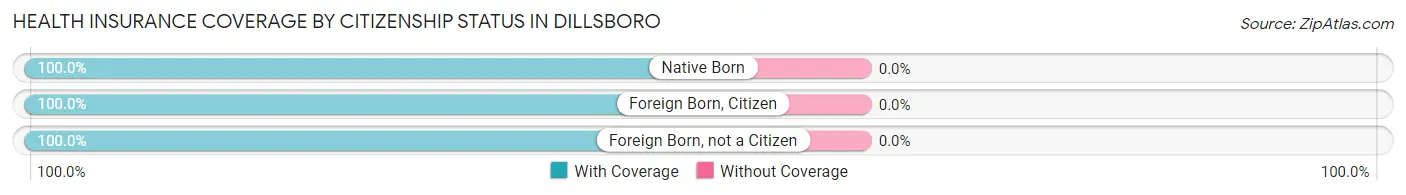
| Citizenship Status | With Coverage | Without Coverage |
| Native Born | 7 (100.0%) | 0 (0.0%) |
| Foreign Born, Citizen | 38 (100.0%) | 0 (0.0%) |
| Foreign Born, not a Citizen | 12 (100.0%) | 0 (0.0%) |
Health Insurance Coverage by Household Income in Dillsboro
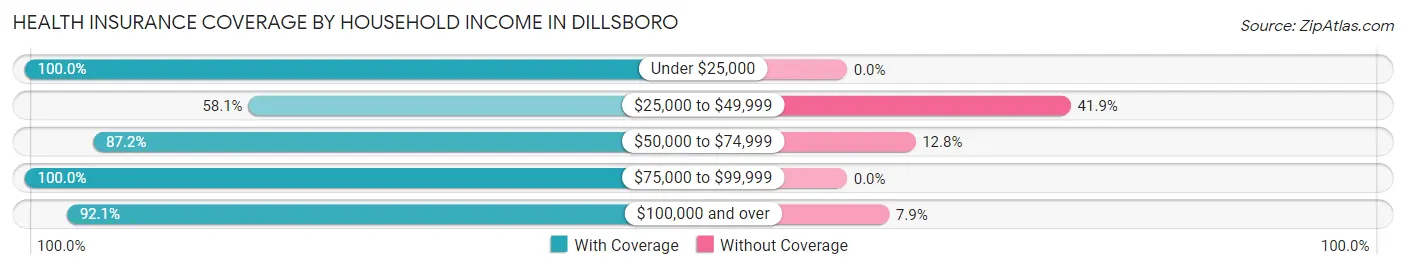
| Household Income | With Coverage | Without Coverage |
| Under $25,000 | 42 (100.0%) | 0 (0.0%) |
| $25,000 to $49,999 | 18 (58.1%) | 13 (41.9%) |
| $50,000 to $74,999 | 34 (87.2%) | 5 (12.8%) |
| $75,000 to $99,999 | 43 (100.0%) | 0 (0.0%) |
| $100,000 and over | 70 (92.1%) | 6 (7.9%) |
Public vs Private Health Insurance Coverage by Age in Dillsboro
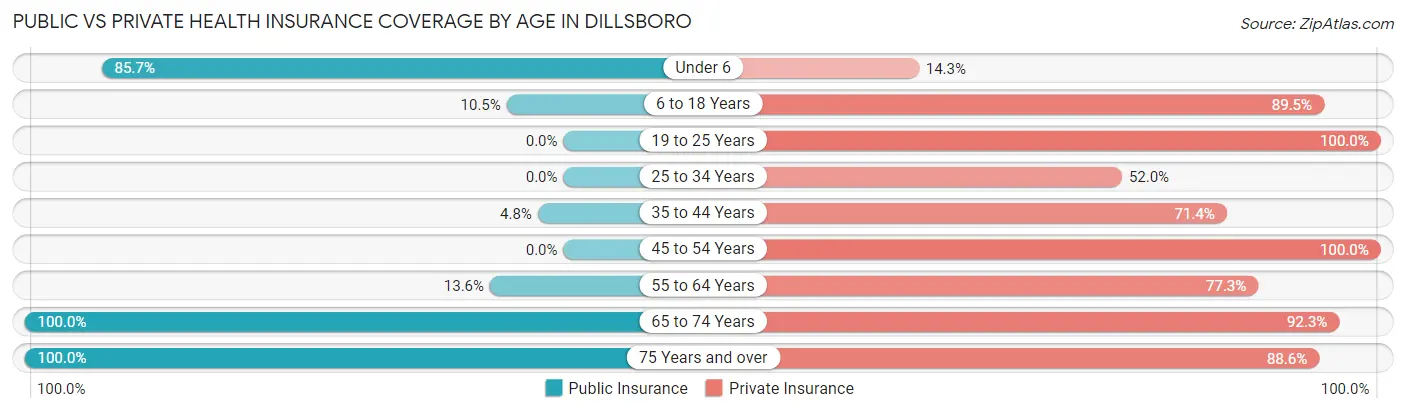
| Age Bracket | Public Insurance | Private Insurance |
| Under 6 | 6 (85.7%) | 1 (14.3%) |
| 6 to 18 Years | 4 (10.5%) | 34 (89.5%) |
| 19 to 25 Years | 0 (0.0%) | 12 (100.0%) |
| 25 to 34 Years | 0 (0.0%) | 13 (52.0%) |
| 35 to 44 Years | 2 (4.8%) | 30 (71.4%) |
| 45 to 54 Years | 0 (0.0%) | 24 (100.0%) |
| 55 to 64 Years | 3 (13.6%) | 17 (77.3%) |
| 65 to 74 Years | 26 (100.0%) | 24 (92.3%) |
| 75 Years and over | 35 (100.0%) | 31 (88.6%) |
| Total | 76 (32.9%) | 186 (80.5%) |
Disability Status by Sex by Age in Dillsboro
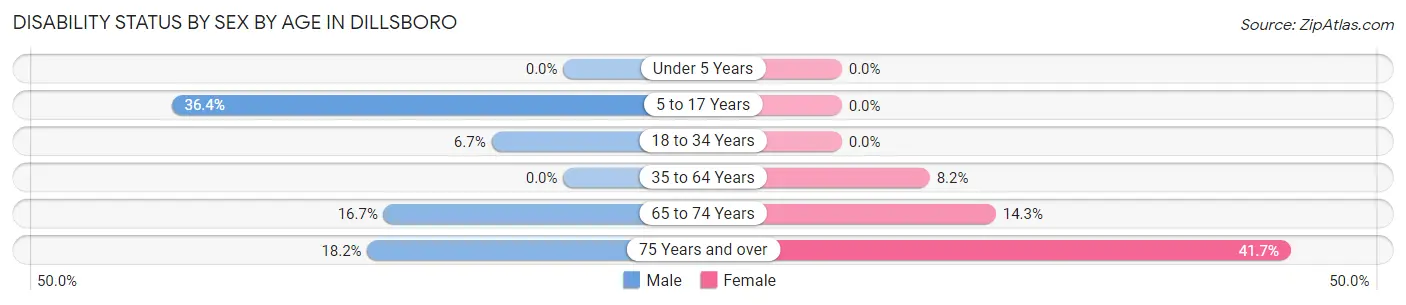
| Age Bracket | Male | Female |
| Under 5 Years | 0 (0.0%) | 0 (0.0%) |
| 5 to 17 Years | 4 (36.4%) | 0 (0.0%) |
| 18 to 34 Years | 1 (6.7%) | 0 (0.0%) |
| 35 to 64 Years | 0 (0.0%) | 4 (8.2%) |
| 65 to 74 Years | 2 (16.7%) | 2 (14.3%) |
| 75 Years and over | 2 (18.2%) | 10 (41.7%) |
Disability Class by Sex by Age in Dillsboro
Disability Class: Hearing Difficulty
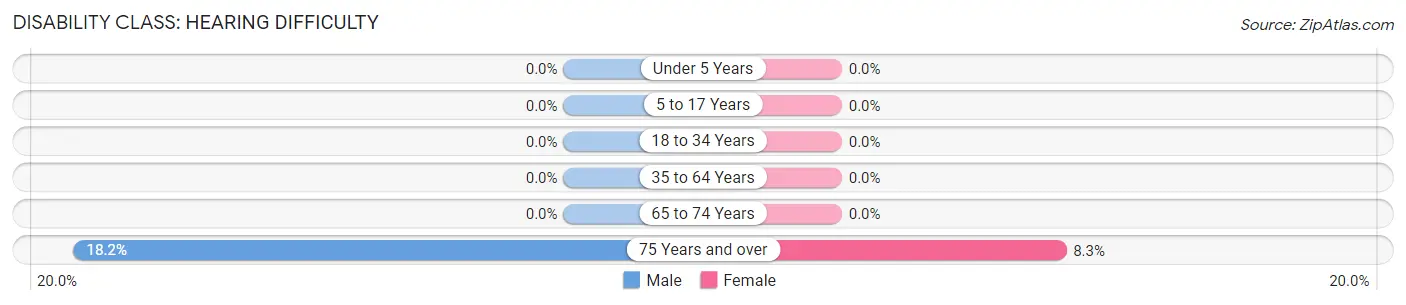
| Age Bracket | Male | Female |
| Under 5 Years | 0 (0.0%) | 0 (0.0%) |
| 5 to 17 Years | 0 (0.0%) | 0 (0.0%) |
| 18 to 34 Years | 0 (0.0%) | 0 (0.0%) |
| 35 to 64 Years | 0 (0.0%) | 0 (0.0%) |
| 65 to 74 Years | 0 (0.0%) | 0 (0.0%) |
| 75 Years and over | 2 (18.2%) | 2 (8.3%) |
Disability Class: Vision Difficulty
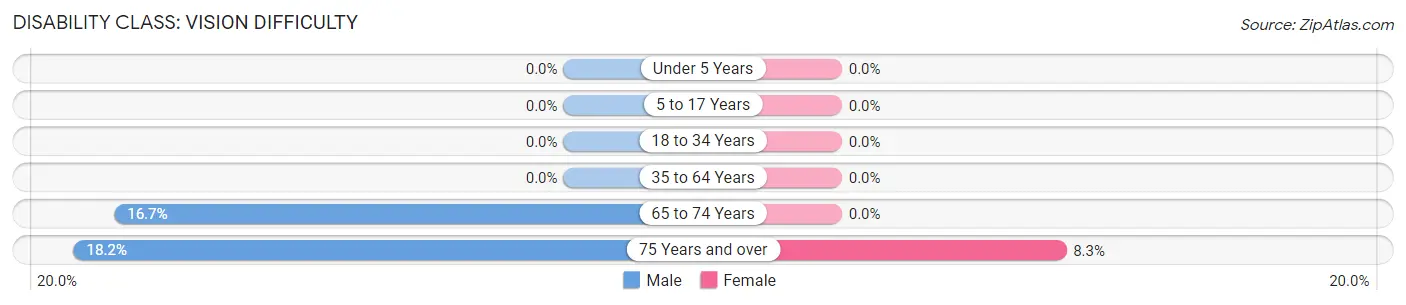
| Age Bracket | Male | Female |
| Under 5 Years | 0 (0.0%) | 0 (0.0%) |
| 5 to 17 Years | 0 (0.0%) | 0 (0.0%) |
| 18 to 34 Years | 0 (0.0%) | 0 (0.0%) |
| 35 to 64 Years | 0 (0.0%) | 0 (0.0%) |
| 65 to 74 Years | 2 (16.7%) | 0 (0.0%) |
| 75 Years and over | 2 (18.2%) | 2 (8.3%) |
Disability Class: Cognitive Difficulty
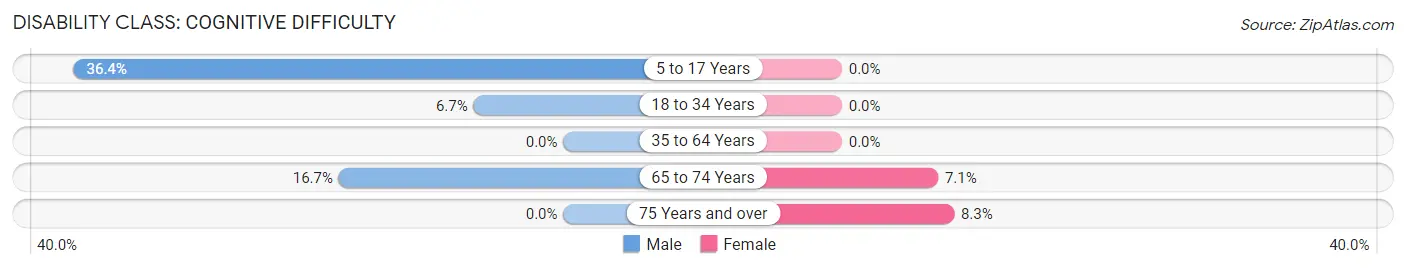
| Age Bracket | Male | Female |
| 5 to 17 Years | 4 (36.4%) | 0 (0.0%) |
| 18 to 34 Years | 1 (6.7%) | 0 (0.0%) |
| 35 to 64 Years | 0 (0.0%) | 0 (0.0%) |
| 65 to 74 Years | 2 (16.7%) | 1 (7.1%) |
| 75 Years and over | 0 (0.0%) | 2 (8.3%) |
Disability Class: Ambulatory Difficulty
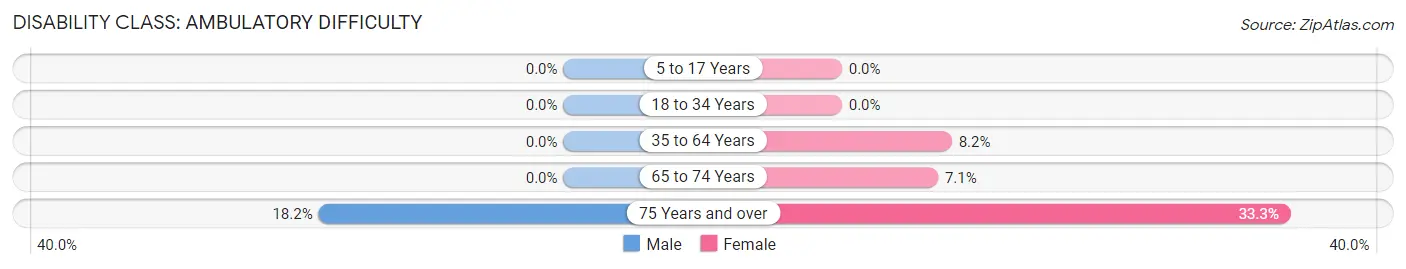
| Age Bracket | Male | Female |
| 5 to 17 Years | 0 (0.0%) | 0 (0.0%) |
| 18 to 34 Years | 0 (0.0%) | 0 (0.0%) |
| 35 to 64 Years | 0 (0.0%) | 4 (8.2%) |
| 65 to 74 Years | 0 (0.0%) | 1 (7.1%) |
| 75 Years and over | 2 (18.2%) | 8 (33.3%) |
Disability Class: Self-Care Difficulty
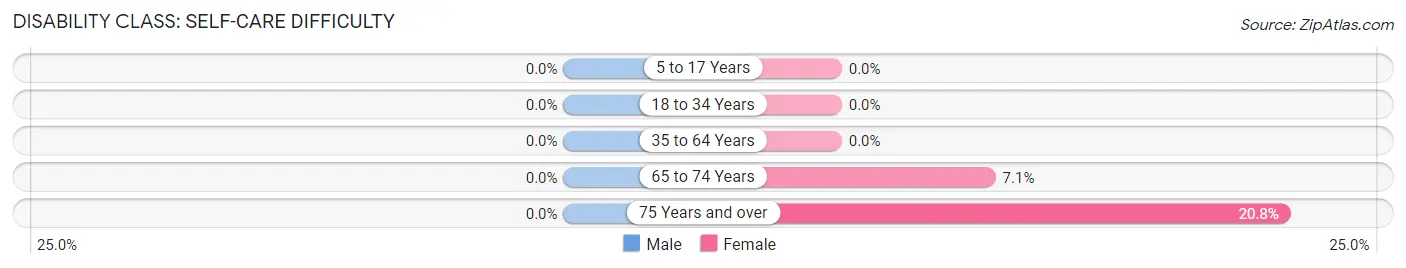
| Age Bracket | Male | Female |
| 5 to 17 Years | 0 (0.0%) | 0 (0.0%) |
| 18 to 34 Years | 0 (0.0%) | 0 (0.0%) |
| 35 to 64 Years | 0 (0.0%) | 0 (0.0%) |
| 65 to 74 Years | 0 (0.0%) | 1 (7.1%) |
| 75 Years and over | 0 (0.0%) | 5 (20.8%) |
Technology Access in Dillsboro
Computing Device Access in Dillsboro
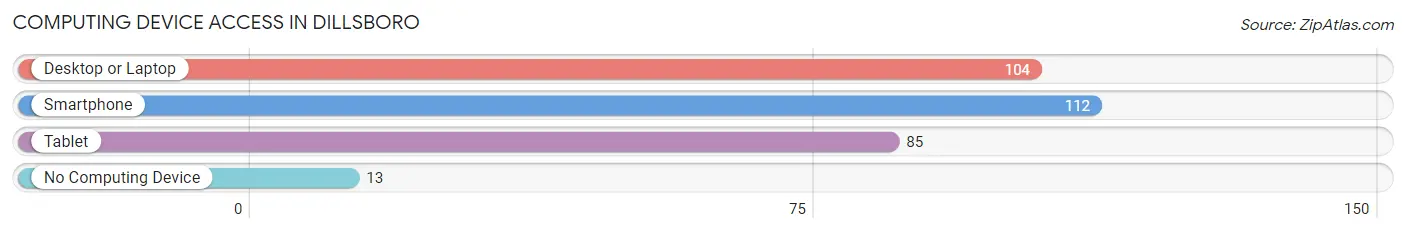
| Device Type | # Households | % Households |
| Desktop or Laptop | 104 | 80.0% |
| Smartphone | 112 | 86.2% |
| Tablet | 85 | 65.4% |
| No Computing Device | 13 | 10.0% |
| Total | 130 | 100.0% |
Internet Access in Dillsboro
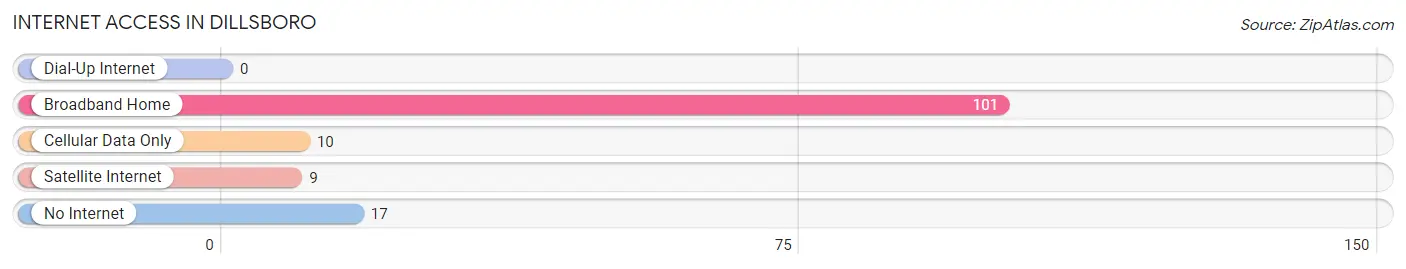
| Internet Type | # Households | % Households |
| Dial-Up Internet | 0 | 0.0% |
| Broadband Home | 101 | 77.7% |
| Cellular Data Only | 10 | 7.7% |
| Satellite Internet | 9 | 6.9% |
| No Internet | 17 | 13.1% |
| Total | 130 | 100.0% |
Dillsboro Summary
Dillsboro is a small town located in the western part of North Carolina, in the United States. It is situated in the Great Smoky Mountains, and is part of the Jackson County area. The town is located along the Tuckasegee River, and is a popular tourist destination due to its proximity to the Great Smoky Mountains National Park.
History
Dillsboro was founded in 1883 by William Dills, a local farmer and entrepreneur. He purchased the land from the Cherokee Indians and named the town after himself. The town quickly grew, and by the early 1900s, it had become a popular tourist destination. The town was home to several hotels, restaurants, and stores, and was a popular stop for travelers heading to the Great Smoky Mountains.
In the early 1900s, the town was also home to a thriving lumber industry. The town was home to several sawmills, and the lumber industry provided jobs for many of the town’s residents. The lumber industry eventually declined, and the town shifted its focus to tourism.
In the late 20th century, the town was revitalized with the construction of the Great Smoky Mountains Railroad. The railroad brought tourists to the town, and the town’s economy began to grow again. Today, Dillsboro is a popular tourist destination, and is home to several restaurants, shops, and hotels.
Geography
Dillsboro is located in the western part of North Carolina, in the United States. It is situated in the Great Smoky Mountains, and is part of the Jackson County area. The town is located along the Tuckasegee River, and is a popular tourist destination due to its proximity to the Great Smoky Mountains National Park.
The town is located at an elevation of 1,890 feet, and has a total area of 0.7 square miles. The town is surrounded by the Nantahala National Forest, and is home to several hiking trails and outdoor activities.
Economy
The economy of Dillsboro is largely based on tourism. The town is home to several restaurants, shops, and hotels, and is a popular destination for travelers heading to the Great Smoky Mountains National Park. The town is also home to several art galleries, and is a popular destination for art lovers.
The town is also home to several manufacturing companies, including a furniture factory and a paper mill. The town is also home to several small businesses, including a brewery, a winery, and a distillery.
Demographics
As of the 2010 census, the population of Dillsboro was 845. The town has a population density of 1,200 people per square mile. The median age of the town’s population is 44.7 years, and the median household income is $37,500.
The town is predominantly white, with 92.3% of the population identifying as white. The town is also home to a small Hispanic population, with 4.2% of the population identifying as Hispanic or Latino. The town is also home to a small African American population, with 1.2% of the population identifying as African American.
Conclusion
Dillsboro is a small town located in the western part of North Carolina, in the United States. It is situated in the Great Smoky Mountains, and is part of the Jackson County area. The town is located along the Tuckasegee River, and is a popular tourist destination due to its proximity to the Great Smoky Mountains National Park. The town’s economy is largely based on tourism, and the town is home to several restaurants, shops, and hotels. The town is predominantly white, with 92.3% of the population identifying as white. The town is also home to a small Hispanic population, with 4.2% of the population identifying as Hispanic or Latino. The town is also home to a small African American population, with 1.2% of the population identifying as African American.
Common Questions
What is Per Capita Income in Dillsboro?
Per Capita income in Dillsboro is $34,729.
What is the Median Family Income in Dillsboro?
Median Family Income in Dillsboro is $83,646.
What is the Median Household income in Dillsboro?
Median Household Income in Dillsboro is $55,625.
What is Income or Wage Gap in Dillsboro?
Income or Wage Gap in Dillsboro is 51.0%.
Women in Dillsboro earn 49.0 cents for every dollar earned by a man.
What is Inequality or Gini Index in Dillsboro?
Inequality or Gini Index in Dillsboro is 0.43.
What is the Total Population of Dillsboro?
Total Population of Dillsboro is 231.
What is the Total Male Population of Dillsboro?
Total Male Population of Dillsboro is 89.
What is the Total Female Population of Dillsboro?
Total Female Population of Dillsboro is 142.
What is the Ratio of Males per 100 Females in Dillsboro?
There are 62.68 Males per 100 Females in Dillsboro.
What is the Ratio of Females per 100 Males in Dillsboro?
There are 159.55 Females per 100 Males in Dillsboro.
What is the Median Population Age in Dillsboro?
Median Population Age in Dillsboro is 44.5 Years.
What is the Average Family Size in Dillsboro
Average Family Size in Dillsboro is 2.4 People.
What is the Average Household Size in Dillsboro
Average Household Size in Dillsboro is 1.8 People.
How Large is the Labor Force in Dillsboro?
There are 120 People in the Labor Forcein in Dillsboro.
What is the Percentage of People in the Labor Force in Dillsboro?
63.5% of People are in the Labor Force in Dillsboro.