Boonville, NC Map & Demographics
Boonville Map
Boonville Overview
$30,178
PER CAPITA INCOME
$71,563
AVG FAMILY INCOME
$59,408
AVG HOUSEHOLD INCOME
34.2%
WAGE / INCOME GAP [ % ]
65.8¢/ $1
WAGE / INCOME GAP [ $ ]
$13,426
FAMILY INCOME DEFICIT
0.39
INEQUALITY / GINI INDEX
1,364
TOTAL POPULATION
614
MALE POPULATION
750
FEMALE POPULATION
81.87
MALES / 100 FEMALES
122.15
FEMALES / 100 MALES
36.9
MEDIAN AGE
3.7
AVG FAMILY SIZE
2.5
AVG HOUSEHOLD SIZE
532
LABOR FORCE [ PEOPLE ]
50.7%
PERCENT IN LABOR FORCE
Boonville Zip Codes
Boonville Area Codes
Income in Boonville
Income Overview in Boonville
Per Capita Income in Boonville is $30,178, while median incomes of families and households are $71,563 and $59,408 respectively.
| Characteristic | Number | Measure |
| Per Capita Income | 1,364 | $30,178 |
| Median Family Income | 290 | $71,563 |
| Mean Family Income | 290 | $73,084 |
| Median Household Income | 555 | $59,408 |
| Mean Household Income | 555 | $63,869 |
| Income Deficit | 290 | $13,426 |
| Wage / Income Gap (%) | 1,364 | 34.25% |
| Wage / Income Gap ($) | 1,364 | 65.75¢ per $1 |
| Gini / Inequality Index | 1,364 | 0.39 |
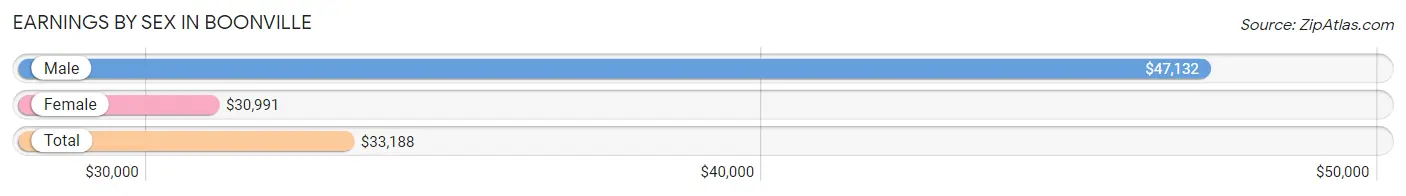
Earnings by Sex in Boonville
Average Earnings in Boonville are $33,188, $47,132 for men and $30,991 for women, a difference of 34.3%.
| Sex | Number | Average Earnings |
| Male | 263 (48.3%) | $47,132 |
| Female | 282 (51.7%) | $30,991 |
| Total | 545 (100.0%) | $33,188 |
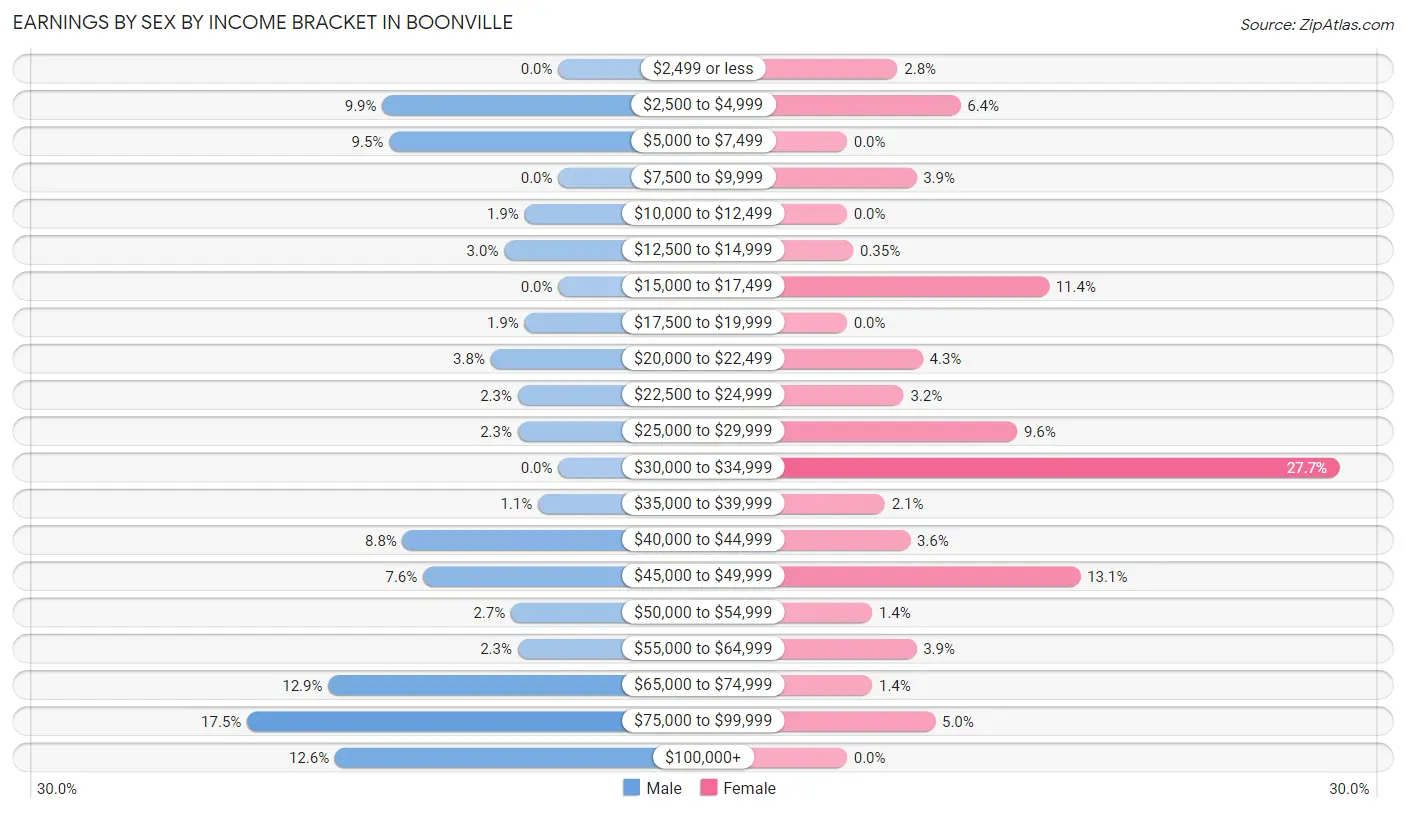
Earnings by Sex by Income Bracket in Boonville
The most common earnings brackets in Boonville are $75,000 to $99,999 for men (46 | 17.5%) and $30,000 to $34,999 for women (78 | 27.7%).
| Income | Male | Female |
| $2,499 or less | 0 (0.0%) | 8 (2.8%) |
| $2,500 to $4,999 | 26 (9.9%) | 18 (6.4%) |
| $5,000 to $7,499 | 25 (9.5%) | 0 (0.0%) |
| $7,500 to $9,999 | 0 (0.0%) | 11 (3.9%) |
| $10,000 to $12,499 | 5 (1.9%) | 0 (0.0%) |
| $12,500 to $14,999 | 8 (3.0%) | 1 (0.4%) |
| $15,000 to $17,499 | 0 (0.0%) | 32 (11.4%) |
| $17,500 to $19,999 | 5 (1.9%) | 0 (0.0%) |
| $20,000 to $22,499 | 10 (3.8%) | 12 (4.3%) |
| $22,500 to $24,999 | 6 (2.3%) | 9 (3.2%) |
| $25,000 to $29,999 | 6 (2.3%) | 27 (9.6%) |
| $30,000 to $34,999 | 0 (0.0%) | 78 (27.7%) |
| $35,000 to $39,999 | 3 (1.1%) | 6 (2.1%) |
| $40,000 to $44,999 | 23 (8.7%) | 10 (3.5%) |
| $45,000 to $49,999 | 20 (7.6%) | 37 (13.1%) |
| $50,000 to $54,999 | 7 (2.7%) | 4 (1.4%) |
| $55,000 to $64,999 | 6 (2.3%) | 11 (3.9%) |
| $65,000 to $74,999 | 34 (12.9%) | 4 (1.4%) |
| $75,000 to $99,999 | 46 (17.5%) | 14 (5.0%) |
| $100,000+ | 33 (12.6%) | 0 (0.0%) |
| Total | 263 (100.0%) | 282 (100.0%) |
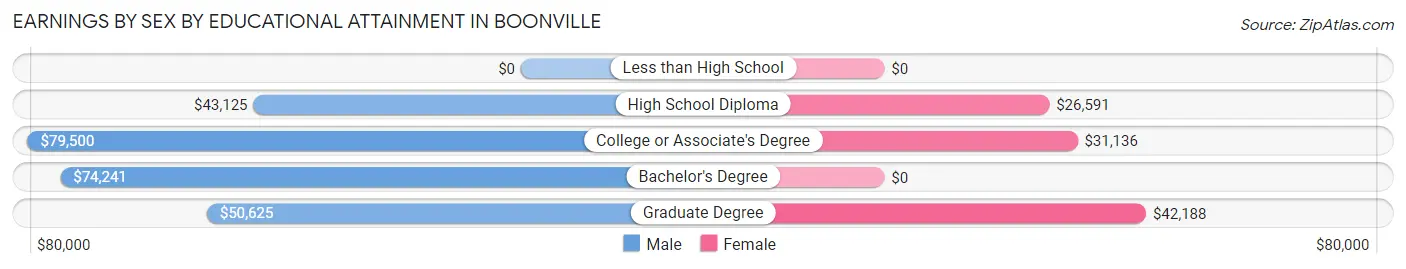
Earnings by Sex by Educational Attainment in Boonville
Average earnings in Boonville are $72,902 for men and $31,318 for women, a difference of 57.0%. Men with an educational attainment of college or associate's degree enjoy the highest average annual earnings of $79,500, while those with high school diploma education earn the least with $43,125. Women with an educational attainment of graduate degree earn the most with the average annual earnings of $42,188, while those with high school diploma education have the smallest earnings of $26,591.
| Educational Attainment | Male Income | Female Income |
| Less than High School | - | - |
| High School Diploma | $43,125 | $26,591 |
| College or Associate's Degree | $79,500 | $31,136 |
| Bachelor's Degree | $74,241 | $0 |
| Graduate Degree | $50,625 | $42,188 |
| Total | $72,902 | $31,318 |
Family Income in Boonville
Family Income Brackets in Boonville
According to the Boonville family income data, there are 70 families falling into the $25,000 to $34,999 income range, which is the most common income bracket and makes up 24.1% of all families. Conversely, the $10,000 to $14,999 income bracket is the least frequent group with only 1 families (0.3%) belonging to this category.
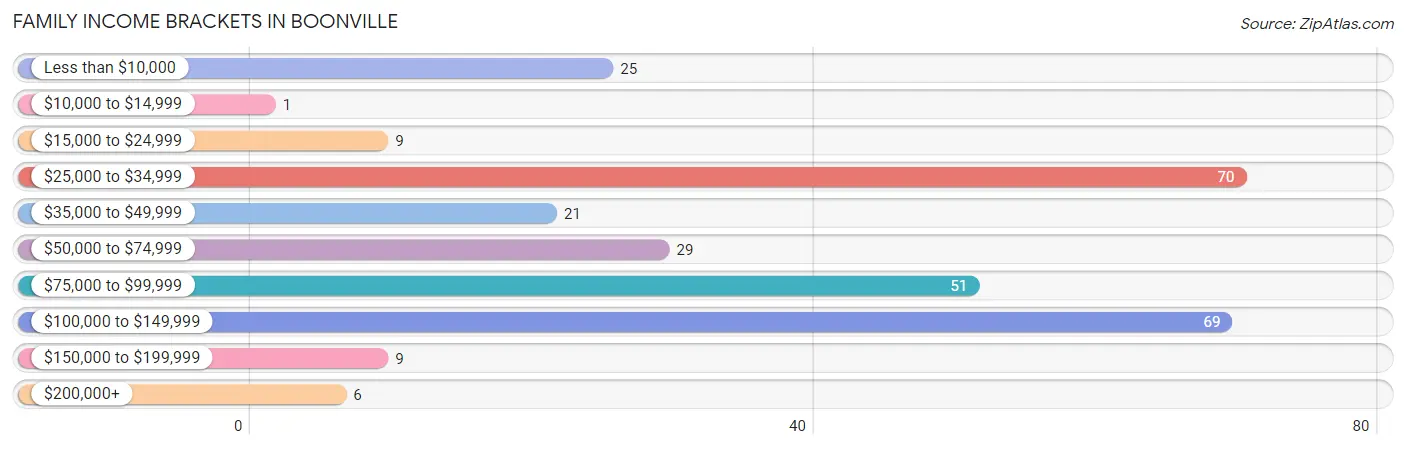
| Income Bracket | # Families | % Families |
| Less than $10,000 | 25 | 8.6% |
| $10,000 to $14,999 | 1 | 0.3% |
| $15,000 to $24,999 | 9 | 3.1% |
| $25,000 to $34,999 | 70 | 24.1% |
| $35,000 to $49,999 | 21 | 7.2% |
| $50,000 to $74,999 | 29 | 10.0% |
| $75,000 to $99,999 | 51 | 17.6% |
| $100,000 to $149,999 | 69 | 23.8% |
| $150,000 to $199,999 | 9 | 3.1% |
| $200,000+ | 6 | 2.1% |
Family Income by Famaliy Size in Boonville
2-person families (131 | 45.2%) account for the highest median family income in Boonville with $92,721 per family, while 2-person families (131 | 45.2%) have the highest median income of $46,360 per family member.
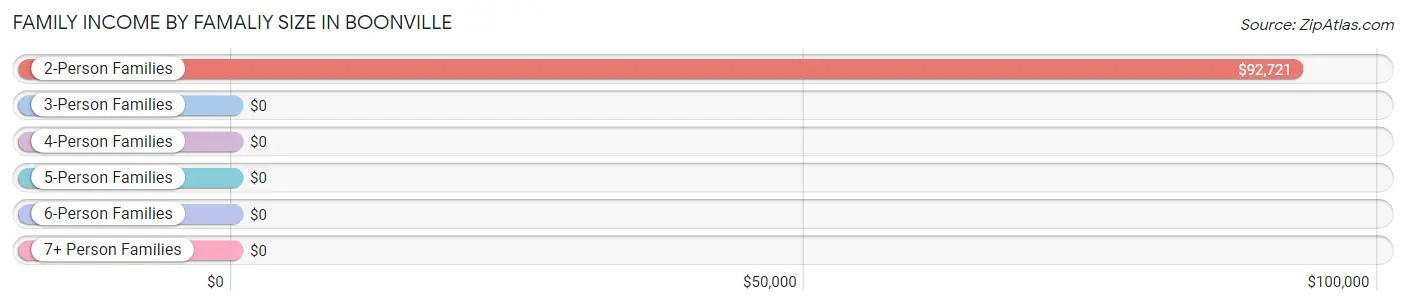
| Income Bracket | # Families | Median Income |
| 2-Person Families | 131 (45.2%) | $92,721 |
| 3-Person Families | 75 (25.9%) | $0 |
| 4-Person Families | 63 (21.7%) | $0 |
| 5-Person Families | 13 (4.5%) | $0 |
| 6-Person Families | 8 (2.8%) | $0 |
| 7+ Person Families | 0 (0.0%) | $0 |
| Total | 290 (100.0%) | $71,563 |
Family Income by Number of Earners in Boonville
The median family income in Boonville is $71,563, with families comprising 2 earners (93) having the highest median family income of $108,750, while families with 1 earner (106) have the lowest median family income of $32,073, accounting for 32.1% and 36.5% of families, respectively.
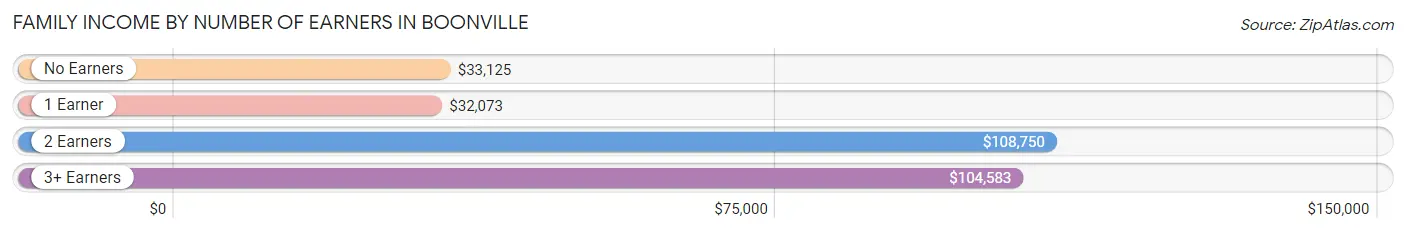
| Number of Earners | # Families | Median Income |
| No Earners | 66 (22.8%) | $33,125 |
| 1 Earner | 106 (36.5%) | $32,073 |
| 2 Earners | 93 (32.1%) | $108,750 |
| 3+ Earners | 25 (8.6%) | $104,583 |
| Total | 290 (100.0%) | $71,563 |
Household Income in Boonville
Household Income Brackets in Boonville
With 133 households falling in the category, the $50,000 to $74,999 income range is the most frequent in Boonville, accounting for 24.0% of all households. In contrast, only 10 households (1.8%) fall into the $200,000+ income bracket, making it the least populous group.
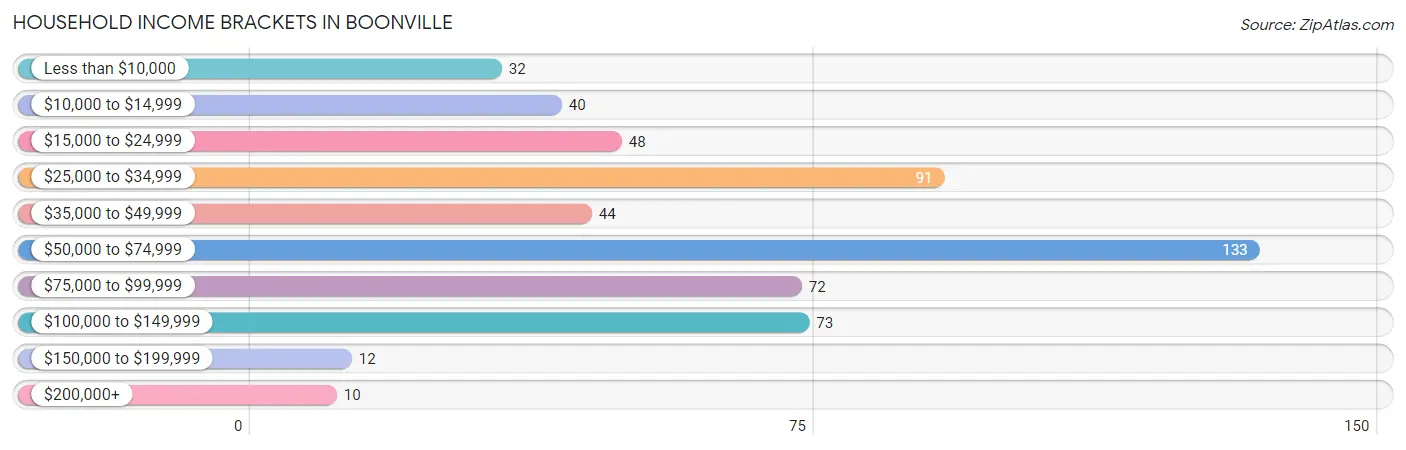
| Income Bracket | # Households | % Households |
| Less than $10,000 | 32 | 5.8% |
| $10,000 to $14,999 | 40 | 7.2% |
| $15,000 to $24,999 | 48 | 8.6% |
| $25,000 to $34,999 | 91 | 16.4% |
| $35,000 to $49,999 | 44 | 7.9% |
| $50,000 to $74,999 | 133 | 24.0% |
| $75,000 to $99,999 | 72 | 13.0% |
| $100,000 to $149,999 | 73 | 13.2% |
| $150,000 to $199,999 | 12 | 2.2% |
| $200,000+ | 10 | 1.8% |
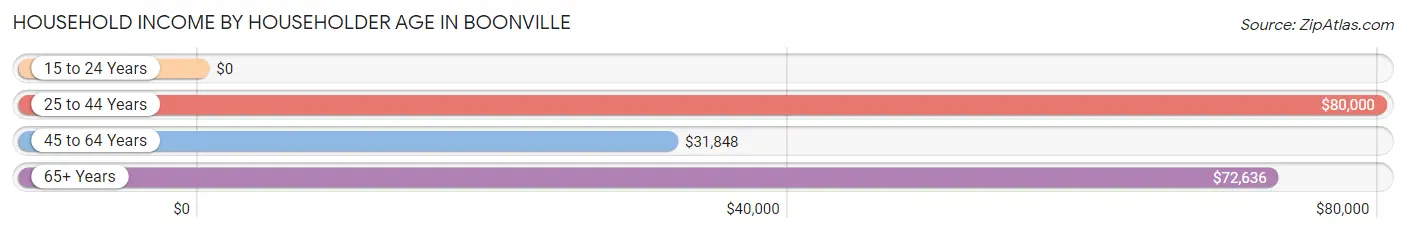
Household Income by Householder Age in Boonville
The median household income in Boonville is $59,408, with the highest median household income of $80,000 found in the 25 to 44 years age bracket for the primary householder. A total of 172 households (31.0%) fall into this category.
| Income Bracket | # Households | Median Income |
| 15 to 24 Years | 0 (0.0%) | $0 |
| 25 to 44 Years | 172 (31.0%) | $80,000 |
| 45 to 64 Years | 174 (31.4%) | $31,848 |
| 65+ Years | 209 (37.7%) | $72,636 |
| Total | 555 (100.0%) | $59,408 |
Poverty in Boonville
Income Below Poverty by Sex and Age in Boonville
With 12.5% poverty level for males and 14.5% for females among the residents of Boonville, under 5 year old males and 55 to 64 year old females are the most vulnerable to poverty, with 11 males (47.8%) and 27 females (50.0%) in their respective age groups living below the poverty level.
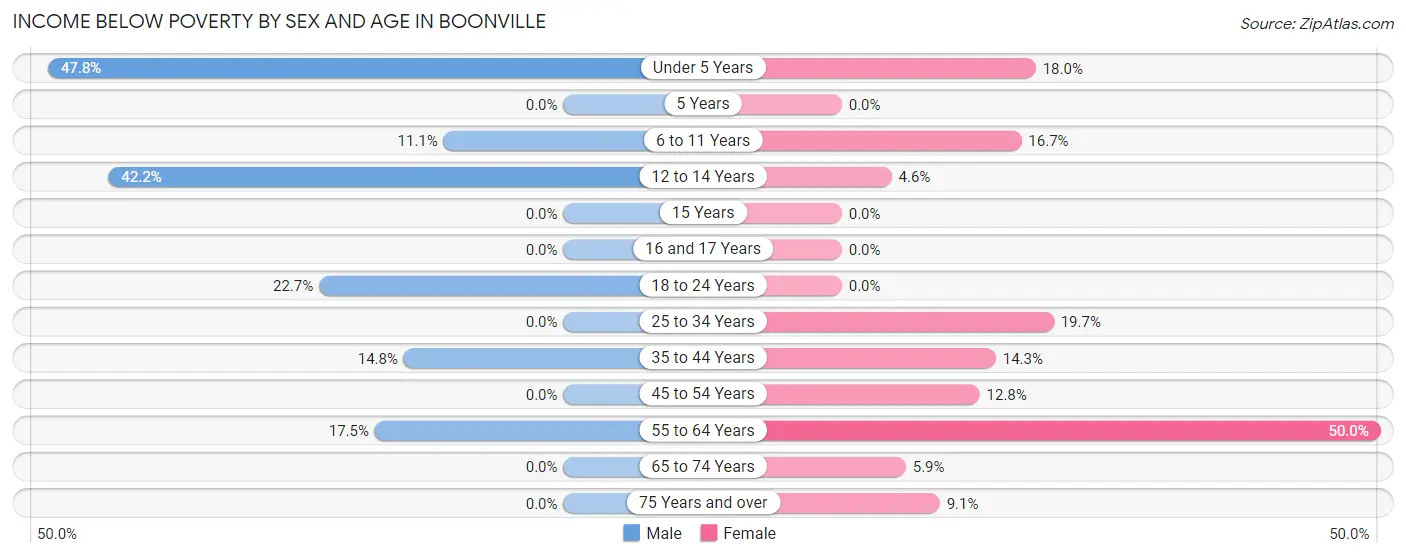
| Age Bracket | Male | Female |
| Under 5 Years | 11 (47.8%) | 9 (18.0%) |
| 5 Years | 0 (0.0%) | 0 (0.0%) |
| 6 to 11 Years | 4 (11.1%) | 13 (16.7%) |
| 12 to 14 Years | 19 (42.2%) | 3 (4.6%) |
| 15 Years | 0 (0.0%) | 0 (0.0%) |
| 16 and 17 Years | 0 (0.0%) | 0 (0.0%) |
| 18 to 24 Years | 17 (22.7%) | 0 (0.0%) |
| 25 to 34 Years | 0 (0.0%) | 24 (19.7%) |
| 35 to 44 Years | 12 (14.8%) | 9 (14.3%) |
| 45 to 54 Years | 0 (0.0%) | 11 (12.8%) |
| 55 to 64 Years | 14 (17.5%) | 27 (50.0%) |
| 65 to 74 Years | 0 (0.0%) | 6 (5.9%) |
| 75 Years and over | 0 (0.0%) | 7 (9.1%) |
| Total | 77 (12.5%) | 109 (14.5%) |
Income Above Poverty by Sex and Age in Boonville
According to the poverty statistics in Boonville, males aged 5 years and females aged 16 and 17 years are the age groups that are most secure financially, with 100.0% of males and 100.0% of females in these age groups living above the poverty line.
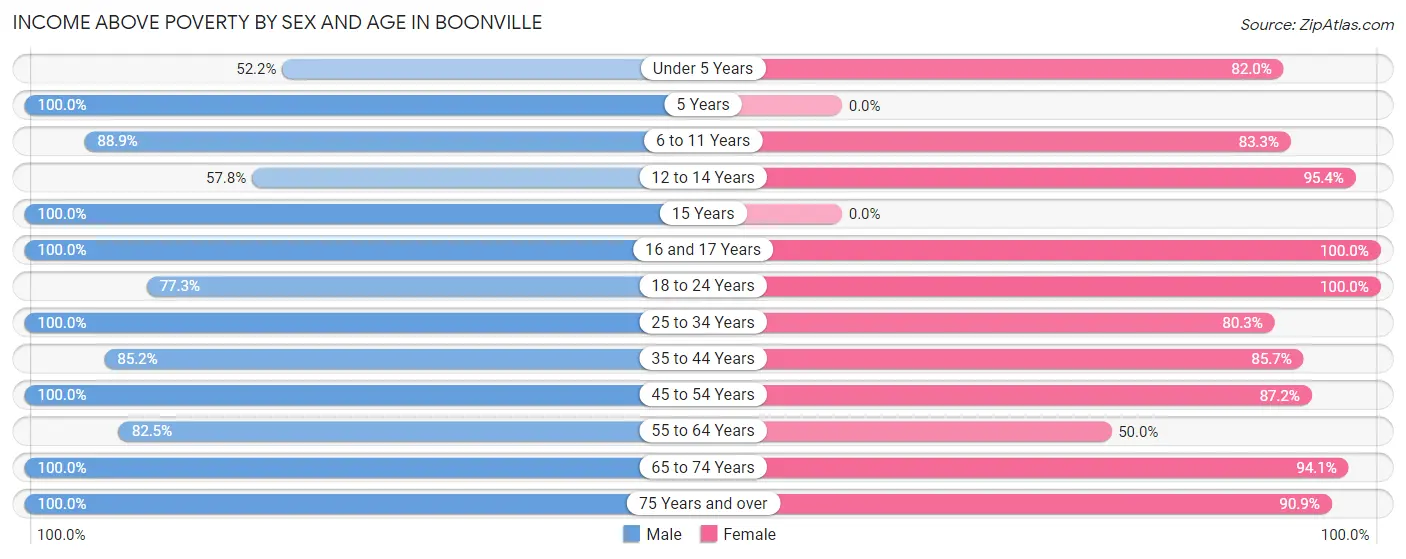
| Age Bracket | Male | Female |
| Under 5 Years | 12 (52.2%) | 41 (82.0%) |
| 5 Years | 12 (100.0%) | 0 (0.0%) |
| 6 to 11 Years | 32 (88.9%) | 65 (83.3%) |
| 12 to 14 Years | 26 (57.8%) | 62 (95.4%) |
| 15 Years | 5 (100.0%) | 0 (0.0%) |
| 16 and 17 Years | 6 (100.0%) | 19 (100.0%) |
| 18 to 24 Years | 58 (77.3%) | 35 (100.0%) |
| 25 to 34 Years | 46 (100.0%) | 98 (80.3%) |
| 35 to 44 Years | 69 (85.2%) | 54 (85.7%) |
| 45 to 54 Years | 52 (100.0%) | 75 (87.2%) |
| 55 to 64 Years | 66 (82.5%) | 27 (50.0%) |
| 65 to 74 Years | 21 (100.0%) | 95 (94.1%) |
| 75 Years and over | 132 (100.0%) | 70 (90.9%) |
| Total | 537 (87.5%) | 641 (85.5%) |
Income Below Poverty Among Married-Couple Families in Boonville
The poverty statistics for married-couple families in Boonville show that 6.6% or 14 of the total 213 families live below the poverty line. Families with 1 or 2 children have the highest poverty rate of 12.2%, comprising of 10 families. On the other hand, families with 3 or 4 children have the lowest poverty rate of 0.0%, which includes 0 families.
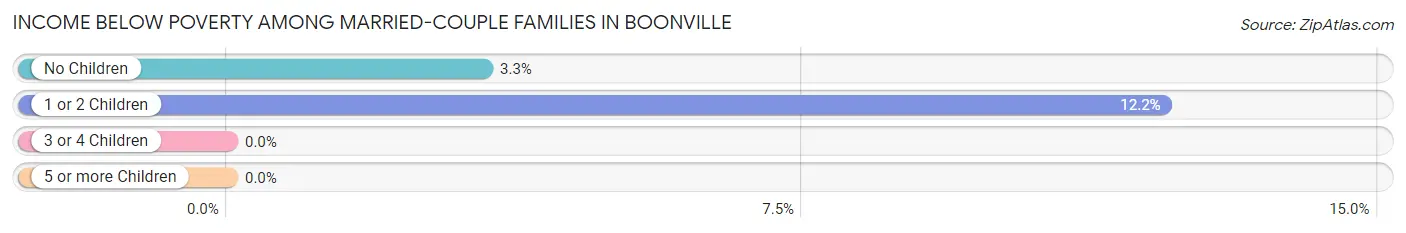
| Children | Above Poverty | Below Poverty |
| No Children | 116 (96.7%) | 4 (3.3%) |
| 1 or 2 Children | 72 (87.8%) | 10 (12.2%) |
| 3 or 4 Children | 11 (100.0%) | 0 (0.0%) |
| 5 or more Children | 0 (0.0%) | 0 (0.0%) |
| Total | 199 (93.4%) | 14 (6.6%) |
Income Below Poverty Among Single-Parent Households in Boonville
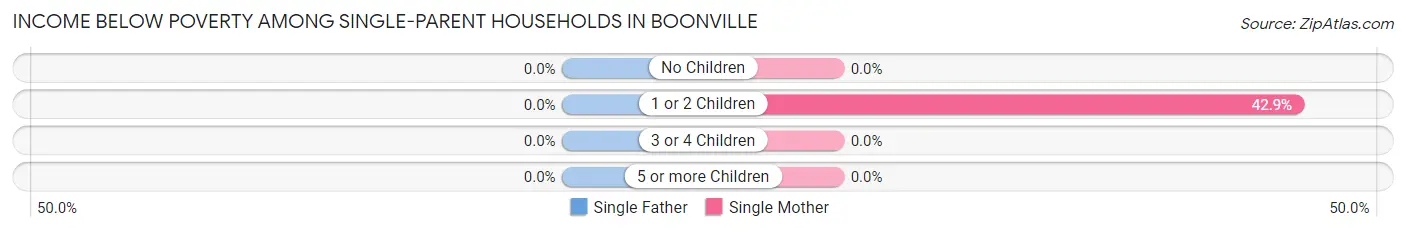
| Children | Single Father | Single Mother |
| No Children | 0 (0.0%) | 0 (0.0%) |
| 1 or 2 Children | 0 (0.0%) | 21 (42.9%) |
| 3 or 4 Children | 0 (0.0%) | 0 (0.0%) |
| 5 or more Children | 0 (0.0%) | 0 (0.0%) |
| Total | 0 (0.0%) | 21 (39.6%) |
Income Below Poverty Among Married-Couple vs Single-Parent Households in Boonville
The poverty data for Boonville shows that 14 of the married-couple family households (6.6%) and 21 of the single-parent households (27.3%) are living below the poverty level. Within the married-couple family households, those with 1 or 2 children have the highest poverty rate, with 10 households (12.2%) falling below the poverty line. Among the single-parent households, those with 1 or 2 children have the highest poverty rate, with 21 household (30.9%) living below poverty.
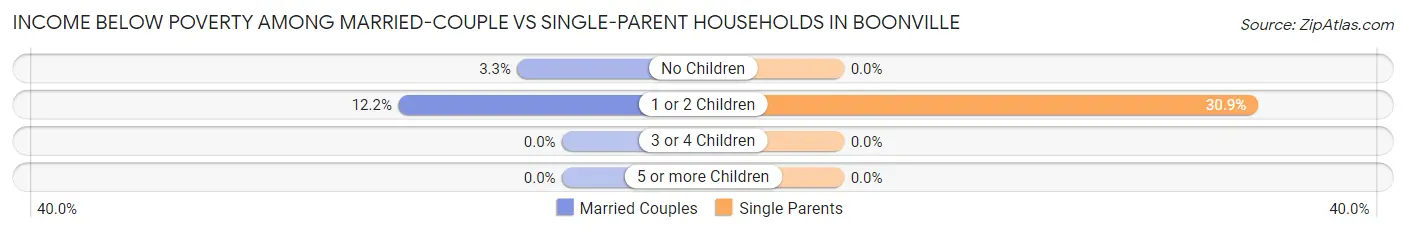
| Children | Married-Couple Families | Single-Parent Households |
| No Children | 4 (3.3%) | 0 (0.0%) |
| 1 or 2 Children | 10 (12.2%) | 21 (30.9%) |
| 3 or 4 Children | 0 (0.0%) | 0 (0.0%) |
| 5 or more Children | 0 (0.0%) | 0 (0.0%) |
| Total | 14 (6.6%) | 21 (27.3%) |
Race in Boonville
The most populous races in Boonville are White / Caucasian (1,262 | 92.5%), Black / African American (45 | 3.3%), and Hispanic or Latino (42 | 3.1%).
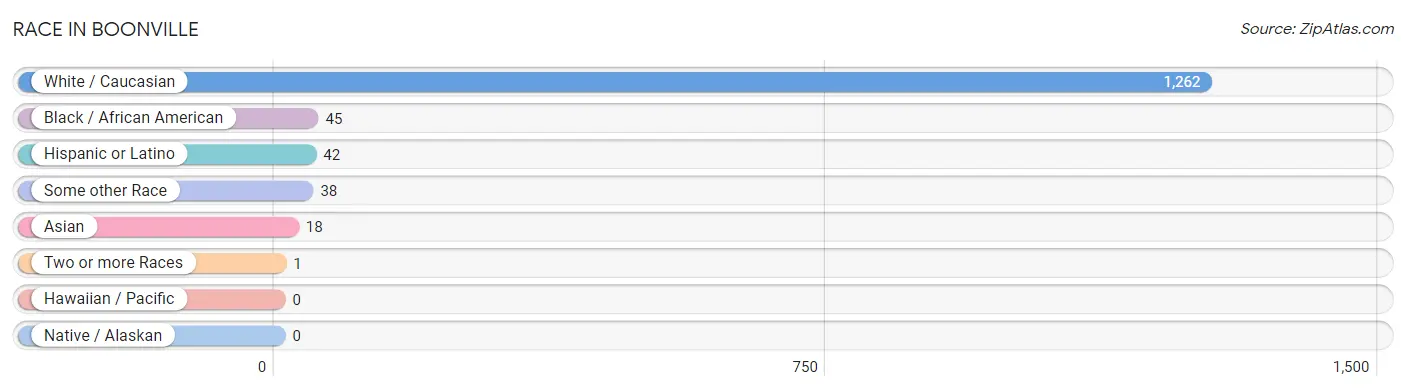
| Race | # Population | % Population |
| Asian | 18 | 1.3% |
| Black / African American | 45 | 3.3% |
| Hawaiian / Pacific | 0 | 0.0% |
| Hispanic or Latino | 42 | 3.1% |
| Native / Alaskan | 0 | 0.0% |
| White / Caucasian | 1,262 | 92.5% |
| Two or more Races | 1 | 0.1% |
| Some other Race | 38 | 2.8% |
| Total | 1,364 | 100.0% |
Ancestry in Boonville
The most populous ancestries reported in Boonville are English (436 | 32.0%), German (245 | 18.0%), American (181 | 13.3%), Irish (135 | 9.9%), and Scotch-Irish (101 | 7.4%), together accounting for 80.5% of all Boonville residents.
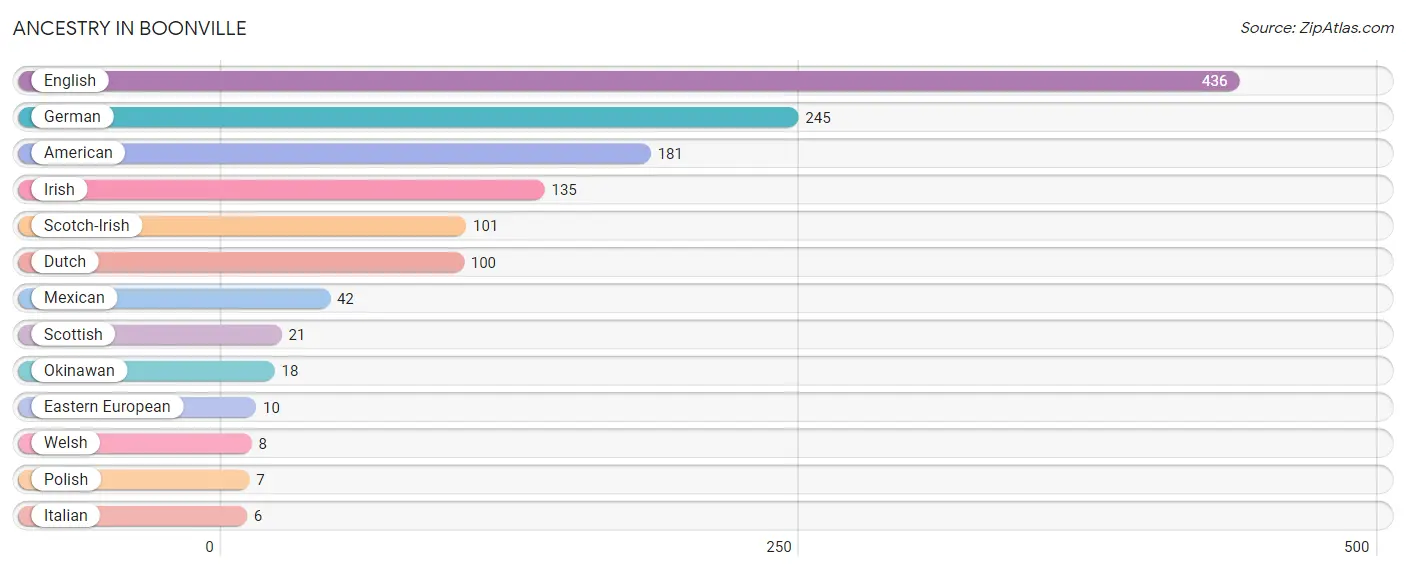
| Ancestry | # Population | % Population |
| American | 181 | 13.3% |
| Dutch | 100 | 7.3% |
| Eastern European | 10 | 0.7% |
| English | 436 | 32.0% |
| German | 245 | 18.0% |
| Irish | 135 | 9.9% |
| Italian | 6 | 0.4% |
| Mexican | 42 | 3.1% |
| Okinawan | 18 | 1.3% |
| Polish | 7 | 0.5% |
| Scotch-Irish | 101 | 7.4% |
| Scottish | 21 | 1.5% |
| Welsh | 8 | 0.6% | View All 13 Rows |
Immigrants in Boonville
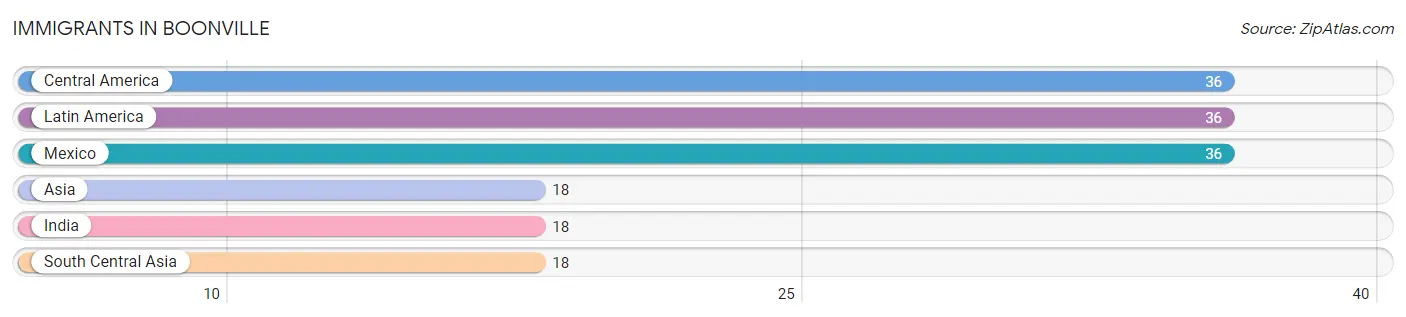
The most numerous immigrant groups reported in Boonville came from Central America (36 | 2.6%), Latin America (36 | 2.6%), Mexico (36 | 2.6%), Asia (18 | 1.3%), and India (18 | 1.3%), together accounting for 10.6% of all Boonville residents.
| Immigration Origin | # Population | % Population |
| Asia | 18 | 1.3% |
| Central America | 36 | 2.6% |
| India | 18 | 1.3% |
| Latin America | 36 | 2.6% |
| Mexico | 36 | 2.6% |
| South Central Asia | 18 | 1.3% | View All 6 Rows |
Sex and Age in Boonville
Sex and Age in Boonville
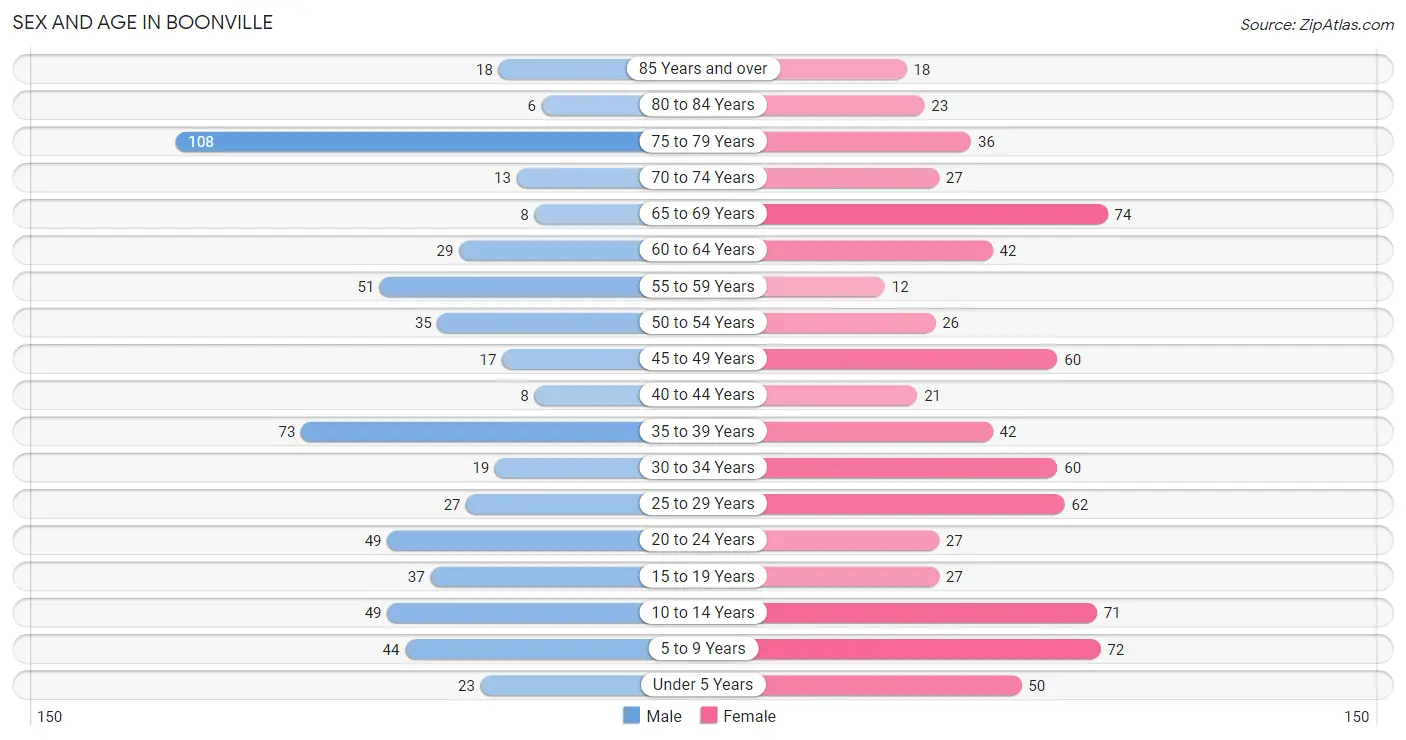
The most populous age groups in Boonville are 75 to 79 Years (108 | 17.6%) for men and 65 to 69 Years (74 | 9.9%) for women.
| Age Bracket | Male | Female |
| Under 5 Years | 23 (3.7%) | 50 (6.7%) |
| 5 to 9 Years | 44 (7.2%) | 72 (9.6%) |
| 10 to 14 Years | 49 (8.0%) | 71 (9.5%) |
| 15 to 19 Years | 37 (6.0%) | 27 (3.6%) |
| 20 to 24 Years | 49 (8.0%) | 27 (3.6%) |
| 25 to 29 Years | 27 (4.4%) | 62 (8.3%) |
| 30 to 34 Years | 19 (3.1%) | 60 (8.0%) |
| 35 to 39 Years | 73 (11.9%) | 42 (5.6%) |
| 40 to 44 Years | 8 (1.3%) | 21 (2.8%) |
| 45 to 49 Years | 17 (2.8%) | 60 (8.0%) |
| 50 to 54 Years | 35 (5.7%) | 26 (3.5%) |
| 55 to 59 Years | 51 (8.3%) | 12 (1.6%) |
| 60 to 64 Years | 29 (4.7%) | 42 (5.6%) |
| 65 to 69 Years | 8 (1.3%) | 74 (9.9%) |
| 70 to 74 Years | 13 (2.1%) | 27 (3.6%) |
| 75 to 79 Years | 108 (17.6%) | 36 (4.8%) |
| 80 to 84 Years | 6 (1.0%) | 23 (3.1%) |
| 85 Years and over | 18 (2.9%) | 18 (2.4%) |
| Total | 614 (100.0%) | 750 (100.0%) |
Families and Households in Boonville
Median Family Size in Boonville
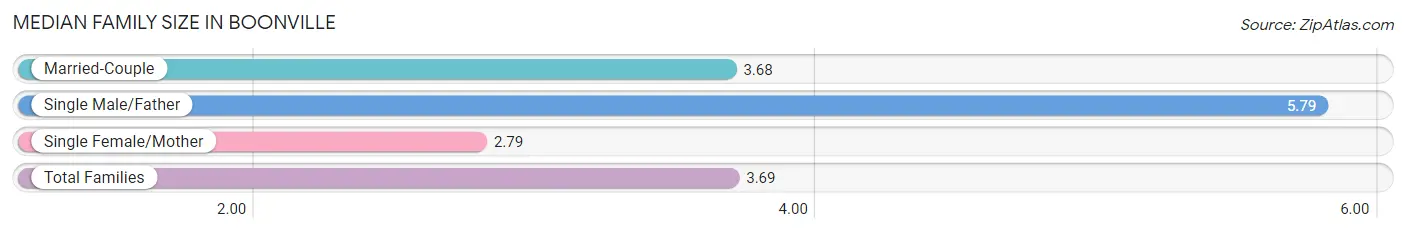
The median family size in Boonville is 3.69 persons per family, with single male/father families (24 | 8.3%) accounting for the largest median family size of 5.79 persons per family. On the other hand, single female/mother families (53 | 18.3%) represent the smallest median family size with 2.79 persons per family.
| Family Type | # Families | Family Size |
| Married-Couple | 213 (73.5%) | 3.68 |
| Single Male/Father | 24 (8.3%) | 5.79 |
| Single Female/Mother | 53 (18.3%) | 2.79 |
| Total Families | 290 (100.0%) | 3.69 |
Median Household Size in Boonville
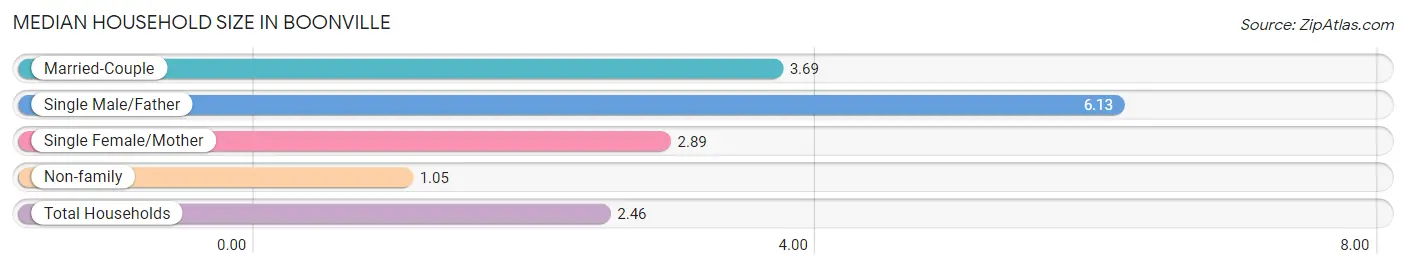
The median household size in Boonville is 2.46 persons per household, with single male/father households (24 | 4.3%) accounting for the largest median household size of 6.13 persons per household. non-family households (265 | 47.7%) represent the smallest median household size with 1.05 persons per household.
| Household Type | # Households | Household Size |
| Married-Couple | 213 (38.4%) | 3.69 |
| Single Male/Father | 24 (4.3%) | 6.13 |
| Single Female/Mother | 53 (9.6%) | 2.89 |
| Non-family | 265 (47.7%) | 1.05 |
| Total Households | 555 (100.0%) | 2.46 |
Household Size by Marriage Status in Boonville
Out of a total of 555 households in Boonville, 290 (52.2%) are family households, while 265 (47.7%) are nonfamily households. The most numerous type of family households are 2-person households, comprising 131, and the most common type of nonfamily households are 1-person households, comprising 256.
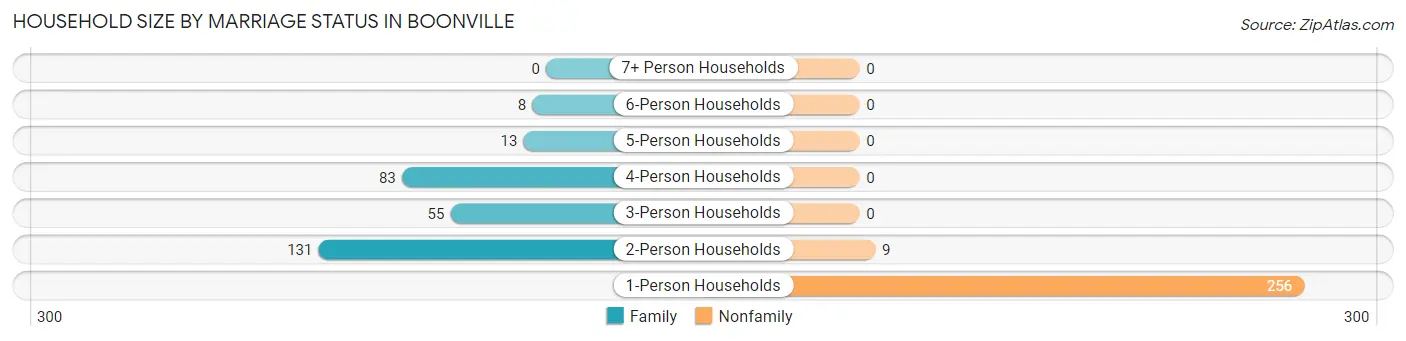
| Household Size | Family Households | Nonfamily Households |
| 1-Person Households | - | 256 (46.1%) |
| 2-Person Households | 131 (23.6%) | 9 (1.6%) |
| 3-Person Households | 55 (9.9%) | 0 (0.0%) |
| 4-Person Households | 83 (14.9%) | 0 (0.0%) |
| 5-Person Households | 13 (2.3%) | 0 (0.0%) |
| 6-Person Households | 8 (1.4%) | 0 (0.0%) |
| 7+ Person Households | 0 (0.0%) | 0 (0.0%) |
| Total | 290 (52.2%) | 265 (47.7%) |
Female Fertility in Boonville
Fertility by Age in Boonville
Average fertility rate in Boonville is 40.0 births per 1,000 women. Women in the age bracket of 20 to 34 years have the highest fertility rate with 81.0 births per 1,000 women. Women in the age bracket of 20 to 34 years acount for 100.0% of all women with births.
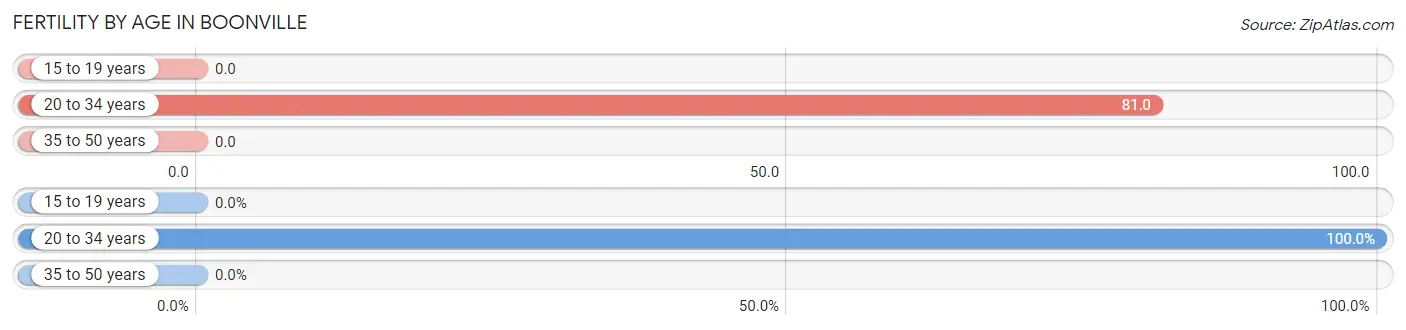
| Age Bracket | Women with Births | Births / 1,000 Women |
| 15 to 19 years | 0 (0.0%) | 0.0 |
| 20 to 34 years | 12 (100.0%) | 81.0 |
| 35 to 50 years | 0 (0.0%) | 0.0 |
| Total | 12 (100.0%) | 40.0 |
Fertility by Age by Marriage Status in Boonville
8.3% of women with births (12) in Boonville are married. The highest percentage of unmarried women with births falls into 20 to 34 years age bracket with 91.7% of them unmarried at the time of birth, while the lowest percentage of unmarried women with births belong to 20 to 34 years age bracket with 91.7% of them unmarried.
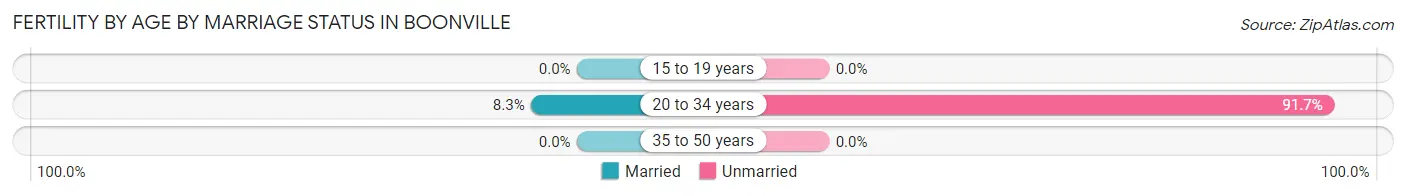
| Age Bracket | Married | Unmarried |
| 15 to 19 years | 0 (0.0%) | 0 (0.0%) |
| 20 to 34 years | 1 (8.3%) | 11 (91.7%) |
| 35 to 50 years | 0 (0.0%) | 0 (0.0%) |
| Total | 1 (8.3%) | 11 (91.7%) |
Fertility by Education in Boonville
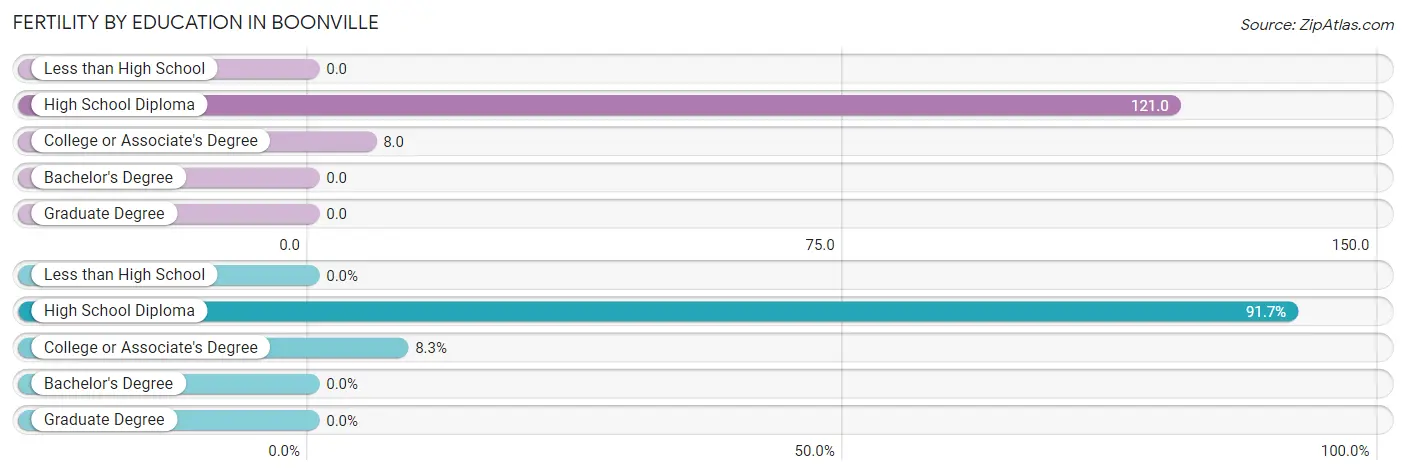
| Educational Attainment | Women with Births | Births / 1,000 Women |
| Less than High School | 0 (0.0%) | 0.0 |
| High School Diploma | 11 (91.7%) | 121.0 |
| College or Associate's Degree | 1 (8.3%) | 8.0 |
| Bachelor's Degree | 0 (0.0%) | 0.0 |
| Graduate Degree | 0 (0.0%) | 0.0 |
| Total | 12 (100.0%) | 40.0 |
Fertility by Education by Marriage Status in Boonville
91.7% of women with births in Boonville are unmarried. Women with the educational attainment of college or associate's degree are most likely to be married with 100.0% of them married at childbirth, while women with the educational attainment of high school diploma are least likely to be married with 100.0% of them unmarried at childbirth.
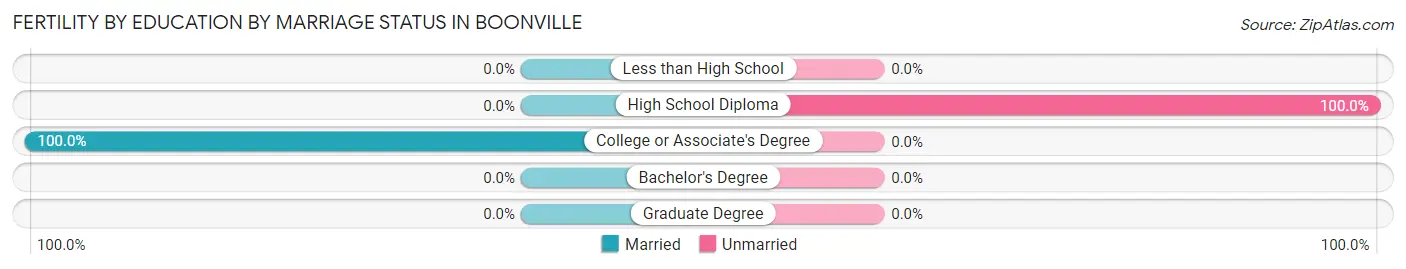
| Educational Attainment | Married | Unmarried |
| Less than High School | 0 (0.0%) | 0 (0.0%) |
| High School Diploma | 0 (0.0%) | 11 (100.0%) |
| College or Associate's Degree | 1 (100.0%) | 0 (0.0%) |
| Bachelor's Degree | 0 (0.0%) | 0 (0.0%) |
| Graduate Degree | 0 (0.0%) | 0 (0.0%) |
| Total | 1 (8.3%) | 11 (91.7%) |
Employment Characteristics in Boonville
Employment by Class of Employer in Boonville
Among the 529 employed individuals in Boonville, private company employees (340 | 64.3%), local government employees (76 | 14.4%), and not-for-profit organizations (55 | 10.4%) make up the most common classes of employment.

| Employer Class | # Employees | % Employees |
| Private Company Employees | 340 | 64.3% |
| Self-Employed (Incorporated) | 0 | 0.0% |
| Self-Employed (Not Incorporated) | 36 | 6.8% |
| Not-for-profit Organizations | 55 | 10.4% |
| Local Government Employees | 76 | 14.4% |
| State Government Employees | 22 | 4.2% |
| Federal Government Employees | 0 | 0.0% |
| Unpaid Family Workers | 0 | 0.0% |
| Total | 529 | 100.0% |
Employment Status by Age in Boonville
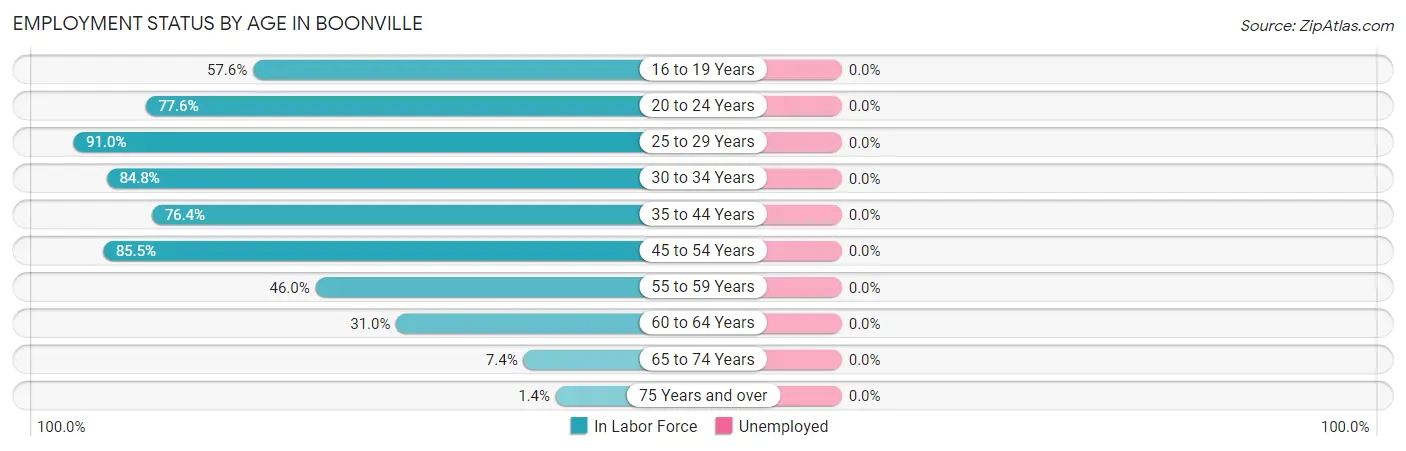
| Age Bracket | In Labor Force | Unemployed |
| 16 to 19 Years | 34 (57.6%) | 0 (0.0%) |
| 20 to 24 Years | 59 (77.6%) | 0 (0.0%) |
| 25 to 29 Years | 81 (91.0%) | 0 (0.0%) |
| 30 to 34 Years | 67 (84.8%) | 0 (0.0%) |
| 35 to 44 Years | 110 (76.4%) | 0 (0.0%) |
| 45 to 54 Years | 118 (85.5%) | 0 (0.0%) |
| 55 to 59 Years | 29 (46.0%) | 0 (0.0%) |
| 60 to 64 Years | 22 (31.0%) | 0 (0.0%) |
| 65 to 74 Years | 9 (7.4%) | 0 (0.0%) |
| 75 Years and over | 3 (1.4%) | 0 (0.0%) |
| Total | 532 (50.7%) | 0 (0.0%) |
Employment Status by Educational Attainment in Boonville
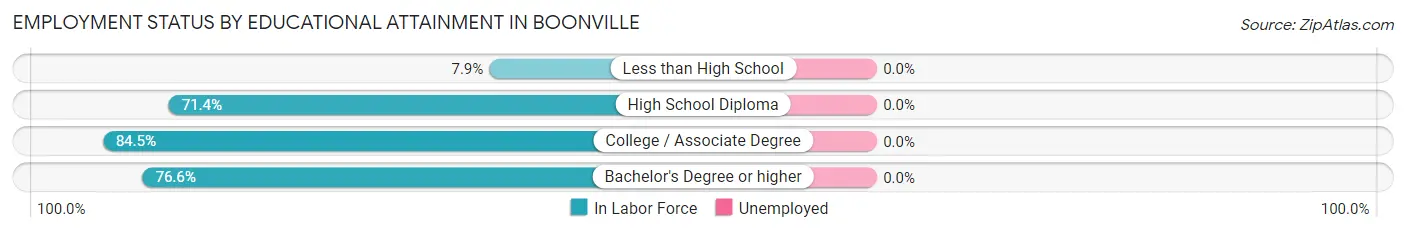
| Educational Attainment | In Labor Force | Unemployed |
| Less than High School | 3 (7.9%) | 0 (0.0%) |
| High School Diploma | 145 (71.4%) | 0 (0.0%) |
| College / Associate Degree | 174 (84.5%) | 0 (0.0%) |
| Bachelor's Degree or higher | 105 (76.6%) | 0 (0.0%) |
| Total | 427 (73.1%) | 0 (0.0%) |
Employment Occupations by Sex in Boonville
Management, Business, Science and Arts Occupations
The most common Management, Business, Science and Arts occupations in Boonville are Community & Social Service (74 | 13.9%), Health Diagnosing & Treating (49 | 9.2%), Management (35 | 6.6%), Computers, Engineering & Science (35 | 6.6%), and Education Instruction & Library (31 | 5.8%).
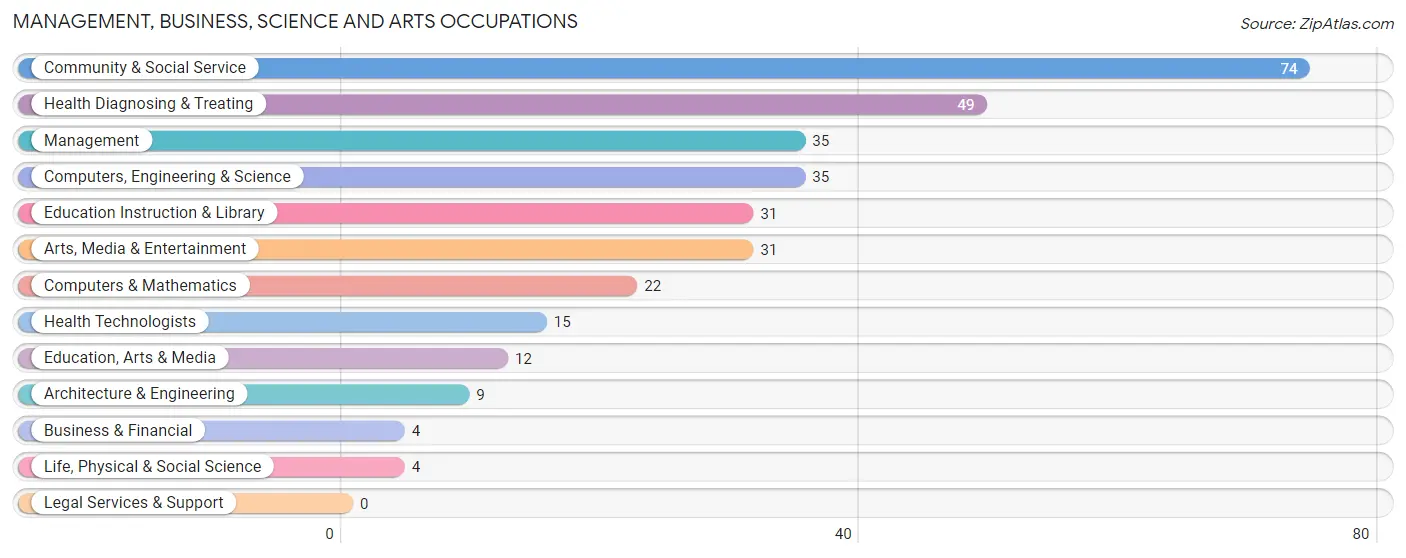
Management, Business, Science and Arts Occupations by Sex
Within the Management, Business, Science and Arts occupations in Boonville, the most male-oriented occupations are Computers, Engineering & Science (100.0%), Computers & Mathematics (100.0%), and Architecture & Engineering (100.0%), while the most female-oriented occupations are Business & Financial (100.0%), Education Instruction & Library (100.0%), and Community & Social Service (81.1%).
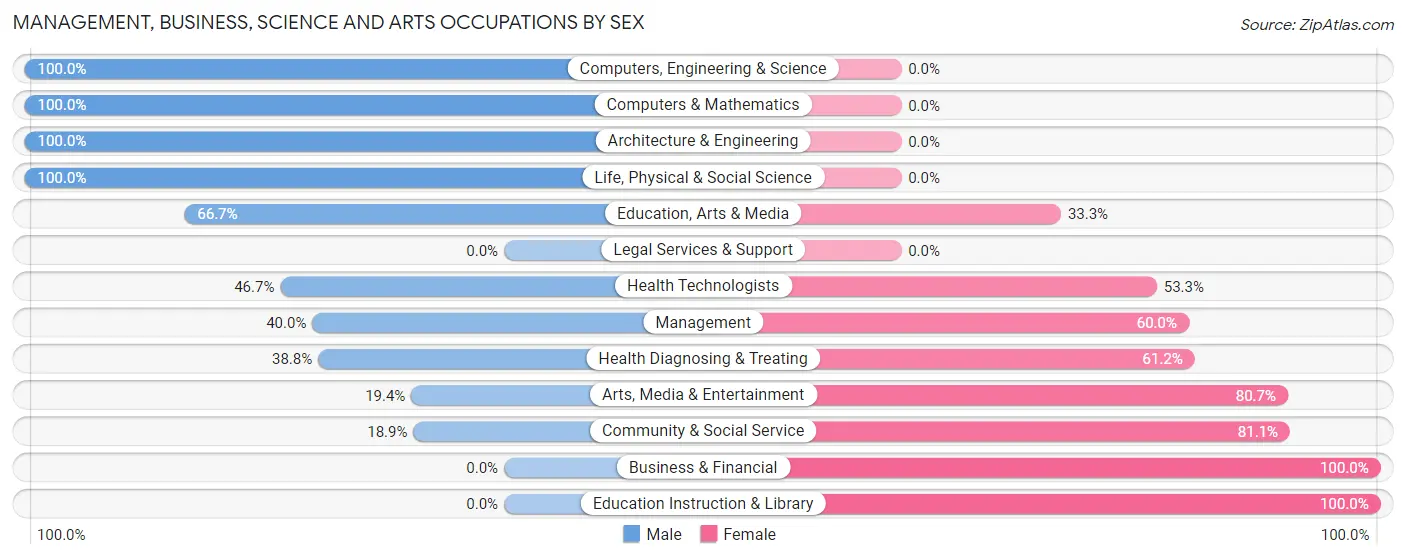
| Occupation | Male | Female |
| Management | 14 (40.0%) | 21 (60.0%) |
| Business & Financial | 0 (0.0%) | 4 (100.0%) |
| Computers, Engineering & Science | 35 (100.0%) | 0 (0.0%) |
| Computers & Mathematics | 22 (100.0%) | 0 (0.0%) |
| Architecture & Engineering | 9 (100.0%) | 0 (0.0%) |
| Life, Physical & Social Science | 4 (100.0%) | 0 (0.0%) |
| Community & Social Service | 14 (18.9%) | 60 (81.1%) |
| Education, Arts & Media | 8 (66.7%) | 4 (33.3%) |
| Legal Services & Support | 0 (0.0%) | 0 (0.0%) |
| Education Instruction & Library | 0 (0.0%) | 31 (100.0%) |
| Arts, Media & Entertainment | 6 (19.4%) | 25 (80.6%) |
| Health Diagnosing & Treating | 19 (38.8%) | 30 (61.2%) |
| Health Technologists | 7 (46.7%) | 8 (53.3%) |
| Total (Category) | 82 (41.6%) | 115 (58.4%) |
| Total (Overall) | 263 (49.4%) | 269 (50.6%) |
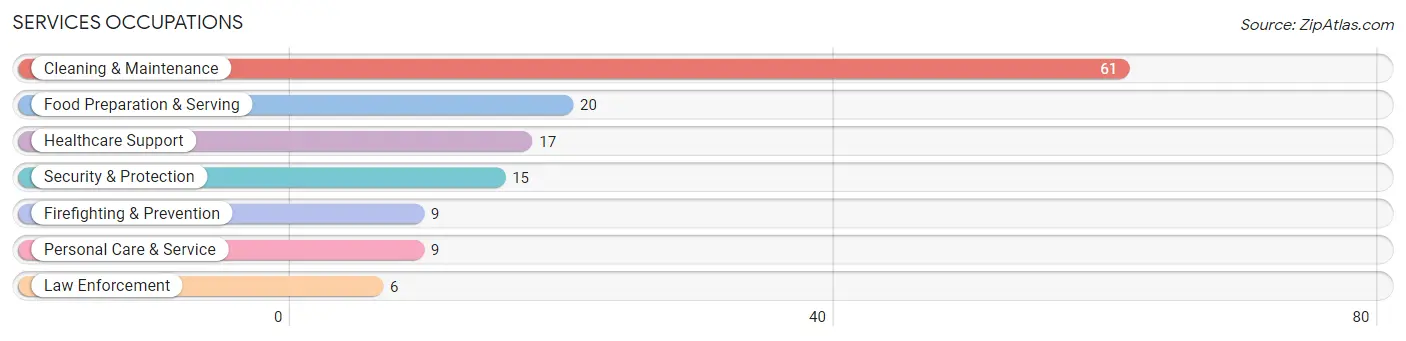
Services Occupations
The most common Services occupations in Boonville are Cleaning & Maintenance (61 | 11.5%), Food Preparation & Serving (20 | 3.8%), Healthcare Support (17 | 3.2%), Security & Protection (15 | 2.8%), and Firefighting & Prevention (9 | 1.7%).
Services Occupations by Sex
Within the Services occupations in Boonville, the most male-oriented occupations are Security & Protection (100.0%), Firefighting & Prevention (100.0%), and Law Enforcement (100.0%), while the most female-oriented occupations are Healthcare Support (100.0%), Personal Care & Service (100.0%), and Cleaning & Maintenance (59.0%).
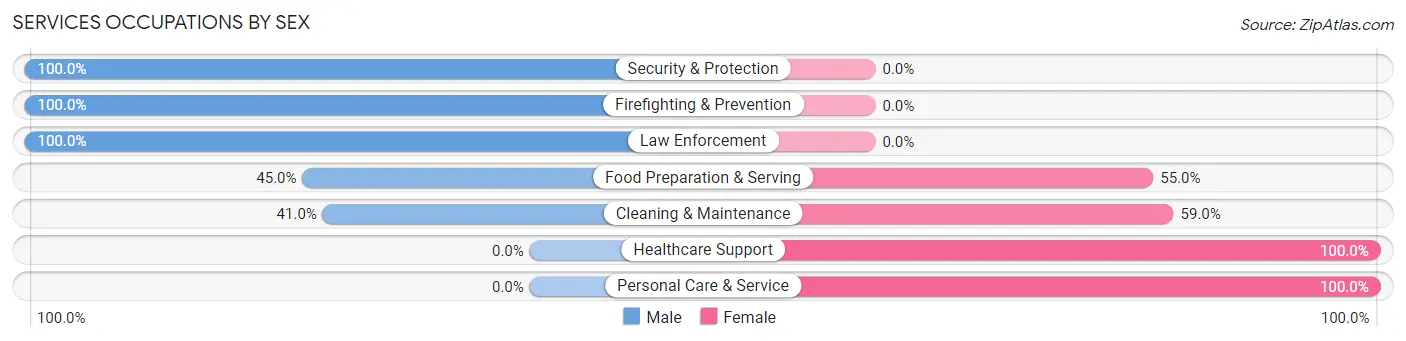
| Occupation | Male | Female |
| Healthcare Support | 0 (0.0%) | 17 (100.0%) |
| Security & Protection | 15 (100.0%) | 0 (0.0%) |
| Firefighting & Prevention | 9 (100.0%) | 0 (0.0%) |
| Law Enforcement | 6 (100.0%) | 0 (0.0%) |
| Food Preparation & Serving | 9 (45.0%) | 11 (55.0%) |
| Cleaning & Maintenance | 25 (41.0%) | 36 (59.0%) |
| Personal Care & Service | 0 (0.0%) | 9 (100.0%) |
| Total (Category) | 49 (40.2%) | 73 (59.8%) |
| Total (Overall) | 263 (49.4%) | 269 (50.6%) |
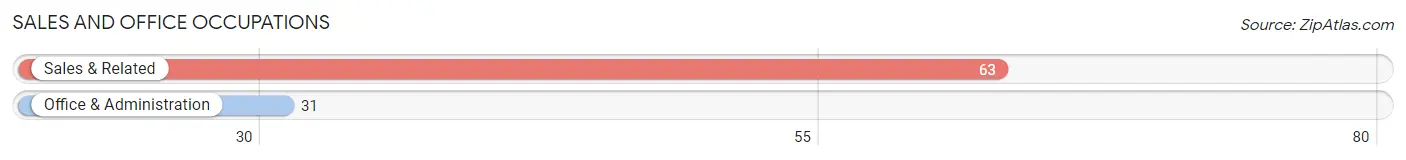
Sales and Office Occupations
The most common Sales and Office occupations in Boonville are Sales & Related (63 | 11.8%), and Office & Administration (31 | 5.8%).
Sales and Office Occupations by Sex
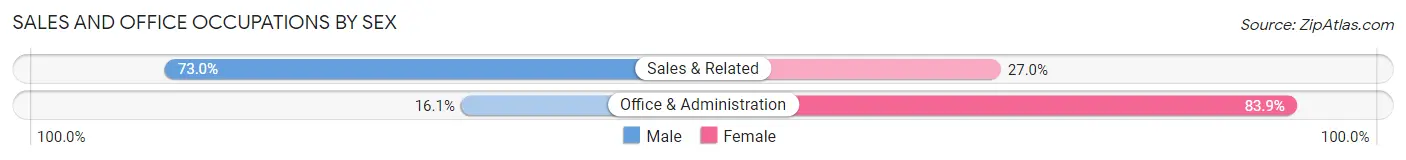
| Occupation | Male | Female |
| Sales & Related | 46 (73.0%) | 17 (27.0%) |
| Office & Administration | 5 (16.1%) | 26 (83.9%) |
| Total (Category) | 51 (54.3%) | 43 (45.7%) |
| Total (Overall) | 263 (49.4%) | 269 (50.6%) |
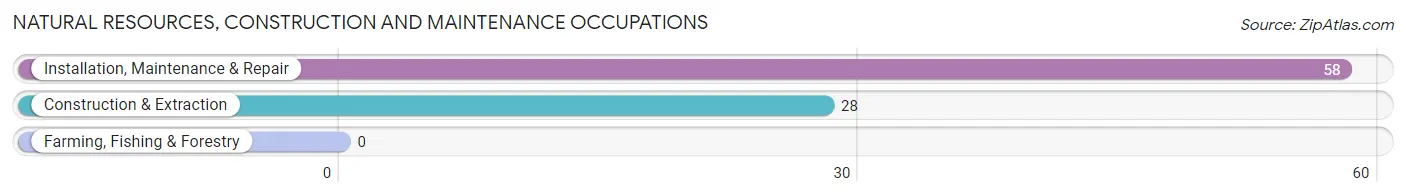
Natural Resources, Construction and Maintenance Occupations
The most common Natural Resources, Construction and Maintenance occupations in Boonville are Installation, Maintenance & Repair (58 | 10.9%), and Construction & Extraction (28 | 5.3%).
Natural Resources, Construction and Maintenance Occupations by Sex
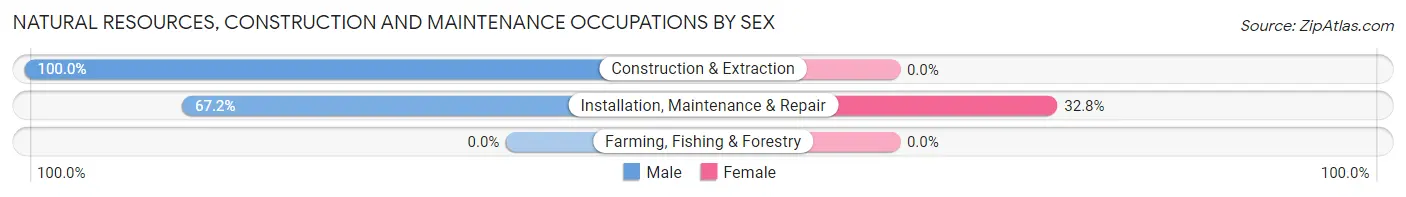
| Occupation | Male | Female |
| Farming, Fishing & Forestry | 0 (0.0%) | 0 (0.0%) |
| Construction & Extraction | 28 (100.0%) | 0 (0.0%) |
| Installation, Maintenance & Repair | 39 (67.2%) | 19 (32.8%) |
| Total (Category) | 67 (77.9%) | 19 (22.1%) |
| Total (Overall) | 263 (49.4%) | 269 (50.6%) |
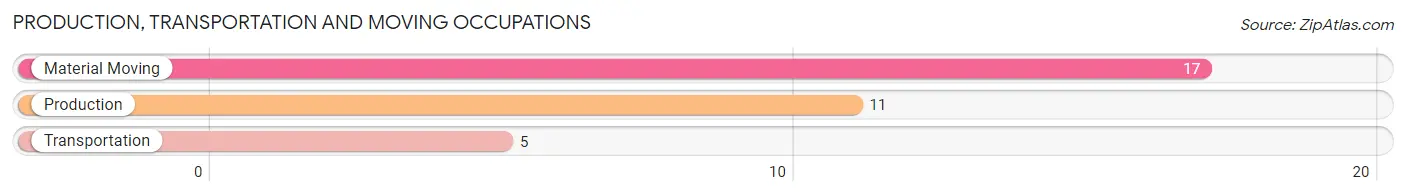
Production, Transportation and Moving Occupations
The most common Production, Transportation and Moving occupations in Boonville are Material Moving (17 | 3.2%), Production (11 | 2.1%), and Transportation (5 | 0.9%).
Production, Transportation and Moving Occupations by Sex
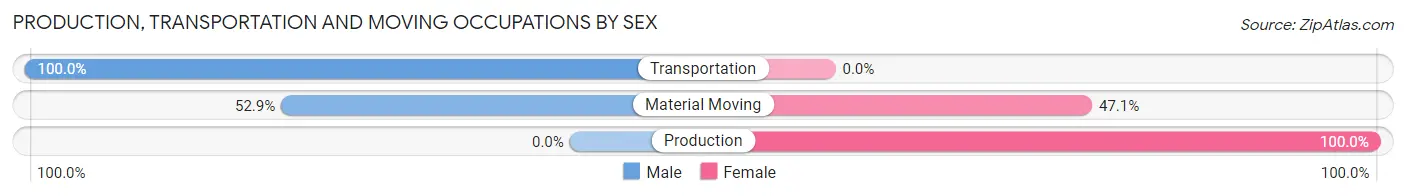
| Occupation | Male | Female |
| Production | 0 (0.0%) | 11 (100.0%) |
| Transportation | 5 (100.0%) | 0 (0.0%) |
| Material Moving | 9 (52.9%) | 8 (47.1%) |
| Total (Category) | 14 (42.4%) | 19 (57.6%) |
| Total (Overall) | 263 (49.4%) | 269 (50.6%) |
Employment Industries by Sex in Boonville
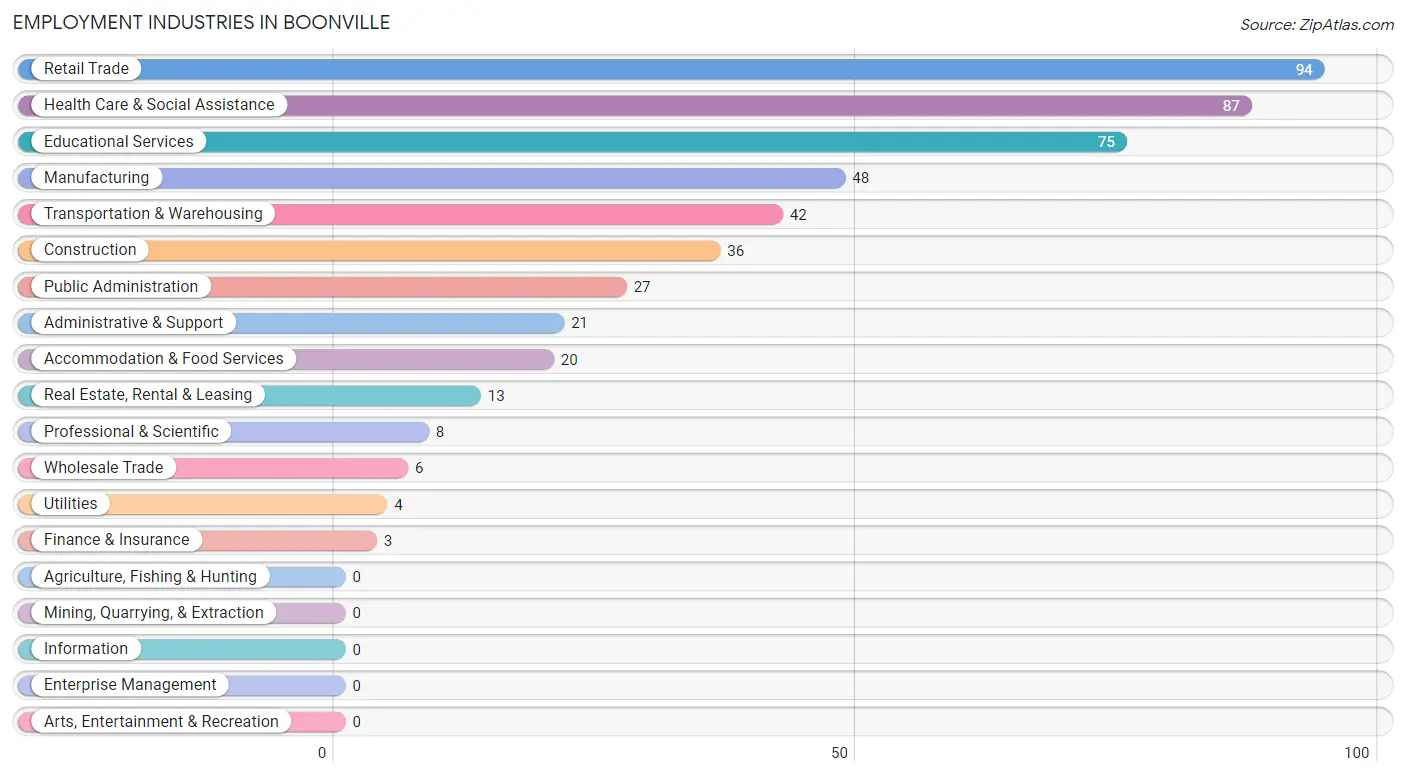
Employment Industries in Boonville
The major employment industries in Boonville include Retail Trade (94 | 17.7%), Health Care & Social Assistance (87 | 16.4%), Educational Services (75 | 14.1%), Manufacturing (48 | 9.0%), and Transportation & Warehousing (42 | 7.9%).
Employment Industries by Sex in Boonville
The Boonville industries that see more men than women are Construction (100.0%), Wholesale Trade (100.0%), and Utilities (100.0%), whereas the industries that tend to have a higher number of women are Educational Services (84.0%), Health Care & Social Assistance (83.9%), and Professional & Scientific (75.0%).
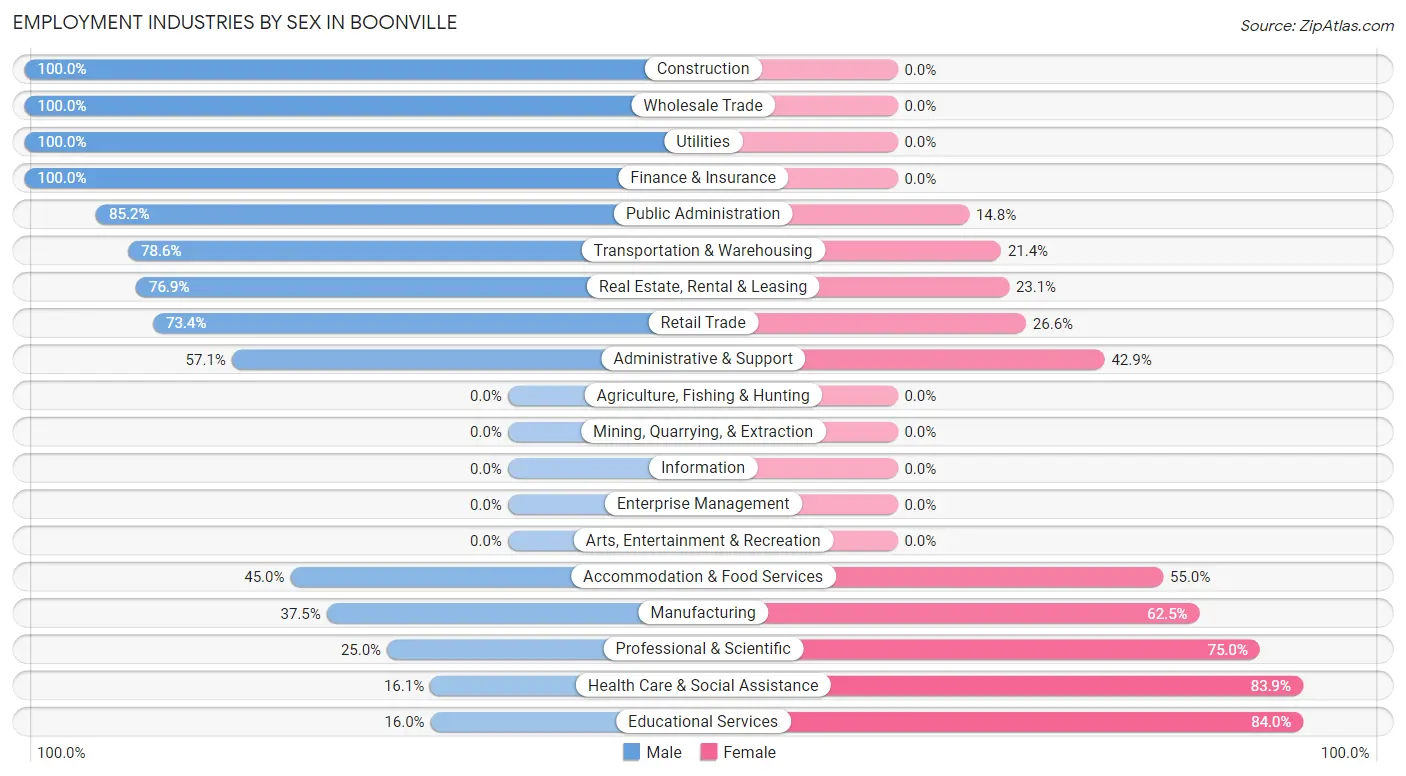
| Industry | Male | Female |
| Agriculture, Fishing & Hunting | 0 (0.0%) | 0 (0.0%) |
| Mining, Quarrying, & Extraction | 0 (0.0%) | 0 (0.0%) |
| Construction | 36 (100.0%) | 0 (0.0%) |
| Manufacturing | 18 (37.5%) | 30 (62.5%) |
| Wholesale Trade | 6 (100.0%) | 0 (0.0%) |
| Retail Trade | 69 (73.4%) | 25 (26.6%) |
| Transportation & Warehousing | 33 (78.6%) | 9 (21.4%) |
| Utilities | 4 (100.0%) | 0 (0.0%) |
| Information | 0 (0.0%) | 0 (0.0%) |
| Finance & Insurance | 3 (100.0%) | 0 (0.0%) |
| Real Estate, Rental & Leasing | 10 (76.9%) | 3 (23.1%) |
| Professional & Scientific | 2 (25.0%) | 6 (75.0%) |
| Enterprise Management | 0 (0.0%) | 0 (0.0%) |
| Administrative & Support | 12 (57.1%) | 9 (42.9%) |
| Educational Services | 12 (16.0%) | 63 (84.0%) |
| Health Care & Social Assistance | 14 (16.1%) | 73 (83.9%) |
| Arts, Entertainment & Recreation | 0 (0.0%) | 0 (0.0%) |
| Accommodation & Food Services | 9 (45.0%) | 11 (55.0%) |
| Public Administration | 23 (85.2%) | 4 (14.8%) |
| Total | 263 (49.4%) | 269 (50.6%) |
Education in Boonville
School Enrollment in Boonville
The most common levels of schooling among the 318 students in Boonville are elementary school (104 | 32.7%), high school (74 | 23.3%), and middle school (68 | 21.4%).
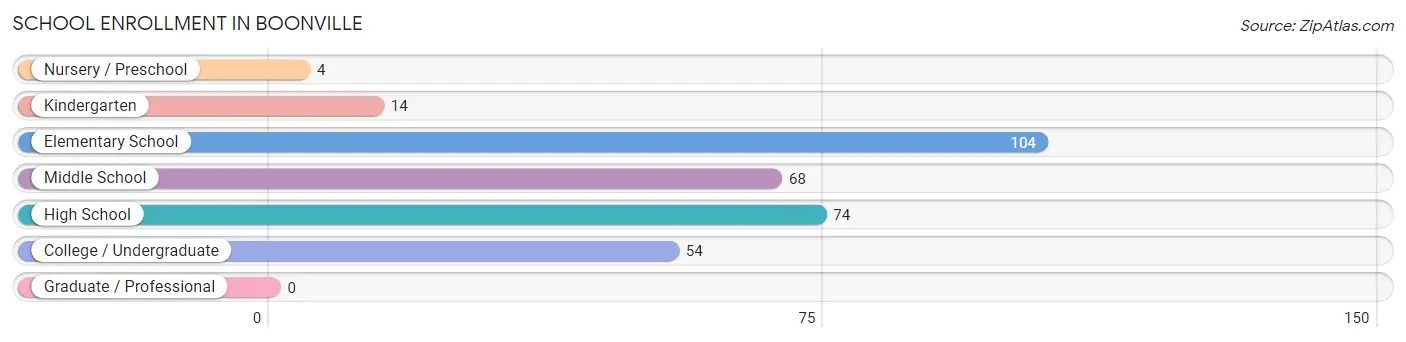
| School Level | # Students | % Students |
| Nursery / Preschool | 4 | 1.3% |
| Kindergarten | 14 | 4.4% |
| Elementary School | 104 | 32.7% |
| Middle School | 68 | 21.4% |
| High School | 74 | 23.3% |
| College / Undergraduate | 54 | 17.0% |
| Graduate / Professional | 0 | 0.0% |
| Total | 318 | 100.0% |
School Enrollment by Age by Funding Source in Boonville
Out of a total of 318 students who are enrolled in schools in Boonville, 7 (2.2%) attend a private institution, while the remaining 311 (97.8%) are enrolled in public schools. The age group of 5 to 9 year old has the highest likelihood of being enrolled in private schools, with 4 (3.6% in the age bracket) enrolled. Conversely, the age group of 3 to 4 year olds has the lowest likelihood of being enrolled in a private school, with 6 (100.0% in the age bracket) attending a public institution.
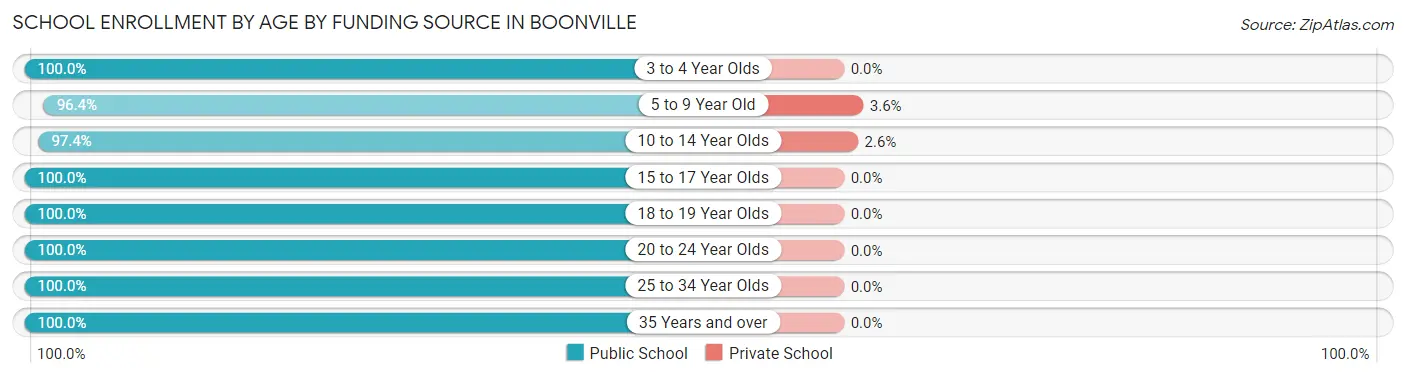
| Age Bracket | Public School | Private School |
| 3 to 4 Year Olds | 6 (100.0%) | 0 (0.0%) |
| 5 to 9 Year Old | 108 (96.4%) | 4 (3.6%) |
| 10 to 14 Year Olds | 113 (97.4%) | 3 (2.6%) |
| 15 to 17 Year Olds | 30 (100.0%) | 0 (0.0%) |
| 18 to 19 Year Olds | 34 (100.0%) | 0 (0.0%) |
| 20 to 24 Year Olds | 6 (100.0%) | 0 (0.0%) |
| 25 to 34 Year Olds | 10 (100.0%) | 0 (0.0%) |
| 35 Years and over | 4 (100.0%) | 0 (0.0%) |
| Total | 311 (97.8%) | 7 (2.2%) |
Educational Attainment by Field of Study in Boonville
Business (45 | 25.7%), education (33 | 18.9%), arts & humanities (32 | 18.3%), science & technology (18 | 10.3%), and engineering (13 | 7.4%) are the most common fields of study among 175 individuals in Boonville who have obtained a bachelor's degree or higher.
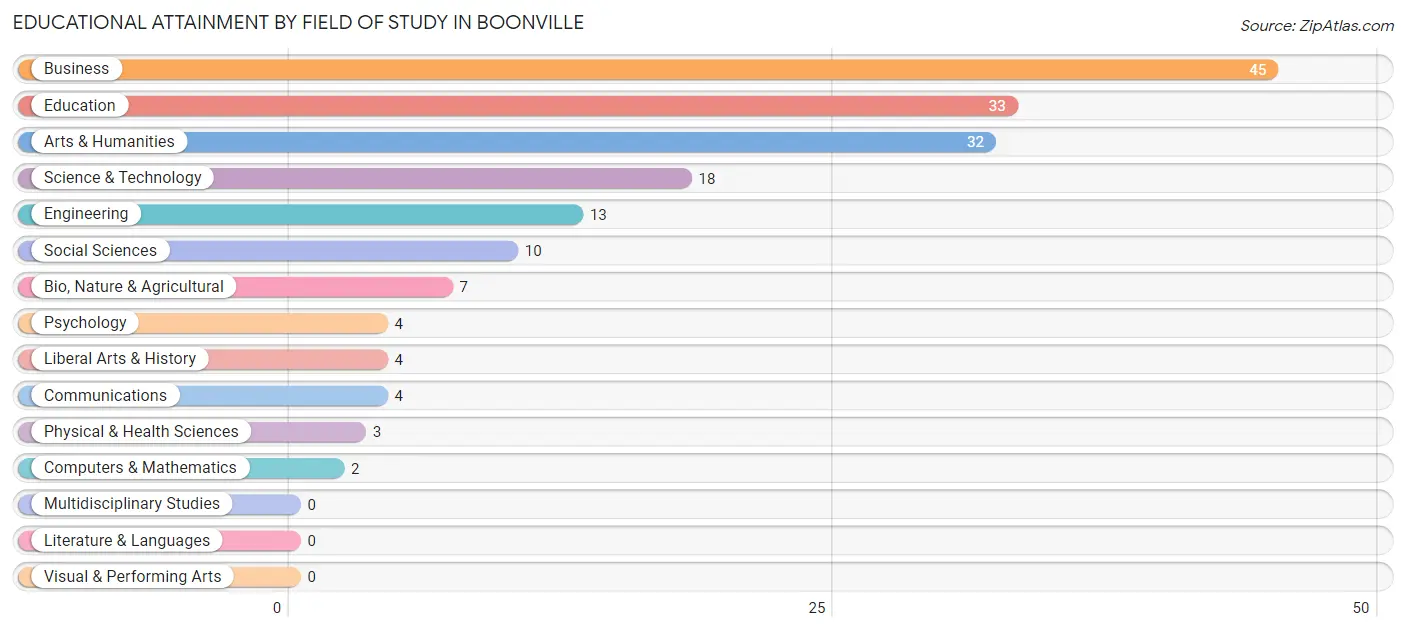
| Field of Study | # Graduates | % Graduates |
| Computers & Mathematics | 2 | 1.1% |
| Bio, Nature & Agricultural | 7 | 4.0% |
| Physical & Health Sciences | 3 | 1.7% |
| Psychology | 4 | 2.3% |
| Social Sciences | 10 | 5.7% |
| Engineering | 13 | 7.4% |
| Multidisciplinary Studies | 0 | 0.0% |
| Science & Technology | 18 | 10.3% |
| Business | 45 | 25.7% |
| Education | 33 | 18.9% |
| Literature & Languages | 0 | 0.0% |
| Liberal Arts & History | 4 | 2.3% |
| Visual & Performing Arts | 0 | 0.0% |
| Communications | 4 | 2.3% |
| Arts & Humanities | 32 | 18.3% |
| Total | 175 | 100.0% |
Transportation & Commute in Boonville
Vehicle Availability by Sex in Boonville
The most prevalent vehicle ownership categories in Boonville are males with 2 vehicles (99, accounting for 37.6%) and females with 2 vehicles (104, making up 37.2%).
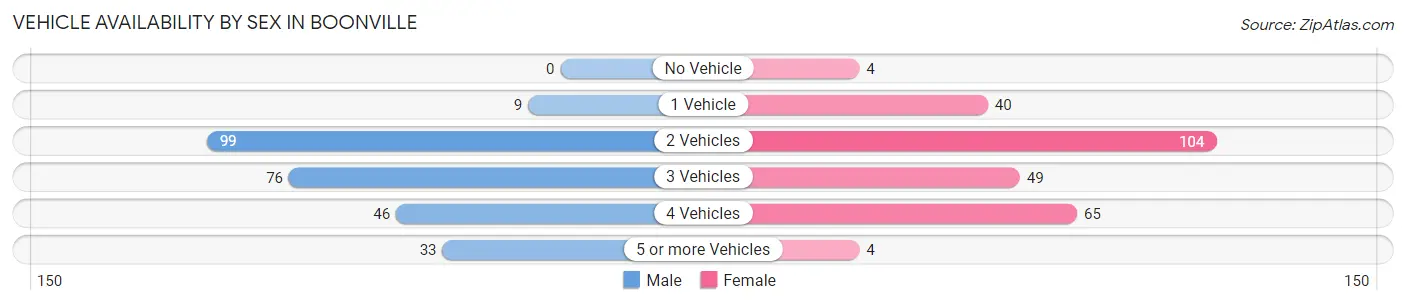
| Vehicles Available | Male | Female |
| No Vehicle | 0 (0.0%) | 4 (1.5%) |
| 1 Vehicle | 9 (3.4%) | 40 (15.0%) |
| 2 Vehicles | 99 (37.6%) | 104 (39.1%) |
| 3 Vehicles | 76 (28.9%) | 49 (18.4%) |
| 4 Vehicles | 46 (17.5%) | 65 (24.4%) |
| 5 or more Vehicles | 33 (12.6%) | 4 (1.5%) |
| Total | 263 (100.0%) | 266 (100.0%) |
Commute Time in Boonville
The most frequently occuring commute durations in Boonville are 15 to 19 minutes (87 commuters, 18.0%), 35 to 39 minutes (85 commuters, 17.6%), and 30 to 34 minutes (67 commuters, 13.8%).
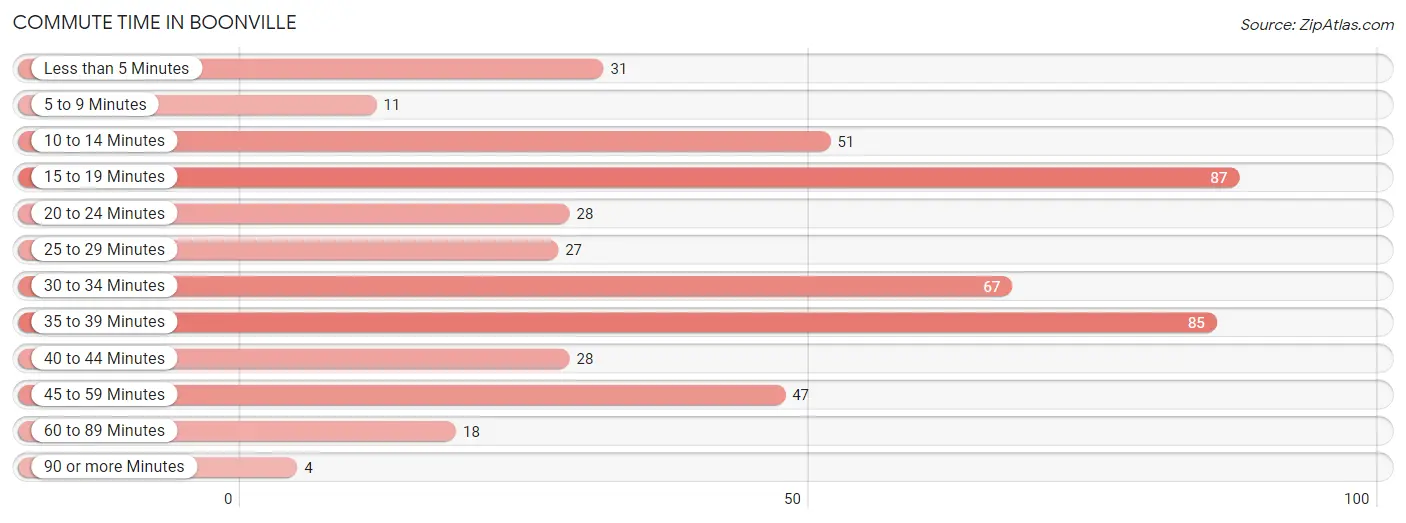
| Commute Time | # Commuters | % Commuters |
| Less than 5 Minutes | 31 | 6.4% |
| 5 to 9 Minutes | 11 | 2.3% |
| 10 to 14 Minutes | 51 | 10.5% |
| 15 to 19 Minutes | 87 | 18.0% |
| 20 to 24 Minutes | 28 | 5.8% |
| 25 to 29 Minutes | 27 | 5.6% |
| 30 to 34 Minutes | 67 | 13.8% |
| 35 to 39 Minutes | 85 | 17.6% |
| 40 to 44 Minutes | 28 | 5.8% |
| 45 to 59 Minutes | 47 | 9.7% |
| 60 to 89 Minutes | 18 | 3.7% |
| 90 or more Minutes | 4 | 0.8% |
Commute Time by Sex in Boonville
The most common commute times in Boonville are 30 to 34 minutes (53 commuters, 22.8%) for males and 35 to 39 minutes (48 commuters, 19.1%) for females.
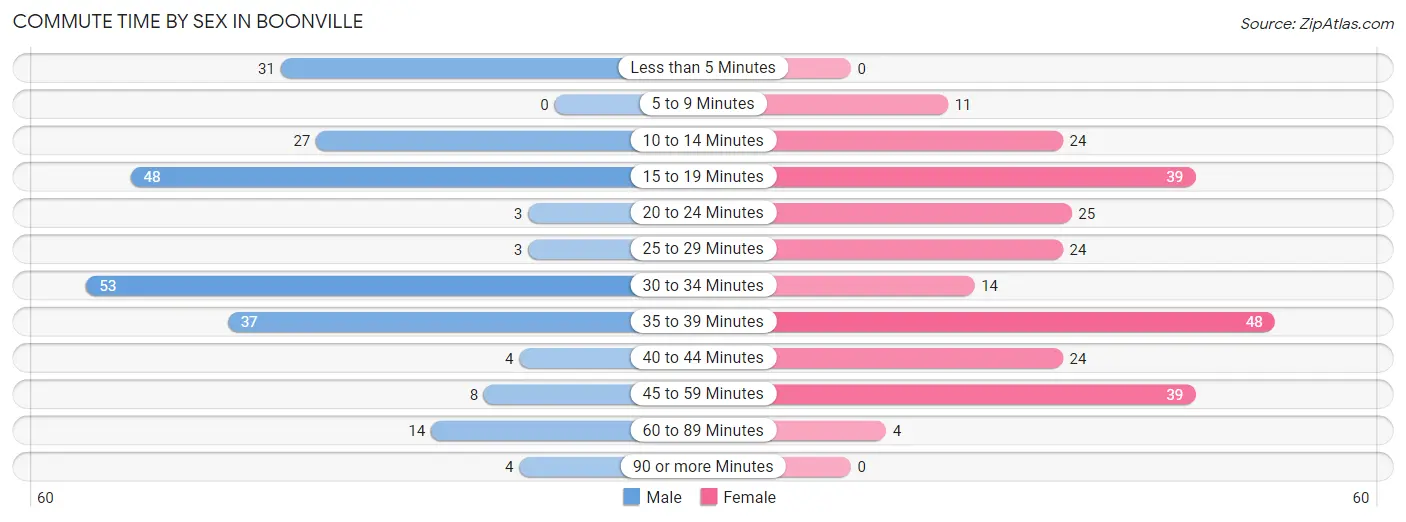
| Commute Time | Male | Female |
| Less than 5 Minutes | 31 (13.4%) | 0 (0.0%) |
| 5 to 9 Minutes | 0 (0.0%) | 11 (4.4%) |
| 10 to 14 Minutes | 27 (11.6%) | 24 (9.5%) |
| 15 to 19 Minutes | 48 (20.7%) | 39 (15.5%) |
| 20 to 24 Minutes | 3 (1.3%) | 25 (9.9%) |
| 25 to 29 Minutes | 3 (1.3%) | 24 (9.5%) |
| 30 to 34 Minutes | 53 (22.8%) | 14 (5.6%) |
| 35 to 39 Minutes | 37 (16.0%) | 48 (19.1%) |
| 40 to 44 Minutes | 4 (1.7%) | 24 (9.5%) |
| 45 to 59 Minutes | 8 (3.5%) | 39 (15.5%) |
| 60 to 89 Minutes | 14 (6.0%) | 4 (1.6%) |
| 90 or more Minutes | 4 (1.7%) | 0 (0.0%) |
Time of Departure to Work by Sex in Boonville
The most frequent times of departure to work in Boonville are 7:00 AM to 7:29 AM (71, 30.6%) for males and 7:00 AM to 7:29 AM (74, 29.4%) for females.
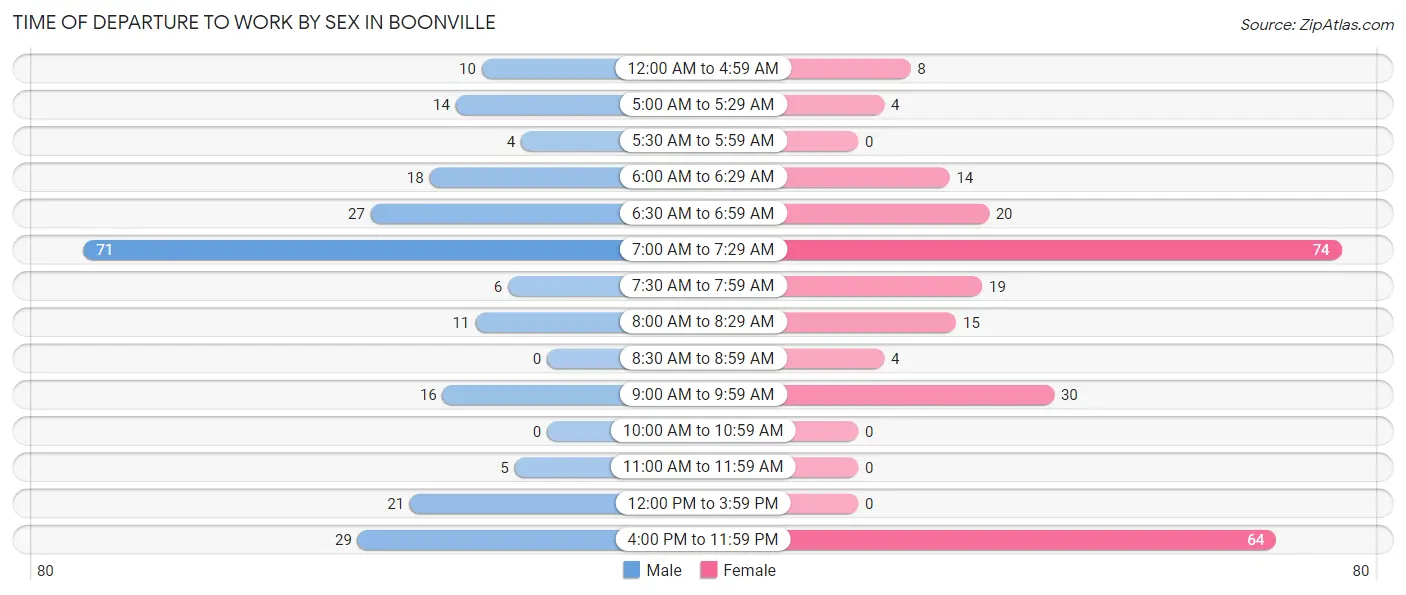
| Time of Departure | Male | Female |
| 12:00 AM to 4:59 AM | 10 (4.3%) | 8 (3.2%) |
| 5:00 AM to 5:29 AM | 14 (6.0%) | 4 (1.6%) |
| 5:30 AM to 5:59 AM | 4 (1.7%) | 0 (0.0%) |
| 6:00 AM to 6:29 AM | 18 (7.8%) | 14 (5.6%) |
| 6:30 AM to 6:59 AM | 27 (11.6%) | 20 (7.9%) |
| 7:00 AM to 7:29 AM | 71 (30.6%) | 74 (29.4%) |
| 7:30 AM to 7:59 AM | 6 (2.6%) | 19 (7.5%) |
| 8:00 AM to 8:29 AM | 11 (4.7%) | 15 (5.9%) |
| 8:30 AM to 8:59 AM | 0 (0.0%) | 4 (1.6%) |
| 9:00 AM to 9:59 AM | 16 (6.9%) | 30 (11.9%) |
| 10:00 AM to 10:59 AM | 0 (0.0%) | 0 (0.0%) |
| 11:00 AM to 11:59 AM | 5 (2.2%) | 0 (0.0%) |
| 12:00 PM to 3:59 PM | 21 (9.0%) | 0 (0.0%) |
| 4:00 PM to 11:59 PM | 29 (12.5%) | 64 (25.4%) |
| Total | 232 (100.0%) | 252 (100.0%) |
Housing Occupancy in Boonville
Occupancy by Ownership in Boonville
Of the total 555 dwellings in Boonville, owner-occupied units account for 360 (64.9%), while renter-occupied units make up 195 (35.1%).
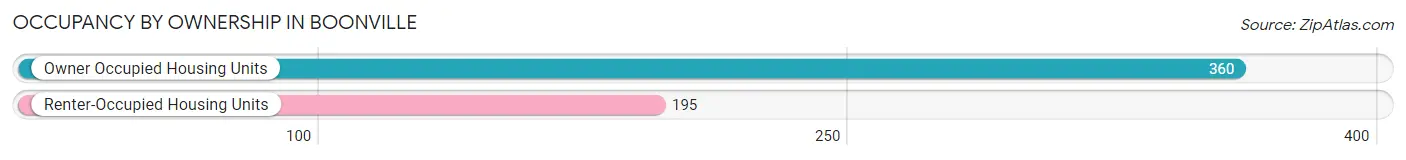
| Occupancy | # Housing Units | % Housing Units |
| Owner Occupied Housing Units | 360 | 64.9% |
| Renter-Occupied Housing Units | 195 | 35.1% |
| Total Occupied Housing Units | 555 | 100.0% |
Occupancy by Household Size in Boonville
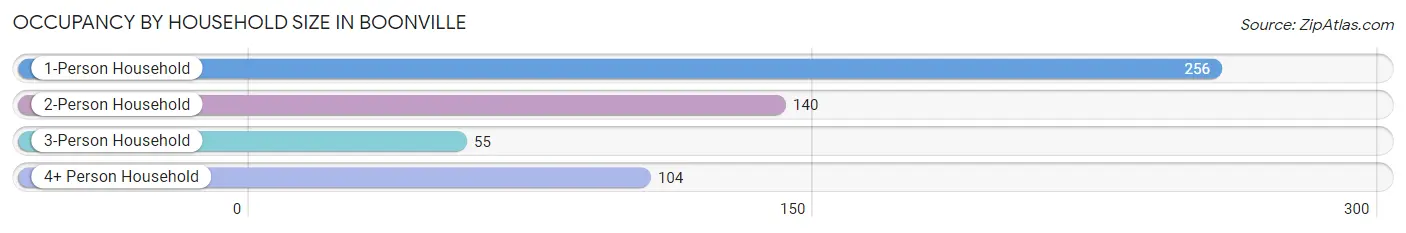
| Household Size | # Housing Units | % Housing Units |
| 1-Person Household | 256 | 46.1% |
| 2-Person Household | 140 | 25.2% |
| 3-Person Household | 55 | 9.9% |
| 4+ Person Household | 104 | 18.7% |
| Total Housing Units | 555 | 100.0% |
Occupancy by Ownership by Household Size in Boonville
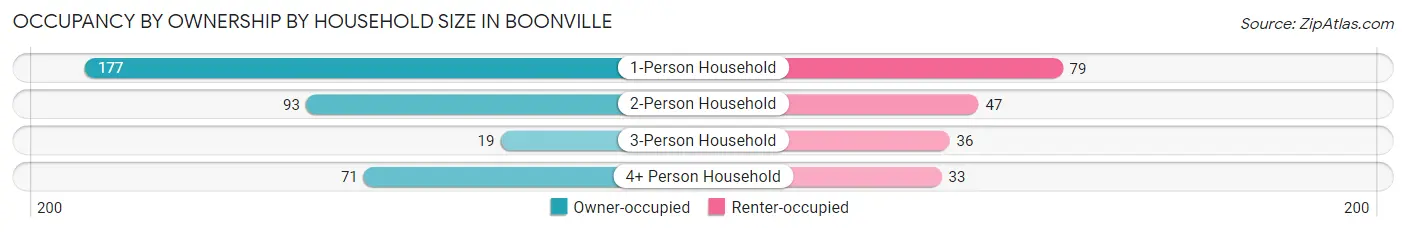
| Household Size | Owner-occupied | Renter-occupied |
| 1-Person Household | 177 (69.1%) | 79 (30.9%) |
| 2-Person Household | 93 (66.4%) | 47 (33.6%) |
| 3-Person Household | 19 (34.5%) | 36 (65.4%) |
| 4+ Person Household | 71 (68.3%) | 33 (31.7%) |
| Total Housing Units | 360 (64.9%) | 195 (35.1%) |
Occupancy by Educational Attainment in Boonville
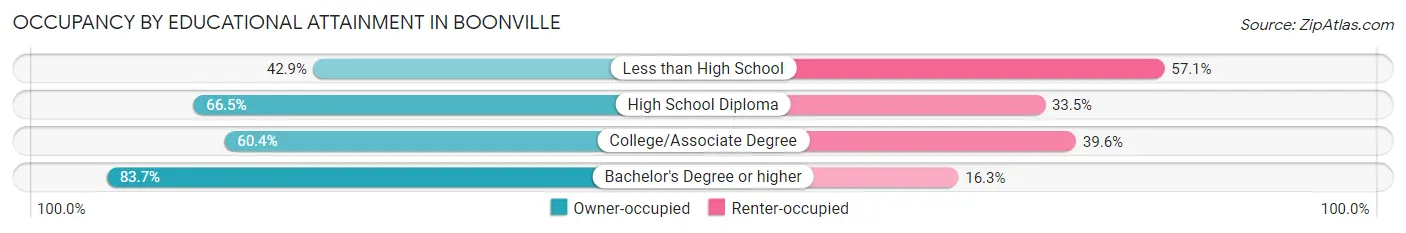
| Household Size | Owner-occupied | Renter-occupied |
| Less than High School | 27 (42.9%) | 36 (57.1%) |
| High School Diploma | 171 (66.5%) | 86 (33.5%) |
| College/Associate Degree | 90 (60.4%) | 59 (39.6%) |
| Bachelor's Degree or higher | 72 (83.7%) | 14 (16.3%) |
Occupancy by Age of Householder in Boonville
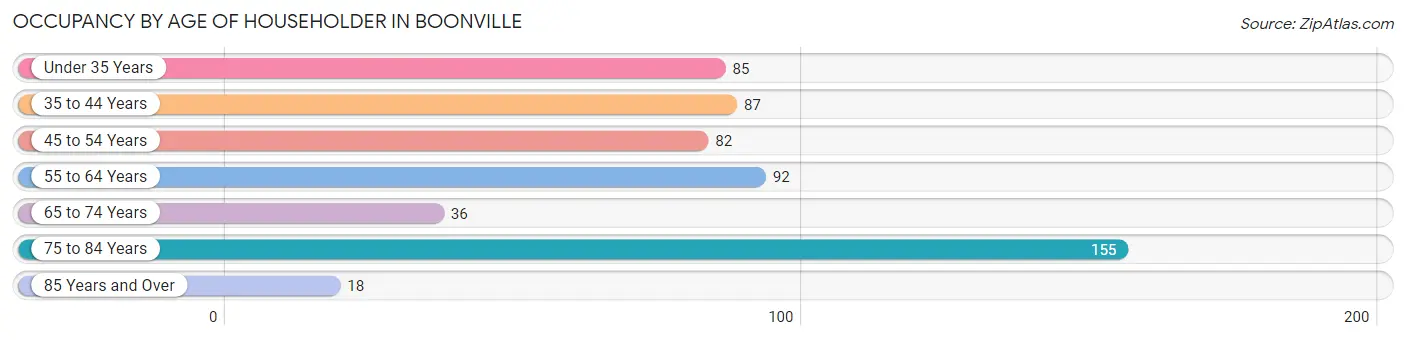
| Age Bracket | # Households | % Households |
| Under 35 Years | 85 | 15.3% |
| 35 to 44 Years | 87 | 15.7% |
| 45 to 54 Years | 82 | 14.8% |
| 55 to 64 Years | 92 | 16.6% |
| 65 to 74 Years | 36 | 6.5% |
| 75 to 84 Years | 155 | 27.9% |
| 85 Years and Over | 18 | 3.2% |
| Total | 555 | 100.0% |
Housing Finances in Boonville
Median Income by Occupancy in Boonville
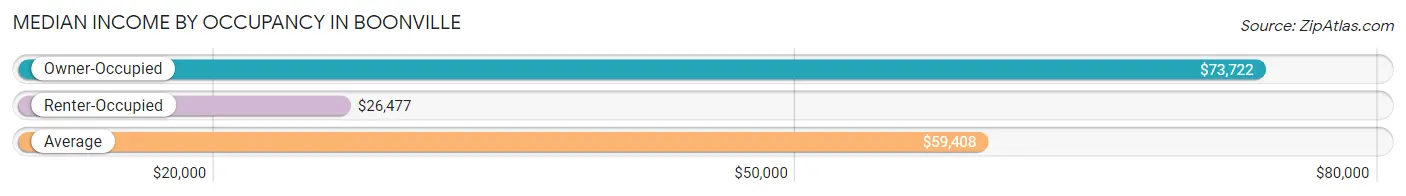
| Occupancy Type | # Households | Median Income |
| Owner-Occupied | 360 (64.9%) | $73,722 |
| Renter-Occupied | 195 (35.1%) | $26,477 |
| Average | 555 (100.0%) | $59,408 |
Occupancy by Householder Income Bracket in Boonville
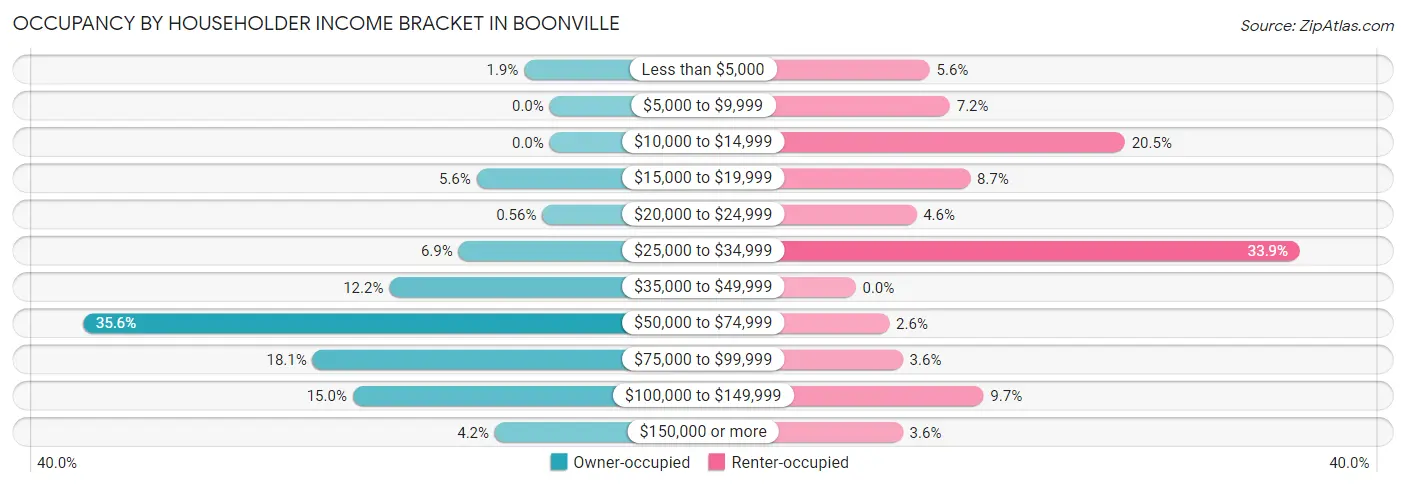
| Income Bracket | Owner-occupied | Renter-occupied |
| Less than $5,000 | 7 (1.9%) | 11 (5.6%) |
| $5,000 to $9,999 | 0 (0.0%) | 14 (7.2%) |
| $10,000 to $14,999 | 0 (0.0%) | 40 (20.5%) |
| $15,000 to $19,999 | 20 (5.6%) | 17 (8.7%) |
| $20,000 to $24,999 | 2 (0.6%) | 9 (4.6%) |
| $25,000 to $34,999 | 25 (6.9%) | 66 (33.9%) |
| $35,000 to $49,999 | 44 (12.2%) | 0 (0.0%) |
| $50,000 to $74,999 | 128 (35.6%) | 5 (2.6%) |
| $75,000 to $99,999 | 65 (18.1%) | 7 (3.6%) |
| $100,000 to $149,999 | 54 (15.0%) | 19 (9.7%) |
| $150,000 or more | 15 (4.2%) | 7 (3.6%) |
| Total | 360 (100.0%) | 195 (100.0%) |
Monthly Housing Cost Tiers in Boonville
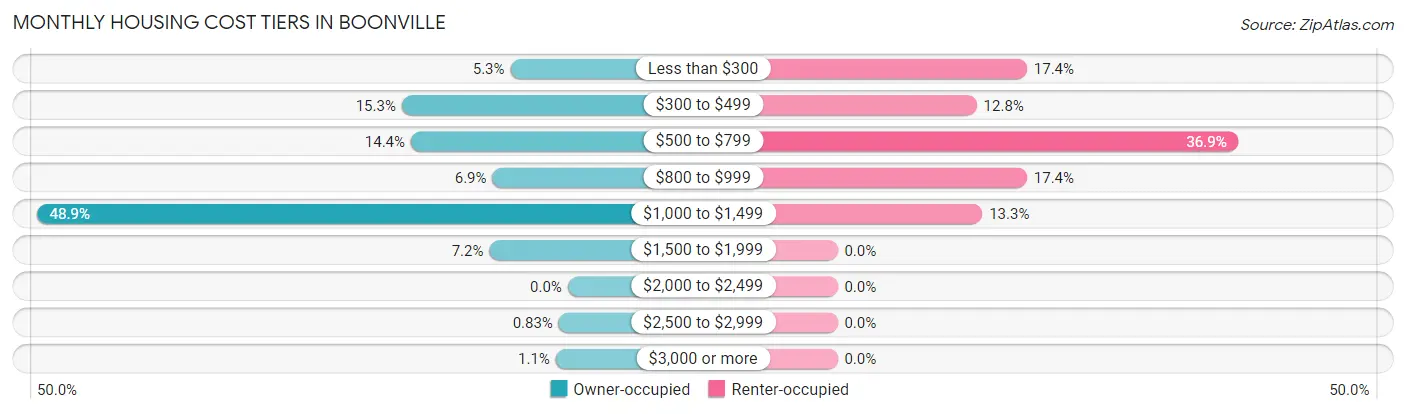
| Monthly Cost | Owner-occupied | Renter-occupied |
| Less than $300 | 19 (5.3%) | 34 (17.4%) |
| $300 to $499 | 55 (15.3%) | 25 (12.8%) |
| $500 to $799 | 52 (14.4%) | 72 (36.9%) |
| $800 to $999 | 25 (6.9%) | 34 (17.4%) |
| $1,000 to $1,499 | 176 (48.9%) | 26 (13.3%) |
| $1,500 to $1,999 | 26 (7.2%) | 0 (0.0%) |
| $2,000 to $2,499 | 0 (0.0%) | 0 (0.0%) |
| $2,500 to $2,999 | 3 (0.8%) | 0 (0.0%) |
| $3,000 or more | 4 (1.1%) | 0 (0.0%) |
| Total | 360 (100.0%) | 195 (100.0%) |
Physical Housing Characteristics in Boonville
Housing Structures in Boonville
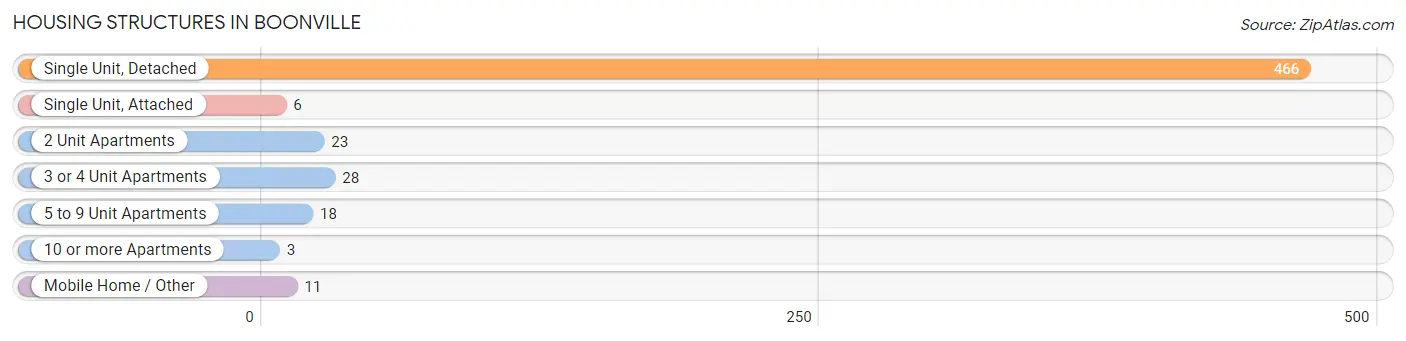
| Structure Type | # Housing Units | % Housing Units |
| Single Unit, Detached | 466 | 84.0% |
| Single Unit, Attached | 6 | 1.1% |
| 2 Unit Apartments | 23 | 4.1% |
| 3 or 4 Unit Apartments | 28 | 5.1% |
| 5 to 9 Unit Apartments | 18 | 3.2% |
| 10 or more Apartments | 3 | 0.5% |
| Mobile Home / Other | 11 | 2.0% |
| Total | 555 | 100.0% |
Housing Structures by Occupancy in Boonville
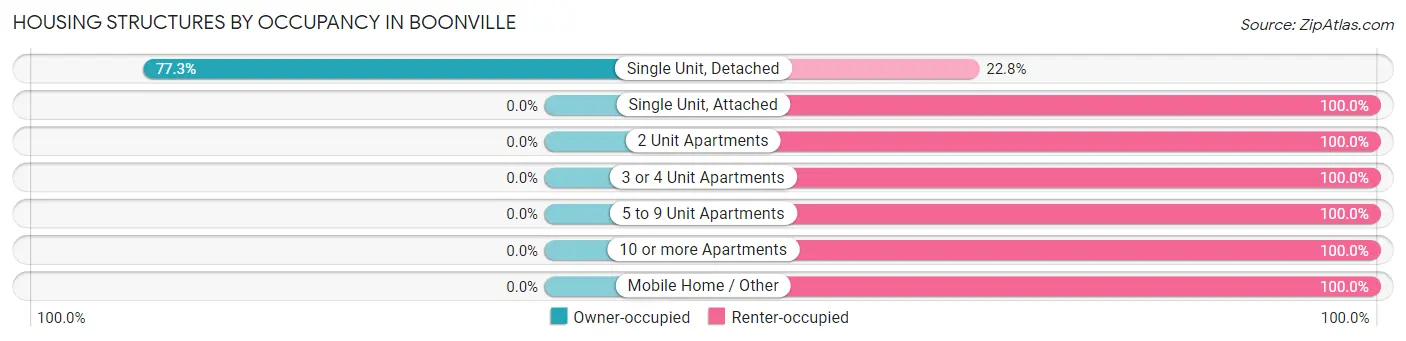
| Structure Type | Owner-occupied | Renter-occupied |
| Single Unit, Detached | 360 (77.2%) | 106 (22.8%) |
| Single Unit, Attached | 0 (0.0%) | 6 (100.0%) |
| 2 Unit Apartments | 0 (0.0%) | 23 (100.0%) |
| 3 or 4 Unit Apartments | 0 (0.0%) | 28 (100.0%) |
| 5 to 9 Unit Apartments | 0 (0.0%) | 18 (100.0%) |
| 10 or more Apartments | 0 (0.0%) | 3 (100.0%) |
| Mobile Home / Other | 0 (0.0%) | 11 (100.0%) |
| Total | 360 (64.9%) | 195 (35.1%) |
Housing Structures by Number of Rooms in Boonville
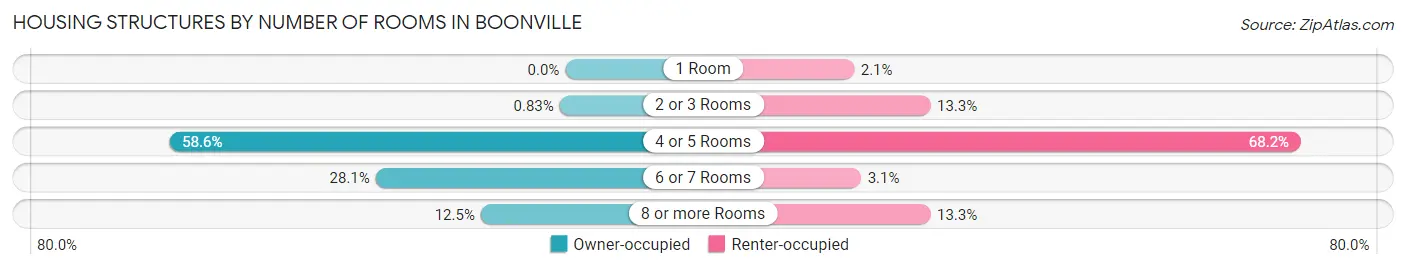
| Number of Rooms | Owner-occupied | Renter-occupied |
| 1 Room | 0 (0.0%) | 4 (2.1%) |
| 2 or 3 Rooms | 3 (0.8%) | 26 (13.3%) |
| 4 or 5 Rooms | 211 (58.6%) | 133 (68.2%) |
| 6 or 7 Rooms | 101 (28.1%) | 6 (3.1%) |
| 8 or more Rooms | 45 (12.5%) | 26 (13.3%) |
| Total | 360 (100.0%) | 195 (100.0%) |
Housing Structure by Heating Type in Boonville
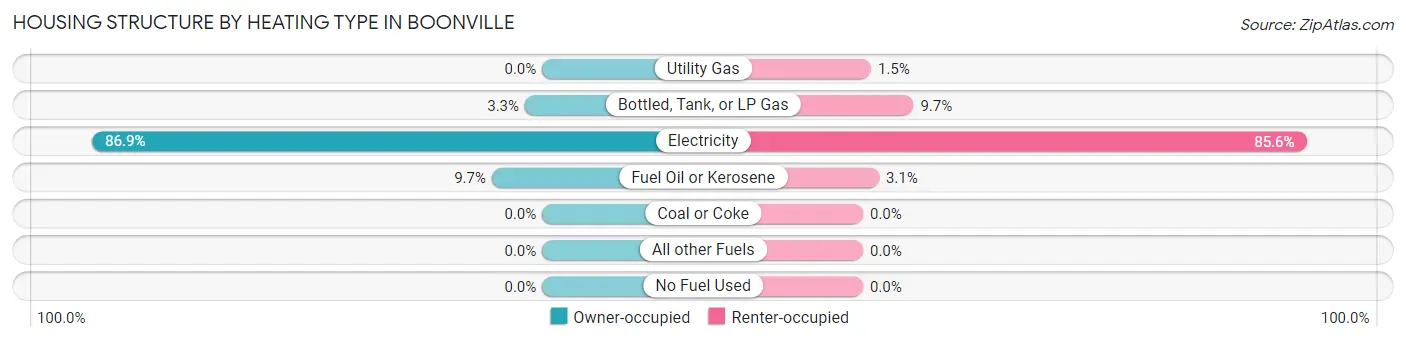
| Heating Type | Owner-occupied | Renter-occupied |
| Utility Gas | 0 (0.0%) | 3 (1.5%) |
| Bottled, Tank, or LP Gas | 12 (3.3%) | 19 (9.7%) |
| Electricity | 313 (86.9%) | 167 (85.6%) |
| Fuel Oil or Kerosene | 35 (9.7%) | 6 (3.1%) |
| Coal or Coke | 0 (0.0%) | 0 (0.0%) |
| All other Fuels | 0 (0.0%) | 0 (0.0%) |
| No Fuel Used | 0 (0.0%) | 0 (0.0%) |
| Total | 360 (100.0%) | 195 (100.0%) |
Household Vehicle Usage in Boonville
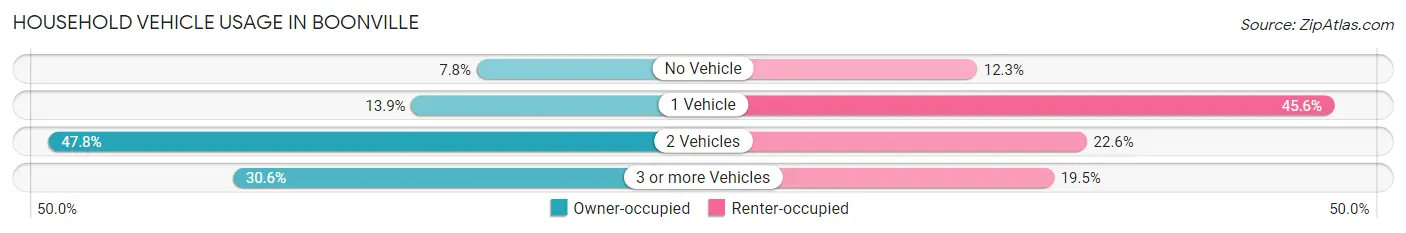
| Vehicles per Household | Owner-occupied | Renter-occupied |
| No Vehicle | 28 (7.8%) | 24 (12.3%) |
| 1 Vehicle | 50 (13.9%) | 89 (45.6%) |
| 2 Vehicles | 172 (47.8%) | 44 (22.6%) |
| 3 or more Vehicles | 110 (30.6%) | 38 (19.5%) |
| Total | 360 (100.0%) | 195 (100.0%) |
Real Estate & Mortgages in Boonville
Real Estate and Mortgage Overview in Boonville
| Characteristic | Without Mortgage | With Mortgage |
| Housing Units | 87 | 273 |
| Median Property Value | $131,700 | $163,400 |
| Median Household Income | $48,125 | $8 |
| Monthly Housing Costs | $363 | $4 |
| Real Estate Taxes | $1,268 | $2 |
Property Value by Mortgage Status in Boonville
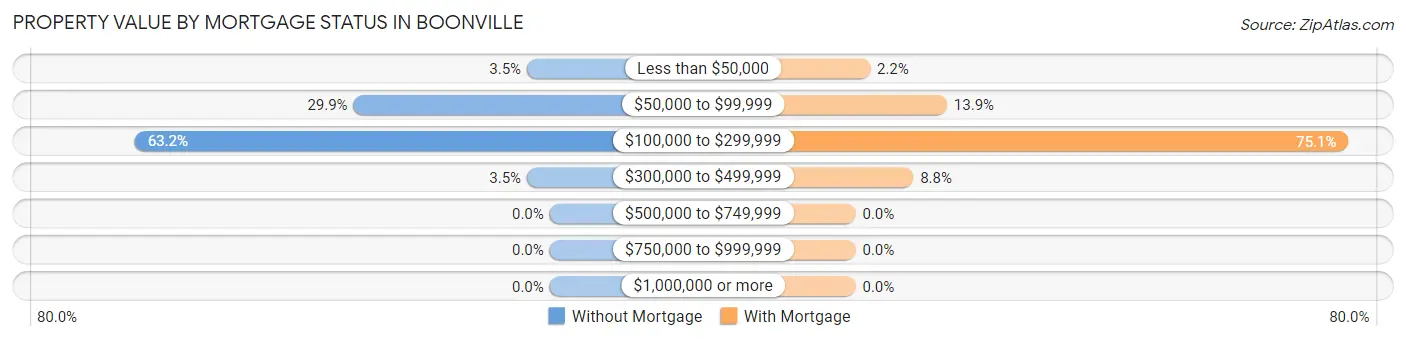
| Property Value | Without Mortgage | With Mortgage |
| Less than $50,000 | 3 (3.5%) | 6 (2.2%) |
| $50,000 to $99,999 | 26 (29.9%) | 38 (13.9%) |
| $100,000 to $299,999 | 55 (63.2%) | 205 (75.1%) |
| $300,000 to $499,999 | 3 (3.5%) | 24 (8.8%) |
| $500,000 to $749,999 | 0 (0.0%) | 0 (0.0%) |
| $750,000 to $999,999 | 0 (0.0%) | 0 (0.0%) |
| $1,000,000 or more | 0 (0.0%) | 0 (0.0%) |
| Total | 87 (100.0%) | 273 (100.0%) |
Household Income by Mortgage Status in Boonville
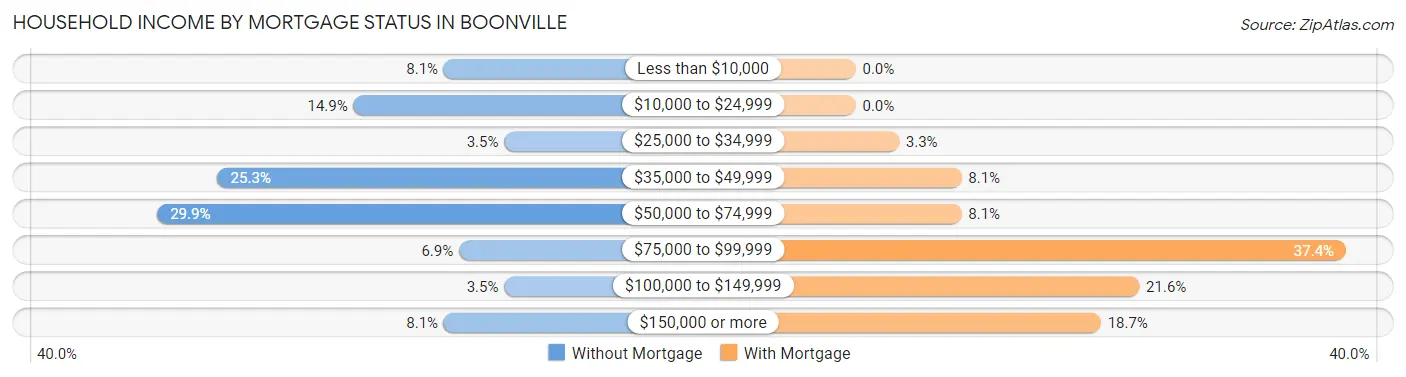
| Household Income | Without Mortgage | With Mortgage |
| Less than $10,000 | 7 (8.1%) | 0 (0.0%) |
| $10,000 to $24,999 | 13 (14.9%) | 0 (0.0%) |
| $25,000 to $34,999 | 3 (3.5%) | 9 (3.3%) |
| $35,000 to $49,999 | 22 (25.3%) | 22 (8.1%) |
| $50,000 to $74,999 | 26 (29.9%) | 22 (8.1%) |
| $75,000 to $99,999 | 6 (6.9%) | 102 (37.4%) |
| $100,000 to $149,999 | 3 (3.5%) | 59 (21.6%) |
| $150,000 or more | 7 (8.1%) | 51 (18.7%) |
| Total | 87 (100.0%) | 273 (100.0%) |
Property Value to Household Income Ratio in Boonville
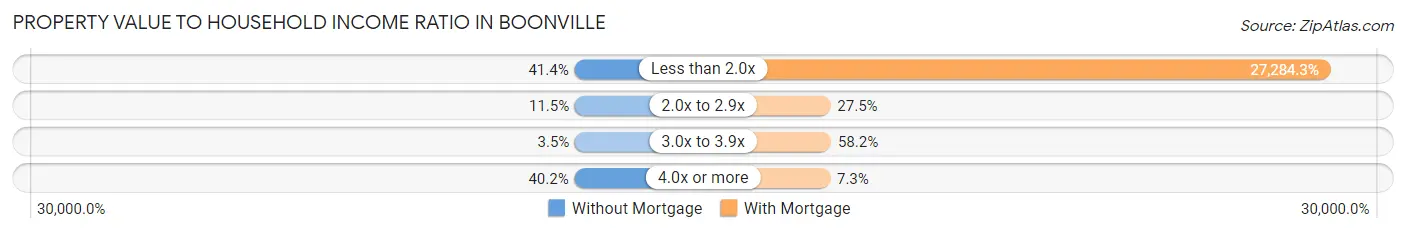
| Value-to-Income Ratio | Without Mortgage | With Mortgage |
| Less than 2.0x | 36 (41.4%) | 74,486 (27,284.2%) |
| 2.0x to 2.9x | 10 (11.5%) | 75 (27.5%) |
| 3.0x to 3.9x | 3 (3.5%) | 159 (58.2%) |
| 4.0x or more | 35 (40.2%) | 20 (7.3%) |
| Total | 87 (100.0%) | 273 (100.0%) |
Real Estate Taxes by Mortgage Status in Boonville
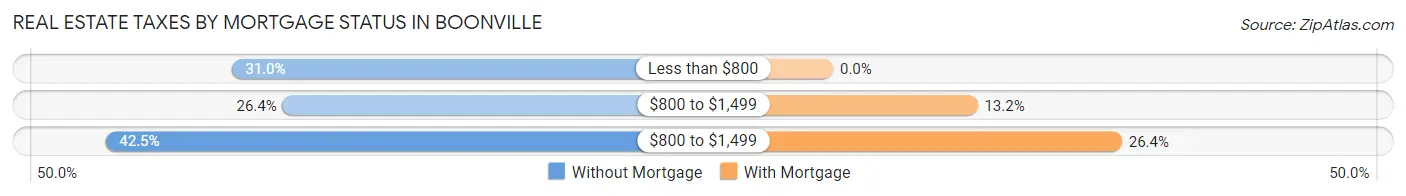
| Property Taxes | Without Mortgage | With Mortgage |
| Less than $800 | 27 (31.0%) | 0 (0.0%) |
| $800 to $1,499 | 23 (26.4%) | 36 (13.2%) |
| $800 to $1,499 | 37 (42.5%) | 72 (26.4%) |
| Total | 87 (100.0%) | 273 (100.0%) |
Health & Disability in Boonville
Health Insurance Coverage by Age in Boonville
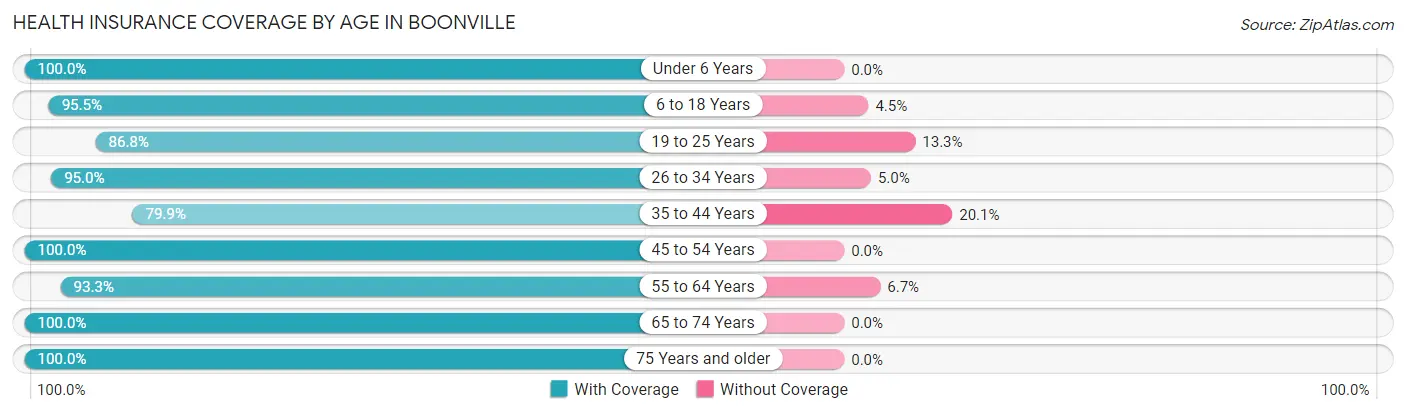
| Age Bracket | With Coverage | Without Coverage |
| Under 6 Years | 85 (100.0%) | 0 (0.0%) |
| 6 to 18 Years | 275 (95.5%) | 13 (4.5%) |
| 19 to 25 Years | 72 (86.8%) | 11 (13.3%) |
| 26 to 34 Years | 153 (95.0%) | 8 (5.0%) |
| 35 to 44 Years | 115 (79.9%) | 29 (20.1%) |
| 45 to 54 Years | 138 (100.0%) | 0 (0.0%) |
| 55 to 64 Years | 125 (93.3%) | 9 (6.7%) |
| 65 to 74 Years | 122 (100.0%) | 0 (0.0%) |
| 75 Years and older | 209 (100.0%) | 0 (0.0%) |
| Total | 1,294 (94.9%) | 70 (5.1%) |
Health Insurance Coverage by Citizenship Status in Boonville
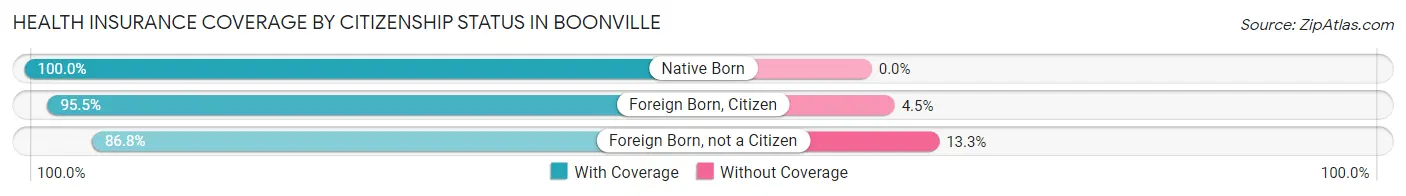
| Citizenship Status | With Coverage | Without Coverage |
| Native Born | 85 (100.0%) | 0 (0.0%) |
| Foreign Born, Citizen | 275 (95.5%) | 13 (4.5%) |
| Foreign Born, not a Citizen | 72 (86.8%) | 11 (13.3%) |
Health Insurance Coverage by Household Income in Boonville
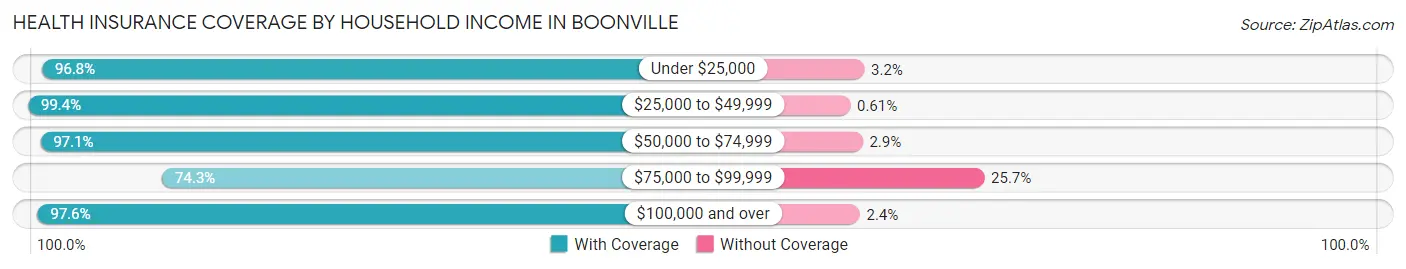
| Household Income | With Coverage | Without Coverage |
| Under $25,000 | 209 (96.8%) | 7 (3.2%) |
| $25,000 to $49,999 | 325 (99.4%) | 2 (0.6%) |
| $50,000 to $74,999 | 265 (97.1%) | 8 (2.9%) |
| $75,000 to $99,999 | 127 (74.3%) | 44 (25.7%) |
| $100,000 and over | 368 (97.6%) | 9 (2.4%) |
Public vs Private Health Insurance Coverage by Age in Boonville
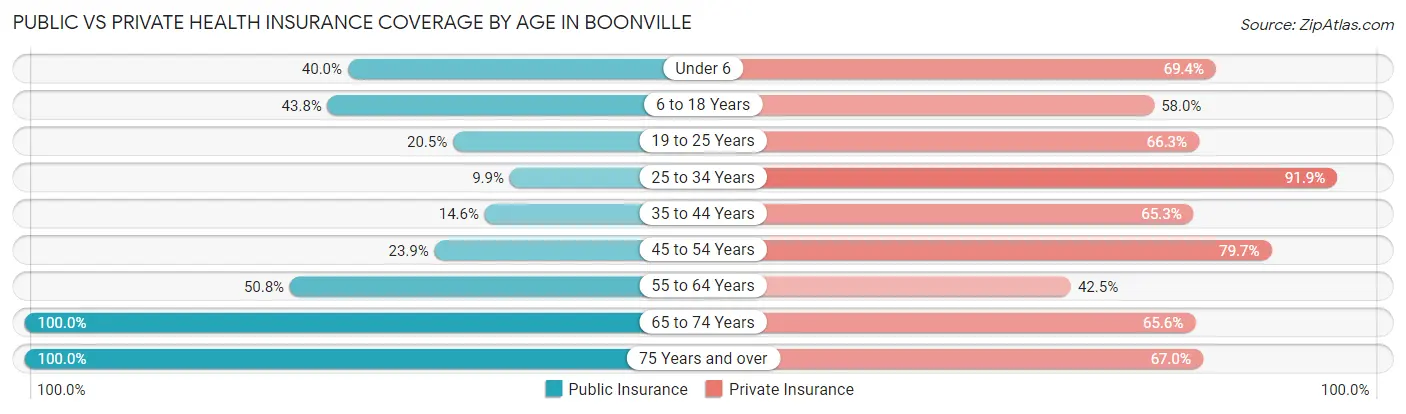
| Age Bracket | Public Insurance | Private Insurance |
| Under 6 | 34 (40.0%) | 59 (69.4%) |
| 6 to 18 Years | 126 (43.8%) | 167 (58.0%) |
| 19 to 25 Years | 17 (20.5%) | 55 (66.3%) |
| 25 to 34 Years | 16 (9.9%) | 148 (91.9%) |
| 35 to 44 Years | 21 (14.6%) | 94 (65.3%) |
| 45 to 54 Years | 33 (23.9%) | 110 (79.7%) |
| 55 to 64 Years | 68 (50.7%) | 57 (42.5%) |
| 65 to 74 Years | 122 (100.0%) | 80 (65.6%) |
| 75 Years and over | 209 (100.0%) | 140 (67.0%) |
| Total | 646 (47.4%) | 910 (66.7%) |
Disability Status by Sex by Age in Boonville
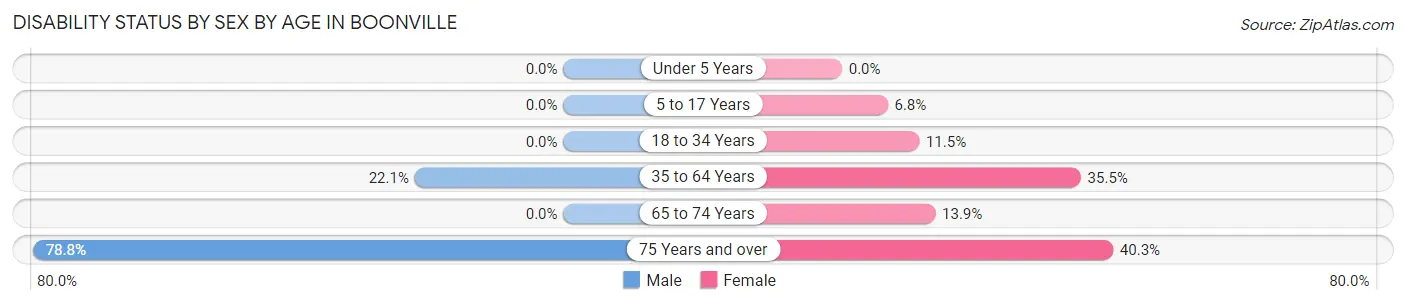
| Age Bracket | Male | Female |
| Under 5 Years | 0 (0.0%) | 0 (0.0%) |
| 5 to 17 Years | 0 (0.0%) | 11 (6.8%) |
| 18 to 34 Years | 0 (0.0%) | 18 (11.5%) |
| 35 to 64 Years | 47 (22.1%) | 72 (35.5%) |
| 65 to 74 Years | 0 (0.0%) | 14 (13.9%) |
| 75 Years and over | 104 (78.8%) | 31 (40.3%) |
Disability Class by Sex by Age in Boonville
Disability Class: Hearing Difficulty
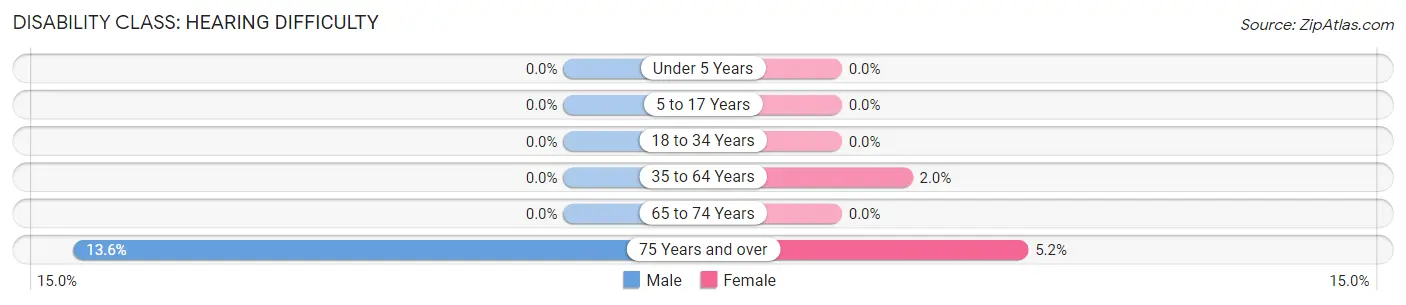
| Age Bracket | Male | Female |
| Under 5 Years | 0 (0.0%) | 0 (0.0%) |
| 5 to 17 Years | 0 (0.0%) | 0 (0.0%) |
| 18 to 34 Years | 0 (0.0%) | 0 (0.0%) |
| 35 to 64 Years | 0 (0.0%) | 4 (2.0%) |
| 65 to 74 Years | 0 (0.0%) | 0 (0.0%) |
| 75 Years and over | 18 (13.6%) | 4 (5.2%) |
Disability Class: Vision Difficulty
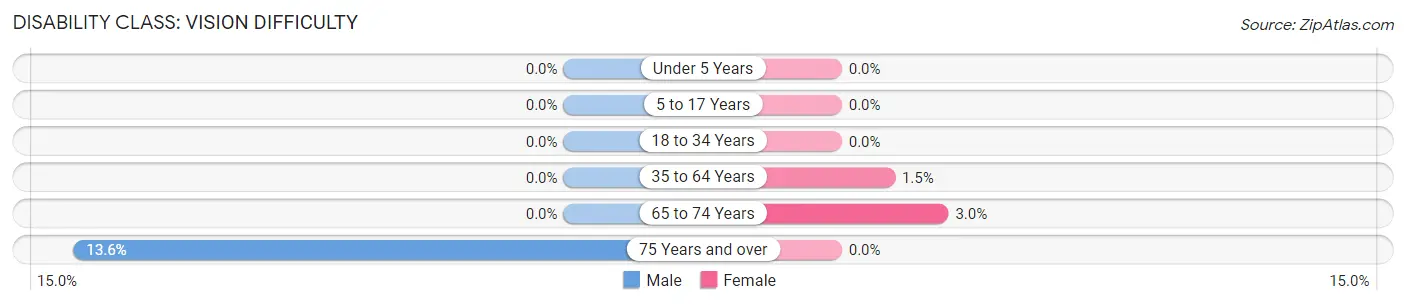
| Age Bracket | Male | Female |
| Under 5 Years | 0 (0.0%) | 0 (0.0%) |
| 5 to 17 Years | 0 (0.0%) | 0 (0.0%) |
| 18 to 34 Years | 0 (0.0%) | 0 (0.0%) |
| 35 to 64 Years | 0 (0.0%) | 3 (1.5%) |
| 65 to 74 Years | 0 (0.0%) | 3 (3.0%) |
| 75 Years and over | 18 (13.6%) | 0 (0.0%) |
Disability Class: Cognitive Difficulty
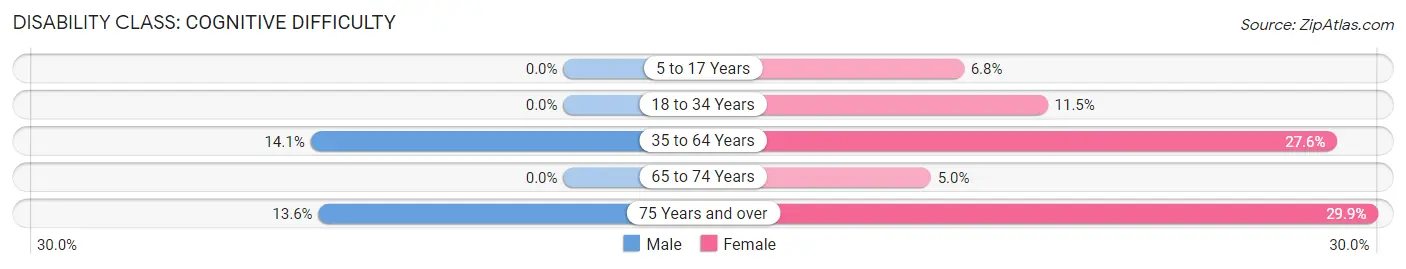
| Age Bracket | Male | Female |
| 5 to 17 Years | 0 (0.0%) | 11 (6.8%) |
| 18 to 34 Years | 0 (0.0%) | 18 (11.5%) |
| 35 to 64 Years | 30 (14.1%) | 56 (27.6%) |
| 65 to 74 Years | 0 (0.0%) | 5 (5.0%) |
| 75 Years and over | 18 (13.6%) | 23 (29.9%) |
Disability Class: Ambulatory Difficulty
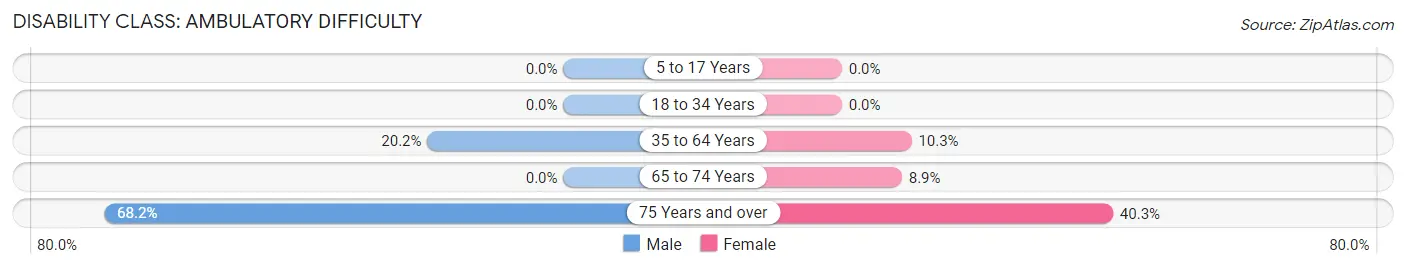
| Age Bracket | Male | Female |
| 5 to 17 Years | 0 (0.0%) | 0 (0.0%) |
| 18 to 34 Years | 0 (0.0%) | 0 (0.0%) |
| 35 to 64 Years | 43 (20.2%) | 21 (10.3%) |
| 65 to 74 Years | 0 (0.0%) | 9 (8.9%) |
| 75 Years and over | 90 (68.2%) | 31 (40.3%) |
Disability Class: Self-Care Difficulty
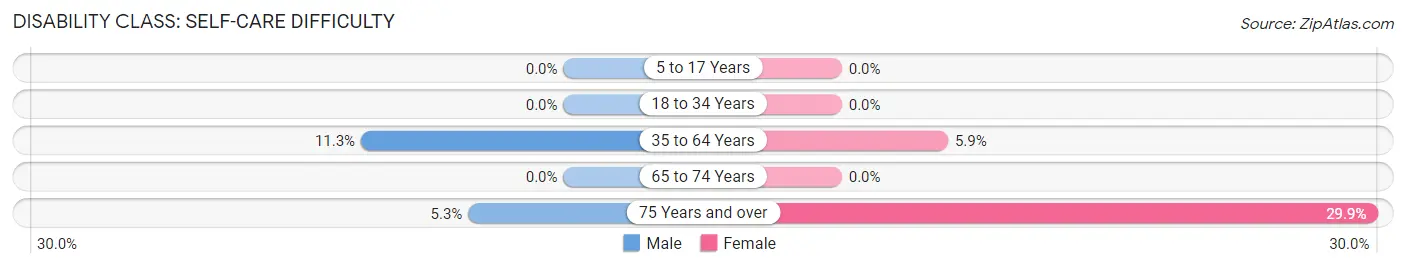
| Age Bracket | Male | Female |
| 5 to 17 Years | 0 (0.0%) | 0 (0.0%) |
| 18 to 34 Years | 0 (0.0%) | 0 (0.0%) |
| 35 to 64 Years | 24 (11.3%) | 12 (5.9%) |
| 65 to 74 Years | 0 (0.0%) | 0 (0.0%) |
| 75 Years and over | 7 (5.3%) | 23 (29.9%) |
Technology Access in Boonville
Computing Device Access in Boonville
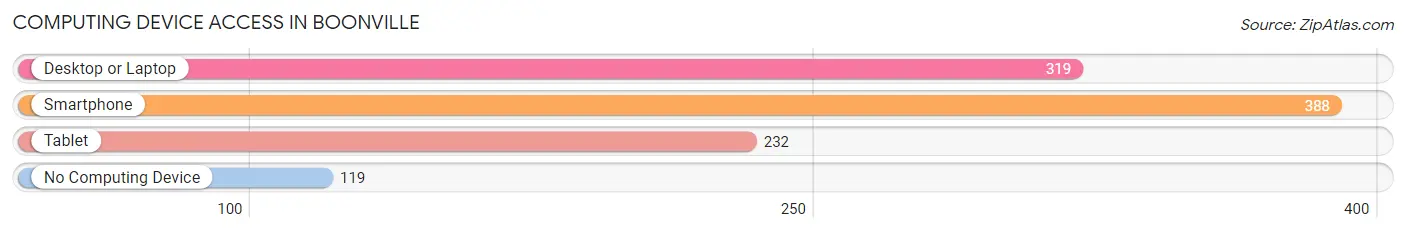
| Device Type | # Households | % Households |
| Desktop or Laptop | 319 | 57.5% |
| Smartphone | 388 | 69.9% |
| Tablet | 232 | 41.8% |
| No Computing Device | 119 | 21.4% |
| Total | 555 | 100.0% |
Internet Access in Boonville
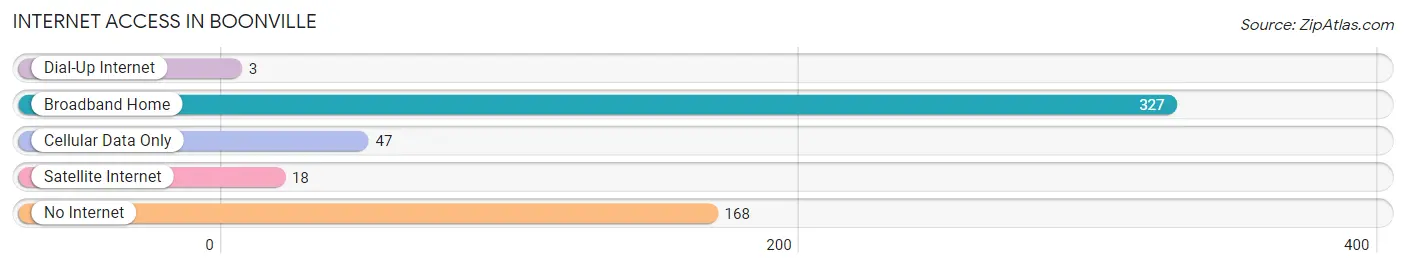
| Internet Type | # Households | % Households |
| Dial-Up Internet | 3 | 0.5% |
| Broadband Home | 327 | 58.9% |
| Cellular Data Only | 47 | 8.5% |
| Satellite Internet | 18 | 3.2% |
| No Internet | 168 | 30.3% |
| Total | 555 | 100.0% |
Boonville Summary
Boonville is a small town located in Yadkin County, North Carolina. It is situated in the foothills of the Blue Ridge Mountains, approximately 40 miles northwest of Winston-Salem. The town was founded in 1799 and is named after the Revolutionary War hero, General Daniel Morgan. Boonville is a rural community with a population of approximately 1,500 people.
Geography
Boonville is located in the foothills of the Blue Ridge Mountains, approximately 40 miles northwest of Winston-Salem. The town is situated in the Yadkin Valley, which is a region of rolling hills and valleys. The Yadkin River runs through the valley and is a major source of recreation for the town. The town is surrounded by the towns of East Bend, Yadkinville, and Jonesville.
History
Boonville was founded in 1799 and is named after the Revolutionary War hero, General Daniel Morgan. The town was originally a farming community and was known for its production of tobacco, corn, and wheat. In the late 19th century, the town began to grow and develop as a manufacturing center. The town was home to several factories, including a cotton mill, a furniture factory, and a shoe factory.
In the early 20th century, Boonville experienced a period of growth and prosperity. The town was home to several businesses, including a bank, a hotel, and a movie theater. The town also had a thriving music scene, with several local bands performing in the area.
In the late 20th century, the town began to decline as the factories closed and the population decreased. The town has since experienced a resurgence in recent years, with new businesses and restaurants opening in the area.
Economy
The economy of Boonville is largely based on agriculture and tourism. The town is home to several farms, which produce a variety of crops, including corn, wheat, and tobacco. The town is also home to several wineries, which attract tourists from all over the region.
The town is also home to several small businesses, including restaurants, shops, and a movie theater. The town is also home to a small manufacturing plant, which produces furniture and other products.
Demographics
As of the 2010 census, the population of Boonville was 1,500. The town is predominantly white, with approximately 95% of the population being white. The town is also home to a small Hispanic population, with approximately 4% of the population being Hispanic. The median household income in Boonville is $35,000, and the median age is 42.
Conclusion
Boonville is a small town located in Yadkin County, North Carolina. The town was founded in 1799 and is named after the Revolutionary War hero, General Daniel Morgan. The town is situated in the foothills of the Blue Ridge Mountains and is surrounded by the towns of East Bend, Yadkinville, and Jonesville. The economy of Boonville is largely based on agriculture and tourism, and the town is home to several small businesses. The population of Boonville is predominantly white, with approximately 95% of the population being white. The median household income in Boonville is $35,000, and the median age is 42.
Common Questions
What is Per Capita Income in Boonville?
Per Capita income in Boonville is $30,178.
What is the Median Family Income in Boonville?
Median Family Income in Boonville is $71,563.
What is the Median Household income in Boonville?
Median Household Income in Boonville is $59,408.
What is Income or Wage Gap in Boonville?
Income or Wage Gap in Boonville is 34.2%.
Women in Boonville earn 65.8 cents for every dollar earned by a man.
What is Family Income Deficit in Boonville?
Family Income Deficit in Boonville is $13,426.
Families that are below poverty line in Boonville earn $13,426 less on average than the poverty threshold level.
What is Inequality or Gini Index in Boonville?
Inequality or Gini Index in Boonville is 0.39.
What is the Total Population of Boonville?
Total Population of Boonville is 1,364.
What is the Total Male Population of Boonville?
Total Male Population of Boonville is 614.
What is the Total Female Population of Boonville?
Total Female Population of Boonville is 750.
What is the Ratio of Males per 100 Females in Boonville?
There are 81.87 Males per 100 Females in Boonville.
What is the Ratio of Females per 100 Males in Boonville?
There are 122.15 Females per 100 Males in Boonville.
What is the Median Population Age in Boonville?
Median Population Age in Boonville is 36.9 Years.
What is the Average Family Size in Boonville
Average Family Size in Boonville is 3.7 People.
What is the Average Household Size in Boonville
Average Household Size in Boonville is 2.5 People.
How Large is the Labor Force in Boonville?
There are 532 People in the Labor Forcein in Boonville.
What is the Percentage of People in the Labor Force in Boonville?
50.7% of People are in the Labor Force in Boonville.