Milton, NC Map & Demographics
Milton Map
Milton Overview
$59,969
PER CAPITA INCOME
0.65
INEQUALITY / GINI INDEX
147
TOTAL POPULATION
53
MALE POPULATION
94
FEMALE POPULATION
56.38
MALES / 100 FEMALES
177.36
FEMALES / 100 MALES
56.5
MEDIAN AGE
2.5
AVG FAMILY SIZE
2.0
AVG HOUSEHOLD SIZE
61
LABOR FORCE [ PEOPLE ]
47.3%
PERCENT IN LABOR FORCE
Milton Zip Codes
Milton Area Codes
Income in Milton
Income Overview in Milton
| Characteristic | Number | Measure |
| Per Capita Income | 147 | $59,969 |
| Median Family Income | 49 | $0 |
| Mean Family Income | 49 | $176,922 |
| Median Household Income | 72 | $0 |
| Mean Household Income | 72 | $129,819 |
| Income Deficit | 49 | $0 |
| Wage / Income Gap (%) | 147 | 0.00% |
| Wage / Income Gap ($) | 147 | 100.00¢ per $1 |
| Gini / Inequality Index | 147 | 0.65 |
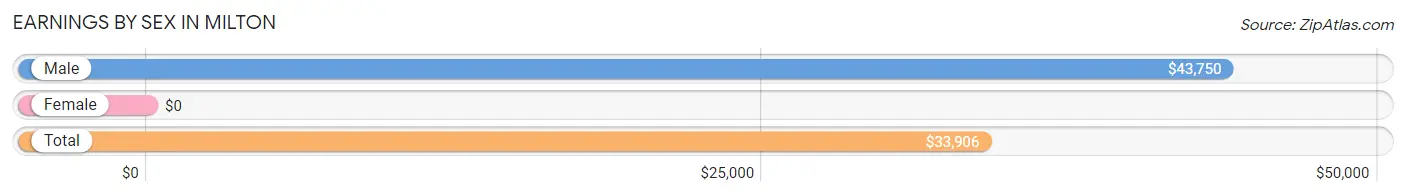
Earnings by Sex in Milton
| Sex | Number | Average Earnings |
| Male | 27 (42.9%) | $43,750 |
| Female | 36 (57.1%) | $0 |
| Total | 63 (100.0%) | $33,906 |
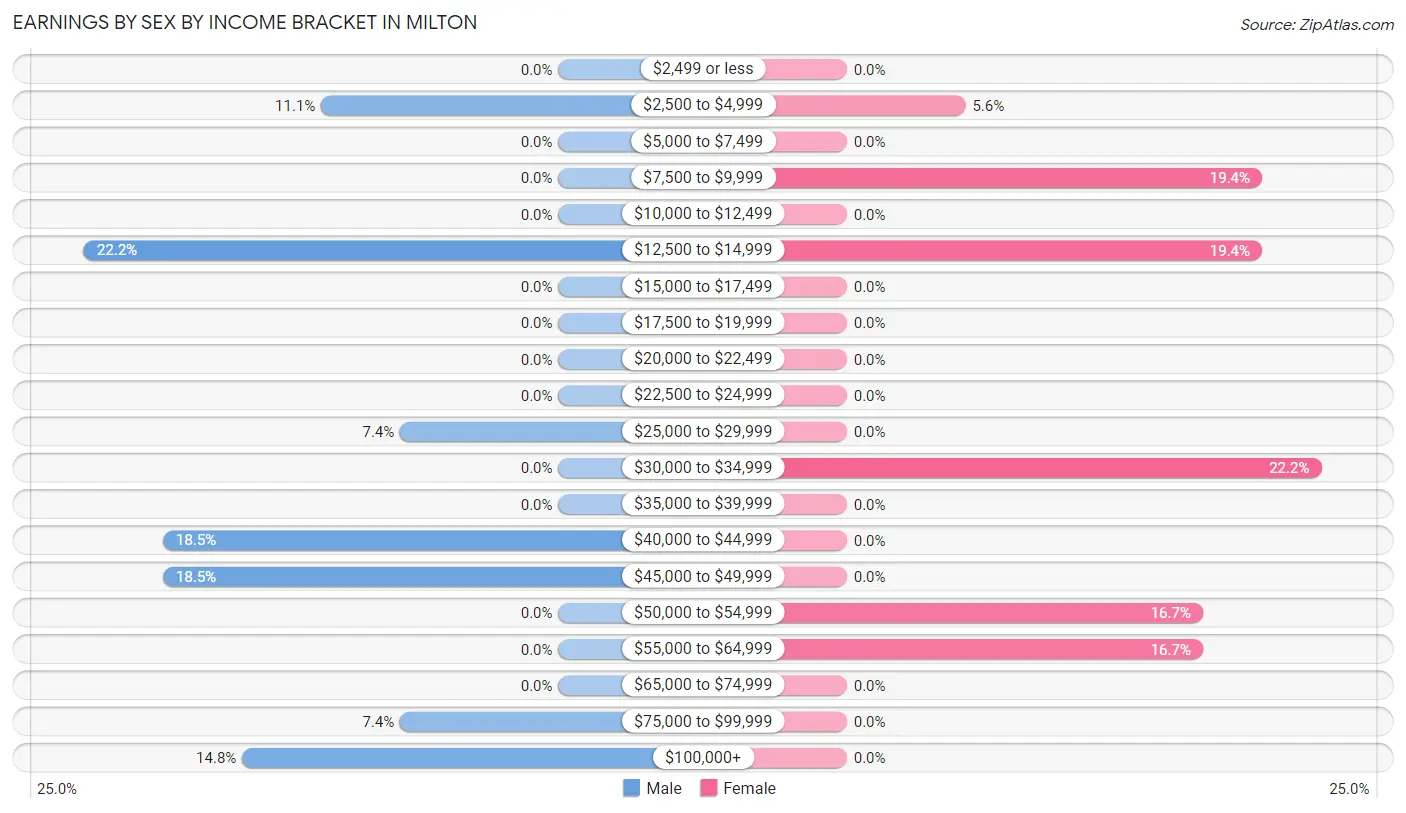
Earnings by Sex by Income Bracket in Milton
The most common earnings brackets in Milton are $12,500 to $14,999 for men (6 | 22.2%) and $30,000 to $34,999 for women (8 | 22.2%).
| Income | Male | Female |
| $2,499 or less | 0 (0.0%) | 0 (0.0%) |
| $2,500 to $4,999 | 3 (11.1%) | 2 (5.6%) |
| $5,000 to $7,499 | 0 (0.0%) | 0 (0.0%) |
| $7,500 to $9,999 | 0 (0.0%) | 7 (19.4%) |
| $10,000 to $12,499 | 0 (0.0%) | 0 (0.0%) |
| $12,500 to $14,999 | 6 (22.2%) | 7 (19.4%) |
| $15,000 to $17,499 | 0 (0.0%) | 0 (0.0%) |
| $17,500 to $19,999 | 0 (0.0%) | 0 (0.0%) |
| $20,000 to $22,499 | 0 (0.0%) | 0 (0.0%) |
| $22,500 to $24,999 | 0 (0.0%) | 0 (0.0%) |
| $25,000 to $29,999 | 2 (7.4%) | 0 (0.0%) |
| $30,000 to $34,999 | 0 (0.0%) | 8 (22.2%) |
| $35,000 to $39,999 | 0 (0.0%) | 0 (0.0%) |
| $40,000 to $44,999 | 5 (18.5%) | 0 (0.0%) |
| $45,000 to $49,999 | 5 (18.5%) | 0 (0.0%) |
| $50,000 to $54,999 | 0 (0.0%) | 6 (16.7%) |
| $55,000 to $64,999 | 0 (0.0%) | 6 (16.7%) |
| $65,000 to $74,999 | 0 (0.0%) | 0 (0.0%) |
| $75,000 to $99,999 | 2 (7.4%) | 0 (0.0%) |
| $100,000+ | 4 (14.8%) | 0 (0.0%) |
| Total | 27 (100.0%) | 36 (100.0%) |
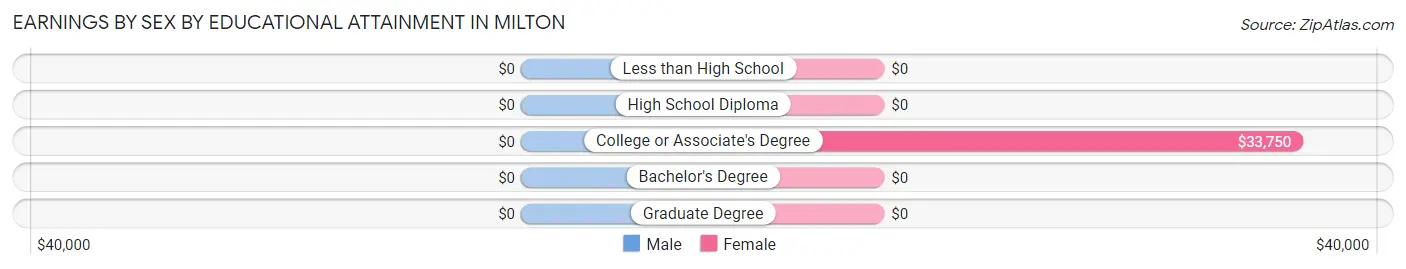
Earnings by Sex by Educational Attainment in Milton
| Educational Attainment | Male Income | Female Income |
| Less than High School | - | - |
| High School Diploma | - | - |
| College or Associate's Degree | - | - |
| Bachelor's Degree | - | - |
| Graduate Degree | - | - |
| Total | $43,750 | $0 |
Family Income in Milton
Family Income Brackets in Milton
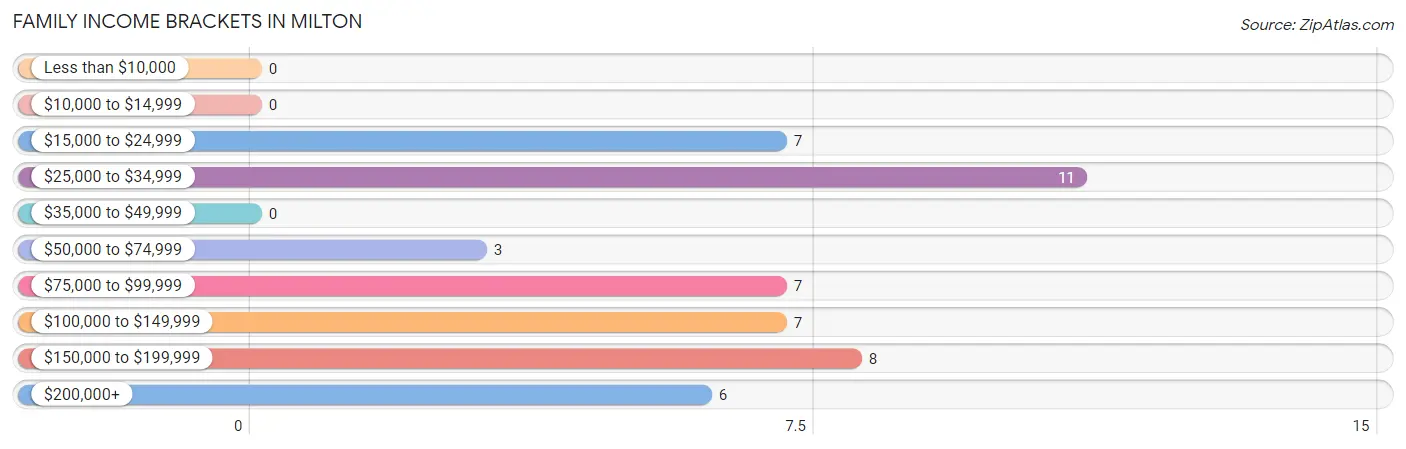
According to the Milton family income data, there are 11 families falling into the $25,000 to $34,999 income range, which is the most common income bracket and makes up 22.5% of all families.
| Income Bracket | # Families | % Families |
| Less than $10,000 | 0 | 0.0% |
| $10,000 to $14,999 | 0 | 0.0% |
| $15,000 to $24,999 | 7 | 14.3% |
| $25,000 to $34,999 | 11 | 22.4% |
| $35,000 to $49,999 | 0 | 0.0% |
| $50,000 to $74,999 | 3 | 6.1% |
| $75,000 to $99,999 | 7 | 14.3% |
| $100,000 to $149,999 | 7 | 14.3% |
| $150,000 to $199,999 | 8 | 16.3% |
| $200,000+ | 6 | 12.2% |
Family Income by Famaliy Size in Milton
| Income Bracket | # Families | Median Income |
| 2-Person Families | 35 (71.4%) | $0 |
| 3-Person Families | 1 (2.0%) | $0 |
| 4-Person Families | 0 (0.0%) | $0 |
| 5-Person Families | 13 (26.5%) | $0 |
| 6-Person Families | 0 (0.0%) | $0 |
| 7+ Person Families | 0 (0.0%) | $0 |
| Total | 49 (100.0%) | $0 |
Family Income by Number of Earners in Milton
| Number of Earners | # Families | Median Income |
| No Earners | 14 (28.6%) | $0 |
| 1 Earner | 17 (34.7%) | $0 |
| 2 Earners | 17 (34.7%) | $0 |
| 3+ Earners | 1 (2.0%) | $0 |
| Total | 49 (100.0%) | $0 |
Household Income in Milton
Household Income Brackets in Milton
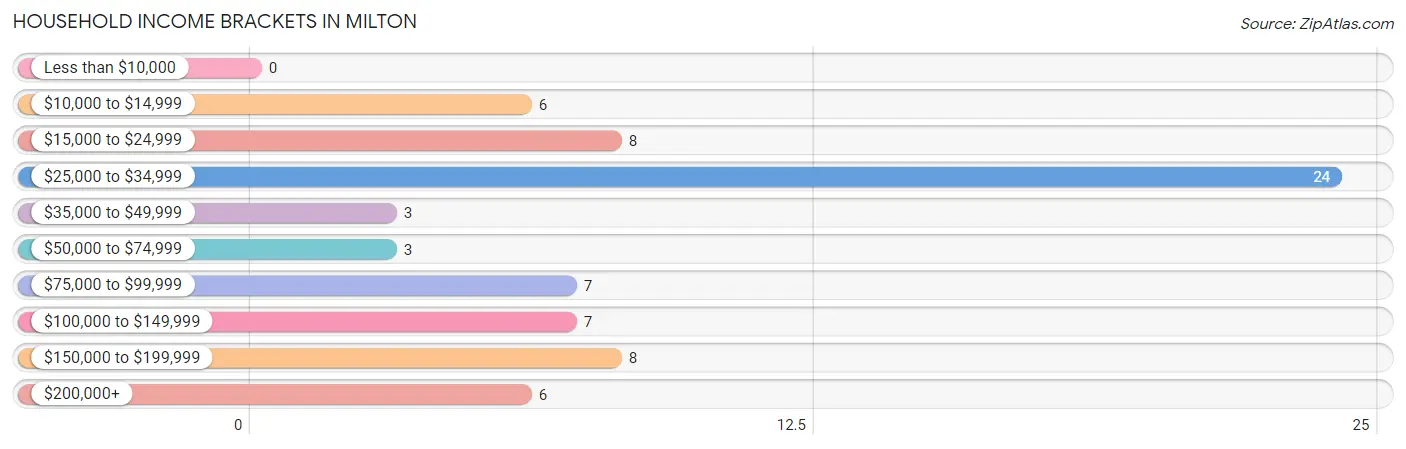
With 24 households falling in the category, the $25,000 to $34,999 income range is the most frequent in Milton, accounting for 33.3% of all households.
| Income Bracket | # Households | % Households |
| Less than $10,000 | 0 | 0.0% |
| $10,000 to $14,999 | 6 | 8.3% |
| $15,000 to $24,999 | 8 | 11.1% |
| $25,000 to $34,999 | 24 | 33.3% |
| $35,000 to $49,999 | 3 | 4.2% |
| $50,000 to $74,999 | 3 | 4.2% |
| $75,000 to $99,999 | 7 | 9.7% |
| $100,000 to $149,999 | 7 | 9.7% |
| $150,000 to $199,999 | 8 | 11.1% |
| $200,000+ | 6 | 8.3% |
Household Income by Householder Age in Milton
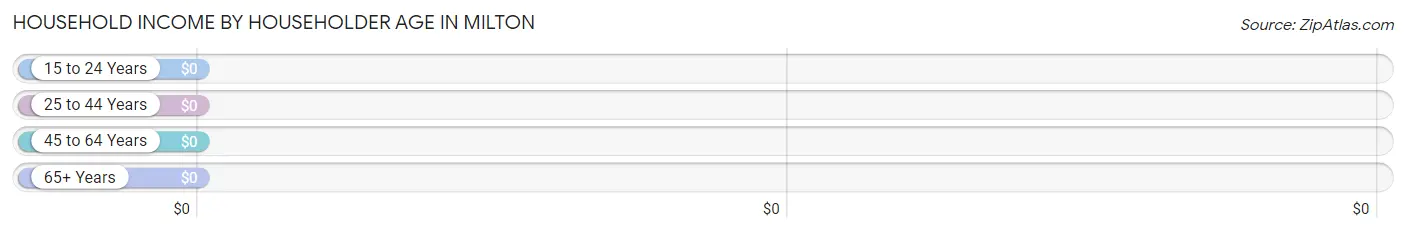
| Income Bracket | # Households | Median Income |
| 15 to 24 Years | 0 (0.0%) | $0 |
| 25 to 44 Years | 14 (19.4%) | $0 |
| 45 to 64 Years | 18 (25.0%) | $0 |
| 65+ Years | 40 (55.6%) | $0 |
| Total | 72 (100.0%) | $0 |
Poverty in Milton
Income Below Poverty by Sex and Age in Milton
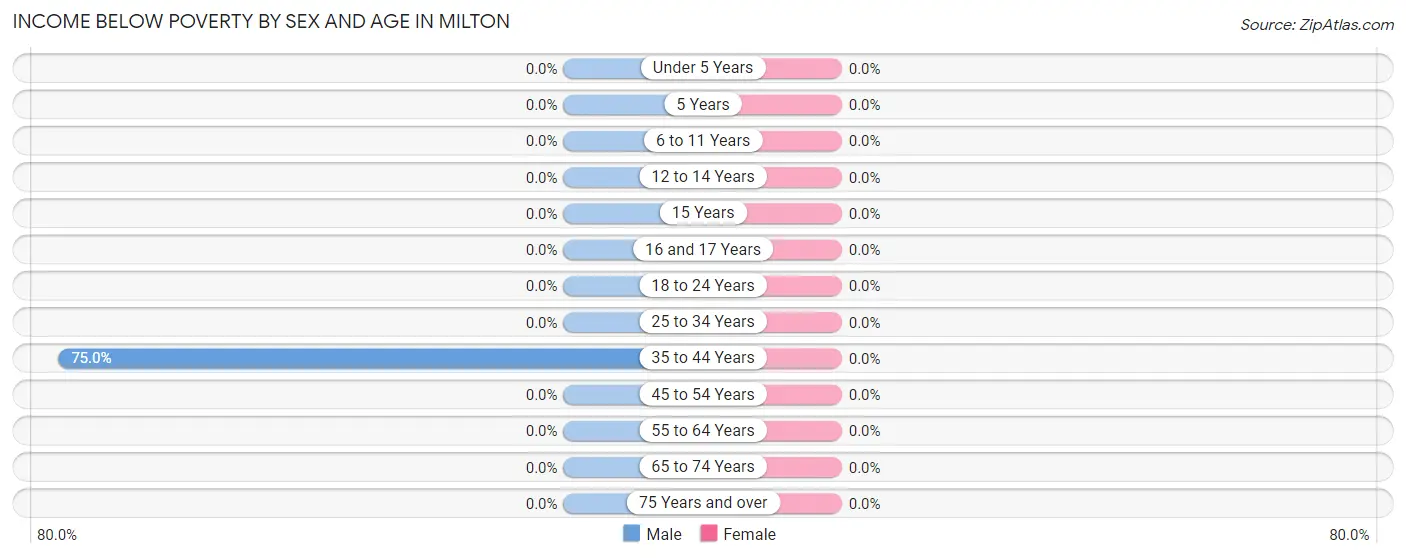
| Age Bracket | Male | Female |
| Under 5 Years | 0 (0.0%) | 0 (0.0%) |
| 5 Years | 0 (0.0%) | 0 (0.0%) |
| 6 to 11 Years | 0 (0.0%) | 0 (0.0%) |
| 12 to 14 Years | 0 (0.0%) | 0 (0.0%) |
| 15 Years | 0 (0.0%) | 0 (0.0%) |
| 16 and 17 Years | 0 (0.0%) | 0 (0.0%) |
| 18 to 24 Years | 0 (0.0%) | 0 (0.0%) |
| 25 to 34 Years | 0 (0.0%) | 0 (0.0%) |
| 35 to 44 Years | 6 (75.0%) | 0 (0.0%) |
| 45 to 54 Years | 0 (0.0%) | 0 (0.0%) |
| 55 to 64 Years | 0 (0.0%) | 0 (0.0%) |
| 65 to 74 Years | 0 (0.0%) | 0 (0.0%) |
| 75 Years and over | 0 (0.0%) | 0 (0.0%) |
| Total | 6 (11.3%) | 0 (0.0%) |
Income Above Poverty by Sex and Age in Milton
According to the poverty statistics in Milton, males aged under 5 years and females aged under 5 years are the age groups that are most secure financially, with 100.0% of males and 100.0% of females in these age groups living above the poverty line.
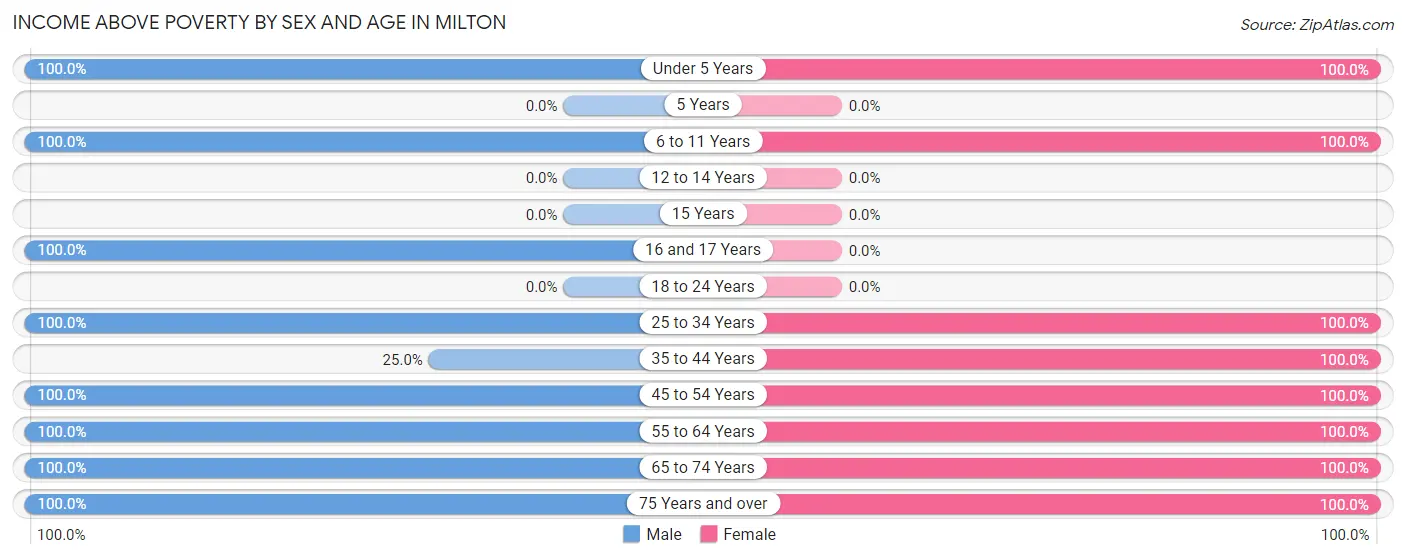
| Age Bracket | Male | Female |
| Under 5 Years | 4 (100.0%) | 6 (100.0%) |
| 5 Years | 0 (0.0%) | 0 (0.0%) |
| 6 to 11 Years | 4 (100.0%) | 4 (100.0%) |
| 12 to 14 Years | 0 (0.0%) | 0 (0.0%) |
| 15 Years | 0 (0.0%) | 0 (0.0%) |
| 16 and 17 Years | 4 (100.0%) | 0 (0.0%) |
| 18 to 24 Years | 0 (0.0%) | 0 (0.0%) |
| 25 to 34 Years | 7 (100.0%) | 13 (100.0%) |
| 35 to 44 Years | 2 (25.0%) | 6 (100.0%) |
| 45 to 54 Years | 2 (100.0%) | 14 (100.0%) |
| 55 to 64 Years | 10 (100.0%) | 8 (100.0%) |
| 65 to 74 Years | 4 (100.0%) | 16 (100.0%) |
| 75 Years and over | 10 (100.0%) | 27 (100.0%) |
| Total | 47 (88.7%) | 94 (100.0%) |
Income Below Poverty Among Married-Couple Families in Milton
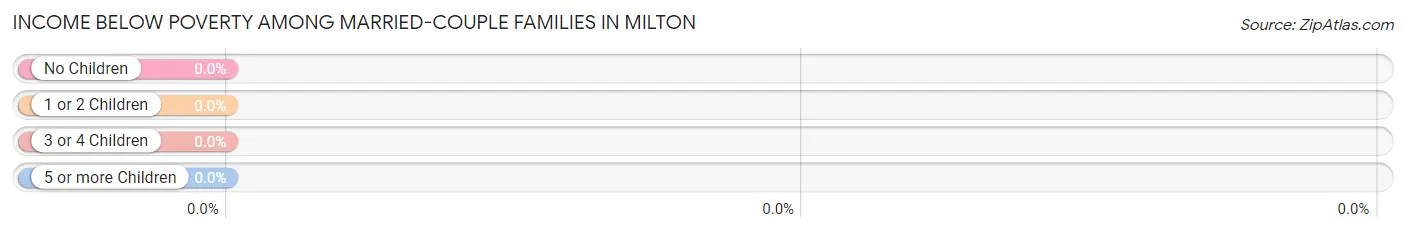
| Children | Above Poverty | Below Poverty |
| No Children | 22 (100.0%) | 0 (0.0%) |
| 1 or 2 Children | 7 (100.0%) | 0 (0.0%) |
| 3 or 4 Children | 6 (100.0%) | 0 (0.0%) |
| 5 or more Children | 0 (0.0%) | 0 (0.0%) |
| Total | 35 (100.0%) | 0 (0.0%) |
Income Below Poverty Among Single-Parent Households in Milton
| Children | Single Father | Single Mother |
| No Children | 0 (0.0%) | 0 (0.0%) |
| 1 or 2 Children | 0 (0.0%) | 0 (0.0%) |
| 3 or 4 Children | 0 (0.0%) | 0 (0.0%) |
| 5 or more Children | 0 (0.0%) | 0 (0.0%) |
| Total | 0 (0.0%) | 0 (0.0%) |
Income Below Poverty Among Married-Couple vs Single-Parent Households in Milton
| Children | Married-Couple Families | Single-Parent Households |
| No Children | 0 (0.0%) | 0 (0.0%) |
| 1 or 2 Children | 0 (0.0%) | 0 (0.0%) |
| 3 or 4 Children | 0 (0.0%) | 0 (0.0%) |
| 5 or more Children | 0 (0.0%) | 0 (0.0%) |
| Total | 0 (0.0%) | 0 (0.0%) |
Race in Milton
The most populous races in Milton are White / Caucasian (84 | 57.1%), Black / African American (57 | 38.8%), and Hispanic or Latino (6 | 4.1%).
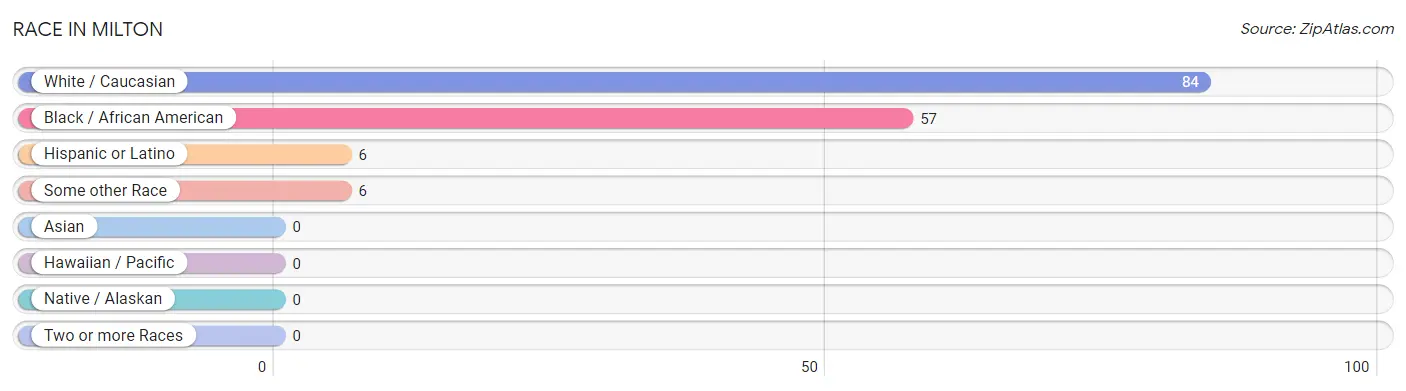
| Race | # Population | % Population |
| Asian | 0 | 0.0% |
| Black / African American | 57 | 38.8% |
| Hawaiian / Pacific | 0 | 0.0% |
| Hispanic or Latino | 6 | 4.1% |
| Native / Alaskan | 0 | 0.0% |
| White / Caucasian | 84 | 57.1% |
| Two or more Races | 0 | 0.0% |
| Some other Race | 6 | 4.1% |
| Total | 147 | 100.0% |
Ancestry in Milton
The most populous ancestries reported in Milton are English (51 | 34.7%), German (18 | 12.2%), Scottish (18 | 12.2%), French (7 | 4.8%), and European (6 | 4.1%), together accounting for 68.0% of all Milton residents.
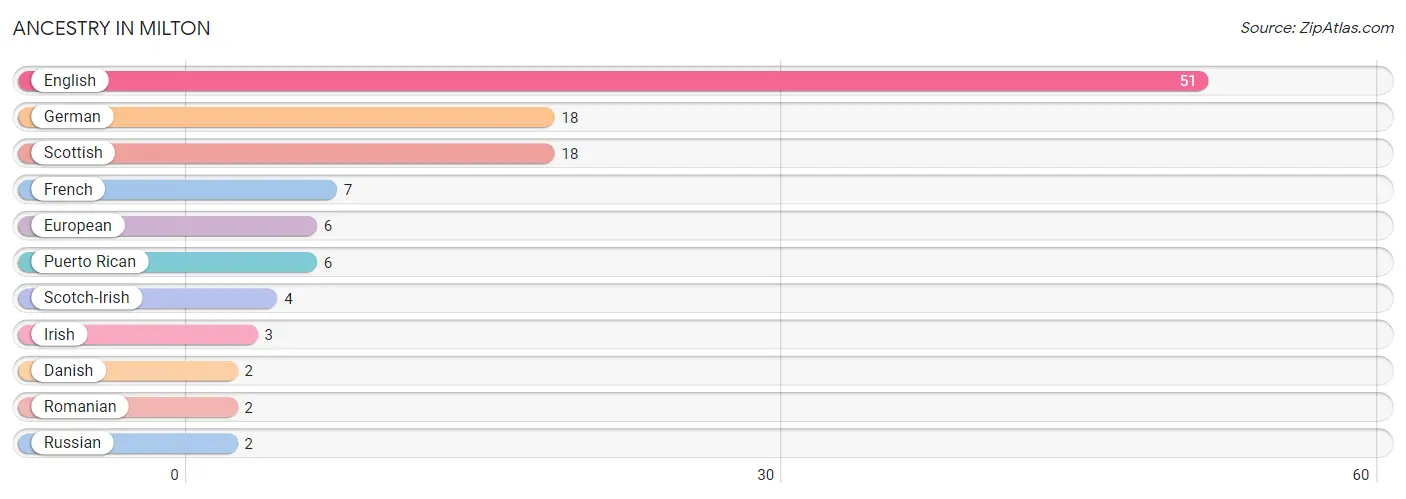
| Ancestry | # Population | % Population |
| Danish | 2 | 1.4% |
| English | 51 | 34.7% |
| European | 6 | 4.1% |
| French | 7 | 4.8% |
| German | 18 | 12.2% |
| Irish | 3 | 2.0% |
| Puerto Rican | 6 | 4.1% |
| Romanian | 2 | 1.4% |
| Russian | 2 | 1.4% |
| Scotch-Irish | 4 | 2.7% |
| Scottish | 18 | 12.2% | View All 11 Rows |
Immigrants in Milton

| Immigration Origin | # Population | % Population | View All 0 Rows |
Sex and Age in Milton
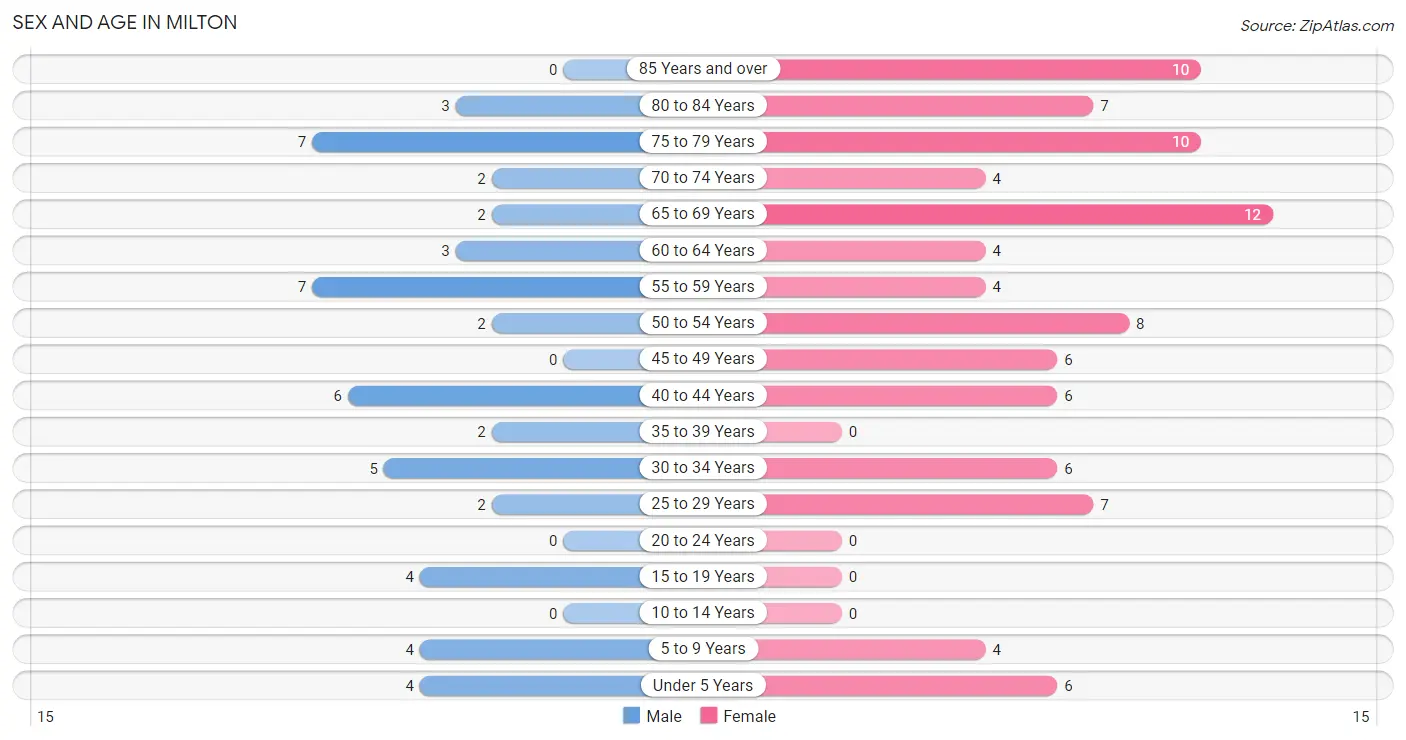
Sex and Age in Milton
The most populous age groups in Milton are 55 to 59 Years (7 | 13.2%) for men and 65 to 69 Years (12 | 12.8%) for women.
| Age Bracket | Male | Female |
| Under 5 Years | 4 (7.5%) | 6 (6.4%) |
| 5 to 9 Years | 4 (7.5%) | 4 (4.3%) |
| 10 to 14 Years | 0 (0.0%) | 0 (0.0%) |
| 15 to 19 Years | 4 (7.5%) | 0 (0.0%) |
| 20 to 24 Years | 0 (0.0%) | 0 (0.0%) |
| 25 to 29 Years | 2 (3.8%) | 7 (7.4%) |
| 30 to 34 Years | 5 (9.4%) | 6 (6.4%) |
| 35 to 39 Years | 2 (3.8%) | 0 (0.0%) |
| 40 to 44 Years | 6 (11.3%) | 6 (6.4%) |
| 45 to 49 Years | 0 (0.0%) | 6 (6.4%) |
| 50 to 54 Years | 2 (3.8%) | 8 (8.5%) |
| 55 to 59 Years | 7 (13.2%) | 4 (4.3%) |
| 60 to 64 Years | 3 (5.7%) | 4 (4.3%) |
| 65 to 69 Years | 2 (3.8%) | 12 (12.8%) |
| 70 to 74 Years | 2 (3.8%) | 4 (4.3%) |
| 75 to 79 Years | 7 (13.2%) | 10 (10.6%) |
| 80 to 84 Years | 3 (5.7%) | 7 (7.4%) |
| 85 Years and over | 0 (0.0%) | 10 (10.6%) |
| Total | 53 (100.0%) | 94 (100.0%) |
Families and Households in Milton
Median Family Size in Milton
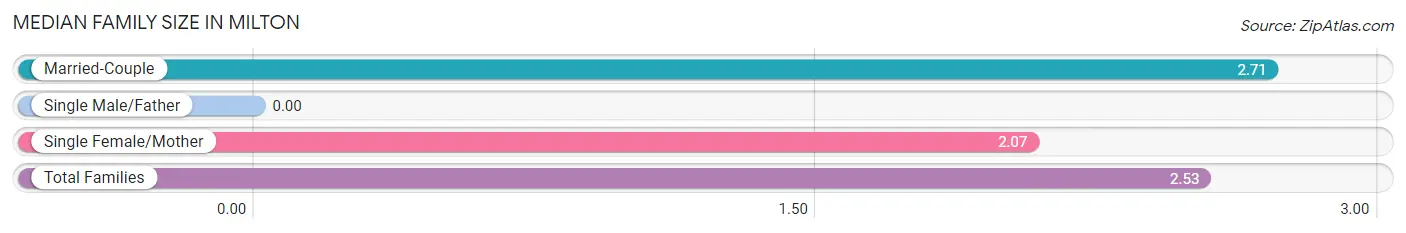
| Family Type | # Families | Family Size |
| Married-Couple | 35 (71.4%) | 2.71 |
| Single Male/Father | 0 (0.0%) | - |
| Single Female/Mother | 14 (28.6%) | 2.07 |
| Total Families | 49 (100.0%) | 2.53 |
Median Household Size in Milton
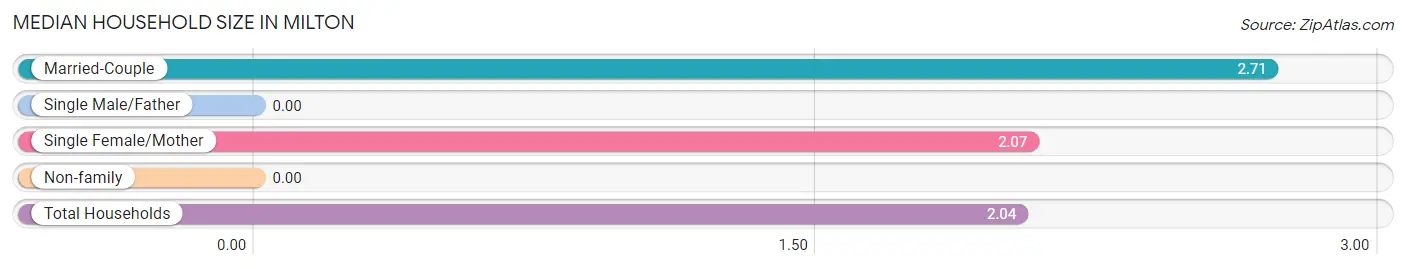
| Household Type | # Households | Household Size |
| Married-Couple | 35 (48.6%) | 2.71 |
| Single Male/Father | 0 (0.0%) | - |
| Single Female/Mother | 14 (19.4%) | 2.07 |
| Non-family | 23 (31.9%) | - |
| Total Households | 72 (100.0%) | 2.04 |
Household Size by Marriage Status in Milton
Out of a total of 72 households in Milton, 49 (68.1%) are family households, while 23 (31.9%) are nonfamily households. The most numerous type of family households are 2-person households, comprising 35, and the most common type of nonfamily households are 1-person households, comprising 23.
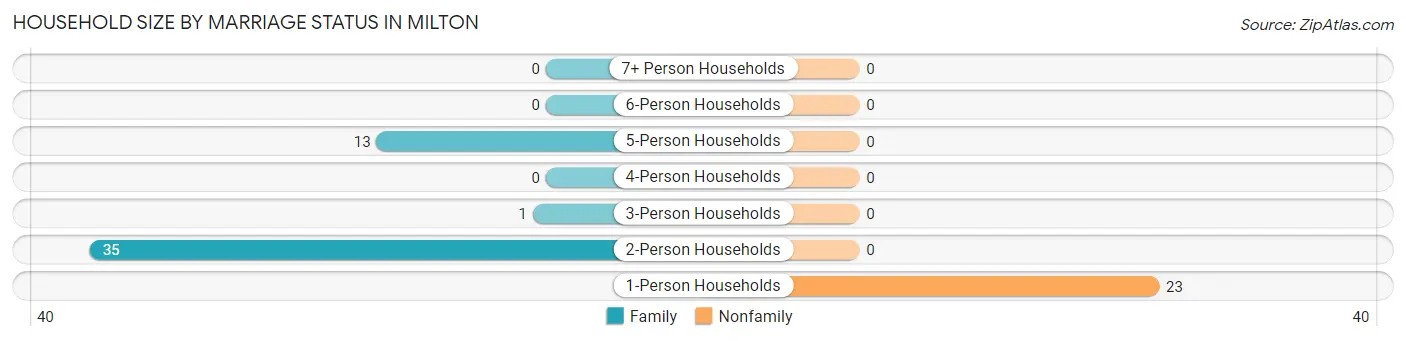
| Household Size | Family Households | Nonfamily Households |
| 1-Person Households | - | 23 (31.9%) |
| 2-Person Households | 35 (48.6%) | 0 (0.0%) |
| 3-Person Households | 1 (1.4%) | 0 (0.0%) |
| 4-Person Households | 0 (0.0%) | 0 (0.0%) |
| 5-Person Households | 13 (18.1%) | 0 (0.0%) |
| 6-Person Households | 0 (0.0%) | 0 (0.0%) |
| 7+ Person Households | 0 (0.0%) | 0 (0.0%) |
| Total | 49 (68.1%) | 23 (31.9%) |
Female Fertility in Milton
Fertility by Age in Milton
| Age Bracket | Women with Births | Births / 1,000 Women |
| 15 to 19 years | 0 (0.0%) | 0.0 |
| 20 to 34 years | 0 (0.0%) | 0.0 |
| 35 to 50 years | 0 (0.0%) | 0.0 |
| Total | 0 (0.0%) | 0.0 |
Fertility by Age by Marriage Status in Milton
| Age Bracket | Married | Unmarried |
| 15 to 19 years | 0 (0.0%) | 0 (0.0%) |
| 20 to 34 years | 0 (0.0%) | 0 (0.0%) |
| 35 to 50 years | 0 (0.0%) | 0 (0.0%) |
| Total | 0 (0.0%) | 0 (0.0%) |
Fertility by Education in Milton
| Educational Attainment | Women with Births | Births / 1,000 Women |
| Less than High School | 0 (0.0%) | 0.0 |
| High School Diploma | 0 (0.0%) | 0.0 |
| College or Associate's Degree | 0 (0.0%) | 0.0 |
| Bachelor's Degree | 0 (0.0%) | 0.0 |
| Graduate Degree | 0 (0.0%) | 0.0 |
| Total | 0 (0.0%) | 0.0 |
Fertility by Education by Marriage Status in Milton
| Educational Attainment | Married | Unmarried |
| Less than High School | 0 (0.0%) | 0 (0.0%) |
| High School Diploma | 0 (0.0%) | 0 (0.0%) |
| College or Associate's Degree | 0 (0.0%) | 0 (0.0%) |
| Bachelor's Degree | 0 (0.0%) | 0 (0.0%) |
| Graduate Degree | 0 (0.0%) | 0 (0.0%) |
| Total | 0 (0.0%) | 0 (0.0%) |
Employment Characteristics in Milton
Employment by Class of Employer in Milton
Among the 53 employed individuals in Milton, private company employees (39 | 73.6%), and state government employees (14 | 26.4%) make up the most common classes of employment.
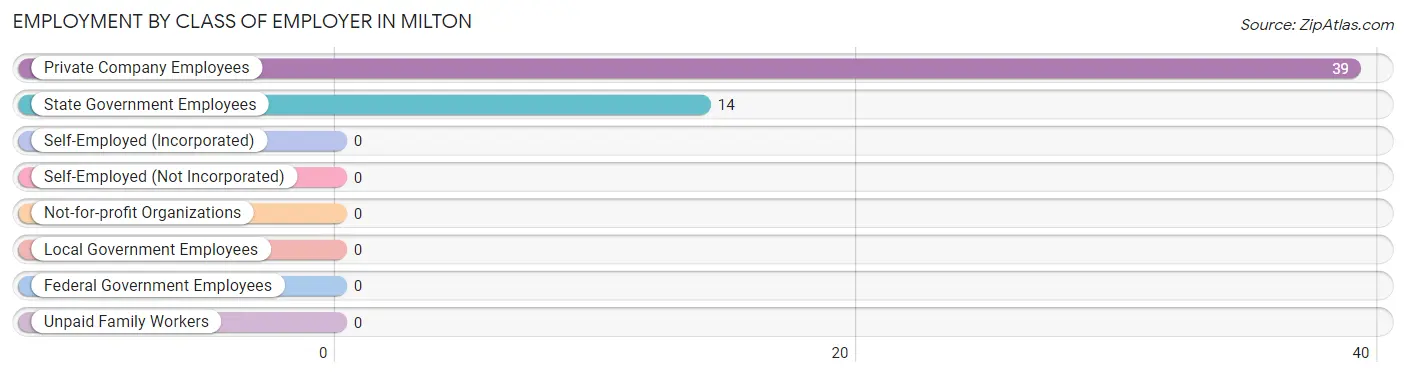
| Employer Class | # Employees | % Employees |
| Private Company Employees | 39 | 73.6% |
| Self-Employed (Incorporated) | 0 | 0.0% |
| Self-Employed (Not Incorporated) | 0 | 0.0% |
| Not-for-profit Organizations | 0 | 0.0% |
| Local Government Employees | 0 | 0.0% |
| State Government Employees | 14 | 26.4% |
| Federal Government Employees | 0 | 0.0% |
| Unpaid Family Workers | 0 | 0.0% |
| Total | 53 | 100.0% |
Employment Status by Age in Milton
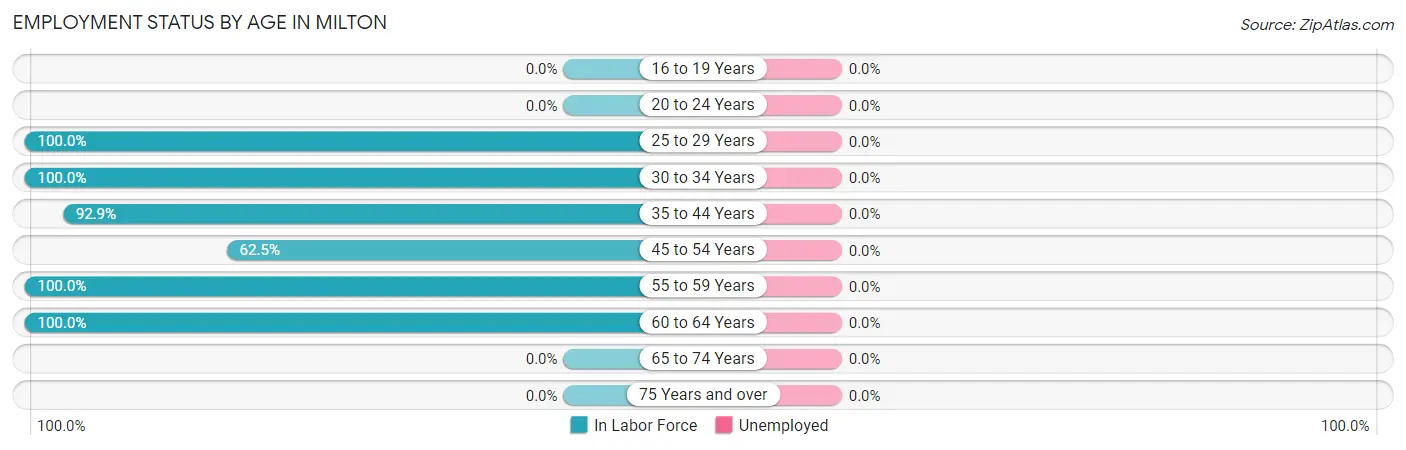
| Age Bracket | In Labor Force | Unemployed |
| 16 to 19 Years | 0 (0.0%) | 0 (0.0%) |
| 20 to 24 Years | 0 (0.0%) | 0 (0.0%) |
| 25 to 29 Years | 9 (100.0%) | 0 (0.0%) |
| 30 to 34 Years | 11 (100.0%) | 0 (0.0%) |
| 35 to 44 Years | 13 (92.9%) | 0 (0.0%) |
| 45 to 54 Years | 10 (62.5%) | 0 (0.0%) |
| 55 to 59 Years | 11 (100.0%) | 0 (0.0%) |
| 60 to 64 Years | 7 (100.0%) | 0 (0.0%) |
| 65 to 74 Years | 0 (0.0%) | 0 (0.0%) |
| 75 Years and over | 0 (0.0%) | 0 (0.0%) |
| Total | 61 (47.3%) | 0 (0.0%) |
Employment Status by Educational Attainment in Milton
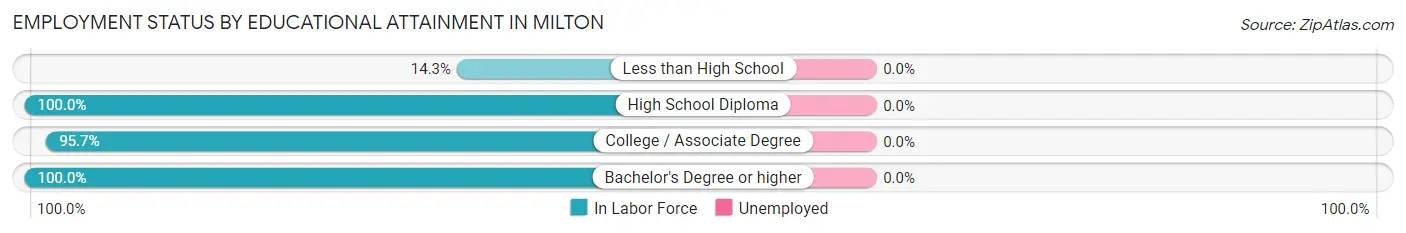
| Educational Attainment | In Labor Force | Unemployed |
| Less than High School | 1 (14.3%) | 0 (0.0%) |
| High School Diploma | 24 (100.0%) | 0 (0.0%) |
| College / Associate Degree | 22 (95.7%) | 0 (0.0%) |
| Bachelor's Degree or higher | 14 (100.0%) | 0 (0.0%) |
| Total | 61 (89.7%) | 0 (0.0%) |
Employment Occupations by Sex in Milton
Management, Business, Science and Arts Occupations
The most common Management, Business, Science and Arts occupations in Milton are Computers, Engineering & Science (6 | 9.8%), Community & Social Service (6 | 9.8%), Education Instruction & Library (6 | 9.8%), Management (4 | 6.6%), and Architecture & Engineering (4 | 6.6%).
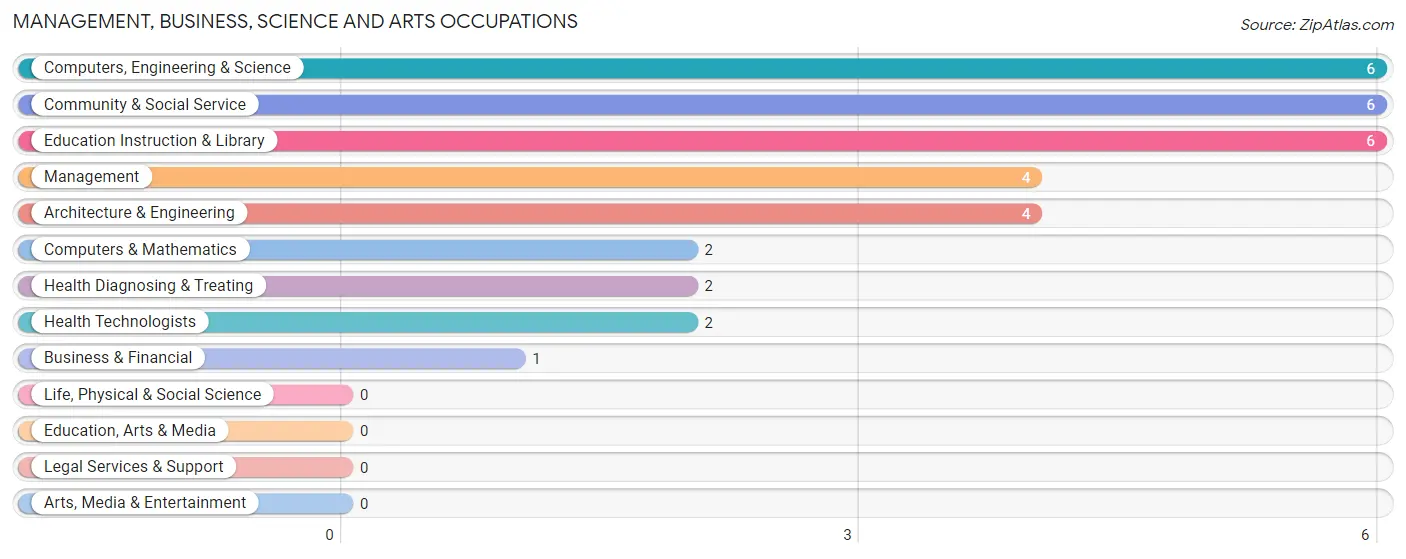
Management, Business, Science and Arts Occupations by Sex
Within the Management, Business, Science and Arts occupations in Milton, the most male-oriented occupations are Computers, Engineering & Science (100.0%), Computers & Mathematics (100.0%), and Architecture & Engineering (100.0%), while the most female-oriented occupations are Management (100.0%), Business & Financial (100.0%), and Community & Social Service (100.0%).
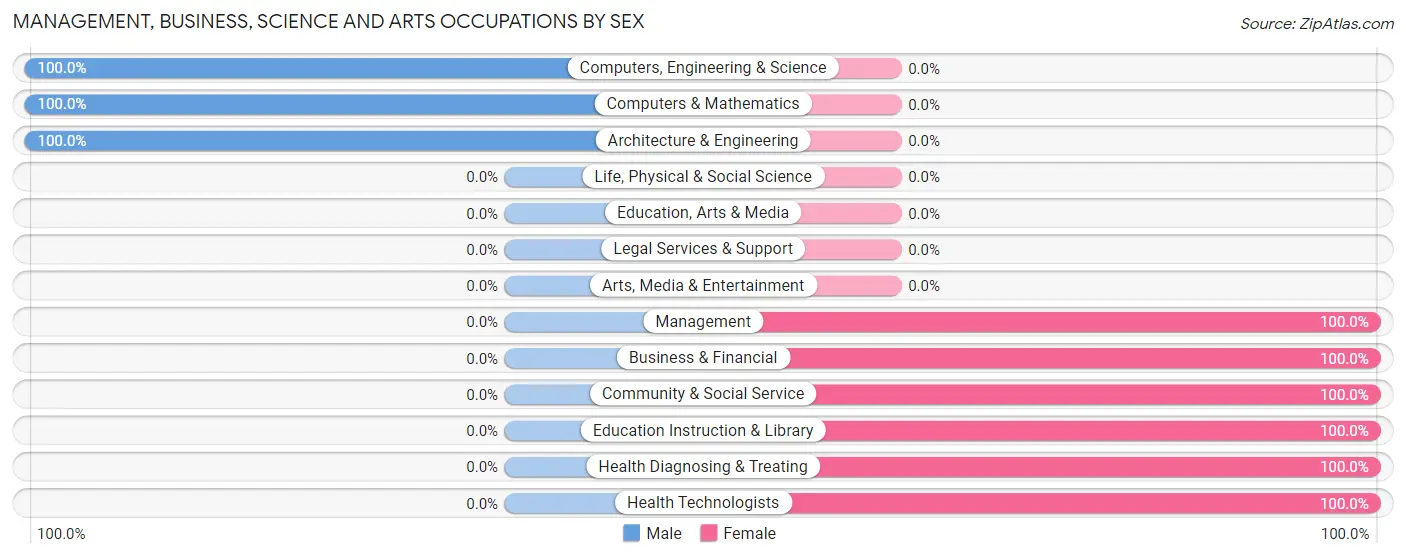
| Occupation | Male | Female |
| Management | 0 (0.0%) | 4 (100.0%) |
| Business & Financial | 0 (0.0%) | 1 (100.0%) |
| Computers, Engineering & Science | 6 (100.0%) | 0 (0.0%) |
| Computers & Mathematics | 2 (100.0%) | 0 (0.0%) |
| Architecture & Engineering | 4 (100.0%) | 0 (0.0%) |
| Life, Physical & Social Science | 0 (0.0%) | 0 (0.0%) |
| Community & Social Service | 0 (0.0%) | 6 (100.0%) |
| Education, Arts & Media | 0 (0.0%) | 0 (0.0%) |
| Legal Services & Support | 0 (0.0%) | 0 (0.0%) |
| Education Instruction & Library | 0 (0.0%) | 6 (100.0%) |
| Arts, Media & Entertainment | 0 (0.0%) | 0 (0.0%) |
| Health Diagnosing & Treating | 0 (0.0%) | 2 (100.0%) |
| Health Technologists | 0 (0.0%) | 2 (100.0%) |
| Total (Category) | 6 (31.6%) | 13 (68.4%) |
| Total (Overall) | 27 (44.3%) | 34 (55.7%) |
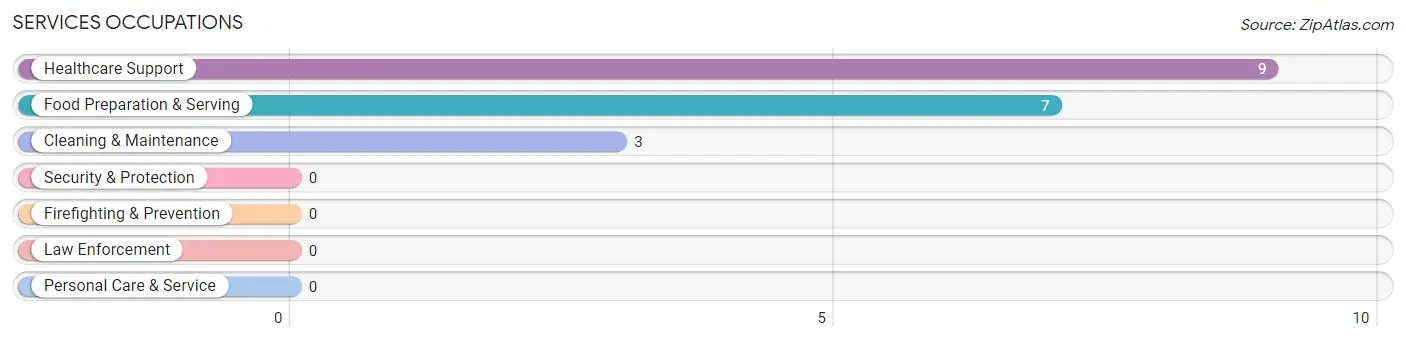
Services Occupations
The most common Services occupations in Milton are Healthcare Support (9 | 14.7%), Food Preparation & Serving (7 | 11.5%), and Cleaning & Maintenance (3 | 4.9%).
Services Occupations by Sex
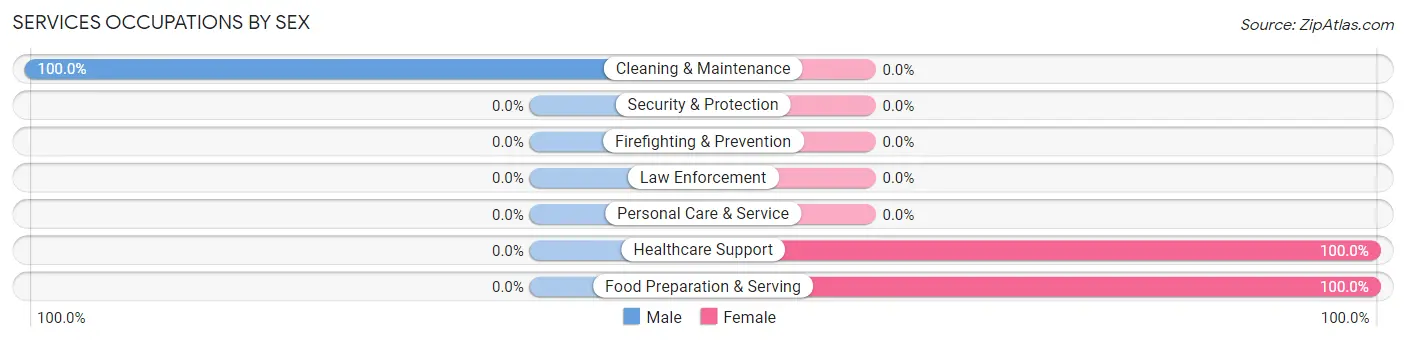
| Occupation | Male | Female |
| Healthcare Support | 0 (0.0%) | 9 (100.0%) |
| Security & Protection | 0 (0.0%) | 0 (0.0%) |
| Firefighting & Prevention | 0 (0.0%) | 0 (0.0%) |
| Law Enforcement | 0 (0.0%) | 0 (0.0%) |
| Food Preparation & Serving | 0 (0.0%) | 7 (100.0%) |
| Cleaning & Maintenance | 3 (100.0%) | 0 (0.0%) |
| Personal Care & Service | 0 (0.0%) | 0 (0.0%) |
| Total (Category) | 3 (15.8%) | 16 (84.2%) |
| Total (Overall) | 27 (44.3%) | 34 (55.7%) |
Sales and Office Occupations
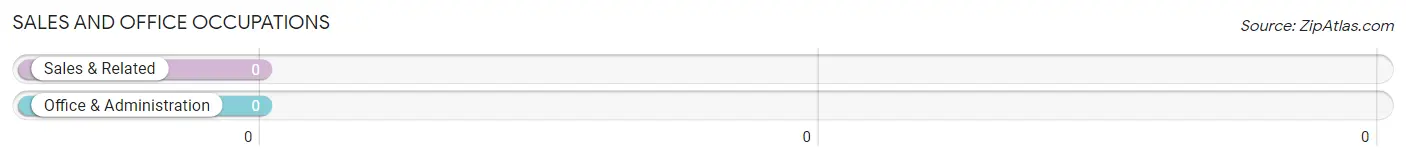
Sales and Office Occupations by Sex
| Occupation | Male | Female |
| Sales & Related | 0 (0.0%) | 0 (0.0%) |
| Office & Administration | 0 (0.0%) | 0 (0.0%) |
| Total (Category) | 0 (0.0%) | 0 (0.0%) |
| Total (Overall) | 27 (44.3%) | 34 (55.7%) |
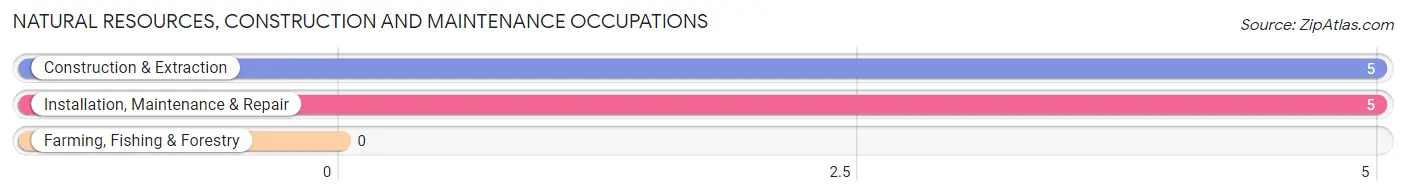
Natural Resources, Construction and Maintenance Occupations
The most common Natural Resources, Construction and Maintenance occupations in Milton are Construction & Extraction (5 | 8.2%), and Installation, Maintenance & Repair (5 | 8.2%).
Natural Resources, Construction and Maintenance Occupations by Sex
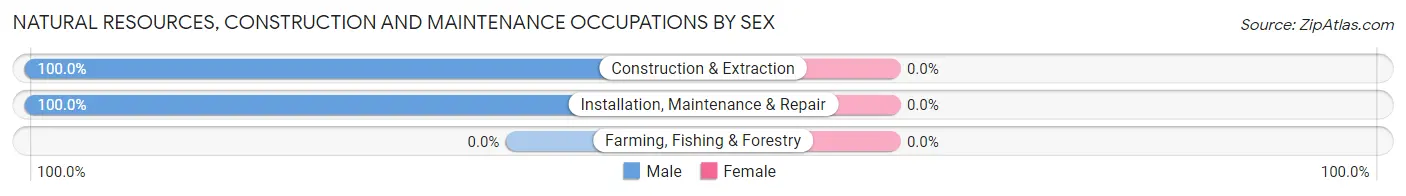
| Occupation | Male | Female |
| Farming, Fishing & Forestry | 0 (0.0%) | 0 (0.0%) |
| Construction & Extraction | 5 (100.0%) | 0 (0.0%) |
| Installation, Maintenance & Repair | 5 (100.0%) | 0 (0.0%) |
| Total (Category) | 10 (100.0%) | 0 (0.0%) |
| Total (Overall) | 27 (44.3%) | 34 (55.7%) |
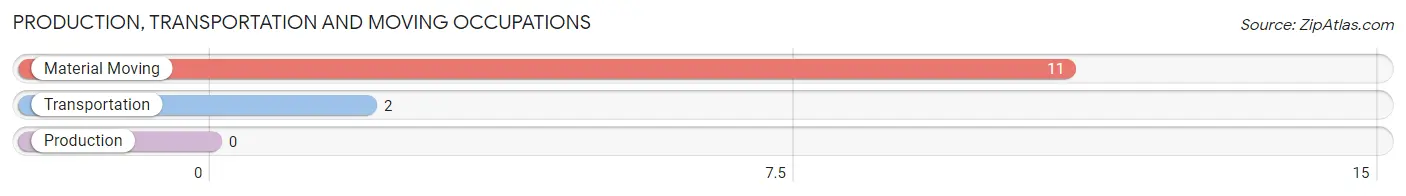
Production, Transportation and Moving Occupations
The most common Production, Transportation and Moving occupations in Milton are Material Moving (11 | 18.0%), and Transportation (2 | 3.3%).
Production, Transportation and Moving Occupations by Sex
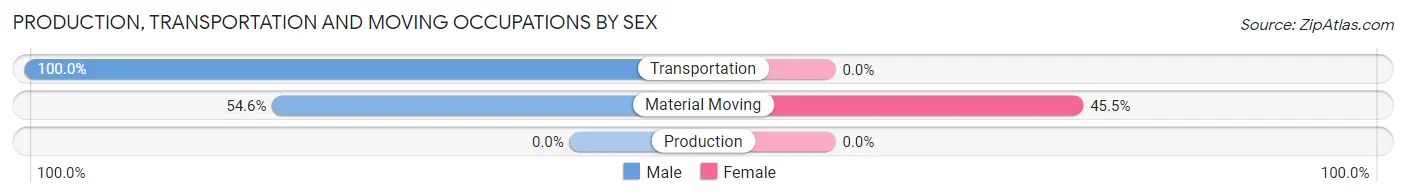
| Occupation | Male | Female |
| Production | 0 (0.0%) | 0 (0.0%) |
| Transportation | 2 (100.0%) | 0 (0.0%) |
| Material Moving | 6 (54.5%) | 5 (45.5%) |
| Total (Category) | 8 (61.5%) | 5 (38.5%) |
| Total (Overall) | 27 (44.3%) | 34 (55.7%) |
Employment Industries by Sex in Milton
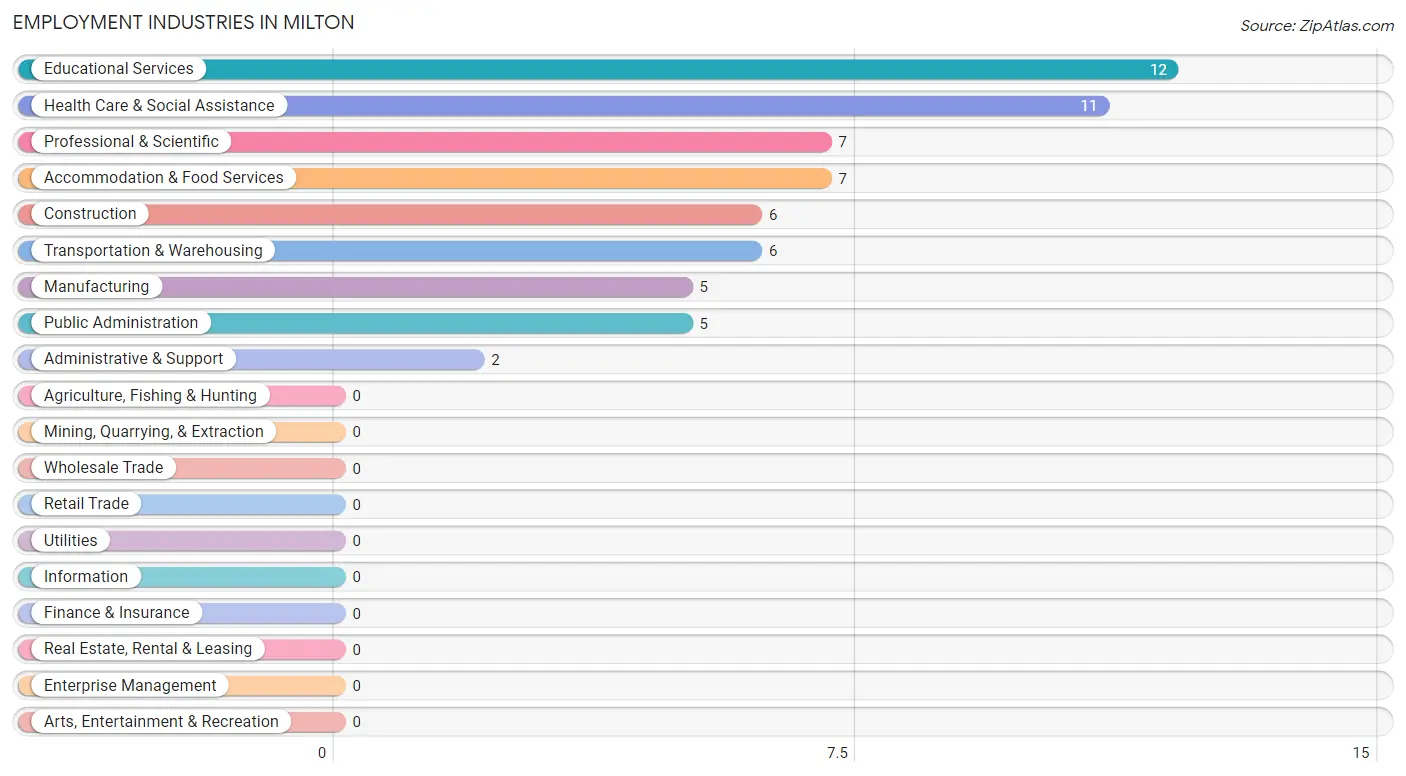
Employment Industries in Milton
The major employment industries in Milton include Educational Services (12 | 19.7%), Health Care & Social Assistance (11 | 18.0%), Professional & Scientific (7 | 11.5%), Accommodation & Food Services (7 | 11.5%), and Construction (6 | 9.8%).
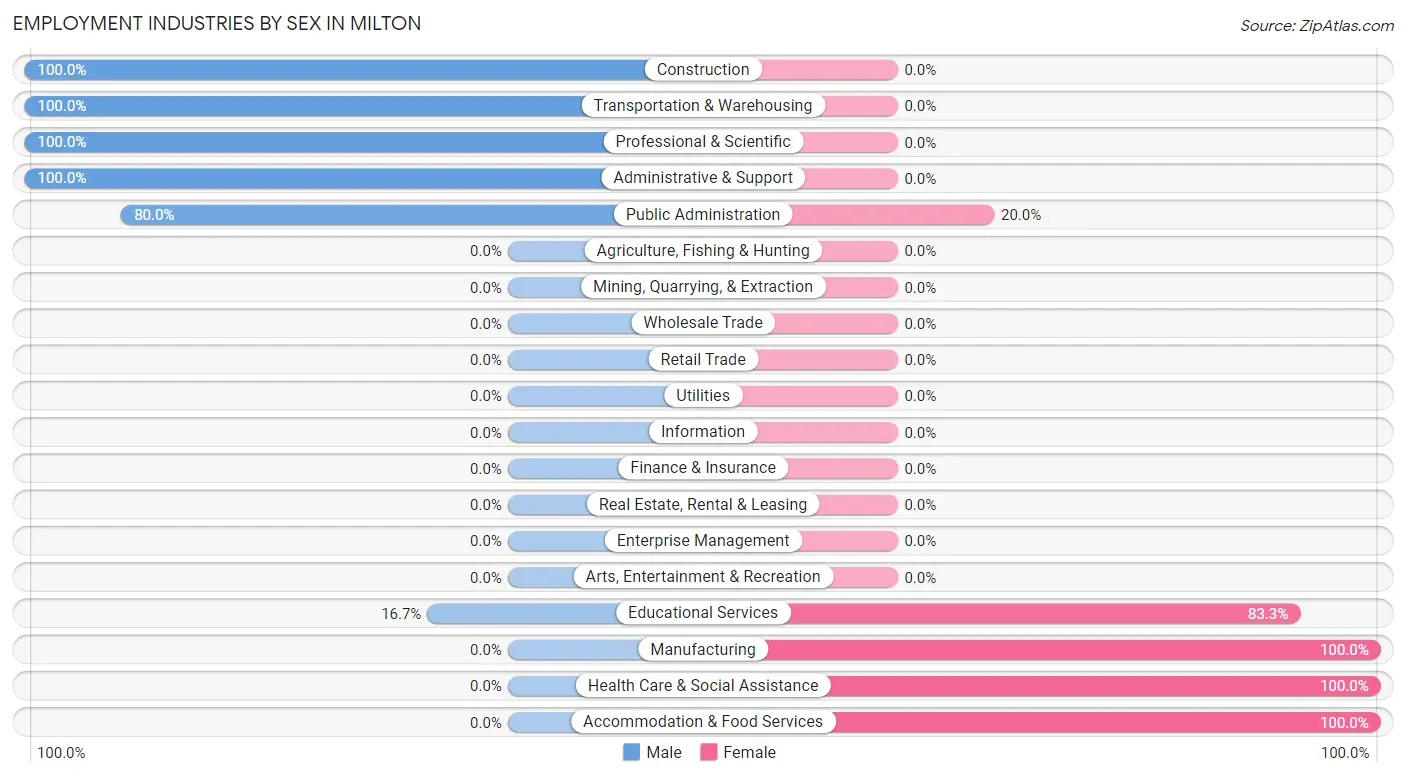
Employment Industries by Sex in Milton
The Milton industries that see more men than women are Construction (100.0%), Transportation & Warehousing (100.0%), and Professional & Scientific (100.0%), whereas the industries that tend to have a higher number of women are Manufacturing (100.0%), Health Care & Social Assistance (100.0%), and Accommodation & Food Services (100.0%).
| Industry | Male | Female |
| Agriculture, Fishing & Hunting | 0 (0.0%) | 0 (0.0%) |
| Mining, Quarrying, & Extraction | 0 (0.0%) | 0 (0.0%) |
| Construction | 6 (100.0%) | 0 (0.0%) |
| Manufacturing | 0 (0.0%) | 5 (100.0%) |
| Wholesale Trade | 0 (0.0%) | 0 (0.0%) |
| Retail Trade | 0 (0.0%) | 0 (0.0%) |
| Transportation & Warehousing | 6 (100.0%) | 0 (0.0%) |
| Utilities | 0 (0.0%) | 0 (0.0%) |
| Information | 0 (0.0%) | 0 (0.0%) |
| Finance & Insurance | 0 (0.0%) | 0 (0.0%) |
| Real Estate, Rental & Leasing | 0 (0.0%) | 0 (0.0%) |
| Professional & Scientific | 7 (100.0%) | 0 (0.0%) |
| Enterprise Management | 0 (0.0%) | 0 (0.0%) |
| Administrative & Support | 2 (100.0%) | 0 (0.0%) |
| Educational Services | 2 (16.7%) | 10 (83.3%) |
| Health Care & Social Assistance | 0 (0.0%) | 11 (100.0%) |
| Arts, Entertainment & Recreation | 0 (0.0%) | 0 (0.0%) |
| Accommodation & Food Services | 0 (0.0%) | 7 (100.0%) |
| Public Administration | 4 (80.0%) | 1 (20.0%) |
| Total | 27 (44.3%) | 34 (55.7%) |
Education in Milton
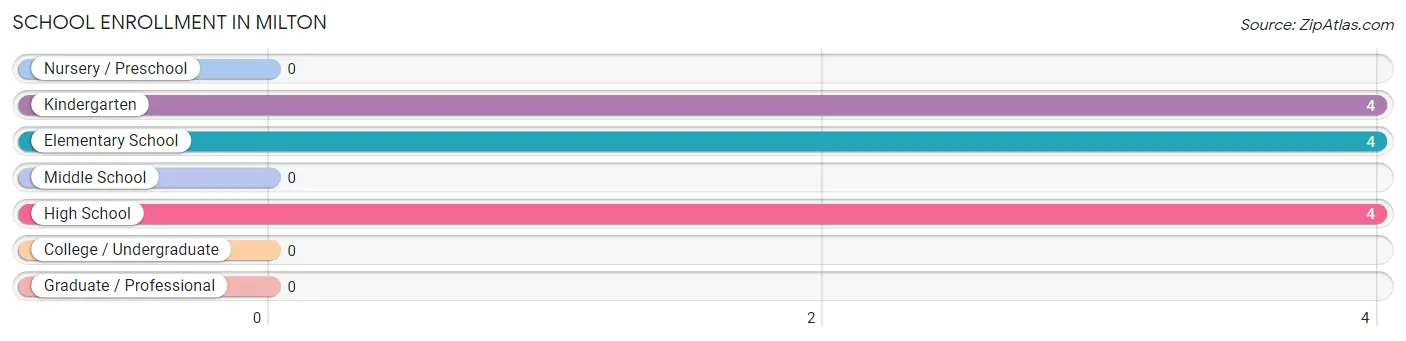
School Enrollment in Milton
The most common levels of schooling among the 12 students in Milton are kindergarten (4 | 33.3%), elementary school (4 | 33.3%), and high school (4 | 33.3%).
| School Level | # Students | % Students |
| Nursery / Preschool | 0 | 0.0% |
| Kindergarten | 4 | 33.3% |
| Elementary School | 4 | 33.3% |
| Middle School | 0 | 0.0% |
| High School | 4 | 33.3% |
| College / Undergraduate | 0 | 0.0% |
| Graduate / Professional | 0 | 0.0% |
| Total | 12 | 100.0% |
School Enrollment by Age by Funding Source in Milton
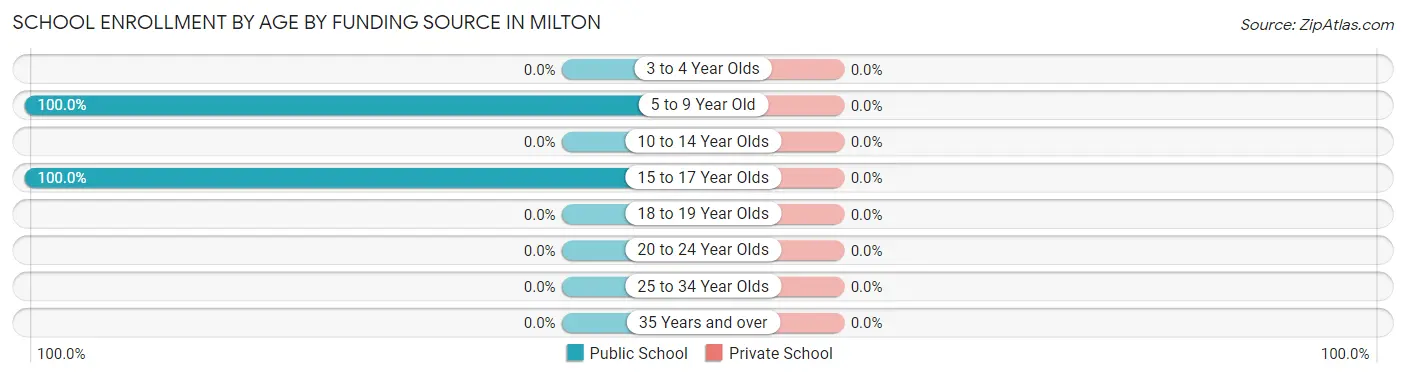
| Age Bracket | Public School | Private School |
| 3 to 4 Year Olds | 0 (0.0%) | 0 (0.0%) |
| 5 to 9 Year Old | 8 (100.0%) | 0 (0.0%) |
| 10 to 14 Year Olds | 0 (0.0%) | 0 (0.0%) |
| 15 to 17 Year Olds | 4 (100.0%) | 0 (0.0%) |
| 18 to 19 Year Olds | 0 (0.0%) | 0 (0.0%) |
| 20 to 24 Year Olds | 0 (0.0%) | 0 (0.0%) |
| 25 to 34 Year Olds | 0 (0.0%) | 0 (0.0%) |
| 35 Years and over | 0 (0.0%) | 0 (0.0%) |
| Total | 12 (100.0%) | 0 (0.0%) |
Educational Attainment by Field of Study in Milton
Education (9 | 33.3%), literature & languages (7 | 25.9%), science & technology (6 | 22.2%), and business (5 | 18.5%) are the most common fields of study among 27 individuals in Milton who have obtained a bachelor's degree or higher.
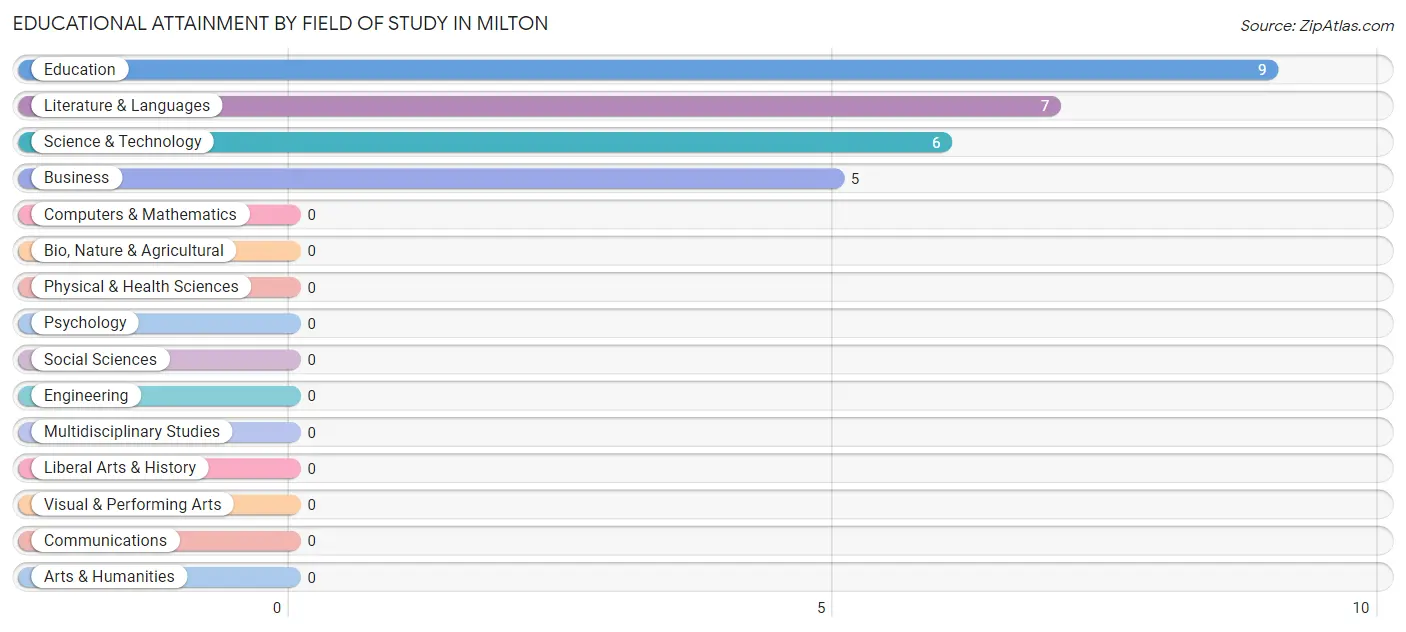
| Field of Study | # Graduates | % Graduates |
| Computers & Mathematics | 0 | 0.0% |
| Bio, Nature & Agricultural | 0 | 0.0% |
| Physical & Health Sciences | 0 | 0.0% |
| Psychology | 0 | 0.0% |
| Social Sciences | 0 | 0.0% |
| Engineering | 0 | 0.0% |
| Multidisciplinary Studies | 0 | 0.0% |
| Science & Technology | 6 | 22.2% |
| Business | 5 | 18.5% |
| Education | 9 | 33.3% |
| Literature & Languages | 7 | 25.9% |
| Liberal Arts & History | 0 | 0.0% |
| Visual & Performing Arts | 0 | 0.0% |
| Communications | 0 | 0.0% |
| Arts & Humanities | 0 | 0.0% |
| Total | 27 | 100.0% |
Transportation & Commute in Milton
Vehicle Availability by Sex in Milton
The most prevalent vehicle ownership categories in Milton are males with 1 vehicle (8, accounting for 34.8%) and females with 1 vehicle (0, making up 26.7%).
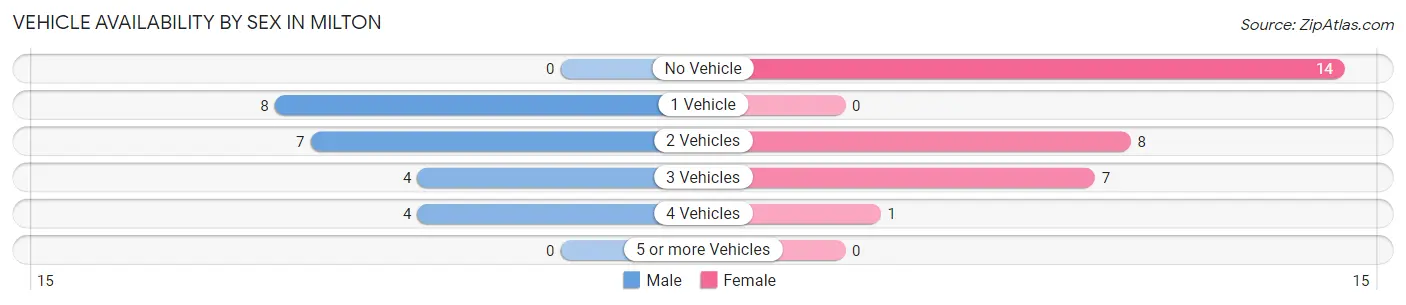
| Vehicles Available | Male | Female |
| No Vehicle | 0 (0.0%) | 14 (46.7%) |
| 1 Vehicle | 8 (34.8%) | 0 (0.0%) |
| 2 Vehicles | 7 (30.4%) | 8 (26.7%) |
| 3 Vehicles | 4 (17.4%) | 7 (23.3%) |
| 4 Vehicles | 4 (17.4%) | 1 (3.3%) |
| 5 or more Vehicles | 0 (0.0%) | 0 (0.0%) |
| Total | 23 (100.0%) | 30 (100.0%) |
Commute Time in Milton
The most frequently occuring commute durations in Milton are 20 to 24 minutes (16 commuters, 31.4%), 30 to 34 minutes (9 commuters, 17.6%), and 5 to 9 minutes (7 commuters, 13.7%).
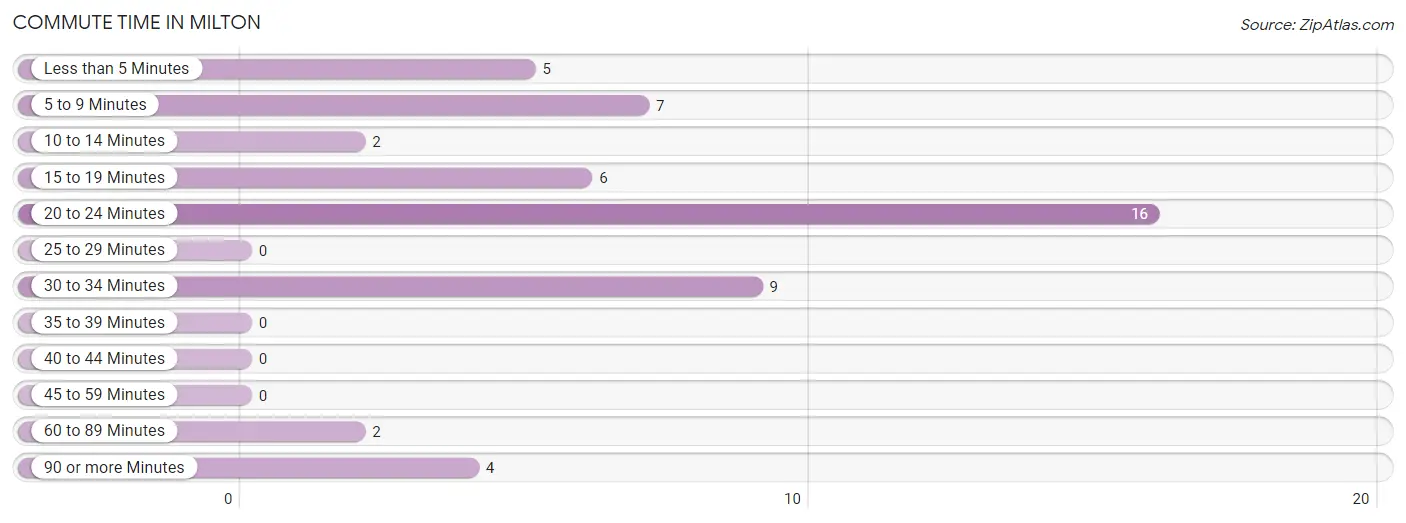
| Commute Time | # Commuters | % Commuters |
| Less than 5 Minutes | 5 | 9.8% |
| 5 to 9 Minutes | 7 | 13.7% |
| 10 to 14 Minutes | 2 | 3.9% |
| 15 to 19 Minutes | 6 | 11.8% |
| 20 to 24 Minutes | 16 | 31.4% |
| 25 to 29 Minutes | 0 | 0.0% |
| 30 to 34 Minutes | 9 | 17.6% |
| 35 to 39 Minutes | 0 | 0.0% |
| 40 to 44 Minutes | 0 | 0.0% |
| 45 to 59 Minutes | 0 | 0.0% |
| 60 to 89 Minutes | 2 | 3.9% |
| 90 or more Minutes | 4 | 7.8% |
Commute Time by Sex in Milton
The most common commute times in Milton are 30 to 34 minutes (8 commuters, 38.1%) for males and 20 to 24 minutes (16 commuters, 53.3%) for females.
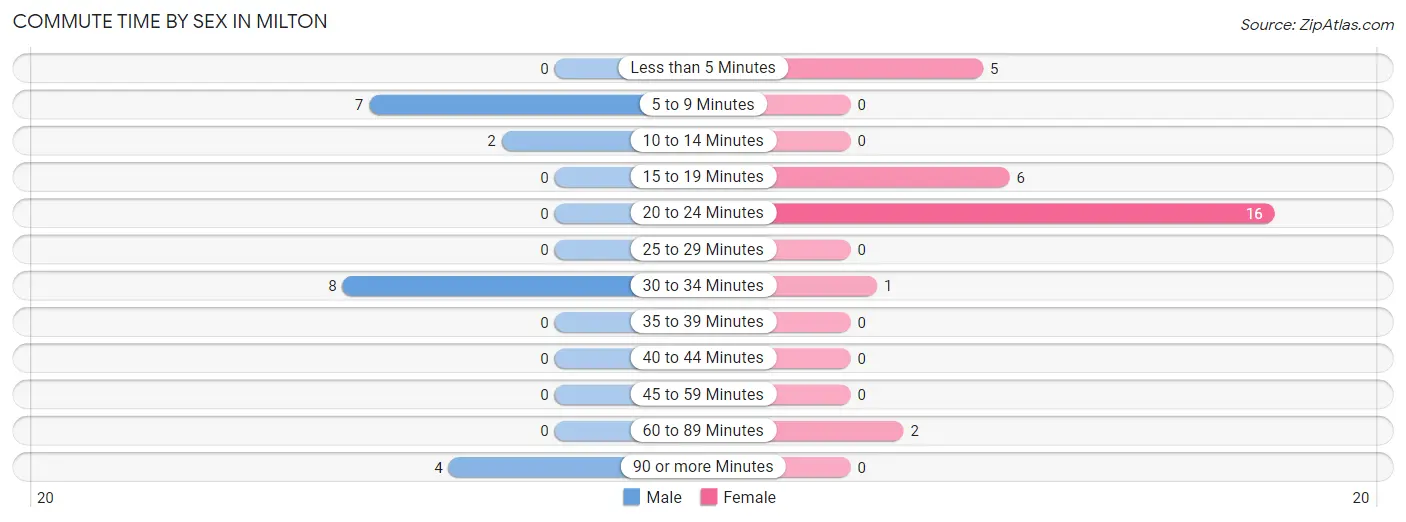
| Commute Time | Male | Female |
| Less than 5 Minutes | 0 (0.0%) | 5 (16.7%) |
| 5 to 9 Minutes | 7 (33.3%) | 0 (0.0%) |
| 10 to 14 Minutes | 2 (9.5%) | 0 (0.0%) |
| 15 to 19 Minutes | 0 (0.0%) | 6 (20.0%) |
| 20 to 24 Minutes | 0 (0.0%) | 16 (53.3%) |
| 25 to 29 Minutes | 0 (0.0%) | 0 (0.0%) |
| 30 to 34 Minutes | 8 (38.1%) | 1 (3.3%) |
| 35 to 39 Minutes | 0 (0.0%) | 0 (0.0%) |
| 40 to 44 Minutes | 0 (0.0%) | 0 (0.0%) |
| 45 to 59 Minutes | 0 (0.0%) | 0 (0.0%) |
| 60 to 89 Minutes | 0 (0.0%) | 2 (6.7%) |
| 90 or more Minutes | 4 (19.1%) | 0 (0.0%) |
Time of Departure to Work by Sex in Milton
The most frequent times of departure to work in Milton are 12:00 AM to 4:59 AM (13, 61.9%) for males and 6:00 AM to 6:29 AM (15, 50.0%) for females.
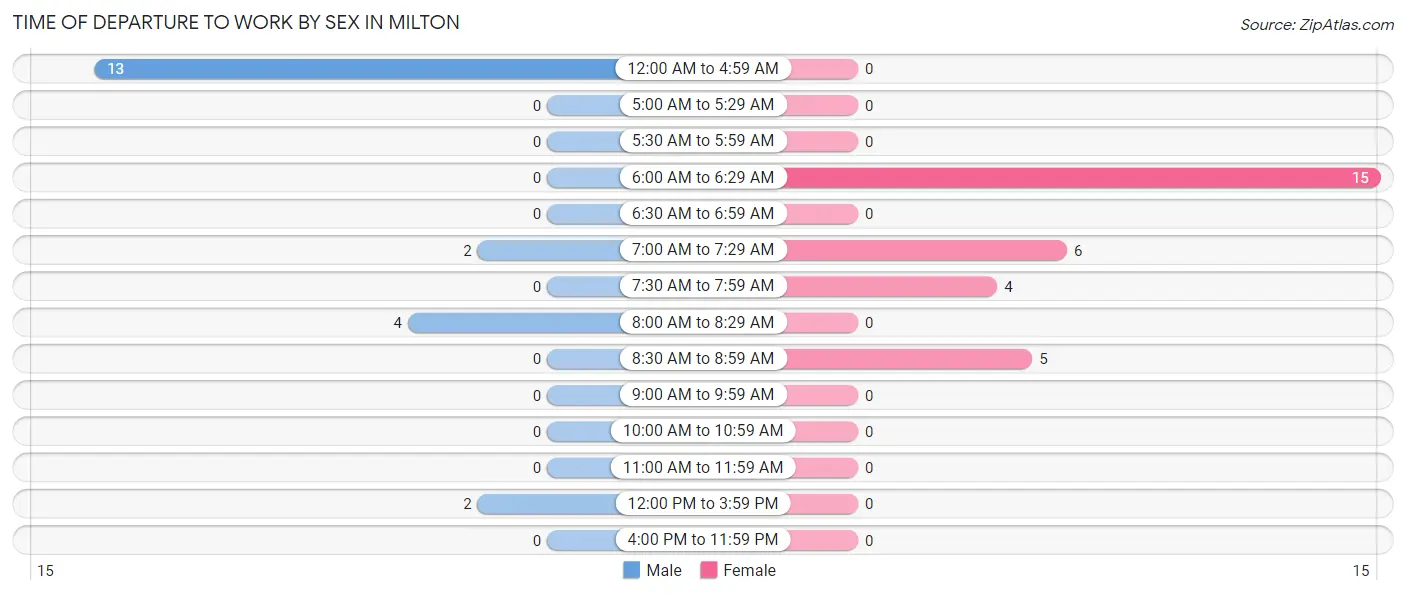
| Time of Departure | Male | Female |
| 12:00 AM to 4:59 AM | 13 (61.9%) | 0 (0.0%) |
| 5:00 AM to 5:29 AM | 0 (0.0%) | 0 (0.0%) |
| 5:30 AM to 5:59 AM | 0 (0.0%) | 0 (0.0%) |
| 6:00 AM to 6:29 AM | 0 (0.0%) | 15 (50.0%) |
| 6:30 AM to 6:59 AM | 0 (0.0%) | 0 (0.0%) |
| 7:00 AM to 7:29 AM | 2 (9.5%) | 6 (20.0%) |
| 7:30 AM to 7:59 AM | 0 (0.0%) | 4 (13.3%) |
| 8:00 AM to 8:29 AM | 4 (19.1%) | 0 (0.0%) |
| 8:30 AM to 8:59 AM | 0 (0.0%) | 5 (16.7%) |
| 9:00 AM to 9:59 AM | 0 (0.0%) | 0 (0.0%) |
| 10:00 AM to 10:59 AM | 0 (0.0%) | 0 (0.0%) |
| 11:00 AM to 11:59 AM | 0 (0.0%) | 0 (0.0%) |
| 12:00 PM to 3:59 PM | 2 (9.5%) | 0 (0.0%) |
| 4:00 PM to 11:59 PM | 0 (0.0%) | 0 (0.0%) |
| Total | 21 (100.0%) | 30 (100.0%) |
Housing Occupancy in Milton
Occupancy by Ownership in Milton
Of the total 72 dwellings in Milton, owner-occupied units account for 64 (88.9%), while renter-occupied units make up 8 (11.1%).
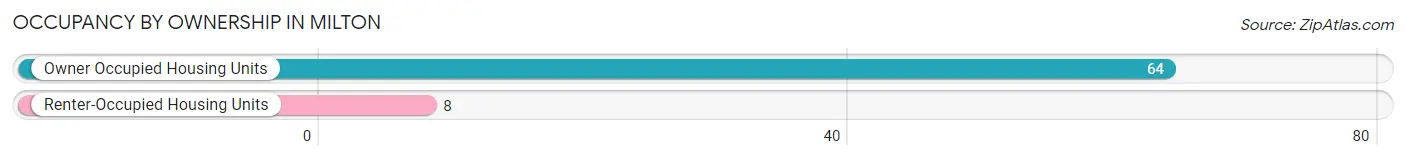
| Occupancy | # Housing Units | % Housing Units |
| Owner Occupied Housing Units | 64 | 88.9% |
| Renter-Occupied Housing Units | 8 | 11.1% |
| Total Occupied Housing Units | 72 | 100.0% |
Occupancy by Household Size in Milton
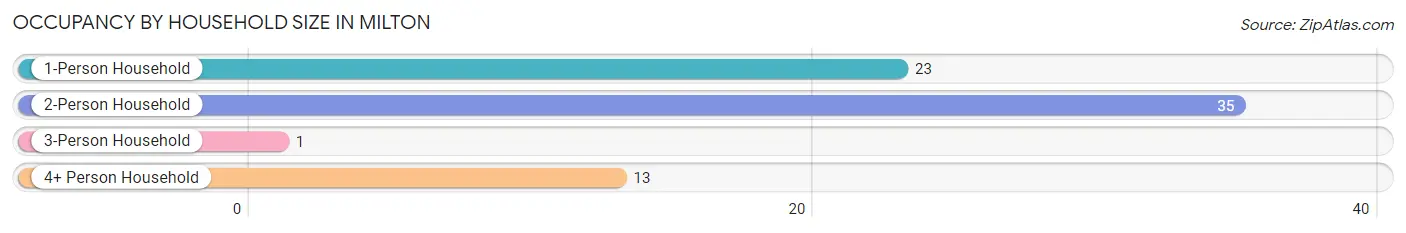
| Household Size | # Housing Units | % Housing Units |
| 1-Person Household | 23 | 31.9% |
| 2-Person Household | 35 | 48.6% |
| 3-Person Household | 1 | 1.4% |
| 4+ Person Household | 13 | 18.1% |
| Total Housing Units | 72 | 100.0% |
Occupancy by Ownership by Household Size in Milton
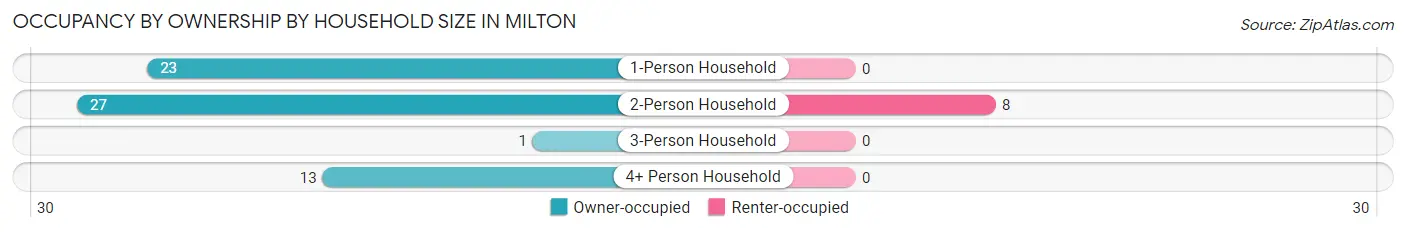
| Household Size | Owner-occupied | Renter-occupied |
| 1-Person Household | 23 (100.0%) | 0 (0.0%) |
| 2-Person Household | 27 (77.1%) | 8 (22.9%) |
| 3-Person Household | 1 (100.0%) | 0 (0.0%) |
| 4+ Person Household | 13 (100.0%) | 0 (0.0%) |
| Total Housing Units | 64 (88.9%) | 8 (11.1%) |
Occupancy by Educational Attainment in Milton
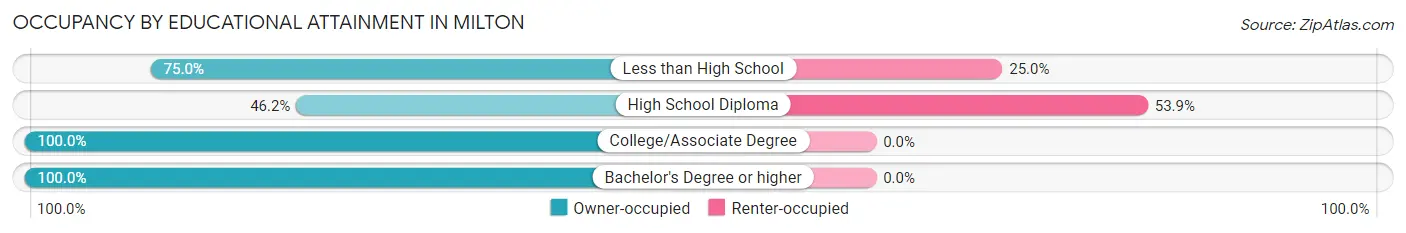
| Household Size | Owner-occupied | Renter-occupied |
| Less than High School | 3 (75.0%) | 1 (25.0%) |
| High School Diploma | 6 (46.2%) | 7 (53.8%) |
| College/Associate Degree | 35 (100.0%) | 0 (0.0%) |
| Bachelor's Degree or higher | 20 (100.0%) | 0 (0.0%) |
Occupancy by Age of Householder in Milton
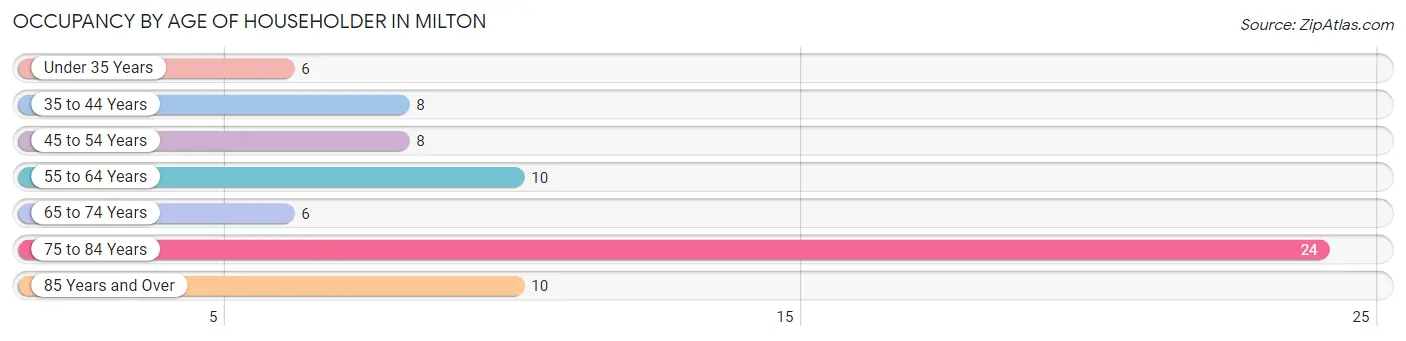
| Age Bracket | # Households | % Households |
| Under 35 Years | 6 | 8.3% |
| 35 to 44 Years | 8 | 11.1% |
| 45 to 54 Years | 8 | 11.1% |
| 55 to 64 Years | 10 | 13.9% |
| 65 to 74 Years | 6 | 8.3% |
| 75 to 84 Years | 24 | 33.3% |
| 85 Years and Over | 10 | 13.9% |
| Total | 72 | 100.0% |
Housing Finances in Milton
Median Income by Occupancy in Milton
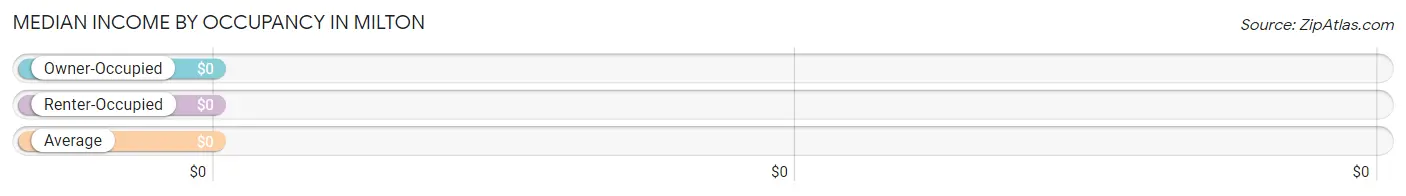
| Occupancy Type | # Households | Median Income |
| Owner-Occupied | 64 (88.9%) | $0 |
| Renter-Occupied | 8 (11.1%) | $0 |
| Average | 72 (100.0%) | $0 |
Occupancy by Householder Income Bracket in Milton
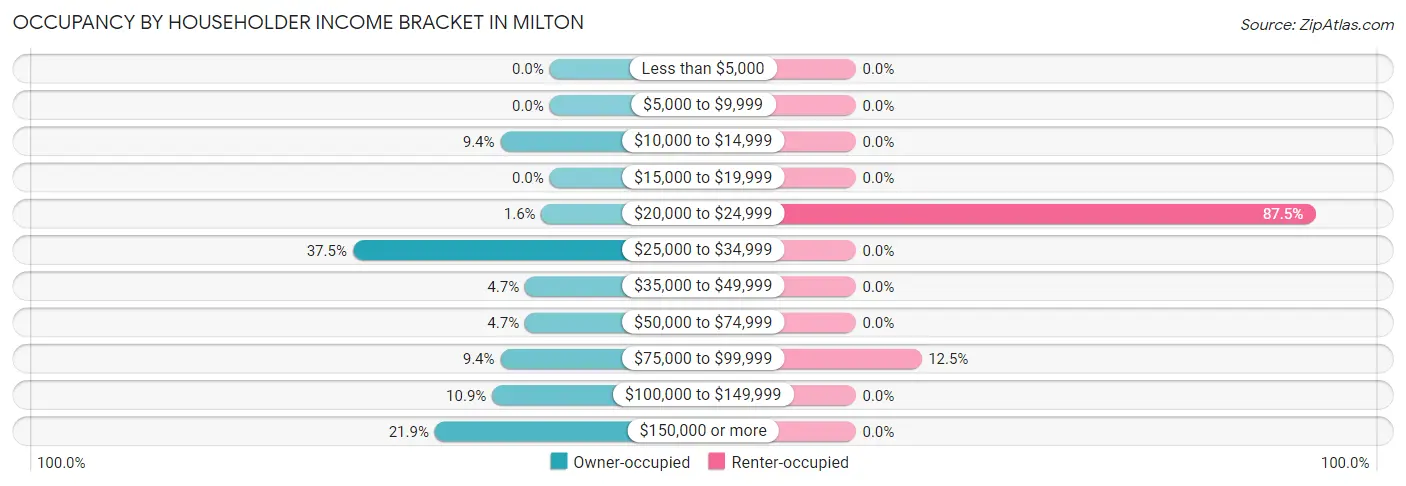
| Income Bracket | Owner-occupied | Renter-occupied |
| Less than $5,000 | 0 (0.0%) | 0 (0.0%) |
| $5,000 to $9,999 | 0 (0.0%) | 0 (0.0%) |
| $10,000 to $14,999 | 6 (9.4%) | 0 (0.0%) |
| $15,000 to $19,999 | 0 (0.0%) | 0 (0.0%) |
| $20,000 to $24,999 | 1 (1.6%) | 7 (87.5%) |
| $25,000 to $34,999 | 24 (37.5%) | 0 (0.0%) |
| $35,000 to $49,999 | 3 (4.7%) | 0 (0.0%) |
| $50,000 to $74,999 | 3 (4.7%) | 0 (0.0%) |
| $75,000 to $99,999 | 6 (9.4%) | 1 (12.5%) |
| $100,000 to $149,999 | 7 (10.9%) | 0 (0.0%) |
| $150,000 or more | 14 (21.9%) | 0 (0.0%) |
| Total | 64 (100.0%) | 8 (100.0%) |
Monthly Housing Cost Tiers in Milton
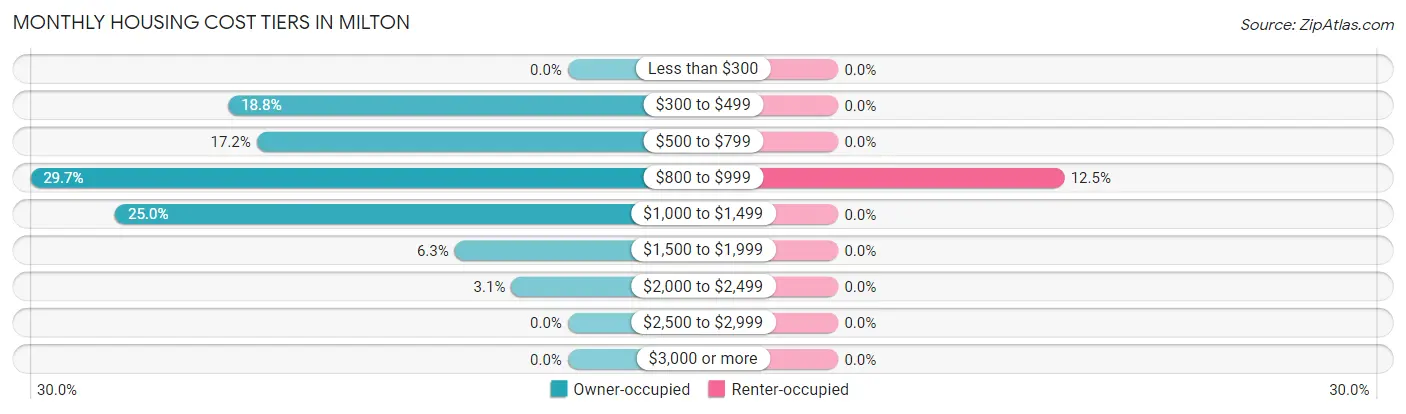
| Monthly Cost | Owner-occupied | Renter-occupied |
| Less than $300 | 0 (0.0%) | 0 (0.0%) |
| $300 to $499 | 12 (18.8%) | 0 (0.0%) |
| $500 to $799 | 11 (17.2%) | 0 (0.0%) |
| $800 to $999 | 19 (29.7%) | 1 (12.5%) |
| $1,000 to $1,499 | 16 (25.0%) | 0 (0.0%) |
| $1,500 to $1,999 | 4 (6.2%) | 0 (0.0%) |
| $2,000 to $2,499 | 2 (3.1%) | 0 (0.0%) |
| $2,500 to $2,999 | 0 (0.0%) | 0 (0.0%) |
| $3,000 or more | 0 (0.0%) | 0 (0.0%) |
| Total | 64 (100.0%) | 8 (100.0%) |
Physical Housing Characteristics in Milton
Housing Structures in Milton
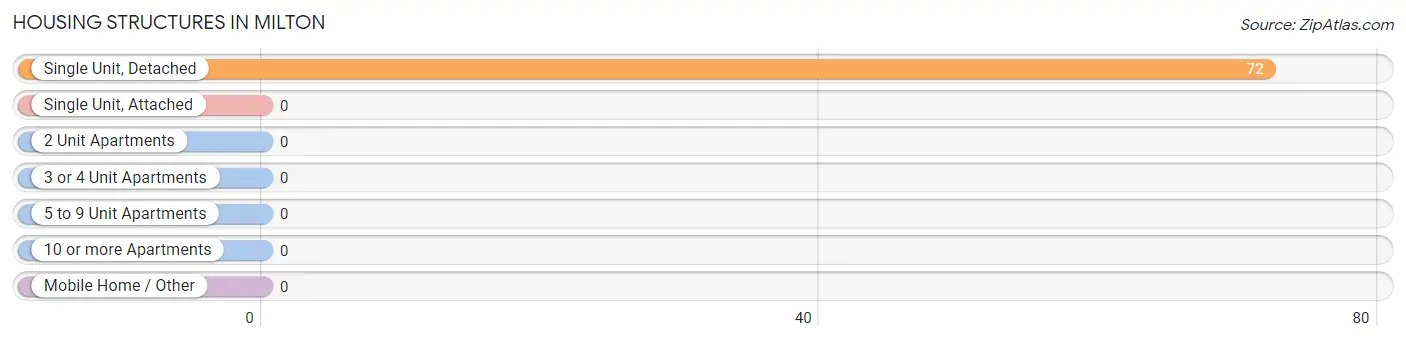
| Structure Type | # Housing Units | % Housing Units |
| Single Unit, Detached | 72 | 100.0% |
| Single Unit, Attached | 0 | 0.0% |
| 2 Unit Apartments | 0 | 0.0% |
| 3 or 4 Unit Apartments | 0 | 0.0% |
| 5 to 9 Unit Apartments | 0 | 0.0% |
| 10 or more Apartments | 0 | 0.0% |
| Mobile Home / Other | 0 | 0.0% |
| Total | 72 | 100.0% |
Housing Structures by Occupancy in Milton
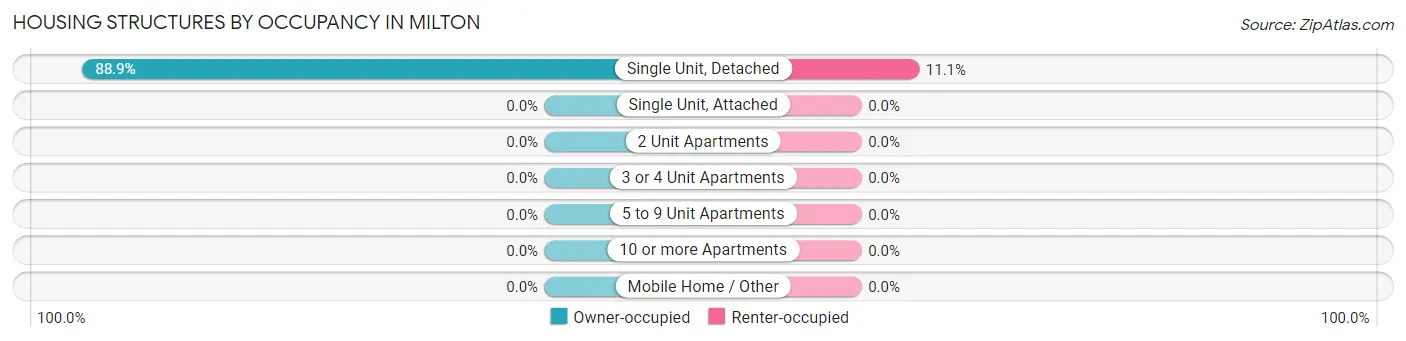
| Structure Type | Owner-occupied | Renter-occupied |
| Single Unit, Detached | 64 (88.9%) | 8 (11.1%) |
| Single Unit, Attached | 0 (0.0%) | 0 (0.0%) |
| 2 Unit Apartments | 0 (0.0%) | 0 (0.0%) |
| 3 or 4 Unit Apartments | 0 (0.0%) | 0 (0.0%) |
| 5 to 9 Unit Apartments | 0 (0.0%) | 0 (0.0%) |
| 10 or more Apartments | 0 (0.0%) | 0 (0.0%) |
| Mobile Home / Other | 0 (0.0%) | 0 (0.0%) |
| Total | 64 (88.9%) | 8 (11.1%) |
Housing Structures by Number of Rooms in Milton
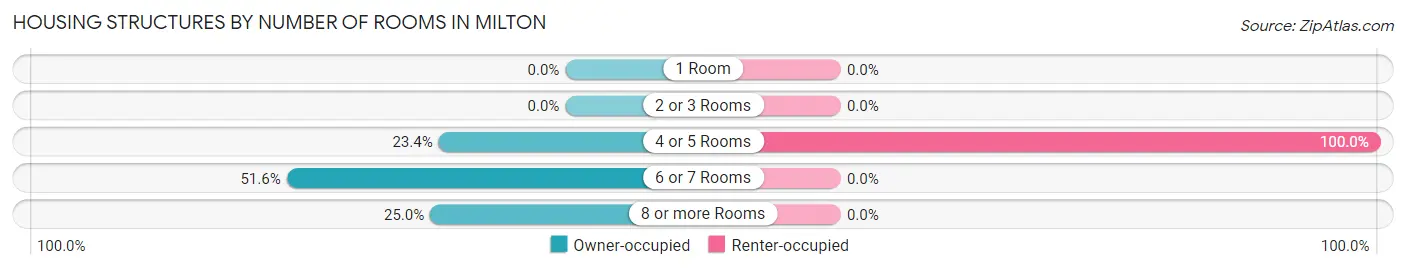
| Number of Rooms | Owner-occupied | Renter-occupied |
| 1 Room | 0 (0.0%) | 0 (0.0%) |
| 2 or 3 Rooms | 0 (0.0%) | 0 (0.0%) |
| 4 or 5 Rooms | 15 (23.4%) | 8 (100.0%) |
| 6 or 7 Rooms | 33 (51.6%) | 0 (0.0%) |
| 8 or more Rooms | 16 (25.0%) | 0 (0.0%) |
| Total | 64 (100.0%) | 8 (100.0%) |
Housing Structure by Heating Type in Milton
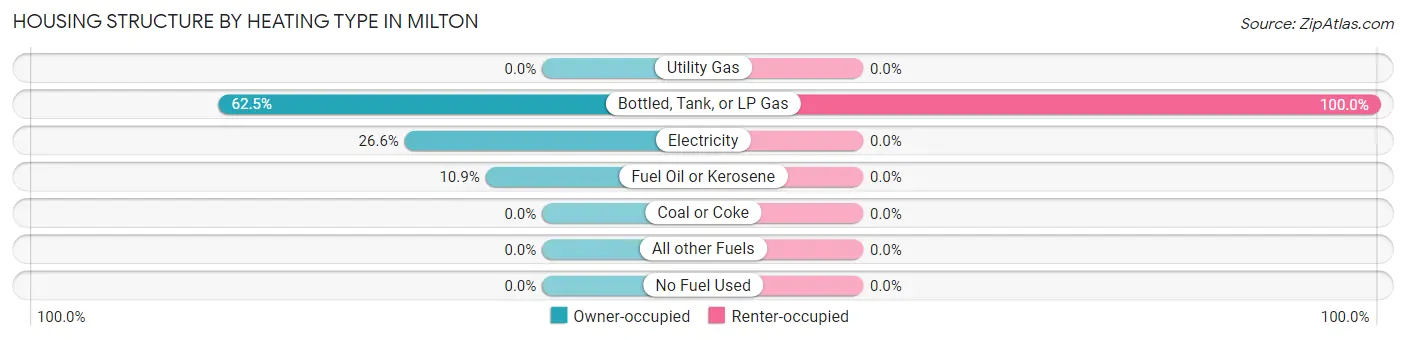
| Heating Type | Owner-occupied | Renter-occupied |
| Utility Gas | 0 (0.0%) | 0 (0.0%) |
| Bottled, Tank, or LP Gas | 40 (62.5%) | 8 (100.0%) |
| Electricity | 17 (26.6%) | 0 (0.0%) |
| Fuel Oil or Kerosene | 7 (10.9%) | 0 (0.0%) |
| Coal or Coke | 0 (0.0%) | 0 (0.0%) |
| All other Fuels | 0 (0.0%) | 0 (0.0%) |
| No Fuel Used | 0 (0.0%) | 0 (0.0%) |
| Total | 64 (100.0%) | 8 (100.0%) |
Household Vehicle Usage in Milton
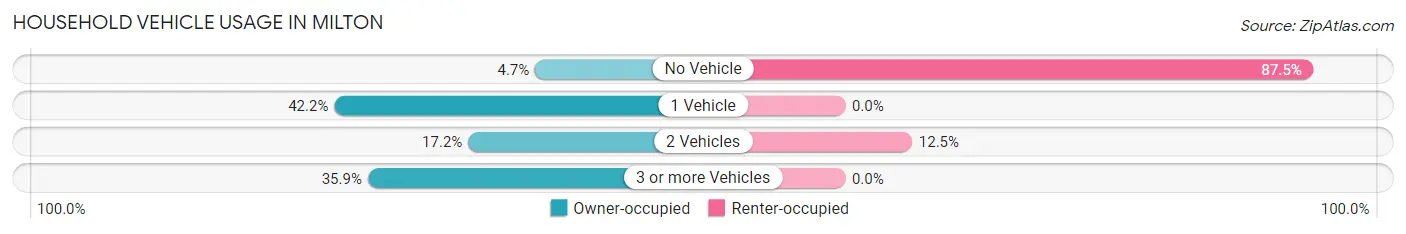
| Vehicles per Household | Owner-occupied | Renter-occupied |
| No Vehicle | 3 (4.7%) | 7 (87.5%) |
| 1 Vehicle | 27 (42.2%) | 0 (0.0%) |
| 2 Vehicles | 11 (17.2%) | 1 (12.5%) |
| 3 or more Vehicles | 23 (35.9%) | 0 (0.0%) |
| Total | 64 (100.0%) | 8 (100.0%) |
Real Estate & Mortgages in Milton
Real Estate and Mortgage Overview in Milton
| Characteristic | Without Mortgage | With Mortgage |
| Housing Units | 19 | 45 |
| Median Property Value | - | - |
| Median Household Income | - | - |
| Monthly Housing Costs | - | - |
| Real Estate Taxes | $1,361 | $0 |
Property Value by Mortgage Status in Milton
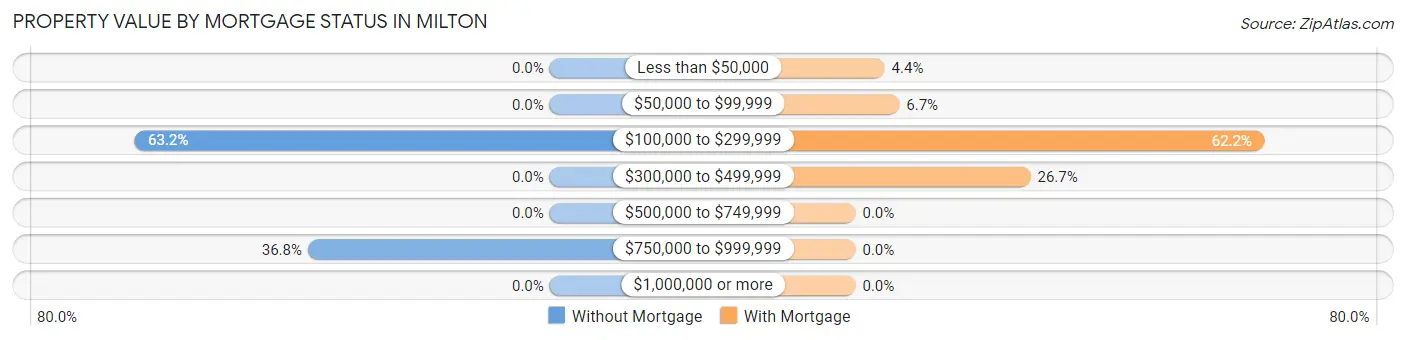
| Property Value | Without Mortgage | With Mortgage |
| Less than $50,000 | 0 (0.0%) | 2 (4.4%) |
| $50,000 to $99,999 | 0 (0.0%) | 3 (6.7%) |
| $100,000 to $299,999 | 12 (63.2%) | 28 (62.2%) |
| $300,000 to $499,999 | 0 (0.0%) | 12 (26.7%) |
| $500,000 to $749,999 | 0 (0.0%) | 0 (0.0%) |
| $750,000 to $999,999 | 7 (36.8%) | 0 (0.0%) |
| $1,000,000 or more | 0 (0.0%) | 0 (0.0%) |
| Total | 19 (100.0%) | 45 (100.0%) |
Household Income by Mortgage Status in Milton
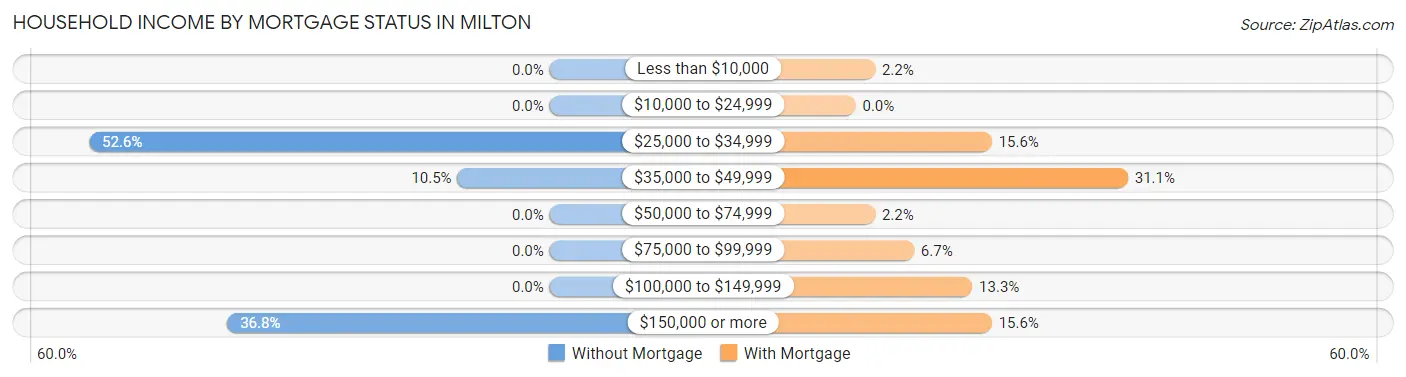
| Household Income | Without Mortgage | With Mortgage |
| Less than $10,000 | 0 (0.0%) | 1 (2.2%) |
| $10,000 to $24,999 | 0 (0.0%) | 0 (0.0%) |
| $25,000 to $34,999 | 10 (52.6%) | 7 (15.6%) |
| $35,000 to $49,999 | 2 (10.5%) | 14 (31.1%) |
| $50,000 to $74,999 | 0 (0.0%) | 1 (2.2%) |
| $75,000 to $99,999 | 0 (0.0%) | 3 (6.7%) |
| $100,000 to $149,999 | 0 (0.0%) | 6 (13.3%) |
| $150,000 or more | 7 (36.8%) | 7 (15.6%) |
| Total | 19 (100.0%) | 45 (100.0%) |
Property Value to Household Income Ratio in Milton
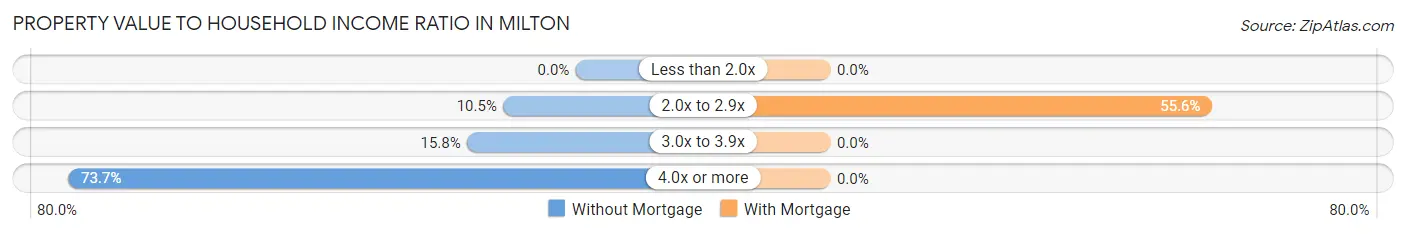
| Value-to-Income Ratio | Without Mortgage | With Mortgage |
| Less than 2.0x | 0 (0.0%) | 0 (0.0%) |
| 2.0x to 2.9x | 2 (10.5%) | 25 (55.6%) |
| 3.0x to 3.9x | 3 (15.8%) | 0 (0.0%) |
| 4.0x or more | 14 (73.7%) | 0 (0.0%) |
| Total | 19 (100.0%) | 45 (100.0%) |
Real Estate Taxes by Mortgage Status in Milton
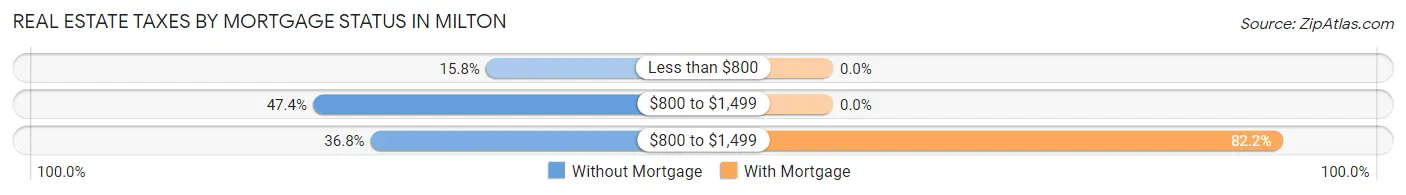
| Property Taxes | Without Mortgage | With Mortgage |
| Less than $800 | 3 (15.8%) | 0 (0.0%) |
| $800 to $1,499 | 9 (47.4%) | 0 (0.0%) |
| $800 to $1,499 | 7 (36.8%) | 37 (82.2%) |
| Total | 19 (100.0%) | 45 (100.0%) |
Health & Disability in Milton
Health Insurance Coverage by Age in Milton
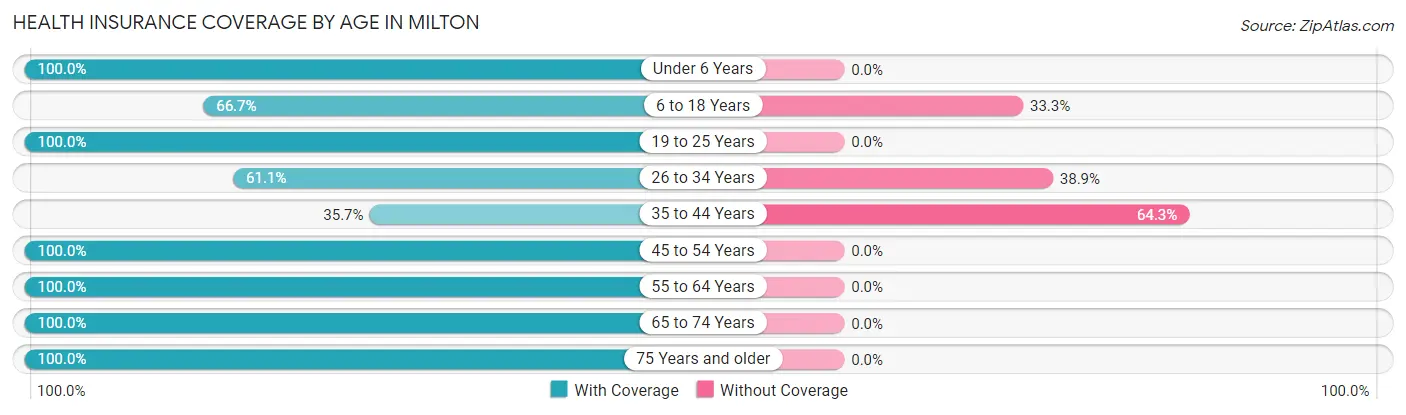
| Age Bracket | With Coverage | Without Coverage |
| Under 6 Years | 10 (100.0%) | 0 (0.0%) |
| 6 to 18 Years | 8 (66.7%) | 4 (33.3%) |
| 19 to 25 Years | 2 (100.0%) | 0 (0.0%) |
| 26 to 34 Years | 11 (61.1%) | 7 (38.9%) |
| 35 to 44 Years | 5 (35.7%) | 9 (64.3%) |
| 45 to 54 Years | 16 (100.0%) | 0 (0.0%) |
| 55 to 64 Years | 18 (100.0%) | 0 (0.0%) |
| 65 to 74 Years | 20 (100.0%) | 0 (0.0%) |
| 75 Years and older | 37 (100.0%) | 0 (0.0%) |
| Total | 127 (86.4%) | 20 (13.6%) |
Health Insurance Coverage by Citizenship Status in Milton
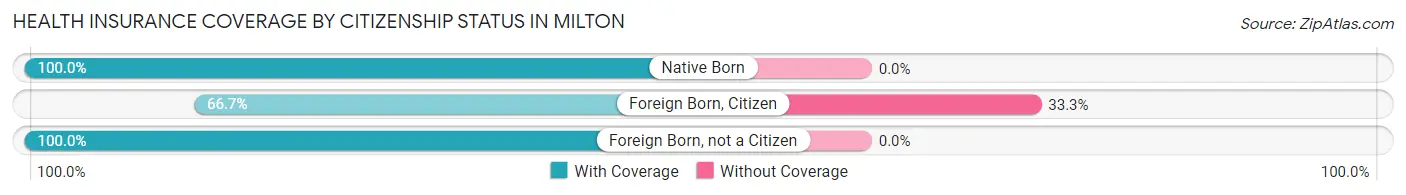
| Citizenship Status | With Coverage | Without Coverage |
| Native Born | 10 (100.0%) | 0 (0.0%) |
| Foreign Born, Citizen | 8 (66.7%) | 4 (33.3%) |
| Foreign Born, not a Citizen | 2 (100.0%) | 0 (0.0%) |
Health Insurance Coverage by Household Income in Milton
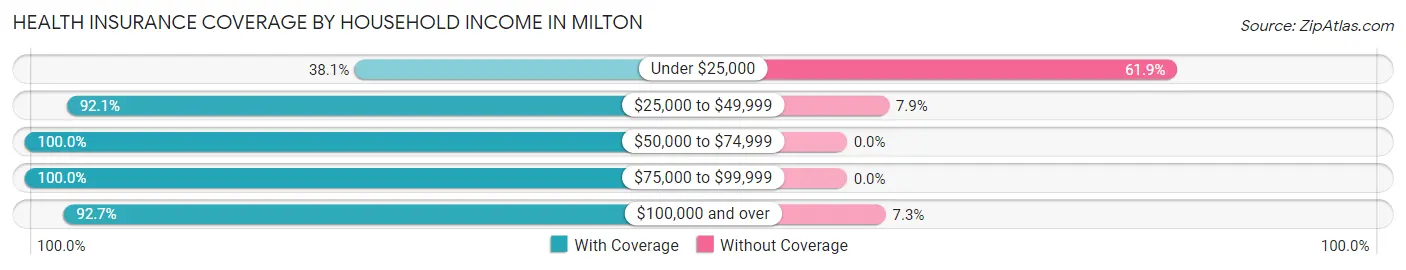
| Household Income | With Coverage | Without Coverage |
| Under $25,000 | 8 (38.1%) | 13 (61.9%) |
| $25,000 to $49,999 | 35 (92.1%) | 3 (7.9%) |
| $50,000 to $74,999 | 7 (100.0%) | 0 (0.0%) |
| $75,000 to $99,999 | 26 (100.0%) | 0 (0.0%) |
| $100,000 and over | 51 (92.7%) | 4 (7.3%) |
Public vs Private Health Insurance Coverage by Age in Milton
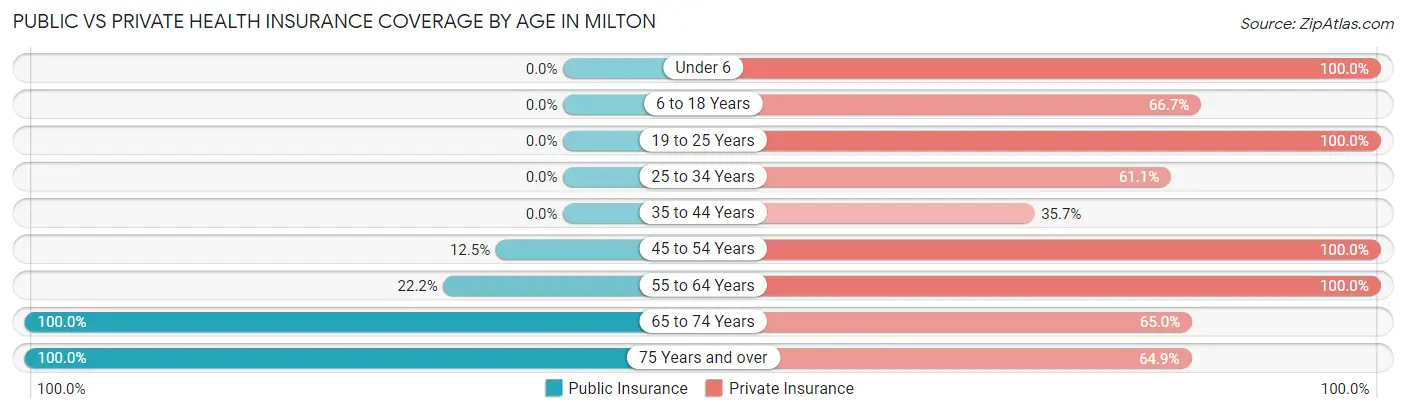
| Age Bracket | Public Insurance | Private Insurance |
| Under 6 | 0 (0.0%) | 10 (100.0%) |
| 6 to 18 Years | 0 (0.0%) | 8 (66.7%) |
| 19 to 25 Years | 0 (0.0%) | 2 (100.0%) |
| 25 to 34 Years | 0 (0.0%) | 11 (61.1%) |
| 35 to 44 Years | 0 (0.0%) | 5 (35.7%) |
| 45 to 54 Years | 2 (12.5%) | 16 (100.0%) |
| 55 to 64 Years | 4 (22.2%) | 18 (100.0%) |
| 65 to 74 Years | 20 (100.0%) | 13 (65.0%) |
| 75 Years and over | 37 (100.0%) | 24 (64.9%) |
| Total | 63 (42.9%) | 107 (72.8%) |
Disability Status by Sex by Age in Milton
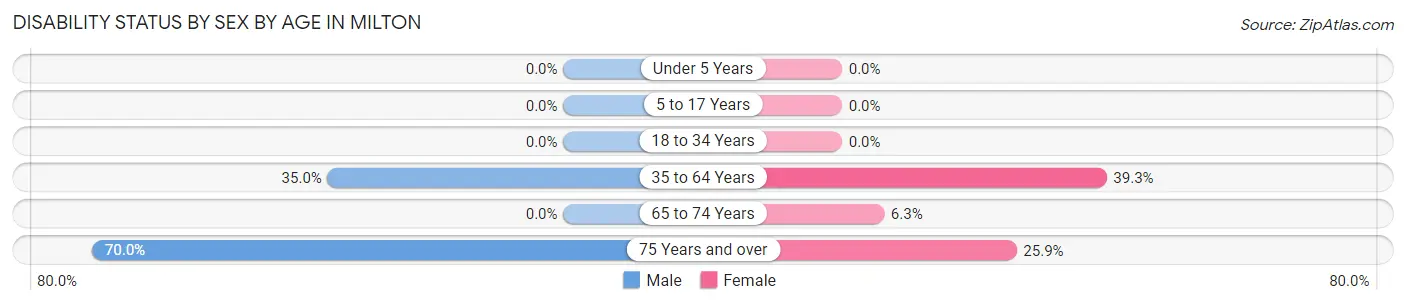
| Age Bracket | Male | Female |
| Under 5 Years | 0 (0.0%) | 0 (0.0%) |
| 5 to 17 Years | 0 (0.0%) | 0 (0.0%) |
| 18 to 34 Years | 0 (0.0%) | 0 (0.0%) |
| 35 to 64 Years | 7 (35.0%) | 11 (39.3%) |
| 65 to 74 Years | 0 (0.0%) | 1 (6.2%) |
| 75 Years and over | 7 (70.0%) | 7 (25.9%) |
Disability Class by Sex by Age in Milton
Disability Class: Hearing Difficulty
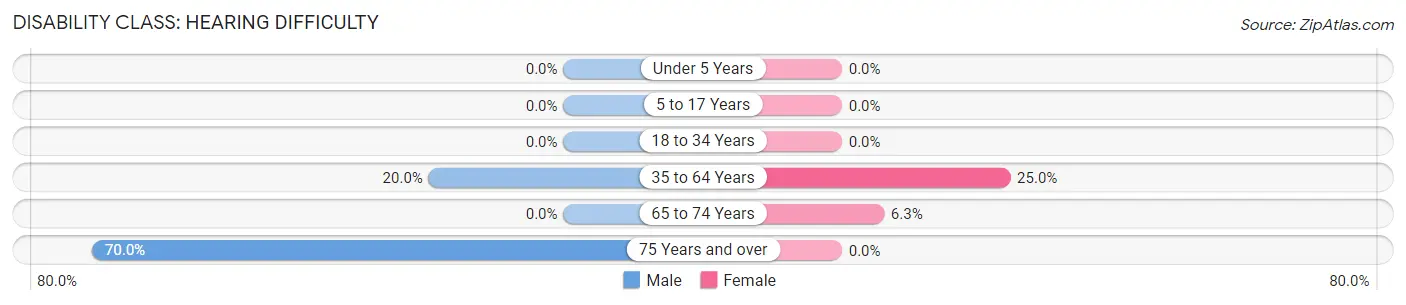
| Age Bracket | Male | Female |
| Under 5 Years | 0 (0.0%) | 0 (0.0%) |
| 5 to 17 Years | 0 (0.0%) | 0 (0.0%) |
| 18 to 34 Years | 0 (0.0%) | 0 (0.0%) |
| 35 to 64 Years | 4 (20.0%) | 7 (25.0%) |
| 65 to 74 Years | 0 (0.0%) | 1 (6.2%) |
| 75 Years and over | 7 (70.0%) | 0 (0.0%) |
Disability Class: Vision Difficulty

| Age Bracket | Male | Female |
| Under 5 Years | 0 (0.0%) | 0 (0.0%) |
| 5 to 17 Years | 0 (0.0%) | 0 (0.0%) |
| 18 to 34 Years | 0 (0.0%) | 0 (0.0%) |
| 35 to 64 Years | 0 (0.0%) | 7 (25.0%) |
| 65 to 74 Years | 0 (0.0%) | 0 (0.0%) |
| 75 Years and over | 7 (70.0%) | 7 (25.9%) |
Disability Class: Cognitive Difficulty
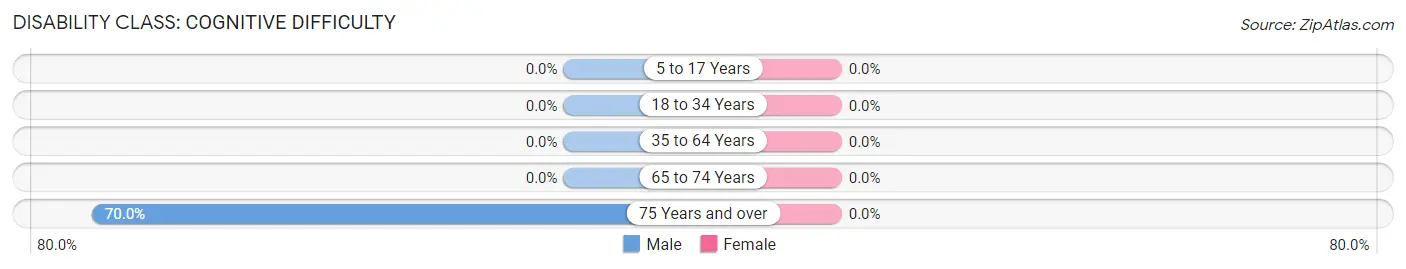
| Age Bracket | Male | Female |
| 5 to 17 Years | 0 (0.0%) | 0 (0.0%) |
| 18 to 34 Years | 0 (0.0%) | 0 (0.0%) |
| 35 to 64 Years | 0 (0.0%) | 0 (0.0%) |
| 65 to 74 Years | 0 (0.0%) | 0 (0.0%) |
| 75 Years and over | 7 (70.0%) | 0 (0.0%) |
Disability Class: Ambulatory Difficulty
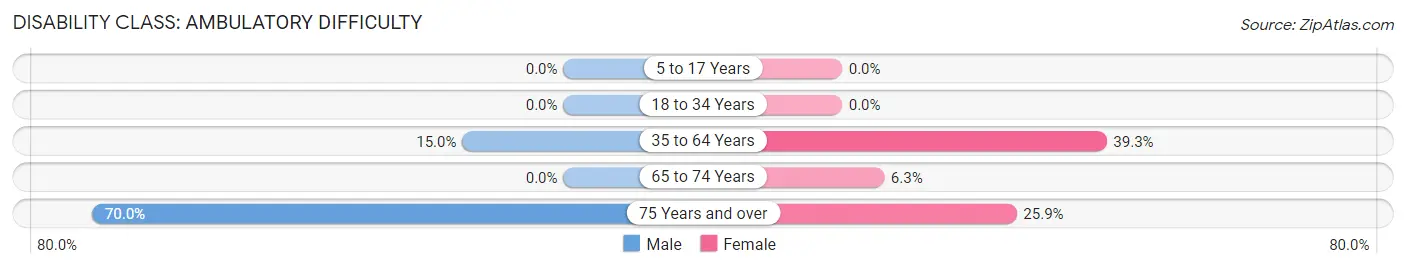
| Age Bracket | Male | Female |
| 5 to 17 Years | 0 (0.0%) | 0 (0.0%) |
| 18 to 34 Years | 0 (0.0%) | 0 (0.0%) |
| 35 to 64 Years | 3 (15.0%) | 11 (39.3%) |
| 65 to 74 Years | 0 (0.0%) | 1 (6.2%) |
| 75 Years and over | 7 (70.0%) | 7 (25.9%) |
Disability Class: Self-Care Difficulty
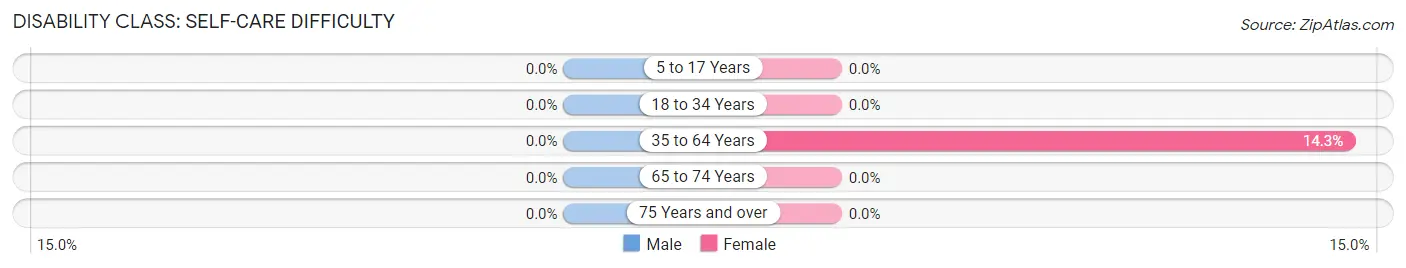
| Age Bracket | Male | Female |
| 5 to 17 Years | 0 (0.0%) | 0 (0.0%) |
| 18 to 34 Years | 0 (0.0%) | 0 (0.0%) |
| 35 to 64 Years | 0 (0.0%) | 4 (14.3%) |
| 65 to 74 Years | 0 (0.0%) | 0 (0.0%) |
| 75 Years and over | 0 (0.0%) | 0 (0.0%) |
Technology Access in Milton
Computing Device Access in Milton
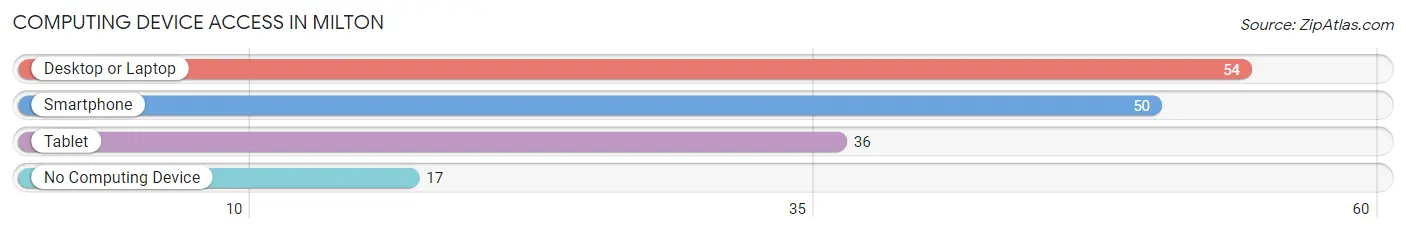
| Device Type | # Households | % Households |
| Desktop or Laptop | 54 | 75.0% |
| Smartphone | 50 | 69.4% |
| Tablet | 36 | 50.0% |
| No Computing Device | 17 | 23.6% |
| Total | 72 | 100.0% |
Internet Access in Milton
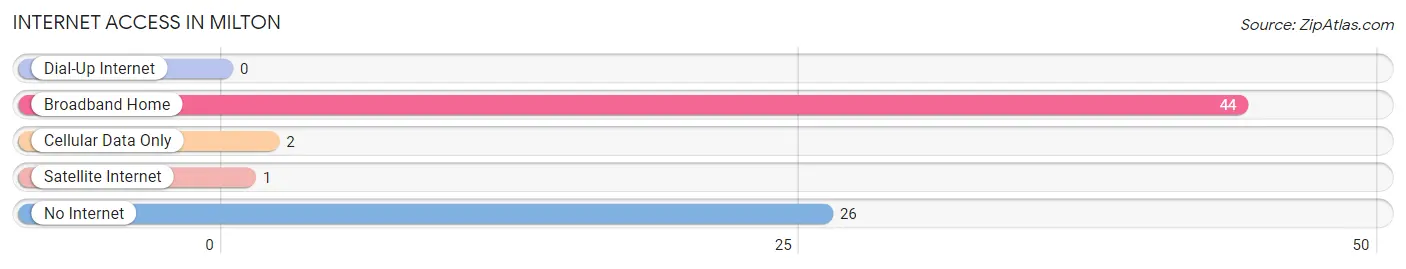
| Internet Type | # Households | % Households |
| Dial-Up Internet | 0 | 0.0% |
| Broadband Home | 44 | 61.1% |
| Cellular Data Only | 2 | 2.8% |
| Satellite Internet | 1 | 1.4% |
| No Internet | 26 | 36.1% |
| Total | 72 | 100.0% |
Milton Summary
Milton, North Carolina is a small town located in Caswell County, North Carolina. It is situated on the banks of the Dan River, and is part of the Danville, Virginia metropolitan area. The town was founded in 1790 and has a population of approximately 1,000 people.
Geography
Milton is located in the Piedmont region of North Carolina, and is situated on the banks of the Dan River. The town is located in Caswell County, and is part of the Danville, Virginia metropolitan area. The town is located approximately 30 miles north of Greensboro, North Carolina, and is approximately 60 miles south of Roanoke, Virginia. The town is located at an elevation of 590 feet above sea level.
The town is surrounded by rolling hills and farmland, and is home to a variety of wildlife, including deer, foxes, and wild turkeys. The town is also home to a variety of plant life, including oak, hickory, and pine trees.
History
Milton was founded in 1790 by a group of settlers from Virginia. The town was named after the English poet John Milton, and was originally intended to be a trading post. The town quickly grew, and by the mid-1800s, it was a thriving community.
The town was home to a variety of businesses, including a grist mill, a sawmill, a tannery, and a blacksmith shop. The town also had a variety of churches, including the First Baptist Church, the Methodist Episcopal Church, and the Presbyterian Church.
The town was also home to a variety of educational institutions, including the Milton Academy, which was founded in 1820. The town was also home to a variety of other schools, including the Milton Female Seminary, which was founded in 1845.
The town was also home to a variety of cultural institutions, including the Milton Opera House, which was built in 1891. The opera house was used for a variety of performances, including plays, concerts, and lectures.
The town was also home to a variety of other businesses, including a variety of stores, restaurants, and hotels. The town was also home to a variety of manufacturing businesses, including a cotton mill, a furniture factory, and a shoe factory.
Economy
Milton’s economy is largely based on agriculture and manufacturing. The town is home to a variety of farms, including dairy farms, beef farms, and poultry farms. The town is also home to a variety of manufacturing businesses, including a furniture factory, a shoe factory, and a cotton mill.
The town is also home to a variety of retail businesses, including a variety of stores, restaurants, and hotels. The town is also home to a variety of service businesses, including a variety of medical and legal services.
Demographics
As of the 2010 census, the population of Milton was 1,000 people. The town is approximately 75% white, 20% African American, and 5% Hispanic. The median household income in the town is approximately $35,000, and the median home value is approximately $150,000.
Conclusion
Milton, North Carolina is a small town located in Caswell County, North Carolina. It is situated on the banks of the Dan River, and is part of the Danville, Virginia metropolitan area. The town was founded in 1790 and has a population of approximately 1,000 people. The town’s economy is largely based on agriculture and manufacturing, and the town is home to a variety of retail businesses, including a variety of stores, restaurants, and hotels. The town is approximately 75% white, 20% African American, and 5% Hispanic, and the median household income in the town is approximately $35,000.
Common Questions
What is Per Capita Income in Milton?
Per Capita income in Milton is $59,969.
What is Inequality or Gini Index in Milton?
Inequality or Gini Index in Milton is 0.65.
What is the Total Population of Milton?
Total Population of Milton is 147.
What is the Total Male Population of Milton?
Total Male Population of Milton is 53.
What is the Total Female Population of Milton?
Total Female Population of Milton is 94.
What is the Ratio of Males per 100 Females in Milton?
There are 56.38 Males per 100 Females in Milton.
What is the Ratio of Females per 100 Males in Milton?
There are 177.36 Females per 100 Males in Milton.
What is the Median Population Age in Milton?
Median Population Age in Milton is 56.5 Years.
What is the Average Family Size in Milton
Average Family Size in Milton is 2.5 People.
What is the Average Household Size in Milton
Average Household Size in Milton is 2.0 People.
How Large is the Labor Force in Milton?
There are 61 People in the Labor Forcein in Milton.
What is the Percentage of People in the Labor Force in Milton?
47.3% of People are in the Labor Force in Milton.