Danbury, NC Map & Demographics
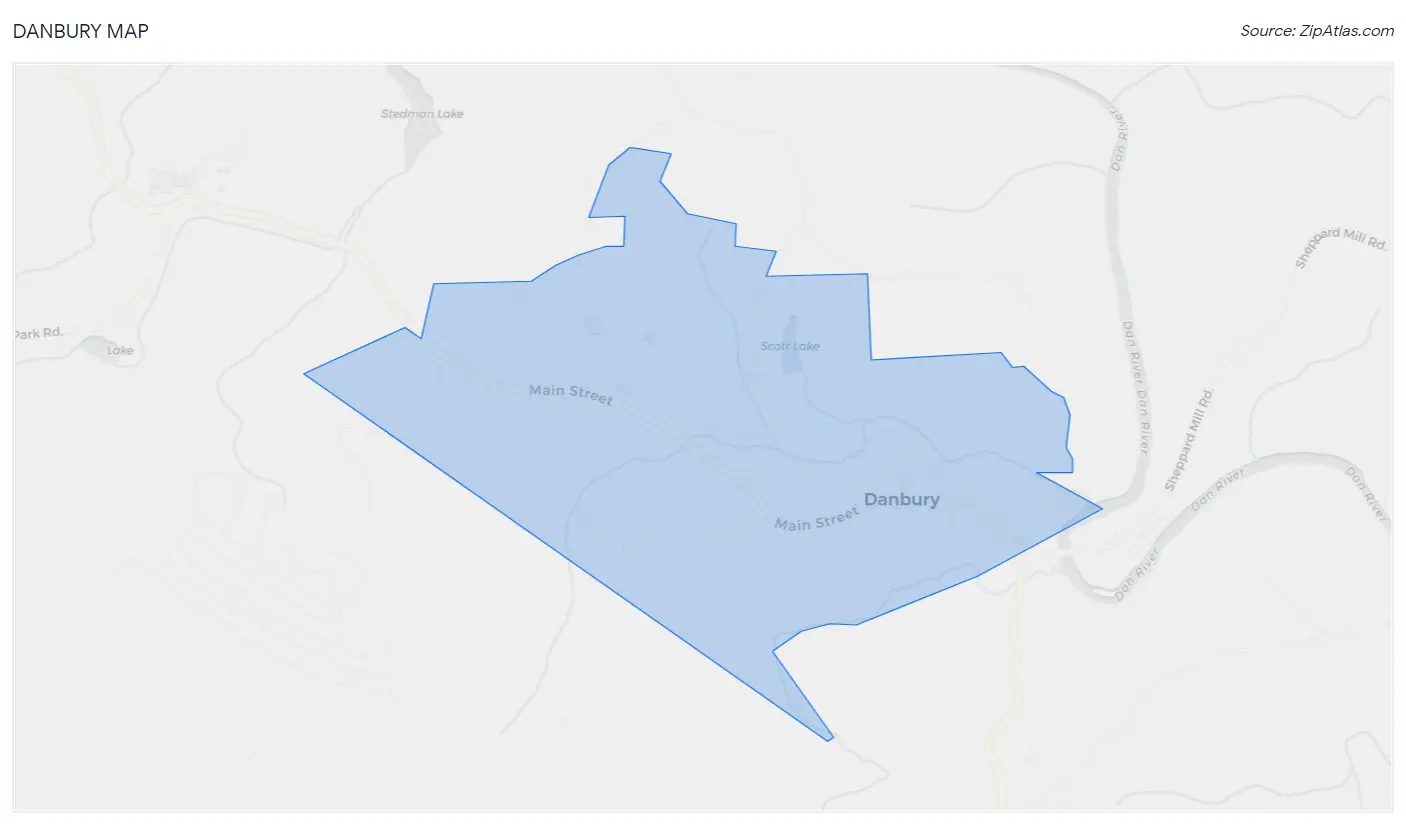
Danbury Map
Danbury Overview
$30,422
PER CAPITA INCOME
$77,222
AVG FAMILY INCOME
$77,222
AVG HOUSEHOLD INCOME
22.1%
WAGE / INCOME GAP [ % ]
77.9¢/ $1
WAGE / INCOME GAP [ $ ]
0.26
INEQUALITY / GINI INDEX
293
TOTAL POPULATION
213
MALE POPULATION
80
FEMALE POPULATION
266.25
MALES / 100 FEMALES
37.56
FEMALES / 100 MALES
43.4
MEDIAN AGE
3.1
AVG FAMILY SIZE
2.5
AVG HOUSEHOLD SIZE
152
LABOR FORCE [ PEOPLE ]
55.1%
PERCENT IN LABOR FORCE
5.9%
UNEMPLOYMENT RATE
Danbury Zip Codes
Danbury Area Codes
Income in Danbury
Income Overview in Danbury
Per Capita Income in Danbury is $30,422, while median incomes of families and households are $77,222 and $77,222 respectively.
| Characteristic | Number | Measure |
| Per Capita Income | 293 | $30,422 |
| Median Family Income | 62 | $77,222 |
| Mean Family Income | 62 | $101,803 |
| Median Household Income | 90 | $77,222 |
| Mean Household Income | 90 | $90,613 |
| Income Deficit | 62 | $0 |
| Wage / Income Gap (%) | 293 | 22.12% |
| Wage / Income Gap ($) | 293 | 77.88¢ per $1 |
| Gini / Inequality Index | 293 | 0.26 |
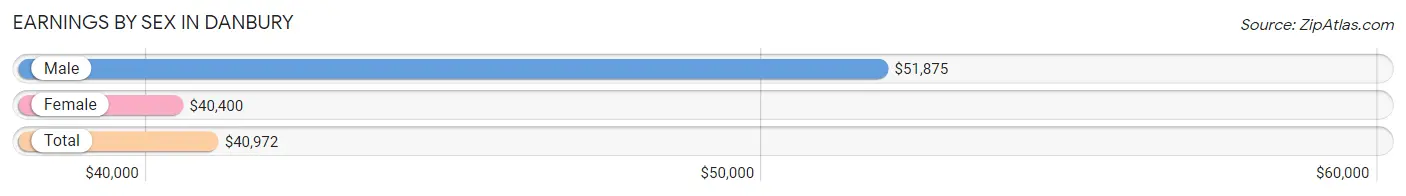
Earnings by Sex in Danbury
Average Earnings in Danbury are $40,972, $51,875 for men and $40,400 for women, a difference of 22.1%.
| Sex | Number | Average Earnings |
| Male | 111 (65.7%) | $51,875 |
| Female | 58 (34.3%) | $40,400 |
| Total | 169 (100.0%) | $40,972 |
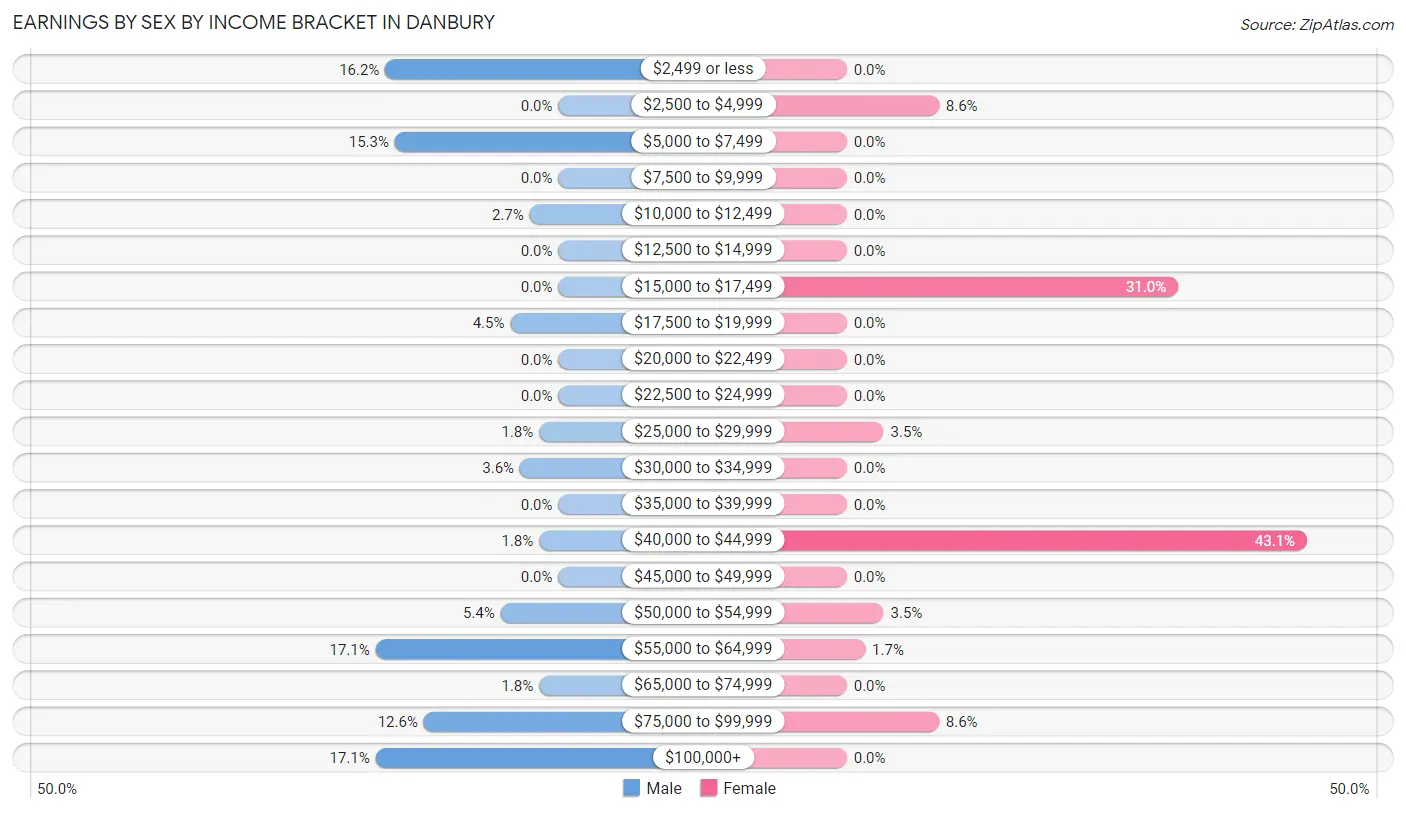
Earnings by Sex by Income Bracket in Danbury
The most common earnings brackets in Danbury are $55,000 to $64,999 for men (19 | 17.1%) and $40,000 to $44,999 for women (25 | 43.1%).
| Income | Male | Female |
| $2,499 or less | 18 (16.2%) | 0 (0.0%) |
| $2,500 to $4,999 | 0 (0.0%) | 5 (8.6%) |
| $5,000 to $7,499 | 17 (15.3%) | 0 (0.0%) |
| $7,500 to $9,999 | 0 (0.0%) | 0 (0.0%) |
| $10,000 to $12,499 | 3 (2.7%) | 0 (0.0%) |
| $12,500 to $14,999 | 0 (0.0%) | 0 (0.0%) |
| $15,000 to $17,499 | 0 (0.0%) | 18 (31.0%) |
| $17,500 to $19,999 | 5 (4.5%) | 0 (0.0%) |
| $20,000 to $22,499 | 0 (0.0%) | 0 (0.0%) |
| $22,500 to $24,999 | 0 (0.0%) | 0 (0.0%) |
| $25,000 to $29,999 | 2 (1.8%) | 2 (3.5%) |
| $30,000 to $34,999 | 4 (3.6%) | 0 (0.0%) |
| $35,000 to $39,999 | 0 (0.0%) | 0 (0.0%) |
| $40,000 to $44,999 | 2 (1.8%) | 25 (43.1%) |
| $45,000 to $49,999 | 0 (0.0%) | 0 (0.0%) |
| $50,000 to $54,999 | 6 (5.4%) | 2 (3.5%) |
| $55,000 to $64,999 | 19 (17.1%) | 1 (1.7%) |
| $65,000 to $74,999 | 2 (1.8%) | 0 (0.0%) |
| $75,000 to $99,999 | 14 (12.6%) | 5 (8.6%) |
| $100,000+ | 19 (17.1%) | 0 (0.0%) |
| Total | 111 (100.0%) | 58 (100.0%) |
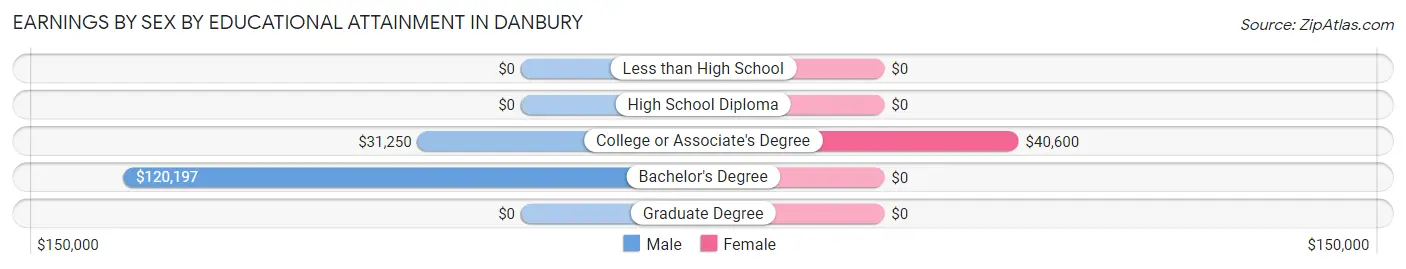
Earnings by Sex by Educational Attainment in Danbury
Average earnings in Danbury are $59,474 for men and $40,600 for women, a difference of 31.7%. Men with an educational attainment of bachelor's degree enjoy the highest average annual earnings of $120,197, while those with college or associate's degree education earn the least with $31,250. Women with an educational attainment of college or associate's degree earn the most with the average annual earnings of $40,600, while those with college or associate's degree education have the smallest earnings of $40,600.
| Educational Attainment | Male Income | Female Income |
| Less than High School | - | - |
| High School Diploma | - | - |
| College or Associate's Degree | $31,250 | $40,600 |
| Bachelor's Degree | $120,197 | $0 |
| Graduate Degree | - | - |
| Total | $59,474 | $40,600 |
Family Income in Danbury
Family Income Brackets in Danbury
According to the Danbury family income data, there are 26 families falling into the $75,000 to $99,999 income range, which is the most common income bracket and makes up 41.9% of all families.
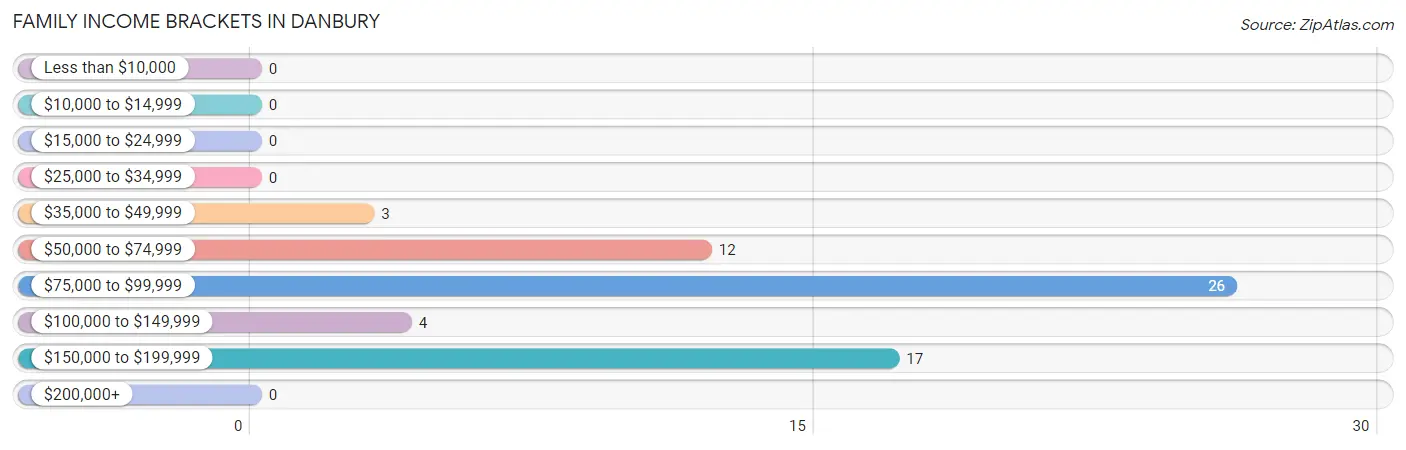
| Income Bracket | # Families | % Families |
| Less than $10,000 | 0 | 0.0% |
| $10,000 to $14,999 | 0 | 0.0% |
| $15,000 to $24,999 | 0 | 0.0% |
| $25,000 to $34,999 | 0 | 0.0% |
| $35,000 to $49,999 | 3 | 4.8% |
| $50,000 to $74,999 | 12 | 19.4% |
| $75,000 to $99,999 | 26 | 41.9% |
| $100,000 to $149,999 | 4 | 6.5% |
| $150,000 to $199,999 | 17 | 27.4% |
| $200,000+ | 0 | 0.0% |
Family Income by Famaliy Size in Danbury
2-person families (18 | 29.0%) account for the highest median family income in Danbury with $88,333 per family, while 2-person families (18 | 29.0%) have the highest median income of $44,166 per family member.
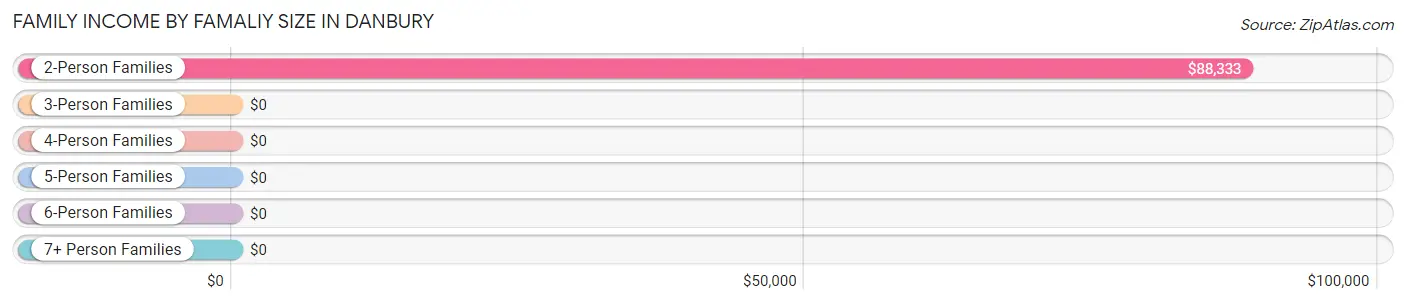
| Income Bracket | # Families | Median Income |
| 2-Person Families | 18 (29.0%) | $88,333 |
| 3-Person Families | 24 (38.7%) | $0 |
| 4-Person Families | 17 (27.4%) | $0 |
| 5-Person Families | 3 (4.8%) | $0 |
| 6-Person Families | 0 (0.0%) | $0 |
| 7+ Person Families | 0 (0.0%) | $0 |
| Total | 62 (100.0%) | $77,222 |
Family Income by Number of Earners in Danbury
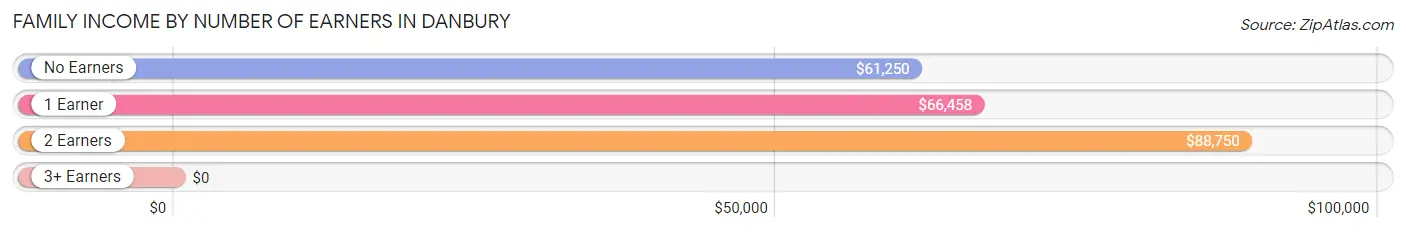
| Number of Earners | # Families | Median Income |
| No Earners | 4 (6.5%) | $61,250 |
| 1 Earner | 13 (21.0%) | $66,458 |
| 2 Earners | 7 (11.3%) | $88,750 |
| 3+ Earners | 38 (61.3%) | $0 |
| Total | 62 (100.0%) | $77,222 |
Household Income in Danbury
Household Income Brackets in Danbury
With 40 households falling in the category, the $75,000 to $99,999 income range is the most frequent in Danbury, accounting for 44.4% of all households.
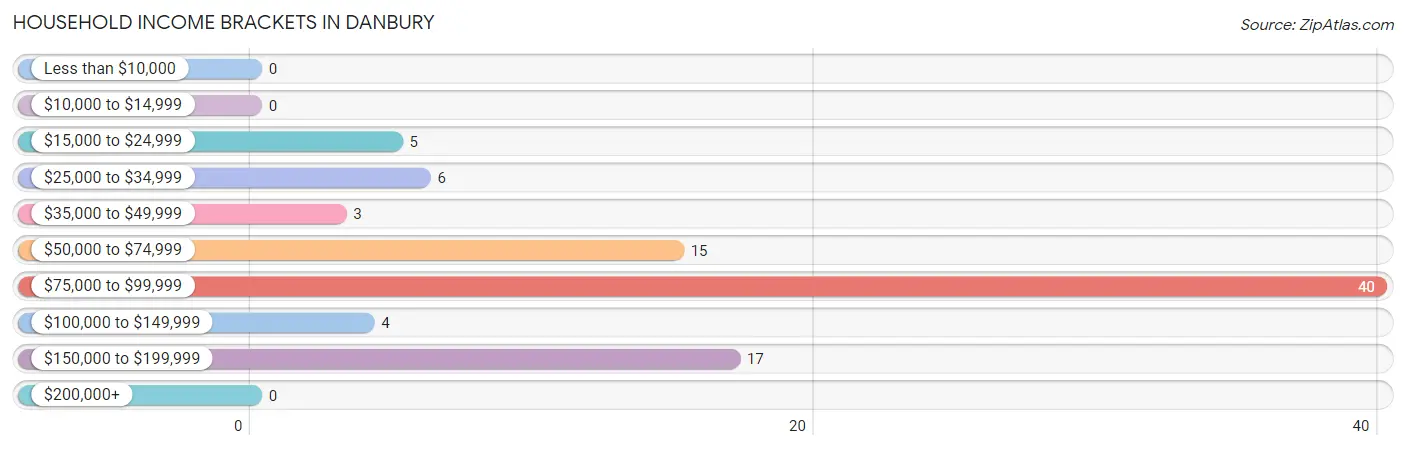
| Income Bracket | # Households | % Households |
| Less than $10,000 | 0 | 0.0% |
| $10,000 to $14,999 | 0 | 0.0% |
| $15,000 to $24,999 | 5 | 5.6% |
| $25,000 to $34,999 | 6 | 6.7% |
| $35,000 to $49,999 | 3 | 3.3% |
| $50,000 to $74,999 | 15 | 16.7% |
| $75,000 to $99,999 | 40 | 44.4% |
| $100,000 to $149,999 | 4 | 4.4% |
| $150,000 to $199,999 | 17 | 18.9% |
| $200,000+ | 0 | 0.0% |
Household Income by Householder Age in Danbury
The median household income in Danbury is $77,222, with the highest median household income of $95,268 found in the 45 to 64 years age bracket for the primary householder. A total of 33 households (36.7%) fall into this category.
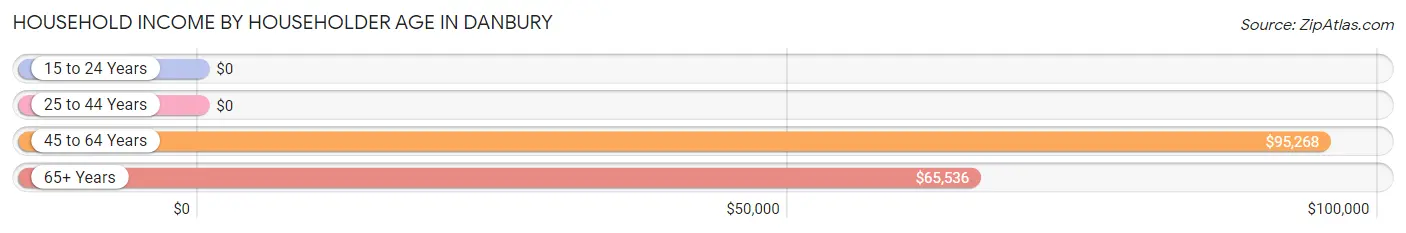
| Income Bracket | # Households | Median Income |
| 15 to 24 Years | 0 (0.0%) | $0 |
| 25 to 44 Years | 38 (42.2%) | $0 |
| 45 to 64 Years | 33 (36.7%) | $95,268 |
| 65+ Years | 19 (21.1%) | $65,536 |
| Total | 90 (100.0%) | $77,222 |
Poverty in Danbury
Income Below Poverty by Sex and Age in Danbury
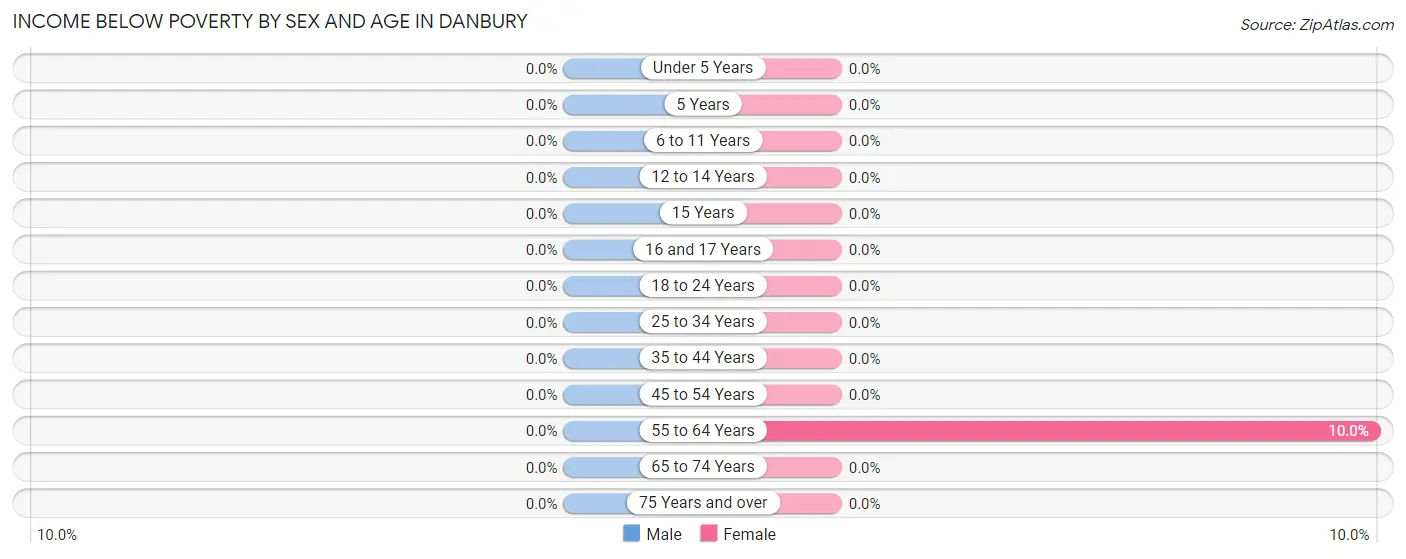
| Age Bracket | Male | Female |
| Under 5 Years | 0 (0.0%) | 0 (0.0%) |
| 5 Years | 0 (0.0%) | 0 (0.0%) |
| 6 to 11 Years | 0 (0.0%) | 0 (0.0%) |
| 12 to 14 Years | 0 (0.0%) | 0 (0.0%) |
| 15 Years | 0 (0.0%) | 0 (0.0%) |
| 16 and 17 Years | 0 (0.0%) | 0 (0.0%) |
| 18 to 24 Years | 0 (0.0%) | 0 (0.0%) |
| 25 to 34 Years | 0 (0.0%) | 0 (0.0%) |
| 35 to 44 Years | 0 (0.0%) | 0 (0.0%) |
| 45 to 54 Years | 0 (0.0%) | 0 (0.0%) |
| 55 to 64 Years | 0 (0.0%) | 1 (10.0%) |
| 65 to 74 Years | 0 (0.0%) | 0 (0.0%) |
| 75 Years and over | 0 (0.0%) | 0 (0.0%) |
| Total | 0 (0.0%) | 1 (1.3%) |
Income Above Poverty by Sex and Age in Danbury
According to the poverty statistics in Danbury, males aged 12 to 14 years and females aged 18 to 24 years are the age groups that are most secure financially, with 100.0% of males and 100.0% of females in these age groups living above the poverty line.
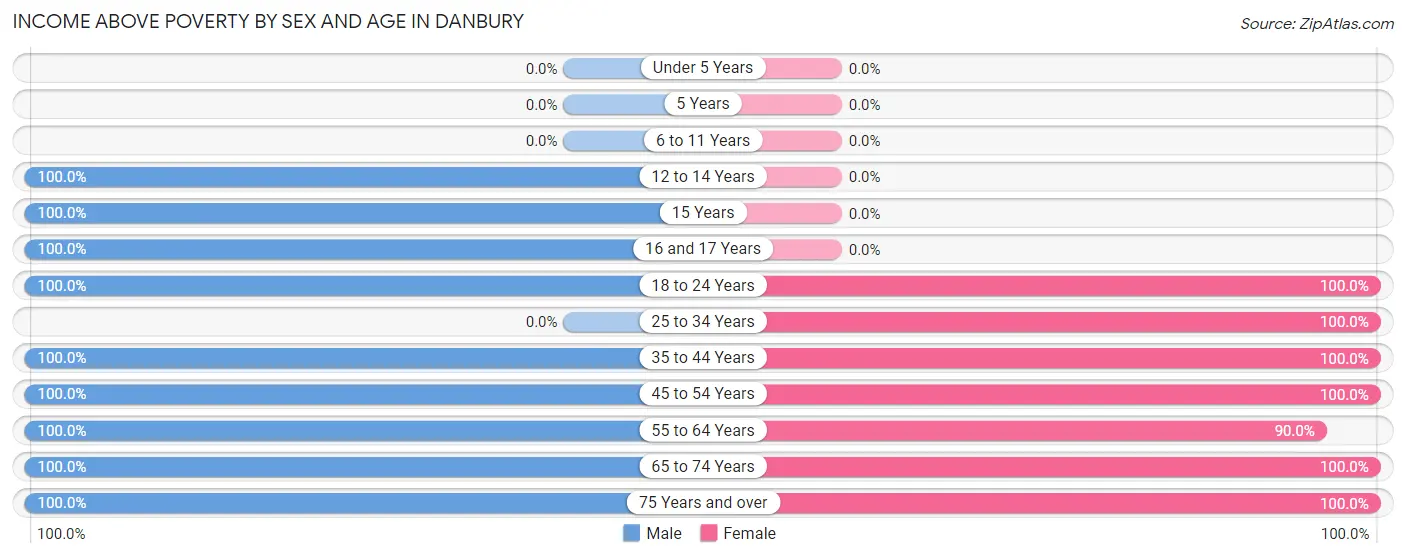
| Age Bracket | Male | Female |
| Under 5 Years | 0 (0.0%) | 0 (0.0%) |
| 5 Years | 0 (0.0%) | 0 (0.0%) |
| 6 to 11 Years | 0 (0.0%) | 0 (0.0%) |
| 12 to 14 Years | 14 (100.0%) | 0 (0.0%) |
| 15 Years | 3 (100.0%) | 0 (0.0%) |
| 16 and 17 Years | 14 (100.0%) | 0 (0.0%) |
| 18 to 24 Years | 19 (100.0%) | 4 (100.0%) |
| 25 to 34 Years | 0 (0.0%) | 8 (100.0%) |
| 35 to 44 Years | 27 (100.0%) | 35 (100.0%) |
| 45 to 54 Years | 28 (100.0%) | 8 (100.0%) |
| 55 to 64 Years | 21 (100.0%) | 9 (90.0%) |
| 65 to 74 Years | 13 (100.0%) | 10 (100.0%) |
| 75 Years and over | 4 (100.0%) | 5 (100.0%) |
| Total | 143 (100.0%) | 79 (98.8%) |
Income Below Poverty Among Married-Couple Families in Danbury
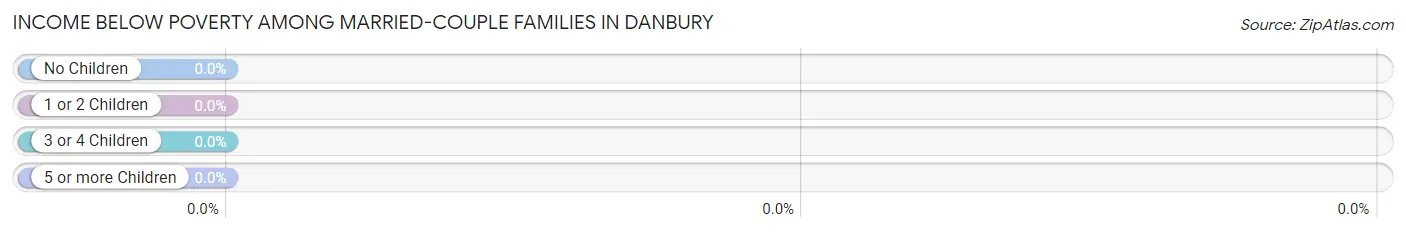
| Children | Above Poverty | Below Poverty |
| No Children | 39 (100.0%) | 0 (0.0%) |
| 1 or 2 Children | 20 (100.0%) | 0 (0.0%) |
| 3 or 4 Children | 0 (0.0%) | 0 (0.0%) |
| 5 or more Children | 0 (0.0%) | 0 (0.0%) |
| Total | 59 (100.0%) | 0 (0.0%) |
Income Below Poverty Among Single-Parent Households in Danbury
| Children | Single Father | Single Mother |
| No Children | 0 (0.0%) | 0 (0.0%) |
| 1 or 2 Children | 0 (0.0%) | 0 (0.0%) |
| 3 or 4 Children | 0 (0.0%) | 0 (0.0%) |
| 5 or more Children | 0 (0.0%) | 0 (0.0%) |
| Total | 0 (0.0%) | 0 (0.0%) |
Income Below Poverty Among Married-Couple vs Single-Parent Households in Danbury
| Children | Married-Couple Families | Single-Parent Households |
| No Children | 0 (0.0%) | 0 (0.0%) |
| 1 or 2 Children | 0 (0.0%) | 0 (0.0%) |
| 3 or 4 Children | 0 (0.0%) | 0 (0.0%) |
| 5 or more Children | 0 (0.0%) | 0 (0.0%) |
| Total | 0 (0.0%) | 0 (0.0%) |
Race in Danbury
The most populous races in Danbury are White / Caucasian (260 | 88.7%), and Black / African American (33 | 11.3%).
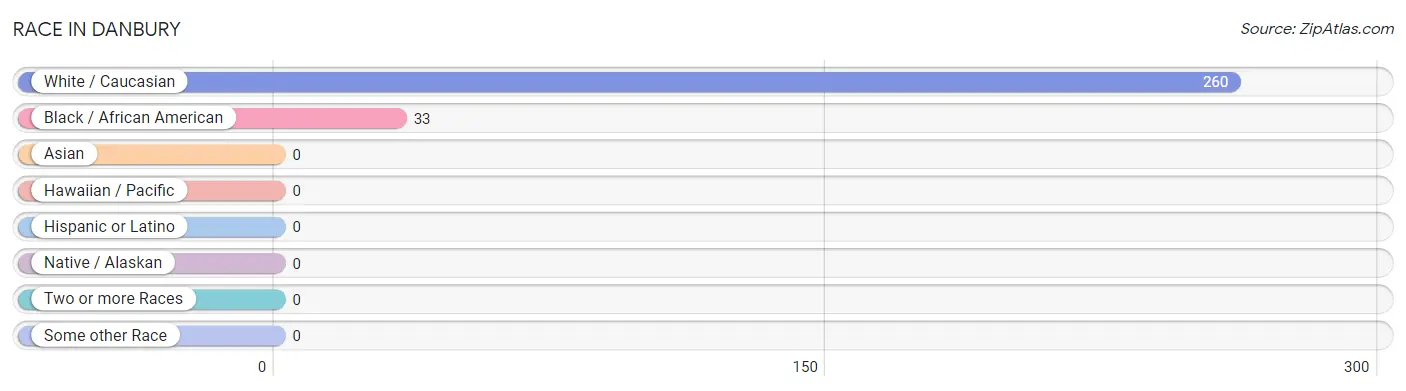
| Race | # Population | % Population |
| Asian | 0 | 0.0% |
| Black / African American | 33 | 11.3% |
| Hawaiian / Pacific | 0 | 0.0% |
| Hispanic or Latino | 0 | 0.0% |
| Native / Alaskan | 0 | 0.0% |
| White / Caucasian | 260 | 88.7% |
| Two or more Races | 0 | 0.0% |
| Some other Race | 0 | 0.0% |
| Total | 293 | 100.0% |
Ancestry in Danbury
The most populous ancestries reported in Danbury are English (88 | 30.0%), German (52 | 17.7%), Scotch-Irish (16 | 5.5%), American (11 | 3.7%), and Irish (8 | 2.7%), together accounting for 59.7% of all Danbury residents.
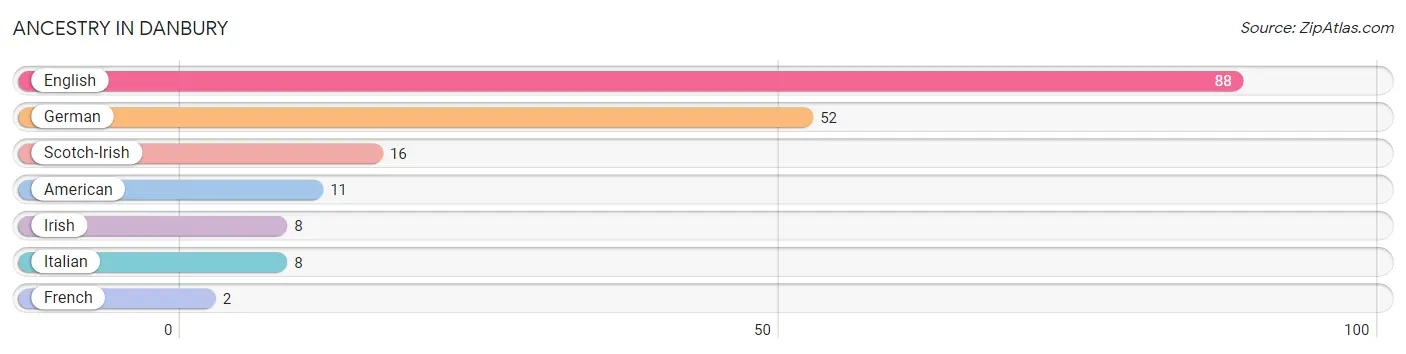
| Ancestry | # Population | % Population |
| American | 11 | 3.7% |
| English | 88 | 30.0% |
| French | 2 | 0.7% |
| German | 52 | 17.7% |
| Irish | 8 | 2.7% |
| Italian | 8 | 2.7% |
| Scotch-Irish | 16 | 5.5% | View All 7 Rows |
Immigrants in Danbury

| Immigration Origin | # Population | % Population | View All 0 Rows |
Sex and Age in Danbury
Sex and Age in Danbury
The most populous age groups in Danbury are 20 to 24 Years (34 | 16.0%) for men and 40 to 44 Years (35 | 43.8%) for women.
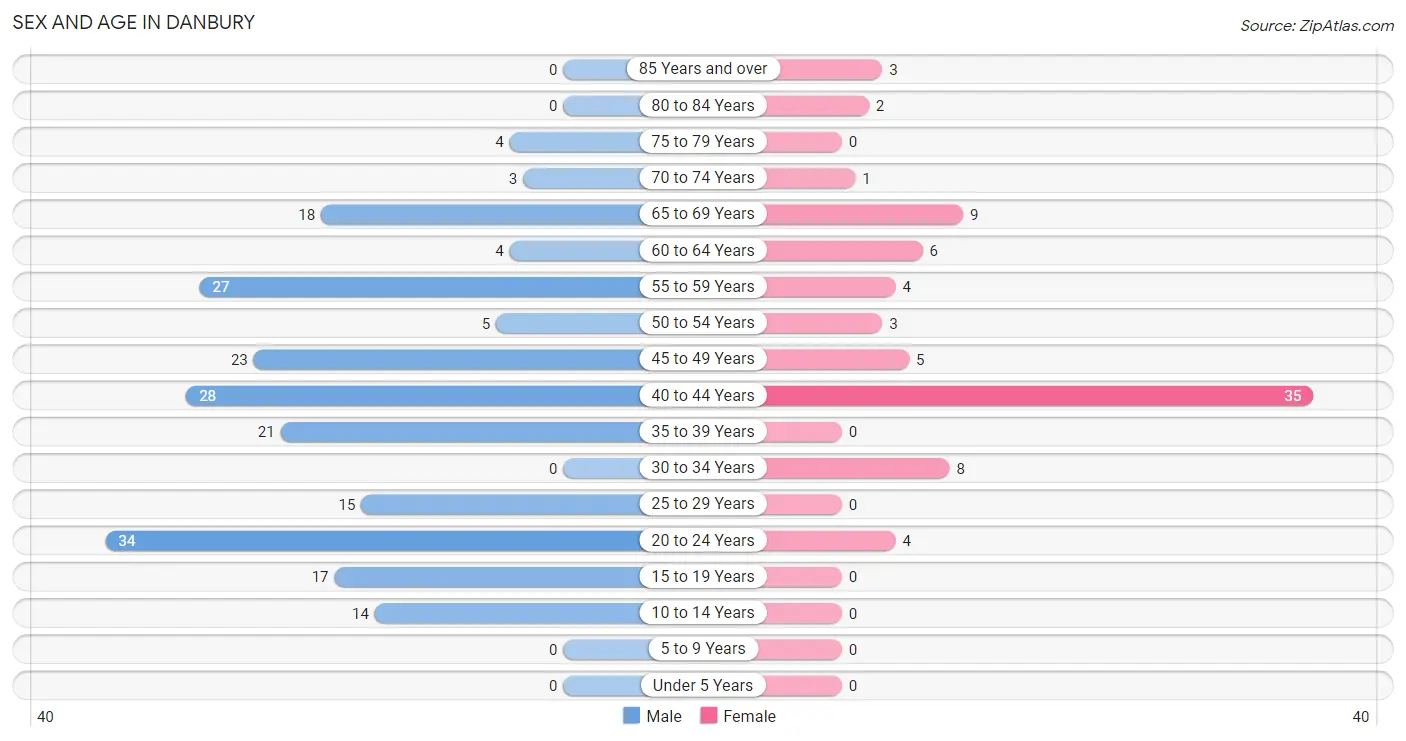
| Age Bracket | Male | Female |
| Under 5 Years | 0 (0.0%) | 0 (0.0%) |
| 5 to 9 Years | 0 (0.0%) | 0 (0.0%) |
| 10 to 14 Years | 14 (6.6%) | 0 (0.0%) |
| 15 to 19 Years | 17 (8.0%) | 0 (0.0%) |
| 20 to 24 Years | 34 (16.0%) | 4 (5.0%) |
| 25 to 29 Years | 15 (7.0%) | 0 (0.0%) |
| 30 to 34 Years | 0 (0.0%) | 8 (10.0%) |
| 35 to 39 Years | 21 (9.9%) | 0 (0.0%) |
| 40 to 44 Years | 28 (13.2%) | 35 (43.8%) |
| 45 to 49 Years | 23 (10.8%) | 5 (6.2%) |
| 50 to 54 Years | 5 (2.4%) | 3 (3.7%) |
| 55 to 59 Years | 27 (12.7%) | 4 (5.0%) |
| 60 to 64 Years | 4 (1.9%) | 6 (7.5%) |
| 65 to 69 Years | 18 (8.5%) | 9 (11.3%) |
| 70 to 74 Years | 3 (1.4%) | 1 (1.3%) |
| 75 to 79 Years | 4 (1.9%) | 0 (0.0%) |
| 80 to 84 Years | 0 (0.0%) | 2 (2.5%) |
| 85 Years and over | 0 (0.0%) | 3 (3.7%) |
| Total | 213 (100.0%) | 80 (100.0%) |
Families and Households in Danbury
Median Family Size in Danbury
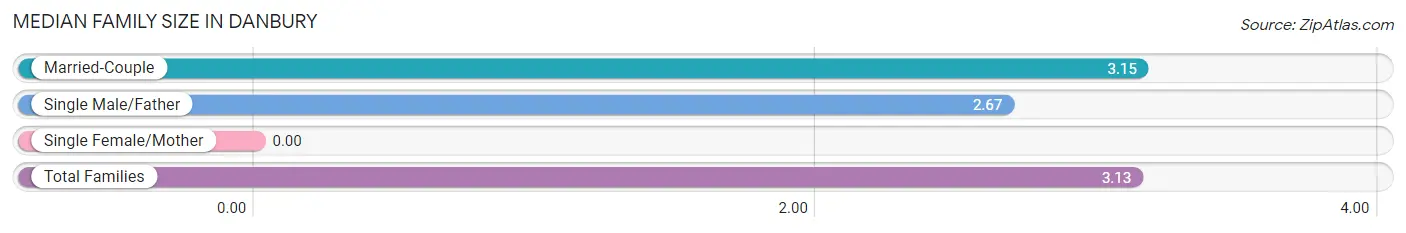
| Family Type | # Families | Family Size |
| Married-Couple | 59 (95.2%) | 3.15 |
| Single Male/Father | 3 (4.8%) | 2.67 |
| Single Female/Mother | 0 (0.0%) | - |
| Total Families | 62 (100.0%) | 3.13 |
Median Household Size in Danbury
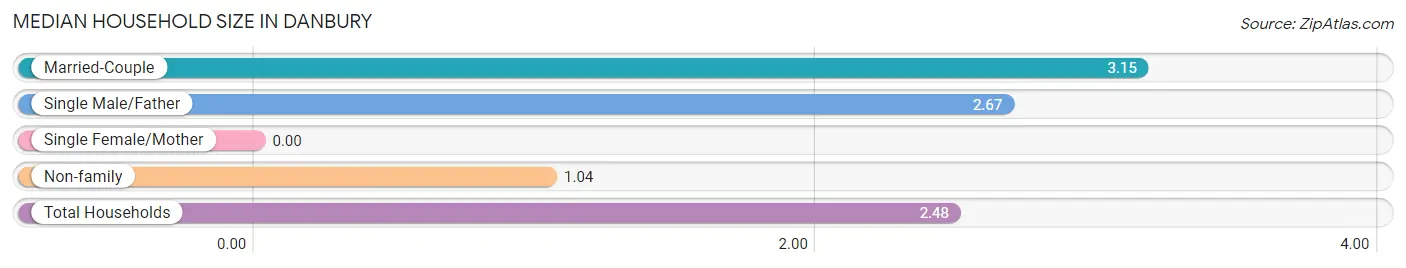
| Household Type | # Households | Household Size |
| Married-Couple | 59 (65.6%) | 3.15 |
| Single Male/Father | 3 (3.3%) | 2.67 |
| Single Female/Mother | 0 (0.0%) | - |
| Non-family | 28 (31.1%) | 1.04 |
| Total Households | 90 (100.0%) | 2.48 |
Household Size by Marriage Status in Danbury
Out of a total of 90 households in Danbury, 62 (68.9%) are family households, while 28 (31.1%) are nonfamily households. The most numerous type of family households are 3-person households, comprising 24, and the most common type of nonfamily households are 1-person households, comprising 26.
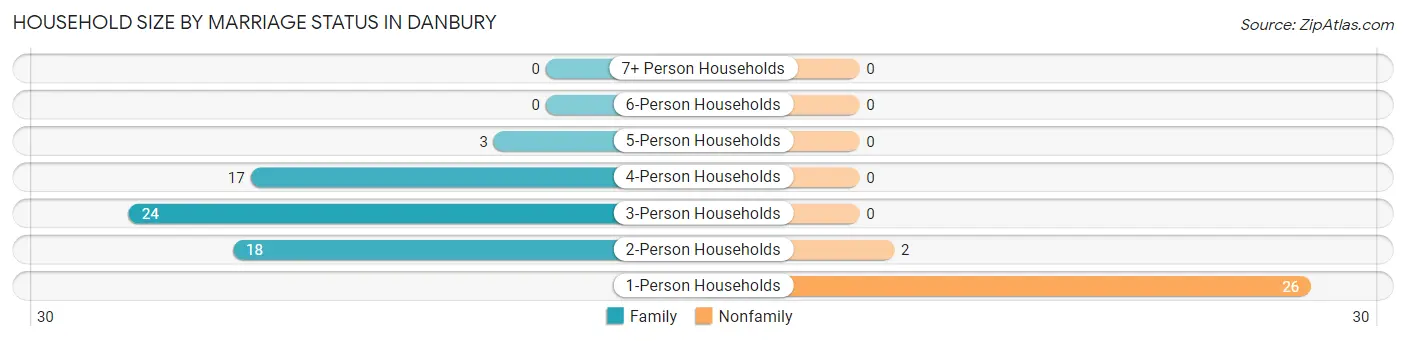
| Household Size | Family Households | Nonfamily Households |
| 1-Person Households | - | 26 (28.9%) |
| 2-Person Households | 18 (20.0%) | 2 (2.2%) |
| 3-Person Households | 24 (26.7%) | 0 (0.0%) |
| 4-Person Households | 17 (18.9%) | 0 (0.0%) |
| 5-Person Households | 3 (3.3%) | 0 (0.0%) |
| 6-Person Households | 0 (0.0%) | 0 (0.0%) |
| 7+ Person Households | 0 (0.0%) | 0 (0.0%) |
| Total | 62 (68.9%) | 28 (31.1%) |
Female Fertility in Danbury
Fertility by Age in Danbury
| Age Bracket | Women with Births | Births / 1,000 Women |
| 15 to 19 years | 0 (0.0%) | 0.0 |
| 20 to 34 years | 0 (0.0%) | 0.0 |
| 35 to 50 years | 0 (0.0%) | 0.0 |
| Total | 0 (0.0%) | 0.0 |
Fertility by Age by Marriage Status in Danbury
| Age Bracket | Married | Unmarried |
| 15 to 19 years | 0 (0.0%) | 0 (0.0%) |
| 20 to 34 years | 0 (0.0%) | 0 (0.0%) |
| 35 to 50 years | 0 (0.0%) | 0 (0.0%) |
| Total | 0 (0.0%) | 0 (0.0%) |
Fertility by Education in Danbury
| Educational Attainment | Women with Births | Births / 1,000 Women |
| Less than High School | 0 (0.0%) | 0.0 |
| High School Diploma | 0 (0.0%) | 0.0 |
| College or Associate's Degree | 0 (0.0%) | 0.0 |
| Bachelor's Degree | 0 (0.0%) | 0.0 |
| Graduate Degree | 0 (0.0%) | 0.0 |
| Total | 0 (0.0%) | 0.0 |
Fertility by Education by Marriage Status in Danbury
| Educational Attainment | Married | Unmarried |
| Less than High School | 0 (0.0%) | 0 (0.0%) |
| High School Diploma | 0 (0.0%) | 0 (0.0%) |
| College or Associate's Degree | 0 (0.0%) | 0 (0.0%) |
| Bachelor's Degree | 0 (0.0%) | 0 (0.0%) |
| Graduate Degree | 0 (0.0%) | 0 (0.0%) |
| Total | 0 (0.0%) | 0 (0.0%) |
Employment Characteristics in Danbury
Employment by Class of Employer in Danbury
Among the 142 employed individuals in Danbury, private company employees (105 | 73.9%), local government employees (27 | 19.0%), and self-employed (incorporated) (5 | 3.5%) make up the most common classes of employment.
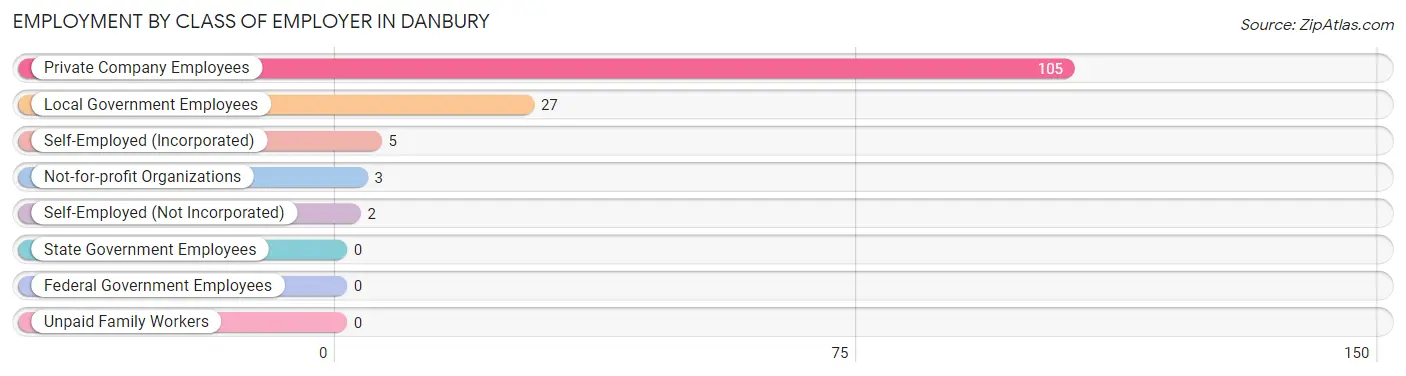
| Employer Class | # Employees | % Employees |
| Private Company Employees | 105 | 73.9% |
| Self-Employed (Incorporated) | 5 | 3.5% |
| Self-Employed (Not Incorporated) | 2 | 1.4% |
| Not-for-profit Organizations | 3 | 2.1% |
| Local Government Employees | 27 | 19.0% |
| State Government Employees | 0 | 0.0% |
| Federal Government Employees | 0 | 0.0% |
| Unpaid Family Workers | 0 | 0.0% |
| Total | 142 | 100.0% |
Employment Status by Age in Danbury
According to the labor force statistics for Danbury, out of the total population over 16 years of age (276), 55.1% or 152 individuals are in the labor force, with 5.9% or 9 of them unemployed. The age group with the highest labor force participation rate is 30 to 34 years, with 100.0% or 8 individuals in the labor force. Within the labor force, the 20 to 24 years age range has the highest percentage of unemployed individuals, with 17.4% or 4 of them being unemployed.
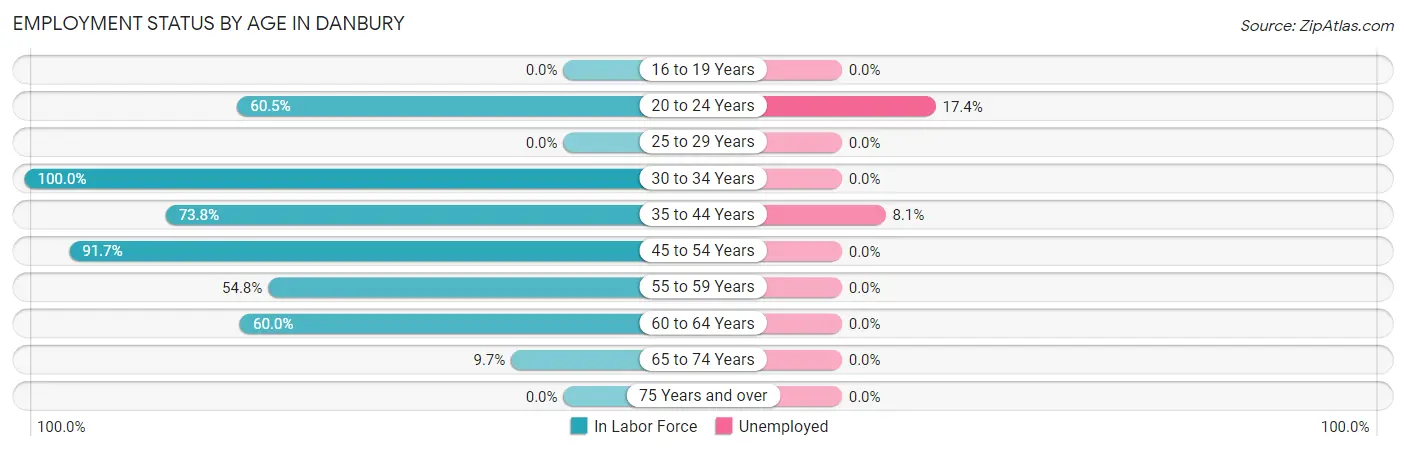
| Age Bracket | In Labor Force | Unemployed |
| 16 to 19 Years | 0 (0.0%) | 0 (0.0%) |
| 20 to 24 Years | 23 (60.5%) | 4 (17.4%) |
| 25 to 29 Years | 0 (0.0%) | 0 (0.0%) |
| 30 to 34 Years | 8 (100.0%) | 0 (0.0%) |
| 35 to 44 Years | 62 (73.8%) | 5 (8.1%) |
| 45 to 54 Years | 33 (91.7%) | 0 (0.0%) |
| 55 to 59 Years | 17 (54.8%) | 0 (0.0%) |
| 60 to 64 Years | 6 (60.0%) | 0 (0.0%) |
| 65 to 74 Years | 3 (9.7%) | 0 (0.0%) |
| 75 Years and over | 0 (0.0%) | 0 (0.0%) |
| Total | 152 (55.1%) | 9 (5.9%) |
Employment Status by Educational Attainment in Danbury
According to labor force statistics for Danbury, 68.5% of individuals (126) out of the total population between 25 and 64 years of age (184) are in the labor force, with 4.0% or 5 of them being unemployed. The group with the highest labor force participation rate are those with the educational attainment of college / associate degree, with 95.4% or 62 individuals in the labor force. Within the labor force, individuals with college / associate degree education have the highest percentage of unemployment, with 8.1% or 5 of them being unemployed.
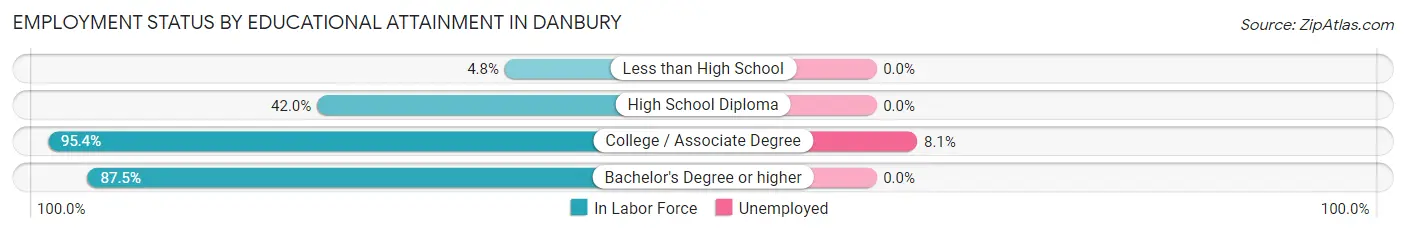
| Educational Attainment | In Labor Force | Unemployed |
| Less than High School | 1 (4.8%) | 0 (0.0%) |
| High School Diploma | 21 (42.0%) | 0 (0.0%) |
| College / Associate Degree | 62 (95.4%) | 5 (8.1%) |
| Bachelor's Degree or higher | 42 (87.5%) | 0 (0.0%) |
| Total | 126 (68.5%) | 7 (4.0%) |
Employment Occupations by Sex in Danbury
Management, Business, Science and Arts Occupations
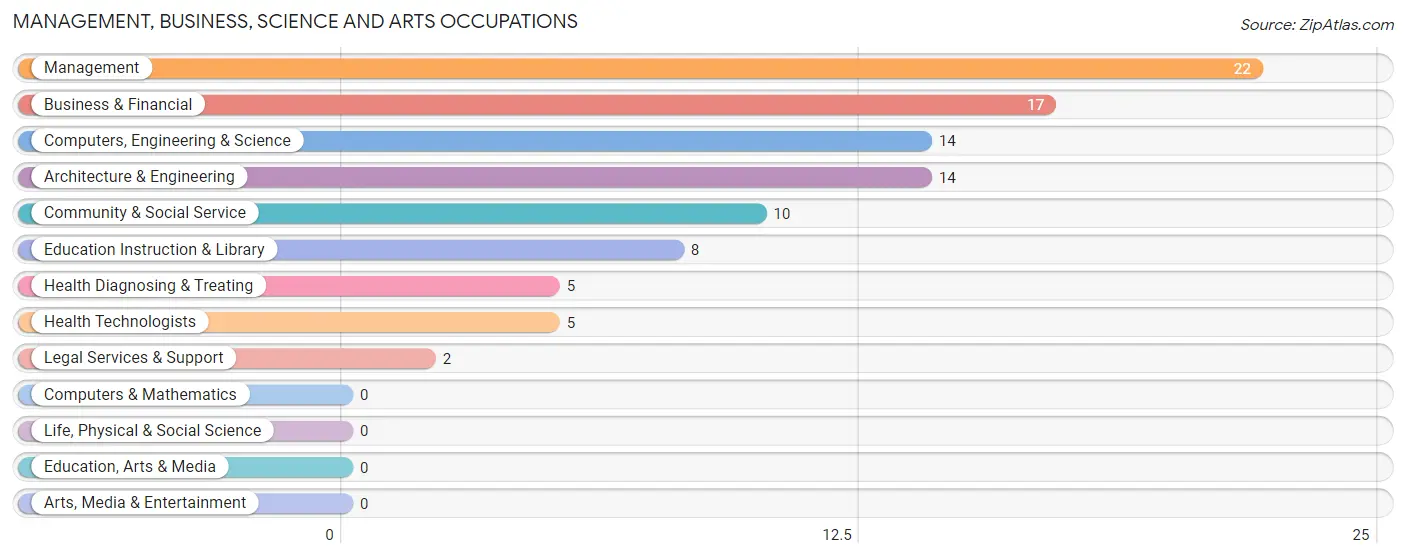
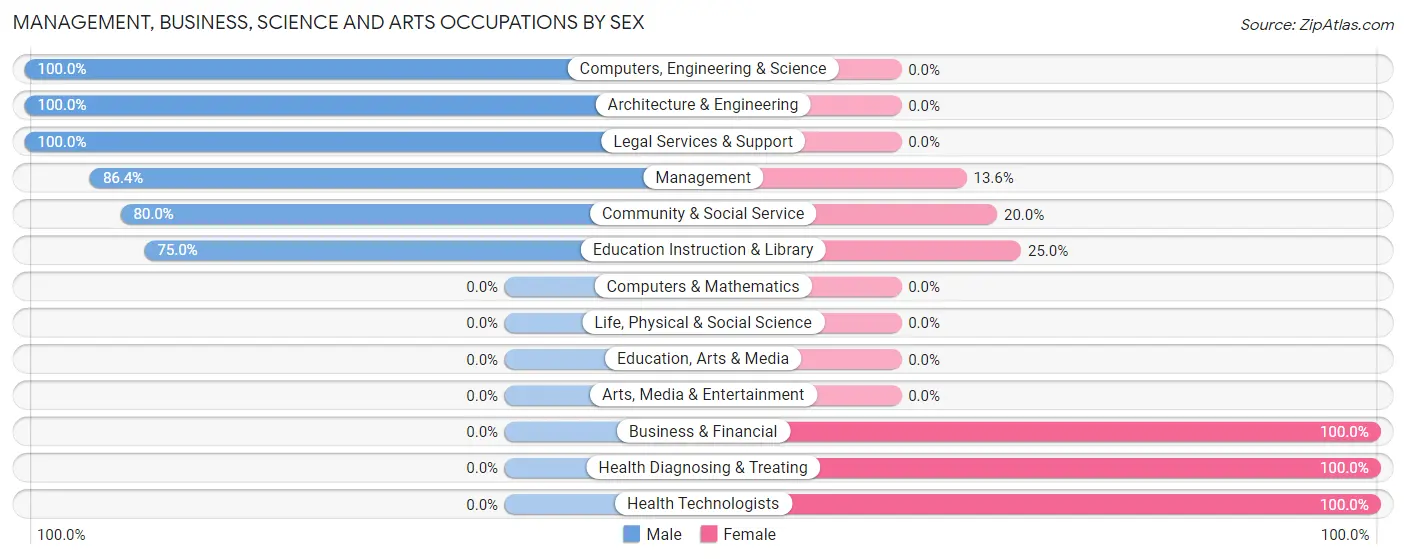
The most common Management, Business, Science and Arts occupations in Danbury are Management (22 | 15.4%), Business & Financial (17 | 11.9%), Computers, Engineering & Science (14 | 9.8%), Architecture & Engineering (14 | 9.8%), and Community & Social Service (10 | 7.0%).
Management, Business, Science and Arts Occupations by Sex
Within the Management, Business, Science and Arts occupations in Danbury, the most male-oriented occupations are Computers, Engineering & Science (100.0%), Architecture & Engineering (100.0%), and Legal Services & Support (100.0%), while the most female-oriented occupations are Business & Financial (100.0%), Health Diagnosing & Treating (100.0%), and Health Technologists (100.0%).
| Occupation | Male | Female |
| Management | 19 (86.4%) | 3 (13.6%) |
| Business & Financial | 0 (0.0%) | 17 (100.0%) |
| Computers, Engineering & Science | 14 (100.0%) | 0 (0.0%) |
| Computers & Mathematics | 0 (0.0%) | 0 (0.0%) |
| Architecture & Engineering | 14 (100.0%) | 0 (0.0%) |
| Life, Physical & Social Science | 0 (0.0%) | 0 (0.0%) |
| Community & Social Service | 8 (80.0%) | 2 (20.0%) |
| Education, Arts & Media | 0 (0.0%) | 0 (0.0%) |
| Legal Services & Support | 2 (100.0%) | 0 (0.0%) |
| Education Instruction & Library | 6 (75.0%) | 2 (25.0%) |
| Arts, Media & Entertainment | 0 (0.0%) | 0 (0.0%) |
| Health Diagnosing & Treating | 0 (0.0%) | 5 (100.0%) |
| Health Technologists | 0 (0.0%) | 5 (100.0%) |
| Total (Category) | 41 (60.3%) | 27 (39.7%) |
| Total (Overall) | 90 (62.9%) | 53 (37.1%) |
Services Occupations
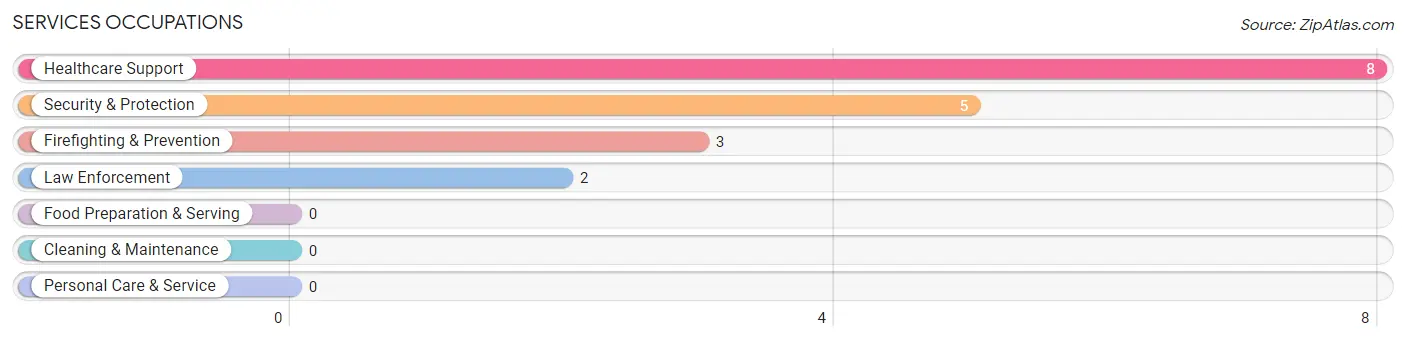
The most common Services occupations in Danbury are Healthcare Support (8 | 5.6%), Security & Protection (5 | 3.5%), Firefighting & Prevention (3 | 2.1%), and Law Enforcement (2 | 1.4%).
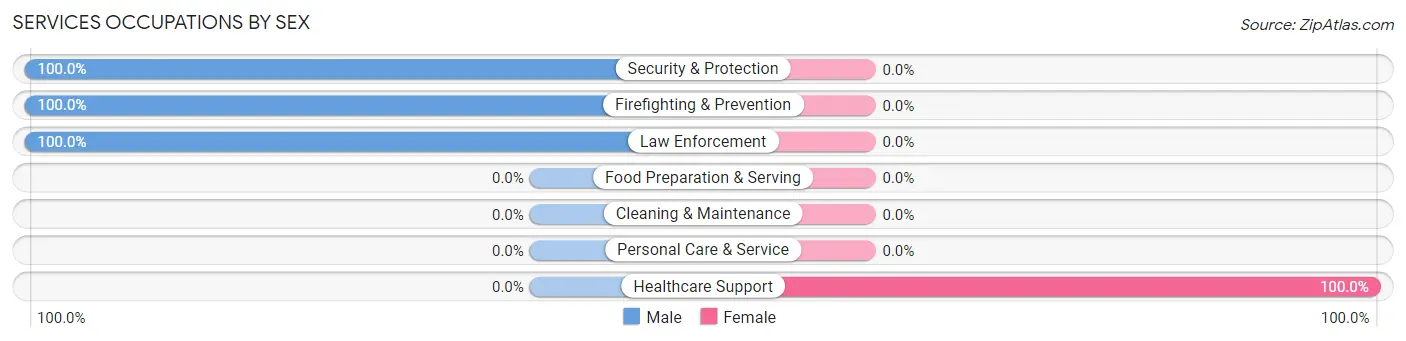
Services Occupations by Sex
| Occupation | Male | Female |
| Healthcare Support | 0 (0.0%) | 8 (100.0%) |
| Security & Protection | 5 (100.0%) | 0 (0.0%) |
| Firefighting & Prevention | 3 (100.0%) | 0 (0.0%) |
| Law Enforcement | 2 (100.0%) | 0 (0.0%) |
| Food Preparation & Serving | 0 (0.0%) | 0 (0.0%) |
| Cleaning & Maintenance | 0 (0.0%) | 0 (0.0%) |
| Personal Care & Service | 0 (0.0%) | 0 (0.0%) |
| Total (Category) | 5 (38.5%) | 8 (61.5%) |
| Total (Overall) | 90 (62.9%) | 53 (37.1%) |
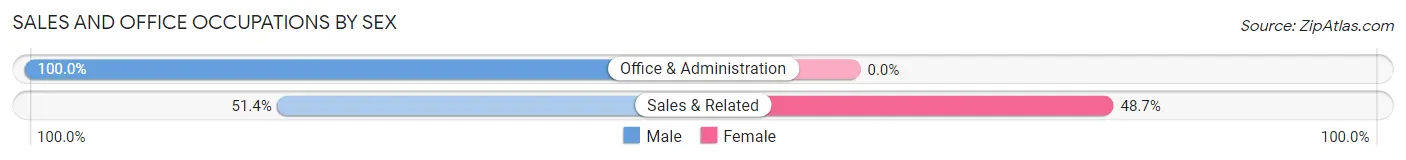
Sales and Office Occupations
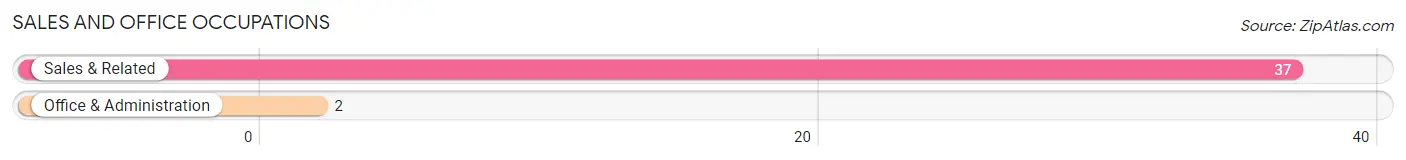
The most common Sales and Office occupations in Danbury are Sales & Related (37 | 25.9%), and Office & Administration (2 | 1.4%).
Sales and Office Occupations by Sex
| Occupation | Male | Female |
| Sales & Related | 19 (51.3%) | 18 (48.6%) |
| Office & Administration | 2 (100.0%) | 0 (0.0%) |
| Total (Category) | 21 (53.8%) | 18 (46.2%) |
| Total (Overall) | 90 (62.9%) | 53 (37.1%) |
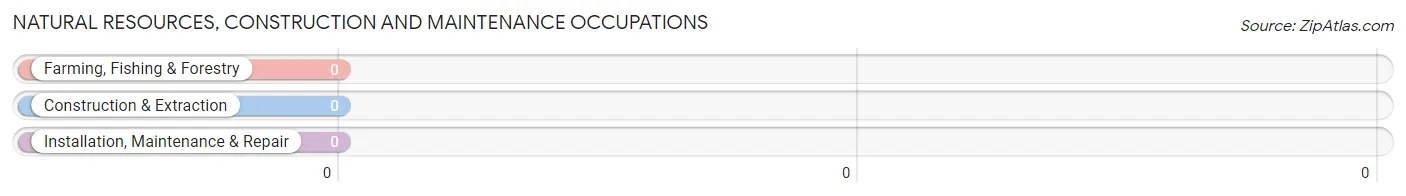
Natural Resources, Construction and Maintenance Occupations
Natural Resources, Construction and Maintenance Occupations by Sex
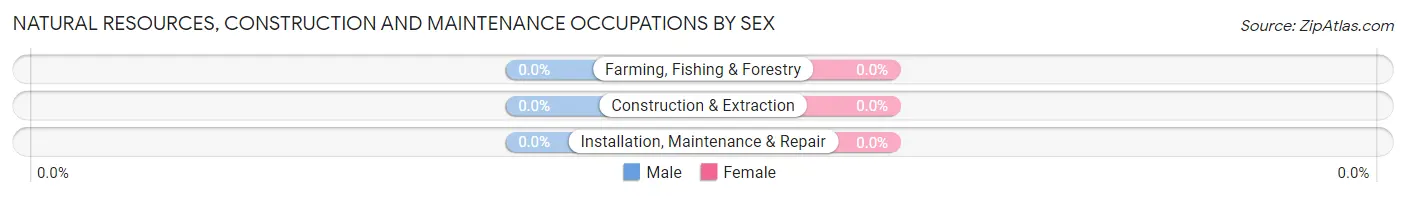
| Occupation | Male | Female |
| Farming, Fishing & Forestry | 0 (0.0%) | 0 (0.0%) |
| Construction & Extraction | 0 (0.0%) | 0 (0.0%) |
| Installation, Maintenance & Repair | 0 (0.0%) | 0 (0.0%) |
| Total (Category) | 0 (0.0%) | 0 (0.0%) |
| Total (Overall) | 90 (62.9%) | 53 (37.1%) |
Production, Transportation and Moving Occupations
The most common Production, Transportation and Moving occupations in Danbury are Transportation (20 | 14.0%), and Production (3 | 2.1%).
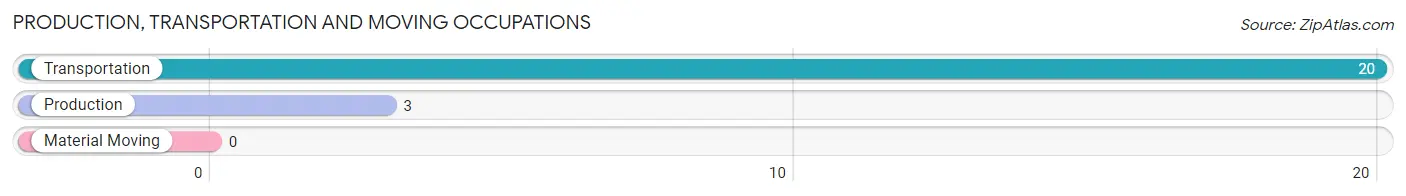
Production, Transportation and Moving Occupations by Sex
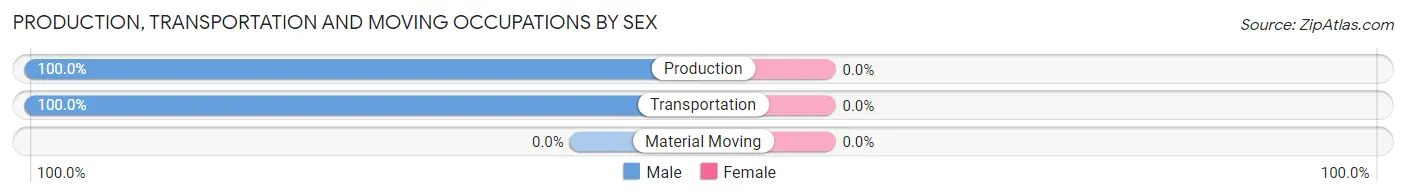
| Occupation | Male | Female |
| Production | 3 (100.0%) | 0 (0.0%) |
| Transportation | 20 (100.0%) | 0 (0.0%) |
| Material Moving | 0 (0.0%) | 0 (0.0%) |
| Total (Category) | 23 (100.0%) | 0 (0.0%) |
| Total (Overall) | 90 (62.9%) | 53 (37.1%) |
Employment Industries by Sex in Danbury
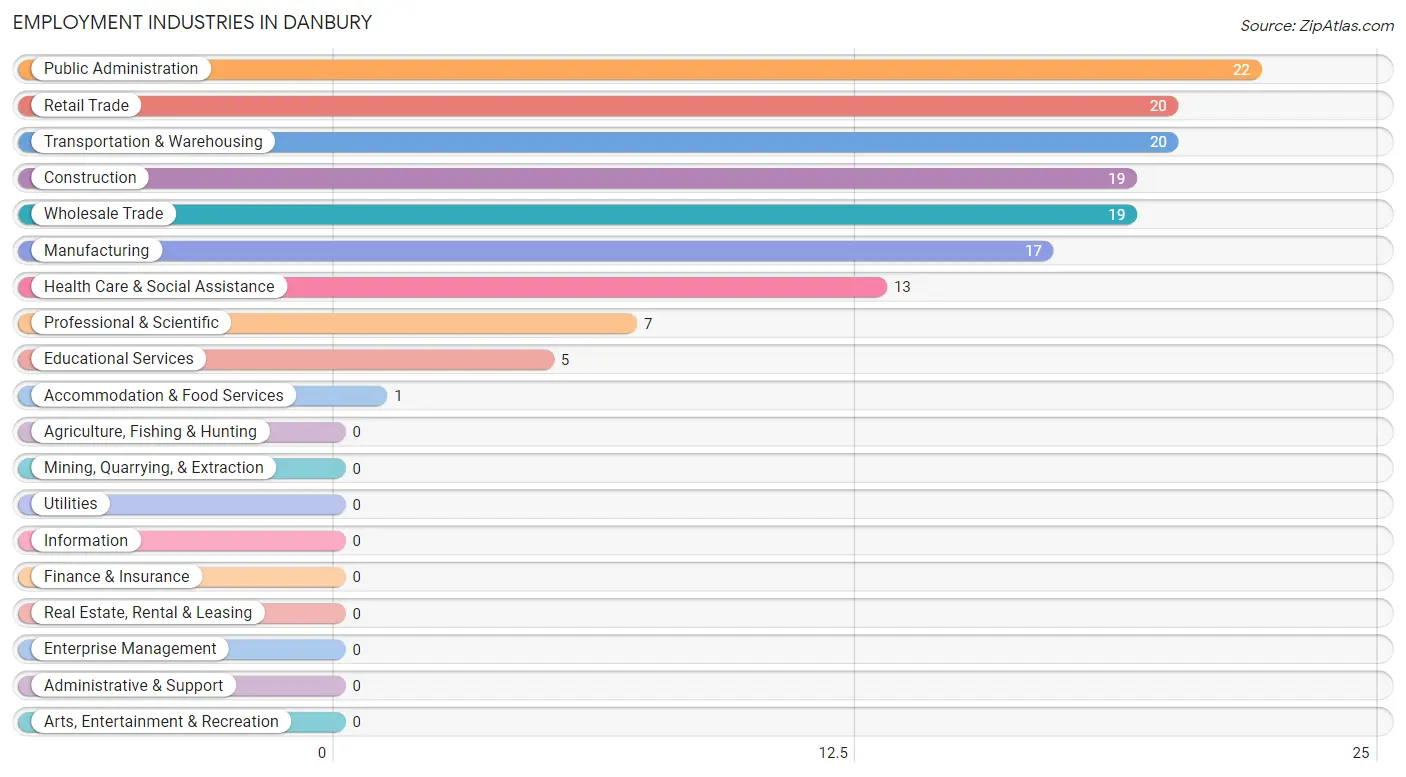
Employment Industries in Danbury
The major employment industries in Danbury include Public Administration (22 | 15.4%), Retail Trade (20 | 14.0%), Transportation & Warehousing (20 | 14.0%), Construction (19 | 13.3%), and Wholesale Trade (19 | 13.3%).
Employment Industries by Sex in Danbury
The Danbury industries that see more men than women are Construction (100.0%), Manufacturing (100.0%), and Wholesale Trade (100.0%), whereas the industries that tend to have a higher number of women are Health Care & Social Assistance (100.0%), Accommodation & Food Services (100.0%), and Retail Trade (90.0%).
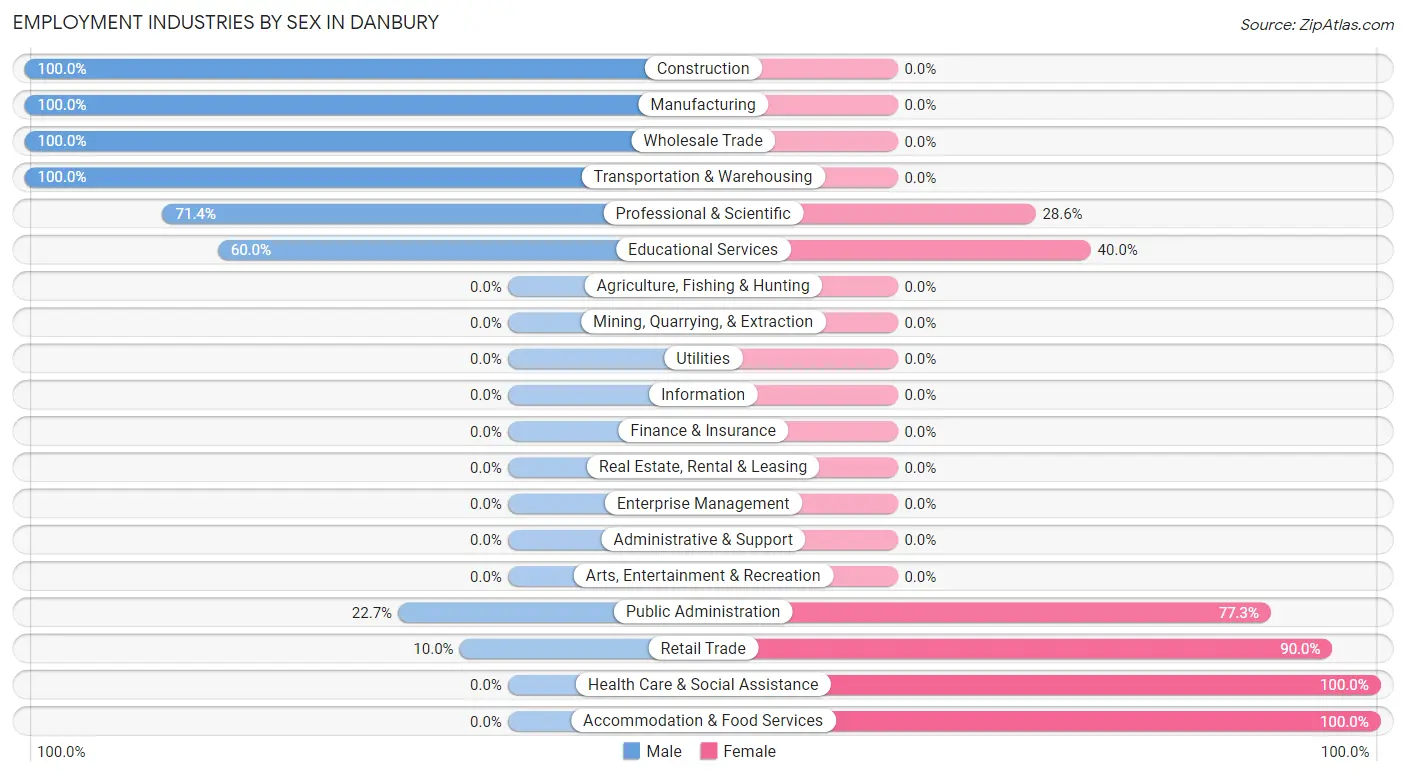
| Industry | Male | Female |
| Agriculture, Fishing & Hunting | 0 (0.0%) | 0 (0.0%) |
| Mining, Quarrying, & Extraction | 0 (0.0%) | 0 (0.0%) |
| Construction | 19 (100.0%) | 0 (0.0%) |
| Manufacturing | 17 (100.0%) | 0 (0.0%) |
| Wholesale Trade | 19 (100.0%) | 0 (0.0%) |
| Retail Trade | 2 (10.0%) | 18 (90.0%) |
| Transportation & Warehousing | 20 (100.0%) | 0 (0.0%) |
| Utilities | 0 (0.0%) | 0 (0.0%) |
| Information | 0 (0.0%) | 0 (0.0%) |
| Finance & Insurance | 0 (0.0%) | 0 (0.0%) |
| Real Estate, Rental & Leasing | 0 (0.0%) | 0 (0.0%) |
| Professional & Scientific | 5 (71.4%) | 2 (28.6%) |
| Enterprise Management | 0 (0.0%) | 0 (0.0%) |
| Administrative & Support | 0 (0.0%) | 0 (0.0%) |
| Educational Services | 3 (60.0%) | 2 (40.0%) |
| Health Care & Social Assistance | 0 (0.0%) | 13 (100.0%) |
| Arts, Entertainment & Recreation | 0 (0.0%) | 0 (0.0%) |
| Accommodation & Food Services | 0 (0.0%) | 1 (100.0%) |
| Public Administration | 5 (22.7%) | 17 (77.3%) |
| Total | 90 (62.9%) | 53 (37.1%) |
Education in Danbury
School Enrollment in Danbury
The most common levels of schooling among the 55 students in Danbury are college / undergraduate (24 | 43.6%), high school (17 | 30.9%), and middle school (14 | 25.5%).
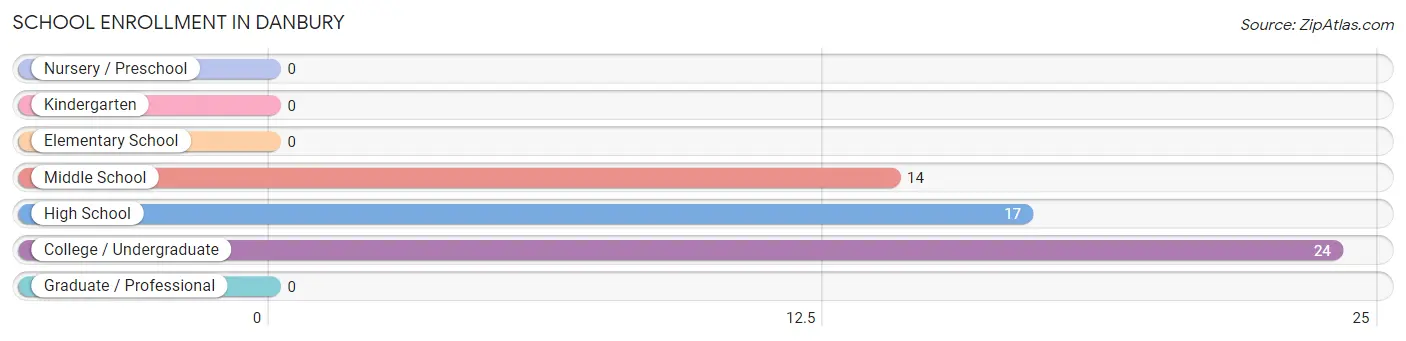
| School Level | # Students | % Students |
| Nursery / Preschool | 0 | 0.0% |
| Kindergarten | 0 | 0.0% |
| Elementary School | 0 | 0.0% |
| Middle School | 14 | 25.5% |
| High School | 17 | 30.9% |
| College / Undergraduate | 24 | 43.6% |
| Graduate / Professional | 0 | 0.0% |
| Total | 55 | 100.0% |
School Enrollment by Age by Funding Source in Danbury
Out of a total of 55 students who are enrolled in schools in Danbury, 3 (5.5%) attend a private institution, while the remaining 52 (94.5%) are enrolled in public schools. The age group of 15 to 17 year olds has the highest likelihood of being enrolled in private schools, with 3 (17.6% in the age bracket) enrolled. Conversely, the age group of 10 to 14 year olds has the lowest likelihood of being enrolled in a private school, with 14 (100.0% in the age bracket) attending a public institution.
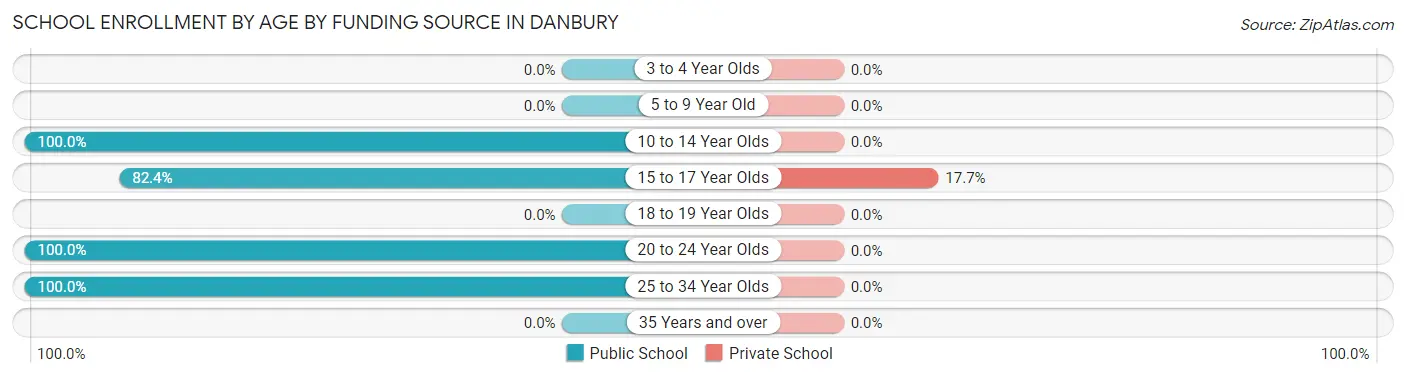
| Age Bracket | Public School | Private School |
| 3 to 4 Year Olds | 0 (0.0%) | 0 (0.0%) |
| 5 to 9 Year Old | 0 (0.0%) | 0 (0.0%) |
| 10 to 14 Year Olds | 14 (100.0%) | 0 (0.0%) |
| 15 to 17 Year Olds | 14 (82.4%) | 3 (17.6%) |
| 18 to 19 Year Olds | 0 (0.0%) | 0 (0.0%) |
| 20 to 24 Year Olds | 16 (100.0%) | 0 (0.0%) |
| 25 to 34 Year Olds | 8 (100.0%) | 0 (0.0%) |
| 35 Years and over | 0 (0.0%) | 0 (0.0%) |
| Total | 52 (94.5%) | 3 (5.5%) |
Educational Attainment by Field of Study in Danbury
Business (21 | 35.0%), engineering (14 | 23.3%), visual & performing arts (8 | 13.3%), education (5 | 8.3%), and literature & languages (5 | 8.3%) are the most common fields of study among 60 individuals in Danbury who have obtained a bachelor's degree or higher.
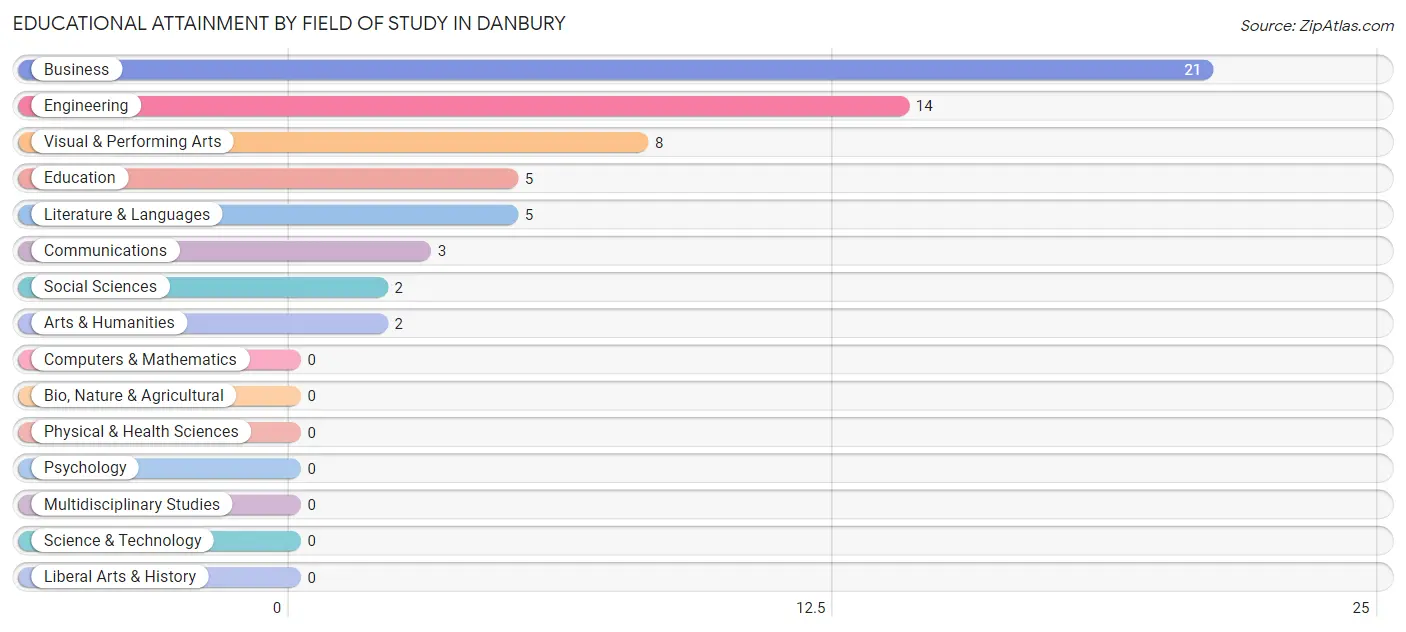
| Field of Study | # Graduates | % Graduates |
| Computers & Mathematics | 0 | 0.0% |
| Bio, Nature & Agricultural | 0 | 0.0% |
| Physical & Health Sciences | 0 | 0.0% |
| Psychology | 0 | 0.0% |
| Social Sciences | 2 | 3.3% |
| Engineering | 14 | 23.3% |
| Multidisciplinary Studies | 0 | 0.0% |
| Science & Technology | 0 | 0.0% |
| Business | 21 | 35.0% |
| Education | 5 | 8.3% |
| Literature & Languages | 5 | 8.3% |
| Liberal Arts & History | 0 | 0.0% |
| Visual & Performing Arts | 8 | 13.3% |
| Communications | 3 | 5.0% |
| Arts & Humanities | 2 | 3.3% |
| Total | 60 | 100.0% |
Transportation & Commute in Danbury
Vehicle Availability by Sex in Danbury
The most prevalent vehicle ownership categories in Danbury are males with 4 vehicles (38, accounting for 42.2%) and females with 4 vehicles (22, making up 73.1%).
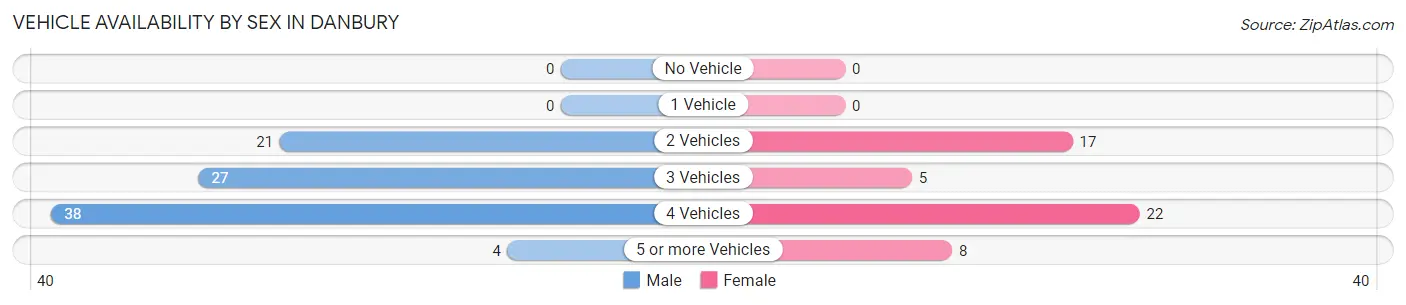
| Vehicles Available | Male | Female |
| No Vehicle | 0 (0.0%) | 0 (0.0%) |
| 1 Vehicle | 0 (0.0%) | 0 (0.0%) |
| 2 Vehicles | 21 (23.3%) | 17 (32.7%) |
| 3 Vehicles | 27 (30.0%) | 5 (9.6%) |
| 4 Vehicles | 38 (42.2%) | 22 (42.3%) |
| 5 or more Vehicles | 4 (4.4%) | 8 (15.4%) |
| Total | 90 (100.0%) | 52 (100.0%) |
Commute Time in Danbury
The most frequently occuring commute durations in Danbury are 60 to 89 minutes (30 commuters, 21.9%), 45 to 59 minutes (27 commuters, 19.7%), and 5 to 9 minutes (22 commuters, 16.1%).
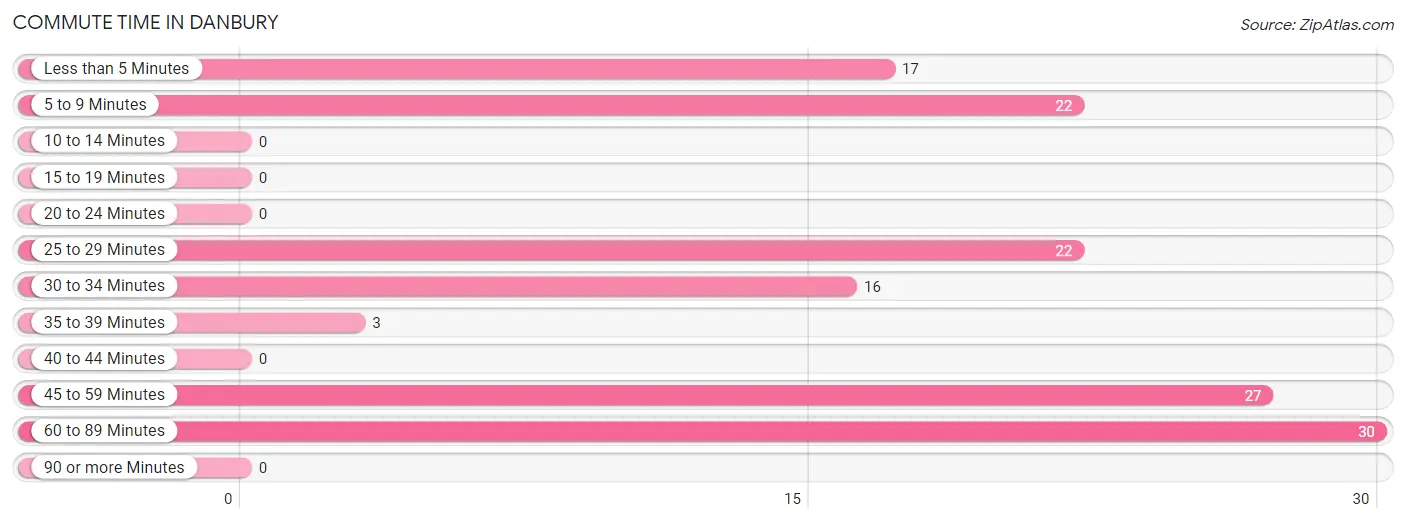
| Commute Time | # Commuters | % Commuters |
| Less than 5 Minutes | 17 | 12.4% |
| 5 to 9 Minutes | 22 | 16.1% |
| 10 to 14 Minutes | 0 | 0.0% |
| 15 to 19 Minutes | 0 | 0.0% |
| 20 to 24 Minutes | 0 | 0.0% |
| 25 to 29 Minutes | 22 | 16.1% |
| 30 to 34 Minutes | 16 | 11.7% |
| 35 to 39 Minutes | 3 | 2.2% |
| 40 to 44 Minutes | 0 | 0.0% |
| 45 to 59 Minutes | 27 | 19.7% |
| 60 to 89 Minutes | 30 | 21.9% |
| 90 or more Minutes | 0 | 0.0% |
Commute Time by Sex in Danbury
The most common commute times in Danbury are 45 to 59 minutes (25 commuters, 28.7%) for males and 5 to 9 minutes (18 commuters, 36.0%) for females.
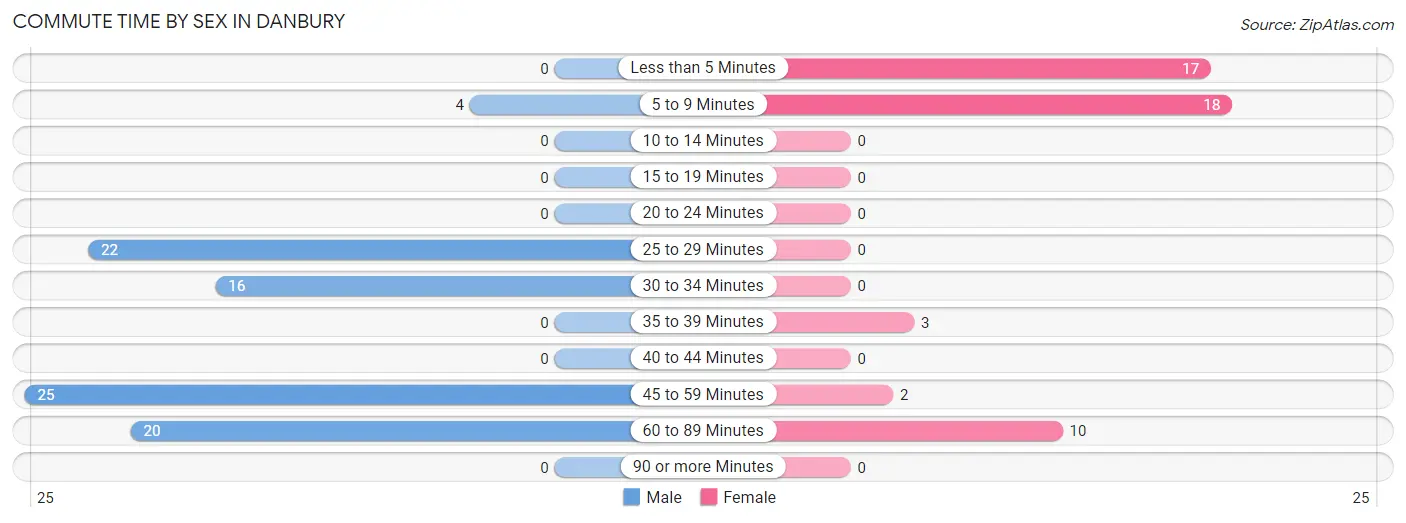
| Commute Time | Male | Female |
| Less than 5 Minutes | 0 (0.0%) | 17 (34.0%) |
| 5 to 9 Minutes | 4 (4.6%) | 18 (36.0%) |
| 10 to 14 Minutes | 0 (0.0%) | 0 (0.0%) |
| 15 to 19 Minutes | 0 (0.0%) | 0 (0.0%) |
| 20 to 24 Minutes | 0 (0.0%) | 0 (0.0%) |
| 25 to 29 Minutes | 22 (25.3%) | 0 (0.0%) |
| 30 to 34 Minutes | 16 (18.4%) | 0 (0.0%) |
| 35 to 39 Minutes | 0 (0.0%) | 3 (6.0%) |
| 40 to 44 Minutes | 0 (0.0%) | 0 (0.0%) |
| 45 to 59 Minutes | 25 (28.7%) | 2 (4.0%) |
| 60 to 89 Minutes | 20 (23.0%) | 10 (20.0%) |
| 90 or more Minutes | 0 (0.0%) | 0 (0.0%) |
Time of Departure to Work by Sex in Danbury
The most frequent times of departure to work in Danbury are 6:30 AM to 6:59 AM (37, 42.5%) for males and 6:00 AM to 6:29 AM (18, 36.0%) for females.
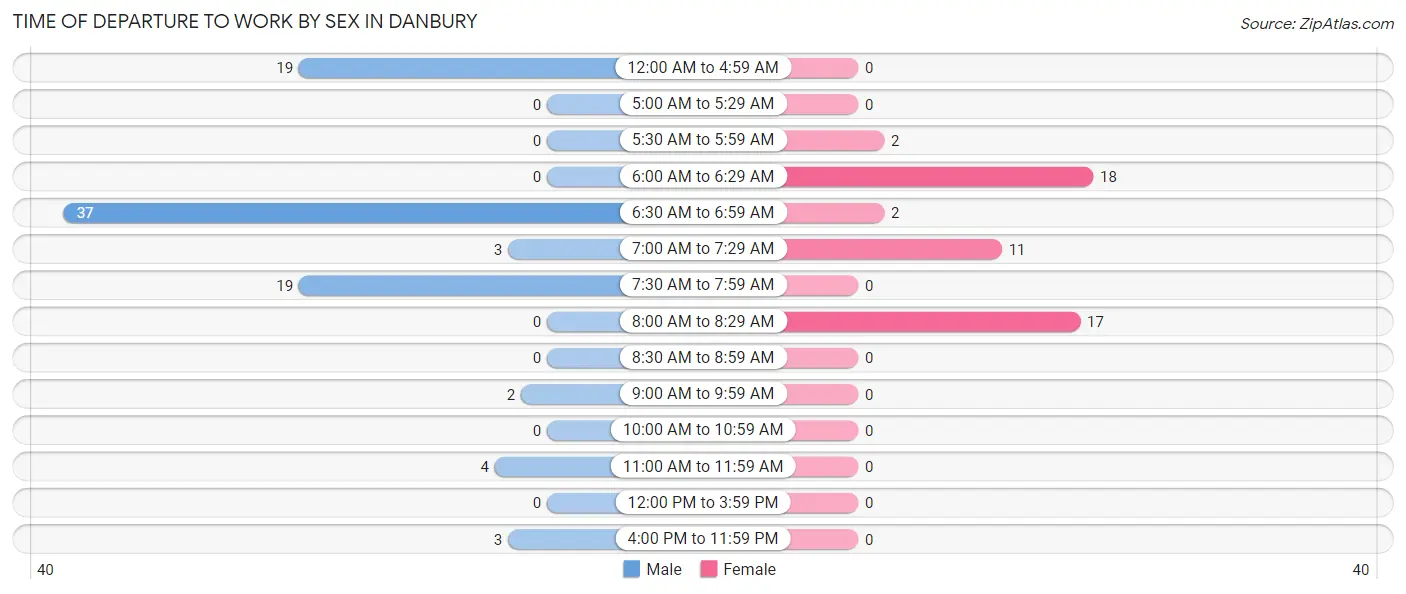
| Time of Departure | Male | Female |
| 12:00 AM to 4:59 AM | 19 (21.8%) | 0 (0.0%) |
| 5:00 AM to 5:29 AM | 0 (0.0%) | 0 (0.0%) |
| 5:30 AM to 5:59 AM | 0 (0.0%) | 2 (4.0%) |
| 6:00 AM to 6:29 AM | 0 (0.0%) | 18 (36.0%) |
| 6:30 AM to 6:59 AM | 37 (42.5%) | 2 (4.0%) |
| 7:00 AM to 7:29 AM | 3 (3.5%) | 11 (22.0%) |
| 7:30 AM to 7:59 AM | 19 (21.8%) | 0 (0.0%) |
| 8:00 AM to 8:29 AM | 0 (0.0%) | 17 (34.0%) |
| 8:30 AM to 8:59 AM | 0 (0.0%) | 0 (0.0%) |
| 9:00 AM to 9:59 AM | 2 (2.3%) | 0 (0.0%) |
| 10:00 AM to 10:59 AM | 0 (0.0%) | 0 (0.0%) |
| 11:00 AM to 11:59 AM | 4 (4.6%) | 0 (0.0%) |
| 12:00 PM to 3:59 PM | 0 (0.0%) | 0 (0.0%) |
| 4:00 PM to 11:59 PM | 3 (3.5%) | 0 (0.0%) |
| Total | 87 (100.0%) | 50 (100.0%) |
Housing Occupancy in Danbury
Occupancy by Ownership in Danbury
Of the total 90 dwellings in Danbury, owner-occupied units account for 88 (97.8%), while renter-occupied units make up 2 (2.2%).
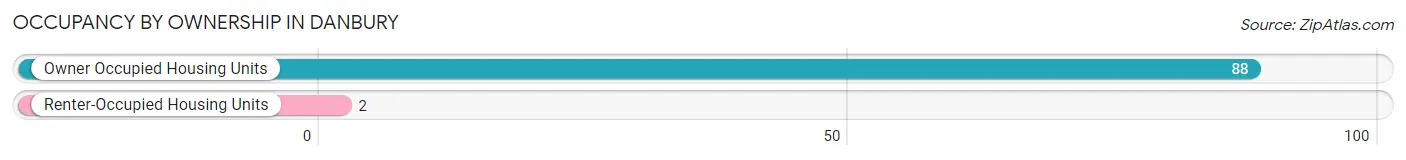
| Occupancy | # Housing Units | % Housing Units |
| Owner Occupied Housing Units | 88 | 97.8% |
| Renter-Occupied Housing Units | 2 | 2.2% |
| Total Occupied Housing Units | 90 | 100.0% |
Occupancy by Household Size in Danbury
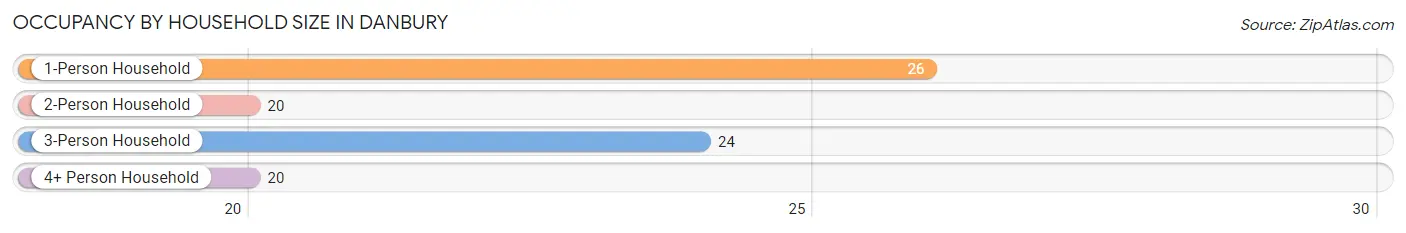
| Household Size | # Housing Units | % Housing Units |
| 1-Person Household | 26 | 28.9% |
| 2-Person Household | 20 | 22.2% |
| 3-Person Household | 24 | 26.7% |
| 4+ Person Household | 20 | 22.2% |
| Total Housing Units | 90 | 100.0% |
Occupancy by Ownership by Household Size in Danbury
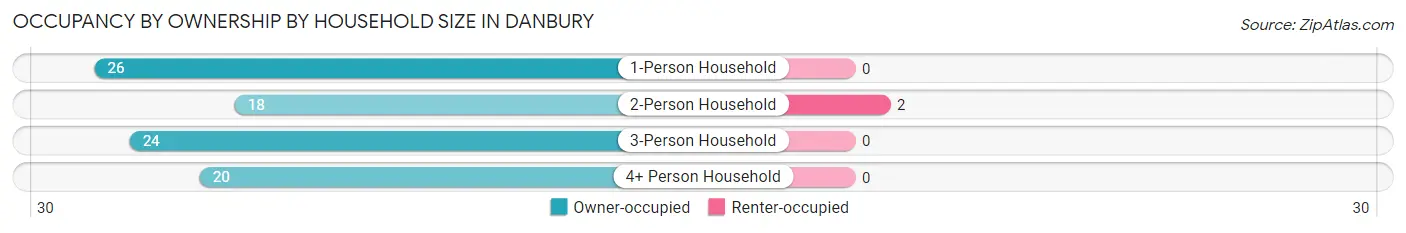
| Household Size | Owner-occupied | Renter-occupied |
| 1-Person Household | 26 (100.0%) | 0 (0.0%) |
| 2-Person Household | 18 (90.0%) | 2 (10.0%) |
| 3-Person Household | 24 (100.0%) | 0 (0.0%) |
| 4+ Person Household | 20 (100.0%) | 0 (0.0%) |
| Total Housing Units | 88 (97.8%) | 2 (2.2%) |
Occupancy by Educational Attainment in Danbury
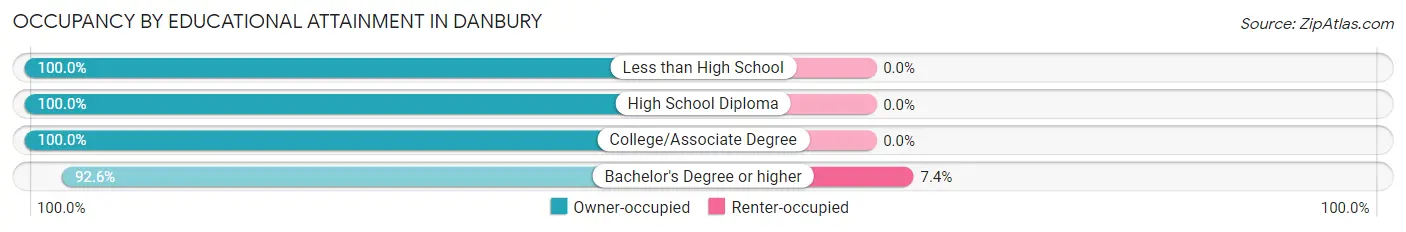
| Household Size | Owner-occupied | Renter-occupied |
| Less than High School | 1 (100.0%) | 0 (0.0%) |
| High School Diploma | 7 (100.0%) | 0 (0.0%) |
| College/Associate Degree | 55 (100.0%) | 0 (0.0%) |
| Bachelor's Degree or higher | 25 (92.6%) | 2 (7.4%) |
Occupancy by Age of Householder in Danbury
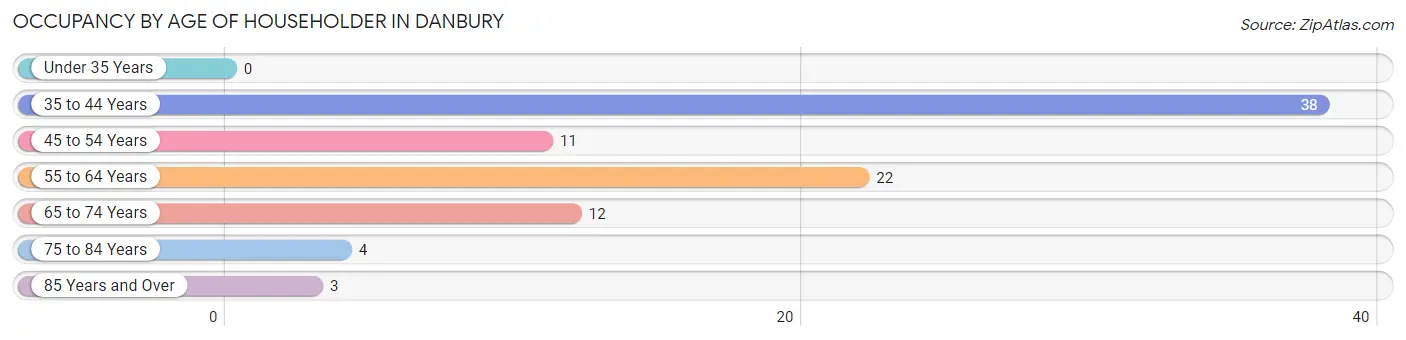
| Age Bracket | # Households | % Households |
| Under 35 Years | 0 | 0.0% |
| 35 to 44 Years | 38 | 42.2% |
| 45 to 54 Years | 11 | 12.2% |
| 55 to 64 Years | 22 | 24.4% |
| 65 to 74 Years | 12 | 13.3% |
| 75 to 84 Years | 4 | 4.4% |
| 85 Years and Over | 3 | 3.3% |
| Total | 90 | 100.0% |
Housing Finances in Danbury
Median Income by Occupancy in Danbury
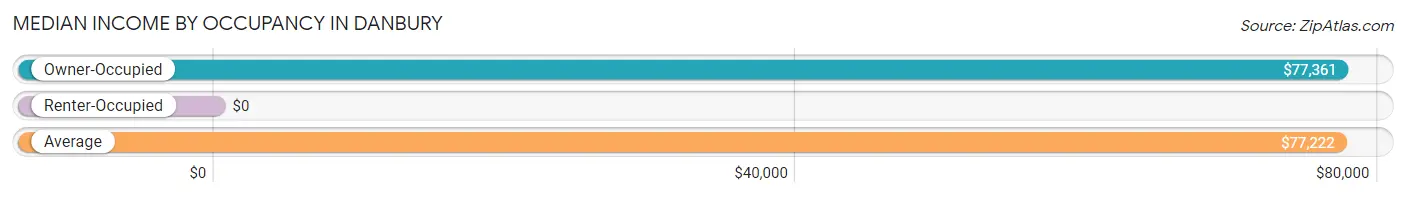
| Occupancy Type | # Households | Median Income |
| Owner-Occupied | 88 (97.8%) | $77,361 |
| Renter-Occupied | 2 (2.2%) | $0 |
| Average | 90 (100.0%) | $77,222 |
Occupancy by Householder Income Bracket in Danbury
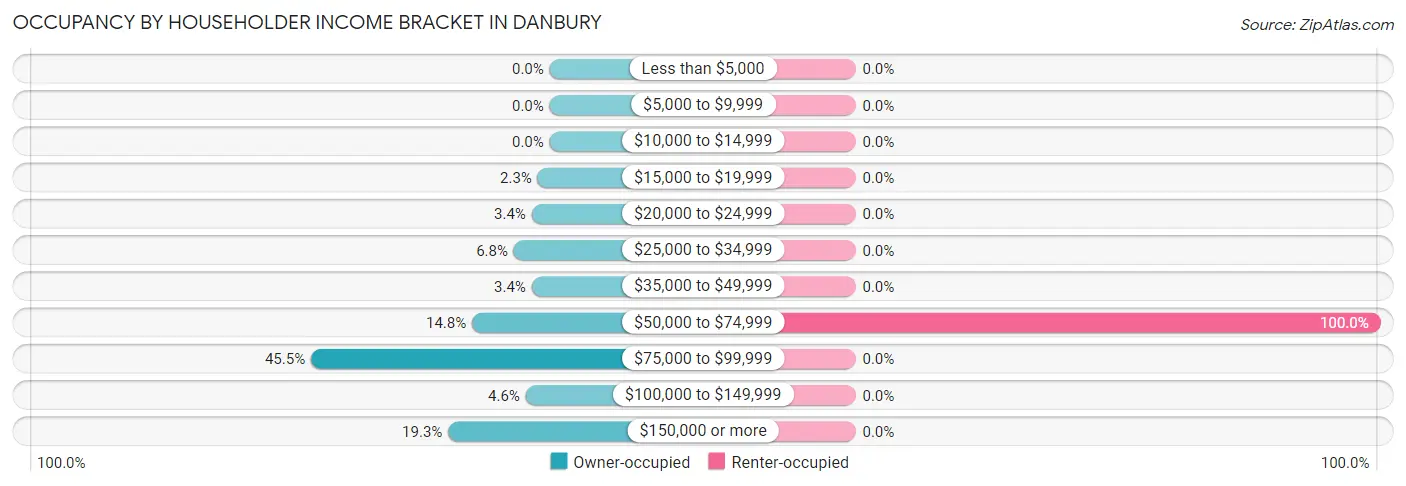
| Income Bracket | Owner-occupied | Renter-occupied |
| Less than $5,000 | 0 (0.0%) | 0 (0.0%) |
| $5,000 to $9,999 | 0 (0.0%) | 0 (0.0%) |
| $10,000 to $14,999 | 0 (0.0%) | 0 (0.0%) |
| $15,000 to $19,999 | 2 (2.3%) | 0 (0.0%) |
| $20,000 to $24,999 | 3 (3.4%) | 0 (0.0%) |
| $25,000 to $34,999 | 6 (6.8%) | 0 (0.0%) |
| $35,000 to $49,999 | 3 (3.4%) | 0 (0.0%) |
| $50,000 to $74,999 | 13 (14.8%) | 2 (100.0%) |
| $75,000 to $99,999 | 40 (45.5%) | 0 (0.0%) |
| $100,000 to $149,999 | 4 (4.5%) | 0 (0.0%) |
| $150,000 or more | 17 (19.3%) | 0 (0.0%) |
| Total | 88 (100.0%) | 2 (100.0%) |
Monthly Housing Cost Tiers in Danbury
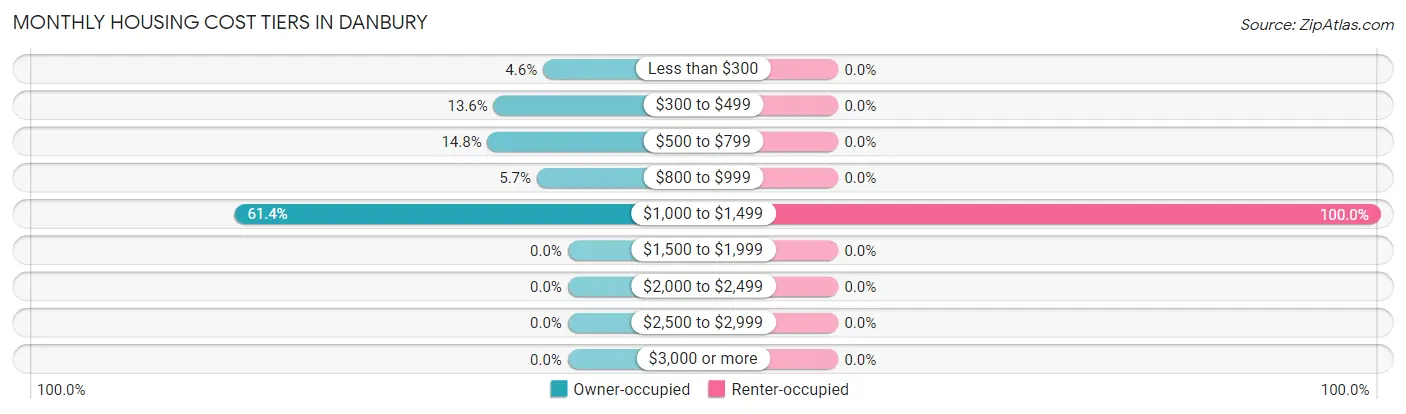
| Monthly Cost | Owner-occupied | Renter-occupied |
| Less than $300 | 4 (4.5%) | 0 (0.0%) |
| $300 to $499 | 12 (13.6%) | 0 (0.0%) |
| $500 to $799 | 13 (14.8%) | 0 (0.0%) |
| $800 to $999 | 5 (5.7%) | 0 (0.0%) |
| $1,000 to $1,499 | 54 (61.4%) | 2 (100.0%) |
| $1,500 to $1,999 | 0 (0.0%) | 0 (0.0%) |
| $2,000 to $2,499 | 0 (0.0%) | 0 (0.0%) |
| $2,500 to $2,999 | 0 (0.0%) | 0 (0.0%) |
| $3,000 or more | 0 (0.0%) | 0 (0.0%) |
| Total | 88 (100.0%) | 2 (100.0%) |
Physical Housing Characteristics in Danbury
Housing Structures in Danbury
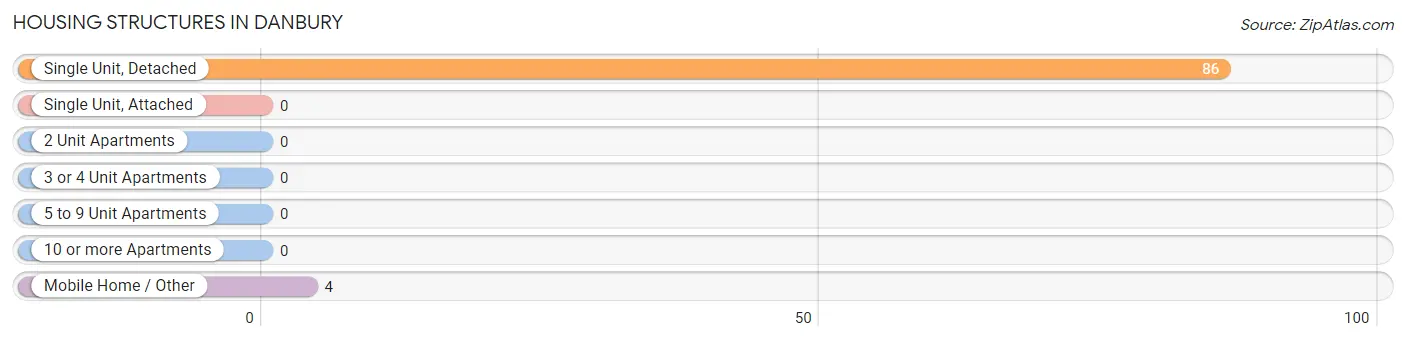
| Structure Type | # Housing Units | % Housing Units |
| Single Unit, Detached | 86 | 95.6% |
| Single Unit, Attached | 0 | 0.0% |
| 2 Unit Apartments | 0 | 0.0% |
| 3 or 4 Unit Apartments | 0 | 0.0% |
| 5 to 9 Unit Apartments | 0 | 0.0% |
| 10 or more Apartments | 0 | 0.0% |
| Mobile Home / Other | 4 | 4.4% |
| Total | 90 | 100.0% |
Housing Structures by Occupancy in Danbury
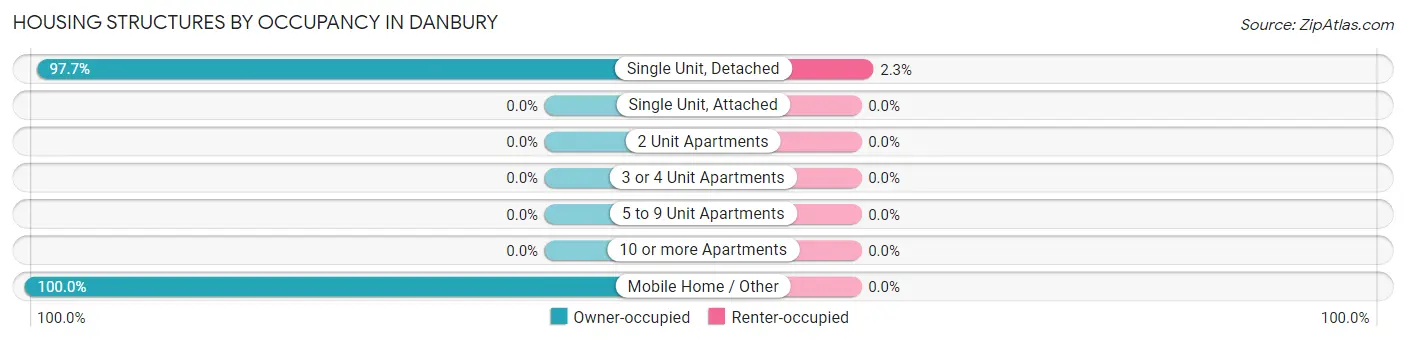
| Structure Type | Owner-occupied | Renter-occupied |
| Single Unit, Detached | 84 (97.7%) | 2 (2.3%) |
| Single Unit, Attached | 0 (0.0%) | 0 (0.0%) |
| 2 Unit Apartments | 0 (0.0%) | 0 (0.0%) |
| 3 or 4 Unit Apartments | 0 (0.0%) | 0 (0.0%) |
| 5 to 9 Unit Apartments | 0 (0.0%) | 0 (0.0%) |
| 10 or more Apartments | 0 (0.0%) | 0 (0.0%) |
| Mobile Home / Other | 4 (100.0%) | 0 (0.0%) |
| Total | 88 (97.8%) | 2 (2.2%) |
Housing Structures by Number of Rooms in Danbury
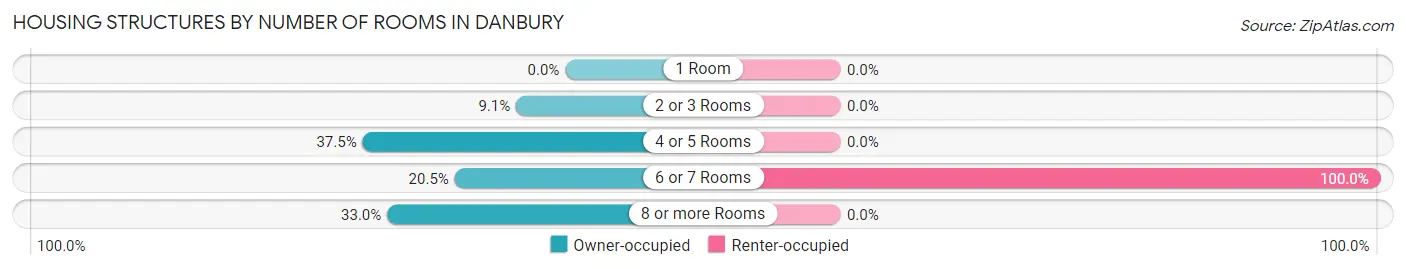
| Number of Rooms | Owner-occupied | Renter-occupied |
| 1 Room | 0 (0.0%) | 0 (0.0%) |
| 2 or 3 Rooms | 8 (9.1%) | 0 (0.0%) |
| 4 or 5 Rooms | 33 (37.5%) | 0 (0.0%) |
| 6 or 7 Rooms | 18 (20.4%) | 2 (100.0%) |
| 8 or more Rooms | 29 (33.0%) | 0 (0.0%) |
| Total | 88 (100.0%) | 2 (100.0%) |
Housing Structure by Heating Type in Danbury
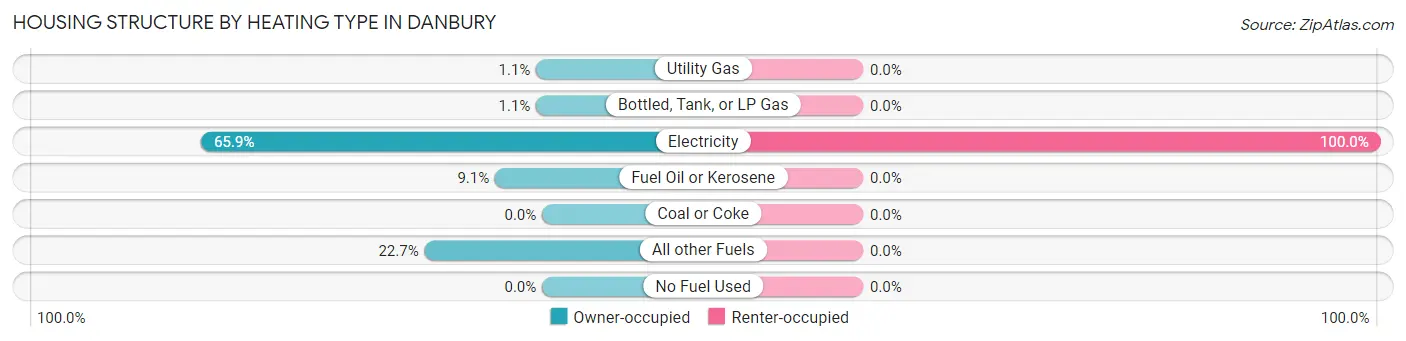
| Heating Type | Owner-occupied | Renter-occupied |
| Utility Gas | 1 (1.1%) | 0 (0.0%) |
| Bottled, Tank, or LP Gas | 1 (1.1%) | 0 (0.0%) |
| Electricity | 58 (65.9%) | 2 (100.0%) |
| Fuel Oil or Kerosene | 8 (9.1%) | 0 (0.0%) |
| Coal or Coke | 0 (0.0%) | 0 (0.0%) |
| All other Fuels | 20 (22.7%) | 0 (0.0%) |
| No Fuel Used | 0 (0.0%) | 0 (0.0%) |
| Total | 88 (100.0%) | 2 (100.0%) |
Household Vehicle Usage in Danbury
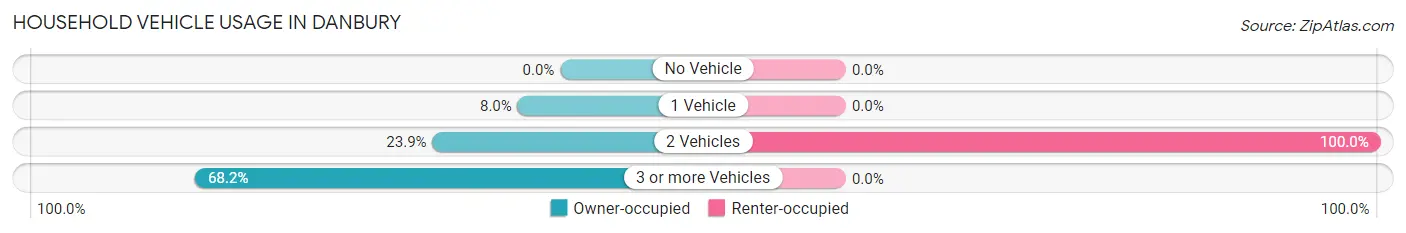
| Vehicles per Household | Owner-occupied | Renter-occupied |
| No Vehicle | 0 (0.0%) | 0 (0.0%) |
| 1 Vehicle | 7 (8.0%) | 0 (0.0%) |
| 2 Vehicles | 21 (23.9%) | 2 (100.0%) |
| 3 or more Vehicles | 60 (68.2%) | 0 (0.0%) |
| Total | 88 (100.0%) | 2 (100.0%) |
Real Estate & Mortgages in Danbury
Real Estate and Mortgage Overview in Danbury
| Characteristic | Without Mortgage | With Mortgage |
| Housing Units | 37 | 51 |
| Median Property Value | $193,800 | $0 |
| Median Household Income | $66,964 | $17 |
| Monthly Housing Costs | - | - |
| Real Estate Taxes | - | - |
Property Value by Mortgage Status in Danbury
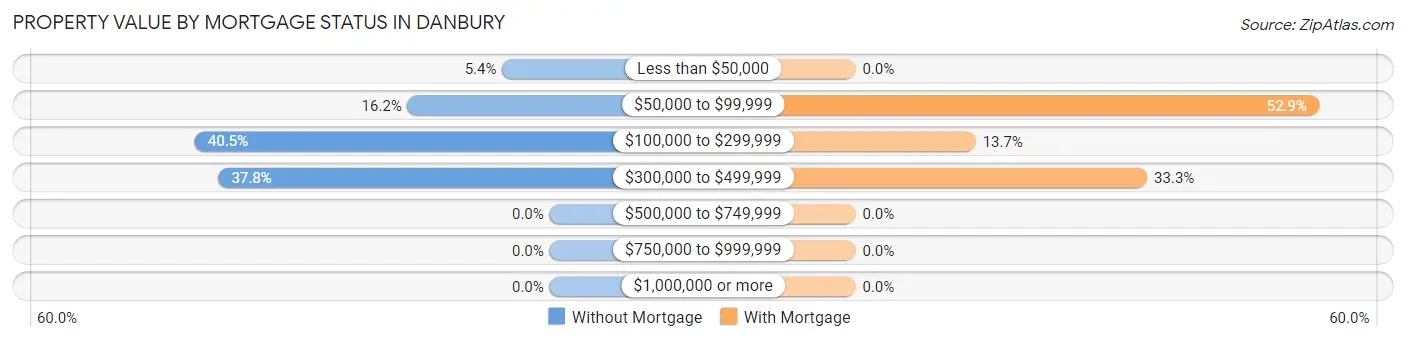
| Property Value | Without Mortgage | With Mortgage |
| Less than $50,000 | 2 (5.4%) | 0 (0.0%) |
| $50,000 to $99,999 | 6 (16.2%) | 27 (52.9%) |
| $100,000 to $299,999 | 15 (40.5%) | 7 (13.7%) |
| $300,000 to $499,999 | 14 (37.8%) | 17 (33.3%) |
| $500,000 to $749,999 | 0 (0.0%) | 0 (0.0%) |
| $750,000 to $999,999 | 0 (0.0%) | 0 (0.0%) |
| $1,000,000 or more | 0 (0.0%) | 0 (0.0%) |
| Total | 37 (100.0%) | 51 (100.0%) |
Household Income by Mortgage Status in Danbury
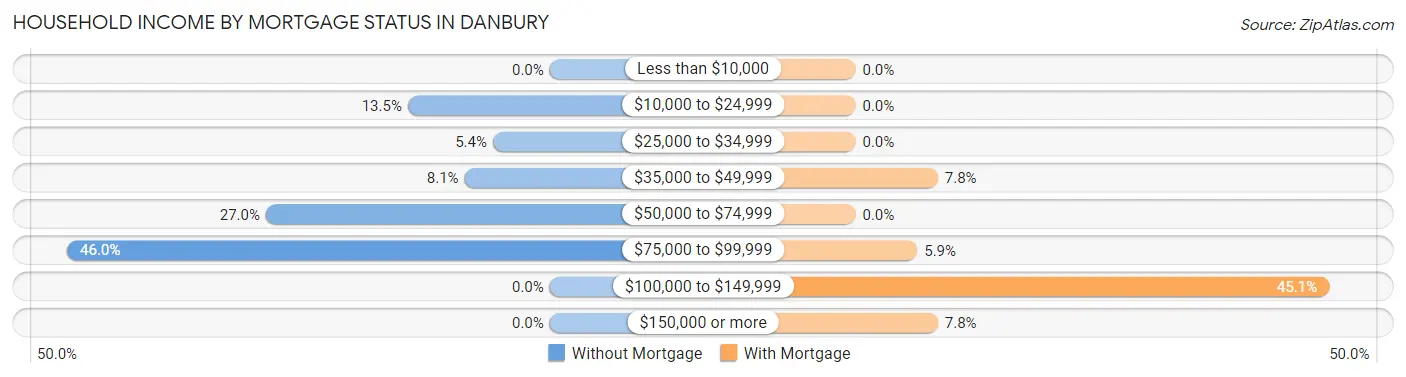
| Household Income | Without Mortgage | With Mortgage |
| Less than $10,000 | 0 (0.0%) | 0 (0.0%) |
| $10,000 to $24,999 | 5 (13.5%) | 0 (0.0%) |
| $25,000 to $34,999 | 2 (5.4%) | 0 (0.0%) |
| $35,000 to $49,999 | 3 (8.1%) | 4 (7.8%) |
| $50,000 to $74,999 | 10 (27.0%) | 0 (0.0%) |
| $75,000 to $99,999 | 17 (46.0%) | 3 (5.9%) |
| $100,000 to $149,999 | 0 (0.0%) | 23 (45.1%) |
| $150,000 or more | 0 (0.0%) | 4 (7.8%) |
| Total | 37 (100.0%) | 51 (100.0%) |
Property Value to Household Income Ratio in Danbury
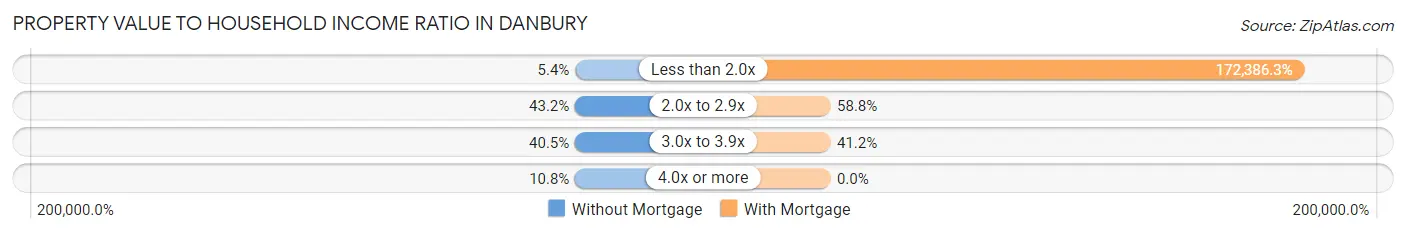
| Value-to-Income Ratio | Without Mortgage | With Mortgage |
| Less than 2.0x | 2 (5.4%) | 87,917 (172,386.3%) |
| 2.0x to 2.9x | 16 (43.2%) | 30 (58.8%) |
| 3.0x to 3.9x | 15 (40.5%) | 21 (41.2%) |
| 4.0x or more | 4 (10.8%) | 0 (0.0%) |
| Total | 37 (100.0%) | 51 (100.0%) |
Real Estate Taxes by Mortgage Status in Danbury
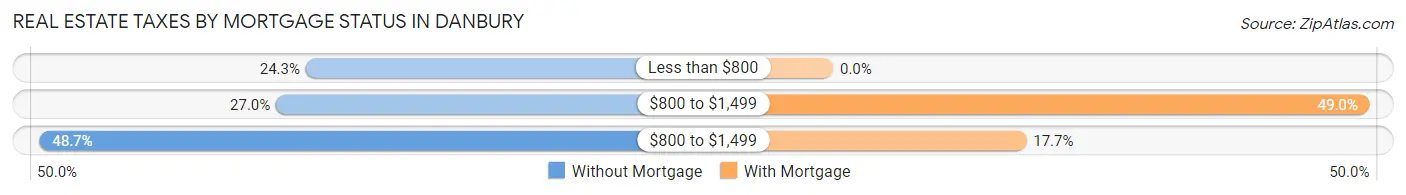
| Property Taxes | Without Mortgage | With Mortgage |
| Less than $800 | 9 (24.3%) | 0 (0.0%) |
| $800 to $1,499 | 10 (27.0%) | 25 (49.0%) |
| $800 to $1,499 | 18 (48.6%) | 9 (17.6%) |
| Total | 37 (100.0%) | 51 (100.0%) |
Health & Disability in Danbury
Health Insurance Coverage by Age in Danbury
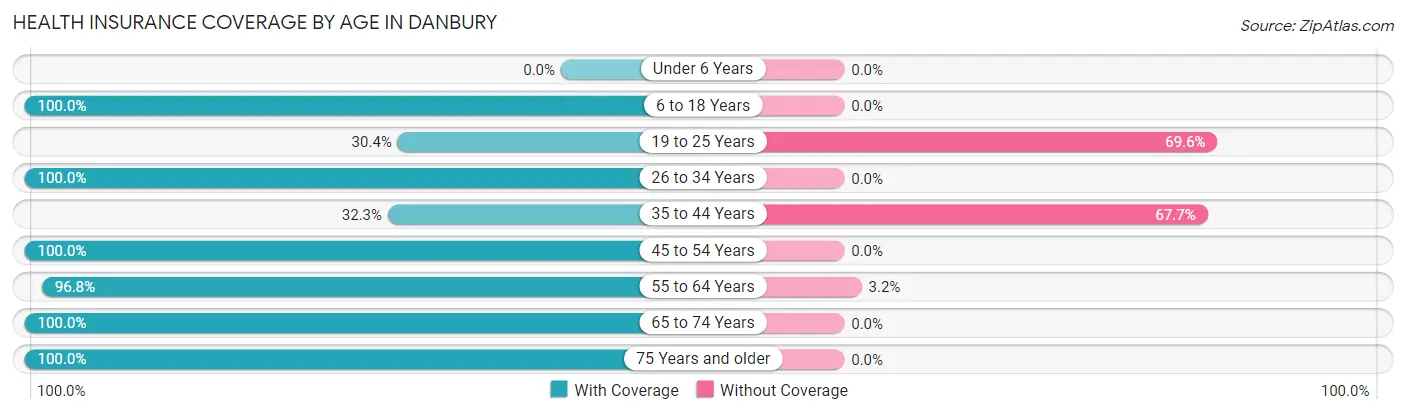
| Age Bracket | With Coverage | Without Coverage |
| Under 6 Years | 0 (0.0%) | 0 (0.0%) |
| 6 to 18 Years | 31 (100.0%) | 0 (0.0%) |
| 19 to 25 Years | 7 (30.4%) | 16 (69.6%) |
| 26 to 34 Years | 8 (100.0%) | 0 (0.0%) |
| 35 to 44 Years | 20 (32.3%) | 42 (67.7%) |
| 45 to 54 Years | 36 (100.0%) | 0 (0.0%) |
| 55 to 64 Years | 30 (96.8%) | 1 (3.2%) |
| 65 to 74 Years | 23 (100.0%) | 0 (0.0%) |
| 75 Years and older | 9 (100.0%) | 0 (0.0%) |
| Total | 164 (73.5%) | 59 (26.5%) |
Health Insurance Coverage by Citizenship Status in Danbury
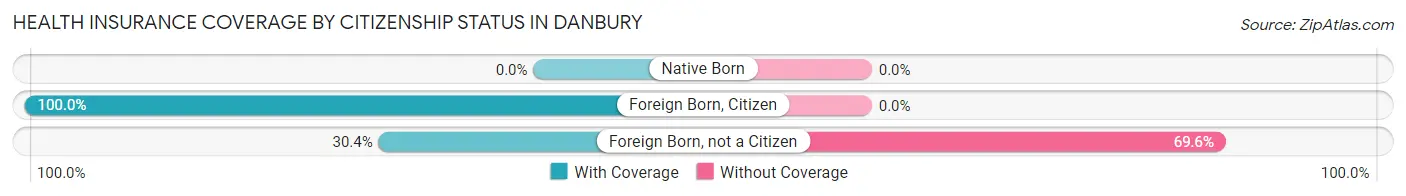
| Citizenship Status | With Coverage | Without Coverage |
| Native Born | 0 (0.0%) | 0 (0.0%) |
| Foreign Born, Citizen | 31 (100.0%) | 0 (0.0%) |
| Foreign Born, not a Citizen | 7 (30.4%) | 16 (69.6%) |
Health Insurance Coverage by Household Income in Danbury
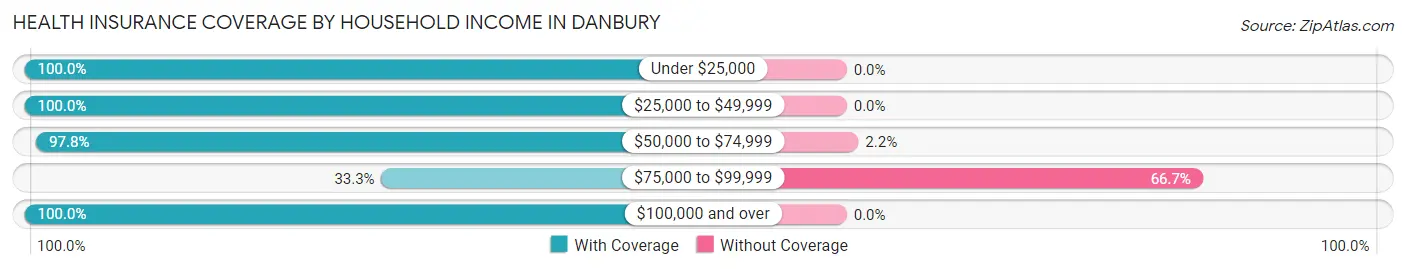
| Household Income | With Coverage | Without Coverage |
| Under $25,000 | 5 (100.0%) | 0 (0.0%) |
| $25,000 to $49,999 | 13 (100.0%) | 0 (0.0%) |
| $50,000 to $74,999 | 45 (97.8%) | 1 (2.2%) |
| $75,000 to $99,999 | 29 (33.3%) | 58 (66.7%) |
| $100,000 and over | 72 (100.0%) | 0 (0.0%) |
Public vs Private Health Insurance Coverage by Age in Danbury
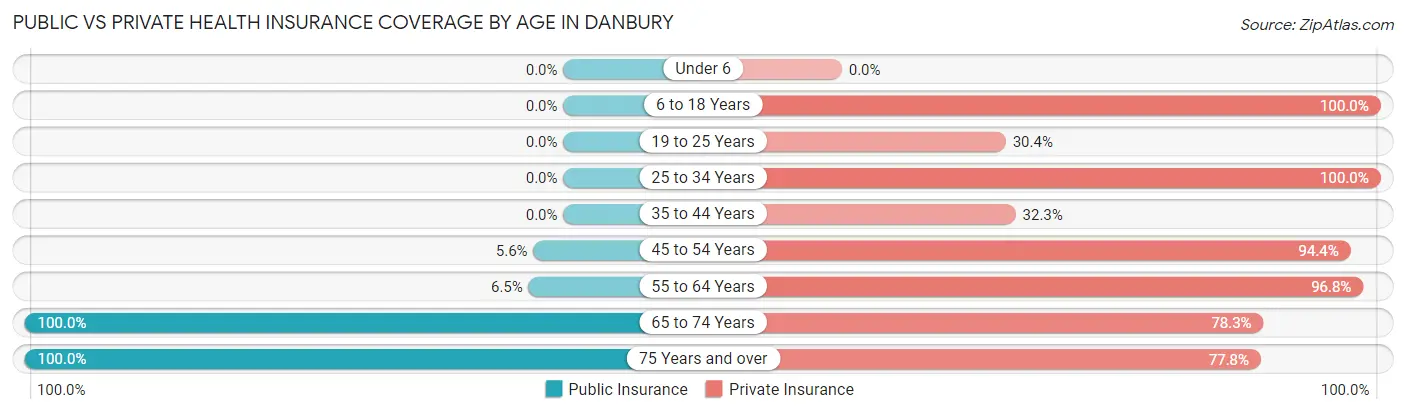
| Age Bracket | Public Insurance | Private Insurance |
| Under 6 | 0 (0.0%) | 0 (0.0%) |
| 6 to 18 Years | 0 (0.0%) | 31 (100.0%) |
| 19 to 25 Years | 0 (0.0%) | 7 (30.4%) |
| 25 to 34 Years | 0 (0.0%) | 8 (100.0%) |
| 35 to 44 Years | 0 (0.0%) | 20 (32.3%) |
| 45 to 54 Years | 2 (5.6%) | 34 (94.4%) |
| 55 to 64 Years | 2 (6.5%) | 30 (96.8%) |
| 65 to 74 Years | 23 (100.0%) | 18 (78.3%) |
| 75 Years and over | 9 (100.0%) | 7 (77.8%) |
| Total | 36 (16.1%) | 155 (69.5%) |
Disability Status by Sex by Age in Danbury
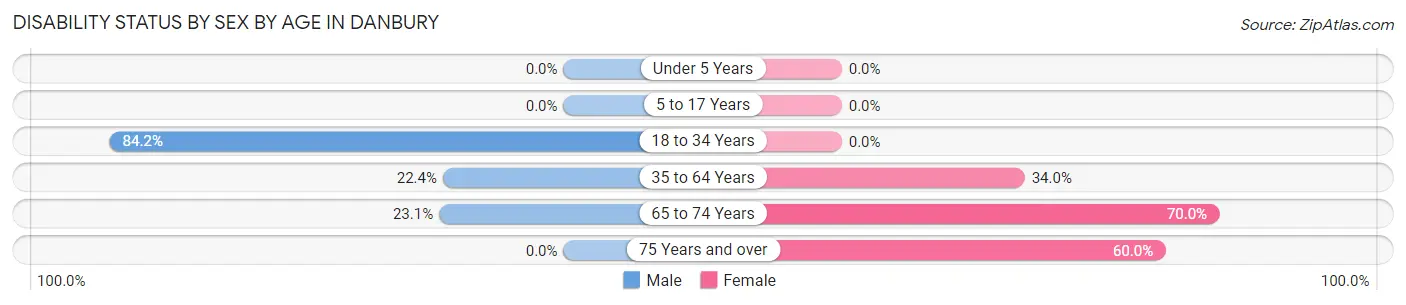
| Age Bracket | Male | Female |
| Under 5 Years | 0 (0.0%) | 0 (0.0%) |
| 5 to 17 Years | 0 (0.0%) | 0 (0.0%) |
| 18 to 34 Years | 16 (84.2%) | 0 (0.0%) |
| 35 to 64 Years | 17 (22.4%) | 18 (34.0%) |
| 65 to 74 Years | 3 (23.1%) | 7 (70.0%) |
| 75 Years and over | 0 (0.0%) | 3 (60.0%) |
Disability Class by Sex by Age in Danbury
Disability Class: Hearing Difficulty
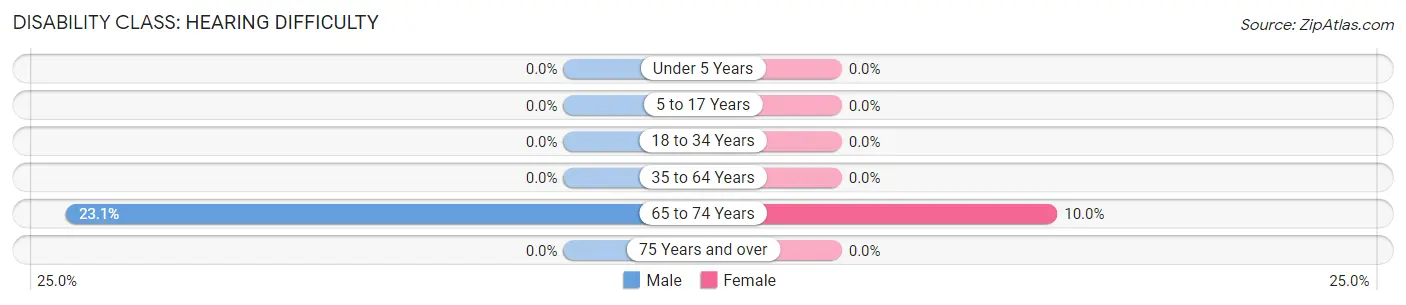
| Age Bracket | Male | Female |
| Under 5 Years | 0 (0.0%) | 0 (0.0%) |
| 5 to 17 Years | 0 (0.0%) | 0 (0.0%) |
| 18 to 34 Years | 0 (0.0%) | 0 (0.0%) |
| 35 to 64 Years | 0 (0.0%) | 0 (0.0%) |
| 65 to 74 Years | 3 (23.1%) | 1 (10.0%) |
| 75 Years and over | 0 (0.0%) | 0 (0.0%) |
Disability Class: Vision Difficulty
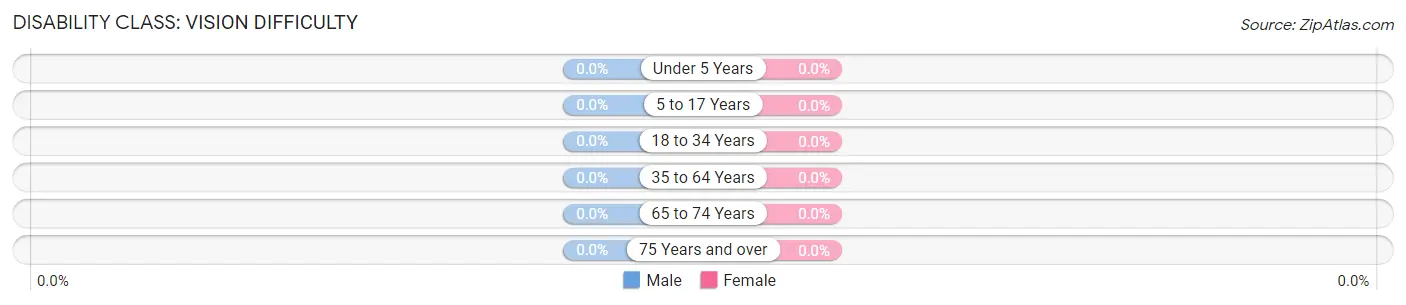
| Age Bracket | Male | Female |
| Under 5 Years | 0 (0.0%) | 0 (0.0%) |
| 5 to 17 Years | 0 (0.0%) | 0 (0.0%) |
| 18 to 34 Years | 0 (0.0%) | 0 (0.0%) |
| 35 to 64 Years | 0 (0.0%) | 0 (0.0%) |
| 65 to 74 Years | 0 (0.0%) | 0 (0.0%) |
| 75 Years and over | 0 (0.0%) | 0 (0.0%) |
Disability Class: Cognitive Difficulty
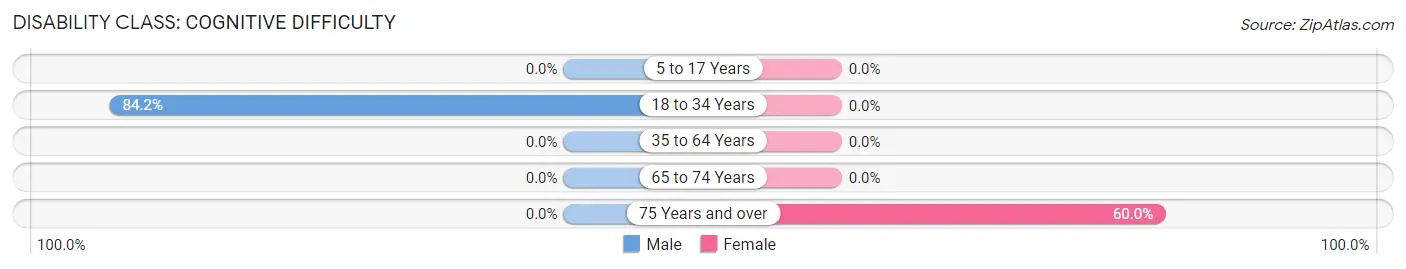
| Age Bracket | Male | Female |
| 5 to 17 Years | 0 (0.0%) | 0 (0.0%) |
| 18 to 34 Years | 16 (84.2%) | 0 (0.0%) |
| 35 to 64 Years | 0 (0.0%) | 0 (0.0%) |
| 65 to 74 Years | 0 (0.0%) | 0 (0.0%) |
| 75 Years and over | 0 (0.0%) | 3 (60.0%) |
Disability Class: Ambulatory Difficulty
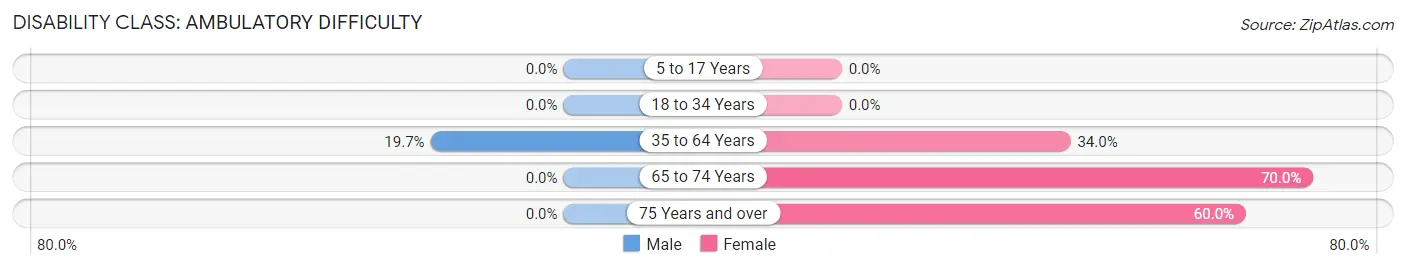
| Age Bracket | Male | Female |
| 5 to 17 Years | 0 (0.0%) | 0 (0.0%) |
| 18 to 34 Years | 0 (0.0%) | 0 (0.0%) |
| 35 to 64 Years | 15 (19.7%) | 18 (34.0%) |
| 65 to 74 Years | 0 (0.0%) | 7 (70.0%) |
| 75 Years and over | 0 (0.0%) | 3 (60.0%) |
Disability Class: Self-Care Difficulty
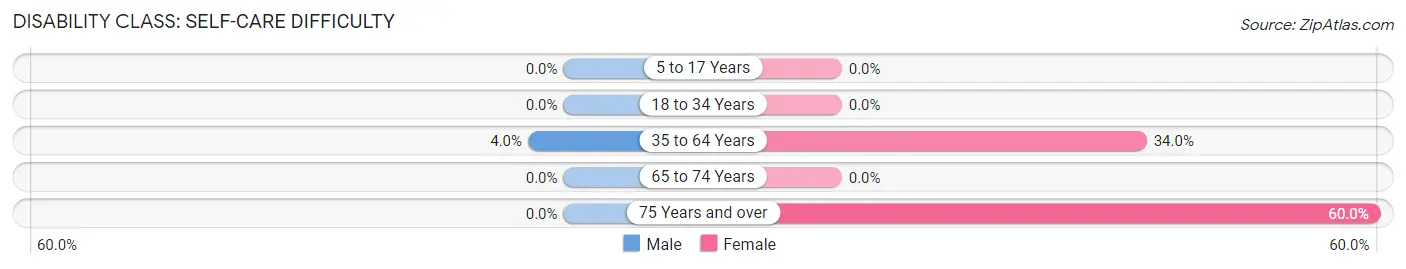
| Age Bracket | Male | Female |
| 5 to 17 Years | 0 (0.0%) | 0 (0.0%) |
| 18 to 34 Years | 0 (0.0%) | 0 (0.0%) |
| 35 to 64 Years | 3 (4.0%) | 18 (34.0%) |
| 65 to 74 Years | 0 (0.0%) | 0 (0.0%) |
| 75 Years and over | 0 (0.0%) | 3 (60.0%) |
Technology Access in Danbury
Computing Device Access in Danbury
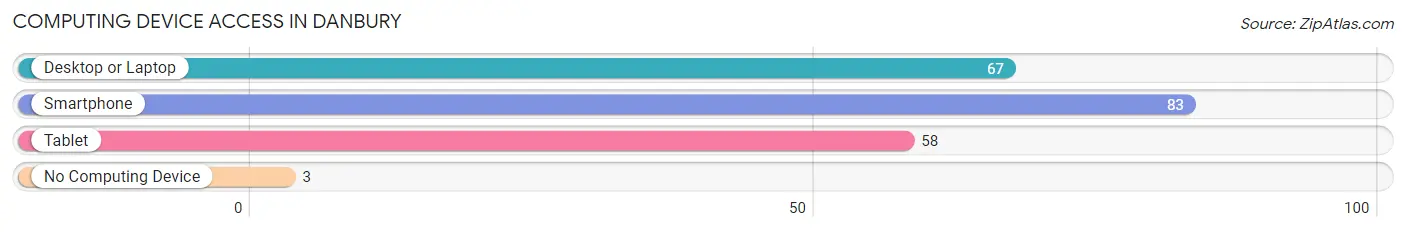
| Device Type | # Households | % Households |
| Desktop or Laptop | 67 | 74.4% |
| Smartphone | 83 | 92.2% |
| Tablet | 58 | 64.4% |
| No Computing Device | 3 | 3.3% |
| Total | 90 | 100.0% |
Internet Access in Danbury
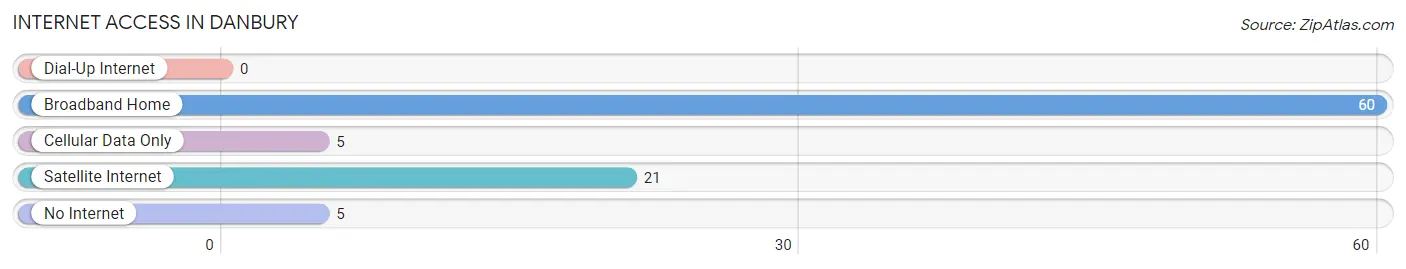
| Internet Type | # Households | % Households |
| Dial-Up Internet | 0 | 0.0% |
| Broadband Home | 60 | 66.7% |
| Cellular Data Only | 5 | 5.6% |
| Satellite Internet | 21 | 23.3% |
| No Internet | 5 | 5.6% |
| Total | 90 | 100.0% |
Danbury Summary
Danbury, North Carolina is a small town located in Stokes County, North Carolina. It is situated in the foothills of the Blue Ridge Mountains and is part of the Piedmont Triad region. The town has a population of approximately 1,400 people and is located about 30 miles northeast of Winston-Salem.
Geography
Danbury is located in the foothills of the Blue Ridge Mountains in Stokes County, North Carolina. The town is situated in the Piedmont Triad region, which is a metropolitan area that includes the cities of Greensboro, Winston-Salem, and High Point. The town is located about 30 miles northeast of Winston-Salem and is bordered by the towns of Walnut Cove, Germanton, and King. The town is situated on the banks of the Dan River, which is a tributary of the Yadkin River. The town is located at an elevation of 890 feet above sea level.
History
Danbury was founded in 1790 by a group of settlers from Pennsylvania. The town was named after the Dan River, which runs through the town. The town was originally a farming community and was known for its tobacco production. In the late 19th century, the town began to grow and develop as a manufacturing center. The town was home to several factories, including a cotton mill, a furniture factory, and a brickyard. The town also had a railroad station, which connected it to other towns in the region.
In the early 20th century, the town experienced a period of growth and development. The town was home to several businesses, including a bank, a hotel, and a movie theater. The town also had a public library and a hospital. In the late 20th century, the town experienced a period of decline as many of the factories and businesses closed.
Economy
The economy of Danbury is largely based on agriculture and manufacturing. The town is home to several farms, which produce a variety of crops, including corn, soybeans, and tobacco. The town is also home to several manufacturing companies, which produce a variety of products, including furniture, textiles, and automotive parts. The town is also home to several small businesses, including restaurants, shops, and service providers.
Demographics
As of the 2010 census, the population of Danbury was 1,400. The town has a median household income of $35,000 and a median home value of $125,000. The town is predominantly white, with approximately 90% of the population identifying as white. The town also has a small Hispanic population, with approximately 5% of the population identifying as Hispanic or Latino. The town also has a small African American population, with approximately 2% of the population identifying as African American.
Conclusion
Danbury, North Carolina is a small town located in Stokes County, North Carolina. It is situated in the foothills of the Blue Ridge Mountains and is part of the Piedmont Triad region. The town has a population of approximately 1,400 people and is located about 30 miles northeast of Winston-Salem. The economy of Danbury is largely based on agriculture and manufacturing. The town is predominantly white, with approximately 90% of the population identifying as white. The town also has a small Hispanic population, with approximately 5% of the population identifying as Hispanic or Latino. The town also has a small African American population, with approximately 2% of the population identifying as African American.
Common Questions
What is Per Capita Income in Danbury?
Per Capita income in Danbury is $30,422.
What is the Median Family Income in Danbury?
Median Family Income in Danbury is $77,222.
What is the Median Household income in Danbury?
Median Household Income in Danbury is $77,222.
What is Income or Wage Gap in Danbury?
Income or Wage Gap in Danbury is 22.1%.
Women in Danbury earn 77.9 cents for every dollar earned by a man.
What is Inequality or Gini Index in Danbury?
Inequality or Gini Index in Danbury is 0.26.
What is the Total Population of Danbury?
Total Population of Danbury is 293.
What is the Total Male Population of Danbury?
Total Male Population of Danbury is 213.
What is the Total Female Population of Danbury?
Total Female Population of Danbury is 80.
What is the Ratio of Males per 100 Females in Danbury?
There are 266.25 Males per 100 Females in Danbury.
What is the Ratio of Females per 100 Males in Danbury?
There are 37.56 Females per 100 Males in Danbury.
What is the Median Population Age in Danbury?
Median Population Age in Danbury is 43.4 Years.
What is the Average Family Size in Danbury
Average Family Size in Danbury is 3.1 People.
What is the Average Household Size in Danbury
Average Household Size in Danbury is 2.5 People.
How Large is the Labor Force in Danbury?
There are 152 People in the Labor Forcein in Danbury.
What is the Percentage of People in the Labor Force in Danbury?
55.1% of People are in the Labor Force in Danbury.
What is the Unemployment Rate in Danbury?
Unemployment Rate in Danbury is 5.9%.