Vandemere, NC Map & Demographics
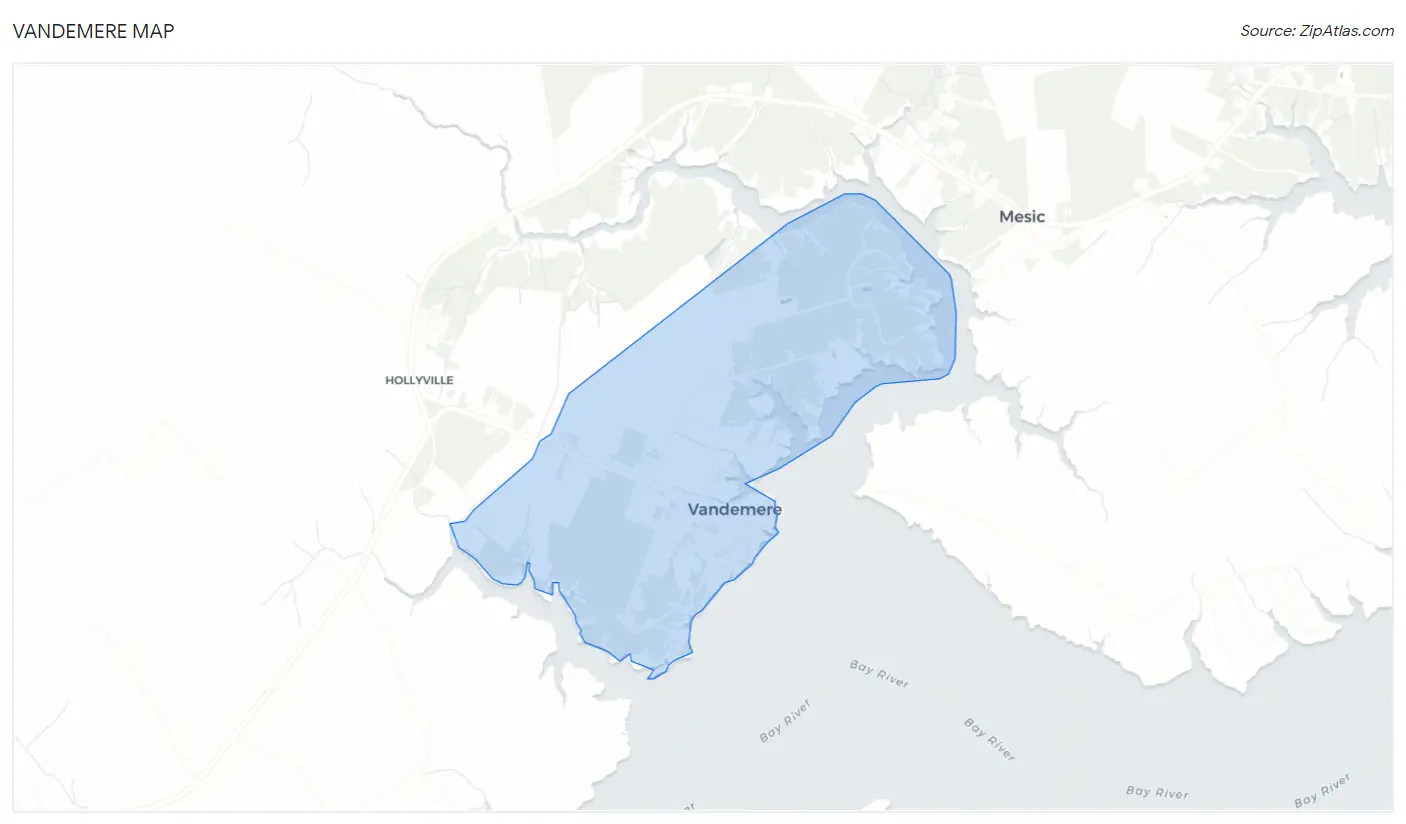
Vandemere Map
Vandemere Overview
$23,605
PER CAPITA INCOME
$51,875
AVG FAMILY INCOME
$31,250
AVG HOUSEHOLD INCOME
54.9%
WAGE / INCOME GAP [ % ]
45.1¢/ $1
WAGE / INCOME GAP [ $ ]
$13,250
FAMILY INCOME DEFICIT
0.48
INEQUALITY / GINI INDEX
214
TOTAL POPULATION
83
MALE POPULATION
131
FEMALE POPULATION
63.36
MALES / 100 FEMALES
157.83
FEMALES / 100 MALES
57.5
MEDIAN AGE
3.0
AVG FAMILY SIZE
2.2
AVG HOUSEHOLD SIZE
65
LABOR FORCE [ PEOPLE ]
36.3%
PERCENT IN LABOR FORCE
7.7%
UNEMPLOYMENT RATE
Vandemere Zip Codes
Vandemere Area Codes
Income in Vandemere
Income Overview in Vandemere
Per Capita Income in Vandemere is $23,605, while median incomes of families and households are $51,875 and $31,250 respectively.
| Characteristic | Number | Measure |
| Per Capita Income | 214 | $23,605 |
| Median Family Income | 56 | $51,875 |
| Mean Family Income | 56 | $66,357 |
| Median Household Income | 99 | $31,250 |
| Mean Household Income | 99 | $47,687 |
| Income Deficit | 56 | $13,250 |
| Wage / Income Gap (%) | 214 | 54.87% |
| Wage / Income Gap ($) | 214 | 45.13¢ per $1 |
| Gini / Inequality Index | 214 | 0.48 |
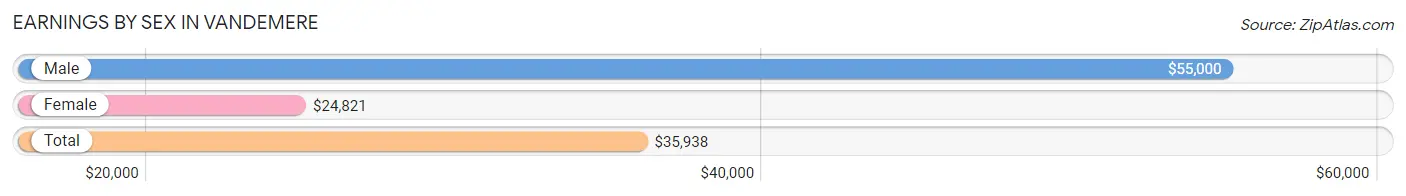
Earnings by Sex in Vandemere
Average Earnings in Vandemere are $35,938, $55,000 for men and $24,821 for women, a difference of 54.9%.
| Sex | Number | Average Earnings |
| Male | 30 (41.1%) | $55,000 |
| Female | 43 (58.9%) | $24,821 |
| Total | 73 (100.0%) | $35,938 |
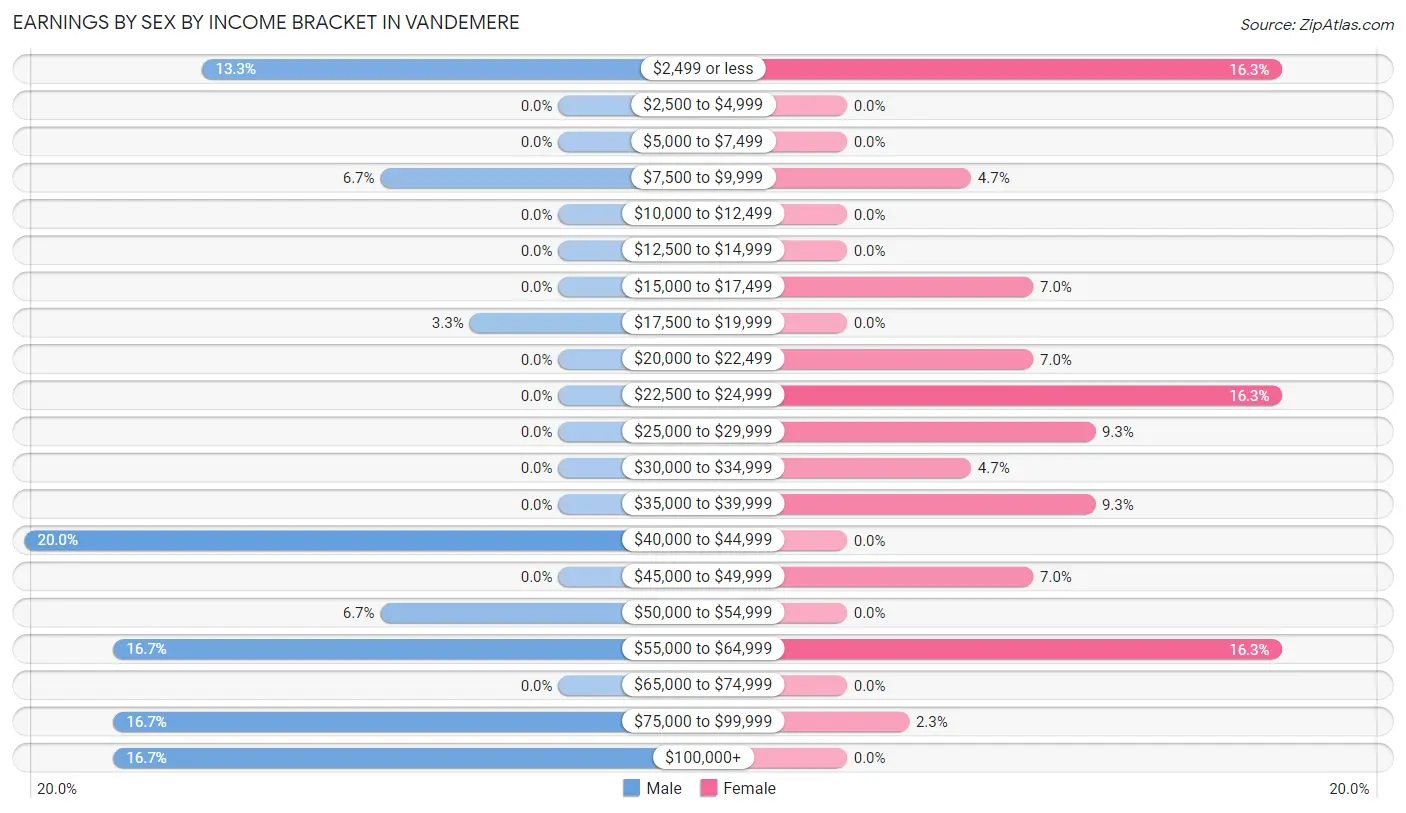
Earnings by Sex by Income Bracket in Vandemere
The most common earnings brackets in Vandemere are $40,000 to $44,999 for men (6 | 20.0%) and $2,499 or less for women (7 | 16.3%).
| Income | Male | Female |
| $2,499 or less | 4 (13.3%) | 7 (16.3%) |
| $2,500 to $4,999 | 0 (0.0%) | 0 (0.0%) |
| $5,000 to $7,499 | 0 (0.0%) | 0 (0.0%) |
| $7,500 to $9,999 | 2 (6.7%) | 2 (4.6%) |
| $10,000 to $12,499 | 0 (0.0%) | 0 (0.0%) |
| $12,500 to $14,999 | 0 (0.0%) | 0 (0.0%) |
| $15,000 to $17,499 | 0 (0.0%) | 3 (7.0%) |
| $17,500 to $19,999 | 1 (3.3%) | 0 (0.0%) |
| $20,000 to $22,499 | 0 (0.0%) | 3 (7.0%) |
| $22,500 to $24,999 | 0 (0.0%) | 7 (16.3%) |
| $25,000 to $29,999 | 0 (0.0%) | 4 (9.3%) |
| $30,000 to $34,999 | 0 (0.0%) | 2 (4.6%) |
| $35,000 to $39,999 | 0 (0.0%) | 4 (9.3%) |
| $40,000 to $44,999 | 6 (20.0%) | 0 (0.0%) |
| $45,000 to $49,999 | 0 (0.0%) | 3 (7.0%) |
| $50,000 to $54,999 | 2 (6.7%) | 0 (0.0%) |
| $55,000 to $64,999 | 5 (16.7%) | 7 (16.3%) |
| $65,000 to $74,999 | 0 (0.0%) | 0 (0.0%) |
| $75,000 to $99,999 | 5 (16.7%) | 1 (2.3%) |
| $100,000+ | 5 (16.7%) | 0 (0.0%) |
| Total | 30 (100.0%) | 43 (100.0%) |
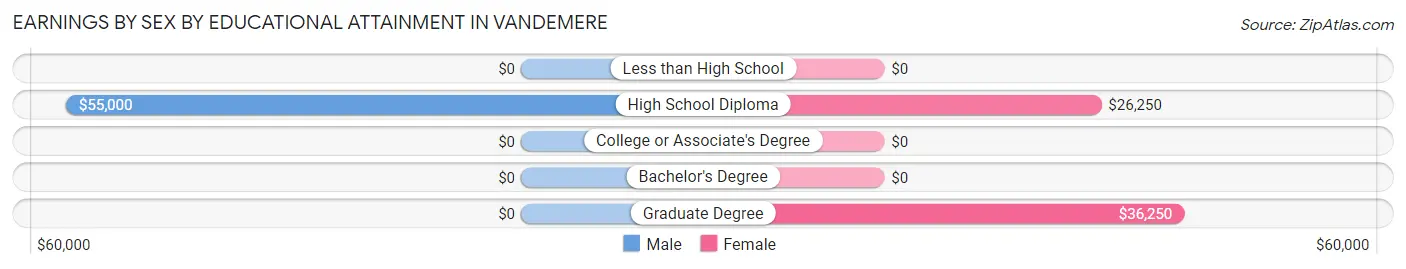
Earnings by Sex by Educational Attainment in Vandemere
Average earnings in Vandemere are $55,313 for men and $26,250 for women, a difference of 52.5%. Men with an educational attainment of high school diploma enjoy the highest average annual earnings of $55,000, while those with high school diploma education earn the least with $55,000. Women with an educational attainment of graduate degree earn the most with the average annual earnings of $36,250, while those with high school diploma education have the smallest earnings of $26,250.
| Educational Attainment | Male Income | Female Income |
| Less than High School | - | - |
| High School Diploma | $55,000 | $26,250 |
| College or Associate's Degree | - | - |
| Bachelor's Degree | - | - |
| Graduate Degree | - | - |
| Total | $55,313 | $26,250 |
Family Income in Vandemere
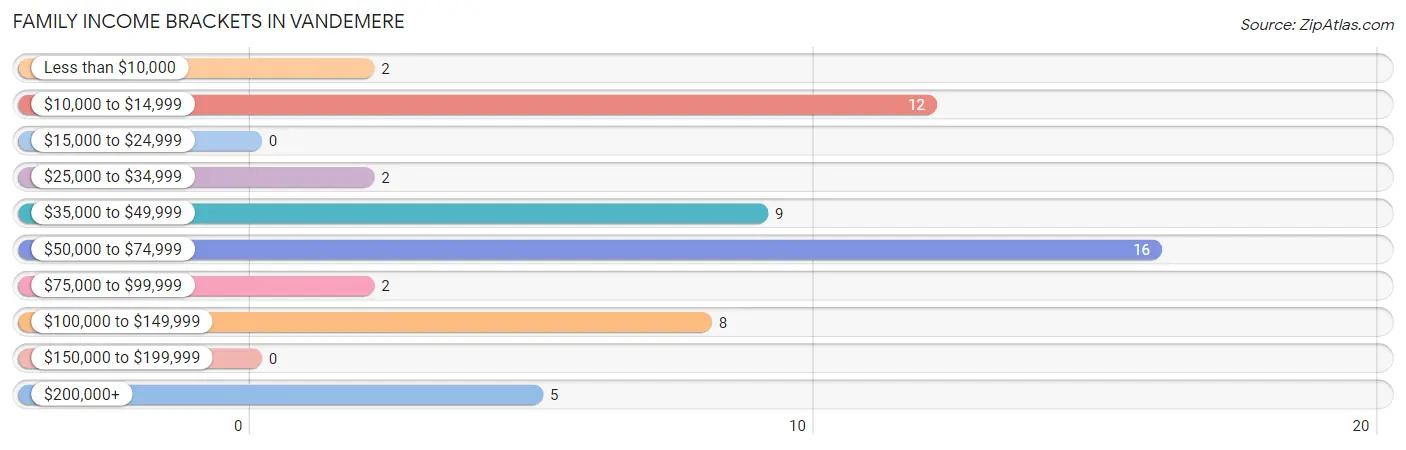
Family Income Brackets in Vandemere
According to the Vandemere family income data, there are 16 families falling into the $50,000 to $74,999 income range, which is the most common income bracket and makes up 28.6% of all families.
| Income Bracket | # Families | % Families |
| Less than $10,000 | 2 | 3.6% |
| $10,000 to $14,999 | 12 | 21.4% |
| $15,000 to $24,999 | 0 | 0.0% |
| $25,000 to $34,999 | 2 | 3.6% |
| $35,000 to $49,999 | 9 | 16.1% |
| $50,000 to $74,999 | 16 | 28.6% |
| $75,000 to $99,999 | 2 | 3.6% |
| $100,000 to $149,999 | 8 | 14.3% |
| $150,000 to $199,999 | 0 | 0.0% |
| $200,000+ | 5 | 8.9% |
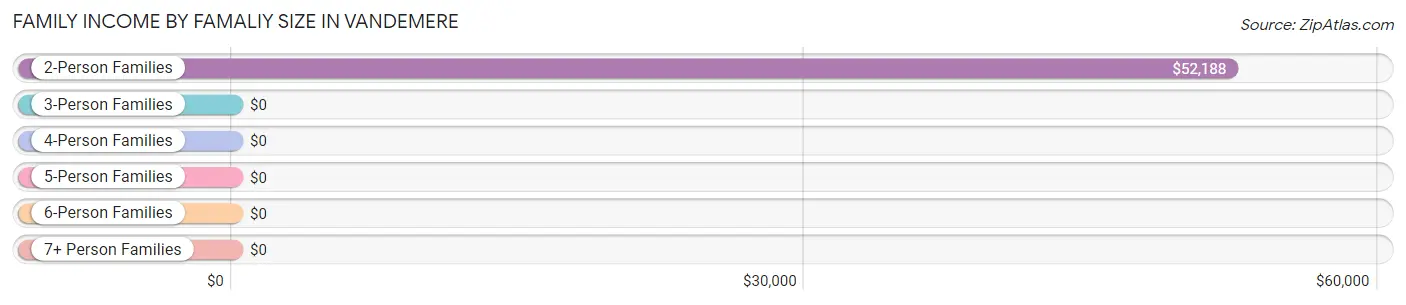
Family Income by Famaliy Size in Vandemere
2-person families (39 | 69.6%) account for the highest median family income in Vandemere with $52,188 per family, while 2-person families (39 | 69.6%) have the highest median income of $26,094 per family member.
| Income Bracket | # Families | Median Income |
| 2-Person Families | 39 (69.6%) | $52,188 |
| 3-Person Families | 3 (5.4%) | $0 |
| 4-Person Families | 5 (8.9%) | $0 |
| 5-Person Families | 9 (16.1%) | $0 |
| 6-Person Families | 0 (0.0%) | $0 |
| 7+ Person Families | 0 (0.0%) | $0 |
| Total | 56 (100.0%) | $51,875 |
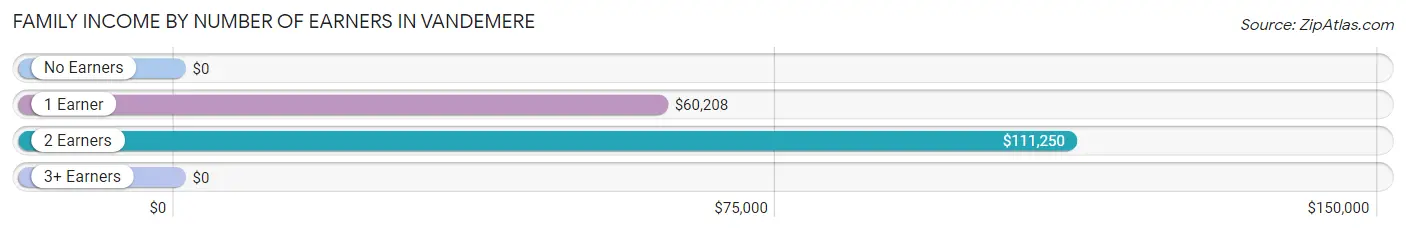
Family Income by Number of Earners in Vandemere
| Number of Earners | # Families | Median Income |
| No Earners | 17 (30.4%) | $0 |
| 1 Earner | 21 (37.5%) | $60,208 |
| 2 Earners | 17 (30.4%) | $111,250 |
| 3+ Earners | 1 (1.8%) | $0 |
| Total | 56 (100.0%) | $51,875 |
Household Income in Vandemere
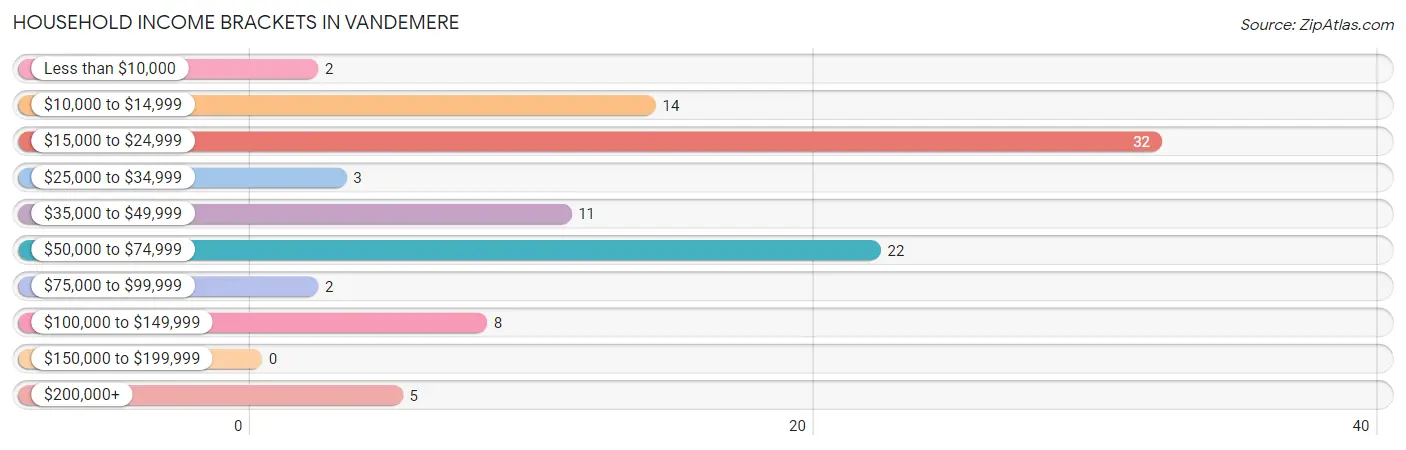
Household Income Brackets in Vandemere
With 32 households falling in the category, the $15,000 to $24,999 income range is the most frequent in Vandemere, accounting for 32.3% of all households.
| Income Bracket | # Households | % Households |
| Less than $10,000 | 2 | 2.0% |
| $10,000 to $14,999 | 14 | 14.1% |
| $15,000 to $24,999 | 32 | 32.3% |
| $25,000 to $34,999 | 3 | 3.0% |
| $35,000 to $49,999 | 11 | 11.1% |
| $50,000 to $74,999 | 22 | 22.2% |
| $75,000 to $99,999 | 2 | 2.0% |
| $100,000 to $149,999 | 8 | 8.1% |
| $150,000 to $199,999 | 0 | 0.0% |
| $200,000+ | 5 | 5.1% |
Household Income by Householder Age in Vandemere
| Income Bracket | # Households | Median Income |
| 15 to 24 Years | 0 (0.0%) | $0 |
| 25 to 44 Years | 5 (5.1%) | $0 |
| 45 to 64 Years | 29 (29.3%) | $0 |
| 65+ Years | 65 (65.7%) | $0 |
| Total | 99 (100.0%) | $31,250 |
Poverty in Vandemere
Income Below Poverty by Sex and Age in Vandemere
With 21.7% poverty level for males and 28.2% for females among the residents of Vandemere, under 5 year old males and under 5 year old females are the most vulnerable to poverty, with 7 males (100.0%) and 8 females (100.0%) in their respective age groups living below the poverty level.
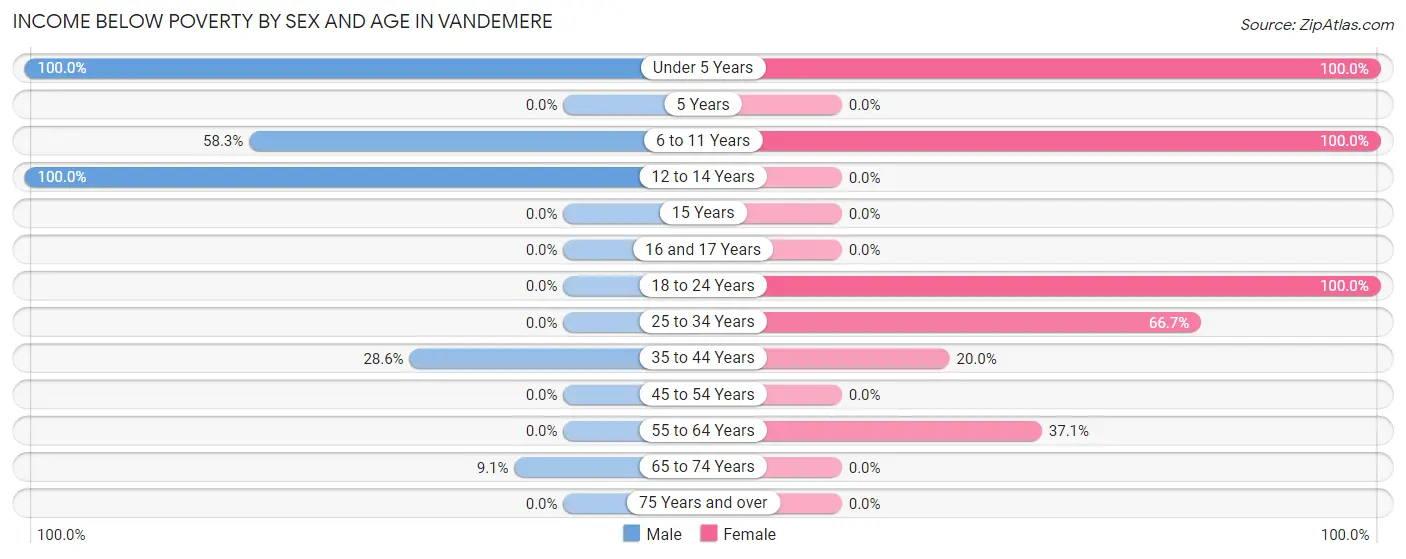
| Age Bracket | Male | Female |
| Under 5 Years | 7 (100.0%) | 8 (100.0%) |
| 5 Years | 0 (0.0%) | 0 (0.0%) |
| 6 to 11 Years | 7 (58.3%) | 5 (100.0%) |
| 12 to 14 Years | 1 (100.0%) | 0 (0.0%) |
| 15 Years | 0 (0.0%) | 0 (0.0%) |
| 16 and 17 Years | 0 (0.0%) | 0 (0.0%) |
| 18 to 24 Years | 0 (0.0%) | 3 (100.0%) |
| 25 to 34 Years | 0 (0.0%) | 6 (66.7%) |
| 35 to 44 Years | 2 (28.6%) | 2 (20.0%) |
| 45 to 54 Years | 0 (0.0%) | 0 (0.0%) |
| 55 to 64 Years | 0 (0.0%) | 13 (37.1%) |
| 65 to 74 Years | 1 (9.1%) | 0 (0.0%) |
| 75 Years and over | 0 (0.0%) | 0 (0.0%) |
| Total | 18 (21.7%) | 37 (28.2%) |
Income Above Poverty by Sex and Age in Vandemere
According to the poverty statistics in Vandemere, males aged 15 years and females aged 45 to 54 years are the age groups that are most secure financially, with 100.0% of males and 100.0% of females in these age groups living above the poverty line.
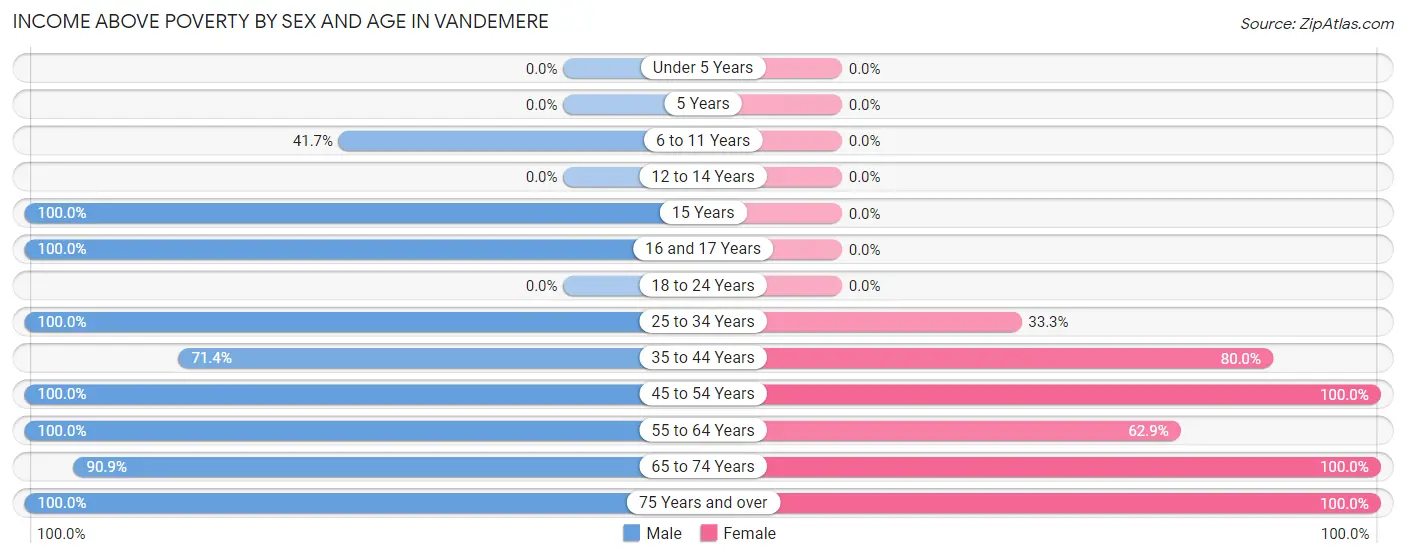
| Age Bracket | Male | Female |
| Under 5 Years | 0 (0.0%) | 0 (0.0%) |
| 5 Years | 0 (0.0%) | 0 (0.0%) |
| 6 to 11 Years | 5 (41.7%) | 0 (0.0%) |
| 12 to 14 Years | 0 (0.0%) | 0 (0.0%) |
| 15 Years | 2 (100.0%) | 0 (0.0%) |
| 16 and 17 Years | 7 (100.0%) | 0 (0.0%) |
| 18 to 24 Years | 0 (0.0%) | 0 (0.0%) |
| 25 to 34 Years | 1 (100.0%) | 3 (33.3%) |
| 35 to 44 Years | 5 (71.4%) | 8 (80.0%) |
| 45 to 54 Years | 16 (100.0%) | 3 (100.0%) |
| 55 to 64 Years | 11 (100.0%) | 22 (62.9%) |
| 65 to 74 Years | 10 (90.9%) | 41 (100.0%) |
| 75 Years and over | 8 (100.0%) | 17 (100.0%) |
| Total | 65 (78.3%) | 94 (71.8%) |
Income Below Poverty Among Married-Couple Families in Vandemere
| Children | Above Poverty | Below Poverty |
| No Children | 21 (100.0%) | 0 (0.0%) |
| 1 or 2 Children | 3 (100.0%) | 0 (0.0%) |
| 3 or 4 Children | 0 (0.0%) | 0 (0.0%) |
| 5 or more Children | 0 (0.0%) | 0 (0.0%) |
| Total | 24 (100.0%) | 0 (0.0%) |
Income Below Poverty Among Single-Parent Households in Vandemere
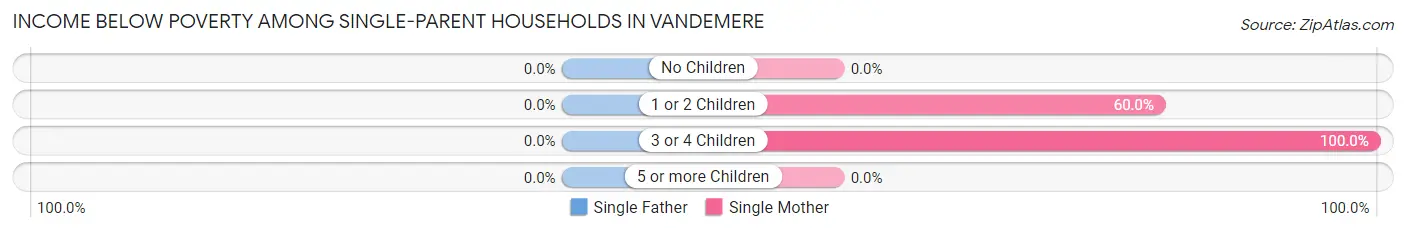
| Children | Single Father | Single Mother |
| No Children | 0 (0.0%) | 0 (0.0%) |
| 1 or 2 Children | 0 (0.0%) | 9 (60.0%) |
| 3 or 4 Children | 0 (0.0%) | 5 (100.0%) |
| 5 or more Children | 0 (0.0%) | 0 (0.0%) |
| Total | 0 (0.0%) | 14 (45.2%) |
Income Below Poverty Among Married-Couple vs Single-Parent Households in Vandemere
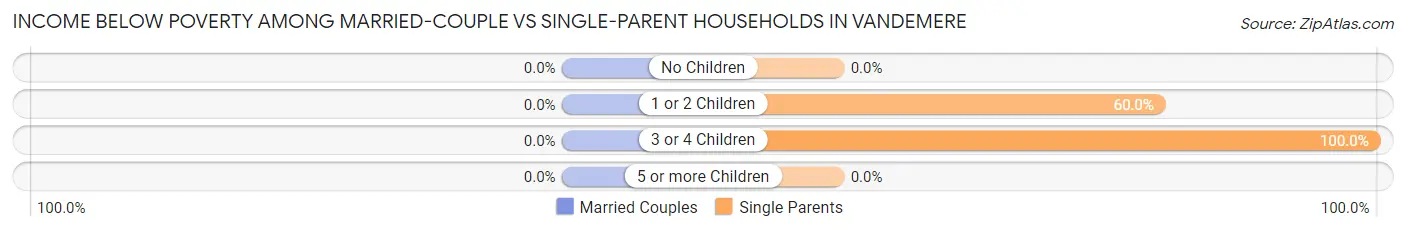
| Children | Married-Couple Families | Single-Parent Households |
| No Children | 0 (0.0%) | 0 (0.0%) |
| 1 or 2 Children | 0 (0.0%) | 9 (60.0%) |
| 3 or 4 Children | 0 (0.0%) | 5 (100.0%) |
| 5 or more Children | 0 (0.0%) | 0 (0.0%) |
| Total | 0 (0.0%) | 14 (43.8%) |
Race in Vandemere
The most populous races in Vandemere are White / Caucasian (112 | 52.3%), Black / African American (100 | 46.7%), and Two or more Races (2 | 0.9%).
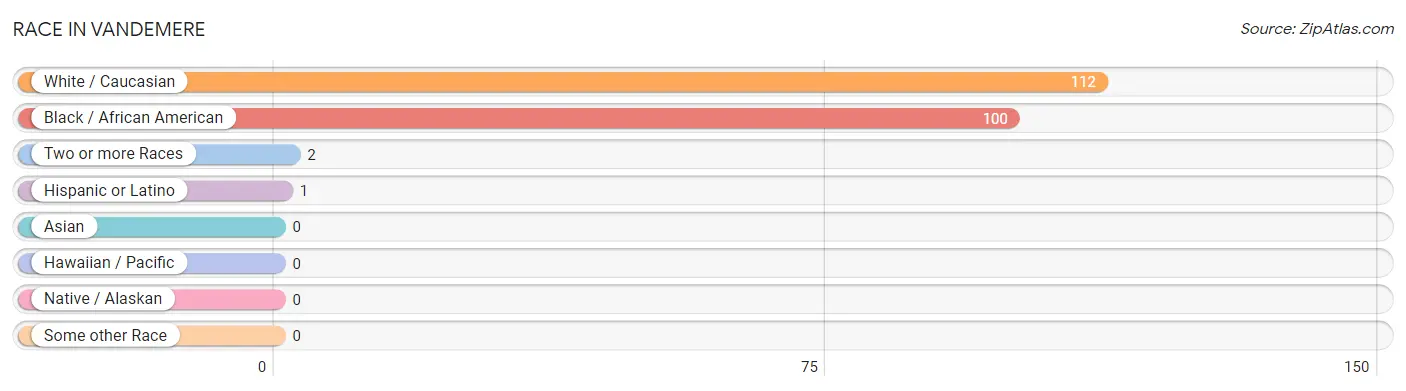
| Race | # Population | % Population |
| Asian | 0 | 0.0% |
| Black / African American | 100 | 46.7% |
| Hawaiian / Pacific | 0 | 0.0% |
| Hispanic or Latino | 1 | 0.5% |
| Native / Alaskan | 0 | 0.0% |
| White / Caucasian | 112 | 52.3% |
| Two or more Races | 2 | 0.9% |
| Some other Race | 0 | 0.0% |
| Total | 214 | 100.0% |
Ancestry in Vandemere
The most populous ancestries reported in Vandemere are American (43 | 20.1%), English (18 | 8.4%), Irish (12 | 5.6%), German (8 | 3.7%), and French (4 | 1.9%), together accounting for 39.7% of all Vandemere residents.
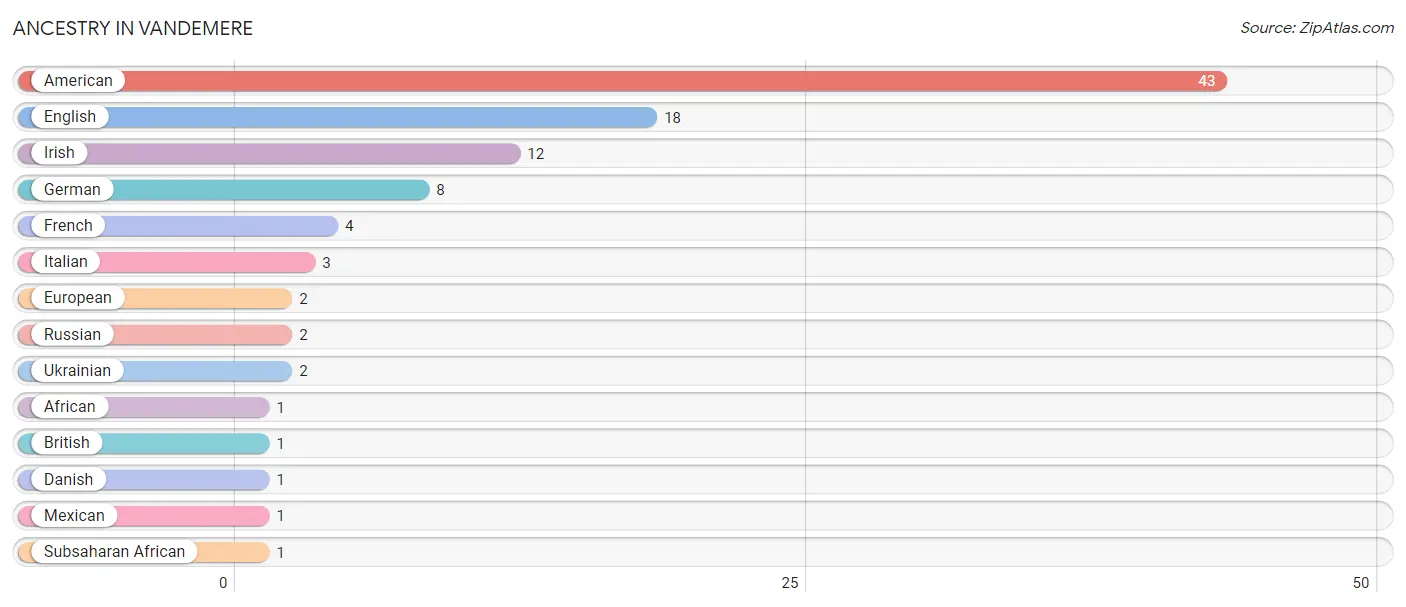
| Ancestry | # Population | % Population |
| African | 1 | 0.5% |
| American | 43 | 20.1% |
| British | 1 | 0.5% |
| Danish | 1 | 0.5% |
| English | 18 | 8.4% |
| European | 2 | 0.9% |
| French | 4 | 1.9% |
| German | 8 | 3.7% |
| Irish | 12 | 5.6% |
| Italian | 3 | 1.4% |
| Mexican | 1 | 0.5% |
| Russian | 2 | 0.9% |
| Subsaharan African | 1 | 0.5% |
| Ukrainian | 2 | 0.9% | View All 14 Rows |
Immigrants in Vandemere
The most numerous immigrant groups reported in Vandemere came from Australia (1 | 0.5%), and Oceania (1 | 0.5%), together accounting for 0.9% of all Vandemere residents.
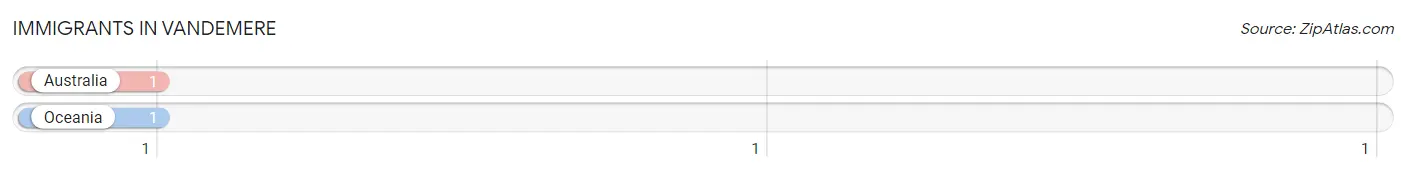
| Immigration Origin | # Population | % Population |
| Australia | 1 | 0.5% |
| Oceania | 1 | 0.5% | View All 2 Rows |
Sex and Age in Vandemere
Sex and Age in Vandemere
The most populous age groups in Vandemere are 5 to 9 Years (12 | 14.5%) for men and 65 to 69 Years (32 | 24.4%) for women.
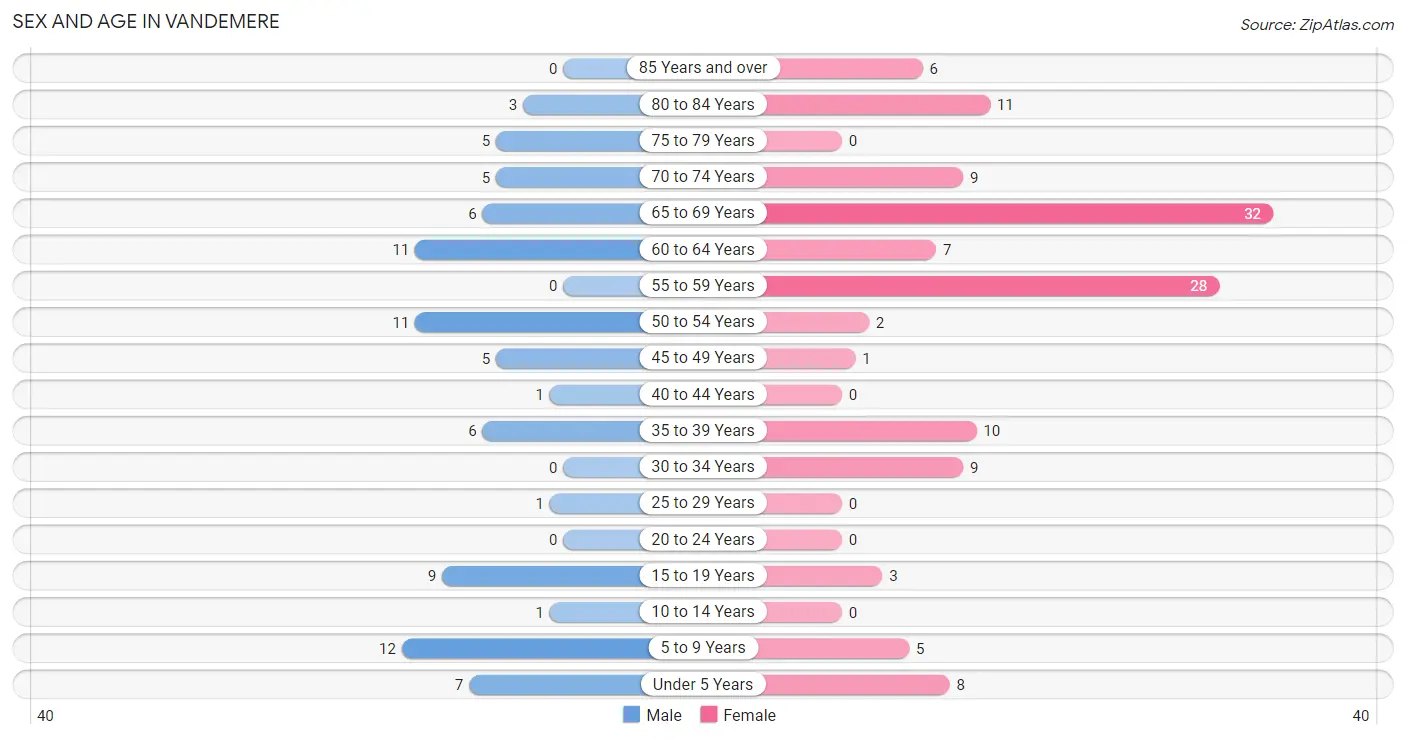
| Age Bracket | Male | Female |
| Under 5 Years | 7 (8.4%) | 8 (6.1%) |
| 5 to 9 Years | 12 (14.5%) | 5 (3.8%) |
| 10 to 14 Years | 1 (1.2%) | 0 (0.0%) |
| 15 to 19 Years | 9 (10.8%) | 3 (2.3%) |
| 20 to 24 Years | 0 (0.0%) | 0 (0.0%) |
| 25 to 29 Years | 1 (1.2%) | 0 (0.0%) |
| 30 to 34 Years | 0 (0.0%) | 9 (6.9%) |
| 35 to 39 Years | 6 (7.2%) | 10 (7.6%) |
| 40 to 44 Years | 1 (1.2%) | 0 (0.0%) |
| 45 to 49 Years | 5 (6.0%) | 1 (0.8%) |
| 50 to 54 Years | 11 (13.3%) | 2 (1.5%) |
| 55 to 59 Years | 0 (0.0%) | 28 (21.4%) |
| 60 to 64 Years | 11 (13.3%) | 7 (5.3%) |
| 65 to 69 Years | 6 (7.2%) | 32 (24.4%) |
| 70 to 74 Years | 5 (6.0%) | 9 (6.9%) |
| 75 to 79 Years | 5 (6.0%) | 0 (0.0%) |
| 80 to 84 Years | 3 (3.6%) | 11 (8.4%) |
| 85 Years and over | 0 (0.0%) | 6 (4.6%) |
| Total | 83 (100.0%) | 131 (100.0%) |
Families and Households in Vandemere
Median Family Size in Vandemere
The median family size in Vandemere is 3.02 persons per family, with single female/mother families (31 | 55.4%) accounting for the largest median family size of 3.65 persons per family. On the other hand, single male/father families (1 | 1.8%) represent the smallest median family size with 2.00 persons per family.
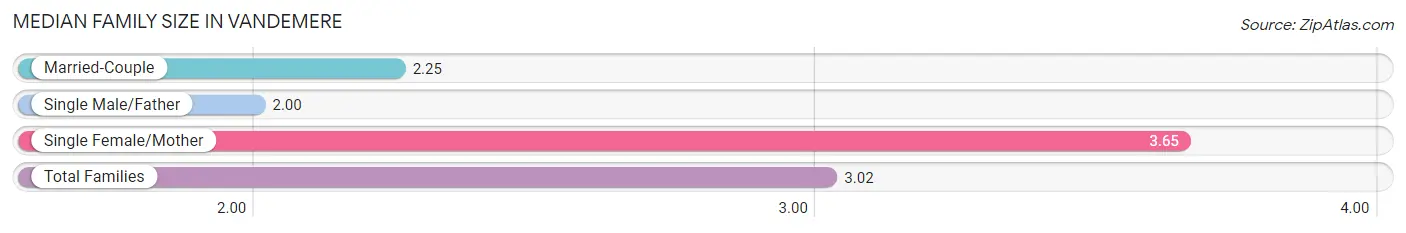
| Family Type | # Families | Family Size |
| Married-Couple | 24 (42.9%) | 2.25 |
| Single Male/Father | 1 (1.8%) | 2.00 |
| Single Female/Mother | 31 (55.4%) | 3.65 |
| Total Families | 56 (100.0%) | 3.02 |
Median Household Size in Vandemere
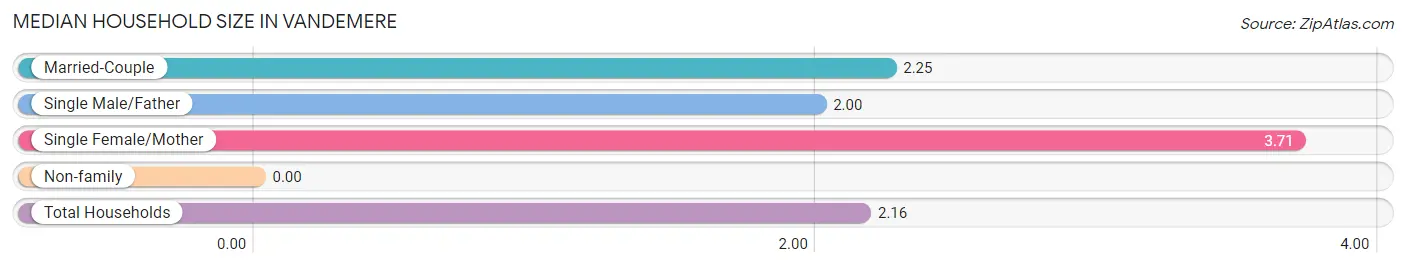
| Household Type | # Households | Household Size |
| Married-Couple | 24 (24.2%) | 2.25 |
| Single Male/Father | 1 (1.0%) | 2.00 |
| Single Female/Mother | 31 (31.3%) | 3.71 |
| Non-family | 43 (43.4%) | - |
| Total Households | 99 (100.0%) | 2.16 |
Household Size by Marriage Status in Vandemere
Out of a total of 99 households in Vandemere, 56 (56.6%) are family households, while 43 (43.4%) are nonfamily households. The most numerous type of family households are 2-person households, comprising 39, and the most common type of nonfamily households are 1-person households, comprising 43.
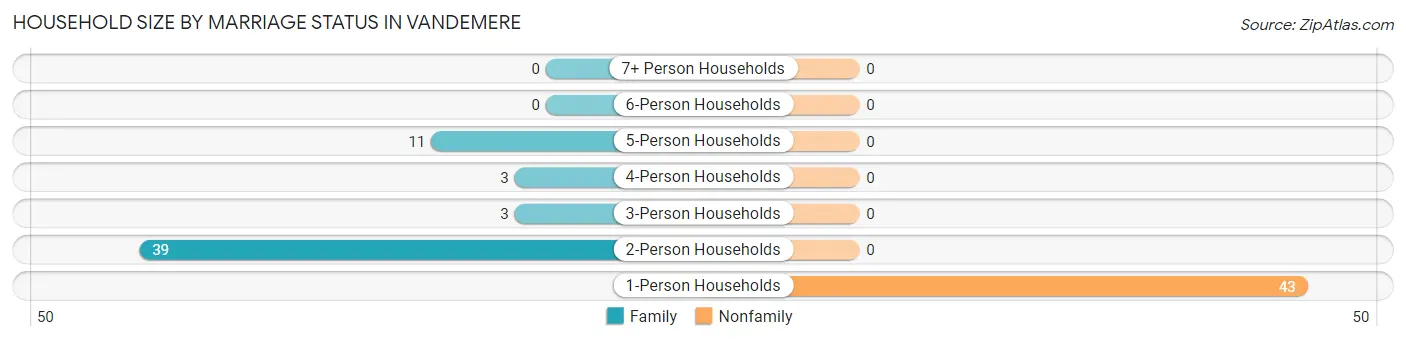
| Household Size | Family Households | Nonfamily Households |
| 1-Person Households | - | 43 (43.4%) |
| 2-Person Households | 39 (39.4%) | 0 (0.0%) |
| 3-Person Households | 3 (3.0%) | 0 (0.0%) |
| 4-Person Households | 3 (3.0%) | 0 (0.0%) |
| 5-Person Households | 11 (11.1%) | 0 (0.0%) |
| 6-Person Households | 0 (0.0%) | 0 (0.0%) |
| 7+ Person Households | 0 (0.0%) | 0 (0.0%) |
| Total | 56 (56.6%) | 43 (43.4%) |
Female Fertility in Vandemere
Fertility by Age in Vandemere
Average fertility rate in Vandemere is 261.0 births per 1,000 women. Women in the age bracket of 20 to 34 years have the highest fertility rate with 667.0 births per 1,000 women. Women in the age bracket of 20 to 34 years acount for 100.0% of all women with births.
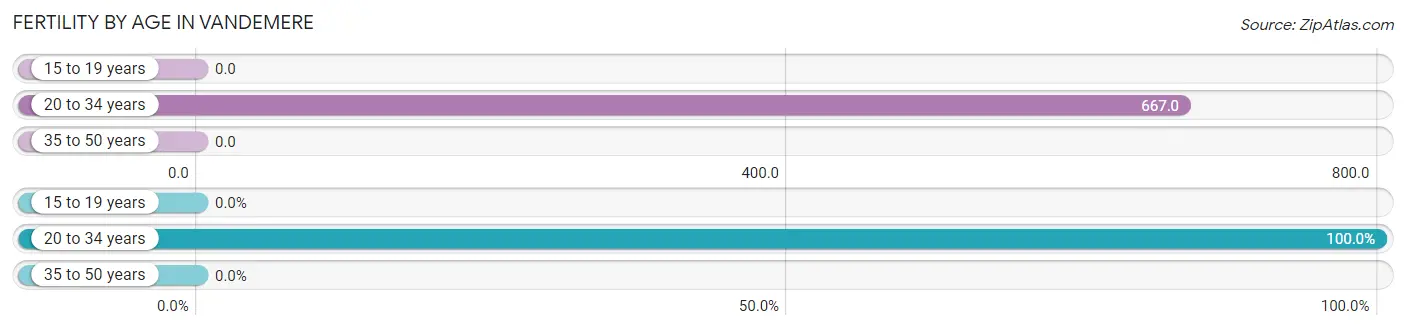
| Age Bracket | Women with Births | Births / 1,000 Women |
| 15 to 19 years | 0 (0.0%) | 0.0 |
| 20 to 34 years | 6 (100.0%) | 667.0 |
| 35 to 50 years | 0 (0.0%) | 0.0 |
| Total | 6 (100.0%) | 261.0 |
Fertility by Age by Marriage Status in Vandemere
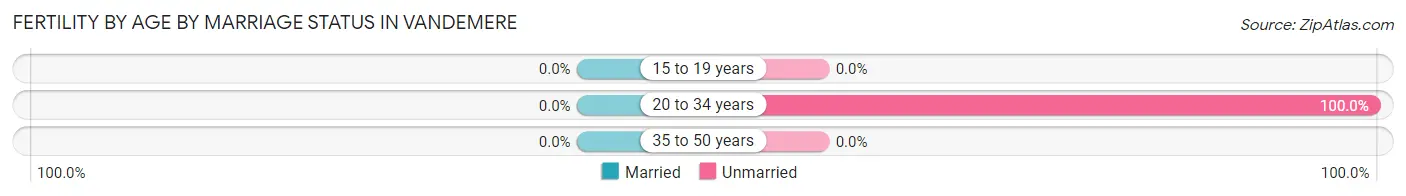
| Age Bracket | Married | Unmarried |
| 15 to 19 years | 0 (0.0%) | 0 (0.0%) |
| 20 to 34 years | 0 (0.0%) | 6 (100.0%) |
| 35 to 50 years | 0 (0.0%) | 0 (0.0%) |
| Total | 0 (0.0%) | 6 (100.0%) |
Fertility by Education in Vandemere
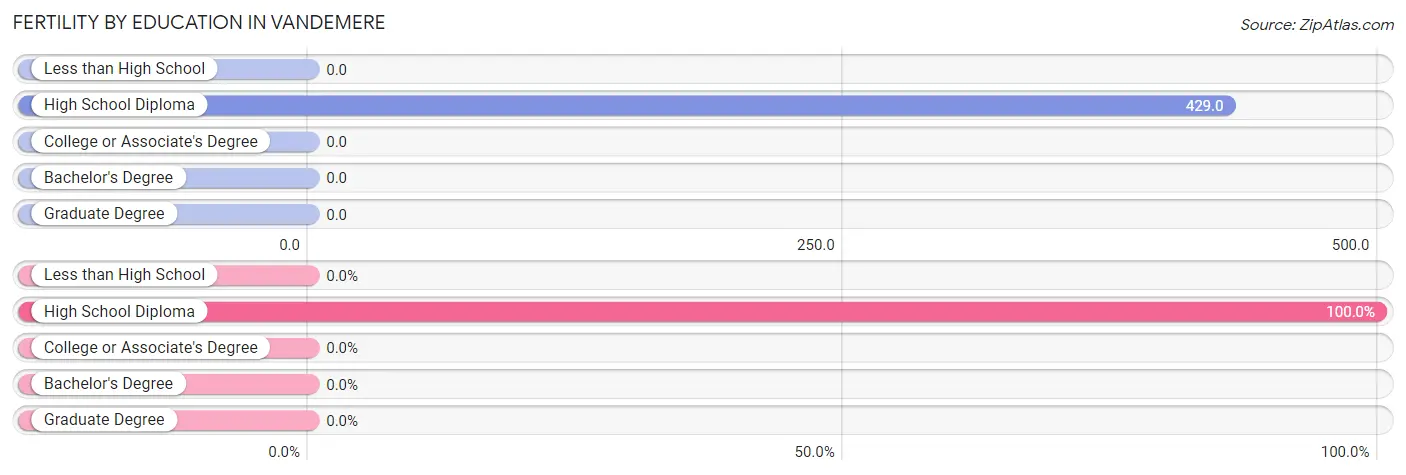
| Educational Attainment | Women with Births | Births / 1,000 Women |
| Less than High School | 0 (0.0%) | 0.0 |
| High School Diploma | 6 (100.0%) | 429.0 |
| College or Associate's Degree | 0 (0.0%) | 0.0 |
| Bachelor's Degree | 0 (0.0%) | 0.0 |
| Graduate Degree | 0 (0.0%) | 0.0 |
| Total | 6 (100.0%) | 261.0 |
Fertility by Education by Marriage Status in Vandemere
| Educational Attainment | Married | Unmarried |
| Less than High School | 0 (0.0%) | 0 (0.0%) |
| High School Diploma | 0 (0.0%) | 6 (100.0%) |
| College or Associate's Degree | 0 (0.0%) | 0 (0.0%) |
| Bachelor's Degree | 0 (0.0%) | 0 (0.0%) |
| Graduate Degree | 0 (0.0%) | 0 (0.0%) |
| Total | 0 (0.0%) | 6 (100.0%) |
Employment Characteristics in Vandemere
Employment by Class of Employer in Vandemere
Among the 55 employed individuals in Vandemere, private company employees (24 | 43.6%), self-employed (incorporated) (6 | 10.9%), and state government employees (6 | 10.9%) make up the most common classes of employment.
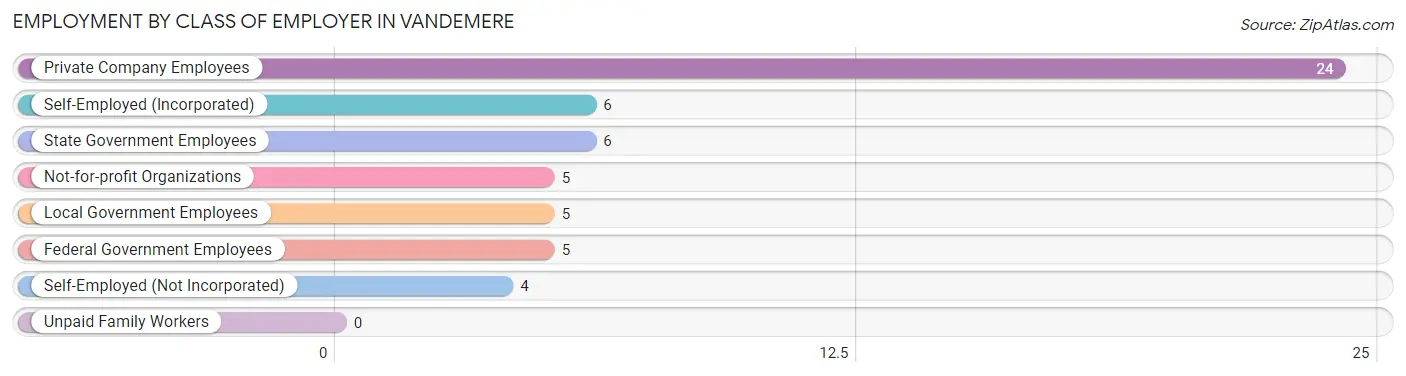
| Employer Class | # Employees | % Employees |
| Private Company Employees | 24 | 43.6% |
| Self-Employed (Incorporated) | 6 | 10.9% |
| Self-Employed (Not Incorporated) | 4 | 7.3% |
| Not-for-profit Organizations | 5 | 9.1% |
| Local Government Employees | 5 | 9.1% |
| State Government Employees | 6 | 10.9% |
| Federal Government Employees | 5 | 9.1% |
| Unpaid Family Workers | 0 | 0.0% |
| Total | 55 | 100.0% |
Employment Status by Age in Vandemere
According to the labor force statistics for Vandemere, out of the total population over 16 years of age (179), 36.3% or 65 individuals are in the labor force, with 7.7% or 5 of them unemployed. The age group with the highest labor force participation rate is 25 to 29 years, with 100.0% or 1 individuals in the labor force. Within the labor force, the 35 to 44 years age range has the highest percentage of unemployed individuals, with 25.0% or 3 of them being unemployed.
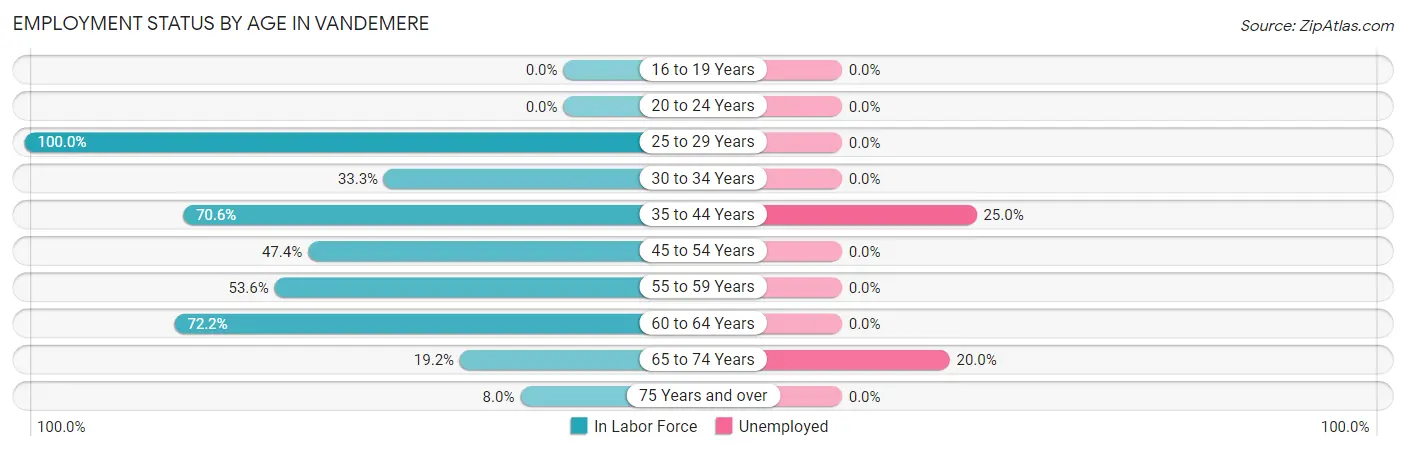
| Age Bracket | In Labor Force | Unemployed |
| 16 to 19 Years | 0 (0.0%) | 0 (0.0%) |
| 20 to 24 Years | 0 (0.0%) | 0 (0.0%) |
| 25 to 29 Years | 1 (100.0%) | 0 (0.0%) |
| 30 to 34 Years | 3 (33.3%) | 0 (0.0%) |
| 35 to 44 Years | 12 (70.6%) | 3 (25.0%) |
| 45 to 54 Years | 9 (47.4%) | 0 (0.0%) |
| 55 to 59 Years | 15 (53.6%) | 0 (0.0%) |
| 60 to 64 Years | 13 (72.2%) | 0 (0.0%) |
| 65 to 74 Years | 10 (19.2%) | 2 (20.0%) |
| 75 Years and over | 2 (8.0%) | 0 (0.0%) |
| Total | 65 (36.3%) | 5 (7.7%) |
Employment Status by Educational Attainment in Vandemere
According to labor force statistics for Vandemere, 57.6% of individuals (53) out of the total population between 25 and 64 years of age (92) are in the labor force, with 5.7% or 3 of them being unemployed. The group with the highest labor force participation rate are those with the educational attainment of college / associate degree, with 93.3% or 28 individuals in the labor force. Within the labor force, individuals with high school diploma education have the highest percentage of unemployment, with 12.5% or 2 of them being unemployed.
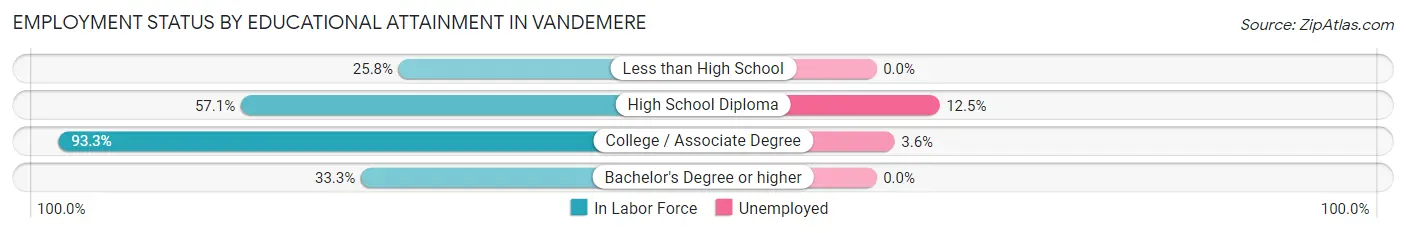
| Educational Attainment | In Labor Force | Unemployed |
| Less than High School | 8 (25.8%) | 0 (0.0%) |
| High School Diploma | 16 (57.1%) | 4 (12.5%) |
| College / Associate Degree | 28 (93.3%) | 1 (3.6%) |
| Bachelor's Degree or higher | 1 (33.3%) | 0 (0.0%) |
| Total | 53 (57.6%) | 5 (5.7%) |
Employment Occupations by Sex in Vandemere
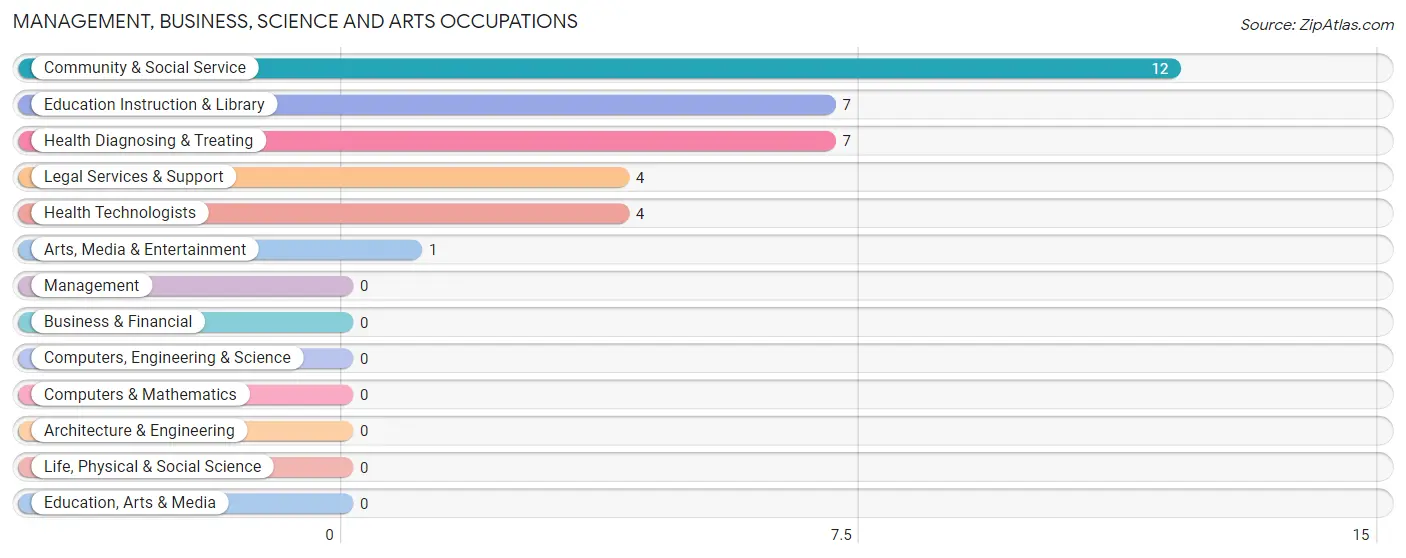
Management, Business, Science and Arts Occupations
The most common Management, Business, Science and Arts occupations in Vandemere are Community & Social Service (12 | 20.0%), Education Instruction & Library (7 | 11.7%), Health Diagnosing & Treating (7 | 11.7%), Legal Services & Support (4 | 6.7%), and Health Technologists (4 | 6.7%).
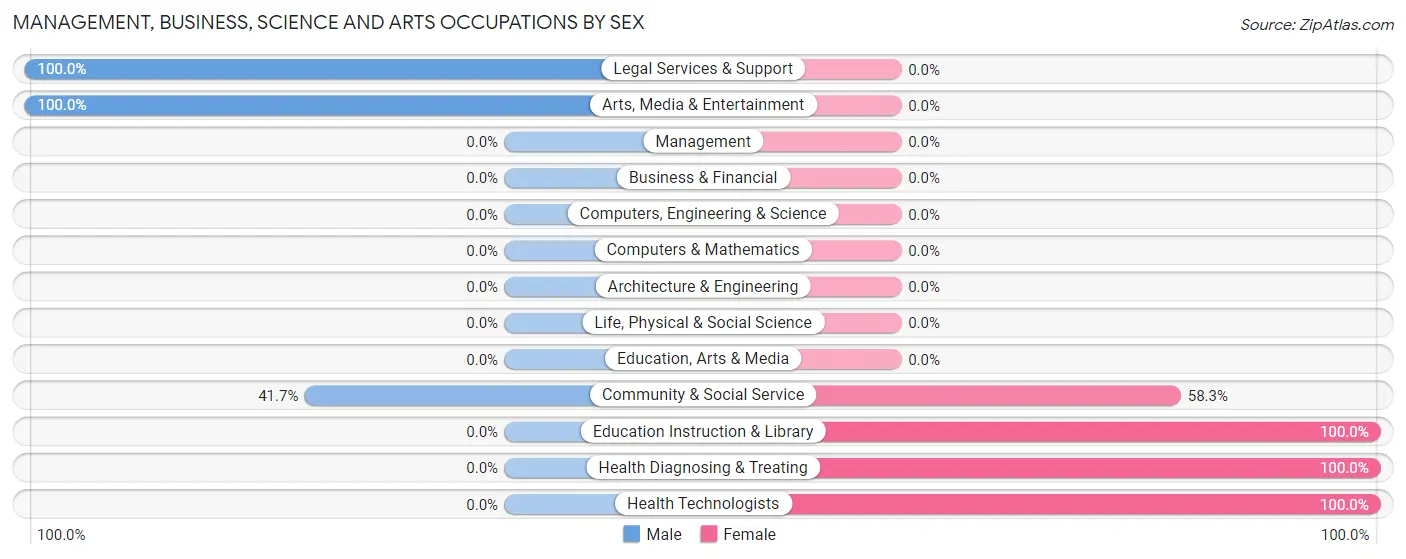
Management, Business, Science and Arts Occupations by Sex
Within the Management, Business, Science and Arts occupations in Vandemere, the most male-oriented occupations are Legal Services & Support (100.0%), Arts, Media & Entertainment (100.0%), and Community & Social Service (41.7%), while the most female-oriented occupations are Education Instruction & Library (100.0%), Health Diagnosing & Treating (100.0%), and Health Technologists (100.0%).
| Occupation | Male | Female |
| Management | 0 (0.0%) | 0 (0.0%) |
| Business & Financial | 0 (0.0%) | 0 (0.0%) |
| Computers, Engineering & Science | 0 (0.0%) | 0 (0.0%) |
| Computers & Mathematics | 0 (0.0%) | 0 (0.0%) |
| Architecture & Engineering | 0 (0.0%) | 0 (0.0%) |
| Life, Physical & Social Science | 0 (0.0%) | 0 (0.0%) |
| Community & Social Service | 5 (41.7%) | 7 (58.3%) |
| Education, Arts & Media | 0 (0.0%) | 0 (0.0%) |
| Legal Services & Support | 4 (100.0%) | 0 (0.0%) |
| Education Instruction & Library | 0 (0.0%) | 7 (100.0%) |
| Arts, Media & Entertainment | 1 (100.0%) | 0 (0.0%) |
| Health Diagnosing & Treating | 0 (0.0%) | 7 (100.0%) |
| Health Technologists | 0 (0.0%) | 4 (100.0%) |
| Total (Category) | 5 (26.3%) | 14 (73.7%) |
| Total (Overall) | 23 (38.3%) | 37 (61.7%) |
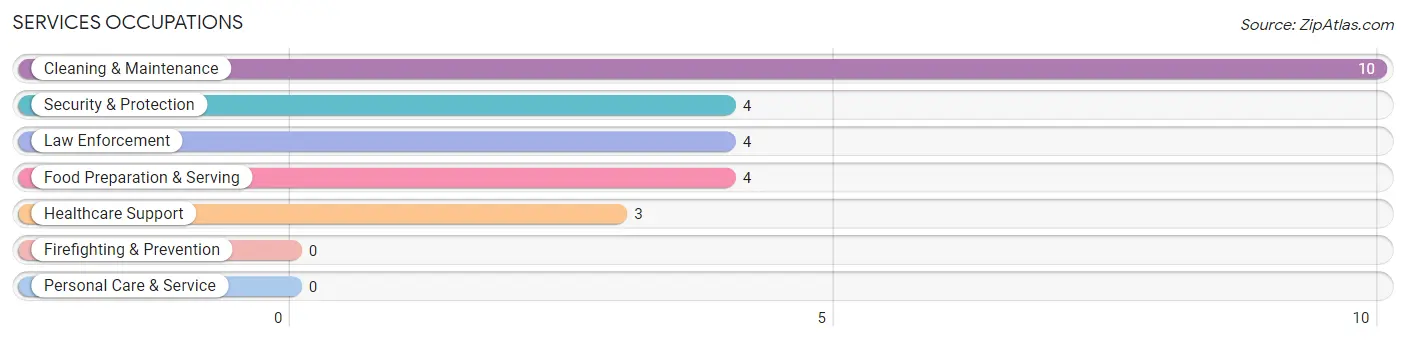
Services Occupations
The most common Services occupations in Vandemere are Cleaning & Maintenance (10 | 16.7%), Security & Protection (4 | 6.7%), Law Enforcement (4 | 6.7%), Food Preparation & Serving (4 | 6.7%), and Healthcare Support (3 | 5.0%).
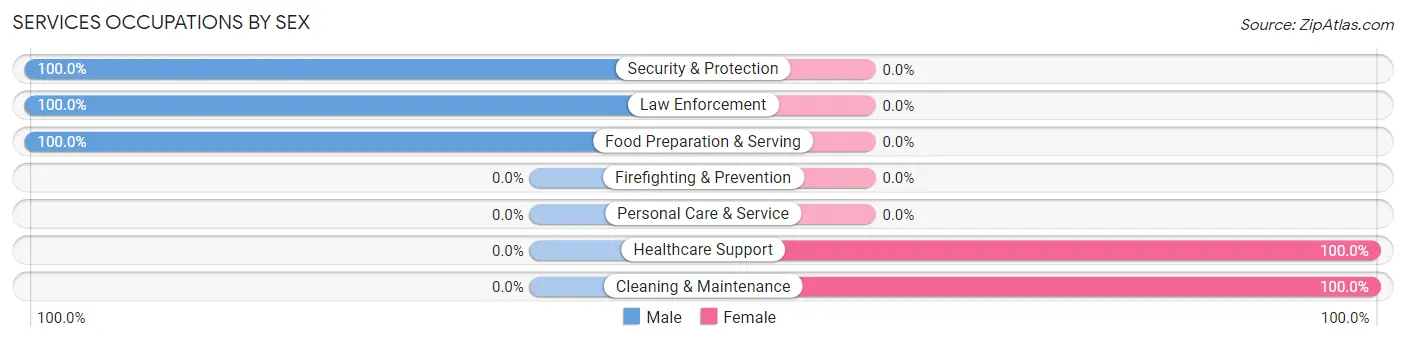
Services Occupations by Sex
Within the Services occupations in Vandemere, the most male-oriented occupations are Security & Protection (100.0%), Law Enforcement (100.0%), and Food Preparation & Serving (100.0%), while the most female-oriented occupations are Healthcare Support (100.0%), and Cleaning & Maintenance (100.0%).
| Occupation | Male | Female |
| Healthcare Support | 0 (0.0%) | 3 (100.0%) |
| Security & Protection | 4 (100.0%) | 0 (0.0%) |
| Firefighting & Prevention | 0 (0.0%) | 0 (0.0%) |
| Law Enforcement | 4 (100.0%) | 0 (0.0%) |
| Food Preparation & Serving | 4 (100.0%) | 0 (0.0%) |
| Cleaning & Maintenance | 0 (0.0%) | 10 (100.0%) |
| Personal Care & Service | 0 (0.0%) | 0 (0.0%) |
| Total (Category) | 8 (38.1%) | 13 (61.9%) |
| Total (Overall) | 23 (38.3%) | 37 (61.7%) |
Sales and Office Occupations
The most common Sales and Office occupations in Vandemere are Sales & Related (6 | 10.0%), and Office & Administration (6 | 10.0%).

Sales and Office Occupations by Sex
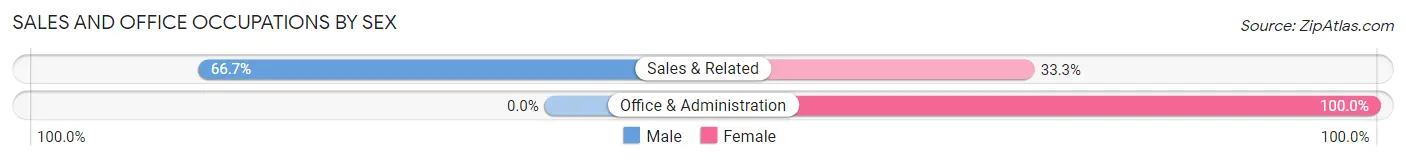
| Occupation | Male | Female |
| Sales & Related | 4 (66.7%) | 2 (33.3%) |
| Office & Administration | 0 (0.0%) | 6 (100.0%) |
| Total (Category) | 4 (33.3%) | 8 (66.7%) |
| Total (Overall) | 23 (38.3%) | 37 (61.7%) |
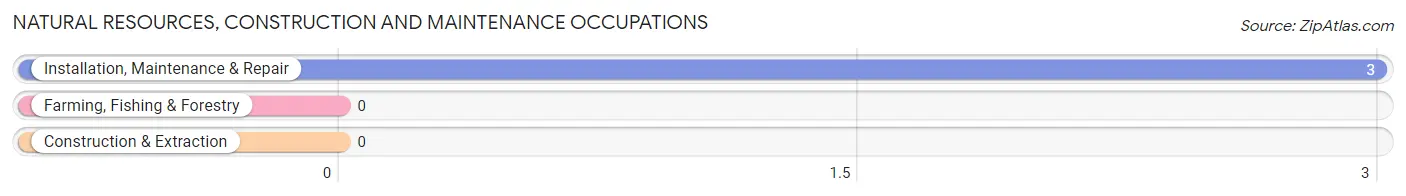
Natural Resources, Construction and Maintenance Occupations
The most common Natural Resources, Construction and Maintenance occupations in Vandemere are , and Installation, Maintenance & Repair (3 | 5.0%).
Natural Resources, Construction and Maintenance Occupations by Sex
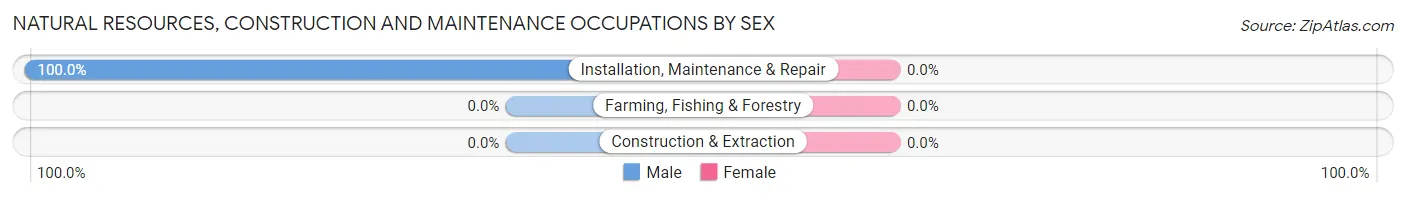
| Occupation | Male | Female |
| Farming, Fishing & Forestry | 0 (0.0%) | 0 (0.0%) |
| Construction & Extraction | 0 (0.0%) | 0 (0.0%) |
| Installation, Maintenance & Repair | 3 (100.0%) | 0 (0.0%) |
| Total (Category) | 3 (100.0%) | 0 (0.0%) |
| Total (Overall) | 23 (38.3%) | 37 (61.7%) |
Production, Transportation and Moving Occupations
The most common Production, Transportation and Moving occupations in Vandemere are Production (3 | 5.0%), and Transportation (2 | 3.3%).
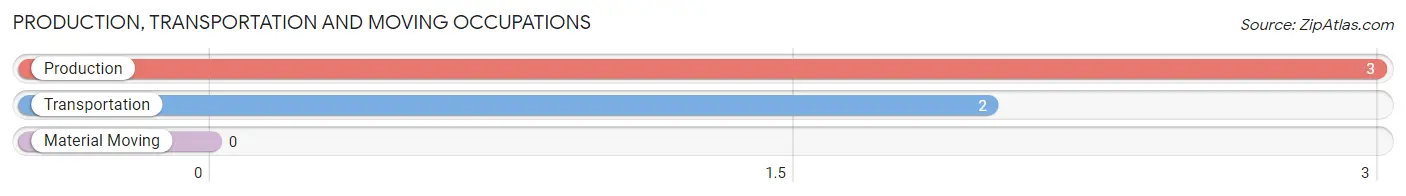
Production, Transportation and Moving Occupations by Sex
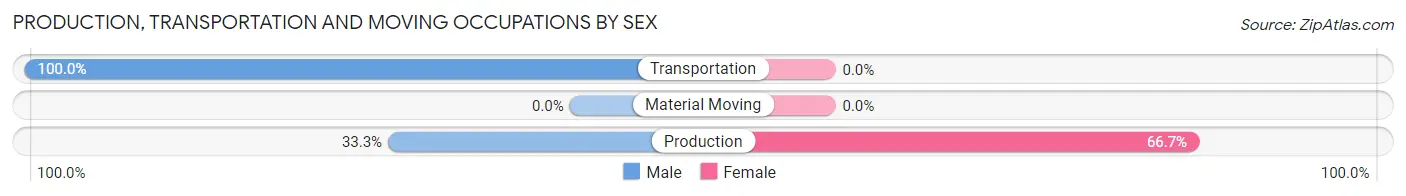
| Occupation | Male | Female |
| Production | 1 (33.3%) | 2 (66.7%) |
| Transportation | 2 (100.0%) | 0 (0.0%) |
| Material Moving | 0 (0.0%) | 0 (0.0%) |
| Total (Category) | 3 (60.0%) | 2 (40.0%) |
| Total (Overall) | 23 (38.3%) | 37 (61.7%) |
Employment Industries by Sex in Vandemere
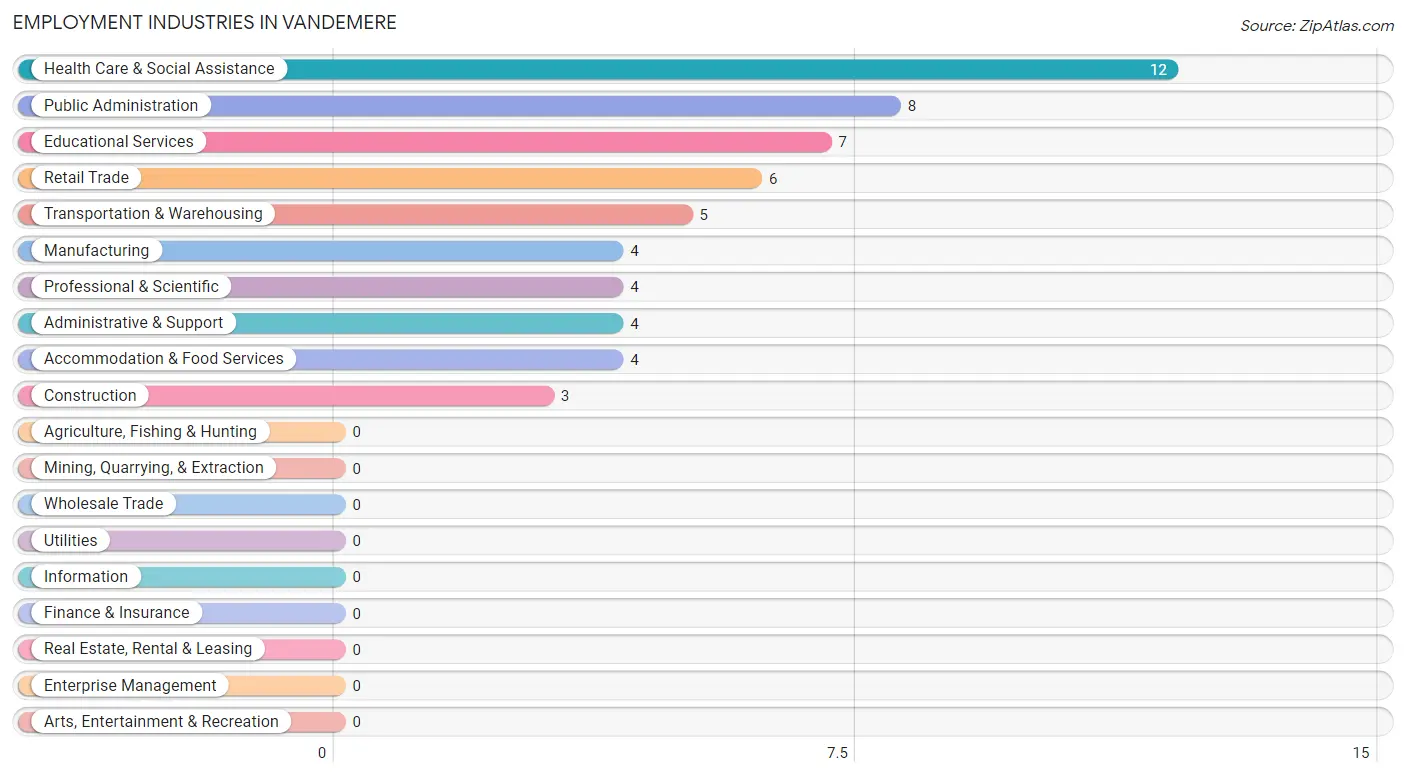
Employment Industries in Vandemere
The major employment industries in Vandemere include Health Care & Social Assistance (12 | 20.0%), Public Administration (8 | 13.3%), Educational Services (7 | 11.7%), Retail Trade (6 | 10.0%), and Transportation & Warehousing (5 | 8.3%).
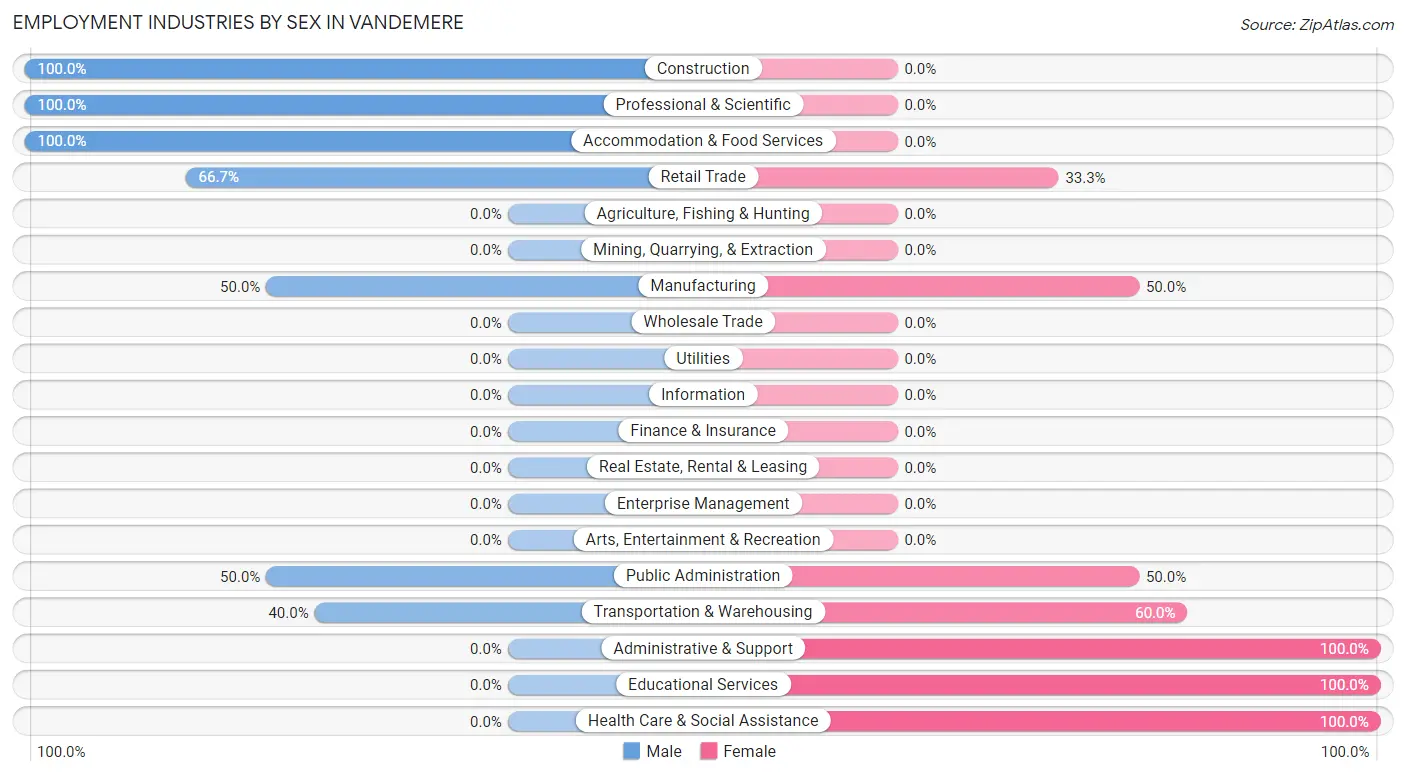
Employment Industries by Sex in Vandemere
The Vandemere industries that see more men than women are Construction (100.0%), Professional & Scientific (100.0%), and Accommodation & Food Services (100.0%), whereas the industries that tend to have a higher number of women are Administrative & Support (100.0%), Educational Services (100.0%), and Health Care & Social Assistance (100.0%).
| Industry | Male | Female |
| Agriculture, Fishing & Hunting | 0 (0.0%) | 0 (0.0%) |
| Mining, Quarrying, & Extraction | 0 (0.0%) | 0 (0.0%) |
| Construction | 3 (100.0%) | 0 (0.0%) |
| Manufacturing | 2 (50.0%) | 2 (50.0%) |
| Wholesale Trade | 0 (0.0%) | 0 (0.0%) |
| Retail Trade | 4 (66.7%) | 2 (33.3%) |
| Transportation & Warehousing | 2 (40.0%) | 3 (60.0%) |
| Utilities | 0 (0.0%) | 0 (0.0%) |
| Information | 0 (0.0%) | 0 (0.0%) |
| Finance & Insurance | 0 (0.0%) | 0 (0.0%) |
| Real Estate, Rental & Leasing | 0 (0.0%) | 0 (0.0%) |
| Professional & Scientific | 4 (100.0%) | 0 (0.0%) |
| Enterprise Management | 0 (0.0%) | 0 (0.0%) |
| Administrative & Support | 0 (0.0%) | 4 (100.0%) |
| Educational Services | 0 (0.0%) | 7 (100.0%) |
| Health Care & Social Assistance | 0 (0.0%) | 12 (100.0%) |
| Arts, Entertainment & Recreation | 0 (0.0%) | 0 (0.0%) |
| Accommodation & Food Services | 4 (100.0%) | 0 (0.0%) |
| Public Administration | 4 (50.0%) | 4 (50.0%) |
| Total | 23 (38.3%) | 37 (61.7%) |
Education in Vandemere
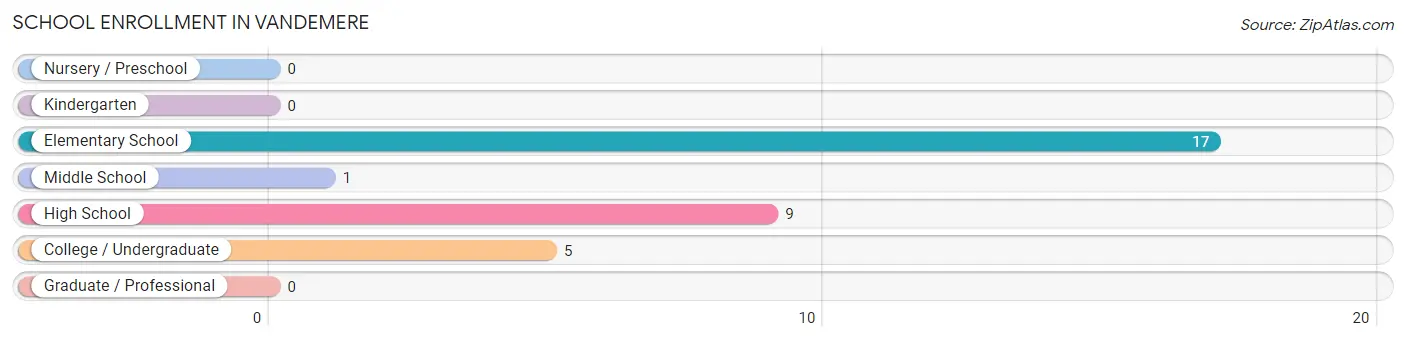
School Enrollment in Vandemere
The most common levels of schooling among the 32 students in Vandemere are elementary school (17 | 53.1%), high school (9 | 28.1%), and college / undergraduate (5 | 15.6%).
| School Level | # Students | % Students |
| Nursery / Preschool | 0 | 0.0% |
| Kindergarten | 0 | 0.0% |
| Elementary School | 17 | 53.1% |
| Middle School | 1 | 3.1% |
| High School | 9 | 28.1% |
| College / Undergraduate | 5 | 15.6% |
| Graduate / Professional | 0 | 0.0% |
| Total | 32 | 100.0% |
School Enrollment by Age by Funding Source in Vandemere
Out of a total of 32 students who are enrolled in schools in Vandemere, 5 (15.6%) attend a private institution, while the remaining 27 (84.4%) are enrolled in public schools. The age group of 5 to 9 year old has the highest likelihood of being enrolled in private schools, with 5 (29.4% in the age bracket) enrolled. Conversely, the age group of 10 to 14 year olds has the lowest likelihood of being enrolled in a private school, with 1 (100.0% in the age bracket) attending a public institution.
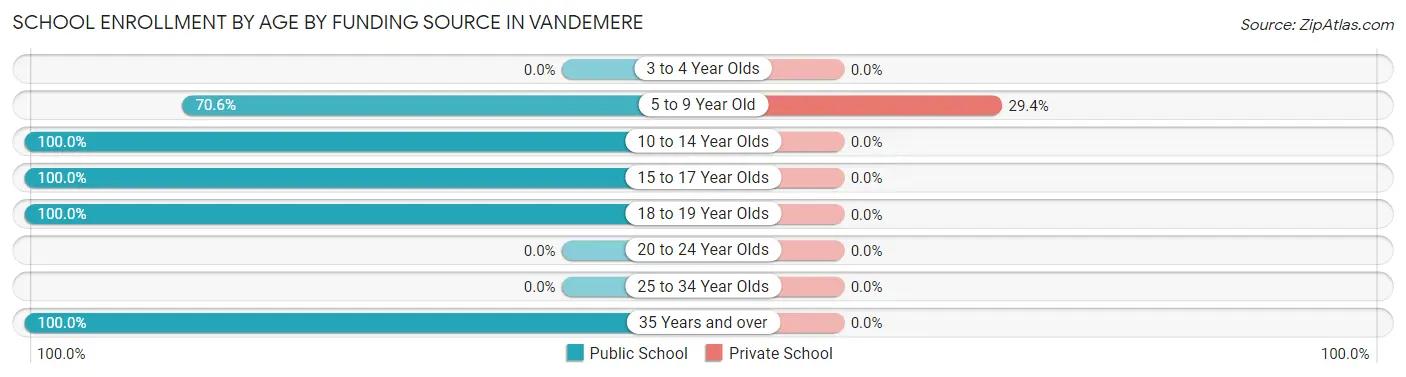
| Age Bracket | Public School | Private School |
| 3 to 4 Year Olds | 0 (0.0%) | 0 (0.0%) |
| 5 to 9 Year Old | 12 (70.6%) | 5 (29.4%) |
| 10 to 14 Year Olds | 1 (100.0%) | 0 (0.0%) |
| 15 to 17 Year Olds | 9 (100.0%) | 0 (0.0%) |
| 18 to 19 Year Olds | 3 (100.0%) | 0 (0.0%) |
| 20 to 24 Year Olds | 0 (0.0%) | 0 (0.0%) |
| 25 to 34 Year Olds | 0 (0.0%) | 0 (0.0%) |
| 35 Years and over | 2 (100.0%) | 0 (0.0%) |
| Total | 27 (84.4%) | 5 (15.6%) |
Educational Attainment by Field of Study in Vandemere
Education (17 | 68.0%), bio, nature & agricultural (4 | 16.0%), science & technology (2 | 8.0%), business (1 | 4.0%), and literature & languages (1 | 4.0%) are the most common fields of study among 25 individuals in Vandemere who have obtained a bachelor's degree or higher.
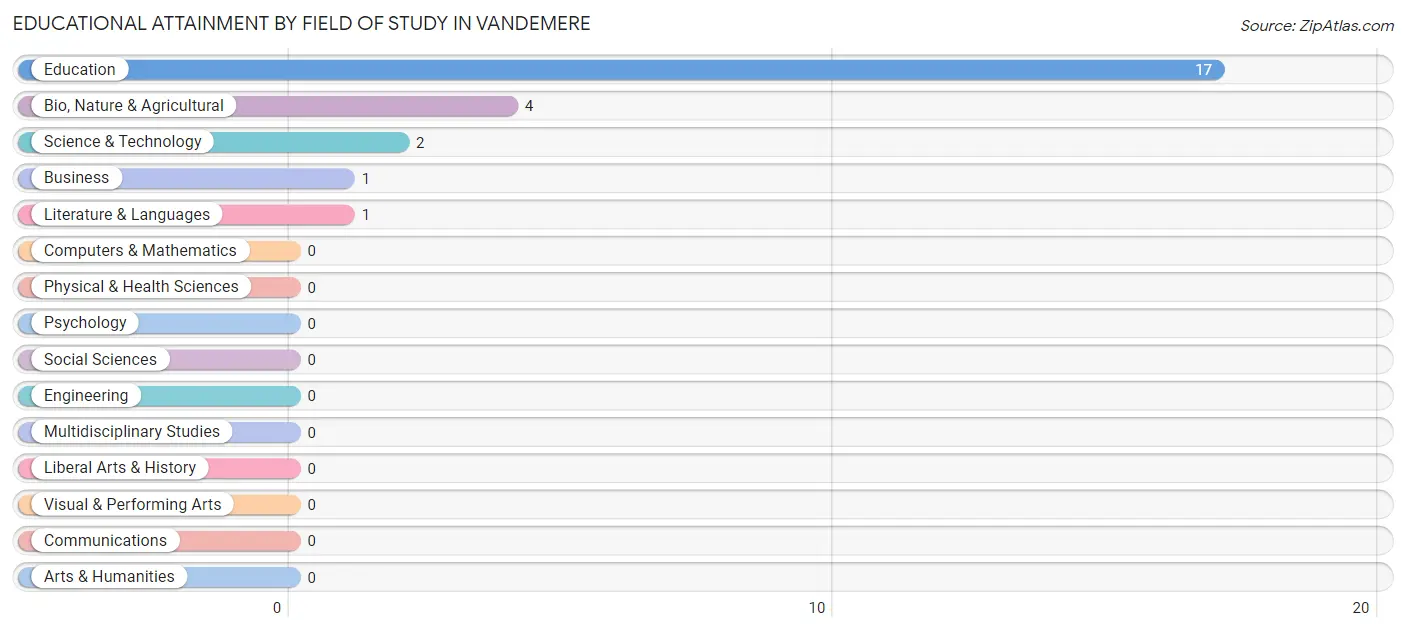
| Field of Study | # Graduates | % Graduates |
| Computers & Mathematics | 0 | 0.0% |
| Bio, Nature & Agricultural | 4 | 16.0% |
| Physical & Health Sciences | 0 | 0.0% |
| Psychology | 0 | 0.0% |
| Social Sciences | 0 | 0.0% |
| Engineering | 0 | 0.0% |
| Multidisciplinary Studies | 0 | 0.0% |
| Science & Technology | 2 | 8.0% |
| Business | 1 | 4.0% |
| Education | 17 | 68.0% |
| Literature & Languages | 1 | 4.0% |
| Liberal Arts & History | 0 | 0.0% |
| Visual & Performing Arts | 0 | 0.0% |
| Communications | 0 | 0.0% |
| Arts & Humanities | 0 | 0.0% |
| Total | 25 | 100.0% |
Transportation & Commute in Vandemere
Vehicle Availability by Sex in Vandemere
The most prevalent vehicle ownership categories in Vandemere are males with 2 vehicles (9, accounting for 39.1%) and females with 2 vehicles (13, making up 28.1%).
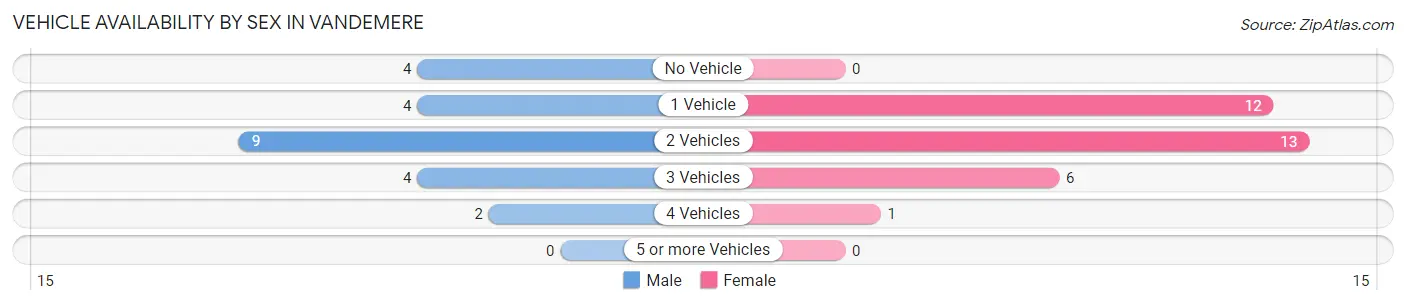
| Vehicles Available | Male | Female |
| No Vehicle | 4 (17.4%) | 0 (0.0%) |
| 1 Vehicle | 4 (17.4%) | 12 (37.5%) |
| 2 Vehicles | 9 (39.1%) | 13 (40.6%) |
| 3 Vehicles | 4 (17.4%) | 6 (18.8%) |
| 4 Vehicles | 2 (8.7%) | 1 (3.1%) |
| 5 or more Vehicles | 0 (0.0%) | 0 (0.0%) |
| Total | 23 (100.0%) | 32 (100.0%) |
Commute Time in Vandemere
The most frequently occuring commute durations in Vandemere are 10 to 14 minutes (25 commuters, 45.5%), 20 to 24 minutes (7 commuters, 12.7%), and 5 to 9 minutes (6 commuters, 10.9%).
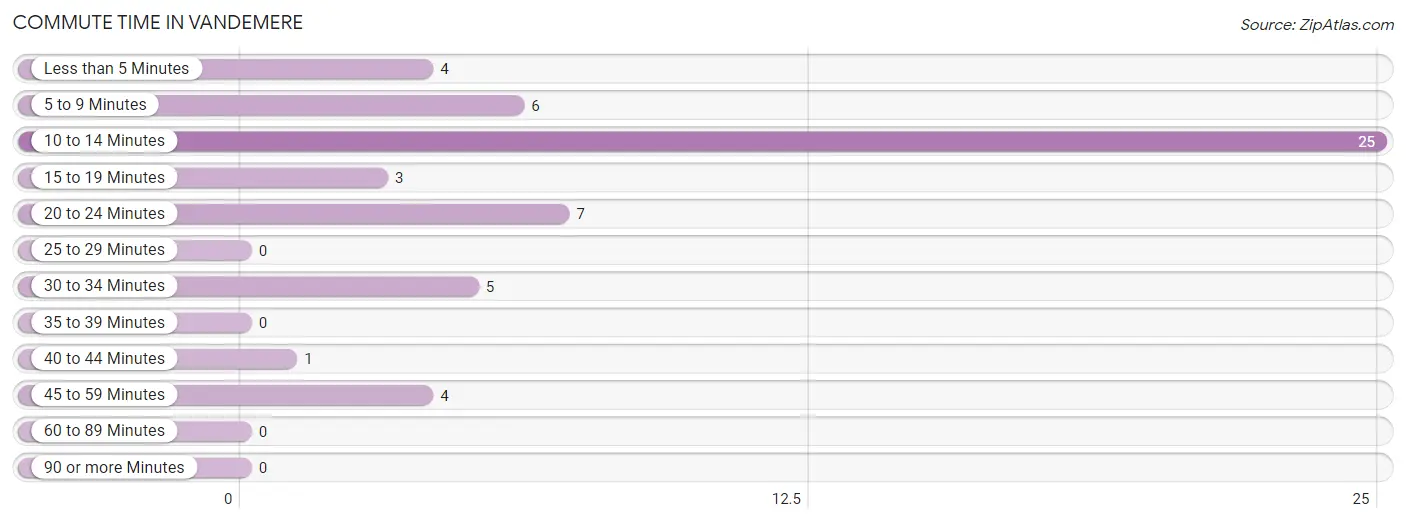
| Commute Time | # Commuters | % Commuters |
| Less than 5 Minutes | 4 | 7.3% |
| 5 to 9 Minutes | 6 | 10.9% |
| 10 to 14 Minutes | 25 | 45.5% |
| 15 to 19 Minutes | 3 | 5.4% |
| 20 to 24 Minutes | 7 | 12.7% |
| 25 to 29 Minutes | 0 | 0.0% |
| 30 to 34 Minutes | 5 | 9.1% |
| 35 to 39 Minutes | 0 | 0.0% |
| 40 to 44 Minutes | 1 | 1.8% |
| 45 to 59 Minutes | 4 | 7.3% |
| 60 to 89 Minutes | 0 | 0.0% |
| 90 or more Minutes | 0 | 0.0% |
Commute Time by Sex in Vandemere
The most common commute times in Vandemere are 10 to 14 minutes (12 commuters, 52.2%) for males and 10 to 14 minutes (13 commuters, 40.6%) for females.
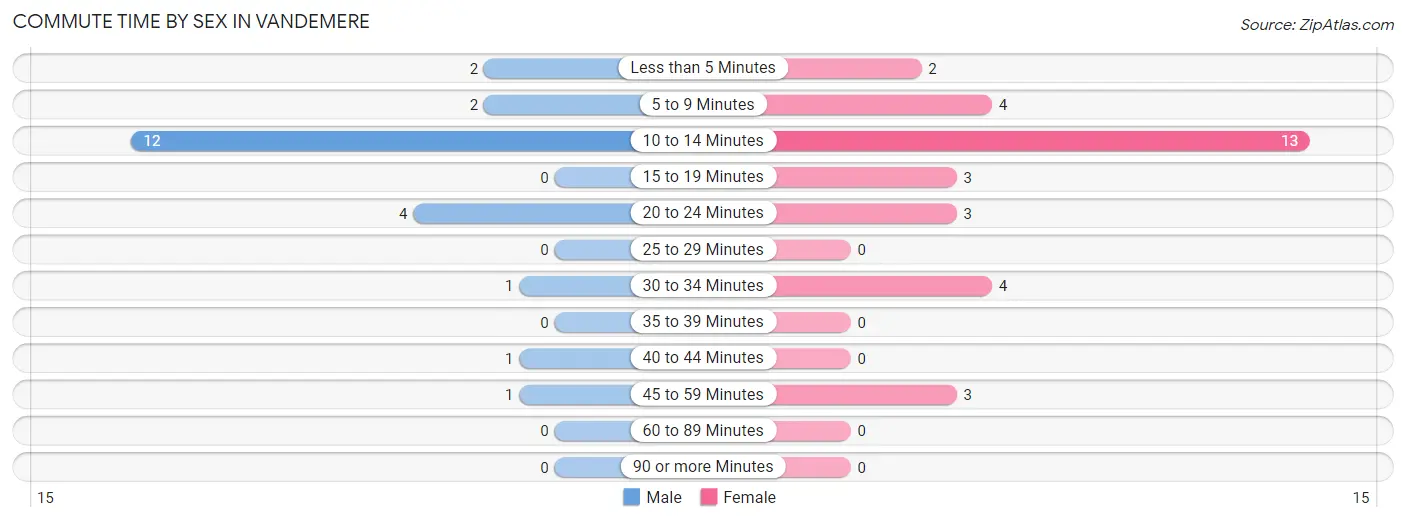
| Commute Time | Male | Female |
| Less than 5 Minutes | 2 (8.7%) | 2 (6.2%) |
| 5 to 9 Minutes | 2 (8.7%) | 4 (12.5%) |
| 10 to 14 Minutes | 12 (52.2%) | 13 (40.6%) |
| 15 to 19 Minutes | 0 (0.0%) | 3 (9.4%) |
| 20 to 24 Minutes | 4 (17.4%) | 3 (9.4%) |
| 25 to 29 Minutes | 0 (0.0%) | 0 (0.0%) |
| 30 to 34 Minutes | 1 (4.3%) | 4 (12.5%) |
| 35 to 39 Minutes | 0 (0.0%) | 0 (0.0%) |
| 40 to 44 Minutes | 1 (4.3%) | 0 (0.0%) |
| 45 to 59 Minutes | 1 (4.3%) | 3 (9.4%) |
| 60 to 89 Minutes | 0 (0.0%) | 0 (0.0%) |
| 90 or more Minutes | 0 (0.0%) | 0 (0.0%) |
Time of Departure to Work by Sex in Vandemere
The most frequent times of departure to work in Vandemere are 8:30 AM to 8:59 AM (6, 26.1%) for males and 6:00 AM to 6:29 AM (8, 25.0%) for females.
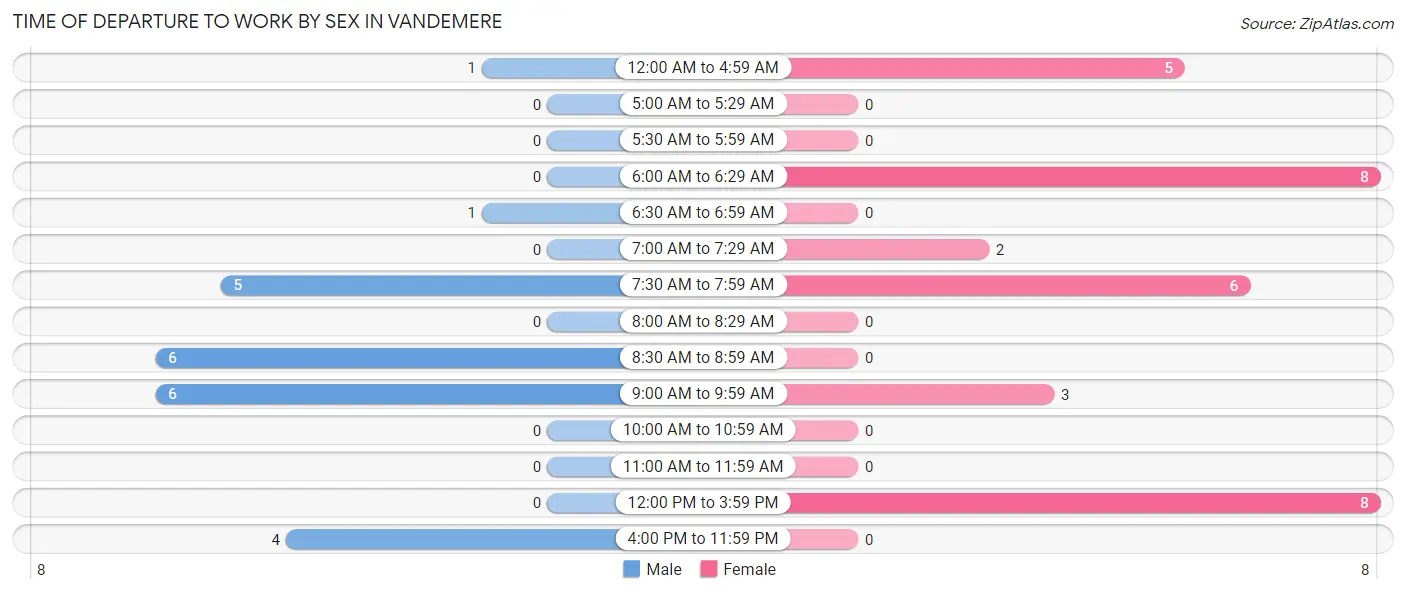
| Time of Departure | Male | Female |
| 12:00 AM to 4:59 AM | 1 (4.3%) | 5 (15.6%) |
| 5:00 AM to 5:29 AM | 0 (0.0%) | 0 (0.0%) |
| 5:30 AM to 5:59 AM | 0 (0.0%) | 0 (0.0%) |
| 6:00 AM to 6:29 AM | 0 (0.0%) | 8 (25.0%) |
| 6:30 AM to 6:59 AM | 1 (4.3%) | 0 (0.0%) |
| 7:00 AM to 7:29 AM | 0 (0.0%) | 2 (6.2%) |
| 7:30 AM to 7:59 AM | 5 (21.7%) | 6 (18.8%) |
| 8:00 AM to 8:29 AM | 0 (0.0%) | 0 (0.0%) |
| 8:30 AM to 8:59 AM | 6 (26.1%) | 0 (0.0%) |
| 9:00 AM to 9:59 AM | 6 (26.1%) | 3 (9.4%) |
| 10:00 AM to 10:59 AM | 0 (0.0%) | 0 (0.0%) |
| 11:00 AM to 11:59 AM | 0 (0.0%) | 0 (0.0%) |
| 12:00 PM to 3:59 PM | 0 (0.0%) | 8 (25.0%) |
| 4:00 PM to 11:59 PM | 4 (17.4%) | 0 (0.0%) |
| Total | 23 (100.0%) | 32 (100.0%) |
Housing Occupancy in Vandemere
Occupancy by Ownership in Vandemere
Of the total 99 dwellings in Vandemere, owner-occupied units account for 92 (92.9%), while renter-occupied units make up 7 (7.1%).
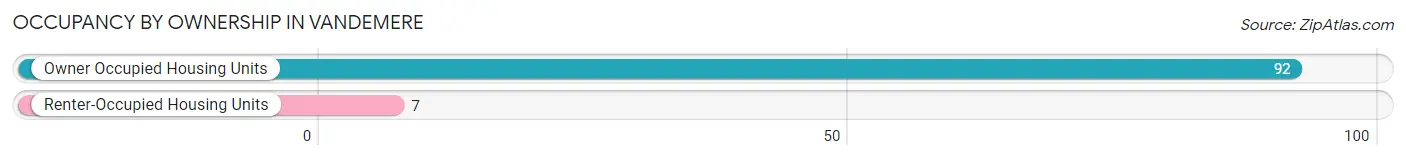
| Occupancy | # Housing Units | % Housing Units |
| Owner Occupied Housing Units | 92 | 92.9% |
| Renter-Occupied Housing Units | 7 | 7.1% |
| Total Occupied Housing Units | 99 | 100.0% |
Occupancy by Household Size in Vandemere
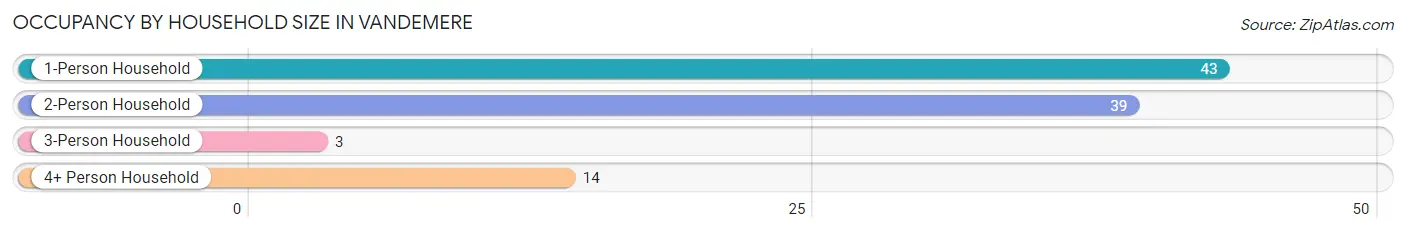
| Household Size | # Housing Units | % Housing Units |
| 1-Person Household | 43 | 43.4% |
| 2-Person Household | 39 | 39.4% |
| 3-Person Household | 3 | 3.0% |
| 4+ Person Household | 14 | 14.1% |
| Total Housing Units | 99 | 100.0% |
Occupancy by Ownership by Household Size in Vandemere
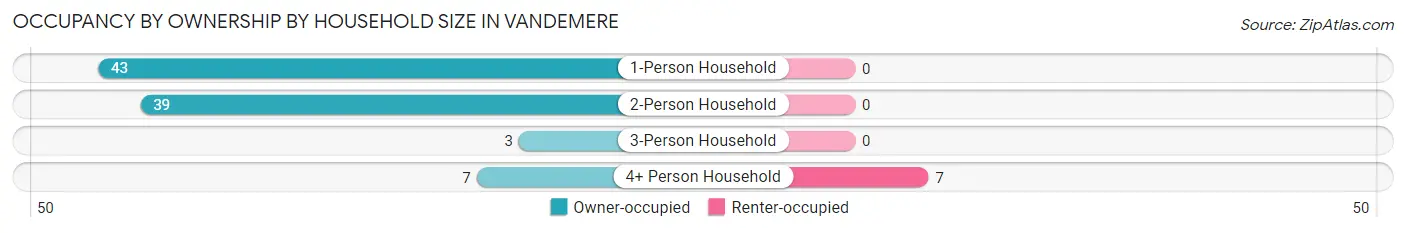
| Household Size | Owner-occupied | Renter-occupied |
| 1-Person Household | 43 (100.0%) | 0 (0.0%) |
| 2-Person Household | 39 (100.0%) | 0 (0.0%) |
| 3-Person Household | 3 (100.0%) | 0 (0.0%) |
| 4+ Person Household | 7 (50.0%) | 7 (50.0%) |
| Total Housing Units | 92 (92.9%) | 7 (7.1%) |
Occupancy by Educational Attainment in Vandemere
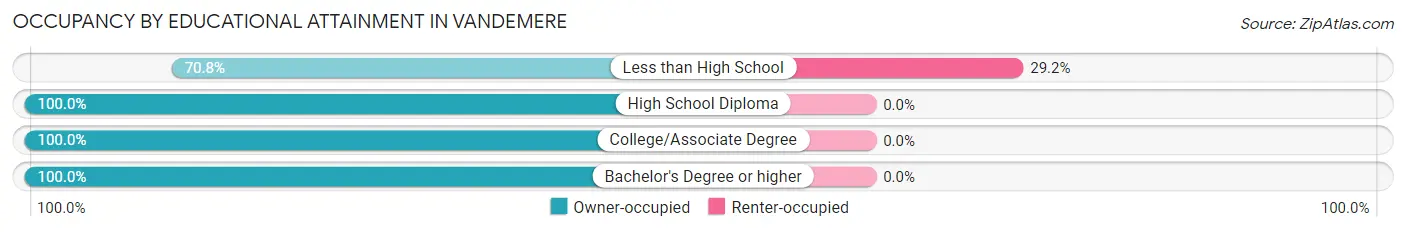
| Household Size | Owner-occupied | Renter-occupied |
| Less than High School | 17 (70.8%) | 7 (29.2%) |
| High School Diploma | 14 (100.0%) | 0 (0.0%) |
| College/Associate Degree | 38 (100.0%) | 0 (0.0%) |
| Bachelor's Degree or higher | 23 (100.0%) | 0 (0.0%) |
Occupancy by Age of Householder in Vandemere
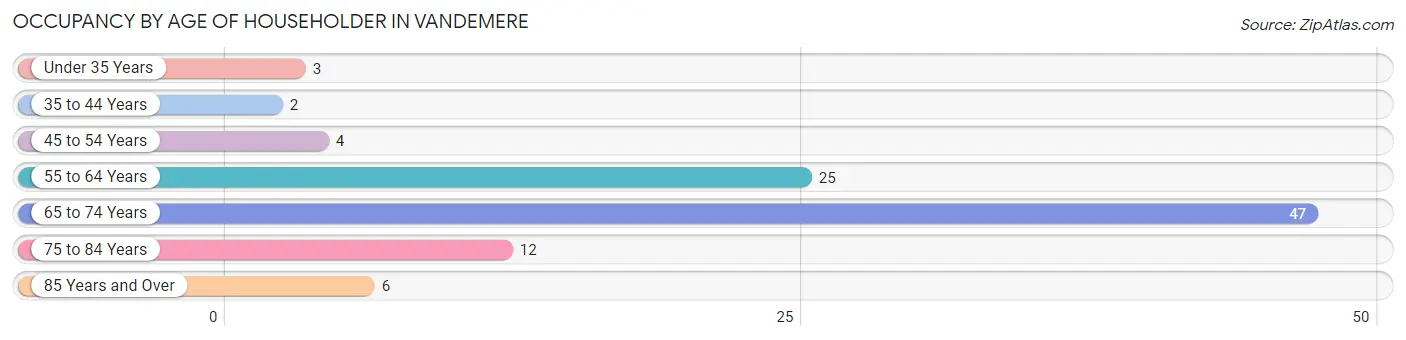
| Age Bracket | # Households | % Households |
| Under 35 Years | 3 | 3.0% |
| 35 to 44 Years | 2 | 2.0% |
| 45 to 54 Years | 4 | 4.0% |
| 55 to 64 Years | 25 | 25.3% |
| 65 to 74 Years | 47 | 47.5% |
| 75 to 84 Years | 12 | 12.1% |
| 85 Years and Over | 6 | 6.1% |
| Total | 99 | 100.0% |
Housing Finances in Vandemere
Median Income by Occupancy in Vandemere
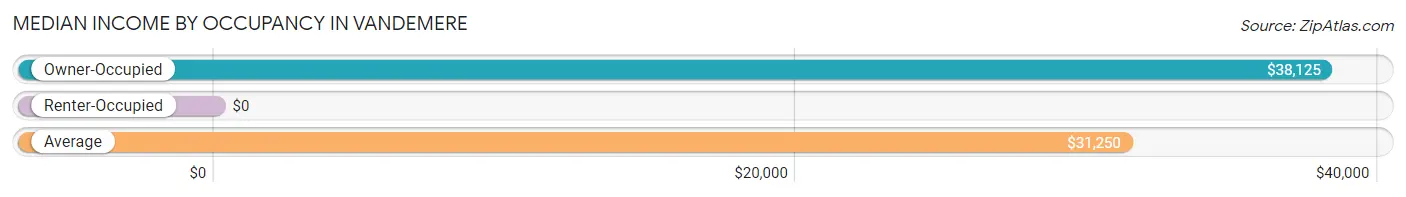
| Occupancy Type | # Households | Median Income |
| Owner-Occupied | 92 (92.9%) | $38,125 |
| Renter-Occupied | 7 (7.1%) | $0 |
| Average | 99 (100.0%) | $31,250 |
Occupancy by Householder Income Bracket in Vandemere
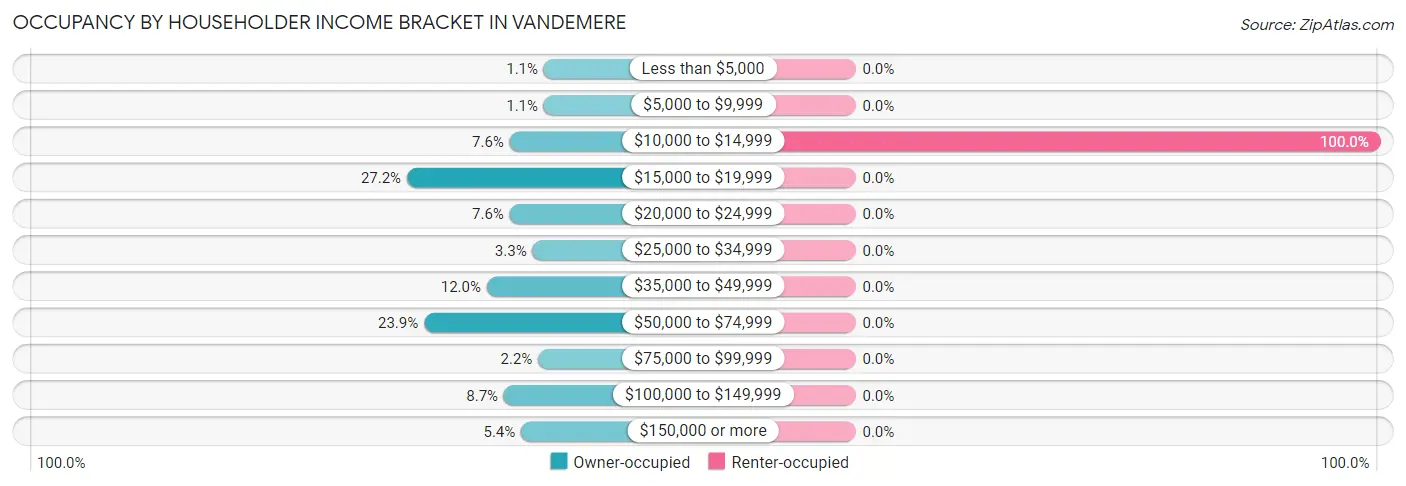
| Income Bracket | Owner-occupied | Renter-occupied |
| Less than $5,000 | 1 (1.1%) | 0 (0.0%) |
| $5,000 to $9,999 | 1 (1.1%) | 0 (0.0%) |
| $10,000 to $14,999 | 7 (7.6%) | 7 (100.0%) |
| $15,000 to $19,999 | 25 (27.2%) | 0 (0.0%) |
| $20,000 to $24,999 | 7 (7.6%) | 0 (0.0%) |
| $25,000 to $34,999 | 3 (3.3%) | 0 (0.0%) |
| $35,000 to $49,999 | 11 (12.0%) | 0 (0.0%) |
| $50,000 to $74,999 | 22 (23.9%) | 0 (0.0%) |
| $75,000 to $99,999 | 2 (2.2%) | 0 (0.0%) |
| $100,000 to $149,999 | 8 (8.7%) | 0 (0.0%) |
| $150,000 or more | 5 (5.4%) | 0 (0.0%) |
| Total | 92 (100.0%) | 7 (100.0%) |
Monthly Housing Cost Tiers in Vandemere
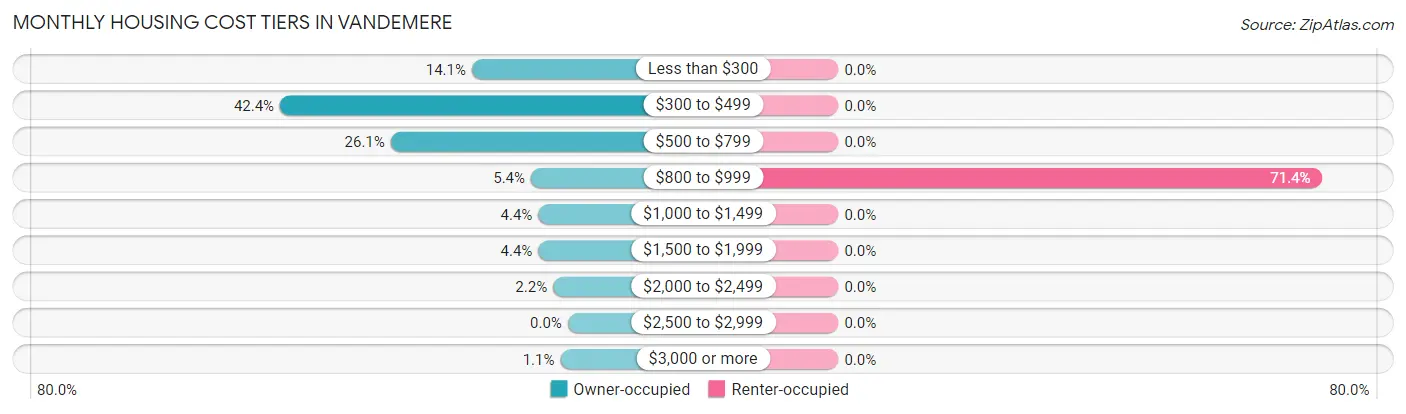
| Monthly Cost | Owner-occupied | Renter-occupied |
| Less than $300 | 13 (14.1%) | 0 (0.0%) |
| $300 to $499 | 39 (42.4%) | 0 (0.0%) |
| $500 to $799 | 24 (26.1%) | 0 (0.0%) |
| $800 to $999 | 5 (5.4%) | 5 (71.4%) |
| $1,000 to $1,499 | 4 (4.3%) | 0 (0.0%) |
| $1,500 to $1,999 | 4 (4.3%) | 0 (0.0%) |
| $2,000 to $2,499 | 2 (2.2%) | 0 (0.0%) |
| $2,500 to $2,999 | 0 (0.0%) | 0 (0.0%) |
| $3,000 or more | 1 (1.1%) | 0 (0.0%) |
| Total | 92 (100.0%) | 7 (100.0%) |
Physical Housing Characteristics in Vandemere
Housing Structures in Vandemere
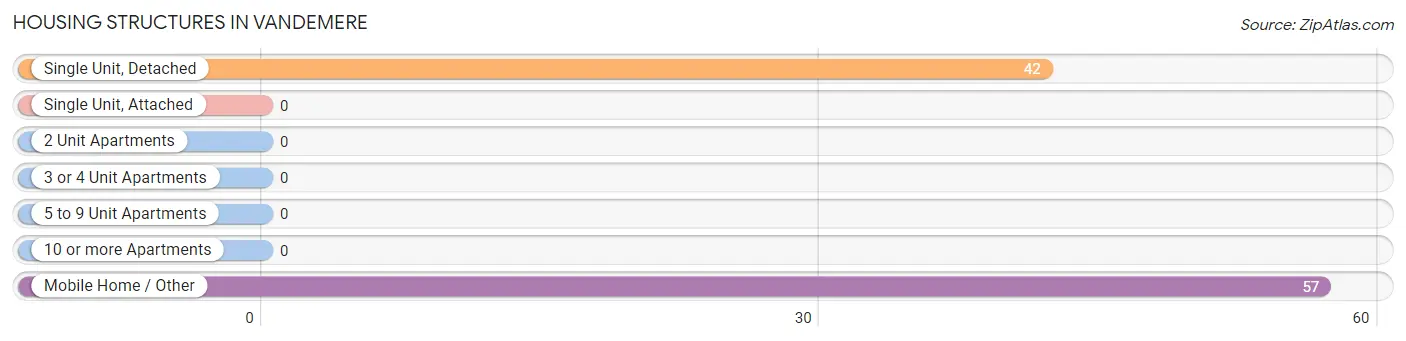
| Structure Type | # Housing Units | % Housing Units |
| Single Unit, Detached | 42 | 42.4% |
| Single Unit, Attached | 0 | 0.0% |
| 2 Unit Apartments | 0 | 0.0% |
| 3 or 4 Unit Apartments | 0 | 0.0% |
| 5 to 9 Unit Apartments | 0 | 0.0% |
| 10 or more Apartments | 0 | 0.0% |
| Mobile Home / Other | 57 | 57.6% |
| Total | 99 | 100.0% |
Housing Structures by Occupancy in Vandemere
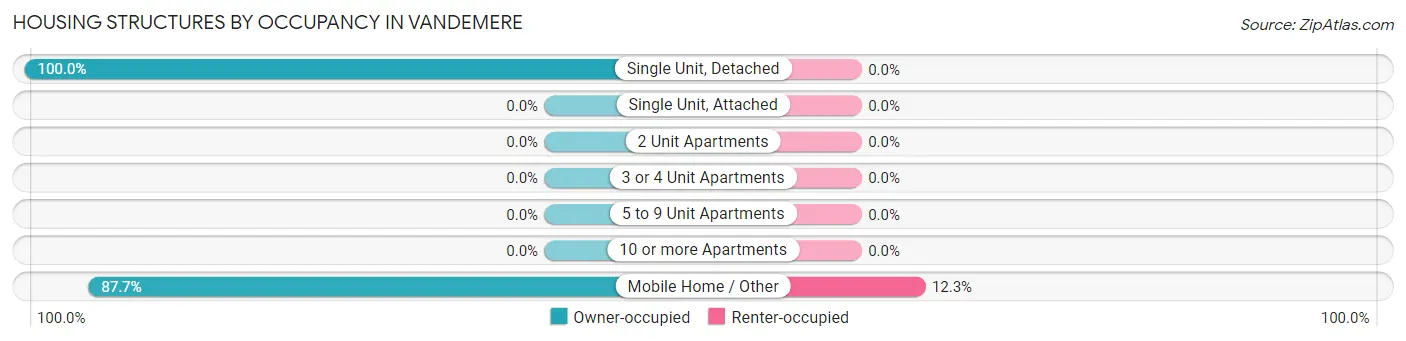
| Structure Type | Owner-occupied | Renter-occupied |
| Single Unit, Detached | 42 (100.0%) | 0 (0.0%) |
| Single Unit, Attached | 0 (0.0%) | 0 (0.0%) |
| 2 Unit Apartments | 0 (0.0%) | 0 (0.0%) |
| 3 or 4 Unit Apartments | 0 (0.0%) | 0 (0.0%) |
| 5 to 9 Unit Apartments | 0 (0.0%) | 0 (0.0%) |
| 10 or more Apartments | 0 (0.0%) | 0 (0.0%) |
| Mobile Home / Other | 50 (87.7%) | 7 (12.3%) |
| Total | 92 (92.9%) | 7 (7.1%) |
Housing Structures by Number of Rooms in Vandemere
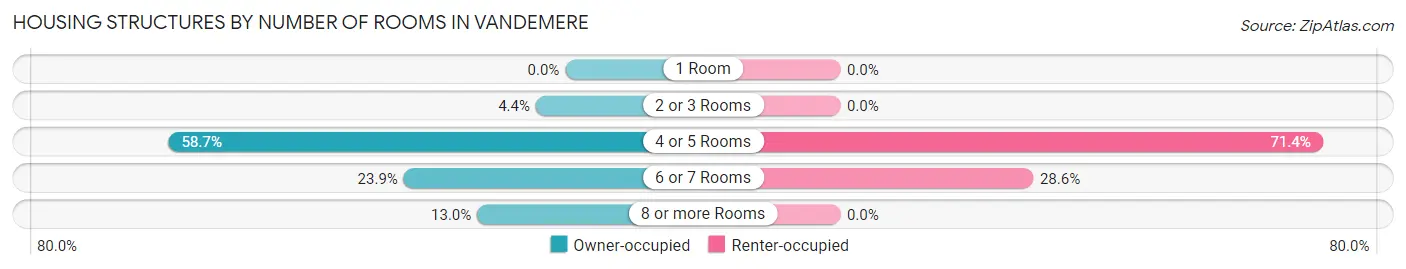
| Number of Rooms | Owner-occupied | Renter-occupied |
| 1 Room | 0 (0.0%) | 0 (0.0%) |
| 2 or 3 Rooms | 4 (4.3%) | 0 (0.0%) |
| 4 or 5 Rooms | 54 (58.7%) | 5 (71.4%) |
| 6 or 7 Rooms | 22 (23.9%) | 2 (28.6%) |
| 8 or more Rooms | 12 (13.0%) | 0 (0.0%) |
| Total | 92 (100.0%) | 7 (100.0%) |
Housing Structure by Heating Type in Vandemere
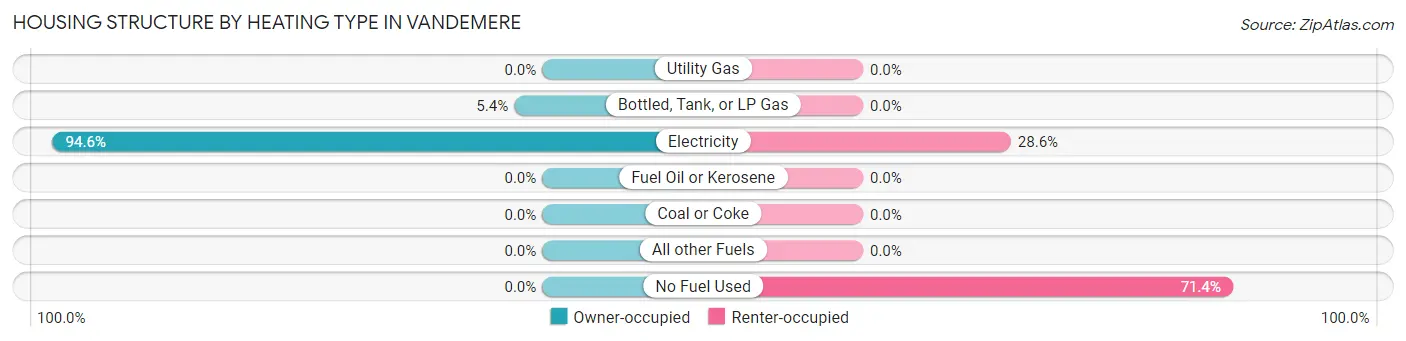
| Heating Type | Owner-occupied | Renter-occupied |
| Utility Gas | 0 (0.0%) | 0 (0.0%) |
| Bottled, Tank, or LP Gas | 5 (5.4%) | 0 (0.0%) |
| Electricity | 87 (94.6%) | 2 (28.6%) |
| Fuel Oil or Kerosene | 0 (0.0%) | 0 (0.0%) |
| Coal or Coke | 0 (0.0%) | 0 (0.0%) |
| All other Fuels | 0 (0.0%) | 0 (0.0%) |
| No Fuel Used | 0 (0.0%) | 5 (71.4%) |
| Total | 92 (100.0%) | 7 (100.0%) |
Household Vehicle Usage in Vandemere
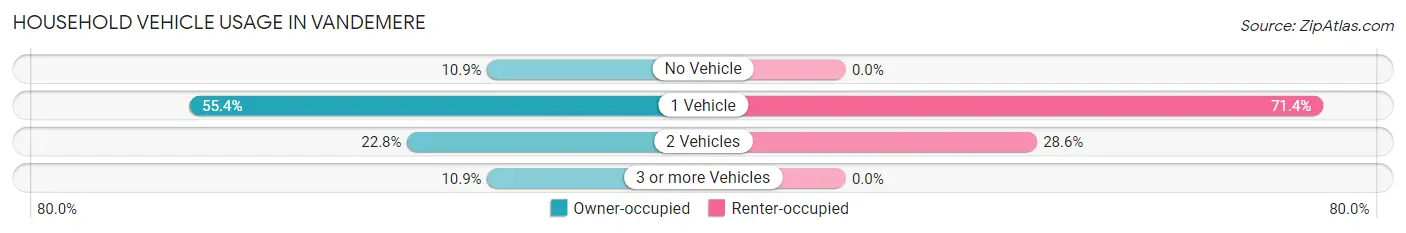
| Vehicles per Household | Owner-occupied | Renter-occupied |
| No Vehicle | 10 (10.9%) | 0 (0.0%) |
| 1 Vehicle | 51 (55.4%) | 5 (71.4%) |
| 2 Vehicles | 21 (22.8%) | 2 (28.6%) |
| 3 or more Vehicles | 10 (10.9%) | 0 (0.0%) |
| Total | 92 (100.0%) | 7 (100.0%) |
Real Estate & Mortgages in Vandemere
Real Estate and Mortgage Overview in Vandemere
| Characteristic | Without Mortgage | With Mortgage |
| Housing Units | 62 | 30 |
| Median Property Value | - | - |
| Median Household Income | - | - |
| Monthly Housing Costs | $377 | $1 |
| Real Estate Taxes | $533 | $0 |
Property Value by Mortgage Status in Vandemere
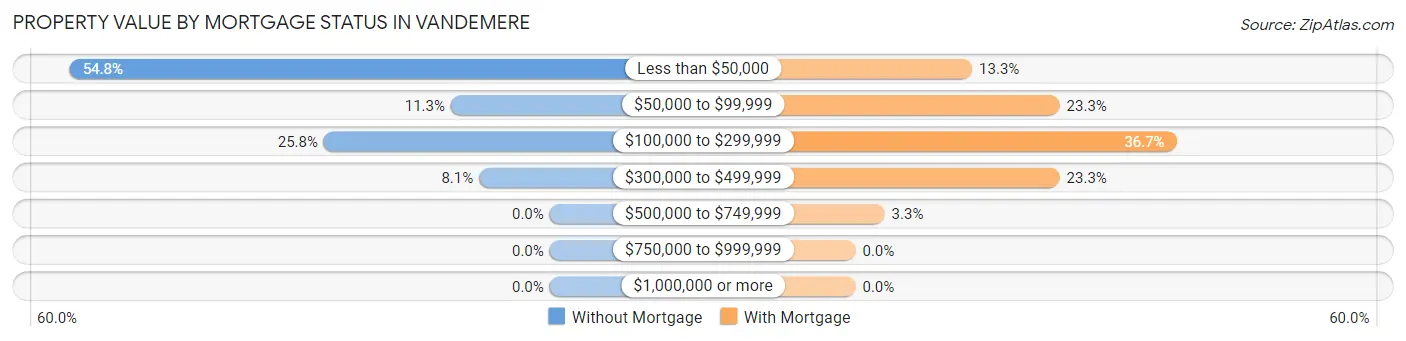
| Property Value | Without Mortgage | With Mortgage |
| Less than $50,000 | 34 (54.8%) | 4 (13.3%) |
| $50,000 to $99,999 | 7 (11.3%) | 7 (23.3%) |
| $100,000 to $299,999 | 16 (25.8%) | 11 (36.7%) |
| $300,000 to $499,999 | 5 (8.1%) | 7 (23.3%) |
| $500,000 to $749,999 | 0 (0.0%) | 1 (3.3%) |
| $750,000 to $999,999 | 0 (0.0%) | 0 (0.0%) |
| $1,000,000 or more | 0 (0.0%) | 0 (0.0%) |
| Total | 62 (100.0%) | 30 (100.0%) |
Household Income by Mortgage Status in Vandemere
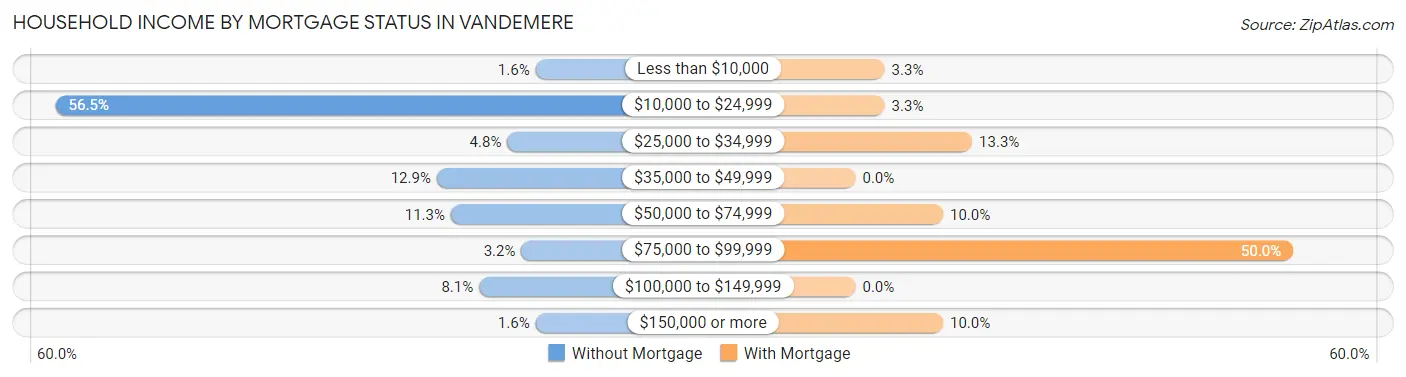
| Household Income | Without Mortgage | With Mortgage |
| Less than $10,000 | 1 (1.6%) | 1 (3.3%) |
| $10,000 to $24,999 | 35 (56.5%) | 1 (3.3%) |
| $25,000 to $34,999 | 3 (4.8%) | 4 (13.3%) |
| $35,000 to $49,999 | 8 (12.9%) | 0 (0.0%) |
| $50,000 to $74,999 | 7 (11.3%) | 3 (10.0%) |
| $75,000 to $99,999 | 2 (3.2%) | 15 (50.0%) |
| $100,000 to $149,999 | 5 (8.1%) | 0 (0.0%) |
| $150,000 or more | 1 (1.6%) | 3 (10.0%) |
| Total | 62 (100.0%) | 30 (100.0%) |
Property Value to Household Income Ratio in Vandemere
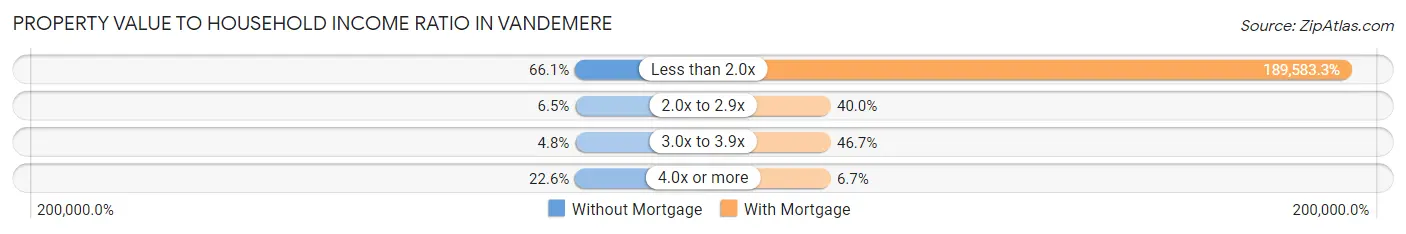
| Value-to-Income Ratio | Without Mortgage | With Mortgage |
| Less than 2.0x | 41 (66.1%) | 56,875 (189,583.3%) |
| 2.0x to 2.9x | 4 (6.5%) | 12 (40.0%) |
| 3.0x to 3.9x | 3 (4.8%) | 14 (46.7%) |
| 4.0x or more | 14 (22.6%) | 2 (6.7%) |
| Total | 62 (100.0%) | 30 (100.0%) |
Real Estate Taxes by Mortgage Status in Vandemere
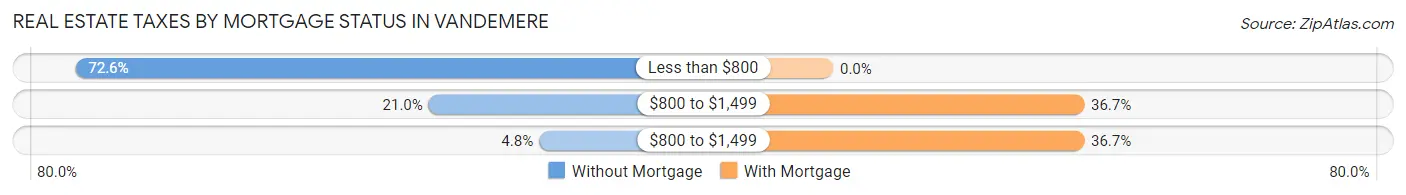
| Property Taxes | Without Mortgage | With Mortgage |
| Less than $800 | 45 (72.6%) | 0 (0.0%) |
| $800 to $1,499 | 13 (21.0%) | 11 (36.7%) |
| $800 to $1,499 | 3 (4.8%) | 11 (36.7%) |
| Total | 62 (100.0%) | 30 (100.0%) |
Health & Disability in Vandemere
Health Insurance Coverage by Age in Vandemere
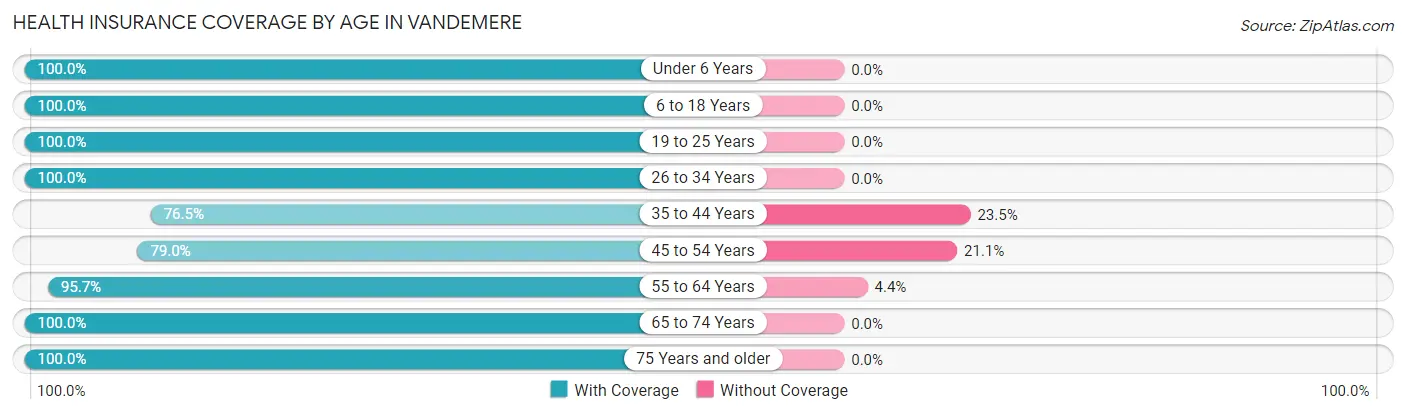
| Age Bracket | With Coverage | Without Coverage |
| Under 6 Years | 15 (100.0%) | 0 (0.0%) |
| 6 to 18 Years | 27 (100.0%) | 0 (0.0%) |
| 19 to 25 Years | 4 (100.0%) | 0 (0.0%) |
| 26 to 34 Years | 9 (100.0%) | 0 (0.0%) |
| 35 to 44 Years | 13 (76.5%) | 4 (23.5%) |
| 45 to 54 Years | 15 (78.9%) | 4 (21.0%) |
| 55 to 64 Years | 44 (95.7%) | 2 (4.3%) |
| 65 to 74 Years | 52 (100.0%) | 0 (0.0%) |
| 75 Years and older | 25 (100.0%) | 0 (0.0%) |
| Total | 204 (95.3%) | 10 (4.7%) |
Health Insurance Coverage by Citizenship Status in Vandemere
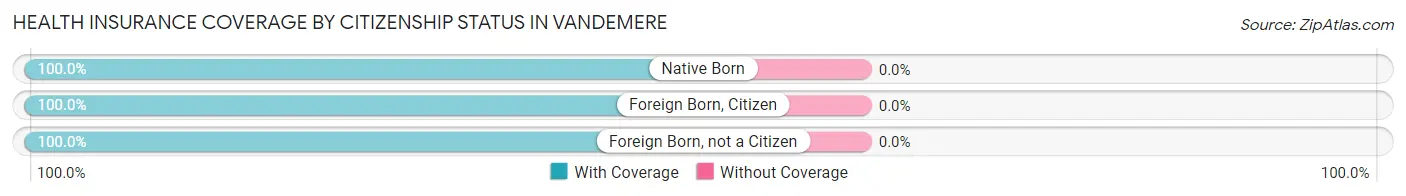
| Citizenship Status | With Coverage | Without Coverage |
| Native Born | 15 (100.0%) | 0 (0.0%) |
| Foreign Born, Citizen | 27 (100.0%) | 0 (0.0%) |
| Foreign Born, not a Citizen | 4 (100.0%) | 0 (0.0%) |
Health Insurance Coverage by Household Income in Vandemere
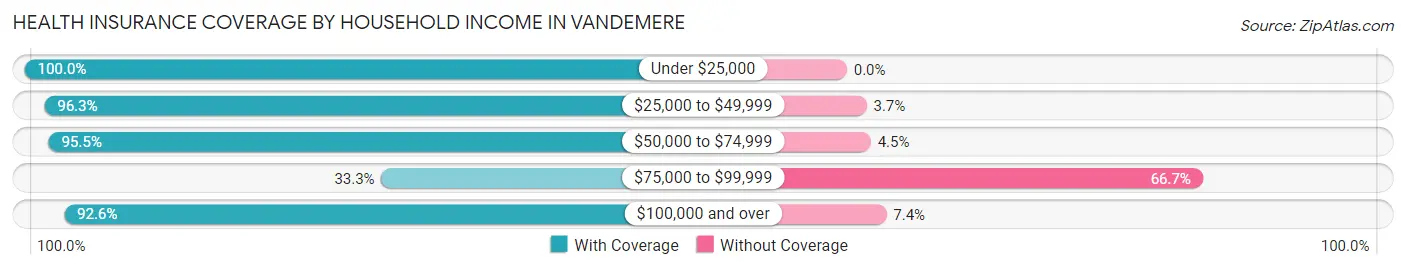
| Household Income | With Coverage | Without Coverage |
| Under $25,000 | 87 (100.0%) | 0 (0.0%) |
| $25,000 to $49,999 | 26 (96.3%) | 1 (3.7%) |
| $50,000 to $74,999 | 64 (95.5%) | 3 (4.5%) |
| $75,000 to $99,999 | 2 (33.3%) | 4 (66.7%) |
| $100,000 and over | 25 (92.6%) | 2 (7.4%) |
Public vs Private Health Insurance Coverage by Age in Vandemere
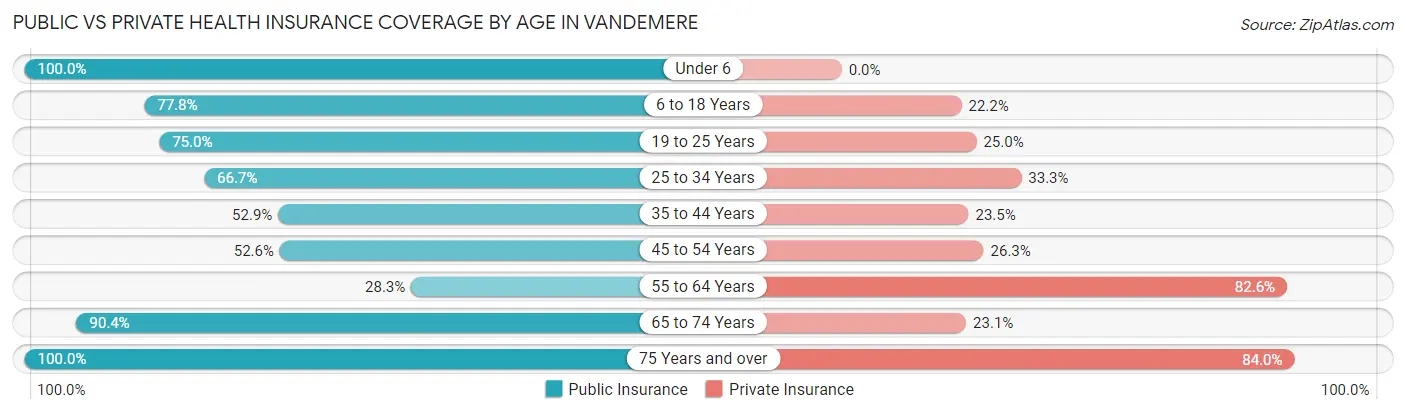
| Age Bracket | Public Insurance | Private Insurance |
| Under 6 | 15 (100.0%) | 0 (0.0%) |
| 6 to 18 Years | 21 (77.8%) | 6 (22.2%) |
| 19 to 25 Years | 3 (75.0%) | 1 (25.0%) |
| 25 to 34 Years | 6 (66.7%) | 3 (33.3%) |
| 35 to 44 Years | 9 (52.9%) | 4 (23.5%) |
| 45 to 54 Years | 10 (52.6%) | 5 (26.3%) |
| 55 to 64 Years | 13 (28.3%) | 38 (82.6%) |
| 65 to 74 Years | 47 (90.4%) | 12 (23.1%) |
| 75 Years and over | 25 (100.0%) | 21 (84.0%) |
| Total | 149 (69.6%) | 90 (42.1%) |
Disability Status by Sex by Age in Vandemere
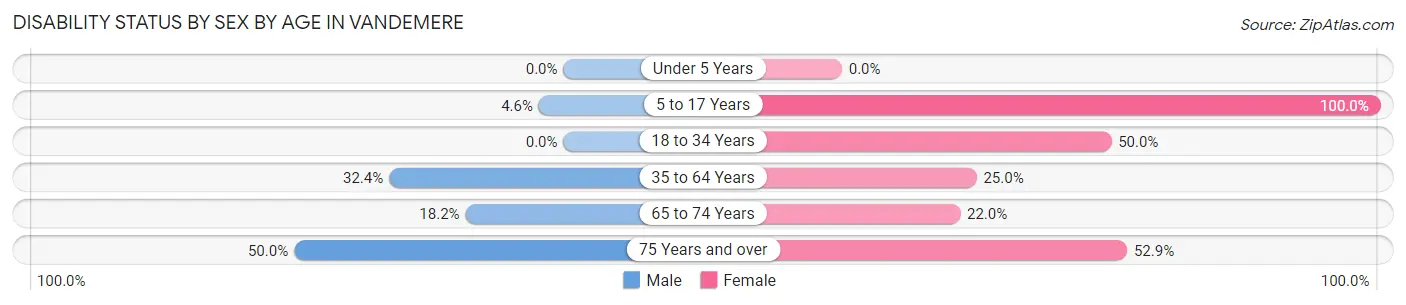
| Age Bracket | Male | Female |
| Under 5 Years | 0 (0.0%) | 0 (0.0%) |
| 5 to 17 Years | 1 (4.5%) | 5 (100.0%) |
| 18 to 34 Years | 0 (0.0%) | 6 (50.0%) |
| 35 to 64 Years | 11 (32.4%) | 12 (25.0%) |
| 65 to 74 Years | 2 (18.2%) | 9 (22.0%) |
| 75 Years and over | 4 (50.0%) | 9 (52.9%) |
Disability Class by Sex by Age in Vandemere
Disability Class: Hearing Difficulty
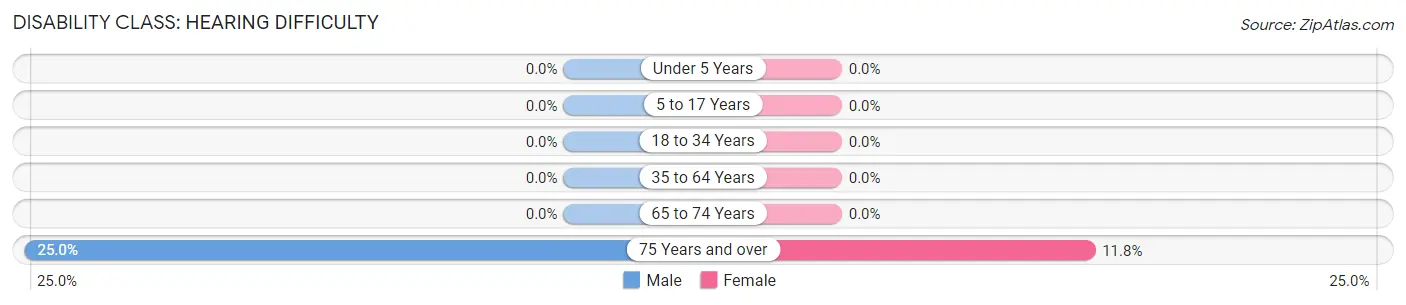
| Age Bracket | Male | Female |
| Under 5 Years | 0 (0.0%) | 0 (0.0%) |
| 5 to 17 Years | 0 (0.0%) | 0 (0.0%) |
| 18 to 34 Years | 0 (0.0%) | 0 (0.0%) |
| 35 to 64 Years | 0 (0.0%) | 0 (0.0%) |
| 65 to 74 Years | 0 (0.0%) | 0 (0.0%) |
| 75 Years and over | 2 (25.0%) | 2 (11.8%) |
Disability Class: Vision Difficulty
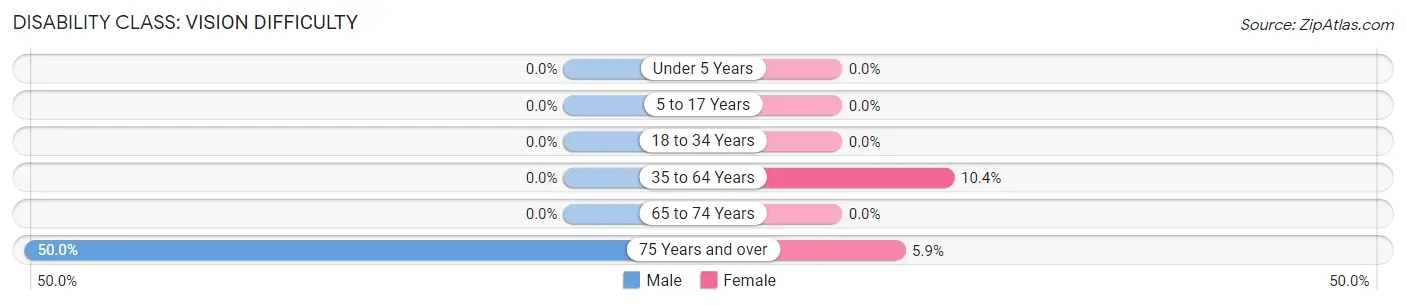
| Age Bracket | Male | Female |
| Under 5 Years | 0 (0.0%) | 0 (0.0%) |
| 5 to 17 Years | 0 (0.0%) | 0 (0.0%) |
| 18 to 34 Years | 0 (0.0%) | 0 (0.0%) |
| 35 to 64 Years | 0 (0.0%) | 5 (10.4%) |
| 65 to 74 Years | 0 (0.0%) | 0 (0.0%) |
| 75 Years and over | 4 (50.0%) | 1 (5.9%) |
Disability Class: Cognitive Difficulty
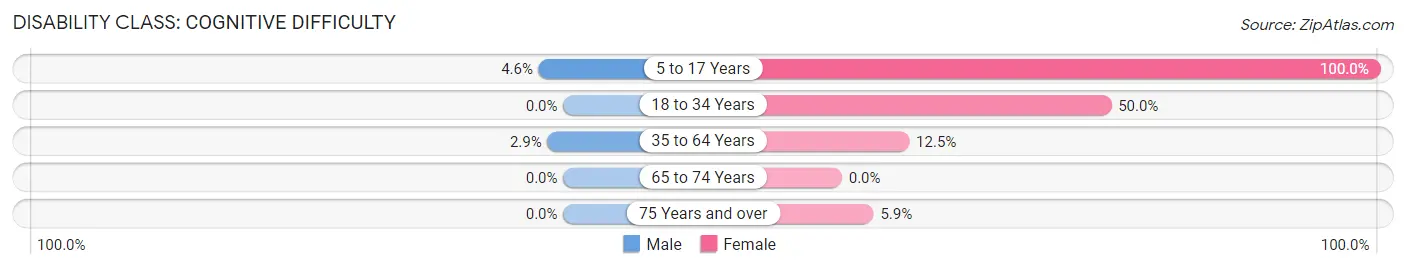
| Age Bracket | Male | Female |
| 5 to 17 Years | 1 (4.5%) | 5 (100.0%) |
| 18 to 34 Years | 0 (0.0%) | 6 (50.0%) |
| 35 to 64 Years | 1 (2.9%) | 6 (12.5%) |
| 65 to 74 Years | 0 (0.0%) | 0 (0.0%) |
| 75 Years and over | 0 (0.0%) | 1 (5.9%) |
Disability Class: Ambulatory Difficulty
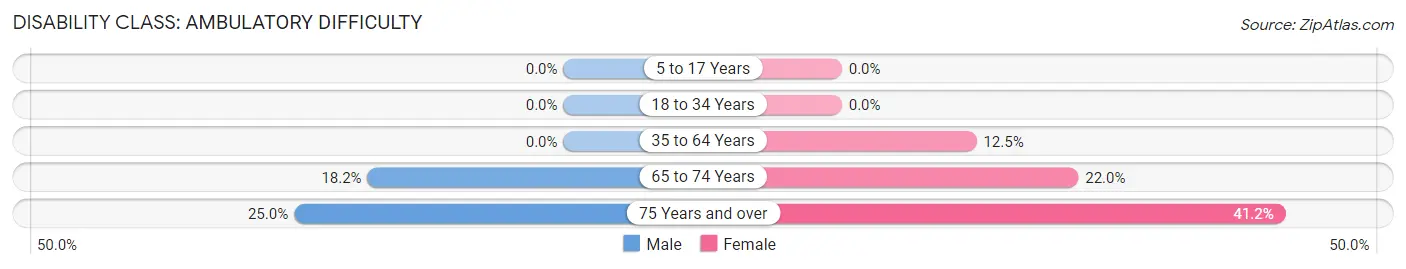
| Age Bracket | Male | Female |
| 5 to 17 Years | 0 (0.0%) | 0 (0.0%) |
| 18 to 34 Years | 0 (0.0%) | 0 (0.0%) |
| 35 to 64 Years | 0 (0.0%) | 6 (12.5%) |
| 65 to 74 Years | 2 (18.2%) | 9 (22.0%) |
| 75 Years and over | 2 (25.0%) | 7 (41.2%) |
Disability Class: Self-Care Difficulty
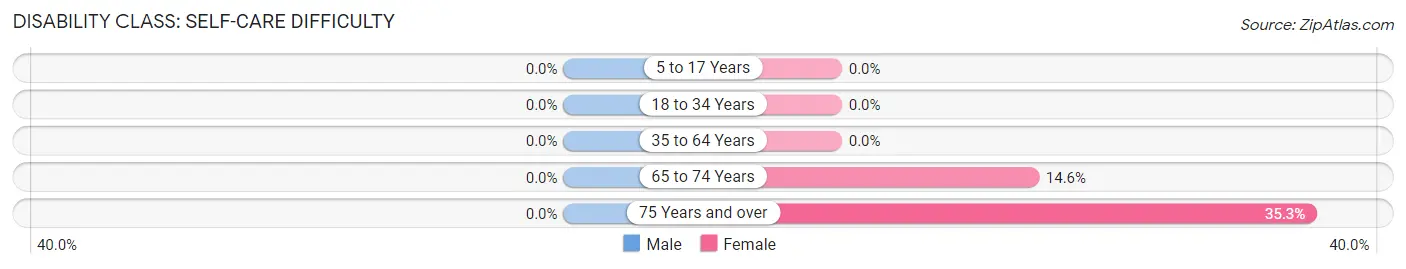
| Age Bracket | Male | Female |
| 5 to 17 Years | 0 (0.0%) | 0 (0.0%) |
| 18 to 34 Years | 0 (0.0%) | 0 (0.0%) |
| 35 to 64 Years | 0 (0.0%) | 0 (0.0%) |
| 65 to 74 Years | 0 (0.0%) | 6 (14.6%) |
| 75 Years and over | 0 (0.0%) | 6 (35.3%) |
Technology Access in Vandemere
Computing Device Access in Vandemere
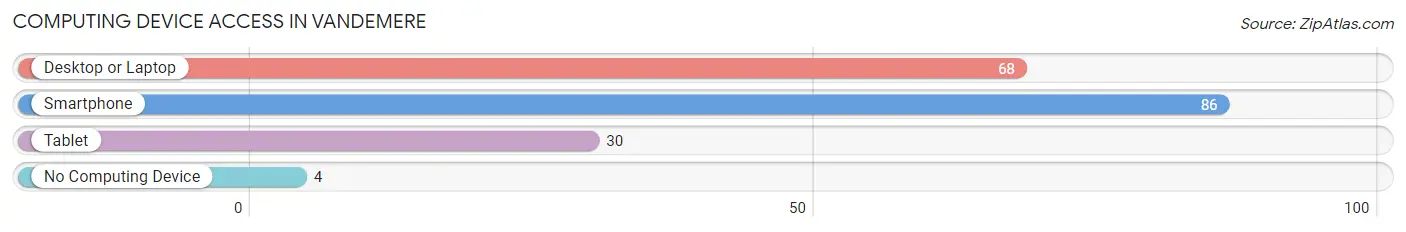
| Device Type | # Households | % Households |
| Desktop or Laptop | 68 | 68.7% |
| Smartphone | 86 | 86.9% |
| Tablet | 30 | 30.3% |
| No Computing Device | 4 | 4.0% |
| Total | 99 | 100.0% |
Internet Access in Vandemere
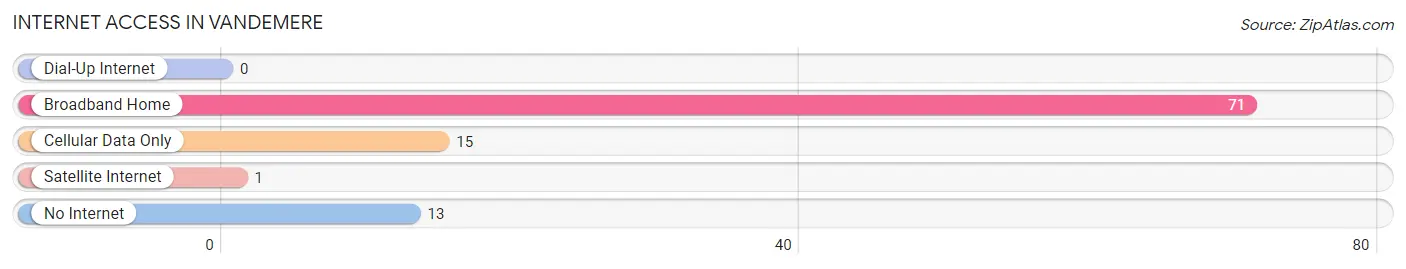
| Internet Type | # Households | % Households |
| Dial-Up Internet | 0 | 0.0% |
| Broadband Home | 71 | 71.7% |
| Cellular Data Only | 15 | 15.1% |
| Satellite Internet | 1 | 1.0% |
| No Internet | 13 | 13.1% |
| Total | 99 | 100.0% |
Vandemere Summary
Vandemere is a small town located in Pamlico County, North Carolina. It is situated on the banks of the Neuse River, approximately 30 miles east of New Bern. The town was founded in 1887 and has a population of approximately 500 people.
Geography
Vandemere is located in the coastal plain region of North Carolina. The town is situated on the banks of the Neuse River, which is the longest river in the state. The town is surrounded by a variety of natural features, including wetlands, forests, and agricultural land. The town is located approximately 30 miles east of New Bern, the county seat of Pamlico County.
The town is located in a humid subtropical climate zone, with hot, humid summers and mild winters. The average annual temperature is around 70 degrees Fahrenheit, with an average annual precipitation of around 50 inches.
History
Vandemere was founded in 1887 by a group of settlers from the nearby town of Oriental. The town was named after the Vandemere family, who were among the first settlers. The town was originally a small fishing village, but it soon grew to become a thriving agricultural community.
The town was incorporated in 1895 and the first mayor was elected in 1896. The town was a popular destination for tourists, and it was known for its seafood restaurants and fishing charters.
In the early 20th century, the town experienced a period of growth and prosperity. The town was home to several businesses, including a sawmill, a cannery, and a shipbuilding company. The town also had a thriving oyster industry, which provided employment for many of the town’s residents.
In the late 20th century, the town experienced a period of decline. The oyster industry declined due to overfishing and pollution, and the shipbuilding industry moved away. The town’s population decreased, and many of the businesses closed.
Economy
Today, Vandemere’s economy is largely based on tourism and agriculture. The town is home to several seafood restaurants, which attract tourists from all over the region. The town is also home to several farms, which produce a variety of crops, including corn, soybeans, and cotton.
The town is also home to several small businesses, including a hardware store, a grocery store, and a gas station. The town is also home to a marina, which provides boat rentals and fishing charters.
Demographics
As of the 2010 census, the population of Vandemere was 498 people. The town is predominantly white, with a small African American population. The median household income is $37,500, and the median home value is $125,000.
Conclusion
Vandemere is a small town located in Pamlico County, North Carolina. The town was founded in 1887 and has a population of approximately 500 people. The town’s economy is largely based on tourism and agriculture, and the town is home to several small businesses. The town is predominantly white, with a small African American population. Vandemere is a charming town with a rich history and a bright future.
Common Questions
What is Per Capita Income in Vandemere?
Per Capita income in Vandemere is $23,605.
What is the Median Family Income in Vandemere?
Median Family Income in Vandemere is $51,875.
What is the Median Household income in Vandemere?
Median Household Income in Vandemere is $31,250.
What is Income or Wage Gap in Vandemere?
Income or Wage Gap in Vandemere is 54.9%.
Women in Vandemere earn 45.1 cents for every dollar earned by a man.
What is Family Income Deficit in Vandemere?
Family Income Deficit in Vandemere is $13,250.
Families that are below poverty line in Vandemere earn $13,250 less on average than the poverty threshold level.
What is Inequality or Gini Index in Vandemere?
Inequality or Gini Index in Vandemere is 0.48.
What is the Total Population of Vandemere?
Total Population of Vandemere is 214.
What is the Total Male Population of Vandemere?
Total Male Population of Vandemere is 83.
What is the Total Female Population of Vandemere?
Total Female Population of Vandemere is 131.
What is the Ratio of Males per 100 Females in Vandemere?
There are 63.36 Males per 100 Females in Vandemere.
What is the Ratio of Females per 100 Males in Vandemere?
There are 157.83 Females per 100 Males in Vandemere.
What is the Median Population Age in Vandemere?
Median Population Age in Vandemere is 57.5 Years.
What is the Average Family Size in Vandemere
Average Family Size in Vandemere is 3.0 People.
What is the Average Household Size in Vandemere
Average Household Size in Vandemere is 2.2 People.
How Large is the Labor Force in Vandemere?
There are 65 People in the Labor Forcein in Vandemere.
What is the Percentage of People in the Labor Force in Vandemere?
36.3% of People are in the Labor Force in Vandemere.
What is the Unemployment Rate in Vandemere?
Unemployment Rate in Vandemere is 7.7%.