Glenville, NC Map & Demographics
Glenville Map
Glenville Overview
$36,657
PER CAPITA INCOME
$92,667
AVG FAMILY INCOME
$92,667
AVG HOUSEHOLD INCOME
29.8%
WAGE / INCOME GAP [ % ]
70.2¢/ $1
WAGE / INCOME GAP [ $ ]
0.10
INEQUALITY / GINI INDEX
136
TOTAL POPULATION
49
MALE POPULATION
87
FEMALE POPULATION
56.32
MALES / 100 FEMALES
177.55
FEMALES / 100 MALES
59.2
MEDIAN AGE
3.0
AVG FAMILY SIZE
3.0
AVG HOUSEHOLD SIZE
73
LABOR FORCE [ PEOPLE ]
53.7%
PERCENT IN LABOR FORCE
Glenville Zip Codes
Glenville Area Codes
Income in Glenville
Income Overview in Glenville
Per Capita Income in Glenville is $36,657, while median incomes of families and households are $92,667 and $92,667 respectively.
| Characteristic | Number | Measure |
| Per Capita Income | 136 | $36,657 |
| Median Family Income | 46 | $92,667 |
| Mean Family Income | 46 | $85,735 |
| Median Household Income | 46 | $92,667 |
| Mean Household Income | 46 | $85,735 |
| Income Deficit | 46 | $0 |
| Wage / Income Gap (%) | 136 | 29.79% |
| Wage / Income Gap ($) | 136 | 70.21¢ per $1 |
| Gini / Inequality Index | 136 | 0.10 |
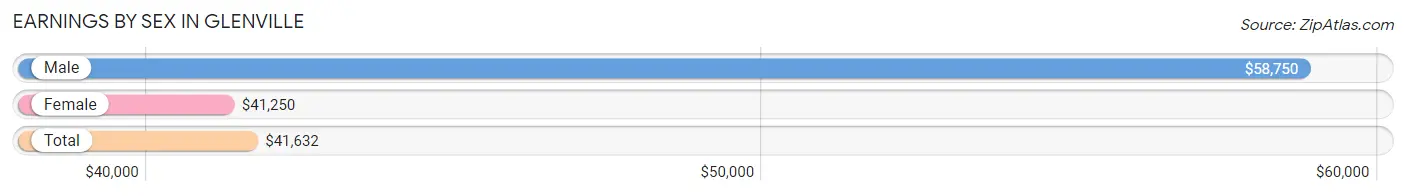
Earnings by Sex in Glenville
Average Earnings in Glenville are $41,632, $58,750 for men and $41,250 for women, a difference of 29.8%.
| Sex | Number | Average Earnings |
| Male | 30 (39.0%) | $58,750 |
| Female | 47 (61.0%) | $41,250 |
| Total | 77 (100.0%) | $41,632 |
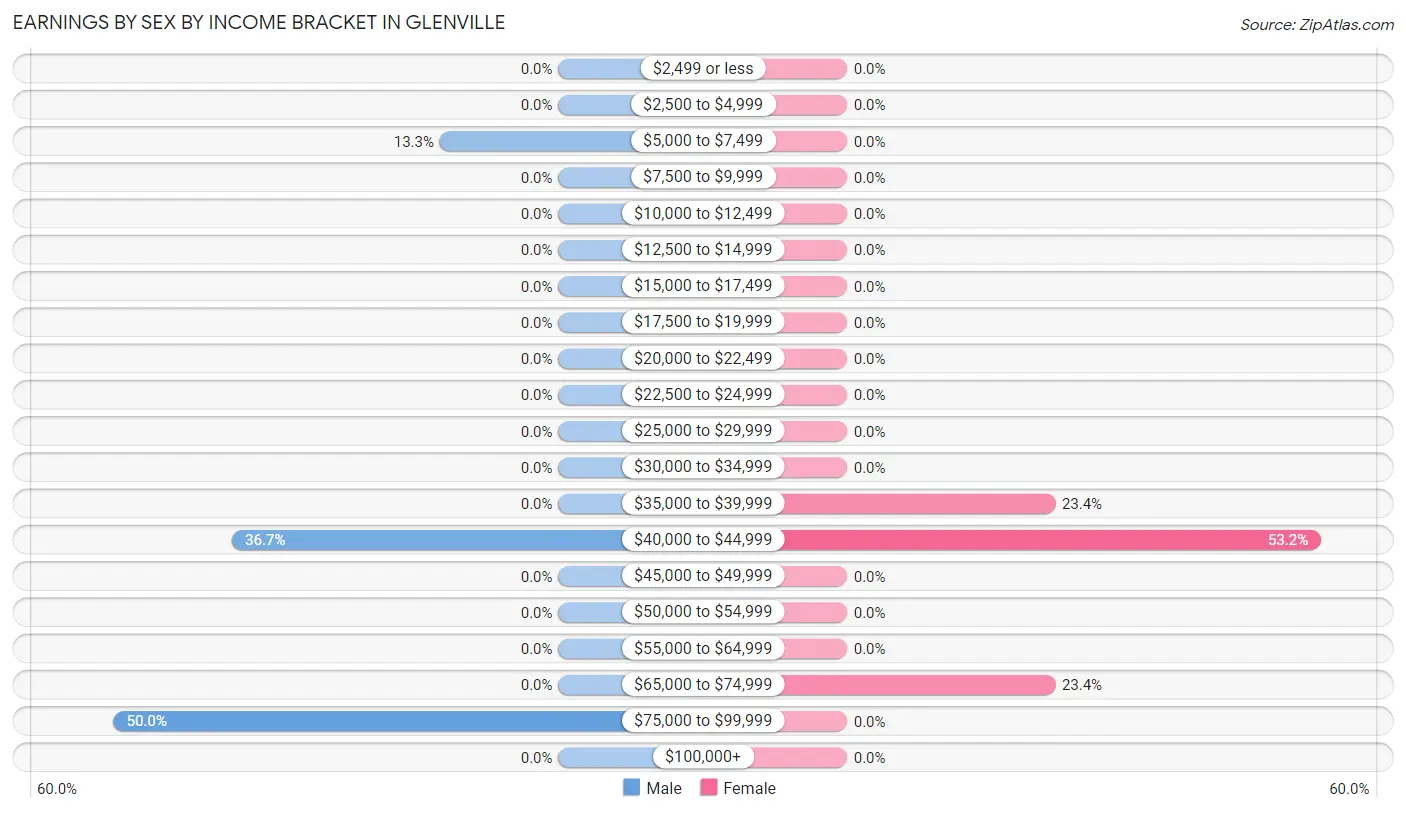
Earnings by Sex by Income Bracket in Glenville
The most common earnings brackets in Glenville are $75,000 to $99,999 for men (15 | 50.0%) and $40,000 to $44,999 for women (25 | 53.2%).
| Income | Male | Female |
| $2,499 or less | 0 (0.0%) | 0 (0.0%) |
| $2,500 to $4,999 | 0 (0.0%) | 0 (0.0%) |
| $5,000 to $7,499 | 4 (13.3%) | 0 (0.0%) |
| $7,500 to $9,999 | 0 (0.0%) | 0 (0.0%) |
| $10,000 to $12,499 | 0 (0.0%) | 0 (0.0%) |
| $12,500 to $14,999 | 0 (0.0%) | 0 (0.0%) |
| $15,000 to $17,499 | 0 (0.0%) | 0 (0.0%) |
| $17,500 to $19,999 | 0 (0.0%) | 0 (0.0%) |
| $20,000 to $22,499 | 0 (0.0%) | 0 (0.0%) |
| $22,500 to $24,999 | 0 (0.0%) | 0 (0.0%) |
| $25,000 to $29,999 | 0 (0.0%) | 0 (0.0%) |
| $30,000 to $34,999 | 0 (0.0%) | 0 (0.0%) |
| $35,000 to $39,999 | 0 (0.0%) | 11 (23.4%) |
| $40,000 to $44,999 | 11 (36.7%) | 25 (53.2%) |
| $45,000 to $49,999 | 0 (0.0%) | 0 (0.0%) |
| $50,000 to $54,999 | 0 (0.0%) | 0 (0.0%) |
| $55,000 to $64,999 | 0 (0.0%) | 0 (0.0%) |
| $65,000 to $74,999 | 0 (0.0%) | 11 (23.4%) |
| $75,000 to $99,999 | 15 (50.0%) | 0 (0.0%) |
| $100,000+ | 0 (0.0%) | 0 (0.0%) |
| Total | 30 (100.0%) | 47 (100.0%) |
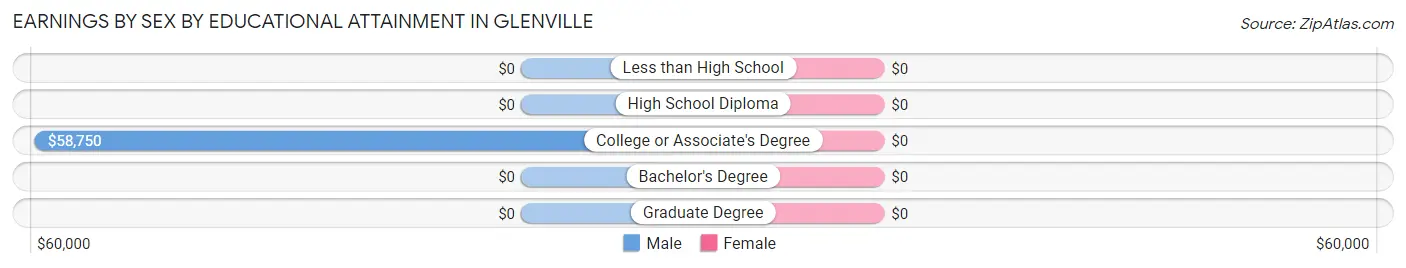
Earnings by Sex by Educational Attainment in Glenville
| Educational Attainment | Male Income | Female Income |
| Less than High School | - | - |
| High School Diploma | - | - |
| College or Associate's Degree | $58,750 | $0 |
| Bachelor's Degree | - | - |
| Graduate Degree | - | - |
| Total | $58,750 | $41,250 |
Family Income in Glenville
Family Income Brackets in Glenville
According to the Glenville family income data, there are 30 families falling into the $75,000 to $99,999 income range, which is the most common income bracket and makes up 65.2% of all families.
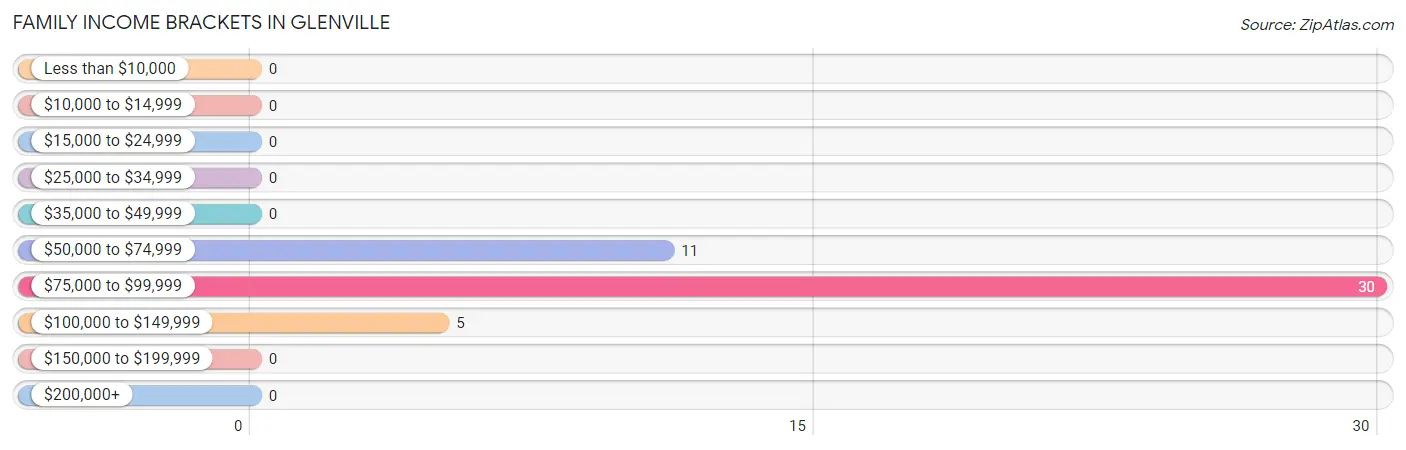
| Income Bracket | # Families | % Families |
| Less than $10,000 | 0 | 0.0% |
| $10,000 to $14,999 | 0 | 0.0% |
| $15,000 to $24,999 | 0 | 0.0% |
| $25,000 to $34,999 | 0 | 0.0% |
| $35,000 to $49,999 | 0 | 0.0% |
| $50,000 to $74,999 | 11 | 23.9% |
| $75,000 to $99,999 | 30 | 65.2% |
| $100,000 to $149,999 | 5 | 10.9% |
| $150,000 to $199,999 | 0 | 0.0% |
| $200,000+ | 0 | 0.0% |
Family Income by Famaliy Size in Glenville
2-person families (20 | 43.5%) account for the highest median family income in Glenville with $79,773 per family, while 2-person families (20 | 43.5%) have the highest median income of $39,886 per family member.
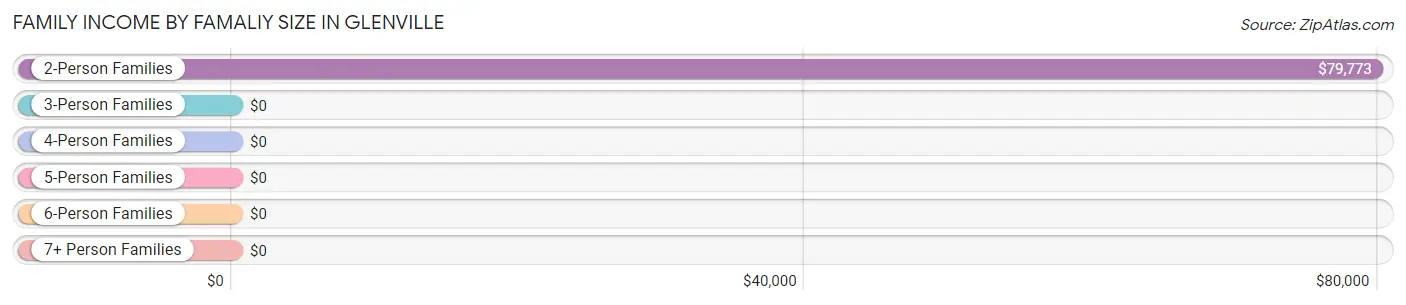
| Income Bracket | # Families | Median Income |
| 2-Person Families | 20 (43.5%) | $79,773 |
| 3-Person Families | 26 (56.5%) | $0 |
| 4-Person Families | 0 (0.0%) | $0 |
| 5-Person Families | 0 (0.0%) | $0 |
| 6-Person Families | 0 (0.0%) | $0 |
| 7+ Person Families | 0 (0.0%) | $0 |
| Total | 46 (100.0%) | $92,667 |
Family Income by Number of Earners in Glenville
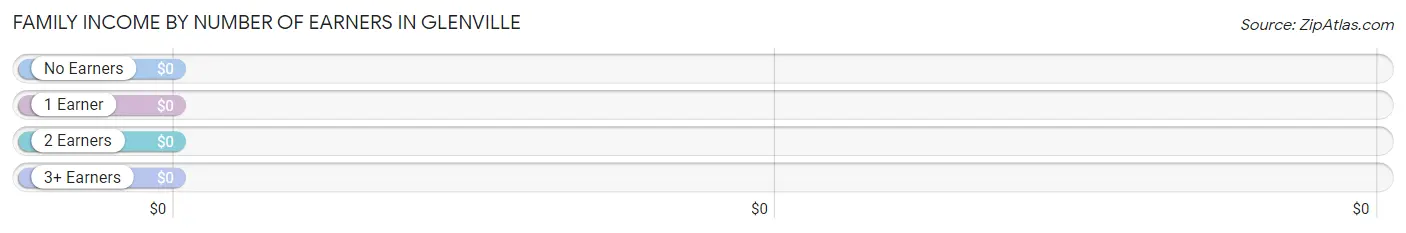
| Number of Earners | # Families | Median Income |
| No Earners | 5 (10.9%) | $0 |
| 1 Earner | 26 (56.5%) | $0 |
| 2 Earners | 15 (32.6%) | $0 |
| 3+ Earners | 0 (0.0%) | $0 |
| Total | 46 (100.0%) | $92,667 |
Household Income in Glenville
Household Income Brackets in Glenville
With 30 households falling in the category, the $75,000 to $99,999 income range is the most frequent in Glenville, accounting for 65.2% of all households.
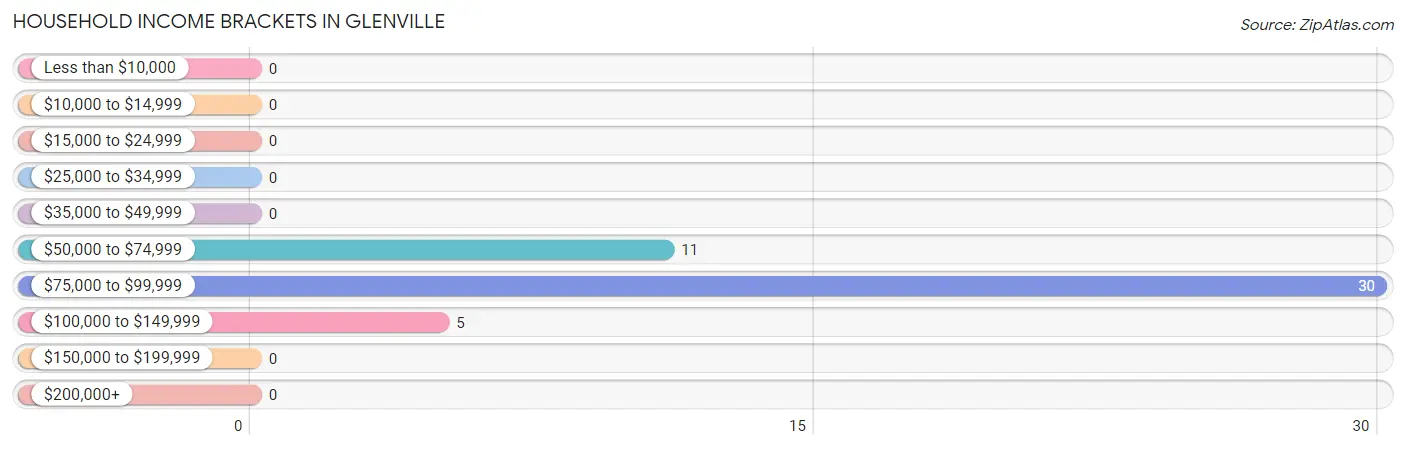
| Income Bracket | # Households | % Households |
| Less than $10,000 | 0 | 0.0% |
| $10,000 to $14,999 | 0 | 0.0% |
| $15,000 to $24,999 | 0 | 0.0% |
| $25,000 to $34,999 | 0 | 0.0% |
| $35,000 to $49,999 | 0 | 0.0% |
| $50,000 to $74,999 | 11 | 23.9% |
| $75,000 to $99,999 | 30 | 65.2% |
| $100,000 to $149,999 | 5 | 10.9% |
| $150,000 to $199,999 | 0 | 0.0% |
| $200,000+ | 0 | 0.0% |
Household Income by Householder Age in Glenville
| Income Bracket | # Households | Median Income |
| 15 to 24 Years | 0 (0.0%) | $0 |
| 25 to 44 Years | 11 (23.9%) | $0 |
| 45 to 64 Years | 15 (32.6%) | $0 |
| 65+ Years | 20 (43.5%) | $0 |
| Total | 46 (100.0%) | $92,667 |
Poverty in Glenville
Income Below Poverty by Sex and Age in Glenville
| Age Bracket | Male | Female |
| Under 5 Years | 0 (0.0%) | 0 (0.0%) |
| 5 Years | 0 (0.0%) | 0 (0.0%) |
| 6 to 11 Years | 0 (0.0%) | 0 (0.0%) |
| 12 to 14 Years | 0 (0.0%) | 0 (0.0%) |
| 15 Years | 0 (0.0%) | 0 (0.0%) |
| 16 and 17 Years | 0 (0.0%) | 0 (0.0%) |
| 18 to 24 Years | 0 (0.0%) | 0 (0.0%) |
| 25 to 34 Years | 0 (0.0%) | 0 (0.0%) |
| 35 to 44 Years | 0 (0.0%) | 0 (0.0%) |
| 45 to 54 Years | 0 (0.0%) | 0 (0.0%) |
| 55 to 64 Years | 0 (0.0%) | 0 (0.0%) |
| 65 to 74 Years | 0 (0.0%) | 0 (0.0%) |
| 75 Years and over | 0 (0.0%) | 0 (0.0%) |
| Total | 0 (0.0%) | 0 (0.0%) |
Income Above Poverty by Sex and Age in Glenville
According to the poverty statistics in Glenville, males aged 35 to 44 years and females aged 25 to 34 years are the age groups that are most secure financially, with 100.0% of males and 100.0% of females in these age groups living above the poverty line.
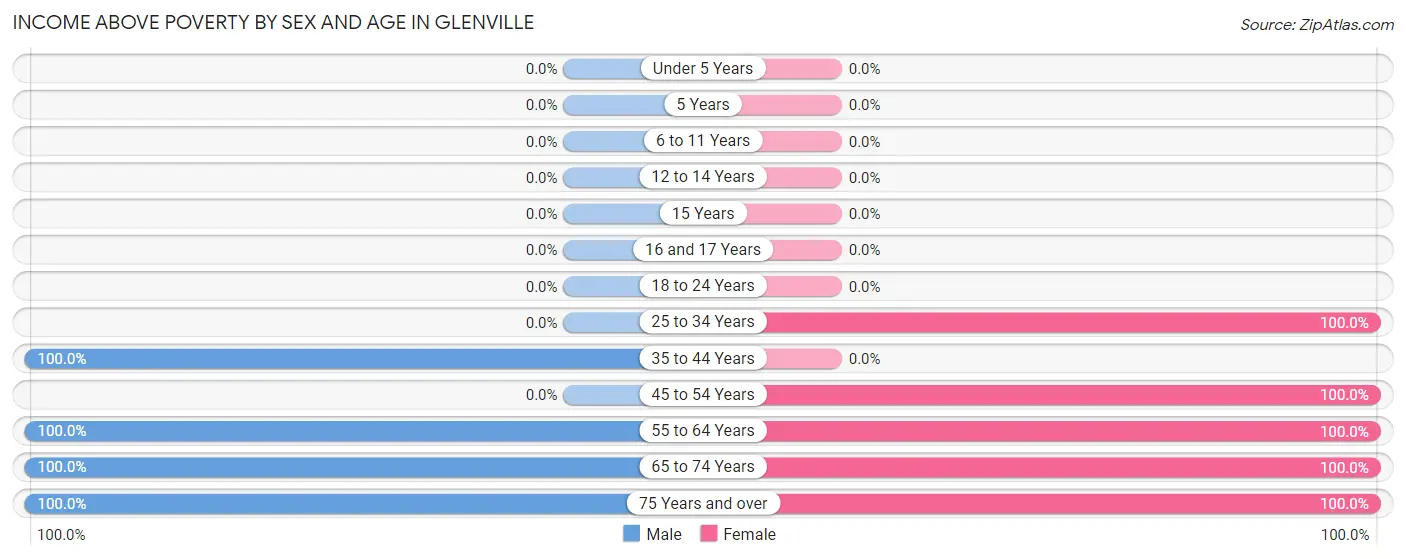
| Age Bracket | Male | Female |
| Under 5 Years | 0 (0.0%) | 0 (0.0%) |
| 5 Years | 0 (0.0%) | 0 (0.0%) |
| 6 to 11 Years | 0 (0.0%) | 0 (0.0%) |
| 12 to 14 Years | 0 (0.0%) | 0 (0.0%) |
| 15 Years | 0 (0.0%) | 0 (0.0%) |
| 16 and 17 Years | 0 (0.0%) | 0 (0.0%) |
| 18 to 24 Years | 0 (0.0%) | 0 (0.0%) |
| 25 to 34 Years | 0 (0.0%) | 11 (100.0%) |
| 35 to 44 Years | 11 (100.0%) | 0 (0.0%) |
| 45 to 54 Years | 0 (0.0%) | 25 (100.0%) |
| 55 to 64 Years | 15 (100.0%) | 25 (100.0%) |
| 65 to 74 Years | 9 (100.0%) | 5 (100.0%) |
| 75 Years and over | 14 (100.0%) | 21 (100.0%) |
| Total | 49 (100.0%) | 87 (100.0%) |
Income Below Poverty Among Married-Couple Families in Glenville
| Children | Above Poverty | Below Poverty |
| No Children | 46 (100.0%) | 0 (0.0%) |
| 1 or 2 Children | 0 (0.0%) | 0 (0.0%) |
| 3 or 4 Children | 0 (0.0%) | 0 (0.0%) |
| 5 or more Children | 0 (0.0%) | 0 (0.0%) |
| Total | 46 (100.0%) | 0 (0.0%) |
Income Below Poverty Among Single-Parent Households in Glenville
| Children | Single Father | Single Mother |
| No Children | 0 (0.0%) | 0 (0.0%) |
| 1 or 2 Children | 0 (0.0%) | 0 (0.0%) |
| 3 or 4 Children | 0 (0.0%) | 0 (0.0%) |
| 5 or more Children | 0 (0.0%) | 0 (0.0%) |
| Total | 0 (0.0%) | 0 (0.0%) |
Income Below Poverty Among Married-Couple vs Single-Parent Households in Glenville
| Children | Married-Couple Families | Single-Parent Households |
| No Children | 0 (0.0%) | 0 (0.0%) |
| 1 or 2 Children | 0 (0.0%) | 0 (0.0%) |
| 3 or 4 Children | 0 (0.0%) | 0 (0.0%) |
| 5 or more Children | 0 (0.0%) | 0 (0.0%) |
| Total | 0 (0.0%) | 0 (0.0%) |
Race in Glenville
The most populous races in Glenville are , and White / Caucasian (136 | 100.0%).
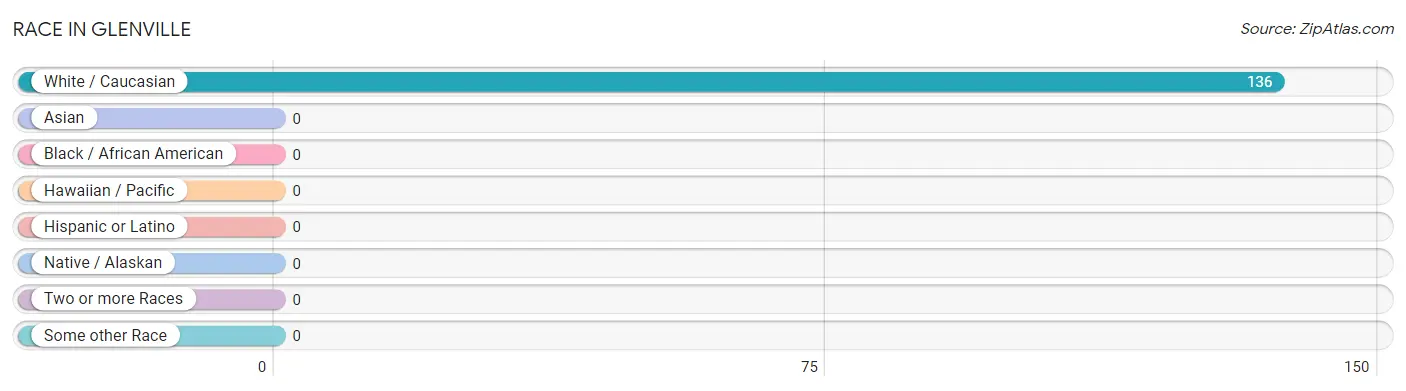
| Race | # Population | % Population |
| Asian | 0 | 0.0% |
| Black / African American | 0 | 0.0% |
| Hawaiian / Pacific | 0 | 0.0% |
| Hispanic or Latino | 0 | 0.0% |
| Native / Alaskan | 0 | 0.0% |
| White / Caucasian | 136 | 100.0% |
| Two or more Races | 0 | 0.0% |
| Some other Race | 0 | 0.0% |
| Total | 136 | 100.0% |
Ancestry in Glenville
The most populous ancestries reported in Glenville are Irish (37 | 27.2%), German (25 | 18.4%), Scotch-Irish (25 | 18.4%), English (5 | 3.7%), and Scottish (4 | 2.9%), together accounting for 70.6% of all Glenville residents.
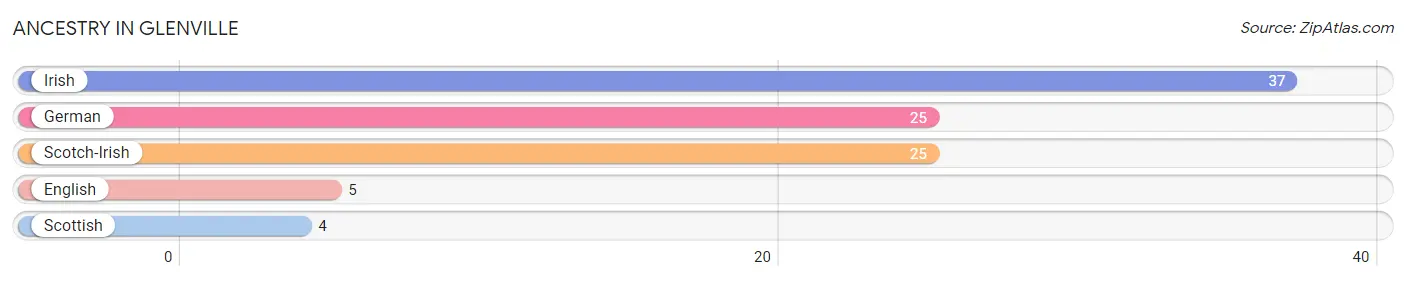
| Ancestry | # Population | % Population |
| English | 5 | 3.7% |
| German | 25 | 18.4% |
| Irish | 37 | 27.2% |
| Scotch-Irish | 25 | 18.4% |
| Scottish | 4 | 2.9% | View All 5 Rows |
Immigrants in Glenville

| Immigration Origin | # Population | % Population | View All 0 Rows |
Sex and Age in Glenville
Sex and Age in Glenville
The most populous age groups in Glenville are 55 to 59 Years (15 | 30.6%) for men and 50 to 54 Years (25 | 28.7%) for women.
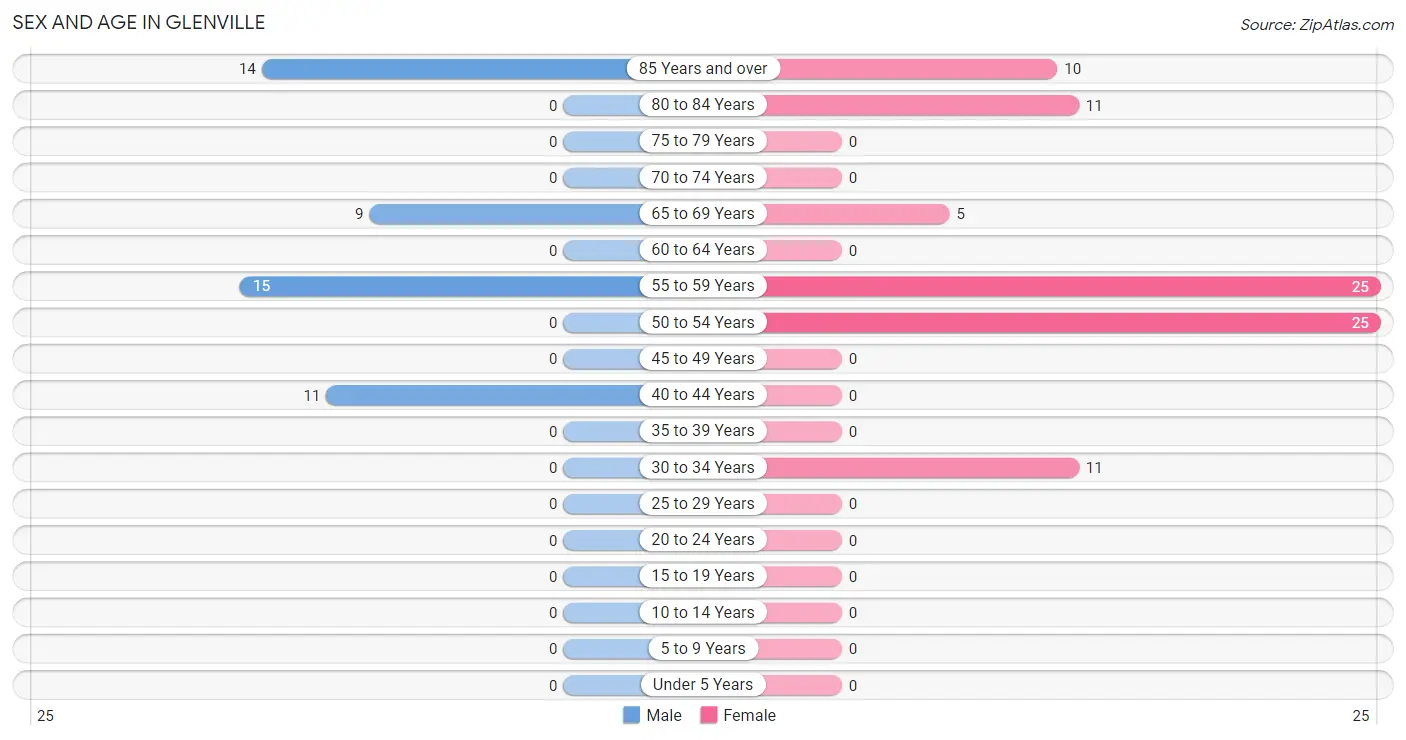
| Age Bracket | Male | Female |
| Under 5 Years | 0 (0.0%) | 0 (0.0%) |
| 5 to 9 Years | 0 (0.0%) | 0 (0.0%) |
| 10 to 14 Years | 0 (0.0%) | 0 (0.0%) |
| 15 to 19 Years | 0 (0.0%) | 0 (0.0%) |
| 20 to 24 Years | 0 (0.0%) | 0 (0.0%) |
| 25 to 29 Years | 0 (0.0%) | 0 (0.0%) |
| 30 to 34 Years | 0 (0.0%) | 11 (12.6%) |
| 35 to 39 Years | 0 (0.0%) | 0 (0.0%) |
| 40 to 44 Years | 11 (22.5%) | 0 (0.0%) |
| 45 to 49 Years | 0 (0.0%) | 0 (0.0%) |
| 50 to 54 Years | 0 (0.0%) | 25 (28.7%) |
| 55 to 59 Years | 15 (30.6%) | 25 (28.7%) |
| 60 to 64 Years | 0 (0.0%) | 0 (0.0%) |
| 65 to 69 Years | 9 (18.4%) | 5 (5.8%) |
| 70 to 74 Years | 0 (0.0%) | 0 (0.0%) |
| 75 to 79 Years | 0 (0.0%) | 0 (0.0%) |
| 80 to 84 Years | 0 (0.0%) | 11 (12.6%) |
| 85 Years and over | 14 (28.6%) | 10 (11.5%) |
| Total | 49 (100.0%) | 87 (100.0%) |
Families and Households in Glenville
Median Family Size in Glenville
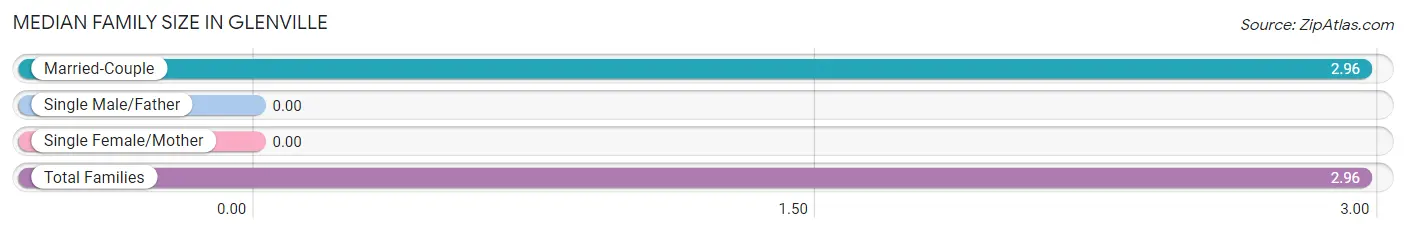
| Family Type | # Families | Family Size |
| Married-Couple | 46 (100.0%) | 2.96 |
| Single Male/Father | 0 (0.0%) | - |
| Single Female/Mother | 0 (0.0%) | - |
| Total Families | 46 (100.0%) | 2.96 |
Median Household Size in Glenville
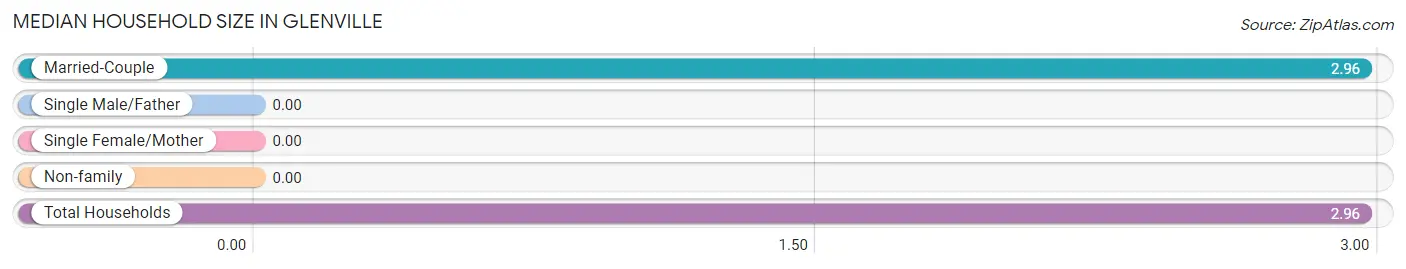
| Household Type | # Households | Household Size |
| Married-Couple | 46 (100.0%) | 2.96 |
| Single Male/Father | 0 (0.0%) | - |
| Single Female/Mother | 0 (0.0%) | - |
| Non-family | 0 (0.0%) | - |
| Total Households | 46 (100.0%) | 2.96 |
Household Size by Marriage Status in Glenville
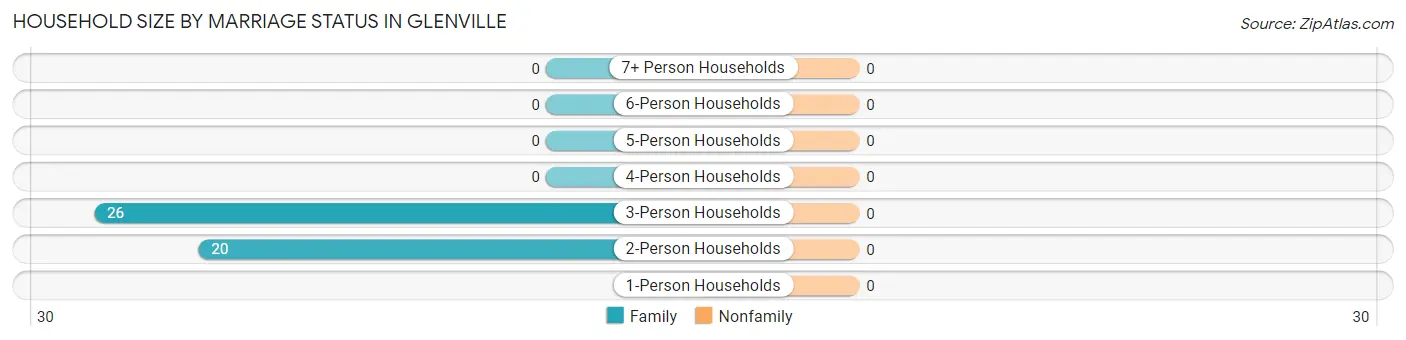
| Household Size | Family Households | Nonfamily Households |
| 1-Person Households | - | 0 (0.0%) |
| 2-Person Households | 20 (43.5%) | 0 (0.0%) |
| 3-Person Households | 26 (56.5%) | 0 (0.0%) |
| 4-Person Households | 0 (0.0%) | 0 (0.0%) |
| 5-Person Households | 0 (0.0%) | 0 (0.0%) |
| 6-Person Households | 0 (0.0%) | 0 (0.0%) |
| 7+ Person Households | 0 (0.0%) | 0 (0.0%) |
| Total | 46 (100.0%) | 0 (0.0%) |
Female Fertility in Glenville
Fertility by Age in Glenville
| Age Bracket | Women with Births | Births / 1,000 Women |
| 15 to 19 years | 0 (0.0%) | 0.0 |
| 20 to 34 years | 0 (0.0%) | 0.0 |
| 35 to 50 years | 0 (0.0%) | 0.0 |
| Total | 0 (0.0%) | 0.0 |
Fertility by Age by Marriage Status in Glenville
| Age Bracket | Married | Unmarried |
| 15 to 19 years | 0 (0.0%) | 0 (0.0%) |
| 20 to 34 years | 0 (0.0%) | 0 (0.0%) |
| 35 to 50 years | 0 (0.0%) | 0 (0.0%) |
| Total | 0 (0.0%) | 0 (0.0%) |
Fertility by Education in Glenville
| Educational Attainment | Women with Births | Births / 1,000 Women |
| Less than High School | 0 (0.0%) | 0.0 |
| High School Diploma | 0 (0.0%) | 0.0 |
| College or Associate's Degree | 0 (0.0%) | 0.0 |
| Bachelor's Degree | 0 (0.0%) | 0.0 |
| Graduate Degree | 0 (0.0%) | 0.0 |
| Total | 0 (0.0%) | 0.0 |
Fertility by Education by Marriage Status in Glenville
| Educational Attainment | Married | Unmarried |
| Less than High School | 0 (0.0%) | 0 (0.0%) |
| High School Diploma | 0 (0.0%) | 0 (0.0%) |
| College or Associate's Degree | 0 (0.0%) | 0 (0.0%) |
| Bachelor's Degree | 0 (0.0%) | 0 (0.0%) |
| Graduate Degree | 0 (0.0%) | 0 (0.0%) |
| Total | 0 (0.0%) | 0 (0.0%) |
Employment Characteristics in Glenville
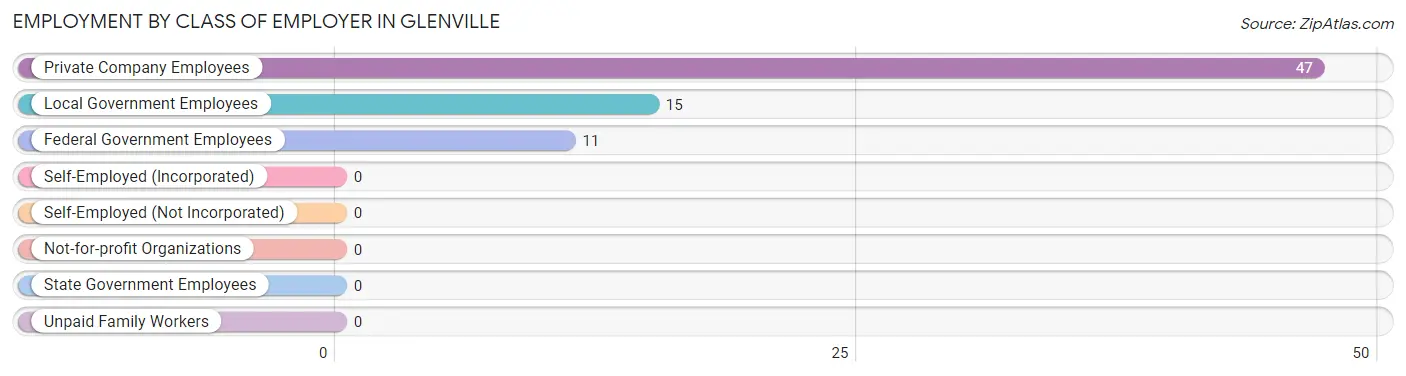
Employment by Class of Employer in Glenville
Among the 73 employed individuals in Glenville, private company employees (47 | 64.4%), local government employees (15 | 20.5%), and federal government employees (11 | 15.1%) make up the most common classes of employment.
| Employer Class | # Employees | % Employees |
| Private Company Employees | 47 | 64.4% |
| Self-Employed (Incorporated) | 0 | 0.0% |
| Self-Employed (Not Incorporated) | 0 | 0.0% |
| Not-for-profit Organizations | 0 | 0.0% |
| Local Government Employees | 15 | 20.5% |
| State Government Employees | 0 | 0.0% |
| Federal Government Employees | 11 | 15.1% |
| Unpaid Family Workers | 0 | 0.0% |
| Total | 73 | 100.0% |
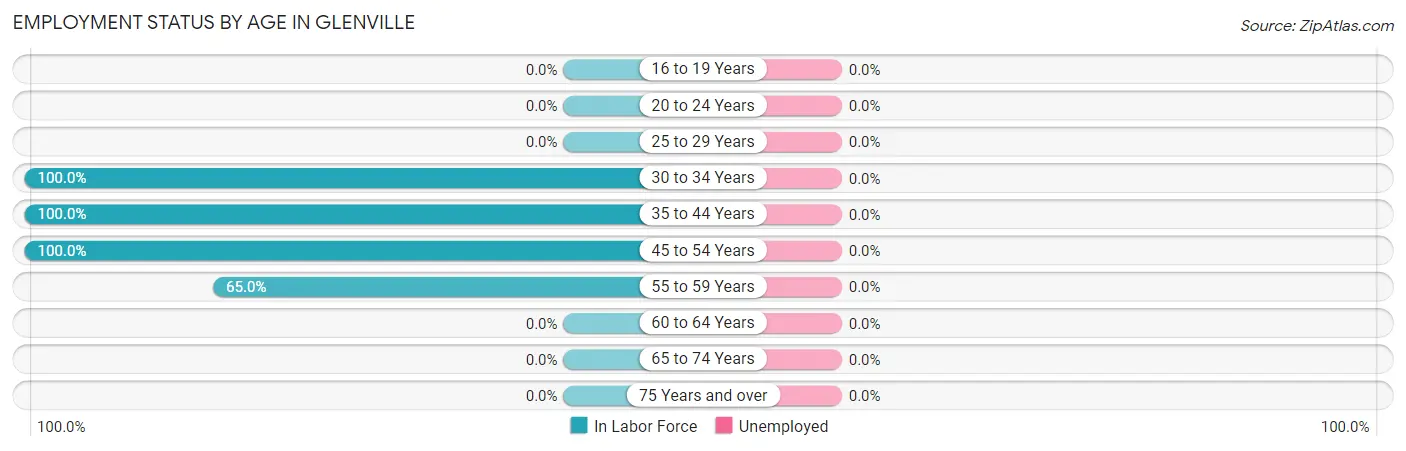
Employment Status by Age in Glenville
| Age Bracket | In Labor Force | Unemployed |
| 16 to 19 Years | 0 (0.0%) | 0 (0.0%) |
| 20 to 24 Years | 0 (0.0%) | 0 (0.0%) |
| 25 to 29 Years | 0 (0.0%) | 0 (0.0%) |
| 30 to 34 Years | 11 (100.0%) | 0 (0.0%) |
| 35 to 44 Years | 11 (100.0%) | 0 (0.0%) |
| 45 to 54 Years | 25 (100.0%) | 0 (0.0%) |
| 55 to 59 Years | 26 (65.0%) | 0 (0.0%) |
| 60 to 64 Years | 0 (0.0%) | 0 (0.0%) |
| 65 to 74 Years | 0 (0.0%) | 0 (0.0%) |
| 75 Years and over | 0 (0.0%) | 0 (0.0%) |
| Total | 73 (53.7%) | 0 (0.0%) |
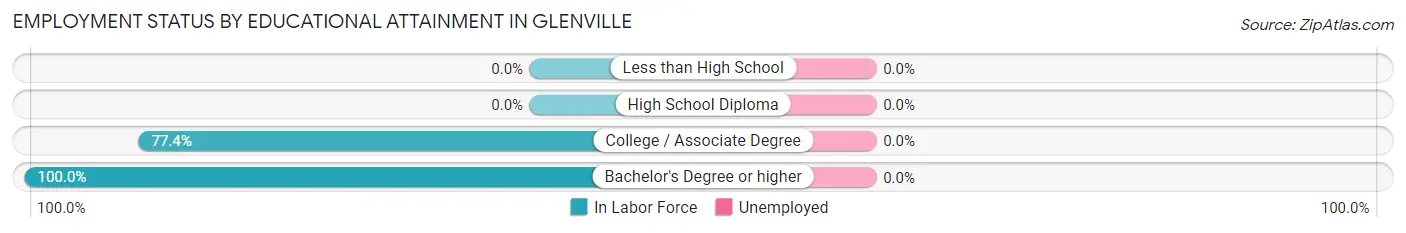
Employment Status by Educational Attainment in Glenville
| Educational Attainment | In Labor Force | Unemployed |
| Less than High School | 0 (0.0%) | 0 (0.0%) |
| High School Diploma | 0 (0.0%) | 0 (0.0%) |
| College / Associate Degree | 48 (77.4%) | 0 (0.0%) |
| Bachelor's Degree or higher | 25 (100.0%) | 0 (0.0%) |
| Total | 73 (83.9%) | 0 (0.0%) |
Employment Occupations by Sex in Glenville
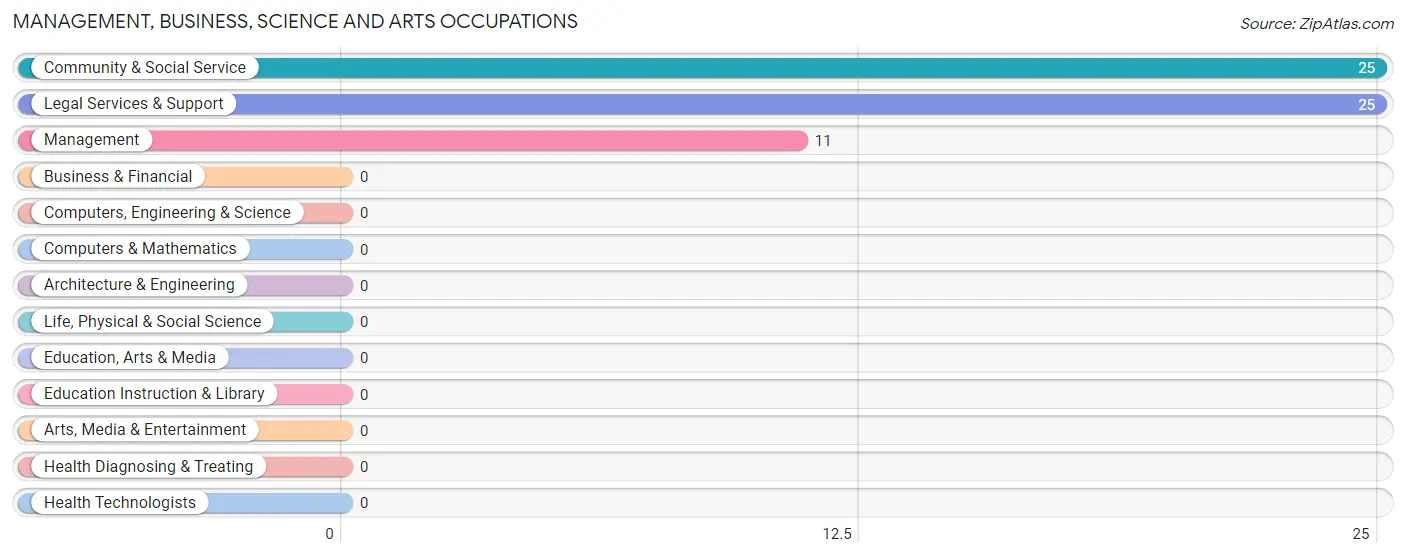
Management, Business, Science and Arts Occupations
The most common Management, Business, Science and Arts occupations in Glenville are Community & Social Service (25 | 34.3%), Legal Services & Support (25 | 34.3%), and Management (11 | 15.1%).
Management, Business, Science and Arts Occupations by Sex
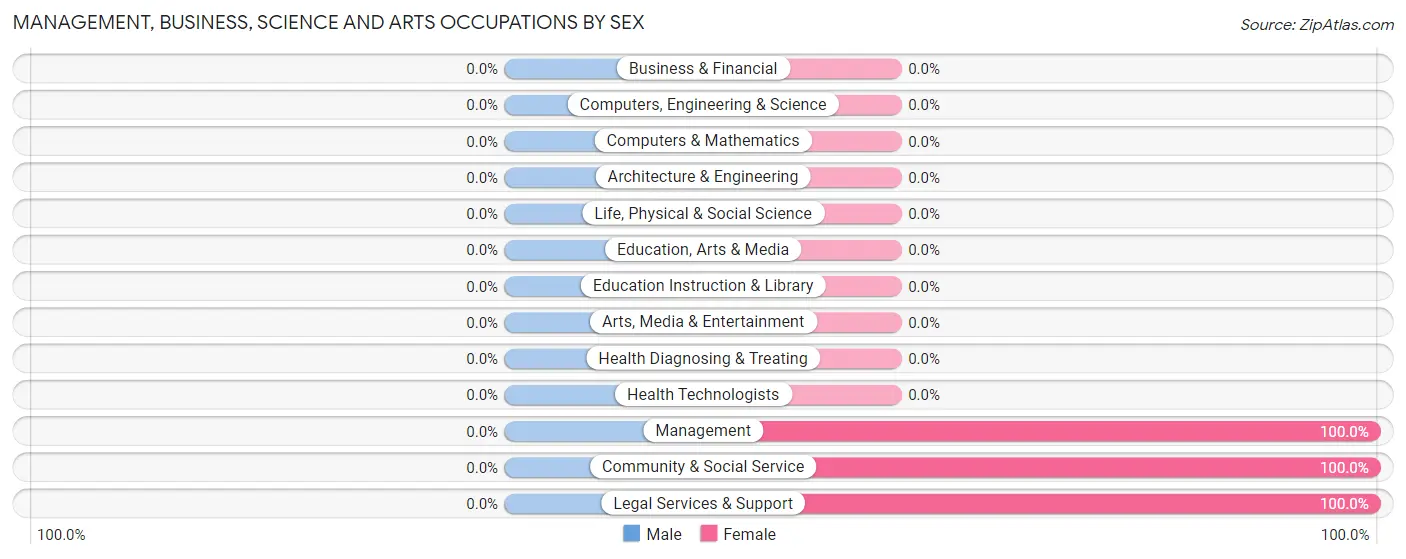
| Occupation | Male | Female |
| Management | 0 (0.0%) | 11 (100.0%) |
| Business & Financial | 0 (0.0%) | 0 (0.0%) |
| Computers, Engineering & Science | 0 (0.0%) | 0 (0.0%) |
| Computers & Mathematics | 0 (0.0%) | 0 (0.0%) |
| Architecture & Engineering | 0 (0.0%) | 0 (0.0%) |
| Life, Physical & Social Science | 0 (0.0%) | 0 (0.0%) |
| Community & Social Service | 0 (0.0%) | 25 (100.0%) |
| Education, Arts & Media | 0 (0.0%) | 0 (0.0%) |
| Legal Services & Support | 0 (0.0%) | 25 (100.0%) |
| Education Instruction & Library | 0 (0.0%) | 0 (0.0%) |
| Arts, Media & Entertainment | 0 (0.0%) | 0 (0.0%) |
| Health Diagnosing & Treating | 0 (0.0%) | 0 (0.0%) |
| Health Technologists | 0 (0.0%) | 0 (0.0%) |
| Total (Category) | 0 (0.0%) | 36 (100.0%) |
| Total (Overall) | 26 (35.6%) | 47 (64.4%) |
Services Occupations
Services Occupations by Sex
| Occupation | Male | Female |
| Healthcare Support | 0 (0.0%) | 0 (0.0%) |
| Security & Protection | 0 (0.0%) | 0 (0.0%) |
| Firefighting & Prevention | 0 (0.0%) | 0 (0.0%) |
| Law Enforcement | 0 (0.0%) | 0 (0.0%) |
| Food Preparation & Serving | 0 (0.0%) | 0 (0.0%) |
| Cleaning & Maintenance | 0 (0.0%) | 0 (0.0%) |
| Personal Care & Service | 0 (0.0%) | 0 (0.0%) |
| Total (Category) | 0 (0.0%) | 0 (0.0%) |
| Total (Overall) | 26 (35.6%) | 47 (64.4%) |
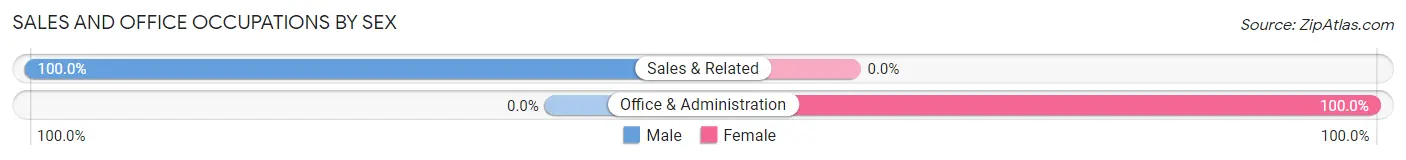
Sales and Office Occupations
The most common Sales and Office occupations in Glenville are Sales & Related (11 | 15.1%), and Office & Administration (11 | 15.1%).
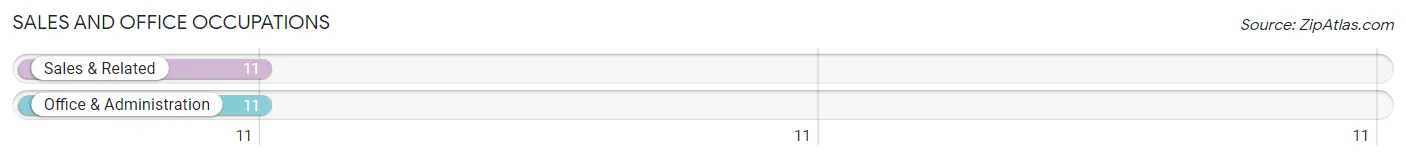
Sales and Office Occupations by Sex
| Occupation | Male | Female |
| Sales & Related | 11 (100.0%) | 0 (0.0%) |
| Office & Administration | 0 (0.0%) | 11 (100.0%) |
| Total (Category) | 11 (50.0%) | 11 (50.0%) |
| Total (Overall) | 26 (35.6%) | 47 (64.4%) |
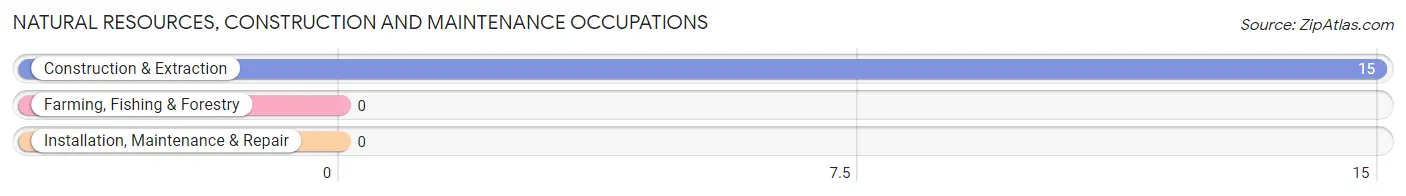
Natural Resources, Construction and Maintenance Occupations
The most common Natural Resources, Construction and Maintenance occupations in Glenville are , and Construction & Extraction (15 | 20.5%).
Natural Resources, Construction and Maintenance Occupations by Sex
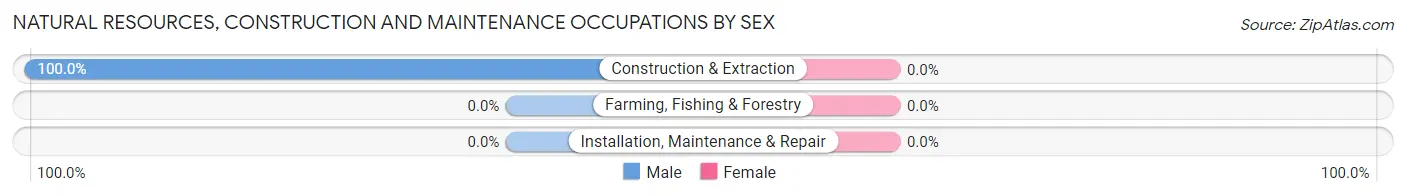
| Occupation | Male | Female |
| Farming, Fishing & Forestry | 0 (0.0%) | 0 (0.0%) |
| Construction & Extraction | 15 (100.0%) | 0 (0.0%) |
| Installation, Maintenance & Repair | 0 (0.0%) | 0 (0.0%) |
| Total (Category) | 15 (100.0%) | 0 (0.0%) |
| Total (Overall) | 26 (35.6%) | 47 (64.4%) |
Production, Transportation and Moving Occupations
Production, Transportation and Moving Occupations by Sex
| Occupation | Male | Female |
| Production | 0 (0.0%) | 0 (0.0%) |
| Transportation | 0 (0.0%) | 0 (0.0%) |
| Material Moving | 0 (0.0%) | 0 (0.0%) |
| Total (Category) | 0 (0.0%) | 0 (0.0%) |
| Total (Overall) | 26 (35.6%) | 47 (64.4%) |
Employment Industries by Sex in Glenville
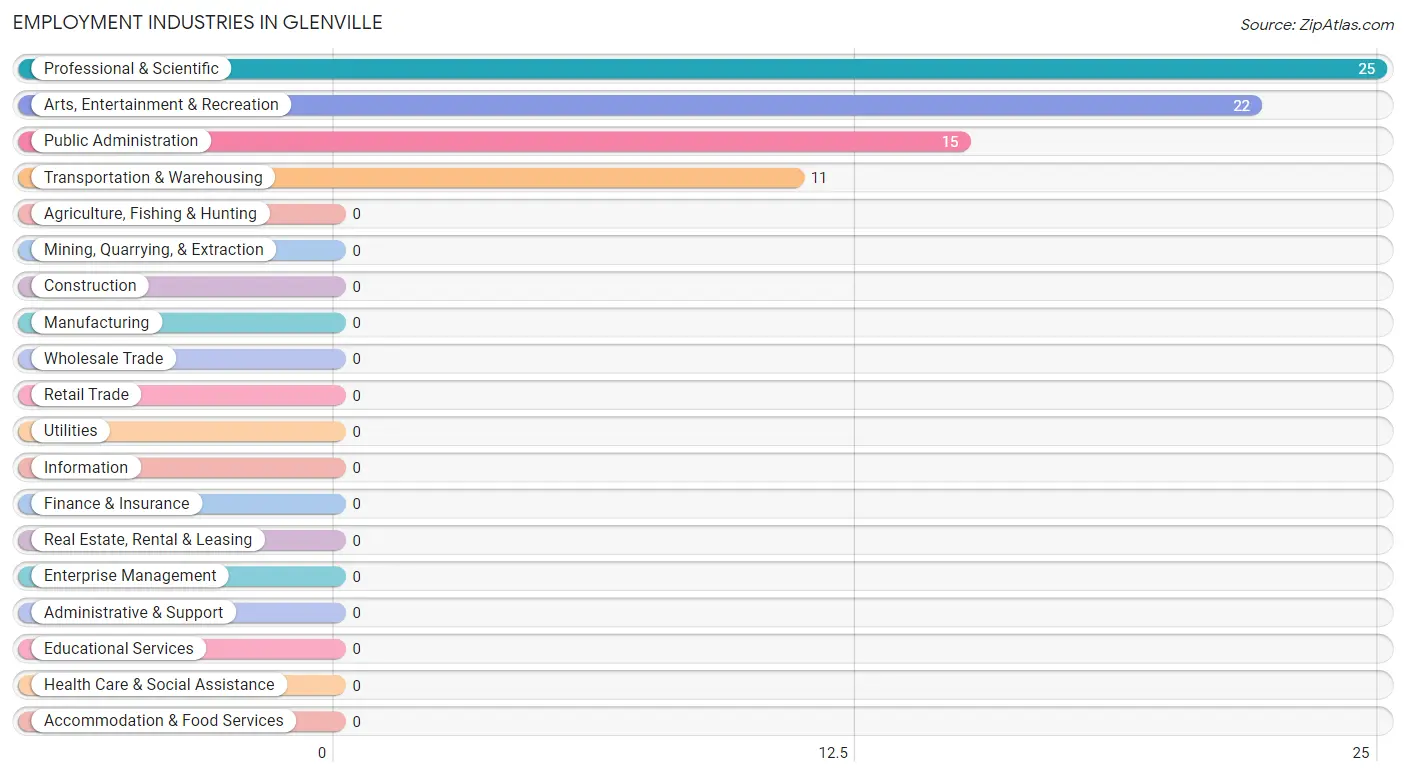
Employment Industries in Glenville
The major employment industries in Glenville include Professional & Scientific (25 | 34.3%), Arts, Entertainment & Recreation (22 | 30.1%), Public Administration (15 | 20.5%), and Transportation & Warehousing (11 | 15.1%).
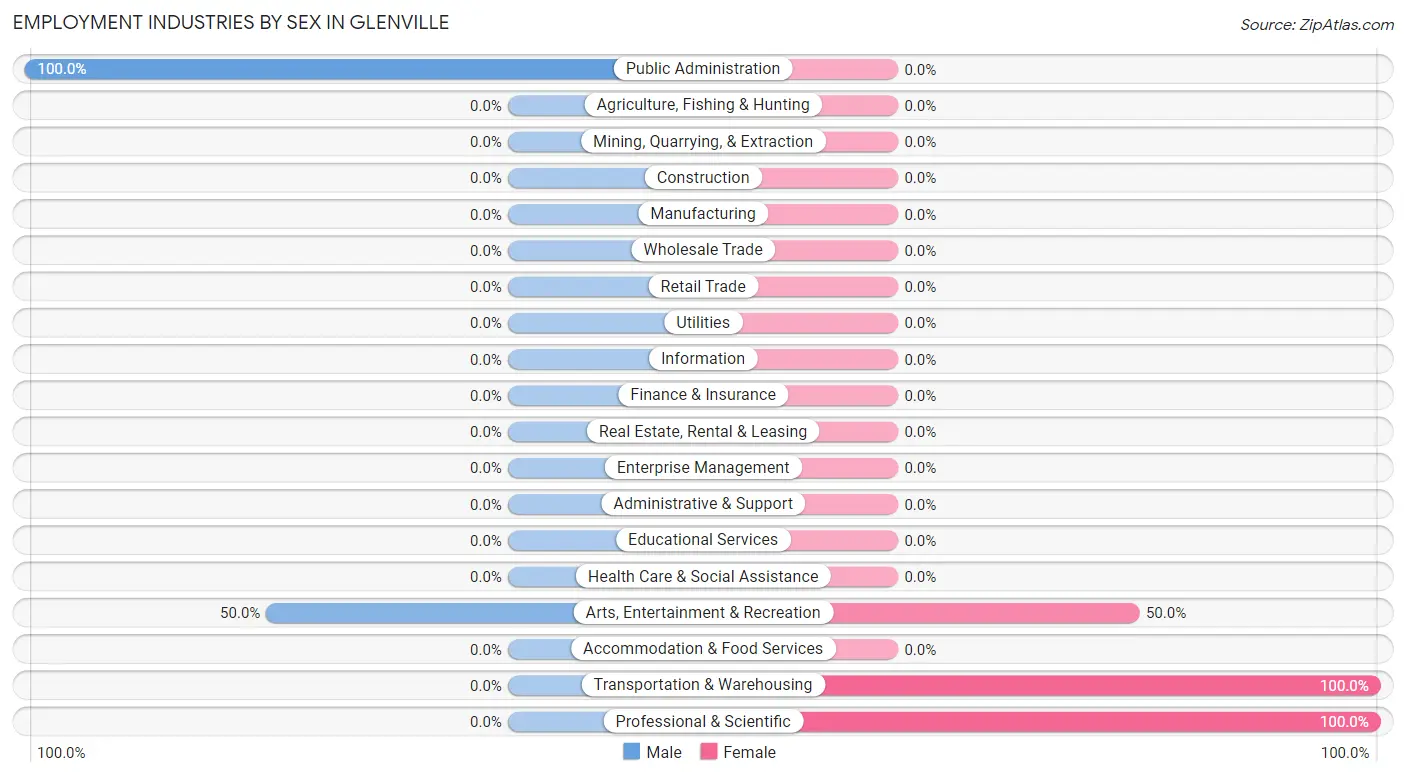
Employment Industries by Sex in Glenville
The Glenville industries that see more men than women are Public Administration (100.0%), and Arts, Entertainment & Recreation (50.0%), whereas the industries that tend to have a higher number of women are Transportation & Warehousing (100.0%), Professional & Scientific (100.0%), and Arts, Entertainment & Recreation (50.0%).
| Industry | Male | Female |
| Agriculture, Fishing & Hunting | 0 (0.0%) | 0 (0.0%) |
| Mining, Quarrying, & Extraction | 0 (0.0%) | 0 (0.0%) |
| Construction | 0 (0.0%) | 0 (0.0%) |
| Manufacturing | 0 (0.0%) | 0 (0.0%) |
| Wholesale Trade | 0 (0.0%) | 0 (0.0%) |
| Retail Trade | 0 (0.0%) | 0 (0.0%) |
| Transportation & Warehousing | 0 (0.0%) | 11 (100.0%) |
| Utilities | 0 (0.0%) | 0 (0.0%) |
| Information | 0 (0.0%) | 0 (0.0%) |
| Finance & Insurance | 0 (0.0%) | 0 (0.0%) |
| Real Estate, Rental & Leasing | 0 (0.0%) | 0 (0.0%) |
| Professional & Scientific | 0 (0.0%) | 25 (100.0%) |
| Enterprise Management | 0 (0.0%) | 0 (0.0%) |
| Administrative & Support | 0 (0.0%) | 0 (0.0%) |
| Educational Services | 0 (0.0%) | 0 (0.0%) |
| Health Care & Social Assistance | 0 (0.0%) | 0 (0.0%) |
| Arts, Entertainment & Recreation | 11 (50.0%) | 11 (50.0%) |
| Accommodation & Food Services | 0 (0.0%) | 0 (0.0%) |
| Public Administration | 15 (100.0%) | 0 (0.0%) |
| Total | 26 (35.6%) | 47 (64.4%) |
Education in Glenville
School Enrollment in Glenville
| School Level | # Students | % Students |
| Nursery / Preschool | 0 | 0.0% |
| Kindergarten | 0 | 0.0% |
| Elementary School | 0 | 0.0% |
| Middle School | 0 | 0.0% |
| High School | 0 | 0.0% |
| College / Undergraduate | 0 | 0.0% |
| Graduate / Professional | 0 | 0.0% |
| Total | 0 | 0.0% |
School Enrollment by Age by Funding Source in Glenville
| Age Bracket | Public School | Private School |
| 3 to 4 Year Olds | 0 (0.0%) | 0 (0.0%) |
| 5 to 9 Year Old | 0 (0.0%) | 0 (0.0%) |
| 10 to 14 Year Olds | 0 (0.0%) | 0 (0.0%) |
| 15 to 17 Year Olds | 0 (0.0%) | 0 (0.0%) |
| 18 to 19 Year Olds | 0 (0.0%) | 0 (0.0%) |
| 20 to 24 Year Olds | 0 (0.0%) | 0 (0.0%) |
| 25 to 34 Year Olds | 0 (0.0%) | 0 (0.0%) |
| 35 Years and over | 0 (0.0%) | 0 (0.0%) |
| Total | 0 (0.0%) | 0 (0.0%) |
Educational Attainment by Field of Study in Glenville
Social sciences (30 | 61.2%), bio, nature & agricultural (14 | 28.6%), and literature & languages (5 | 10.2%) are the most common fields of study among 49 individuals in Glenville who have obtained a bachelor's degree or higher.
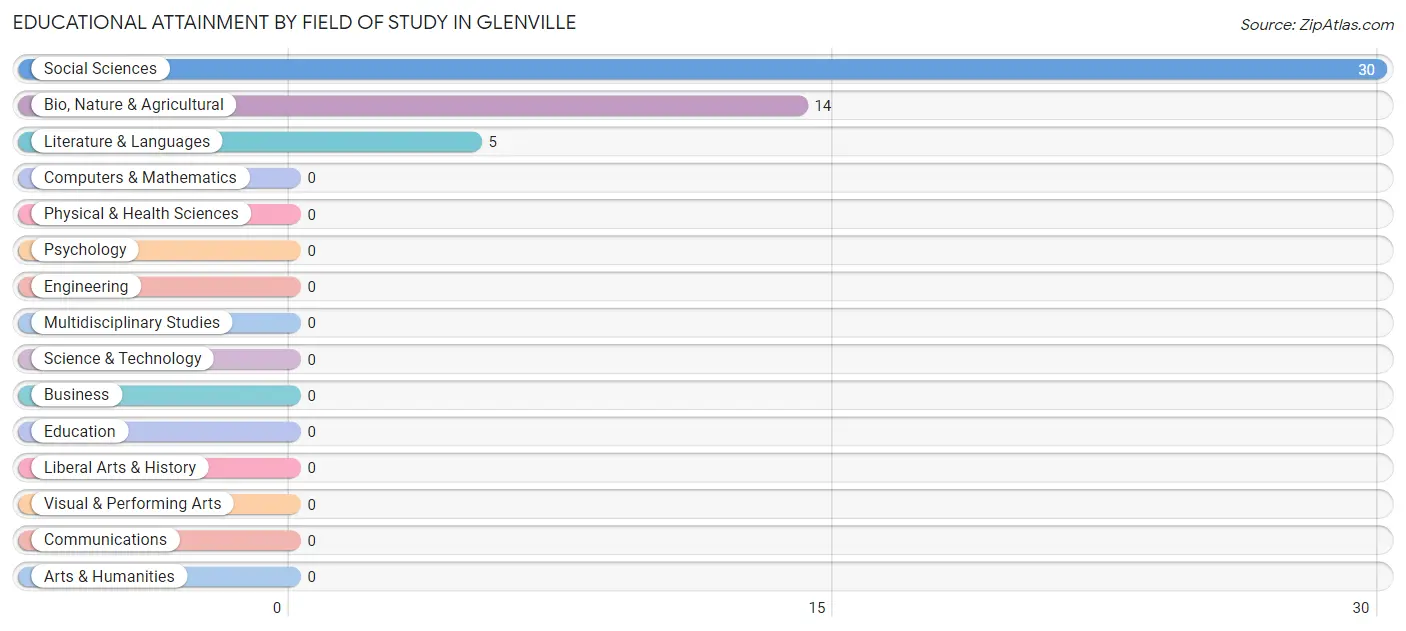
| Field of Study | # Graduates | % Graduates |
| Computers & Mathematics | 0 | 0.0% |
| Bio, Nature & Agricultural | 14 | 28.6% |
| Physical & Health Sciences | 0 | 0.0% |
| Psychology | 0 | 0.0% |
| Social Sciences | 30 | 61.2% |
| Engineering | 0 | 0.0% |
| Multidisciplinary Studies | 0 | 0.0% |
| Science & Technology | 0 | 0.0% |
| Business | 0 | 0.0% |
| Education | 0 | 0.0% |
| Literature & Languages | 5 | 10.2% |
| Liberal Arts & History | 0 | 0.0% |
| Visual & Performing Arts | 0 | 0.0% |
| Communications | 0 | 0.0% |
| Arts & Humanities | 0 | 0.0% |
| Total | 49 | 100.0% |
Transportation & Commute in Glenville
Vehicle Availability by Sex in Glenville
The most prevalent vehicle ownership categories in Glenville are males with 3 vehicles (15, accounting for 57.7%) and females with 3 vehicles (0, making up 31.9%).
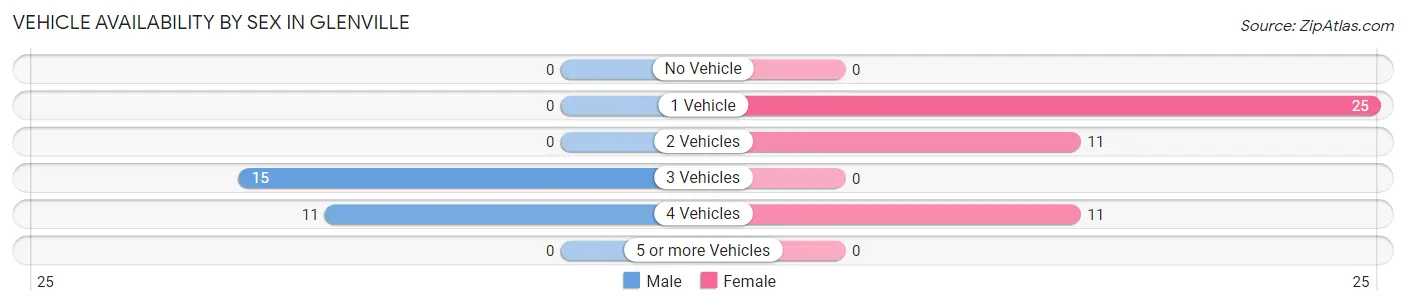
| Vehicles Available | Male | Female |
| No Vehicle | 0 (0.0%) | 0 (0.0%) |
| 1 Vehicle | 0 (0.0%) | 25 (53.2%) |
| 2 Vehicles | 0 (0.0%) | 11 (23.4%) |
| 3 Vehicles | 15 (57.7%) | 0 (0.0%) |
| 4 Vehicles | 11 (42.3%) | 11 (23.4%) |
| 5 or more Vehicles | 0 (0.0%) | 0 (0.0%) |
| Total | 26 (100.0%) | 47 (100.0%) |
Commute Time in Glenville
The most frequently occuring commute durations in Glenville are 15 to 19 minutes (22 commuters, 66.7%), 30 to 34 minutes (11 commuters, 33.3%), and less than 5 minutes (0 commuters, 0.0%).
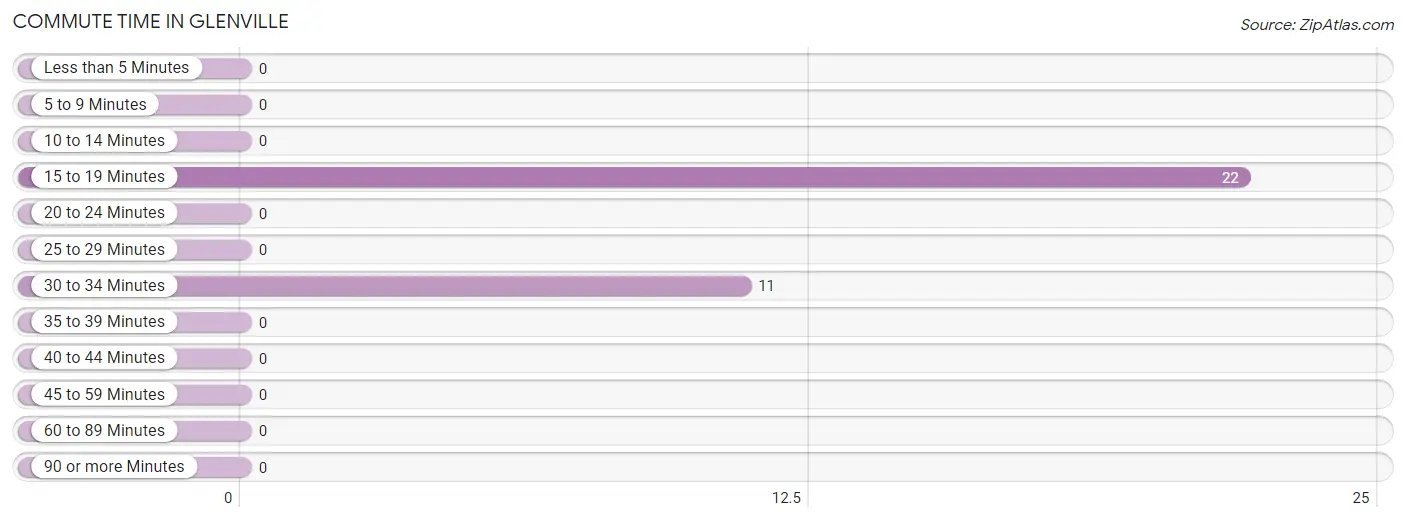
| Commute Time | # Commuters | % Commuters |
| Less than 5 Minutes | 0 | 0.0% |
| 5 to 9 Minutes | 0 | 0.0% |
| 10 to 14 Minutes | 0 | 0.0% |
| 15 to 19 Minutes | 22 | 66.7% |
| 20 to 24 Minutes | 0 | 0.0% |
| 25 to 29 Minutes | 0 | 0.0% |
| 30 to 34 Minutes | 11 | 33.3% |
| 35 to 39 Minutes | 0 | 0.0% |
| 40 to 44 Minutes | 0 | 0.0% |
| 45 to 59 Minutes | 0 | 0.0% |
| 60 to 89 Minutes | 0 | 0.0% |
| 90 or more Minutes | 0 | 0.0% |
Commute Time by Sex in Glenville
The most common commute times in Glenville are 15 to 19 minutes (11 commuters, 100.0%) for males and 15 to 19 minutes (11 commuters, 50.0%) for females.
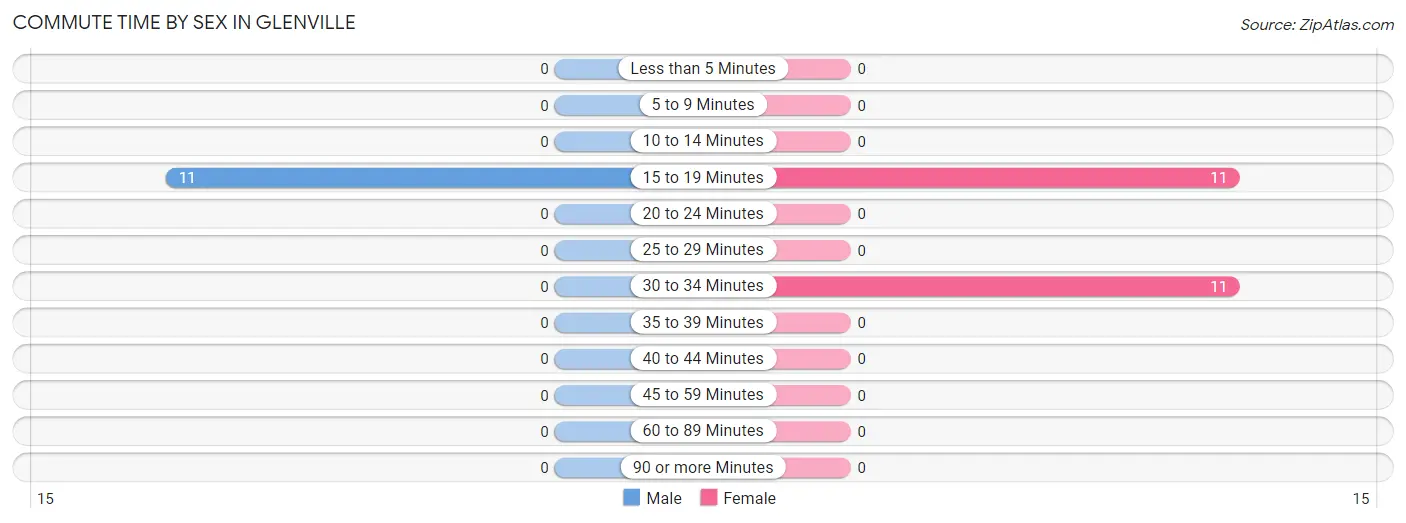
| Commute Time | Male | Female |
| Less than 5 Minutes | 0 (0.0%) | 0 (0.0%) |
| 5 to 9 Minutes | 0 (0.0%) | 0 (0.0%) |
| 10 to 14 Minutes | 0 (0.0%) | 0 (0.0%) |
| 15 to 19 Minutes | 11 (100.0%) | 11 (50.0%) |
| 20 to 24 Minutes | 0 (0.0%) | 0 (0.0%) |
| 25 to 29 Minutes | 0 (0.0%) | 0 (0.0%) |
| 30 to 34 Minutes | 0 (0.0%) | 11 (50.0%) |
| 35 to 39 Minutes | 0 (0.0%) | 0 (0.0%) |
| 40 to 44 Minutes | 0 (0.0%) | 0 (0.0%) |
| 45 to 59 Minutes | 0 (0.0%) | 0 (0.0%) |
| 60 to 89 Minutes | 0 (0.0%) | 0 (0.0%) |
| 90 or more Minutes | 0 (0.0%) | 0 (0.0%) |
Time of Departure to Work by Sex in Glenville
The most frequent times of departure to work in Glenville are 7:00 AM to 7:29 AM (11, 100.0%) for males and 7:00 AM to 7:29 AM (22, 100.0%) for females.
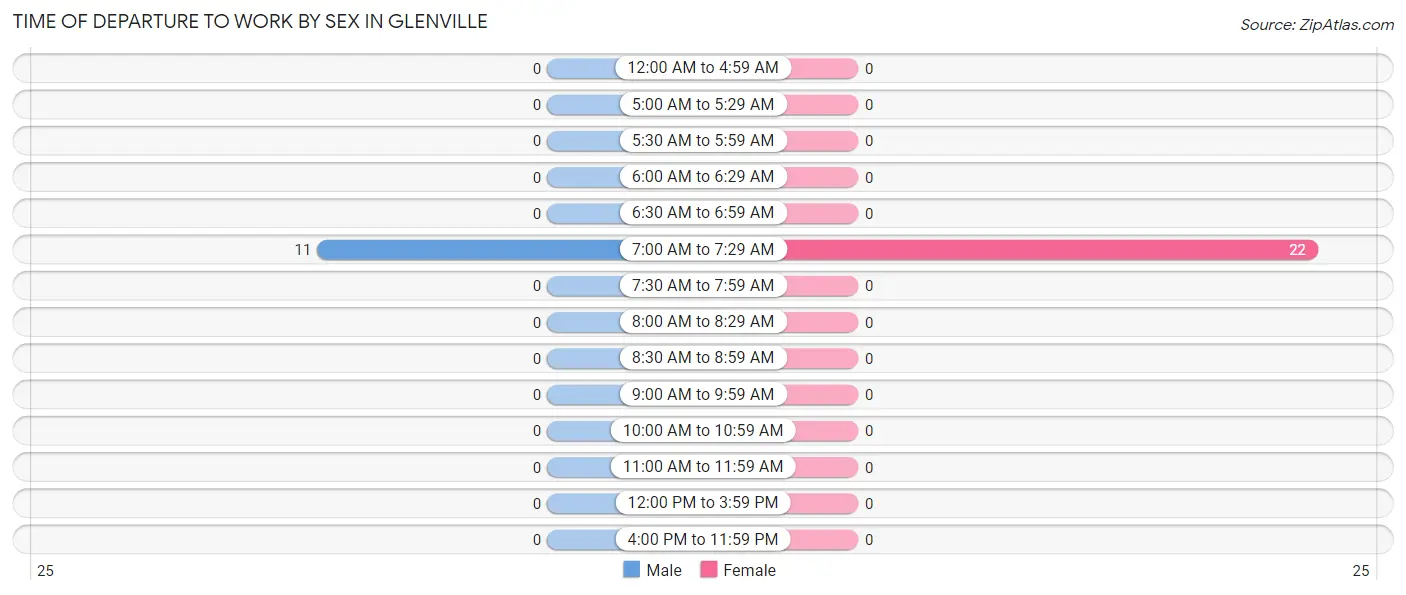
| Time of Departure | Male | Female |
| 12:00 AM to 4:59 AM | 0 (0.0%) | 0 (0.0%) |
| 5:00 AM to 5:29 AM | 0 (0.0%) | 0 (0.0%) |
| 5:30 AM to 5:59 AM | 0 (0.0%) | 0 (0.0%) |
| 6:00 AM to 6:29 AM | 0 (0.0%) | 0 (0.0%) |
| 6:30 AM to 6:59 AM | 0 (0.0%) | 0 (0.0%) |
| 7:00 AM to 7:29 AM | 11 (100.0%) | 22 (100.0%) |
| 7:30 AM to 7:59 AM | 0 (0.0%) | 0 (0.0%) |
| 8:00 AM to 8:29 AM | 0 (0.0%) | 0 (0.0%) |
| 8:30 AM to 8:59 AM | 0 (0.0%) | 0 (0.0%) |
| 9:00 AM to 9:59 AM | 0 (0.0%) | 0 (0.0%) |
| 10:00 AM to 10:59 AM | 0 (0.0%) | 0 (0.0%) |
| 11:00 AM to 11:59 AM | 0 (0.0%) | 0 (0.0%) |
| 12:00 PM to 3:59 PM | 0 (0.0%) | 0 (0.0%) |
| 4:00 PM to 11:59 PM | 0 (0.0%) | 0 (0.0%) |
| Total | 11 (100.0%) | 22 (100.0%) |
Housing Occupancy in Glenville
Occupancy by Ownership in Glenville
Of the total 46 dwellings in Glenville, owner-occupied units account for 35 (76.1%), while renter-occupied units make up 11 (23.9%).
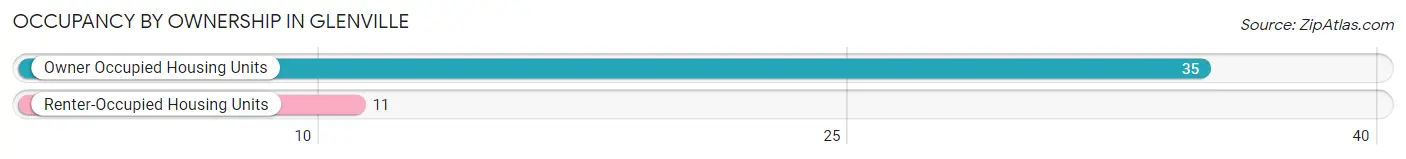
| Occupancy | # Housing Units | % Housing Units |
| Owner Occupied Housing Units | 35 | 76.1% |
| Renter-Occupied Housing Units | 11 | 23.9% |
| Total Occupied Housing Units | 46 | 100.0% |
Occupancy by Household Size in Glenville
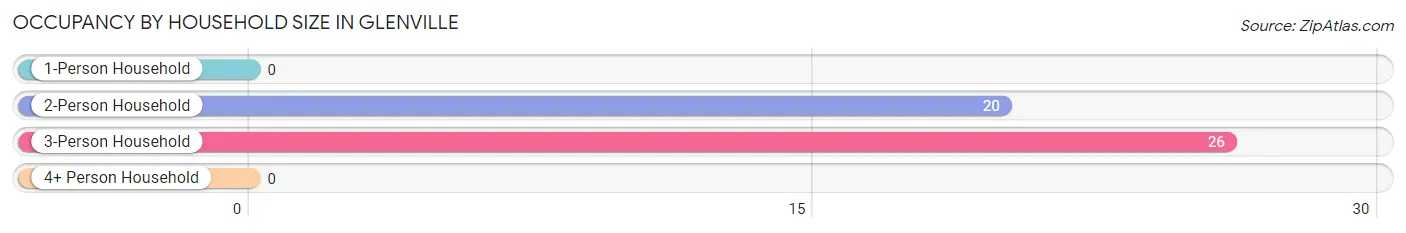
| Household Size | # Housing Units | % Housing Units |
| 1-Person Household | 0 | 0.0% |
| 2-Person Household | 20 | 43.5% |
| 3-Person Household | 26 | 56.5% |
| 4+ Person Household | 0 | 0.0% |
| Total Housing Units | 46 | 100.0% |
Occupancy by Ownership by Household Size in Glenville
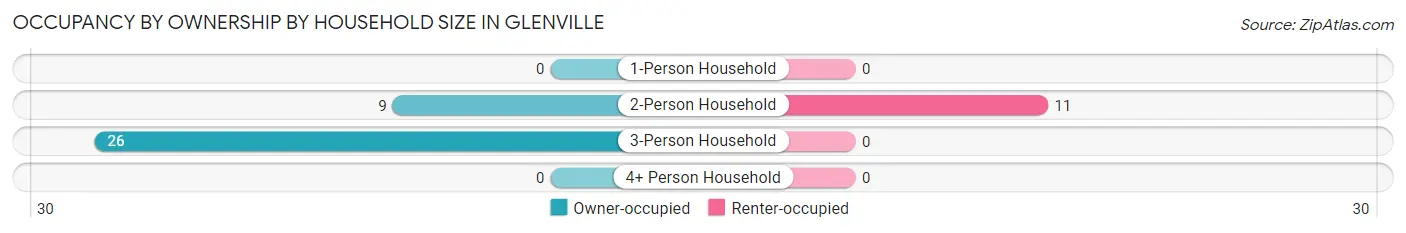
| Household Size | Owner-occupied | Renter-occupied |
| 1-Person Household | 0 (0.0%) | 0 (0.0%) |
| 2-Person Household | 9 (45.0%) | 11 (55.0%) |
| 3-Person Household | 26 (100.0%) | 0 (0.0%) |
| 4+ Person Household | 0 (0.0%) | 0 (0.0%) |
| Total Housing Units | 35 (76.1%) | 11 (23.9%) |
Occupancy by Educational Attainment in Glenville
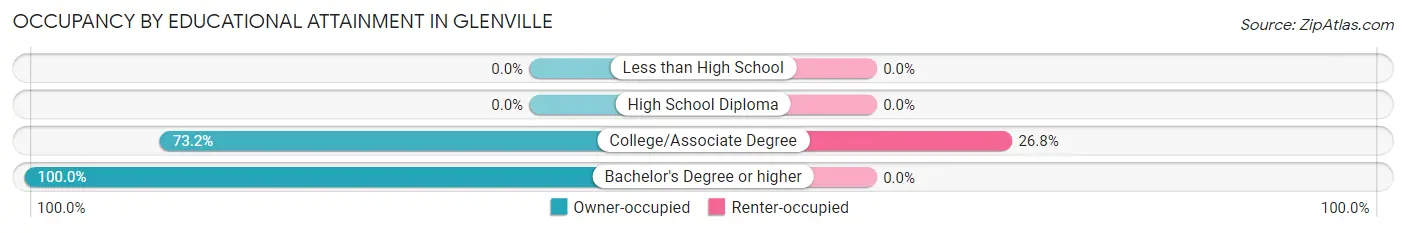
| Household Size | Owner-occupied | Renter-occupied |
| Less than High School | 0 (0.0%) | 0 (0.0%) |
| High School Diploma | 0 (0.0%) | 0 (0.0%) |
| College/Associate Degree | 30 (73.2%) | 11 (26.8%) |
| Bachelor's Degree or higher | 5 (100.0%) | 0 (0.0%) |
Occupancy by Age of Householder in Glenville
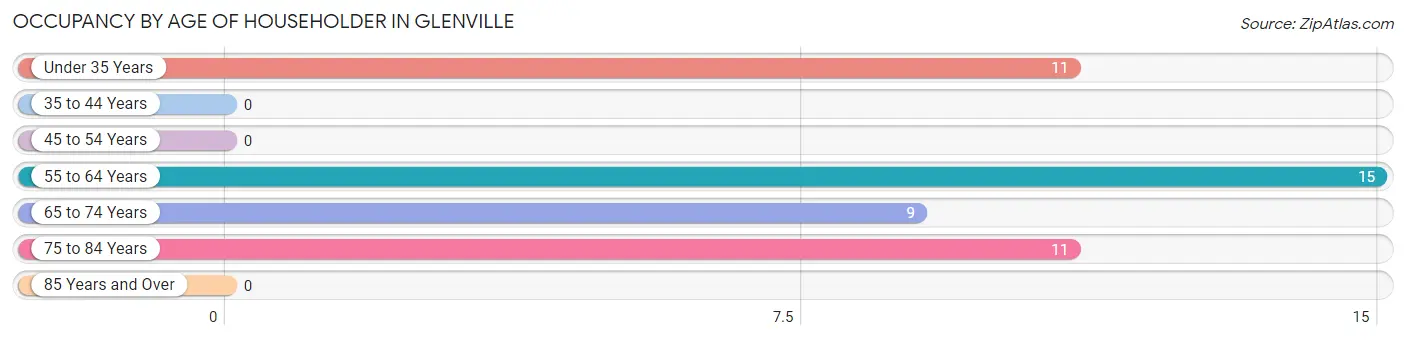
| Age Bracket | # Households | % Households |
| Under 35 Years | 11 | 23.9% |
| 35 to 44 Years | 0 | 0.0% |
| 45 to 54 Years | 0 | 0.0% |
| 55 to 64 Years | 15 | 32.6% |
| 65 to 74 Years | 9 | 19.6% |
| 75 to 84 Years | 11 | 23.9% |
| 85 Years and Over | 0 | 0.0% |
| Total | 46 | 100.0% |
Housing Finances in Glenville
Median Income by Occupancy in Glenville
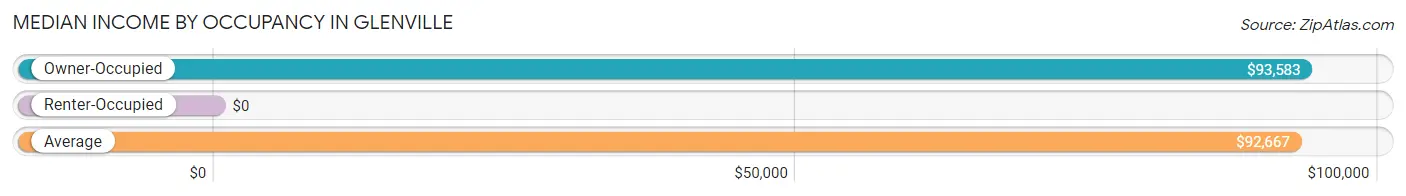
| Occupancy Type | # Households | Median Income |
| Owner-Occupied | 35 (76.1%) | $93,583 |
| Renter-Occupied | 11 (23.9%) | $0 |
| Average | 46 (100.0%) | $92,667 |
Occupancy by Householder Income Bracket in Glenville
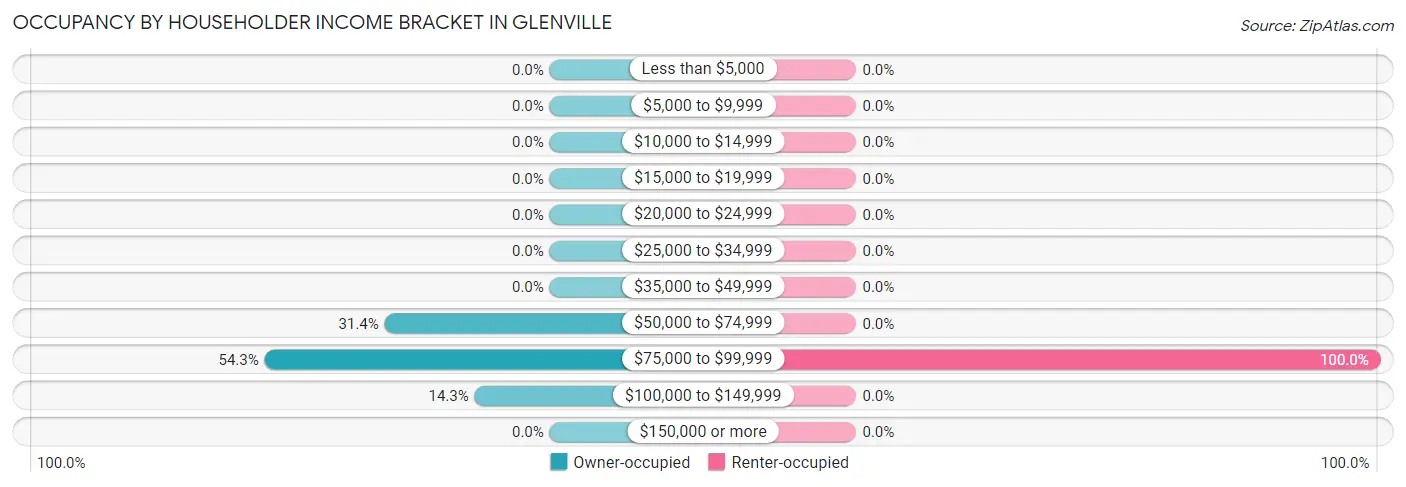
| Income Bracket | Owner-occupied | Renter-occupied |
| Less than $5,000 | 0 (0.0%) | 0 (0.0%) |
| $5,000 to $9,999 | 0 (0.0%) | 0 (0.0%) |
| $10,000 to $14,999 | 0 (0.0%) | 0 (0.0%) |
| $15,000 to $19,999 | 0 (0.0%) | 0 (0.0%) |
| $20,000 to $24,999 | 0 (0.0%) | 0 (0.0%) |
| $25,000 to $34,999 | 0 (0.0%) | 0 (0.0%) |
| $35,000 to $49,999 | 0 (0.0%) | 0 (0.0%) |
| $50,000 to $74,999 | 11 (31.4%) | 0 (0.0%) |
| $75,000 to $99,999 | 19 (54.3%) | 11 (100.0%) |
| $100,000 to $149,999 | 5 (14.3%) | 0 (0.0%) |
| $150,000 or more | 0 (0.0%) | 0 (0.0%) |
| Total | 35 (100.0%) | 11 (100.0%) |
Monthly Housing Cost Tiers in Glenville
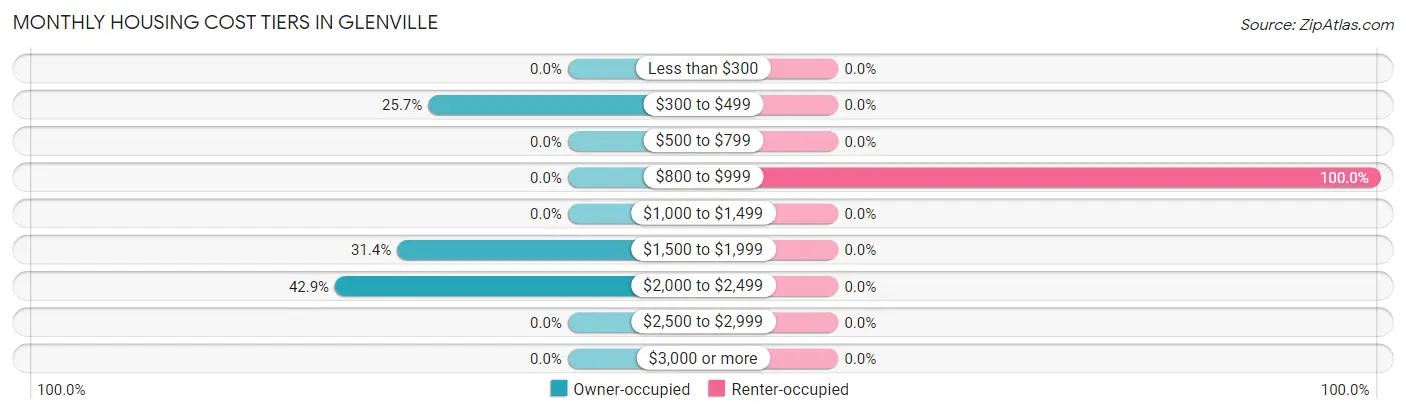
| Monthly Cost | Owner-occupied | Renter-occupied |
| Less than $300 | 0 (0.0%) | 0 (0.0%) |
| $300 to $499 | 9 (25.7%) | 0 (0.0%) |
| $500 to $799 | 0 (0.0%) | 0 (0.0%) |
| $800 to $999 | 0 (0.0%) | 11 (100.0%) |
| $1,000 to $1,499 | 0 (0.0%) | 0 (0.0%) |
| $1,500 to $1,999 | 11 (31.4%) | 0 (0.0%) |
| $2,000 to $2,499 | 15 (42.9%) | 0 (0.0%) |
| $2,500 to $2,999 | 0 (0.0%) | 0 (0.0%) |
| $3,000 or more | 0 (0.0%) | 0 (0.0%) |
| Total | 35 (100.0%) | 11 (100.0%) |
Physical Housing Characteristics in Glenville
Housing Structures in Glenville
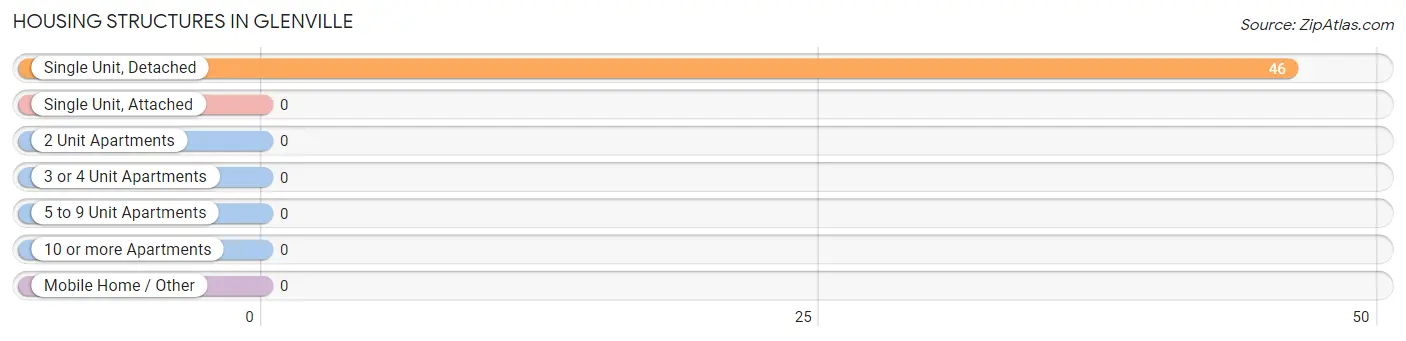
| Structure Type | # Housing Units | % Housing Units |
| Single Unit, Detached | 46 | 100.0% |
| Single Unit, Attached | 0 | 0.0% |
| 2 Unit Apartments | 0 | 0.0% |
| 3 or 4 Unit Apartments | 0 | 0.0% |
| 5 to 9 Unit Apartments | 0 | 0.0% |
| 10 or more Apartments | 0 | 0.0% |
| Mobile Home / Other | 0 | 0.0% |
| Total | 46 | 100.0% |
Housing Structures by Occupancy in Glenville
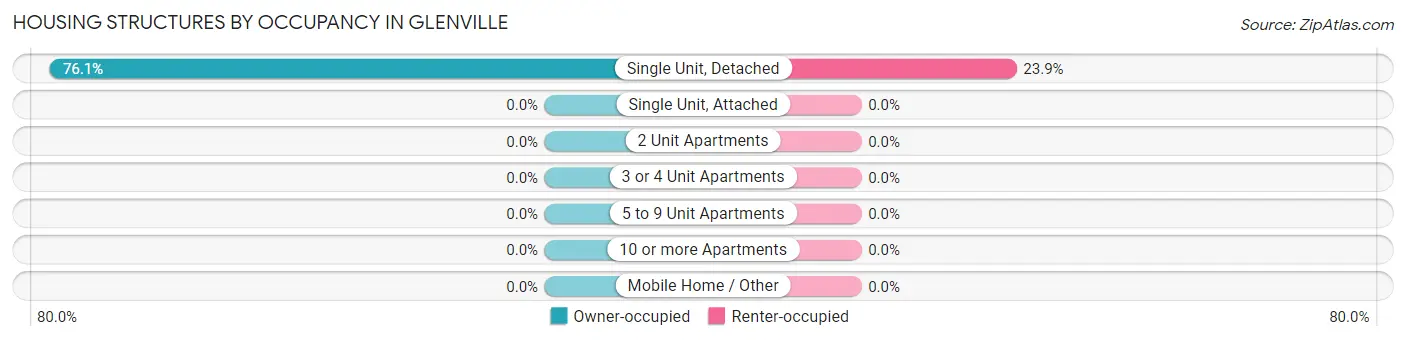
| Structure Type | Owner-occupied | Renter-occupied |
| Single Unit, Detached | 35 (76.1%) | 11 (23.9%) |
| Single Unit, Attached | 0 (0.0%) | 0 (0.0%) |
| 2 Unit Apartments | 0 (0.0%) | 0 (0.0%) |
| 3 or 4 Unit Apartments | 0 (0.0%) | 0 (0.0%) |
| 5 to 9 Unit Apartments | 0 (0.0%) | 0 (0.0%) |
| 10 or more Apartments | 0 (0.0%) | 0 (0.0%) |
| Mobile Home / Other | 0 (0.0%) | 0 (0.0%) |
| Total | 35 (76.1%) | 11 (23.9%) |
Housing Structures by Number of Rooms in Glenville
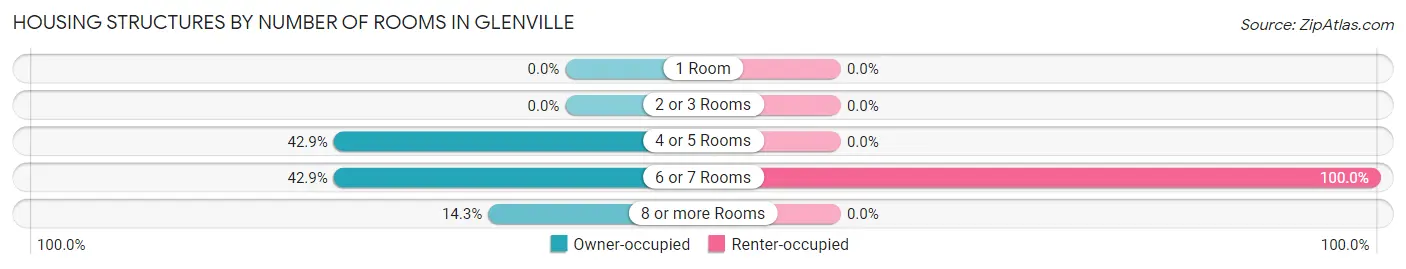
| Number of Rooms | Owner-occupied | Renter-occupied |
| 1 Room | 0 (0.0%) | 0 (0.0%) |
| 2 or 3 Rooms | 0 (0.0%) | 0 (0.0%) |
| 4 or 5 Rooms | 15 (42.9%) | 0 (0.0%) |
| 6 or 7 Rooms | 15 (42.9%) | 11 (100.0%) |
| 8 or more Rooms | 5 (14.3%) | 0 (0.0%) |
| Total | 35 (100.0%) | 11 (100.0%) |
Housing Structure by Heating Type in Glenville
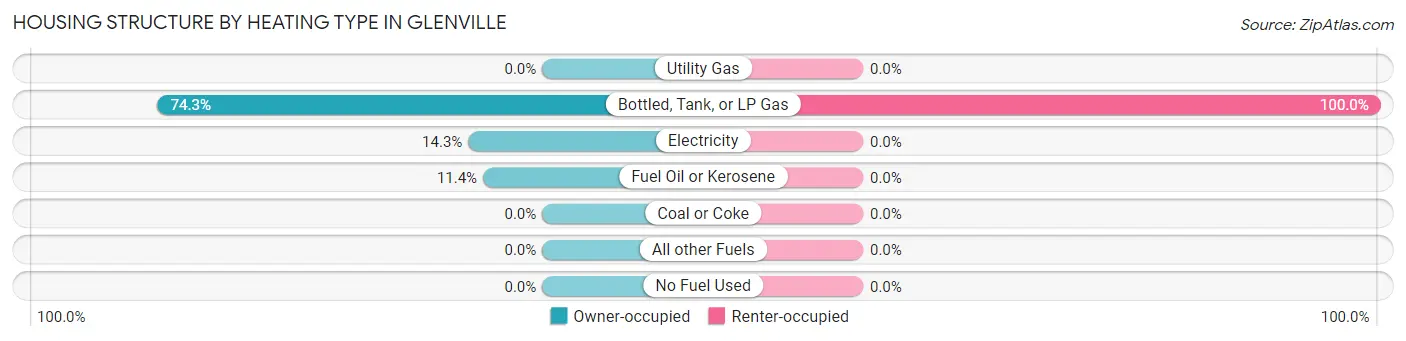
| Heating Type | Owner-occupied | Renter-occupied |
| Utility Gas | 0 (0.0%) | 0 (0.0%) |
| Bottled, Tank, or LP Gas | 26 (74.3%) | 11 (100.0%) |
| Electricity | 5 (14.3%) | 0 (0.0%) |
| Fuel Oil or Kerosene | 4 (11.4%) | 0 (0.0%) |
| Coal or Coke | 0 (0.0%) | 0 (0.0%) |
| All other Fuels | 0 (0.0%) | 0 (0.0%) |
| No Fuel Used | 0 (0.0%) | 0 (0.0%) |
| Total | 35 (100.0%) | 11 (100.0%) |
Household Vehicle Usage in Glenville
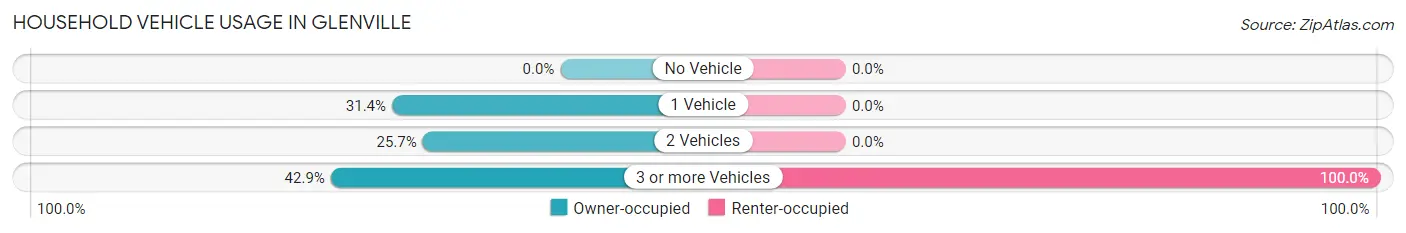
| Vehicles per Household | Owner-occupied | Renter-occupied |
| No Vehicle | 0 (0.0%) | 0 (0.0%) |
| 1 Vehicle | 11 (31.4%) | 0 (0.0%) |
| 2 Vehicles | 9 (25.7%) | 0 (0.0%) |
| 3 or more Vehicles | 15 (42.9%) | 11 (100.0%) |
| Total | 35 (100.0%) | 11 (100.0%) |
Real Estate & Mortgages in Glenville
Real Estate and Mortgage Overview in Glenville
| Characteristic | Without Mortgage | With Mortgage |
| Housing Units | 9 | 26 |
| Median Property Value | - | - |
| Median Household Income | - | - |
| Monthly Housing Costs | - | - |
| Real Estate Taxes | - | - |
Property Value by Mortgage Status in Glenville
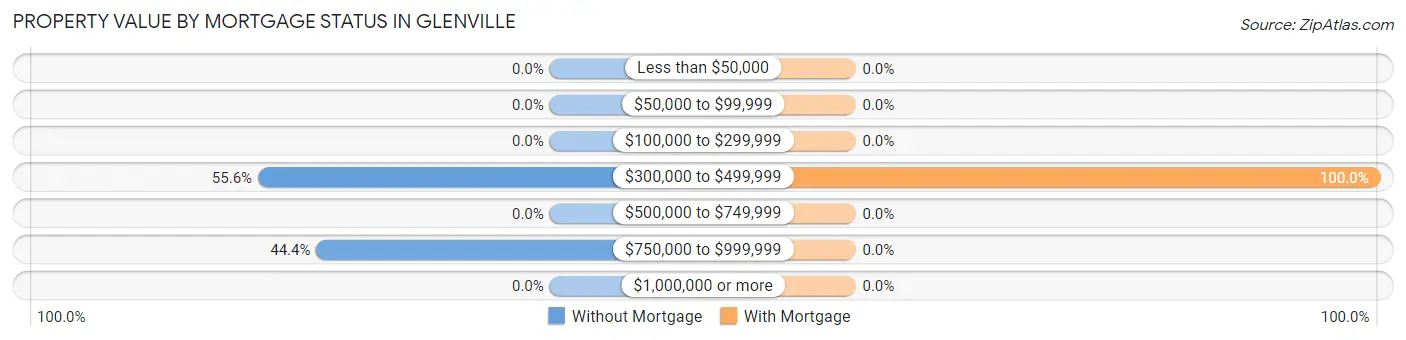
| Property Value | Without Mortgage | With Mortgage |
| Less than $50,000 | 0 (0.0%) | 0 (0.0%) |
| $50,000 to $99,999 | 0 (0.0%) | 0 (0.0%) |
| $100,000 to $299,999 | 0 (0.0%) | 0 (0.0%) |
| $300,000 to $499,999 | 5 (55.6%) | 26 (100.0%) |
| $500,000 to $749,999 | 0 (0.0%) | 0 (0.0%) |
| $750,000 to $999,999 | 4 (44.4%) | 0 (0.0%) |
| $1,000,000 or more | 0 (0.0%) | 0 (0.0%) |
| Total | 9 (100.0%) | 26 (100.0%) |
Household Income by Mortgage Status in Glenville
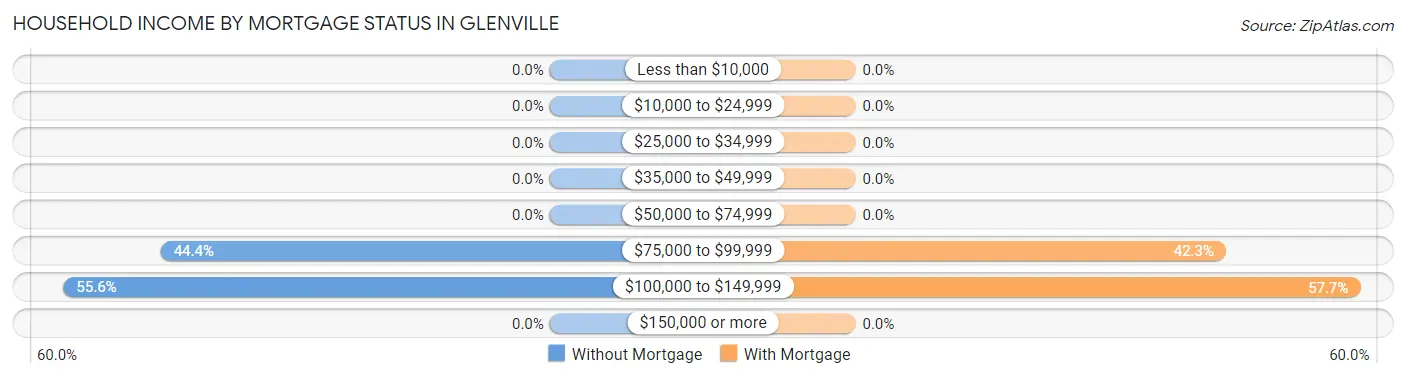
| Household Income | Without Mortgage | With Mortgage |
| Less than $10,000 | 0 (0.0%) | 0 (0.0%) |
| $10,000 to $24,999 | 0 (0.0%) | 0 (0.0%) |
| $25,000 to $34,999 | 0 (0.0%) | 0 (0.0%) |
| $35,000 to $49,999 | 0 (0.0%) | 0 (0.0%) |
| $50,000 to $74,999 | 0 (0.0%) | 0 (0.0%) |
| $75,000 to $99,999 | 4 (44.4%) | 11 (42.3%) |
| $100,000 to $149,999 | 5 (55.6%) | 15 (57.7%) |
| $150,000 or more | 0 (0.0%) | 0 (0.0%) |
| Total | 9 (100.0%) | 26 (100.0%) |
Property Value to Household Income Ratio in Glenville
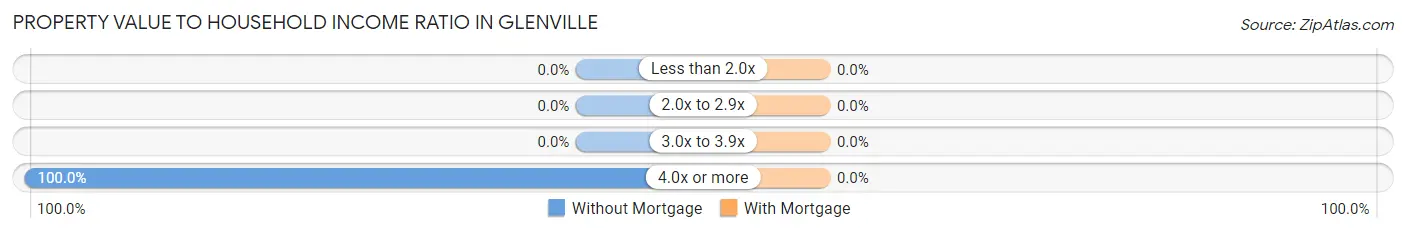
| Value-to-Income Ratio | Without Mortgage | With Mortgage |
| Less than 2.0x | 0 (0.0%) | 0 (0.0%) |
| 2.0x to 2.9x | 0 (0.0%) | 0 (0.0%) |
| 3.0x to 3.9x | 0 (0.0%) | 0 (0.0%) |
| 4.0x or more | 9 (100.0%) | 0 (0.0%) |
| Total | 9 (100.0%) | 26 (100.0%) |
Real Estate Taxes by Mortgage Status in Glenville
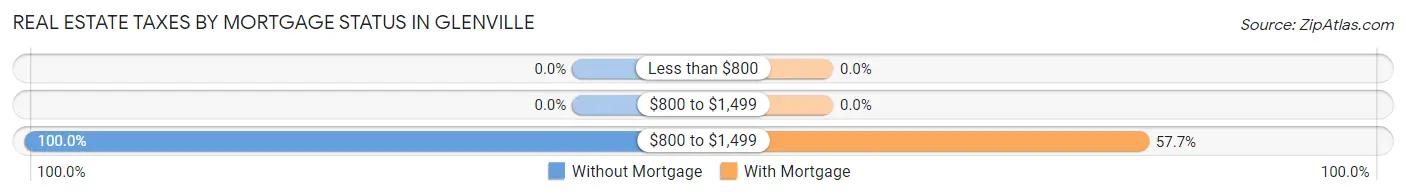
| Property Taxes | Without Mortgage | With Mortgage |
| Less than $800 | 0 (0.0%) | 0 (0.0%) |
| $800 to $1,499 | 0 (0.0%) | 0 (0.0%) |
| $800 to $1,499 | 9 (100.0%) | 15 (57.7%) |
| Total | 9 (100.0%) | 26 (100.0%) |
Health & Disability in Glenville
Health Insurance Coverage by Age in Glenville
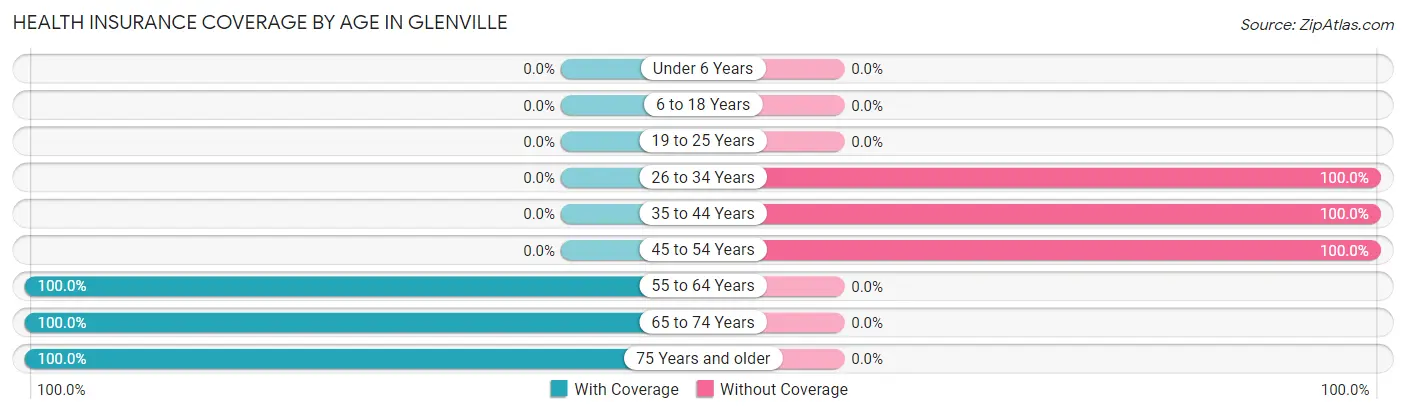
| Age Bracket | With Coverage | Without Coverage |
| Under 6 Years | 0 (0.0%) | 0 (0.0%) |
| 6 to 18 Years | 0 (0.0%) | 0 (0.0%) |
| 19 to 25 Years | 0 (0.0%) | 0 (0.0%) |
| 26 to 34 Years | 0 (0.0%) | 11 (100.0%) |
| 35 to 44 Years | 0 (0.0%) | 11 (100.0%) |
| 45 to 54 Years | 0 (0.0%) | 25 (100.0%) |
| 55 to 64 Years | 40 (100.0%) | 0 (0.0%) |
| 65 to 74 Years | 14 (100.0%) | 0 (0.0%) |
| 75 Years and older | 35 (100.0%) | 0 (0.0%) |
| Total | 89 (65.4%) | 47 (34.6%) |
Health Insurance Coverage by Citizenship Status in Glenville
| Citizenship Status | With Coverage | Without Coverage |
| Native Born | 0 (0.0%) | 0 (0.0%) |
| Foreign Born, Citizen | 0 (0.0%) | 0 (0.0%) |
| Foreign Born, not a Citizen | 0 (0.0%) | 0 (0.0%) |
Health Insurance Coverage by Household Income in Glenville
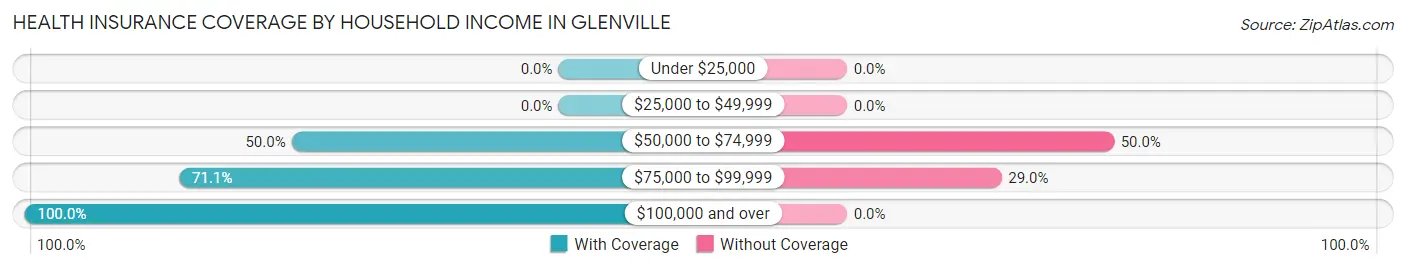
| Household Income | With Coverage | Without Coverage |
| Under $25,000 | 0 (0.0%) | 0 (0.0%) |
| $25,000 to $49,999 | 0 (0.0%) | 0 (0.0%) |
| $50,000 to $74,999 | 25 (50.0%) | 25 (50.0%) |
| $75,000 to $99,999 | 54 (71.1%) | 22 (28.9%) |
| $100,000 and over | 10 (100.0%) | 0 (0.0%) |
Public vs Private Health Insurance Coverage by Age in Glenville
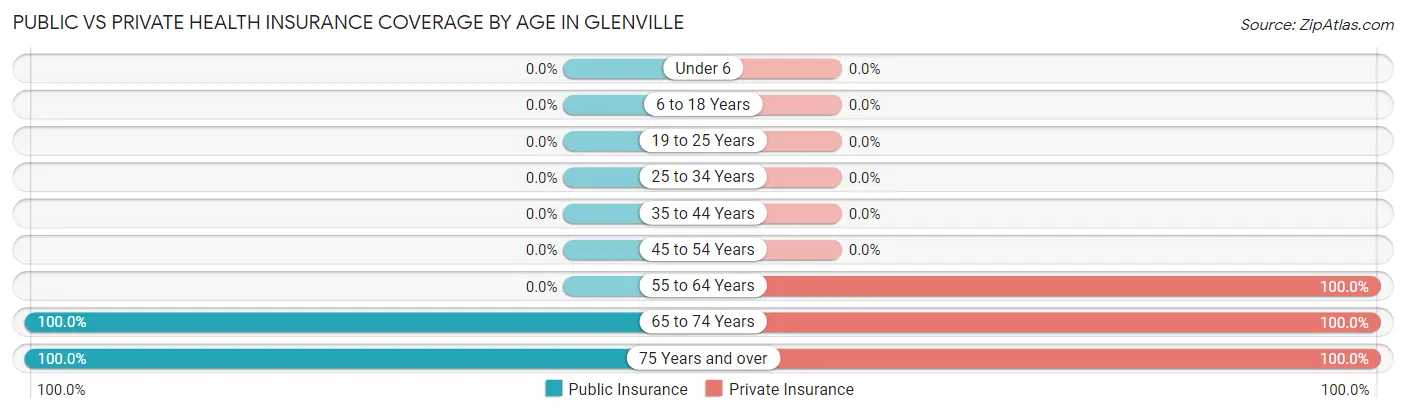
| Age Bracket | Public Insurance | Private Insurance |
| Under 6 | 0 (0.0%) | 0 (0.0%) |
| 6 to 18 Years | 0 (0.0%) | 0 (0.0%) |
| 19 to 25 Years | 0 (0.0%) | 0 (0.0%) |
| 25 to 34 Years | 0 (0.0%) | 0 (0.0%) |
| 35 to 44 Years | 0 (0.0%) | 0 (0.0%) |
| 45 to 54 Years | 0 (0.0%) | 0 (0.0%) |
| 55 to 64 Years | 0 (0.0%) | 40 (100.0%) |
| 65 to 74 Years | 14 (100.0%) | 14 (100.0%) |
| 75 Years and over | 35 (100.0%) | 35 (100.0%) |
| Total | 49 (36.0%) | 89 (65.4%) |
Disability Status by Sex by Age in Glenville
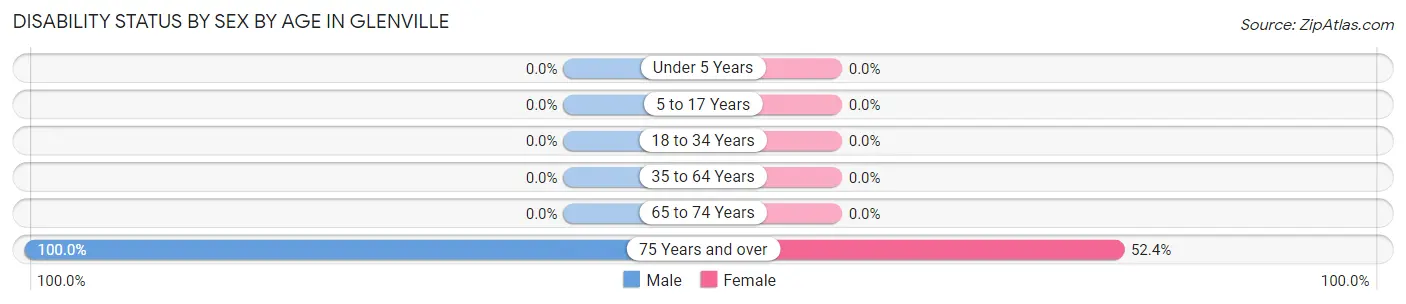
| Age Bracket | Male | Female |
| Under 5 Years | 0 (0.0%) | 0 (0.0%) |
| 5 to 17 Years | 0 (0.0%) | 0 (0.0%) |
| 18 to 34 Years | 0 (0.0%) | 0 (0.0%) |
| 35 to 64 Years | 0 (0.0%) | 0 (0.0%) |
| 65 to 74 Years | 0 (0.0%) | 0 (0.0%) |
| 75 Years and over | 14 (100.0%) | 11 (52.4%) |
Disability Class by Sex by Age in Glenville
Disability Class: Hearing Difficulty
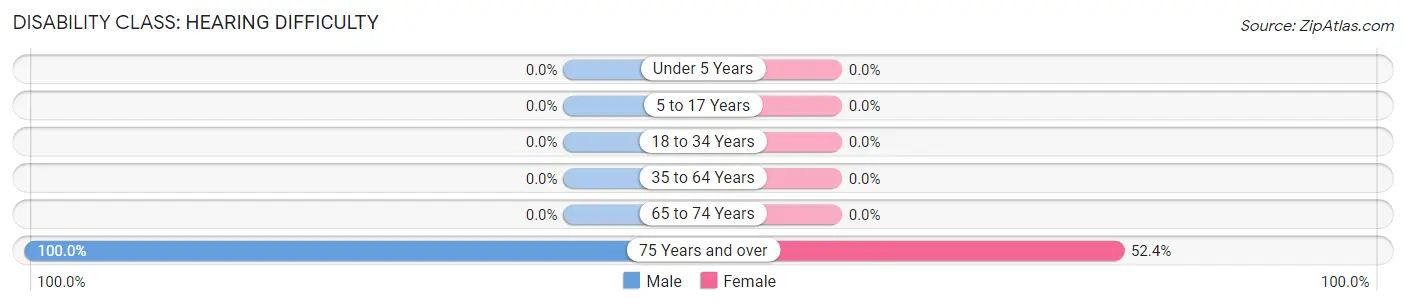
| Age Bracket | Male | Female |
| Under 5 Years | 0 (0.0%) | 0 (0.0%) |
| 5 to 17 Years | 0 (0.0%) | 0 (0.0%) |
| 18 to 34 Years | 0 (0.0%) | 0 (0.0%) |
| 35 to 64 Years | 0 (0.0%) | 0 (0.0%) |
| 65 to 74 Years | 0 (0.0%) | 0 (0.0%) |
| 75 Years and over | 14 (100.0%) | 11 (52.4%) |
Disability Class: Vision Difficulty
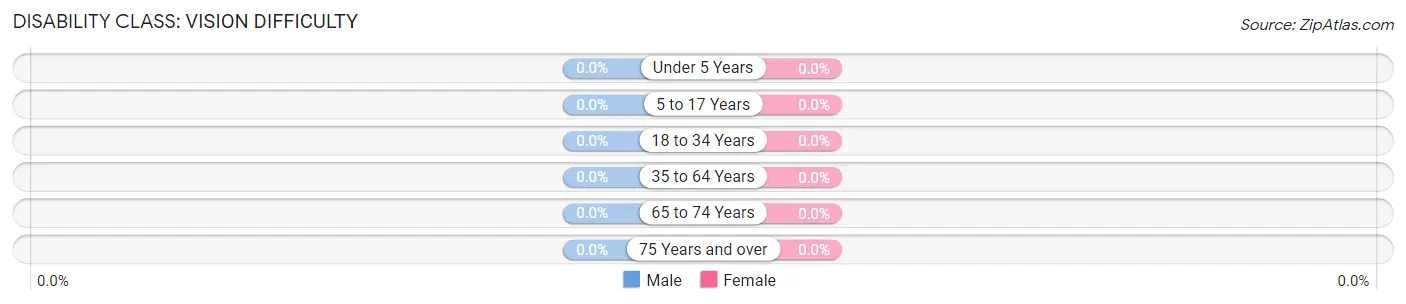
| Age Bracket | Male | Female |
| Under 5 Years | 0 (0.0%) | 0 (0.0%) |
| 5 to 17 Years | 0 (0.0%) | 0 (0.0%) |
| 18 to 34 Years | 0 (0.0%) | 0 (0.0%) |
| 35 to 64 Years | 0 (0.0%) | 0 (0.0%) |
| 65 to 74 Years | 0 (0.0%) | 0 (0.0%) |
| 75 Years and over | 0 (0.0%) | 0 (0.0%) |
Disability Class: Cognitive Difficulty
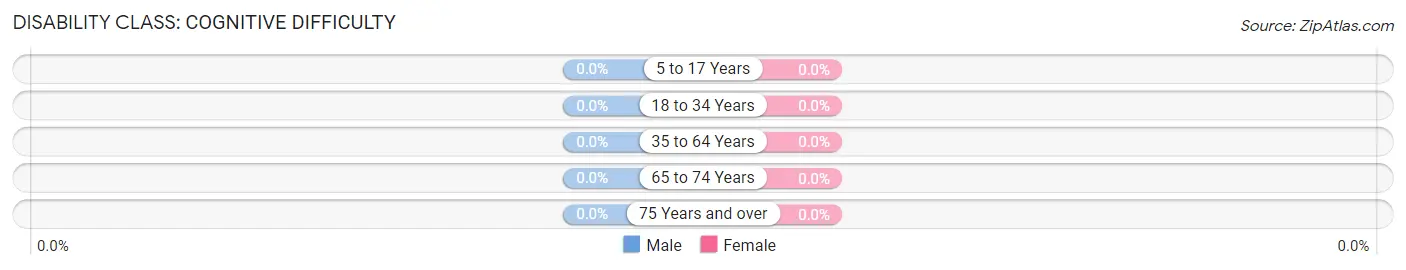
| Age Bracket | Male | Female |
| 5 to 17 Years | 0 (0.0%) | 0 (0.0%) |
| 18 to 34 Years | 0 (0.0%) | 0 (0.0%) |
| 35 to 64 Years | 0 (0.0%) | 0 (0.0%) |
| 65 to 74 Years | 0 (0.0%) | 0 (0.0%) |
| 75 Years and over | 0 (0.0%) | 0 (0.0%) |
Disability Class: Ambulatory Difficulty
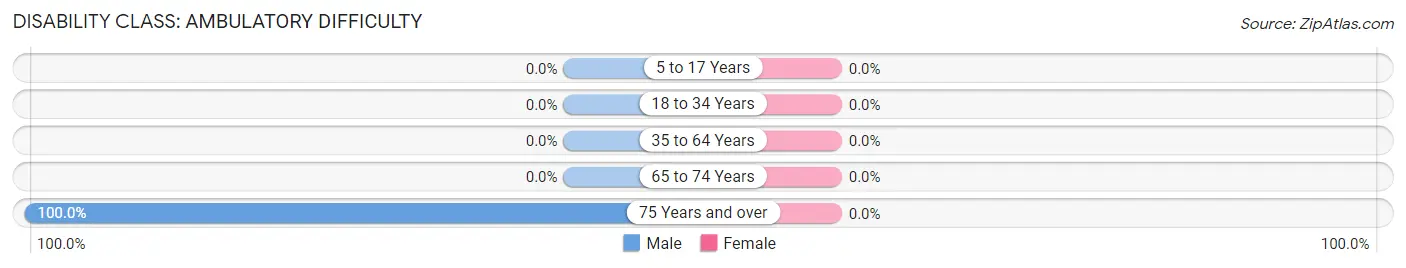
| Age Bracket | Male | Female |
| 5 to 17 Years | 0 (0.0%) | 0 (0.0%) |
| 18 to 34 Years | 0 (0.0%) | 0 (0.0%) |
| 35 to 64 Years | 0 (0.0%) | 0 (0.0%) |
| 65 to 74 Years | 0 (0.0%) | 0 (0.0%) |
| 75 Years and over | 14 (100.0%) | 0 (0.0%) |
Disability Class: Self-Care Difficulty
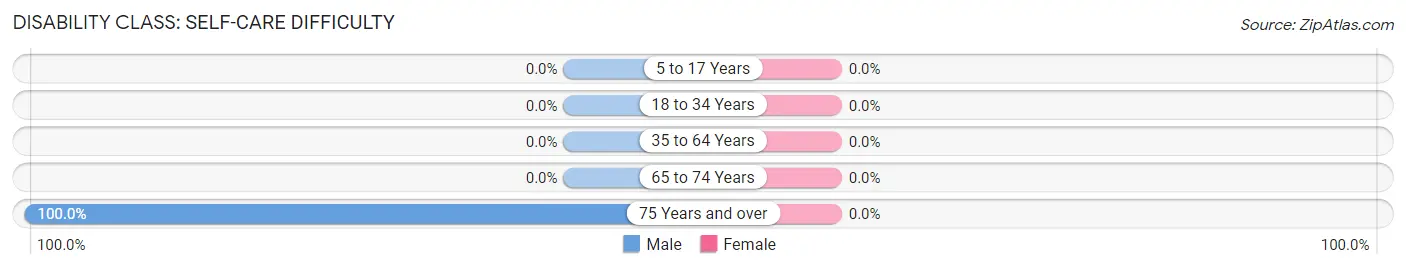
| Age Bracket | Male | Female |
| 5 to 17 Years | 0 (0.0%) | 0 (0.0%) |
| 18 to 34 Years | 0 (0.0%) | 0 (0.0%) |
| 35 to 64 Years | 0 (0.0%) | 0 (0.0%) |
| 65 to 74 Years | 0 (0.0%) | 0 (0.0%) |
| 75 Years and over | 14 (100.0%) | 0 (0.0%) |
Technology Access in Glenville
Computing Device Access in Glenville
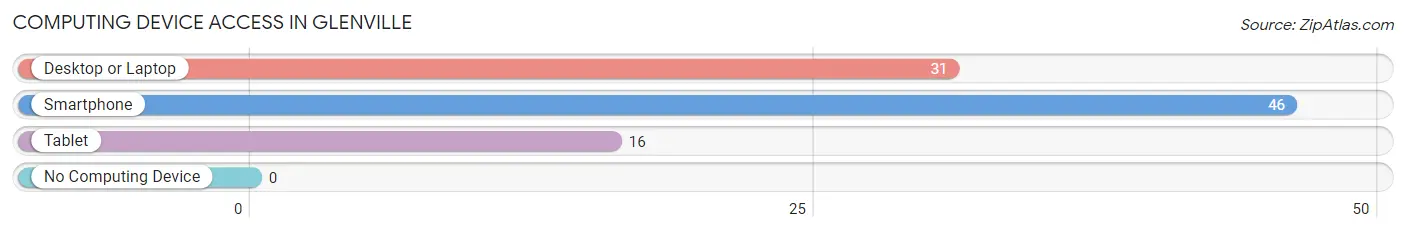
| Device Type | # Households | % Households |
| Desktop or Laptop | 31 | 67.4% |
| Smartphone | 46 | 100.0% |
| Tablet | 16 | 34.8% |
| No Computing Device | 0 | 0.0% |
| Total | 46 | 100.0% |
Internet Access in Glenville
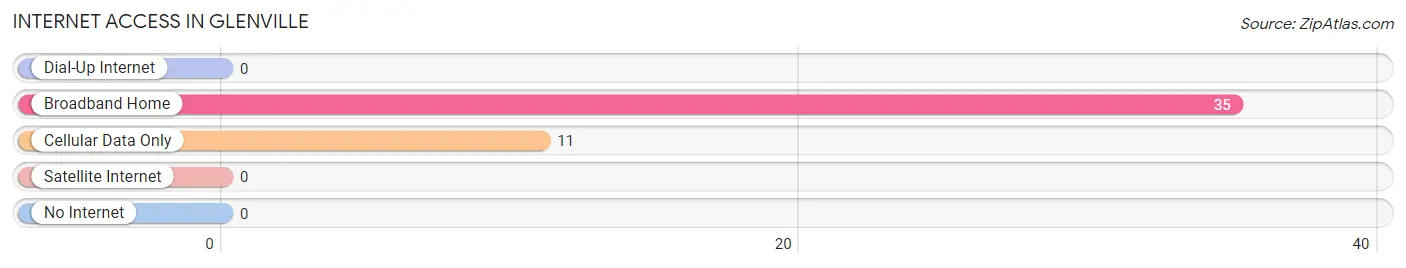
| Internet Type | # Households | % Households |
| Dial-Up Internet | 0 | 0.0% |
| Broadband Home | 35 | 76.1% |
| Cellular Data Only | 11 | 23.9% |
| Satellite Internet | 0 | 0.0% |
| No Internet | 0 | 0.0% |
| Total | 46 | 100.0% |
Glenville Summary
Glenville is a small town located in the western part of North Carolina, in the United States. It is situated in the foothills of the Blue Ridge Mountains, and is part of the larger region known as the Appalachian Mountains. The town is located in the county of Jackson, and is part of the larger Asheville metropolitan area. The town has a population of approximately 1,000 people, and is a popular tourist destination due to its proximity to the Great Smoky Mountains National Park.
Geography
Glenville is located in the western part of North Carolina, in the foothills of the Blue Ridge Mountains. The town is situated in the county of Jackson, and is part of the larger Asheville metropolitan area. The town is located at an elevation of 1,400 feet, and is surrounded by the Nantahala National Forest. The town is located near the Tuckasegee River, which is a popular destination for fishing and rafting. The town is also located near the Great Smoky Mountains National Park, which is a popular tourist destination.
Climate
Glenville has a humid subtropical climate, with hot summers and mild winters. The average temperature in the summer months is around 80 degrees Fahrenheit, and the average temperature in the winter months is around 40 degrees Fahrenheit. The town receives an average of 45 inches of precipitation per year, with most of the precipitation occurring in the summer months.
Demographics
As of the 2010 census, the population of Glenville was 1,000 people. The racial makeup of the town was 97.2% White, 0.7% African American, 0.3% Native American, 0.2% Asian, 0.1% Pacific Islander, and 1.5% from other races. The median household income in the town was $30,000, and the median age was 40 years.
Economy
The economy of Glenville is largely based on tourism, as the town is located near the Great Smoky Mountains National Park. The town is also home to several small businesses, including restaurants, shops, and lodging. The town is also home to a number of farms, which produce a variety of crops, including corn, soybeans, and hay.
History
Glenville was first settled in the early 1800s by settlers from Scotland and Ireland. The town was originally known as “Glenville”, and was named after the nearby Glenville Creek. The town was incorporated in 1891, and the first post office was established in 1892. The town grew steadily throughout the 20th century, and today is a popular tourist destination due to its proximity to the Great Smoky Mountains National Park.
Common Questions
What is Per Capita Income in Glenville?
Per Capita income in Glenville is $36,657.
What is the Median Family Income in Glenville?
Median Family Income in Glenville is $92,667.
What is the Median Household income in Glenville?
Median Household Income in Glenville is $92,667.
What is Income or Wage Gap in Glenville?
Income or Wage Gap in Glenville is 29.8%.
Women in Glenville earn 70.2 cents for every dollar earned by a man.
What is Inequality or Gini Index in Glenville?
Inequality or Gini Index in Glenville is 0.10.
What is the Total Population of Glenville?
Total Population of Glenville is 136.
What is the Total Male Population of Glenville?
Total Male Population of Glenville is 49.
What is the Total Female Population of Glenville?
Total Female Population of Glenville is 87.
What is the Ratio of Males per 100 Females in Glenville?
There are 56.32 Males per 100 Females in Glenville.
What is the Ratio of Females per 100 Males in Glenville?
There are 177.55 Females per 100 Males in Glenville.
What is the Median Population Age in Glenville?
Median Population Age in Glenville is 59.2 Years.
What is the Average Family Size in Glenville
Average Family Size in Glenville is 3.0 People.
What is the Average Household Size in Glenville
Average Household Size in Glenville is 3.0 People.
How Large is the Labor Force in Glenville?
There are 73 People in the Labor Forcein in Glenville.
What is the Percentage of People in the Labor Force in Glenville?
53.7% of People are in the Labor Force in Glenville.