Advance, NC Map & Demographics
Advance Map
Advance Overview
$29,995
PER CAPITA INCOME
$112,500
AVG FAMILY INCOME
$91,528
AVG HOUSEHOLD INCOME
29.7%
WAGE / INCOME GAP [ % ]
70.3¢/ $1
WAGE / INCOME GAP [ $ ]
0.33
INEQUALITY / GINI INDEX
1,605
TOTAL POPULATION
752
MALE POPULATION
853
FEMALE POPULATION
88.16
MALES / 100 FEMALES
113.43
FEMALES / 100 MALES
39.3
MEDIAN AGE
3.7
AVG FAMILY SIZE
3.2
AVG HOUSEHOLD SIZE
673
LABOR FORCE [ PEOPLE ]
62.3%
PERCENT IN LABOR FORCE
Advance Zip Codes
Advance Area Codes
Income in Advance
Income Overview in Advance
Per Capita Income in Advance is $29,995, while median incomes of families and households are $112,500 and $91,528 respectively.
| Characteristic | Number | Measure |
| Per Capita Income | 1,605 | $29,995 |
| Median Family Income | 386 | $112,500 |
| Mean Family Income | 386 | $105,343 |
| Median Household Income | 508 | $91,528 |
| Mean Household Income | 508 | $94,957 |
| Income Deficit | 386 | $0 |
| Wage / Income Gap (%) | 1,605 | 29.66% |
| Wage / Income Gap ($) | 1,605 | 70.34¢ per $1 |
| Gini / Inequality Index | 1,605 | 0.33 |
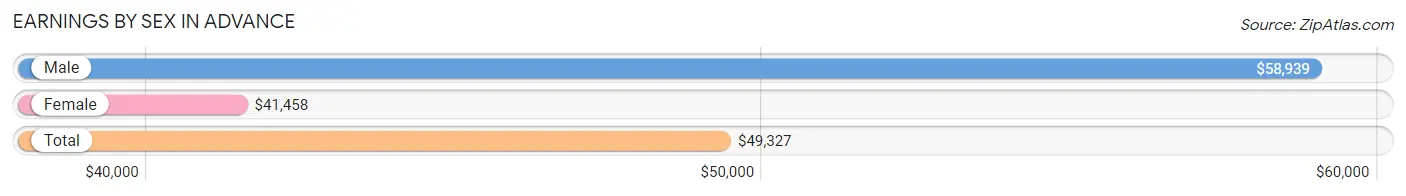
Earnings by Sex in Advance
Average Earnings in Advance are $49,327, $58,939 for men and $41,458 for women, a difference of 29.7%.
| Sex | Number | Average Earnings |
| Male | 375 (51.8%) | $58,939 |
| Female | 349 (48.2%) | $41,458 |
| Total | 724 (100.0%) | $49,327 |
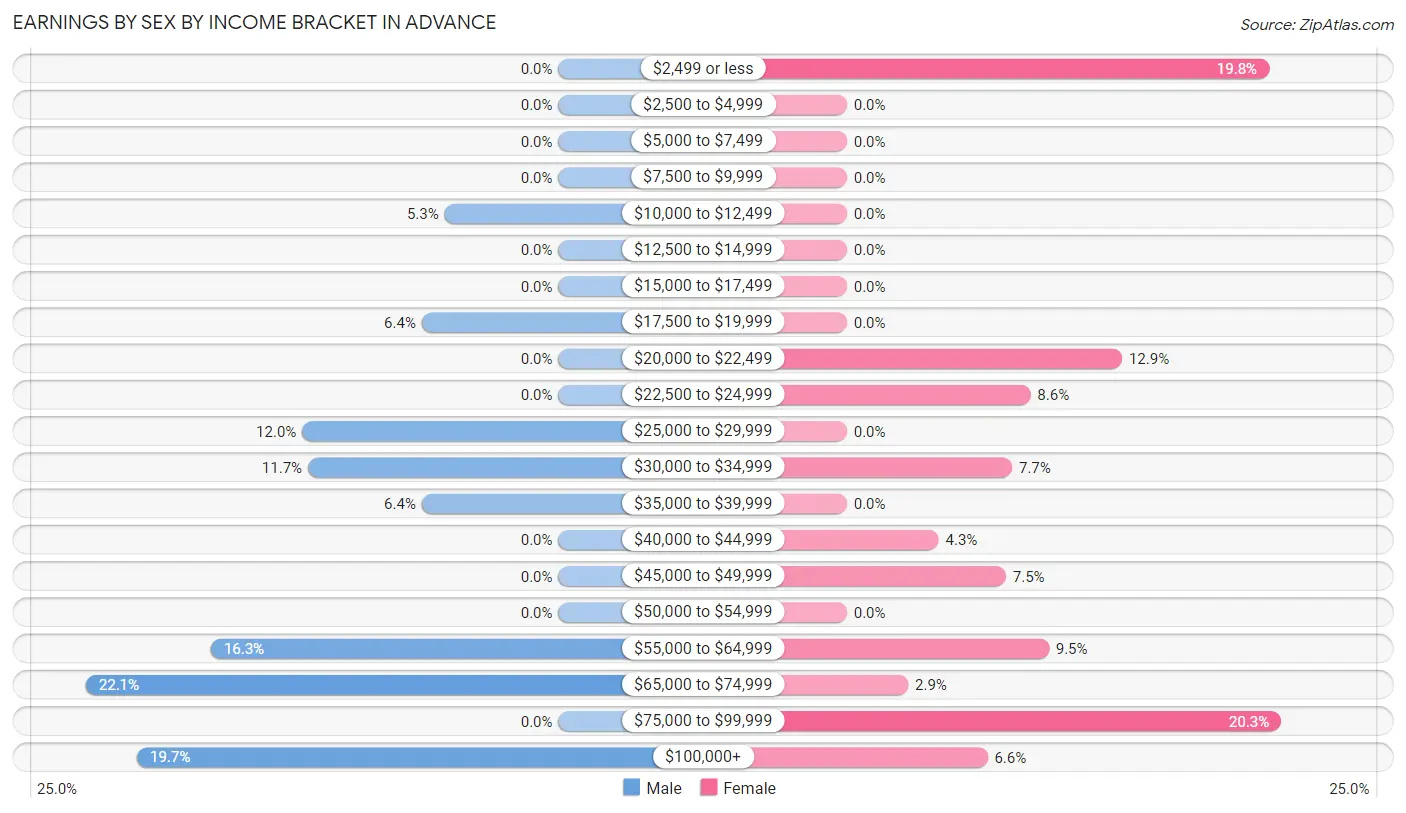
Earnings by Sex by Income Bracket in Advance
The most common earnings brackets in Advance are $65,000 to $74,999 for men (83 | 22.1%) and $75,000 to $99,999 for women (71 | 20.3%).
| Income | Male | Female |
| $2,499 or less | 0 (0.0%) | 69 (19.8%) |
| $2,500 to $4,999 | 0 (0.0%) | 0 (0.0%) |
| $5,000 to $7,499 | 0 (0.0%) | 0 (0.0%) |
| $7,500 to $9,999 | 0 (0.0%) | 0 (0.0%) |
| $10,000 to $12,499 | 20 (5.3%) | 0 (0.0%) |
| $12,500 to $14,999 | 0 (0.0%) | 0 (0.0%) |
| $15,000 to $17,499 | 0 (0.0%) | 0 (0.0%) |
| $17,500 to $19,999 | 24 (6.4%) | 0 (0.0%) |
| $20,000 to $22,499 | 0 (0.0%) | 45 (12.9%) |
| $22,500 to $24,999 | 0 (0.0%) | 30 (8.6%) |
| $25,000 to $29,999 | 45 (12.0%) | 0 (0.0%) |
| $30,000 to $34,999 | 44 (11.7%) | 27 (7.7%) |
| $35,000 to $39,999 | 24 (6.4%) | 0 (0.0%) |
| $40,000 to $44,999 | 0 (0.0%) | 15 (4.3%) |
| $45,000 to $49,999 | 0 (0.0%) | 26 (7.4%) |
| $50,000 to $54,999 | 0 (0.0%) | 0 (0.0%) |
| $55,000 to $64,999 | 61 (16.3%) | 33 (9.5%) |
| $65,000 to $74,999 | 83 (22.1%) | 10 (2.9%) |
| $75,000 to $99,999 | 0 (0.0%) | 71 (20.3%) |
| $100,000+ | 74 (19.7%) | 23 (6.6%) |
| Total | 375 (100.0%) | 349 (100.0%) |
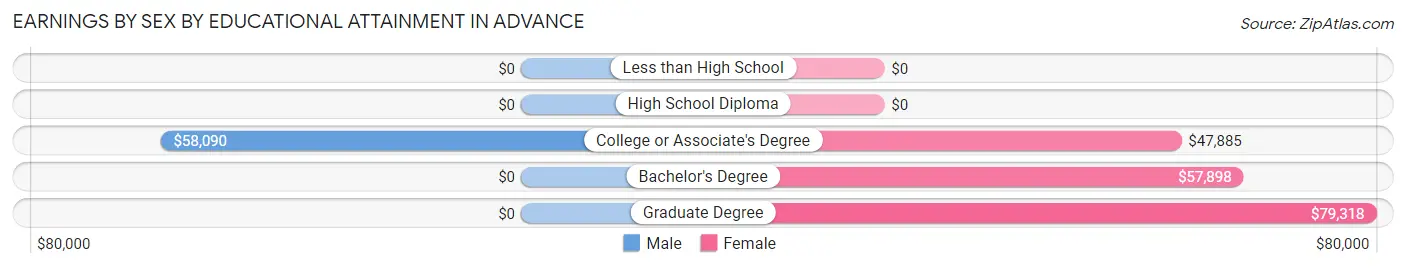
Earnings by Sex by Educational Attainment in Advance
Average earnings in Advance are $58,939 for men and $48,846 for women, a difference of 17.1%. Men with an educational attainment of college or associate's degree enjoy the highest average annual earnings of $58,090, while those with college or associate's degree education earn the least with $58,090. Women with an educational attainment of graduate degree earn the most with the average annual earnings of $79,318, while those with college or associate's degree education have the smallest earnings of $47,885.
| Educational Attainment | Male Income | Female Income |
| Less than High School | - | - |
| High School Diploma | - | - |
| College or Associate's Degree | $58,090 | $47,885 |
| Bachelor's Degree | - | - |
| Graduate Degree | - | - |
| Total | $58,939 | $48,846 |
Family Income in Advance
Family Income Brackets in Advance
According to the Advance family income data, there are 111 families falling into the $150,000 to $199,999 income range, which is the most common income bracket and makes up 28.8% of all families.
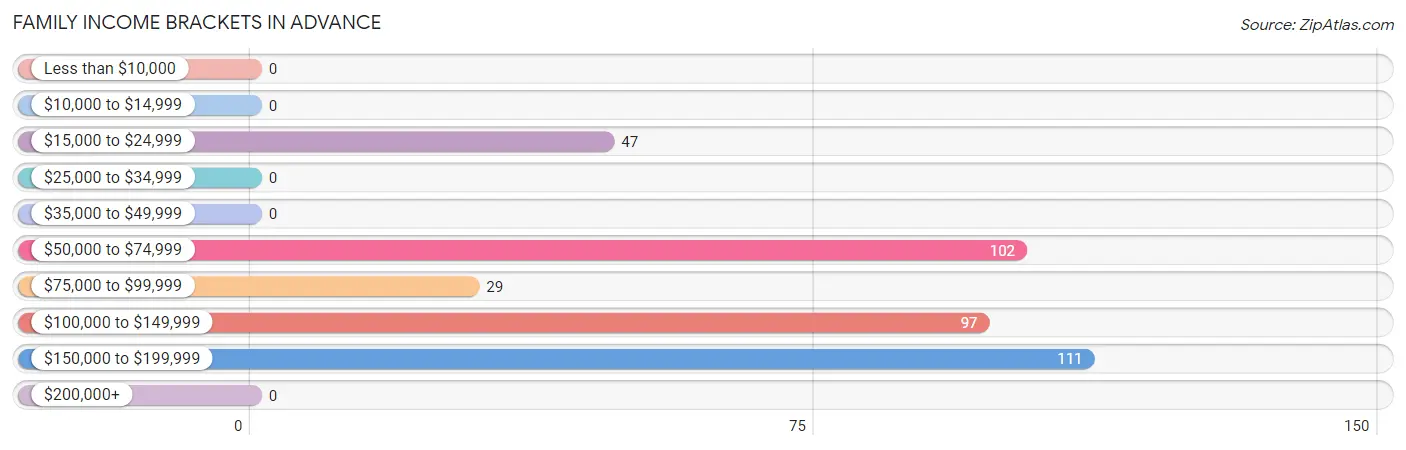
| Income Bracket | # Families | % Families |
| Less than $10,000 | 0 | 0.0% |
| $10,000 to $14,999 | 0 | 0.0% |
| $15,000 to $24,999 | 47 | 12.2% |
| $25,000 to $34,999 | 0 | 0.0% |
| $35,000 to $49,999 | 0 | 0.0% |
| $50,000 to $74,999 | 102 | 26.4% |
| $75,000 to $99,999 | 29 | 7.5% |
| $100,000 to $149,999 | 97 | 25.1% |
| $150,000 to $199,999 | 111 | 28.8% |
| $200,000+ | 0 | 0.0% |
Family Income by Famaliy Size in Advance
4-person families (96 | 24.9%) account for the highest median family income in Advance with $151,014 per family, while 2-person families (151 | 39.1%) have the highest median income of $57,597 per family member.
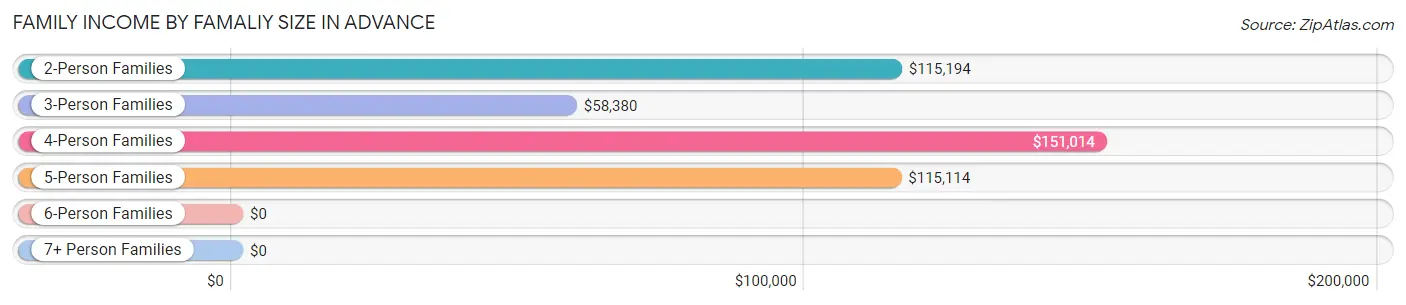
| Income Bracket | # Families | Median Income |
| 2-Person Families | 151 (39.1%) | $115,194 |
| 3-Person Families | 65 (16.8%) | $58,380 |
| 4-Person Families | 96 (24.9%) | $151,014 |
| 5-Person Families | 31 (8.0%) | $115,114 |
| 6-Person Families | 26 (6.7%) | $0 |
| 7+ Person Families | 17 (4.4%) | $0 |
| Total | 386 (100.0%) | $112,500 |
Family Income by Number of Earners in Advance
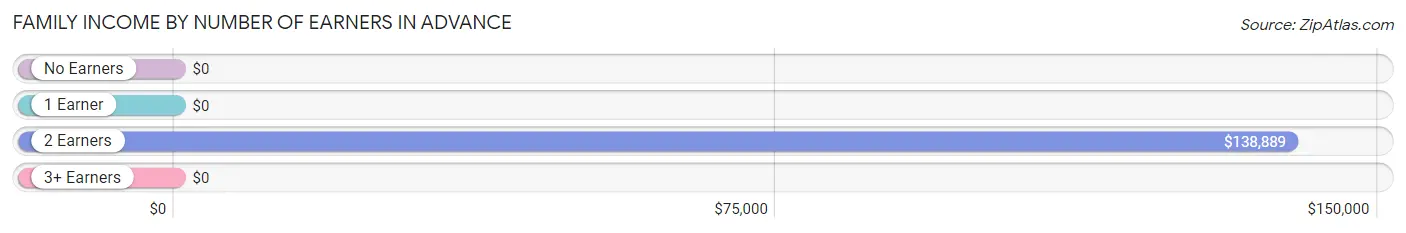
| Number of Earners | # Families | Median Income |
| No Earners | 37 (9.6%) | $0 |
| 1 Earner | 114 (29.5%) | $0 |
| 2 Earners | 220 (57.0%) | $138,889 |
| 3+ Earners | 15 (3.9%) | $0 |
| Total | 386 (100.0%) | $112,500 |
Household Income in Advance
Household Income Brackets in Advance
With 132 households falling in the category, the $50,000 to $74,999 income range is the most frequent in Advance, accounting for 26.0% of all households.
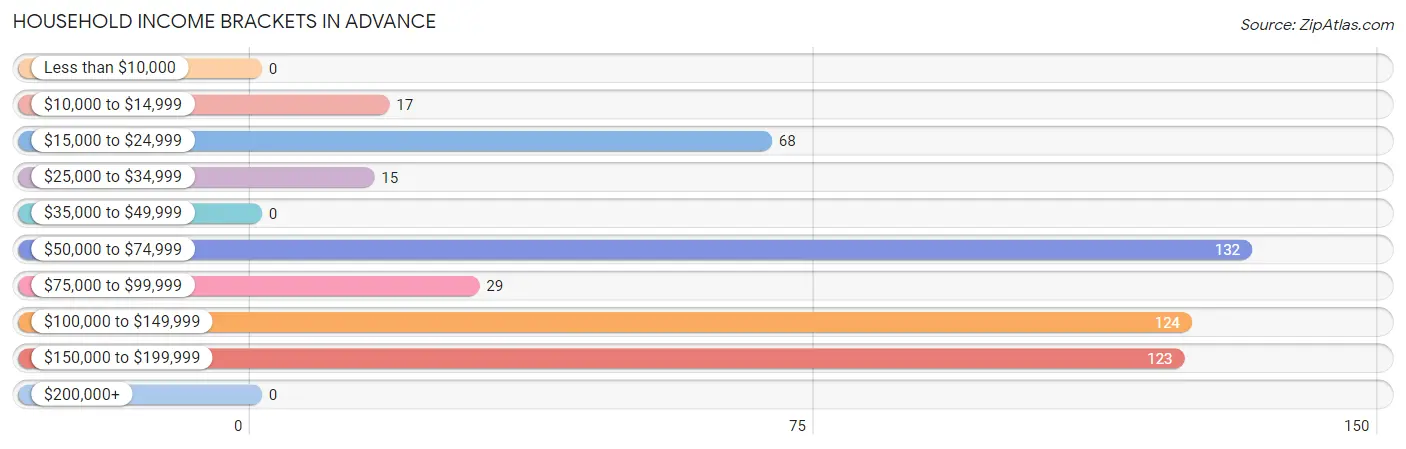
| Income Bracket | # Households | % Households |
| Less than $10,000 | 0 | 0.0% |
| $10,000 to $14,999 | 17 | 3.3% |
| $15,000 to $24,999 | 68 | 13.4% |
| $25,000 to $34,999 | 15 | 3.0% |
| $35,000 to $49,999 | 0 | 0.0% |
| $50,000 to $74,999 | 132 | 26.0% |
| $75,000 to $99,999 | 29 | 5.7% |
| $100,000 to $149,999 | 124 | 24.4% |
| $150,000 to $199,999 | 123 | 24.2% |
| $200,000+ | 0 | 0.0% |
Household Income by Householder Age in Advance
The median household income in Advance is $91,528, with the highest median household income of $109,833 found in the 25 to 44 years age bracket for the primary householder. A total of 164 households (32.3%) fall into this category.
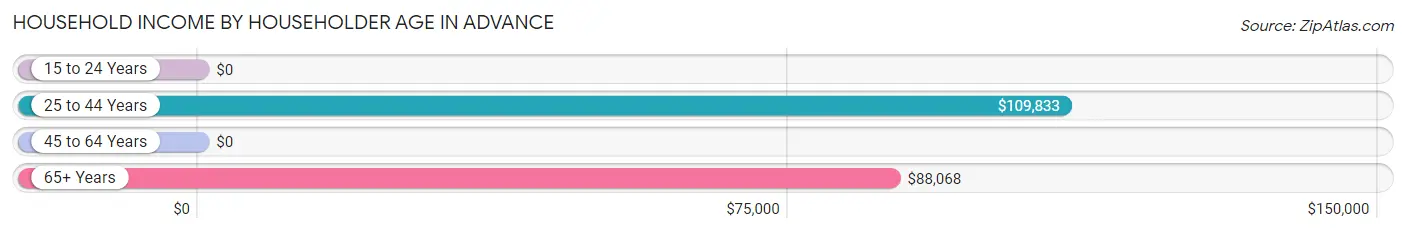
| Income Bracket | # Households | Median Income |
| 15 to 24 Years | 0 (0.0%) | $0 |
| 25 to 44 Years | 164 (32.3%) | $109,833 |
| 45 to 64 Years | 207 (40.7%) | $0 |
| 65+ Years | 137 (27.0%) | $88,068 |
| Total | 508 (100.0%) | $91,528 |
Poverty in Advance
Income Below Poverty by Sex and Age in Advance
With 3.2% poverty level for males and 20.5% for females among the residents of Advance, 45 to 54 year old males and 15 year old females are the most vulnerable to poverty, with 24 males (28.2%) and 24 females (100.0%) in their respective age groups living below the poverty level.
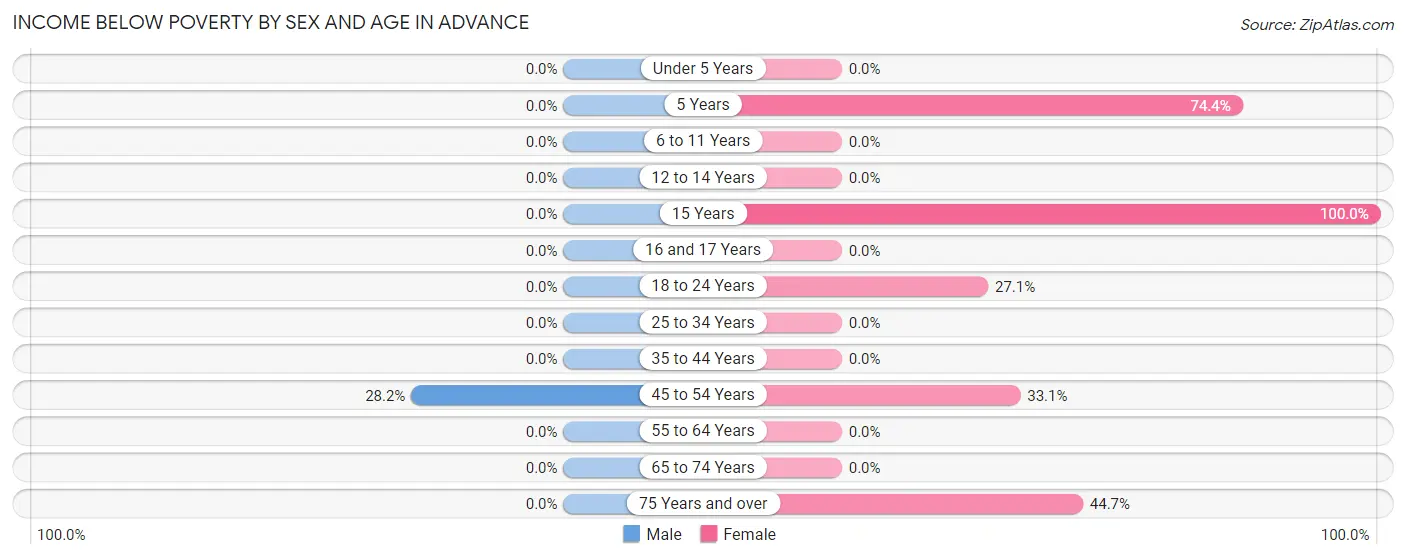
| Age Bracket | Male | Female |
| Under 5 Years | 0 (0.0%) | 0 (0.0%) |
| 5 Years | 0 (0.0%) | 61 (74.4%) |
| 6 to 11 Years | 0 (0.0%) | 0 (0.0%) |
| 12 to 14 Years | 0 (0.0%) | 0 (0.0%) |
| 15 Years | 0 (0.0%) | 24 (100.0%) |
| 16 and 17 Years | 0 (0.0%) | 0 (0.0%) |
| 18 to 24 Years | 0 (0.0%) | 19 (27.1%) |
| 25 to 34 Years | 0 (0.0%) | 0 (0.0%) |
| 35 to 44 Years | 0 (0.0%) | 0 (0.0%) |
| 45 to 54 Years | 24 (28.2%) | 54 (33.1%) |
| 55 to 64 Years | 0 (0.0%) | 0 (0.0%) |
| 65 to 74 Years | 0 (0.0%) | 0 (0.0%) |
| 75 Years and over | 0 (0.0%) | 17 (44.7%) |
| Total | 24 (3.2%) | 175 (20.5%) |
Income Above Poverty by Sex and Age in Advance
According to the poverty statistics in Advance, males aged under 5 years and females aged under 5 years are the age groups that are most secure financially, with 100.0% of males and 100.0% of females in these age groups living above the poverty line.
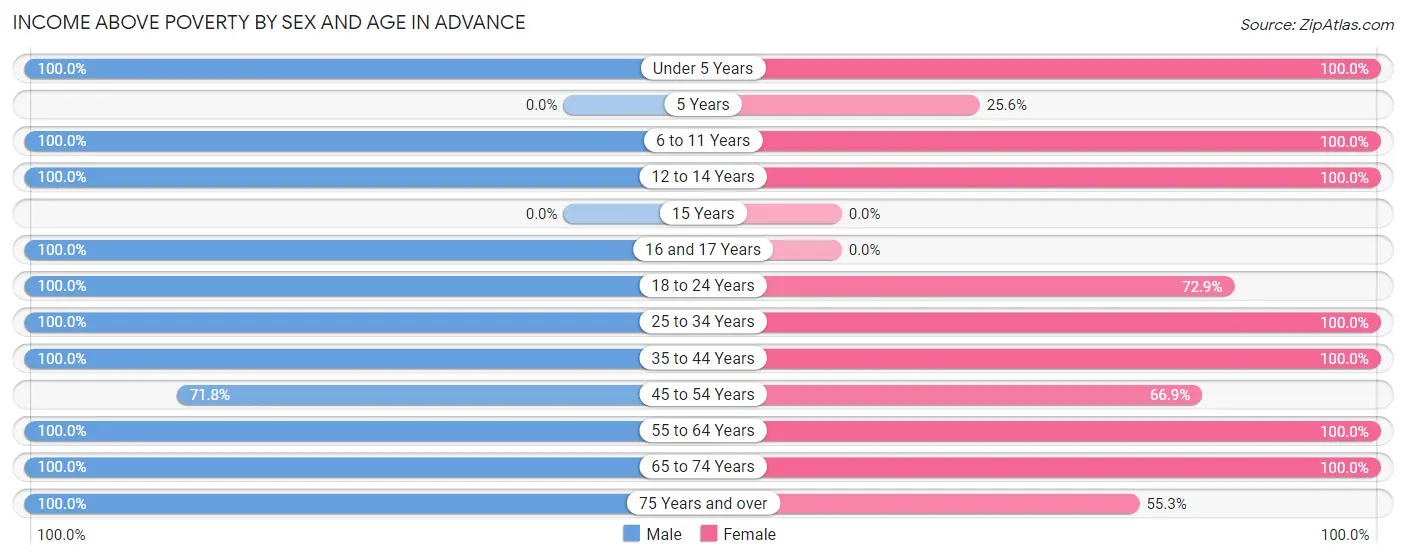
| Age Bracket | Male | Female |
| Under 5 Years | 59 (100.0%) | 72 (100.0%) |
| 5 Years | 0 (0.0%) | 21 (25.6%) |
| 6 to 11 Years | 109 (100.0%) | 94 (100.0%) |
| 12 to 14 Years | 45 (100.0%) | 39 (100.0%) |
| 15 Years | 0 (0.0%) | 0 (0.0%) |
| 16 and 17 Years | 34 (100.0%) | 0 (0.0%) |
| 18 to 24 Years | 33 (100.0%) | 51 (72.9%) |
| 25 to 34 Years | 50 (100.0%) | 41 (100.0%) |
| 35 to 44 Years | 107 (100.0%) | 78 (100.0%) |
| 45 to 54 Years | 61 (71.8%) | 109 (66.9%) |
| 55 to 64 Years | 105 (100.0%) | 128 (100.0%) |
| 65 to 74 Years | 83 (100.0%) | 24 (100.0%) |
| 75 Years and over | 42 (100.0%) | 21 (55.3%) |
| Total | 728 (96.8%) | 678 (79.5%) |
Income Below Poverty Among Married-Couple Families in Advance
The poverty statistics for married-couple families in Advance show that 7.5% or 24 of the total 321 families live below the poverty line. Families with 1 or 2 children have the highest poverty rate of 25.0%, comprising of 24 families. On the other hand, families with no children have the lowest poverty rate of 0.0%, which includes 0 families.
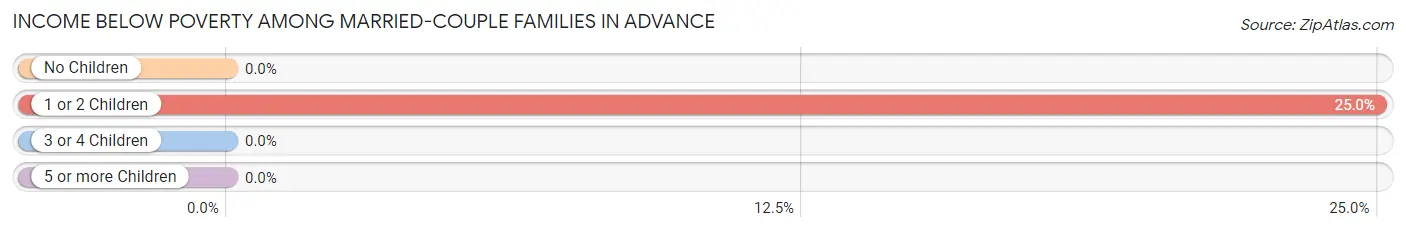
| Children | Above Poverty | Below Poverty |
| No Children | 151 (100.0%) | 0 (0.0%) |
| 1 or 2 Children | 72 (75.0%) | 24 (25.0%) |
| 3 or 4 Children | 74 (100.0%) | 0 (0.0%) |
| 5 or more Children | 0 (0.0%) | 0 (0.0%) |
| Total | 297 (92.5%) | 24 (7.5%) |
Income Below Poverty Among Single-Parent Households in Advance
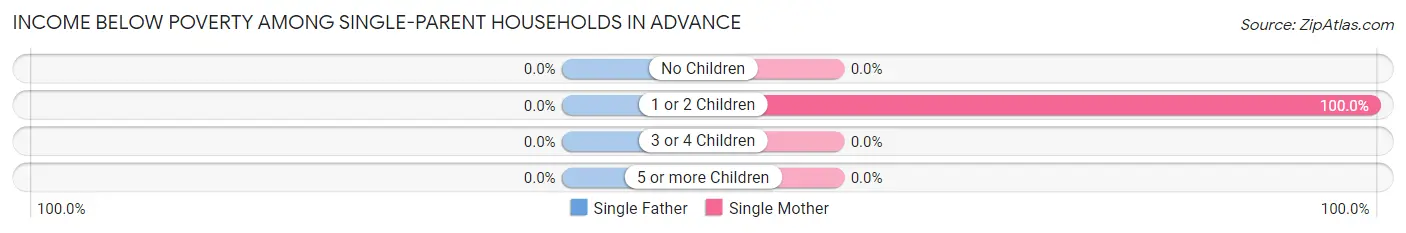
| Children | Single Father | Single Mother |
| No Children | 0 (0.0%) | 0 (0.0%) |
| 1 or 2 Children | 0 (0.0%) | 23 (100.0%) |
| 3 or 4 Children | 0 (0.0%) | 0 (0.0%) |
| 5 or more Children | 0 (0.0%) | 0 (0.0%) |
| Total | 0 (0.0%) | 23 (60.5%) |
Income Below Poverty Among Married-Couple vs Single-Parent Households in Advance
The poverty data for Advance shows that 24 of the married-couple family households (7.5%) and 23 of the single-parent households (35.4%) are living below the poverty level. Within the married-couple family households, those with 1 or 2 children have the highest poverty rate, with 24 households (25.0%) falling below the poverty line. Among the single-parent households, those with 1 or 2 children have the highest poverty rate, with 23 household (46.0%) living below poverty.
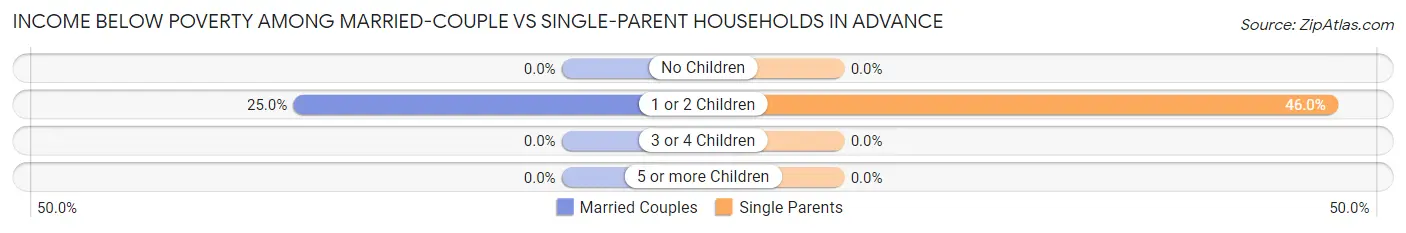
| Children | Married-Couple Families | Single-Parent Households |
| No Children | 0 (0.0%) | 0 (0.0%) |
| 1 or 2 Children | 24 (25.0%) | 23 (46.0%) |
| 3 or 4 Children | 0 (0.0%) | 0 (0.0%) |
| 5 or more Children | 0 (0.0%) | 0 (0.0%) |
| Total | 24 (7.5%) | 23 (35.4%) |
Race in Advance
The most populous races in Advance are White / Caucasian (1,423 | 88.7%), Some other Race (84 | 5.2%), and Black / African American (66 | 4.1%).
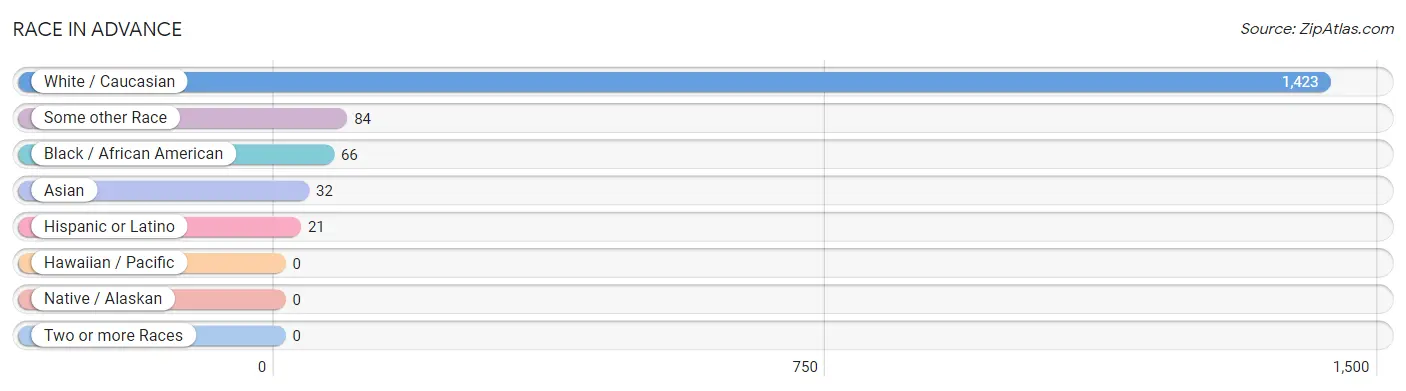
| Race | # Population | % Population |
| Asian | 32 | 2.0% |
| Black / African American | 66 | 4.1% |
| Hawaiian / Pacific | 0 | 0.0% |
| Hispanic or Latino | 21 | 1.3% |
| Native / Alaskan | 0 | 0.0% |
| White / Caucasian | 1,423 | 88.7% |
| Two or more Races | 0 | 0.0% |
| Some other Race | 84 | 5.2% |
| Total | 1,605 | 100.0% |
Ancestry in Advance
The most populous ancestries reported in Advance are Irish (93 | 5.8%), Scotch-Irish (92 | 5.7%), American (89 | 5.6%), English (74 | 4.6%), and German (72 | 4.5%), together accounting for 26.2% of all Advance residents.
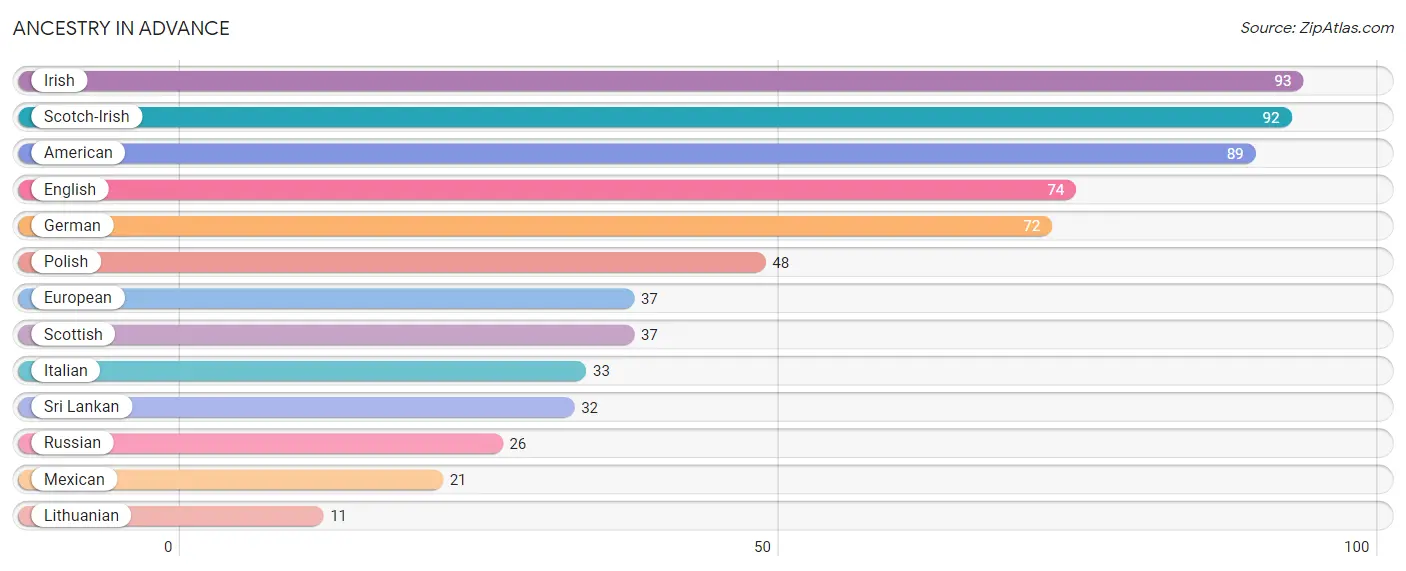
| Ancestry | # Population | % Population |
| American | 89 | 5.6% |
| English | 74 | 4.6% |
| European | 37 | 2.3% |
| German | 72 | 4.5% |
| Irish | 93 | 5.8% |
| Italian | 33 | 2.1% |
| Lithuanian | 11 | 0.7% |
| Mexican | 21 | 1.3% |
| Polish | 48 | 3.0% |
| Russian | 26 | 1.6% |
| Scotch-Irish | 92 | 5.7% |
| Scottish | 37 | 2.3% |
| Sri Lankan | 32 | 2.0% | View All 13 Rows |
Immigrants in Advance
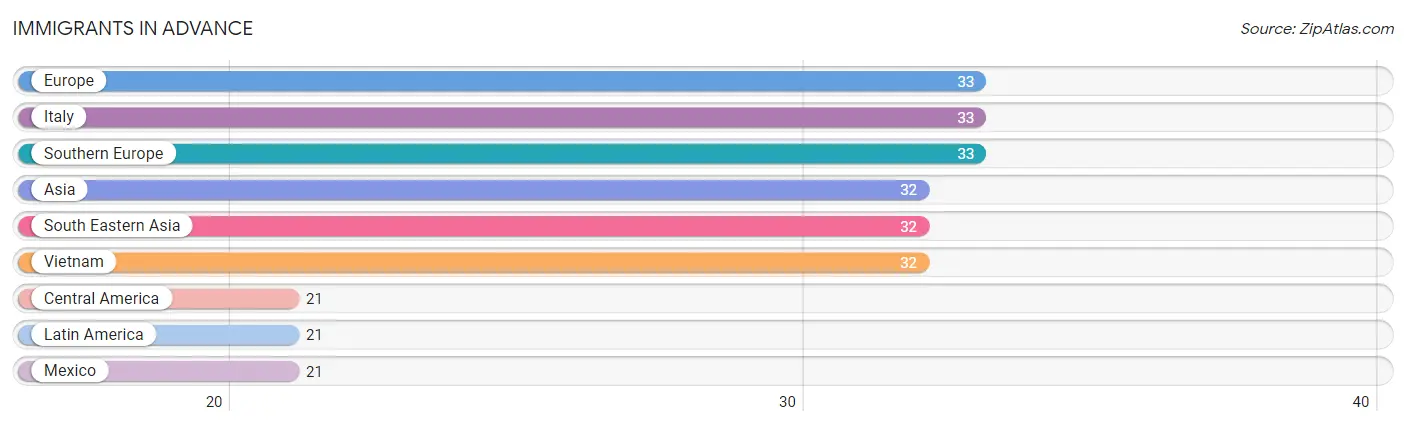
The most numerous immigrant groups reported in Advance came from Europe (33 | 2.1%), Italy (33 | 2.1%), Southern Europe (33 | 2.1%), Asia (32 | 2.0%), and South Eastern Asia (32 | 2.0%), together accounting for 10.2% of all Advance residents.
| Immigration Origin | # Population | % Population |
| Asia | 32 | 2.0% |
| Central America | 21 | 1.3% |
| Europe | 33 | 2.1% |
| Italy | 33 | 2.1% |
| Latin America | 21 | 1.3% |
| Mexico | 21 | 1.3% |
| South Eastern Asia | 32 | 2.0% |
| Southern Europe | 33 | 2.1% |
| Vietnam | 32 | 2.0% | View All 9 Rows |
Sex and Age in Advance
Sex and Age in Advance
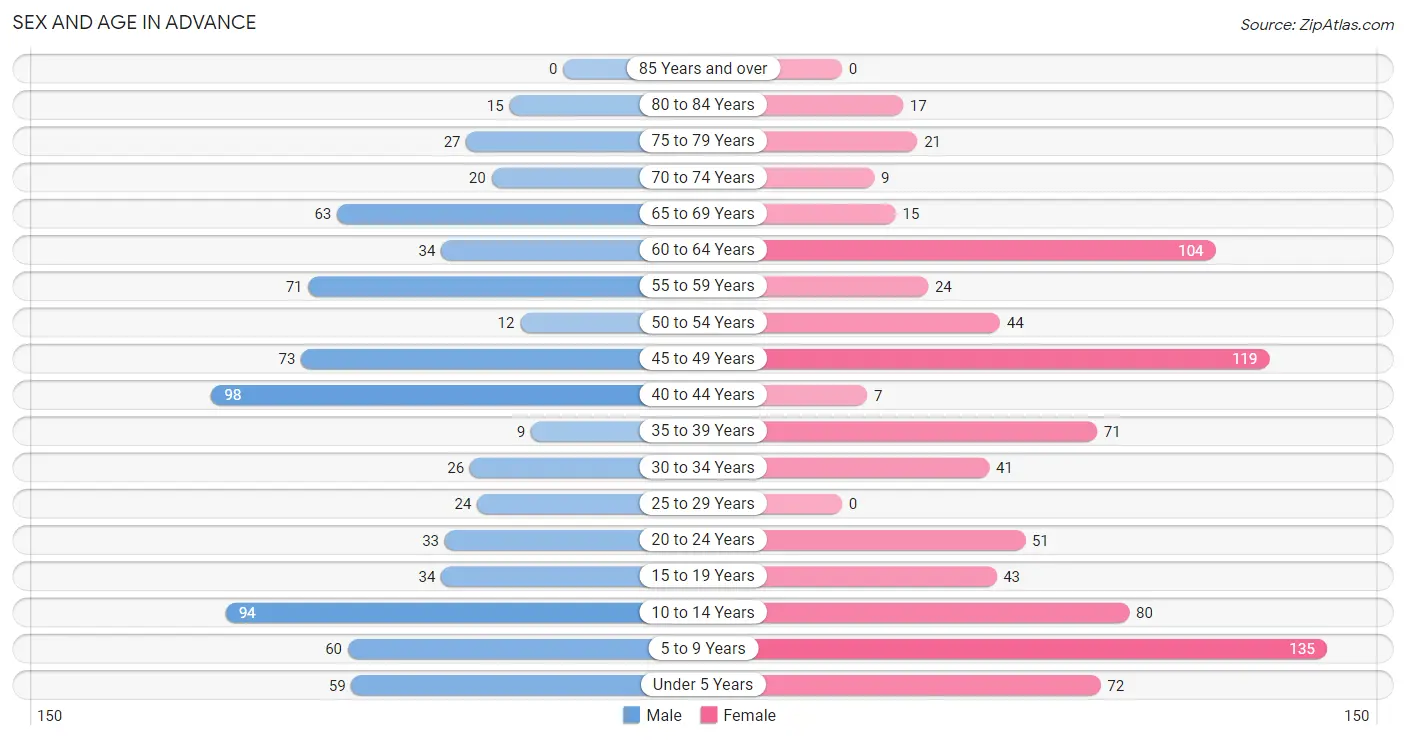
The most populous age groups in Advance are 40 to 44 Years (98 | 13.0%) for men and 5 to 9 Years (135 | 15.8%) for women.
| Age Bracket | Male | Female |
| Under 5 Years | 59 (7.9%) | 72 (8.4%) |
| 5 to 9 Years | 60 (8.0%) | 135 (15.8%) |
| 10 to 14 Years | 94 (12.5%) | 80 (9.4%) |
| 15 to 19 Years | 34 (4.5%) | 43 (5.0%) |
| 20 to 24 Years | 33 (4.4%) | 51 (6.0%) |
| 25 to 29 Years | 24 (3.2%) | 0 (0.0%) |
| 30 to 34 Years | 26 (3.5%) | 41 (4.8%) |
| 35 to 39 Years | 9 (1.2%) | 71 (8.3%) |
| 40 to 44 Years | 98 (13.0%) | 7 (0.8%) |
| 45 to 49 Years | 73 (9.7%) | 119 (14.0%) |
| 50 to 54 Years | 12 (1.6%) | 44 (5.2%) |
| 55 to 59 Years | 71 (9.4%) | 24 (2.8%) |
| 60 to 64 Years | 34 (4.5%) | 104 (12.2%) |
| 65 to 69 Years | 63 (8.4%) | 15 (1.8%) |
| 70 to 74 Years | 20 (2.7%) | 9 (1.1%) |
| 75 to 79 Years | 27 (3.6%) | 21 (2.5%) |
| 80 to 84 Years | 15 (2.0%) | 17 (2.0%) |
| 85 Years and over | 0 (0.0%) | 0 (0.0%) |
| Total | 752 (100.0%) | 853 (100.0%) |
Families and Households in Advance
Median Family Size in Advance
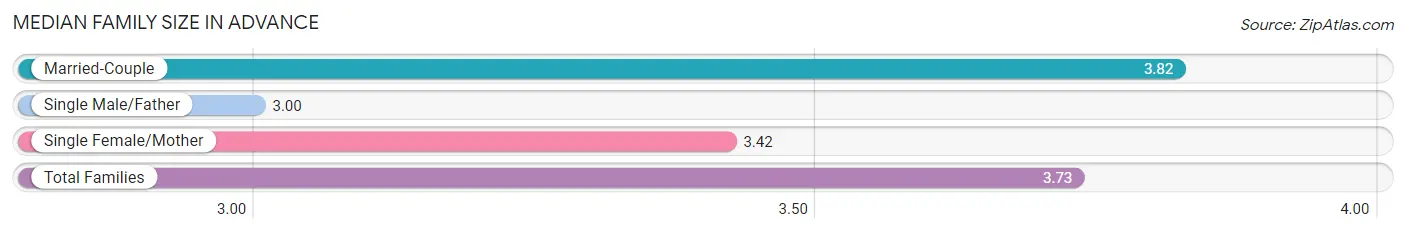
The median family size in Advance is 3.73 persons per family, with married-couple families (321 | 83.2%) accounting for the largest median family size of 3.82 persons per family. On the other hand, single male/father families (27 | 7.0%) represent the smallest median family size with 3.00 persons per family.
| Family Type | # Families | Family Size |
| Married-Couple | 321 (83.2%) | 3.82 |
| Single Male/Father | 27 (7.0%) | 3.00 |
| Single Female/Mother | 38 (9.8%) | 3.42 |
| Total Families | 386 (100.0%) | 3.73 |
Median Household Size in Advance
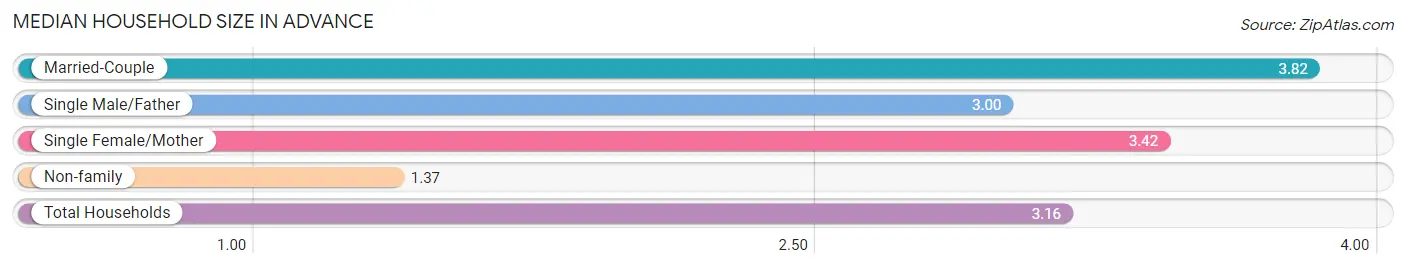
The median household size in Advance is 3.16 persons per household, with married-couple households (321 | 63.2%) accounting for the largest median household size of 3.82 persons per household. non-family households (122 | 24.0%) represent the smallest median household size with 1.37 persons per household.
| Household Type | # Households | Household Size |
| Married-Couple | 321 (63.2%) | 3.82 |
| Single Male/Father | 27 (5.3%) | 3.00 |
| Single Female/Mother | 38 (7.5%) | 3.42 |
| Non-family | 122 (24.0%) | 1.37 |
| Total Households | 508 (100.0%) | 3.16 |
Household Size by Marriage Status in Advance
Out of a total of 508 households in Advance, 386 (76.0%) are family households, while 122 (24.0%) are nonfamily households. The most numerous type of family households are 2-person households, comprising 151, and the most common type of nonfamily households are 1-person households, comprising 92.
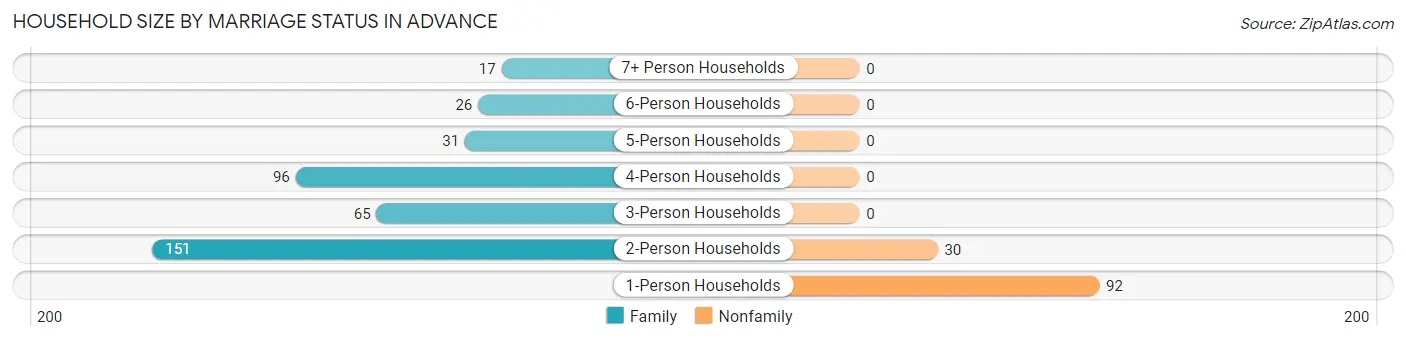
| Household Size | Family Households | Nonfamily Households |
| 1-Person Households | - | 92 (18.1%) |
| 2-Person Households | 151 (29.7%) | 30 (5.9%) |
| 3-Person Households | 65 (12.8%) | 0 (0.0%) |
| 4-Person Households | 96 (18.9%) | 0 (0.0%) |
| 5-Person Households | 31 (6.1%) | 0 (0.0%) |
| 6-Person Households | 26 (5.1%) | 0 (0.0%) |
| 7+ Person Households | 17 (3.4%) | 0 (0.0%) |
| Total | 386 (76.0%) | 122 (24.0%) |
Female Fertility in Advance
Fertility by Age in Advance
Average fertility rate in Advance is 78.0 births per 1,000 women. Women in the age bracket of 20 to 34 years have the highest fertility rate with 283.0 births per 1,000 women. Women in the age bracket of 20 to 34 years acount for 100.0% of all women with births.
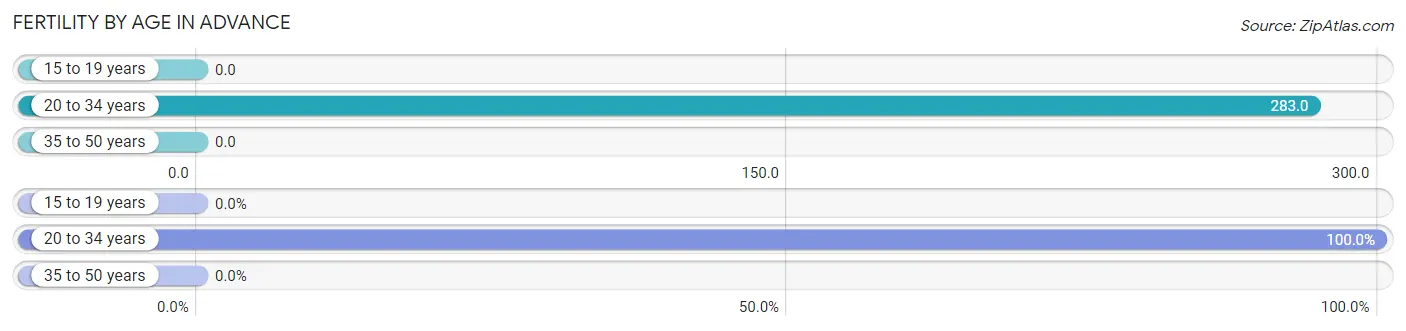
| Age Bracket | Women with Births | Births / 1,000 Women |
| 15 to 19 years | 0 (0.0%) | 0.0 |
| 20 to 34 years | 26 (100.0%) | 283.0 |
| 35 to 50 years | 0 (0.0%) | 0.0 |
| Total | 26 (100.0%) | 78.0 |
Fertility by Age by Marriage Status in Advance
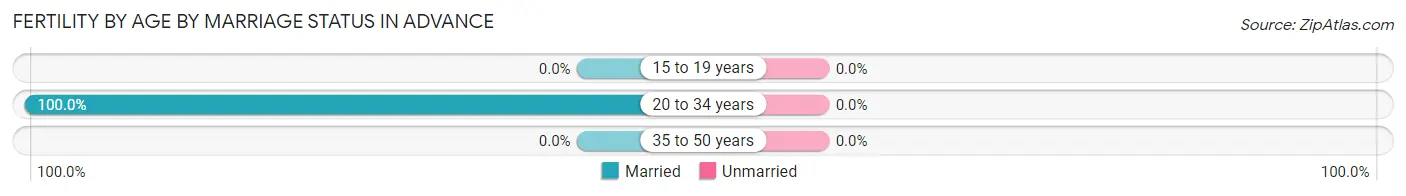
| Age Bracket | Married | Unmarried |
| 15 to 19 years | 0 (0.0%) | 0 (0.0%) |
| 20 to 34 years | 26 (100.0%) | 0 (0.0%) |
| 35 to 50 years | 0 (0.0%) | 0 (0.0%) |
| Total | 26 (100.0%) | 0 (0.0%) |
Fertility by Education in Advance
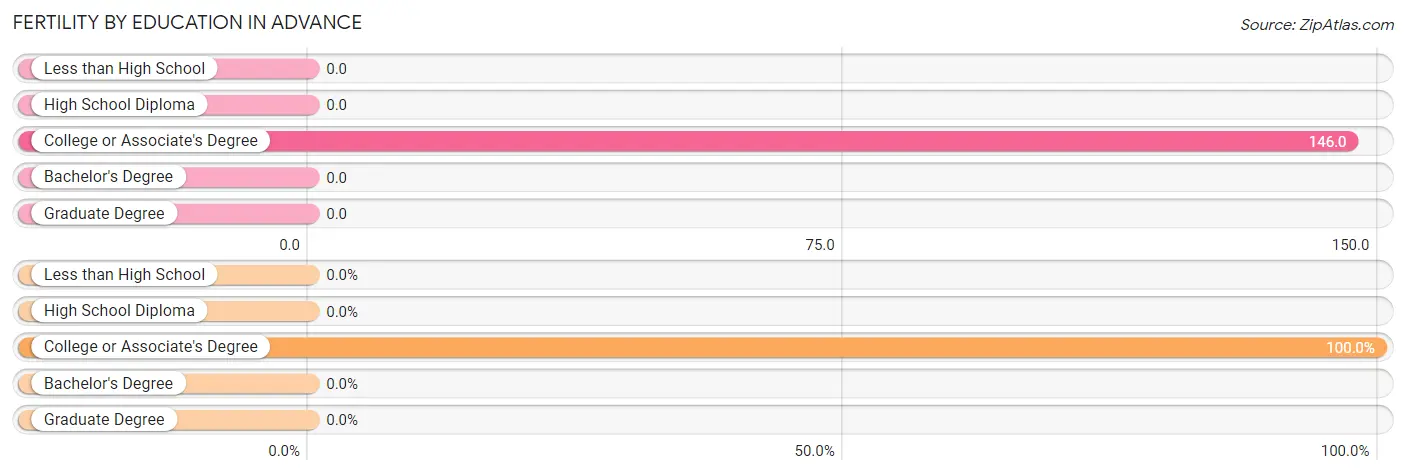
| Educational Attainment | Women with Births | Births / 1,000 Women |
| Less than High School | 0 (0.0%) | 0.0 |
| High School Diploma | 0 (0.0%) | 0.0 |
| College or Associate's Degree | 26 (100.0%) | 146.0 |
| Bachelor's Degree | 0 (0.0%) | 0.0 |
| Graduate Degree | 0 (0.0%) | 0.0 |
| Total | 26 (100.0%) | 78.0 |
Fertility by Education by Marriage Status in Advance
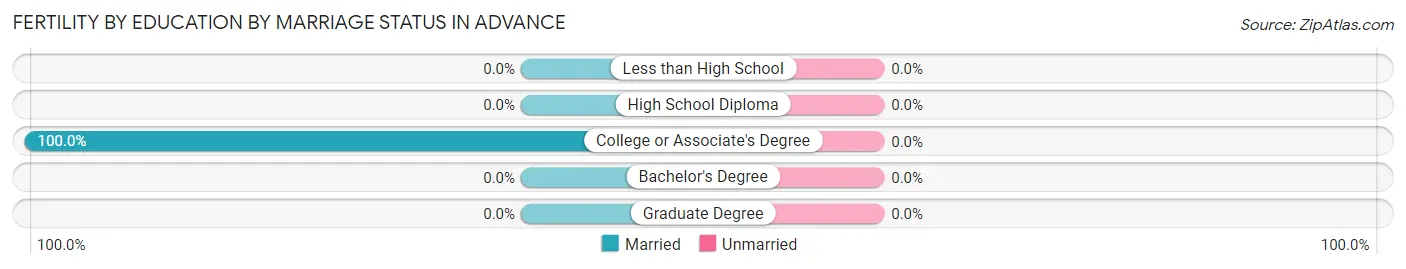
| Educational Attainment | Married | Unmarried |
| Less than High School | 0 (0.0%) | 0 (0.0%) |
| High School Diploma | 0 (0.0%) | 0 (0.0%) |
| College or Associate's Degree | 26 (100.0%) | 0 (0.0%) |
| Bachelor's Degree | 0 (0.0%) | 0 (0.0%) |
| Graduate Degree | 0 (0.0%) | 0 (0.0%) |
| Total | 26 (100.0%) | 0 (0.0%) |
Employment Characteristics in Advance
Employment by Class of Employer in Advance
Among the 673 employed individuals in Advance, private company employees (369 | 54.8%), not-for-profit organizations (93 | 13.8%), and local government employees (78 | 11.6%) make up the most common classes of employment.
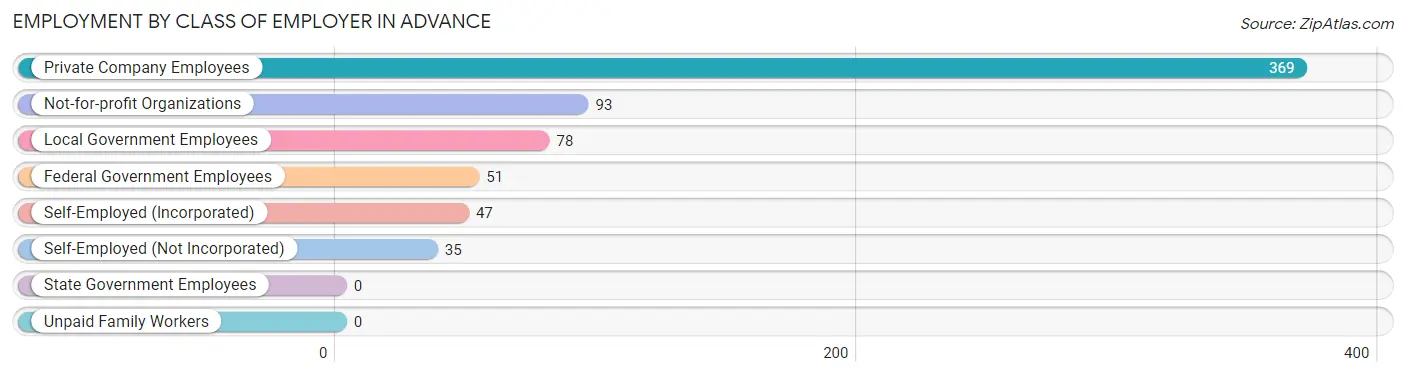
| Employer Class | # Employees | % Employees |
| Private Company Employees | 369 | 54.8% |
| Self-Employed (Incorporated) | 47 | 7.0% |
| Self-Employed (Not Incorporated) | 35 | 5.2% |
| Not-for-profit Organizations | 93 | 13.8% |
| Local Government Employees | 78 | 11.6% |
| State Government Employees | 0 | 0.0% |
| Federal Government Employees | 51 | 7.6% |
| Unpaid Family Workers | 0 | 0.0% |
| Total | 673 | 100.0% |
Employment Status by Age in Advance
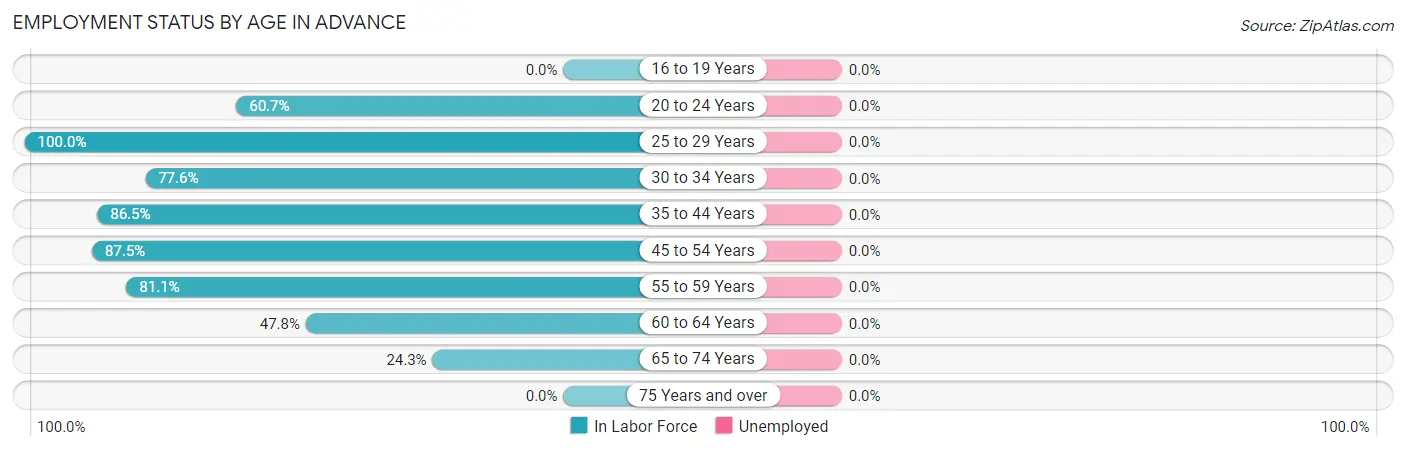
| Age Bracket | In Labor Force | Unemployed |
| 16 to 19 Years | 0 (0.0%) | 0 (0.0%) |
| 20 to 24 Years | 51 (60.7%) | 0 (0.0%) |
| 25 to 29 Years | 24 (100.0%) | 0 (0.0%) |
| 30 to 34 Years | 52 (77.6%) | 0 (0.0%) |
| 35 to 44 Years | 160 (86.5%) | 0 (0.0%) |
| 45 to 54 Years | 217 (87.5%) | 0 (0.0%) |
| 55 to 59 Years | 77 (81.1%) | 0 (0.0%) |
| 60 to 64 Years | 66 (47.8%) | 0 (0.0%) |
| 65 to 74 Years | 26 (24.3%) | 0 (0.0%) |
| 75 Years and over | 0 (0.0%) | 0 (0.0%) |
| Total | 673 (62.3%) | 0 (0.0%) |
Employment Status by Educational Attainment in Advance
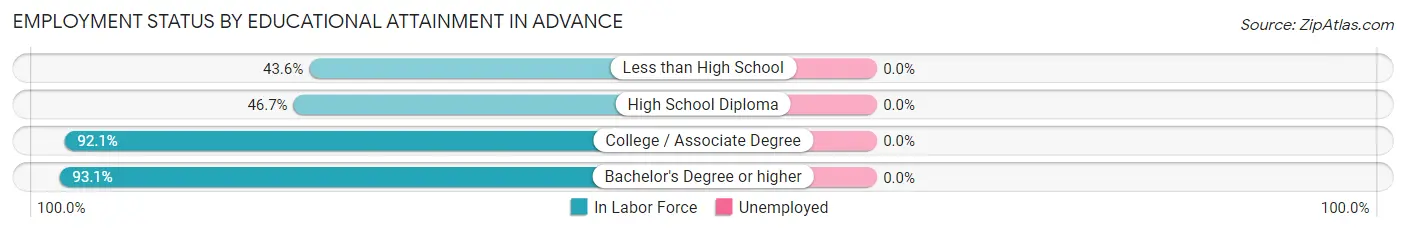
| Educational Attainment | In Labor Force | Unemployed |
| Less than High School | 24 (43.6%) | 0 (0.0%) |
| High School Diploma | 79 (46.7%) | 0 (0.0%) |
| College / Associate Degree | 291 (92.1%) | 0 (0.0%) |
| Bachelor's Degree or higher | 202 (93.1%) | 0 (0.0%) |
| Total | 596 (78.7%) | 0 (0.0%) |
Employment Occupations by Sex in Advance
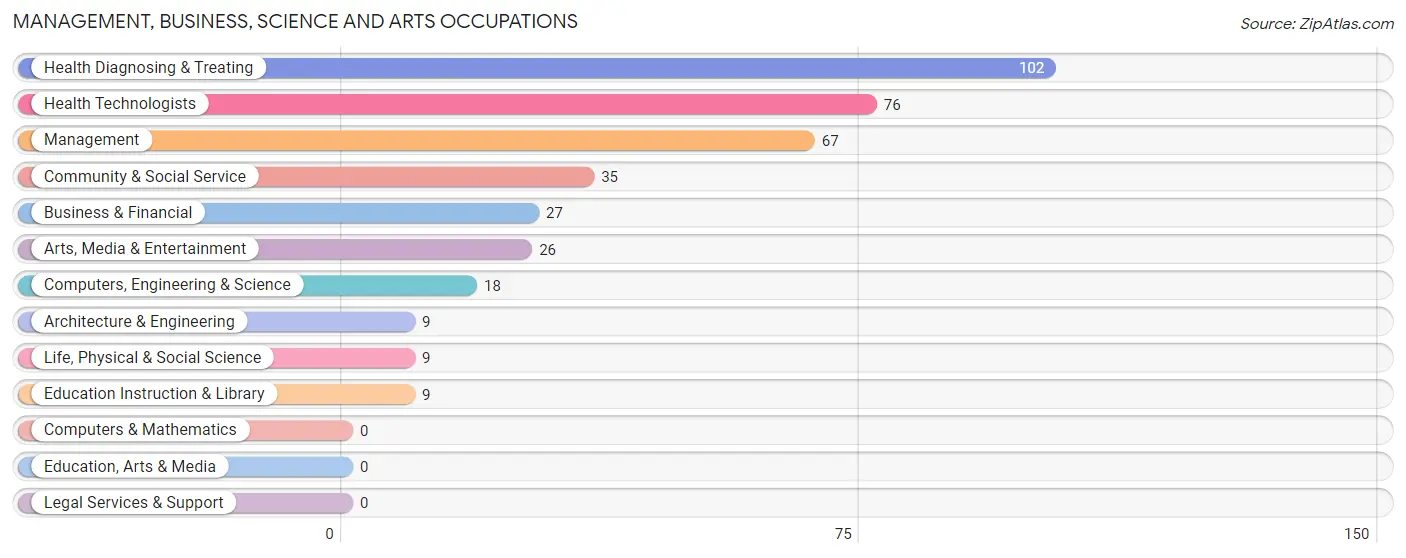
Management, Business, Science and Arts Occupations
The most common Management, Business, Science and Arts occupations in Advance are Health Diagnosing & Treating (102 | 15.2%), Health Technologists (76 | 11.3%), Management (67 | 10.0%), Community & Social Service (35 | 5.2%), and Business & Financial (27 | 4.0%).
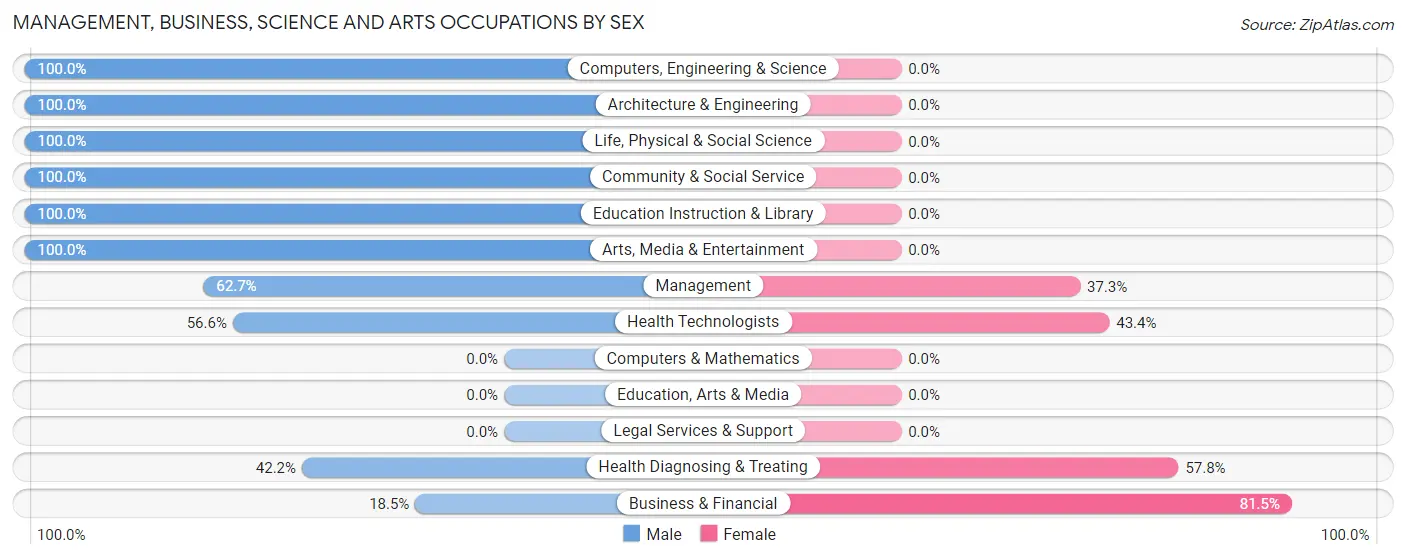
Management, Business, Science and Arts Occupations by Sex
Within the Management, Business, Science and Arts occupations in Advance, the most male-oriented occupations are Computers, Engineering & Science (100.0%), Architecture & Engineering (100.0%), and Life, Physical & Social Science (100.0%), while the most female-oriented occupations are Business & Financial (81.5%), Health Diagnosing & Treating (57.8%), and Health Technologists (43.4%).
| Occupation | Male | Female |
| Management | 42 (62.7%) | 25 (37.3%) |
| Business & Financial | 5 (18.5%) | 22 (81.5%) |
| Computers, Engineering & Science | 18 (100.0%) | 0 (0.0%) |
| Computers & Mathematics | 0 (0.0%) | 0 (0.0%) |
| Architecture & Engineering | 9 (100.0%) | 0 (0.0%) |
| Life, Physical & Social Science | 9 (100.0%) | 0 (0.0%) |
| Community & Social Service | 35 (100.0%) | 0 (0.0%) |
| Education, Arts & Media | 0 (0.0%) | 0 (0.0%) |
| Legal Services & Support | 0 (0.0%) | 0 (0.0%) |
| Education Instruction & Library | 9 (100.0%) | 0 (0.0%) |
| Arts, Media & Entertainment | 26 (100.0%) | 0 (0.0%) |
| Health Diagnosing & Treating | 43 (42.2%) | 59 (57.8%) |
| Health Technologists | 43 (56.6%) | 33 (43.4%) |
| Total (Category) | 143 (57.4%) | 106 (42.6%) |
| Total (Overall) | 339 (50.4%) | 334 (49.6%) |
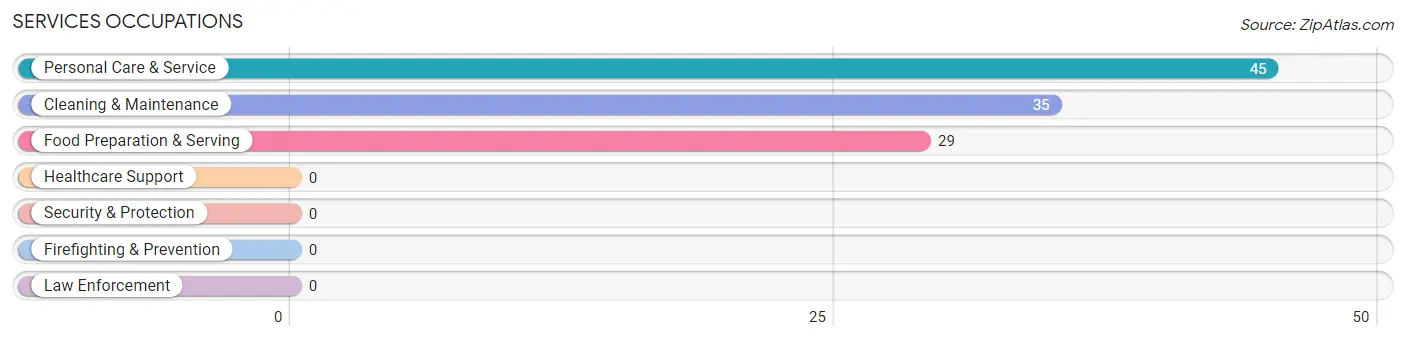
Services Occupations
The most common Services occupations in Advance are Personal Care & Service (45 | 6.7%), Cleaning & Maintenance (35 | 5.2%), and Food Preparation & Serving (29 | 4.3%).
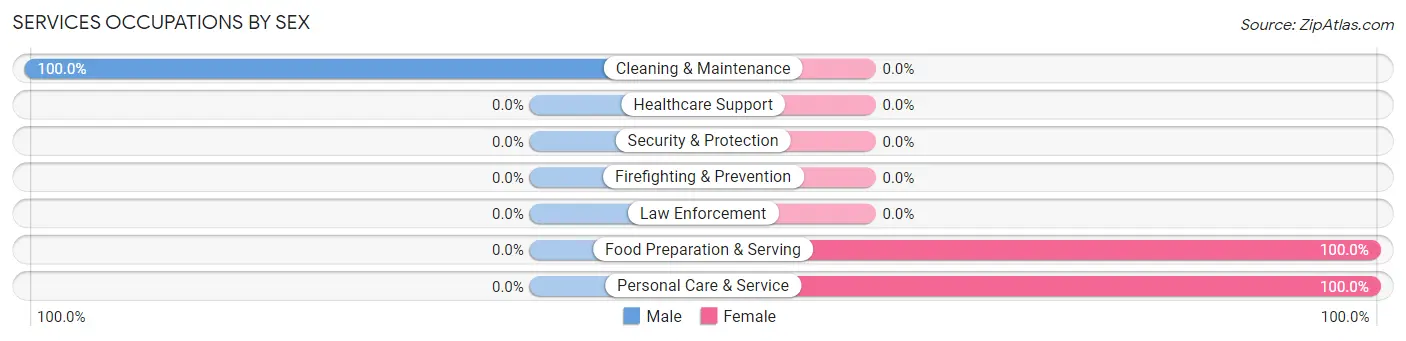
Services Occupations by Sex
| Occupation | Male | Female |
| Healthcare Support | 0 (0.0%) | 0 (0.0%) |
| Security & Protection | 0 (0.0%) | 0 (0.0%) |
| Firefighting & Prevention | 0 (0.0%) | 0 (0.0%) |
| Law Enforcement | 0 (0.0%) | 0 (0.0%) |
| Food Preparation & Serving | 0 (0.0%) | 29 (100.0%) |
| Cleaning & Maintenance | 35 (100.0%) | 0 (0.0%) |
| Personal Care & Service | 0 (0.0%) | 45 (100.0%) |
| Total (Category) | 35 (32.1%) | 74 (67.9%) |
| Total (Overall) | 339 (50.4%) | 334 (49.6%) |
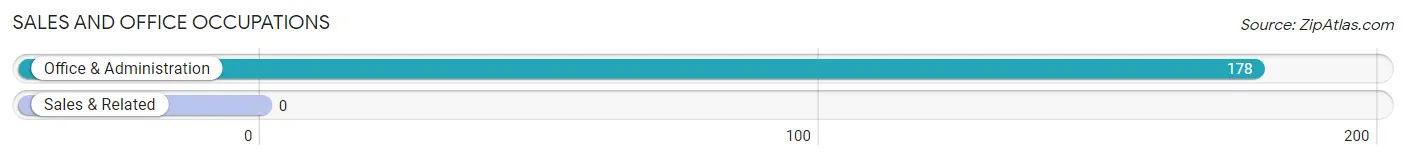
Sales and Office Occupations
The most common Sales and Office occupations in Advance are , and Office & Administration (178 | 26.5%).
Sales and Office Occupations by Sex
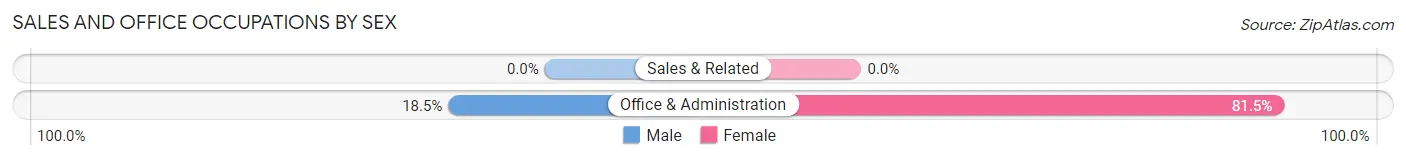
| Occupation | Male | Female |
| Sales & Related | 0 (0.0%) | 0 (0.0%) |
| Office & Administration | 33 (18.5%) | 145 (81.5%) |
| Total (Category) | 33 (18.5%) | 145 (81.5%) |
| Total (Overall) | 339 (50.4%) | 334 (49.6%) |
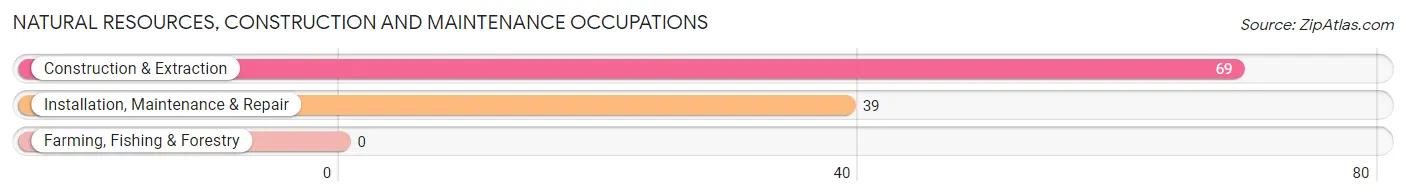
Natural Resources, Construction and Maintenance Occupations
The most common Natural Resources, Construction and Maintenance occupations in Advance are Construction & Extraction (69 | 10.2%), and Installation, Maintenance & Repair (39 | 5.8%).
Natural Resources, Construction and Maintenance Occupations by Sex
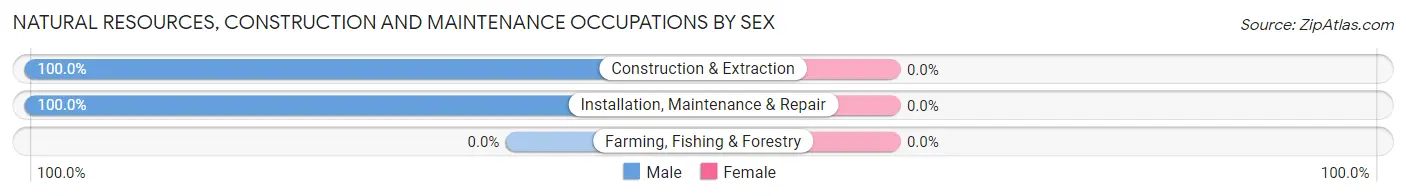
| Occupation | Male | Female |
| Farming, Fishing & Forestry | 0 (0.0%) | 0 (0.0%) |
| Construction & Extraction | 69 (100.0%) | 0 (0.0%) |
| Installation, Maintenance & Repair | 39 (100.0%) | 0 (0.0%) |
| Total (Category) | 108 (100.0%) | 0 (0.0%) |
| Total (Overall) | 339 (50.4%) | 334 (49.6%) |
Production, Transportation and Moving Occupations
The most common Production, Transportation and Moving occupations in Advance are , and Transportation (29 | 4.3%).
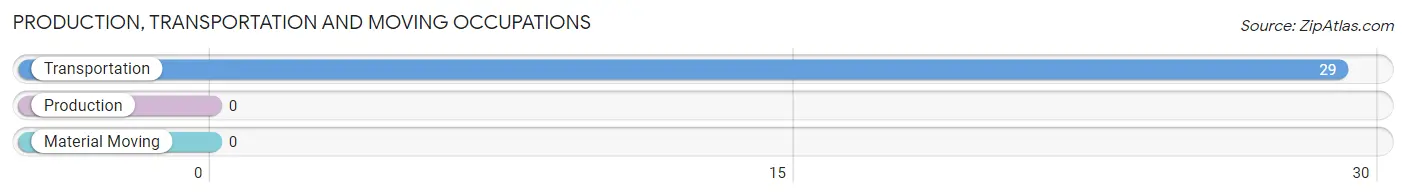
Production, Transportation and Moving Occupations by Sex
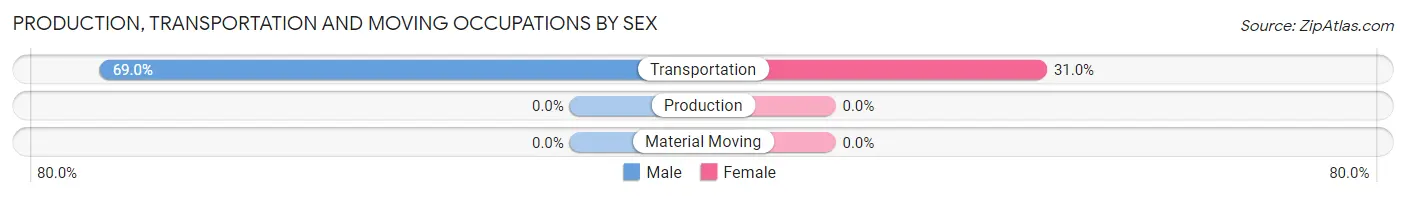
| Occupation | Male | Female |
| Production | 0 (0.0%) | 0 (0.0%) |
| Transportation | 20 (69.0%) | 9 (31.0%) |
| Material Moving | 0 (0.0%) | 0 (0.0%) |
| Total (Category) | 20 (69.0%) | 9 (31.0%) |
| Total (Overall) | 339 (50.4%) | 334 (49.6%) |
Employment Industries by Sex in Advance
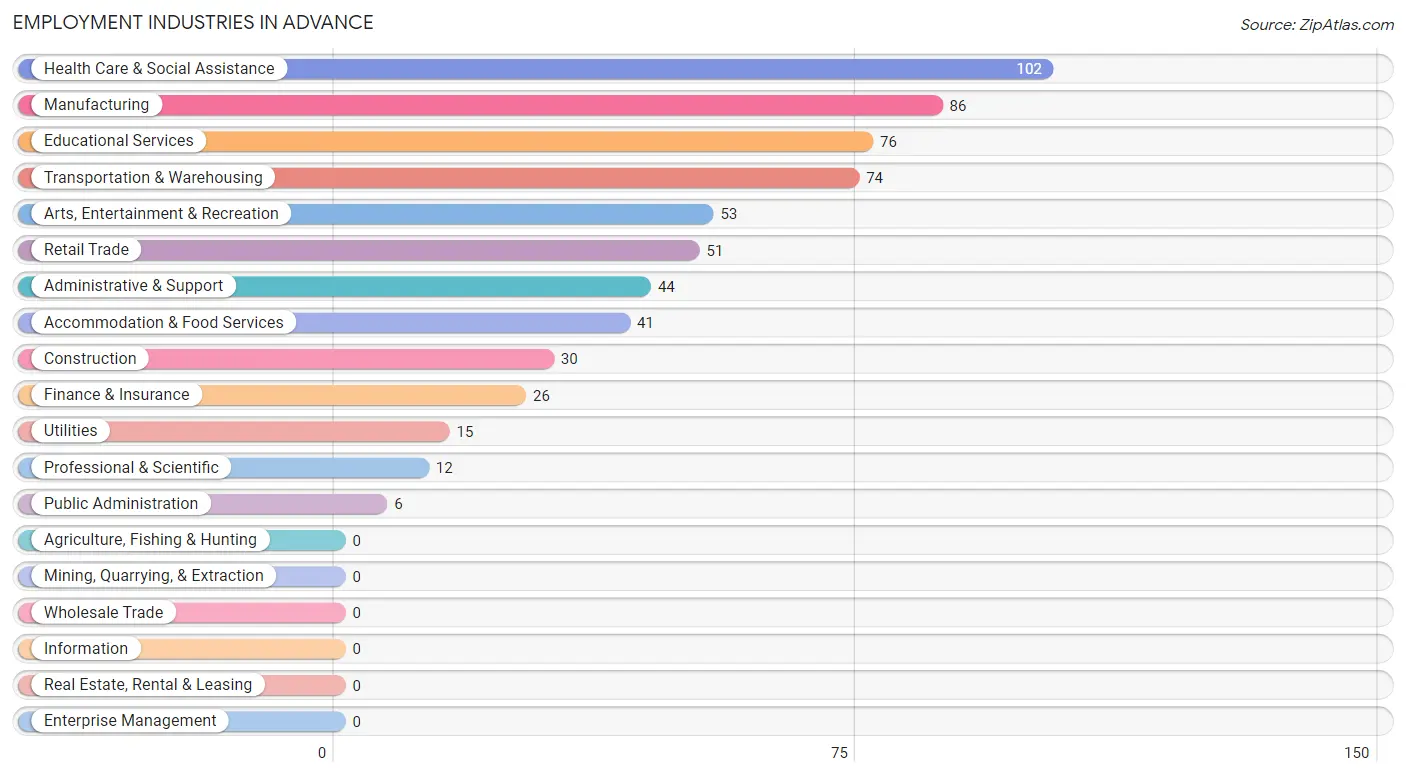
Employment Industries in Advance
The major employment industries in Advance include Health Care & Social Assistance (102 | 15.2%), Manufacturing (86 | 12.8%), Educational Services (76 | 11.3%), Transportation & Warehousing (74 | 11.0%), and Arts, Entertainment & Recreation (53 | 7.9%).
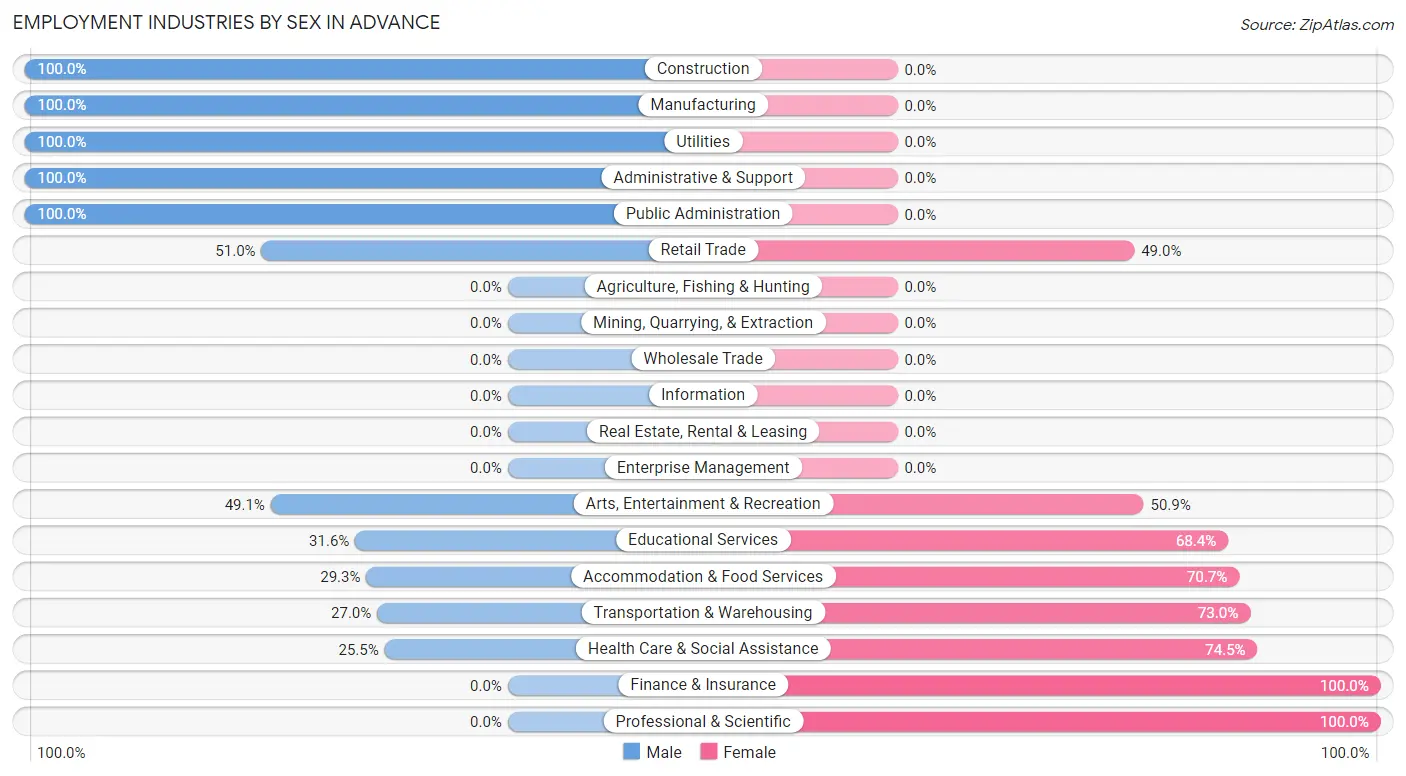
Employment Industries by Sex in Advance
The Advance industries that see more men than women are Construction (100.0%), Manufacturing (100.0%), and Utilities (100.0%), whereas the industries that tend to have a higher number of women are Finance & Insurance (100.0%), Professional & Scientific (100.0%), and Health Care & Social Assistance (74.5%).
| Industry | Male | Female |
| Agriculture, Fishing & Hunting | 0 (0.0%) | 0 (0.0%) |
| Mining, Quarrying, & Extraction | 0 (0.0%) | 0 (0.0%) |
| Construction | 30 (100.0%) | 0 (0.0%) |
| Manufacturing | 86 (100.0%) | 0 (0.0%) |
| Wholesale Trade | 0 (0.0%) | 0 (0.0%) |
| Retail Trade | 26 (51.0%) | 25 (49.0%) |
| Transportation & Warehousing | 20 (27.0%) | 54 (73.0%) |
| Utilities | 15 (100.0%) | 0 (0.0%) |
| Information | 0 (0.0%) | 0 (0.0%) |
| Finance & Insurance | 0 (0.0%) | 26 (100.0%) |
| Real Estate, Rental & Leasing | 0 (0.0%) | 0 (0.0%) |
| Professional & Scientific | 0 (0.0%) | 12 (100.0%) |
| Enterprise Management | 0 (0.0%) | 0 (0.0%) |
| Administrative & Support | 44 (100.0%) | 0 (0.0%) |
| Educational Services | 24 (31.6%) | 52 (68.4%) |
| Health Care & Social Assistance | 26 (25.5%) | 76 (74.5%) |
| Arts, Entertainment & Recreation | 26 (49.1%) | 27 (50.9%) |
| Accommodation & Food Services | 12 (29.3%) | 29 (70.7%) |
| Public Administration | 6 (100.0%) | 0 (0.0%) |
| Total | 339 (50.4%) | 334 (49.6%) |
Education in Advance
School Enrollment in Advance
The most common levels of schooling among the 461 students in Advance are middle school (164 | 35.6%), elementary school (123 | 26.7%), and high school (86 | 18.7%).
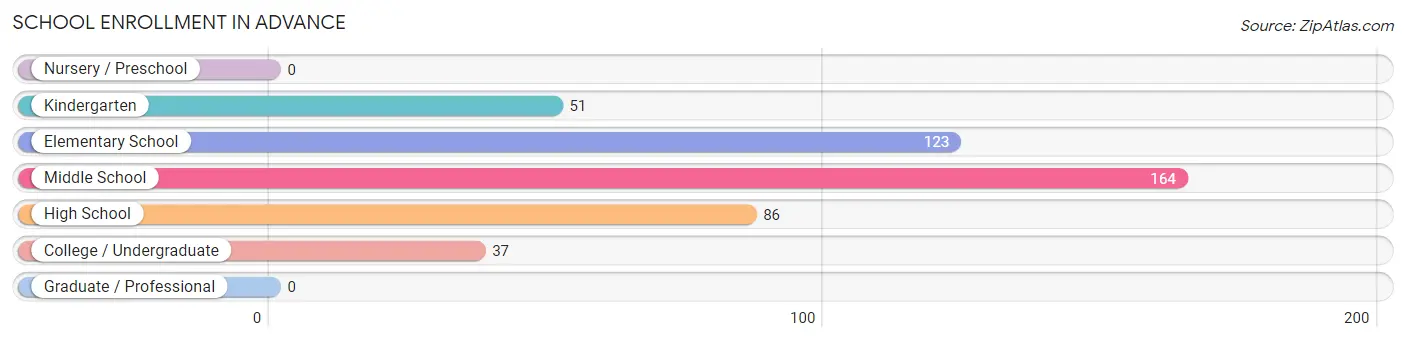
| School Level | # Students | % Students |
| Nursery / Preschool | 0 | 0.0% |
| Kindergarten | 51 | 11.1% |
| Elementary School | 123 | 26.7% |
| Middle School | 164 | 35.6% |
| High School | 86 | 18.7% |
| College / Undergraduate | 37 | 8.0% |
| Graduate / Professional | 0 | 0.0% |
| Total | 461 | 100.0% |
School Enrollment by Age by Funding Source in Advance
Out of a total of 461 students who are enrolled in schools in Advance, 113 (24.5%) attend a private institution, while the remaining 348 (75.5%) are enrolled in public schools. The age group of 35 years and over has the highest likelihood of being enrolled in private schools, with 8 (100.0% in the age bracket) enrolled. Conversely, the age group of 15 to 17 year olds has the lowest likelihood of being enrolled in a private school, with 34 (100.0% in the age bracket) attending a public institution.
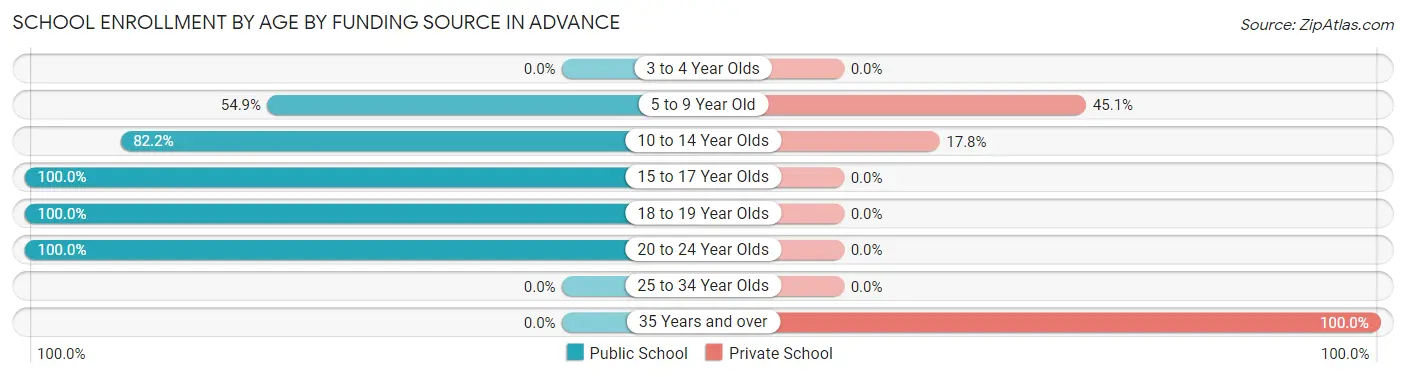
| Age Bracket | Public School | Private School |
| 3 to 4 Year Olds | 0 (0.0%) | 0 (0.0%) |
| 5 to 9 Year Old | 90 (54.9%) | 74 (45.1%) |
| 10 to 14 Year Olds | 143 (82.2%) | 31 (17.8%) |
| 15 to 17 Year Olds | 34 (100.0%) | 0 (0.0%) |
| 18 to 19 Year Olds | 19 (100.0%) | 0 (0.0%) |
| 20 to 24 Year Olds | 62 (100.0%) | 0 (0.0%) |
| 25 to 34 Year Olds | 0 (0.0%) | 0 (0.0%) |
| 35 Years and over | 0 (0.0%) | 8 (100.0%) |
| Total | 348 (75.5%) | 113 (24.5%) |
Educational Attainment by Field of Study in Advance
Arts & humanities (68 | 22.6%), science & technology (65 | 21.6%), bio, nature & agricultural (32 | 10.6%), education (31 | 10.3%), and social sciences (27 | 9.0%) are the most common fields of study among 301 individuals in Advance who have obtained a bachelor's degree or higher.
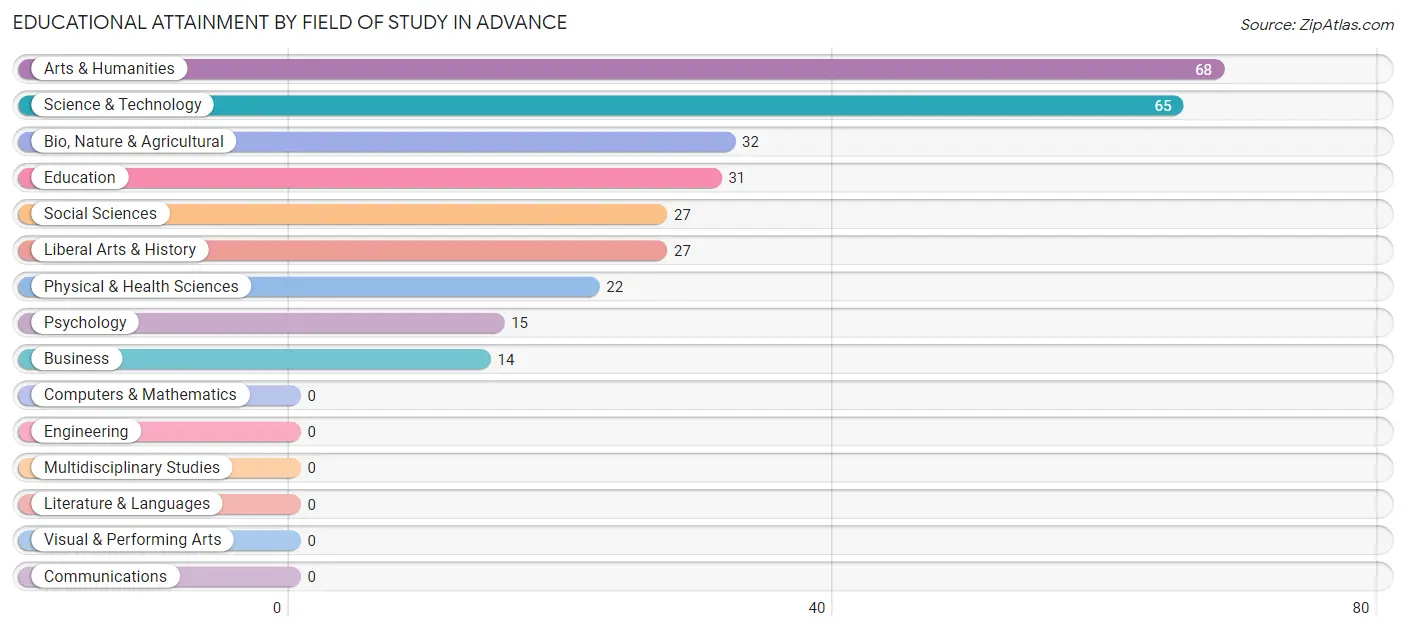
| Field of Study | # Graduates | % Graduates |
| Computers & Mathematics | 0 | 0.0% |
| Bio, Nature & Agricultural | 32 | 10.6% |
| Physical & Health Sciences | 22 | 7.3% |
| Psychology | 15 | 5.0% |
| Social Sciences | 27 | 9.0% |
| Engineering | 0 | 0.0% |
| Multidisciplinary Studies | 0 | 0.0% |
| Science & Technology | 65 | 21.6% |
| Business | 14 | 4.6% |
| Education | 31 | 10.3% |
| Literature & Languages | 0 | 0.0% |
| Liberal Arts & History | 27 | 9.0% |
| Visual & Performing Arts | 0 | 0.0% |
| Communications | 0 | 0.0% |
| Arts & Humanities | 68 | 22.6% |
| Total | 301 | 100.0% |
Transportation & Commute in Advance
Vehicle Availability by Sex in Advance
The most prevalent vehicle ownership categories in Advance are males with 3 vehicles (196, accounting for 57.8%) and females with 3 vehicles (234, making up 58.7%).
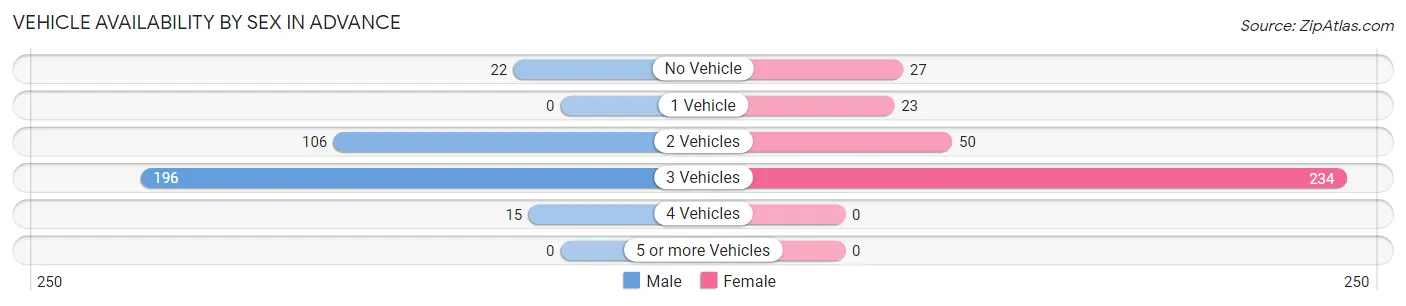
| Vehicles Available | Male | Female |
| No Vehicle | 22 (6.5%) | 27 (8.1%) |
| 1 Vehicle | 0 (0.0%) | 23 (6.9%) |
| 2 Vehicles | 106 (31.3%) | 50 (15.0%) |
| 3 Vehicles | 196 (57.8%) | 234 (70.1%) |
| 4 Vehicles | 15 (4.4%) | 0 (0.0%) |
| 5 or more Vehicles | 0 (0.0%) | 0 (0.0%) |
| Total | 339 (100.0%) | 334 (100.0%) |
Commute Time in Advance
The most frequently occuring commute durations in Advance are 45 to 59 minutes (123 commuters, 19.5%), 25 to 29 minutes (101 commuters, 16.0%), and 20 to 24 minutes (88 commuters, 14.0%).
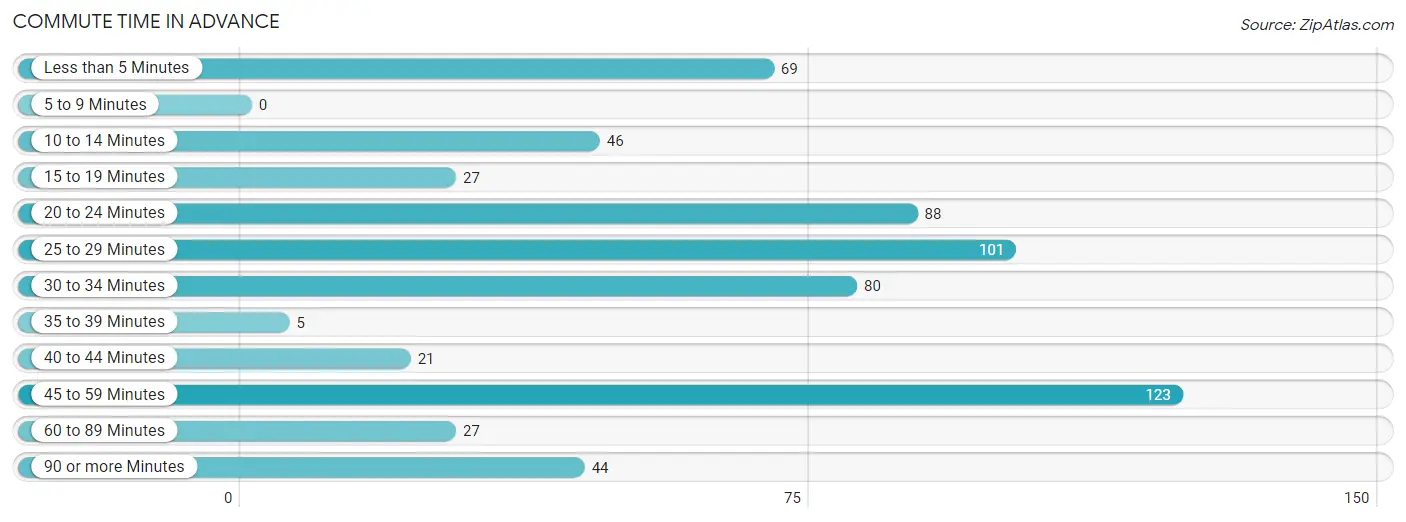
| Commute Time | # Commuters | % Commuters |
| Less than 5 Minutes | 69 | 10.9% |
| 5 to 9 Minutes | 0 | 0.0% |
| 10 to 14 Minutes | 46 | 7.3% |
| 15 to 19 Minutes | 27 | 4.3% |
| 20 to 24 Minutes | 88 | 14.0% |
| 25 to 29 Minutes | 101 | 16.0% |
| 30 to 34 Minutes | 80 | 12.7% |
| 35 to 39 Minutes | 5 | 0.8% |
| 40 to 44 Minutes | 21 | 3.3% |
| 45 to 59 Minutes | 123 | 19.5% |
| 60 to 89 Minutes | 27 | 4.3% |
| 90 or more Minutes | 44 | 7.0% |
Commute Time by Sex in Advance
The most common commute times in Advance are 45 to 59 minutes (86 commuters, 25.8%) for males and 25 to 29 minutes (69 commuters, 23.2%) for females.
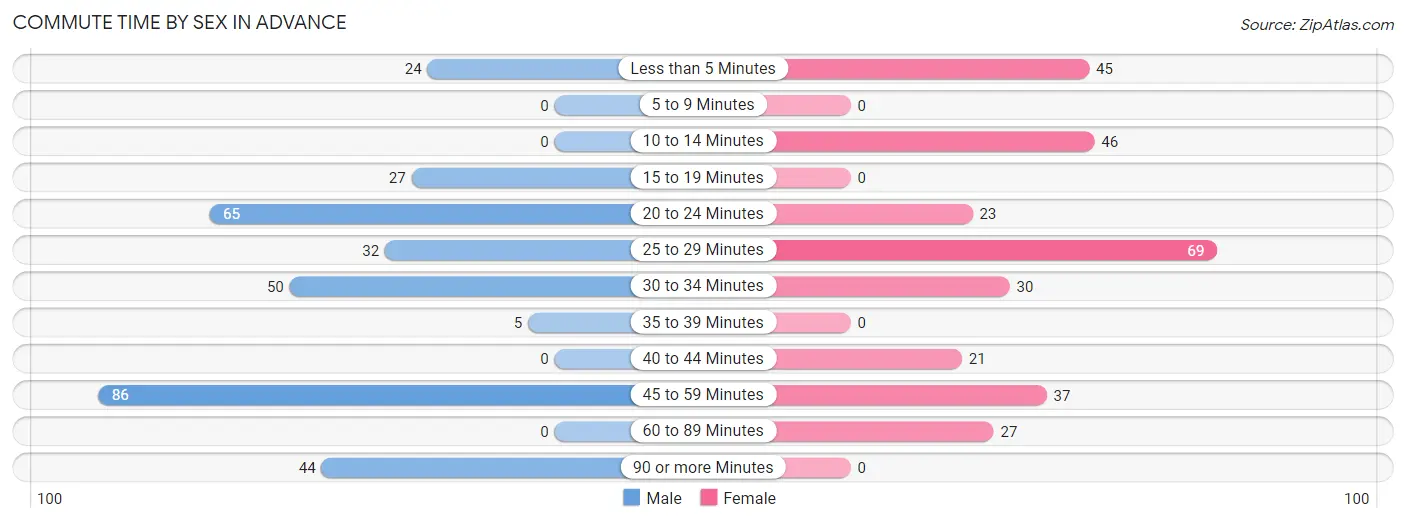
| Commute Time | Male | Female |
| Less than 5 Minutes | 24 (7.2%) | 45 (15.1%) |
| 5 to 9 Minutes | 0 (0.0%) | 0 (0.0%) |
| 10 to 14 Minutes | 0 (0.0%) | 46 (15.4%) |
| 15 to 19 Minutes | 27 (8.1%) | 0 (0.0%) |
| 20 to 24 Minutes | 65 (19.5%) | 23 (7.7%) |
| 25 to 29 Minutes | 32 (9.6%) | 69 (23.2%) |
| 30 to 34 Minutes | 50 (15.0%) | 30 (10.1%) |
| 35 to 39 Minutes | 5 (1.5%) | 0 (0.0%) |
| 40 to 44 Minutes | 0 (0.0%) | 21 (7.0%) |
| 45 to 59 Minutes | 86 (25.8%) | 37 (12.4%) |
| 60 to 89 Minutes | 0 (0.0%) | 27 (9.1%) |
| 90 or more Minutes | 44 (13.2%) | 0 (0.0%) |
Time of Departure to Work by Sex in Advance
The most frequent times of departure to work in Advance are 8:00 AM to 8:29 AM (60, 18.0%) for males and 6:30 AM to 6:59 AM (97, 32.6%) for females.
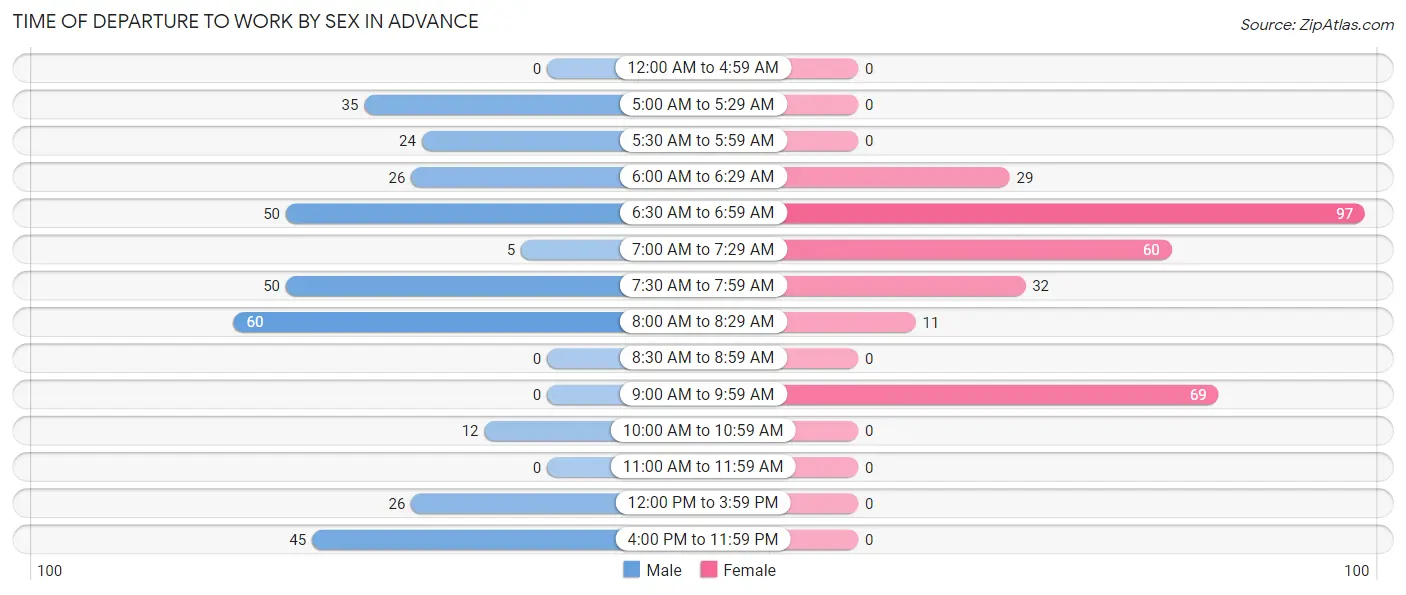
| Time of Departure | Male | Female |
| 12:00 AM to 4:59 AM | 0 (0.0%) | 0 (0.0%) |
| 5:00 AM to 5:29 AM | 35 (10.5%) | 0 (0.0%) |
| 5:30 AM to 5:59 AM | 24 (7.2%) | 0 (0.0%) |
| 6:00 AM to 6:29 AM | 26 (7.8%) | 29 (9.7%) |
| 6:30 AM to 6:59 AM | 50 (15.0%) | 97 (32.6%) |
| 7:00 AM to 7:29 AM | 5 (1.5%) | 60 (20.1%) |
| 7:30 AM to 7:59 AM | 50 (15.0%) | 32 (10.7%) |
| 8:00 AM to 8:29 AM | 60 (18.0%) | 11 (3.7%) |
| 8:30 AM to 8:59 AM | 0 (0.0%) | 0 (0.0%) |
| 9:00 AM to 9:59 AM | 0 (0.0%) | 69 (23.2%) |
| 10:00 AM to 10:59 AM | 12 (3.6%) | 0 (0.0%) |
| 11:00 AM to 11:59 AM | 0 (0.0%) | 0 (0.0%) |
| 12:00 PM to 3:59 PM | 26 (7.8%) | 0 (0.0%) |
| 4:00 PM to 11:59 PM | 45 (13.5%) | 0 (0.0%) |
| Total | 333 (100.0%) | 298 (100.0%) |
Housing Occupancy in Advance
Occupancy by Ownership in Advance
Of the total 508 dwellings in Advance, owner-occupied units account for 407 (80.1%), while renter-occupied units make up 101 (19.9%).
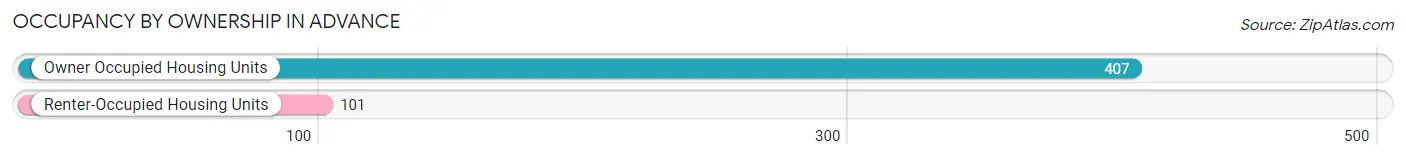
| Occupancy | # Housing Units | % Housing Units |
| Owner Occupied Housing Units | 407 | 80.1% |
| Renter-Occupied Housing Units | 101 | 19.9% |
| Total Occupied Housing Units | 508 | 100.0% |
Occupancy by Household Size in Advance
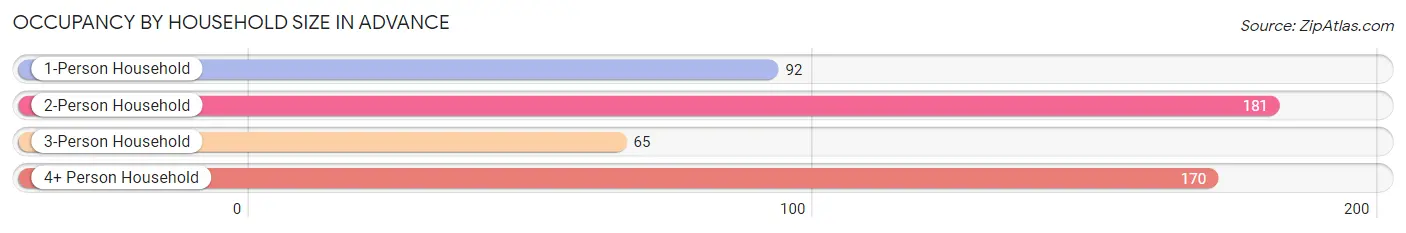
| Household Size | # Housing Units | % Housing Units |
| 1-Person Household | 92 | 18.1% |
| 2-Person Household | 181 | 35.6% |
| 3-Person Household | 65 | 12.8% |
| 4+ Person Household | 170 | 33.5% |
| Total Housing Units | 508 | 100.0% |
Occupancy by Ownership by Household Size in Advance
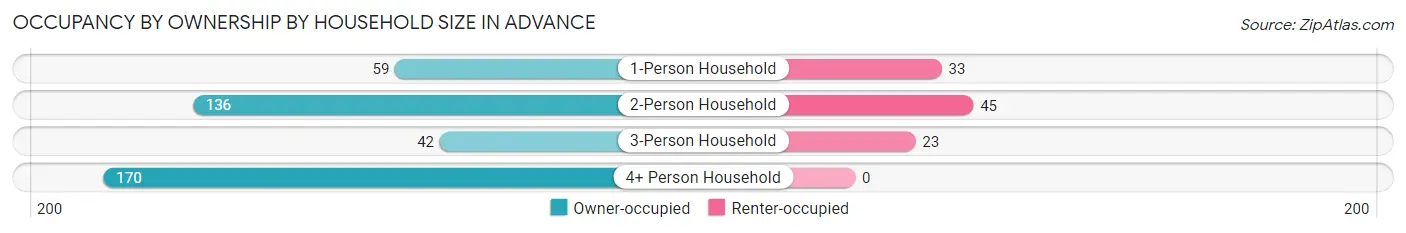
| Household Size | Owner-occupied | Renter-occupied |
| 1-Person Household | 59 (64.1%) | 33 (35.9%) |
| 2-Person Household | 136 (75.1%) | 45 (24.9%) |
| 3-Person Household | 42 (64.6%) | 23 (35.4%) |
| 4+ Person Household | 170 (100.0%) | 0 (0.0%) |
| Total Housing Units | 407 (80.1%) | 101 (19.9%) |
Occupancy by Educational Attainment in Advance
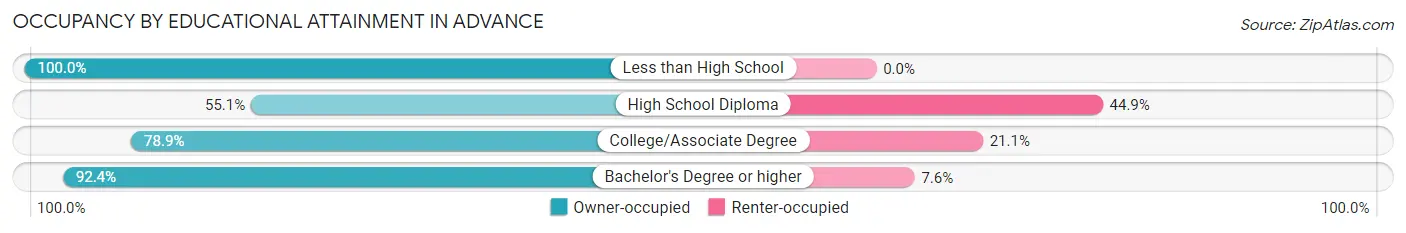
| Household Size | Owner-occupied | Renter-occupied |
| Less than High School | 39 (100.0%) | 0 (0.0%) |
| High School Diploma | 54 (55.1%) | 44 (44.9%) |
| College/Associate Degree | 168 (78.9%) | 45 (21.1%) |
| Bachelor's Degree or higher | 146 (92.4%) | 12 (7.6%) |
Occupancy by Age of Householder in Advance
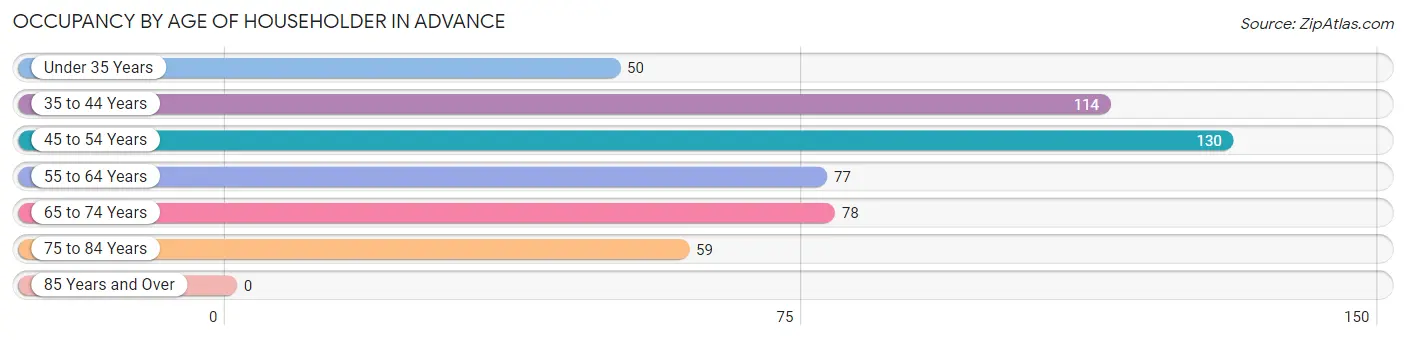
| Age Bracket | # Households | % Households |
| Under 35 Years | 50 | 9.8% |
| 35 to 44 Years | 114 | 22.4% |
| 45 to 54 Years | 130 | 25.6% |
| 55 to 64 Years | 77 | 15.2% |
| 65 to 74 Years | 78 | 15.3% |
| 75 to 84 Years | 59 | 11.6% |
| 85 Years and Over | 0 | 0.0% |
| Total | 508 | 100.0% |
Housing Finances in Advance
Median Income by Occupancy in Advance
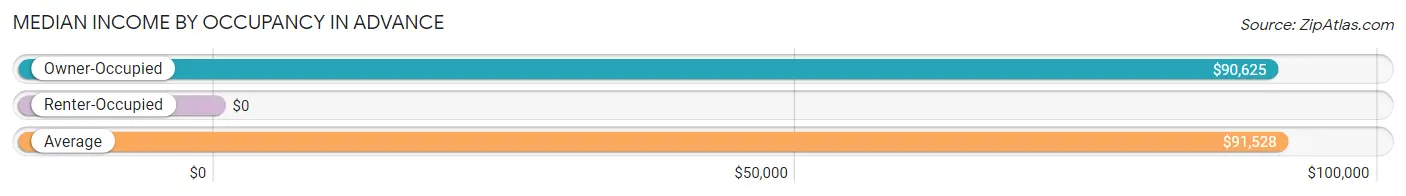
| Occupancy Type | # Households | Median Income |
| Owner-Occupied | 407 (80.1%) | $90,625 |
| Renter-Occupied | 101 (19.9%) | $0 |
| Average | 508 (100.0%) | $91,528 |
Occupancy by Householder Income Bracket in Advance
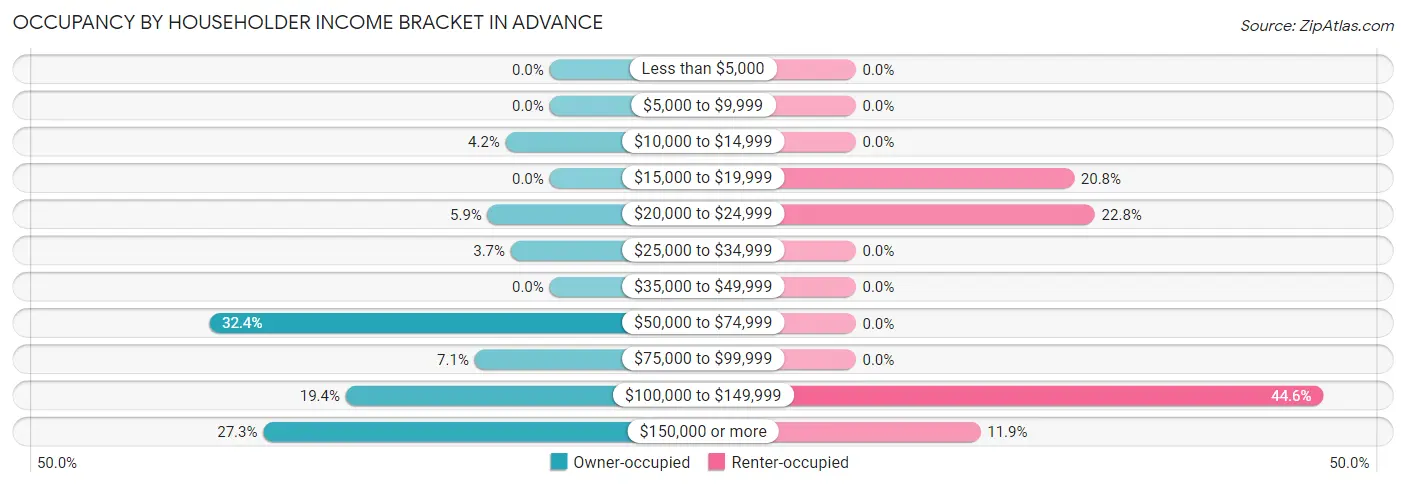
| Income Bracket | Owner-occupied | Renter-occupied |
| Less than $5,000 | 0 (0.0%) | 0 (0.0%) |
| $5,000 to $9,999 | 0 (0.0%) | 0 (0.0%) |
| $10,000 to $14,999 | 17 (4.2%) | 0 (0.0%) |
| $15,000 to $19,999 | 0 (0.0%) | 21 (20.8%) |
| $20,000 to $24,999 | 24 (5.9%) | 23 (22.8%) |
| $25,000 to $34,999 | 15 (3.7%) | 0 (0.0%) |
| $35,000 to $49,999 | 0 (0.0%) | 0 (0.0%) |
| $50,000 to $74,999 | 132 (32.4%) | 0 (0.0%) |
| $75,000 to $99,999 | 29 (7.1%) | 0 (0.0%) |
| $100,000 to $149,999 | 79 (19.4%) | 45 (44.6%) |
| $150,000 or more | 111 (27.3%) | 12 (11.9%) |
| Total | 407 (100.0%) | 101 (100.0%) |
Monthly Housing Cost Tiers in Advance
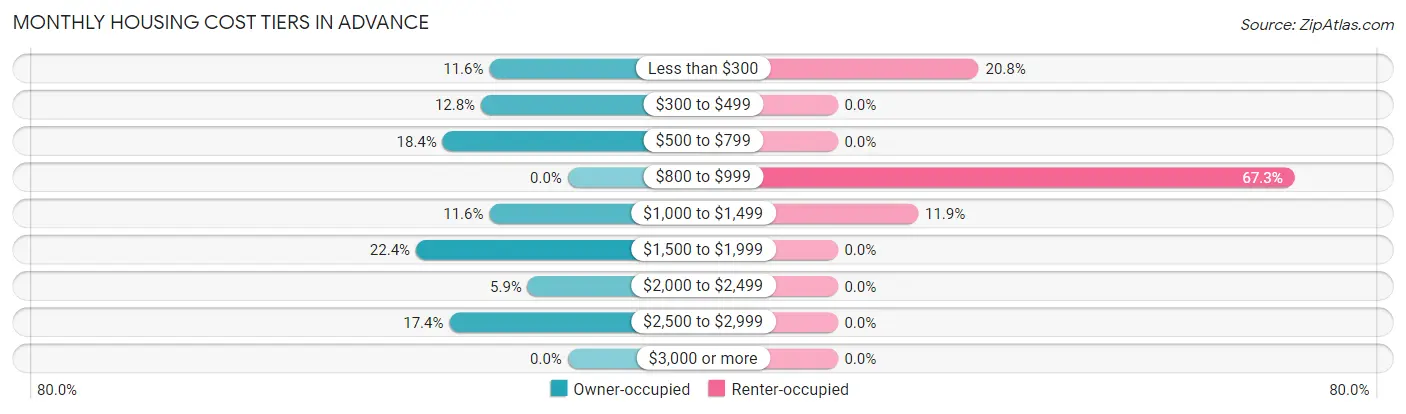
| Monthly Cost | Owner-occupied | Renter-occupied |
| Less than $300 | 47 (11.6%) | 21 (20.8%) |
| $300 to $499 | 52 (12.8%) | 0 (0.0%) |
| $500 to $799 | 75 (18.4%) | 0 (0.0%) |
| $800 to $999 | 0 (0.0%) | 68 (67.3%) |
| $1,000 to $1,499 | 47 (11.6%) | 12 (11.9%) |
| $1,500 to $1,999 | 91 (22.4%) | 0 (0.0%) |
| $2,000 to $2,499 | 24 (5.9%) | 0 (0.0%) |
| $2,500 to $2,999 | 71 (17.4%) | 0 (0.0%) |
| $3,000 or more | 0 (0.0%) | 0 (0.0%) |
| Total | 407 (100.0%) | 101 (100.0%) |
Physical Housing Characteristics in Advance
Housing Structures in Advance
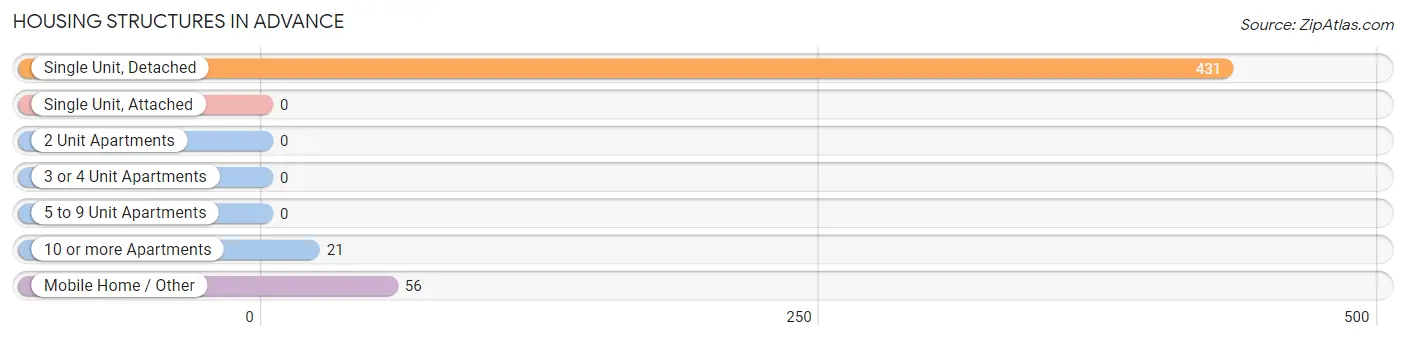
| Structure Type | # Housing Units | % Housing Units |
| Single Unit, Detached | 431 | 84.8% |
| Single Unit, Attached | 0 | 0.0% |
| 2 Unit Apartments | 0 | 0.0% |
| 3 or 4 Unit Apartments | 0 | 0.0% |
| 5 to 9 Unit Apartments | 0 | 0.0% |
| 10 or more Apartments | 21 | 4.1% |
| Mobile Home / Other | 56 | 11.0% |
| Total | 508 | 100.0% |
Housing Structures by Occupancy in Advance
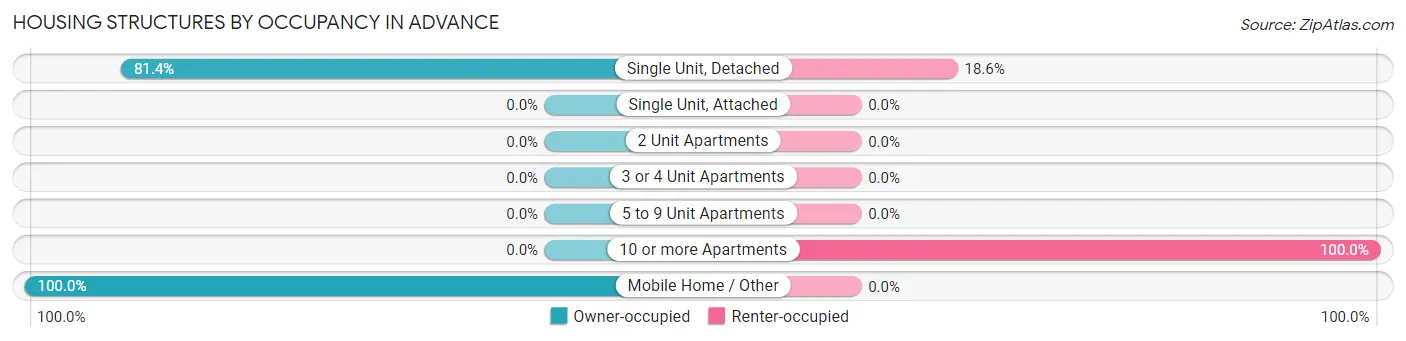
| Structure Type | Owner-occupied | Renter-occupied |
| Single Unit, Detached | 351 (81.4%) | 80 (18.6%) |
| Single Unit, Attached | 0 (0.0%) | 0 (0.0%) |
| 2 Unit Apartments | 0 (0.0%) | 0 (0.0%) |
| 3 or 4 Unit Apartments | 0 (0.0%) | 0 (0.0%) |
| 5 to 9 Unit Apartments | 0 (0.0%) | 0 (0.0%) |
| 10 or more Apartments | 0 (0.0%) | 21 (100.0%) |
| Mobile Home / Other | 56 (100.0%) | 0 (0.0%) |
| Total | 407 (80.1%) | 101 (19.9%) |
Housing Structures by Number of Rooms in Advance
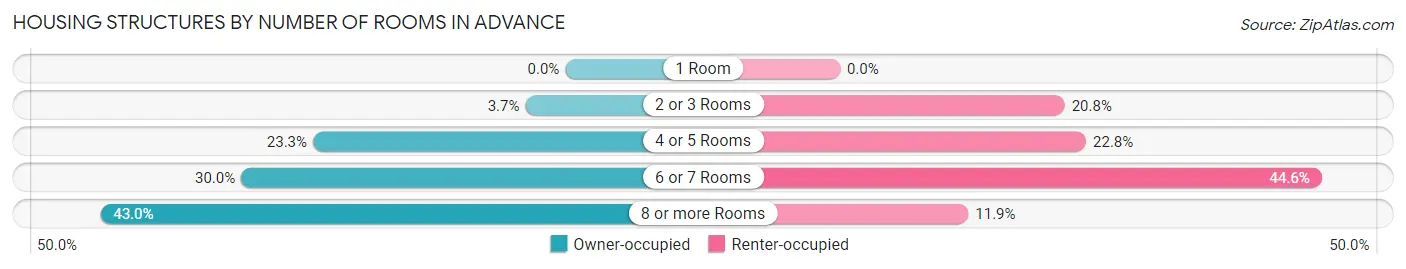
| Number of Rooms | Owner-occupied | Renter-occupied |
| 1 Room | 0 (0.0%) | 0 (0.0%) |
| 2 or 3 Rooms | 15 (3.7%) | 21 (20.8%) |
| 4 or 5 Rooms | 95 (23.3%) | 23 (22.8%) |
| 6 or 7 Rooms | 122 (30.0%) | 45 (44.6%) |
| 8 or more Rooms | 175 (43.0%) | 12 (11.9%) |
| Total | 407 (100.0%) | 101 (100.0%) |
Housing Structure by Heating Type in Advance
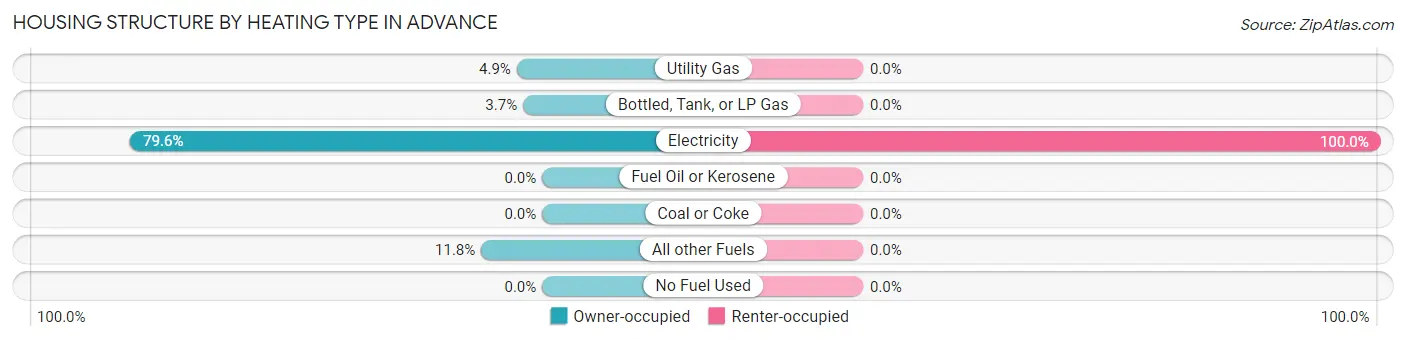
| Heating Type | Owner-occupied | Renter-occupied |
| Utility Gas | 20 (4.9%) | 0 (0.0%) |
| Bottled, Tank, or LP Gas | 15 (3.7%) | 0 (0.0%) |
| Electricity | 324 (79.6%) | 101 (100.0%) |
| Fuel Oil or Kerosene | 0 (0.0%) | 0 (0.0%) |
| Coal or Coke | 0 (0.0%) | 0 (0.0%) |
| All other Fuels | 48 (11.8%) | 0 (0.0%) |
| No Fuel Used | 0 (0.0%) | 0 (0.0%) |
| Total | 407 (100.0%) | 101 (100.0%) |
Household Vehicle Usage in Advance
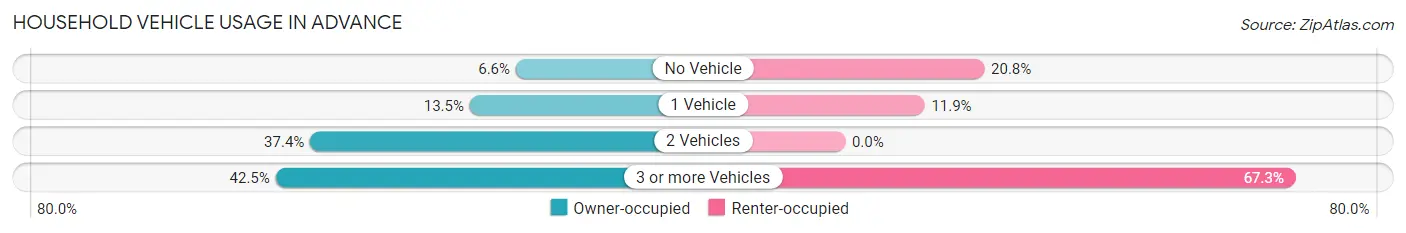
| Vehicles per Household | Owner-occupied | Renter-occupied |
| No Vehicle | 27 (6.6%) | 21 (20.8%) |
| 1 Vehicle | 55 (13.5%) | 12 (11.9%) |
| 2 Vehicles | 152 (37.3%) | 0 (0.0%) |
| 3 or more Vehicles | 173 (42.5%) | 68 (67.3%) |
| Total | 407 (100.0%) | 101 (100.0%) |
Real Estate & Mortgages in Advance
Real Estate and Mortgage Overview in Advance
| Characteristic | Without Mortgage | With Mortgage |
| Housing Units | 123 | 284 |
| Median Property Value | $157,600 | $389,900 |
| Median Household Income | $52,958 | $111 |
| Monthly Housing Costs | $348 | $0 |
| Real Estate Taxes | $1,057 | $0 |
Property Value by Mortgage Status in Advance
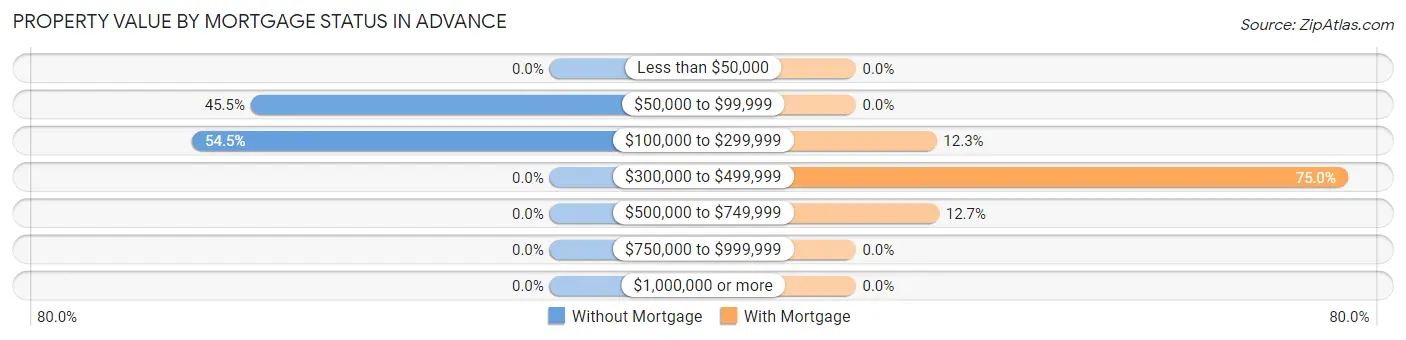
| Property Value | Without Mortgage | With Mortgage |
| Less than $50,000 | 0 (0.0%) | 0 (0.0%) |
| $50,000 to $99,999 | 56 (45.5%) | 0 (0.0%) |
| $100,000 to $299,999 | 67 (54.5%) | 35 (12.3%) |
| $300,000 to $499,999 | 0 (0.0%) | 213 (75.0%) |
| $500,000 to $749,999 | 0 (0.0%) | 36 (12.7%) |
| $750,000 to $999,999 | 0 (0.0%) | 0 (0.0%) |
| $1,000,000 or more | 0 (0.0%) | 0 (0.0%) |
| Total | 123 (100.0%) | 284 (100.0%) |
Household Income by Mortgage Status in Advance
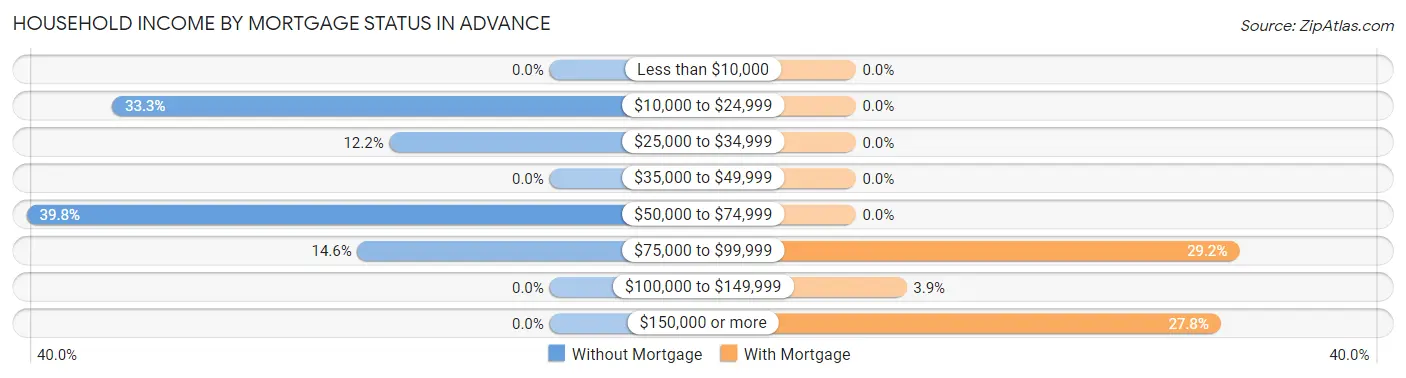
| Household Income | Without Mortgage | With Mortgage |
| Less than $10,000 | 0 (0.0%) | 0 (0.0%) |
| $10,000 to $24,999 | 41 (33.3%) | 0 (0.0%) |
| $25,000 to $34,999 | 15 (12.2%) | 0 (0.0%) |
| $35,000 to $49,999 | 0 (0.0%) | 0 (0.0%) |
| $50,000 to $74,999 | 49 (39.8%) | 0 (0.0%) |
| $75,000 to $99,999 | 18 (14.6%) | 83 (29.2%) |
| $100,000 to $149,999 | 0 (0.0%) | 11 (3.9%) |
| $150,000 or more | 0 (0.0%) | 79 (27.8%) |
| Total | 123 (100.0%) | 284 (100.0%) |
Property Value to Household Income Ratio in Advance
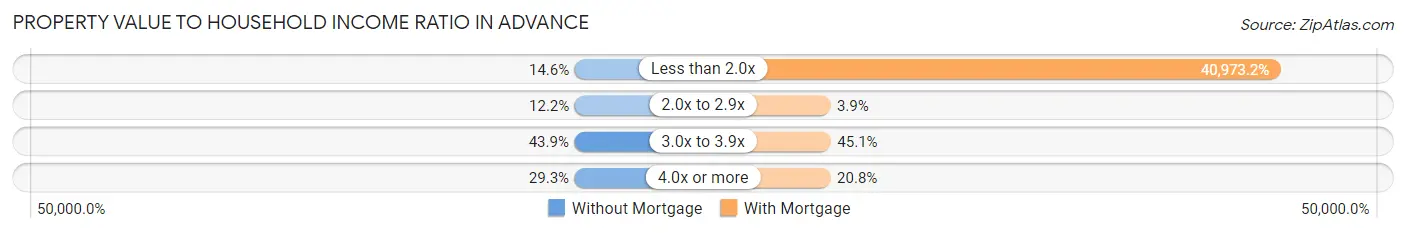
| Value-to-Income Ratio | Without Mortgage | With Mortgage |
| Less than 2.0x | 18 (14.6%) | 116,364 (40,973.2%) |
| 2.0x to 2.9x | 15 (12.2%) | 11 (3.9%) |
| 3.0x to 3.9x | 54 (43.9%) | 128 (45.1%) |
| 4.0x or more | 36 (29.3%) | 59 (20.8%) |
| Total | 123 (100.0%) | 284 (100.0%) |
Real Estate Taxes by Mortgage Status in Advance
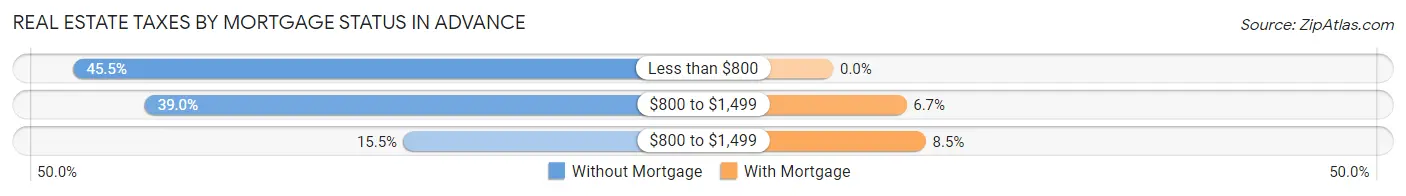
| Property Taxes | Without Mortgage | With Mortgage |
| Less than $800 | 56 (45.5%) | 0 (0.0%) |
| $800 to $1,499 | 48 (39.0%) | 19 (6.7%) |
| $800 to $1,499 | 19 (15.4%) | 24 (8.5%) |
| Total | 123 (100.0%) | 284 (100.0%) |
Health & Disability in Advance
Health Insurance Coverage by Age in Advance
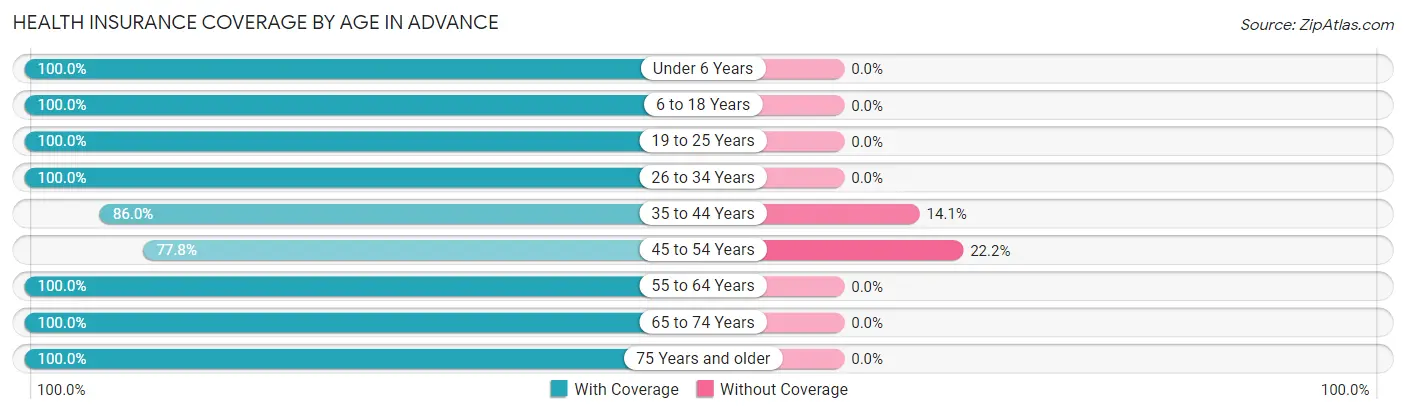
| Age Bracket | With Coverage | Without Coverage |
| Under 6 Years | 213 (100.0%) | 0 (0.0%) |
| 6 to 18 Years | 364 (100.0%) | 0 (0.0%) |
| 19 to 25 Years | 108 (100.0%) | 0 (0.0%) |
| 26 to 34 Years | 67 (100.0%) | 0 (0.0%) |
| 35 to 44 Years | 159 (86.0%) | 26 (14.1%) |
| 45 to 54 Years | 193 (77.8%) | 55 (22.2%) |
| 55 to 64 Years | 233 (100.0%) | 0 (0.0%) |
| 65 to 74 Years | 107 (100.0%) | 0 (0.0%) |
| 75 Years and older | 80 (100.0%) | 0 (0.0%) |
| Total | 1,524 (95.0%) | 81 (5.1%) |
Health Insurance Coverage by Citizenship Status in Advance
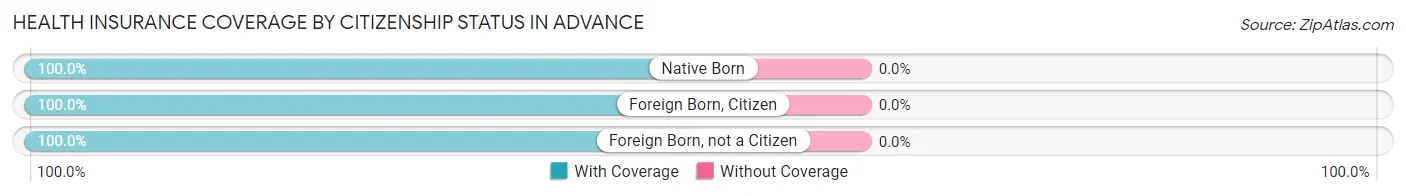
| Citizenship Status | With Coverage | Without Coverage |
| Native Born | 213 (100.0%) | 0 (0.0%) |
| Foreign Born, Citizen | 364 (100.0%) | 0 (0.0%) |
| Foreign Born, not a Citizen | 108 (100.0%) | 0 (0.0%) |
Health Insurance Coverage by Household Income in Advance
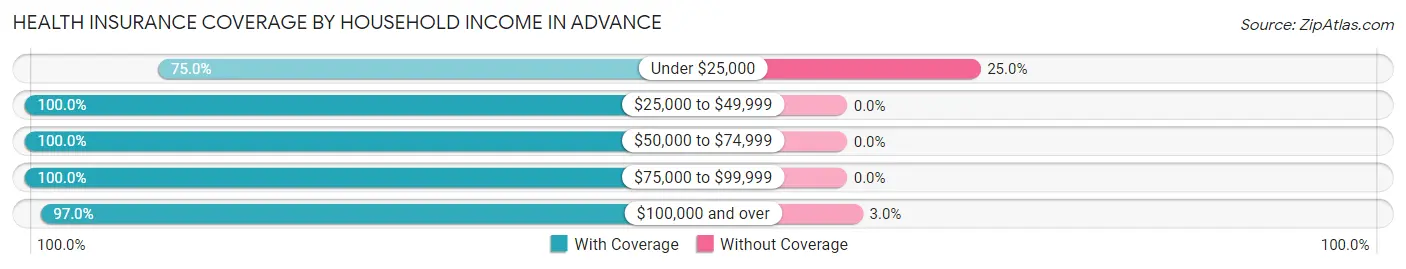
| Household Income | With Coverage | Without Coverage |
| Under $25,000 | 165 (75.0%) | 55 (25.0%) |
| $25,000 to $49,999 | 15 (100.0%) | 0 (0.0%) |
| $50,000 to $74,999 | 434 (100.0%) | 0 (0.0%) |
| $75,000 to $99,999 | 57 (100.0%) | 0 (0.0%) |
| $100,000 and over | 853 (97.0%) | 26 (3.0%) |
Public vs Private Health Insurance Coverage by Age in Advance
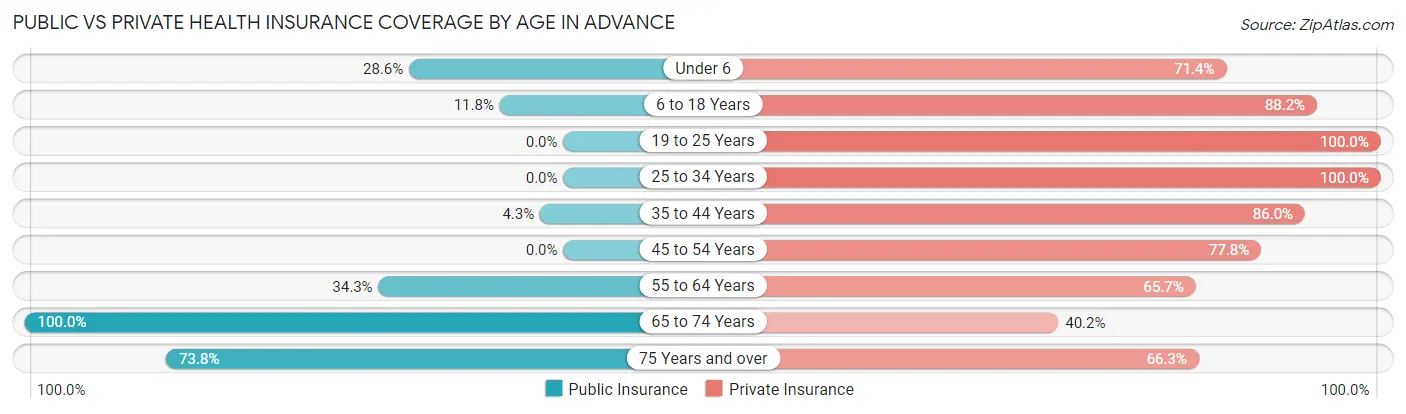
| Age Bracket | Public Insurance | Private Insurance |
| Under 6 | 61 (28.6%) | 152 (71.4%) |
| 6 to 18 Years | 43 (11.8%) | 321 (88.2%) |
| 19 to 25 Years | 0 (0.0%) | 108 (100.0%) |
| 25 to 34 Years | 0 (0.0%) | 67 (100.0%) |
| 35 to 44 Years | 8 (4.3%) | 159 (86.0%) |
| 45 to 54 Years | 0 (0.0%) | 193 (77.8%) |
| 55 to 64 Years | 80 (34.3%) | 153 (65.7%) |
| 65 to 74 Years | 107 (100.0%) | 43 (40.2%) |
| 75 Years and over | 59 (73.8%) | 53 (66.2%) |
| Total | 358 (22.3%) | 1,249 (77.8%) |
Disability Status by Sex by Age in Advance
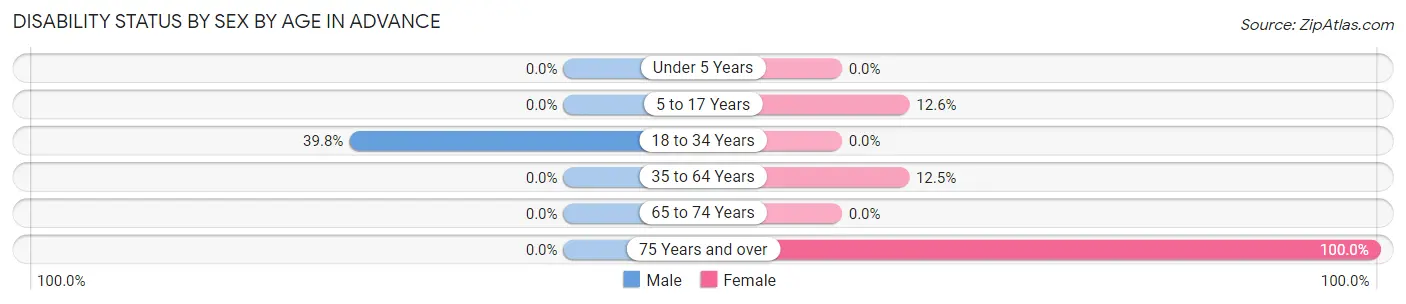
| Age Bracket | Male | Female |
| Under 5 Years | 0 (0.0%) | 0 (0.0%) |
| 5 to 17 Years | 0 (0.0%) | 30 (12.6%) |
| 18 to 34 Years | 33 (39.8%) | 0 (0.0%) |
| 35 to 64 Years | 0 (0.0%) | 46 (12.5%) |
| 65 to 74 Years | 0 (0.0%) | 0 (0.0%) |
| 75 Years and over | 0 (0.0%) | 38 (100.0%) |
Disability Class by Sex by Age in Advance
Disability Class: Hearing Difficulty
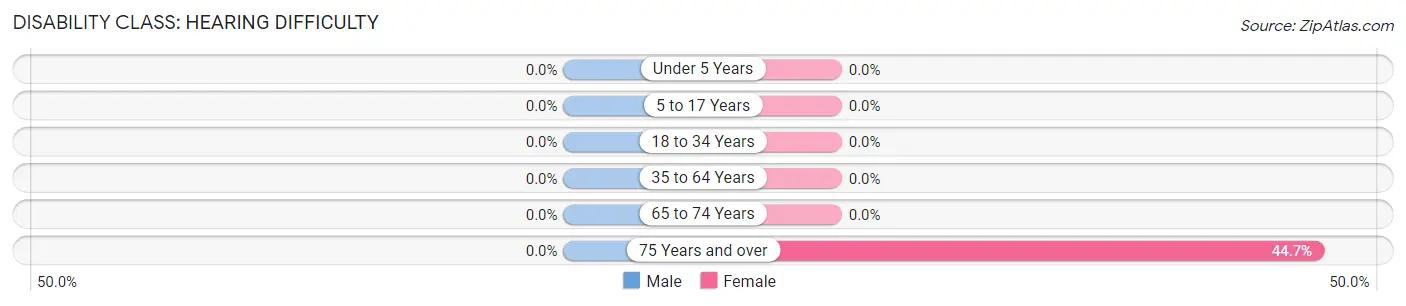
| Age Bracket | Male | Female |
| Under 5 Years | 0 (0.0%) | 0 (0.0%) |
| 5 to 17 Years | 0 (0.0%) | 0 (0.0%) |
| 18 to 34 Years | 0 (0.0%) | 0 (0.0%) |
| 35 to 64 Years | 0 (0.0%) | 0 (0.0%) |
| 65 to 74 Years | 0 (0.0%) | 0 (0.0%) |
| 75 Years and over | 0 (0.0%) | 17 (44.7%) |
Disability Class: Vision Difficulty
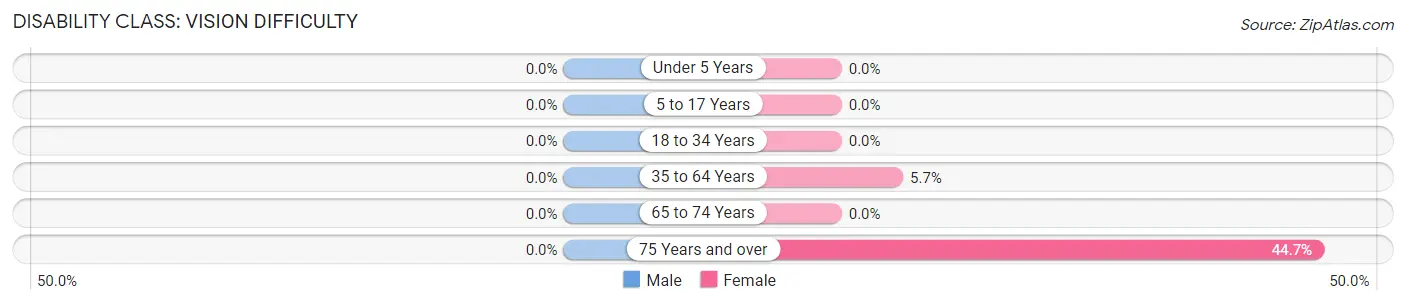
| Age Bracket | Male | Female |
| Under 5 Years | 0 (0.0%) | 0 (0.0%) |
| 5 to 17 Years | 0 (0.0%) | 0 (0.0%) |
| 18 to 34 Years | 0 (0.0%) | 0 (0.0%) |
| 35 to 64 Years | 0 (0.0%) | 21 (5.7%) |
| 65 to 74 Years | 0 (0.0%) | 0 (0.0%) |
| 75 Years and over | 0 (0.0%) | 17 (44.7%) |
Disability Class: Cognitive Difficulty
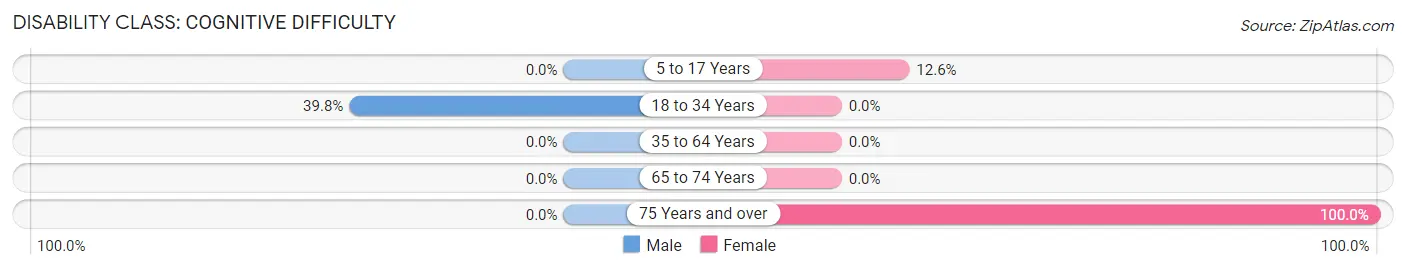
| Age Bracket | Male | Female |
| 5 to 17 Years | 0 (0.0%) | 30 (12.6%) |
| 18 to 34 Years | 33 (39.8%) | 0 (0.0%) |
| 35 to 64 Years | 0 (0.0%) | 0 (0.0%) |
| 65 to 74 Years | 0 (0.0%) | 0 (0.0%) |
| 75 Years and over | 0 (0.0%) | 38 (100.0%) |
Disability Class: Ambulatory Difficulty
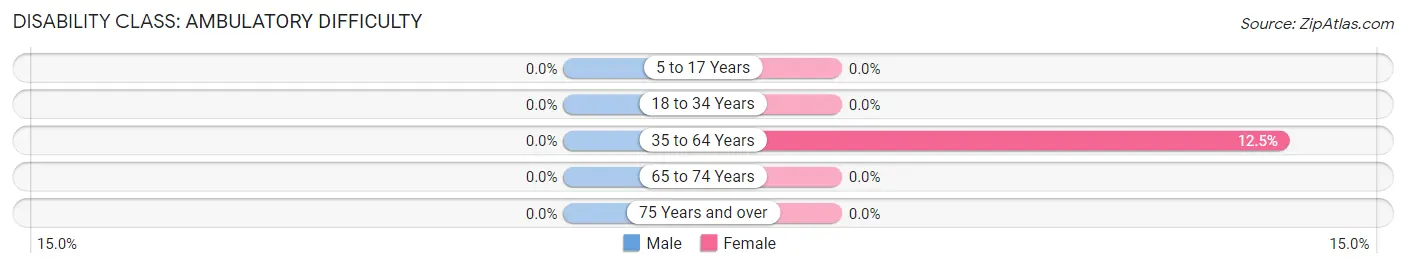
| Age Bracket | Male | Female |
| 5 to 17 Years | 0 (0.0%) | 0 (0.0%) |
| 18 to 34 Years | 0 (0.0%) | 0 (0.0%) |
| 35 to 64 Years | 0 (0.0%) | 46 (12.5%) |
| 65 to 74 Years | 0 (0.0%) | 0 (0.0%) |
| 75 Years and over | 0 (0.0%) | 0 (0.0%) |
Disability Class: Self-Care Difficulty
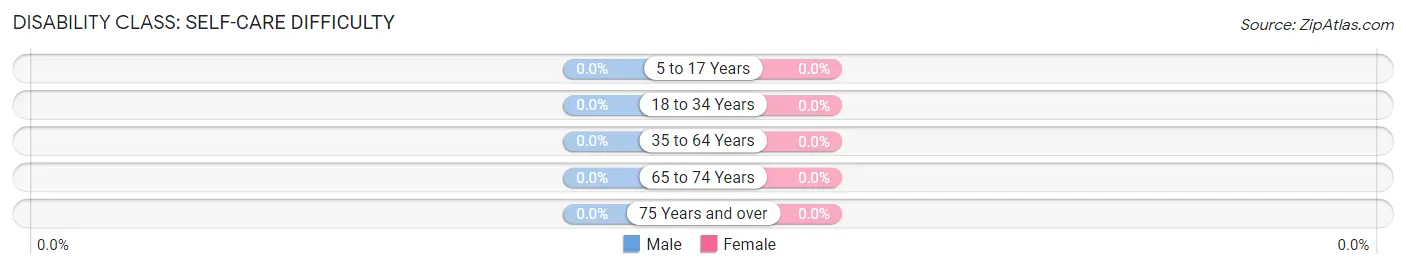
| Age Bracket | Male | Female |
| 5 to 17 Years | 0 (0.0%) | 0 (0.0%) |
| 18 to 34 Years | 0 (0.0%) | 0 (0.0%) |
| 35 to 64 Years | 0 (0.0%) | 0 (0.0%) |
| 65 to 74 Years | 0 (0.0%) | 0 (0.0%) |
| 75 Years and over | 0 (0.0%) | 0 (0.0%) |
Technology Access in Advance
Computing Device Access in Advance
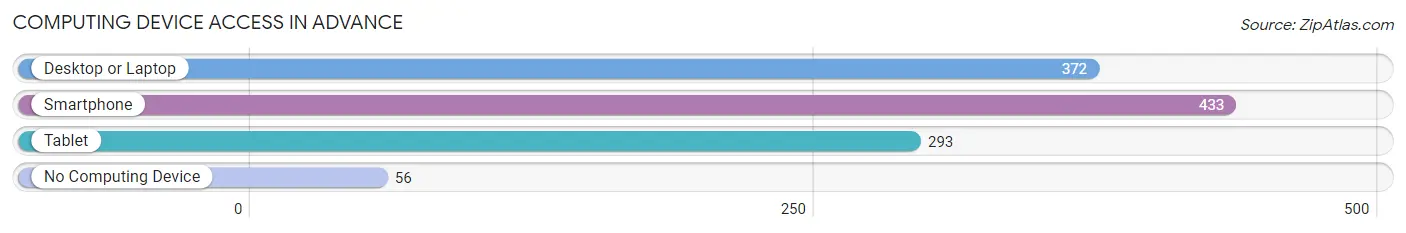
| Device Type | # Households | % Households |
| Desktop or Laptop | 372 | 73.2% |
| Smartphone | 433 | 85.2% |
| Tablet | 293 | 57.7% |
| No Computing Device | 56 | 11.0% |
| Total | 508 | 100.0% |
Internet Access in Advance
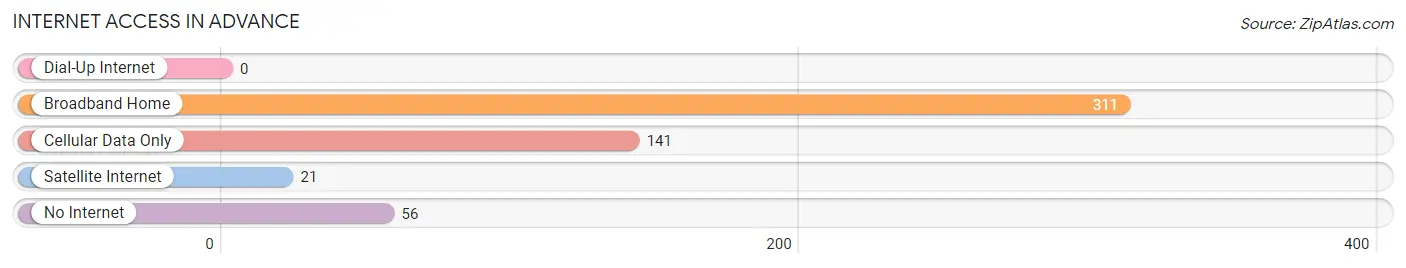
| Internet Type | # Households | % Households |
| Dial-Up Internet | 0 | 0.0% |
| Broadband Home | 311 | 61.2% |
| Cellular Data Only | 141 | 27.8% |
| Satellite Internet | 21 | 4.1% |
| No Internet | 56 | 11.0% |
| Total | 508 | 100.0% |
Advance Summary
NC History
North Carolina is one of the original 13 colonies and was the first state to declare independence from Britain in 1776. The state was originally inhabited by Native American tribes, including the Cherokee, Catawba, and Tuscarora. The first European settlers arrived in the late 16th century, and the state was officially established in 1729.
North Carolina was a major player in the American Revolution, and was the site of several major battles, including the Battle of Moore’s Creek Bridge and the Battle of Kings Mountain. After the war, the state became a major center of the cotton and tobacco industries, and was a major supplier of naval stores during the War of 1812.
In the 19th century, North Carolina was a major center of the Civil War, and was the site of several major battles, including the Battle of Fort Fisher and the Battle of Bentonville. After the war, the state was a major center of Reconstruction, and was the site of several major civil rights battles, including the Greensboro sit-ins and the Wilmington insurrection.
Geography
North Carolina is located in the southeastern United States, bordered by Virginia to the north, South Carolina to the south, Georgia to the west, and the Atlantic Ocean to the east. The state is divided into three distinct geographic regions: the Coastal Plain, the Piedmont, and the Appalachian Mountains.
The Coastal Plain is a flat, low-lying region that stretches along the Atlantic coast. It is home to the state’s largest cities, including Charlotte, Raleigh, and Wilmington. The Piedmont is a hilly region that stretches from the Coastal Plain to the Appalachian Mountains. It is home to the state’s capital, Raleigh, as well as several other major cities, including Durham, Greensboro, and Winston-Salem. The Appalachian Mountains are a rugged, mountainous region that stretches from the Piedmont to the Tennessee border.
Economy
North Carolina’s economy is largely based on agriculture, manufacturing, and services. The state is a major producer of tobacco, cotton, and soybeans, and is also a major producer of furniture, textiles, and chemicals. The state is also home to several major corporations, including Bank of America, Duke Energy, and Lowe’s.
The state’s economy has been growing steadily since the late 1990s, and the state has seen a significant increase in jobs in the technology, finance, and healthcare sectors. The state’s unemployment rate has been steadily declining since the Great Recession, and is currently at 4.2%.
Demographics
As of 2020, North Carolina’s population was estimated to be 10.5 million. The state is racially diverse, with the largest racial groups being White (68.5%), Black or African American (21.5%), and Hispanic or Latino (8.7%). The state is also home to a large Native American population, with the largest tribes being the Cherokee, Lumbee, and Catawba.
The state’s largest cities are Charlotte (872,498), Raleigh (464,758), and Greensboro (285,342). The state’s capital, Raleigh, is the second-largest city in the state. The state’s largest metropolitan area is the Charlotte-Concord-Gastonia metropolitan area, which is home to 2.5 million people.
Common Questions
What is Per Capita Income in Advance?
Per Capita income in Advance is $29,995.
What is the Median Family Income in Advance?
Median Family Income in Advance is $112,500.
What is the Median Household income in Advance?
Median Household Income in Advance is $91,528.
What is Income or Wage Gap in Advance?
Income or Wage Gap in Advance is 29.7%.
Women in Advance earn 70.3 cents for every dollar earned by a man.
What is Inequality or Gini Index in Advance?
Inequality or Gini Index in Advance is 0.33.
What is the Total Population of Advance?
Total Population of Advance is 1,605.
What is the Total Male Population of Advance?
Total Male Population of Advance is 752.
What is the Total Female Population of Advance?
Total Female Population of Advance is 853.
What is the Ratio of Males per 100 Females in Advance?
There are 88.16 Males per 100 Females in Advance.
What is the Ratio of Females per 100 Males in Advance?
There are 113.43 Females per 100 Males in Advance.
What is the Median Population Age in Advance?
Median Population Age in Advance is 39.3 Years.
What is the Average Family Size in Advance
Average Family Size in Advance is 3.7 People.
What is the Average Household Size in Advance
Average Household Size in Advance is 3.2 People.
How Large is the Labor Force in Advance?
There are 673 People in the Labor Forcein in Advance.
What is the Percentage of People in the Labor Force in Advance?
62.3% of People are in the Labor Force in Advance.