Canton, NC Map & Demographics
Canton Map
Canton Overview
$29,777
PER CAPITA INCOME
$64,539
AVG FAMILY INCOME
$54,728
AVG HOUSEHOLD INCOME
35.0%
WAGE / INCOME GAP [ % ]
65.0¢/ $1
WAGE / INCOME GAP [ $ ]
0.40
INEQUALITY / GINI INDEX
4,410
TOTAL POPULATION
2,085
MALE POPULATION
2,325
FEMALE POPULATION
89.68
MALES / 100 FEMALES
111.51
FEMALES / 100 MALES
36.3
MEDIAN AGE
3.1
AVG FAMILY SIZE
2.4
AVG HOUSEHOLD SIZE
2,408
LABOR FORCE [ PEOPLE ]
67.1%
PERCENT IN LABOR FORCE
1.0%
UNEMPLOYMENT RATE
Canton Zip Codes
Canton Area Codes
Income in Canton
Income Overview in Canton
Per Capita Income in Canton is $29,777, while median incomes of families and households are $64,539 and $54,728 respectively.
| Characteristic | Number | Measure |
| Per Capita Income | 4,410 | $29,777 |
| Median Family Income | 969 | $64,539 |
| Mean Family Income | 969 | $79,754 |
| Median Household Income | 1,832 | $54,728 |
| Mean Household Income | 1,832 | $67,434 |
| Income Deficit | 969 | $0 |
| Wage / Income Gap (%) | 4,410 | 34.99% |
| Wage / Income Gap ($) | 4,410 | 65.01¢ per $1 |
| Gini / Inequality Index | 4,410 | 0.40 |
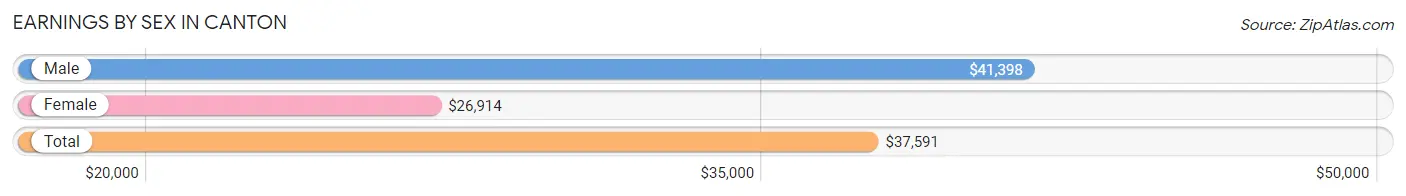
Earnings by Sex in Canton
Average Earnings in Canton are $37,591, $41,398 for men and $26,914 for women, a difference of 35.0%.
| Sex | Number | Average Earnings |
| Male | 1,337 (54.7%) | $41,398 |
| Female | 1,107 (45.3%) | $26,914 |
| Total | 2,444 (100.0%) | $37,591 |
Earnings by Sex by Income Bracket in Canton
The most common earnings brackets in Canton are $40,000 to $44,999 for men (213 | 15.9%) and $15,000 to $17,499 for women (119 | 10.7%).
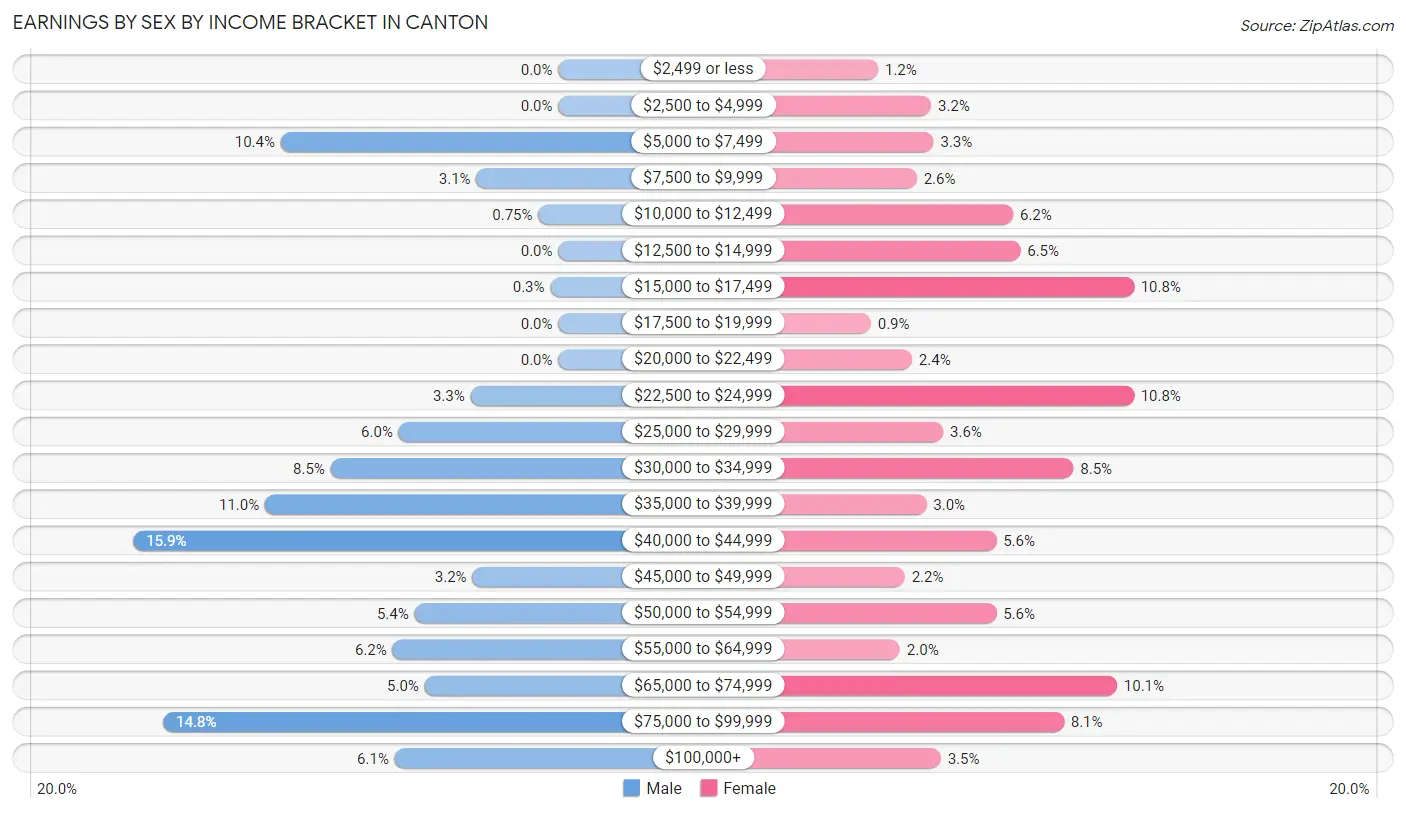
| Income | Male | Female |
| $2,499 or less | 0 (0.0%) | 13 (1.2%) |
| $2,500 to $4,999 | 0 (0.0%) | 35 (3.2%) |
| $5,000 to $7,499 | 139 (10.4%) | 36 (3.3%) |
| $7,500 to $9,999 | 41 (3.1%) | 29 (2.6%) |
| $10,000 to $12,499 | 10 (0.7%) | 69 (6.2%) |
| $12,500 to $14,999 | 0 (0.0%) | 72 (6.5%) |
| $15,000 to $17,499 | 4 (0.3%) | 119 (10.7%) |
| $17,500 to $19,999 | 0 (0.0%) | 10 (0.9%) |
| $20,000 to $22,499 | 0 (0.0%) | 27 (2.4%) |
| $22,500 to $24,999 | 44 (3.3%) | 119 (10.7%) |
| $25,000 to $29,999 | 80 (6.0%) | 40 (3.6%) |
| $30,000 to $34,999 | 114 (8.5%) | 94 (8.5%) |
| $35,000 to $39,999 | 147 (11.0%) | 33 (3.0%) |
| $40,000 to $44,999 | 213 (15.9%) | 62 (5.6%) |
| $45,000 to $49,999 | 43 (3.2%) | 24 (2.2%) |
| $50,000 to $54,999 | 72 (5.4%) | 62 (5.6%) |
| $55,000 to $64,999 | 83 (6.2%) | 22 (2.0%) |
| $65,000 to $74,999 | 67 (5.0%) | 112 (10.1%) |
| $75,000 to $99,999 | 198 (14.8%) | 90 (8.1%) |
| $100,000+ | 82 (6.1%) | 39 (3.5%) |
| Total | 1,337 (100.0%) | 1,107 (100.0%) |
Earnings by Sex by Educational Attainment in Canton
Average earnings in Canton are $42,422 for men and $34,063 for women, a difference of 19.7%. Men with an educational attainment of bachelor's degree enjoy the highest average annual earnings of $107,692, while those with college or associate's degree education earn the least with $41,661. Women with an educational attainment of graduate degree earn the most with the average annual earnings of $69,375, while those with high school diploma education have the smallest earnings of $13,591.
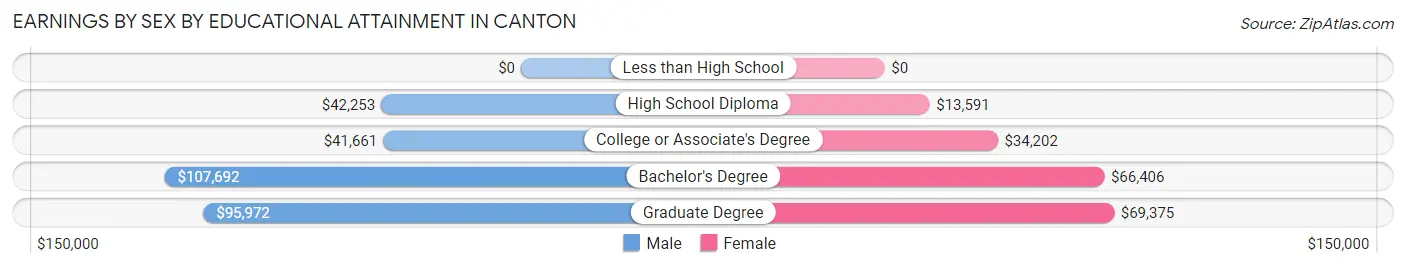
| Educational Attainment | Male Income | Female Income |
| Less than High School | - | - |
| High School Diploma | $42,253 | $13,591 |
| College or Associate's Degree | $41,661 | $34,202 |
| Bachelor's Degree | $107,692 | $66,406 |
| Graduate Degree | $95,972 | $69,375 |
| Total | $42,422 | $34,063 |
Family Income in Canton
Family Income Brackets in Canton
According to the Canton family income data, there are 276 families falling into the $50,000 to $74,999 income range, which is the most common income bracket and makes up 28.5% of all families. Conversely, the $200,000+ income bracket is the least frequent group with only 22 families (2.3%) belonging to this category.
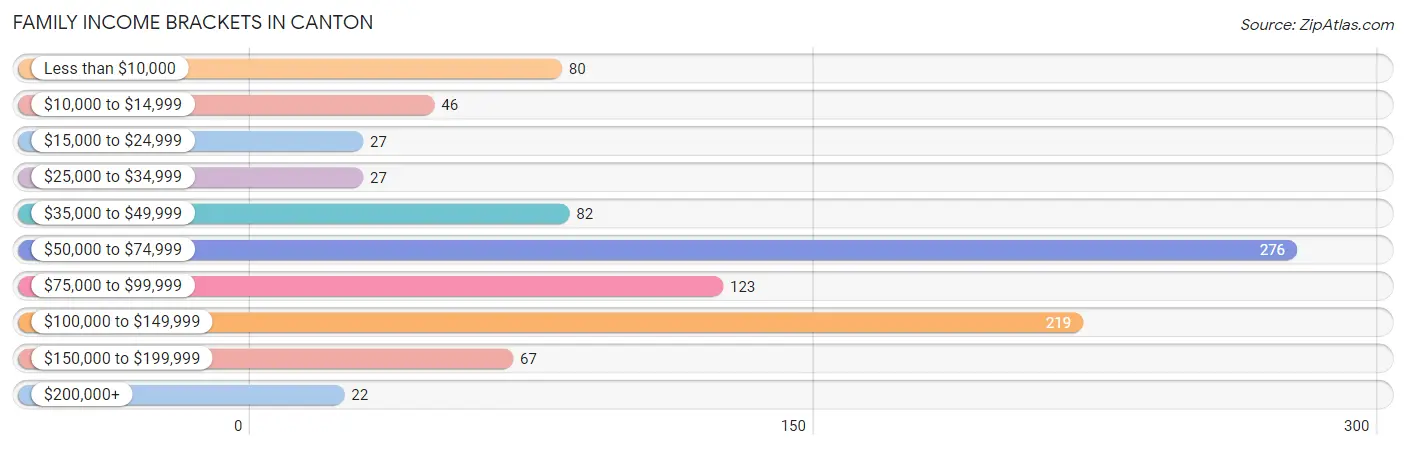
| Income Bracket | # Families | % Families |
| Less than $10,000 | 80 | 8.3% |
| $10,000 to $14,999 | 46 | 4.7% |
| $15,000 to $24,999 | 27 | 2.8% |
| $25,000 to $34,999 | 27 | 2.8% |
| $35,000 to $49,999 | 82 | 8.5% |
| $50,000 to $74,999 | 276 | 28.5% |
| $75,000 to $99,999 | 123 | 12.7% |
| $100,000 to $149,999 | 219 | 22.6% |
| $150,000 to $199,999 | 67 | 6.9% |
| $200,000+ | 22 | 2.3% |
Family Income by Famaliy Size in Canton
5-person families (57 | 5.9%) account for the highest median family income in Canton with $114,044 per family, while 2-person families (465 | 48.0%) have the highest median income of $41,875 per family member.
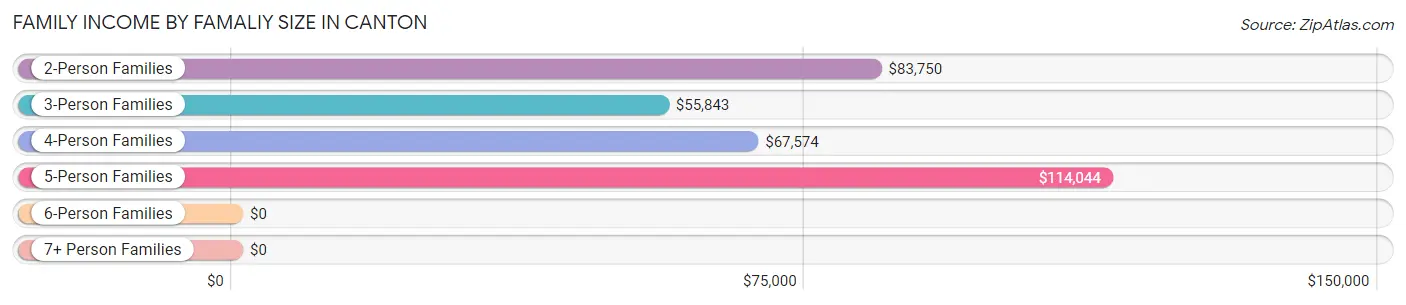
| Income Bracket | # Families | Median Income |
| 2-Person Families | 465 (48.0%) | $83,750 |
| 3-Person Families | 255 (26.3%) | $55,843 |
| 4-Person Families | 169 (17.4%) | $67,574 |
| 5-Person Families | 57 (5.9%) | $114,044 |
| 6-Person Families | 23 (2.4%) | $0 |
| 7+ Person Families | 0 (0.0%) | $0 |
| Total | 969 (100.0%) | $64,539 |
Family Income by Number of Earners in Canton
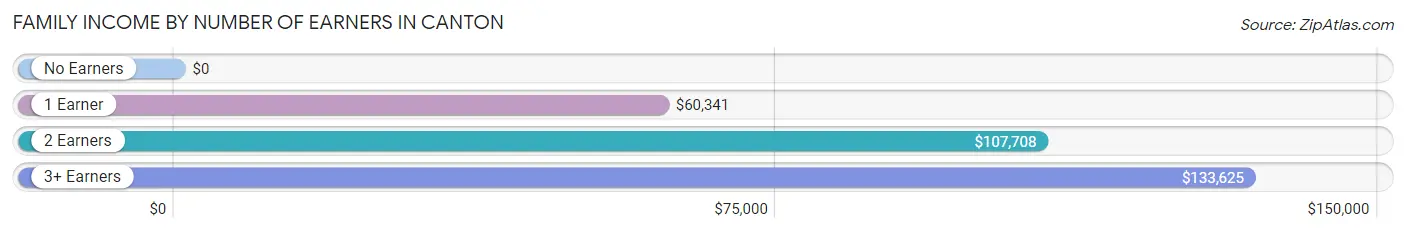
| Number of Earners | # Families | Median Income |
| No Earners | 168 (17.3%) | $0 |
| 1 Earner | 327 (33.8%) | $60,341 |
| 2 Earners | 421 (43.4%) | $107,708 |
| 3+ Earners | 53 (5.5%) | $133,625 |
| Total | 969 (100.0%) | $64,539 |
Household Income in Canton
Household Income Brackets in Canton
With 440 households falling in the category, the $50,000 to $74,999 income range is the most frequent in Canton, accounting for 24.0% of all households. In contrast, only 53 households (2.9%) fall into the $200,000+ income bracket, making it the least populous group.
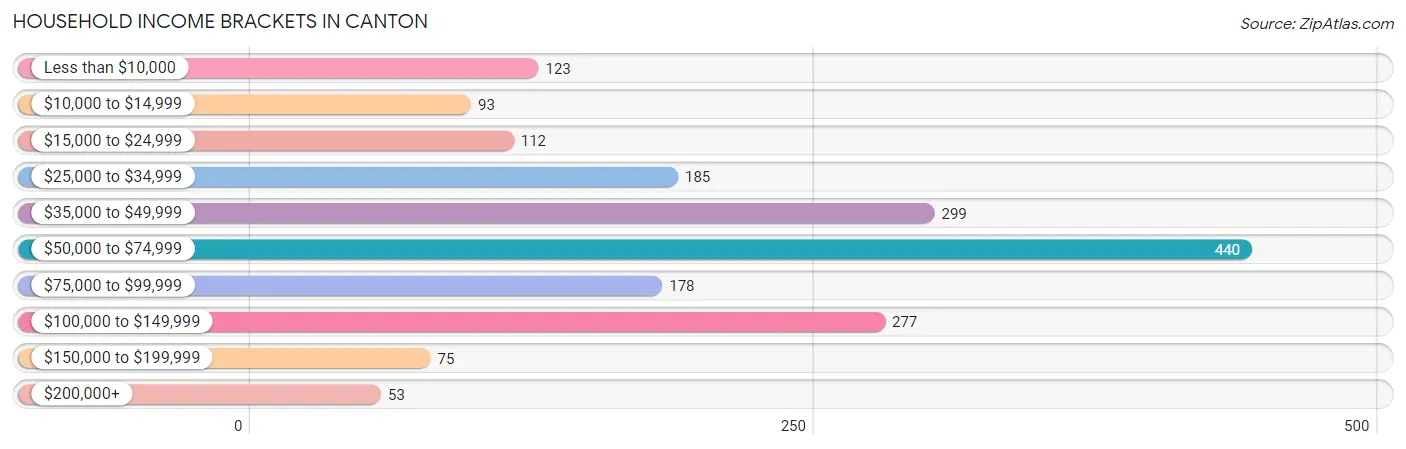
| Income Bracket | # Households | % Households |
| Less than $10,000 | 123 | 6.7% |
| $10,000 to $14,999 | 93 | 5.1% |
| $15,000 to $24,999 | 112 | 6.1% |
| $25,000 to $34,999 | 185 | 10.1% |
| $35,000 to $49,999 | 299 | 16.3% |
| $50,000 to $74,999 | 440 | 24.0% |
| $75,000 to $99,999 | 178 | 9.7% |
| $100,000 to $149,999 | 277 | 15.1% |
| $150,000 to $199,999 | 75 | 4.1% |
| $200,000+ | 53 | 2.9% |
Household Income by Householder Age in Canton
The median household income in Canton is $54,728, with the highest median household income of $72,037 found in the 45 to 64 years age bracket for the primary householder. A total of 650 households (35.5%) fall into this category. Meanwhile, the 65+ years age bracket for the primary householder has the lowest median household income of $31,125, with 520 households (28.4%) in this group.
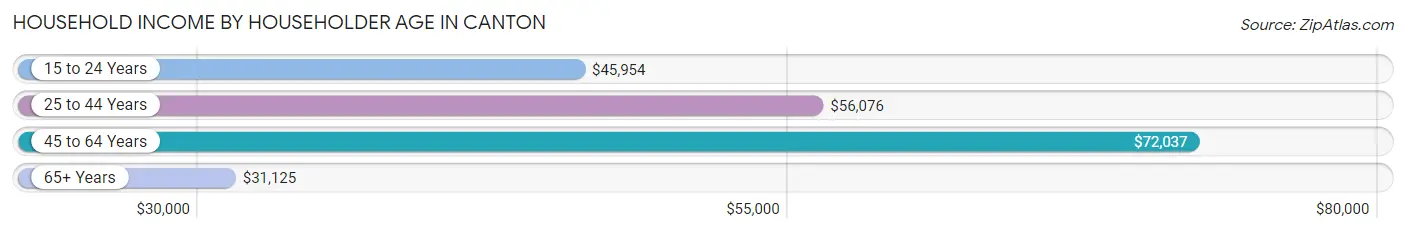
| Income Bracket | # Households | Median Income |
| 15 to 24 Years | 101 (5.5%) | $45,954 |
| 25 to 44 Years | 561 (30.6%) | $56,076 |
| 45 to 64 Years | 650 (35.5%) | $72,037 |
| 65+ Years | 520 (28.4%) | $31,125 |
| Total | 1,832 (100.0%) | $54,728 |
Poverty in Canton
Income Below Poverty by Sex and Age in Canton
With 13.4% poverty level for males and 14.8% for females among the residents of Canton, 65 to 74 year old males and 6 to 11 year old females are the most vulnerable to poverty, with 58 males (47.5%) and 41 females (32.0%) in their respective age groups living below the poverty level.
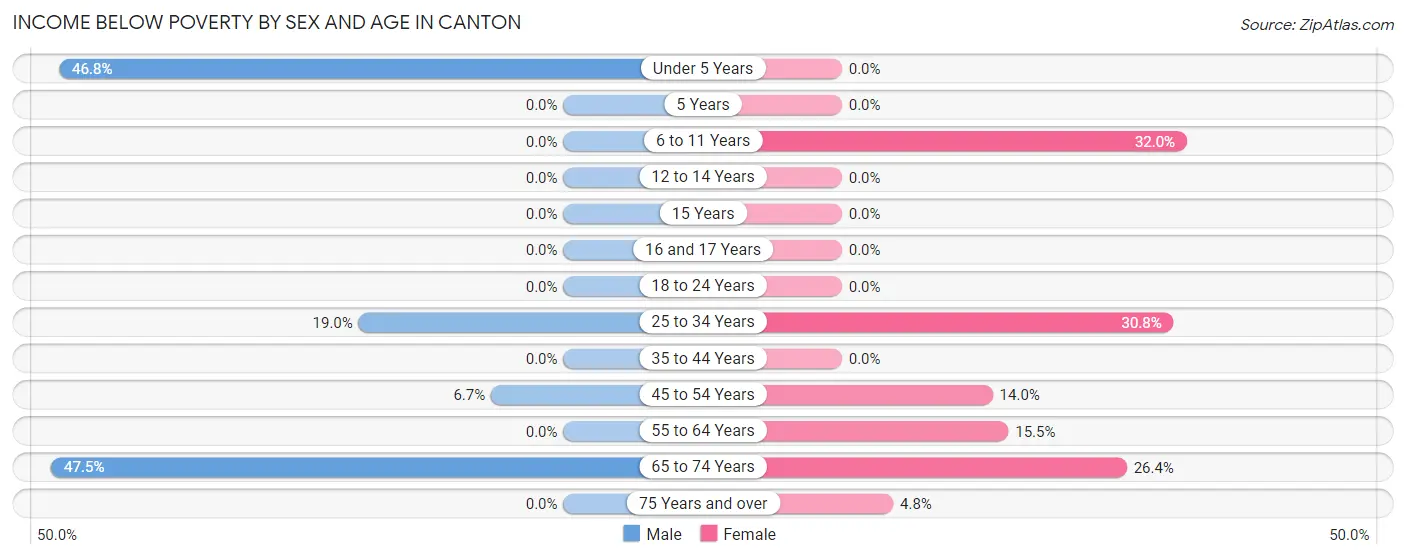
| Age Bracket | Male | Female |
| Under 5 Years | 95 (46.8%) | 0 (0.0%) |
| 5 Years | 0 (0.0%) | 0 (0.0%) |
| 6 to 11 Years | 0 (0.0%) | 41 (32.0%) |
| 12 to 14 Years | 0 (0.0%) | 0 (0.0%) |
| 15 Years | 0 (0.0%) | 0 (0.0%) |
| 16 and 17 Years | 0 (0.0%) | 0 (0.0%) |
| 18 to 24 Years | 0 (0.0%) | 0 (0.0%) |
| 25 to 34 Years | 103 (19.0%) | 129 (30.8%) |
| 35 to 44 Years | 0 (0.0%) | 0 (0.0%) |
| 45 to 54 Years | 23 (6.7%) | 35 (14.0%) |
| 55 to 64 Years | 0 (0.0%) | 38 (15.4%) |
| 65 to 74 Years | 58 (47.5%) | 78 (26.4%) |
| 75 Years and over | 0 (0.0%) | 8 (4.8%) |
| Total | 279 (13.4%) | 329 (14.8%) |
Income Above Poverty by Sex and Age in Canton
According to the poverty statistics in Canton, males aged 5 years and females aged under 5 years are the age groups that are most secure financially, with 100.0% of males and 100.0% of females in these age groups living above the poverty line.
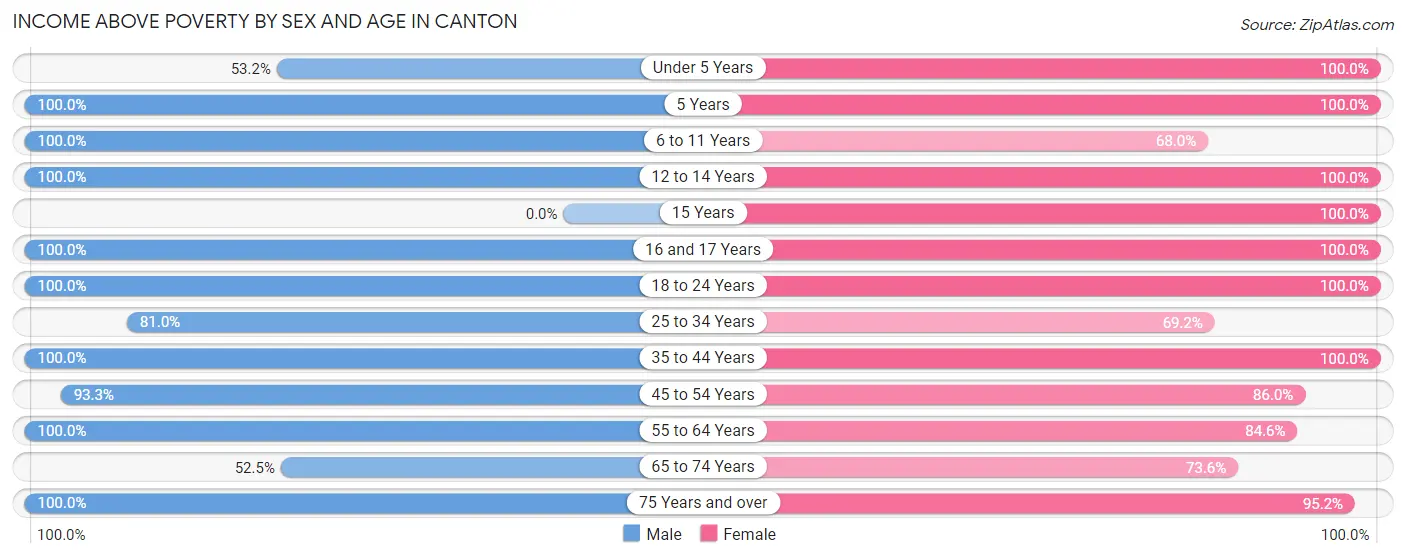
| Age Bracket | Male | Female |
| Under 5 Years | 108 (53.2%) | 103 (100.0%) |
| 5 Years | 10 (100.0%) | 12 (100.0%) |
| 6 to 11 Years | 171 (100.0%) | 87 (68.0%) |
| 12 to 14 Years | 45 (100.0%) | 26 (100.0%) |
| 15 Years | 0 (0.0%) | 49 (100.0%) |
| 16 and 17 Years | 29 (100.0%) | 4 (100.0%) |
| 18 to 24 Years | 102 (100.0%) | 188 (100.0%) |
| 25 to 34 Years | 439 (81.0%) | 290 (69.2%) |
| 35 to 44 Years | 168 (100.0%) | 335 (100.0%) |
| 45 to 54 Years | 320 (93.3%) | 215 (86.0%) |
| 55 to 64 Years | 222 (100.0%) | 208 (84.6%) |
| 65 to 74 Years | 64 (52.5%) | 217 (73.6%) |
| 75 Years and over | 121 (100.0%) | 160 (95.2%) |
| Total | 1,799 (86.6%) | 1,894 (85.2%) |
Income Below Poverty Among Married-Couple Families in Canton
The poverty statistics for married-couple families in Canton show that 5.6% or 37 of the total 661 families live below the poverty line. Families with no children have the highest poverty rate of 10.6%, comprising of 37 families. On the other hand, families with 1 or 2 children have the lowest poverty rate of 0.0%, which includes 0 families.
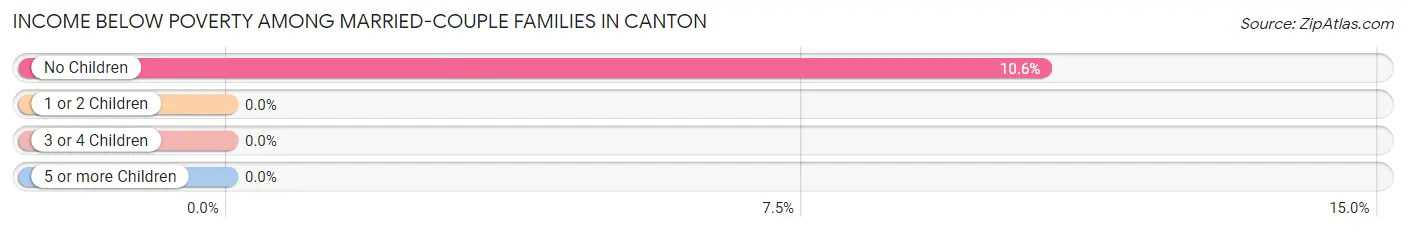
| Children | Above Poverty | Below Poverty |
| No Children | 311 (89.4%) | 37 (10.6%) |
| 1 or 2 Children | 268 (100.0%) | 0 (0.0%) |
| 3 or 4 Children | 45 (100.0%) | 0 (0.0%) |
| 5 or more Children | 0 (0.0%) | 0 (0.0%) |
| Total | 624 (94.4%) | 37 (5.6%) |
Income Below Poverty Among Single-Parent Households in Canton
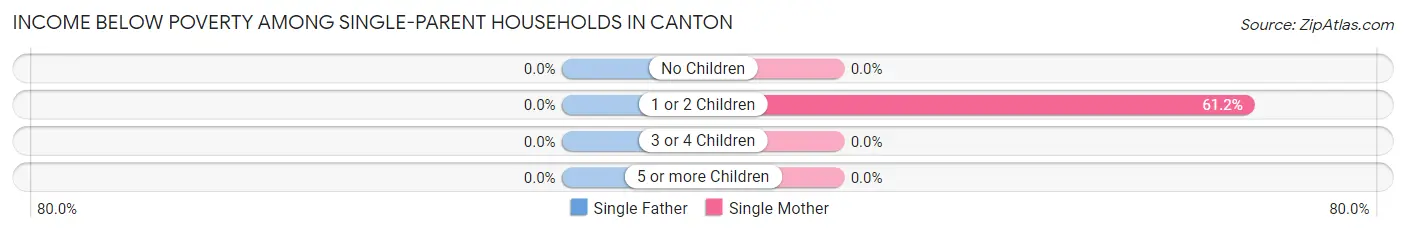
| Children | Single Father | Single Mother |
| No Children | 0 (0.0%) | 0 (0.0%) |
| 1 or 2 Children | 0 (0.0%) | 101 (61.2%) |
| 3 or 4 Children | 0 (0.0%) | 0 (0.0%) |
| 5 or more Children | 0 (0.0%) | 0 (0.0%) |
| Total | 0 (0.0%) | 101 (46.1%) |
Income Below Poverty Among Married-Couple vs Single-Parent Households in Canton
The poverty data for Canton shows that 37 of the married-couple family households (5.6%) and 101 of the single-parent households (32.8%) are living below the poverty level. Within the married-couple family households, those with no children have the highest poverty rate, with 37 households (10.6%) falling below the poverty line. Among the single-parent households, those with 1 or 2 children have the highest poverty rate, with 101 household (45.9%) living below poverty.
| Children | Married-Couple Families | Single-Parent Households |
| No Children | 37 (10.6%) | 0 (0.0%) |
| 1 or 2 Children | 0 (0.0%) | 101 (45.9%) |
| 3 or 4 Children | 0 (0.0%) | 0 (0.0%) |
| 5 or more Children | 0 (0.0%) | 0 (0.0%) |
| Total | 37 (5.6%) | 101 (32.8%) |
Race in Canton
The most populous races in Canton are White / Caucasian (3,914 | 88.7%), Hispanic or Latino (302 | 6.9%), and Two or more Races (158 | 3.6%).

| Race | # Population | % Population |
| Asian | 9 | 0.2% |
| Black / African American | 74 | 1.7% |
| Hawaiian / Pacific | 0 | 0.0% |
| Hispanic or Latino | 302 | 6.9% |
| Native / Alaskan | 113 | 2.6% |
| White / Caucasian | 3,914 | 88.7% |
| Two or more Races | 158 | 3.6% |
| Some other Race | 142 | 3.2% |
| Total | 4,410 | 100.0% |
Ancestry in Canton
The most populous ancestries reported in Canton are English (993 | 22.5%), German (581 | 13.2%), American (421 | 9.6%), Irish (326 | 7.4%), and Mexican (289 | 6.6%), together accounting for 59.2% of all Canton residents.
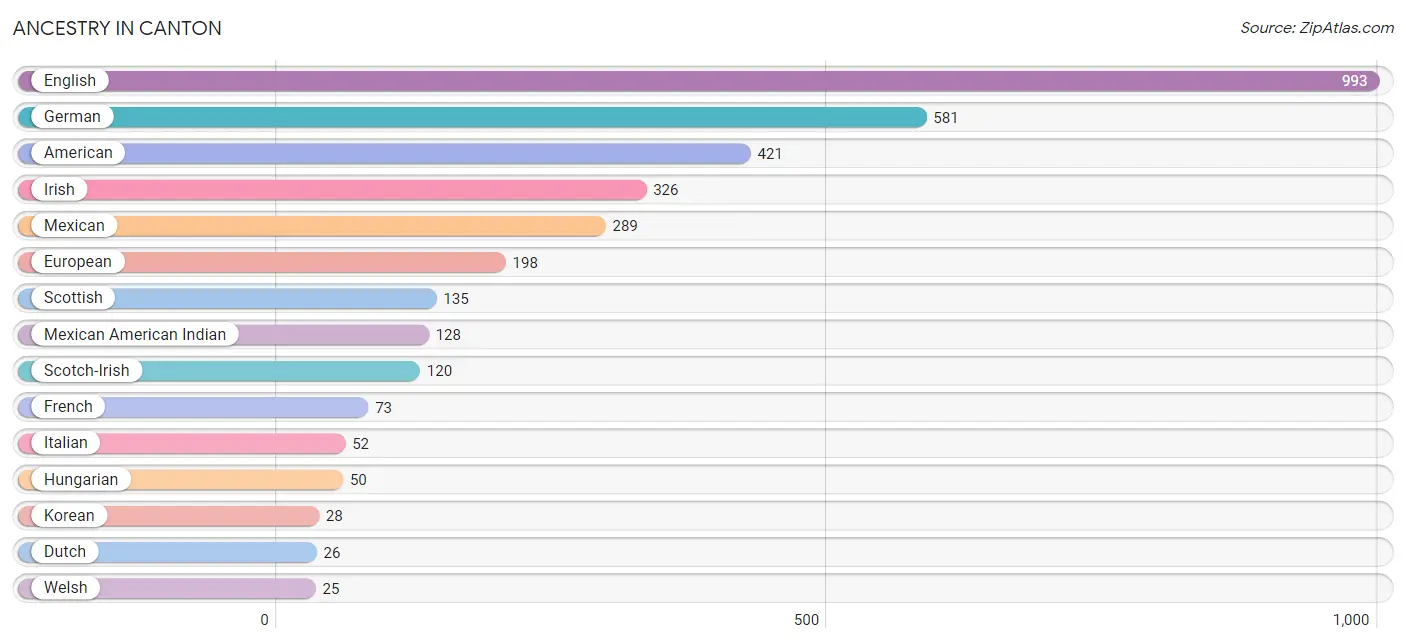
| Ancestry | # Population | % Population |
| American | 421 | 9.6% |
| British | 20 | 0.4% |
| Canadian | 21 | 0.5% |
| Czech | 9 | 0.2% |
| Danish | 16 | 0.4% |
| Dutch | 26 | 0.6% |
| English | 993 | 22.5% |
| European | 198 | 4.5% |
| French | 73 | 1.7% |
| French Canadian | 8 | 0.2% |
| German | 581 | 13.2% |
| Hungarian | 50 | 1.1% |
| Irish | 326 | 7.4% |
| Italian | 52 | 1.2% |
| Korean | 28 | 0.6% |
| Mexican | 289 | 6.6% |
| Mexican American Indian | 128 | 2.9% |
| Puerto Rican | 3 | 0.1% |
| Scotch-Irish | 120 | 2.7% |
| Scottish | 135 | 3.1% |
| Swedish | 9 | 0.2% |
| Swiss | 5 | 0.1% |
| Welsh | 25 | 0.6% | View All 23 Rows |
Immigrants in Canton
The most numerous immigrant groups reported in Canton came from Central America (251 | 5.7%), Latin America (251 | 5.7%), Mexico (251 | 5.7%), Asia (9 | 0.2%), and Philippines (9 | 0.2%), together accounting for 17.5% of all Canton residents.
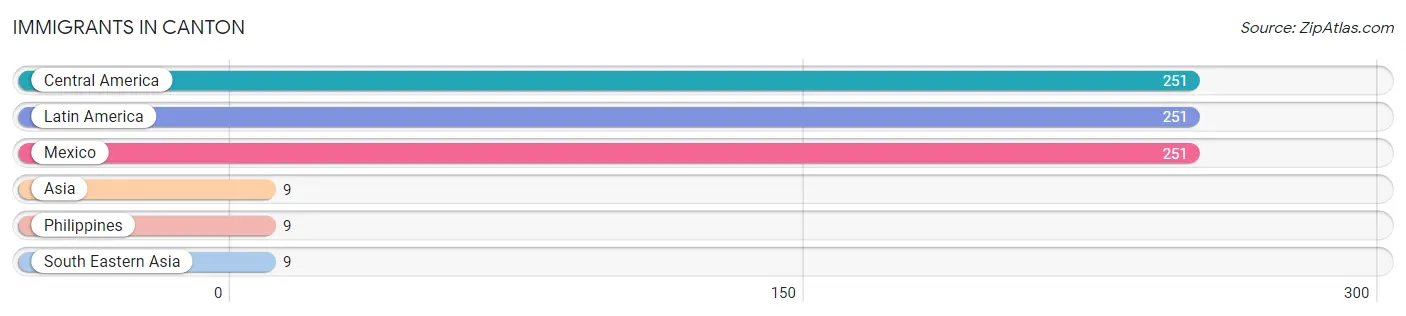
| Immigration Origin | # Population | % Population |
| Asia | 9 | 0.2% |
| Central America | 251 | 5.7% |
| Latin America | 251 | 5.7% |
| Mexico | 251 | 5.7% |
| Philippines | 9 | 0.2% |
| South Eastern Asia | 9 | 0.2% | View All 6 Rows |
Sex and Age in Canton
Sex and Age in Canton
The most populous age groups in Canton are 30 to 34 Years (278 | 13.3%) for men and 65 to 69 Years (225 | 9.7%) for women.
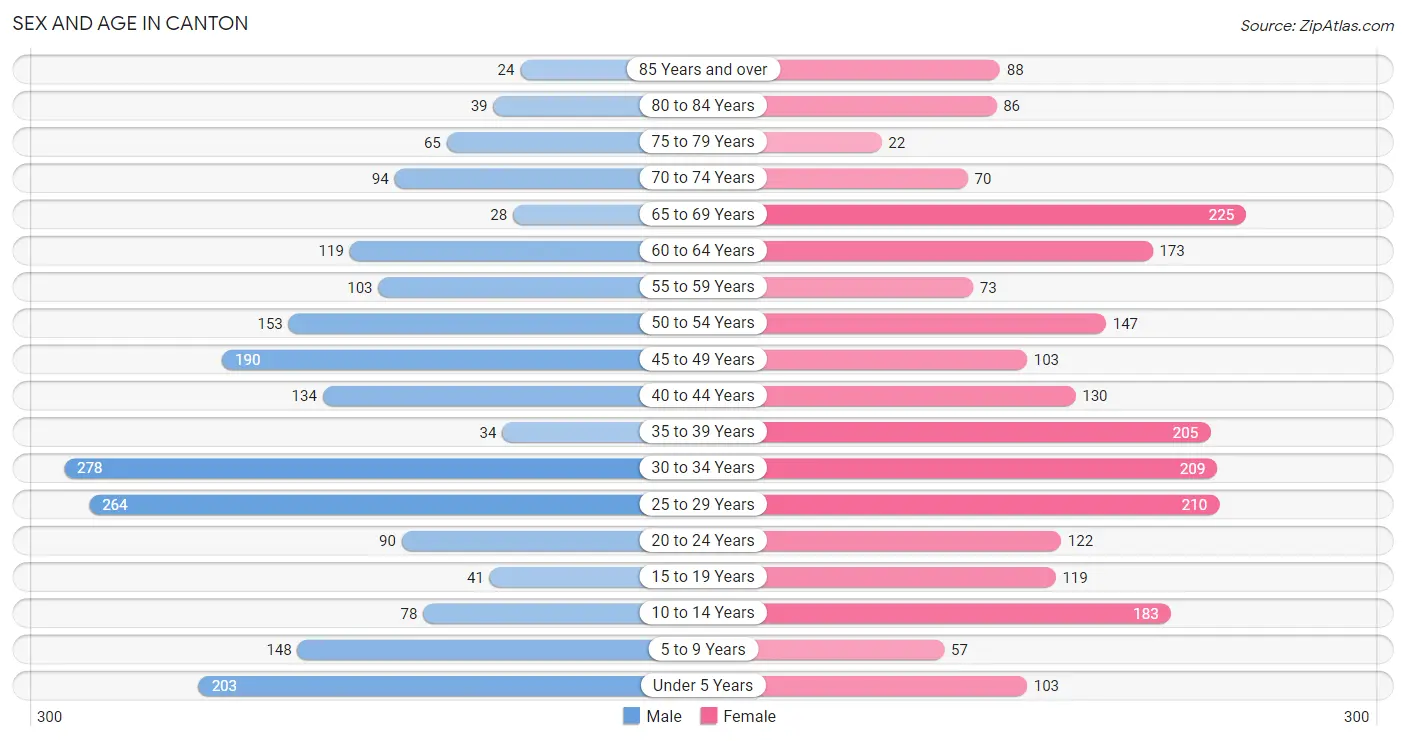
| Age Bracket | Male | Female |
| Under 5 Years | 203 (9.7%) | 103 (4.4%) |
| 5 to 9 Years | 148 (7.1%) | 57 (2.5%) |
| 10 to 14 Years | 78 (3.7%) | 183 (7.9%) |
| 15 to 19 Years | 41 (2.0%) | 119 (5.1%) |
| 20 to 24 Years | 90 (4.3%) | 122 (5.2%) |
| 25 to 29 Years | 264 (12.7%) | 210 (9.0%) |
| 30 to 34 Years | 278 (13.3%) | 209 (9.0%) |
| 35 to 39 Years | 34 (1.6%) | 205 (8.8%) |
| 40 to 44 Years | 134 (6.4%) | 130 (5.6%) |
| 45 to 49 Years | 190 (9.1%) | 103 (4.4%) |
| 50 to 54 Years | 153 (7.3%) | 147 (6.3%) |
| 55 to 59 Years | 103 (4.9%) | 73 (3.1%) |
| 60 to 64 Years | 119 (5.7%) | 173 (7.4%) |
| 65 to 69 Years | 28 (1.3%) | 225 (9.7%) |
| 70 to 74 Years | 94 (4.5%) | 70 (3.0%) |
| 75 to 79 Years | 65 (3.1%) | 22 (0.9%) |
| 80 to 84 Years | 39 (1.9%) | 86 (3.7%) |
| 85 Years and over | 24 (1.1%) | 88 (3.8%) |
| Total | 2,085 (100.0%) | 2,325 (100.0%) |
Families and Households in Canton
Median Family Size in Canton
The median family size in Canton is 3.09 persons per family, with single male/father families (89 | 9.2%) accounting for the largest median family size of 3.65 persons per family. On the other hand, married-couple families (661 | 68.2%) represent the smallest median family size with 2.98 persons per family.
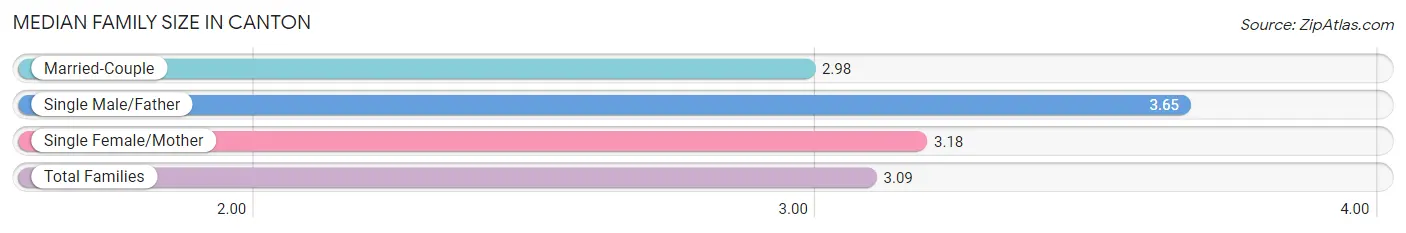
| Family Type | # Families | Family Size |
| Married-Couple | 661 (68.2%) | 2.98 |
| Single Male/Father | 89 (9.2%) | 3.65 |
| Single Female/Mother | 219 (22.6%) | 3.18 |
| Total Families | 969 (100.0%) | 3.09 |
Median Household Size in Canton
The median household size in Canton is 2.39 persons per household, with single female/mother households (219 | 11.9%) accounting for the largest median household size of 3.87 persons per household. non-family households (863 | 47.1%) represent the smallest median household size with 1.43 persons per household.
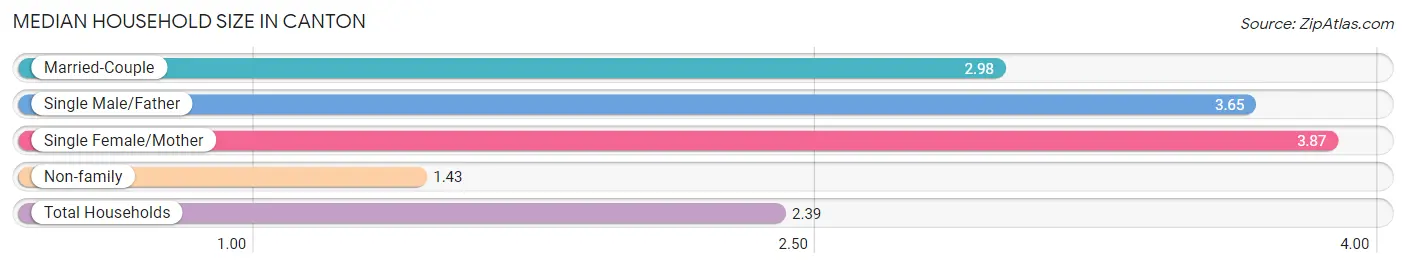
| Household Type | # Households | Household Size |
| Married-Couple | 661 (36.1%) | 2.98 |
| Single Male/Father | 89 (4.9%) | 3.65 |
| Single Female/Mother | 219 (11.9%) | 3.87 |
| Non-family | 863 (47.1%) | 1.43 |
| Total Households | 1,832 (100.0%) | 2.39 |
Household Size by Marriage Status in Canton
Out of a total of 1,832 households in Canton, 969 (52.9%) are family households, while 863 (47.1%) are nonfamily households. The most numerous type of family households are 2-person households, comprising 402, and the most common type of nonfamily households are 1-person households, comprising 657.
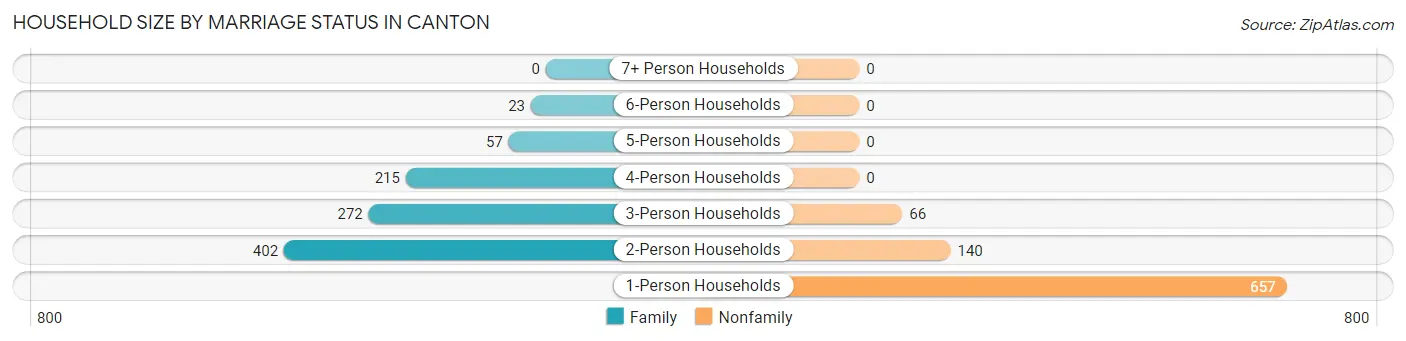
| Household Size | Family Households | Nonfamily Households |
| 1-Person Households | - | 657 (35.9%) |
| 2-Person Households | 402 (21.9%) | 140 (7.6%) |
| 3-Person Households | 272 (14.8%) | 66 (3.6%) |
| 4-Person Households | 215 (11.7%) | 0 (0.0%) |
| 5-Person Households | 57 (3.1%) | 0 (0.0%) |
| 6-Person Households | 23 (1.3%) | 0 (0.0%) |
| 7+ Person Households | 0 (0.0%) | 0 (0.0%) |
| Total | 969 (52.9%) | 863 (47.1%) |
Female Fertility in Canton
Fertility by Age in Canton
Average fertility rate in Canton is 41.0 births per 1,000 women. Women in the age bracket of 20 to 34 years have the highest fertility rate with 85.0 births per 1,000 women. Women in the age bracket of 20 to 34 years acount for 100.0% of all women with births.
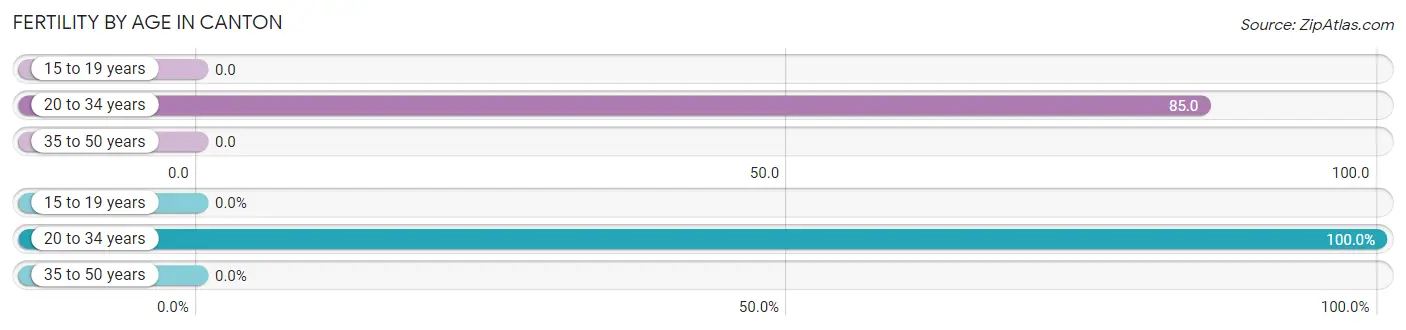
| Age Bracket | Women with Births | Births / 1,000 Women |
| 15 to 19 years | 0 (0.0%) | 0.0 |
| 20 to 34 years | 46 (100.0%) | 85.0 |
| 35 to 50 years | 0 (0.0%) | 0.0 |
| Total | 46 (100.0%) | 41.0 |
Fertility by Age by Marriage Status in Canton
84.8% of women with births (46) in Canton are married. The highest percentage of unmarried women with births falls into 20 to 34 years age bracket with 15.2% of them unmarried at the time of birth, while the lowest percentage of unmarried women with births belong to 20 to 34 years age bracket with 15.2% of them unmarried.
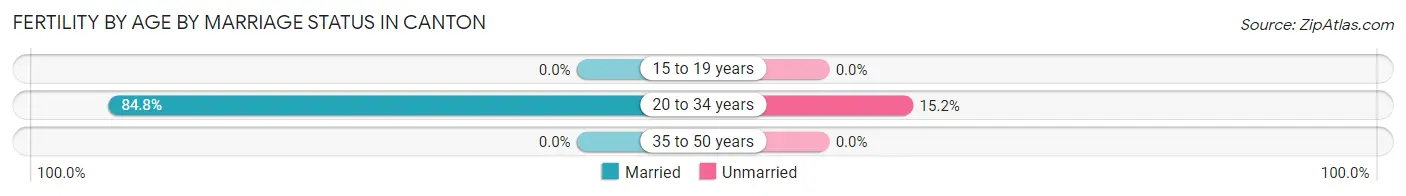
| Age Bracket | Married | Unmarried |
| 15 to 19 years | 0 (0.0%) | 0 (0.0%) |
| 20 to 34 years | 39 (84.8%) | 7 (15.2%) |
| 35 to 50 years | 0 (0.0%) | 0 (0.0%) |
| Total | 39 (84.8%) | 7 (15.2%) |
Fertility by Education in Canton
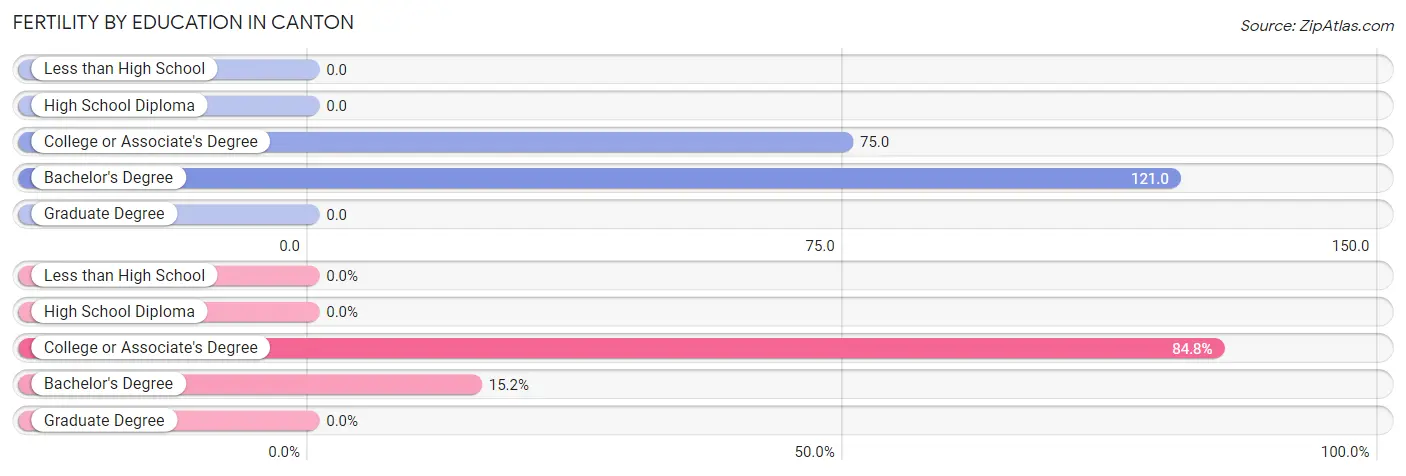
| Educational Attainment | Women with Births | Births / 1,000 Women |
| Less than High School | 0 (0.0%) | 0.0 |
| High School Diploma | 0 (0.0%) | 0.0 |
| College or Associate's Degree | 39 (84.8%) | 75.0 |
| Bachelor's Degree | 7 (15.2%) | 121.0 |
| Graduate Degree | 0 (0.0%) | 0.0 |
| Total | 46 (100.0%) | 41.0 |
Fertility by Education by Marriage Status in Canton
15.2% of women with births in Canton are unmarried. Women with the educational attainment of college or associate's degree are most likely to be married with 100.0% of them married at childbirth, while women with the educational attainment of bachelor's degree are least likely to be married with 100.0% of them unmarried at childbirth.
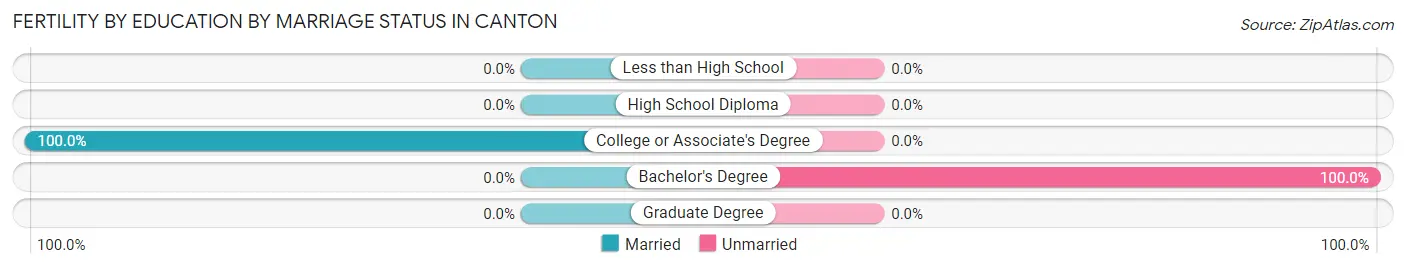
| Educational Attainment | Married | Unmarried |
| Less than High School | 0 (0.0%) | 0 (0.0%) |
| High School Diploma | 0 (0.0%) | 0 (0.0%) |
| College or Associate's Degree | 39 (100.0%) | 0 (0.0%) |
| Bachelor's Degree | 0 (0.0%) | 7 (100.0%) |
| Graduate Degree | 0 (0.0%) | 0 (0.0%) |
| Total | 39 (84.8%) | 7 (15.2%) |
Employment Characteristics in Canton
Employment by Class of Employer in Canton
Among the 2,316 employed individuals in Canton, private company employees (1,882 | 81.3%), not-for-profit organizations (179 | 7.7%), and local government employees (109 | 4.7%) make up the most common classes of employment.
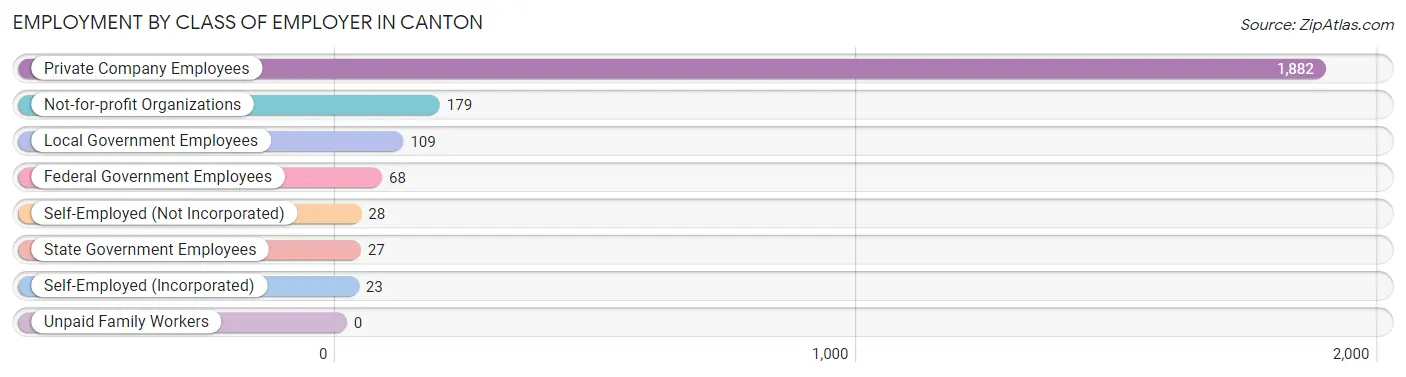
| Employer Class | # Employees | % Employees |
| Private Company Employees | 1,882 | 81.3% |
| Self-Employed (Incorporated) | 23 | 1.0% |
| Self-Employed (Not Incorporated) | 28 | 1.2% |
| Not-for-profit Organizations | 179 | 7.7% |
| Local Government Employees | 109 | 4.7% |
| State Government Employees | 27 | 1.2% |
| Federal Government Employees | 68 | 2.9% |
| Unpaid Family Workers | 0 | 0.0% |
| Total | 2,316 | 100.0% |
Employment Status by Age in Canton
According to the labor force statistics for Canton, out of the total population over 16 years of age (3,589), 67.1% or 2,408 individuals are in the labor force, with 1.0% or 24 of them unemployed. The age group with the highest labor force participation rate is 30 to 34 years, with 91.6% or 446 individuals in the labor force. Within the labor force, the 16 to 19 years age range has the highest percentage of unemployed individuals, with 12.4% or 12 of them being unemployed.
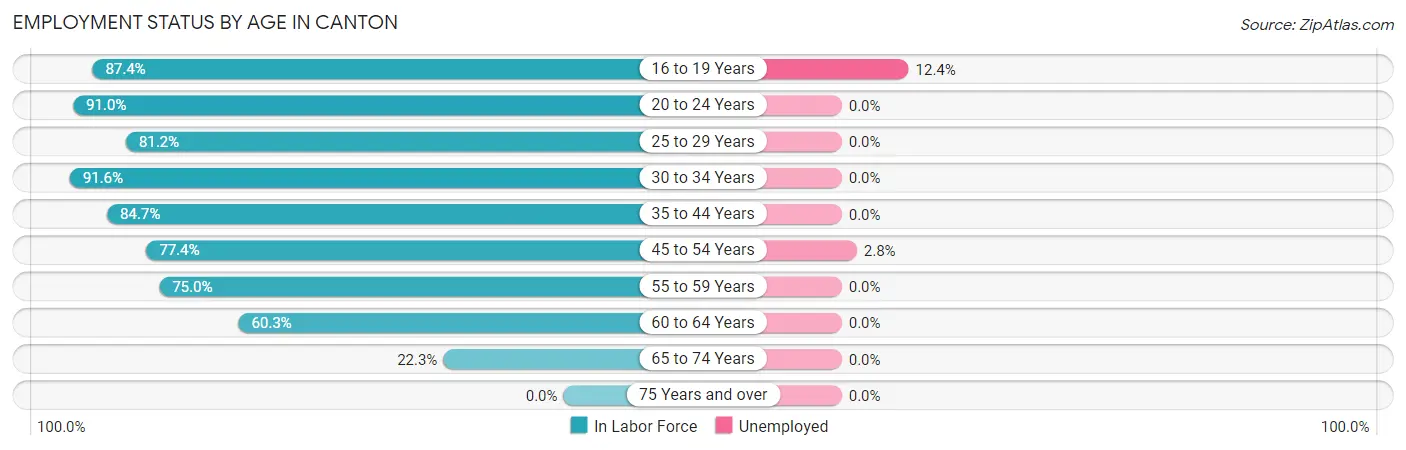
| Age Bracket | In Labor Force | Unemployed |
| 16 to 19 Years | 97 (87.4%) | 12 (12.4%) |
| 20 to 24 Years | 193 (91.0%) | 0 (0.0%) |
| 25 to 29 Years | 385 (81.2%) | 0 (0.0%) |
| 30 to 34 Years | 446 (91.6%) | 0 (0.0%) |
| 35 to 44 Years | 426 (84.7%) | 0 (0.0%) |
| 45 to 54 Years | 459 (77.4%) | 13 (2.8%) |
| 55 to 59 Years | 132 (75.0%) | 0 (0.0%) |
| 60 to 64 Years | 176 (60.3%) | 0 (0.0%) |
| 65 to 74 Years | 93 (22.3%) | 0 (0.0%) |
| 75 Years and over | 0 (0.0%) | 0 (0.0%) |
| Total | 2,408 (67.1%) | 24 (1.0%) |
Employment Status by Educational Attainment in Canton
According to labor force statistics for Canton, 80.2% of individuals (2,025) out of the total population between 25 and 64 years of age (2,525) are in the labor force, with 0.6% or 12 of them being unemployed. The group with the highest labor force participation rate are those with the educational attainment of bachelor's degree or higher, with 95.7% or 405 individuals in the labor force. Within the labor force, individuals with college / associate degree education have the highest percentage of unemployment, with 1.7% or 13 of them being unemployed.
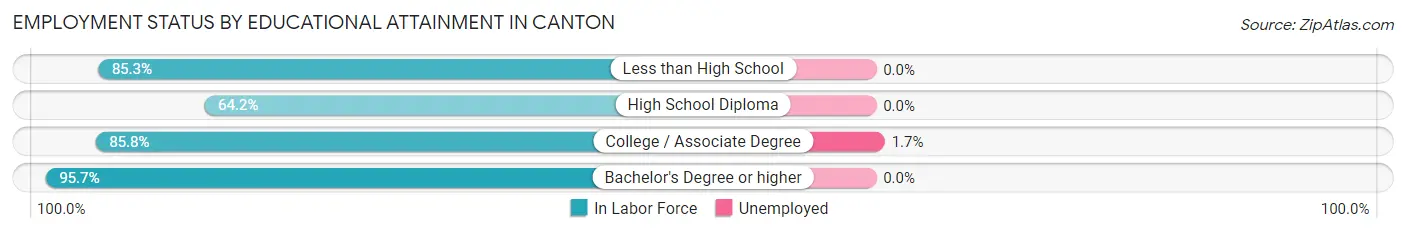
| Educational Attainment | In Labor Force | Unemployed |
| Less than High School | 295 (85.3%) | 0 (0.0%) |
| High School Diploma | 544 (64.2%) | 0 (0.0%) |
| College / Associate Degree | 780 (85.8%) | 15 (1.7%) |
| Bachelor's Degree or higher | 405 (95.7%) | 0 (0.0%) |
| Total | 2,025 (80.2%) | 15 (0.6%) |
Employment Occupations by Sex in Canton
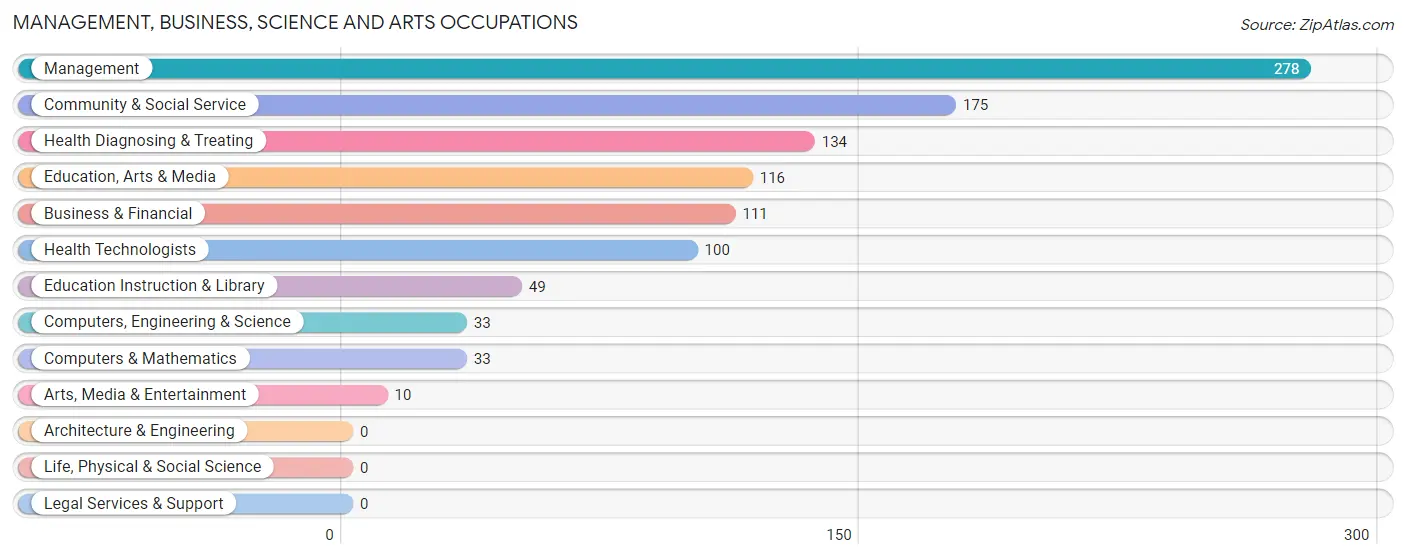
Management, Business, Science and Arts Occupations
The most common Management, Business, Science and Arts occupations in Canton are Management (278 | 11.8%), Community & Social Service (175 | 7.4%), Health Diagnosing & Treating (134 | 5.7%), Education, Arts & Media (116 | 4.9%), and Business & Financial (111 | 4.7%).
Management, Business, Science and Arts Occupations by Sex
Within the Management, Business, Science and Arts occupations in Canton, the most male-oriented occupations are Computers, Engineering & Science (72.7%), Computers & Mathematics (72.7%), and Education, Arts & Media (58.6%), while the most female-oriented occupations are Arts, Media & Entertainment (100.0%), Health Diagnosing & Treating (100.0%), and Health Technologists (100.0%).
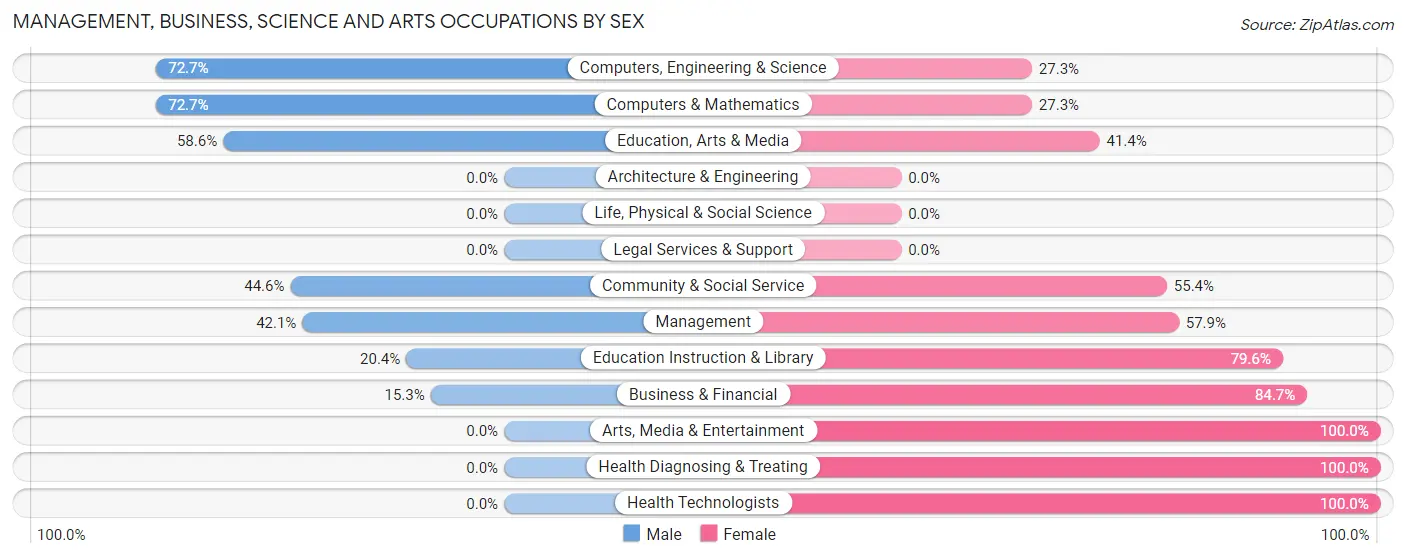
| Occupation | Male | Female |
| Management | 117 (42.1%) | 161 (57.9%) |
| Business & Financial | 17 (15.3%) | 94 (84.7%) |
| Computers, Engineering & Science | 24 (72.7%) | 9 (27.3%) |
| Computers & Mathematics | 24 (72.7%) | 9 (27.3%) |
| Architecture & Engineering | 0 (0.0%) | 0 (0.0%) |
| Life, Physical & Social Science | 0 (0.0%) | 0 (0.0%) |
| Community & Social Service | 78 (44.6%) | 97 (55.4%) |
| Education, Arts & Media | 68 (58.6%) | 48 (41.4%) |
| Legal Services & Support | 0 (0.0%) | 0 (0.0%) |
| Education Instruction & Library | 10 (20.4%) | 39 (79.6%) |
| Arts, Media & Entertainment | 0 (0.0%) | 10 (100.0%) |
| Health Diagnosing & Treating | 0 (0.0%) | 134 (100.0%) |
| Health Technologists | 0 (0.0%) | 100 (100.0%) |
| Total (Category) | 236 (32.3%) | 495 (67.7%) |
| Total (Overall) | 1,305 (55.2%) | 1,057 (44.8%) |
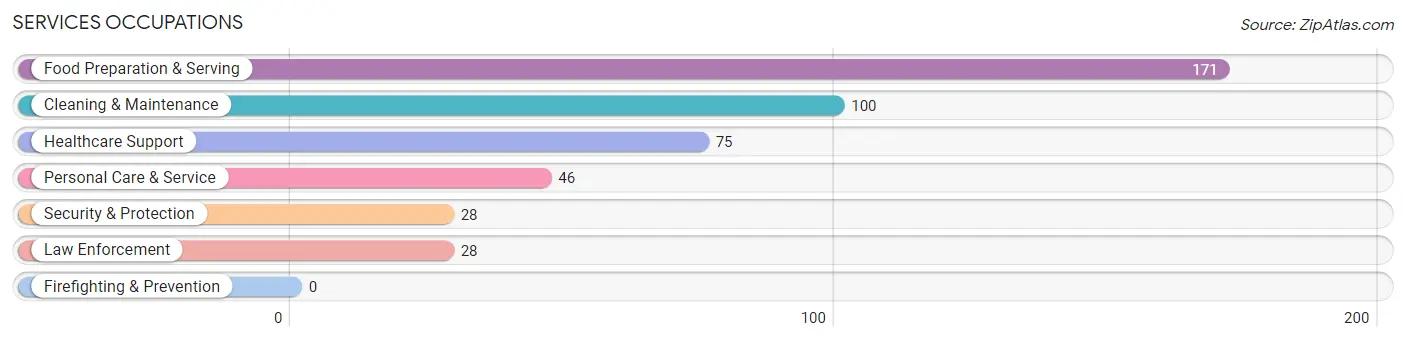
Services Occupations
The most common Services occupations in Canton are Food Preparation & Serving (171 | 7.2%), Cleaning & Maintenance (100 | 4.2%), Healthcare Support (75 | 3.2%), Personal Care & Service (46 | 1.9%), and Security & Protection (28 | 1.2%).
Services Occupations by Sex
Within the Services occupations in Canton, the most male-oriented occupations are Security & Protection (100.0%), Law Enforcement (100.0%), and Cleaning & Maintenance (77.0%), while the most female-oriented occupations are Healthcare Support (76.0%), Personal Care & Service (63.0%), and Food Preparation & Serving (39.8%).
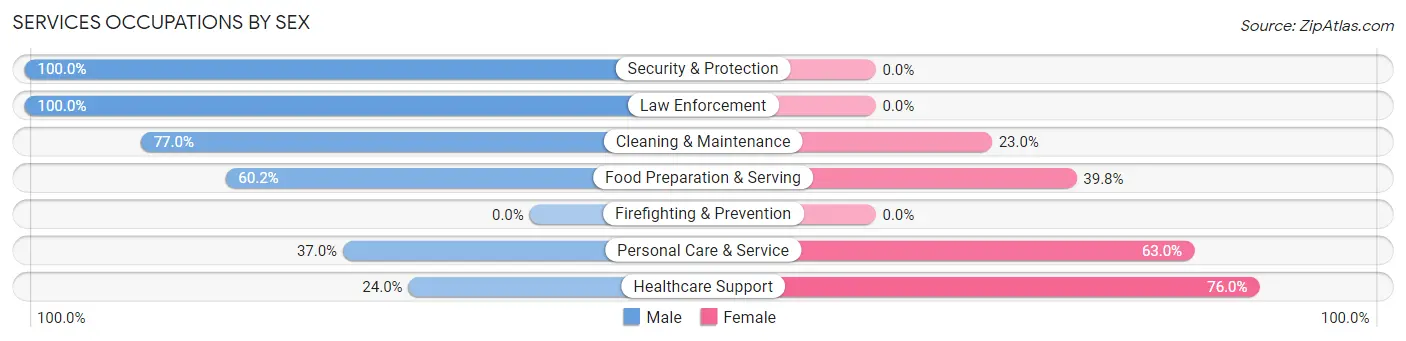
| Occupation | Male | Female |
| Healthcare Support | 18 (24.0%) | 57 (76.0%) |
| Security & Protection | 28 (100.0%) | 0 (0.0%) |
| Firefighting & Prevention | 0 (0.0%) | 0 (0.0%) |
| Law Enforcement | 28 (100.0%) | 0 (0.0%) |
| Food Preparation & Serving | 103 (60.2%) | 68 (39.8%) |
| Cleaning & Maintenance | 77 (77.0%) | 23 (23.0%) |
| Personal Care & Service | 17 (37.0%) | 29 (63.0%) |
| Total (Category) | 243 (57.9%) | 177 (42.1%) |
| Total (Overall) | 1,305 (55.2%) | 1,057 (44.8%) |
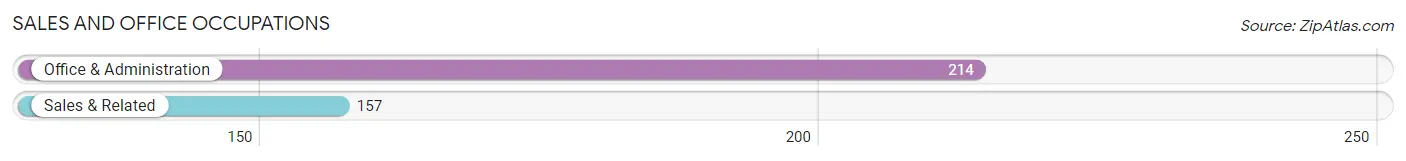
Sales and Office Occupations
The most common Sales and Office occupations in Canton are Office & Administration (214 | 9.1%), and Sales & Related (157 | 6.7%).
Sales and Office Occupations by Sex
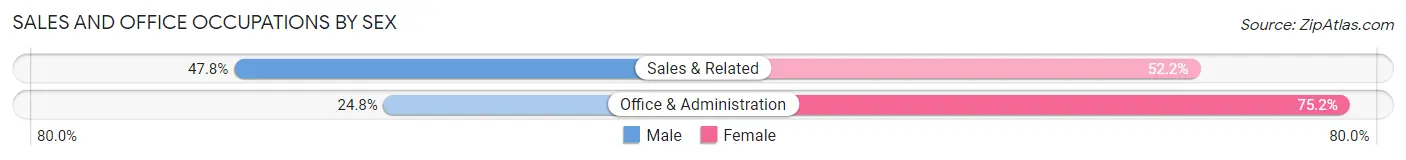
| Occupation | Male | Female |
| Sales & Related | 75 (47.8%) | 82 (52.2%) |
| Office & Administration | 53 (24.8%) | 161 (75.2%) |
| Total (Category) | 128 (34.5%) | 243 (65.5%) |
| Total (Overall) | 1,305 (55.2%) | 1,057 (44.8%) |
Natural Resources, Construction and Maintenance Occupations
The most common Natural Resources, Construction and Maintenance occupations in Canton are Construction & Extraction (83 | 3.5%), and Installation, Maintenance & Repair (37 | 1.6%).
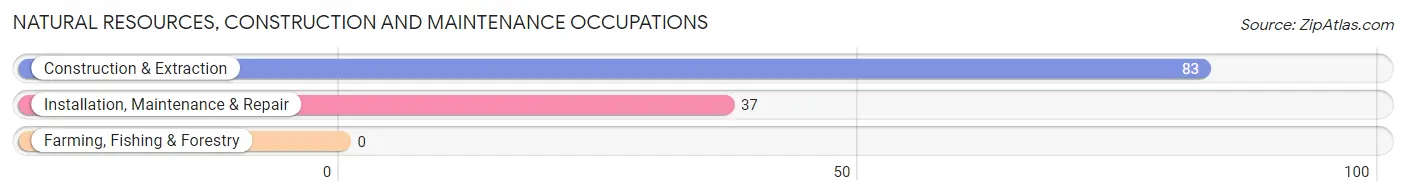
Natural Resources, Construction and Maintenance Occupations by Sex
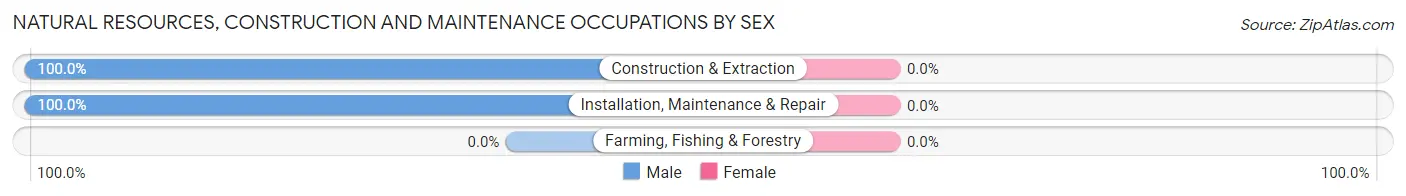
| Occupation | Male | Female |
| Farming, Fishing & Forestry | 0 (0.0%) | 0 (0.0%) |
| Construction & Extraction | 83 (100.0%) | 0 (0.0%) |
| Installation, Maintenance & Repair | 37 (100.0%) | 0 (0.0%) |
| Total (Category) | 120 (100.0%) | 0 (0.0%) |
| Total (Overall) | 1,305 (55.2%) | 1,057 (44.8%) |
Production, Transportation and Moving Occupations
The most common Production, Transportation and Moving occupations in Canton are Production (407 | 17.2%), Transportation (249 | 10.5%), and Material Moving (64 | 2.7%).
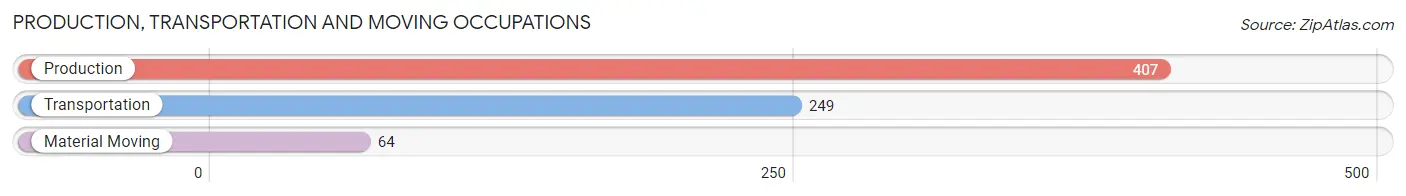
Production, Transportation and Moving Occupations by Sex
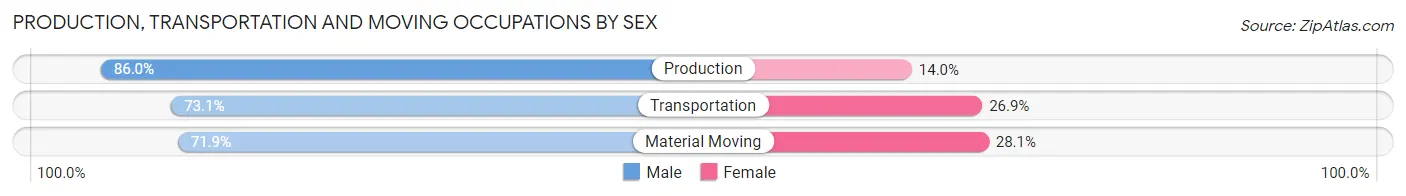
| Occupation | Male | Female |
| Production | 350 (86.0%) | 57 (14.0%) |
| Transportation | 182 (73.1%) | 67 (26.9%) |
| Material Moving | 46 (71.9%) | 18 (28.1%) |
| Total (Category) | 578 (80.3%) | 142 (19.7%) |
| Total (Overall) | 1,305 (55.2%) | 1,057 (44.8%) |
Employment Industries by Sex in Canton
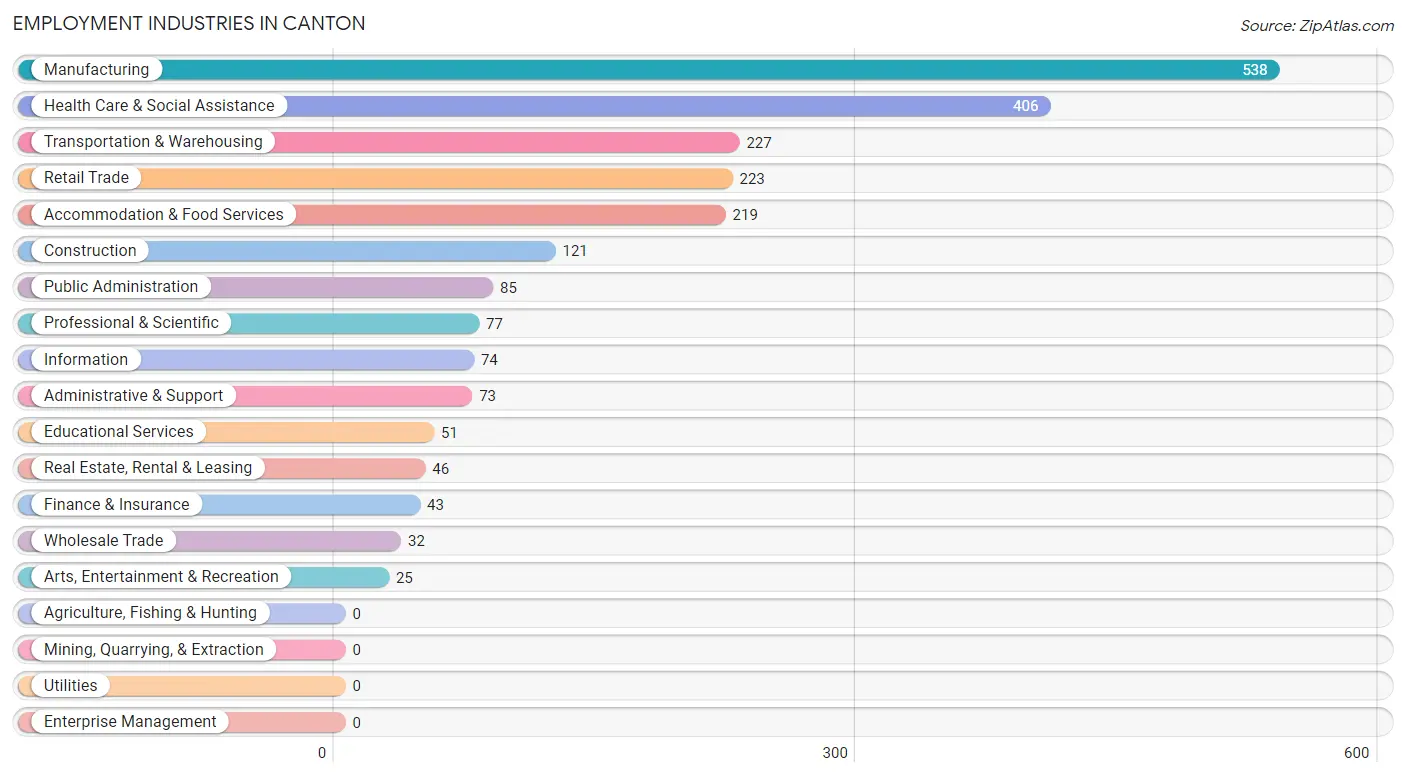
Employment Industries in Canton
The major employment industries in Canton include Manufacturing (538 | 22.8%), Health Care & Social Assistance (406 | 17.2%), Transportation & Warehousing (227 | 9.6%), Retail Trade (223 | 9.4%), and Accommodation & Food Services (219 | 9.3%).
Employment Industries by Sex in Canton
The Canton industries that see more men than women are Wholesale Trade (100.0%), Information (100.0%), and Construction (87.6%), whereas the industries that tend to have a higher number of women are Finance & Insurance (100.0%), Real Estate, Rental & Leasing (100.0%), and Professional & Scientific (100.0%).
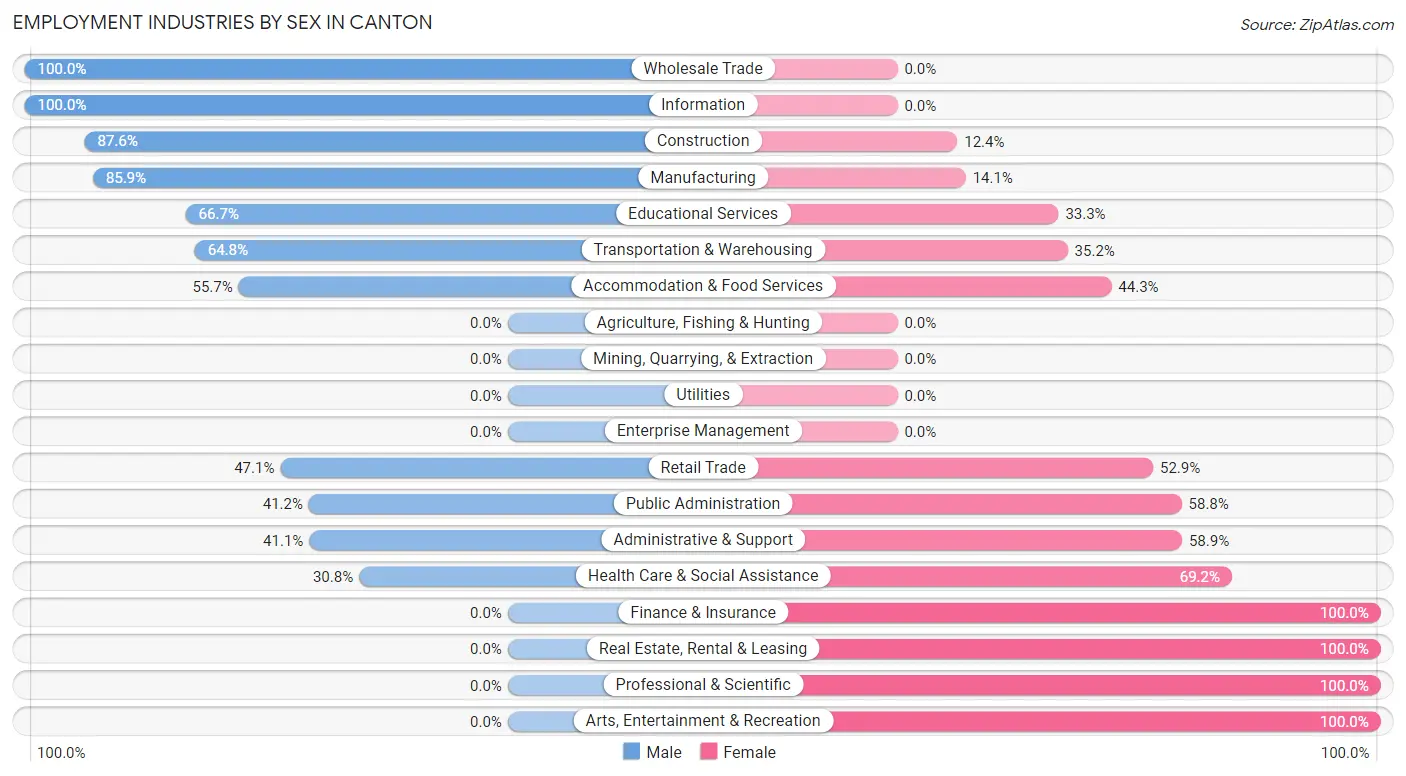
| Industry | Male | Female |
| Agriculture, Fishing & Hunting | 0 (0.0%) | 0 (0.0%) |
| Mining, Quarrying, & Extraction | 0 (0.0%) | 0 (0.0%) |
| Construction | 106 (87.6%) | 15 (12.4%) |
| Manufacturing | 462 (85.9%) | 76 (14.1%) |
| Wholesale Trade | 32 (100.0%) | 0 (0.0%) |
| Retail Trade | 105 (47.1%) | 118 (52.9%) |
| Transportation & Warehousing | 147 (64.8%) | 80 (35.2%) |
| Utilities | 0 (0.0%) | 0 (0.0%) |
| Information | 74 (100.0%) | 0 (0.0%) |
| Finance & Insurance | 0 (0.0%) | 43 (100.0%) |
| Real Estate, Rental & Leasing | 0 (0.0%) | 46 (100.0%) |
| Professional & Scientific | 0 (0.0%) | 77 (100.0%) |
| Enterprise Management | 0 (0.0%) | 0 (0.0%) |
| Administrative & Support | 30 (41.1%) | 43 (58.9%) |
| Educational Services | 34 (66.7%) | 17 (33.3%) |
| Health Care & Social Assistance | 125 (30.8%) | 281 (69.2%) |
| Arts, Entertainment & Recreation | 0 (0.0%) | 25 (100.0%) |
| Accommodation & Food Services | 122 (55.7%) | 97 (44.3%) |
| Public Administration | 35 (41.2%) | 50 (58.8%) |
| Total | 1,305 (55.2%) | 1,057 (44.8%) |
Education in Canton
School Enrollment in Canton
The most common levels of schooling among the 746 students in Canton are elementary school (332 | 44.5%), college / undergraduate (174 | 23.3%), and high school (124 | 16.6%).
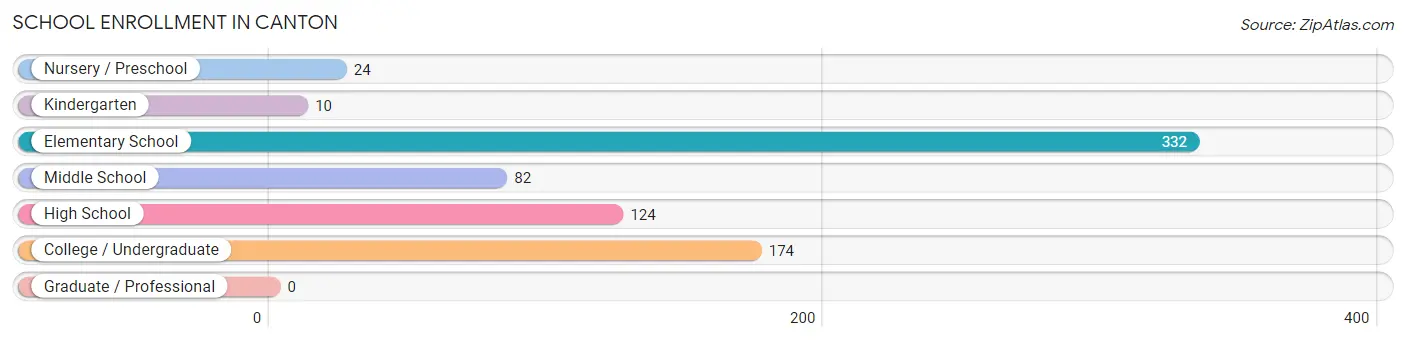
| School Level | # Students | % Students |
| Nursery / Preschool | 24 | 3.2% |
| Kindergarten | 10 | 1.3% |
| Elementary School | 332 | 44.5% |
| Middle School | 82 | 11.0% |
| High School | 124 | 16.6% |
| College / Undergraduate | 174 | 23.3% |
| Graduate / Professional | 0 | 0.0% |
| Total | 746 | 100.0% |
School Enrollment by Age by Funding Source in Canton
Out of a total of 746 students who are enrolled in schools in Canton, 43 (5.8%) attend a private institution, while the remaining 703 (94.2%) are enrolled in public schools. The age group of 3 to 4 year olds has the highest likelihood of being enrolled in private schools, with 24 (100.0% in the age bracket) enrolled. Conversely, the age group of 5 to 9 year old has the lowest likelihood of being enrolled in a private school, with 193 (100.0% in the age bracket) attending a public institution.
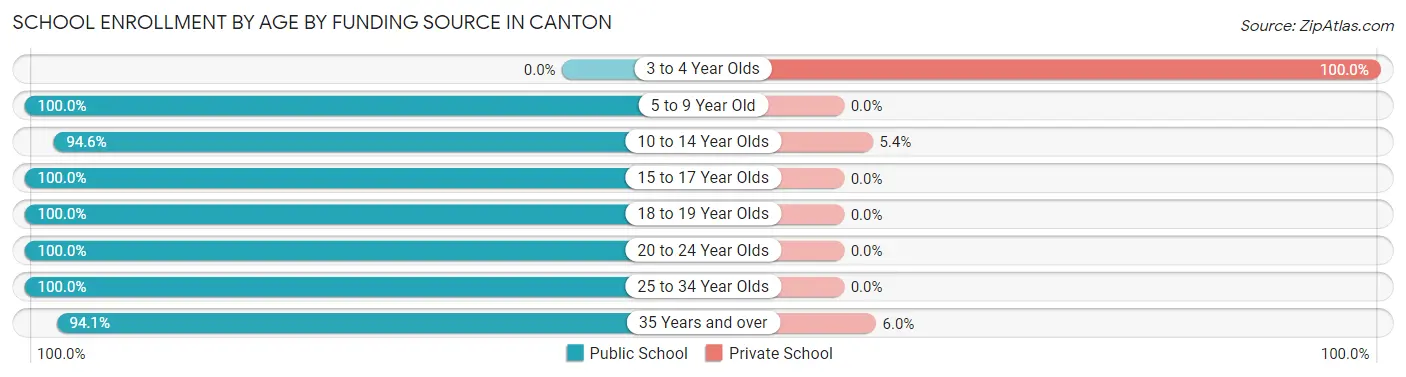
| Age Bracket | Public School | Private School |
| 3 to 4 Year Olds | 0 (0.0%) | 24 (100.0%) |
| 5 to 9 Year Old | 193 (100.0%) | 0 (0.0%) |
| 10 to 14 Year Olds | 247 (94.6%) | 14 (5.4%) |
| 15 to 17 Year Olds | 82 (100.0%) | 0 (0.0%) |
| 18 to 19 Year Olds | 12 (100.0%) | 0 (0.0%) |
| 20 to 24 Year Olds | 11 (100.0%) | 0 (0.0%) |
| 25 to 34 Year Olds | 79 (100.0%) | 0 (0.0%) |
| 35 Years and over | 79 (94.1%) | 5 (5.9%) |
| Total | 703 (94.2%) | 43 (5.8%) |
Educational Attainment by Field of Study in Canton
Business (107 | 19.7%), science & technology (89 | 16.4%), computers & mathematics (55 | 10.1%), education (55 | 10.1%), and literature & languages (52 | 9.6%) are the most common fields of study among 543 individuals in Canton who have obtained a bachelor's degree or higher.
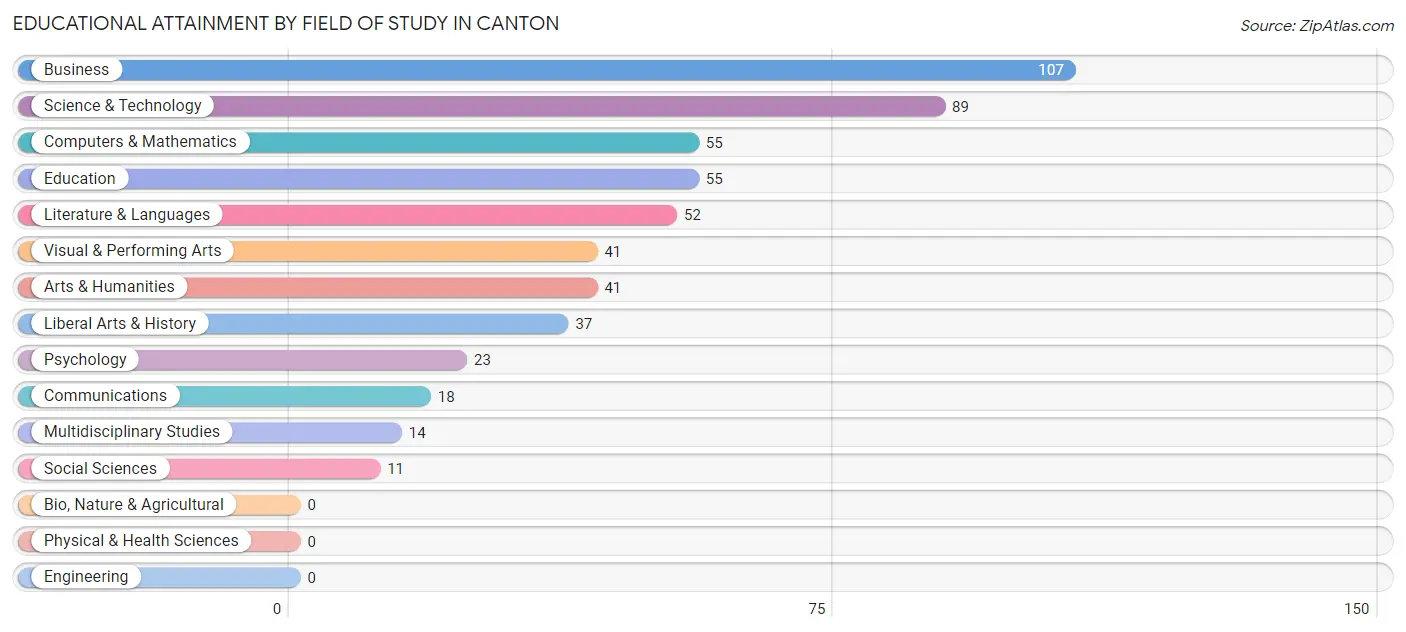
| Field of Study | # Graduates | % Graduates |
| Computers & Mathematics | 55 | 10.1% |
| Bio, Nature & Agricultural | 0 | 0.0% |
| Physical & Health Sciences | 0 | 0.0% |
| Psychology | 23 | 4.2% |
| Social Sciences | 11 | 2.0% |
| Engineering | 0 | 0.0% |
| Multidisciplinary Studies | 14 | 2.6% |
| Science & Technology | 89 | 16.4% |
| Business | 107 | 19.7% |
| Education | 55 | 10.1% |
| Literature & Languages | 52 | 9.6% |
| Liberal Arts & History | 37 | 6.8% |
| Visual & Performing Arts | 41 | 7.5% |
| Communications | 18 | 3.3% |
| Arts & Humanities | 41 | 7.5% |
| Total | 543 | 100.0% |
Transportation & Commute in Canton
Vehicle Availability by Sex in Canton
The most prevalent vehicle ownership categories in Canton are males with 2 vehicles (747, accounting for 56.8%) and females with 2 vehicles (478, making up 74.7%).
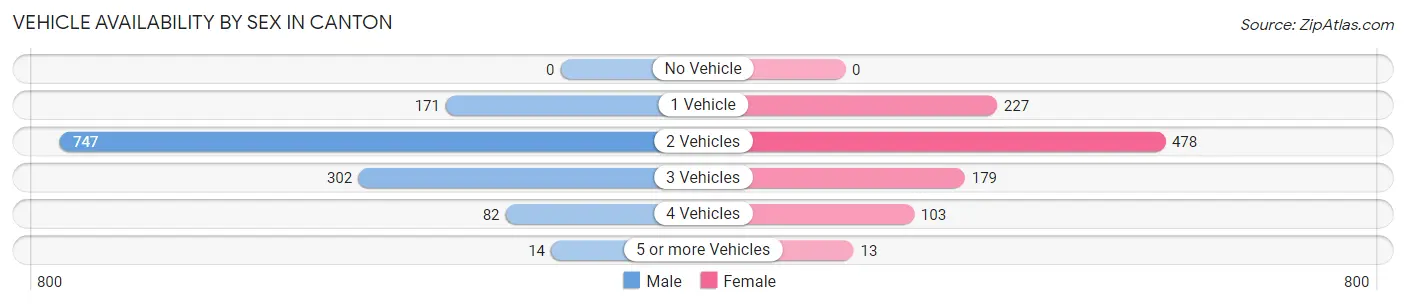
| Vehicles Available | Male | Female |
| No Vehicle | 0 (0.0%) | 0 (0.0%) |
| 1 Vehicle | 171 (13.0%) | 227 (22.7%) |
| 2 Vehicles | 747 (56.8%) | 478 (47.8%) |
| 3 Vehicles | 302 (23.0%) | 179 (17.9%) |
| 4 Vehicles | 82 (6.2%) | 103 (10.3%) |
| 5 or more Vehicles | 14 (1.1%) | 13 (1.3%) |
| Total | 1,316 (100.0%) | 1,000 (100.0%) |
Commute Time in Canton
The most frequently occuring commute durations in Canton are 15 to 19 minutes (379 commuters, 17.0%), 5 to 9 minutes (299 commuters, 13.4%), and 30 to 34 minutes (288 commuters, 12.9%).
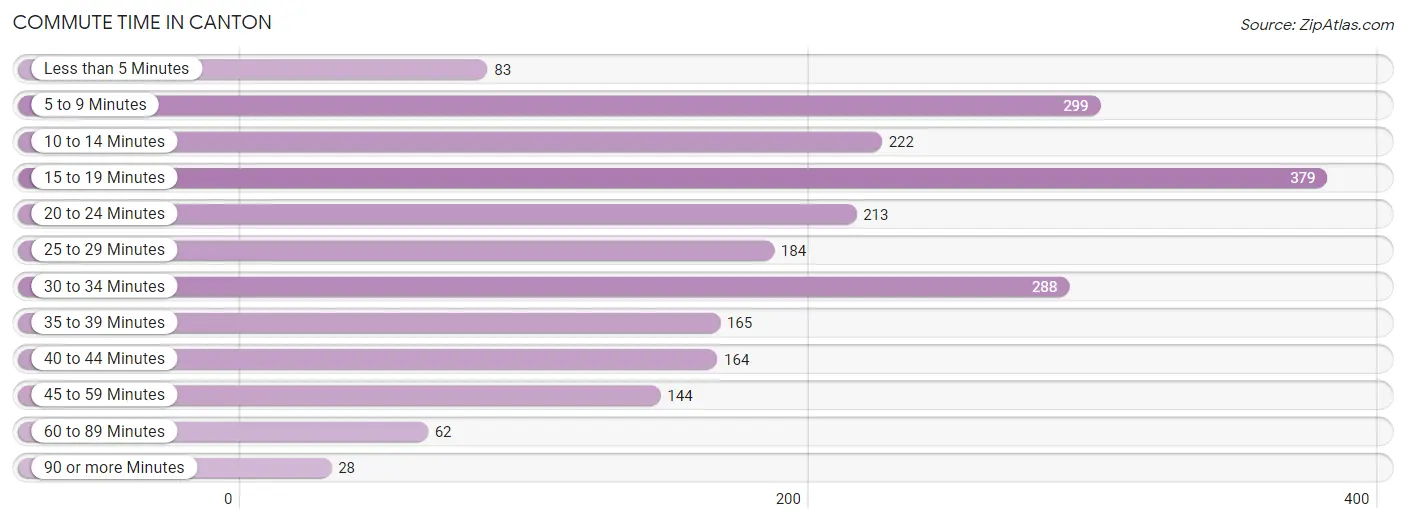
| Commute Time | # Commuters | % Commuters |
| Less than 5 Minutes | 83 | 3.7% |
| 5 to 9 Minutes | 299 | 13.4% |
| 10 to 14 Minutes | 222 | 10.0% |
| 15 to 19 Minutes | 379 | 17.0% |
| 20 to 24 Minutes | 213 | 9.6% |
| 25 to 29 Minutes | 184 | 8.3% |
| 30 to 34 Minutes | 288 | 12.9% |
| 35 to 39 Minutes | 165 | 7.4% |
| 40 to 44 Minutes | 164 | 7.3% |
| 45 to 59 Minutes | 144 | 6.5% |
| 60 to 89 Minutes | 62 | 2.8% |
| 90 or more Minutes | 28 | 1.3% |
Commute Time by Sex in Canton
The most common commute times in Canton are 5 to 9 minutes (196 commuters, 15.7%) for males and 15 to 19 minutes (195 commuters, 19.8%) for females.
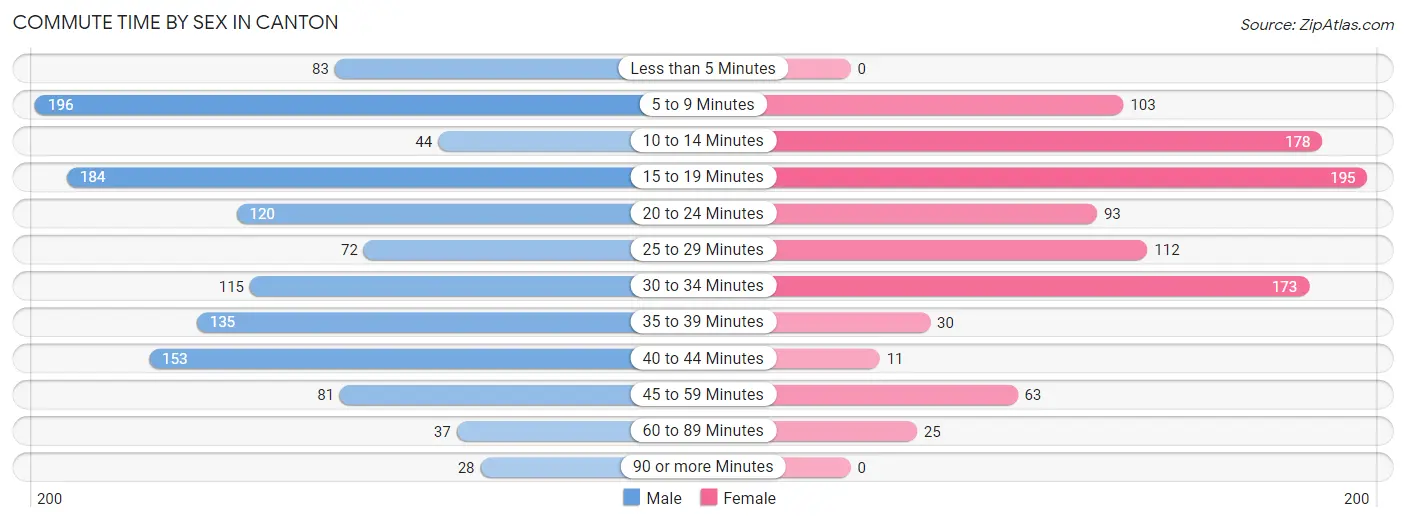
| Commute Time | Male | Female |
| Less than 5 Minutes | 83 (6.7%) | 0 (0.0%) |
| 5 to 9 Minutes | 196 (15.7%) | 103 (10.5%) |
| 10 to 14 Minutes | 44 (3.5%) | 178 (18.1%) |
| 15 to 19 Minutes | 184 (14.7%) | 195 (19.8%) |
| 20 to 24 Minutes | 120 (9.6%) | 93 (9.5%) |
| 25 to 29 Minutes | 72 (5.8%) | 112 (11.4%) |
| 30 to 34 Minutes | 115 (9.2%) | 173 (17.6%) |
| 35 to 39 Minutes | 135 (10.8%) | 30 (3.0%) |
| 40 to 44 Minutes | 153 (12.3%) | 11 (1.1%) |
| 45 to 59 Minutes | 81 (6.5%) | 63 (6.4%) |
| 60 to 89 Minutes | 37 (3.0%) | 25 (2.5%) |
| 90 or more Minutes | 28 (2.2%) | 0 (0.0%) |
Time of Departure to Work by Sex in Canton
The most frequent times of departure to work in Canton are 7:00 AM to 7:29 AM (241, 19.3%) for males and 7:30 AM to 7:59 AM (199, 20.2%) for females.
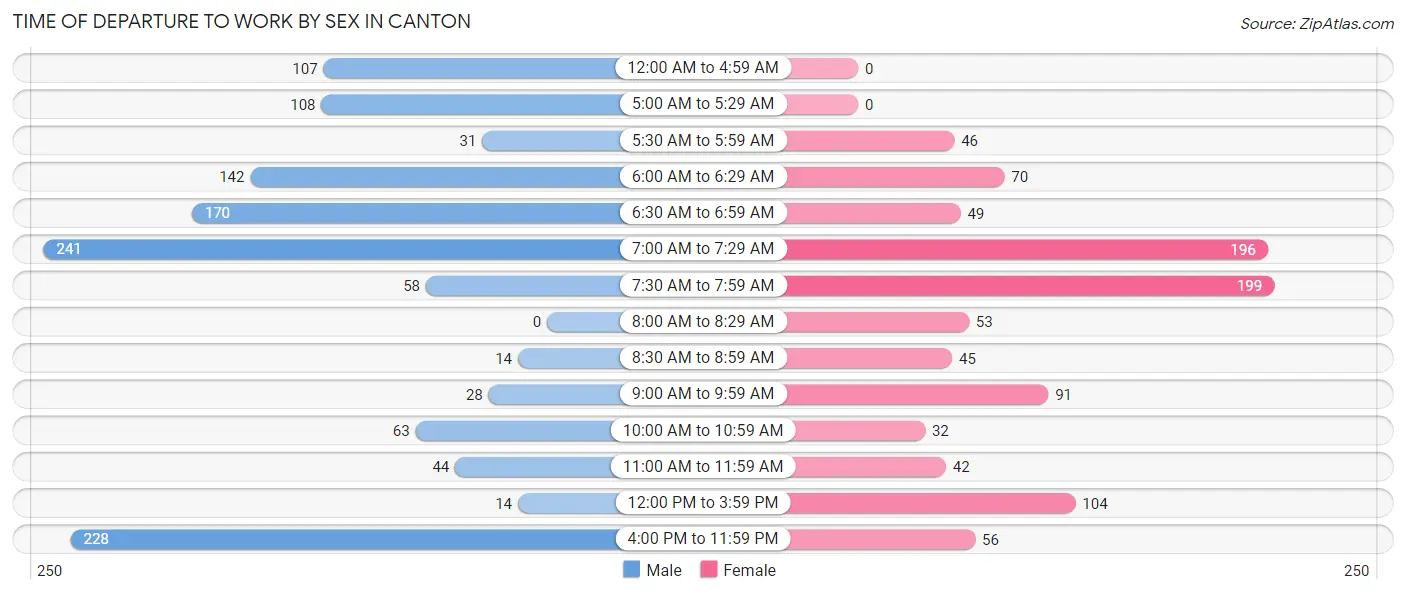
| Time of Departure | Male | Female |
| 12:00 AM to 4:59 AM | 107 (8.6%) | 0 (0.0%) |
| 5:00 AM to 5:29 AM | 108 (8.6%) | 0 (0.0%) |
| 5:30 AM to 5:59 AM | 31 (2.5%) | 46 (4.7%) |
| 6:00 AM to 6:29 AM | 142 (11.4%) | 70 (7.1%) |
| 6:30 AM to 6:59 AM | 170 (13.6%) | 49 (5.0%) |
| 7:00 AM to 7:29 AM | 241 (19.3%) | 196 (19.9%) |
| 7:30 AM to 7:59 AM | 58 (4.6%) | 199 (20.2%) |
| 8:00 AM to 8:29 AM | 0 (0.0%) | 53 (5.4%) |
| 8:30 AM to 8:59 AM | 14 (1.1%) | 45 (4.6%) |
| 9:00 AM to 9:59 AM | 28 (2.2%) | 91 (9.3%) |
| 10:00 AM to 10:59 AM | 63 (5.1%) | 32 (3.3%) |
| 11:00 AM to 11:59 AM | 44 (3.5%) | 42 (4.3%) |
| 12:00 PM to 3:59 PM | 14 (1.1%) | 104 (10.6%) |
| 4:00 PM to 11:59 PM | 228 (18.3%) | 56 (5.7%) |
| Total | 1,248 (100.0%) | 983 (100.0%) |
Housing Occupancy in Canton
Occupancy by Ownership in Canton
Of the total 1,832 dwellings in Canton, owner-occupied units account for 1,206 (65.8%), while renter-occupied units make up 626 (34.2%).
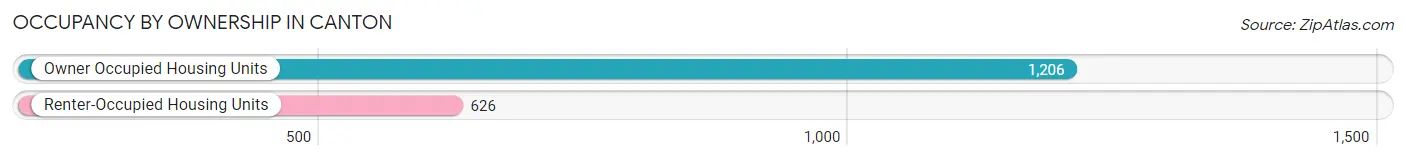
| Occupancy | # Housing Units | % Housing Units |
| Owner Occupied Housing Units | 1,206 | 65.8% |
| Renter-Occupied Housing Units | 626 | 34.2% |
| Total Occupied Housing Units | 1,832 | 100.0% |
Occupancy by Household Size in Canton
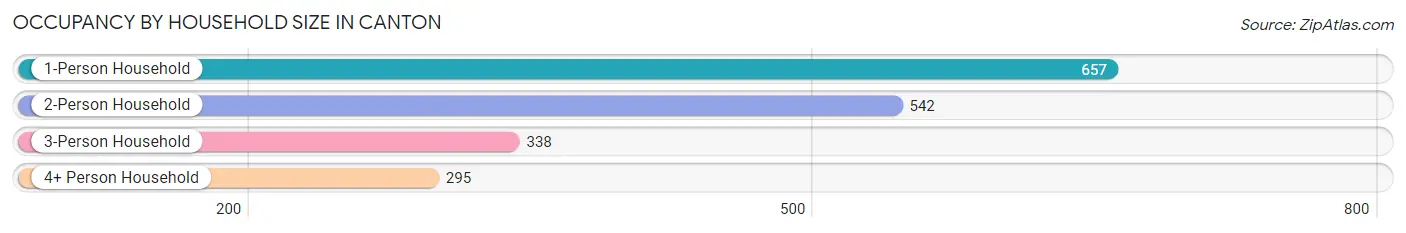
| Household Size | # Housing Units | % Housing Units |
| 1-Person Household | 657 | 35.9% |
| 2-Person Household | 542 | 29.6% |
| 3-Person Household | 338 | 18.4% |
| 4+ Person Household | 295 | 16.1% |
| Total Housing Units | 1,832 | 100.0% |
Occupancy by Ownership by Household Size in Canton
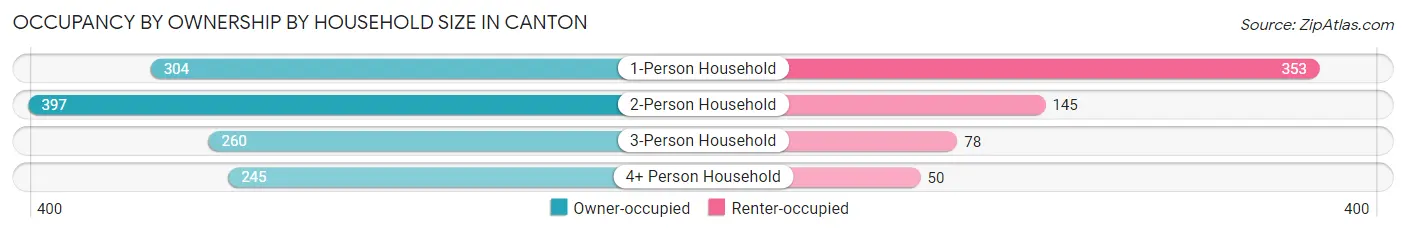
| Household Size | Owner-occupied | Renter-occupied |
| 1-Person Household | 304 (46.3%) | 353 (53.7%) |
| 2-Person Household | 397 (73.3%) | 145 (26.8%) |
| 3-Person Household | 260 (76.9%) | 78 (23.1%) |
| 4+ Person Household | 245 (83.1%) | 50 (17.0%) |
| Total Housing Units | 1,206 (65.8%) | 626 (34.2%) |
Occupancy by Educational Attainment in Canton
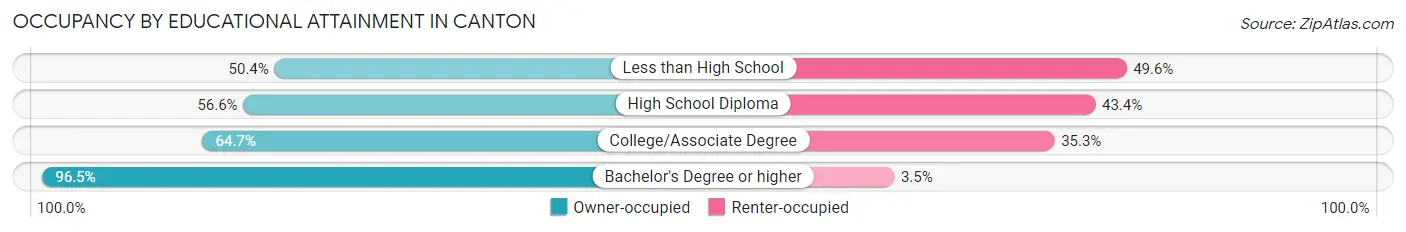
| Household Size | Owner-occupied | Renter-occupied |
| Less than High School | 117 (50.4%) | 115 (49.6%) |
| High School Diploma | 317 (56.6%) | 243 (43.4%) |
| College/Associate Degree | 471 (64.7%) | 257 (35.3%) |
| Bachelor's Degree or higher | 301 (96.5%) | 11 (3.5%) |
Occupancy by Age of Householder in Canton
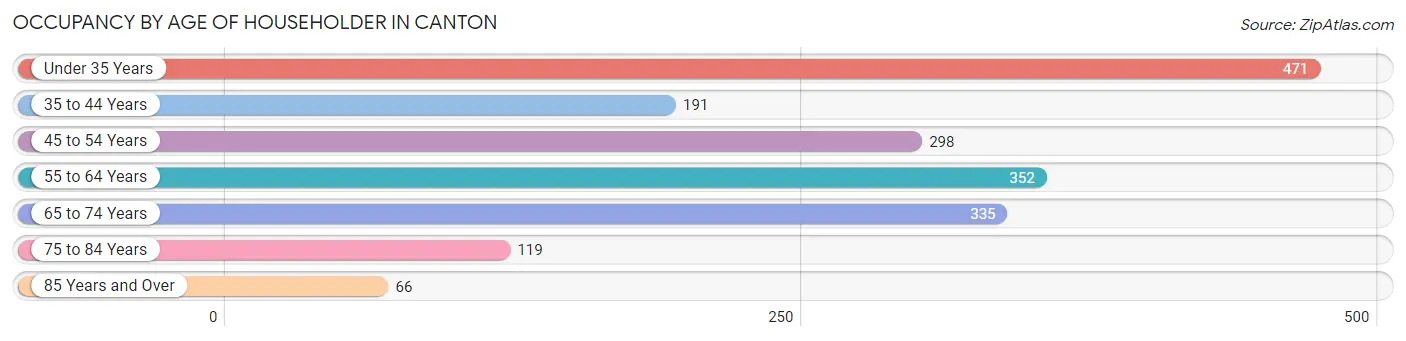
| Age Bracket | # Households | % Households |
| Under 35 Years | 471 | 25.7% |
| 35 to 44 Years | 191 | 10.4% |
| 45 to 54 Years | 298 | 16.3% |
| 55 to 64 Years | 352 | 19.2% |
| 65 to 74 Years | 335 | 18.3% |
| 75 to 84 Years | 119 | 6.5% |
| 85 Years and Over | 66 | 3.6% |
| Total | 1,832 | 100.0% |
Housing Finances in Canton
Median Income by Occupancy in Canton
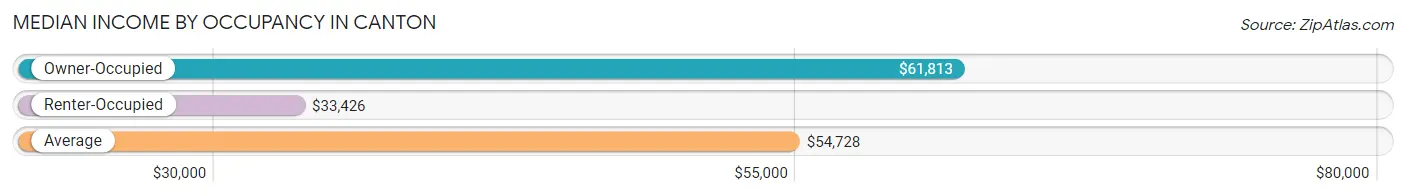
| Occupancy Type | # Households | Median Income |
| Owner-Occupied | 1,206 (65.8%) | $61,813 |
| Renter-Occupied | 626 (34.2%) | $33,426 |
| Average | 1,832 (100.0%) | $54,728 |
Occupancy by Householder Income Bracket in Canton
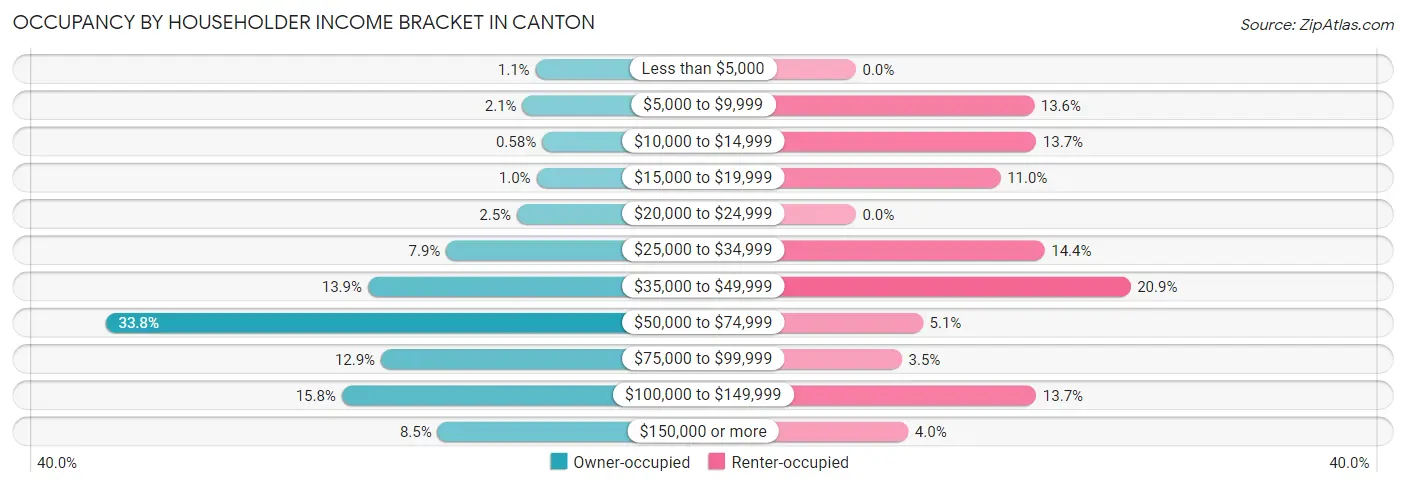
| Income Bracket | Owner-occupied | Renter-occupied |
| Less than $5,000 | 13 (1.1%) | 0 (0.0%) |
| $5,000 to $9,999 | 25 (2.1%) | 85 (13.6%) |
| $10,000 to $14,999 | 7 (0.6%) | 86 (13.7%) |
| $15,000 to $19,999 | 12 (1.0%) | 69 (11.0%) |
| $20,000 to $24,999 | 30 (2.5%) | 0 (0.0%) |
| $25,000 to $34,999 | 95 (7.9%) | 90 (14.4%) |
| $35,000 to $49,999 | 167 (13.9%) | 131 (20.9%) |
| $50,000 to $74,999 | 408 (33.8%) | 32 (5.1%) |
| $75,000 to $99,999 | 155 (12.9%) | 22 (3.5%) |
| $100,000 to $149,999 | 191 (15.8%) | 86 (13.7%) |
| $150,000 or more | 103 (8.5%) | 25 (4.0%) |
| Total | 1,206 (100.0%) | 626 (100.0%) |
Monthly Housing Cost Tiers in Canton
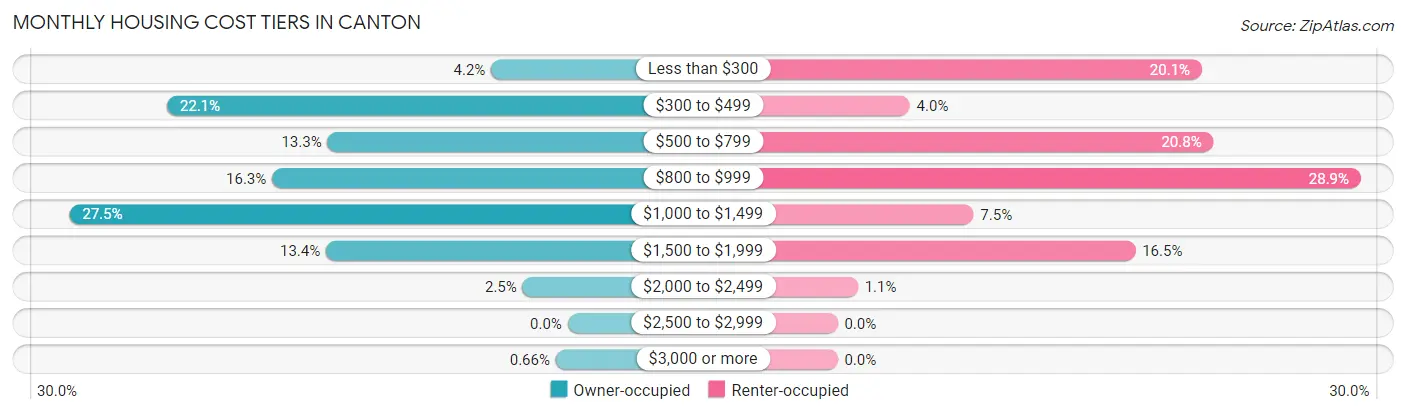
| Monthly Cost | Owner-occupied | Renter-occupied |
| Less than $300 | 51 (4.2%) | 126 (20.1%) |
| $300 to $499 | 267 (22.1%) | 25 (4.0%) |
| $500 to $799 | 160 (13.3%) | 130 (20.8%) |
| $800 to $999 | 197 (16.3%) | 181 (28.9%) |
| $1,000 to $1,499 | 332 (27.5%) | 47 (7.5%) |
| $1,500 to $1,999 | 161 (13.4%) | 103 (16.5%) |
| $2,000 to $2,499 | 30 (2.5%) | 7 (1.1%) |
| $2,500 to $2,999 | 0 (0.0%) | 0 (0.0%) |
| $3,000 or more | 8 (0.7%) | 0 (0.0%) |
| Total | 1,206 (100.0%) | 626 (100.0%) |
Physical Housing Characteristics in Canton
Housing Structures in Canton
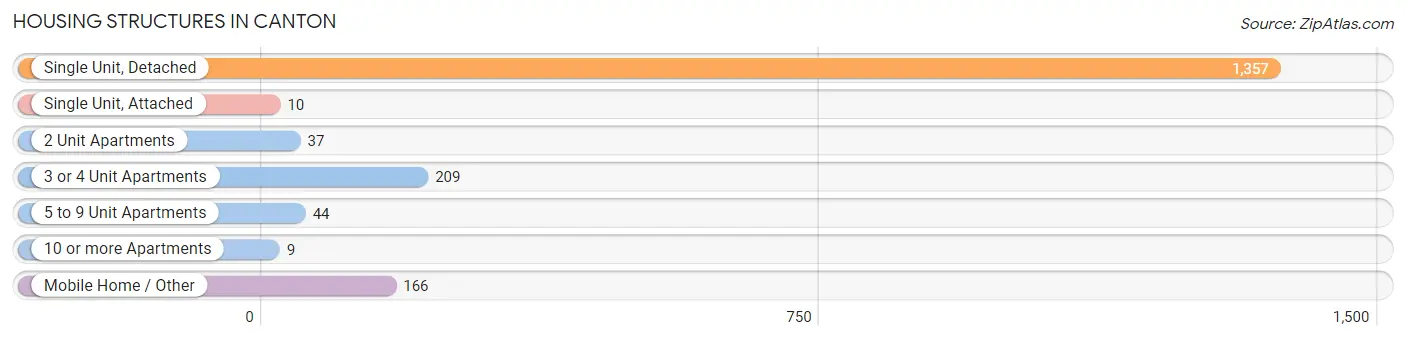
| Structure Type | # Housing Units | % Housing Units |
| Single Unit, Detached | 1,357 | 74.1% |
| Single Unit, Attached | 10 | 0.5% |
| 2 Unit Apartments | 37 | 2.0% |
| 3 or 4 Unit Apartments | 209 | 11.4% |
| 5 to 9 Unit Apartments | 44 | 2.4% |
| 10 or more Apartments | 9 | 0.5% |
| Mobile Home / Other | 166 | 9.1% |
| Total | 1,832 | 100.0% |
Housing Structures by Occupancy in Canton
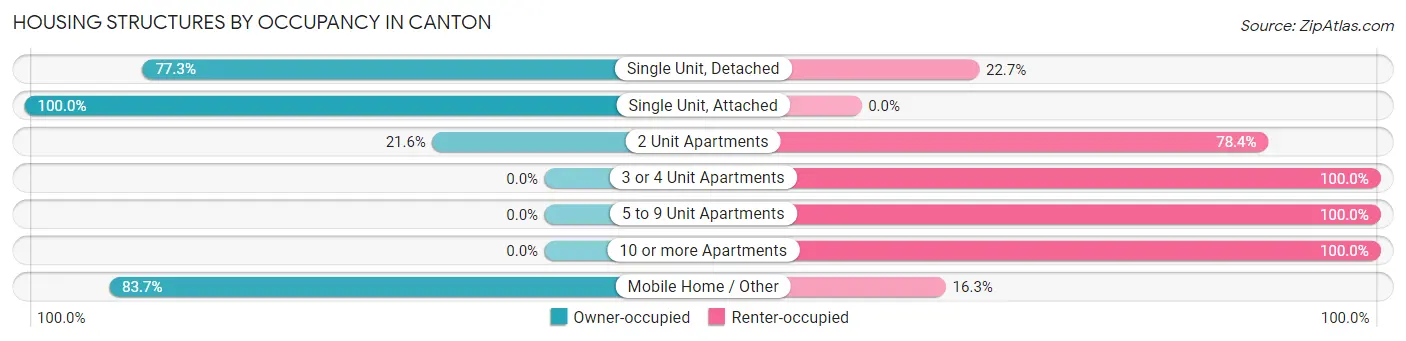
| Structure Type | Owner-occupied | Renter-occupied |
| Single Unit, Detached | 1,049 (77.3%) | 308 (22.7%) |
| Single Unit, Attached | 10 (100.0%) | 0 (0.0%) |
| 2 Unit Apartments | 8 (21.6%) | 29 (78.4%) |
| 3 or 4 Unit Apartments | 0 (0.0%) | 209 (100.0%) |
| 5 to 9 Unit Apartments | 0 (0.0%) | 44 (100.0%) |
| 10 or more Apartments | 0 (0.0%) | 9 (100.0%) |
| Mobile Home / Other | 139 (83.7%) | 27 (16.3%) |
| Total | 1,206 (65.8%) | 626 (34.2%) |
Housing Structures by Number of Rooms in Canton
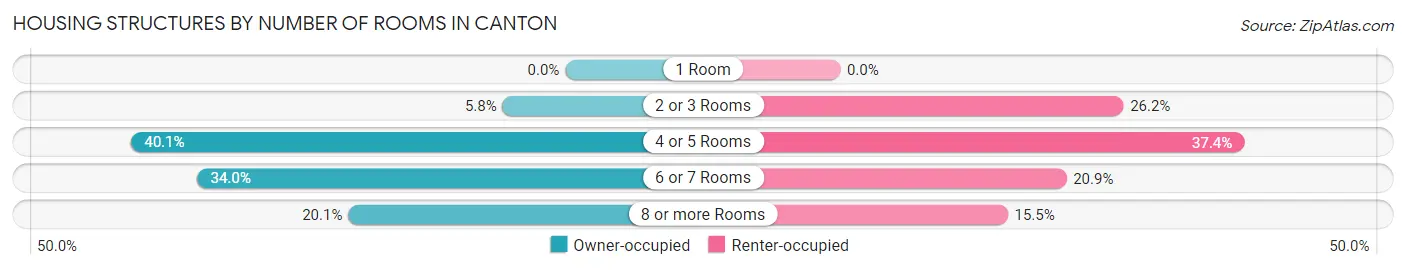
| Number of Rooms | Owner-occupied | Renter-occupied |
| 1 Room | 0 (0.0%) | 0 (0.0%) |
| 2 or 3 Rooms | 70 (5.8%) | 164 (26.2%) |
| 4 or 5 Rooms | 484 (40.1%) | 234 (37.4%) |
| 6 or 7 Rooms | 410 (34.0%) | 131 (20.9%) |
| 8 or more Rooms | 242 (20.1%) | 97 (15.5%) |
| Total | 1,206 (100.0%) | 626 (100.0%) |
Housing Structure by Heating Type in Canton
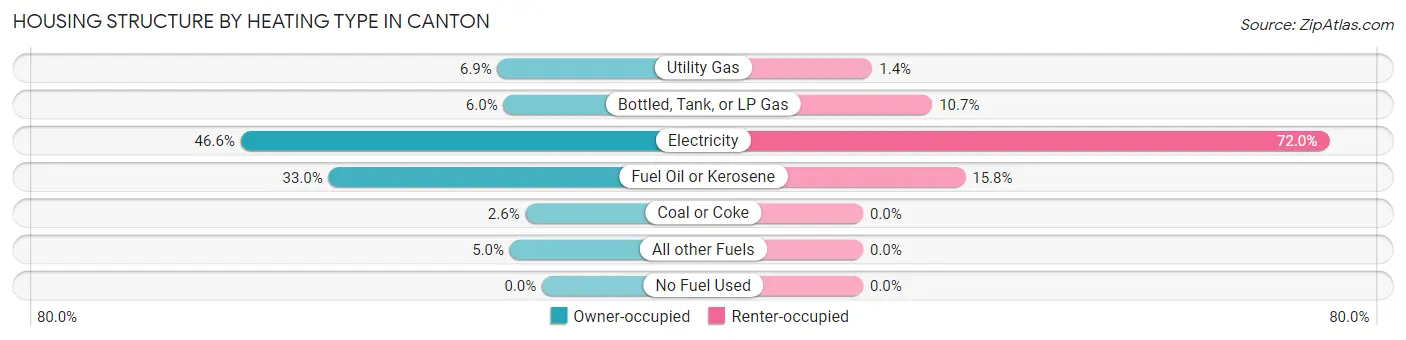
| Heating Type | Owner-occupied | Renter-occupied |
| Utility Gas | 83 (6.9%) | 9 (1.4%) |
| Bottled, Tank, or LP Gas | 72 (6.0%) | 67 (10.7%) |
| Electricity | 562 (46.6%) | 451 (72.0%) |
| Fuel Oil or Kerosene | 398 (33.0%) | 99 (15.8%) |
| Coal or Coke | 31 (2.6%) | 0 (0.0%) |
| All other Fuels | 60 (5.0%) | 0 (0.0%) |
| No Fuel Used | 0 (0.0%) | 0 (0.0%) |
| Total | 1,206 (100.0%) | 626 (100.0%) |
Household Vehicle Usage in Canton
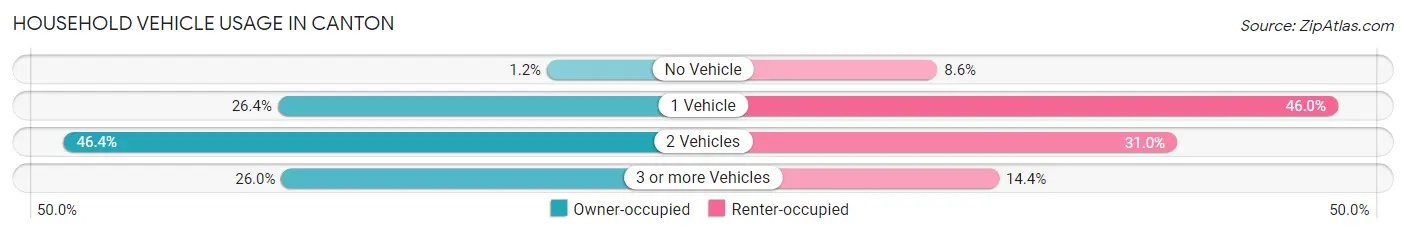
| Vehicles per Household | Owner-occupied | Renter-occupied |
| No Vehicle | 15 (1.2%) | 54 (8.6%) |
| 1 Vehicle | 318 (26.4%) | 288 (46.0%) |
| 2 Vehicles | 559 (46.4%) | 194 (31.0%) |
| 3 or more Vehicles | 314 (26.0%) | 90 (14.4%) |
| Total | 1,206 (100.0%) | 626 (100.0%) |
Real Estate & Mortgages in Canton
Real Estate and Mortgage Overview in Canton
| Characteristic | Without Mortgage | With Mortgage |
| Housing Units | 423 | 783 |
| Median Property Value | $149,600 | $212,900 |
| Median Household Income | $56,060 | $60 |
| Monthly Housing Costs | $359 | $8 |
| Real Estate Taxes | $1,409 | $16 |
Property Value by Mortgage Status in Canton
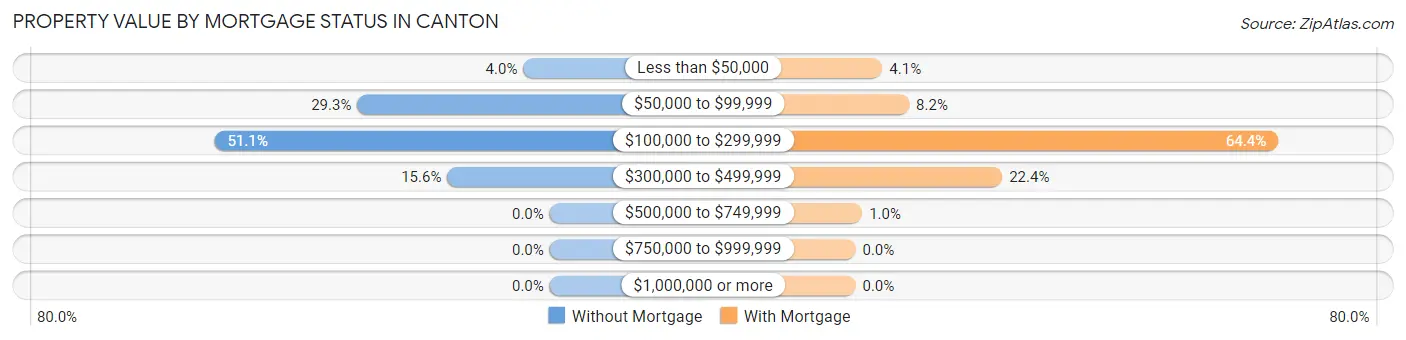
| Property Value | Without Mortgage | With Mortgage |
| Less than $50,000 | 17 (4.0%) | 32 (4.1%) |
| $50,000 to $99,999 | 124 (29.3%) | 64 (8.2%) |
| $100,000 to $299,999 | 216 (51.1%) | 504 (64.4%) |
| $300,000 to $499,999 | 66 (15.6%) | 175 (22.4%) |
| $500,000 to $749,999 | 0 (0.0%) | 8 (1.0%) |
| $750,000 to $999,999 | 0 (0.0%) | 0 (0.0%) |
| $1,000,000 or more | 0 (0.0%) | 0 (0.0%) |
| Total | 423 (100.0%) | 783 (100.0%) |
Household Income by Mortgage Status in Canton
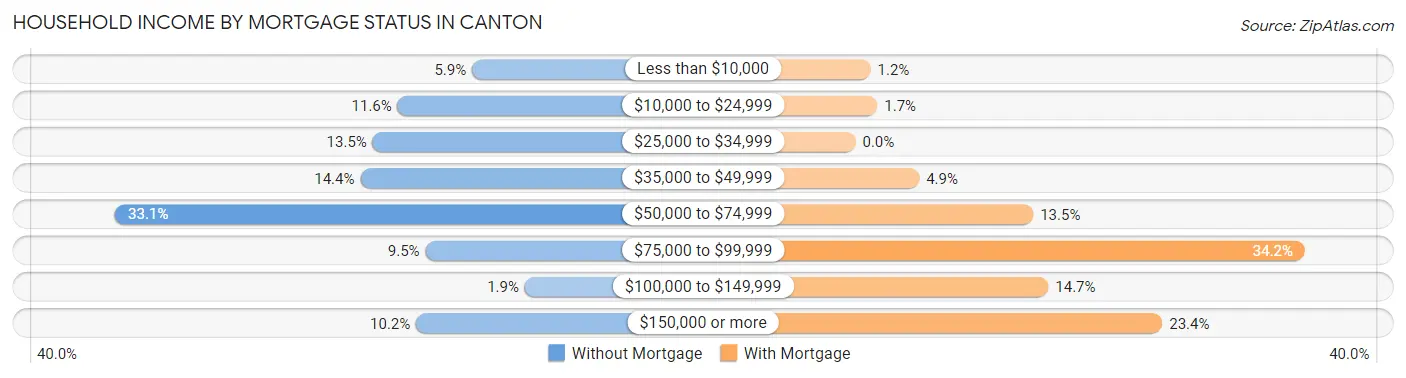
| Household Income | Without Mortgage | With Mortgage |
| Less than $10,000 | 25 (5.9%) | 9 (1.1%) |
| $10,000 to $24,999 | 49 (11.6%) | 13 (1.7%) |
| $25,000 to $34,999 | 57 (13.5%) | 0 (0.0%) |
| $35,000 to $49,999 | 61 (14.4%) | 38 (4.9%) |
| $50,000 to $74,999 | 140 (33.1%) | 106 (13.5%) |
| $75,000 to $99,999 | 40 (9.5%) | 268 (34.2%) |
| $100,000 to $149,999 | 8 (1.9%) | 115 (14.7%) |
| $150,000 or more | 43 (10.2%) | 183 (23.4%) |
| Total | 423 (100.0%) | 783 (100.0%) |
Property Value to Household Income Ratio in Canton
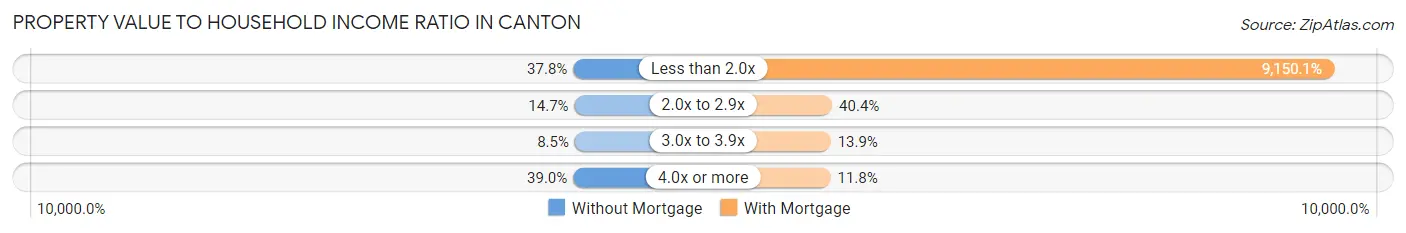
| Value-to-Income Ratio | Without Mortgage | With Mortgage |
| Less than 2.0x | 160 (37.8%) | 71,645 (9,150.1%) |
| 2.0x to 2.9x | 62 (14.7%) | 316 (40.4%) |
| 3.0x to 3.9x | 36 (8.5%) | 109 (13.9%) |
| 4.0x or more | 165 (39.0%) | 92 (11.7%) |
| Total | 423 (100.0%) | 783 (100.0%) |
Real Estate Taxes by Mortgage Status in Canton
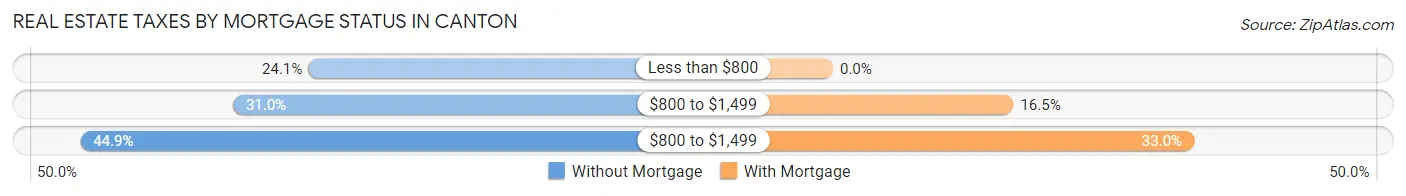
| Property Taxes | Without Mortgage | With Mortgage |
| Less than $800 | 102 (24.1%) | 0 (0.0%) |
| $800 to $1,499 | 131 (31.0%) | 129 (16.5%) |
| $800 to $1,499 | 190 (44.9%) | 258 (33.0%) |
| Total | 423 (100.0%) | 783 (100.0%) |
Health & Disability in Canton
Health Insurance Coverage by Age in Canton
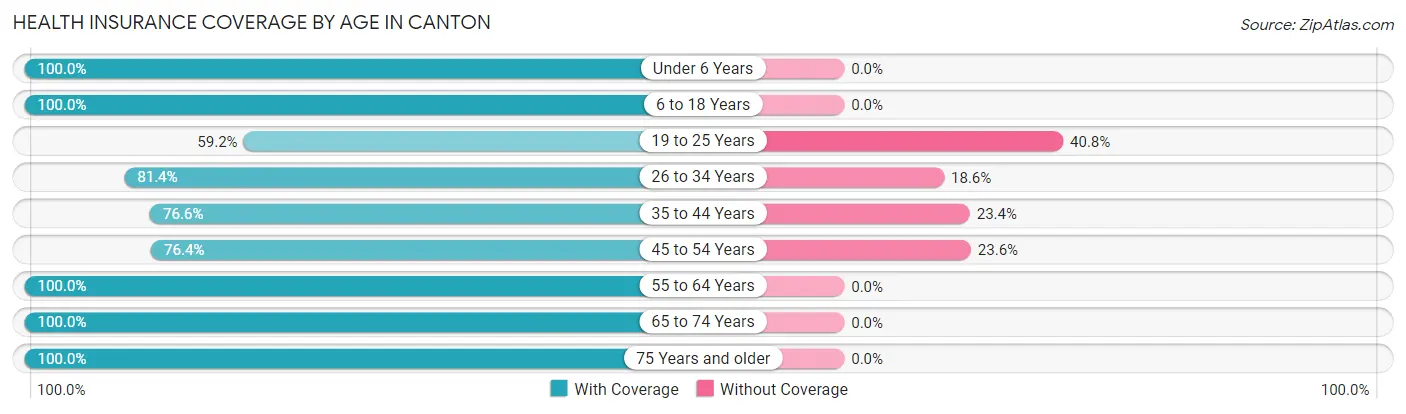
| Age Bracket | With Coverage | Without Coverage |
| Under 6 Years | 328 (100.0%) | 0 (0.0%) |
| 6 to 18 Years | 570 (100.0%) | 0 (0.0%) |
| 19 to 25 Years | 177 (59.2%) | 122 (40.8%) |
| 26 to 34 Years | 739 (81.4%) | 169 (18.6%) |
| 35 to 44 Years | 370 (76.6%) | 113 (23.4%) |
| 45 to 54 Years | 453 (76.4%) | 140 (23.6%) |
| 55 to 64 Years | 468 (100.0%) | 0 (0.0%) |
| 65 to 74 Years | 417 (100.0%) | 0 (0.0%) |
| 75 Years and older | 289 (100.0%) | 0 (0.0%) |
| Total | 3,811 (87.5%) | 544 (12.5%) |
Health Insurance Coverage by Citizenship Status in Canton
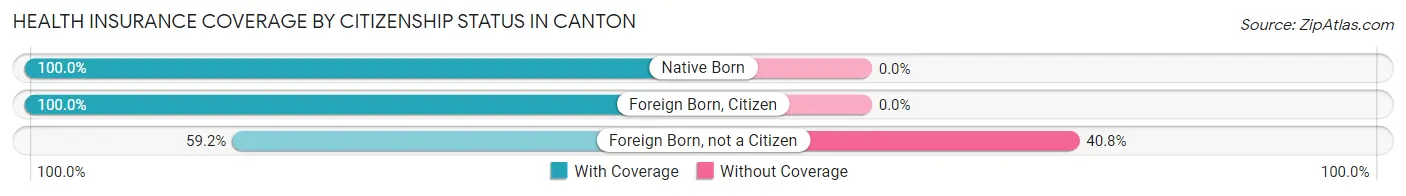
| Citizenship Status | With Coverage | Without Coverage |
| Native Born | 328 (100.0%) | 0 (0.0%) |
| Foreign Born, Citizen | 570 (100.0%) | 0 (0.0%) |
| Foreign Born, not a Citizen | 177 (59.2%) | 122 (40.8%) |
Health Insurance Coverage by Household Income in Canton
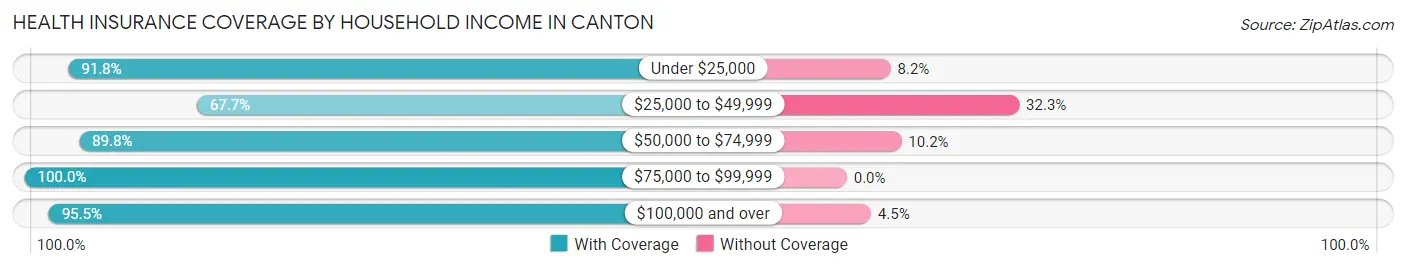
| Household Income | With Coverage | Without Coverage |
| Under $25,000 | 358 (91.8%) | 32 (8.2%) |
| $25,000 to $49,999 | 669 (67.7%) | 319 (32.3%) |
| $50,000 to $74,999 | 1,220 (89.8%) | 139 (10.2%) |
| $75,000 to $99,999 | 422 (100.0%) | 0 (0.0%) |
| $100,000 and over | 1,142 (95.5%) | 54 (4.5%) |
Public vs Private Health Insurance Coverage by Age in Canton
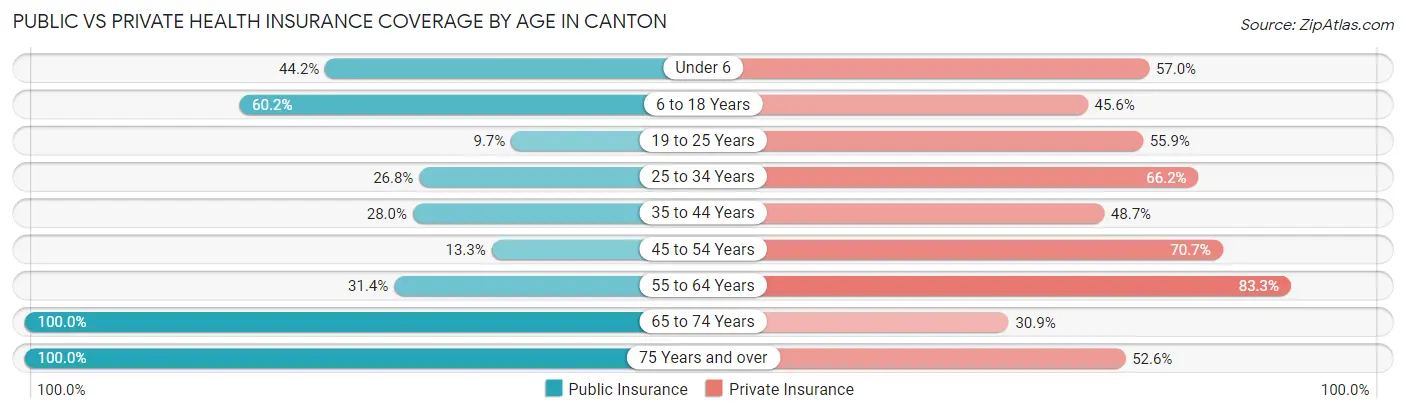
| Age Bracket | Public Insurance | Private Insurance |
| Under 6 | 145 (44.2%) | 187 (57.0%) |
| 6 to 18 Years | 343 (60.2%) | 260 (45.6%) |
| 19 to 25 Years | 29 (9.7%) | 167 (55.8%) |
| 25 to 34 Years | 243 (26.8%) | 601 (66.2%) |
| 35 to 44 Years | 135 (28.0%) | 235 (48.6%) |
| 45 to 54 Years | 79 (13.3%) | 419 (70.7%) |
| 55 to 64 Years | 147 (31.4%) | 390 (83.3%) |
| 65 to 74 Years | 417 (100.0%) | 129 (30.9%) |
| 75 Years and over | 289 (100.0%) | 152 (52.6%) |
| Total | 1,827 (41.9%) | 2,540 (58.3%) |
Disability Status by Sex by Age in Canton
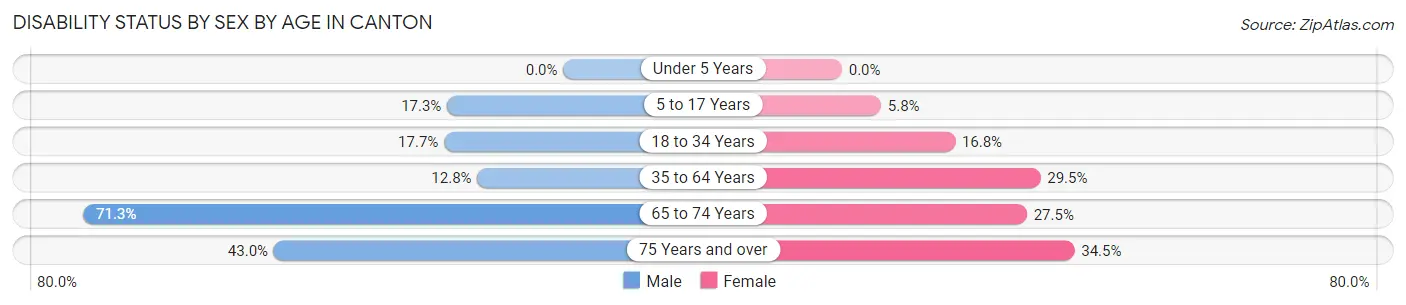
| Age Bracket | Male | Female |
| Under 5 Years | 0 (0.0%) | 0 (0.0%) |
| 5 to 17 Years | 44 (17.2%) | 17 (5.8%) |
| 18 to 34 Years | 114 (17.7%) | 102 (16.8%) |
| 35 to 64 Years | 91 (12.8%) | 245 (29.5%) |
| 65 to 74 Years | 87 (71.3%) | 81 (27.5%) |
| 75 Years and over | 52 (43.0%) | 58 (34.5%) |
Disability Class by Sex by Age in Canton
Disability Class: Hearing Difficulty
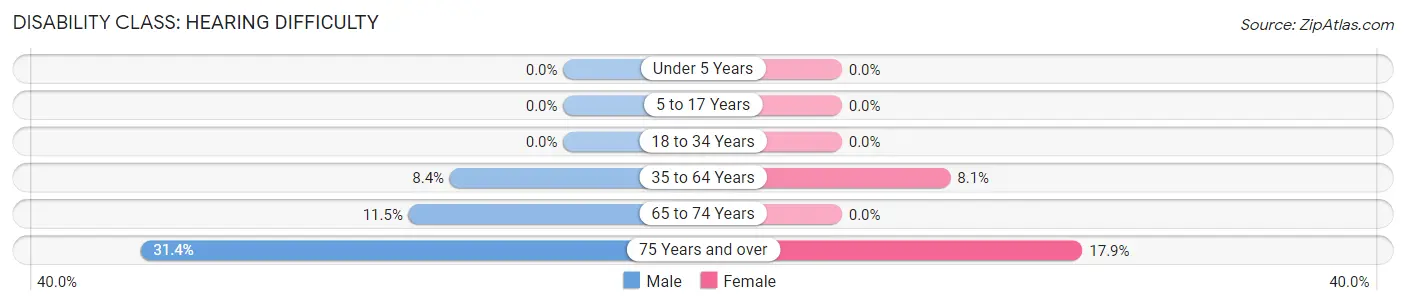
| Age Bracket | Male | Female |
| Under 5 Years | 0 (0.0%) | 0 (0.0%) |
| 5 to 17 Years | 0 (0.0%) | 0 (0.0%) |
| 18 to 34 Years | 0 (0.0%) | 0 (0.0%) |
| 35 to 64 Years | 60 (8.4%) | 67 (8.1%) |
| 65 to 74 Years | 14 (11.5%) | 0 (0.0%) |
| 75 Years and over | 38 (31.4%) | 30 (17.9%) |
Disability Class: Vision Difficulty
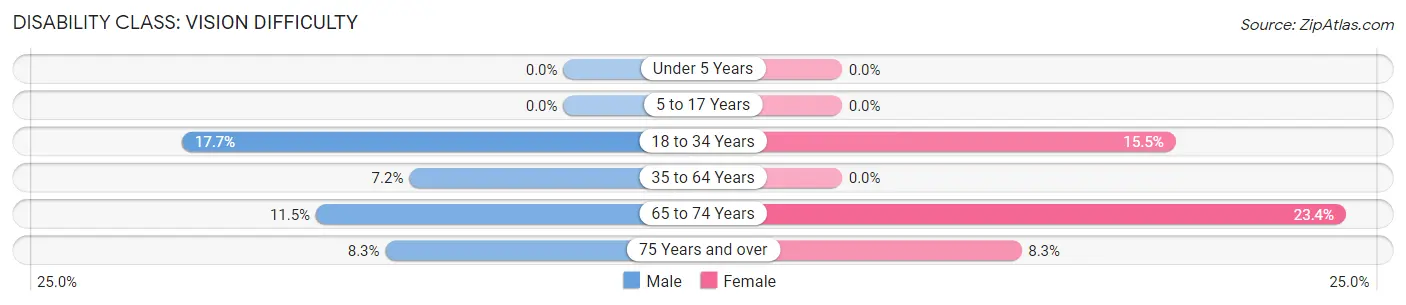
| Age Bracket | Male | Female |
| Under 5 Years | 0 (0.0%) | 0 (0.0%) |
| 5 to 17 Years | 0 (0.0%) | 0 (0.0%) |
| 18 to 34 Years | 114 (17.7%) | 94 (15.5%) |
| 35 to 64 Years | 51 (7.1%) | 0 (0.0%) |
| 65 to 74 Years | 14 (11.5%) | 69 (23.4%) |
| 75 Years and over | 10 (8.3%) | 14 (8.3%) |
Disability Class: Cognitive Difficulty
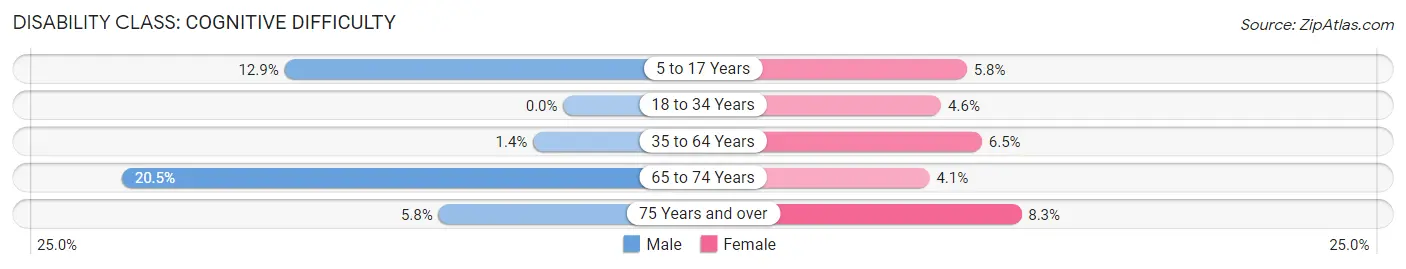
| Age Bracket | Male | Female |
| 5 to 17 Years | 33 (12.9%) | 17 (5.8%) |
| 18 to 34 Years | 0 (0.0%) | 28 (4.6%) |
| 35 to 64 Years | 10 (1.4%) | 54 (6.5%) |
| 65 to 74 Years | 25 (20.5%) | 12 (4.1%) |
| 75 Years and over | 7 (5.8%) | 14 (8.3%) |
Disability Class: Ambulatory Difficulty
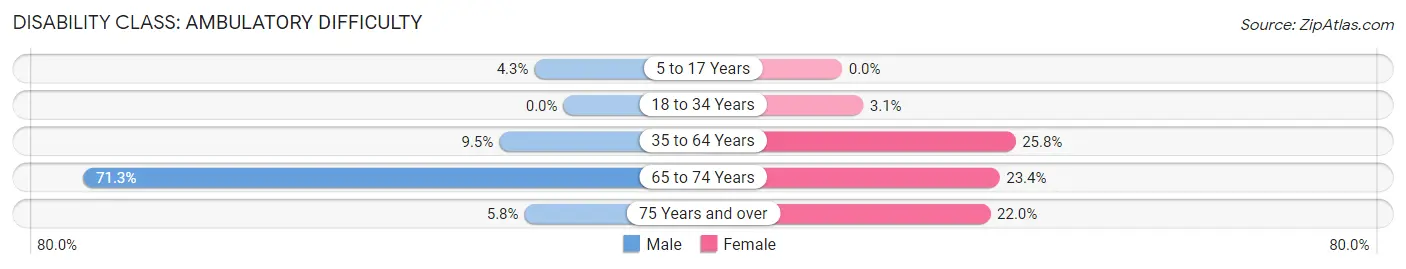
| Age Bracket | Male | Female |
| 5 to 17 Years | 11 (4.3%) | 0 (0.0%) |
| 18 to 34 Years | 0 (0.0%) | 19 (3.1%) |
| 35 to 64 Years | 68 (9.5%) | 214 (25.8%) |
| 65 to 74 Years | 87 (71.3%) | 69 (23.4%) |
| 75 Years and over | 7 (5.8%) | 37 (22.0%) |
Disability Class: Self-Care Difficulty
| Age Bracket | Male | Female |
| 5 to 17 Years | 11 (4.3%) | 0 (0.0%) |
| 18 to 34 Years | 0 (0.0%) | 8 (1.3%) |
| 35 to 64 Years | 0 (0.0%) | 66 (7.9%) |
| 65 to 74 Years | 25 (20.5%) | 0 (0.0%) |
| 75 Years and over | 0 (0.0%) | 0 (0.0%) |
Technology Access in Canton
Computing Device Access in Canton
| Device Type | # Households | % Households |
| Desktop or Laptop | 1,117 | 61.0% |
| Smartphone | 1,505 | 82.2% |
| Tablet | 830 | 45.3% |
| No Computing Device | 224 | 12.2% |
| Total | 1,832 | 100.0% |
Internet Access in Canton
| Internet Type | # Households | % Households |
| Dial-Up Internet | 0 | 0.0% |
| Broadband Home | 1,220 | 66.6% |
| Cellular Data Only | 232 | 12.7% |
| Satellite Internet | 28 | 1.5% |
| No Internet | 344 | 18.8% |
| Total | 1,832 | 100.0% |
Canton Summary
Canton is a town located in Haywood County, North Carolina, United States. It is situated in the western part of the state, about 30 miles west of Asheville. The population was 4,227 at the 2010 census.
History
Canton was founded in 1848 by a group of settlers from the nearby town of Waynesville. The town was named after the city of Canton, Ohio, which was the hometown of one of the settlers. The town was incorporated in 1851 and has since grown to become the largest town in Haywood County.
Geography
Canton is located in the western part of Haywood County, in the foothills of the Great Smoky Mountains. The town is situated at the confluence of the Pigeon River and the West Fork of the Pigeon River. The town is surrounded by the Pisgah National Forest and is located about 30 miles west of Asheville.
The town has a total area of 4.2 square miles, all of which is land. The elevation of the town is 2,072 feet above sea level.
Economy
Canton is home to a variety of businesses, including manufacturing, retail, and tourism. The town is home to several large employers, including Champion International, a paper mill, and Evergreen Packaging, a paper and packaging company. The town is also home to several small businesses, including restaurants, shops, and galleries.
Tourism is an important part of the local economy. The town is home to several attractions, including the Canton Historic District, the Pisgah National Forest, and the Great Smoky Mountains National Park. The town is also home to several festivals and events, including the annual Canton Labor Day Festival and the Canton Christmas Parade.
Demographics
As of the 2010 census, there were 4,227 people, 1,717 households, and 1,093 families residing in the town. The population density was 1,006.2 people per square mile. The racial makeup of the town was 92.2% White, 4.2% African American, 0.3% Native American, 0.7% Asian, 0.1% Pacific Islander, 1.2% from other races, and 1.3% from two or more races. Hispanic or Latino of any race were 2.7% of the population.
The median income for a household in the town was $35,938, and the median income for a family was $45,938. The per capita income for the town was $19,945. About 14.2% of families and 17.3% of the population were below the poverty line, including 25.2% of those under age 18 and 11.2% of those age 65 or over.
Common Questions
What is Per Capita Income in Canton?
Per Capita income in Canton is $29,777.
What is the Median Family Income in Canton?
Median Family Income in Canton is $64,539.
What is the Median Household income in Canton?
Median Household Income in Canton is $54,728.
What is Income or Wage Gap in Canton?
Income or Wage Gap in Canton is 35.0%.
Women in Canton earn 65.0 cents for every dollar earned by a man.
What is Inequality or Gini Index in Canton?
Inequality or Gini Index in Canton is 0.40.
What is the Total Population of Canton?
Total Population of Canton is 4,410.
What is the Total Male Population of Canton?
Total Male Population of Canton is 2,085.
What is the Total Female Population of Canton?
Total Female Population of Canton is 2,325.
What is the Ratio of Males per 100 Females in Canton?
There are 89.68 Males per 100 Females in Canton.
What is the Ratio of Females per 100 Males in Canton?
There are 111.51 Females per 100 Males in Canton.
What is the Median Population Age in Canton?
Median Population Age in Canton is 36.3 Years.
What is the Average Family Size in Canton
Average Family Size in Canton is 3.1 People.
What is the Average Household Size in Canton
Average Household Size in Canton is 2.4 People.
How Large is the Labor Force in Canton?
There are 2,408 People in the Labor Forcein in Canton.
What is the Percentage of People in the Labor Force in Canton?
67.1% of People are in the Labor Force in Canton.
What is the Unemployment Rate in Canton?
Unemployment Rate in Canton is 1.0%.