Waco, NC Map & Demographics
Waco Map
Waco Overview
$23,944
PER CAPITA INCOME
$56,528
AVG FAMILY INCOME
$41,875
AVG HOUSEHOLD INCOME
17.5%
WAGE / INCOME GAP [ % ]
82.5¢/ $1
WAGE / INCOME GAP [ $ ]
0.40
INEQUALITY / GINI INDEX
278
TOTAL POPULATION
124
MALE POPULATION
154
FEMALE POPULATION
80.52
MALES / 100 FEMALES
124.19
FEMALES / 100 MALES
52.7
MEDIAN AGE
3.0
AVG FAMILY SIZE
2.6
AVG HOUSEHOLD SIZE
104
LABOR FORCE [ PEOPLE ]
43.7%
PERCENT IN LABOR FORCE
1.9%
UNEMPLOYMENT RATE
Waco Zip Codes
Waco Area Codes
Income in Waco
Income Overview in Waco
Per Capita Income in Waco is $23,944, while median incomes of families and households are $56,528 and $41,875 respectively.
| Characteristic | Number | Measure |
| Per Capita Income | 278 | $23,944 |
| Median Family Income | 83 | $56,528 |
| Mean Family Income | 83 | $62,254 |
| Median Household Income | 105 | $41,875 |
| Mean Household Income | 105 | $57,813 |
| Income Deficit | 83 | $0 |
| Wage / Income Gap (%) | 278 | 17.47% |
| Wage / Income Gap ($) | 278 | 82.53¢ per $1 |
| Gini / Inequality Index | 278 | 0.40 |
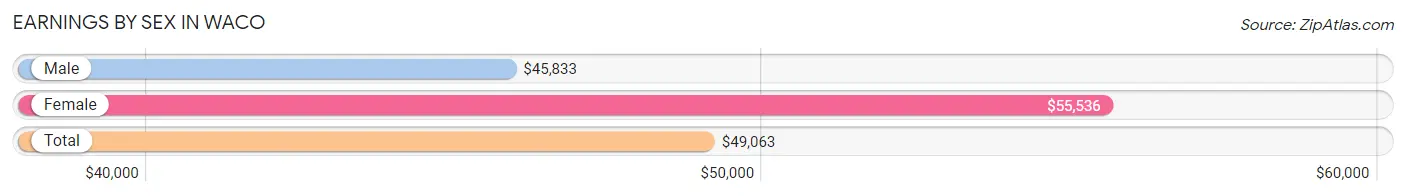
Earnings by Sex in Waco
Average Earnings in Waco are $49,063, $45,833 for men and $55,536 for women, a difference of 17.5%.
| Sex | Number | Average Earnings |
| Male | 62 (56.9%) | $45,833 |
| Female | 47 (43.1%) | $55,536 |
| Total | 109 (100.0%) | $49,063 |
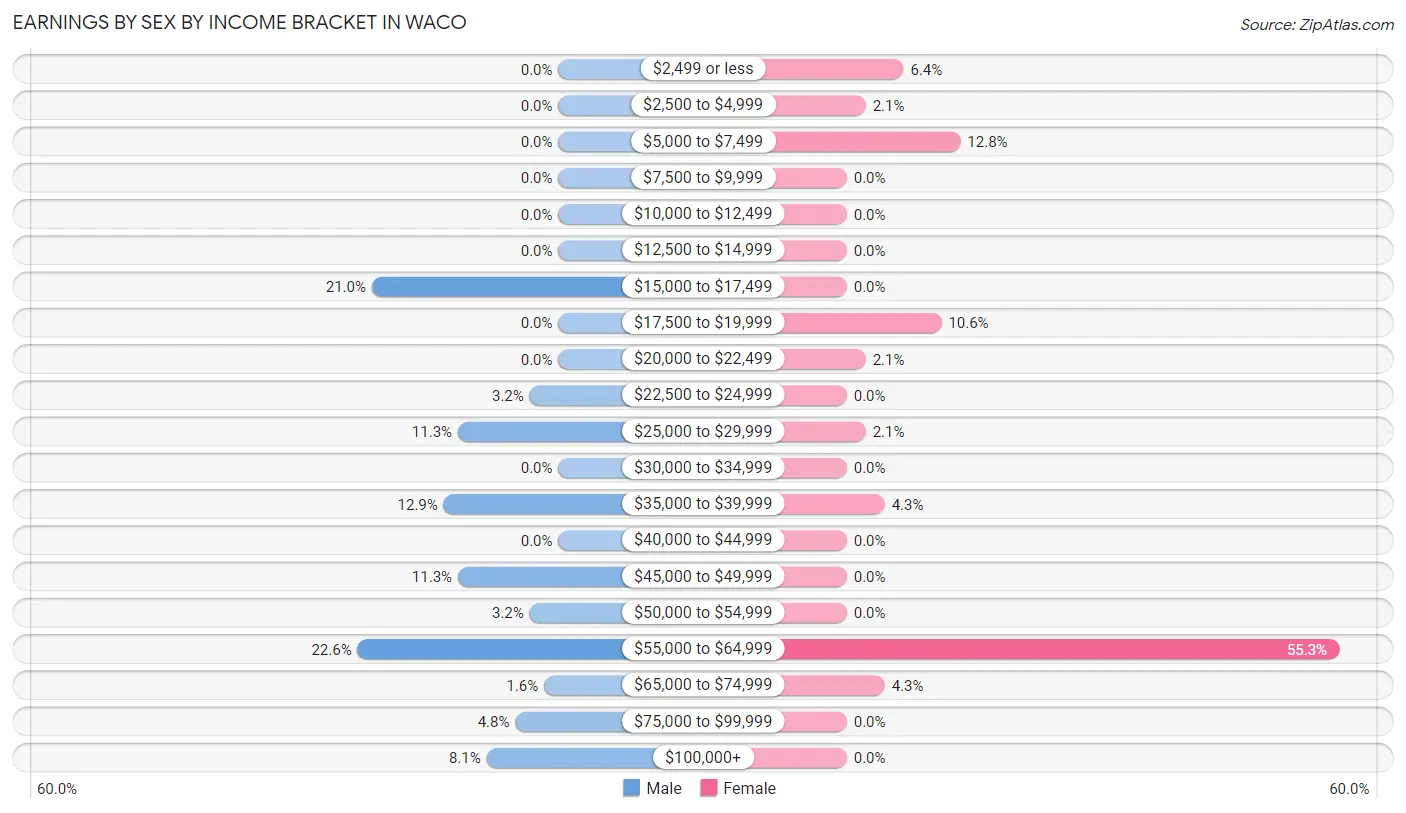
Earnings by Sex by Income Bracket in Waco
The most common earnings brackets in Waco are $55,000 to $64,999 for men (14 | 22.6%) and $55,000 to $64,999 for women (26 | 55.3%).
| Income | Male | Female |
| $2,499 or less | 0 (0.0%) | 3 (6.4%) |
| $2,500 to $4,999 | 0 (0.0%) | 1 (2.1%) |
| $5,000 to $7,499 | 0 (0.0%) | 6 (12.8%) |
| $7,500 to $9,999 | 0 (0.0%) | 0 (0.0%) |
| $10,000 to $12,499 | 0 (0.0%) | 0 (0.0%) |
| $12,500 to $14,999 | 0 (0.0%) | 0 (0.0%) |
| $15,000 to $17,499 | 13 (21.0%) | 0 (0.0%) |
| $17,500 to $19,999 | 0 (0.0%) | 5 (10.6%) |
| $20,000 to $22,499 | 0 (0.0%) | 1 (2.1%) |
| $22,500 to $24,999 | 2 (3.2%) | 0 (0.0%) |
| $25,000 to $29,999 | 7 (11.3%) | 1 (2.1%) |
| $30,000 to $34,999 | 0 (0.0%) | 0 (0.0%) |
| $35,000 to $39,999 | 8 (12.9%) | 2 (4.3%) |
| $40,000 to $44,999 | 0 (0.0%) | 0 (0.0%) |
| $45,000 to $49,999 | 7 (11.3%) | 0 (0.0%) |
| $50,000 to $54,999 | 2 (3.2%) | 0 (0.0%) |
| $55,000 to $64,999 | 14 (22.6%) | 26 (55.3%) |
| $65,000 to $74,999 | 1 (1.6%) | 2 (4.3%) |
| $75,000 to $99,999 | 3 (4.8%) | 0 (0.0%) |
| $100,000+ | 5 (8.1%) | 0 (0.0%) |
| Total | 62 (100.0%) | 47 (100.0%) |
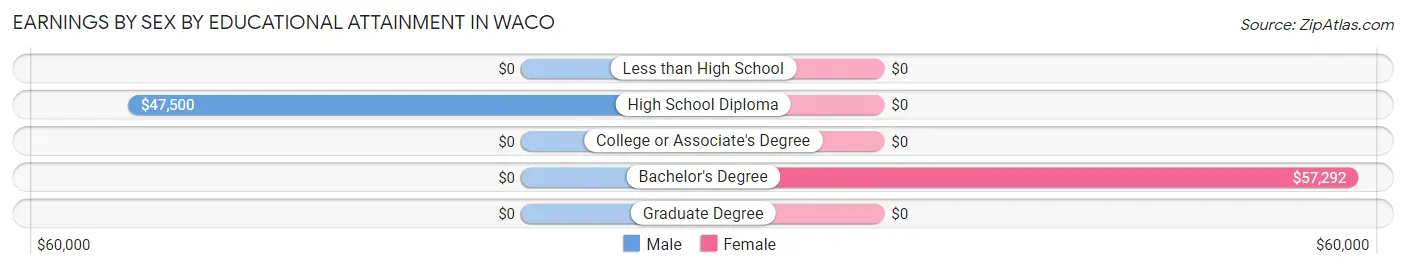
Earnings by Sex by Educational Attainment in Waco
Average earnings in Waco are $39,821 for men and $55,536 for women, a difference of 28.3%. Men with an educational attainment of high school diploma enjoy the highest average annual earnings of $47,500, while those with high school diploma education earn the least with $47,500. Women with an educational attainment of bachelor's degree earn the most with the average annual earnings of $57,292, while those with bachelor's degree education have the smallest earnings of $57,292.
| Educational Attainment | Male Income | Female Income |
| Less than High School | - | - |
| High School Diploma | $47,500 | $0 |
| College or Associate's Degree | - | - |
| Bachelor's Degree | - | - |
| Graduate Degree | - | - |
| Total | $39,821 | $55,536 |
Family Income in Waco
Family Income Brackets in Waco
According to the Waco family income data, there are 19 families falling into the $50,000 to $74,999 income range, which is the most common income bracket and makes up 22.9% of all families.
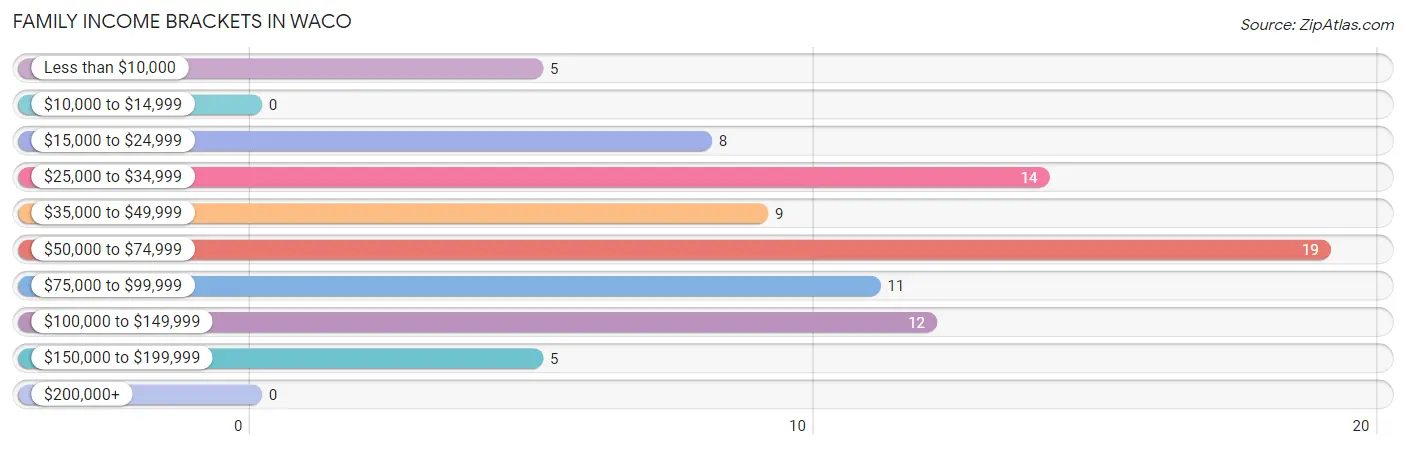
| Income Bracket | # Families | % Families |
| Less than $10,000 | 5 | 6.0% |
| $10,000 to $14,999 | 0 | 0.0% |
| $15,000 to $24,999 | 8 | 9.6% |
| $25,000 to $34,999 | 14 | 16.9% |
| $35,000 to $49,999 | 9 | 10.8% |
| $50,000 to $74,999 | 19 | 22.9% |
| $75,000 to $99,999 | 11 | 13.3% |
| $100,000 to $149,999 | 12 | 14.5% |
| $150,000 to $199,999 | 5 | 6.0% |
| $200,000+ | 0 | 0.0% |
Family Income by Famaliy Size in Waco
3-person families (18 | 21.7%) account for the highest median family income in Waco with $113,571 per family, while 3-person families (18 | 21.7%) have the highest median income of $37,857 per family member.
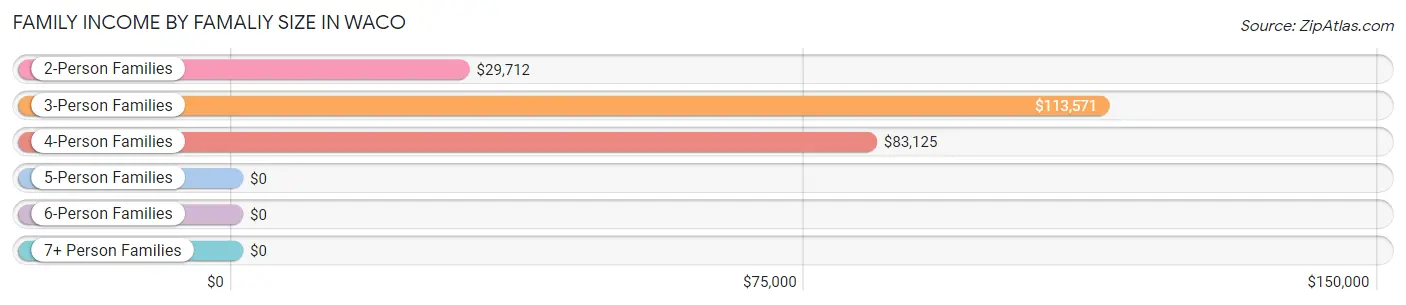
| Income Bracket | # Families | Median Income |
| 2-Person Families | 49 (59.0%) | $29,712 |
| 3-Person Families | 18 (21.7%) | $113,571 |
| 4-Person Families | 16 (19.3%) | $83,125 |
| 5-Person Families | 0 (0.0%) | $0 |
| 6-Person Families | 0 (0.0%) | $0 |
| 7+ Person Families | 0 (0.0%) | $0 |
| Total | 83 (100.0%) | $56,528 |
Family Income by Number of Earners in Waco
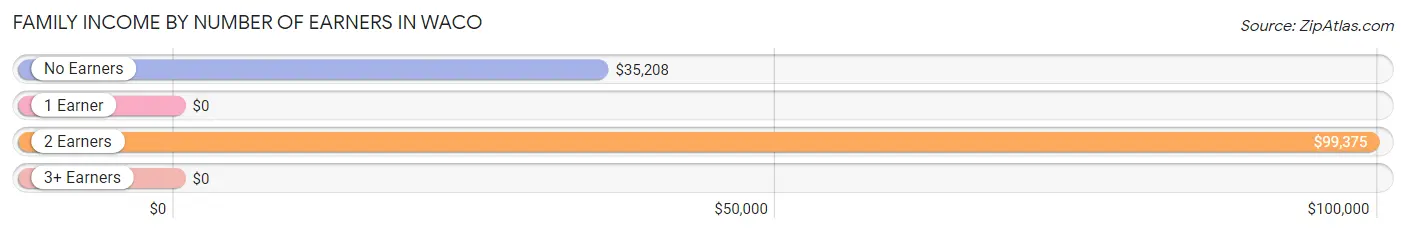
| Number of Earners | # Families | Median Income |
| No Earners | 27 (32.5%) | $35,208 |
| 1 Earner | 25 (30.1%) | $0 |
| 2 Earners | 29 (34.9%) | $99,375 |
| 3+ Earners | 2 (2.4%) | $0 |
| Total | 83 (100.0%) | $56,528 |
Household Income in Waco
Household Income Brackets in Waco
With 19 households falling in the category, the $25,000 to $34,999 income range is the most frequent in Waco, accounting for 18.1% of all households.
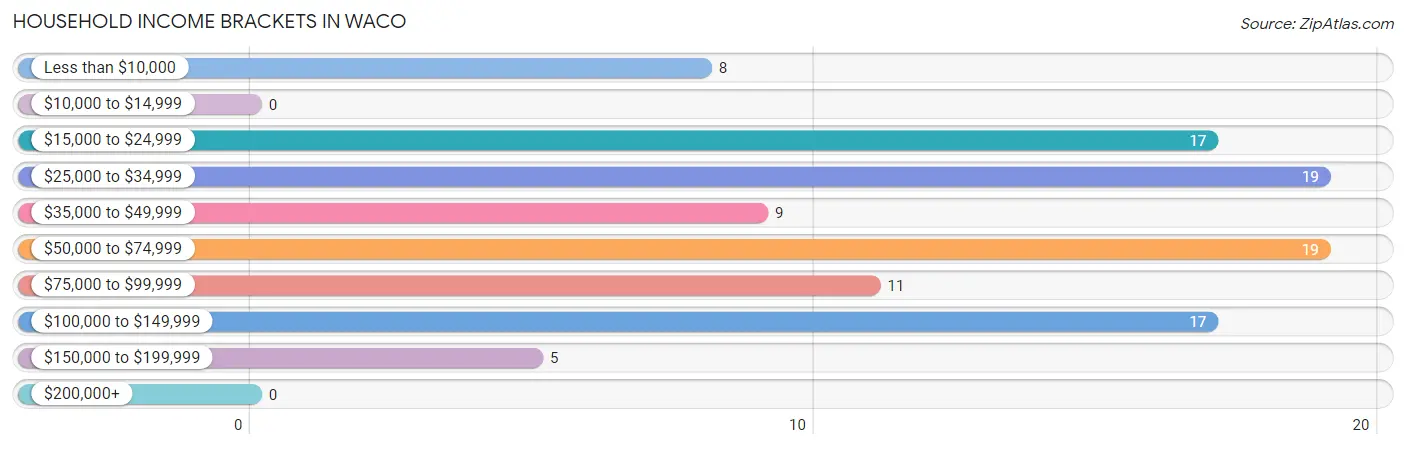
| Income Bracket | # Households | % Households |
| Less than $10,000 | 8 | 7.6% |
| $10,000 to $14,999 | 0 | 0.0% |
| $15,000 to $24,999 | 17 | 16.2% |
| $25,000 to $34,999 | 19 | 18.1% |
| $35,000 to $49,999 | 9 | 8.6% |
| $50,000 to $74,999 | 19 | 18.1% |
| $75,000 to $99,999 | 11 | 10.5% |
| $100,000 to $149,999 | 17 | 16.2% |
| $150,000 to $199,999 | 5 | 4.8% |
| $200,000+ | 0 | 0.0% |
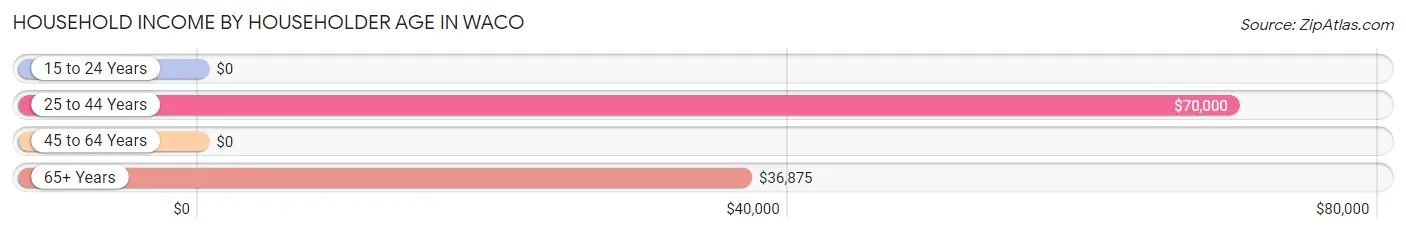
Household Income by Householder Age in Waco
The median household income in Waco is $41,875, with the highest median household income of $70,000 found in the 25 to 44 years age bracket for the primary householder. A total of 22 households (20.9%) fall into this category.
| Income Bracket | # Households | Median Income |
| 15 to 24 Years | 0 (0.0%) | $0 |
| 25 to 44 Years | 22 (20.9%) | $70,000 |
| 45 to 64 Years | 40 (38.1%) | $0 |
| 65+ Years | 43 (40.9%) | $36,875 |
| Total | 105 (100.0%) | $41,875 |
Poverty in Waco
Income Below Poverty by Sex and Age in Waco
With 7.3% poverty level for males and 7.8% for females among the residents of Waco, under 5 year old males and 45 to 54 year old females are the most vulnerable to poverty, with 5 males (100.0%) and 3 females (33.3%) in their respective age groups living below the poverty level.
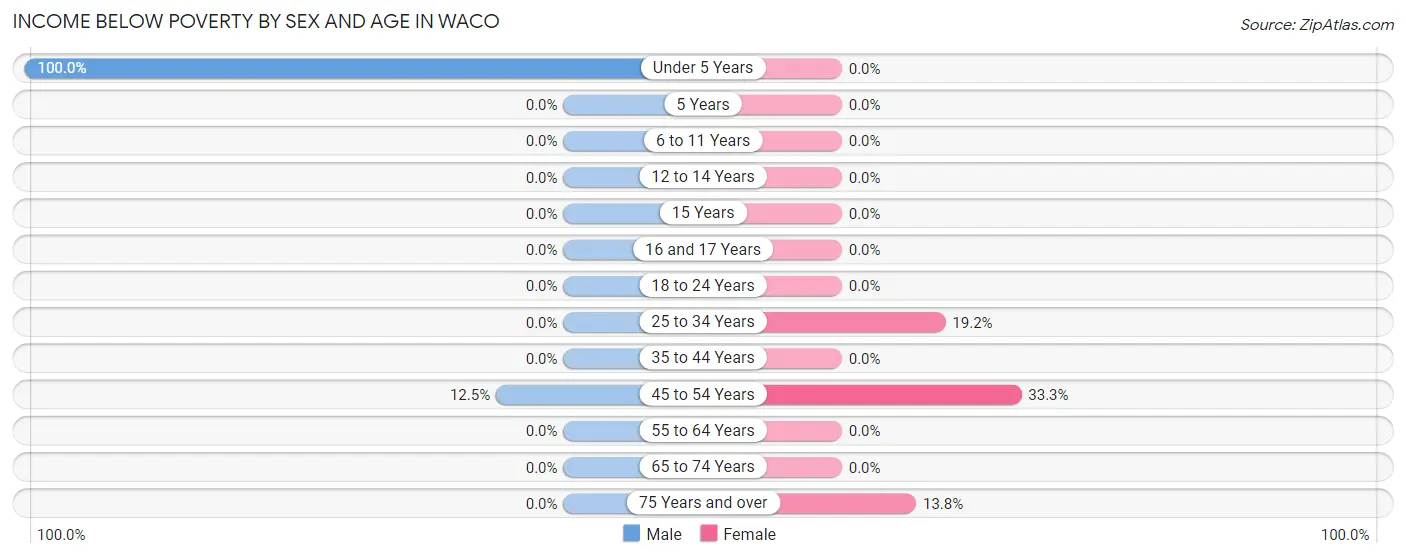
| Age Bracket | Male | Female |
| Under 5 Years | 5 (100.0%) | 0 (0.0%) |
| 5 Years | 0 (0.0%) | 0 (0.0%) |
| 6 to 11 Years | 0 (0.0%) | 0 (0.0%) |
| 12 to 14 Years | 0 (0.0%) | 0 (0.0%) |
| 15 Years | 0 (0.0%) | 0 (0.0%) |
| 16 and 17 Years | 0 (0.0%) | 0 (0.0%) |
| 18 to 24 Years | 0 (0.0%) | 0 (0.0%) |
| 25 to 34 Years | 0 (0.0%) | 5 (19.2%) |
| 35 to 44 Years | 0 (0.0%) | 0 (0.0%) |
| 45 to 54 Years | 4 (12.5%) | 3 (33.3%) |
| 55 to 64 Years | 0 (0.0%) | 0 (0.0%) |
| 65 to 74 Years | 0 (0.0%) | 0 (0.0%) |
| 75 Years and over | 0 (0.0%) | 4 (13.8%) |
| Total | 9 (7.3%) | 12 (7.8%) |
Income Above Poverty by Sex and Age in Waco
According to the poverty statistics in Waco, males aged 12 to 14 years and females aged under 5 years are the age groups that are most secure financially, with 100.0% of males and 100.0% of females in these age groups living above the poverty line.
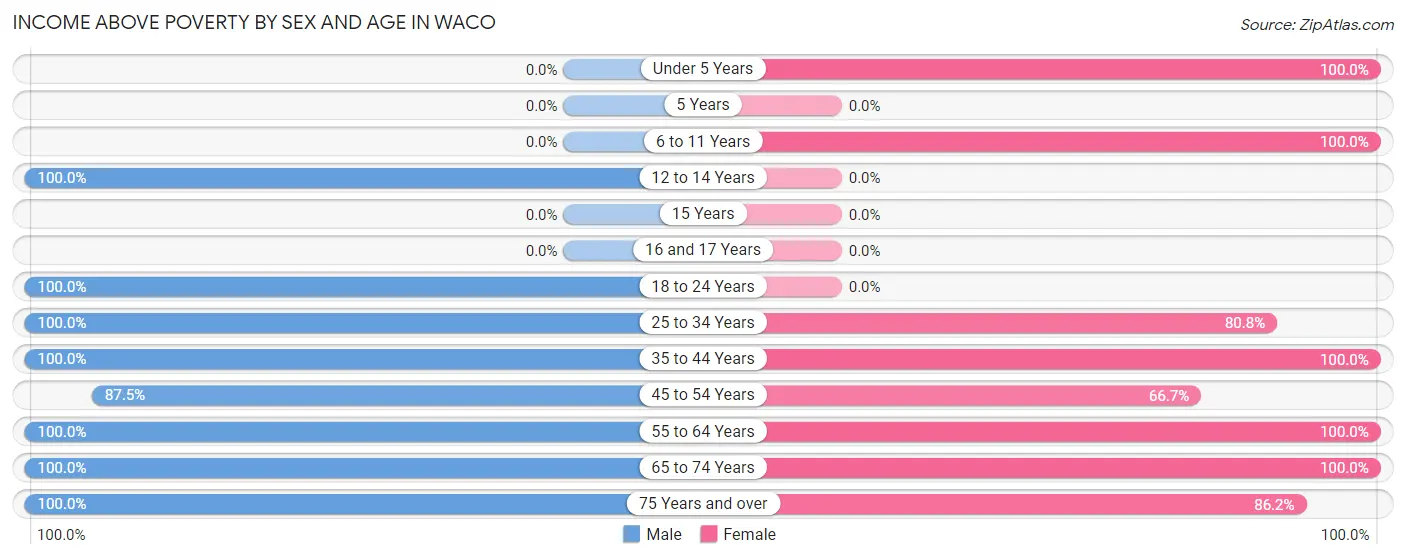
| Age Bracket | Male | Female |
| Under 5 Years | 0 (0.0%) | 7 (100.0%) |
| 5 Years | 0 (0.0%) | 0 (0.0%) |
| 6 to 11 Years | 0 (0.0%) | 10 (100.0%) |
| 12 to 14 Years | 18 (100.0%) | 0 (0.0%) |
| 15 Years | 0 (0.0%) | 0 (0.0%) |
| 16 and 17 Years | 0 (0.0%) | 0 (0.0%) |
| 18 to 24 Years | 3 (100.0%) | 0 (0.0%) |
| 25 to 34 Years | 13 (100.0%) | 21 (80.8%) |
| 35 to 44 Years | 15 (100.0%) | 24 (100.0%) |
| 45 to 54 Years | 28 (87.5%) | 6 (66.7%) |
| 55 to 64 Years | 1 (100.0%) | 25 (100.0%) |
| 65 to 74 Years | 26 (100.0%) | 24 (100.0%) |
| 75 Years and over | 11 (100.0%) | 25 (86.2%) |
| Total | 115 (92.7%) | 142 (92.2%) |
Income Below Poverty Among Married-Couple Families in Waco
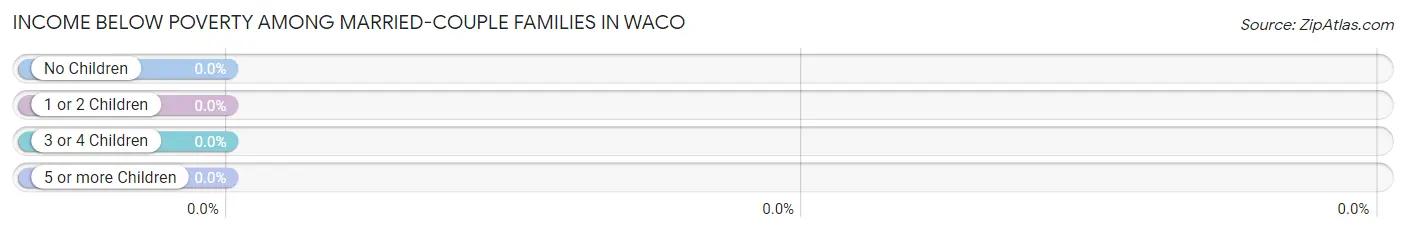
| Children | Above Poverty | Below Poverty |
| No Children | 23 (100.0%) | 0 (0.0%) |
| 1 or 2 Children | 26 (100.0%) | 0 (0.0%) |
| 3 or 4 Children | 0 (0.0%) | 0 (0.0%) |
| 5 or more Children | 0 (0.0%) | 0 (0.0%) |
| Total | 49 (100.0%) | 0 (0.0%) |
Income Below Poverty Among Single-Parent Households in Waco
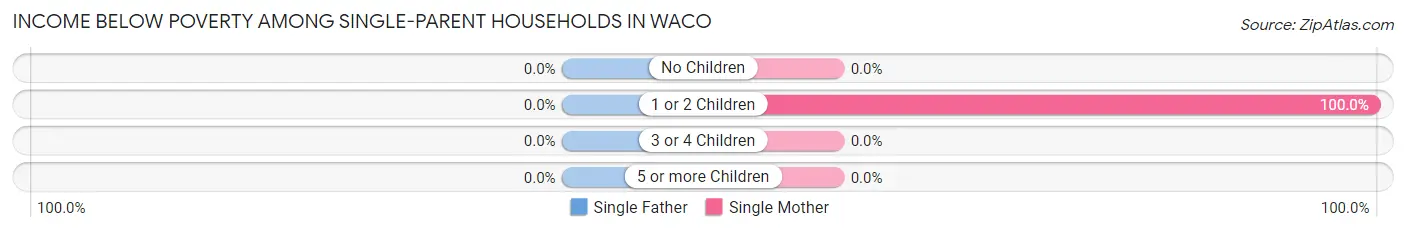
| Children | Single Father | Single Mother |
| No Children | 0 (0.0%) | 0 (0.0%) |
| 1 or 2 Children | 0 (0.0%) | 5 (100.0%) |
| 3 or 4 Children | 0 (0.0%) | 0 (0.0%) |
| 5 or more Children | 0 (0.0%) | 0 (0.0%) |
| Total | 0 (0.0%) | 5 (100.0%) |
Income Below Poverty Among Married-Couple vs Single-Parent Households in Waco
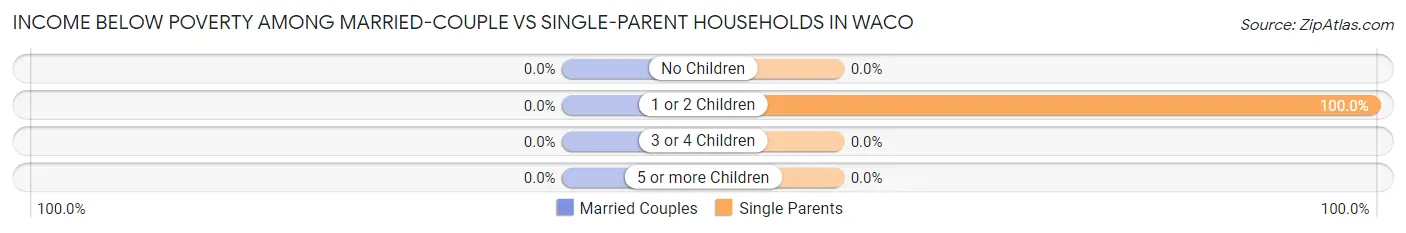
| Children | Married-Couple Families | Single-Parent Households |
| No Children | 0 (0.0%) | 0 (0.0%) |
| 1 or 2 Children | 0 (0.0%) | 5 (100.0%) |
| 3 or 4 Children | 0 (0.0%) | 0 (0.0%) |
| 5 or more Children | 0 (0.0%) | 0 (0.0%) |
| Total | 0 (0.0%) | 5 (14.7%) |
Race in Waco
The most populous races in Waco are White / Caucasian (258 | 92.8%), Black / African American (19 | 6.8%), and Hispanic or Latino (1 | 0.4%).
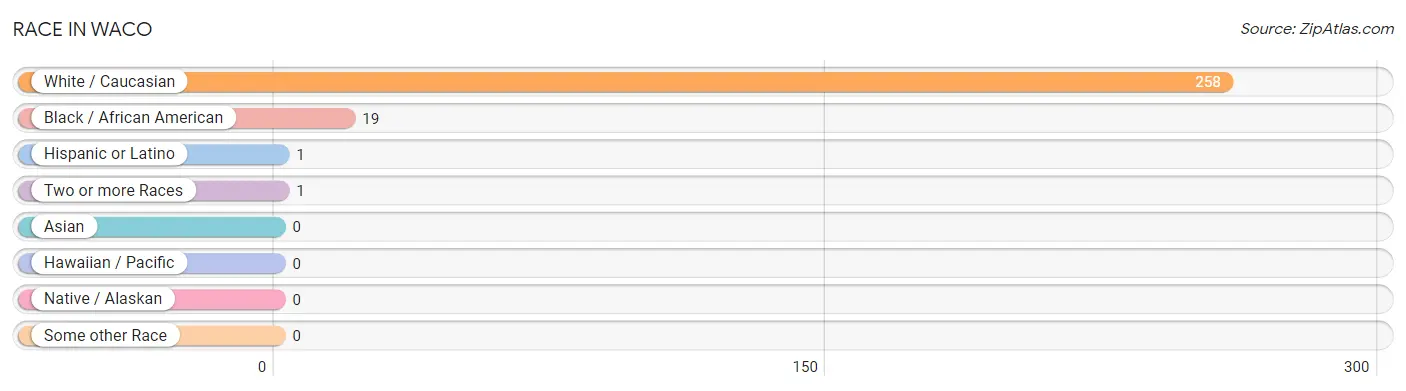
| Race | # Population | % Population |
| Asian | 0 | 0.0% |
| Black / African American | 19 | 6.8% |
| Hawaiian / Pacific | 0 | 0.0% |
| Hispanic or Latino | 1 | 0.4% |
| Native / Alaskan | 0 | 0.0% |
| White / Caucasian | 258 | 92.8% |
| Two or more Races | 1 | 0.4% |
| Some other Race | 0 | 0.0% |
| Total | 278 | 100.0% |
Ancestry in Waco
The most populous ancestries reported in Waco are American (145 | 52.2%), German (42 | 15.1%), Scotch-Irish (34 | 12.2%), English (6 | 2.2%), and Scottish (6 | 2.2%), together accounting for 83.8% of all Waco residents.
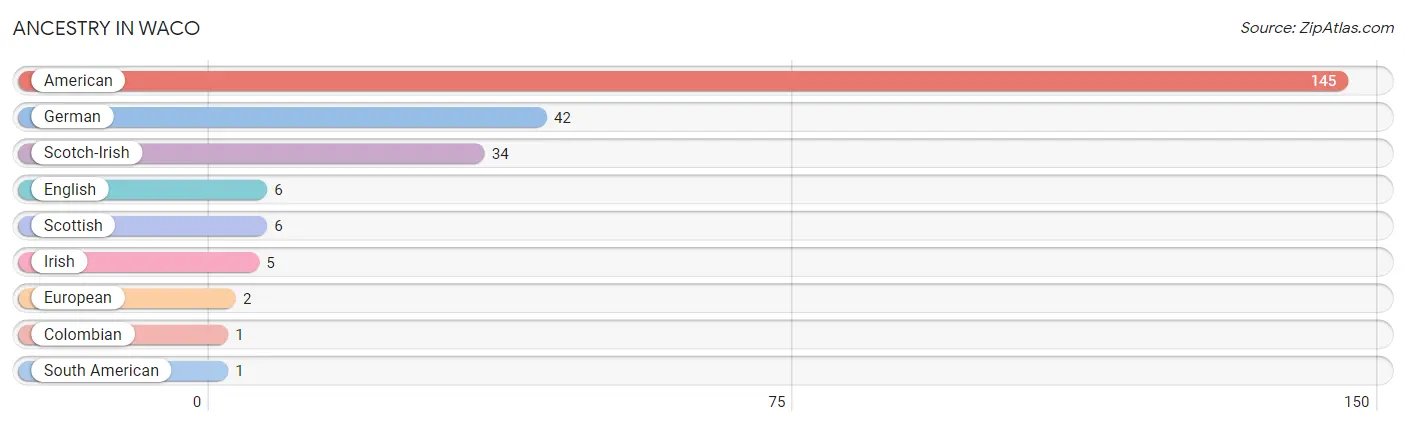
| Ancestry | # Population | % Population |
| American | 145 | 52.2% |
| Colombian | 1 | 0.4% |
| English | 6 | 2.2% |
| European | 2 | 0.7% |
| German | 42 | 15.1% |
| Irish | 5 | 1.8% |
| Scotch-Irish | 34 | 12.2% |
| Scottish | 6 | 2.2% |
| South American | 1 | 0.4% | View All 9 Rows |
Immigrants in Waco
The most numerous immigrant groups reported in Waco came from Colombia (1 | 0.4%), Latin America (1 | 0.4%), and South America (1 | 0.4%), together accounting for 1.1% of all Waco residents.
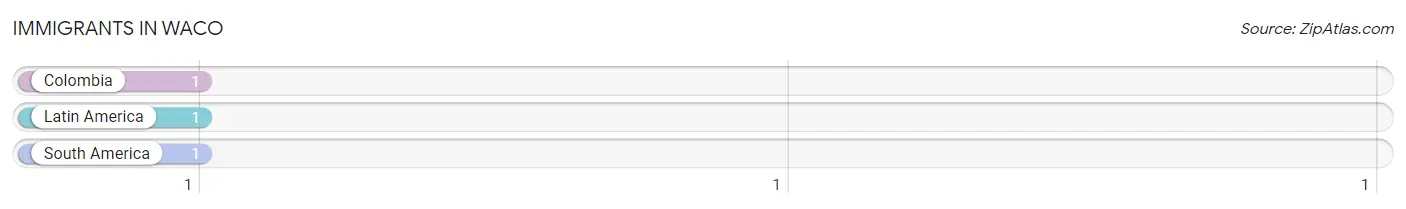
| Immigration Origin | # Population | % Population |
| Colombia | 1 | 0.4% |
| Latin America | 1 | 0.4% |
| South America | 1 | 0.4% | View All 3 Rows |
Sex and Age in Waco
Sex and Age in Waco
The most populous age groups in Waco are 50 to 54 Years (29 | 23.4%) for men and 40 to 44 Years (24 | 15.6%) for women.

| Age Bracket | Male | Female |
| Under 5 Years | 5 (4.0%) | 7 (4.5%) |
| 5 to 9 Years | 0 (0.0%) | 8 (5.2%) |
| 10 to 14 Years | 18 (14.5%) | 2 (1.3%) |
| 15 to 19 Years | 0 (0.0%) | 0 (0.0%) |
| 20 to 24 Years | 3 (2.4%) | 0 (0.0%) |
| 25 to 29 Years | 4 (3.2%) | 5 (3.3%) |
| 30 to 34 Years | 9 (7.3%) | 21 (13.6%) |
| 35 to 39 Years | 8 (6.5%) | 0 (0.0%) |
| 40 to 44 Years | 7 (5.7%) | 24 (15.6%) |
| 45 to 49 Years | 3 (2.4%) | 0 (0.0%) |
| 50 to 54 Years | 29 (23.4%) | 9 (5.8%) |
| 55 to 59 Years | 1 (0.8%) | 10 (6.5%) |
| 60 to 64 Years | 0 (0.0%) | 15 (9.7%) |
| 65 to 69 Years | 18 (14.5%) | 21 (13.6%) |
| 70 to 74 Years | 8 (6.5%) | 3 (1.9%) |
| 75 to 79 Years | 4 (3.2%) | 5 (3.3%) |
| 80 to 84 Years | 3 (2.4%) | 20 (13.0%) |
| 85 Years and over | 4 (3.2%) | 4 (2.6%) |
| Total | 124 (100.0%) | 154 (100.0%) |
Families and Households in Waco
Median Family Size in Waco
The median family size in Waco is 2.96 persons per family, with married-couple families (49 | 59.0%) accounting for the largest median family size of 3.06 persons per family. On the other hand, single female/mother families (5 | 6.0%) represent the smallest median family size with 2.00 persons per family.
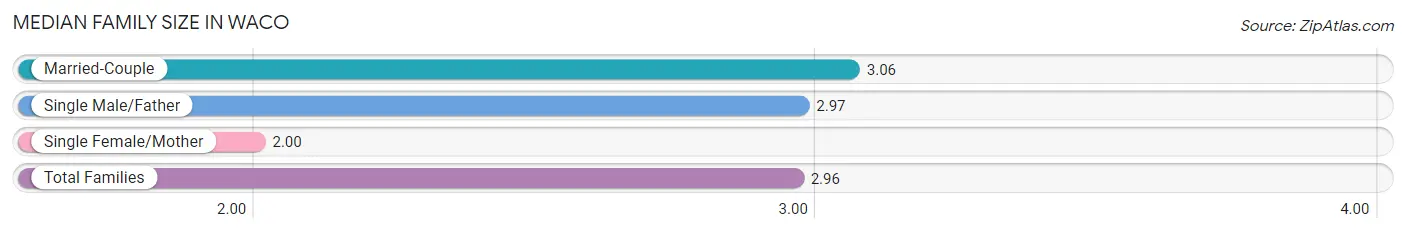
| Family Type | # Families | Family Size |
| Married-Couple | 49 (59.0%) | 3.06 |
| Single Male/Father | 29 (34.9%) | 2.97 |
| Single Female/Mother | 5 (6.0%) | 2.00 |
| Total Families | 83 (100.0%) | 2.96 |
Median Household Size in Waco
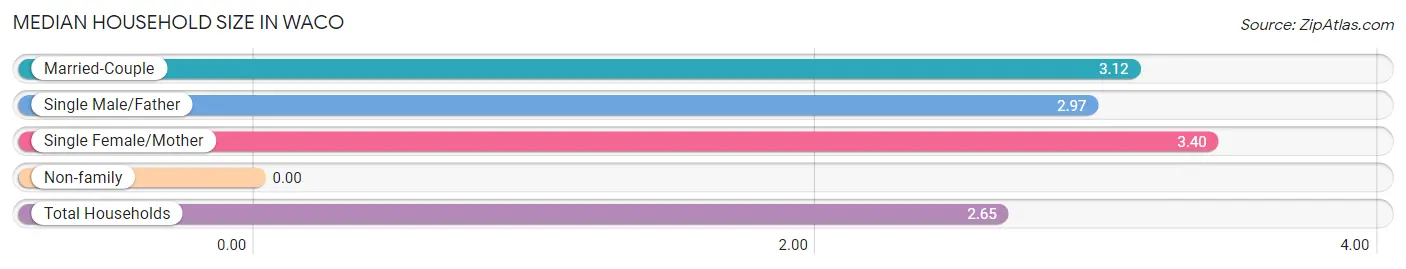
| Household Type | # Households | Household Size |
| Married-Couple | 49 (46.7%) | 3.12 |
| Single Male/Father | 29 (27.6%) | 2.97 |
| Single Female/Mother | 5 (4.8%) | 3.40 |
| Non-family | 22 (20.9%) | - |
| Total Households | 105 (100.0%) | 2.65 |
Household Size by Marriage Status in Waco
Out of a total of 105 households in Waco, 83 (79.0%) are family households, while 22 (20.9%) are nonfamily households. The most numerous type of family households are 2-person households, comprising 43, and the most common type of nonfamily households are 1-person households, comprising 22.
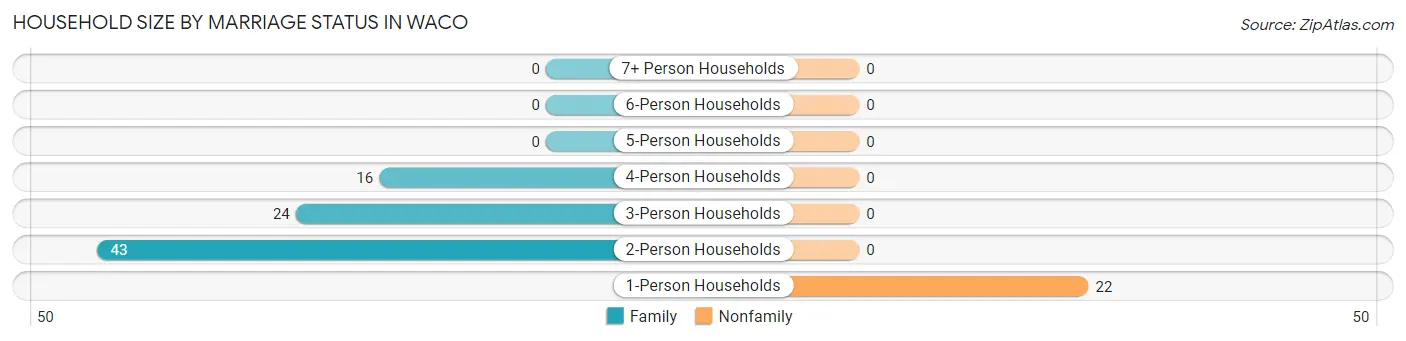
| Household Size | Family Households | Nonfamily Households |
| 1-Person Households | - | 22 (20.9%) |
| 2-Person Households | 43 (40.9%) | 0 (0.0%) |
| 3-Person Households | 24 (22.9%) | 0 (0.0%) |
| 4-Person Households | 16 (15.2%) | 0 (0.0%) |
| 5-Person Households | 0 (0.0%) | 0 (0.0%) |
| 6-Person Households | 0 (0.0%) | 0 (0.0%) |
| 7+ Person Households | 0 (0.0%) | 0 (0.0%) |
| Total | 83 (79.0%) | 22 (20.9%) |
Female Fertility in Waco
Fertility by Age in Waco
Average fertility rate in Waco is 120.0 births per 1,000 women. Women in the age bracket of 20 to 34 years have the highest fertility rate with 231.0 births per 1,000 women. Women in the age bracket of 20 to 34 years acount for 100.0% of all women with births.
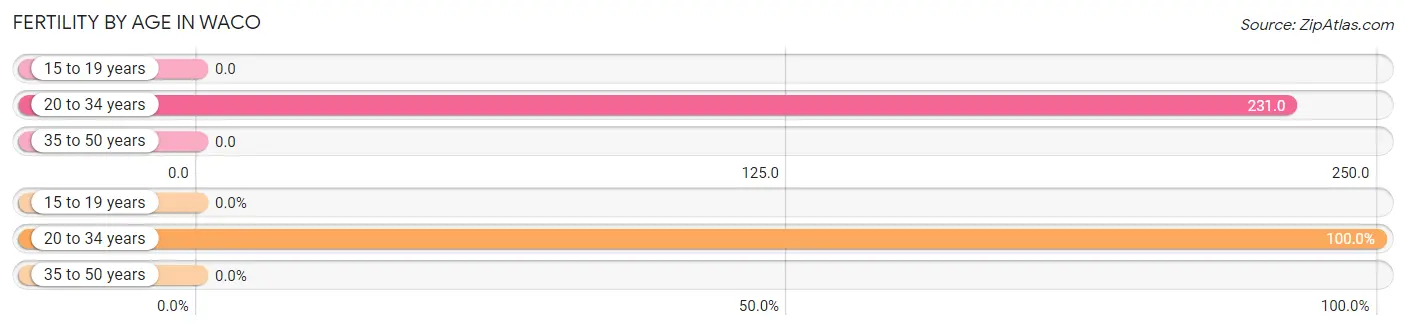
| Age Bracket | Women with Births | Births / 1,000 Women |
| 15 to 19 years | 0 (0.0%) | 0.0 |
| 20 to 34 years | 6 (100.0%) | 231.0 |
| 35 to 50 years | 0 (0.0%) | 0.0 |
| Total | 6 (100.0%) | 120.0 |
Fertility by Age by Marriage Status in Waco
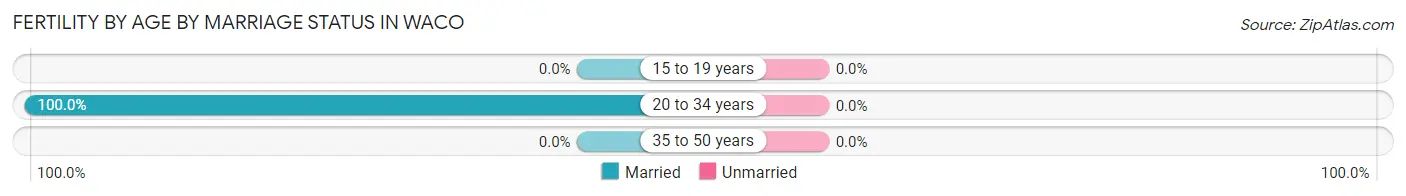
| Age Bracket | Married | Unmarried |
| 15 to 19 years | 0 (0.0%) | 0 (0.0%) |
| 20 to 34 years | 6 (100.0%) | 0 (0.0%) |
| 35 to 50 years | 0 (0.0%) | 0 (0.0%) |
| Total | 6 (100.0%) | 0 (0.0%) |
Fertility by Education in Waco
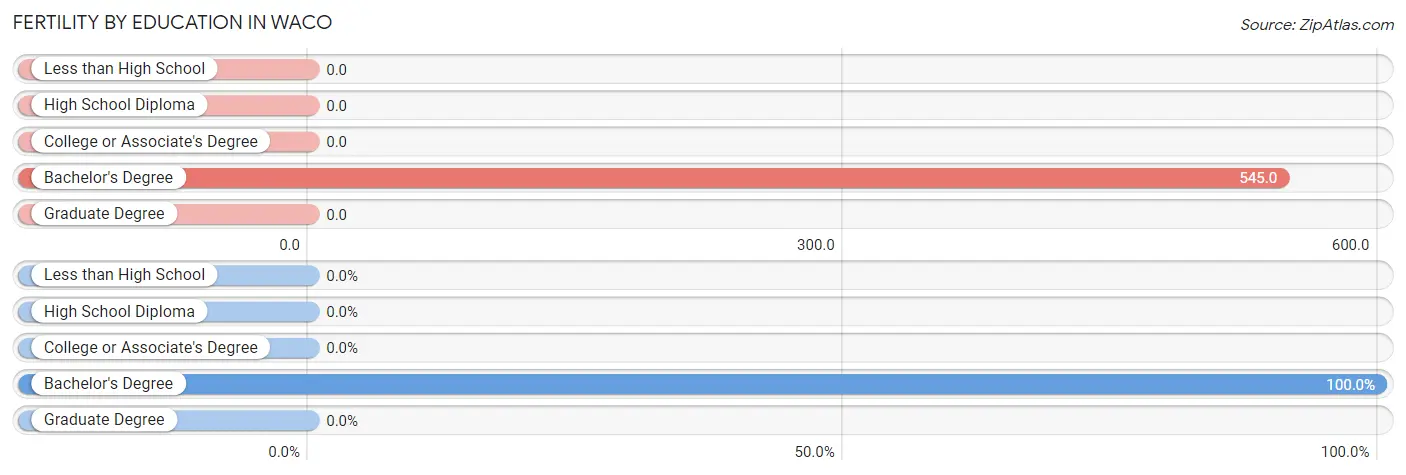
| Educational Attainment | Women with Births | Births / 1,000 Women |
| Less than High School | 0 (0.0%) | 0.0 |
| High School Diploma | 0 (0.0%) | 0.0 |
| College or Associate's Degree | 0 (0.0%) | 0.0 |
| Bachelor's Degree | 6 (100.0%) | 545.0 |
| Graduate Degree | 0 (0.0%) | 0.0 |
| Total | 6 (100.0%) | 120.0 |
Fertility by Education by Marriage Status in Waco
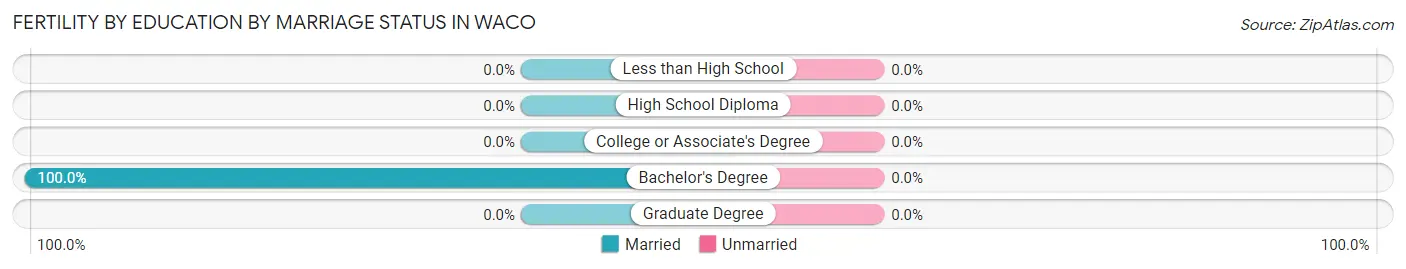
| Educational Attainment | Married | Unmarried |
| Less than High School | 0 (0.0%) | 0 (0.0%) |
| High School Diploma | 0 (0.0%) | 0 (0.0%) |
| College or Associate's Degree | 0 (0.0%) | 0 (0.0%) |
| Bachelor's Degree | 6 (100.0%) | 0 (0.0%) |
| Graduate Degree | 0 (0.0%) | 0 (0.0%) |
| Total | 6 (100.0%) | 0 (0.0%) |
Employment Characteristics in Waco
Employment by Class of Employer in Waco
Among the 102 employed individuals in Waco, private company employees (60 | 58.8%), local government employees (16 | 15.7%), and self-employed (not incorporated) (13 | 12.8%) make up the most common classes of employment.
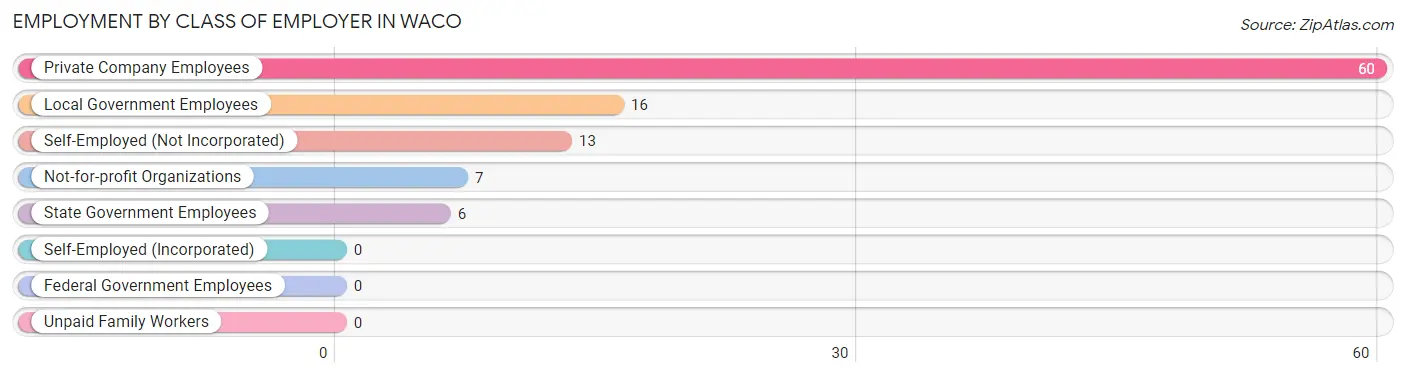
| Employer Class | # Employees | % Employees |
| Private Company Employees | 60 | 58.8% |
| Self-Employed (Incorporated) | 0 | 0.0% |
| Self-Employed (Not Incorporated) | 13 | 12.8% |
| Not-for-profit Organizations | 7 | 6.9% |
| Local Government Employees | 16 | 15.7% |
| State Government Employees | 6 | 5.9% |
| Federal Government Employees | 0 | 0.0% |
| Unpaid Family Workers | 0 | 0.0% |
| Total | 102 | 100.0% |
Employment Status by Age in Waco
According to the labor force statistics for Waco, out of the total population over 16 years of age (238), 43.7% or 104 individuals are in the labor force, with 1.9% or 2 of them unemployed. The age group with the highest labor force participation rate is 20 to 24 years, with 100.0% or 3 individuals in the labor force. Within the labor force, the 30 to 34 years age range has the highest percentage of unemployed individuals, with 10.5% or 2 of them being unemployed.
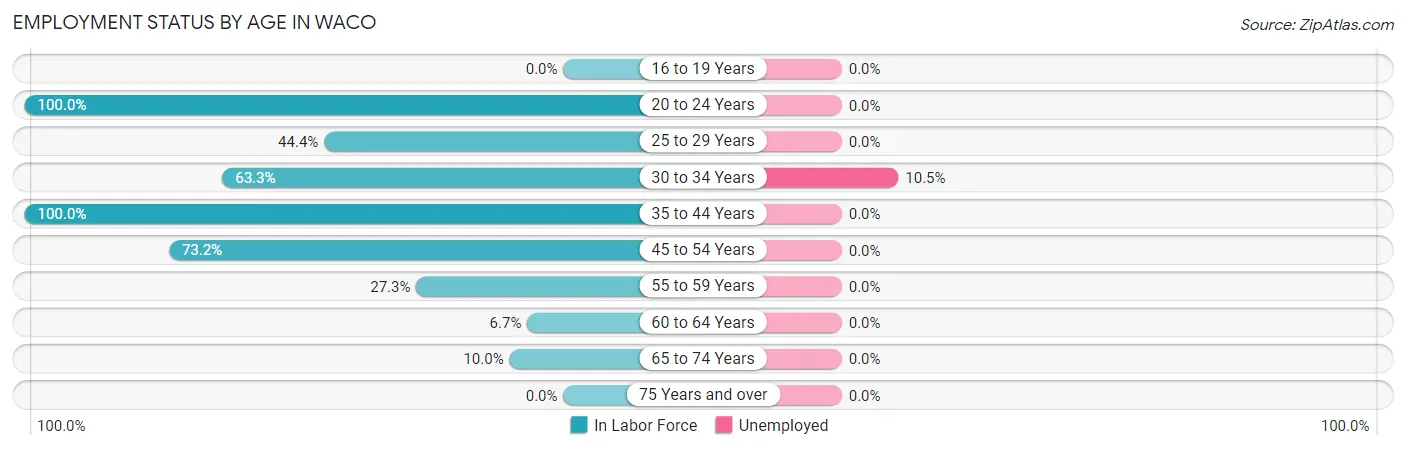
| Age Bracket | In Labor Force | Unemployed |
| 16 to 19 Years | 0 (0.0%) | 0 (0.0%) |
| 20 to 24 Years | 3 (100.0%) | 0 (0.0%) |
| 25 to 29 Years | 4 (44.4%) | 0 (0.0%) |
| 30 to 34 Years | 19 (63.3%) | 2 (10.5%) |
| 35 to 44 Years | 39 (100.0%) | 0 (0.0%) |
| 45 to 54 Years | 30 (73.2%) | 0 (0.0%) |
| 55 to 59 Years | 3 (27.3%) | 0 (0.0%) |
| 60 to 64 Years | 1 (6.7%) | 0 (0.0%) |
| 65 to 74 Years | 5 (10.0%) | 0 (0.0%) |
| 75 Years and over | 0 (0.0%) | 0 (0.0%) |
| Total | 104 (43.7%) | 2 (1.9%) |
Employment Status by Educational Attainment in Waco
According to labor force statistics for Waco, 66.2% of individuals (96) out of the total population between 25 and 64 years of age (145) are in the labor force, with 2.1% or 2 of them being unemployed. The group with the highest labor force participation rate are those with the educational attainment of bachelor's degree or higher, with 85.3% or 29 individuals in the labor force. Within the labor force, individuals with college / associate degree education have the highest percentage of unemployment, with 6.5% or 2 of them being unemployed.
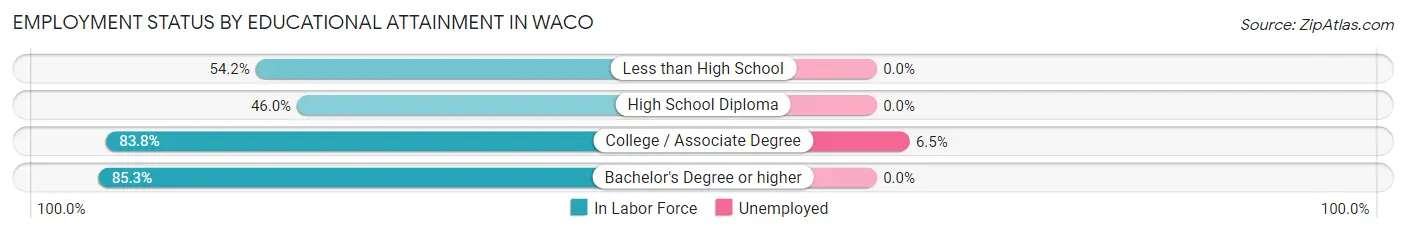
| Educational Attainment | In Labor Force | Unemployed |
| Less than High School | 13 (54.2%) | 0 (0.0%) |
| High School Diploma | 23 (46.0%) | 0 (0.0%) |
| College / Associate Degree | 31 (83.8%) | 2 (6.5%) |
| Bachelor's Degree or higher | 29 (85.3%) | 0 (0.0%) |
| Total | 96 (66.2%) | 3 (2.1%) |
Employment Occupations by Sex in Waco
Management, Business, Science and Arts Occupations
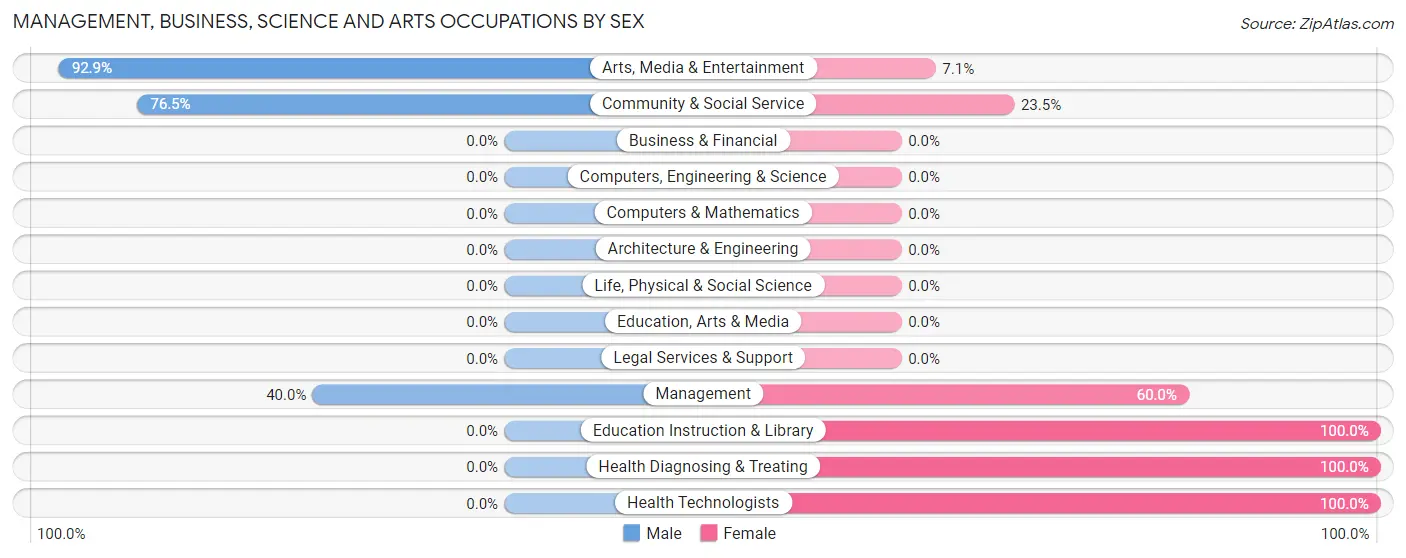
The most common Management, Business, Science and Arts occupations in Waco are Management (25 | 24.5%), Community & Social Service (17 | 16.7%), Arts, Media & Entertainment (14 | 13.7%), Health Diagnosing & Treating (8 | 7.8%), and Health Technologists (8 | 7.8%).
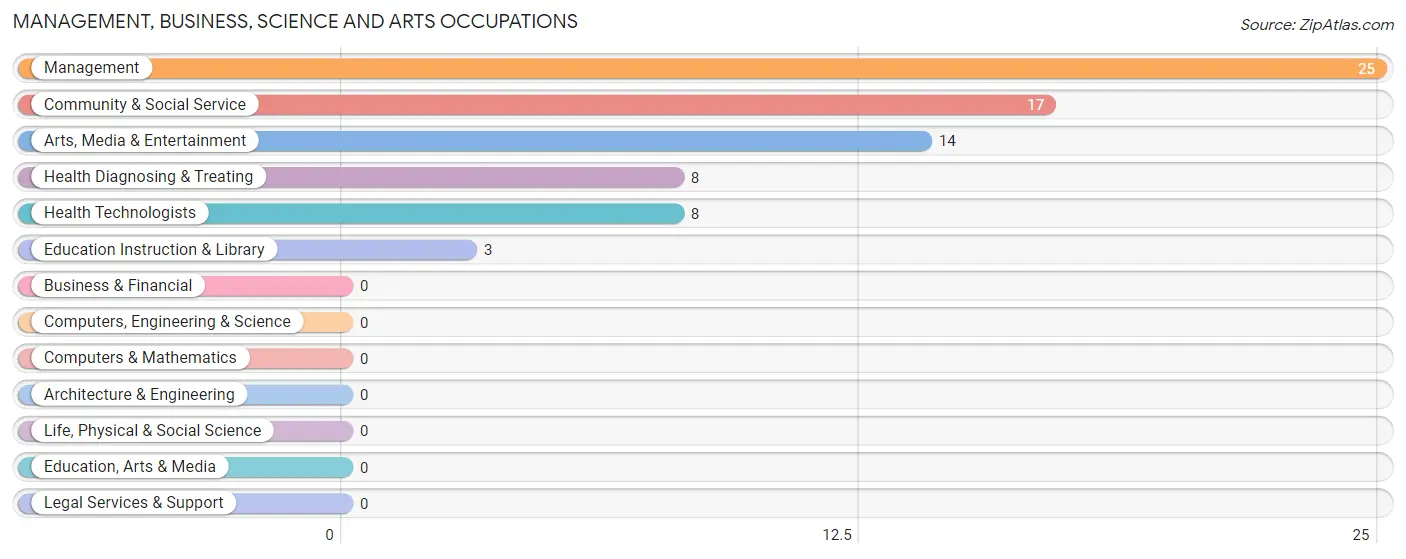
Management, Business, Science and Arts Occupations by Sex
Within the Management, Business, Science and Arts occupations in Waco, the most male-oriented occupations are Arts, Media & Entertainment (92.9%), Community & Social Service (76.5%), and Management (40.0%), while the most female-oriented occupations are Education Instruction & Library (100.0%), Health Diagnosing & Treating (100.0%), and Health Technologists (100.0%).
| Occupation | Male | Female |
| Management | 10 (40.0%) | 15 (60.0%) |
| Business & Financial | 0 (0.0%) | 0 (0.0%) |
| Computers, Engineering & Science | 0 (0.0%) | 0 (0.0%) |
| Computers & Mathematics | 0 (0.0%) | 0 (0.0%) |
| Architecture & Engineering | 0 (0.0%) | 0 (0.0%) |
| Life, Physical & Social Science | 0 (0.0%) | 0 (0.0%) |
| Community & Social Service | 13 (76.5%) | 4 (23.5%) |
| Education, Arts & Media | 0 (0.0%) | 0 (0.0%) |
| Legal Services & Support | 0 (0.0%) | 0 (0.0%) |
| Education Instruction & Library | 0 (0.0%) | 3 (100.0%) |
| Arts, Media & Entertainment | 13 (92.9%) | 1 (7.1%) |
| Health Diagnosing & Treating | 0 (0.0%) | 8 (100.0%) |
| Health Technologists | 0 (0.0%) | 8 (100.0%) |
| Total (Category) | 23 (46.0%) | 27 (54.0%) |
| Total (Overall) | 57 (55.9%) | 45 (44.1%) |
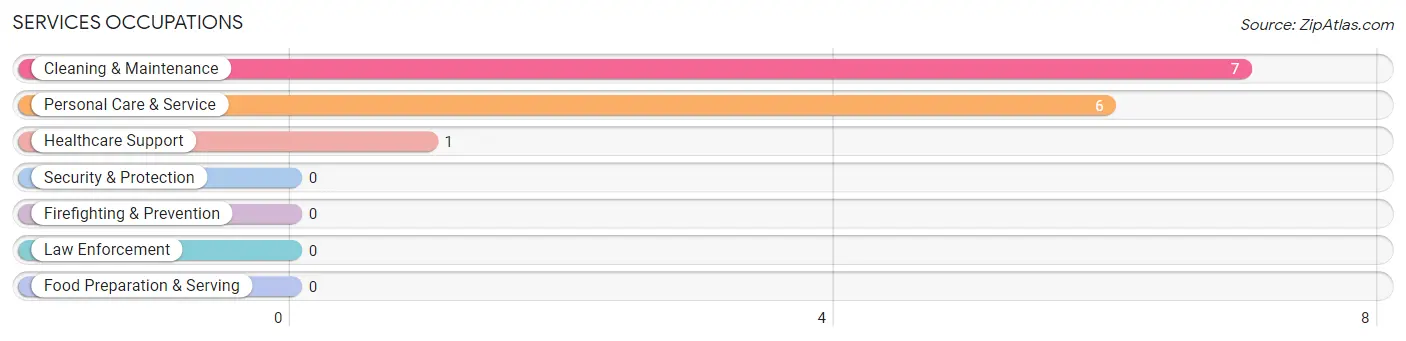
Services Occupations
The most common Services occupations in Waco are Cleaning & Maintenance (7 | 6.9%), Personal Care & Service (6 | 5.9%), and Healthcare Support (1 | 1.0%).
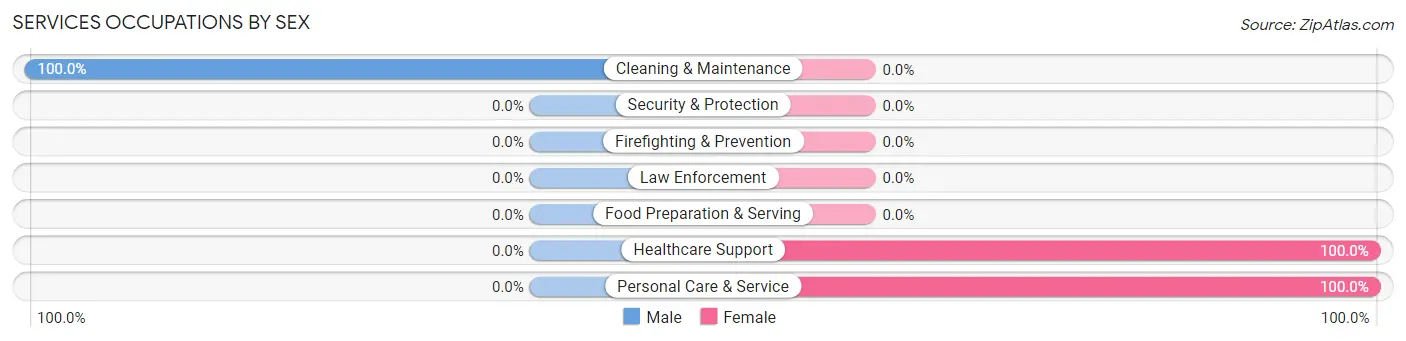
Services Occupations by Sex
| Occupation | Male | Female |
| Healthcare Support | 0 (0.0%) | 1 (100.0%) |
| Security & Protection | 0 (0.0%) | 0 (0.0%) |
| Firefighting & Prevention | 0 (0.0%) | 0 (0.0%) |
| Law Enforcement | 0 (0.0%) | 0 (0.0%) |
| Food Preparation & Serving | 0 (0.0%) | 0 (0.0%) |
| Cleaning & Maintenance | 7 (100.0%) | 0 (0.0%) |
| Personal Care & Service | 0 (0.0%) | 6 (100.0%) |
| Total (Category) | 7 (50.0%) | 7 (50.0%) |
| Total (Overall) | 57 (55.9%) | 45 (44.1%) |
Sales and Office Occupations
The most common Sales and Office occupations in Waco are Sales & Related (10 | 9.8%), and Office & Administration (4 | 3.9%).

Sales and Office Occupations by Sex

| Occupation | Male | Female |
| Sales & Related | 7 (70.0%) | 3 (30.0%) |
| Office & Administration | 2 (50.0%) | 2 (50.0%) |
| Total (Category) | 9 (64.3%) | 5 (35.7%) |
| Total (Overall) | 57 (55.9%) | 45 (44.1%) |
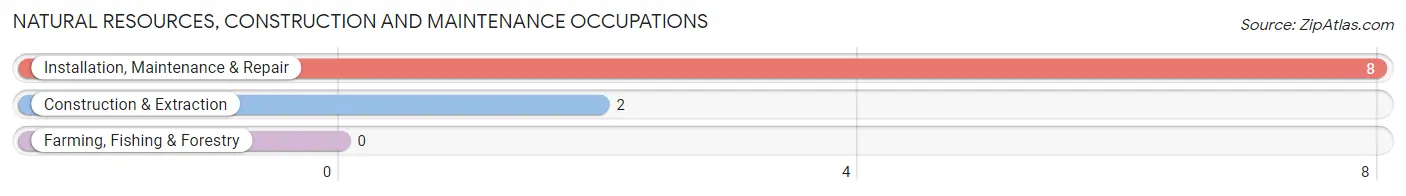
Natural Resources, Construction and Maintenance Occupations
The most common Natural Resources, Construction and Maintenance occupations in Waco are Installation, Maintenance & Repair (8 | 7.8%), and Construction & Extraction (2 | 2.0%).
Natural Resources, Construction and Maintenance Occupations by Sex

| Occupation | Male | Female |
| Farming, Fishing & Forestry | 0 (0.0%) | 0 (0.0%) |
| Construction & Extraction | 2 (100.0%) | 0 (0.0%) |
| Installation, Maintenance & Repair | 8 (100.0%) | 0 (0.0%) |
| Total (Category) | 10 (100.0%) | 0 (0.0%) |
| Total (Overall) | 57 (55.9%) | 45 (44.1%) |
Production, Transportation and Moving Occupations
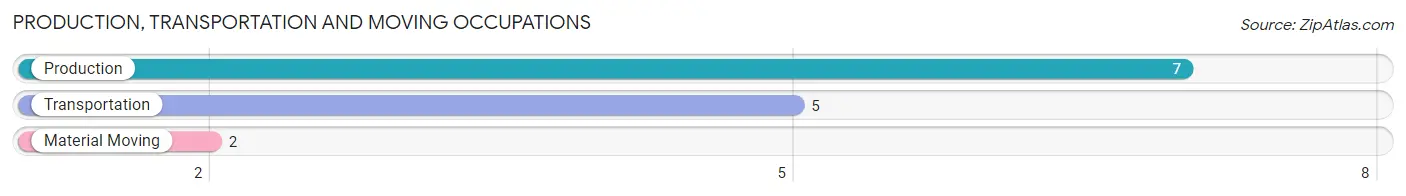
The most common Production, Transportation and Moving occupations in Waco are Production (7 | 6.9%), Transportation (5 | 4.9%), and Material Moving (2 | 2.0%).
Production, Transportation and Moving Occupations by Sex
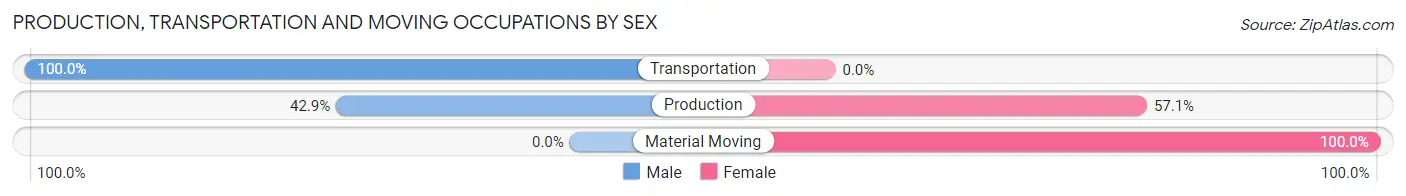
| Occupation | Male | Female |
| Production | 3 (42.9%) | 4 (57.1%) |
| Transportation | 5 (100.0%) | 0 (0.0%) |
| Material Moving | 0 (0.0%) | 2 (100.0%) |
| Total (Category) | 8 (57.1%) | 6 (42.9%) |
| Total (Overall) | 57 (55.9%) | 45 (44.1%) |
Employment Industries by Sex in Waco
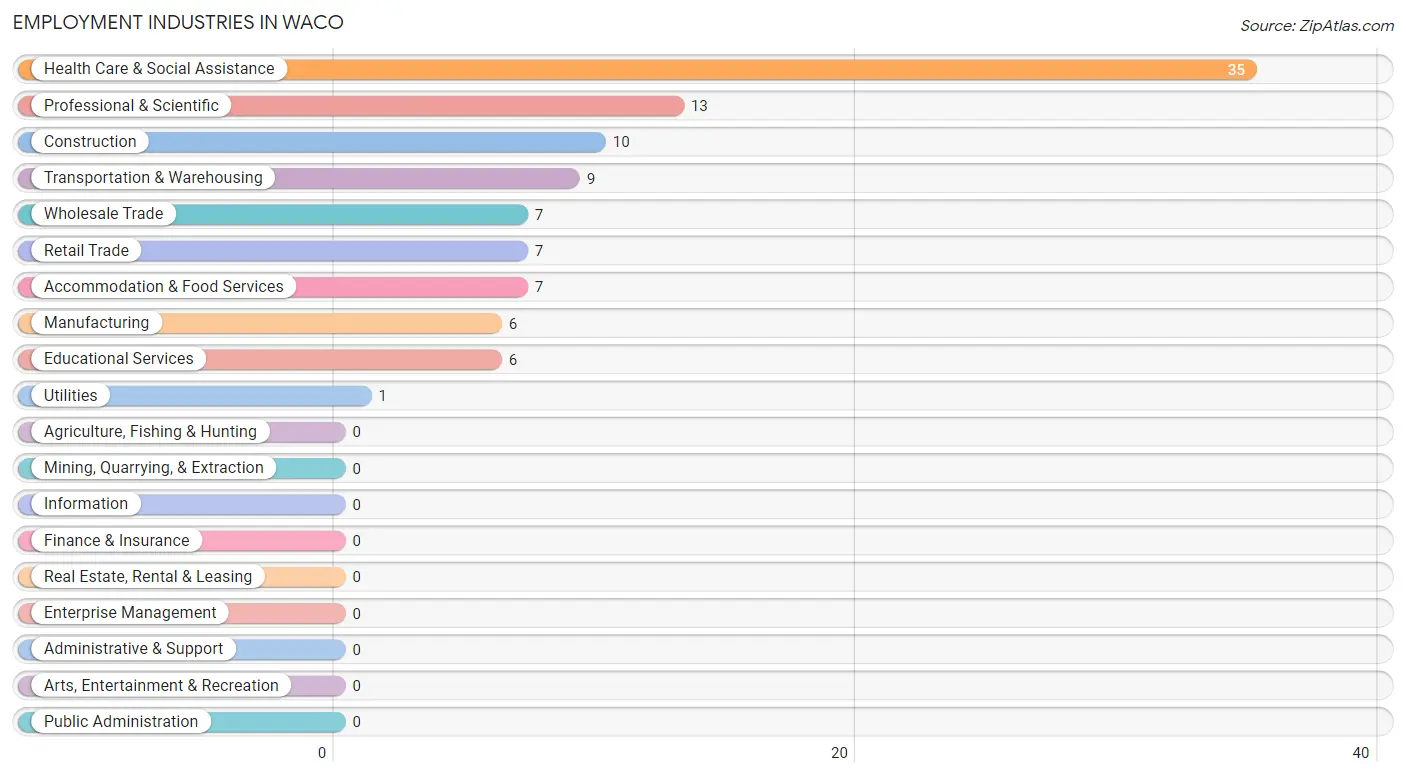
Employment Industries in Waco
The major employment industries in Waco include Health Care & Social Assistance (35 | 34.3%), Professional & Scientific (13 | 12.8%), Construction (10 | 9.8%), Transportation & Warehousing (9 | 8.8%), and Wholesale Trade (7 | 6.9%).
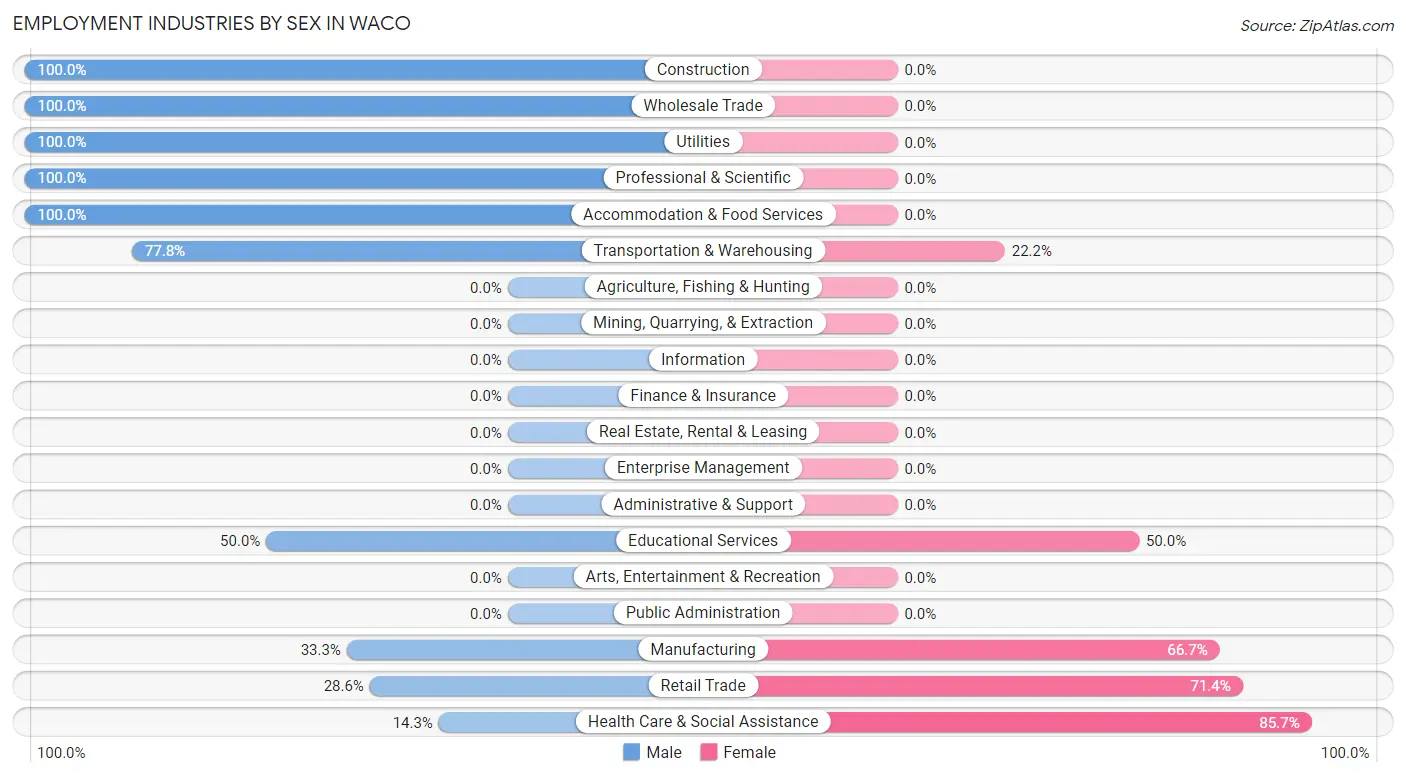
Employment Industries by Sex in Waco
The Waco industries that see more men than women are Construction (100.0%), Wholesale Trade (100.0%), and Utilities (100.0%), whereas the industries that tend to have a higher number of women are Health Care & Social Assistance (85.7%), Retail Trade (71.4%), and Manufacturing (66.7%).
| Industry | Male | Female |
| Agriculture, Fishing & Hunting | 0 (0.0%) | 0 (0.0%) |
| Mining, Quarrying, & Extraction | 0 (0.0%) | 0 (0.0%) |
| Construction | 10 (100.0%) | 0 (0.0%) |
| Manufacturing | 2 (33.3%) | 4 (66.7%) |
| Wholesale Trade | 7 (100.0%) | 0 (0.0%) |
| Retail Trade | 2 (28.6%) | 5 (71.4%) |
| Transportation & Warehousing | 7 (77.8%) | 2 (22.2%) |
| Utilities | 1 (100.0%) | 0 (0.0%) |
| Information | 0 (0.0%) | 0 (0.0%) |
| Finance & Insurance | 0 (0.0%) | 0 (0.0%) |
| Real Estate, Rental & Leasing | 0 (0.0%) | 0 (0.0%) |
| Professional & Scientific | 13 (100.0%) | 0 (0.0%) |
| Enterprise Management | 0 (0.0%) | 0 (0.0%) |
| Administrative & Support | 0 (0.0%) | 0 (0.0%) |
| Educational Services | 3 (50.0%) | 3 (50.0%) |
| Health Care & Social Assistance | 5 (14.3%) | 30 (85.7%) |
| Arts, Entertainment & Recreation | 0 (0.0%) | 0 (0.0%) |
| Accommodation & Food Services | 7 (100.0%) | 0 (0.0%) |
| Public Administration | 0 (0.0%) | 0 (0.0%) |
| Total | 57 (55.9%) | 45 (44.1%) |
Education in Waco
School Enrollment in Waco
The most common levels of schooling among the 28 students in Waco are middle school (20 | 71.4%), and elementary school (8 | 28.6%).
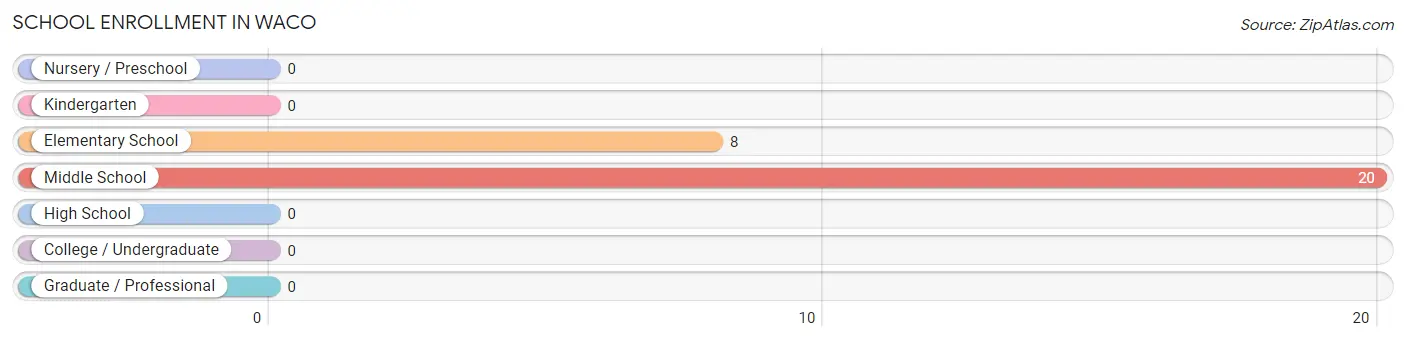
| School Level | # Students | % Students |
| Nursery / Preschool | 0 | 0.0% |
| Kindergarten | 0 | 0.0% |
| Elementary School | 8 | 28.6% |
| Middle School | 20 | 71.4% |
| High School | 0 | 0.0% |
| College / Undergraduate | 0 | 0.0% |
| Graduate / Professional | 0 | 0.0% |
| Total | 28 | 100.0% |
School Enrollment by Age by Funding Source in Waco
Out of a total of 28 students who are enrolled in schools in Waco, 12 (42.9%) attend a private institution, while the remaining 16 (57.1%) are enrolled in public schools. The age group of 10 to 14 year olds has the highest likelihood of being enrolled in private schools, with 12 (60.0% in the age bracket) enrolled. Conversely, the age group of 5 to 9 year old has the lowest likelihood of being enrolled in a private school, with 8 (100.0% in the age bracket) attending a public institution.
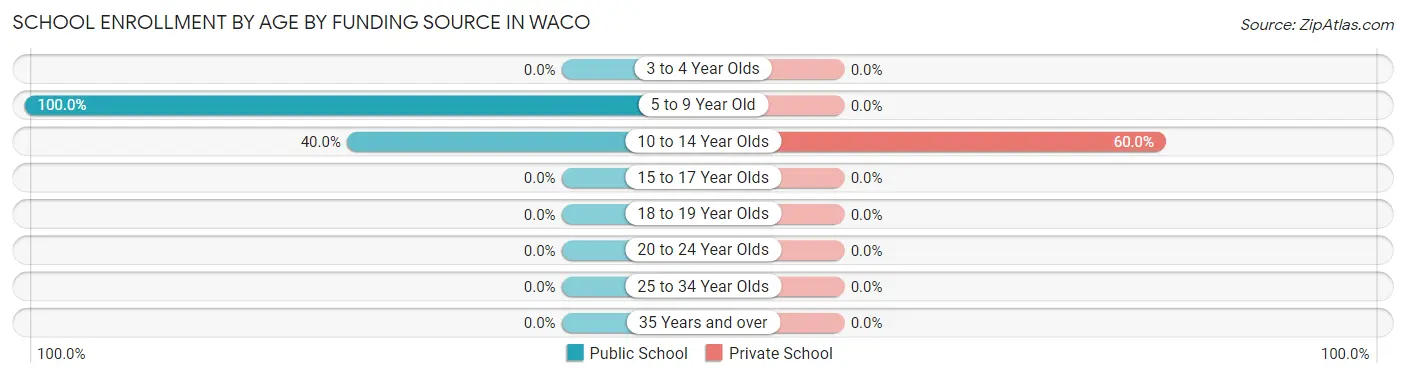
| Age Bracket | Public School | Private School |
| 3 to 4 Year Olds | 0 (0.0%) | 0 (0.0%) |
| 5 to 9 Year Old | 8 (100.0%) | 0 (0.0%) |
| 10 to 14 Year Olds | 8 (40.0%) | 12 (60.0%) |
| 15 to 17 Year Olds | 0 (0.0%) | 0 (0.0%) |
| 18 to 19 Year Olds | 0 (0.0%) | 0 (0.0%) |
| 20 to 24 Year Olds | 0 (0.0%) | 0 (0.0%) |
| 25 to 34 Year Olds | 0 (0.0%) | 0 (0.0%) |
| 35 Years and over | 0 (0.0%) | 0 (0.0%) |
| Total | 16 (57.1%) | 12 (42.9%) |
Educational Attainment by Field of Study in Waco
Psychology (18 | 43.9%), science & technology (7 | 17.1%), arts & humanities (6 | 14.6%), multidisciplinary studies (5 | 12.2%), and education (5 | 12.2%) are the most common fields of study among 41 individuals in Waco who have obtained a bachelor's degree or higher.
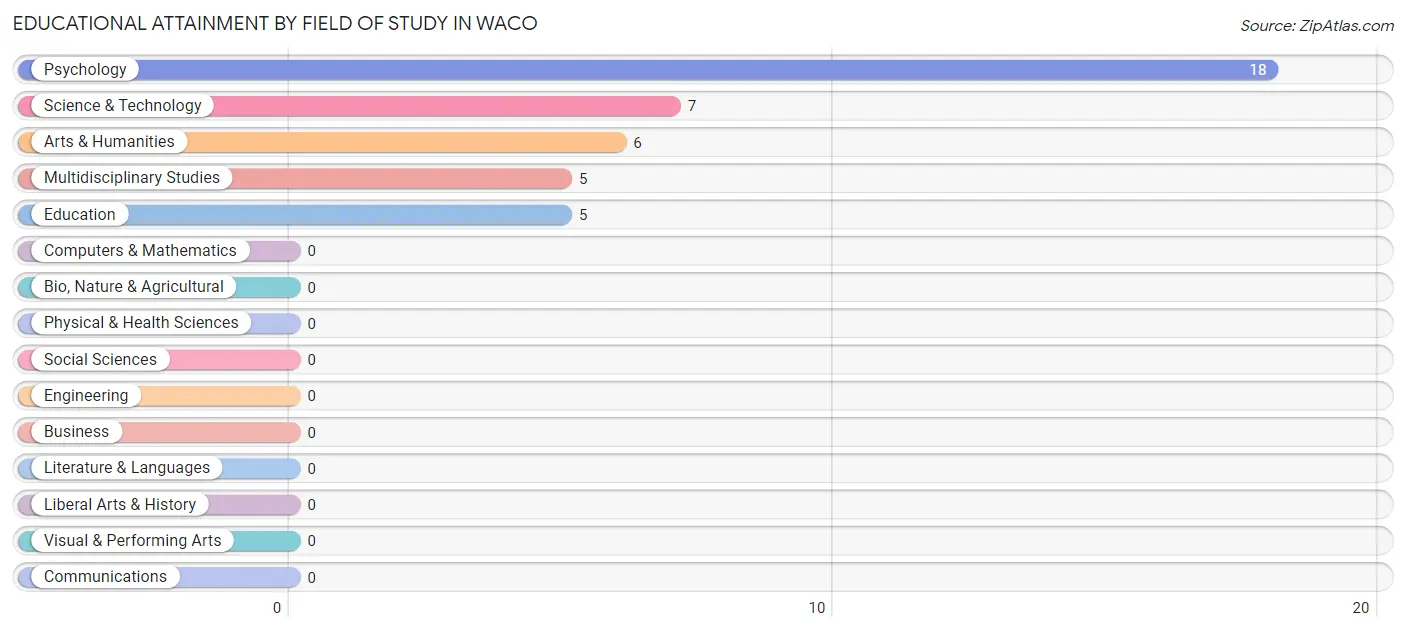
| Field of Study | # Graduates | % Graduates |
| Computers & Mathematics | 0 | 0.0% |
| Bio, Nature & Agricultural | 0 | 0.0% |
| Physical & Health Sciences | 0 | 0.0% |
| Psychology | 18 | 43.9% |
| Social Sciences | 0 | 0.0% |
| Engineering | 0 | 0.0% |
| Multidisciplinary Studies | 5 | 12.2% |
| Science & Technology | 7 | 17.1% |
| Business | 0 | 0.0% |
| Education | 5 | 12.2% |
| Literature & Languages | 0 | 0.0% |
| Liberal Arts & History | 0 | 0.0% |
| Visual & Performing Arts | 0 | 0.0% |
| Communications | 0 | 0.0% |
| Arts & Humanities | 6 | 14.6% |
| Total | 41 | 100.0% |
Transportation & Commute in Waco
Vehicle Availability by Sex in Waco
The most prevalent vehicle ownership categories in Waco are males with 2 vehicles (25, accounting for 43.9%) and females with 2 vehicles (27, making up 55.6%).
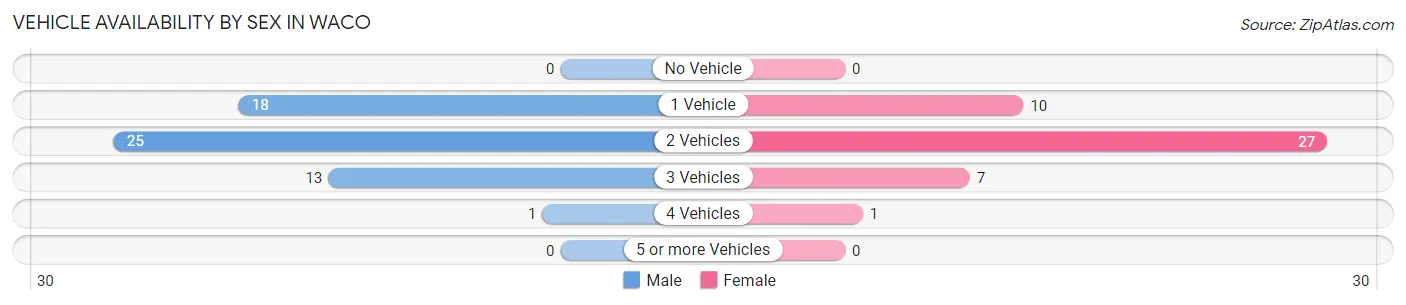
| Vehicles Available | Male | Female |
| No Vehicle | 0 (0.0%) | 0 (0.0%) |
| 1 Vehicle | 18 (31.6%) | 10 (22.2%) |
| 2 Vehicles | 25 (43.9%) | 27 (60.0%) |
| 3 Vehicles | 13 (22.8%) | 7 (15.6%) |
| 4 Vehicles | 1 (1.8%) | 1 (2.2%) |
| 5 or more Vehicles | 0 (0.0%) | 0 (0.0%) |
| Total | 57 (100.0%) | 45 (100.0%) |
Commute Time in Waco
The most frequently occuring commute durations in Waco are 20 to 24 minutes (29 commuters, 39.2%), 10 to 14 minutes (22 commuters, 29.7%), and 30 to 34 minutes (8 commuters, 10.8%).
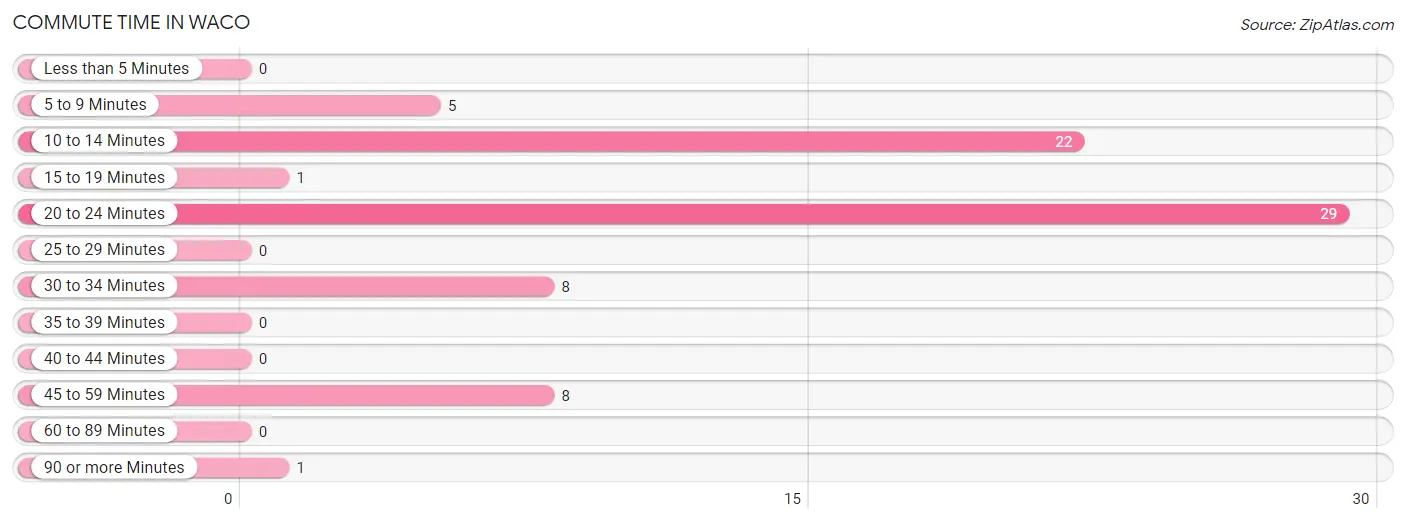
| Commute Time | # Commuters | % Commuters |
| Less than 5 Minutes | 0 | 0.0% |
| 5 to 9 Minutes | 5 | 6.8% |
| 10 to 14 Minutes | 22 | 29.7% |
| 15 to 19 Minutes | 1 | 1.3% |
| 20 to 24 Minutes | 29 | 39.2% |
| 25 to 29 Minutes | 0 | 0.0% |
| 30 to 34 Minutes | 8 | 10.8% |
| 35 to 39 Minutes | 0 | 0.0% |
| 40 to 44 Minutes | 0 | 0.0% |
| 45 to 59 Minutes | 8 | 10.8% |
| 60 to 89 Minutes | 0 | 0.0% |
| 90 or more Minutes | 1 | 1.3% |
Commute Time by Sex in Waco
The most common commute times in Waco are 20 to 24 minutes (20 commuters, 45.5%) for males and 10 to 14 minutes (11 commuters, 36.7%) for females.
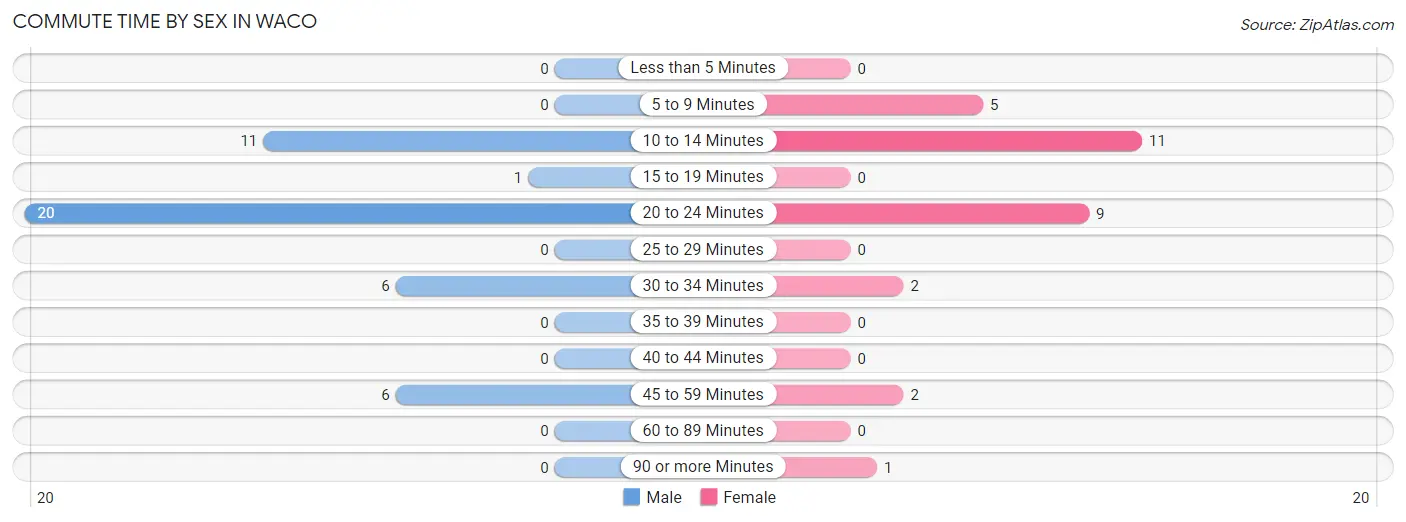
| Commute Time | Male | Female |
| Less than 5 Minutes | 0 (0.0%) | 0 (0.0%) |
| 5 to 9 Minutes | 0 (0.0%) | 5 (16.7%) |
| 10 to 14 Minutes | 11 (25.0%) | 11 (36.7%) |
| 15 to 19 Minutes | 1 (2.3%) | 0 (0.0%) |
| 20 to 24 Minutes | 20 (45.5%) | 9 (30.0%) |
| 25 to 29 Minutes | 0 (0.0%) | 0 (0.0%) |
| 30 to 34 Minutes | 6 (13.6%) | 2 (6.7%) |
| 35 to 39 Minutes | 0 (0.0%) | 0 (0.0%) |
| 40 to 44 Minutes | 0 (0.0%) | 0 (0.0%) |
| 45 to 59 Minutes | 6 (13.6%) | 2 (6.7%) |
| 60 to 89 Minutes | 0 (0.0%) | 0 (0.0%) |
| 90 or more Minutes | 0 (0.0%) | 1 (3.3%) |
Time of Departure to Work by Sex in Waco
The most frequent times of departure to work in Waco are 6:30 AM to 6:59 AM (13, 29.5%) for males and 7:30 AM to 7:59 AM (18, 60.0%) for females.
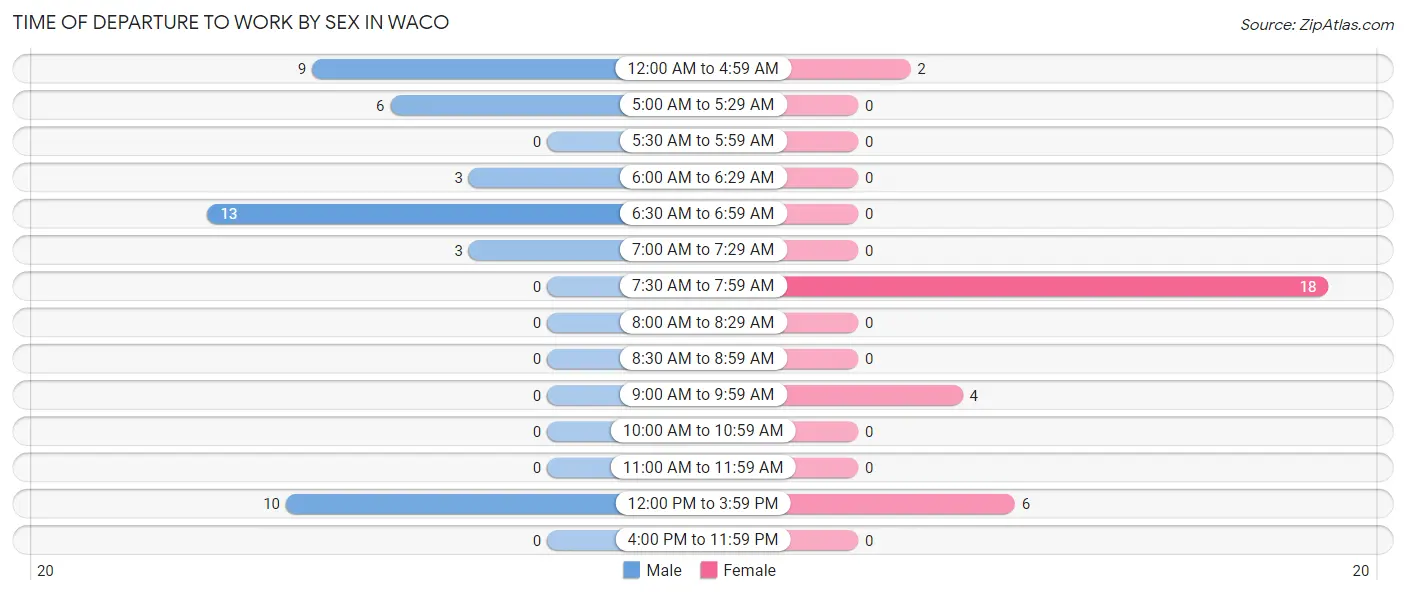
| Time of Departure | Male | Female |
| 12:00 AM to 4:59 AM | 9 (20.4%) | 2 (6.7%) |
| 5:00 AM to 5:29 AM | 6 (13.6%) | 0 (0.0%) |
| 5:30 AM to 5:59 AM | 0 (0.0%) | 0 (0.0%) |
| 6:00 AM to 6:29 AM | 3 (6.8%) | 0 (0.0%) |
| 6:30 AM to 6:59 AM | 13 (29.5%) | 0 (0.0%) |
| 7:00 AM to 7:29 AM | 3 (6.8%) | 0 (0.0%) |
| 7:30 AM to 7:59 AM | 0 (0.0%) | 18 (60.0%) |
| 8:00 AM to 8:29 AM | 0 (0.0%) | 0 (0.0%) |
| 8:30 AM to 8:59 AM | 0 (0.0%) | 0 (0.0%) |
| 9:00 AM to 9:59 AM | 0 (0.0%) | 4 (13.3%) |
| 10:00 AM to 10:59 AM | 0 (0.0%) | 0 (0.0%) |
| 11:00 AM to 11:59 AM | 0 (0.0%) | 0 (0.0%) |
| 12:00 PM to 3:59 PM | 10 (22.7%) | 6 (20.0%) |
| 4:00 PM to 11:59 PM | 0 (0.0%) | 0 (0.0%) |
| Total | 44 (100.0%) | 30 (100.0%) |
Housing Occupancy in Waco
Occupancy by Ownership in Waco
Of the total 105 dwellings in Waco, owner-occupied units account for 86 (81.9%), while renter-occupied units make up 19 (18.1%).
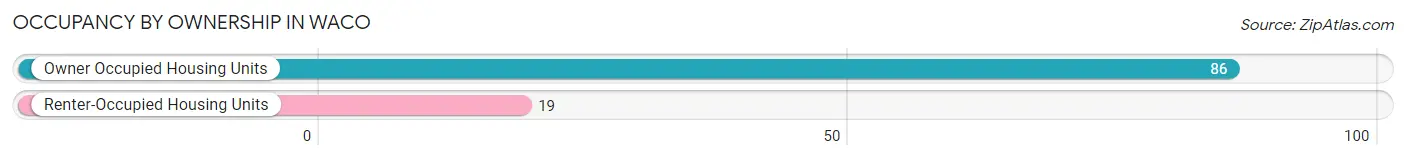
| Occupancy | # Housing Units | % Housing Units |
| Owner Occupied Housing Units | 86 | 81.9% |
| Renter-Occupied Housing Units | 19 | 18.1% |
| Total Occupied Housing Units | 105 | 100.0% |
Occupancy by Household Size in Waco
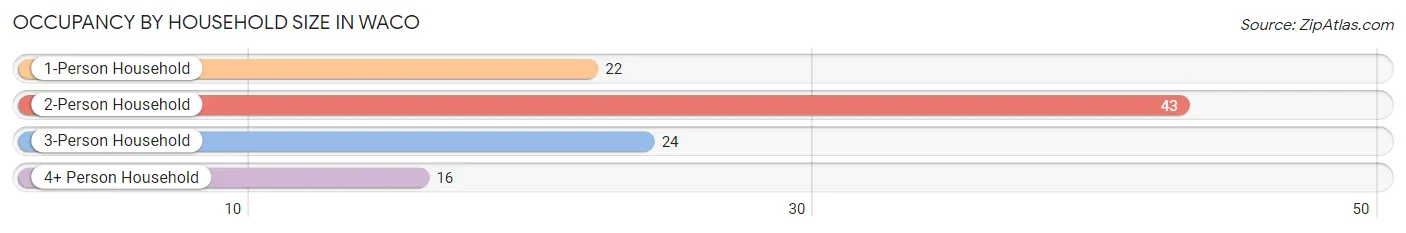
| Household Size | # Housing Units | % Housing Units |
| 1-Person Household | 22 | 20.9% |
| 2-Person Household | 43 | 40.9% |
| 3-Person Household | 24 | 22.9% |
| 4+ Person Household | 16 | 15.2% |
| Total Housing Units | 105 | 100.0% |
Occupancy by Ownership by Household Size in Waco
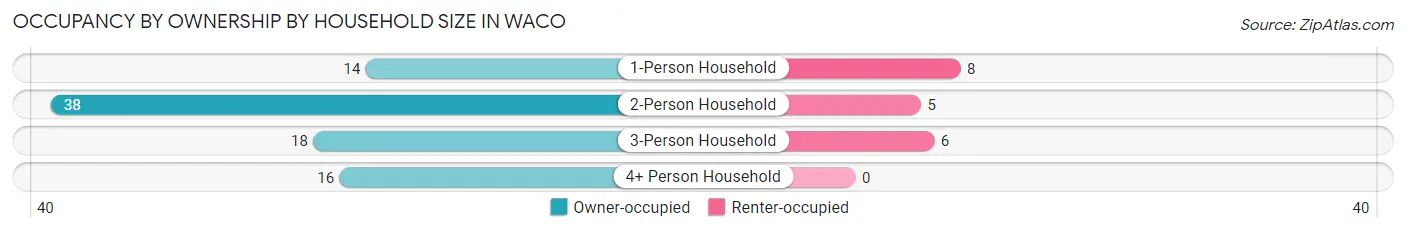
| Household Size | Owner-occupied | Renter-occupied |
| 1-Person Household | 14 (63.6%) | 8 (36.4%) |
| 2-Person Household | 38 (88.4%) | 5 (11.6%) |
| 3-Person Household | 18 (75.0%) | 6 (25.0%) |
| 4+ Person Household | 16 (100.0%) | 0 (0.0%) |
| Total Housing Units | 86 (81.9%) | 19 (18.1%) |
Occupancy by Educational Attainment in Waco
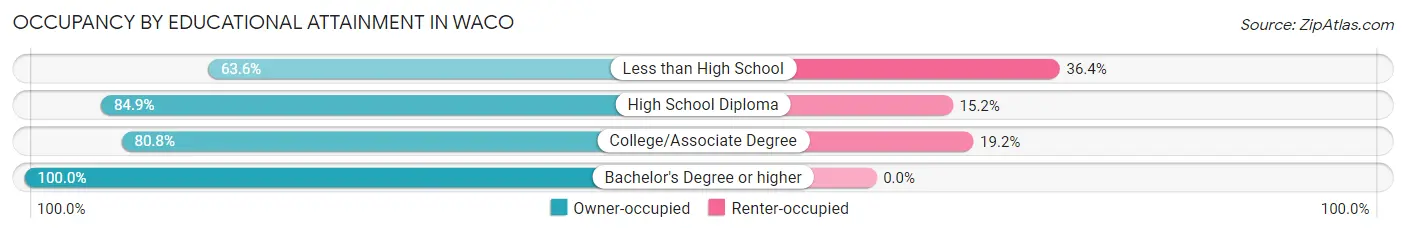
| Household Size | Owner-occupied | Renter-occupied |
| Less than High School | 7 (63.6%) | 4 (36.4%) |
| High School Diploma | 28 (84.9%) | 5 (15.1%) |
| College/Associate Degree | 42 (80.8%) | 10 (19.2%) |
| Bachelor's Degree or higher | 9 (100.0%) | 0 (0.0%) |
Occupancy by Age of Householder in Waco
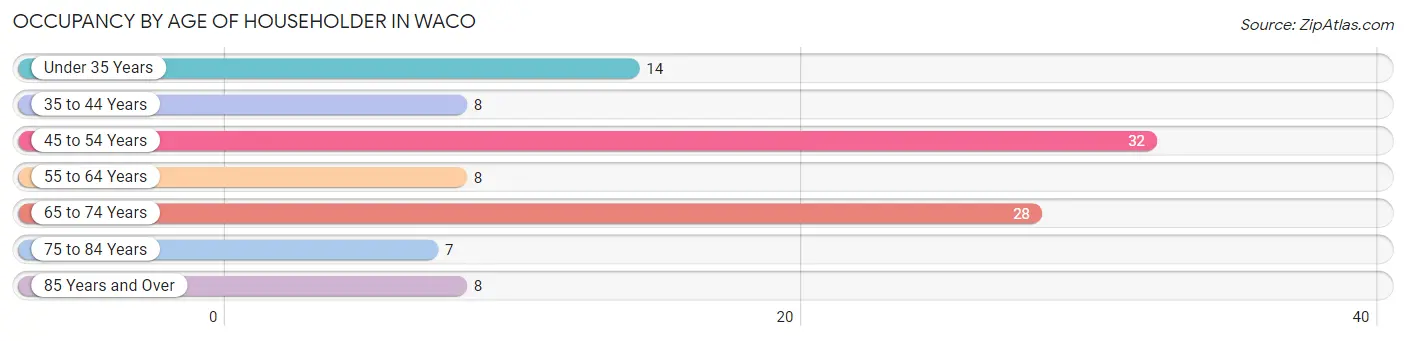
| Age Bracket | # Households | % Households |
| Under 35 Years | 14 | 13.3% |
| 35 to 44 Years | 8 | 7.6% |
| 45 to 54 Years | 32 | 30.5% |
| 55 to 64 Years | 8 | 7.6% |
| 65 to 74 Years | 28 | 26.7% |
| 75 to 84 Years | 7 | 6.7% |
| 85 Years and Over | 8 | 7.6% |
| Total | 105 | 100.0% |
Housing Finances in Waco
Median Income by Occupancy in Waco
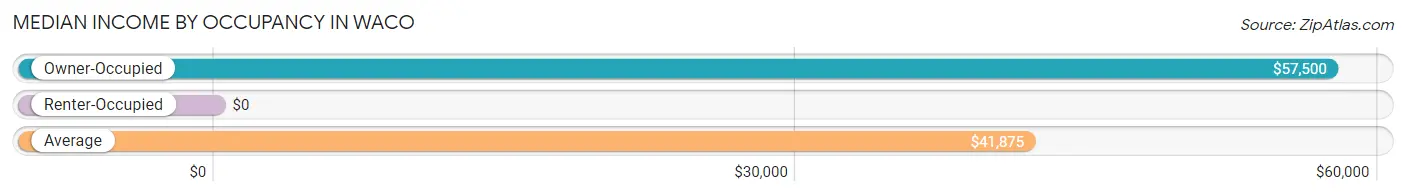
| Occupancy Type | # Households | Median Income |
| Owner-Occupied | 86 (81.9%) | $57,500 |
| Renter-Occupied | 19 (18.1%) | $0 |
| Average | 105 (100.0%) | $41,875 |
Occupancy by Householder Income Bracket in Waco
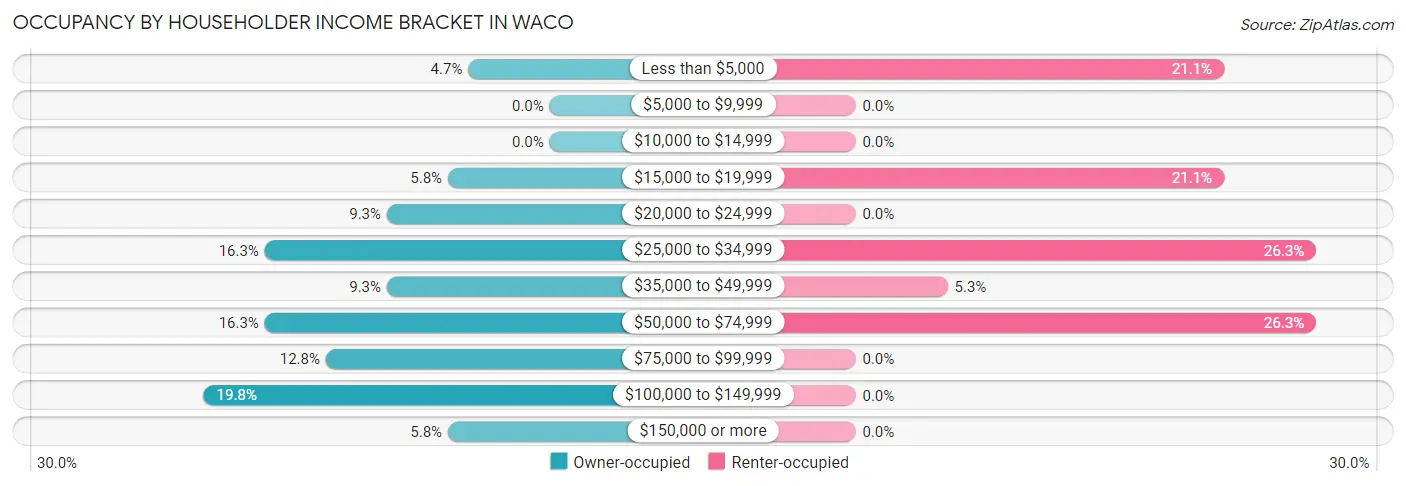
| Income Bracket | Owner-occupied | Renter-occupied |
| Less than $5,000 | 4 (4.6%) | 4 (21.0%) |
| $5,000 to $9,999 | 0 (0.0%) | 0 (0.0%) |
| $10,000 to $14,999 | 0 (0.0%) | 0 (0.0%) |
| $15,000 to $19,999 | 5 (5.8%) | 4 (21.0%) |
| $20,000 to $24,999 | 8 (9.3%) | 0 (0.0%) |
| $25,000 to $34,999 | 14 (16.3%) | 5 (26.3%) |
| $35,000 to $49,999 | 8 (9.3%) | 1 (5.3%) |
| $50,000 to $74,999 | 14 (16.3%) | 5 (26.3%) |
| $75,000 to $99,999 | 11 (12.8%) | 0 (0.0%) |
| $100,000 to $149,999 | 17 (19.8%) | 0 (0.0%) |
| $150,000 or more | 5 (5.8%) | 0 (0.0%) |
| Total | 86 (100.0%) | 19 (100.0%) |
Monthly Housing Cost Tiers in Waco
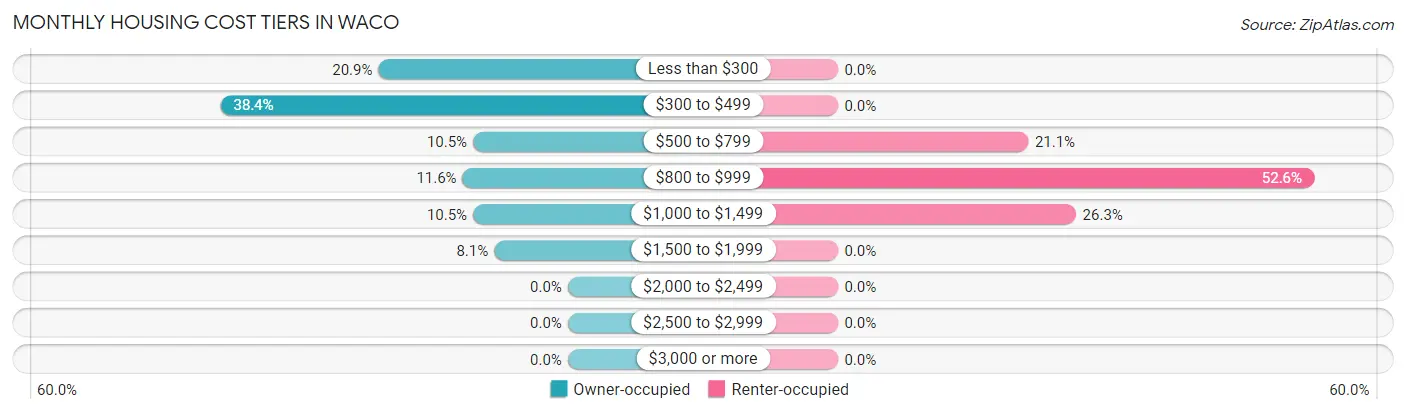
| Monthly Cost | Owner-occupied | Renter-occupied |
| Less than $300 | 18 (20.9%) | 0 (0.0%) |
| $300 to $499 | 33 (38.4%) | 0 (0.0%) |
| $500 to $799 | 9 (10.5%) | 4 (21.0%) |
| $800 to $999 | 10 (11.6%) | 10 (52.6%) |
| $1,000 to $1,499 | 9 (10.5%) | 5 (26.3%) |
| $1,500 to $1,999 | 7 (8.1%) | 0 (0.0%) |
| $2,000 to $2,499 | 0 (0.0%) | 0 (0.0%) |
| $2,500 to $2,999 | 0 (0.0%) | 0 (0.0%) |
| $3,000 or more | 0 (0.0%) | 0 (0.0%) |
| Total | 86 (100.0%) | 19 (100.0%) |
Physical Housing Characteristics in Waco
Housing Structures in Waco
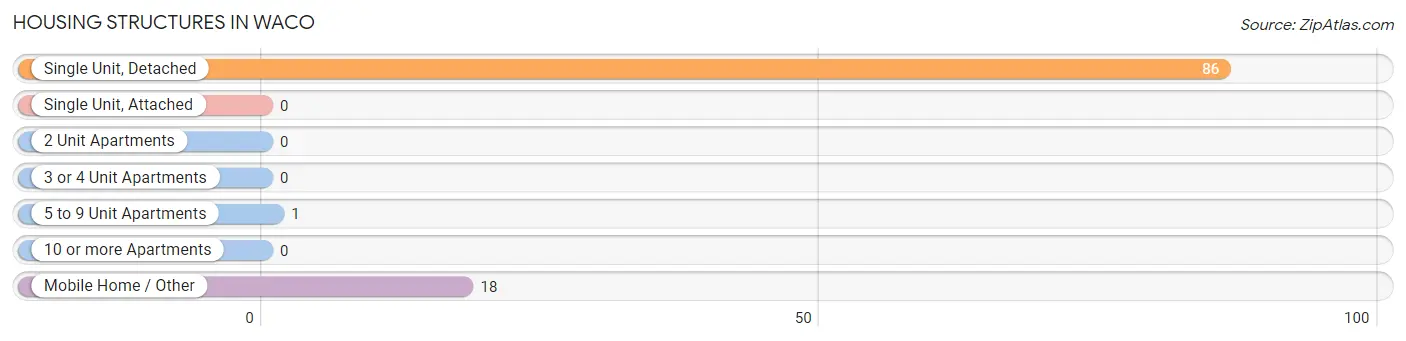
| Structure Type | # Housing Units | % Housing Units |
| Single Unit, Detached | 86 | 81.9% |
| Single Unit, Attached | 0 | 0.0% |
| 2 Unit Apartments | 0 | 0.0% |
| 3 or 4 Unit Apartments | 0 | 0.0% |
| 5 to 9 Unit Apartments | 1 | 0.9% |
| 10 or more Apartments | 0 | 0.0% |
| Mobile Home / Other | 18 | 17.1% |
| Total | 105 | 100.0% |
Housing Structures by Occupancy in Waco
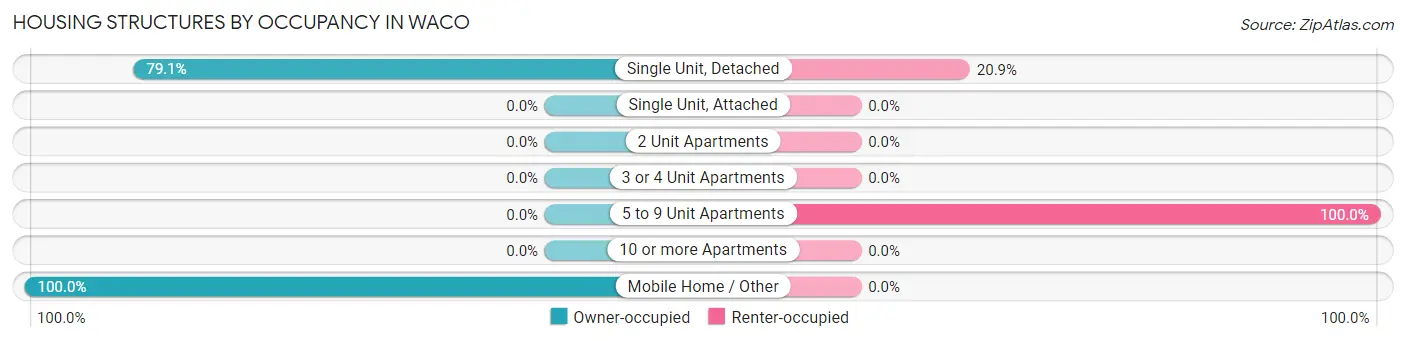
| Structure Type | Owner-occupied | Renter-occupied |
| Single Unit, Detached | 68 (79.1%) | 18 (20.9%) |
| Single Unit, Attached | 0 (0.0%) | 0 (0.0%) |
| 2 Unit Apartments | 0 (0.0%) | 0 (0.0%) |
| 3 or 4 Unit Apartments | 0 (0.0%) | 0 (0.0%) |
| 5 to 9 Unit Apartments | 0 (0.0%) | 1 (100.0%) |
| 10 or more Apartments | 0 (0.0%) | 0 (0.0%) |
| Mobile Home / Other | 18 (100.0%) | 0 (0.0%) |
| Total | 86 (81.9%) | 19 (18.1%) |
Housing Structures by Number of Rooms in Waco
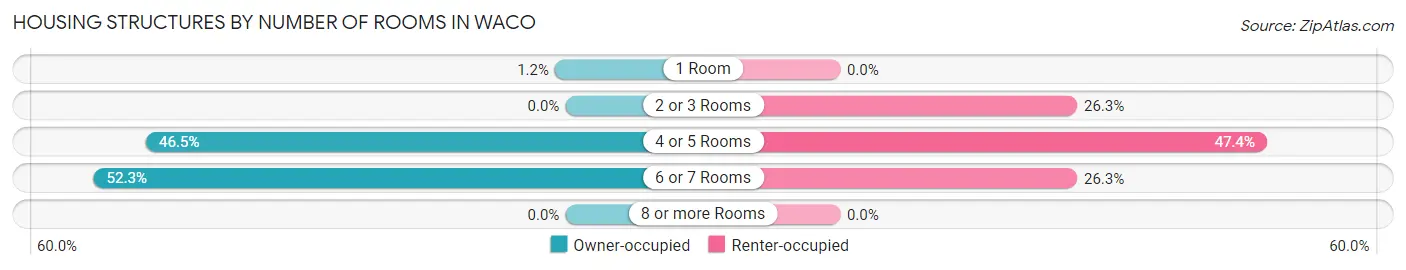
| Number of Rooms | Owner-occupied | Renter-occupied |
| 1 Room | 1 (1.2%) | 0 (0.0%) |
| 2 or 3 Rooms | 0 (0.0%) | 5 (26.3%) |
| 4 or 5 Rooms | 40 (46.5%) | 9 (47.4%) |
| 6 or 7 Rooms | 45 (52.3%) | 5 (26.3%) |
| 8 or more Rooms | 0 (0.0%) | 0 (0.0%) |
| Total | 86 (100.0%) | 19 (100.0%) |
Housing Structure by Heating Type in Waco
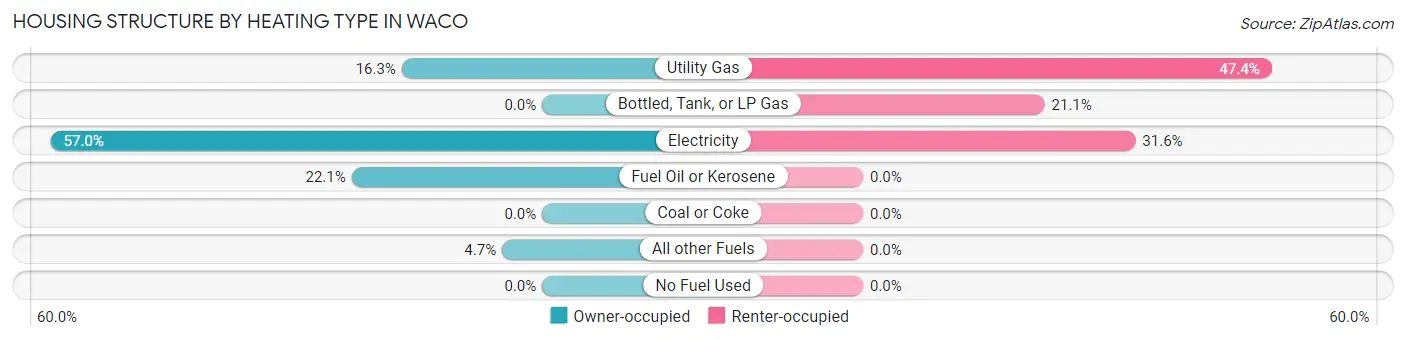
| Heating Type | Owner-occupied | Renter-occupied |
| Utility Gas | 14 (16.3%) | 9 (47.4%) |
| Bottled, Tank, or LP Gas | 0 (0.0%) | 4 (21.0%) |
| Electricity | 49 (57.0%) | 6 (31.6%) |
| Fuel Oil or Kerosene | 19 (22.1%) | 0 (0.0%) |
| Coal or Coke | 0 (0.0%) | 0 (0.0%) |
| All other Fuels | 4 (4.6%) | 0 (0.0%) |
| No Fuel Used | 0 (0.0%) | 0 (0.0%) |
| Total | 86 (100.0%) | 19 (100.0%) |
Household Vehicle Usage in Waco
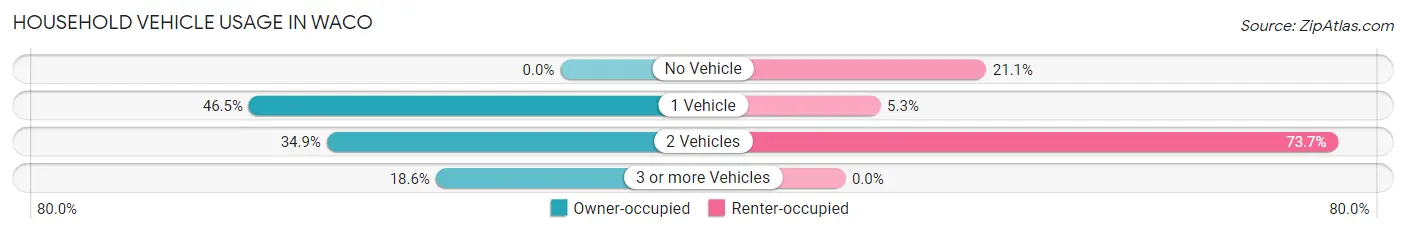
| Vehicles per Household | Owner-occupied | Renter-occupied |
| No Vehicle | 0 (0.0%) | 4 (21.0%) |
| 1 Vehicle | 40 (46.5%) | 1 (5.3%) |
| 2 Vehicles | 30 (34.9%) | 14 (73.7%) |
| 3 or more Vehicles | 16 (18.6%) | 0 (0.0%) |
| Total | 86 (100.0%) | 19 (100.0%) |
Real Estate & Mortgages in Waco
Real Estate and Mortgage Overview in Waco
| Characteristic | Without Mortgage | With Mortgage |
| Housing Units | 53 | 33 |
| Median Property Value | $95,800 | $107,800 |
| Median Household Income | $36,875 | $3 |
| Monthly Housing Costs | $355 | $0 |
| Real Estate Taxes | $819 | $0 |
Property Value by Mortgage Status in Waco
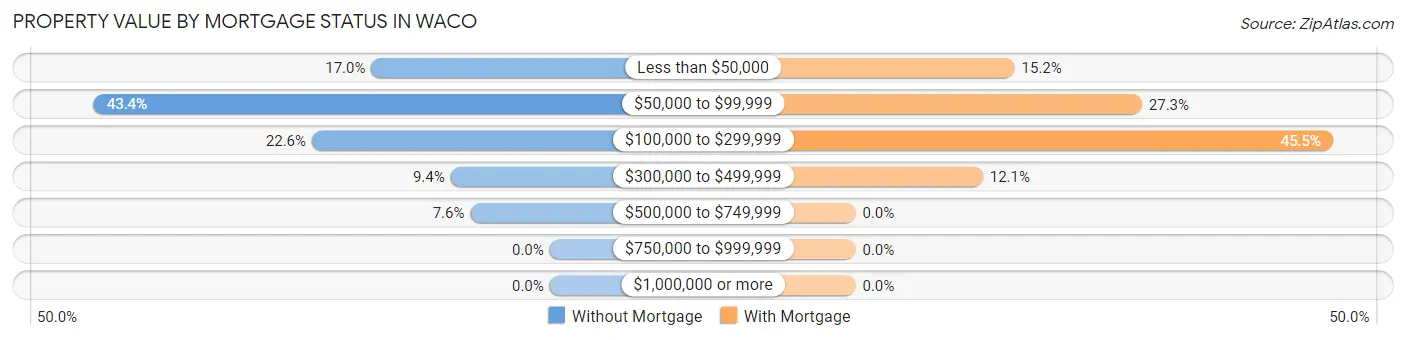
| Property Value | Without Mortgage | With Mortgage |
| Less than $50,000 | 9 (17.0%) | 5 (15.1%) |
| $50,000 to $99,999 | 23 (43.4%) | 9 (27.3%) |
| $100,000 to $299,999 | 12 (22.6%) | 15 (45.5%) |
| $300,000 to $499,999 | 5 (9.4%) | 4 (12.1%) |
| $500,000 to $749,999 | 4 (7.5%) | 0 (0.0%) |
| $750,000 to $999,999 | 0 (0.0%) | 0 (0.0%) |
| $1,000,000 or more | 0 (0.0%) | 0 (0.0%) |
| Total | 53 (100.0%) | 33 (100.0%) |
Household Income by Mortgage Status in Waco
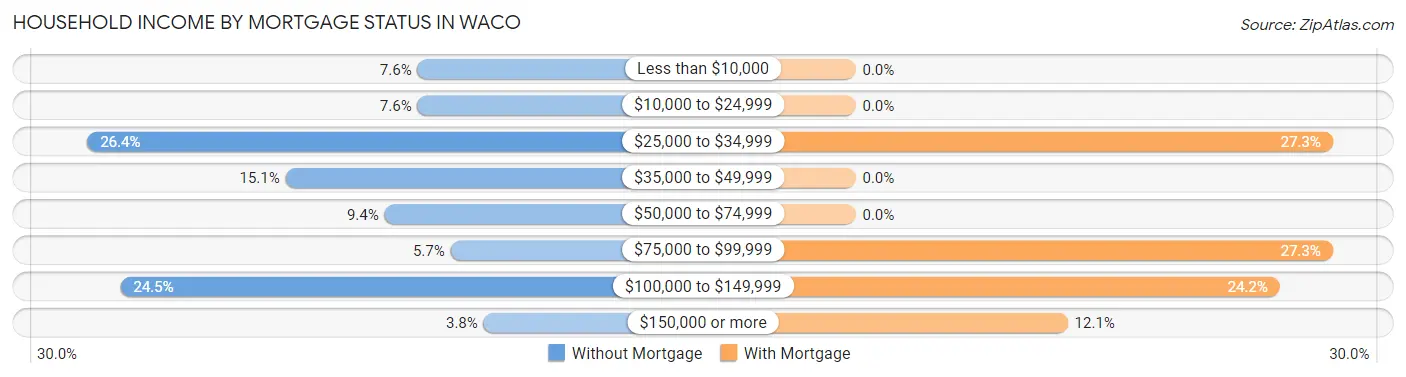
| Household Income | Without Mortgage | With Mortgage |
| Less than $10,000 | 4 (7.5%) | 0 (0.0%) |
| $10,000 to $24,999 | 4 (7.5%) | 0 (0.0%) |
| $25,000 to $34,999 | 14 (26.4%) | 9 (27.3%) |
| $35,000 to $49,999 | 8 (15.1%) | 0 (0.0%) |
| $50,000 to $74,999 | 5 (9.4%) | 0 (0.0%) |
| $75,000 to $99,999 | 3 (5.7%) | 9 (27.3%) |
| $100,000 to $149,999 | 13 (24.5%) | 8 (24.2%) |
| $150,000 or more | 2 (3.8%) | 4 (12.1%) |
| Total | 53 (100.0%) | 33 (100.0%) |
Property Value to Household Income Ratio in Waco
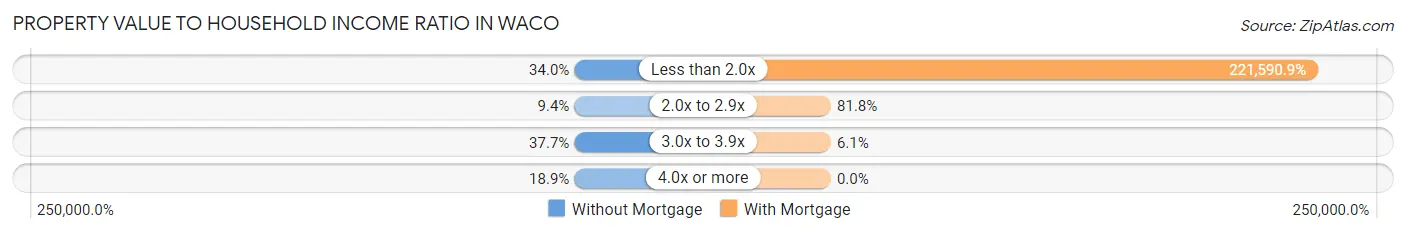
| Value-to-Income Ratio | Without Mortgage | With Mortgage |
| Less than 2.0x | 18 (34.0%) | 73,125 (221,590.9%) |
| 2.0x to 2.9x | 5 (9.4%) | 27 (81.8%) |
| 3.0x to 3.9x | 20 (37.7%) | 2 (6.1%) |
| 4.0x or more | 10 (18.9%) | 0 (0.0%) |
| Total | 53 (100.0%) | 33 (100.0%) |
Real Estate Taxes by Mortgage Status in Waco
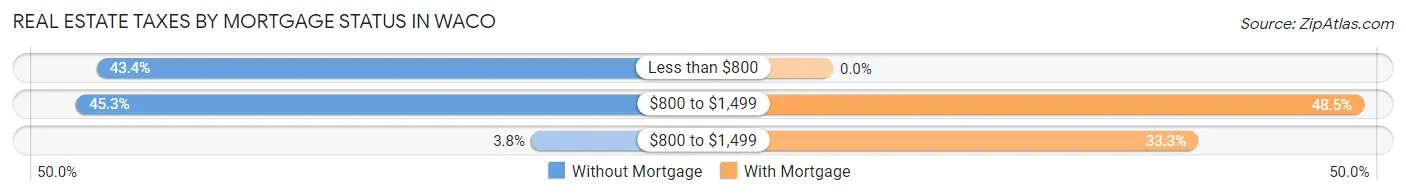
| Property Taxes | Without Mortgage | With Mortgage |
| Less than $800 | 23 (43.4%) | 0 (0.0%) |
| $800 to $1,499 | 24 (45.3%) | 16 (48.5%) |
| $800 to $1,499 | 2 (3.8%) | 11 (33.3%) |
| Total | 53 (100.0%) | 33 (100.0%) |
Health & Disability in Waco
Health Insurance Coverage by Age in Waco
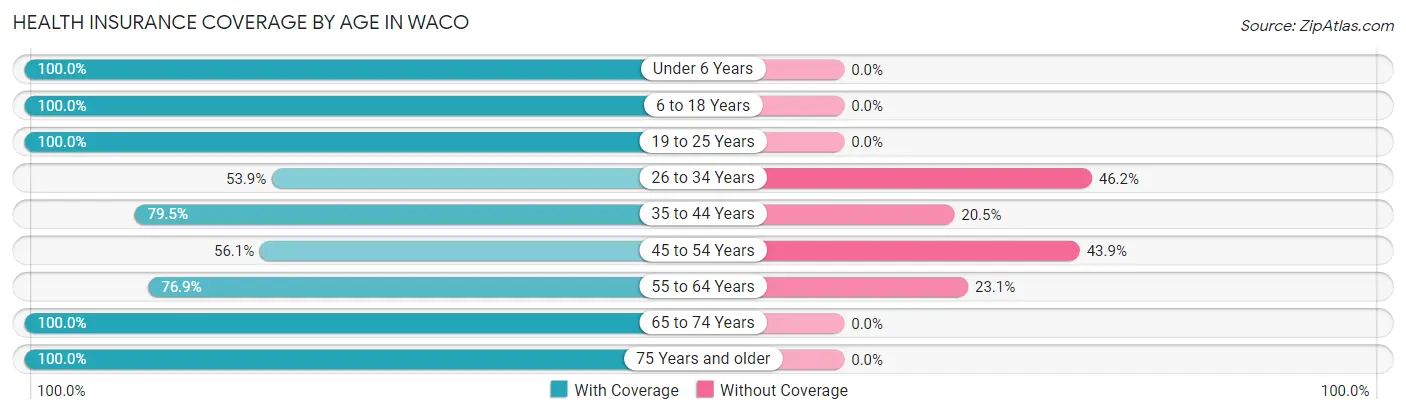
| Age Bracket | With Coverage | Without Coverage |
| Under 6 Years | 12 (100.0%) | 0 (0.0%) |
| 6 to 18 Years | 28 (100.0%) | 0 (0.0%) |
| 19 to 25 Years | 3 (100.0%) | 0 (0.0%) |
| 26 to 34 Years | 21 (53.8%) | 18 (46.2%) |
| 35 to 44 Years | 31 (79.5%) | 8 (20.5%) |
| 45 to 54 Years | 23 (56.1%) | 18 (43.9%) |
| 55 to 64 Years | 20 (76.9%) | 6 (23.1%) |
| 65 to 74 Years | 50 (100.0%) | 0 (0.0%) |
| 75 Years and older | 40 (100.0%) | 0 (0.0%) |
| Total | 228 (82.0%) | 50 (18.0%) |
Health Insurance Coverage by Citizenship Status in Waco

| Citizenship Status | With Coverage | Without Coverage |
| Native Born | 12 (100.0%) | 0 (0.0%) |
| Foreign Born, Citizen | 28 (100.0%) | 0 (0.0%) |
| Foreign Born, not a Citizen | 3 (100.0%) | 0 (0.0%) |
Health Insurance Coverage by Household Income in Waco
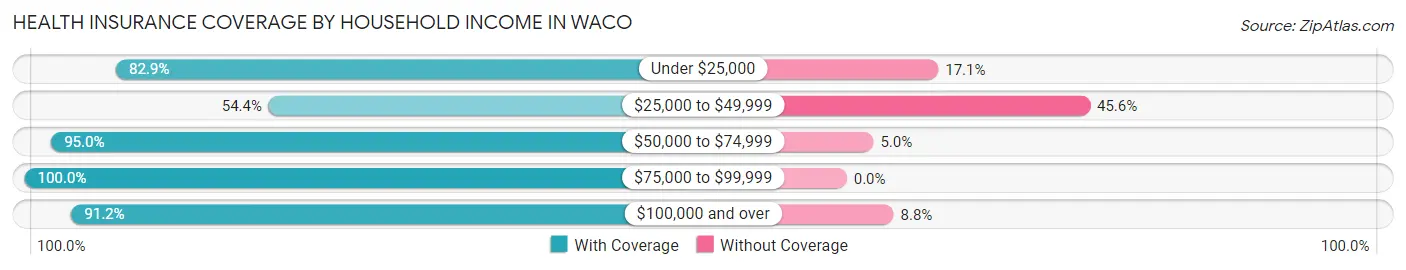
| Household Income | With Coverage | Without Coverage |
| Under $25,000 | 29 (82.9%) | 6 (17.1%) |
| $25,000 to $49,999 | 43 (54.4%) | 36 (45.6%) |
| $50,000 to $74,999 | 57 (95.0%) | 3 (5.0%) |
| $75,000 to $99,999 | 47 (100.0%) | 0 (0.0%) |
| $100,000 and over | 52 (91.2%) | 5 (8.8%) |
Public vs Private Health Insurance Coverage by Age in Waco
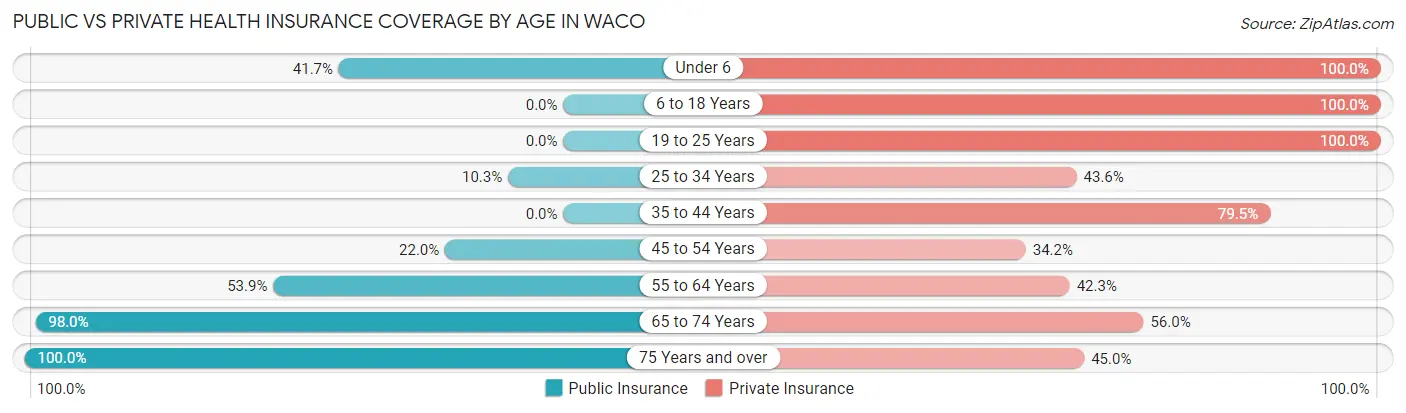
| Age Bracket | Public Insurance | Private Insurance |
| Under 6 | 5 (41.7%) | 12 (100.0%) |
| 6 to 18 Years | 0 (0.0%) | 28 (100.0%) |
| 19 to 25 Years | 0 (0.0%) | 3 (100.0%) |
| 25 to 34 Years | 4 (10.3%) | 17 (43.6%) |
| 35 to 44 Years | 0 (0.0%) | 31 (79.5%) |
| 45 to 54 Years | 9 (22.0%) | 14 (34.2%) |
| 55 to 64 Years | 14 (53.8%) | 11 (42.3%) |
| 65 to 74 Years | 49 (98.0%) | 28 (56.0%) |
| 75 Years and over | 40 (100.0%) | 18 (45.0%) |
| Total | 121 (43.5%) | 162 (58.3%) |
Disability Status by Sex by Age in Waco
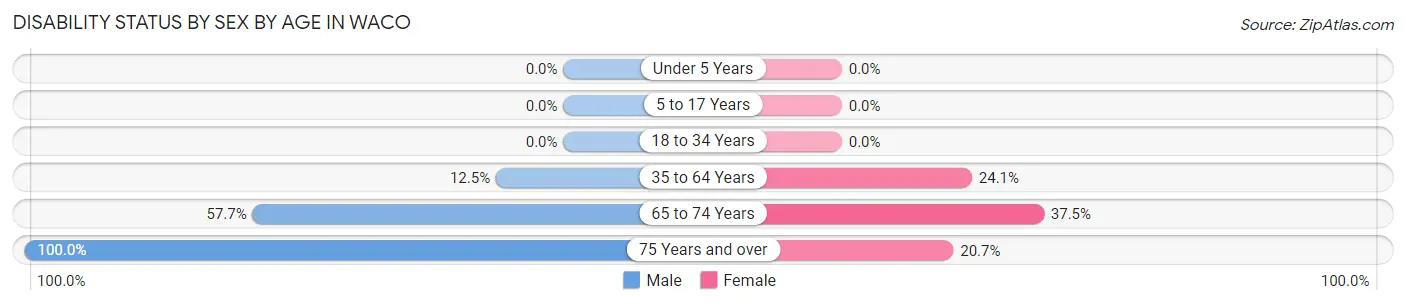
| Age Bracket | Male | Female |
| Under 5 Years | 0 (0.0%) | 0 (0.0%) |
| 5 to 17 Years | 0 (0.0%) | 0 (0.0%) |
| 18 to 34 Years | 0 (0.0%) | 0 (0.0%) |
| 35 to 64 Years | 6 (12.5%) | 14 (24.1%) |
| 65 to 74 Years | 15 (57.7%) | 9 (37.5%) |
| 75 Years and over | 11 (100.0%) | 6 (20.7%) |
Disability Class by Sex by Age in Waco
Disability Class: Hearing Difficulty
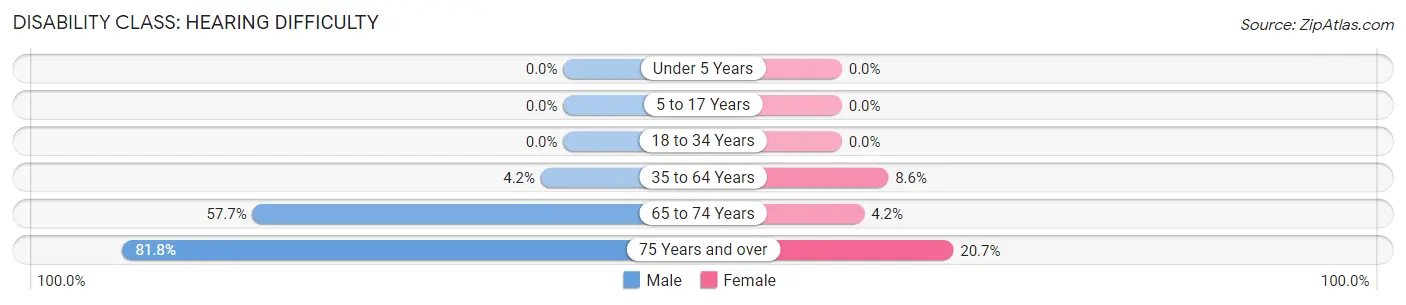
| Age Bracket | Male | Female |
| Under 5 Years | 0 (0.0%) | 0 (0.0%) |
| 5 to 17 Years | 0 (0.0%) | 0 (0.0%) |
| 18 to 34 Years | 0 (0.0%) | 0 (0.0%) |
| 35 to 64 Years | 2 (4.2%) | 5 (8.6%) |
| 65 to 74 Years | 15 (57.7%) | 1 (4.2%) |
| 75 Years and over | 9 (81.8%) | 6 (20.7%) |
Disability Class: Vision Difficulty
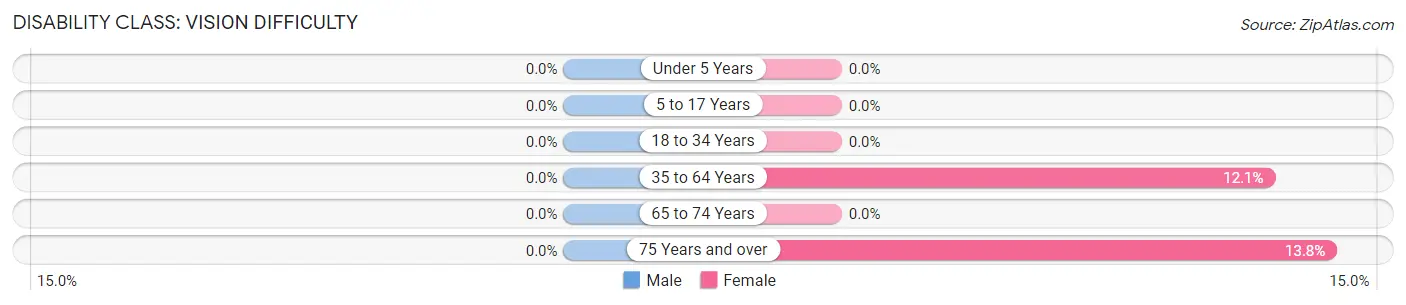
| Age Bracket | Male | Female |
| Under 5 Years | 0 (0.0%) | 0 (0.0%) |
| 5 to 17 Years | 0 (0.0%) | 0 (0.0%) |
| 18 to 34 Years | 0 (0.0%) | 0 (0.0%) |
| 35 to 64 Years | 0 (0.0%) | 7 (12.1%) |
| 65 to 74 Years | 0 (0.0%) | 0 (0.0%) |
| 75 Years and over | 0 (0.0%) | 4 (13.8%) |
Disability Class: Cognitive Difficulty
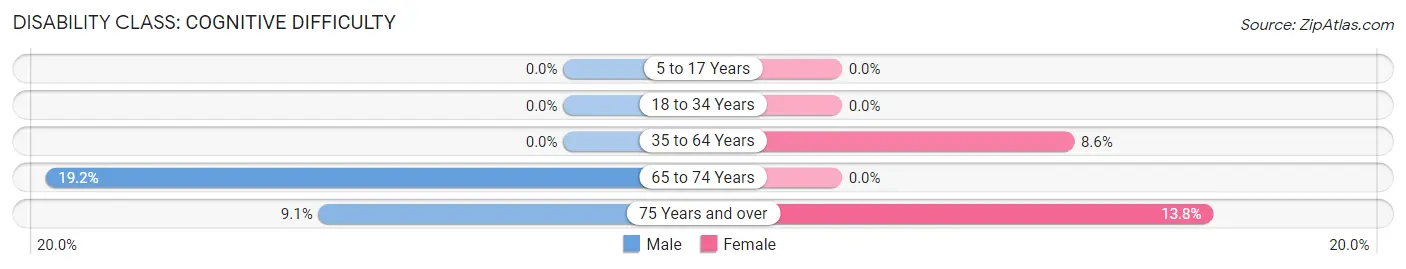
| Age Bracket | Male | Female |
| 5 to 17 Years | 0 (0.0%) | 0 (0.0%) |
| 18 to 34 Years | 0 (0.0%) | 0 (0.0%) |
| 35 to 64 Years | 0 (0.0%) | 5 (8.6%) |
| 65 to 74 Years | 5 (19.2%) | 0 (0.0%) |
| 75 Years and over | 1 (9.1%) | 4 (13.8%) |
Disability Class: Ambulatory Difficulty
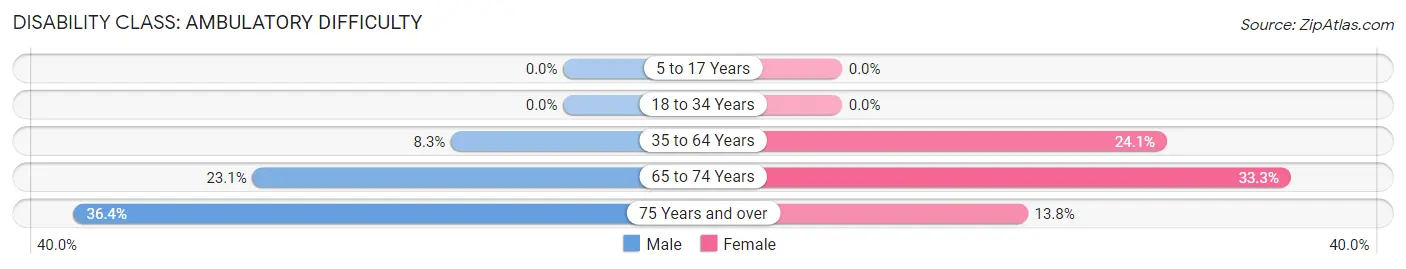
| Age Bracket | Male | Female |
| 5 to 17 Years | 0 (0.0%) | 0 (0.0%) |
| 18 to 34 Years | 0 (0.0%) | 0 (0.0%) |
| 35 to 64 Years | 4 (8.3%) | 14 (24.1%) |
| 65 to 74 Years | 6 (23.1%) | 8 (33.3%) |
| 75 Years and over | 4 (36.4%) | 4 (13.8%) |
Disability Class: Self-Care Difficulty
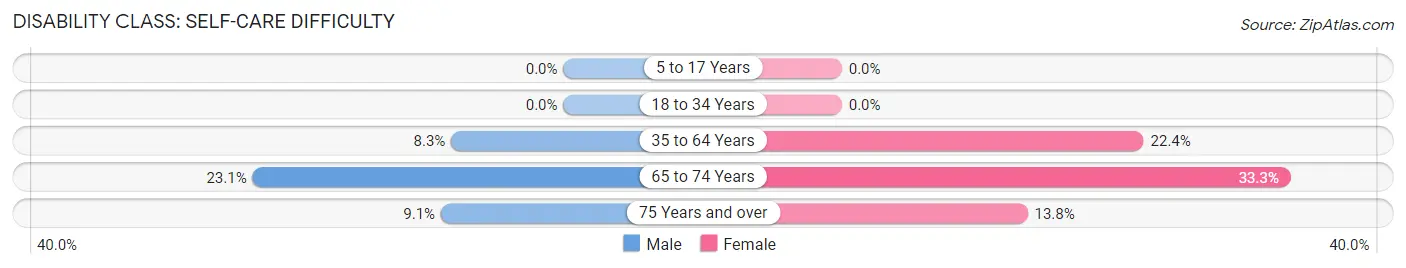
| Age Bracket | Male | Female |
| 5 to 17 Years | 0 (0.0%) | 0 (0.0%) |
| 18 to 34 Years | 0 (0.0%) | 0 (0.0%) |
| 35 to 64 Years | 4 (8.3%) | 13 (22.4%) |
| 65 to 74 Years | 6 (23.1%) | 8 (33.3%) |
| 75 Years and over | 1 (9.1%) | 4 (13.8%) |
Technology Access in Waco
Computing Device Access in Waco
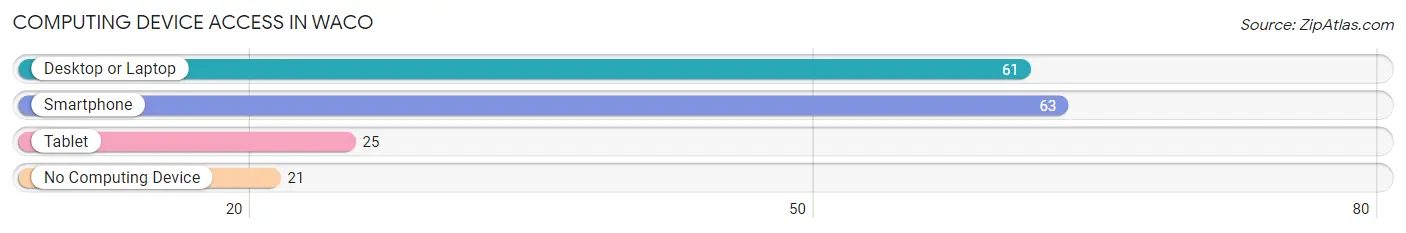
| Device Type | # Households | % Households |
| Desktop or Laptop | 61 | 58.1% |
| Smartphone | 63 | 60.0% |
| Tablet | 25 | 23.8% |
| No Computing Device | 21 | 20.0% |
| Total | 105 | 100.0% |
Internet Access in Waco
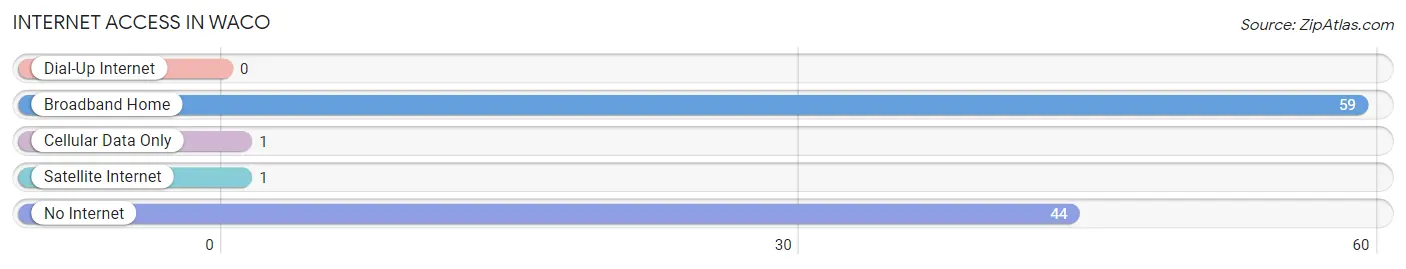
| Internet Type | # Households | % Households |
| Dial-Up Internet | 0 | 0.0% |
| Broadband Home | 59 | 56.2% |
| Cellular Data Only | 1 | 0.9% |
| Satellite Internet | 1 | 0.9% |
| No Internet | 44 | 41.9% |
| Total | 105 | 100.0% |
Waco Summary
Waco is a small town located in the state of North Carolina, in the United States. It is situated in the foothills of the Blue Ridge Mountains, in the Yadkin Valley region of the state. The town is located in Wilkes County, and is part of the North Wilkesboro Micropolitan Statistical Area. As of the 2010 census, the population of Waco was 1,845.
History
The area that is now Waco was first settled in the late 1700s by German and Scots-Irish immigrants. The town was originally known as “Waco Town”, and was officially incorporated in 1887. The town was named after the Waco Indians, a Native American tribe that once lived in the area.
The town was an important stop on the North Carolina Railroad, which ran from Charlotte to Winston-Salem. The railroad was built in the 1850s, and was a major factor in the growth of the town. The railroad brought new businesses and industries to the area, and helped to make Waco a thriving community.
Geography
Waco is located in the foothills of the Blue Ridge Mountains, in the Yadkin Valley region of North Carolina. The town is situated in Wilkes County, and is part of the North Wilkesboro Micropolitan Statistical Area. The town is located at an elevation of 1,072 feet (326 m).
The town is located at the intersection of US Highway 421 and NC Highway 268. The nearest major cities are Winston-Salem (45 miles to the east) and Charlotte (90 miles to the west).
Economy
The economy of Waco is largely based on agriculture and tourism. The town is home to several farms, which produce a variety of crops, including corn, soybeans, wheat, and hay. The town is also home to several wineries, which produce a variety of wines.
The town is also a popular tourist destination, due to its proximity to the Blue Ridge Mountains. The town is home to several outdoor recreation areas, including the W. Kerr Scott Reservoir, which offers fishing, boating, and camping. The town is also home to several historic sites, including the Waco Historic District, which is listed on the National Register of Historic Places.
Demographics
As of the 2010 census, the population of Waco was 1,845. The racial makeup of the town was 94.3% White, 2.7% African American, 0.3% Native American, 0.3% Asian, 0.1% Pacific Islander, 0.9% from other races, and 1.4% from two or more races. Hispanic or Latino of any race were 2.2% of the population.
The median household income in Waco was $35,938, and the median family income was $41,250. The per capita income for the town was $17,845. About 15.3% of families and 18.2% of the population were below the poverty line, including 25.2% of those under age 18 and 11.2% of those age 65 or over.
Common Questions
What is Per Capita Income in Waco?
Per Capita income in Waco is $23,944.
What is the Median Family Income in Waco?
Median Family Income in Waco is $56,528.
What is the Median Household income in Waco?
Median Household Income in Waco is $41,875.
What is Income or Wage Gap in Waco?
Income or Wage Gap in Waco is 17.5%.
Women in Waco earn 82.5 cents for every dollar earned by a man.
What is Inequality or Gini Index in Waco?
Inequality or Gini Index in Waco is 0.40.
What is the Total Population of Waco?
Total Population of Waco is 278.
What is the Total Male Population of Waco?
Total Male Population of Waco is 124.
What is the Total Female Population of Waco?
Total Female Population of Waco is 154.
What is the Ratio of Males per 100 Females in Waco?
There are 80.52 Males per 100 Females in Waco.
What is the Ratio of Females per 100 Males in Waco?
There are 124.19 Females per 100 Males in Waco.
What is the Median Population Age in Waco?
Median Population Age in Waco is 52.7 Years.
What is the Average Family Size in Waco
Average Family Size in Waco is 3.0 People.
What is the Average Household Size in Waco
Average Household Size in Waco is 2.6 People.
How Large is the Labor Force in Waco?
There are 104 People in the Labor Forcein in Waco.
What is the Percentage of People in the Labor Force in Waco?
43.7% of People are in the Labor Force in Waco.
What is the Unemployment Rate in Waco?
Unemployment Rate in Waco is 1.9%.