Black Creek, NC Map & Demographics
Black Creek Map
Black Creek Overview
$26,343
PER CAPITA INCOME
$76,429
AVG FAMILY INCOME
$53,382
AVG HOUSEHOLD INCOME
0.9%
WAGE / INCOME GAP [ % ]
99.1¢/ $1
WAGE / INCOME GAP [ $ ]
0.40
INEQUALITY / GINI INDEX
758
TOTAL POPULATION
387
MALE POPULATION
371
FEMALE POPULATION
104.31
MALES / 100 FEMALES
95.87
FEMALES / 100 MALES
39.6
MEDIAN AGE
3.4
AVG FAMILY SIZE
2.7
AVG HOUSEHOLD SIZE
422
LABOR FORCE [ PEOPLE ]
67.0%
PERCENT IN LABOR FORCE
9.7%
UNEMPLOYMENT RATE
Black Creek Zip Codes
Black Creek Area Codes
Income in Black Creek
Income Overview in Black Creek
Per Capita Income in Black Creek is $26,343, while median incomes of families and households are $76,429 and $53,382 respectively.
| Characteristic | Number | Measure |
| Per Capita Income | 758 | $26,343 |
| Median Family Income | 182 | $76,429 |
| Mean Family Income | 182 | $81,151 |
| Median Household Income | 282 | $53,382 |
| Mean Household Income | 282 | $67,030 |
| Income Deficit | 182 | $0 |
| Wage / Income Gap (%) | 758 | 0.90% |
| Wage / Income Gap ($) | 758 | 99.10¢ per $1 |
| Gini / Inequality Index | 758 | 0.40 |
Earnings by Sex in Black Creek
Average Earnings in Black Creek are $36,000, $35,769 for men and $36,094 for women, a difference of 0.9%.
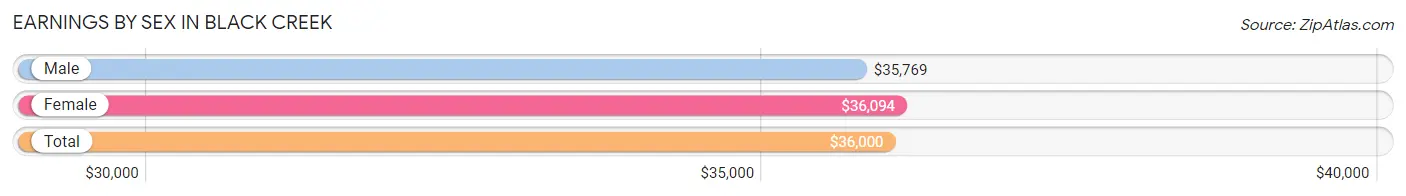
| Sex | Number | Average Earnings |
| Male | 216 (52.7%) | $35,769 |
| Female | 194 (47.3%) | $36,094 |
| Total | 410 (100.0%) | $36,000 |
Earnings by Sex by Income Bracket in Black Creek
The most common earnings brackets in Black Creek are $25,000 to $29,999 for men (44 | 20.4%) and $40,000 to $44,999 for women (43 | 22.2%).
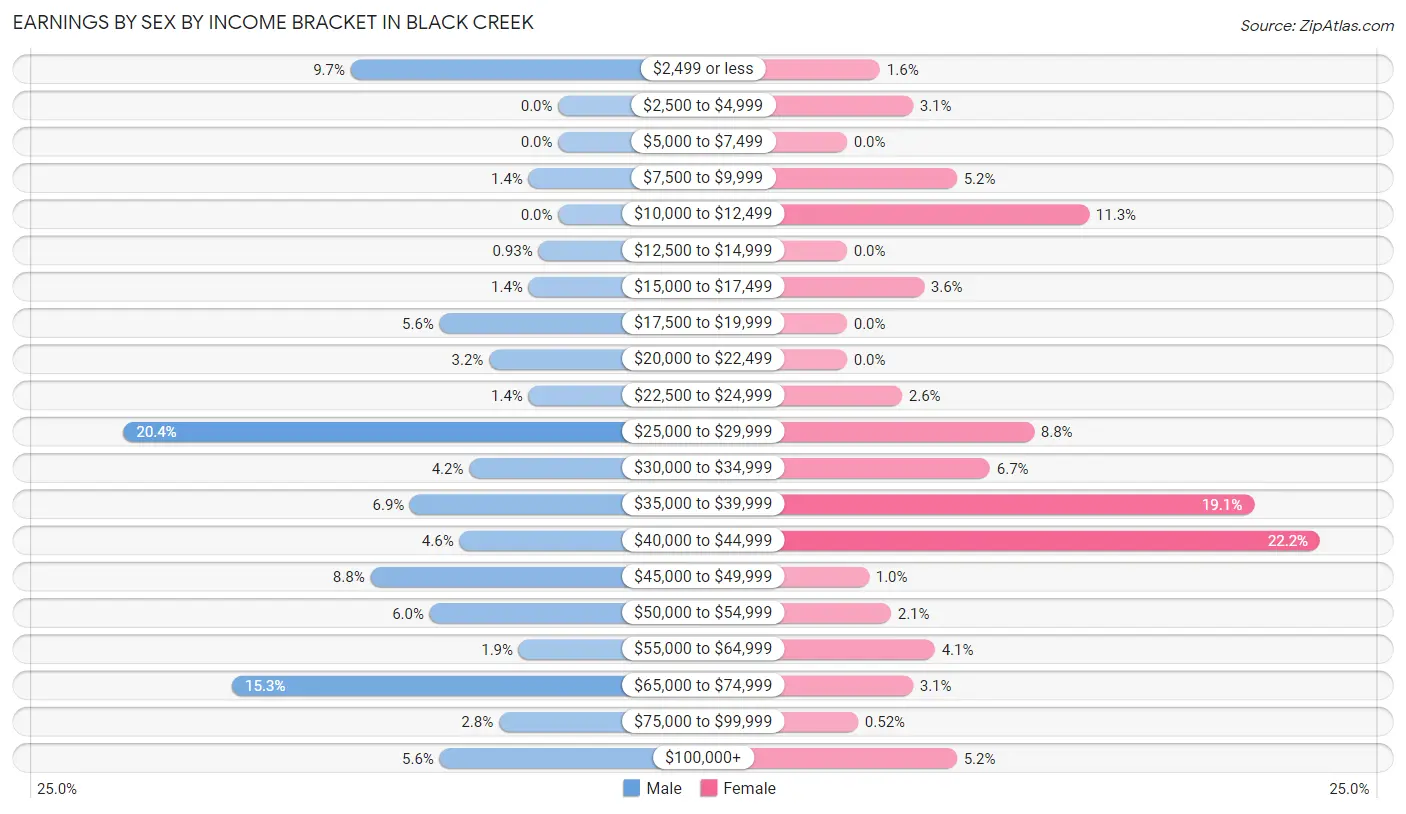
| Income | Male | Female |
| $2,499 or less | 21 (9.7%) | 3 (1.5%) |
| $2,500 to $4,999 | 0 (0.0%) | 6 (3.1%) |
| $5,000 to $7,499 | 0 (0.0%) | 0 (0.0%) |
| $7,500 to $9,999 | 3 (1.4%) | 10 (5.1%) |
| $10,000 to $12,499 | 0 (0.0%) | 22 (11.3%) |
| $12,500 to $14,999 | 2 (0.9%) | 0 (0.0%) |
| $15,000 to $17,499 | 3 (1.4%) | 7 (3.6%) |
| $17,500 to $19,999 | 12 (5.6%) | 0 (0.0%) |
| $20,000 to $22,499 | 7 (3.2%) | 0 (0.0%) |
| $22,500 to $24,999 | 3 (1.4%) | 5 (2.6%) |
| $25,000 to $29,999 | 44 (20.4%) | 17 (8.8%) |
| $30,000 to $34,999 | 9 (4.2%) | 13 (6.7%) |
| $35,000 to $39,999 | 15 (6.9%) | 37 (19.1%) |
| $40,000 to $44,999 | 10 (4.6%) | 43 (22.2%) |
| $45,000 to $49,999 | 19 (8.8%) | 2 (1.0%) |
| $50,000 to $54,999 | 13 (6.0%) | 4 (2.1%) |
| $55,000 to $64,999 | 4 (1.8%) | 8 (4.1%) |
| $65,000 to $74,999 | 33 (15.3%) | 6 (3.1%) |
| $75,000 to $99,999 | 6 (2.8%) | 1 (0.5%) |
| $100,000+ | 12 (5.6%) | 10 (5.1%) |
| Total | 216 (100.0%) | 194 (100.0%) |
Earnings by Sex by Educational Attainment in Black Creek
Average earnings in Black Creek are $45,263 for men and $36,445 for women, a difference of 19.5%. Men with an educational attainment of college or associate's degree enjoy the highest average annual earnings of $46,250, while those with less than high school education earn the least with $31,250. Women with an educational attainment of graduate degree earn the most with the average annual earnings of $73,125, while those with college or associate's degree education have the smallest earnings of $31,875.
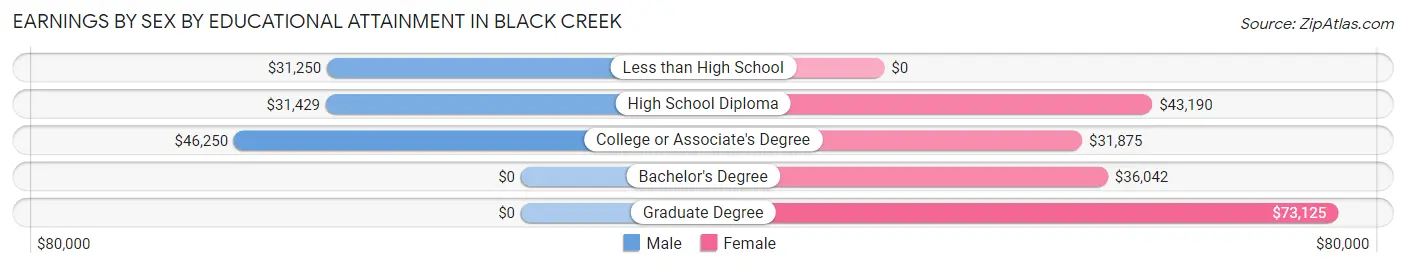
| Educational Attainment | Male Income | Female Income |
| Less than High School | $31,250 | $0 |
| High School Diploma | $31,429 | $43,190 |
| College or Associate's Degree | $46,250 | $31,875 |
| Bachelor's Degree | - | - |
| Graduate Degree | - | - |
| Total | $45,263 | $36,445 |
Family Income in Black Creek
Family Income Brackets in Black Creek
According to the Black Creek family income data, there are 42 families falling into the $75,000 to $99,999 income range, which is the most common income bracket and makes up 23.1% of all families.
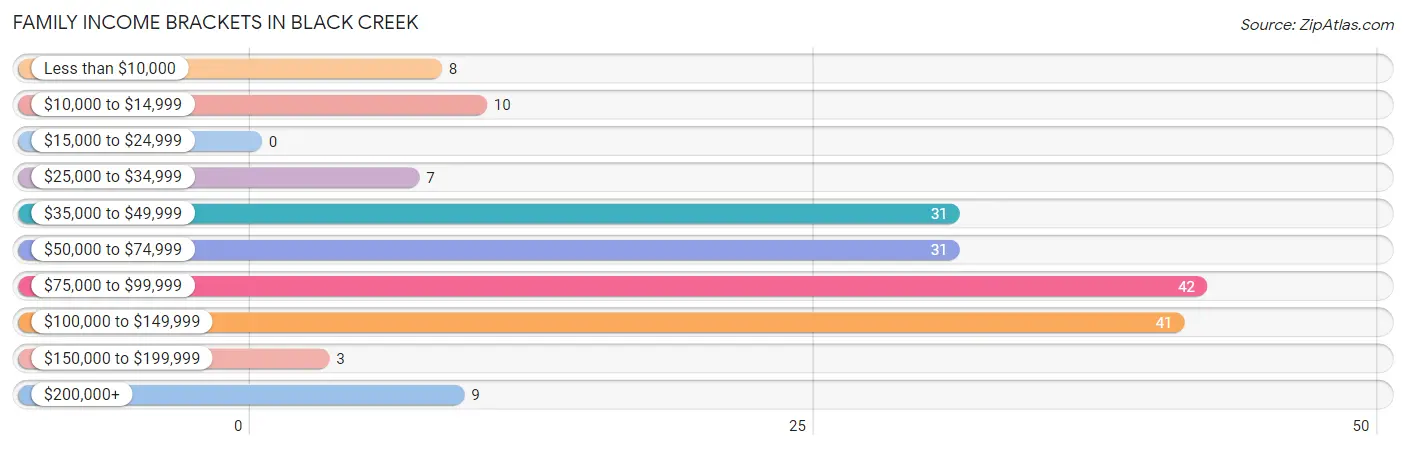
| Income Bracket | # Families | % Families |
| Less than $10,000 | 8 | 4.4% |
| $10,000 to $14,999 | 10 | 5.5% |
| $15,000 to $24,999 | 0 | 0.0% |
| $25,000 to $34,999 | 7 | 3.8% |
| $35,000 to $49,999 | 31 | 17.0% |
| $50,000 to $74,999 | 31 | 17.0% |
| $75,000 to $99,999 | 42 | 23.1% |
| $100,000 to $149,999 | 41 | 22.5% |
| $150,000 to $199,999 | 3 | 1.6% |
| $200,000+ | 9 | 4.9% |
Family Income by Famaliy Size in Black Creek
5-person families (25 | 13.7%) account for the highest median family income in Black Creek with $99,107 per family, while 3-person families (75 | 41.2%) have the highest median income of $29,417 per family member.
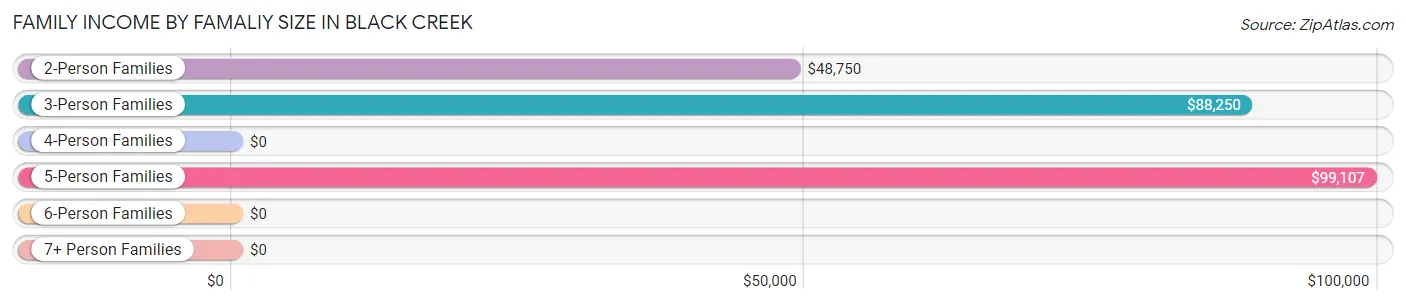
| Income Bracket | # Families | Median Income |
| 2-Person Families | 68 (37.4%) | $48,750 |
| 3-Person Families | 75 (41.2%) | $88,250 |
| 4-Person Families | 6 (3.3%) | $0 |
| 5-Person Families | 25 (13.7%) | $99,107 |
| 6-Person Families | 8 (4.4%) | $0 |
| 7+ Person Families | 0 (0.0%) | $0 |
| Total | 182 (100.0%) | $76,429 |
Family Income by Number of Earners in Black Creek
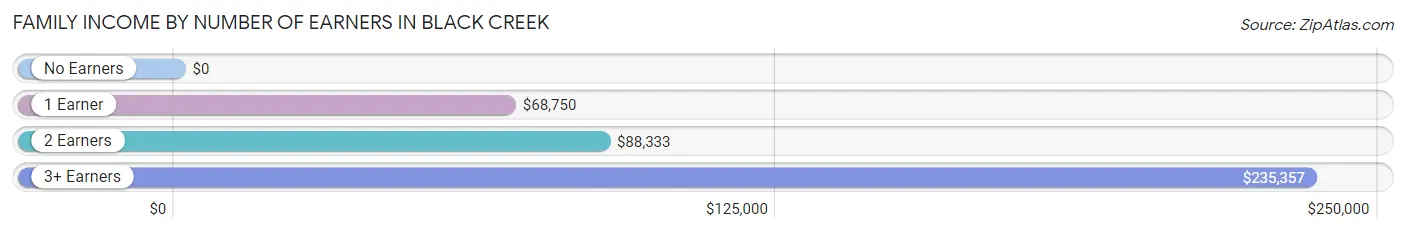
| Number of Earners | # Families | Median Income |
| No Earners | 31 (17.0%) | $0 |
| 1 Earner | 31 (17.0%) | $68,750 |
| 2 Earners | 108 (59.3%) | $88,333 |
| 3+ Earners | 12 (6.6%) | $235,357 |
| Total | 182 (100.0%) | $76,429 |
Household Income in Black Creek
Household Income Brackets in Black Creek
With 54 households falling in the category, the $100,000 to $149,999 income range is the most frequent in Black Creek, accounting for 19.2% of all households. In contrast, only 3 households (1.1%) fall into the $150,000 to $199,999 income bracket, making it the least populous group.
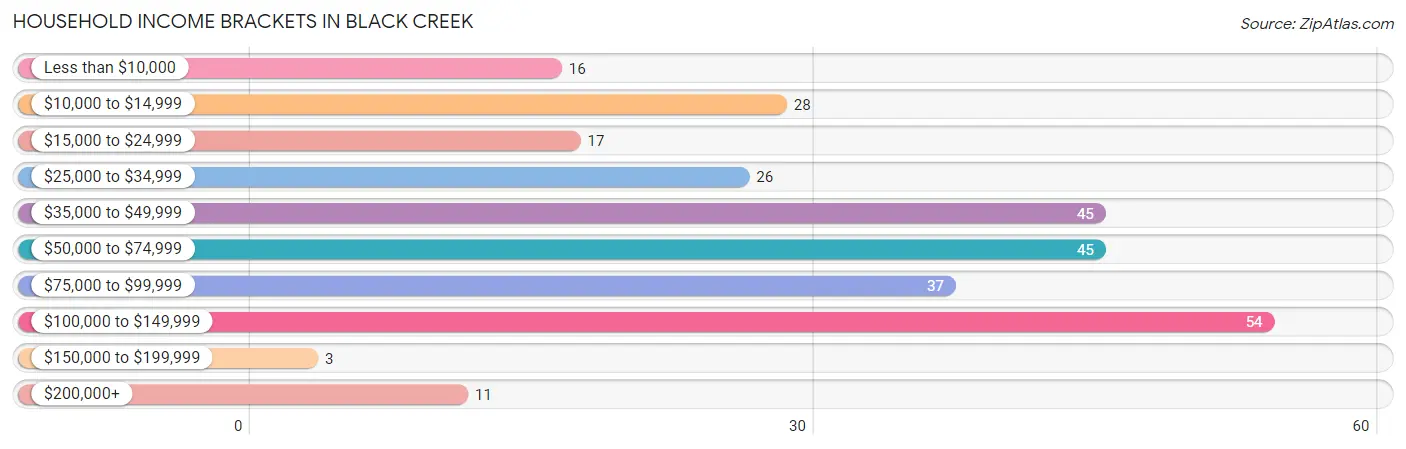
| Income Bracket | # Households | % Households |
| Less than $10,000 | 16 | 5.7% |
| $10,000 to $14,999 | 28 | 9.9% |
| $15,000 to $24,999 | 17 | 6.0% |
| $25,000 to $34,999 | 26 | 9.2% |
| $35,000 to $49,999 | 45 | 16.0% |
| $50,000 to $74,999 | 45 | 16.0% |
| $75,000 to $99,999 | 37 | 13.1% |
| $100,000 to $149,999 | 54 | 19.1% |
| $150,000 to $199,999 | 3 | 1.1% |
| $200,000+ | 11 | 3.9% |
Household Income by Householder Age in Black Creek
The median household income in Black Creek is $53,382, with the highest median household income of $88,917 found in the 45 to 64 years age bracket for the primary householder. A total of 119 households (42.2%) fall into this category. Meanwhile, the 15 to 24 years age bracket for the primary householder has the lowest median household income of $0, with 14 households (5.0%) in this group.
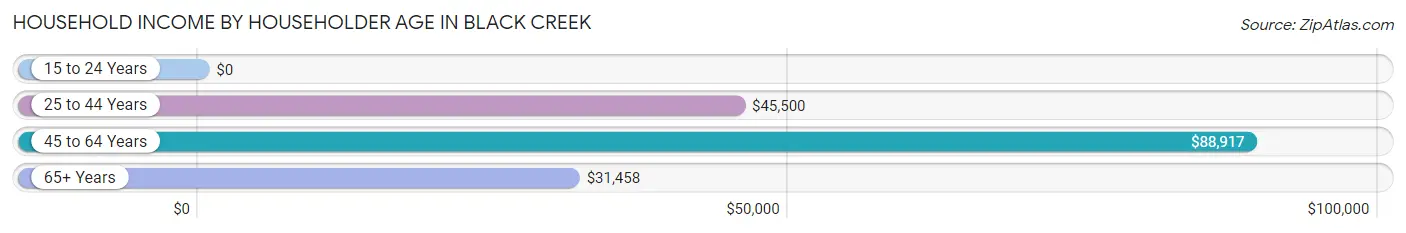
| Income Bracket | # Households | Median Income |
| 15 to 24 Years | 14 (5.0%) | $0 |
| 25 to 44 Years | 66 (23.4%) | $45,500 |
| 45 to 64 Years | 119 (42.2%) | $88,917 |
| 65+ Years | 83 (29.4%) | $31,458 |
| Total | 282 (100.0%) | $53,382 |
Poverty in Black Creek
Income Below Poverty by Sex and Age in Black Creek
With 13.4% poverty level for males and 7.6% for females among the residents of Black Creek, 16 and 17 year old males and 18 to 24 year old females are the most vulnerable to poverty, with 12 males (100.0%) and 15 females (44.1%) in their respective age groups living below the poverty level.
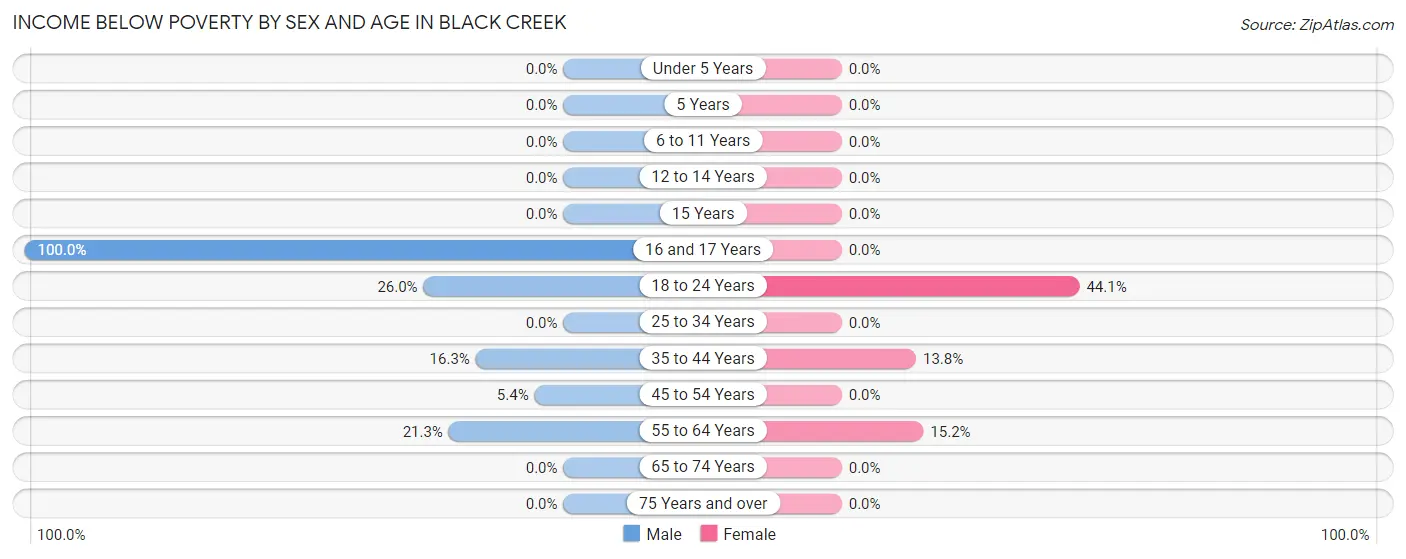
| Age Bracket | Male | Female |
| Under 5 Years | 0 (0.0%) | 0 (0.0%) |
| 5 Years | 0 (0.0%) | 0 (0.0%) |
| 6 to 11 Years | 0 (0.0%) | 0 (0.0%) |
| 12 to 14 Years | 0 (0.0%) | 0 (0.0%) |
| 15 Years | 0 (0.0%) | 0 (0.0%) |
| 16 and 17 Years | 12 (100.0%) | 0 (0.0%) |
| 18 to 24 Years | 20 (26.0%) | 15 (44.1%) |
| 25 to 34 Years | 0 (0.0%) | 0 (0.0%) |
| 35 to 44 Years | 7 (16.3%) | 8 (13.8%) |
| 45 to 54 Years | 3 (5.4%) | 0 (0.0%) |
| 55 to 64 Years | 10 (21.3%) | 5 (15.1%) |
| 65 to 74 Years | 0 (0.0%) | 0 (0.0%) |
| 75 Years and over | 0 (0.0%) | 0 (0.0%) |
| Total | 52 (13.4%) | 28 (7.6%) |
Income Above Poverty by Sex and Age in Black Creek
According to the poverty statistics in Black Creek, males aged under 5 years and females aged under 5 years are the age groups that are most secure financially, with 100.0% of males and 100.0% of females in these age groups living above the poverty line.
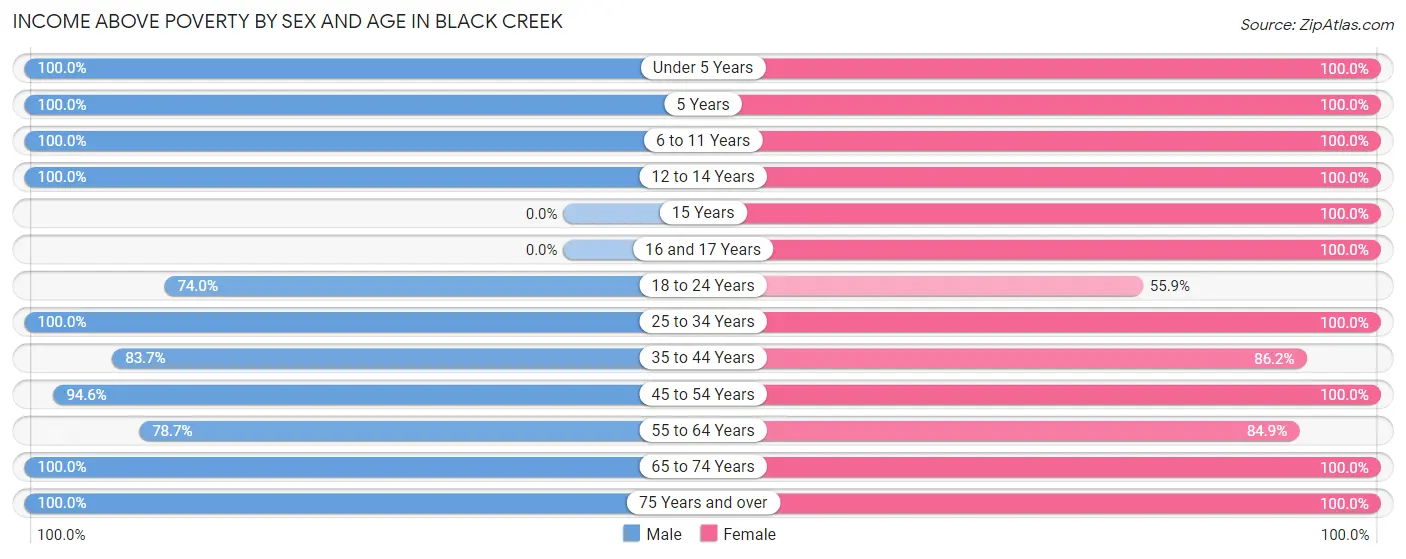
| Age Bracket | Male | Female |
| Under 5 Years | 13 (100.0%) | 26 (100.0%) |
| 5 Years | 7 (100.0%) | 2 (100.0%) |
| 6 to 11 Years | 22 (100.0%) | 21 (100.0%) |
| 12 to 14 Years | 21 (100.0%) | 6 (100.0%) |
| 15 Years | 0 (0.0%) | 5 (100.0%) |
| 16 and 17 Years | 0 (0.0%) | 8 (100.0%) |
| 18 to 24 Years | 57 (74.0%) | 19 (55.9%) |
| 25 to 34 Years | 35 (100.0%) | 39 (100.0%) |
| 35 to 44 Years | 36 (83.7%) | 50 (86.2%) |
| 45 to 54 Years | 53 (94.6%) | 76 (100.0%) |
| 55 to 64 Years | 37 (78.7%) | 28 (84.9%) |
| 65 to 74 Years | 29 (100.0%) | 43 (100.0%) |
| 75 Years and over | 25 (100.0%) | 15 (100.0%) |
| Total | 335 (86.6%) | 338 (92.3%) |
Income Below Poverty Among Married-Couple Families in Black Creek
The poverty statistics for married-couple families in Black Creek show that 3.6% or 5 of the total 138 families live below the poverty line. Families with no children have the highest poverty rate of 5.4%, comprising of 5 families. On the other hand, families with 1 or 2 children have the lowest poverty rate of 0.0%, which includes 0 families.
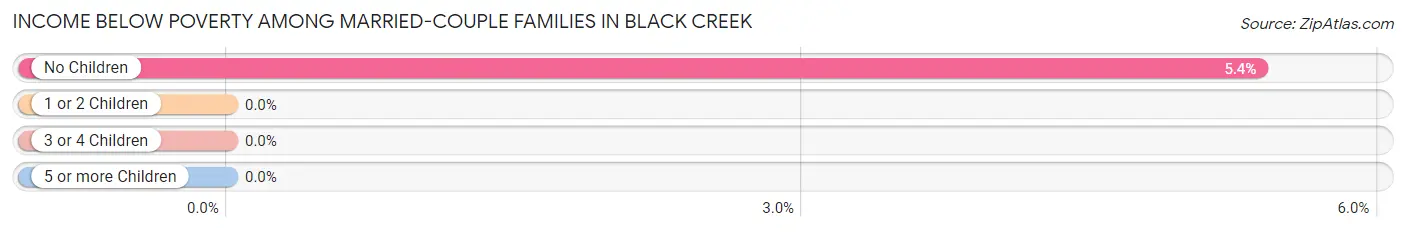
| Children | Above Poverty | Below Poverty |
| No Children | 88 (94.6%) | 5 (5.4%) |
| 1 or 2 Children | 30 (100.0%) | 0 (0.0%) |
| 3 or 4 Children | 15 (100.0%) | 0 (0.0%) |
| 5 or more Children | 0 (0.0%) | 0 (0.0%) |
| Total | 133 (96.4%) | 5 (3.6%) |
Income Below Poverty Among Single-Parent Households in Black Creek
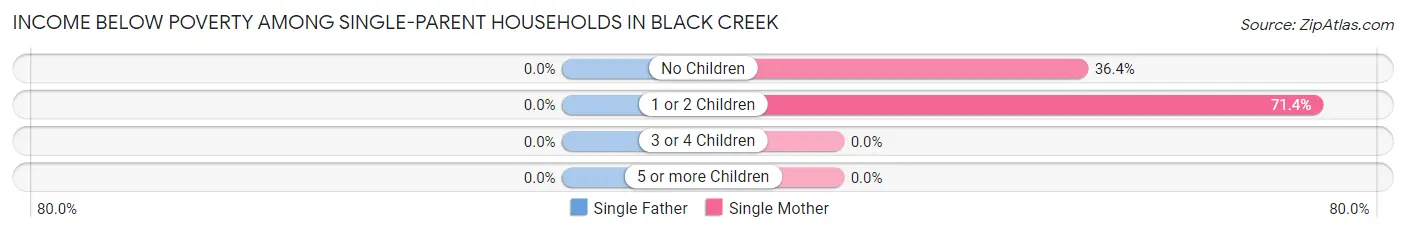
| Children | Single Father | Single Mother |
| No Children | 0 (0.0%) | 8 (36.4%) |
| 1 or 2 Children | 0 (0.0%) | 5 (71.4%) |
| 3 or 4 Children | 0 (0.0%) | 0 (0.0%) |
| 5 or more Children | 0 (0.0%) | 0 (0.0%) |
| Total | 0 (0.0%) | 13 (38.2%) |
Income Below Poverty Among Married-Couple vs Single-Parent Households in Black Creek
The poverty data for Black Creek shows that 5 of the married-couple family households (3.6%) and 13 of the single-parent households (29.5%) are living below the poverty level. Within the married-couple family households, those with no children have the highest poverty rate, with 5 households (5.4%) falling below the poverty line. Among the single-parent households, those with 1 or 2 children have the highest poverty rate, with 5 household (35.7%) living below poverty.
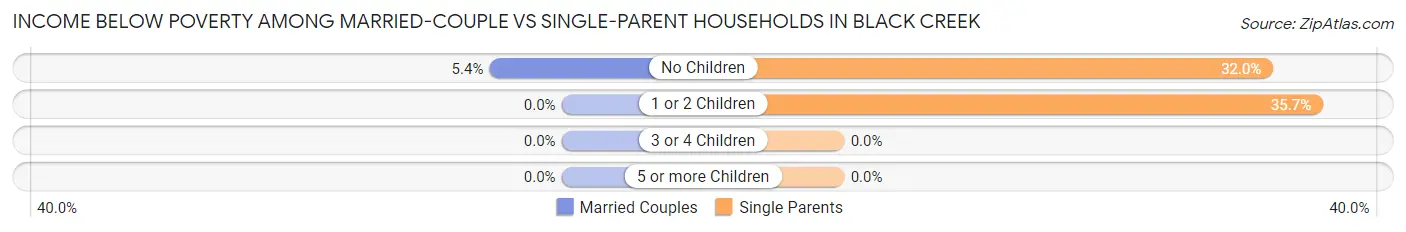
| Children | Married-Couple Families | Single-Parent Households |
| No Children | 5 (5.4%) | 8 (32.0%) |
| 1 or 2 Children | 0 (0.0%) | 5 (35.7%) |
| 3 or 4 Children | 0 (0.0%) | 0 (0.0%) |
| 5 or more Children | 0 (0.0%) | 0 (0.0%) |
| Total | 5 (3.6%) | 13 (29.5%) |
Race in Black Creek
The most populous races in Black Creek are White / Caucasian (563 | 74.3%), Black / African American (144 | 19.0%), and Two or more Races (25 | 3.3%).
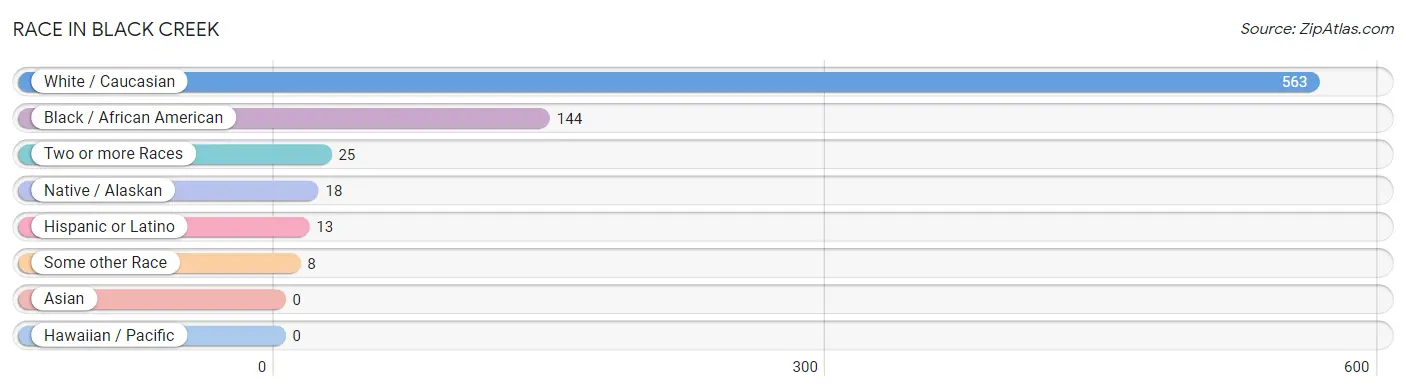
| Race | # Population | % Population |
| Asian | 0 | 0.0% |
| Black / African American | 144 | 19.0% |
| Hawaiian / Pacific | 0 | 0.0% |
| Hispanic or Latino | 13 | 1.7% |
| Native / Alaskan | 18 | 2.4% |
| White / Caucasian | 563 | 74.3% |
| Two or more Races | 25 | 3.3% |
| Some other Race | 8 | 1.1% |
| Total | 758 | 100.0% |
Ancestry in Black Creek
The most populous ancestries reported in Black Creek are American (205 | 27.0%), English (121 | 16.0%), Irish (42 | 5.5%), Italian (27 | 3.6%), and Scottish (19 | 2.5%), together accounting for 54.6% of all Black Creek residents.
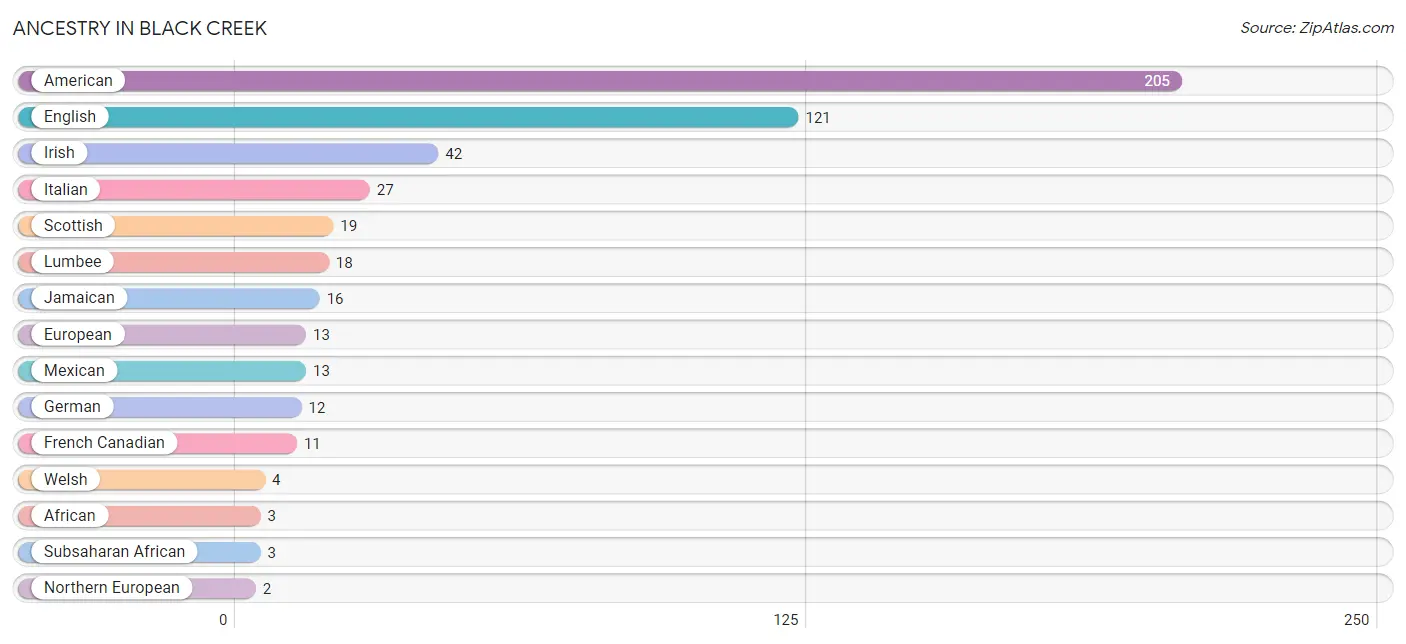
| Ancestry | # Population | % Population |
| African | 3 | 0.4% |
| American | 205 | 27.0% |
| Dutch | 1 | 0.1% |
| English | 121 | 16.0% |
| European | 13 | 1.7% |
| French Canadian | 11 | 1.5% |
| German | 12 | 1.6% |
| Irish | 42 | 5.5% |
| Italian | 27 | 3.6% |
| Jamaican | 16 | 2.1% |
| Lumbee | 18 | 2.4% |
| Mexican | 13 | 1.7% |
| Northern European | 2 | 0.3% |
| Scottish | 19 | 2.5% |
| Subsaharan African | 3 | 0.4% |
| Welsh | 4 | 0.5% | View All 16 Rows |
Immigrants in Black Creek
The most numerous immigrant groups reported in Black Creek came from Latin America (22 | 2.9%), Caribbean (14 | 1.8%), Jamaica (14 | 1.8%), Central America (8 | 1.1%), and Nicaragua (8 | 1.1%), together accounting for 8.7% of all Black Creek residents.
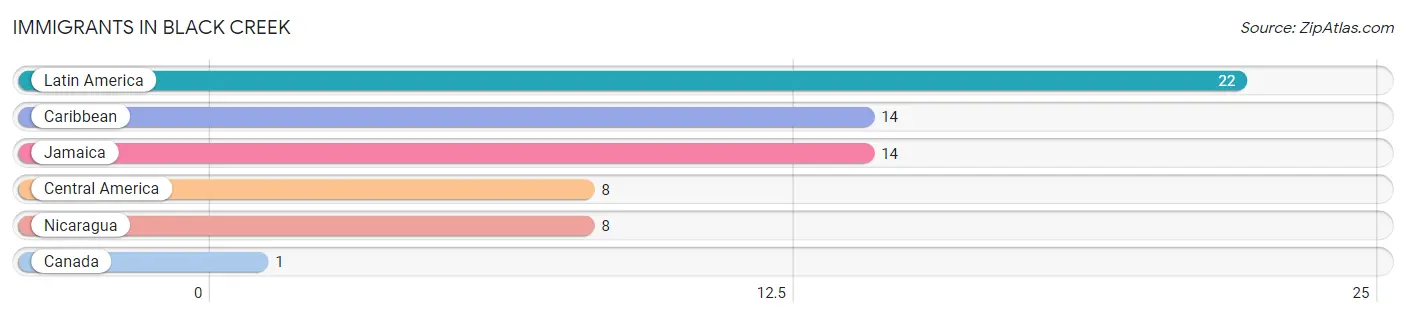
| Immigration Origin | # Population | % Population |
| Canada | 1 | 0.1% |
| Caribbean | 14 | 1.8% |
| Central America | 8 | 1.1% |
| Jamaica | 14 | 1.8% |
| Latin America | 22 | 2.9% |
| Nicaragua | 8 | 1.1% | View All 6 Rows |
Sex and Age in Black Creek
Sex and Age in Black Creek
The most populous age groups in Black Creek are 20 to 24 Years (69 | 17.8%) for men and 50 to 54 Years (48 | 12.9%) for women.
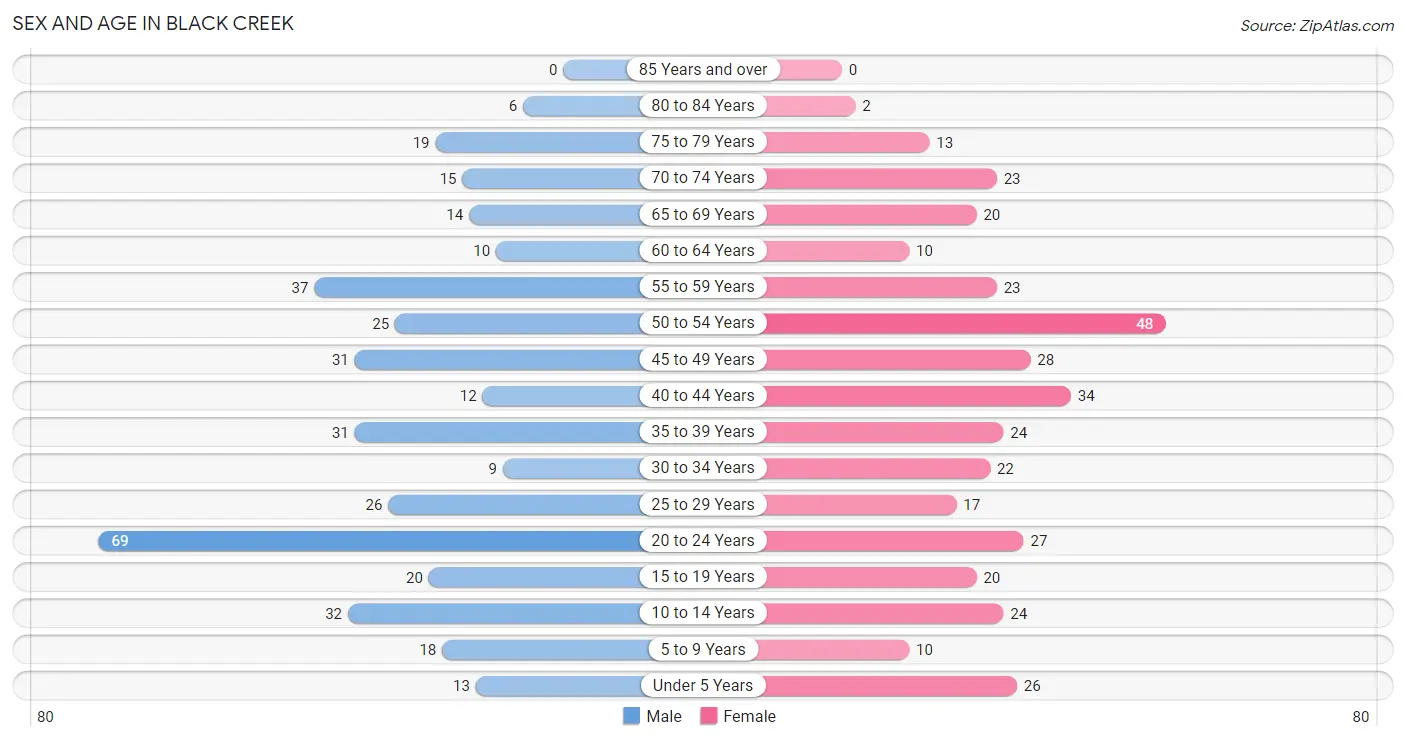
| Age Bracket | Male | Female |
| Under 5 Years | 13 (3.4%) | 26 (7.0%) |
| 5 to 9 Years | 18 (4.6%) | 10 (2.7%) |
| 10 to 14 Years | 32 (8.3%) | 24 (6.5%) |
| 15 to 19 Years | 20 (5.2%) | 20 (5.4%) |
| 20 to 24 Years | 69 (17.8%) | 27 (7.3%) |
| 25 to 29 Years | 26 (6.7%) | 17 (4.6%) |
| 30 to 34 Years | 9 (2.3%) | 22 (5.9%) |
| 35 to 39 Years | 31 (8.0%) | 24 (6.5%) |
| 40 to 44 Years | 12 (3.1%) | 34 (9.2%) |
| 45 to 49 Years | 31 (8.0%) | 28 (7.5%) |
| 50 to 54 Years | 25 (6.5%) | 48 (12.9%) |
| 55 to 59 Years | 37 (9.6%) | 23 (6.2%) |
| 60 to 64 Years | 10 (2.6%) | 10 (2.7%) |
| 65 to 69 Years | 14 (3.6%) | 20 (5.4%) |
| 70 to 74 Years | 15 (3.9%) | 23 (6.2%) |
| 75 to 79 Years | 19 (4.9%) | 13 (3.5%) |
| 80 to 84 Years | 6 (1.5%) | 2 (0.5%) |
| 85 Years and over | 0 (0.0%) | 0 (0.0%) |
| Total | 387 (100.0%) | 371 (100.0%) |
Families and Households in Black Creek
Median Family Size in Black Creek
The median family size in Black Creek is 3.36 persons per family, with single female/mother families (34 | 18.7%) accounting for the largest median family size of 3.74 persons per family. On the other hand, single male/father families (10 | 5.5%) represent the smallest median family size with 3.20 persons per family.
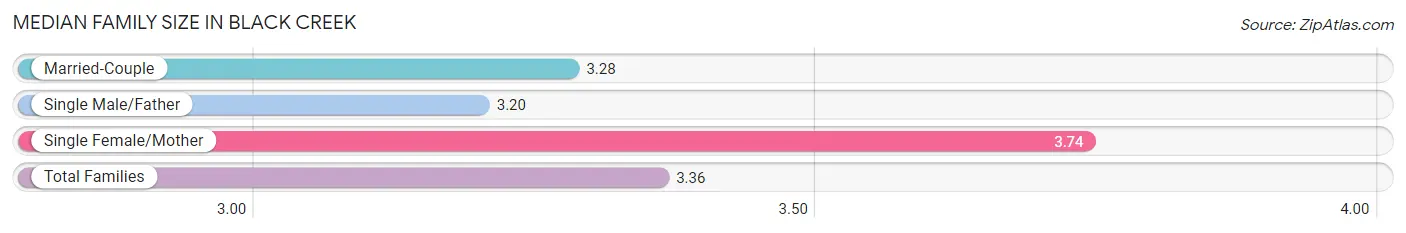
| Family Type | # Families | Family Size |
| Married-Couple | 138 (75.8%) | 3.28 |
| Single Male/Father | 10 (5.5%) | 3.20 |
| Single Female/Mother | 34 (18.7%) | 3.74 |
| Total Families | 182 (100.0%) | 3.36 |
Median Household Size in Black Creek
The median household size in Black Creek is 2.69 persons per household, with single female/mother households (34 | 12.1%) accounting for the largest median household size of 4.03 persons per household. non-family households (100 | 35.5%) represent the smallest median household size with 1.36 persons per household.
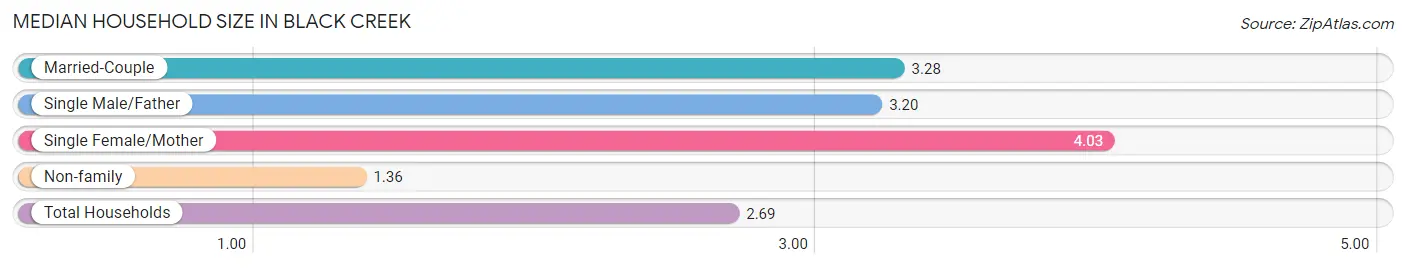
| Household Type | # Households | Household Size |
| Married-Couple | 138 (48.9%) | 3.28 |
| Single Male/Father | 10 (3.5%) | 3.20 |
| Single Female/Mother | 34 (12.1%) | 4.03 |
| Non-family | 100 (35.5%) | 1.36 |
| Total Households | 282 (100.0%) | 2.69 |
Household Size by Marriage Status in Black Creek
Out of a total of 282 households in Black Creek, 182 (64.5%) are family households, while 100 (35.5%) are nonfamily households. The most numerous type of family households are 3-person households, comprising 75, and the most common type of nonfamily households are 1-person households, comprising 73.
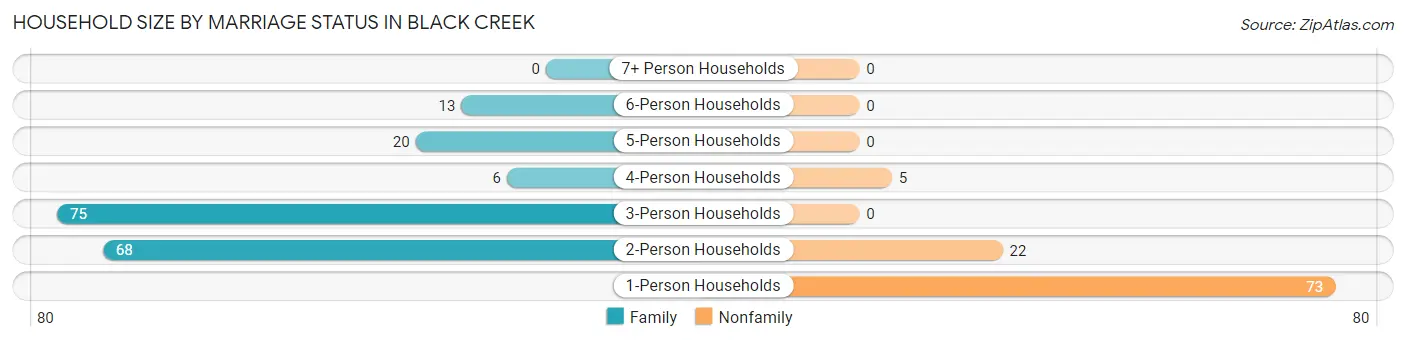
| Household Size | Family Households | Nonfamily Households |
| 1-Person Households | - | 73 (25.9%) |
| 2-Person Households | 68 (24.1%) | 22 (7.8%) |
| 3-Person Households | 75 (26.6%) | 0 (0.0%) |
| 4-Person Households | 6 (2.1%) | 5 (1.8%) |
| 5-Person Households | 20 (7.1%) | 0 (0.0%) |
| 6-Person Households | 13 (4.6%) | 0 (0.0%) |
| 7+ Person Households | 0 (0.0%) | 0 (0.0%) |
| Total | 182 (64.5%) | 100 (35.5%) |
Female Fertility in Black Creek
Fertility by Age in Black Creek
| Age Bracket | Women with Births | Births / 1,000 Women |
| 15 to 19 years | 0 (0.0%) | 0.0 |
| 20 to 34 years | 0 (0.0%) | 0.0 |
| 35 to 50 years | 0 (0.0%) | 0.0 |
| Total | 0 (0.0%) | 0.0 |
Fertility by Age by Marriage Status in Black Creek
| Age Bracket | Married | Unmarried |
| 15 to 19 years | 0 (0.0%) | 0 (0.0%) |
| 20 to 34 years | 0 (0.0%) | 0 (0.0%) |
| 35 to 50 years | 0 (0.0%) | 0 (0.0%) |
| Total | 0 (0.0%) | 0 (0.0%) |
Fertility by Education in Black Creek
| Educational Attainment | Women with Births | Births / 1,000 Women |
| Less than High School | 0 (0.0%) | 0.0 |
| High School Diploma | 0 (0.0%) | 0.0 |
| College or Associate's Degree | 0 (0.0%) | 0.0 |
| Bachelor's Degree | 0 (0.0%) | 0.0 |
| Graduate Degree | 0 (0.0%) | 0.0 |
| Total | 0 (0.0%) | 0.0 |
Fertility by Education by Marriage Status in Black Creek
| Educational Attainment | Married | Unmarried |
| Less than High School | 0 (0.0%) | 0 (0.0%) |
| High School Diploma | 0 (0.0%) | 0 (0.0%) |
| College or Associate's Degree | 0 (0.0%) | 0 (0.0%) |
| Bachelor's Degree | 0 (0.0%) | 0 (0.0%) |
| Graduate Degree | 0 (0.0%) | 0 (0.0%) |
| Total | 0 (0.0%) | 0 (0.0%) |
Employment Characteristics in Black Creek
Employment by Class of Employer in Black Creek
Among the 373 employed individuals in Black Creek, private company employees (246 | 65.9%), local government employees (54 | 14.5%), and state government employees (31 | 8.3%) make up the most common classes of employment.
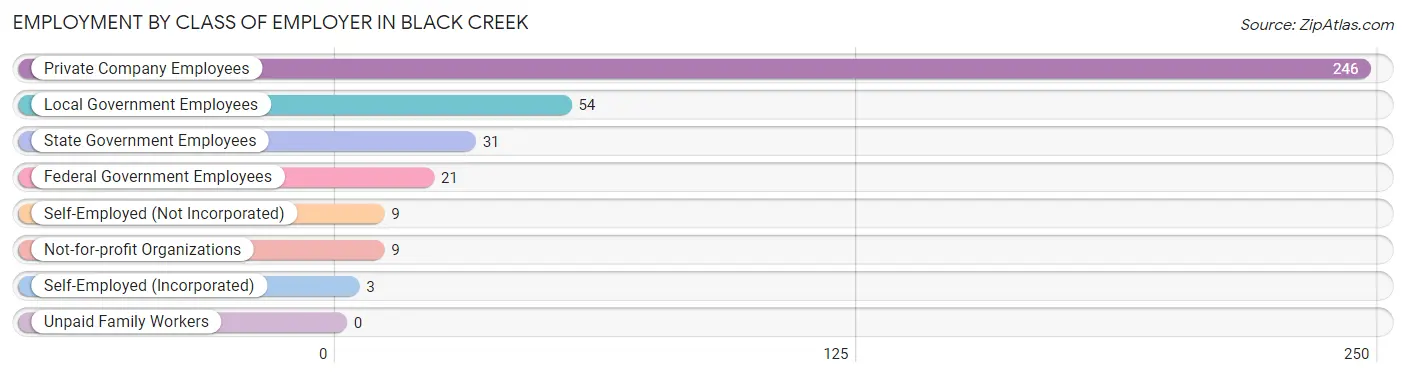
| Employer Class | # Employees | % Employees |
| Private Company Employees | 246 | 65.9% |
| Self-Employed (Incorporated) | 3 | 0.8% |
| Self-Employed (Not Incorporated) | 9 | 2.4% |
| Not-for-profit Organizations | 9 | 2.4% |
| Local Government Employees | 54 | 14.5% |
| State Government Employees | 31 | 8.3% |
| Federal Government Employees | 21 | 5.6% |
| Unpaid Family Workers | 0 | 0.0% |
| Total | 373 | 100.0% |
Employment Status by Age in Black Creek
According to the labor force statistics for Black Creek, out of the total population over 16 years of age (630), 67.0% or 422 individuals are in the labor force, with 9.7% or 41 of them unemployed. The age group with the highest labor force participation rate is 25 to 29 years, with 100.0% or 43 individuals in the labor force. Within the labor force, the 16 to 19 years age range has the highest percentage of unemployed individuals, with 33.3% or 2 of them being unemployed.
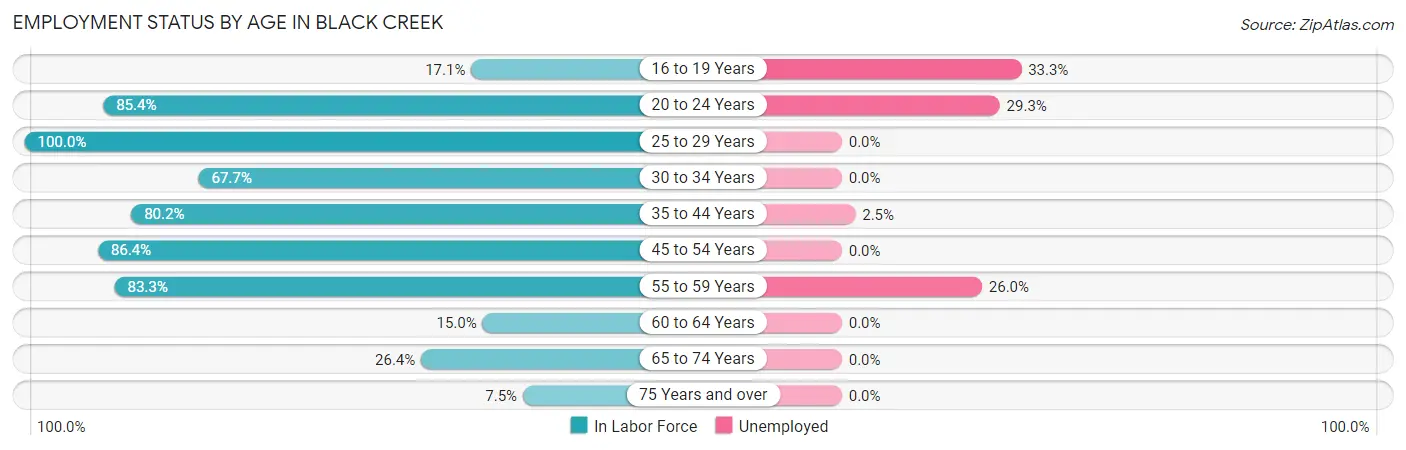
| Age Bracket | In Labor Force | Unemployed |
| 16 to 19 Years | 6 (17.1%) | 2 (33.3%) |
| 20 to 24 Years | 82 (85.4%) | 24 (29.3%) |
| 25 to 29 Years | 43 (100.0%) | 0 (0.0%) |
| 30 to 34 Years | 21 (67.7%) | 0 (0.0%) |
| 35 to 44 Years | 81 (80.2%) | 2 (2.5%) |
| 45 to 54 Years | 114 (86.4%) | 0 (0.0%) |
| 55 to 59 Years | 50 (83.3%) | 13 (26.0%) |
| 60 to 64 Years | 3 (15.0%) | 0 (0.0%) |
| 65 to 74 Years | 19 (26.4%) | 0 (0.0%) |
| 75 Years and over | 3 (7.5%) | 0 (0.0%) |
| Total | 422 (67.0%) | 41 (9.7%) |
Employment Status by Educational Attainment in Black Creek
According to labor force statistics for Black Creek, 80.6% of individuals (312) out of the total population between 25 and 64 years of age (387) are in the labor force, with 4.8% or 15 of them being unemployed. The group with the highest labor force participation rate are those with the educational attainment of college / associate degree, with 90.2% or 165 individuals in the labor force. Within the labor force, individuals with college / associate degree education have the highest percentage of unemployment, with 7.9% or 13 of them being unemployed.
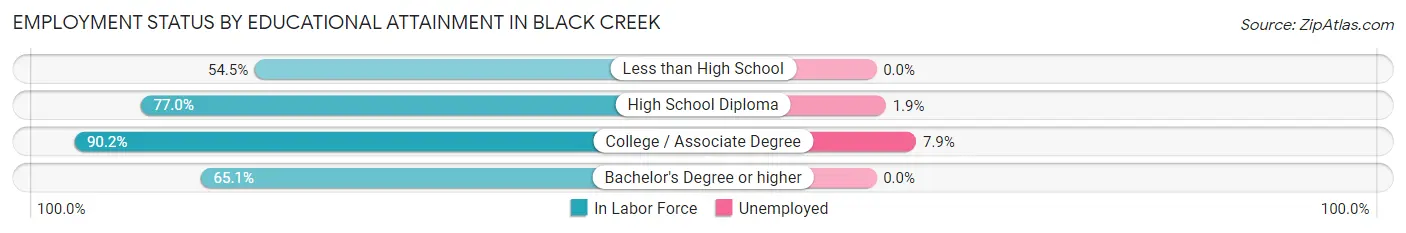
| Educational Attainment | In Labor Force | Unemployed |
| Less than High School | 12 (54.5%) | 0 (0.0%) |
| High School Diploma | 107 (77.0%) | 3 (1.9%) |
| College / Associate Degree | 165 (90.2%) | 14 (7.9%) |
| Bachelor's Degree or higher | 28 (65.1%) | 0 (0.0%) |
| Total | 312 (80.6%) | 19 (4.8%) |
Employment Occupations by Sex in Black Creek
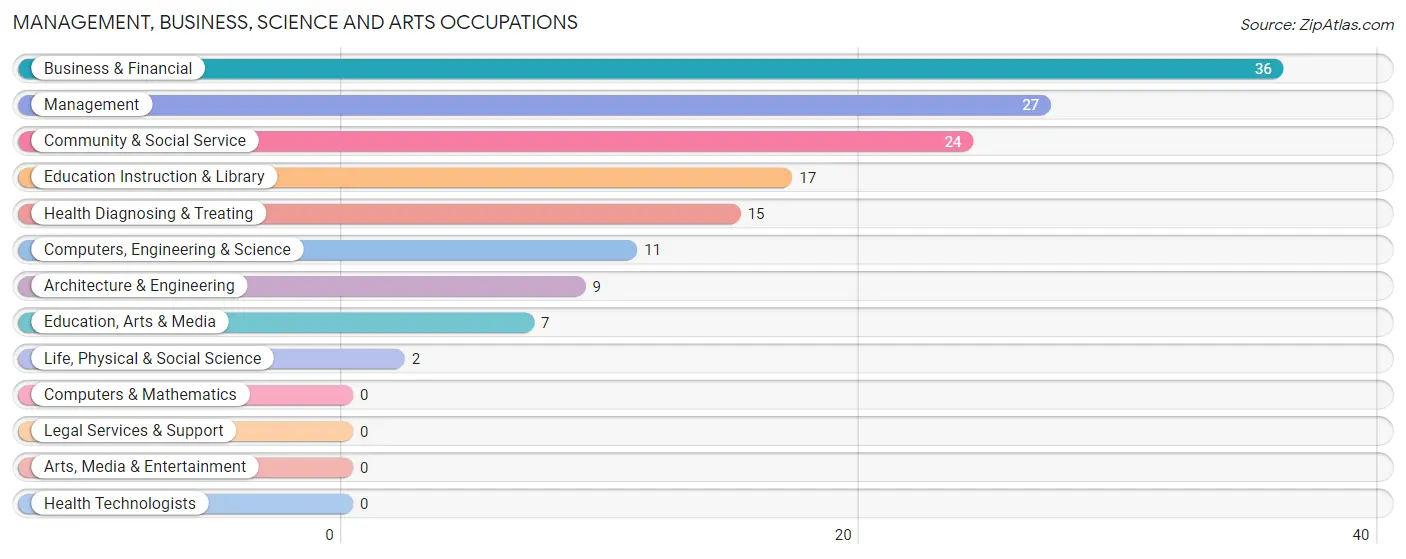
Management, Business, Science and Arts Occupations
The most common Management, Business, Science and Arts occupations in Black Creek are Business & Financial (36 | 9.5%), Management (27 | 7.1%), Community & Social Service (24 | 6.3%), Education Instruction & Library (17 | 4.5%), and Health Diagnosing & Treating (15 | 3.9%).
Management, Business, Science and Arts Occupations by Sex
Within the Management, Business, Science and Arts occupations in Black Creek, the most male-oriented occupations are Computers, Engineering & Science (100.0%), Architecture & Engineering (100.0%), and Life, Physical & Social Science (100.0%), while the most female-oriented occupations are Business & Financial (100.0%), Education Instruction & Library (76.5%), and Health Diagnosing & Treating (66.7%).
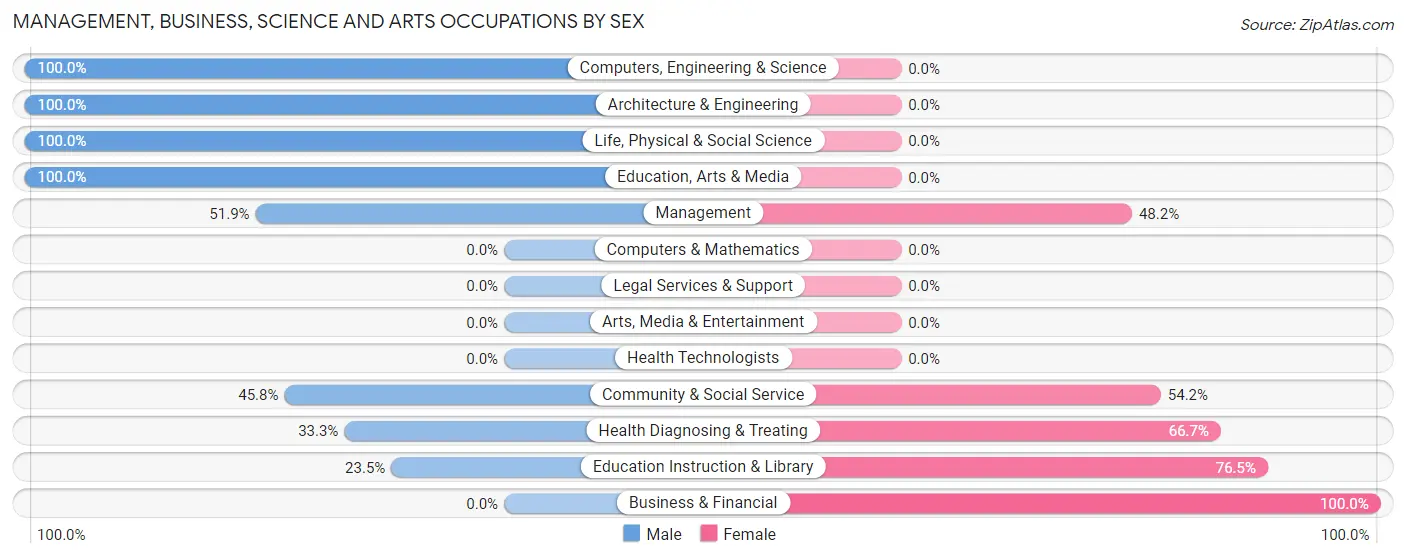
| Occupation | Male | Female |
| Management | 14 (51.8%) | 13 (48.1%) |
| Business & Financial | 0 (0.0%) | 36 (100.0%) |
| Computers, Engineering & Science | 11 (100.0%) | 0 (0.0%) |
| Computers & Mathematics | 0 (0.0%) | 0 (0.0%) |
| Architecture & Engineering | 9 (100.0%) | 0 (0.0%) |
| Life, Physical & Social Science | 2 (100.0%) | 0 (0.0%) |
| Community & Social Service | 11 (45.8%) | 13 (54.2%) |
| Education, Arts & Media | 7 (100.0%) | 0 (0.0%) |
| Legal Services & Support | 0 (0.0%) | 0 (0.0%) |
| Education Instruction & Library | 4 (23.5%) | 13 (76.5%) |
| Arts, Media & Entertainment | 0 (0.0%) | 0 (0.0%) |
| Health Diagnosing & Treating | 5 (33.3%) | 10 (66.7%) |
| Health Technologists | 0 (0.0%) | 0 (0.0%) |
| Total (Category) | 41 (36.3%) | 72 (63.7%) |
| Total (Overall) | 198 (52.0%) | 183 (48.0%) |
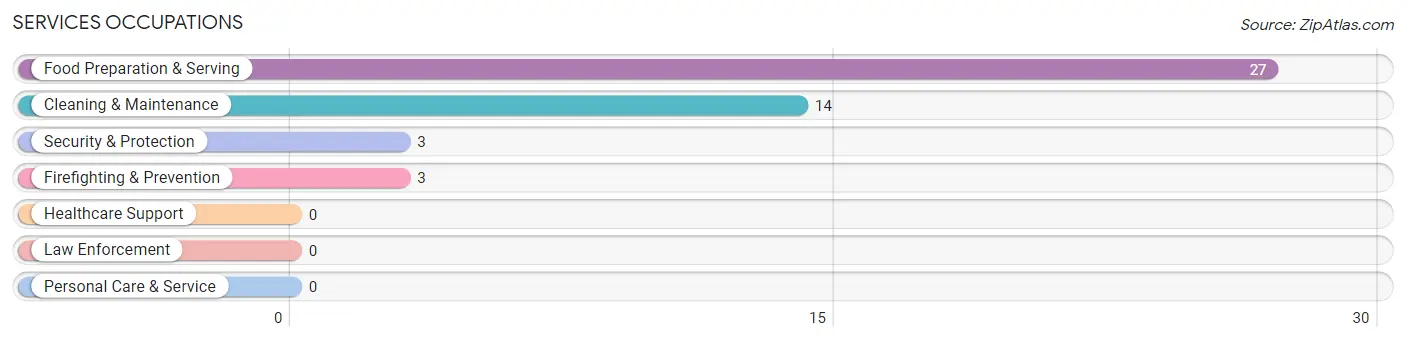
Services Occupations
The most common Services occupations in Black Creek are Food Preparation & Serving (27 | 7.1%), Cleaning & Maintenance (14 | 3.7%), Security & Protection (3 | 0.8%), and Firefighting & Prevention (3 | 0.8%).
Services Occupations by Sex
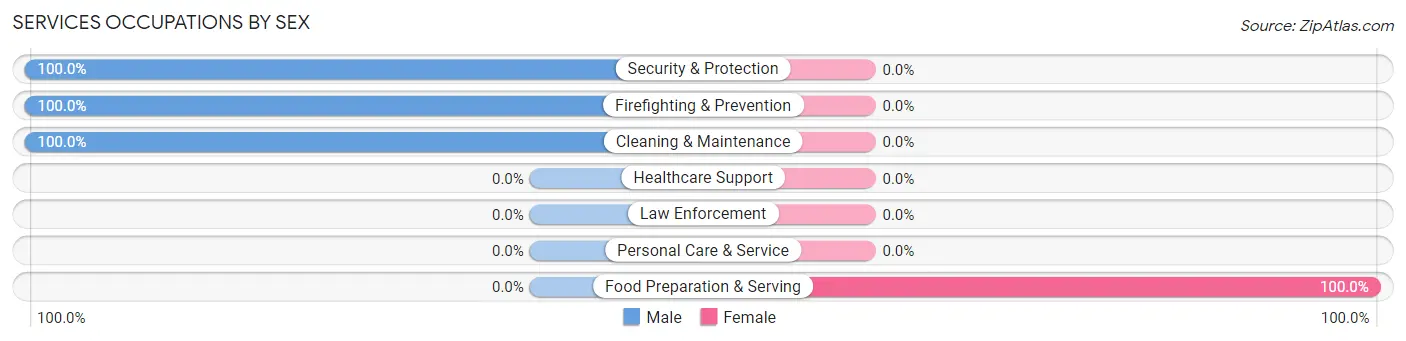
| Occupation | Male | Female |
| Healthcare Support | 0 (0.0%) | 0 (0.0%) |
| Security & Protection | 3 (100.0%) | 0 (0.0%) |
| Firefighting & Prevention | 3 (100.0%) | 0 (0.0%) |
| Law Enforcement | 0 (0.0%) | 0 (0.0%) |
| Food Preparation & Serving | 0 (0.0%) | 27 (100.0%) |
| Cleaning & Maintenance | 14 (100.0%) | 0 (0.0%) |
| Personal Care & Service | 0 (0.0%) | 0 (0.0%) |
| Total (Category) | 17 (38.6%) | 27 (61.4%) |
| Total (Overall) | 198 (52.0%) | 183 (48.0%) |
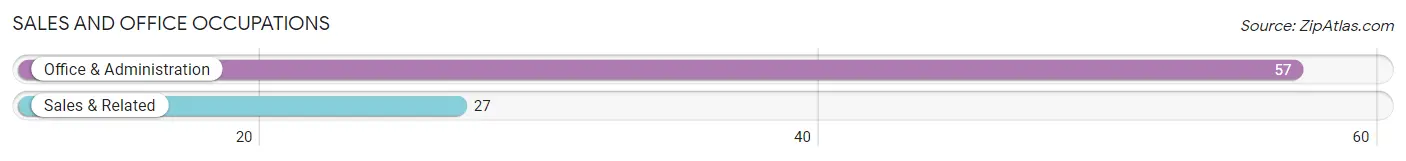
Sales and Office Occupations
The most common Sales and Office occupations in Black Creek are Office & Administration (57 | 15.0%), and Sales & Related (27 | 7.1%).
Sales and Office Occupations by Sex
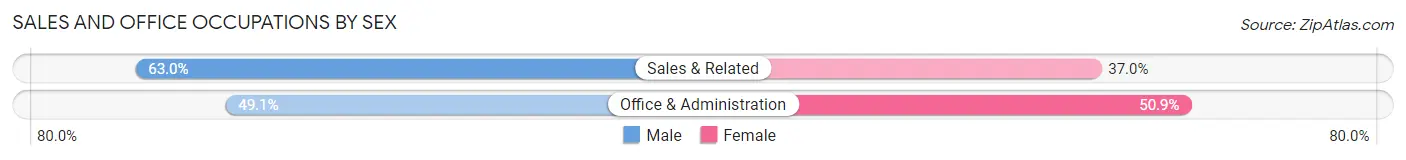
| Occupation | Male | Female |
| Sales & Related | 17 (63.0%) | 10 (37.0%) |
| Office & Administration | 28 (49.1%) | 29 (50.9%) |
| Total (Category) | 45 (53.6%) | 39 (46.4%) |
| Total (Overall) | 198 (52.0%) | 183 (48.0%) |
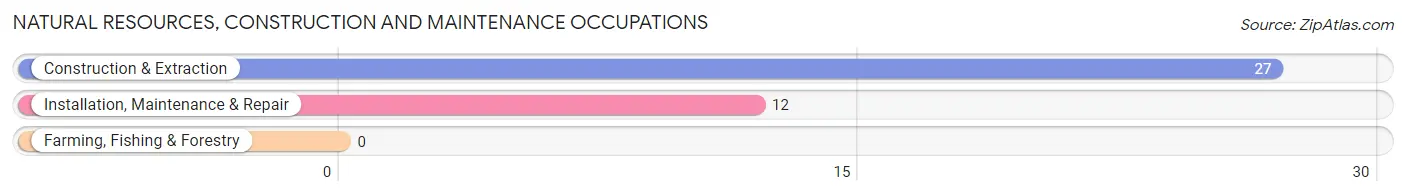
Natural Resources, Construction and Maintenance Occupations
The most common Natural Resources, Construction and Maintenance occupations in Black Creek are Construction & Extraction (27 | 7.1%), and Installation, Maintenance & Repair (12 | 3.2%).
Natural Resources, Construction and Maintenance Occupations by Sex
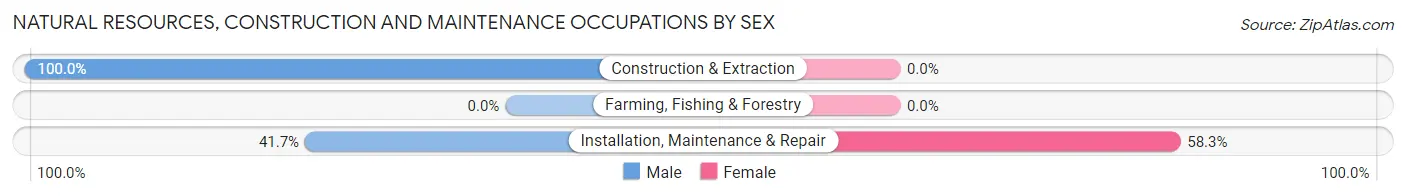
| Occupation | Male | Female |
| Farming, Fishing & Forestry | 0 (0.0%) | 0 (0.0%) |
| Construction & Extraction | 27 (100.0%) | 0 (0.0%) |
| Installation, Maintenance & Repair | 5 (41.7%) | 7 (58.3%) |
| Total (Category) | 32 (82.1%) | 7 (17.9%) |
| Total (Overall) | 198 (52.0%) | 183 (48.0%) |
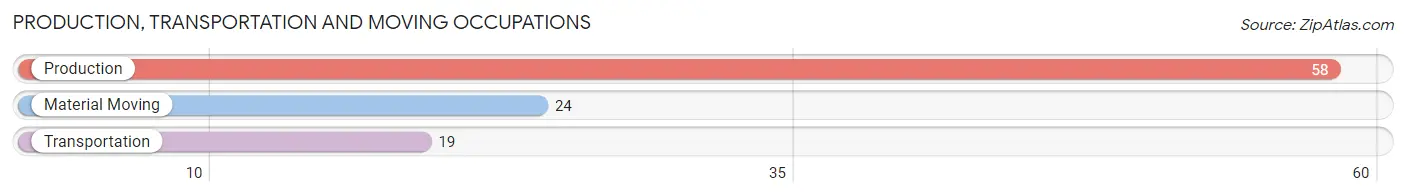
Production, Transportation and Moving Occupations
The most common Production, Transportation and Moving occupations in Black Creek are Production (58 | 15.2%), Material Moving (24 | 6.3%), and Transportation (19 | 5.0%).
Production, Transportation and Moving Occupations by Sex
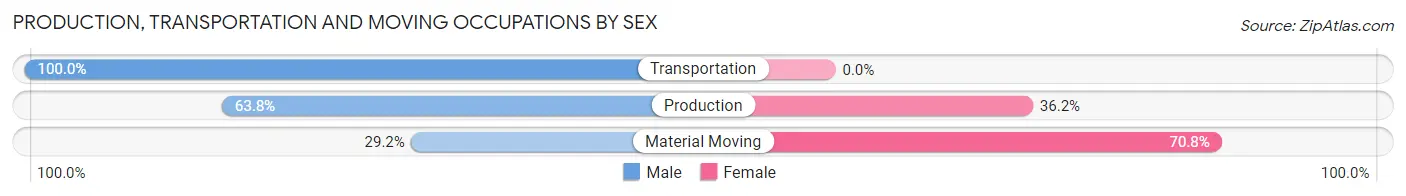
| Occupation | Male | Female |
| Production | 37 (63.8%) | 21 (36.2%) |
| Transportation | 19 (100.0%) | 0 (0.0%) |
| Material Moving | 7 (29.2%) | 17 (70.8%) |
| Total (Category) | 63 (62.4%) | 38 (37.6%) |
| Total (Overall) | 198 (52.0%) | 183 (48.0%) |
Employment Industries by Sex in Black Creek
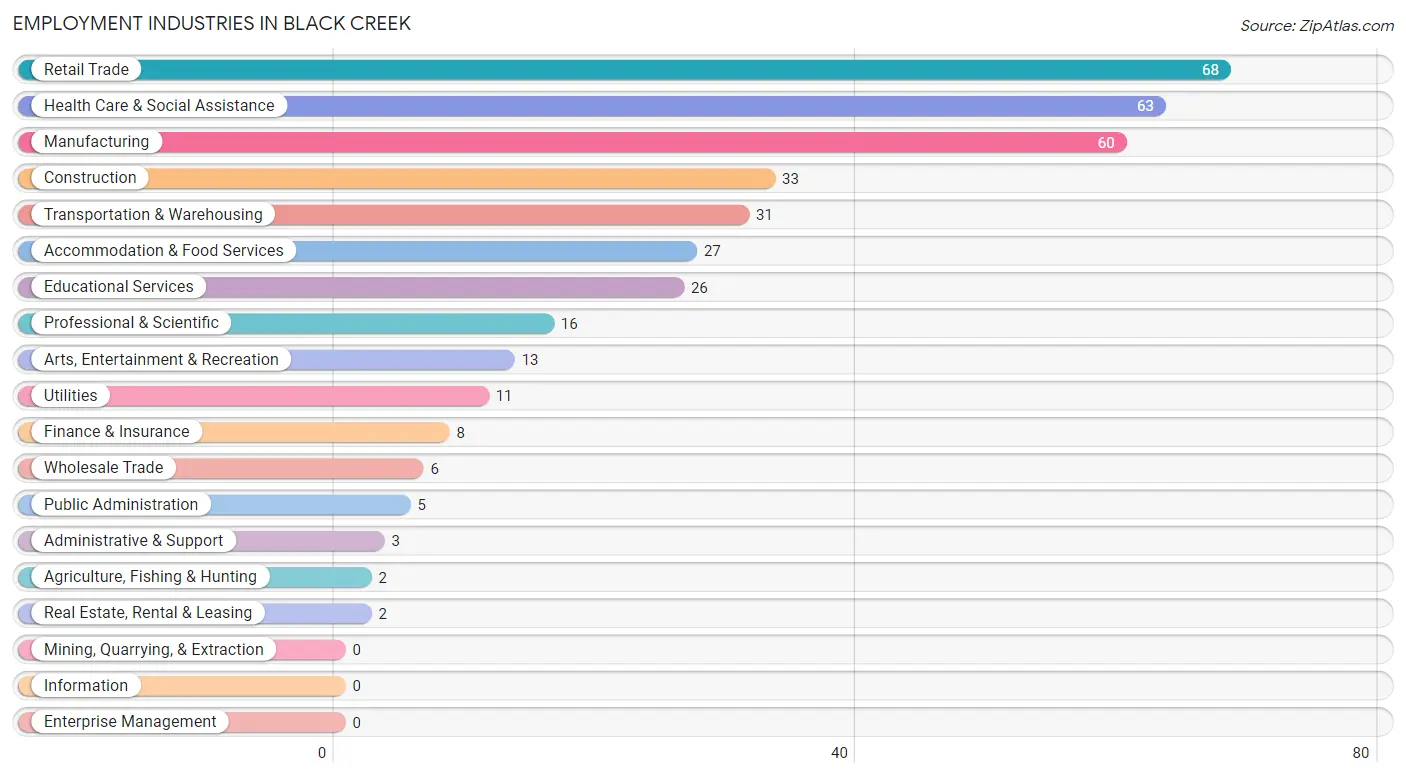
Employment Industries in Black Creek
The major employment industries in Black Creek include Retail Trade (68 | 17.8%), Health Care & Social Assistance (63 | 16.5%), Manufacturing (60 | 15.8%), Construction (33 | 8.7%), and Transportation & Warehousing (31 | 8.1%).
Employment Industries by Sex in Black Creek
The Black Creek industries that see more men than women are Agriculture, Fishing & Hunting (100.0%), Wholesale Trade (100.0%), and Administrative & Support (100.0%), whereas the industries that tend to have a higher number of women are Real Estate, Rental & Leasing (100.0%), Accommodation & Food Services (100.0%), and Educational Services (84.6%).
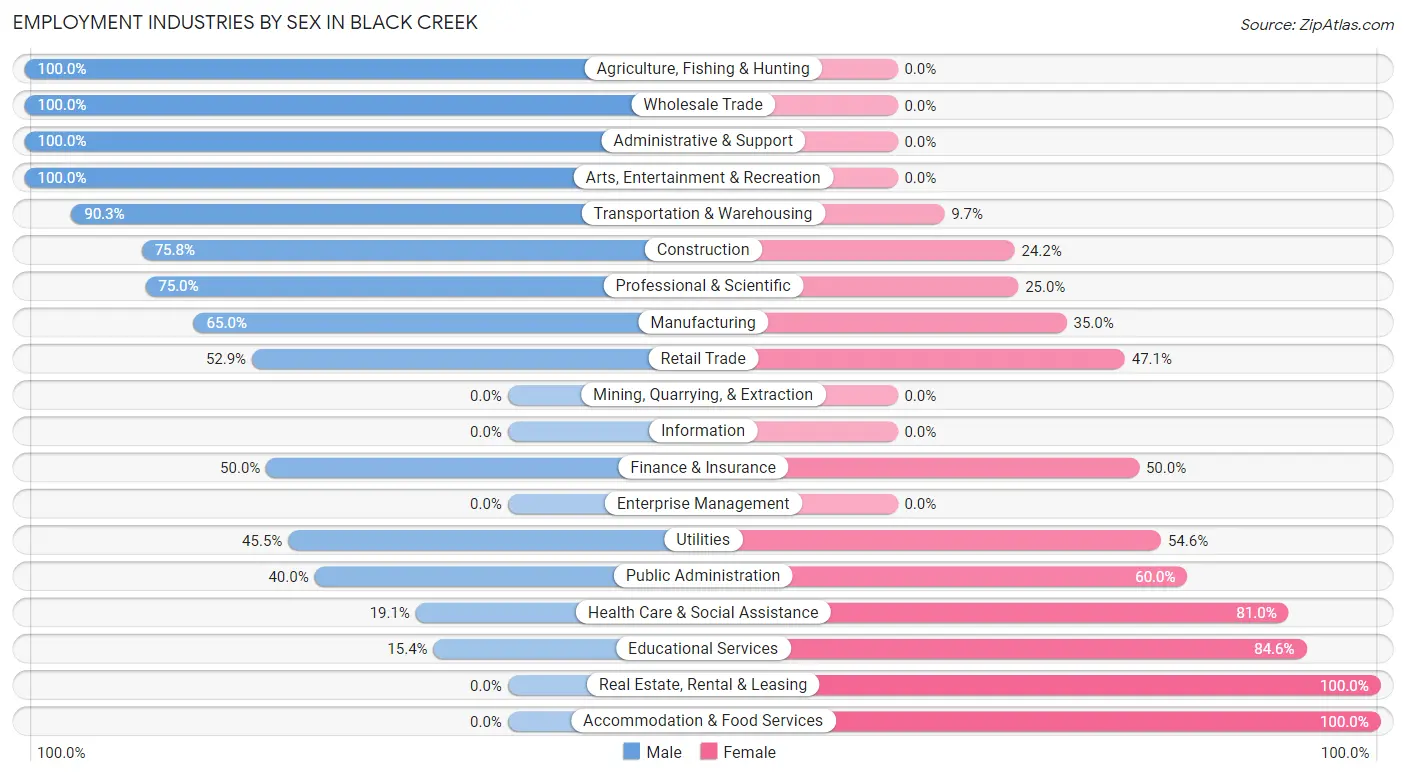
| Industry | Male | Female |
| Agriculture, Fishing & Hunting | 2 (100.0%) | 0 (0.0%) |
| Mining, Quarrying, & Extraction | 0 (0.0%) | 0 (0.0%) |
| Construction | 25 (75.8%) | 8 (24.2%) |
| Manufacturing | 39 (65.0%) | 21 (35.0%) |
| Wholesale Trade | 6 (100.0%) | 0 (0.0%) |
| Retail Trade | 36 (52.9%) | 32 (47.1%) |
| Transportation & Warehousing | 28 (90.3%) | 3 (9.7%) |
| Utilities | 5 (45.5%) | 6 (54.5%) |
| Information | 0 (0.0%) | 0 (0.0%) |
| Finance & Insurance | 4 (50.0%) | 4 (50.0%) |
| Real Estate, Rental & Leasing | 0 (0.0%) | 2 (100.0%) |
| Professional & Scientific | 12 (75.0%) | 4 (25.0%) |
| Enterprise Management | 0 (0.0%) | 0 (0.0%) |
| Administrative & Support | 3 (100.0%) | 0 (0.0%) |
| Educational Services | 4 (15.4%) | 22 (84.6%) |
| Health Care & Social Assistance | 12 (19.1%) | 51 (80.9%) |
| Arts, Entertainment & Recreation | 13 (100.0%) | 0 (0.0%) |
| Accommodation & Food Services | 0 (0.0%) | 27 (100.0%) |
| Public Administration | 2 (40.0%) | 3 (60.0%) |
| Total | 198 (52.0%) | 183 (48.0%) |
Education in Black Creek
School Enrollment in Black Creek
The most common levels of schooling among the 146 students in Black Creek are middle school (44 | 30.1%), elementary school (29 | 19.9%), and high school (28 | 19.2%).
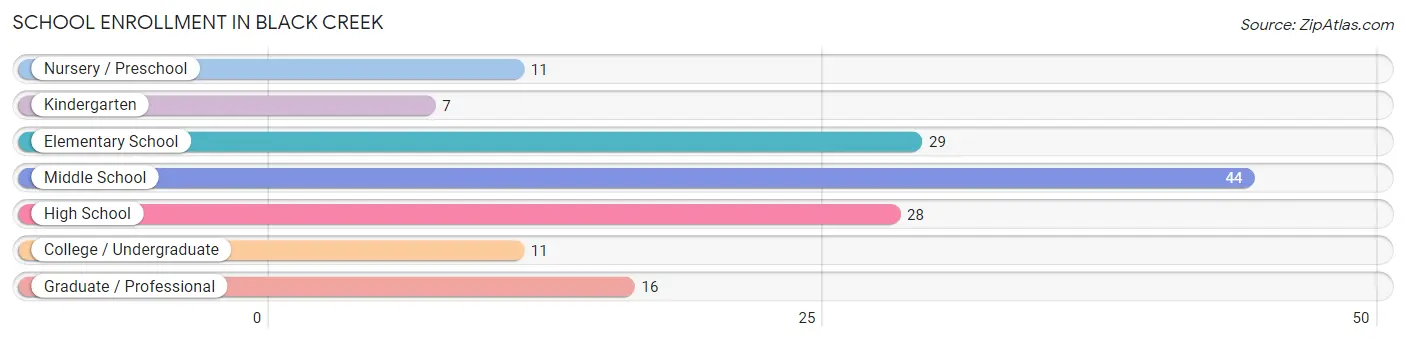
| School Level | # Students | % Students |
| Nursery / Preschool | 11 | 7.5% |
| Kindergarten | 7 | 4.8% |
| Elementary School | 29 | 19.9% |
| Middle School | 44 | 30.1% |
| High School | 28 | 19.2% |
| College / Undergraduate | 11 | 7.5% |
| Graduate / Professional | 16 | 11.0% |
| Total | 146 | 100.0% |
School Enrollment by Age by Funding Source in Black Creek
Out of a total of 146 students who are enrolled in schools in Black Creek, 35 (24.0%) attend a private institution, while the remaining 111 (76.0%) are enrolled in public schools. The age group of 3 to 4 year olds has the highest likelihood of being enrolled in private schools, with 9 (100.0% in the age bracket) enrolled. Conversely, the age group of 15 to 17 year olds has the lowest likelihood of being enrolled in a private school, with 21 (100.0% in the age bracket) attending a public institution.
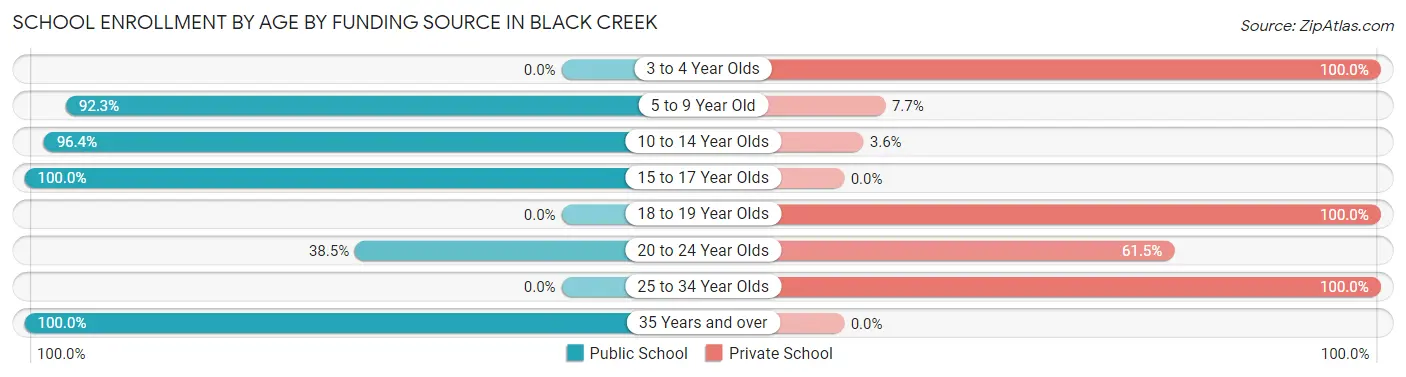
| Age Bracket | Public School | Private School |
| 3 to 4 Year Olds | 0 (0.0%) | 9 (100.0%) |
| 5 to 9 Year Old | 24 (92.3%) | 2 (7.7%) |
| 10 to 14 Year Olds | 54 (96.4%) | 2 (3.6%) |
| 15 to 17 Year Olds | 21 (100.0%) | 0 (0.0%) |
| 18 to 19 Year Olds | 0 (0.0%) | 7 (100.0%) |
| 20 to 24 Year Olds | 5 (38.5%) | 8 (61.5%) |
| 25 to 34 Year Olds | 0 (0.0%) | 7 (100.0%) |
| 35 Years and over | 7 (100.0%) | 0 (0.0%) |
| Total | 111 (76.0%) | 35 (24.0%) |
Educational Attainment by Field of Study in Black Creek
Education (9 | 20.9%), science & technology (7 | 16.3%), business (6 | 14.0%), visual & performing arts (6 | 14.0%), and arts & humanities (5 | 11.6%) are the most common fields of study among 43 individuals in Black Creek who have obtained a bachelor's degree or higher.
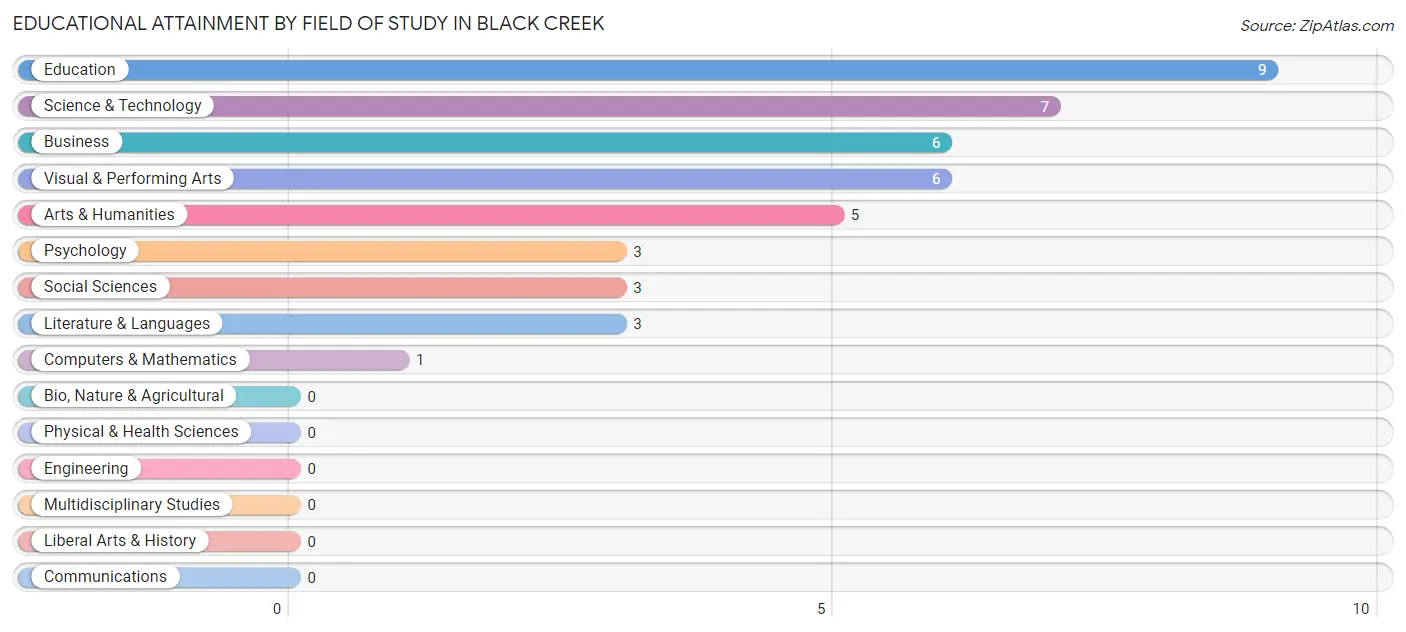
| Field of Study | # Graduates | % Graduates |
| Computers & Mathematics | 1 | 2.3% |
| Bio, Nature & Agricultural | 0 | 0.0% |
| Physical & Health Sciences | 0 | 0.0% |
| Psychology | 3 | 7.0% |
| Social Sciences | 3 | 7.0% |
| Engineering | 0 | 0.0% |
| Multidisciplinary Studies | 0 | 0.0% |
| Science & Technology | 7 | 16.3% |
| Business | 6 | 14.0% |
| Education | 9 | 20.9% |
| Literature & Languages | 3 | 7.0% |
| Liberal Arts & History | 0 | 0.0% |
| Visual & Performing Arts | 6 | 14.0% |
| Communications | 0 | 0.0% |
| Arts & Humanities | 5 | 11.6% |
| Total | 43 | 100.0% |
Transportation & Commute in Black Creek
Vehicle Availability by Sex in Black Creek
The most prevalent vehicle ownership categories in Black Creek are males with 3 vehicles (74, accounting for 37.4%) and females with 3 vehicles (67, making up 42.3%).
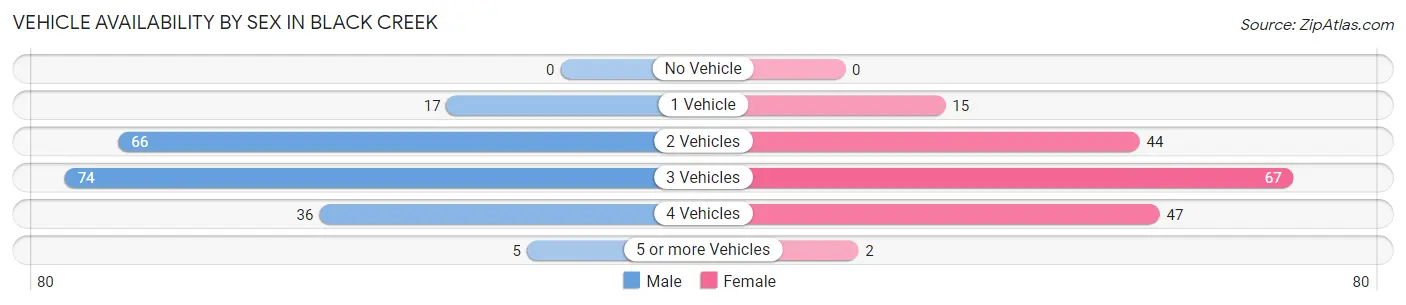
| Vehicles Available | Male | Female |
| No Vehicle | 0 (0.0%) | 0 (0.0%) |
| 1 Vehicle | 17 (8.6%) | 15 (8.6%) |
| 2 Vehicles | 66 (33.3%) | 44 (25.1%) |
| 3 Vehicles | 74 (37.4%) | 67 (38.3%) |
| 4 Vehicles | 36 (18.2%) | 47 (26.9%) |
| 5 or more Vehicles | 5 (2.5%) | 2 (1.1%) |
| Total | 198 (100.0%) | 175 (100.0%) |
Commute Time in Black Creek
The most frequently occuring commute durations in Black Creek are 15 to 19 minutes (106 commuters, 28.9%), 10 to 14 minutes (62 commuters, 16.9%), and 60 to 89 minutes (46 commuters, 12.5%).
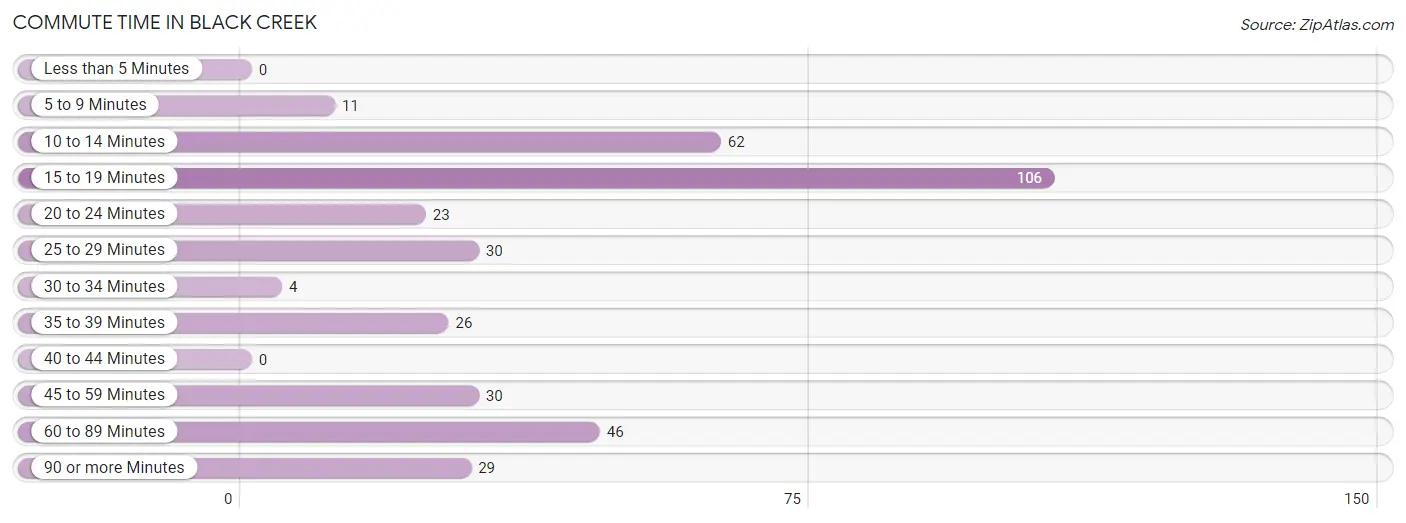
| Commute Time | # Commuters | % Commuters |
| Less than 5 Minutes | 0 | 0.0% |
| 5 to 9 Minutes | 11 | 3.0% |
| 10 to 14 Minutes | 62 | 16.9% |
| 15 to 19 Minutes | 106 | 28.9% |
| 20 to 24 Minutes | 23 | 6.3% |
| 25 to 29 Minutes | 30 | 8.2% |
| 30 to 34 Minutes | 4 | 1.1% |
| 35 to 39 Minutes | 26 | 7.1% |
| 40 to 44 Minutes | 0 | 0.0% |
| 45 to 59 Minutes | 30 | 8.2% |
| 60 to 89 Minutes | 46 | 12.5% |
| 90 or more Minutes | 29 | 7.9% |
Commute Time by Sex in Black Creek
The most common commute times in Black Creek are 10 to 14 minutes (35 commuters, 17.9%) for males and 15 to 19 minutes (72 commuters, 41.9%) for females.
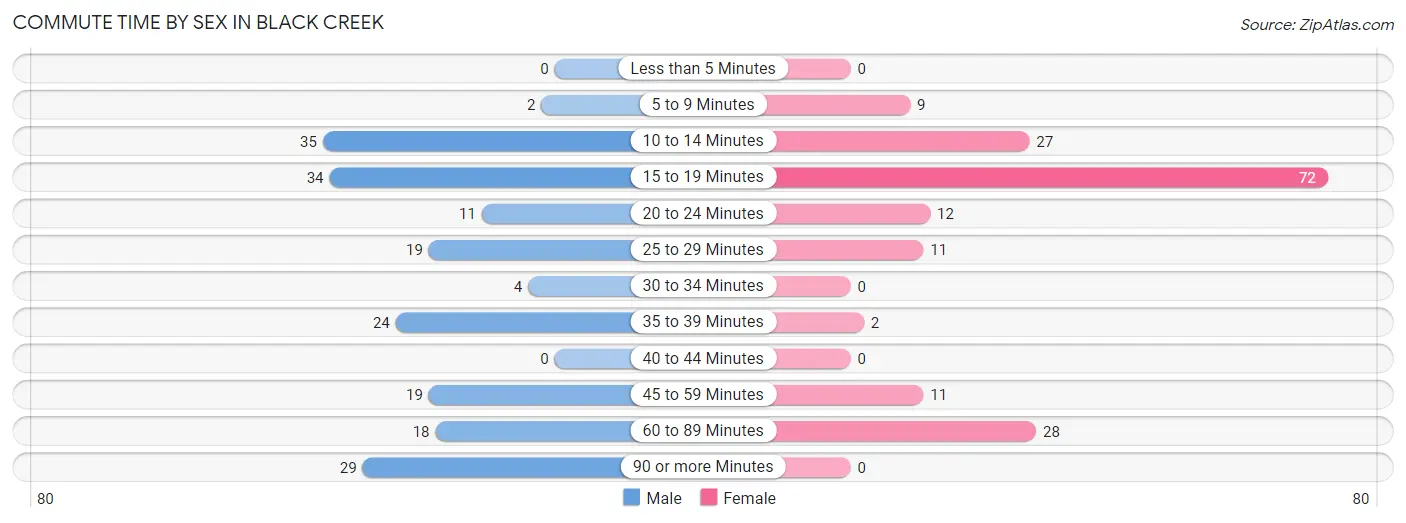
| Commute Time | Male | Female |
| Less than 5 Minutes | 0 (0.0%) | 0 (0.0%) |
| 5 to 9 Minutes | 2 (1.0%) | 9 (5.2%) |
| 10 to 14 Minutes | 35 (17.9%) | 27 (15.7%) |
| 15 to 19 Minutes | 34 (17.4%) | 72 (41.9%) |
| 20 to 24 Minutes | 11 (5.6%) | 12 (7.0%) |
| 25 to 29 Minutes | 19 (9.7%) | 11 (6.4%) |
| 30 to 34 Minutes | 4 (2.1%) | 0 (0.0%) |
| 35 to 39 Minutes | 24 (12.3%) | 2 (1.2%) |
| 40 to 44 Minutes | 0 (0.0%) | 0 (0.0%) |
| 45 to 59 Minutes | 19 (9.7%) | 11 (6.4%) |
| 60 to 89 Minutes | 18 (9.2%) | 28 (16.3%) |
| 90 or more Minutes | 29 (14.9%) | 0 (0.0%) |
Time of Departure to Work by Sex in Black Creek
The most frequent times of departure to work in Black Creek are 6:30 AM to 6:59 AM (48, 24.6%) for males and 7:30 AM to 7:59 AM (62, 36.0%) for females.
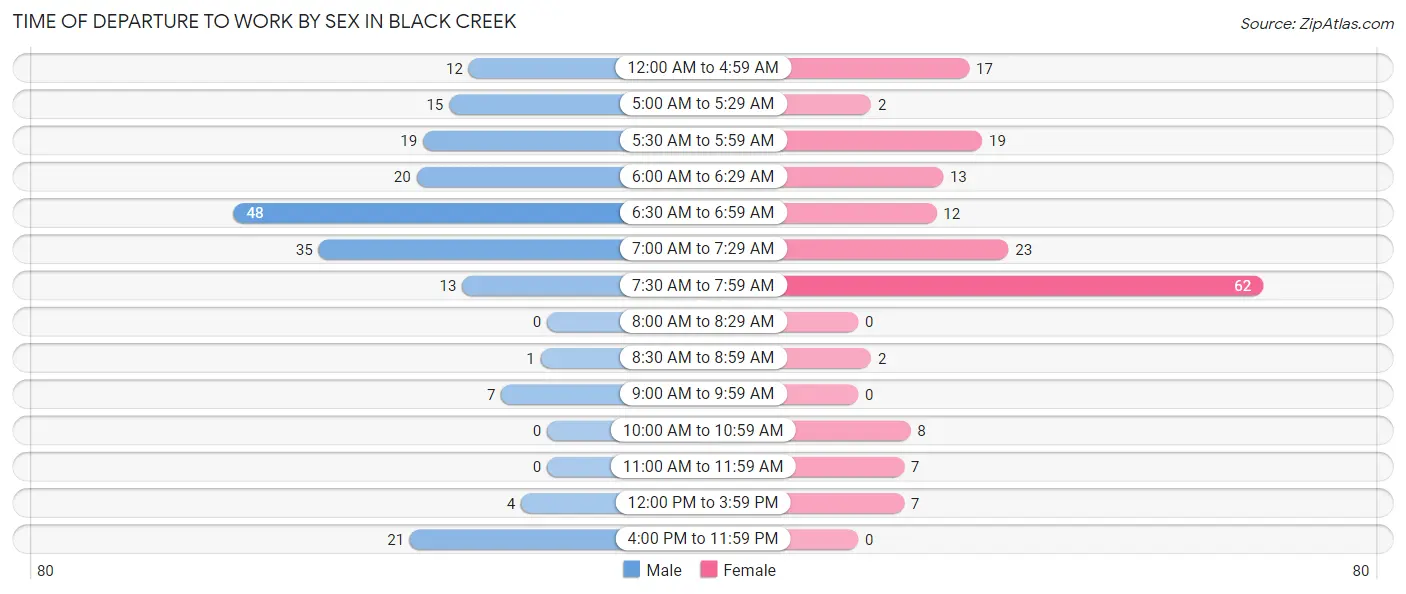
| Time of Departure | Male | Female |
| 12:00 AM to 4:59 AM | 12 (6.1%) | 17 (9.9%) |
| 5:00 AM to 5:29 AM | 15 (7.7%) | 2 (1.2%) |
| 5:30 AM to 5:59 AM | 19 (9.7%) | 19 (11.1%) |
| 6:00 AM to 6:29 AM | 20 (10.3%) | 13 (7.6%) |
| 6:30 AM to 6:59 AM | 48 (24.6%) | 12 (7.0%) |
| 7:00 AM to 7:29 AM | 35 (17.9%) | 23 (13.4%) |
| 7:30 AM to 7:59 AM | 13 (6.7%) | 62 (36.0%) |
| 8:00 AM to 8:29 AM | 0 (0.0%) | 0 (0.0%) |
| 8:30 AM to 8:59 AM | 1 (0.5%) | 2 (1.2%) |
| 9:00 AM to 9:59 AM | 7 (3.6%) | 0 (0.0%) |
| 10:00 AM to 10:59 AM | 0 (0.0%) | 8 (4.6%) |
| 11:00 AM to 11:59 AM | 0 (0.0%) | 7 (4.1%) |
| 12:00 PM to 3:59 PM | 4 (2.1%) | 7 (4.1%) |
| 4:00 PM to 11:59 PM | 21 (10.8%) | 0 (0.0%) |
| Total | 195 (100.0%) | 172 (100.0%) |
Housing Occupancy in Black Creek
Occupancy by Ownership in Black Creek
Of the total 282 dwellings in Black Creek, owner-occupied units account for 174 (61.7%), while renter-occupied units make up 108 (38.3%).
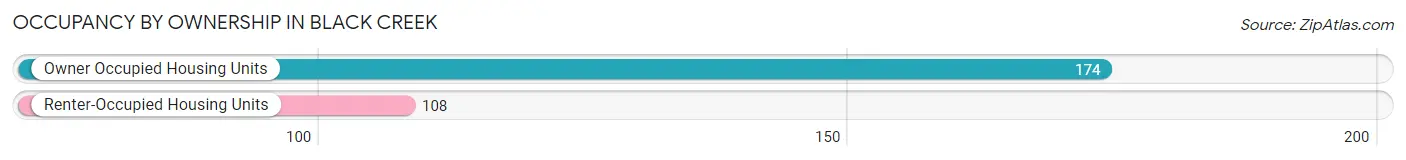
| Occupancy | # Housing Units | % Housing Units |
| Owner Occupied Housing Units | 174 | 61.7% |
| Renter-Occupied Housing Units | 108 | 38.3% |
| Total Occupied Housing Units | 282 | 100.0% |
Occupancy by Household Size in Black Creek
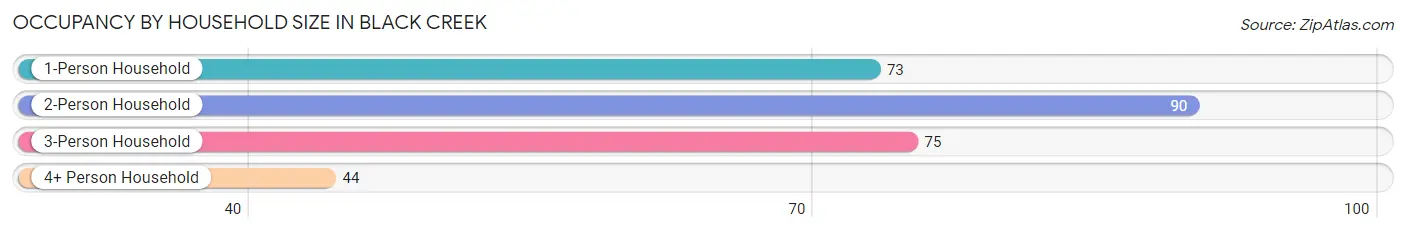
| Household Size | # Housing Units | % Housing Units |
| 1-Person Household | 73 | 25.9% |
| 2-Person Household | 90 | 31.9% |
| 3-Person Household | 75 | 26.6% |
| 4+ Person Household | 44 | 15.6% |
| Total Housing Units | 282 | 100.0% |
Occupancy by Ownership by Household Size in Black Creek
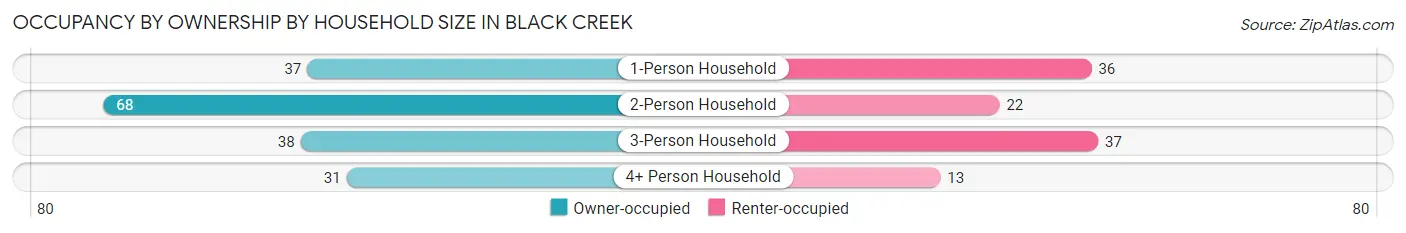
| Household Size | Owner-occupied | Renter-occupied |
| 1-Person Household | 37 (50.7%) | 36 (49.3%) |
| 2-Person Household | 68 (75.6%) | 22 (24.4%) |
| 3-Person Household | 38 (50.7%) | 37 (49.3%) |
| 4+ Person Household | 31 (70.5%) | 13 (29.5%) |
| Total Housing Units | 174 (61.7%) | 108 (38.3%) |
Occupancy by Educational Attainment in Black Creek
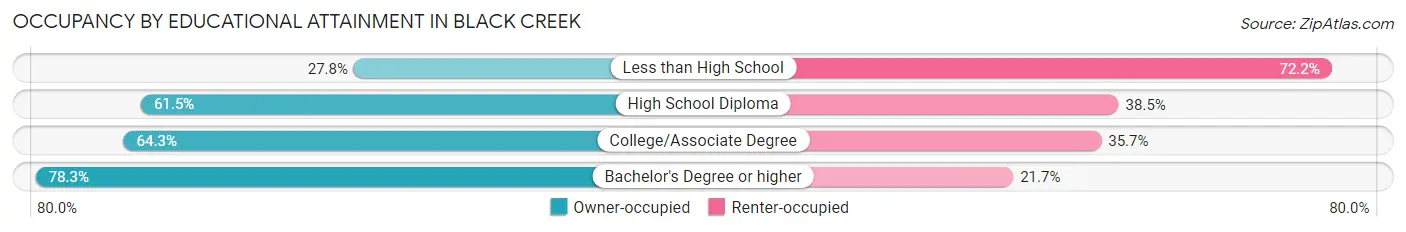
| Household Size | Owner-occupied | Renter-occupied |
| Less than High School | 5 (27.8%) | 13 (72.2%) |
| High School Diploma | 88 (61.5%) | 55 (38.5%) |
| College/Associate Degree | 63 (64.3%) | 35 (35.7%) |
| Bachelor's Degree or higher | 18 (78.3%) | 5 (21.7%) |
Occupancy by Age of Householder in Black Creek
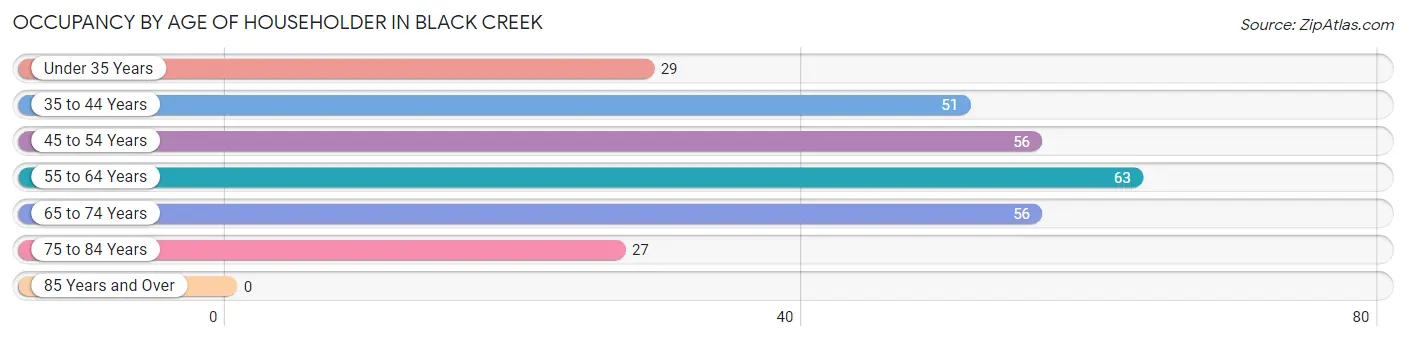
| Age Bracket | # Households | % Households |
| Under 35 Years | 29 | 10.3% |
| 35 to 44 Years | 51 | 18.1% |
| 45 to 54 Years | 56 | 19.9% |
| 55 to 64 Years | 63 | 22.3% |
| 65 to 74 Years | 56 | 19.9% |
| 75 to 84 Years | 27 | 9.6% |
| 85 Years and Over | 0 | 0.0% |
| Total | 282 | 100.0% |
Housing Finances in Black Creek
Median Income by Occupancy in Black Creek
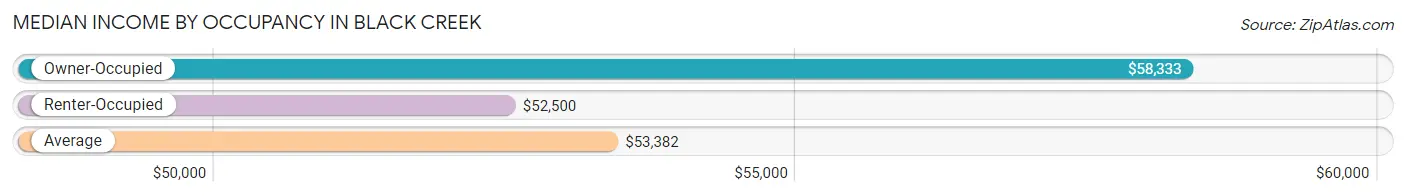
| Occupancy Type | # Households | Median Income |
| Owner-Occupied | 174 (61.7%) | $58,333 |
| Renter-Occupied | 108 (38.3%) | $52,500 |
| Average | 282 (100.0%) | $53,382 |
Occupancy by Householder Income Bracket in Black Creek
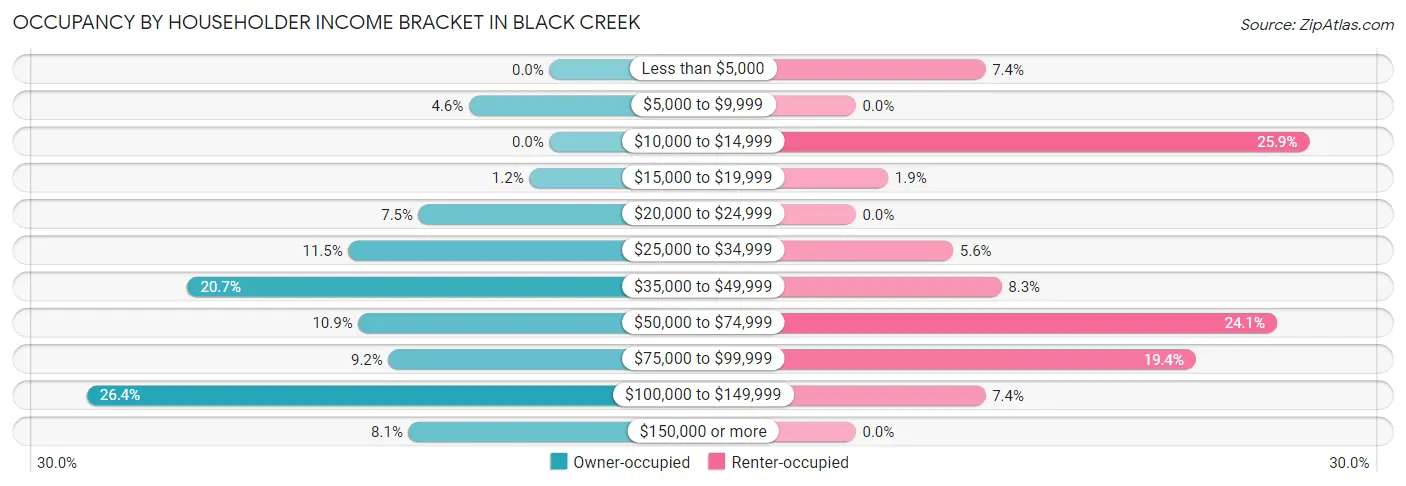
| Income Bracket | Owner-occupied | Renter-occupied |
| Less than $5,000 | 0 (0.0%) | 8 (7.4%) |
| $5,000 to $9,999 | 8 (4.6%) | 0 (0.0%) |
| $10,000 to $14,999 | 0 (0.0%) | 28 (25.9%) |
| $15,000 to $19,999 | 2 (1.1%) | 2 (1.8%) |
| $20,000 to $24,999 | 13 (7.5%) | 0 (0.0%) |
| $25,000 to $34,999 | 20 (11.5%) | 6 (5.6%) |
| $35,000 to $49,999 | 36 (20.7%) | 9 (8.3%) |
| $50,000 to $74,999 | 19 (10.9%) | 26 (24.1%) |
| $75,000 to $99,999 | 16 (9.2%) | 21 (19.4%) |
| $100,000 to $149,999 | 46 (26.4%) | 8 (7.4%) |
| $150,000 or more | 14 (8.1%) | 0 (0.0%) |
| Total | 174 (100.0%) | 108 (100.0%) |
Monthly Housing Cost Tiers in Black Creek
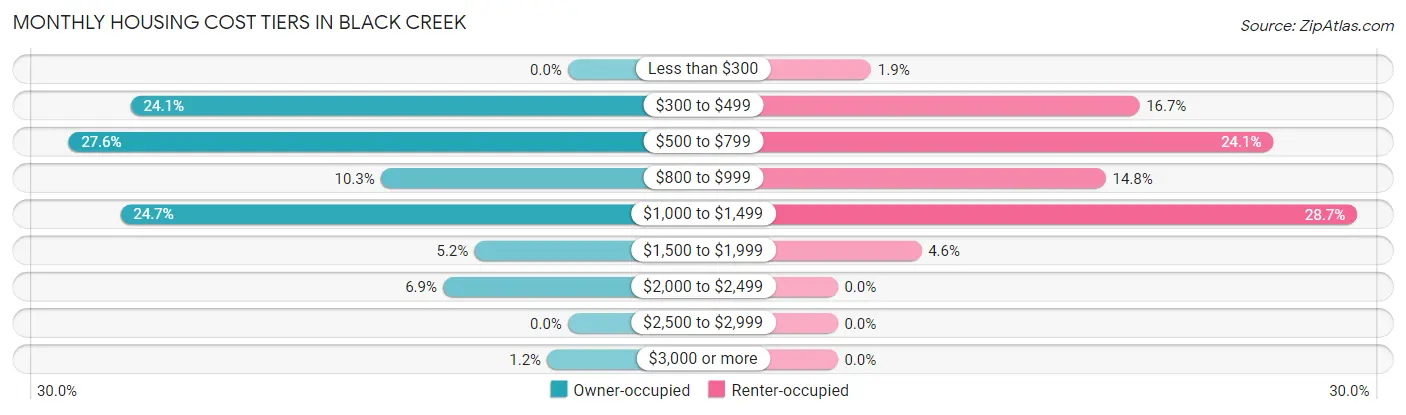
| Monthly Cost | Owner-occupied | Renter-occupied |
| Less than $300 | 0 (0.0%) | 2 (1.8%) |
| $300 to $499 | 42 (24.1%) | 18 (16.7%) |
| $500 to $799 | 48 (27.6%) | 26 (24.1%) |
| $800 to $999 | 18 (10.3%) | 16 (14.8%) |
| $1,000 to $1,499 | 43 (24.7%) | 31 (28.7%) |
| $1,500 to $1,999 | 9 (5.2%) | 5 (4.6%) |
| $2,000 to $2,499 | 12 (6.9%) | 0 (0.0%) |
| $2,500 to $2,999 | 0 (0.0%) | 0 (0.0%) |
| $3,000 or more | 2 (1.1%) | 0 (0.0%) |
| Total | 174 (100.0%) | 108 (100.0%) |
Physical Housing Characteristics in Black Creek
Housing Structures in Black Creek
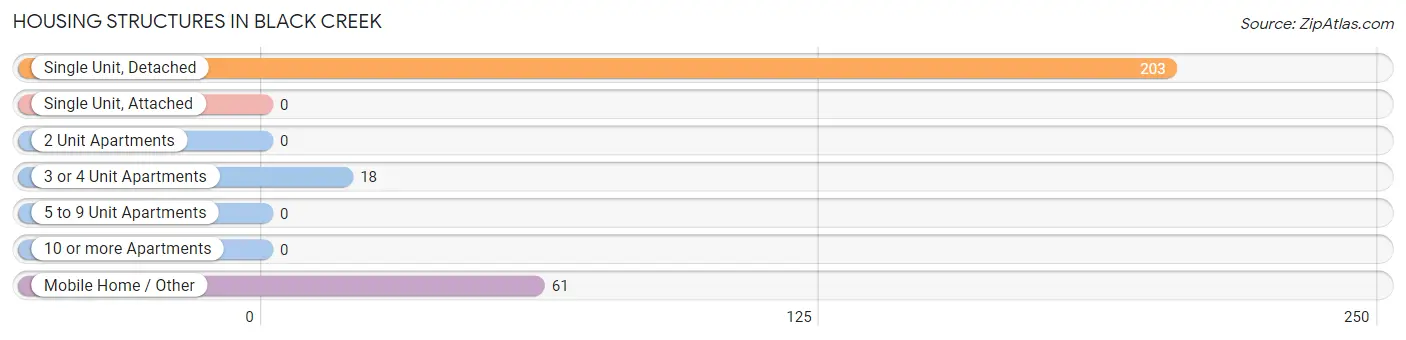
| Structure Type | # Housing Units | % Housing Units |
| Single Unit, Detached | 203 | 72.0% |
| Single Unit, Attached | 0 | 0.0% |
| 2 Unit Apartments | 0 | 0.0% |
| 3 or 4 Unit Apartments | 18 | 6.4% |
| 5 to 9 Unit Apartments | 0 | 0.0% |
| 10 or more Apartments | 0 | 0.0% |
| Mobile Home / Other | 61 | 21.6% |
| Total | 282 | 100.0% |
Housing Structures by Occupancy in Black Creek
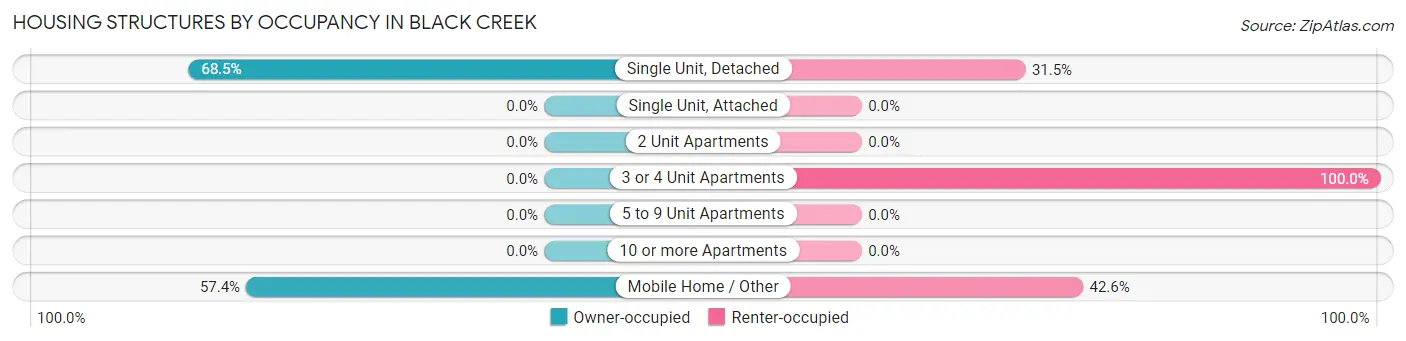
| Structure Type | Owner-occupied | Renter-occupied |
| Single Unit, Detached | 139 (68.5%) | 64 (31.5%) |
| Single Unit, Attached | 0 (0.0%) | 0 (0.0%) |
| 2 Unit Apartments | 0 (0.0%) | 0 (0.0%) |
| 3 or 4 Unit Apartments | 0 (0.0%) | 18 (100.0%) |
| 5 to 9 Unit Apartments | 0 (0.0%) | 0 (0.0%) |
| 10 or more Apartments | 0 (0.0%) | 0 (0.0%) |
| Mobile Home / Other | 35 (57.4%) | 26 (42.6%) |
| Total | 174 (61.7%) | 108 (38.3%) |
Housing Structures by Number of Rooms in Black Creek
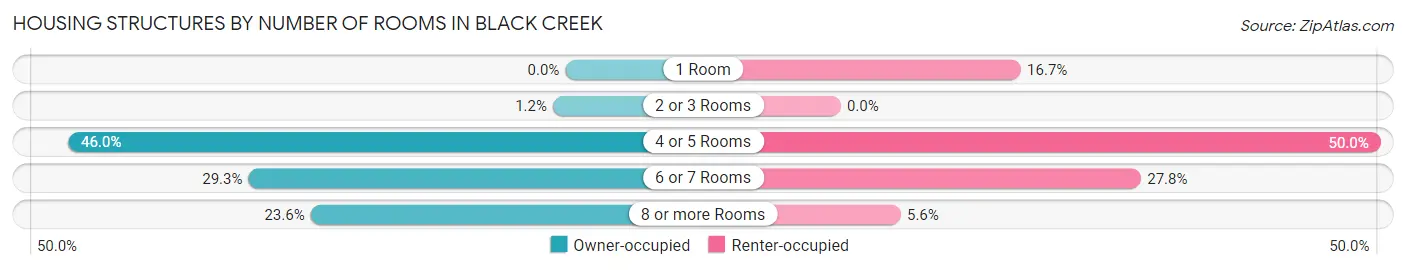
| Number of Rooms | Owner-occupied | Renter-occupied |
| 1 Room | 0 (0.0%) | 18 (16.7%) |
| 2 or 3 Rooms | 2 (1.1%) | 0 (0.0%) |
| 4 or 5 Rooms | 80 (46.0%) | 54 (50.0%) |
| 6 or 7 Rooms | 51 (29.3%) | 30 (27.8%) |
| 8 or more Rooms | 41 (23.6%) | 6 (5.6%) |
| Total | 174 (100.0%) | 108 (100.0%) |
Housing Structure by Heating Type in Black Creek
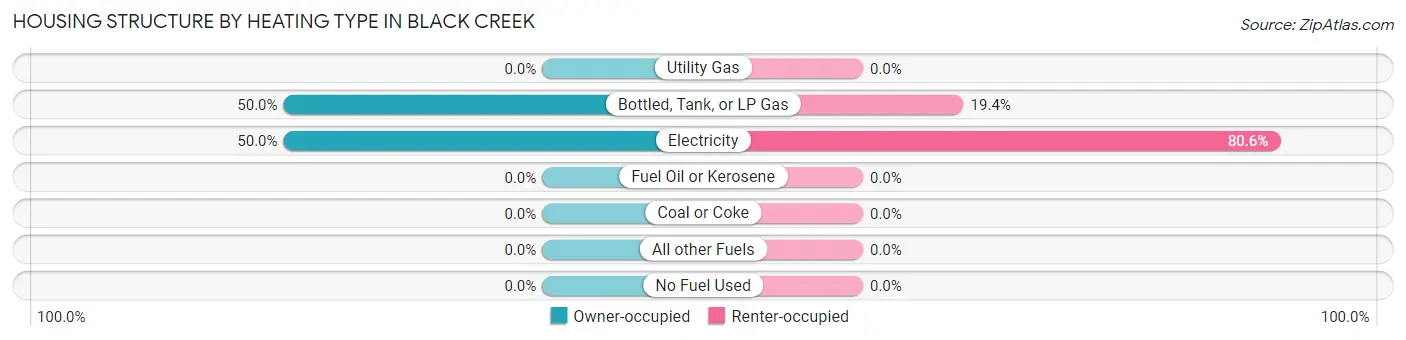
| Heating Type | Owner-occupied | Renter-occupied |
| Utility Gas | 0 (0.0%) | 0 (0.0%) |
| Bottled, Tank, or LP Gas | 87 (50.0%) | 21 (19.4%) |
| Electricity | 87 (50.0%) | 87 (80.6%) |
| Fuel Oil or Kerosene | 0 (0.0%) | 0 (0.0%) |
| Coal or Coke | 0 (0.0%) | 0 (0.0%) |
| All other Fuels | 0 (0.0%) | 0 (0.0%) |
| No Fuel Used | 0 (0.0%) | 0 (0.0%) |
| Total | 174 (100.0%) | 108 (100.0%) |
Household Vehicle Usage in Black Creek
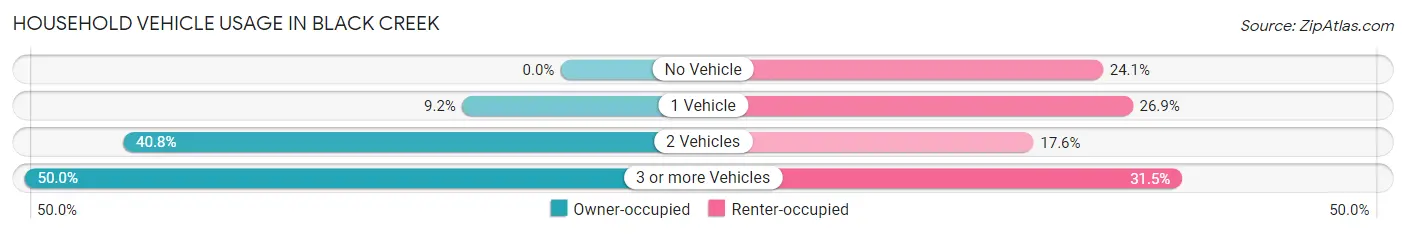
| Vehicles per Household | Owner-occupied | Renter-occupied |
| No Vehicle | 0 (0.0%) | 26 (24.1%) |
| 1 Vehicle | 16 (9.2%) | 29 (26.9%) |
| 2 Vehicles | 71 (40.8%) | 19 (17.6%) |
| 3 or more Vehicles | 87 (50.0%) | 34 (31.5%) |
| Total | 174 (100.0%) | 108 (100.0%) |
Real Estate & Mortgages in Black Creek
Real Estate and Mortgage Overview in Black Creek
| Characteristic | Without Mortgage | With Mortgage |
| Housing Units | 82 | 92 |
| Median Property Value | $91,300 | $117,500 |
| Median Household Income | - | - |
| Monthly Housing Costs | $493 | $2 |
| Real Estate Taxes | $1,094 | $0 |
Property Value by Mortgage Status in Black Creek
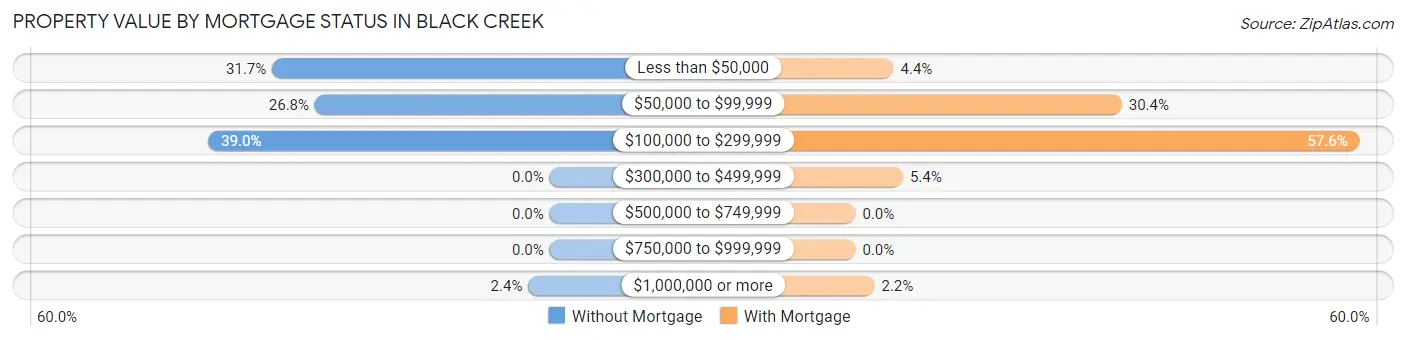
| Property Value | Without Mortgage | With Mortgage |
| Less than $50,000 | 26 (31.7%) | 4 (4.3%) |
| $50,000 to $99,999 | 22 (26.8%) | 28 (30.4%) |
| $100,000 to $299,999 | 32 (39.0%) | 53 (57.6%) |
| $300,000 to $499,999 | 0 (0.0%) | 5 (5.4%) |
| $500,000 to $749,999 | 0 (0.0%) | 0 (0.0%) |
| $750,000 to $999,999 | 0 (0.0%) | 0 (0.0%) |
| $1,000,000 or more | 2 (2.4%) | 2 (2.2%) |
| Total | 82 (100.0%) | 92 (100.0%) |
Household Income by Mortgage Status in Black Creek
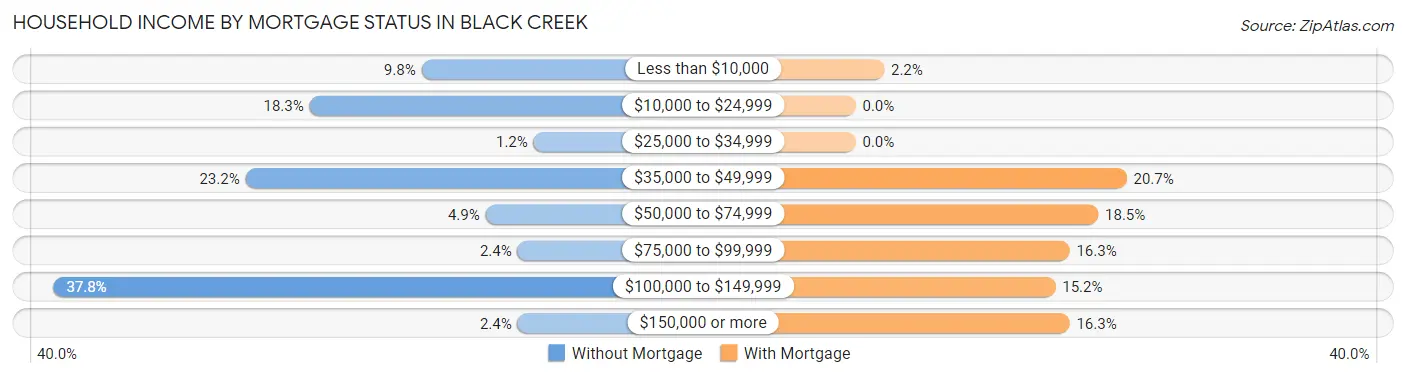
| Household Income | Without Mortgage | With Mortgage |
| Less than $10,000 | 8 (9.8%) | 2 (2.2%) |
| $10,000 to $24,999 | 15 (18.3%) | 0 (0.0%) |
| $25,000 to $34,999 | 1 (1.2%) | 0 (0.0%) |
| $35,000 to $49,999 | 19 (23.2%) | 19 (20.6%) |
| $50,000 to $74,999 | 4 (4.9%) | 17 (18.5%) |
| $75,000 to $99,999 | 2 (2.4%) | 15 (16.3%) |
| $100,000 to $149,999 | 31 (37.8%) | 14 (15.2%) |
| $150,000 or more | 2 (2.4%) | 15 (16.3%) |
| Total | 82 (100.0%) | 92 (100.0%) |
Property Value to Household Income Ratio in Black Creek
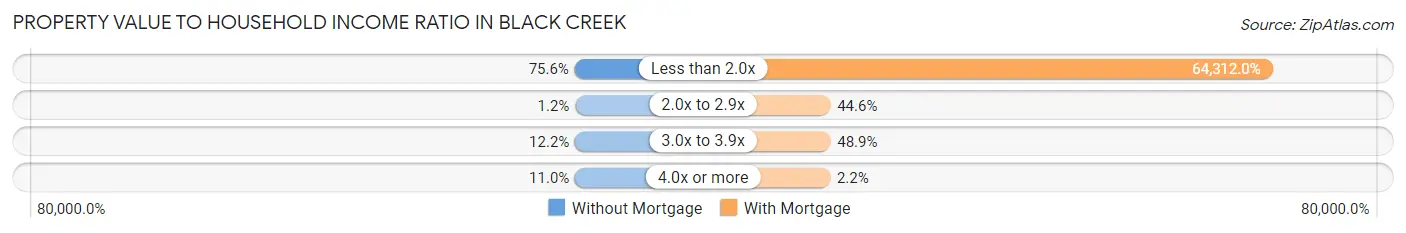
| Value-to-Income Ratio | Without Mortgage | With Mortgage |
| Less than 2.0x | 62 (75.6%) | 59,167 (64,312.0%) |
| 2.0x to 2.9x | 1 (1.2%) | 41 (44.6%) |
| 3.0x to 3.9x | 10 (12.2%) | 45 (48.9%) |
| 4.0x or more | 9 (11.0%) | 2 (2.2%) |
| Total | 82 (100.0%) | 92 (100.0%) |
Real Estate Taxes by Mortgage Status in Black Creek
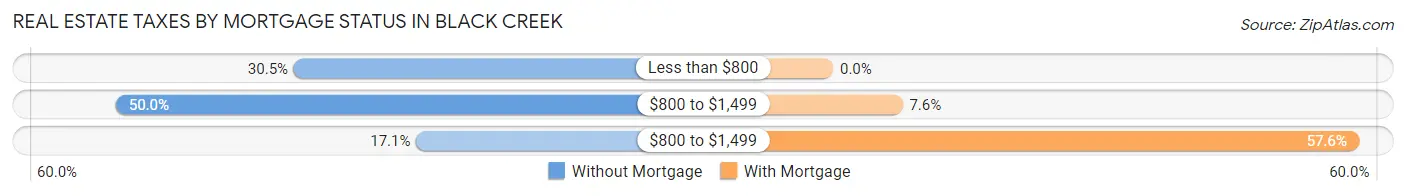
| Property Taxes | Without Mortgage | With Mortgage |
| Less than $800 | 25 (30.5%) | 0 (0.0%) |
| $800 to $1,499 | 41 (50.0%) | 7 (7.6%) |
| $800 to $1,499 | 14 (17.1%) | 53 (57.6%) |
| Total | 82 (100.0%) | 92 (100.0%) |
Health & Disability in Black Creek
Health Insurance Coverage by Age in Black Creek
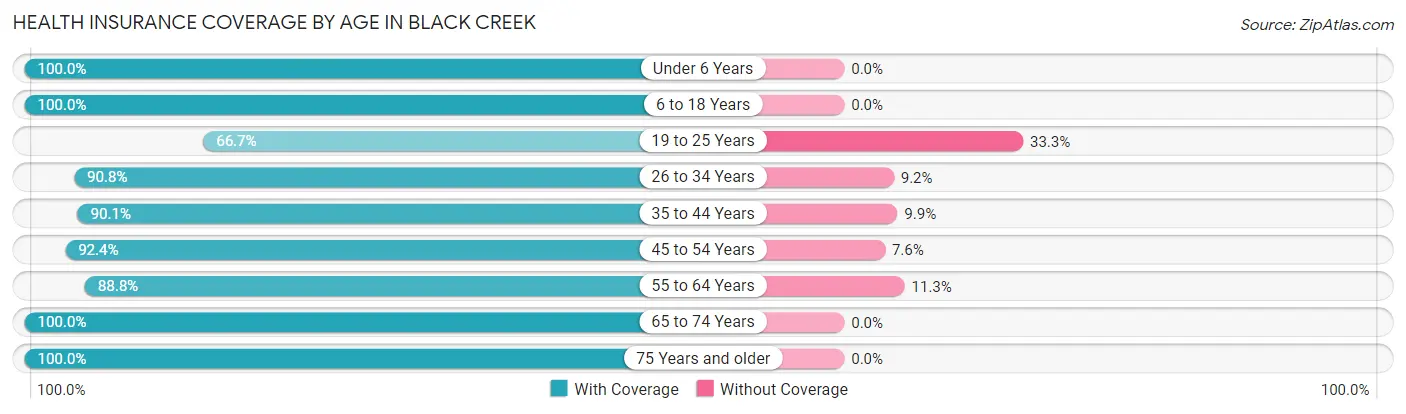
| Age Bracket | With Coverage | Without Coverage |
| Under 6 Years | 48 (100.0%) | 0 (0.0%) |
| 6 to 18 Years | 109 (100.0%) | 0 (0.0%) |
| 19 to 25 Years | 74 (66.7%) | 37 (33.3%) |
| 26 to 34 Years | 59 (90.8%) | 6 (9.2%) |
| 35 to 44 Years | 91 (90.1%) | 10 (9.9%) |
| 45 to 54 Years | 122 (92.4%) | 10 (7.6%) |
| 55 to 64 Years | 71 (88.7%) | 9 (11.3%) |
| 65 to 74 Years | 72 (100.0%) | 0 (0.0%) |
| 75 Years and older | 40 (100.0%) | 0 (0.0%) |
| Total | 686 (90.5%) | 72 (9.5%) |
Health Insurance Coverage by Citizenship Status in Black Creek
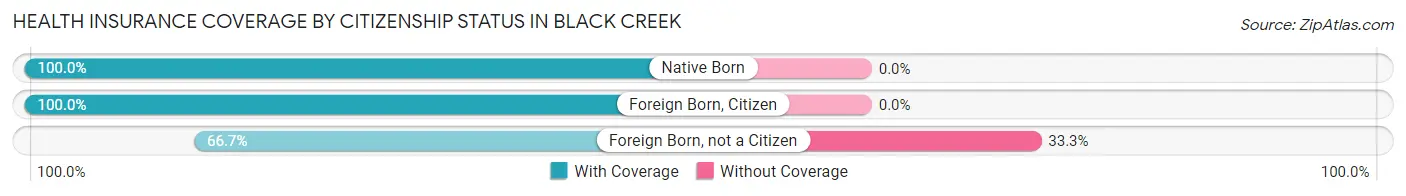
| Citizenship Status | With Coverage | Without Coverage |
| Native Born | 48 (100.0%) | 0 (0.0%) |
| Foreign Born, Citizen | 109 (100.0%) | 0 (0.0%) |
| Foreign Born, not a Citizen | 74 (66.7%) | 37 (33.3%) |
Health Insurance Coverage by Household Income in Black Creek
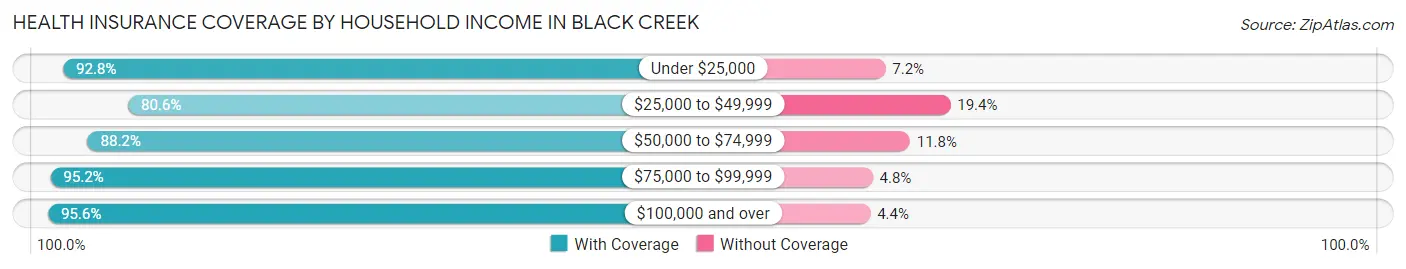
| Household Income | With Coverage | Without Coverage |
| Under $25,000 | 90 (92.8%) | 7 (7.2%) |
| $25,000 to $49,999 | 133 (80.6%) | 32 (19.4%) |
| $50,000 to $74,999 | 127 (88.2%) | 17 (11.8%) |
| $75,000 to $99,999 | 118 (95.2%) | 6 (4.8%) |
| $100,000 and over | 218 (95.6%) | 10 (4.4%) |
Public vs Private Health Insurance Coverage by Age in Black Creek
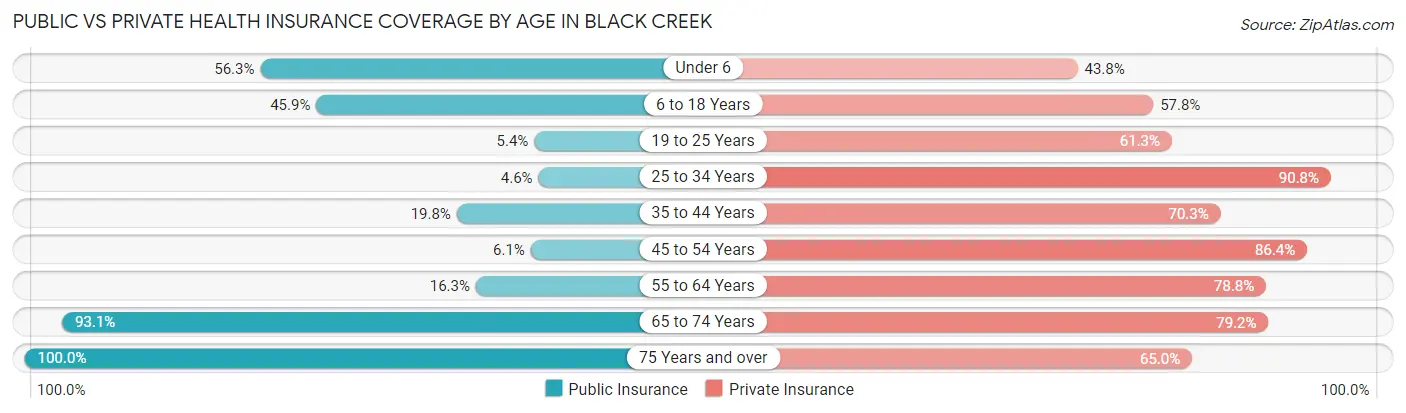
| Age Bracket | Public Insurance | Private Insurance |
| Under 6 | 27 (56.2%) | 21 (43.8%) |
| 6 to 18 Years | 50 (45.9%) | 63 (57.8%) |
| 19 to 25 Years | 6 (5.4%) | 68 (61.3%) |
| 25 to 34 Years | 3 (4.6%) | 59 (90.8%) |
| 35 to 44 Years | 20 (19.8%) | 71 (70.3%) |
| 45 to 54 Years | 8 (6.1%) | 114 (86.4%) |
| 55 to 64 Years | 13 (16.3%) | 63 (78.7%) |
| 65 to 74 Years | 67 (93.1%) | 57 (79.2%) |
| 75 Years and over | 40 (100.0%) | 26 (65.0%) |
| Total | 234 (30.9%) | 542 (71.5%) |
Disability Status by Sex by Age in Black Creek
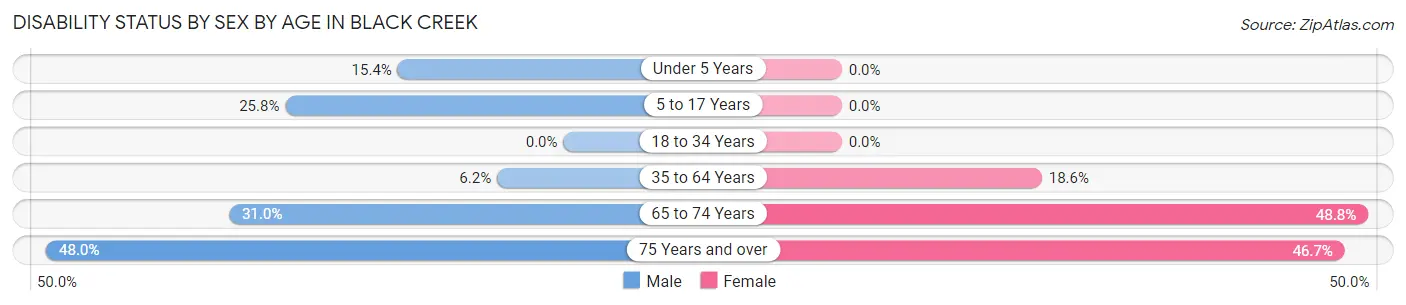
| Age Bracket | Male | Female |
| Under 5 Years | 2 (15.4%) | 0 (0.0%) |
| 5 to 17 Years | 16 (25.8%) | 0 (0.0%) |
| 18 to 34 Years | 0 (0.0%) | 0 (0.0%) |
| 35 to 64 Years | 9 (6.2%) | 31 (18.6%) |
| 65 to 74 Years | 9 (31.0%) | 21 (48.8%) |
| 75 Years and over | 12 (48.0%) | 7 (46.7%) |
Disability Class by Sex by Age in Black Creek
Disability Class: Hearing Difficulty
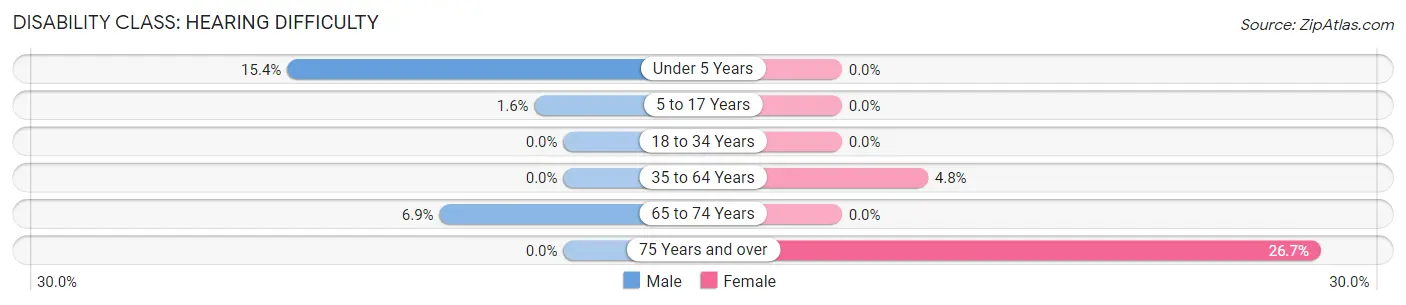
| Age Bracket | Male | Female |
| Under 5 Years | 2 (15.4%) | 0 (0.0%) |
| 5 to 17 Years | 1 (1.6%) | 0 (0.0%) |
| 18 to 34 Years | 0 (0.0%) | 0 (0.0%) |
| 35 to 64 Years | 0 (0.0%) | 8 (4.8%) |
| 65 to 74 Years | 2 (6.9%) | 0 (0.0%) |
| 75 Years and over | 0 (0.0%) | 4 (26.7%) |
Disability Class: Vision Difficulty
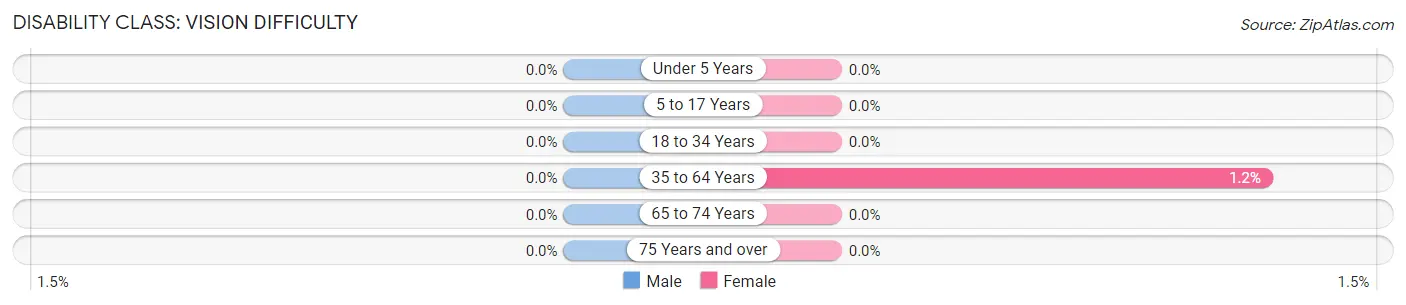
| Age Bracket | Male | Female |
| Under 5 Years | 0 (0.0%) | 0 (0.0%) |
| 5 to 17 Years | 0 (0.0%) | 0 (0.0%) |
| 18 to 34 Years | 0 (0.0%) | 0 (0.0%) |
| 35 to 64 Years | 0 (0.0%) | 2 (1.2%) |
| 65 to 74 Years | 0 (0.0%) | 0 (0.0%) |
| 75 Years and over | 0 (0.0%) | 0 (0.0%) |
Disability Class: Cognitive Difficulty
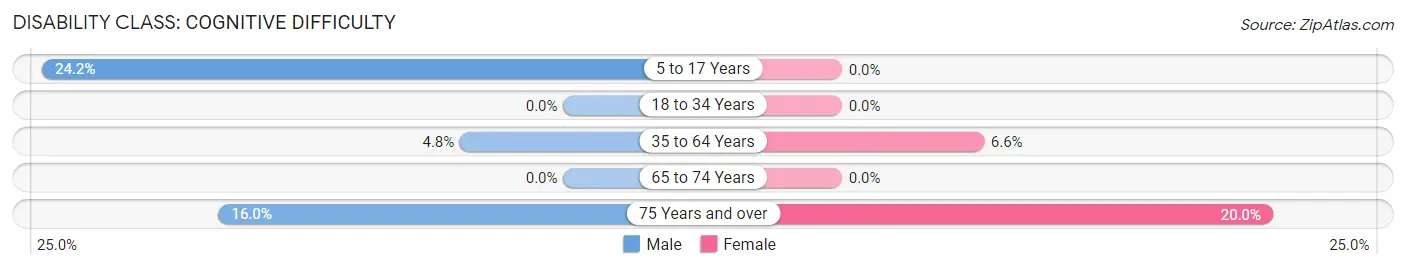
| Age Bracket | Male | Female |
| 5 to 17 Years | 15 (24.2%) | 0 (0.0%) |
| 18 to 34 Years | 0 (0.0%) | 0 (0.0%) |
| 35 to 64 Years | 7 (4.8%) | 11 (6.6%) |
| 65 to 74 Years | 0 (0.0%) | 0 (0.0%) |
| 75 Years and over | 4 (16.0%) | 3 (20.0%) |
Disability Class: Ambulatory Difficulty
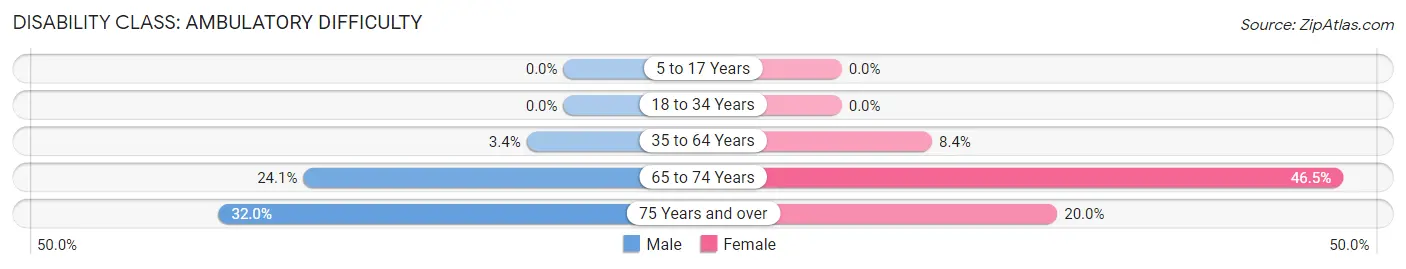
| Age Bracket | Male | Female |
| 5 to 17 Years | 0 (0.0%) | 0 (0.0%) |
| 18 to 34 Years | 0 (0.0%) | 0 (0.0%) |
| 35 to 64 Years | 5 (3.4%) | 14 (8.4%) |
| 65 to 74 Years | 7 (24.1%) | 20 (46.5%) |
| 75 Years and over | 8 (32.0%) | 3 (20.0%) |
Disability Class: Self-Care Difficulty
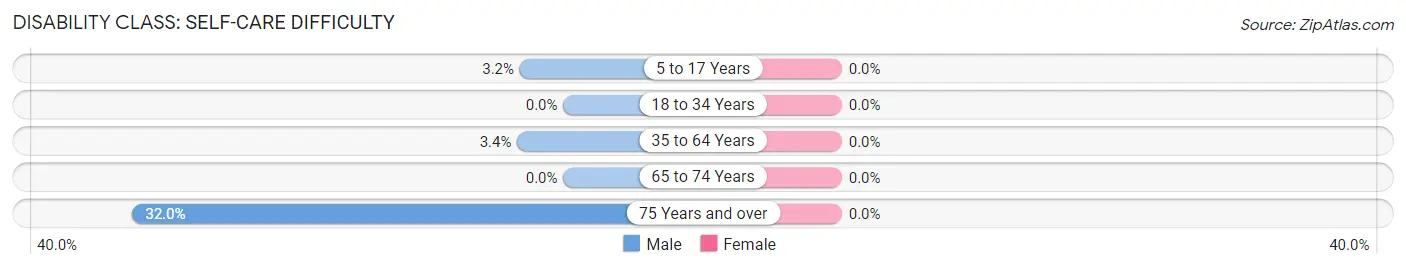
| Age Bracket | Male | Female |
| 5 to 17 Years | 2 (3.2%) | 0 (0.0%) |
| 18 to 34 Years | 0 (0.0%) | 0 (0.0%) |
| 35 to 64 Years | 5 (3.4%) | 0 (0.0%) |
| 65 to 74 Years | 0 (0.0%) | 0 (0.0%) |
| 75 Years and over | 8 (32.0%) | 0 (0.0%) |
Technology Access in Black Creek
Computing Device Access in Black Creek
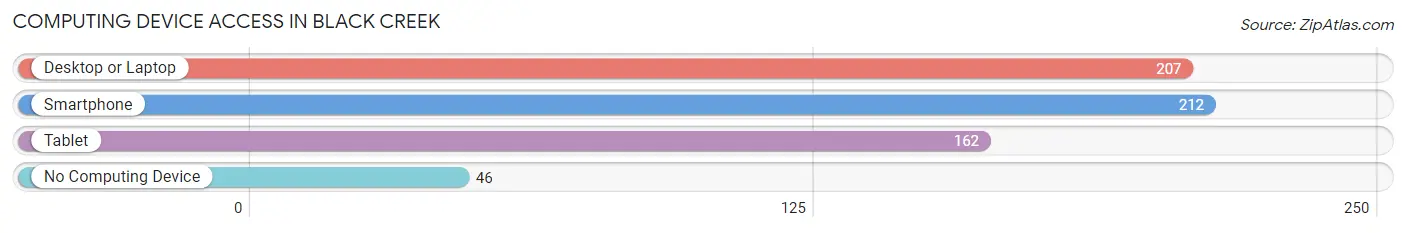
| Device Type | # Households | % Households |
| Desktop or Laptop | 207 | 73.4% |
| Smartphone | 212 | 75.2% |
| Tablet | 162 | 57.5% |
| No Computing Device | 46 | 16.3% |
| Total | 282 | 100.0% |
Internet Access in Black Creek
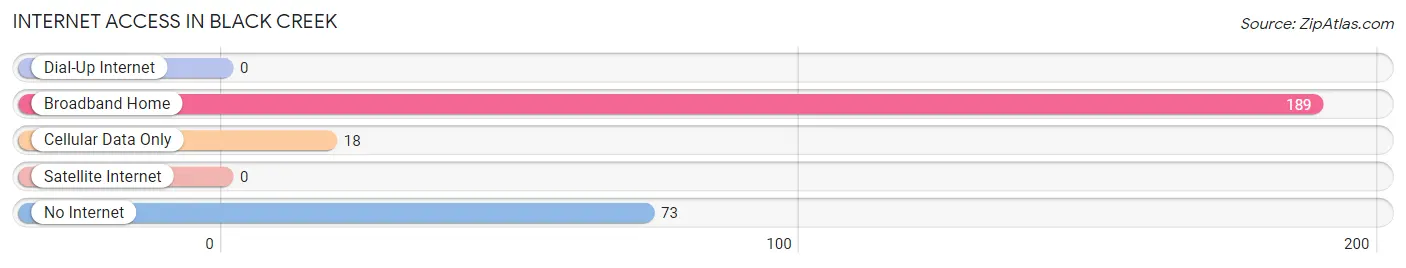
| Internet Type | # Households | % Households |
| Dial-Up Internet | 0 | 0.0% |
| Broadband Home | 189 | 67.0% |
| Cellular Data Only | 18 | 6.4% |
| Satellite Internet | 0 | 0.0% |
| No Internet | 73 | 25.9% |
| Total | 282 | 100.0% |
Black Creek Summary
Black Creek is a small town located in Wilson County, North Carolina. It is situated in the eastern part of the state, approximately 30 miles east of Raleigh. The town was founded in 1872 and has a population of approximately 1,000 people.
History
Black Creek was founded in 1872 by a group of settlers from the nearby town of Wilson. The town was named after the nearby Black Creek, which was a major source of water for the settlers. The town was originally a farming community, with the main crops being cotton, corn, and tobacco. In the early 1900s, the town began to grow and develop, with the construction of a railroad line and the opening of a post office.
In the 1920s, the town experienced a period of growth and prosperity, with the opening of several businesses, including a bank, a hotel, and a movie theater. The town also saw the construction of a new school and a new church.
In the 1950s, the town experienced a period of decline, as many of the businesses closed and the population began to decline. However, in the late 1970s, the town began to experience a resurgence, with the opening of several new businesses and the construction of a new library.
Geography
Black Creek is located in the eastern part of Wilson County, approximately 30 miles east of Raleigh. The town is situated on the banks of the Black Creek, which is a major source of water for the town. The town is surrounded by rolling hills and forests, and is located near several lakes, including Lake Wilson and Lake Gaston.
Economy
The economy of Black Creek is largely based on agriculture, with the main crops being cotton, corn, and tobacco. The town also has several small businesses, including a bank, a hotel, and a movie theater. In recent years, the town has seen an increase in tourism, with visitors coming to enjoy the town's natural beauty and its historic sites.
Demographics
As of the 2010 census, the population of Black Creek was 1,000 people. The racial makeup of the town was 95.2% White, 2.2% African American, 0.2% Native American, 0.2% Asian, 0.2% from other races, and 1.9% from two or more races. The median household income was $30,000, and the median age was 39.
Conclusion
Black Creek is a small town located in Wilson County, North Carolina. It was founded in 1872 and has a population of approximately 1,000 people. The town's economy is largely based on agriculture, with the main crops being cotton, corn, and tobacco. The town also has several small businesses, including a bank, a hotel, and a movie theater. The racial makeup of the town is 95.2% White, 2.2% African American, 0.2% Native American, 0.2% Asian, 0.2% from other races, and 1.9% from two or more races. The median household income was $30,000, and the median age was 39. Black Creek is a small town with a rich history and a bright future.
Common Questions
What is Per Capita Income in Black Creek?
Per Capita income in Black Creek is $26,343.
What is the Median Family Income in Black Creek?
Median Family Income in Black Creek is $76,429.
What is the Median Household income in Black Creek?
Median Household Income in Black Creek is $53,382.
What is Income or Wage Gap in Black Creek?
Income or Wage Gap in Black Creek is 0.9%.
Women in Black Creek earn 99.1 cents for every dollar earned by a man.
What is Inequality or Gini Index in Black Creek?
Inequality or Gini Index in Black Creek is 0.40.
What is the Total Population of Black Creek?
Total Population of Black Creek is 758.
What is the Total Male Population of Black Creek?
Total Male Population of Black Creek is 387.
What is the Total Female Population of Black Creek?
Total Female Population of Black Creek is 371.
What is the Ratio of Males per 100 Females in Black Creek?
There are 104.31 Males per 100 Females in Black Creek.
What is the Ratio of Females per 100 Males in Black Creek?
There are 95.87 Females per 100 Males in Black Creek.
What is the Median Population Age in Black Creek?
Median Population Age in Black Creek is 39.6 Years.
What is the Average Family Size in Black Creek
Average Family Size in Black Creek is 3.4 People.
What is the Average Household Size in Black Creek
Average Household Size in Black Creek is 2.7 People.
How Large is the Labor Force in Black Creek?
There are 422 People in the Labor Forcein in Black Creek.
What is the Percentage of People in the Labor Force in Black Creek?
67.0% of People are in the Labor Force in Black Creek.
What is the Unemployment Rate in Black Creek?
Unemployment Rate in Black Creek is 9.7%.