Cooleemee, NC Map & Demographics
Cooleemee Map
Cooleemee Overview
$27,612
PER CAPITA INCOME
$68,636
AVG FAMILY INCOME
$50,250
AVG HOUSEHOLD INCOME
27.2%
WAGE / INCOME GAP [ % ]
72.8¢/ $1
WAGE / INCOME GAP [ $ ]
0.39
INEQUALITY / GINI INDEX
875
TOTAL POPULATION
408
MALE POPULATION
467
FEMALE POPULATION
87.37
MALES / 100 FEMALES
114.46
FEMALES / 100 MALES
34.4
MEDIAN AGE
3.2
AVG FAMILY SIZE
2.5
AVG HOUSEHOLD SIZE
443
LABOR FORCE [ PEOPLE ]
65.3%
PERCENT IN LABOR FORCE
3.4%
UNEMPLOYMENT RATE
Cooleemee Zip Codes
Cooleemee Area Codes
Income in Cooleemee
Income Overview in Cooleemee
Per Capita Income in Cooleemee is $27,612, while median incomes of families and households are $68,636 and $50,250 respectively.
| Characteristic | Number | Measure |
| Per Capita Income | 875 | $27,612 |
| Median Family Income | 216 | $68,636 |
| Mean Family Income | 216 | $71,311 |
| Median Household Income | 347 | $50,250 |
| Mean Household Income | 347 | $65,518 |
| Income Deficit | 216 | $0 |
| Wage / Income Gap (%) | 875 | 27.24% |
| Wage / Income Gap ($) | 875 | 72.76¢ per $1 |
| Gini / Inequality Index | 875 | 0.39 |
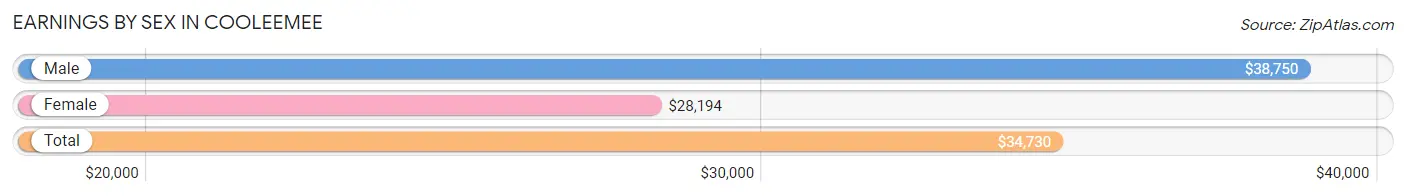
Earnings by Sex in Cooleemee
Average Earnings in Cooleemee are $34,730, $38,750 for men and $28,194 for women, a difference of 27.2%.
| Sex | Number | Average Earnings |
| Male | 207 (46.6%) | $38,750 |
| Female | 237 (53.4%) | $28,194 |
| Total | 444 (100.0%) | $34,730 |
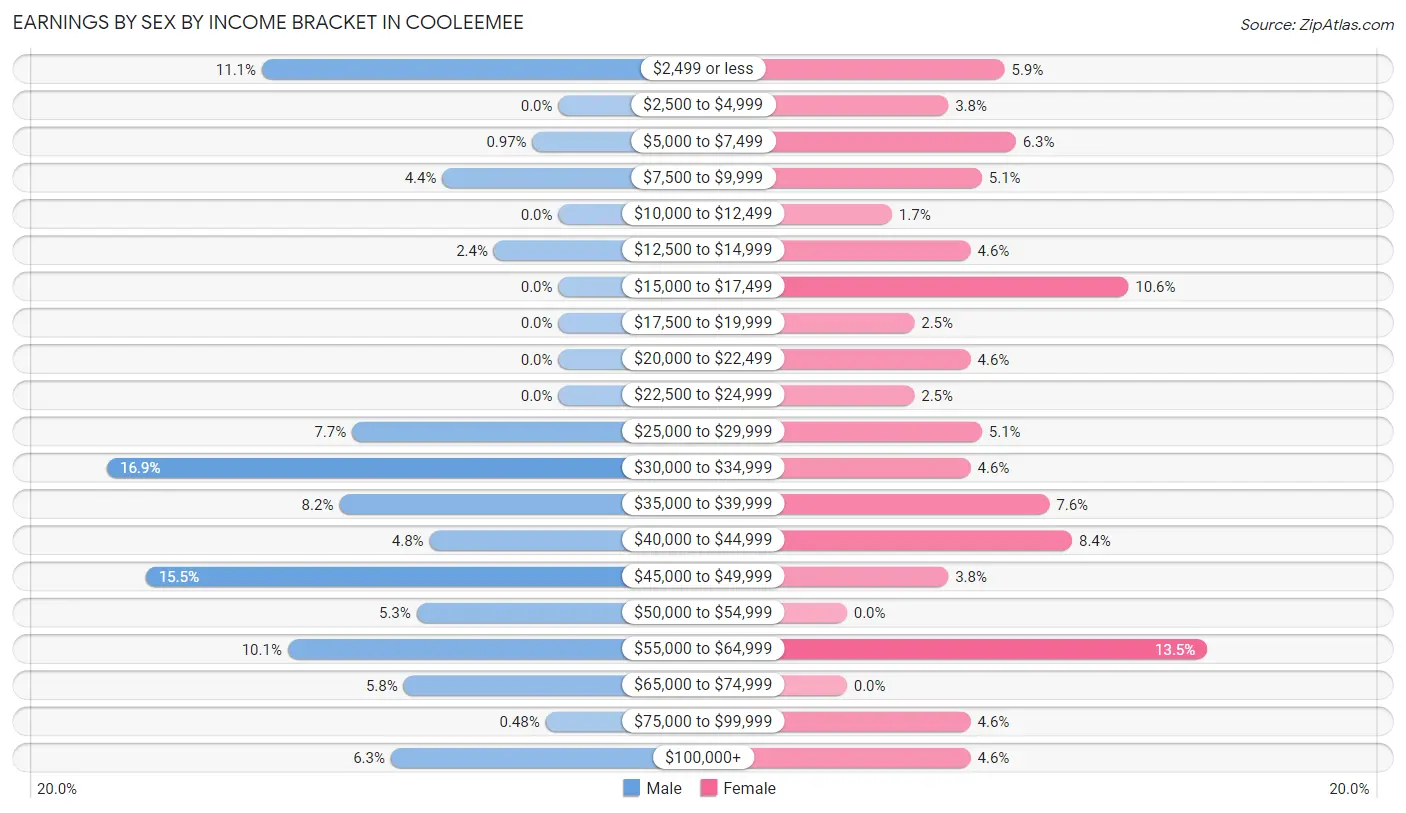
Earnings by Sex by Income Bracket in Cooleemee
The most common earnings brackets in Cooleemee are $30,000 to $34,999 for men (35 | 16.9%) and $55,000 to $64,999 for women (32 | 13.5%).
| Income | Male | Female |
| $2,499 or less | 23 (11.1%) | 14 (5.9%) |
| $2,500 to $4,999 | 0 (0.0%) | 9 (3.8%) |
| $5,000 to $7,499 | 2 (1.0%) | 15 (6.3%) |
| $7,500 to $9,999 | 9 (4.3%) | 12 (5.1%) |
| $10,000 to $12,499 | 0 (0.0%) | 4 (1.7%) |
| $12,500 to $14,999 | 5 (2.4%) | 11 (4.6%) |
| $15,000 to $17,499 | 0 (0.0%) | 25 (10.5%) |
| $17,500 to $19,999 | 0 (0.0%) | 6 (2.5%) |
| $20,000 to $22,499 | 0 (0.0%) | 11 (4.6%) |
| $22,500 to $24,999 | 0 (0.0%) | 6 (2.5%) |
| $25,000 to $29,999 | 16 (7.7%) | 12 (5.1%) |
| $30,000 to $34,999 | 35 (16.9%) | 11 (4.6%) |
| $35,000 to $39,999 | 17 (8.2%) | 18 (7.6%) |
| $40,000 to $44,999 | 10 (4.8%) | 20 (8.4%) |
| $45,000 to $49,999 | 32 (15.5%) | 9 (3.8%) |
| $50,000 to $54,999 | 11 (5.3%) | 0 (0.0%) |
| $55,000 to $64,999 | 21 (10.1%) | 32 (13.5%) |
| $65,000 to $74,999 | 12 (5.8%) | 0 (0.0%) |
| $75,000 to $99,999 | 1 (0.5%) | 11 (4.6%) |
| $100,000+ | 13 (6.3%) | 11 (4.6%) |
| Total | 207 (100.0%) | 237 (100.0%) |
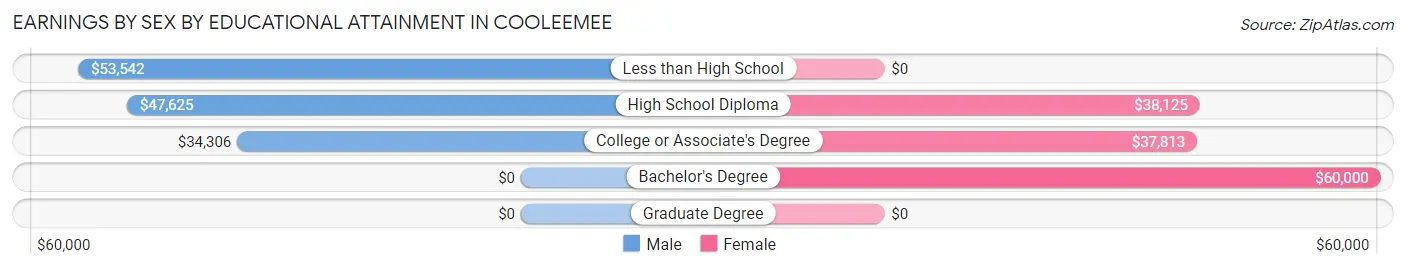
Earnings by Sex by Educational Attainment in Cooleemee
Average earnings in Cooleemee are $45,069 for men and $37,891 for women, a difference of 15.9%. Men with an educational attainment of less than high school enjoy the highest average annual earnings of $53,542, while those with college or associate's degree education earn the least with $34,306. Women with an educational attainment of bachelor's degree earn the most with the average annual earnings of $60,000, while those with college or associate's degree education have the smallest earnings of $37,813.
| Educational Attainment | Male Income | Female Income |
| Less than High School | $53,542 | $0 |
| High School Diploma | $47,625 | $38,125 |
| College or Associate's Degree | $34,306 | $37,813 |
| Bachelor's Degree | - | - |
| Graduate Degree | - | - |
| Total | $45,069 | $37,891 |
Family Income in Cooleemee
Family Income Brackets in Cooleemee
According to the Cooleemee family income data, there are 46 families falling into the $75,000 to $99,999 income range, which is the most common income bracket and makes up 21.3% of all families. Conversely, the $10,000 to $14,999 income bracket is the least frequent group with only 1 families (0.5%) belonging to this category.
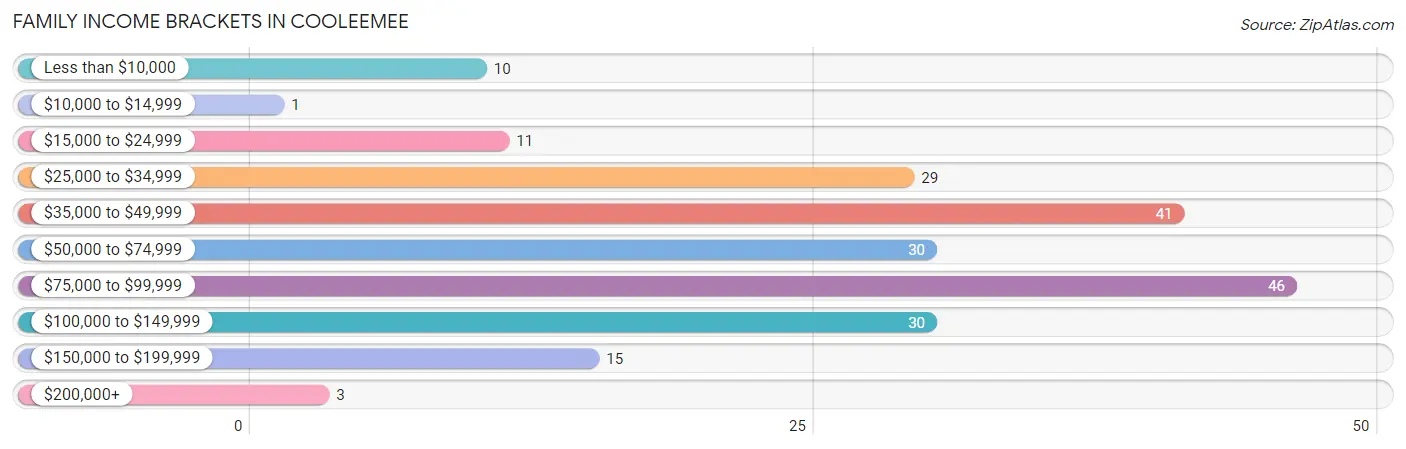
| Income Bracket | # Families | % Families |
| Less than $10,000 | 10 | 4.6% |
| $10,000 to $14,999 | 1 | 0.5% |
| $15,000 to $24,999 | 11 | 5.1% |
| $25,000 to $34,999 | 29 | 13.4% |
| $35,000 to $49,999 | 41 | 19.0% |
| $50,000 to $74,999 | 30 | 13.9% |
| $75,000 to $99,999 | 46 | 21.3% |
| $100,000 to $149,999 | 30 | 13.9% |
| $150,000 to $199,999 | 15 | 6.9% |
| $200,000+ | 3 | 1.4% |
Family Income by Famaliy Size in Cooleemee
3-person families (62 | 28.7%) account for the highest median family income in Cooleemee with $88,333 per family, while 3-person families (62 | 28.7%) have the highest median income of $29,444 per family member.
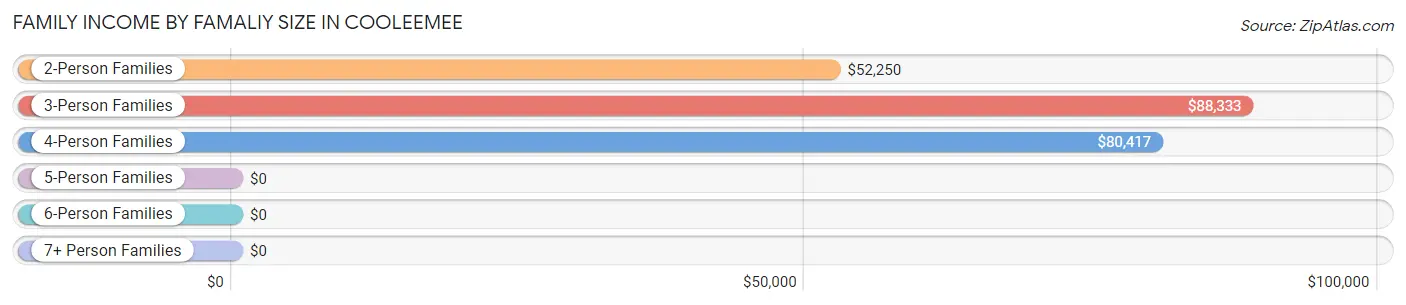
| Income Bracket | # Families | Median Income |
| 2-Person Families | 105 (48.6%) | $52,250 |
| 3-Person Families | 62 (28.7%) | $88,333 |
| 4-Person Families | 31 (14.3%) | $80,417 |
| 5-Person Families | 12 (5.6%) | $0 |
| 6-Person Families | 6 (2.8%) | $0 |
| 7+ Person Families | 0 (0.0%) | $0 |
| Total | 216 (100.0%) | $68,636 |
Family Income by Number of Earners in Cooleemee
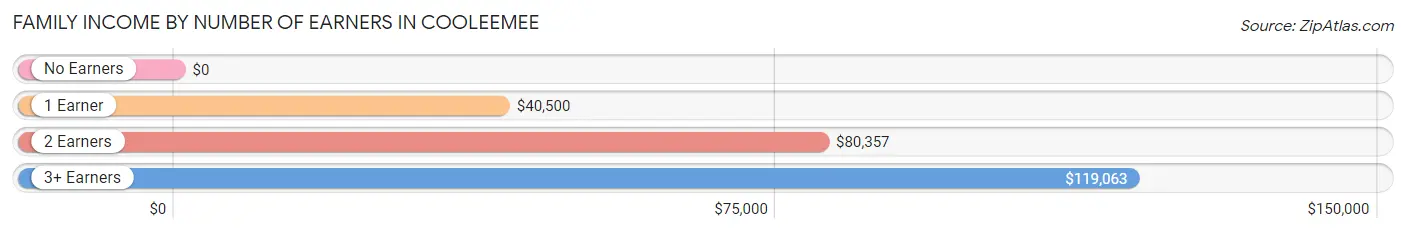
| Number of Earners | # Families | Median Income |
| No Earners | 31 (14.3%) | $0 |
| 1 Earner | 84 (38.9%) | $40,500 |
| 2 Earners | 76 (35.2%) | $80,357 |
| 3+ Earners | 25 (11.6%) | $119,063 |
| Total | 216 (100.0%) | $68,636 |
Household Income in Cooleemee
Household Income Brackets in Cooleemee
With 66 households falling in the category, the $75,000 to $99,999 income range is the most frequent in Cooleemee, accounting for 19.0% of all households. In contrast, only 7 households (2.0%) fall into the $200,000+ income bracket, making it the least populous group.
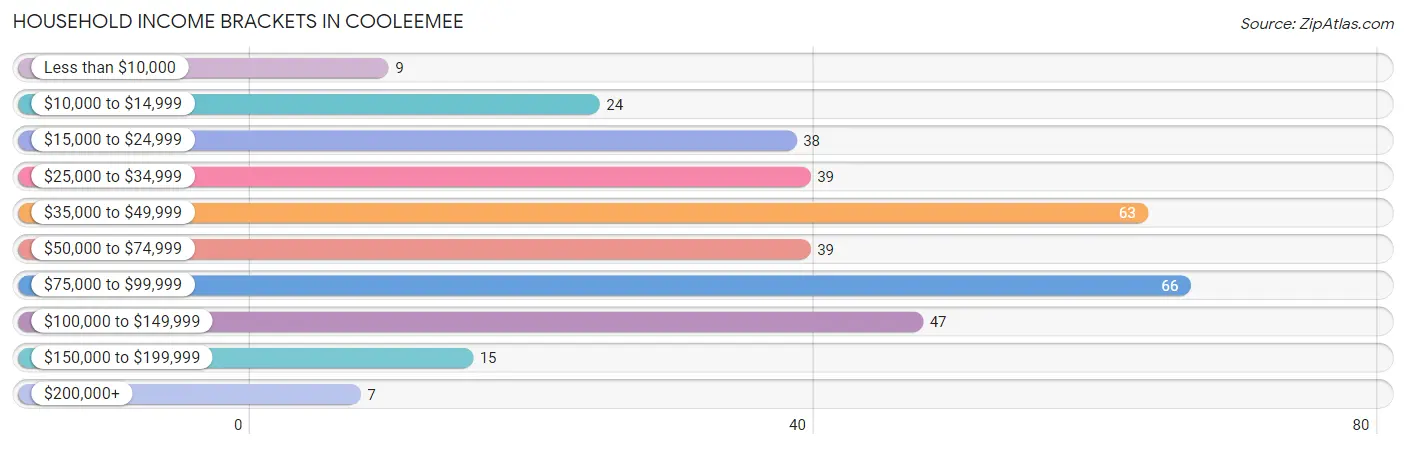
| Income Bracket | # Households | % Households |
| Less than $10,000 | 9 | 2.6% |
| $10,000 to $14,999 | 24 | 6.9% |
| $15,000 to $24,999 | 38 | 11.0% |
| $25,000 to $34,999 | 39 | 11.2% |
| $35,000 to $49,999 | 63 | 18.2% |
| $50,000 to $74,999 | 39 | 11.2% |
| $75,000 to $99,999 | 66 | 19.0% |
| $100,000 to $149,999 | 47 | 13.5% |
| $150,000 to $199,999 | 15 | 4.3% |
| $200,000+ | 7 | 2.0% |
Household Income by Householder Age in Cooleemee
The median household income in Cooleemee is $50,250, with the highest median household income of $77,083 found in the 45 to 64 years age bracket for the primary householder. A total of 116 households (33.4%) fall into this category. Meanwhile, the 15 to 24 years age bracket for the primary householder has the lowest median household income of $0, with 4 households (1.1%) in this group.
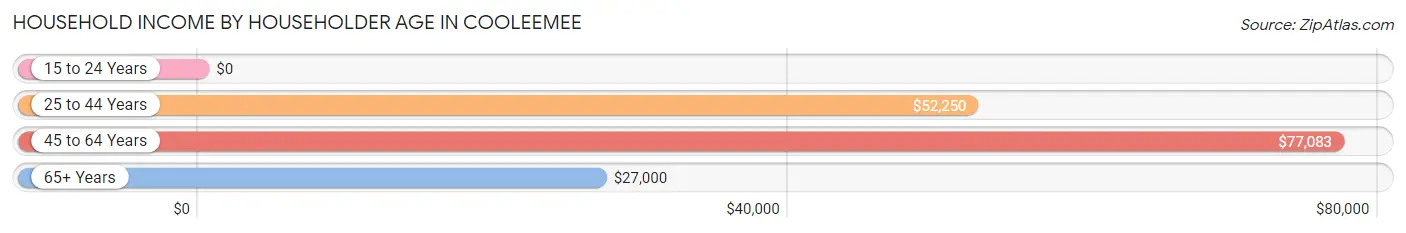
| Income Bracket | # Households | Median Income |
| 15 to 24 Years | 4 (1.1%) | $0 |
| 25 to 44 Years | 117 (33.7%) | $52,250 |
| 45 to 64 Years | 116 (33.4%) | $77,083 |
| 65+ Years | 110 (31.7%) | $27,000 |
| Total | 347 (100.0%) | $50,250 |
Poverty in Cooleemee
Income Below Poverty by Sex and Age in Cooleemee
With 8.1% poverty level for males and 16.5% for females among the residents of Cooleemee, 55 to 64 year old males and 6 to 11 year old females are the most vulnerable to poverty, with 13 males (20.0%) and 14 females (56.0%) in their respective age groups living below the poverty level.
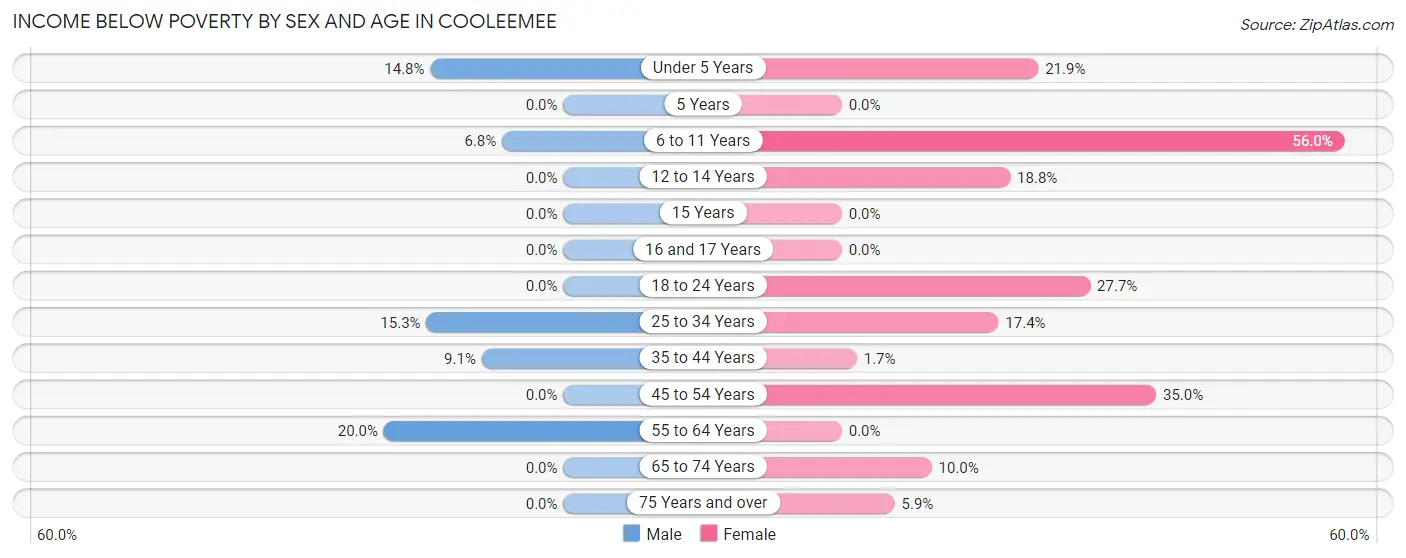
| Age Bracket | Male | Female |
| Under 5 Years | 4 (14.8%) | 7 (21.9%) |
| 5 Years | 0 (0.0%) | 0 (0.0%) |
| 6 to 11 Years | 3 (6.8%) | 14 (56.0%) |
| 12 to 14 Years | 0 (0.0%) | 6 (18.8%) |
| 15 Years | 0 (0.0%) | 0 (0.0%) |
| 16 and 17 Years | 0 (0.0%) | 0 (0.0%) |
| 18 to 24 Years | 0 (0.0%) | 13 (27.7%) |
| 25 to 34 Years | 9 (15.2%) | 15 (17.4%) |
| 35 to 44 Years | 4 (9.1%) | 1 (1.7%) |
| 45 to 54 Years | 0 (0.0%) | 14 (35.0%) |
| 55 to 64 Years | 13 (20.0%) | 0 (0.0%) |
| 65 to 74 Years | 0 (0.0%) | 5 (10.0%) |
| 75 Years and over | 0 (0.0%) | 2 (5.9%) |
| Total | 33 (8.1%) | 77 (16.5%) |
Income Above Poverty by Sex and Age in Cooleemee
According to the poverty statistics in Cooleemee, males aged 12 to 14 years and females aged 5 years are the age groups that are most secure financially, with 100.0% of males and 100.0% of females in these age groups living above the poverty line.
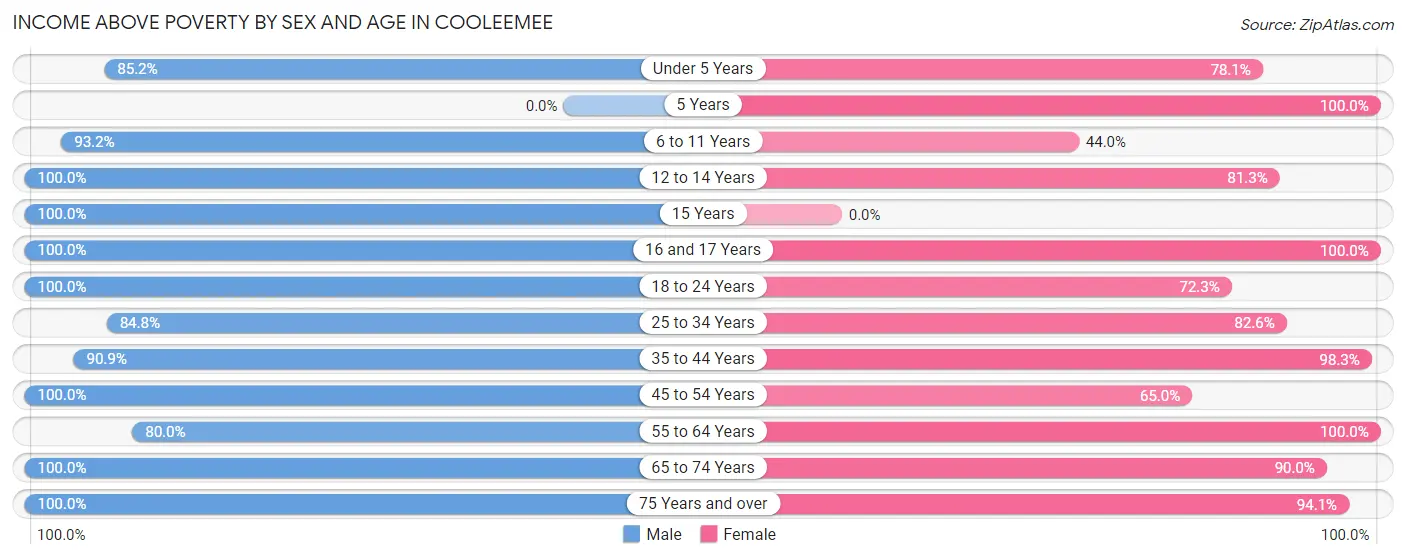
| Age Bracket | Male | Female |
| Under 5 Years | 23 (85.2%) | 25 (78.1%) |
| 5 Years | 0 (0.0%) | 11 (100.0%) |
| 6 to 11 Years | 41 (93.2%) | 11 (44.0%) |
| 12 to 14 Years | 22 (100.0%) | 26 (81.2%) |
| 15 Years | 4 (100.0%) | 0 (0.0%) |
| 16 and 17 Years | 11 (100.0%) | 18 (100.0%) |
| 18 to 24 Years | 31 (100.0%) | 34 (72.3%) |
| 25 to 34 Years | 50 (84.8%) | 71 (82.6%) |
| 35 to 44 Years | 40 (90.9%) | 59 (98.3%) |
| 45 to 54 Years | 28 (100.0%) | 26 (65.0%) |
| 55 to 64 Years | 52 (80.0%) | 32 (100.0%) |
| 65 to 74 Years | 51 (100.0%) | 45 (90.0%) |
| 75 Years and over | 22 (100.0%) | 32 (94.1%) |
| Total | 375 (91.9%) | 390 (83.5%) |
Income Below Poverty Among Married-Couple Families in Cooleemee
The poverty statistics for married-couple families in Cooleemee show that 3.1% or 4 of the total 128 families live below the poverty line. Families with 3 or 4 children have the highest poverty rate of 100.0%, comprising of 4 families. On the other hand, families with no children have the lowest poverty rate of 0.0%, which includes 0 families.
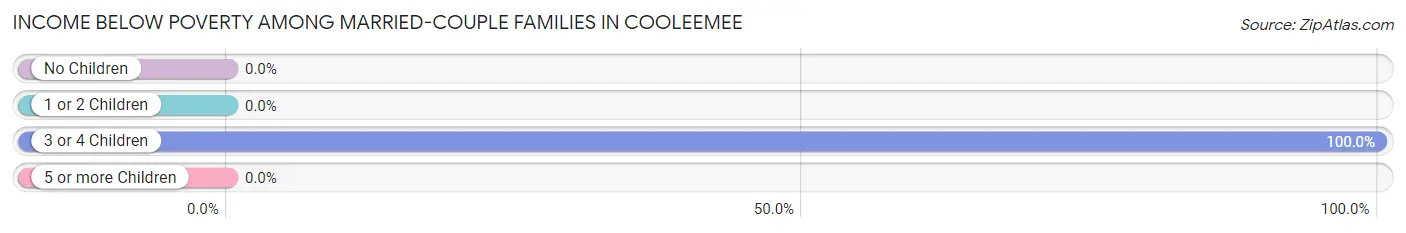
| Children | Above Poverty | Below Poverty |
| No Children | 71 (100.0%) | 0 (0.0%) |
| 1 or 2 Children | 53 (100.0%) | 0 (0.0%) |
| 3 or 4 Children | 0 (0.0%) | 4 (100.0%) |
| 5 or more Children | 0 (0.0%) | 0 (0.0%) |
| Total | 124 (96.9%) | 4 (3.1%) |
Income Below Poverty Among Single-Parent Households in Cooleemee
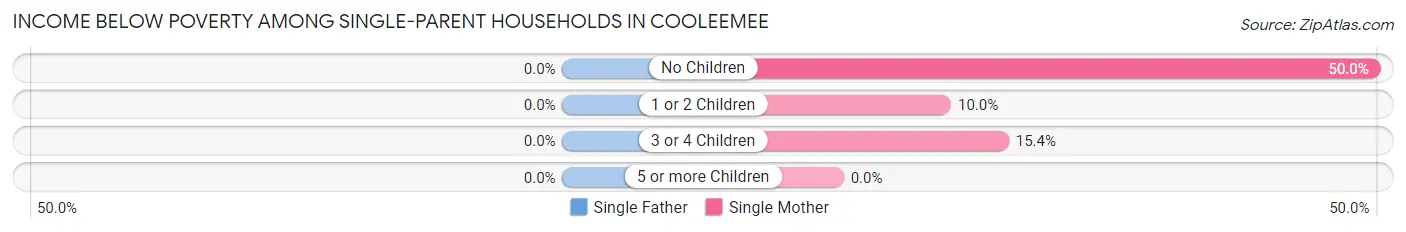
| Children | Single Father | Single Mother |
| No Children | 0 (0.0%) | 2 (50.0%) |
| 1 or 2 Children | 0 (0.0%) | 5 (10.0%) |
| 3 or 4 Children | 0 (0.0%) | 2 (15.4%) |
| 5 or more Children | 0 (0.0%) | 0 (0.0%) |
| Total | 0 (0.0%) | 9 (13.4%) |
Income Below Poverty Among Married-Couple vs Single-Parent Households in Cooleemee
The poverty data for Cooleemee shows that 4 of the married-couple family households (3.1%) and 9 of the single-parent households (10.2%) are living below the poverty level. Within the married-couple family households, those with 3 or 4 children have the highest poverty rate, with 4 households (100.0%) falling below the poverty line. Among the single-parent households, those with 3 or 4 children have the highest poverty rate, with 2 household (15.4%) living below poverty.
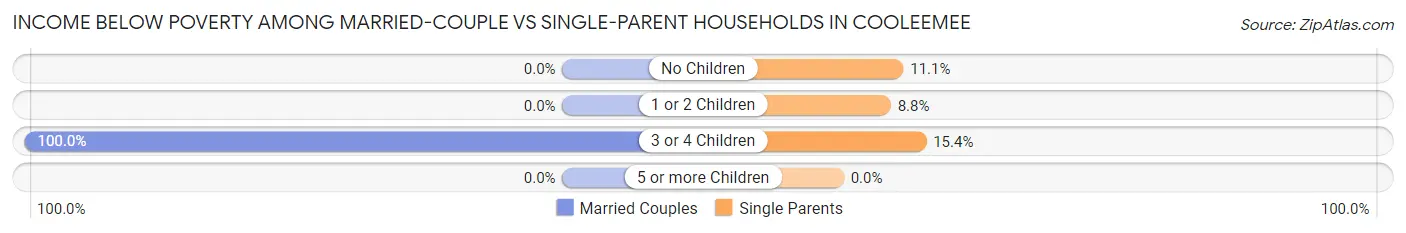
| Children | Married-Couple Families | Single-Parent Households |
| No Children | 0 (0.0%) | 2 (11.1%) |
| 1 or 2 Children | 0 (0.0%) | 5 (8.8%) |
| 3 or 4 Children | 4 (100.0%) | 2 (15.4%) |
| 5 or more Children | 0 (0.0%) | 0 (0.0%) |
| Total | 4 (3.1%) | 9 (10.2%) |
Race in Cooleemee
The most populous races in Cooleemee are White / Caucasian (619 | 70.7%), Two or more Races (139 | 15.9%), and Black / African American (84 | 9.6%).
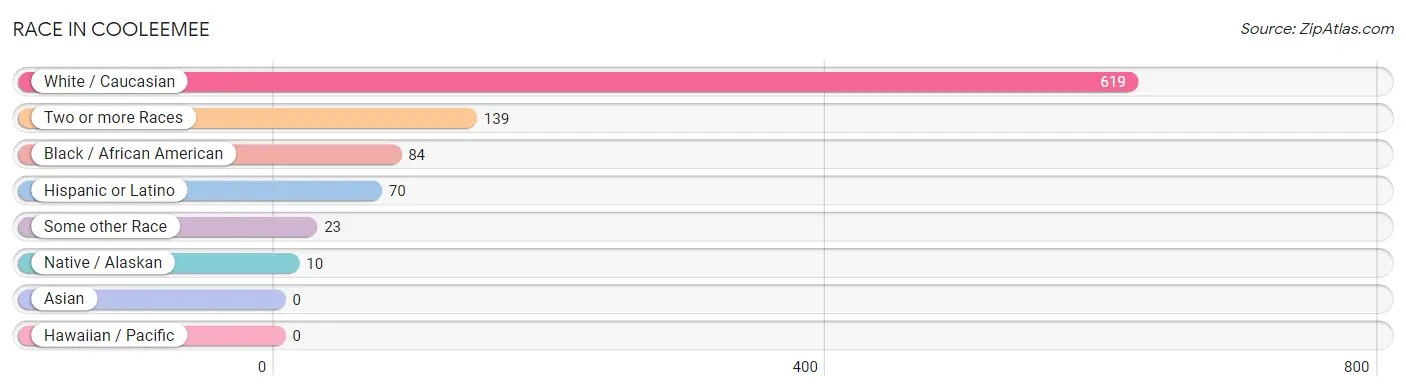
| Race | # Population | % Population |
| Asian | 0 | 0.0% |
| Black / African American | 84 | 9.6% |
| Hawaiian / Pacific | 0 | 0.0% |
| Hispanic or Latino | 70 | 8.0% |
| Native / Alaskan | 10 | 1.1% |
| White / Caucasian | 619 | 70.7% |
| Two or more Races | 139 | 15.9% |
| Some other Race | 23 | 2.6% |
| Total | 875 | 100.0% |
Ancestry in Cooleemee
The most populous ancestries reported in Cooleemee are German (180 | 20.6%), English (128 | 14.6%), Irish (122 | 13.9%), Cherokee (105 | 12.0%), and Scotch-Irish (78 | 8.9%), together accounting for 70.0% of all Cooleemee residents.
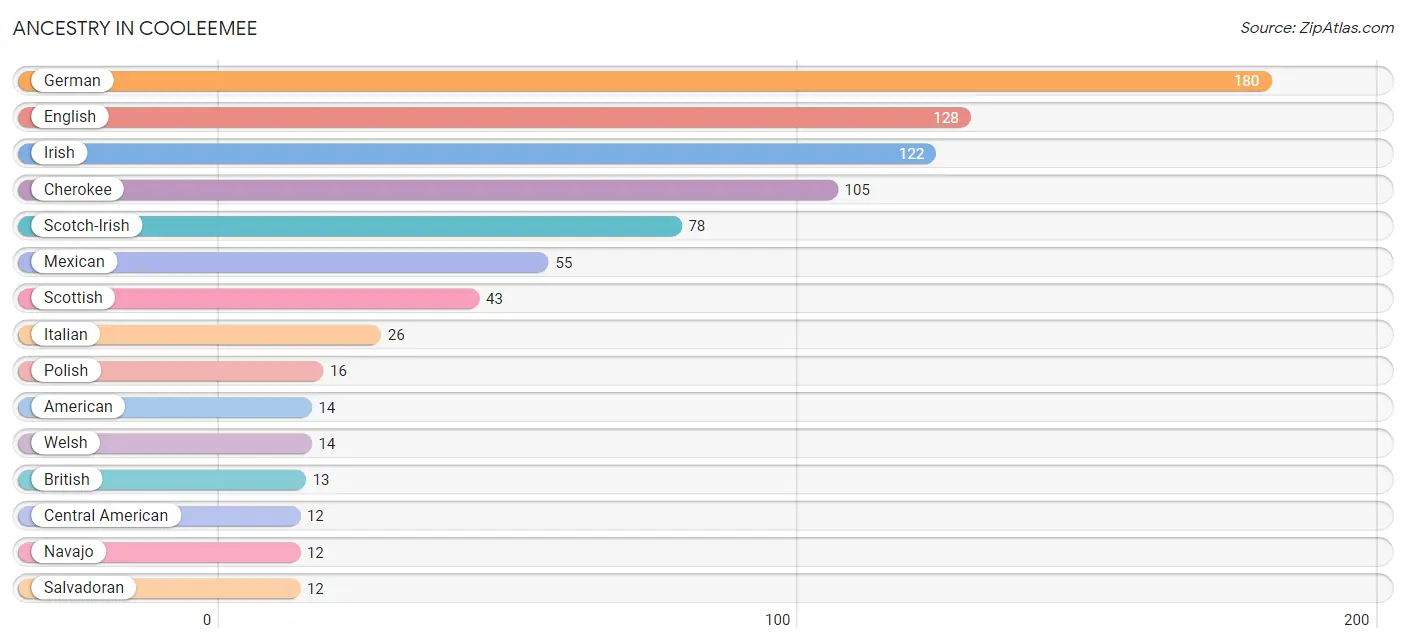
| Ancestry | # Population | % Population |
| African | 3 | 0.3% |
| American | 14 | 1.6% |
| Blackfeet | 7 | 0.8% |
| British | 13 | 1.5% |
| Central American | 12 | 1.4% |
| Cherokee | 105 | 12.0% |
| Colombian | 3 | 0.3% |
| Creek | 8 | 0.9% |
| Dutch | 5 | 0.6% |
| English | 128 | 14.6% |
| European | 11 | 1.3% |
| French | 11 | 1.3% |
| German | 180 | 20.6% |
| Irish | 122 | 13.9% |
| Italian | 26 | 3.0% |
| Lithuanian | 7 | 0.8% |
| Mexican | 55 | 6.3% |
| Navajo | 12 | 1.4% |
| Polish | 16 | 1.8% |
| Salvadoran | 12 | 1.4% |
| Scotch-Irish | 78 | 8.9% |
| Scottish | 43 | 4.9% |
| South American | 3 | 0.3% |
| Subsaharan African | 5 | 0.6% |
| Welsh | 14 | 1.6% | View All 25 Rows |
Immigrants in Cooleemee
The most numerous immigrant groups reported in Cooleemee came from Latin America (13 | 1.5%), Central America (10 | 1.1%), Mexico (10 | 1.1%), Europe (9 | 1.0%), and France (5 | 0.6%), together accounting for 5.4% of all Cooleemee residents.
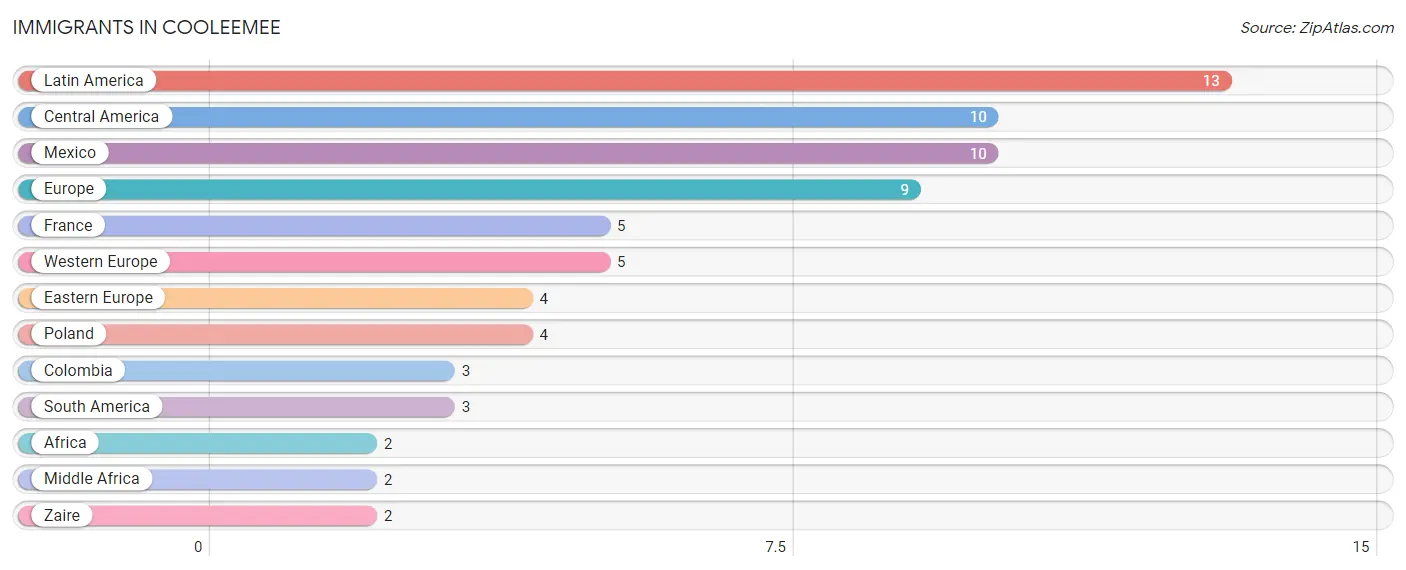
| Immigration Origin | # Population | % Population |
| Africa | 2 | 0.2% |
| Central America | 10 | 1.1% |
| Colombia | 3 | 0.3% |
| Eastern Europe | 4 | 0.5% |
| Europe | 9 | 1.0% |
| France | 5 | 0.6% |
| Latin America | 13 | 1.5% |
| Mexico | 10 | 1.1% |
| Middle Africa | 2 | 0.2% |
| Poland | 4 | 0.5% |
| South America | 3 | 0.3% |
| Western Europe | 5 | 0.6% |
| Zaire | 2 | 0.2% | View All 13 Rows |
Sex and Age in Cooleemee
Sex and Age in Cooleemee
The most populous age groups in Cooleemee are 55 to 59 Years (39 | 9.6%) for men and 30 to 34 Years (54 | 11.6%) for women.
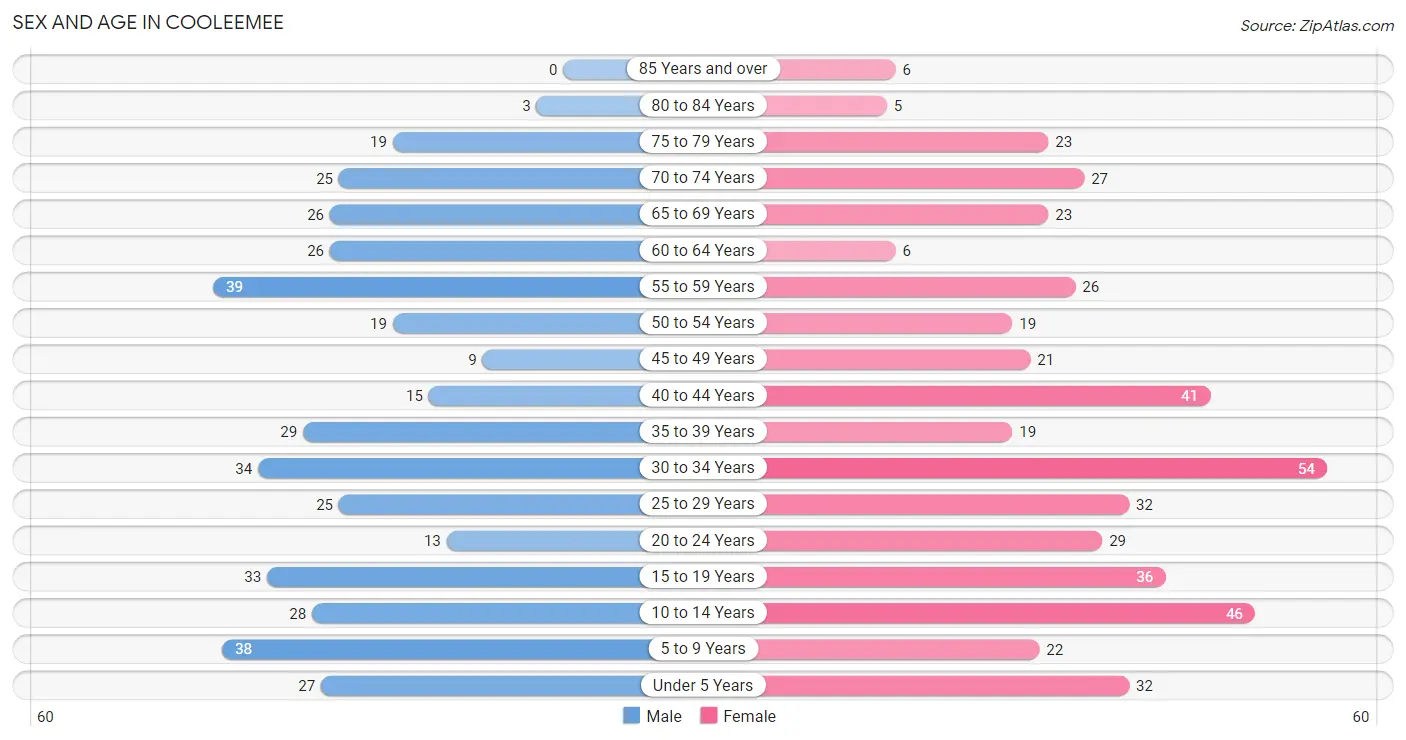
| Age Bracket | Male | Female |
| Under 5 Years | 27 (6.6%) | 32 (6.9%) |
| 5 to 9 Years | 38 (9.3%) | 22 (4.7%) |
| 10 to 14 Years | 28 (6.9%) | 46 (9.9%) |
| 15 to 19 Years | 33 (8.1%) | 36 (7.7%) |
| 20 to 24 Years | 13 (3.2%) | 29 (6.2%) |
| 25 to 29 Years | 25 (6.1%) | 32 (6.9%) |
| 30 to 34 Years | 34 (8.3%) | 54 (11.6%) |
| 35 to 39 Years | 29 (7.1%) | 19 (4.1%) |
| 40 to 44 Years | 15 (3.7%) | 41 (8.8%) |
| 45 to 49 Years | 9 (2.2%) | 21 (4.5%) |
| 50 to 54 Years | 19 (4.7%) | 19 (4.1%) |
| 55 to 59 Years | 39 (9.6%) | 26 (5.6%) |
| 60 to 64 Years | 26 (6.4%) | 6 (1.3%) |
| 65 to 69 Years | 26 (6.4%) | 23 (4.9%) |
| 70 to 74 Years | 25 (6.1%) | 27 (5.8%) |
| 75 to 79 Years | 19 (4.7%) | 23 (4.9%) |
| 80 to 84 Years | 3 (0.7%) | 5 (1.1%) |
| 85 Years and over | 0 (0.0%) | 6 (1.3%) |
| Total | 408 (100.0%) | 467 (100.0%) |
Families and Households in Cooleemee
Median Family Size in Cooleemee
The median family size in Cooleemee is 3.20 persons per family, with single female/mother families (67 | 31.0%) accounting for the largest median family size of 3.54 persons per family. On the other hand, single male/father families (21 | 9.7%) represent the smallest median family size with 2.19 persons per family.
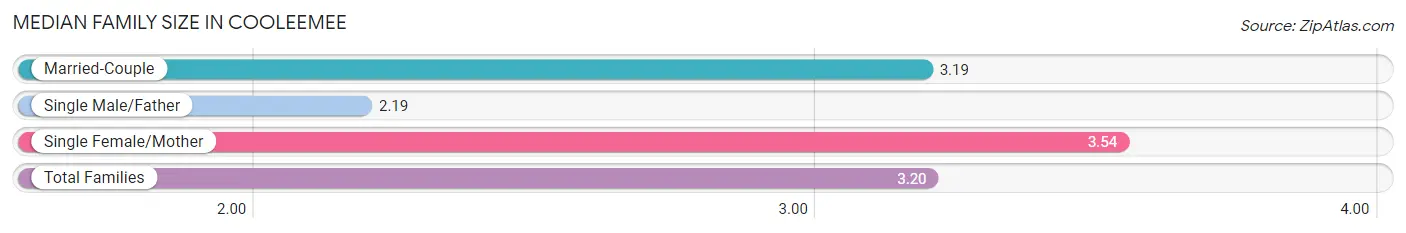
| Family Type | # Families | Family Size |
| Married-Couple | 128 (59.3%) | 3.19 |
| Single Male/Father | 21 (9.7%) | 2.19 |
| Single Female/Mother | 67 (31.0%) | 3.54 |
| Total Families | 216 (100.0%) | 3.20 |
Median Household Size in Cooleemee
The median household size in Cooleemee is 2.52 persons per household, with single female/mother households (67 | 19.3%) accounting for the largest median household size of 3.79 persons per household. non-family households (131 | 37.8%) represent the smallest median household size with 1.14 persons per household.
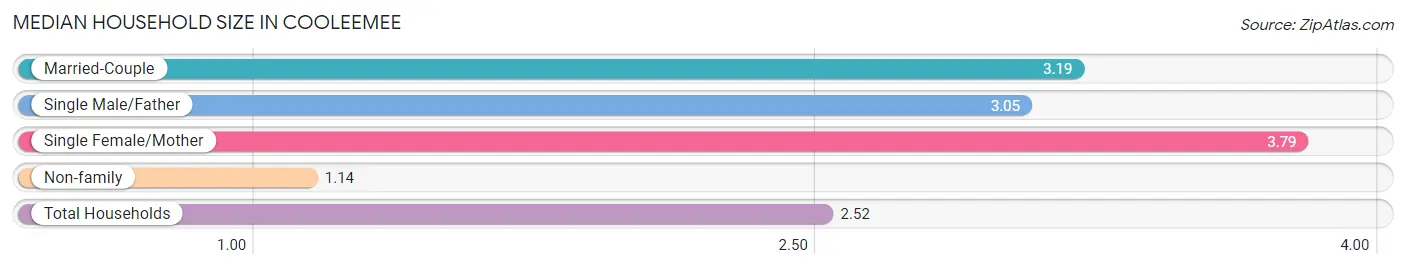
| Household Type | # Households | Household Size |
| Married-Couple | 128 (36.9%) | 3.19 |
| Single Male/Father | 21 (6.0%) | 3.05 |
| Single Female/Mother | 67 (19.3%) | 3.79 |
| Non-family | 131 (37.8%) | 1.14 |
| Total Households | 347 (100.0%) | 2.52 |
Household Size by Marriage Status in Cooleemee
Out of a total of 347 households in Cooleemee, 216 (62.3%) are family households, while 131 (37.8%) are nonfamily households. The most numerous type of family households are 2-person households, comprising 90, and the most common type of nonfamily households are 1-person households, comprising 121.
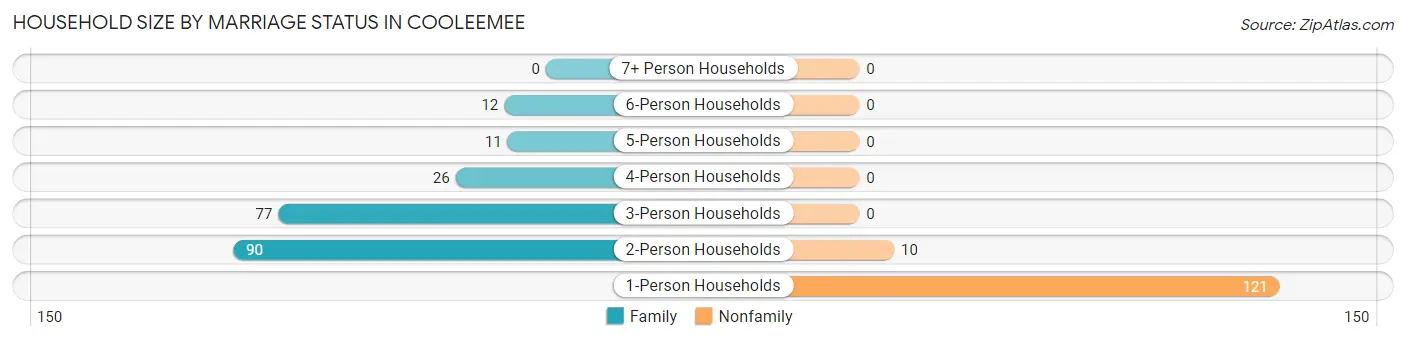
| Household Size | Family Households | Nonfamily Households |
| 1-Person Households | - | 121 (34.9%) |
| 2-Person Households | 90 (25.9%) | 10 (2.9%) |
| 3-Person Households | 77 (22.2%) | 0 (0.0%) |
| 4-Person Households | 26 (7.5%) | 0 (0.0%) |
| 5-Person Households | 11 (3.2%) | 0 (0.0%) |
| 6-Person Households | 12 (3.5%) | 0 (0.0%) |
| 7+ Person Households | 0 (0.0%) | 0 (0.0%) |
| Total | 216 (62.3%) | 131 (37.8%) |
Female Fertility in Cooleemee
Fertility by Age in Cooleemee
Average fertility rate in Cooleemee is 17.0 births per 1,000 women. Women in the age bracket of 20 to 34 years have the highest fertility rate with 35.0 births per 1,000 women. Women in the age bracket of 20 to 34 years acount for 100.0% of all women with births.
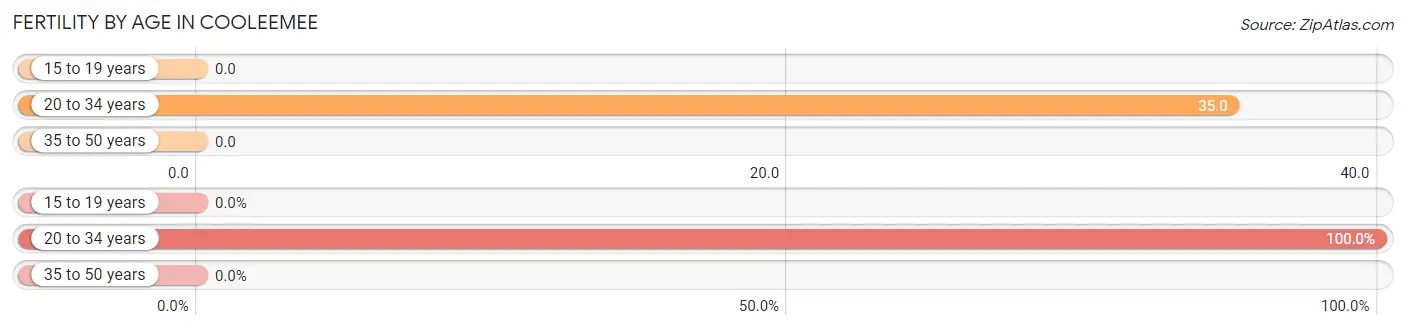
| Age Bracket | Women with Births | Births / 1,000 Women |
| 15 to 19 years | 0 (0.0%) | 0.0 |
| 20 to 34 years | 4 (100.0%) | 35.0 |
| 35 to 50 years | 0 (0.0%) | 0.0 |
| Total | 4 (100.0%) | 17.0 |
Fertility by Age by Marriage Status in Cooleemee
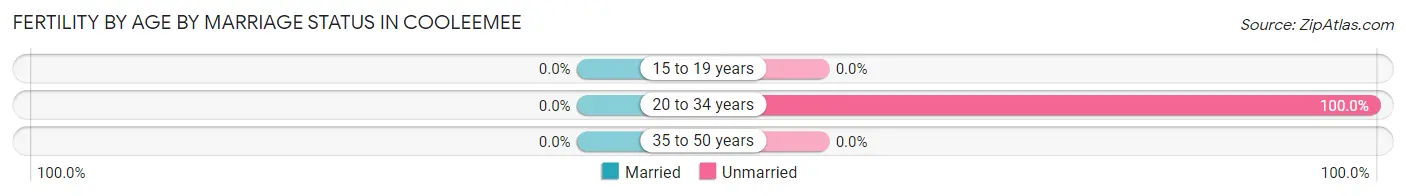
| Age Bracket | Married | Unmarried |
| 15 to 19 years | 0 (0.0%) | 0 (0.0%) |
| 20 to 34 years | 0 (0.0%) | 4 (100.0%) |
| 35 to 50 years | 0 (0.0%) | 0 (0.0%) |
| Total | 0 (0.0%) | 4 (100.0%) |
Fertility by Education in Cooleemee
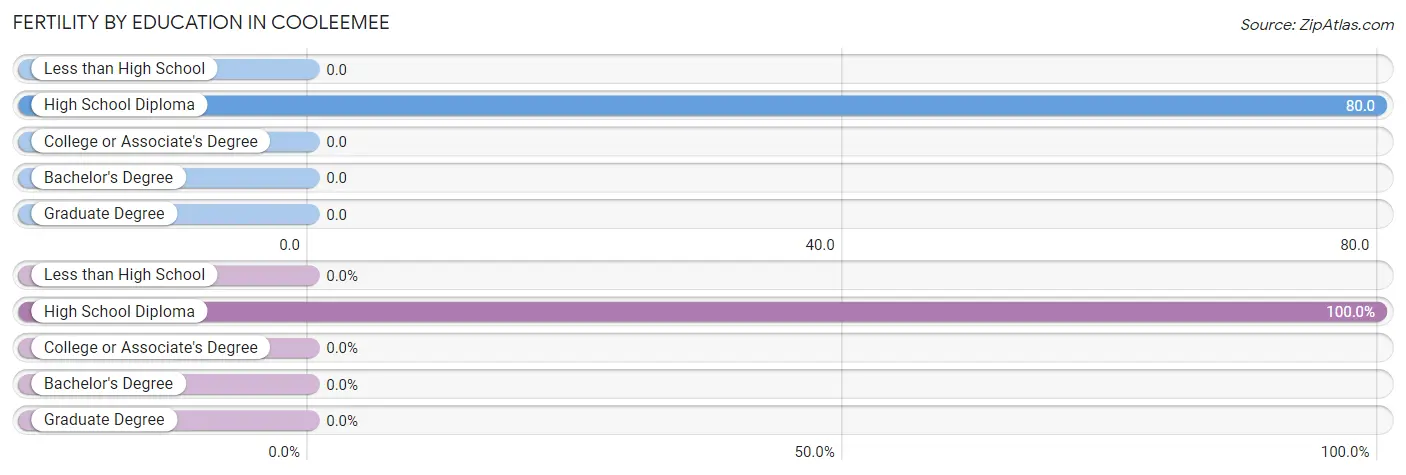
| Educational Attainment | Women with Births | Births / 1,000 Women |
| Less than High School | 0 (0.0%) | 0.0 |
| High School Diploma | 4 (100.0%) | 80.0 |
| College or Associate's Degree | 0 (0.0%) | 0.0 |
| Bachelor's Degree | 0 (0.0%) | 0.0 |
| Graduate Degree | 0 (0.0%) | 0.0 |
| Total | 4 (100.0%) | 17.0 |
Fertility by Education by Marriage Status in Cooleemee
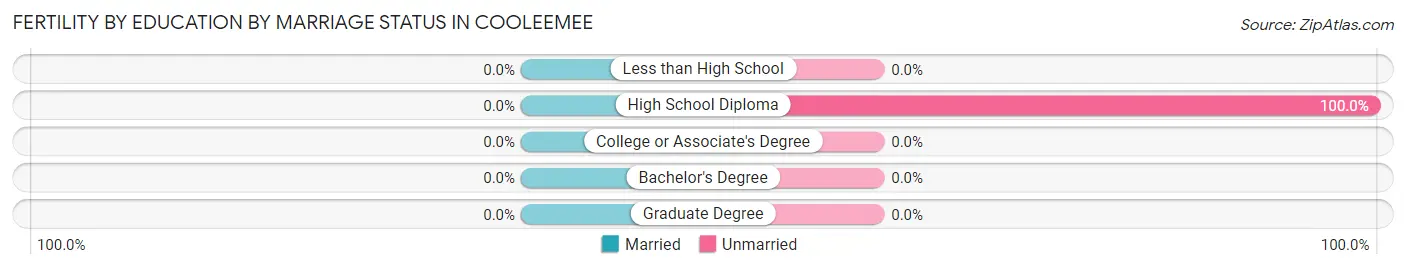
| Educational Attainment | Married | Unmarried |
| Less than High School | 0 (0.0%) | 0 (0.0%) |
| High School Diploma | 0 (0.0%) | 4 (100.0%) |
| College or Associate's Degree | 0 (0.0%) | 0 (0.0%) |
| Bachelor's Degree | 0 (0.0%) | 0 (0.0%) |
| Graduate Degree | 0 (0.0%) | 0 (0.0%) |
| Total | 0 (0.0%) | 4 (100.0%) |
Employment Characteristics in Cooleemee
Employment by Class of Employer in Cooleemee
Among the 385 employed individuals in Cooleemee, private company employees (269 | 69.9%), local government employees (38 | 9.9%), and self-employed (not incorporated) (33 | 8.6%) make up the most common classes of employment.
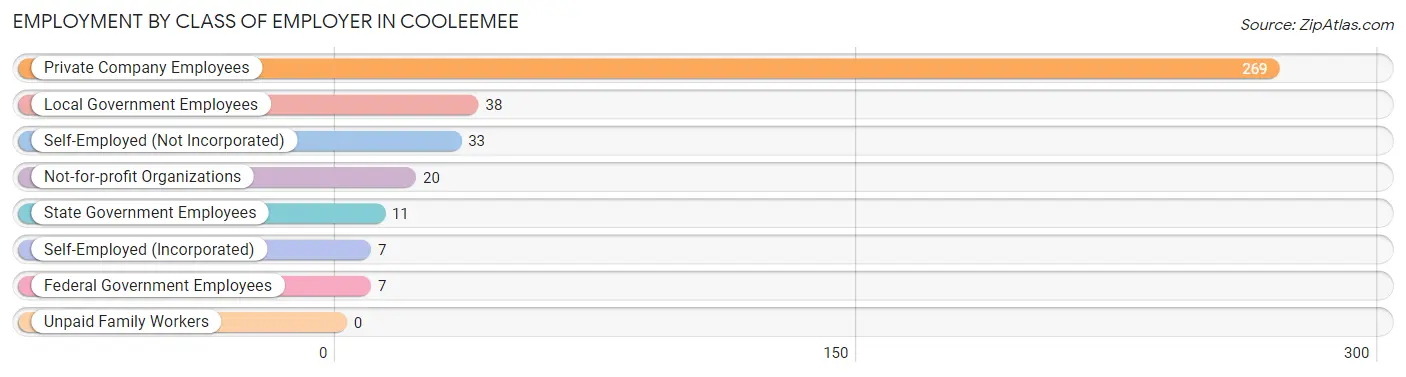
| Employer Class | # Employees | % Employees |
| Private Company Employees | 269 | 69.9% |
| Self-Employed (Incorporated) | 7 | 1.8% |
| Self-Employed (Not Incorporated) | 33 | 8.6% |
| Not-for-profit Organizations | 20 | 5.2% |
| Local Government Employees | 38 | 9.9% |
| State Government Employees | 11 | 2.9% |
| Federal Government Employees | 7 | 1.8% |
| Unpaid Family Workers | 0 | 0.0% |
| Total | 385 | 100.0% |
Employment Status by Age in Cooleemee
According to the labor force statistics for Cooleemee, out of the total population over 16 years of age (678), 65.3% or 443 individuals are in the labor force, with 3.4% or 15 of them unemployed. The age group with the highest labor force participation rate is 20 to 24 years, with 90.5% or 38 individuals in the labor force. Within the labor force, the 16 to 19 years age range has the highest percentage of unemployed individuals, with 18.0% or 9 of them being unemployed.
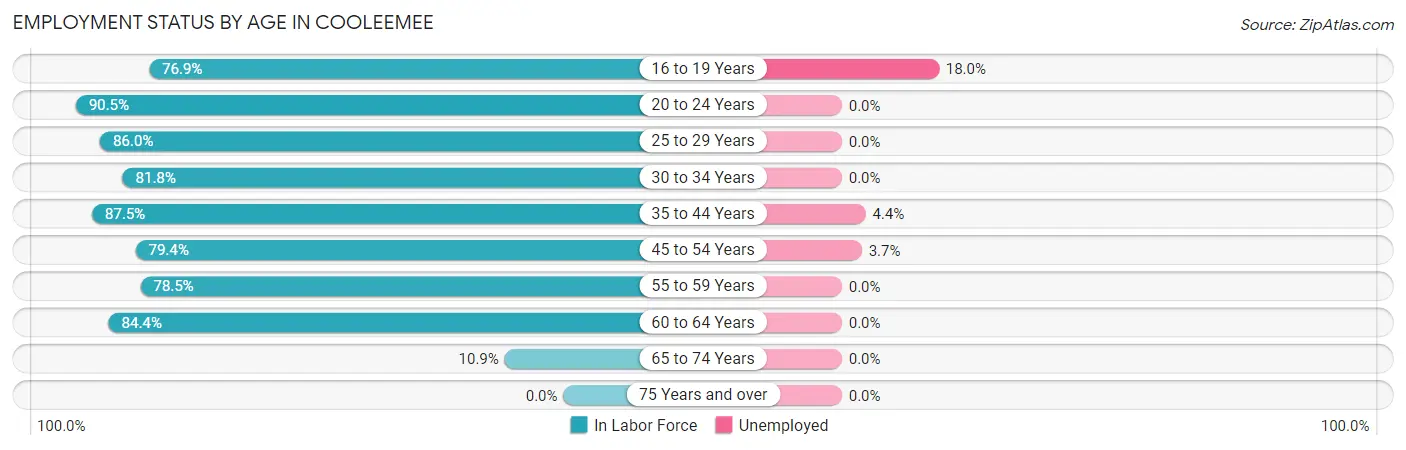
| Age Bracket | In Labor Force | Unemployed |
| 16 to 19 Years | 50 (76.9%) | 9 (18.0%) |
| 20 to 24 Years | 38 (90.5%) | 0 (0.0%) |
| 25 to 29 Years | 49 (86.0%) | 0 (0.0%) |
| 30 to 34 Years | 72 (81.8%) | 0 (0.0%) |
| 35 to 44 Years | 91 (87.5%) | 4 (4.4%) |
| 45 to 54 Years | 54 (79.4%) | 2 (3.7%) |
| 55 to 59 Years | 51 (78.5%) | 0 (0.0%) |
| 60 to 64 Years | 27 (84.4%) | 0 (0.0%) |
| 65 to 74 Years | 11 (10.9%) | 0 (0.0%) |
| 75 Years and over | 0 (0.0%) | 0 (0.0%) |
| Total | 443 (65.3%) | 15 (3.4%) |
Employment Status by Educational Attainment in Cooleemee
According to labor force statistics for Cooleemee, 83.1% of individuals (344) out of the total population between 25 and 64 years of age (414) are in the labor force, with 1.7% or 6 of them being unemployed. The group with the highest labor force participation rate are those with the educational attainment of college / associate degree, with 86.4% or 133 individuals in the labor force. Within the labor force, individuals with less than high school education have the highest percentage of unemployment, with 15.0% or 6 of them being unemployed.
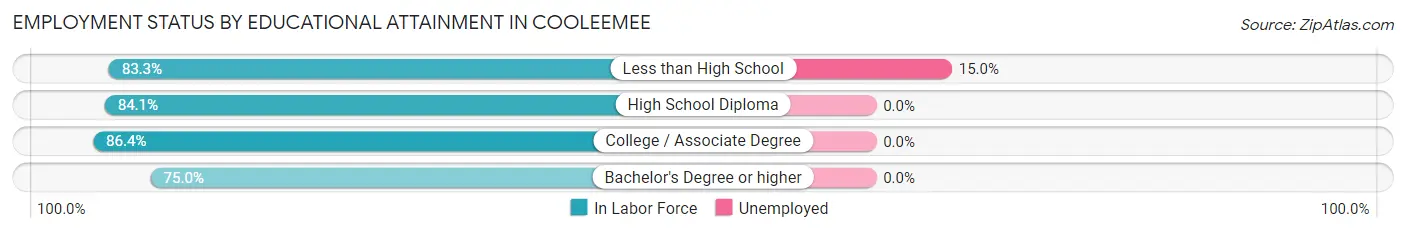
| Educational Attainment | In Labor Force | Unemployed |
| Less than High School | 40 (83.3%) | 7 (15.0%) |
| High School Diploma | 111 (84.1%) | 0 (0.0%) |
| College / Associate Degree | 133 (86.4%) | 0 (0.0%) |
| Bachelor's Degree or higher | 60 (75.0%) | 0 (0.0%) |
| Total | 344 (83.1%) | 7 (1.7%) |
Employment Occupations by Sex in Cooleemee
Management, Business, Science and Arts Occupations
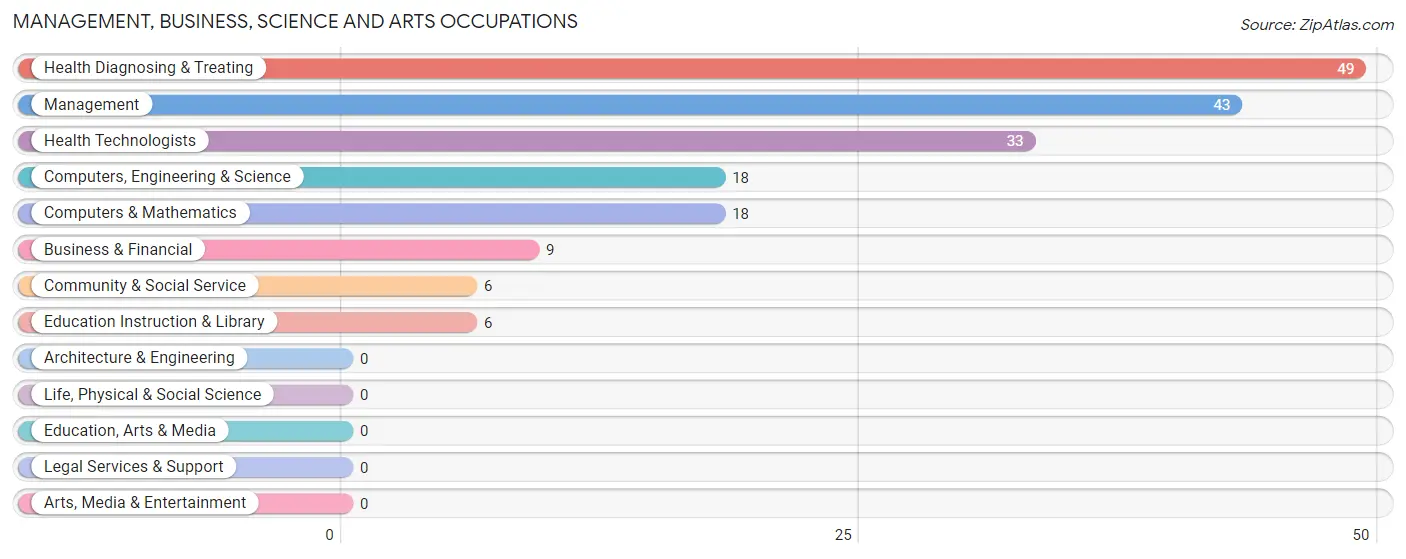
The most common Management, Business, Science and Arts occupations in Cooleemee are Health Diagnosing & Treating (49 | 11.5%), Management (43 | 10.1%), Health Technologists (33 | 7.7%), Computers, Engineering & Science (18 | 4.2%), and Computers & Mathematics (18 | 4.2%).
Management, Business, Science and Arts Occupations by Sex
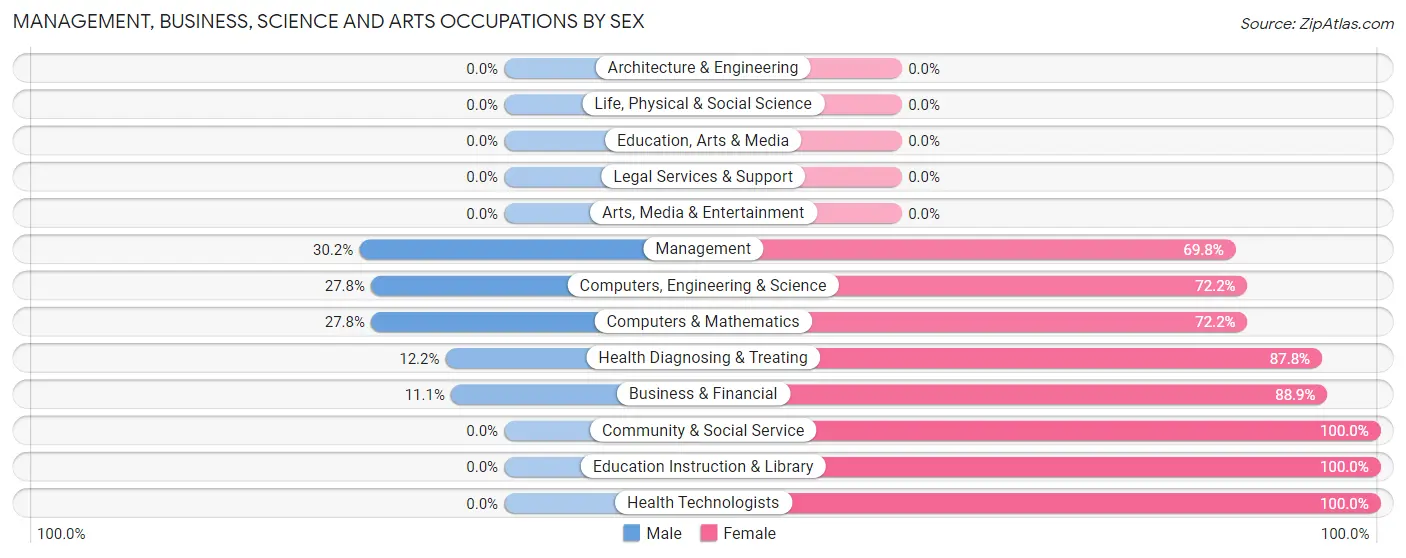
Within the Management, Business, Science and Arts occupations in Cooleemee, the most male-oriented occupations are Management (30.2%), Computers, Engineering & Science (27.8%), and Computers & Mathematics (27.8%), while the most female-oriented occupations are Community & Social Service (100.0%), Education Instruction & Library (100.0%), and Health Technologists (100.0%).
| Occupation | Male | Female |
| Management | 13 (30.2%) | 30 (69.8%) |
| Business & Financial | 1 (11.1%) | 8 (88.9%) |
| Computers, Engineering & Science | 5 (27.8%) | 13 (72.2%) |
| Computers & Mathematics | 5 (27.8%) | 13 (72.2%) |
| Architecture & Engineering | 0 (0.0%) | 0 (0.0%) |
| Life, Physical & Social Science | 0 (0.0%) | 0 (0.0%) |
| Community & Social Service | 0 (0.0%) | 6 (100.0%) |
| Education, Arts & Media | 0 (0.0%) | 0 (0.0%) |
| Legal Services & Support | 0 (0.0%) | 0 (0.0%) |
| Education Instruction & Library | 0 (0.0%) | 6 (100.0%) |
| Arts, Media & Entertainment | 0 (0.0%) | 0 (0.0%) |
| Health Diagnosing & Treating | 6 (12.2%) | 43 (87.8%) |
| Health Technologists | 0 (0.0%) | 33 (100.0%) |
| Total (Category) | 25 (20.0%) | 100 (80.0%) |
| Total (Overall) | 205 (47.9%) | 223 (52.1%) |
Services Occupations
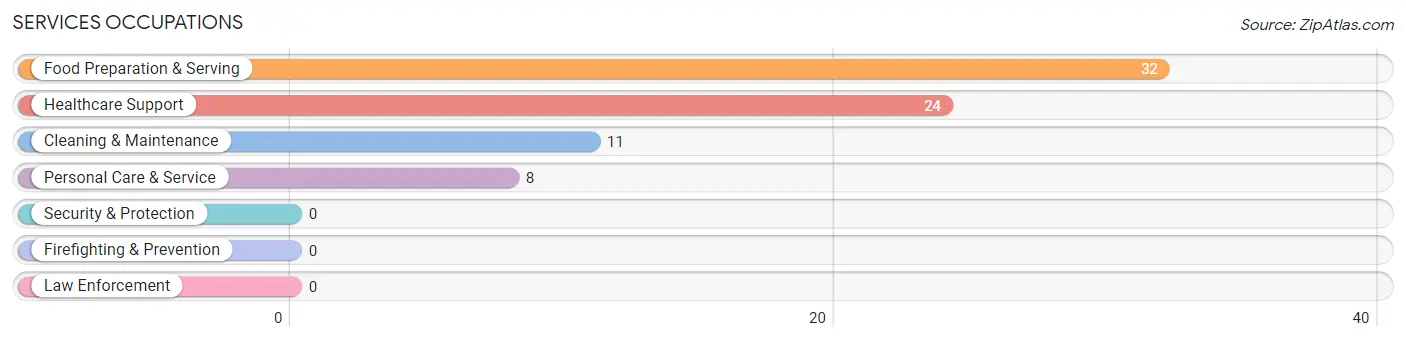
The most common Services occupations in Cooleemee are Food Preparation & Serving (32 | 7.5%), Healthcare Support (24 | 5.6%), Cleaning & Maintenance (11 | 2.6%), and Personal Care & Service (8 | 1.9%).
Services Occupations by Sex
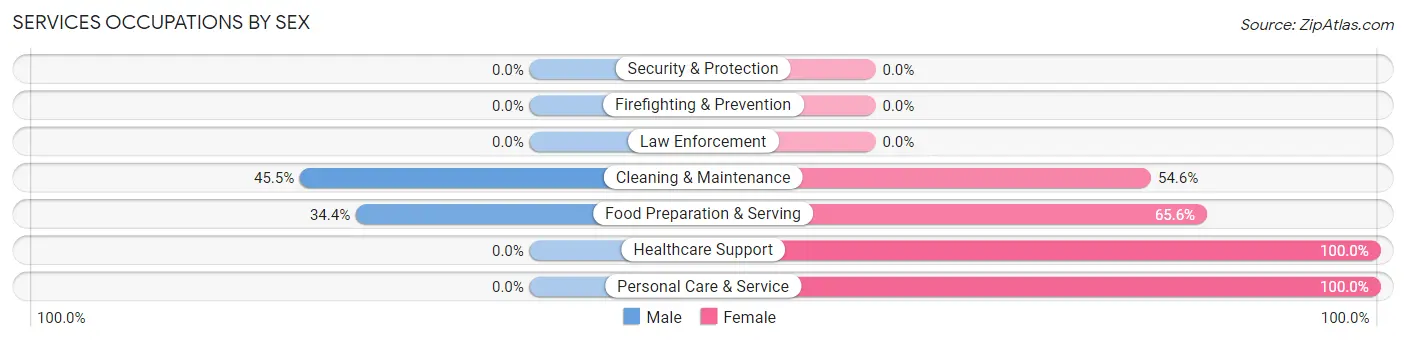
Within the Services occupations in Cooleemee, the most male-oriented occupations are Cleaning & Maintenance (45.5%), and Food Preparation & Serving (34.4%), while the most female-oriented occupations are Healthcare Support (100.0%), Personal Care & Service (100.0%), and Food Preparation & Serving (65.6%).
| Occupation | Male | Female |
| Healthcare Support | 0 (0.0%) | 24 (100.0%) |
| Security & Protection | 0 (0.0%) | 0 (0.0%) |
| Firefighting & Prevention | 0 (0.0%) | 0 (0.0%) |
| Law Enforcement | 0 (0.0%) | 0 (0.0%) |
| Food Preparation & Serving | 11 (34.4%) | 21 (65.6%) |
| Cleaning & Maintenance | 5 (45.5%) | 6 (54.5%) |
| Personal Care & Service | 0 (0.0%) | 8 (100.0%) |
| Total (Category) | 16 (21.3%) | 59 (78.7%) |
| Total (Overall) | 205 (47.9%) | 223 (52.1%) |
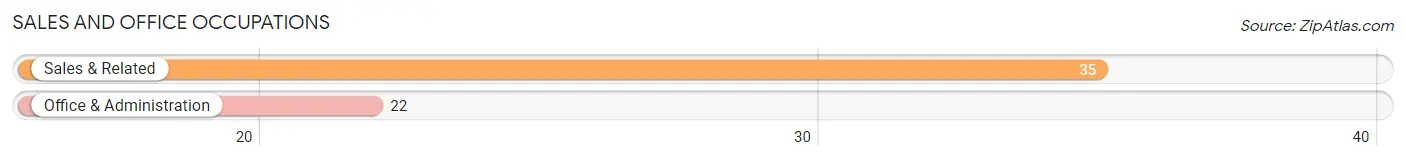
Sales and Office Occupations
The most common Sales and Office occupations in Cooleemee are Sales & Related (35 | 8.2%), and Office & Administration (22 | 5.1%).
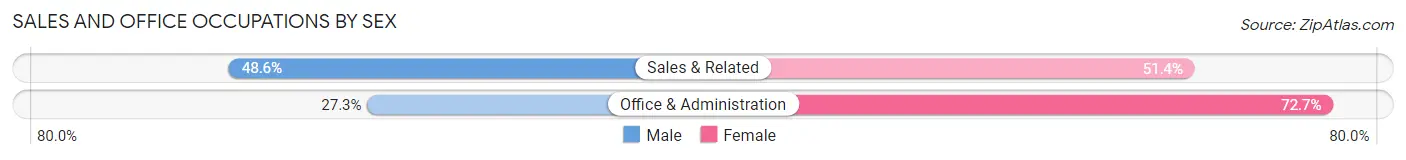
Sales and Office Occupations by Sex
| Occupation | Male | Female |
| Sales & Related | 17 (48.6%) | 18 (51.4%) |
| Office & Administration | 6 (27.3%) | 16 (72.7%) |
| Total (Category) | 23 (40.4%) | 34 (59.7%) |
| Total (Overall) | 205 (47.9%) | 223 (52.1%) |
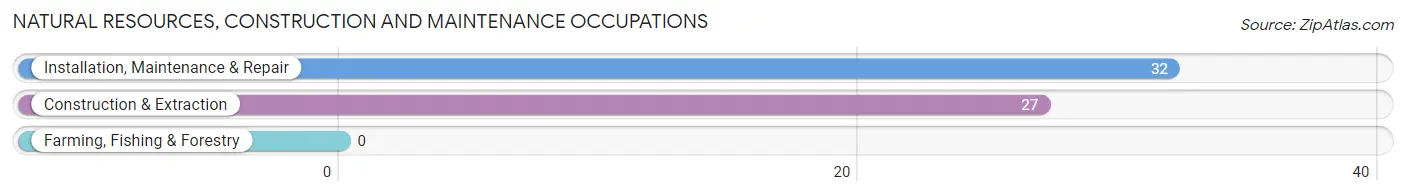
Natural Resources, Construction and Maintenance Occupations
The most common Natural Resources, Construction and Maintenance occupations in Cooleemee are Installation, Maintenance & Repair (32 | 7.5%), and Construction & Extraction (27 | 6.3%).
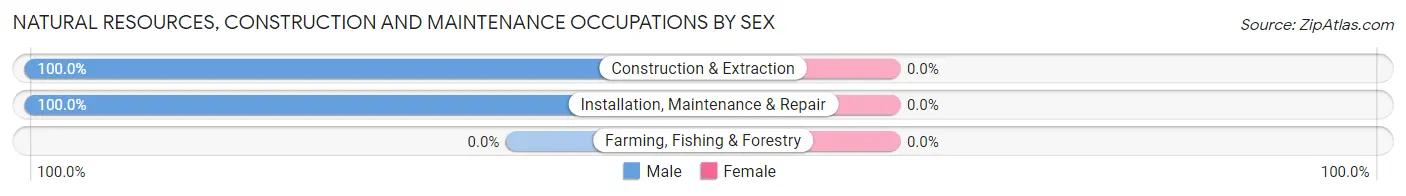
Natural Resources, Construction and Maintenance Occupations by Sex
| Occupation | Male | Female |
| Farming, Fishing & Forestry | 0 (0.0%) | 0 (0.0%) |
| Construction & Extraction | 27 (100.0%) | 0 (0.0%) |
| Installation, Maintenance & Repair | 32 (100.0%) | 0 (0.0%) |
| Total (Category) | 59 (100.0%) | 0 (0.0%) |
| Total (Overall) | 205 (47.9%) | 223 (52.1%) |
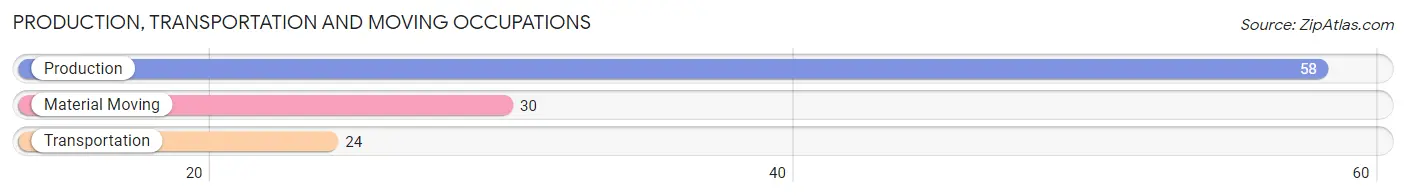
Production, Transportation and Moving Occupations
The most common Production, Transportation and Moving occupations in Cooleemee are Production (58 | 13.6%), Material Moving (30 | 7.0%), and Transportation (24 | 5.6%).
Production, Transportation and Moving Occupations by Sex
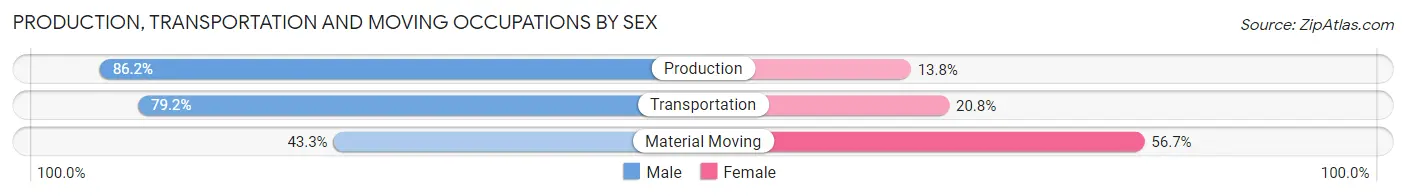
| Occupation | Male | Female |
| Production | 50 (86.2%) | 8 (13.8%) |
| Transportation | 19 (79.2%) | 5 (20.8%) |
| Material Moving | 13 (43.3%) | 17 (56.7%) |
| Total (Category) | 82 (73.2%) | 30 (26.8%) |
| Total (Overall) | 205 (47.9%) | 223 (52.1%) |
Employment Industries by Sex in Cooleemee
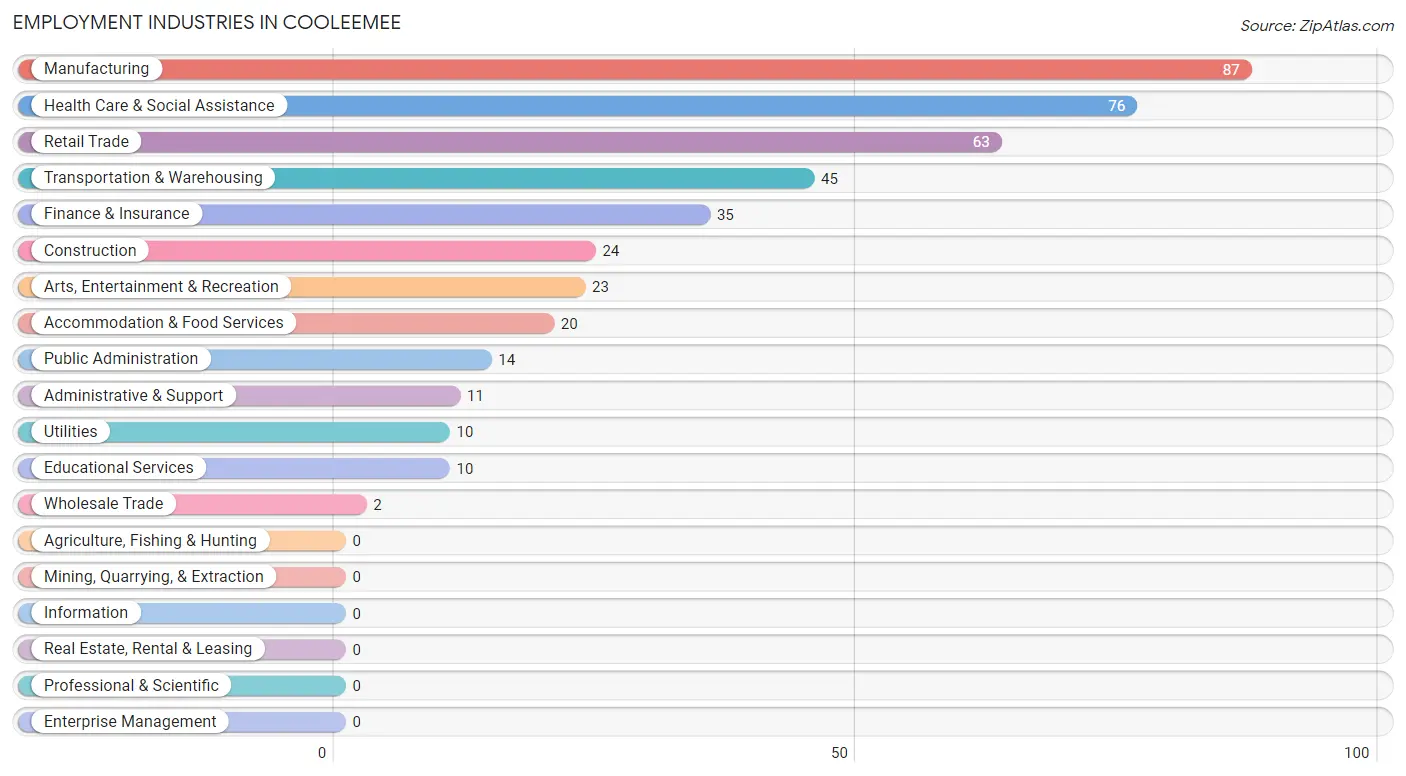
Employment Industries in Cooleemee
The major employment industries in Cooleemee include Manufacturing (87 | 20.3%), Health Care & Social Assistance (76 | 17.8%), Retail Trade (63 | 14.7%), Transportation & Warehousing (45 | 10.5%), and Finance & Insurance (35 | 8.2%).
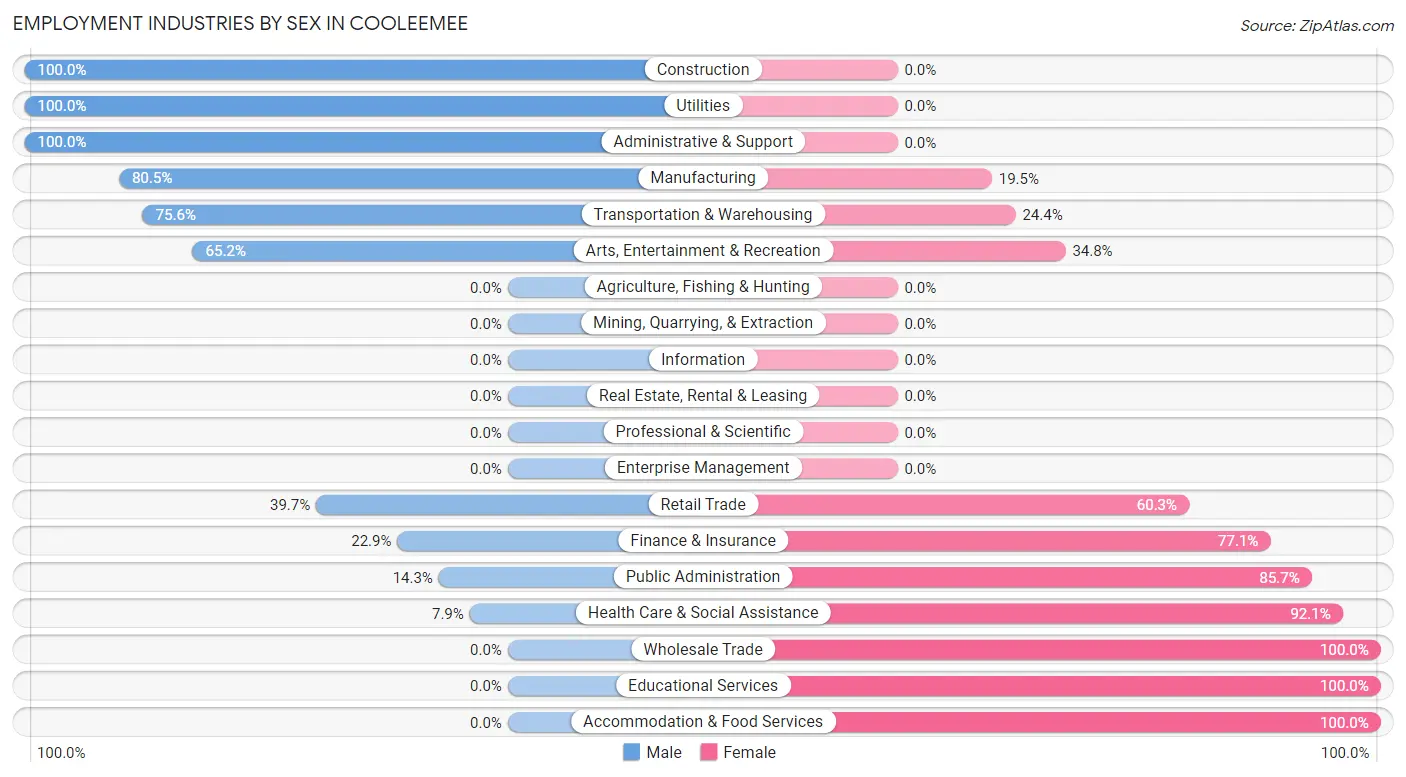
Employment Industries by Sex in Cooleemee
The Cooleemee industries that see more men than women are Construction (100.0%), Utilities (100.0%), and Administrative & Support (100.0%), whereas the industries that tend to have a higher number of women are Wholesale Trade (100.0%), Educational Services (100.0%), and Accommodation & Food Services (100.0%).
| Industry | Male | Female |
| Agriculture, Fishing & Hunting | 0 (0.0%) | 0 (0.0%) |
| Mining, Quarrying, & Extraction | 0 (0.0%) | 0 (0.0%) |
| Construction | 24 (100.0%) | 0 (0.0%) |
| Manufacturing | 70 (80.5%) | 17 (19.5%) |
| Wholesale Trade | 0 (0.0%) | 2 (100.0%) |
| Retail Trade | 25 (39.7%) | 38 (60.3%) |
| Transportation & Warehousing | 34 (75.6%) | 11 (24.4%) |
| Utilities | 10 (100.0%) | 0 (0.0%) |
| Information | 0 (0.0%) | 0 (0.0%) |
| Finance & Insurance | 8 (22.9%) | 27 (77.1%) |
| Real Estate, Rental & Leasing | 0 (0.0%) | 0 (0.0%) |
| Professional & Scientific | 0 (0.0%) | 0 (0.0%) |
| Enterprise Management | 0 (0.0%) | 0 (0.0%) |
| Administrative & Support | 11 (100.0%) | 0 (0.0%) |
| Educational Services | 0 (0.0%) | 10 (100.0%) |
| Health Care & Social Assistance | 6 (7.9%) | 70 (92.1%) |
| Arts, Entertainment & Recreation | 15 (65.2%) | 8 (34.8%) |
| Accommodation & Food Services | 0 (0.0%) | 20 (100.0%) |
| Public Administration | 2 (14.3%) | 12 (85.7%) |
| Total | 205 (47.9%) | 223 (52.1%) |
Education in Cooleemee
School Enrollment in Cooleemee
The most common levels of schooling among the 248 students in Cooleemee are middle school (66 | 26.6%), college / undergraduate (56 | 22.6%), and elementary school (54 | 21.8%).
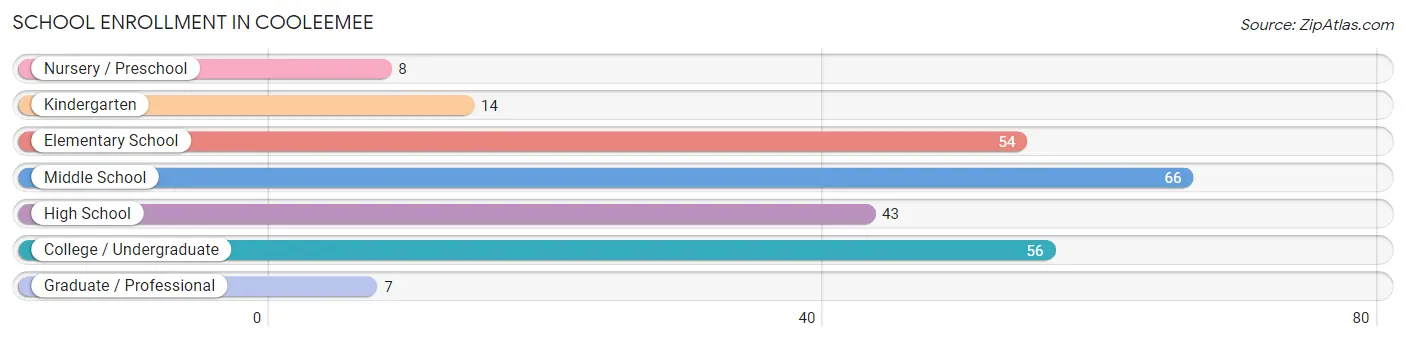
| School Level | # Students | % Students |
| Nursery / Preschool | 8 | 3.2% |
| Kindergarten | 14 | 5.7% |
| Elementary School | 54 | 21.8% |
| Middle School | 66 | 26.6% |
| High School | 43 | 17.3% |
| College / Undergraduate | 56 | 22.6% |
| Graduate / Professional | 7 | 2.8% |
| Total | 248 | 100.0% |
School Enrollment by Age by Funding Source in Cooleemee
Out of a total of 248 students who are enrolled in schools in Cooleemee, 31 (12.5%) attend a private institution, while the remaining 217 (87.5%) are enrolled in public schools. The age group of 5 to 9 year old has the highest likelihood of being enrolled in private schools, with 14 (23.3% in the age bracket) enrolled. Conversely, the age group of 3 to 4 year olds has the lowest likelihood of being enrolled in a private school, with 8 (100.0% in the age bracket) attending a public institution.
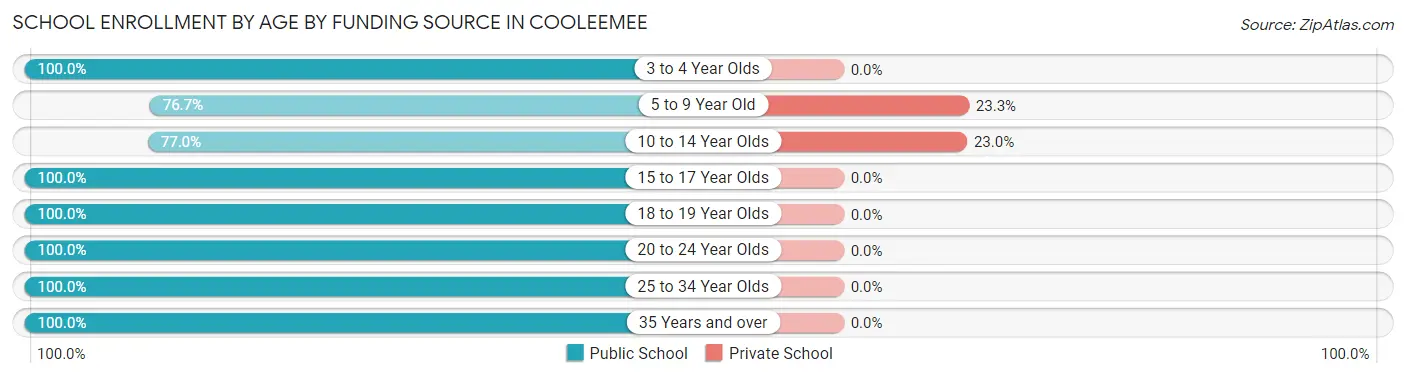
| Age Bracket | Public School | Private School |
| 3 to 4 Year Olds | 8 (100.0%) | 0 (0.0%) |
| 5 to 9 Year Old | 46 (76.7%) | 14 (23.3%) |
| 10 to 14 Year Olds | 57 (77.0%) | 17 (23.0%) |
| 15 to 17 Year Olds | 33 (100.0%) | 0 (0.0%) |
| 18 to 19 Year Olds | 10 (100.0%) | 0 (0.0%) |
| 20 to 24 Year Olds | 16 (100.0%) | 0 (0.0%) |
| 25 to 34 Year Olds | 39 (100.0%) | 0 (0.0%) |
| 35 Years and over | 8 (100.0%) | 0 (0.0%) |
| Total | 217 (87.5%) | 31 (12.5%) |
Educational Attainment by Field of Study in Cooleemee
Computers & mathematics (18 | 18.0%), social sciences (15 | 15.0%), arts & humanities (15 | 15.0%), business (13 | 13.0%), and science & technology (10 | 10.0%) are the most common fields of study among 100 individuals in Cooleemee who have obtained a bachelor's degree or higher.
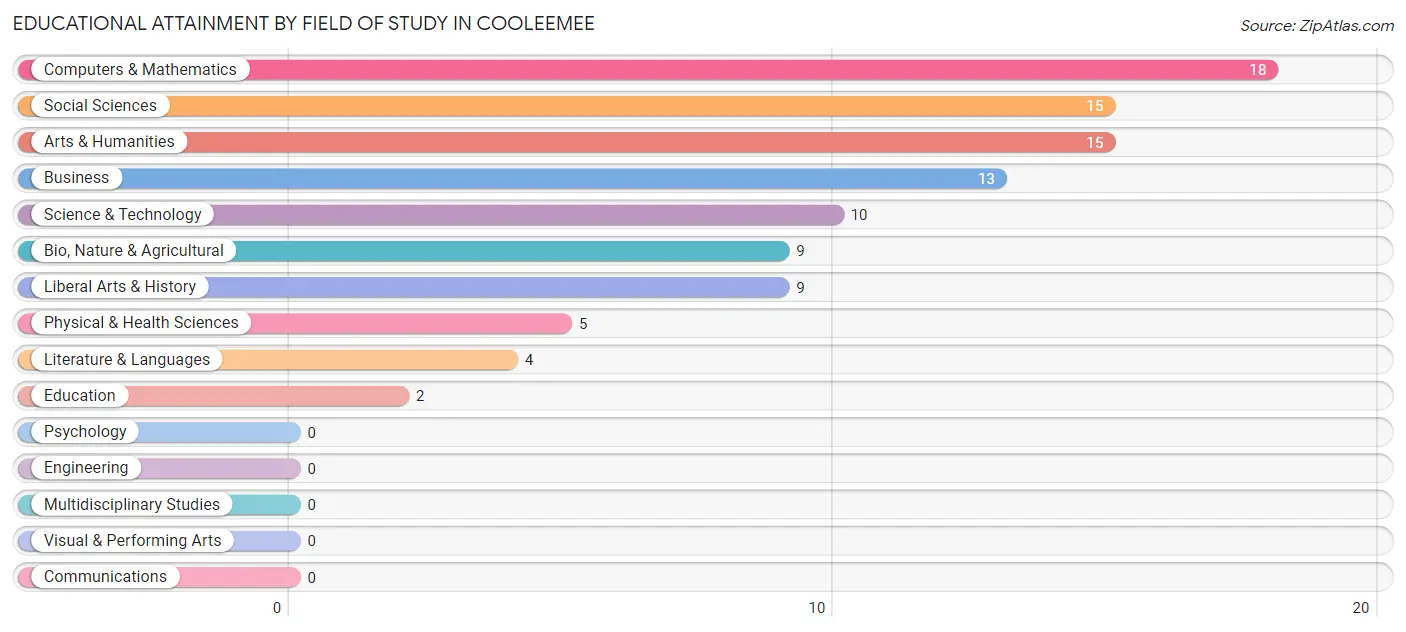
| Field of Study | # Graduates | % Graduates |
| Computers & Mathematics | 18 | 18.0% |
| Bio, Nature & Agricultural | 9 | 9.0% |
| Physical & Health Sciences | 5 | 5.0% |
| Psychology | 0 | 0.0% |
| Social Sciences | 15 | 15.0% |
| Engineering | 0 | 0.0% |
| Multidisciplinary Studies | 0 | 0.0% |
| Science & Technology | 10 | 10.0% |
| Business | 13 | 13.0% |
| Education | 2 | 2.0% |
| Literature & Languages | 4 | 4.0% |
| Liberal Arts & History | 9 | 9.0% |
| Visual & Performing Arts | 0 | 0.0% |
| Communications | 0 | 0.0% |
| Arts & Humanities | 15 | 15.0% |
| Total | 100 | 100.0% |
Transportation & Commute in Cooleemee
Vehicle Availability by Sex in Cooleemee
The most prevalent vehicle ownership categories in Cooleemee are males with 2 vehicles (56, accounting for 30.1%) and females with 2 vehicles (77, making up 28.1%).
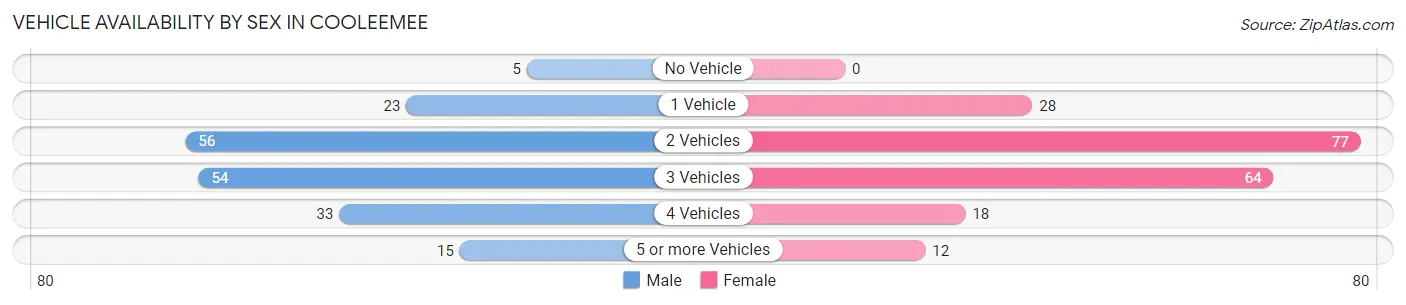
| Vehicles Available | Male | Female |
| No Vehicle | 5 (2.7%) | 0 (0.0%) |
| 1 Vehicle | 23 (12.4%) | 28 (14.1%) |
| 2 Vehicles | 56 (30.1%) | 77 (38.7%) |
| 3 Vehicles | 54 (29.0%) | 64 (32.2%) |
| 4 Vehicles | 33 (17.7%) | 18 (9.0%) |
| 5 or more Vehicles | 15 (8.1%) | 12 (6.0%) |
| Total | 186 (100.0%) | 199 (100.0%) |
Commute Time in Cooleemee
The most frequently occuring commute durations in Cooleemee are 15 to 19 minutes (78 commuters, 20.5%), 20 to 24 minutes (58 commuters, 15.2%), and 45 to 59 minutes (55 commuters, 14.4%).
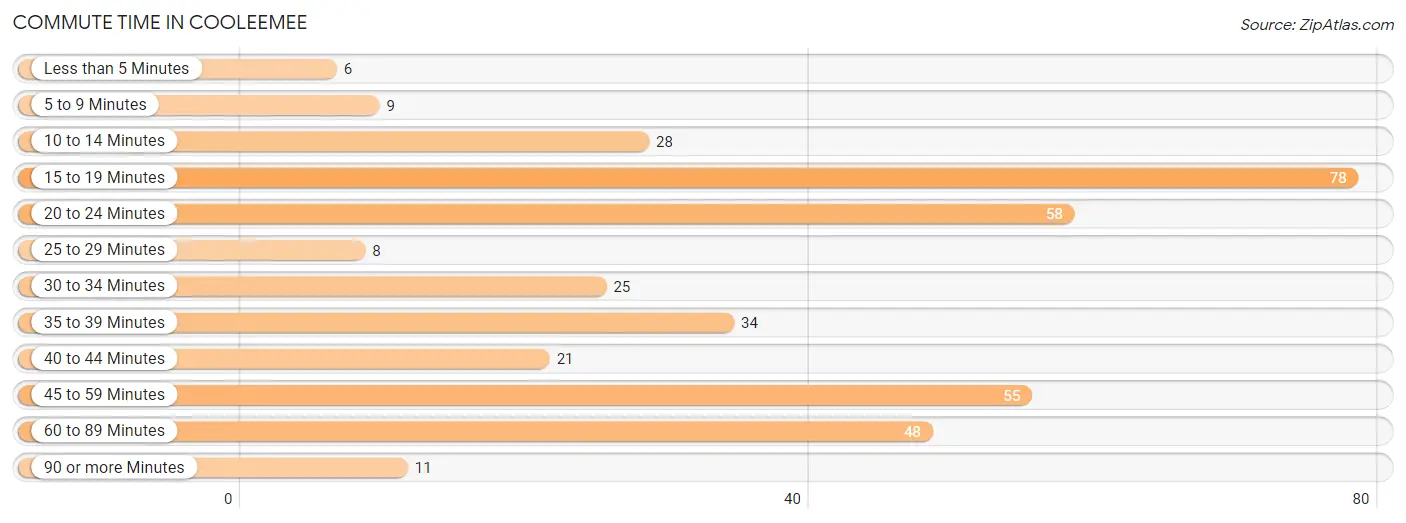
| Commute Time | # Commuters | % Commuters |
| Less than 5 Minutes | 6 | 1.6% |
| 5 to 9 Minutes | 9 | 2.4% |
| 10 to 14 Minutes | 28 | 7.3% |
| 15 to 19 Minutes | 78 | 20.5% |
| 20 to 24 Minutes | 58 | 15.2% |
| 25 to 29 Minutes | 8 | 2.1% |
| 30 to 34 Minutes | 25 | 6.6% |
| 35 to 39 Minutes | 34 | 8.9% |
| 40 to 44 Minutes | 21 | 5.5% |
| 45 to 59 Minutes | 55 | 14.4% |
| 60 to 89 Minutes | 48 | 12.6% |
| 90 or more Minutes | 11 | 2.9% |
Commute Time by Sex in Cooleemee
The most common commute times in Cooleemee are 15 to 19 minutes (51 commuters, 27.4%) for males and 45 to 59 minutes (36 commuters, 18.5%) for females.
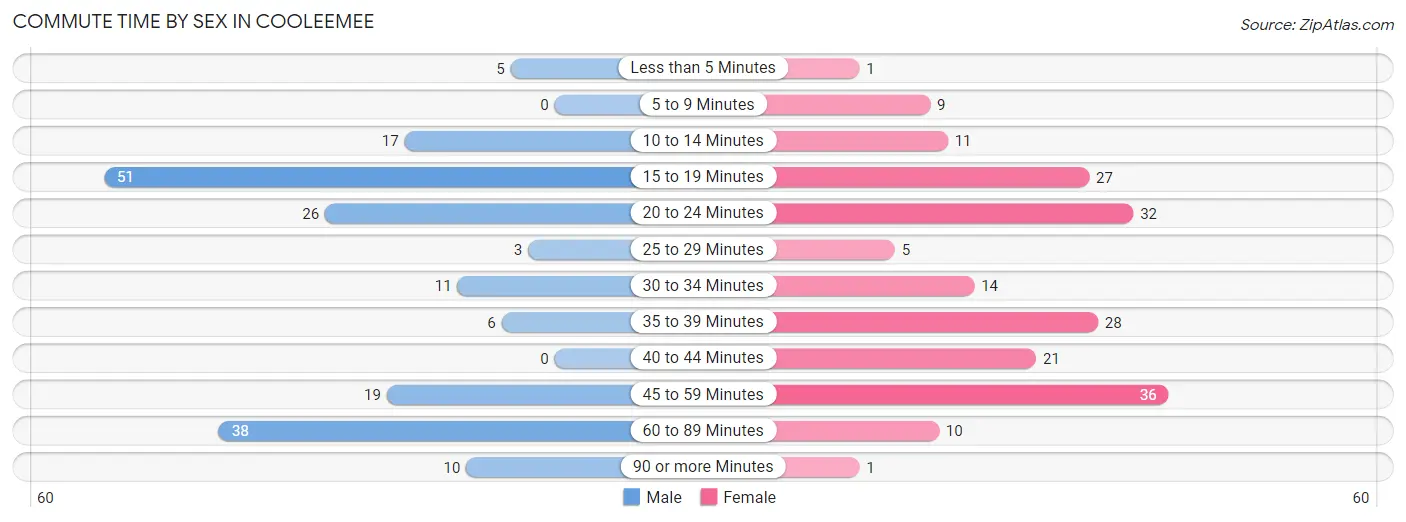
| Commute Time | Male | Female |
| Less than 5 Minutes | 5 (2.7%) | 1 (0.5%) |
| 5 to 9 Minutes | 0 (0.0%) | 9 (4.6%) |
| 10 to 14 Minutes | 17 (9.1%) | 11 (5.6%) |
| 15 to 19 Minutes | 51 (27.4%) | 27 (13.9%) |
| 20 to 24 Minutes | 26 (14.0%) | 32 (16.4%) |
| 25 to 29 Minutes | 3 (1.6%) | 5 (2.6%) |
| 30 to 34 Minutes | 11 (5.9%) | 14 (7.2%) |
| 35 to 39 Minutes | 6 (3.2%) | 28 (14.4%) |
| 40 to 44 Minutes | 0 (0.0%) | 21 (10.8%) |
| 45 to 59 Minutes | 19 (10.2%) | 36 (18.5%) |
| 60 to 89 Minutes | 38 (20.4%) | 10 (5.1%) |
| 90 or more Minutes | 10 (5.4%) | 1 (0.5%) |
Time of Departure to Work by Sex in Cooleemee
The most frequent times of departure to work in Cooleemee are 5:30 AM to 5:59 AM (44, 23.7%) for males and 7:00 AM to 7:29 AM (48, 24.6%) for females.
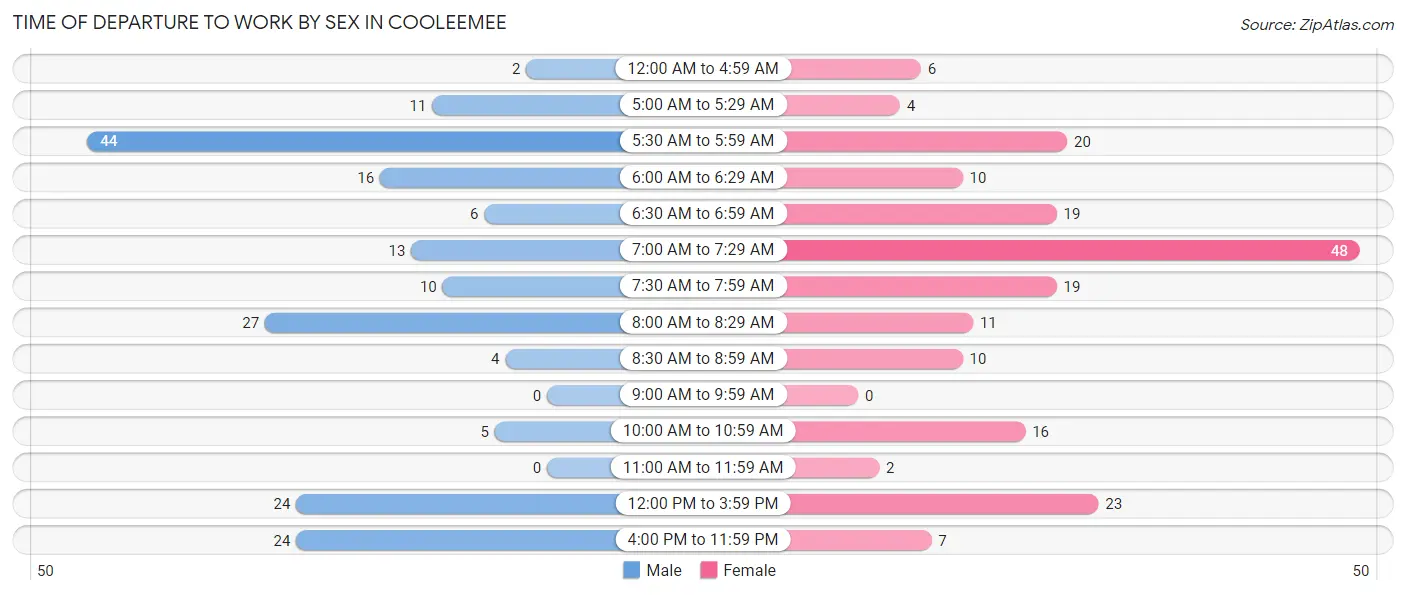
| Time of Departure | Male | Female |
| 12:00 AM to 4:59 AM | 2 (1.1%) | 6 (3.1%) |
| 5:00 AM to 5:29 AM | 11 (5.9%) | 4 (2.1%) |
| 5:30 AM to 5:59 AM | 44 (23.7%) | 20 (10.3%) |
| 6:00 AM to 6:29 AM | 16 (8.6%) | 10 (5.1%) |
| 6:30 AM to 6:59 AM | 6 (3.2%) | 19 (9.7%) |
| 7:00 AM to 7:29 AM | 13 (7.0%) | 48 (24.6%) |
| 7:30 AM to 7:59 AM | 10 (5.4%) | 19 (9.7%) |
| 8:00 AM to 8:29 AM | 27 (14.5%) | 11 (5.6%) |
| 8:30 AM to 8:59 AM | 4 (2.1%) | 10 (5.1%) |
| 9:00 AM to 9:59 AM | 0 (0.0%) | 0 (0.0%) |
| 10:00 AM to 10:59 AM | 5 (2.7%) | 16 (8.2%) |
| 11:00 AM to 11:59 AM | 0 (0.0%) | 2 (1.0%) |
| 12:00 PM to 3:59 PM | 24 (12.9%) | 23 (11.8%) |
| 4:00 PM to 11:59 PM | 24 (12.9%) | 7 (3.6%) |
| Total | 186 (100.0%) | 195 (100.0%) |
Housing Occupancy in Cooleemee
Occupancy by Ownership in Cooleemee
Of the total 347 dwellings in Cooleemee, owner-occupied units account for 247 (71.2%), while renter-occupied units make up 100 (28.8%).
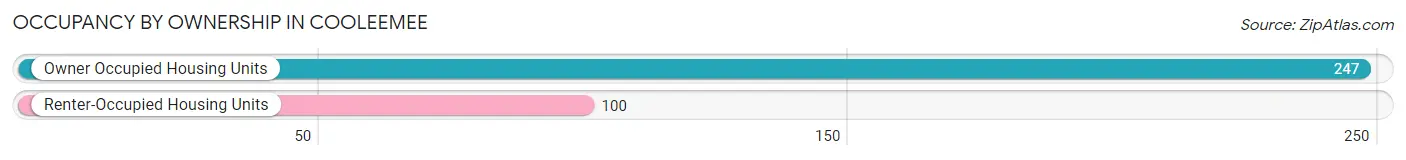
| Occupancy | # Housing Units | % Housing Units |
| Owner Occupied Housing Units | 247 | 71.2% |
| Renter-Occupied Housing Units | 100 | 28.8% |
| Total Occupied Housing Units | 347 | 100.0% |
Occupancy by Household Size in Cooleemee
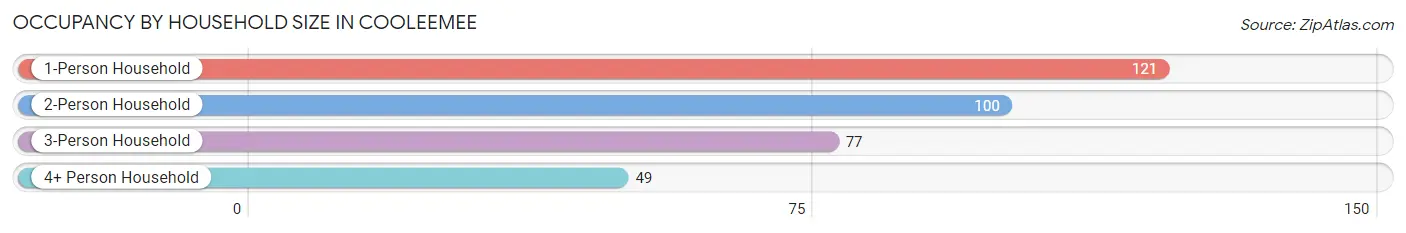
| Household Size | # Housing Units | % Housing Units |
| 1-Person Household | 121 | 34.9% |
| 2-Person Household | 100 | 28.8% |
| 3-Person Household | 77 | 22.2% |
| 4+ Person Household | 49 | 14.1% |
| Total Housing Units | 347 | 100.0% |
Occupancy by Ownership by Household Size in Cooleemee
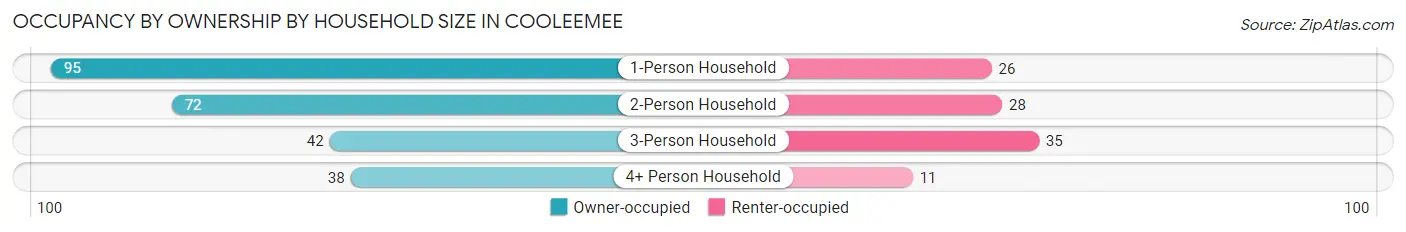
| Household Size | Owner-occupied | Renter-occupied |
| 1-Person Household | 95 (78.5%) | 26 (21.5%) |
| 2-Person Household | 72 (72.0%) | 28 (28.0%) |
| 3-Person Household | 42 (54.5%) | 35 (45.5%) |
| 4+ Person Household | 38 (77.5%) | 11 (22.5%) |
| Total Housing Units | 247 (71.2%) | 100 (28.8%) |
Occupancy by Educational Attainment in Cooleemee
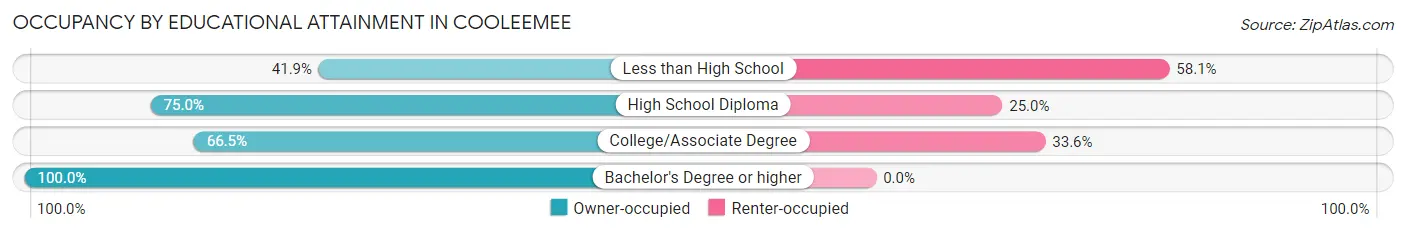
| Household Size | Owner-occupied | Renter-occupied |
| Less than High School | 18 (41.9%) | 25 (58.1%) |
| High School Diploma | 69 (75.0%) | 23 (25.0%) |
| College/Associate Degree | 103 (66.4%) | 52 (33.6%) |
| Bachelor's Degree or higher | 57 (100.0%) | 0 (0.0%) |
Occupancy by Age of Householder in Cooleemee
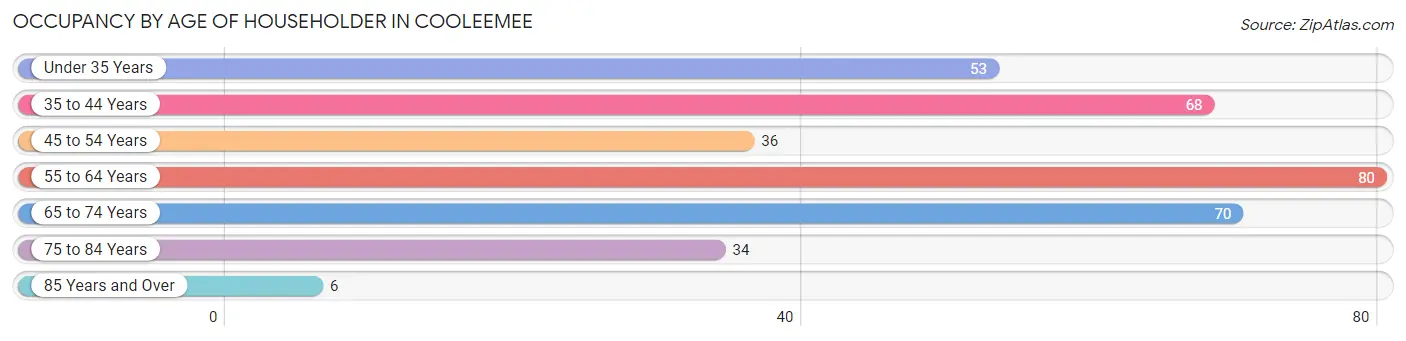
| Age Bracket | # Households | % Households |
| Under 35 Years | 53 | 15.3% |
| 35 to 44 Years | 68 | 19.6% |
| 45 to 54 Years | 36 | 10.4% |
| 55 to 64 Years | 80 | 23.1% |
| 65 to 74 Years | 70 | 20.2% |
| 75 to 84 Years | 34 | 9.8% |
| 85 Years and Over | 6 | 1.7% |
| Total | 347 | 100.0% |
Housing Finances in Cooleemee
Median Income by Occupancy in Cooleemee
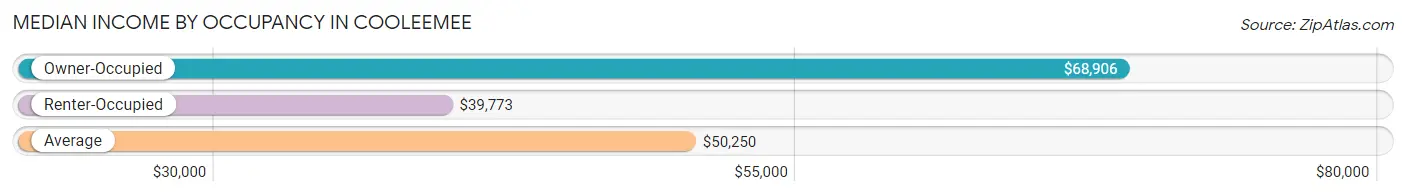
| Occupancy Type | # Households | Median Income |
| Owner-Occupied | 247 (71.2%) | $68,906 |
| Renter-Occupied | 100 (28.8%) | $39,773 |
| Average | 347 (100.0%) | $50,250 |
Occupancy by Householder Income Bracket in Cooleemee
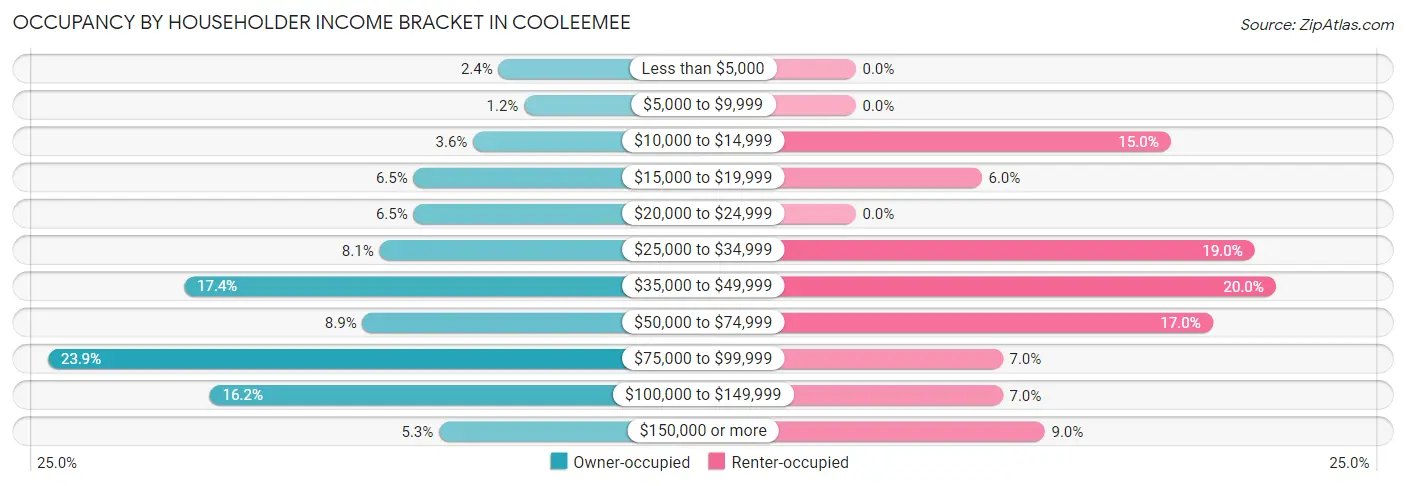
| Income Bracket | Owner-occupied | Renter-occupied |
| Less than $5,000 | 6 (2.4%) | 0 (0.0%) |
| $5,000 to $9,999 | 3 (1.2%) | 0 (0.0%) |
| $10,000 to $14,999 | 9 (3.6%) | 15 (15.0%) |
| $15,000 to $19,999 | 16 (6.5%) | 6 (6.0%) |
| $20,000 to $24,999 | 16 (6.5%) | 0 (0.0%) |
| $25,000 to $34,999 | 20 (8.1%) | 19 (19.0%) |
| $35,000 to $49,999 | 43 (17.4%) | 20 (20.0%) |
| $50,000 to $74,999 | 22 (8.9%) | 17 (17.0%) |
| $75,000 to $99,999 | 59 (23.9%) | 7 (7.0%) |
| $100,000 to $149,999 | 40 (16.2%) | 7 (7.0%) |
| $150,000 or more | 13 (5.3%) | 9 (9.0%) |
| Total | 247 (100.0%) | 100 (100.0%) |
Monthly Housing Cost Tiers in Cooleemee
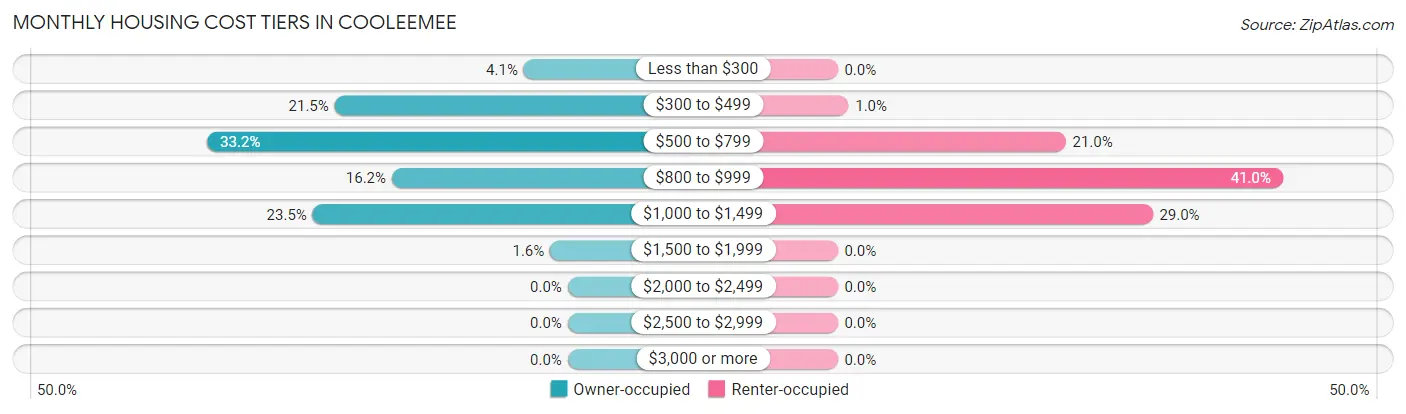
| Monthly Cost | Owner-occupied | Renter-occupied |
| Less than $300 | 10 (4.1%) | 0 (0.0%) |
| $300 to $499 | 53 (21.5%) | 1 (1.0%) |
| $500 to $799 | 82 (33.2%) | 21 (21.0%) |
| $800 to $999 | 40 (16.2%) | 41 (41.0%) |
| $1,000 to $1,499 | 58 (23.5%) | 29 (29.0%) |
| $1,500 to $1,999 | 4 (1.6%) | 0 (0.0%) |
| $2,000 to $2,499 | 0 (0.0%) | 0 (0.0%) |
| $2,500 to $2,999 | 0 (0.0%) | 0 (0.0%) |
| $3,000 or more | 0 (0.0%) | 0 (0.0%) |
| Total | 247 (100.0%) | 100 (100.0%) |
Physical Housing Characteristics in Cooleemee
Housing Structures in Cooleemee
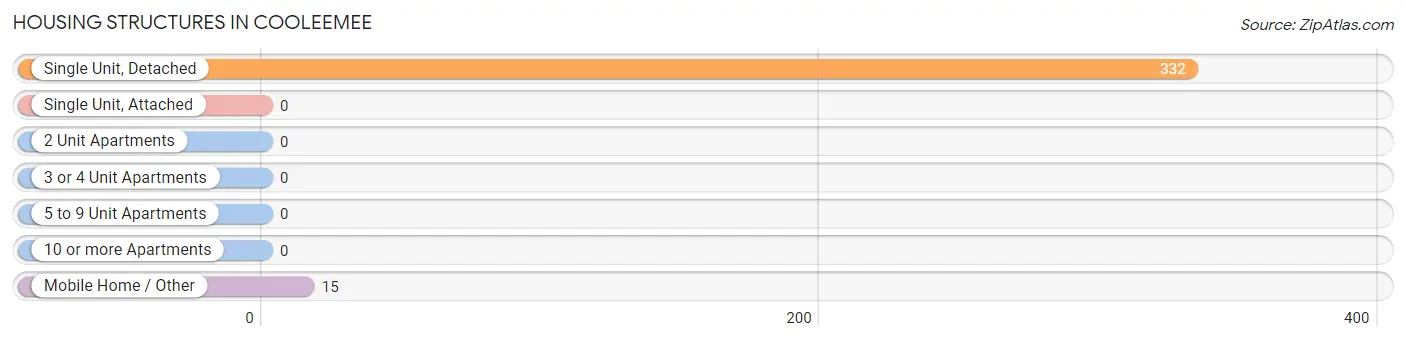
| Structure Type | # Housing Units | % Housing Units |
| Single Unit, Detached | 332 | 95.7% |
| Single Unit, Attached | 0 | 0.0% |
| 2 Unit Apartments | 0 | 0.0% |
| 3 or 4 Unit Apartments | 0 | 0.0% |
| 5 to 9 Unit Apartments | 0 | 0.0% |
| 10 or more Apartments | 0 | 0.0% |
| Mobile Home / Other | 15 | 4.3% |
| Total | 347 | 100.0% |
Housing Structures by Occupancy in Cooleemee
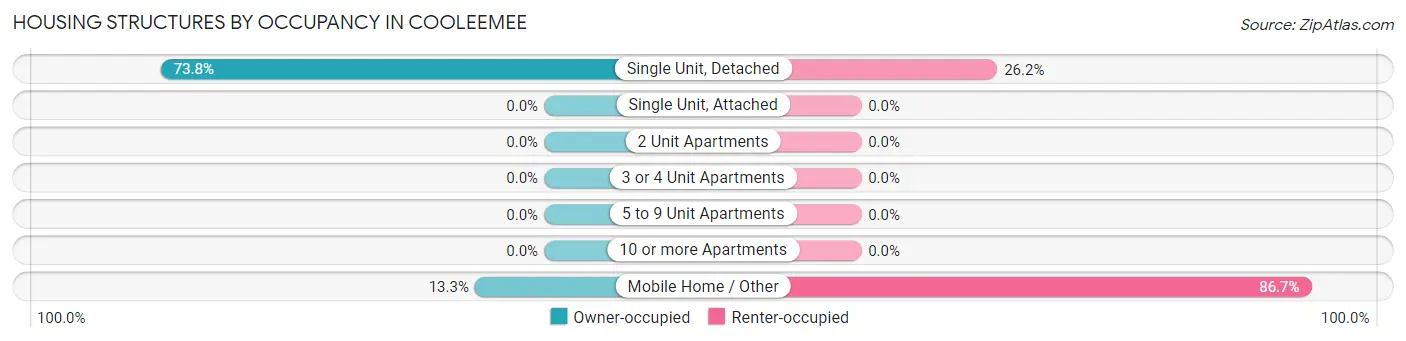
| Structure Type | Owner-occupied | Renter-occupied |
| Single Unit, Detached | 245 (73.8%) | 87 (26.2%) |
| Single Unit, Attached | 0 (0.0%) | 0 (0.0%) |
| 2 Unit Apartments | 0 (0.0%) | 0 (0.0%) |
| 3 or 4 Unit Apartments | 0 (0.0%) | 0 (0.0%) |
| 5 to 9 Unit Apartments | 0 (0.0%) | 0 (0.0%) |
| 10 or more Apartments | 0 (0.0%) | 0 (0.0%) |
| Mobile Home / Other | 2 (13.3%) | 13 (86.7%) |
| Total | 247 (71.2%) | 100 (28.8%) |
Housing Structures by Number of Rooms in Cooleemee
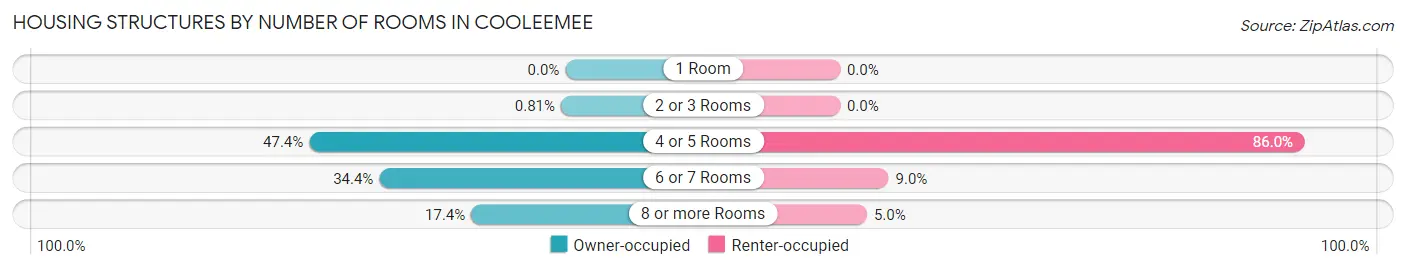
| Number of Rooms | Owner-occupied | Renter-occupied |
| 1 Room | 0 (0.0%) | 0 (0.0%) |
| 2 or 3 Rooms | 2 (0.8%) | 0 (0.0%) |
| 4 or 5 Rooms | 117 (47.4%) | 86 (86.0%) |
| 6 or 7 Rooms | 85 (34.4%) | 9 (9.0%) |
| 8 or more Rooms | 43 (17.4%) | 5 (5.0%) |
| Total | 247 (100.0%) | 100 (100.0%) |
Housing Structure by Heating Type in Cooleemee
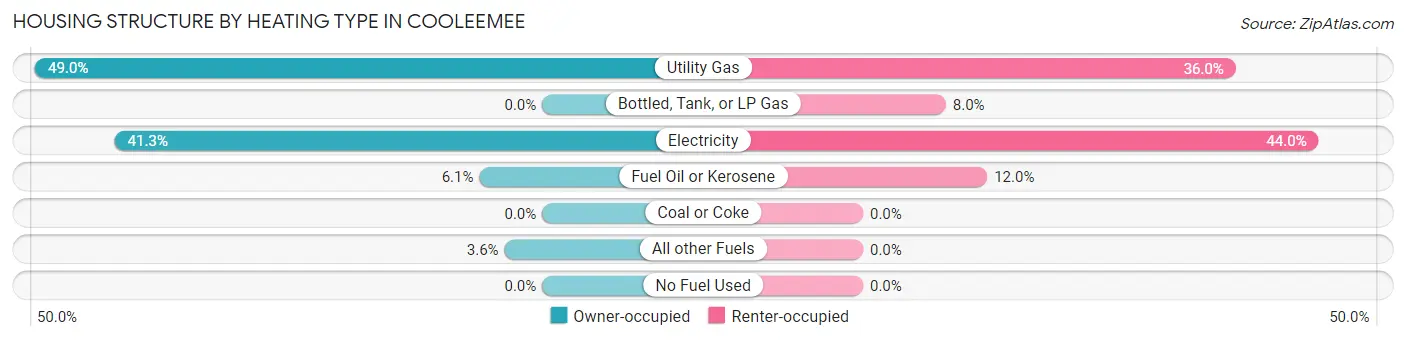
| Heating Type | Owner-occupied | Renter-occupied |
| Utility Gas | 121 (49.0%) | 36 (36.0%) |
| Bottled, Tank, or LP Gas | 0 (0.0%) | 8 (8.0%) |
| Electricity | 102 (41.3%) | 44 (44.0%) |
| Fuel Oil or Kerosene | 15 (6.1%) | 12 (12.0%) |
| Coal or Coke | 0 (0.0%) | 0 (0.0%) |
| All other Fuels | 9 (3.6%) | 0 (0.0%) |
| No Fuel Used | 0 (0.0%) | 0 (0.0%) |
| Total | 247 (100.0%) | 100 (100.0%) |
Household Vehicle Usage in Cooleemee
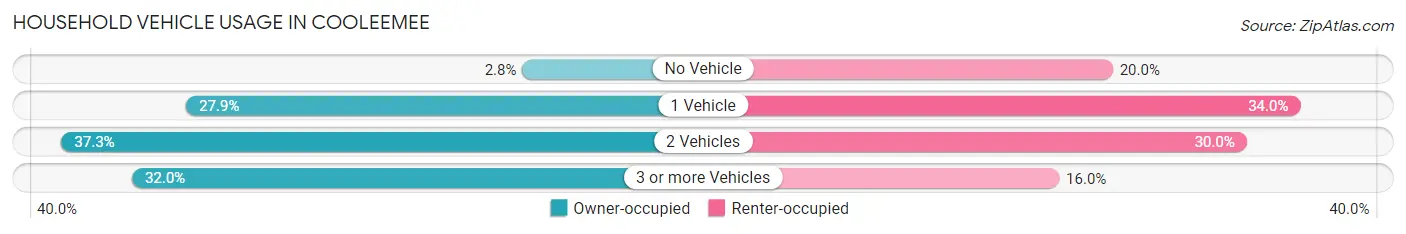
| Vehicles per Household | Owner-occupied | Renter-occupied |
| No Vehicle | 7 (2.8%) | 20 (20.0%) |
| 1 Vehicle | 69 (27.9%) | 34 (34.0%) |
| 2 Vehicles | 92 (37.2%) | 30 (30.0%) |
| 3 or more Vehicles | 79 (32.0%) | 16 (16.0%) |
| Total | 247 (100.0%) | 100 (100.0%) |
Real Estate & Mortgages in Cooleemee
Real Estate and Mortgage Overview in Cooleemee
| Characteristic | Without Mortgage | With Mortgage |
| Housing Units | 106 | 141 |
| Median Property Value | $118,800 | $134,900 |
| Median Household Income | $32,500 | $7 |
| Monthly Housing Costs | $475 | $0 |
| Real Estate Taxes | $1,353 | $0 |
Property Value by Mortgage Status in Cooleemee
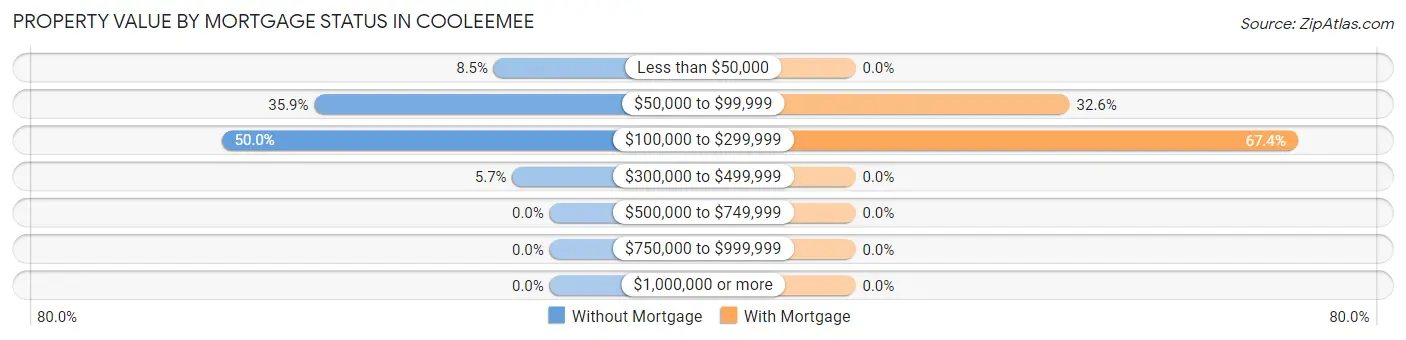
| Property Value | Without Mortgage | With Mortgage |
| Less than $50,000 | 9 (8.5%) | 0 (0.0%) |
| $50,000 to $99,999 | 38 (35.8%) | 46 (32.6%) |
| $100,000 to $299,999 | 53 (50.0%) | 95 (67.4%) |
| $300,000 to $499,999 | 6 (5.7%) | 0 (0.0%) |
| $500,000 to $749,999 | 0 (0.0%) | 0 (0.0%) |
| $750,000 to $999,999 | 0 (0.0%) | 0 (0.0%) |
| $1,000,000 or more | 0 (0.0%) | 0 (0.0%) |
| Total | 106 (100.0%) | 141 (100.0%) |
Household Income by Mortgage Status in Cooleemee
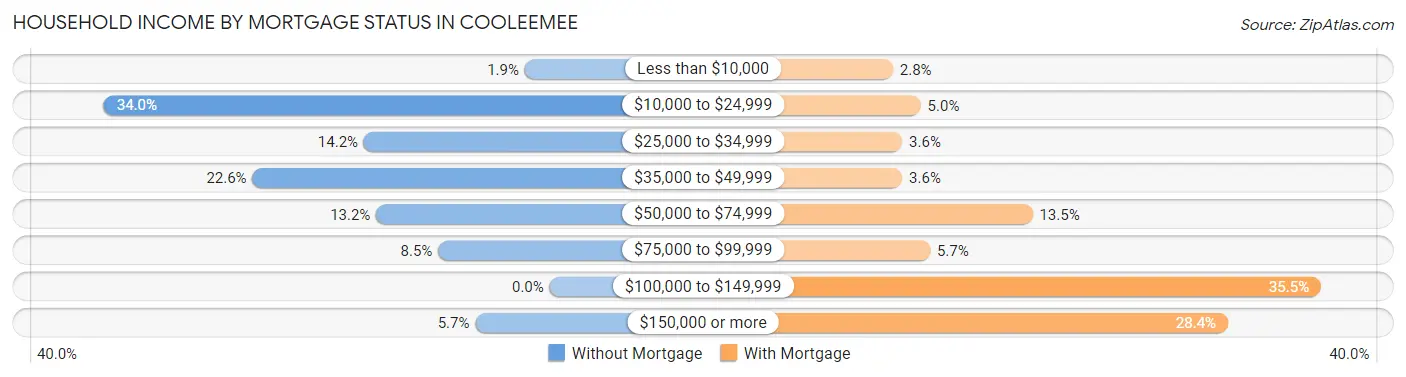
| Household Income | Without Mortgage | With Mortgage |
| Less than $10,000 | 2 (1.9%) | 4 (2.8%) |
| $10,000 to $24,999 | 36 (34.0%) | 7 (5.0%) |
| $25,000 to $34,999 | 15 (14.1%) | 5 (3.5%) |
| $35,000 to $49,999 | 24 (22.6%) | 5 (3.5%) |
| $50,000 to $74,999 | 14 (13.2%) | 19 (13.5%) |
| $75,000 to $99,999 | 9 (8.5%) | 8 (5.7%) |
| $100,000 to $149,999 | 0 (0.0%) | 50 (35.5%) |
| $150,000 or more | 6 (5.7%) | 40 (28.4%) |
| Total | 106 (100.0%) | 141 (100.0%) |
Property Value to Household Income Ratio in Cooleemee
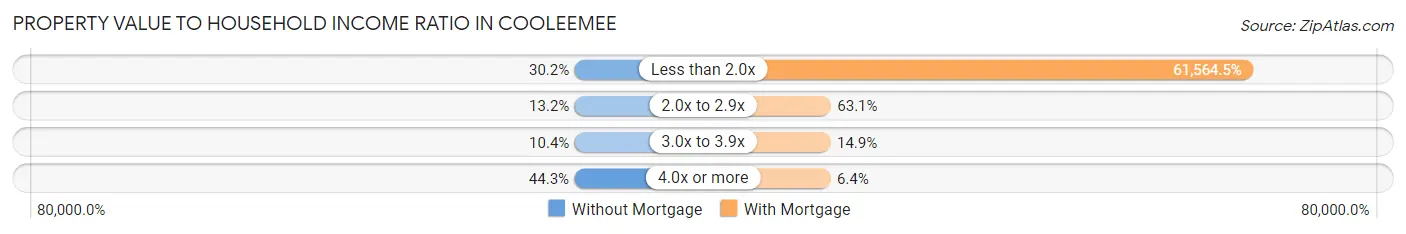
| Value-to-Income Ratio | Without Mortgage | With Mortgage |
| Less than 2.0x | 32 (30.2%) | 86,806 (61,564.5%) |
| 2.0x to 2.9x | 14 (13.2%) | 89 (63.1%) |
| 3.0x to 3.9x | 11 (10.4%) | 21 (14.9%) |
| 4.0x or more | 47 (44.3%) | 9 (6.4%) |
| Total | 106 (100.0%) | 141 (100.0%) |
Real Estate Taxes by Mortgage Status in Cooleemee
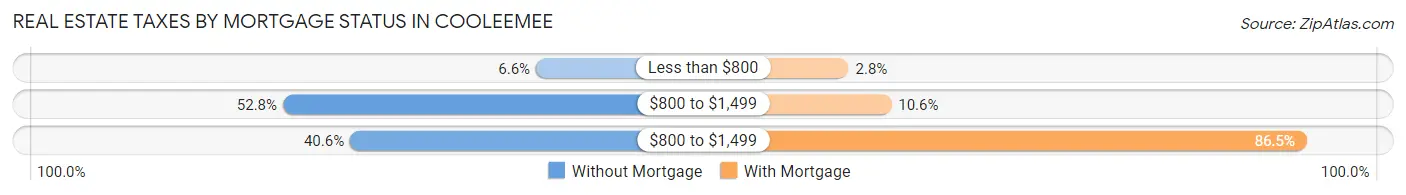
| Property Taxes | Without Mortgage | With Mortgage |
| Less than $800 | 7 (6.6%) | 4 (2.8%) |
| $800 to $1,499 | 56 (52.8%) | 15 (10.6%) |
| $800 to $1,499 | 43 (40.6%) | 122 (86.5%) |
| Total | 106 (100.0%) | 141 (100.0%) |
Health & Disability in Cooleemee
Health Insurance Coverage by Age in Cooleemee
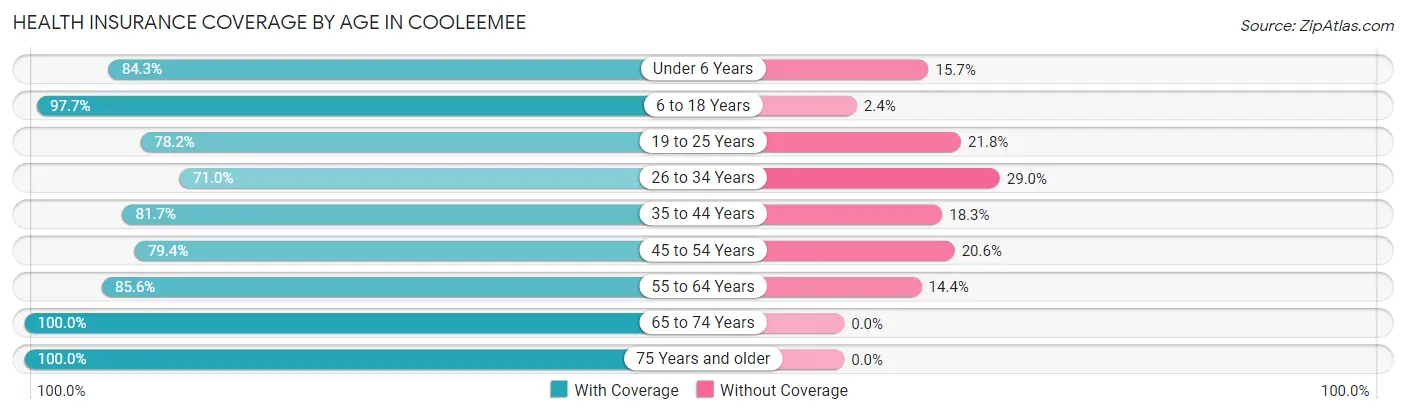
| Age Bracket | With Coverage | Without Coverage |
| Under 6 Years | 59 (84.3%) | 11 (15.7%) |
| 6 to 18 Years | 166 (97.7%) | 4 (2.4%) |
| 19 to 25 Years | 61 (78.2%) | 17 (21.8%) |
| 26 to 34 Years | 93 (71.0%) | 38 (29.0%) |
| 35 to 44 Years | 85 (81.7%) | 19 (18.3%) |
| 45 to 54 Years | 54 (79.4%) | 14 (20.6%) |
| 55 to 64 Years | 83 (85.6%) | 14 (14.4%) |
| 65 to 74 Years | 101 (100.0%) | 0 (0.0%) |
| 75 Years and older | 56 (100.0%) | 0 (0.0%) |
| Total | 758 (86.6%) | 117 (13.4%) |
Health Insurance Coverage by Citizenship Status in Cooleemee
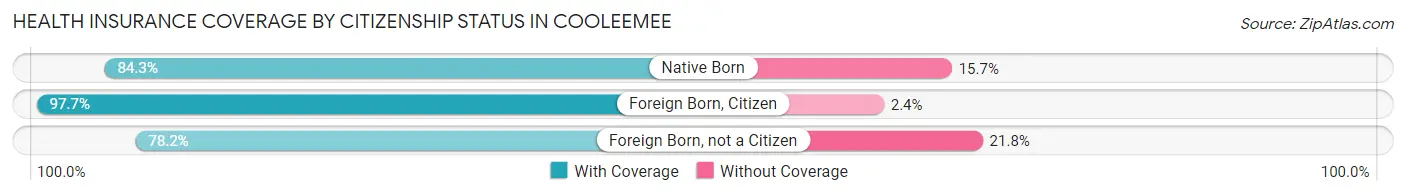
| Citizenship Status | With Coverage | Without Coverage |
| Native Born | 59 (84.3%) | 11 (15.7%) |
| Foreign Born, Citizen | 166 (97.7%) | 4 (2.4%) |
| Foreign Born, not a Citizen | 61 (78.2%) | 17 (21.8%) |
Health Insurance Coverage by Household Income in Cooleemee
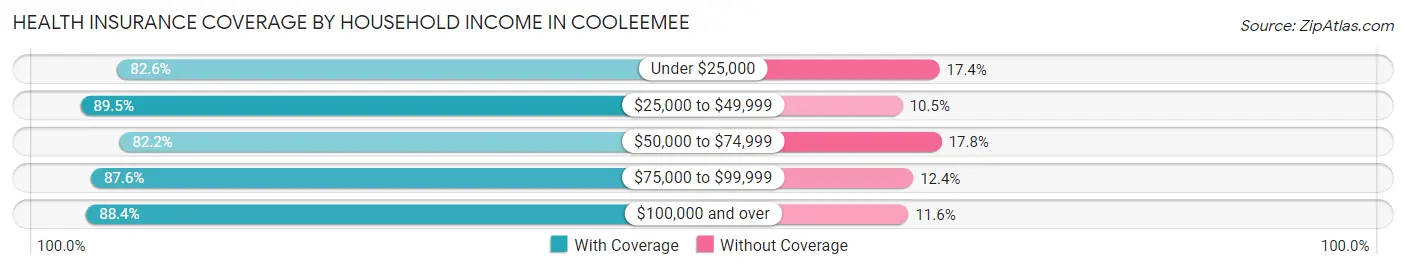
| Household Income | With Coverage | Without Coverage |
| Under $25,000 | 114 (82.6%) | 24 (17.4%) |
| $25,000 to $49,999 | 188 (89.5%) | 22 (10.5%) |
| $50,000 to $74,999 | 111 (82.2%) | 24 (17.8%) |
| $75,000 to $99,999 | 169 (87.6%) | 24 (12.4%) |
| $100,000 and over | 176 (88.4%) | 23 (11.6%) |
Public vs Private Health Insurance Coverage by Age in Cooleemee
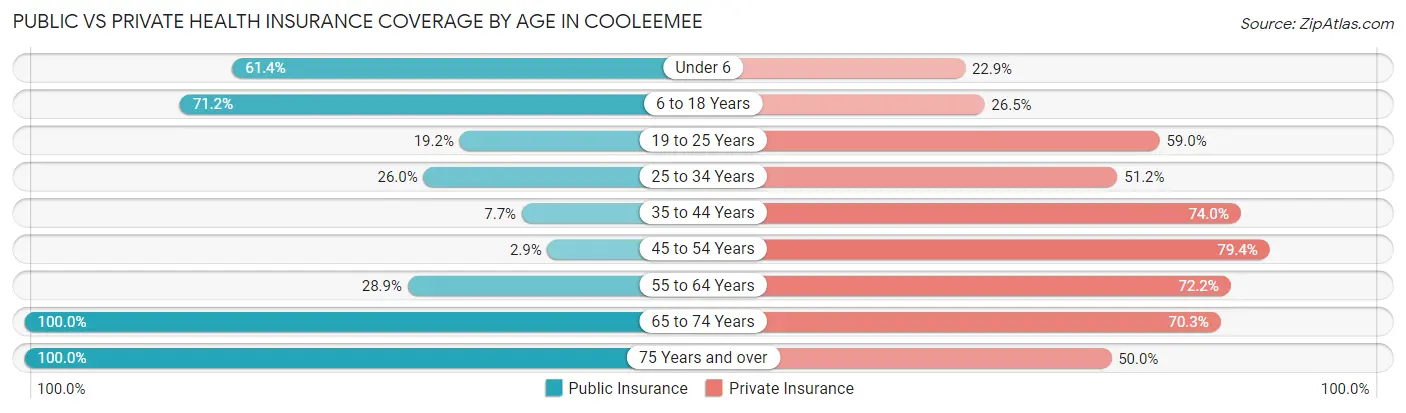
| Age Bracket | Public Insurance | Private Insurance |
| Under 6 | 43 (61.4%) | 16 (22.9%) |
| 6 to 18 Years | 121 (71.2%) | 45 (26.5%) |
| 19 to 25 Years | 15 (19.2%) | 46 (59.0%) |
| 25 to 34 Years | 34 (26.0%) | 67 (51.1%) |
| 35 to 44 Years | 8 (7.7%) | 77 (74.0%) |
| 45 to 54 Years | 2 (2.9%) | 54 (79.4%) |
| 55 to 64 Years | 28 (28.9%) | 70 (72.2%) |
| 65 to 74 Years | 101 (100.0%) | 71 (70.3%) |
| 75 Years and over | 56 (100.0%) | 28 (50.0%) |
| Total | 408 (46.6%) | 474 (54.2%) |
Disability Status by Sex by Age in Cooleemee
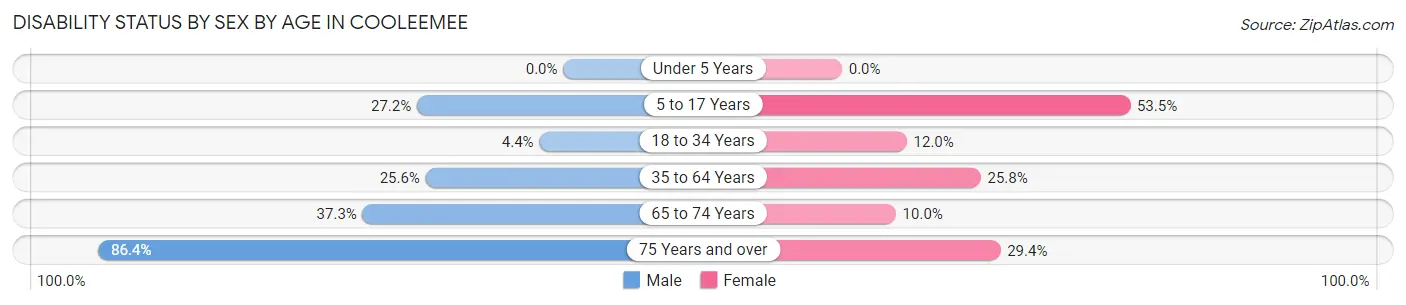
| Age Bracket | Male | Female |
| Under 5 Years | 0 (0.0%) | 0 (0.0%) |
| 5 to 17 Years | 22 (27.2%) | 46 (53.5%) |
| 18 to 34 Years | 4 (4.4%) | 16 (12.0%) |
| 35 to 64 Years | 35 (25.6%) | 34 (25.8%) |
| 65 to 74 Years | 19 (37.2%) | 5 (10.0%) |
| 75 Years and over | 19 (86.4%) | 10 (29.4%) |
Disability Class by Sex by Age in Cooleemee
Disability Class: Hearing Difficulty
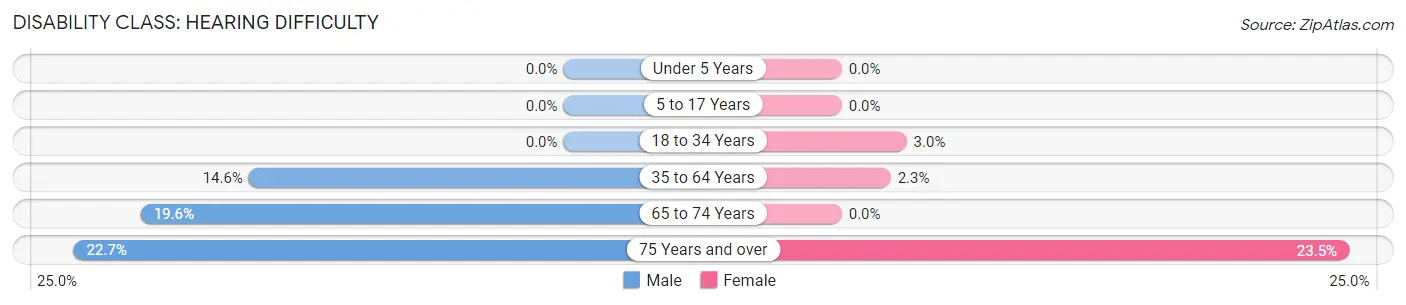
| Age Bracket | Male | Female |
| Under 5 Years | 0 (0.0%) | 0 (0.0%) |
| 5 to 17 Years | 0 (0.0%) | 0 (0.0%) |
| 18 to 34 Years | 0 (0.0%) | 4 (3.0%) |
| 35 to 64 Years | 20 (14.6%) | 3 (2.3%) |
| 65 to 74 Years | 10 (19.6%) | 0 (0.0%) |
| 75 Years and over | 5 (22.7%) | 8 (23.5%) |
Disability Class: Vision Difficulty
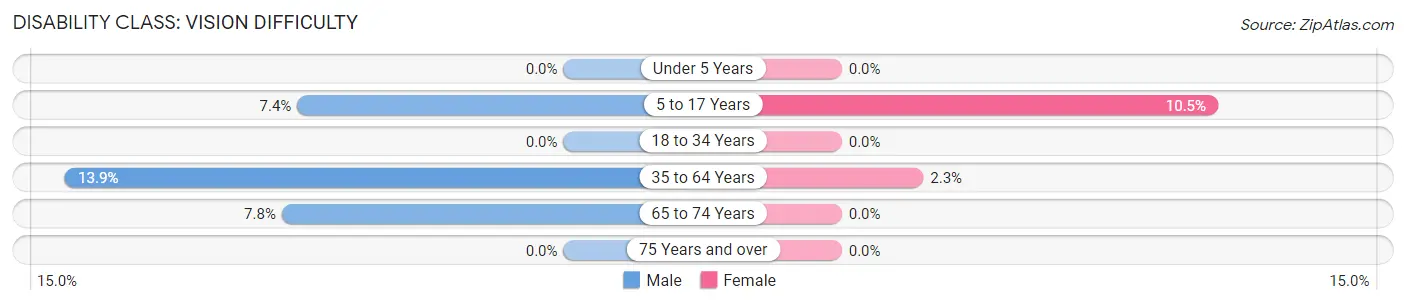
| Age Bracket | Male | Female |
| Under 5 Years | 0 (0.0%) | 0 (0.0%) |
| 5 to 17 Years | 6 (7.4%) | 9 (10.5%) |
| 18 to 34 Years | 0 (0.0%) | 0 (0.0%) |
| 35 to 64 Years | 19 (13.9%) | 3 (2.3%) |
| 65 to 74 Years | 4 (7.8%) | 0 (0.0%) |
| 75 Years and over | 0 (0.0%) | 0 (0.0%) |
Disability Class: Cognitive Difficulty
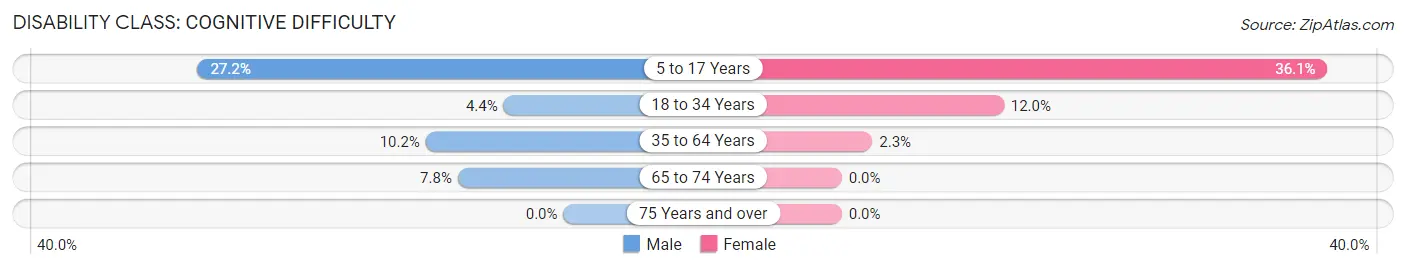
| Age Bracket | Male | Female |
| 5 to 17 Years | 22 (27.2%) | 31 (36.0%) |
| 18 to 34 Years | 4 (4.4%) | 16 (12.0%) |
| 35 to 64 Years | 14 (10.2%) | 3 (2.3%) |
| 65 to 74 Years | 4 (7.8%) | 0 (0.0%) |
| 75 Years and over | 0 (0.0%) | 0 (0.0%) |
Disability Class: Ambulatory Difficulty
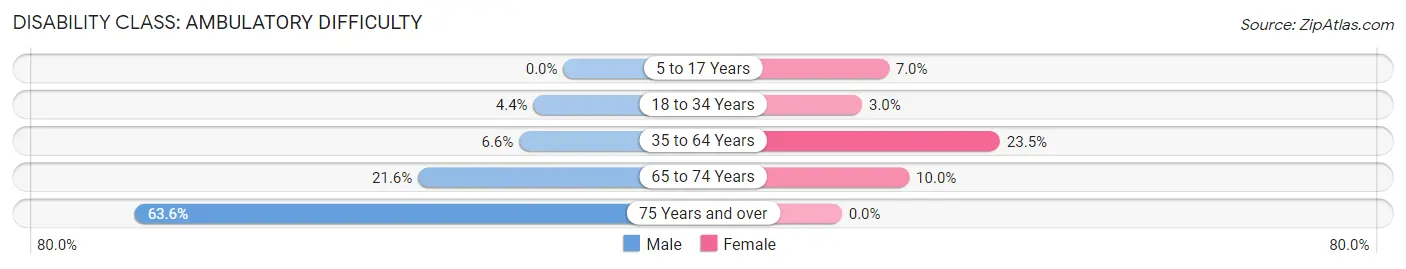
| Age Bracket | Male | Female |
| 5 to 17 Years | 0 (0.0%) | 6 (7.0%) |
| 18 to 34 Years | 4 (4.4%) | 4 (3.0%) |
| 35 to 64 Years | 9 (6.6%) | 31 (23.5%) |
| 65 to 74 Years | 11 (21.6%) | 5 (10.0%) |
| 75 Years and over | 14 (63.6%) | 0 (0.0%) |
Disability Class: Self-Care Difficulty
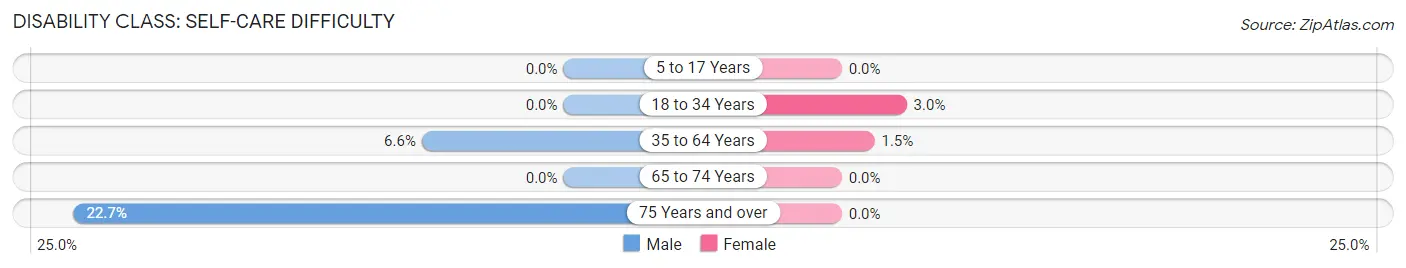
| Age Bracket | Male | Female |
| 5 to 17 Years | 0 (0.0%) | 0 (0.0%) |
| 18 to 34 Years | 0 (0.0%) | 4 (3.0%) |
| 35 to 64 Years | 9 (6.6%) | 2 (1.5%) |
| 65 to 74 Years | 0 (0.0%) | 0 (0.0%) |
| 75 Years and over | 5 (22.7%) | 0 (0.0%) |
Technology Access in Cooleemee
Computing Device Access in Cooleemee
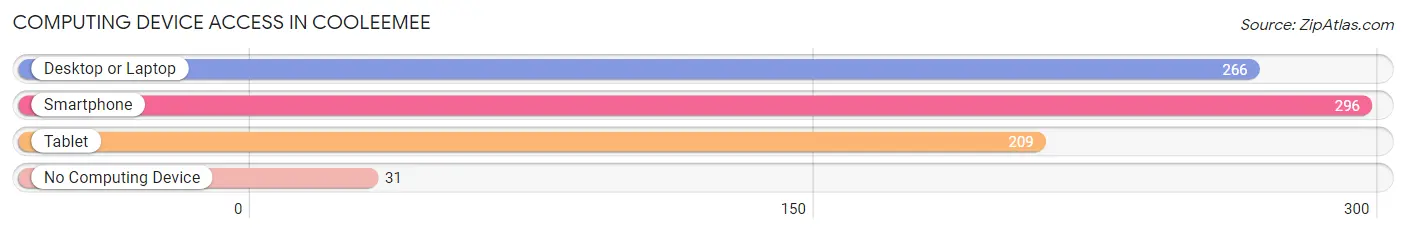
| Device Type | # Households | % Households |
| Desktop or Laptop | 266 | 76.7% |
| Smartphone | 296 | 85.3% |
| Tablet | 209 | 60.2% |
| No Computing Device | 31 | 8.9% |
| Total | 347 | 100.0% |
Internet Access in Cooleemee
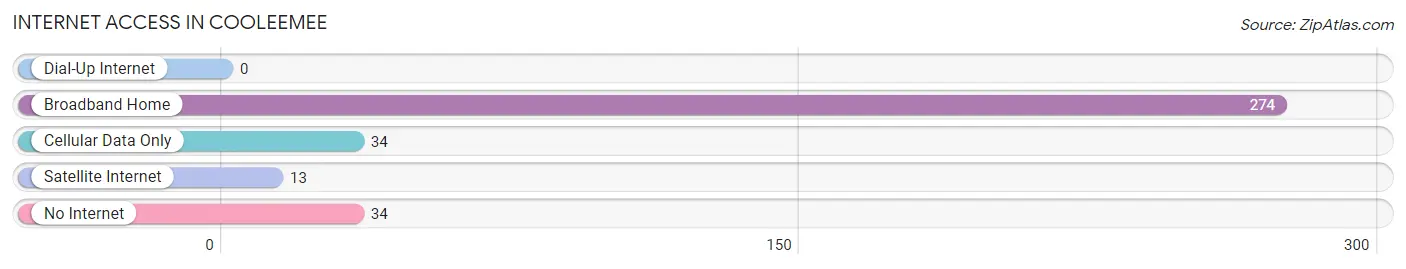
| Internet Type | # Households | % Households |
| Dial-Up Internet | 0 | 0.0% |
| Broadband Home | 274 | 79.0% |
| Cellular Data Only | 34 | 9.8% |
| Satellite Internet | 13 | 3.7% |
| No Internet | 34 | 9.8% |
| Total | 347 | 100.0% |
Cooleemee Summary
Cooleemee is a small town located in Davie County, North Carolina. It is situated in the foothills of the Blue Ridge Mountains, approximately 25 miles northwest of Winston-Salem. The town was founded in 1854 and was named after the Cooleemee Plantation, which was owned by the prominent local family of the same name. The town has a population of approximately 1,000 people and is known for its small-town charm and friendly atmosphere.
Geography
Cooleemee is located in the Piedmont region of North Carolina, in the foothills of the Blue Ridge Mountains. The town is situated on the banks of the Yadkin River, which flows through the center of town. The town is surrounded by rolling hills and farmland, and is located approximately 25 miles northwest of Winston-Salem.
Economy
Cooleemee is a small, rural town with a limited economy. The town is home to several small businesses, including a grocery store, a hardware store, and a few restaurants. The town is also home to a few manufacturing companies, including a furniture factory and a textile mill. The town is also home to a few small farms, which produce a variety of crops, including corn, soybeans, and tobacco.
Demographics
As of the 2010 census, the population of Cooleemee was 1,039. The racial makeup of the town was 94.3% White, 3.2% African American, 0.3% Native American, 0.2% Asian, 0.1% Pacific Islander, 0.7% from other races, and 1.4% from two or more races. Hispanic or Latino of any race were 1.7% of the population.
The median income for a household in Cooleemee was $31,250, and the median income for a family was $37,500. The per capita income for the town was $17,845. About 15.2% of families and 17.2% of the population were below the poverty line, including 22.2% of those under age 18 and 11.3% of those age 65 or over.
Conclusion
Cooleemee is a small, rural town located in the foothills of the Blue Ridge Mountains in North Carolina. The town has a population of approximately 1,000 people and is known for its small-town charm and friendly atmosphere. The town is home to several small businesses, including a grocery store, a hardware store, and a few restaurants. The town is also home to a few manufacturing companies, including a furniture factory and a textile mill. The town is also home to a few small farms, which produce a variety of crops, including corn, soybeans, and tobacco. The racial makeup of the town is predominantly White, with a small percentage of African American, Native American, Asian, and Pacific Islander residents. The median income for a household in Cooleemee is $31,250, and the median income for a family is $37,500. About 15.2% of families and 17.2% of the population are below the poverty line.
Common Questions
What is Per Capita Income in Cooleemee?
Per Capita income in Cooleemee is $27,612.
What is the Median Family Income in Cooleemee?
Median Family Income in Cooleemee is $68,636.
What is the Median Household income in Cooleemee?
Median Household Income in Cooleemee is $50,250.
What is Income or Wage Gap in Cooleemee?
Income or Wage Gap in Cooleemee is 27.2%.
Women in Cooleemee earn 72.8 cents for every dollar earned by a man.
What is Inequality or Gini Index in Cooleemee?
Inequality or Gini Index in Cooleemee is 0.39.
What is the Total Population of Cooleemee?
Total Population of Cooleemee is 875.
What is the Total Male Population of Cooleemee?
Total Male Population of Cooleemee is 408.
What is the Total Female Population of Cooleemee?
Total Female Population of Cooleemee is 467.
What is the Ratio of Males per 100 Females in Cooleemee?
There are 87.37 Males per 100 Females in Cooleemee.
What is the Ratio of Females per 100 Males in Cooleemee?
There are 114.46 Females per 100 Males in Cooleemee.
What is the Median Population Age in Cooleemee?
Median Population Age in Cooleemee is 34.4 Years.
What is the Average Family Size in Cooleemee
Average Family Size in Cooleemee is 3.2 People.
What is the Average Household Size in Cooleemee
Average Household Size in Cooleemee is 2.5 People.
How Large is the Labor Force in Cooleemee?
There are 443 People in the Labor Forcein in Cooleemee.
What is the Percentage of People in the Labor Force in Cooleemee?
65.3% of People are in the Labor Force in Cooleemee.
What is the Unemployment Rate in Cooleemee?
Unemployment Rate in Cooleemee is 3.4%.