Mesic, NC Map & Demographics
Mesic Map
Mesic Overview
$29,497
PER CAPITA INCOME
$78,750
AVG FAMILY INCOME
0.54
INEQUALITY / GINI INDEX
183
TOTAL POPULATION
68
MALE POPULATION
115
FEMALE POPULATION
59.13
MALES / 100 FEMALES
169.12
FEMALES / 100 MALES
53.4
MEDIAN AGE
4.5
AVG FAMILY SIZE
2.6
AVG HOUSEHOLD SIZE
70
LABOR FORCE [ PEOPLE ]
41.4%
PERCENT IN LABOR FORCE
4.3%
UNEMPLOYMENT RATE
Mesic Area Codes
Income in Mesic
Income Overview in Mesic
| Characteristic | Number | Measure |
| Per Capita Income | 183 | $29,497 |
| Median Family Income | 32 | $78,750 |
| Mean Family Income | 32 | $117,066 |
| Median Household Income | 71 | $0 |
| Mean Household Income | 71 | $64,715 |
| Income Deficit | 32 | $0 |
| Wage / Income Gap (%) | 183 | 0.00% |
| Wage / Income Gap ($) | 183 | 100.00¢ per $1 |
| Gini / Inequality Index | 183 | 0.54 |
Earnings by Sex in Mesic
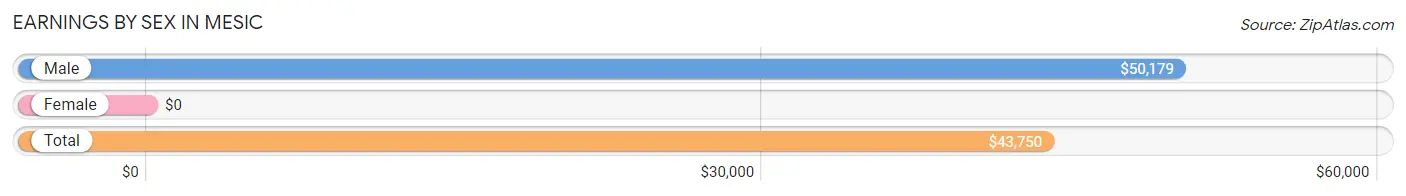
| Sex | Number | Average Earnings |
| Male | 47 (66.2%) | $50,179 |
| Female | 24 (33.8%) | $0 |
| Total | 71 (100.0%) | $43,750 |
Earnings by Sex by Income Bracket in Mesic
The most common earnings brackets in Mesic are $25,000 to $29,999 for men (13 | 27.7%) and $12,500 to $14,999 for women (8 | 33.3%).
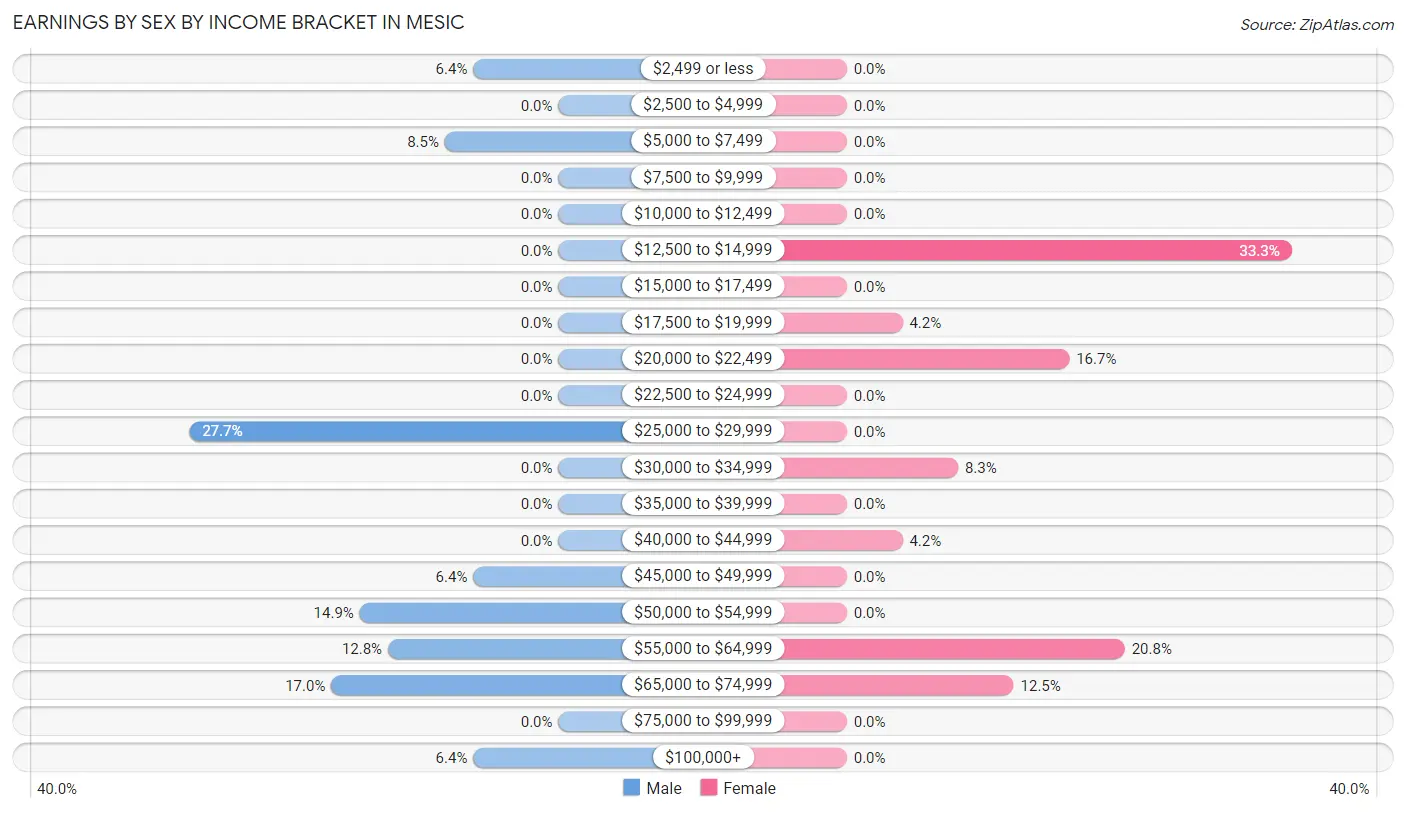
| Income | Male | Female |
| $2,499 or less | 3 (6.4%) | 0 (0.0%) |
| $2,500 to $4,999 | 0 (0.0%) | 0 (0.0%) |
| $5,000 to $7,499 | 4 (8.5%) | 0 (0.0%) |
| $7,500 to $9,999 | 0 (0.0%) | 0 (0.0%) |
| $10,000 to $12,499 | 0 (0.0%) | 0 (0.0%) |
| $12,500 to $14,999 | 0 (0.0%) | 8 (33.3%) |
| $15,000 to $17,499 | 0 (0.0%) | 0 (0.0%) |
| $17,500 to $19,999 | 0 (0.0%) | 1 (4.2%) |
| $20,000 to $22,499 | 0 (0.0%) | 4 (16.7%) |
| $22,500 to $24,999 | 0 (0.0%) | 0 (0.0%) |
| $25,000 to $29,999 | 13 (27.7%) | 0 (0.0%) |
| $30,000 to $34,999 | 0 (0.0%) | 2 (8.3%) |
| $35,000 to $39,999 | 0 (0.0%) | 0 (0.0%) |
| $40,000 to $44,999 | 0 (0.0%) | 1 (4.2%) |
| $45,000 to $49,999 | 3 (6.4%) | 0 (0.0%) |
| $50,000 to $54,999 | 7 (14.9%) | 0 (0.0%) |
| $55,000 to $64,999 | 6 (12.8%) | 5 (20.8%) |
| $65,000 to $74,999 | 8 (17.0%) | 3 (12.5%) |
| $75,000 to $99,999 | 0 (0.0%) | 0 (0.0%) |
| $100,000+ | 3 (6.4%) | 0 (0.0%) |
| Total | 47 (100.0%) | 24 (100.0%) |
Earnings by Sex by Educational Attainment in Mesic
Average earnings in Mesic are $50,893 for men and $50,000 for women, a difference of 1.8%. Men with an educational attainment of college or associate's degree enjoy the highest average annual earnings of $50,714, while those with high school diploma education earn the least with $28,750. Women with an educational attainment of high school diploma earn the most with the average annual earnings of $26,250, while those with high school diploma education have the smallest earnings of $26,250.
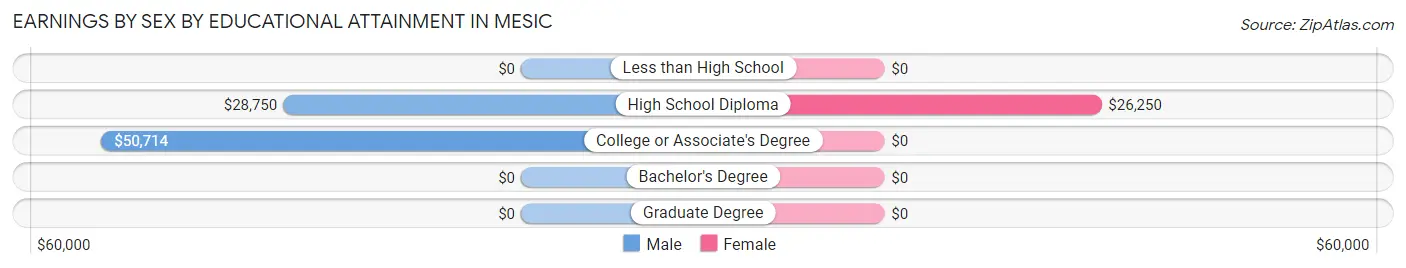
| Educational Attainment | Male Income | Female Income |
| Less than High School | - | - |
| High School Diploma | $28,750 | $26,250 |
| College or Associate's Degree | $50,714 | $0 |
| Bachelor's Degree | - | - |
| Graduate Degree | - | - |
| Total | $50,893 | $50,000 |
Family Income in Mesic
Family Income Brackets in Mesic
According to the Mesic family income data, there are 11 families falling into the $50,000 to $74,999 income range, which is the most common income bracket and makes up 34.4% of all families.
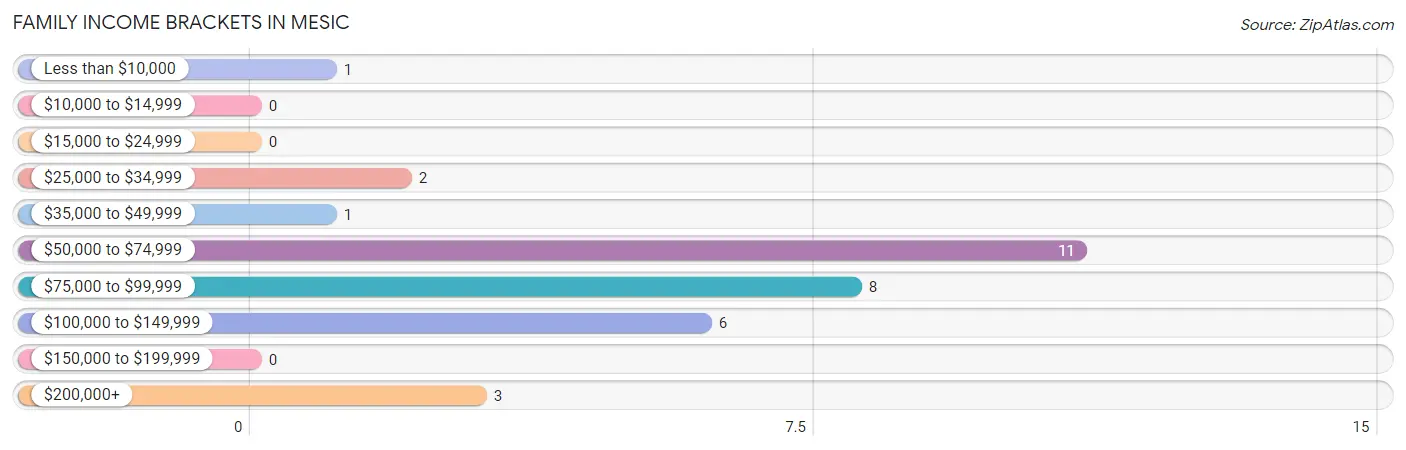
| Income Bracket | # Families | % Families |
| Less than $10,000 | 1 | 3.1% |
| $10,000 to $14,999 | 0 | 0.0% |
| $15,000 to $24,999 | 0 | 0.0% |
| $25,000 to $34,999 | 2 | 6.3% |
| $35,000 to $49,999 | 1 | 3.1% |
| $50,000 to $74,999 | 11 | 34.4% |
| $75,000 to $99,999 | 8 | 25.0% |
| $100,000 to $149,999 | 6 | 18.8% |
| $150,000 to $199,999 | 0 | 0.0% |
| $200,000+ | 3 | 9.4% |
Family Income by Famaliy Size in Mesic
3-person families (12 | 37.5%) account for the highest median family income in Mesic with $131,250 per family, while 3-person families (12 | 37.5%) have the highest median income of $43,750 per family member.
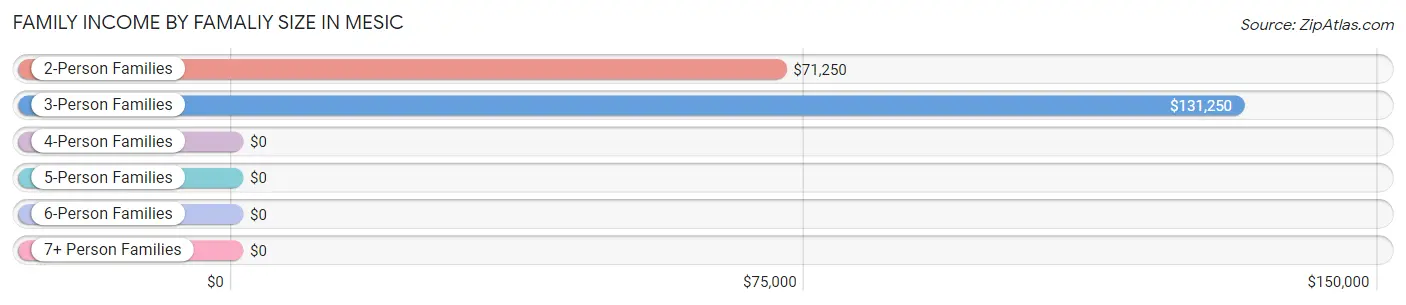
| Income Bracket | # Families | Median Income |
| 2-Person Families | 7 (21.9%) | $71,250 |
| 3-Person Families | 12 (37.5%) | $131,250 |
| 4-Person Families | 12 (37.5%) | $0 |
| 5-Person Families | 1 (3.1%) | $0 |
| 6-Person Families | 0 (0.0%) | $0 |
| 7+ Person Families | 0 (0.0%) | $0 |
| Total | 32 (100.0%) | $78,750 |
Family Income by Number of Earners in Mesic
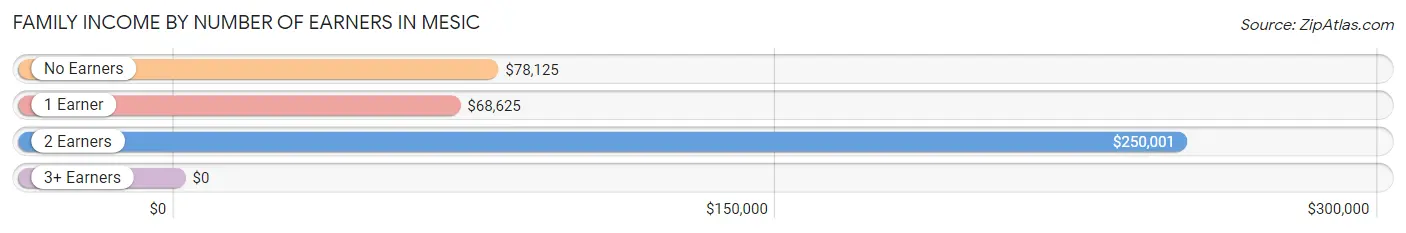
| Number of Earners | # Families | Median Income |
| No Earners | 7 (21.9%) | $78,125 |
| 1 Earner | 13 (40.6%) | $68,625 |
| 2 Earners | 5 (15.6%) | $250,001 |
| 3+ Earners | 7 (21.9%) | $0 |
| Total | 32 (100.0%) | $78,750 |
Household Income in Mesic
Household Income Brackets in Mesic
With 13 households falling in the category, the $10,000 to $14,999 income range is the most frequent in Mesic, accounting for 18.3% of all households.
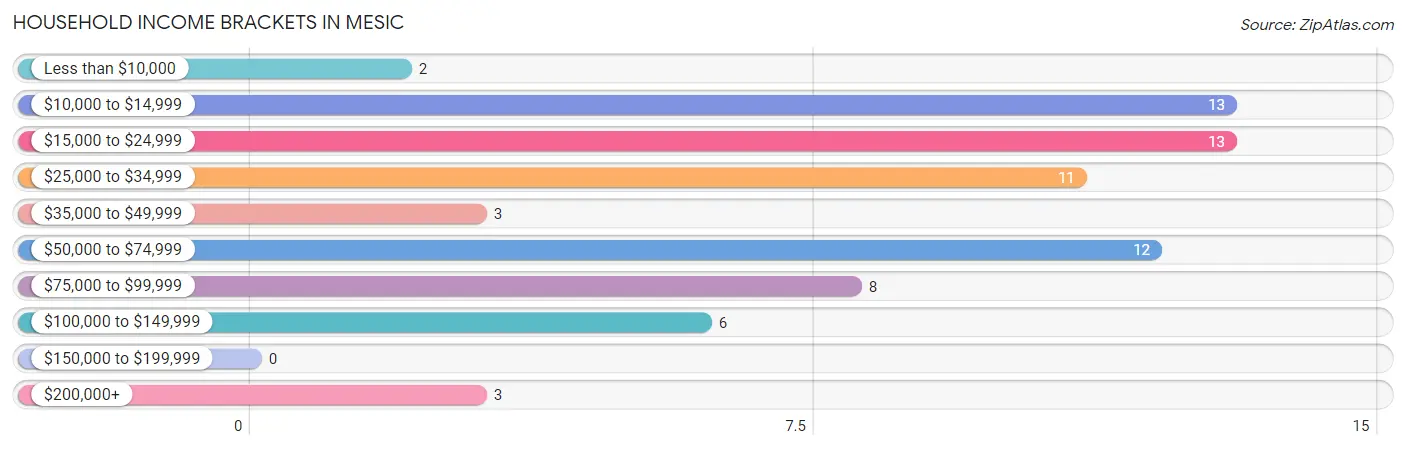
| Income Bracket | # Households | % Households |
| Less than $10,000 | 2 | 2.8% |
| $10,000 to $14,999 | 13 | 18.3% |
| $15,000 to $24,999 | 13 | 18.3% |
| $25,000 to $34,999 | 11 | 15.5% |
| $35,000 to $49,999 | 3 | 4.2% |
| $50,000 to $74,999 | 12 | 16.9% |
| $75,000 to $99,999 | 8 | 11.3% |
| $100,000 to $149,999 | 6 | 8.5% |
| $150,000 to $199,999 | 0 | 0.0% |
| $200,000+ | 3 | 4.2% |
Household Income by Householder Age in Mesic
The median household income in Mesic is $0, with the highest median household income of $89,688 found in the 25 to 44 years age bracket for the primary householder. A total of 7 households (9.9%) fall into this category.
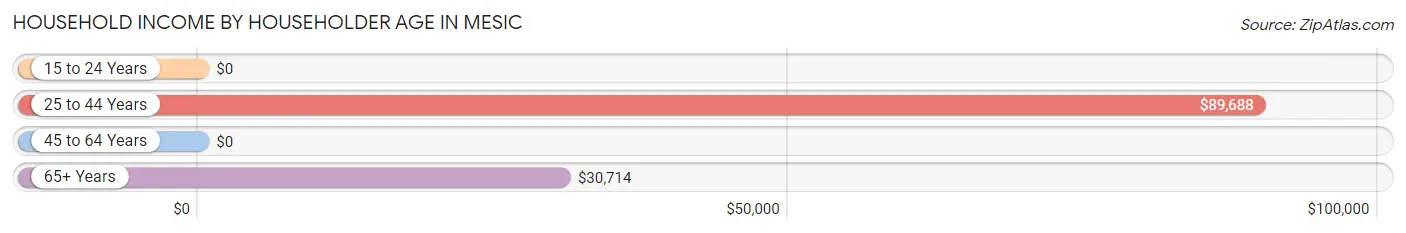
| Income Bracket | # Households | Median Income |
| 15 to 24 Years | 0 (0.0%) | $0 |
| 25 to 44 Years | 7 (9.9%) | $89,688 |
| 45 to 64 Years | 26 (36.6%) | $0 |
| 65+ Years | 38 (53.5%) | $30,714 |
| Total | 71 (100.0%) | $0 |
Poverty in Mesic
Income Below Poverty by Sex and Age in Mesic
With 5.9% poverty level for males and 13.9% for females among the residents of Mesic, 25 to 34 year old males and 65 to 74 year old females are the most vulnerable to poverty, with 3 males (30.0%) and 3 females (60.0%) in their respective age groups living below the poverty level.
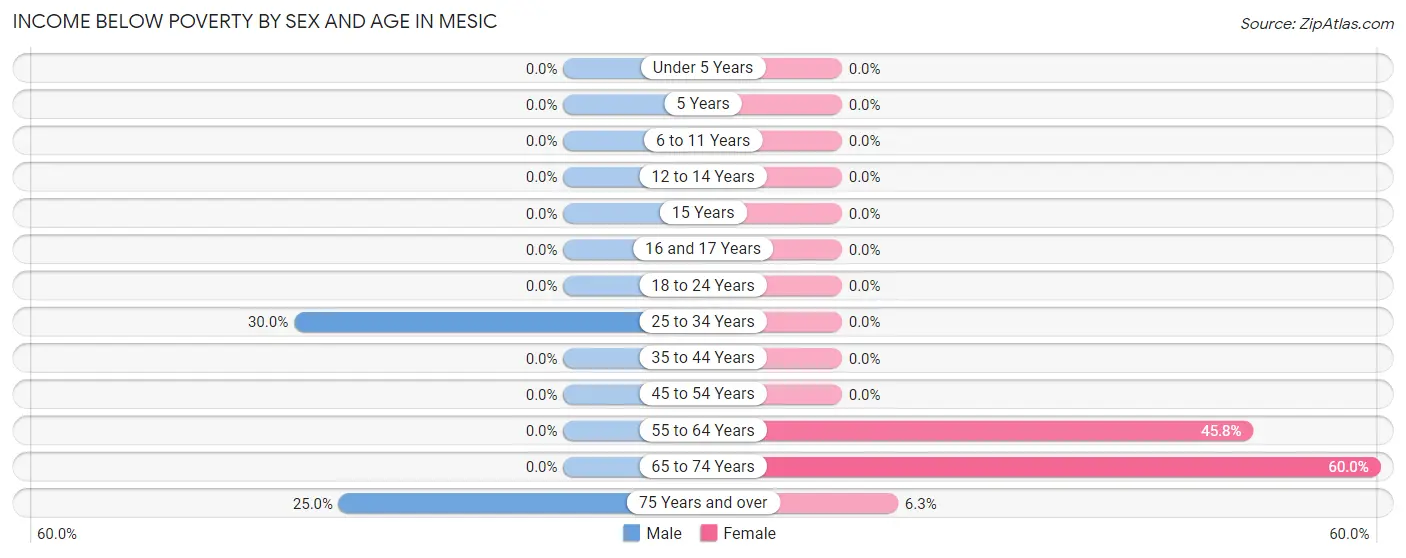
| Age Bracket | Male | Female |
| Under 5 Years | 0 (0.0%) | 0 (0.0%) |
| 5 Years | 0 (0.0%) | 0 (0.0%) |
| 6 to 11 Years | 0 (0.0%) | 0 (0.0%) |
| 12 to 14 Years | 0 (0.0%) | 0 (0.0%) |
| 15 Years | 0 (0.0%) | 0 (0.0%) |
| 16 and 17 Years | 0 (0.0%) | 0 (0.0%) |
| 18 to 24 Years | 0 (0.0%) | 0 (0.0%) |
| 25 to 34 Years | 3 (30.0%) | 0 (0.0%) |
| 35 to 44 Years | 0 (0.0%) | 0 (0.0%) |
| 45 to 54 Years | 0 (0.0%) | 0 (0.0%) |
| 55 to 64 Years | 0 (0.0%) | 11 (45.8%) |
| 65 to 74 Years | 0 (0.0%) | 3 (60.0%) |
| 75 Years and over | 1 (25.0%) | 2 (6.2%) |
| Total | 4 (5.9%) | 16 (13.9%) |
Income Above Poverty by Sex and Age in Mesic
According to the poverty statistics in Mesic, males aged 12 to 14 years and females aged 6 to 11 years are the age groups that are most secure financially, with 100.0% of males and 100.0% of females in these age groups living above the poverty line.
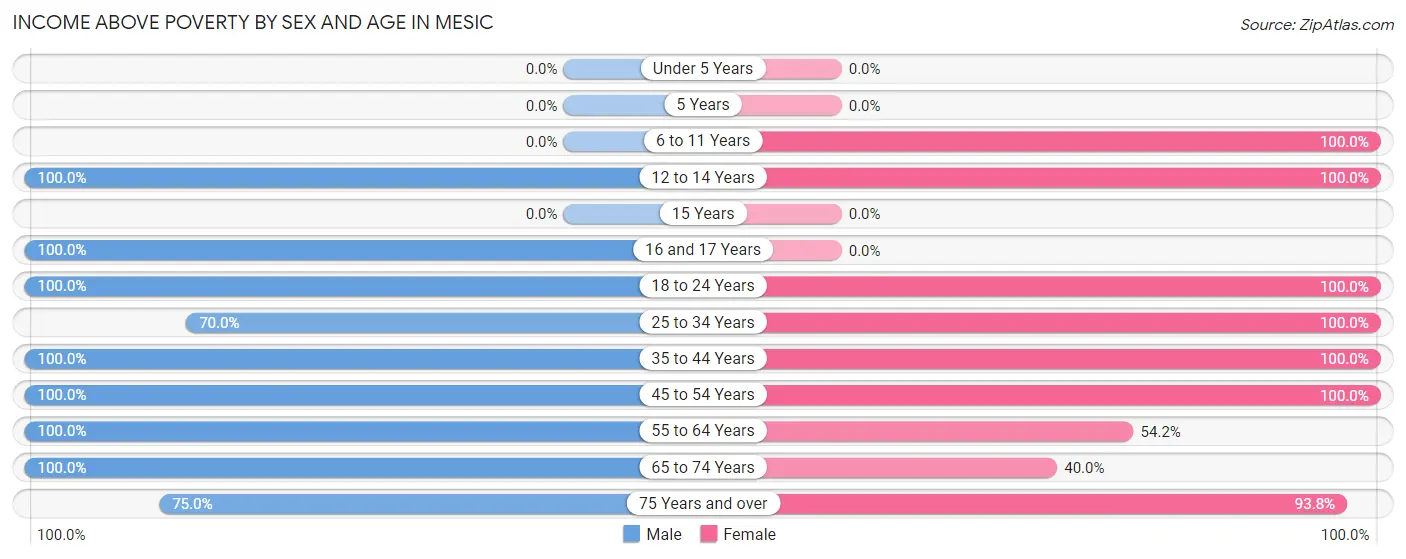
| Age Bracket | Male | Female |
| Under 5 Years | 0 (0.0%) | 0 (0.0%) |
| 5 Years | 0 (0.0%) | 0 (0.0%) |
| 6 to 11 Years | 0 (0.0%) | 6 (100.0%) |
| 12 to 14 Years | 5 (100.0%) | 3 (100.0%) |
| 15 Years | 0 (0.0%) | 0 (0.0%) |
| 16 and 17 Years | 4 (100.0%) | 0 (0.0%) |
| 18 to 24 Years | 6 (100.0%) | 8 (100.0%) |
| 25 to 34 Years | 7 (70.0%) | 18 (100.0%) |
| 35 to 44 Years | 6 (100.0%) | 5 (100.0%) |
| 45 to 54 Years | 12 (100.0%) | 14 (100.0%) |
| 55 to 64 Years | 3 (100.0%) | 13 (54.2%) |
| 65 to 74 Years | 18 (100.0%) | 2 (40.0%) |
| 75 Years and over | 3 (75.0%) | 30 (93.8%) |
| Total | 64 (94.1%) | 99 (86.1%) |
Income Below Poverty Among Married-Couple Families in Mesic
The poverty statistics for married-couple families in Mesic show that 5.0% or 1 of the total 20 families live below the poverty line. Families with no children have the highest poverty rate of 6.7%, comprising of 1 families. On the other hand, families with 1 or 2 children have the lowest poverty rate of 0.0%, which includes 0 families.
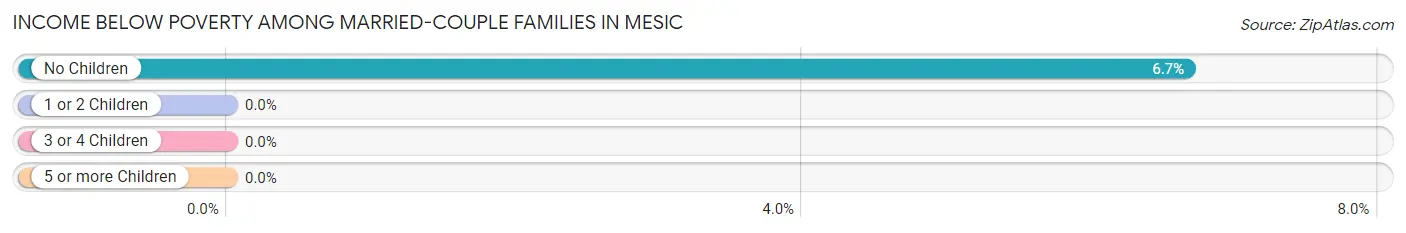
| Children | Above Poverty | Below Poverty |
| No Children | 14 (93.3%) | 1 (6.7%) |
| 1 or 2 Children | 4 (100.0%) | 0 (0.0%) |
| 3 or 4 Children | 1 (100.0%) | 0 (0.0%) |
| 5 or more Children | 0 (0.0%) | 0 (0.0%) |
| Total | 19 (95.0%) | 1 (5.0%) |
Income Below Poverty Among Single-Parent Households in Mesic
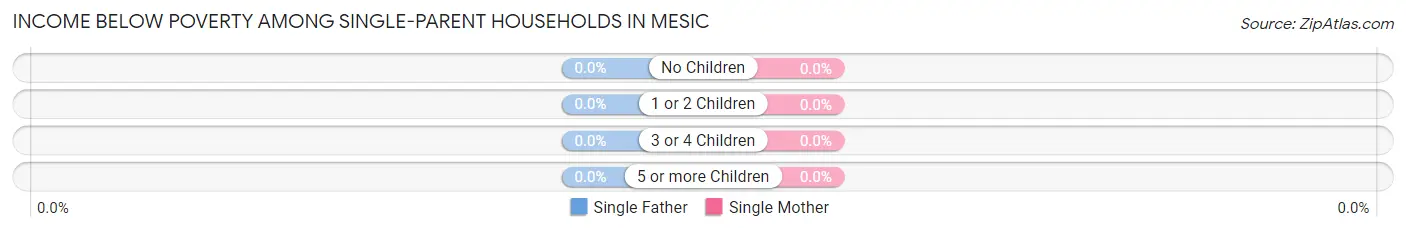
| Children | Single Father | Single Mother |
| No Children | 0 (0.0%) | 0 (0.0%) |
| 1 or 2 Children | 0 (0.0%) | 0 (0.0%) |
| 3 or 4 Children | 0 (0.0%) | 0 (0.0%) |
| 5 or more Children | 0 (0.0%) | 0 (0.0%) |
| Total | 0 (0.0%) | 0 (0.0%) |
Income Below Poverty Among Married-Couple vs Single-Parent Households in Mesic
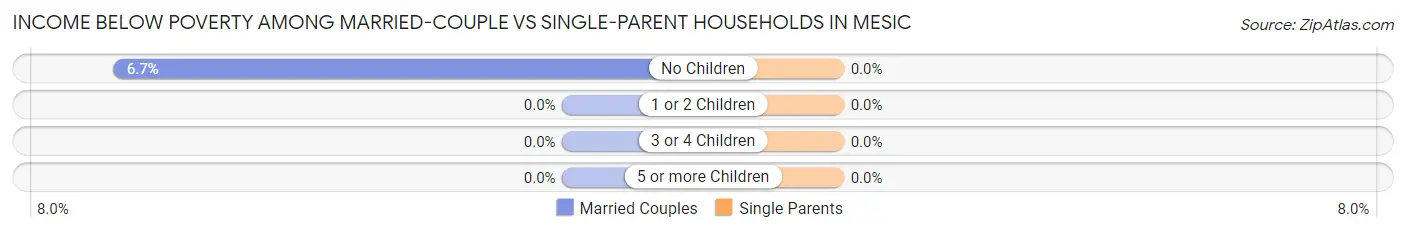
| Children | Married-Couple Families | Single-Parent Households |
| No Children | 1 (6.7%) | 0 (0.0%) |
| 1 or 2 Children | 0 (0.0%) | 0 (0.0%) |
| 3 or 4 Children | 0 (0.0%) | 0 (0.0%) |
| 5 or more Children | 0 (0.0%) | 0 (0.0%) |
| Total | 1 (5.0%) | 0 (0.0%) |
Race in Mesic
The most populous races in Mesic are White / Caucasian (98 | 53.5%), and Black / African American (85 | 46.5%).
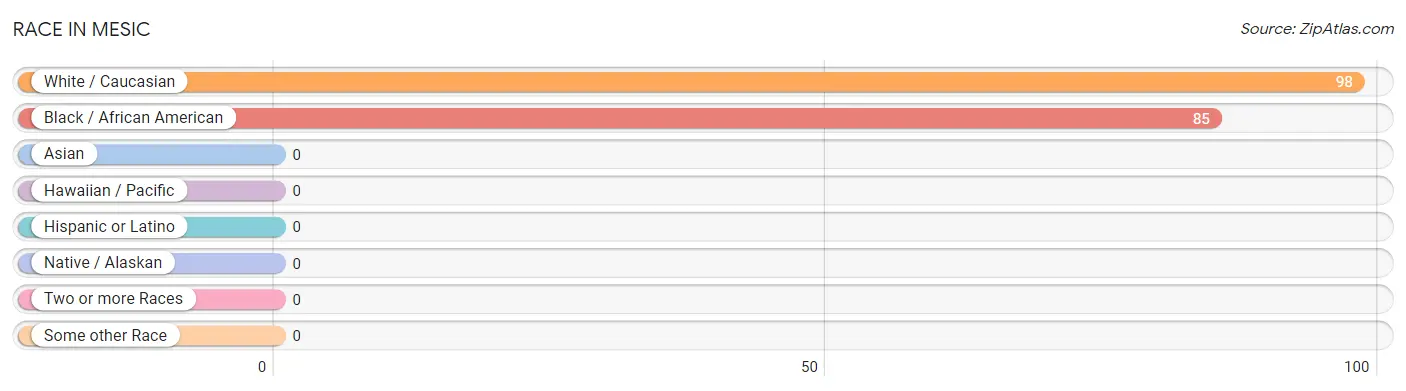
| Race | # Population | % Population |
| Asian | 0 | 0.0% |
| Black / African American | 85 | 46.5% |
| Hawaiian / Pacific | 0 | 0.0% |
| Hispanic or Latino | 0 | 0.0% |
| Native / Alaskan | 0 | 0.0% |
| White / Caucasian | 98 | 53.5% |
| Two or more Races | 0 | 0.0% |
| Some other Race | 0 | 0.0% |
| Total | 183 | 100.0% |
Ancestry in Mesic
The most populous ancestries reported in Mesic are English (3 | 1.6%), Scotch-Irish (3 | 1.6%), American (2 | 1.1%), and German (2 | 1.1%), together accounting for 5.5% of all Mesic residents.
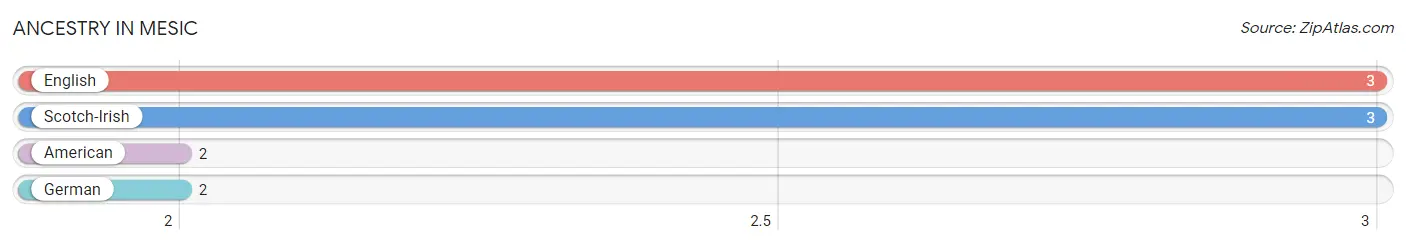
| Ancestry | # Population | % Population |
| American | 2 | 1.1% |
| English | 3 | 1.6% |
| German | 2 | 1.1% |
| Scotch-Irish | 3 | 1.6% | View All 4 Rows |
Immigrants in Mesic
The most numerous immigrant groups reported in Mesic came from Europe (2 | 1.1%), Northern Europe (2 | 1.1%), and Scotland (2 | 1.1%), together accounting for 3.3% of all Mesic residents.
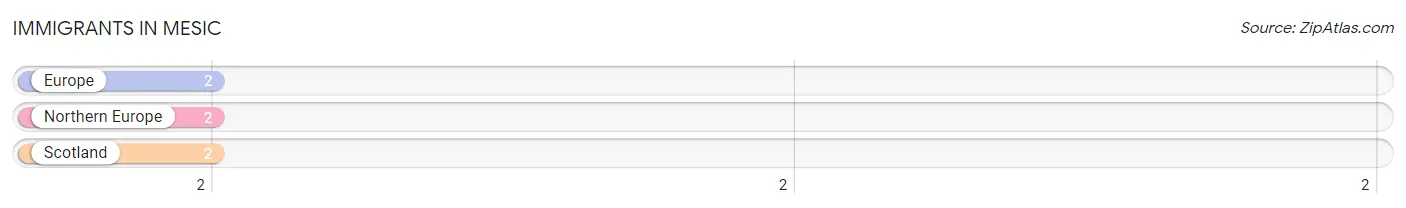
| Immigration Origin | # Population | % Population |
| Europe | 2 | 1.1% |
| Northern Europe | 2 | 1.1% |
| Scotland | 2 | 1.1% | View All 3 Rows |
Sex and Age in Mesic
Sex and Age in Mesic
The most populous age groups in Mesic are 65 to 69 Years (15 | 22.1%) for men and 75 to 79 Years (21 | 18.3%) for women.
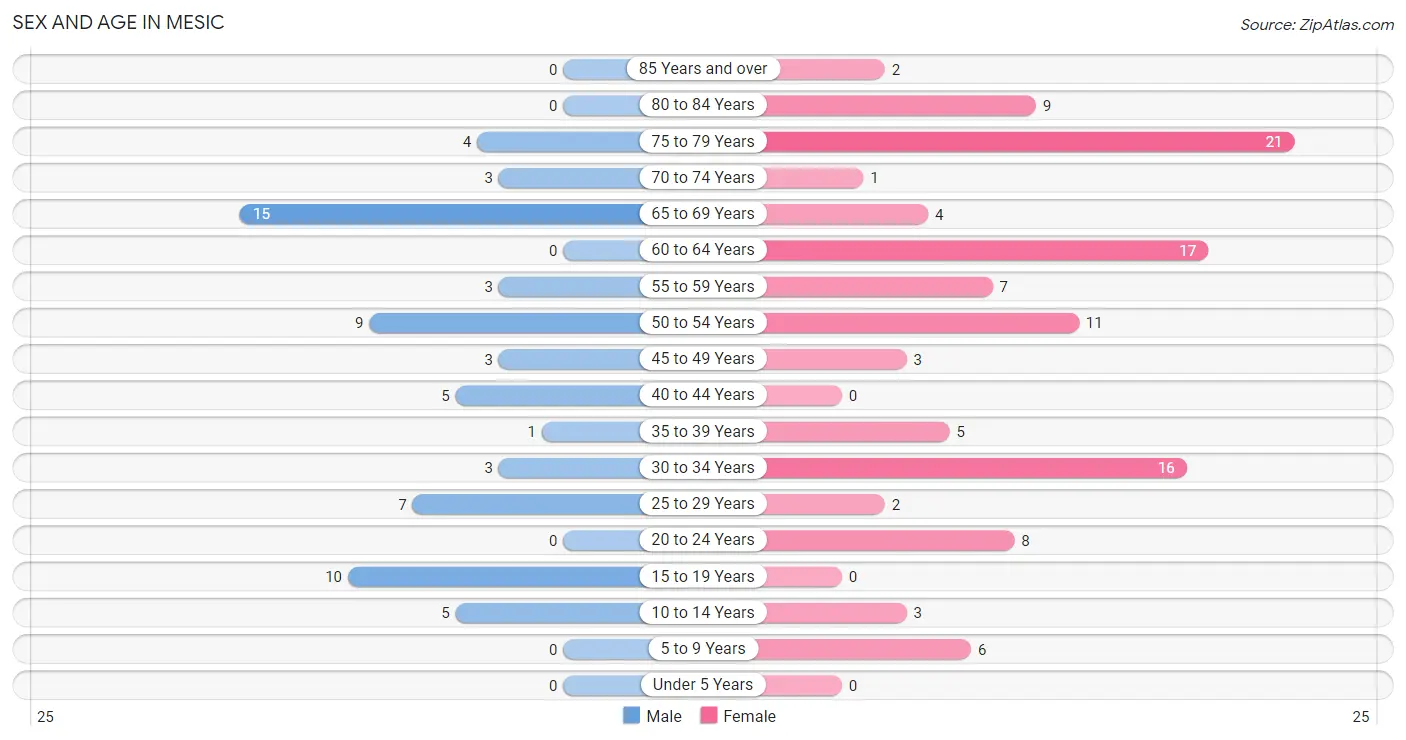
| Age Bracket | Male | Female |
| Under 5 Years | 0 (0.0%) | 0 (0.0%) |
| 5 to 9 Years | 0 (0.0%) | 6 (5.2%) |
| 10 to 14 Years | 5 (7.3%) | 3 (2.6%) |
| 15 to 19 Years | 10 (14.7%) | 0 (0.0%) |
| 20 to 24 Years | 0 (0.0%) | 8 (7.0%) |
| 25 to 29 Years | 7 (10.3%) | 2 (1.7%) |
| 30 to 34 Years | 3 (4.4%) | 16 (13.9%) |
| 35 to 39 Years | 1 (1.5%) | 5 (4.3%) |
| 40 to 44 Years | 5 (7.3%) | 0 (0.0%) |
| 45 to 49 Years | 3 (4.4%) | 3 (2.6%) |
| 50 to 54 Years | 9 (13.2%) | 11 (9.6%) |
| 55 to 59 Years | 3 (4.4%) | 7 (6.1%) |
| 60 to 64 Years | 0 (0.0%) | 17 (14.8%) |
| 65 to 69 Years | 15 (22.1%) | 4 (3.5%) |
| 70 to 74 Years | 3 (4.4%) | 1 (0.9%) |
| 75 to 79 Years | 4 (5.9%) | 21 (18.3%) |
| 80 to 84 Years | 0 (0.0%) | 9 (7.8%) |
| 85 Years and over | 0 (0.0%) | 2 (1.7%) |
| Total | 68 (100.0%) | 115 (100.0%) |
Families and Households in Mesic
Median Family Size in Mesic
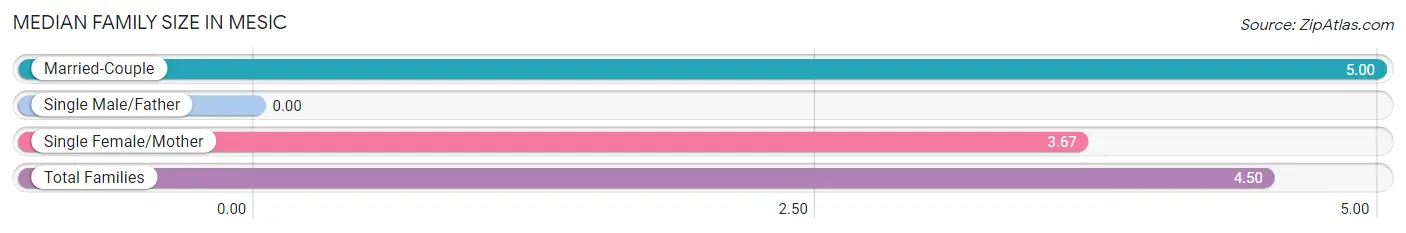
| Family Type | # Families | Family Size |
| Married-Couple | 20 (62.5%) | 5.00 |
| Single Male/Father | 0 (0.0%) | - |
| Single Female/Mother | 12 (37.5%) | 3.67 |
| Total Families | 32 (100.0%) | 4.50 |
Median Household Size in Mesic
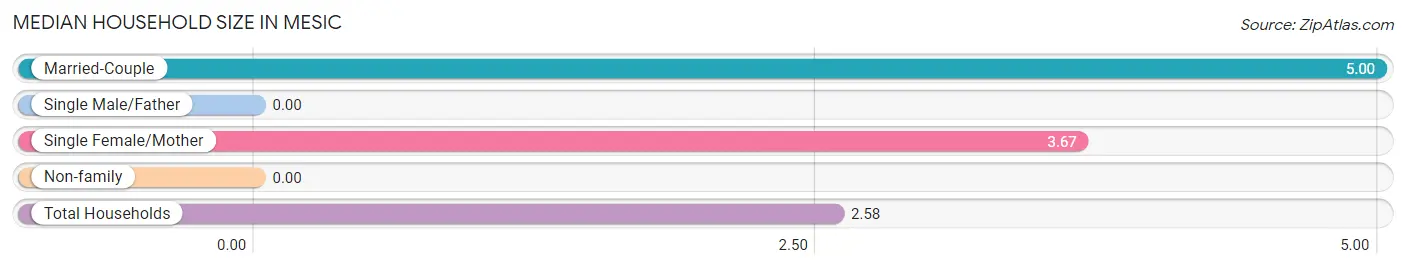
| Household Type | # Households | Household Size |
| Married-Couple | 20 (28.2%) | 5.00 |
| Single Male/Father | 0 (0.0%) | - |
| Single Female/Mother | 12 (16.9%) | 3.67 |
| Non-family | 39 (54.9%) | - |
| Total Households | 71 (100.0%) | 2.58 |
Household Size by Marriage Status in Mesic
Out of a total of 71 households in Mesic, 32 (45.1%) are family households, while 39 (54.9%) are nonfamily households. The most numerous type of family households are 3-person households, comprising 12, and the most common type of nonfamily households are 1-person households, comprising 39.
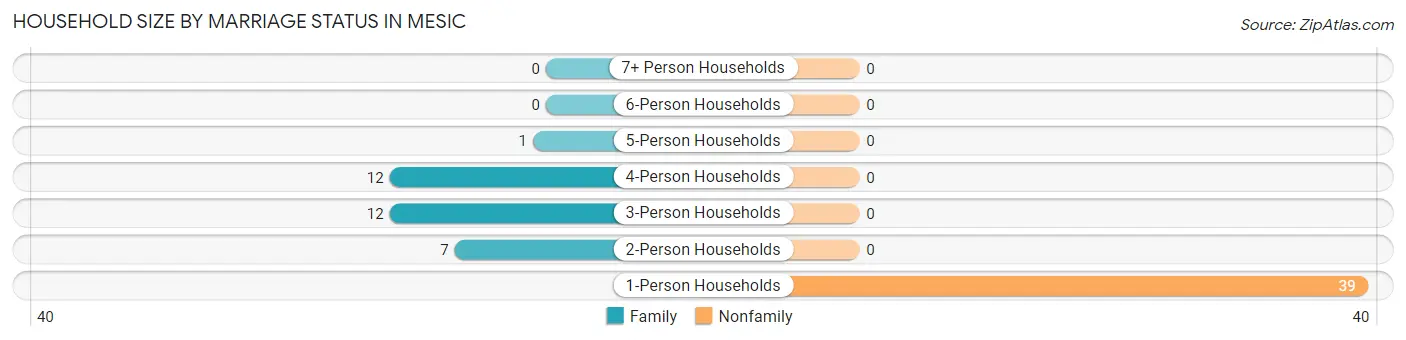
| Household Size | Family Households | Nonfamily Households |
| 1-Person Households | - | 39 (54.9%) |
| 2-Person Households | 7 (9.9%) | 0 (0.0%) |
| 3-Person Households | 12 (16.9%) | 0 (0.0%) |
| 4-Person Households | 12 (16.9%) | 0 (0.0%) |
| 5-Person Households | 1 (1.4%) | 0 (0.0%) |
| 6-Person Households | 0 (0.0%) | 0 (0.0%) |
| 7+ Person Households | 0 (0.0%) | 0 (0.0%) |
| Total | 32 (45.1%) | 39 (54.9%) |
Female Fertility in Mesic
Fertility by Age in Mesic
| Age Bracket | Women with Births | Births / 1,000 Women |
| 15 to 19 years | 0 (0.0%) | 0.0 |
| 20 to 34 years | 0 (0.0%) | 0.0 |
| 35 to 50 years | 0 (0.0%) | 0.0 |
| Total | 0 (0.0%) | 0.0 |
Fertility by Age by Marriage Status in Mesic
| Age Bracket | Married | Unmarried |
| 15 to 19 years | 0 (0.0%) | 0 (0.0%) |
| 20 to 34 years | 0 (0.0%) | 0 (0.0%) |
| 35 to 50 years | 0 (0.0%) | 0 (0.0%) |
| Total | 0 (0.0%) | 0 (0.0%) |
Fertility by Education in Mesic
| Educational Attainment | Women with Births | Births / 1,000 Women |
| Less than High School | 0 (0.0%) | 0.0 |
| High School Diploma | 0 (0.0%) | 0.0 |
| College or Associate's Degree | 0 (0.0%) | 0.0 |
| Bachelor's Degree | 0 (0.0%) | 0.0 |
| Graduate Degree | 0 (0.0%) | 0.0 |
| Total | 0 (0.0%) | 0.0 |
Fertility by Education by Marriage Status in Mesic
| Educational Attainment | Married | Unmarried |
| Less than High School | 0 (0.0%) | 0 (0.0%) |
| High School Diploma | 0 (0.0%) | 0 (0.0%) |
| College or Associate's Degree | 0 (0.0%) | 0 (0.0%) |
| Bachelor's Degree | 0 (0.0%) | 0 (0.0%) |
| Graduate Degree | 0 (0.0%) | 0 (0.0%) |
| Total | 0 (0.0%) | 0 (0.0%) |
Employment Characteristics in Mesic
Employment by Class of Employer in Mesic
Among the 61 employed individuals in Mesic, private company employees (29 | 47.5%), state government employees (9 | 14.7%), and self-employed (not incorporated) (8 | 13.1%) make up the most common classes of employment.
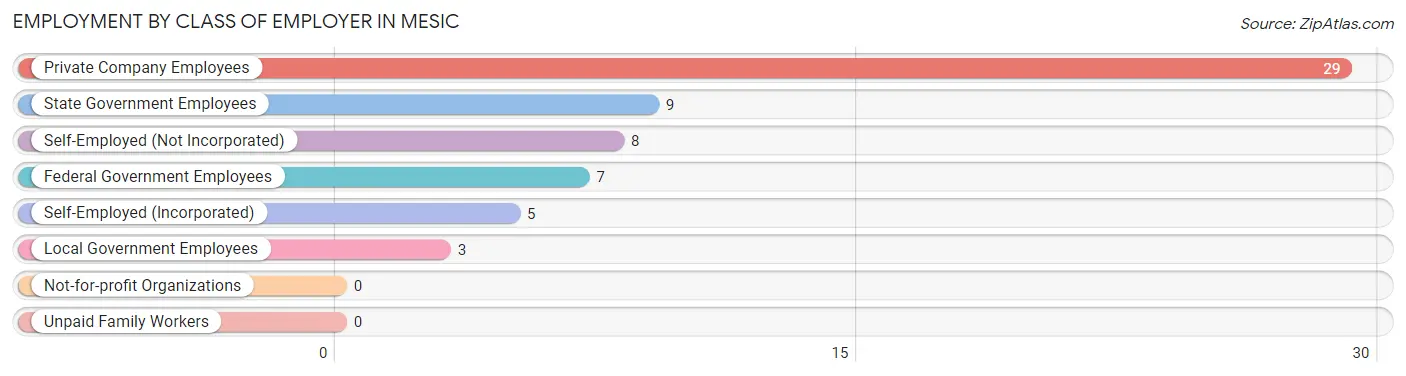
| Employer Class | # Employees | % Employees |
| Private Company Employees | 29 | 47.5% |
| Self-Employed (Incorporated) | 5 | 8.2% |
| Self-Employed (Not Incorporated) | 8 | 13.1% |
| Not-for-profit Organizations | 0 | 0.0% |
| Local Government Employees | 3 | 4.9% |
| State Government Employees | 9 | 14.7% |
| Federal Government Employees | 7 | 11.5% |
| Unpaid Family Workers | 0 | 0.0% |
| Total | 61 | 100.0% |
Employment Status by Age in Mesic
According to the labor force statistics for Mesic, out of the total population over 16 years of age (169), 41.4% or 70 individuals are in the labor force, with 4.3% or 3 of them unemployed. The age group with the highest labor force participation rate is 20 to 24 years, with 100.0% or 8 individuals in the labor force. Within the labor force, the 45 to 54 years age range has the highest percentage of unemployed individuals, with 25.0% or 3 of them being unemployed.
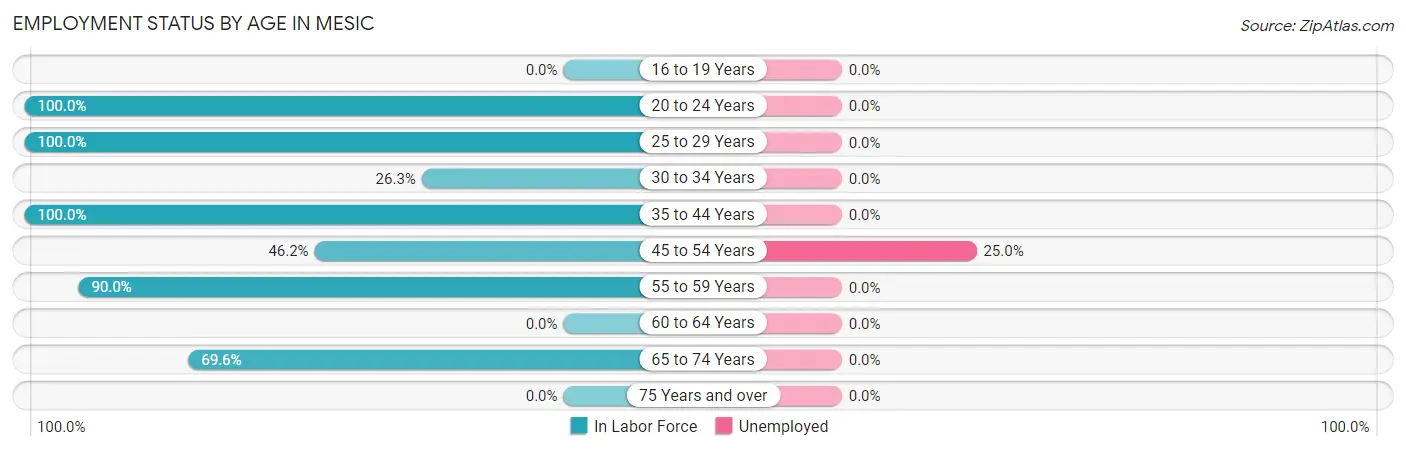
| Age Bracket | In Labor Force | Unemployed |
| 16 to 19 Years | 0 (0.0%) | 0 (0.0%) |
| 20 to 24 Years | 8 (100.0%) | 0 (0.0%) |
| 25 to 29 Years | 9 (100.0%) | 0 (0.0%) |
| 30 to 34 Years | 5 (26.3%) | 0 (0.0%) |
| 35 to 44 Years | 11 (100.0%) | 0 (0.0%) |
| 45 to 54 Years | 12 (46.2%) | 3 (25.0%) |
| 55 to 59 Years | 9 (90.0%) | 0 (0.0%) |
| 60 to 64 Years | 0 (0.0%) | 0 (0.0%) |
| 65 to 74 Years | 16 (69.6%) | 0 (0.0%) |
| 75 Years and over | 0 (0.0%) | 0 (0.0%) |
| Total | 70 (41.4%) | 3 (4.3%) |
Employment Status by Educational Attainment in Mesic
According to labor force statistics for Mesic, 50.0% of individuals (46) out of the total population between 25 and 64 years of age (92) are in the labor force, with 6.5% or 3 of them being unemployed. The group with the highest labor force participation rate are those with the educational attainment of bachelor's degree or higher, with 100.0% or 12 individuals in the labor force. Within the labor force, individuals with bachelor's degree or higher education have the highest percentage of unemployment, with 25.0% or 3 of them being unemployed.
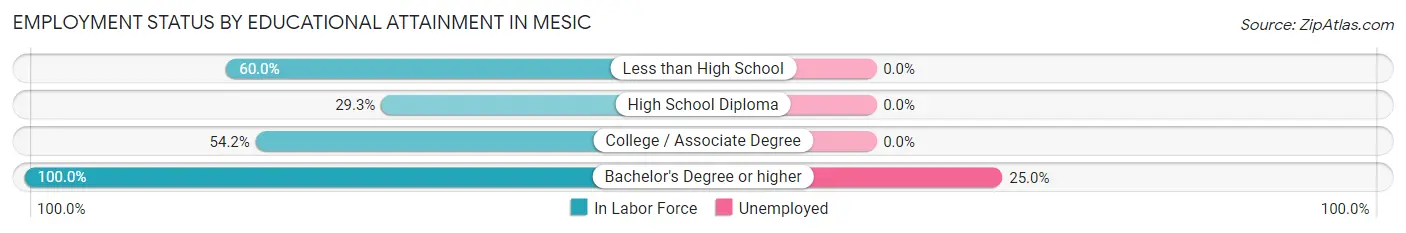
| Educational Attainment | In Labor Force | Unemployed |
| Less than High School | 9 (60.0%) | 0 (0.0%) |
| High School Diploma | 12 (29.3%) | 0 (0.0%) |
| College / Associate Degree | 13 (54.2%) | 0 (0.0%) |
| Bachelor's Degree or higher | 12 (100.0%) | 3 (25.0%) |
| Total | 46 (50.0%) | 6 (6.5%) |
Employment Occupations by Sex in Mesic
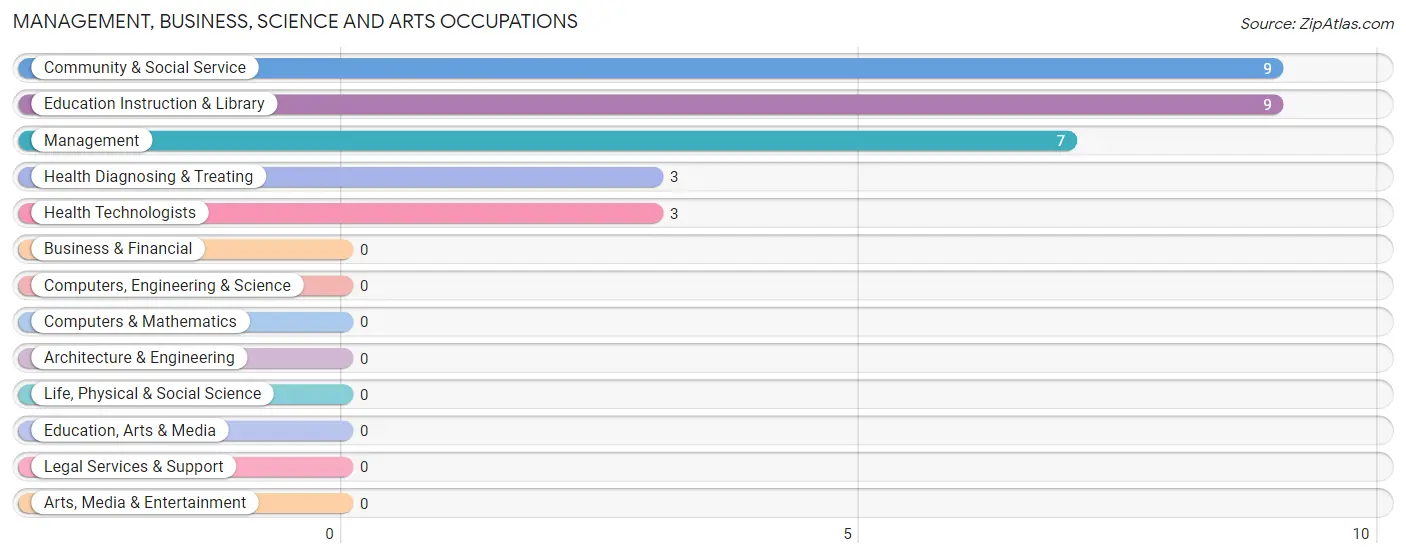
Management, Business, Science and Arts Occupations
The most common Management, Business, Science and Arts occupations in Mesic are Community & Social Service (9 | 13.4%), Education Instruction & Library (9 | 13.4%), Management (7 | 10.4%), Health Diagnosing & Treating (3 | 4.5%), and Health Technologists (3 | 4.5%).
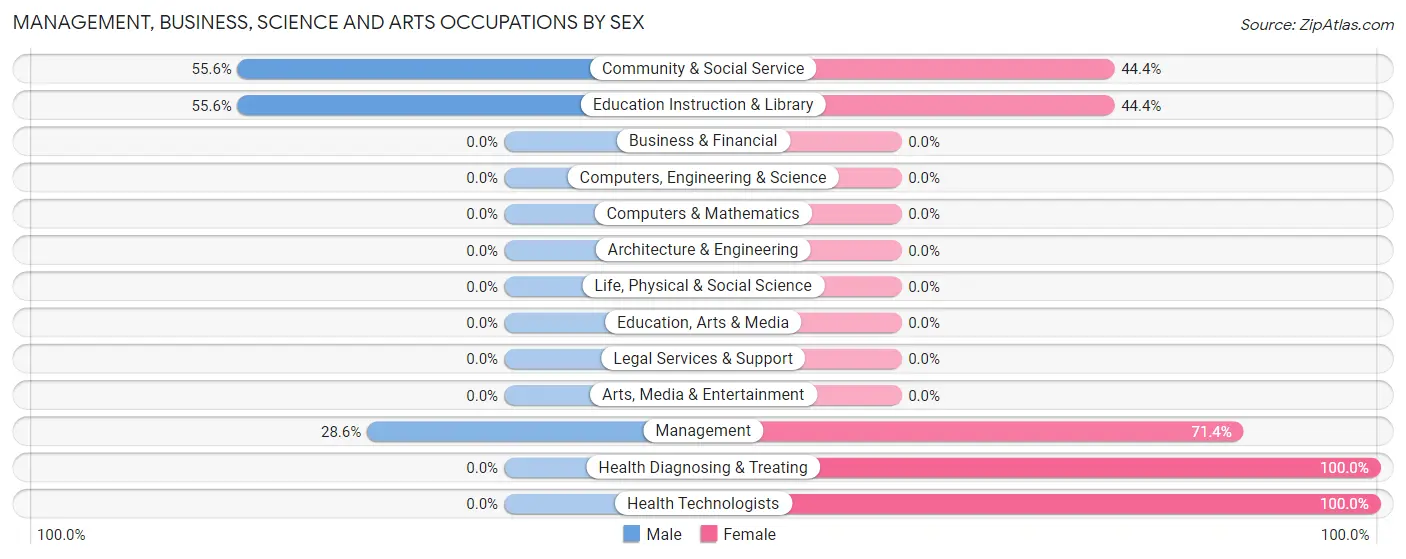
Management, Business, Science and Arts Occupations by Sex
Within the Management, Business, Science and Arts occupations in Mesic, the most male-oriented occupations are Community & Social Service (55.6%), Education Instruction & Library (55.6%), and Management (28.6%), while the most female-oriented occupations are Health Diagnosing & Treating (100.0%), Health Technologists (100.0%), and Management (71.4%).
| Occupation | Male | Female |
| Management | 2 (28.6%) | 5 (71.4%) |
| Business & Financial | 0 (0.0%) | 0 (0.0%) |
| Computers, Engineering & Science | 0 (0.0%) | 0 (0.0%) |
| Computers & Mathematics | 0 (0.0%) | 0 (0.0%) |
| Architecture & Engineering | 0 (0.0%) | 0 (0.0%) |
| Life, Physical & Social Science | 0 (0.0%) | 0 (0.0%) |
| Community & Social Service | 5 (55.6%) | 4 (44.4%) |
| Education, Arts & Media | 0 (0.0%) | 0 (0.0%) |
| Legal Services & Support | 0 (0.0%) | 0 (0.0%) |
| Education Instruction & Library | 5 (55.6%) | 4 (44.4%) |
| Arts, Media & Entertainment | 0 (0.0%) | 0 (0.0%) |
| Health Diagnosing & Treating | 0 (0.0%) | 3 (100.0%) |
| Health Technologists | 0 (0.0%) | 3 (100.0%) |
| Total (Category) | 7 (36.8%) | 12 (63.2%) |
| Total (Overall) | 43 (64.2%) | 24 (35.8%) |
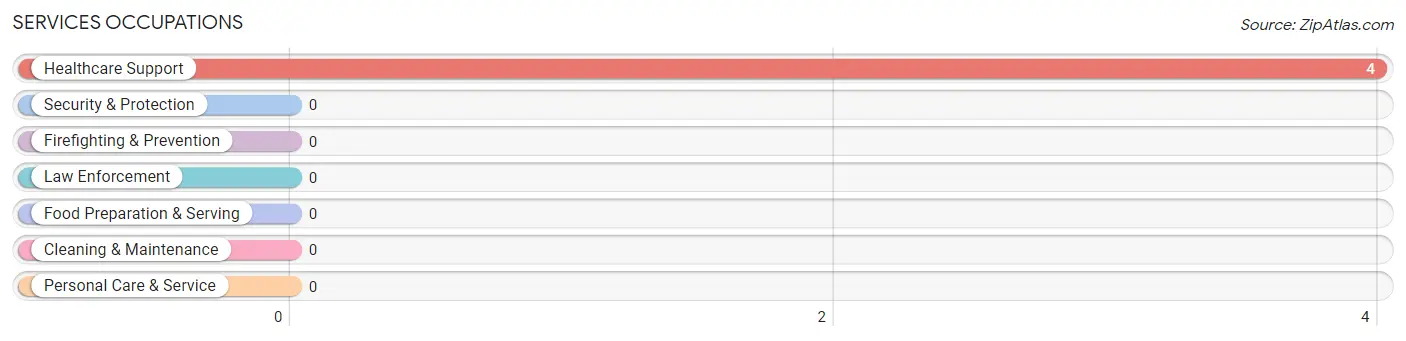
Services Occupations
The most common Services occupations in Mesic are , and Healthcare Support (4 | 6.0%).
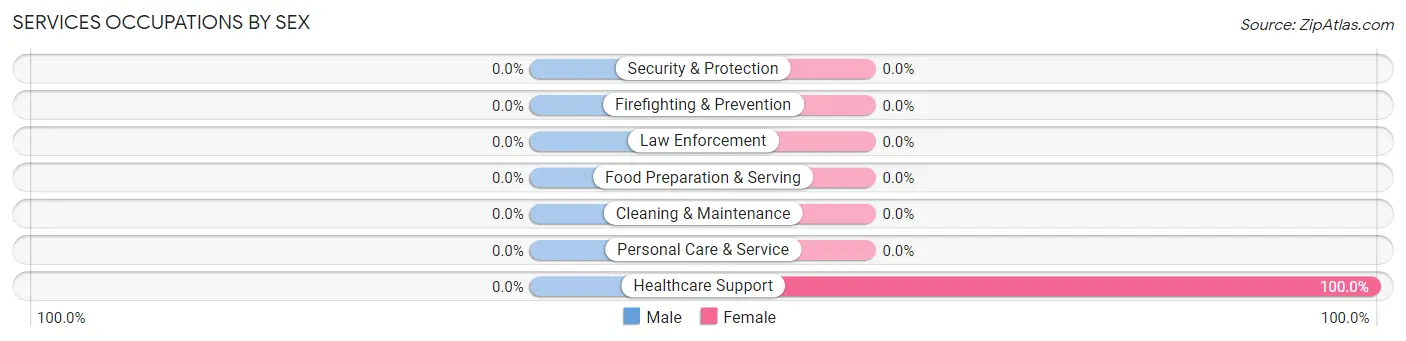
Services Occupations by Sex
| Occupation | Male | Female |
| Healthcare Support | 0 (0.0%) | 4 (100.0%) |
| Security & Protection | 0 (0.0%) | 0 (0.0%) |
| Firefighting & Prevention | 0 (0.0%) | 0 (0.0%) |
| Law Enforcement | 0 (0.0%) | 0 (0.0%) |
| Food Preparation & Serving | 0 (0.0%) | 0 (0.0%) |
| Cleaning & Maintenance | 0 (0.0%) | 0 (0.0%) |
| Personal Care & Service | 0 (0.0%) | 0 (0.0%) |
| Total (Category) | 0 (0.0%) | 4 (100.0%) |
| Total (Overall) | 43 (64.2%) | 24 (35.8%) |
Sales and Office Occupations
The most common Sales and Office occupations in Mesic are Sales & Related (8 | 11.9%), and Office & Administration (7 | 10.4%).

Sales and Office Occupations by Sex

| Occupation | Male | Female |
| Sales & Related | 0 (0.0%) | 8 (100.0%) |
| Office & Administration | 7 (100.0%) | 0 (0.0%) |
| Total (Category) | 7 (46.7%) | 8 (53.3%) |
| Total (Overall) | 43 (64.2%) | 24 (35.8%) |
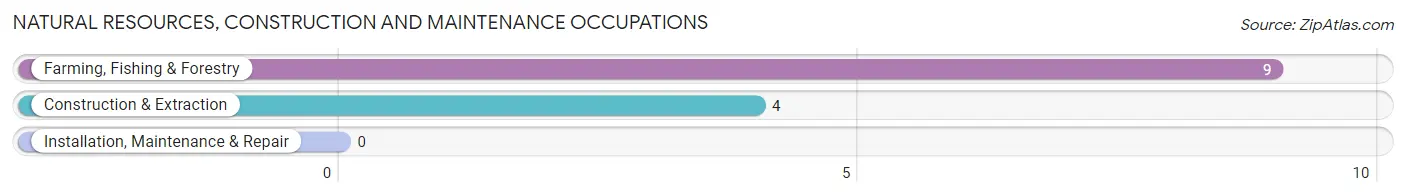
Natural Resources, Construction and Maintenance Occupations
The most common Natural Resources, Construction and Maintenance occupations in Mesic are Farming, Fishing & Forestry (9 | 13.4%), and Construction & Extraction (4 | 6.0%).
Natural Resources, Construction and Maintenance Occupations by Sex
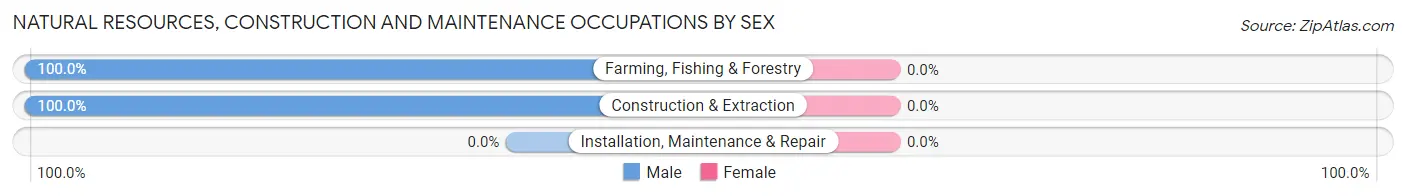
| Occupation | Male | Female |
| Farming, Fishing & Forestry | 9 (100.0%) | 0 (0.0%) |
| Construction & Extraction | 4 (100.0%) | 0 (0.0%) |
| Installation, Maintenance & Repair | 0 (0.0%) | 0 (0.0%) |
| Total (Category) | 13 (100.0%) | 0 (0.0%) |
| Total (Overall) | 43 (64.2%) | 24 (35.8%) |
Production, Transportation and Moving Occupations
The most common Production, Transportation and Moving occupations in Mesic are Transportation (14 | 20.9%), and Material Moving (2 | 3.0%).
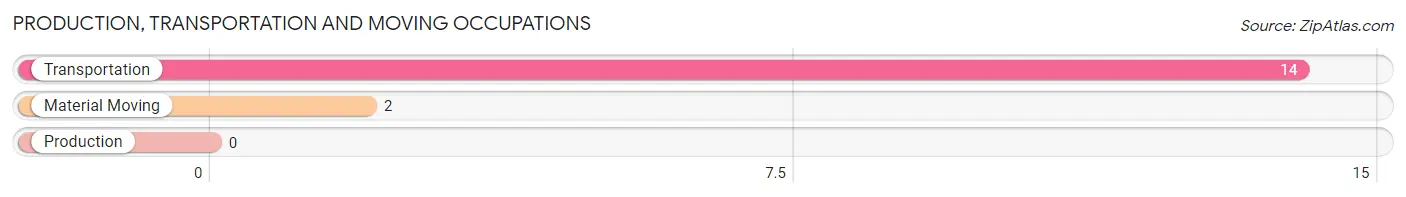
Production, Transportation and Moving Occupations by Sex
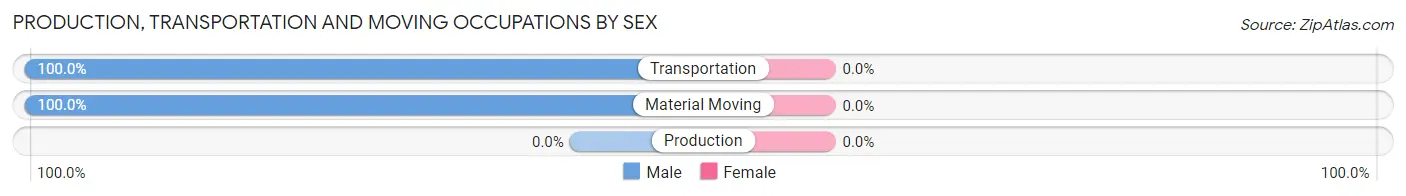
| Occupation | Male | Female |
| Production | 0 (0.0%) | 0 (0.0%) |
| Transportation | 14 (100.0%) | 0 (0.0%) |
| Material Moving | 2 (100.0%) | 0 (0.0%) |
| Total (Category) | 16 (100.0%) | 0 (0.0%) |
| Total (Overall) | 43 (64.2%) | 24 (35.8%) |
Employment Industries by Sex in Mesic
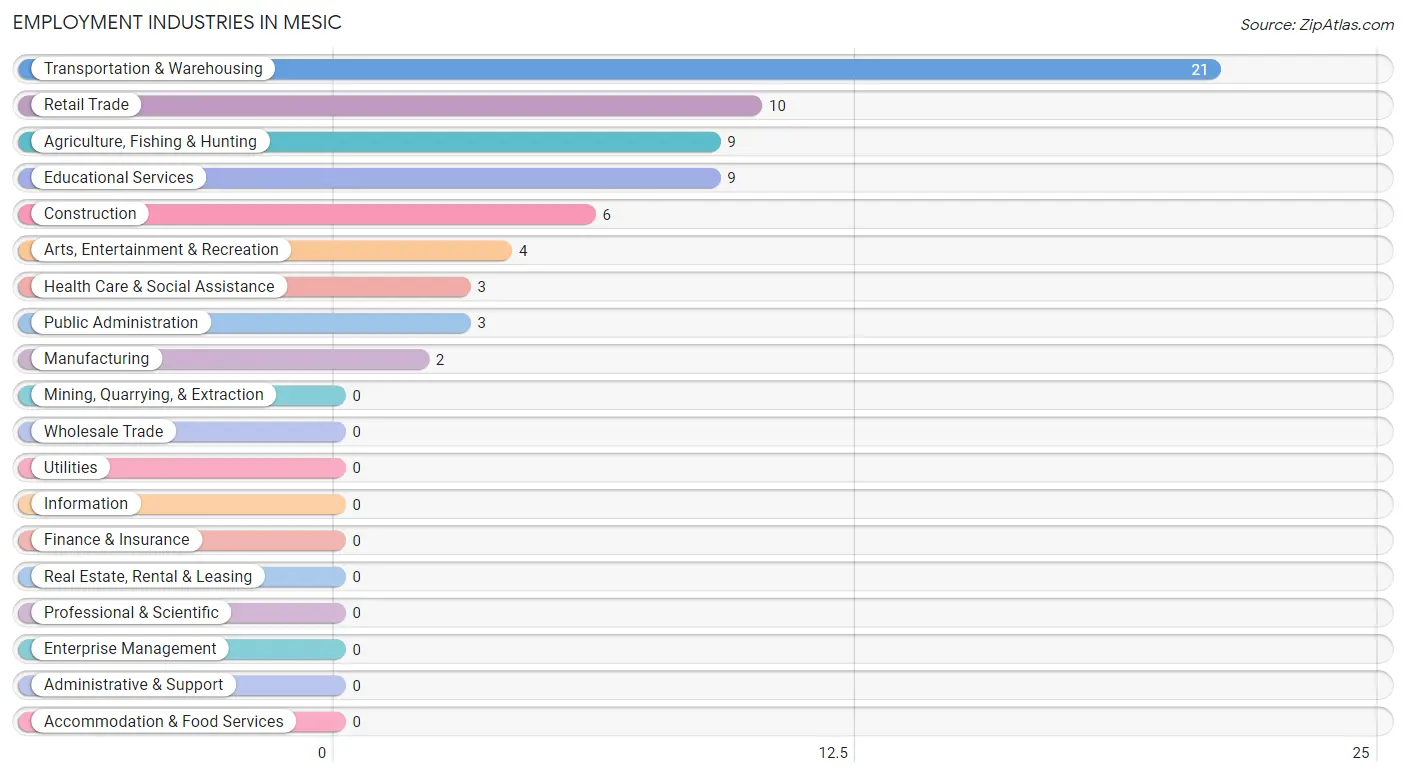
Employment Industries in Mesic
The major employment industries in Mesic include Transportation & Warehousing (21 | 31.3%), Retail Trade (10 | 14.9%), Agriculture, Fishing & Hunting (9 | 13.4%), Educational Services (9 | 13.4%), and Construction (6 | 9.0%).
Employment Industries by Sex in Mesic
The Mesic industries that see more men than women are Agriculture, Fishing & Hunting (100.0%), Construction (100.0%), and Manufacturing (100.0%), whereas the industries that tend to have a higher number of women are Retail Trade (100.0%), Health Care & Social Assistance (100.0%), and Arts, Entertainment & Recreation (100.0%).
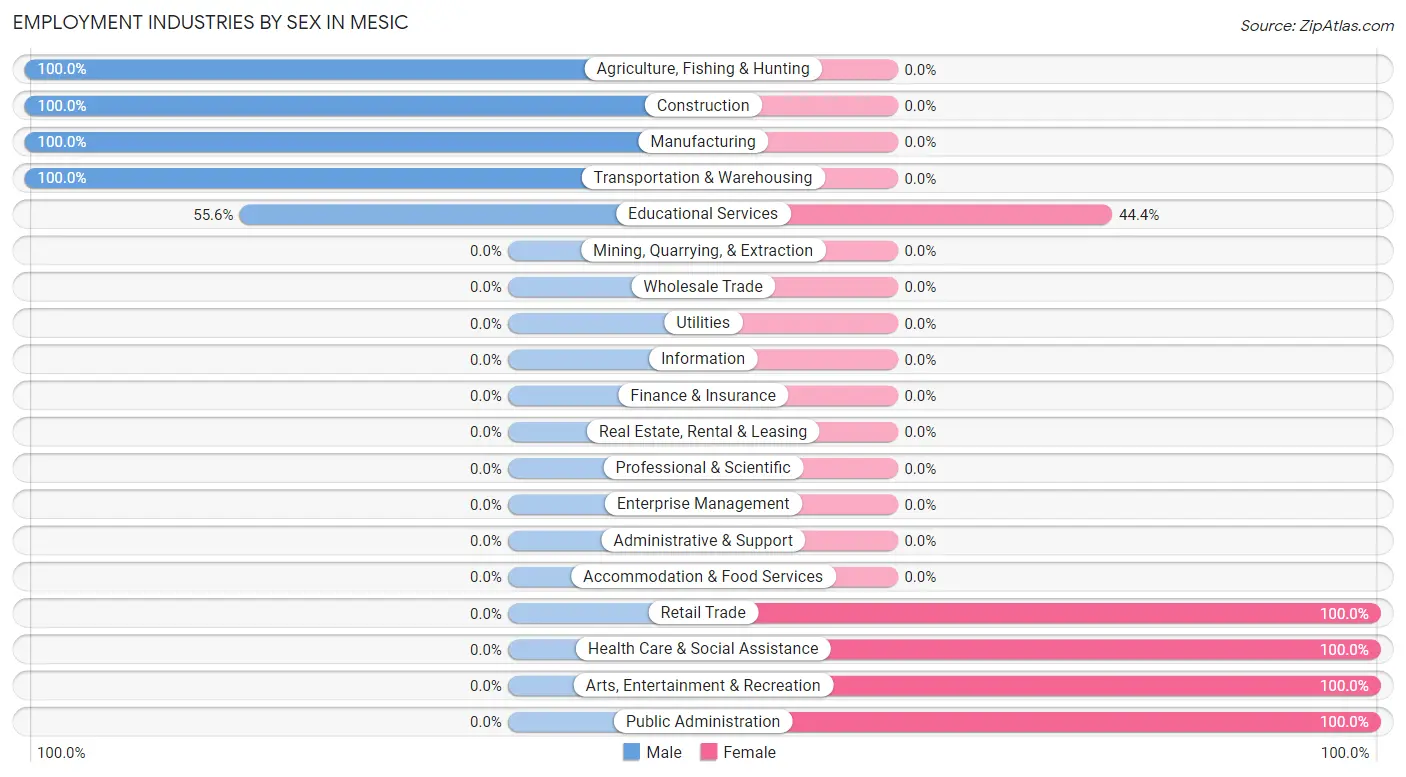
| Industry | Male | Female |
| Agriculture, Fishing & Hunting | 9 (100.0%) | 0 (0.0%) |
| Mining, Quarrying, & Extraction | 0 (0.0%) | 0 (0.0%) |
| Construction | 6 (100.0%) | 0 (0.0%) |
| Manufacturing | 2 (100.0%) | 0 (0.0%) |
| Wholesale Trade | 0 (0.0%) | 0 (0.0%) |
| Retail Trade | 0 (0.0%) | 10 (100.0%) |
| Transportation & Warehousing | 21 (100.0%) | 0 (0.0%) |
| Utilities | 0 (0.0%) | 0 (0.0%) |
| Information | 0 (0.0%) | 0 (0.0%) |
| Finance & Insurance | 0 (0.0%) | 0 (0.0%) |
| Real Estate, Rental & Leasing | 0 (0.0%) | 0 (0.0%) |
| Professional & Scientific | 0 (0.0%) | 0 (0.0%) |
| Enterprise Management | 0 (0.0%) | 0 (0.0%) |
| Administrative & Support | 0 (0.0%) | 0 (0.0%) |
| Educational Services | 5 (55.6%) | 4 (44.4%) |
| Health Care & Social Assistance | 0 (0.0%) | 3 (100.0%) |
| Arts, Entertainment & Recreation | 0 (0.0%) | 4 (100.0%) |
| Accommodation & Food Services | 0 (0.0%) | 0 (0.0%) |
| Public Administration | 0 (0.0%) | 3 (100.0%) |
| Total | 43 (64.2%) | 24 (35.8%) |
Education in Mesic
School Enrollment in Mesic
The most common levels of schooling among the 36 students in Mesic are college / undergraduate (18 | 50.0%), middle school (8 | 22.2%), and elementary school (6 | 16.7%).
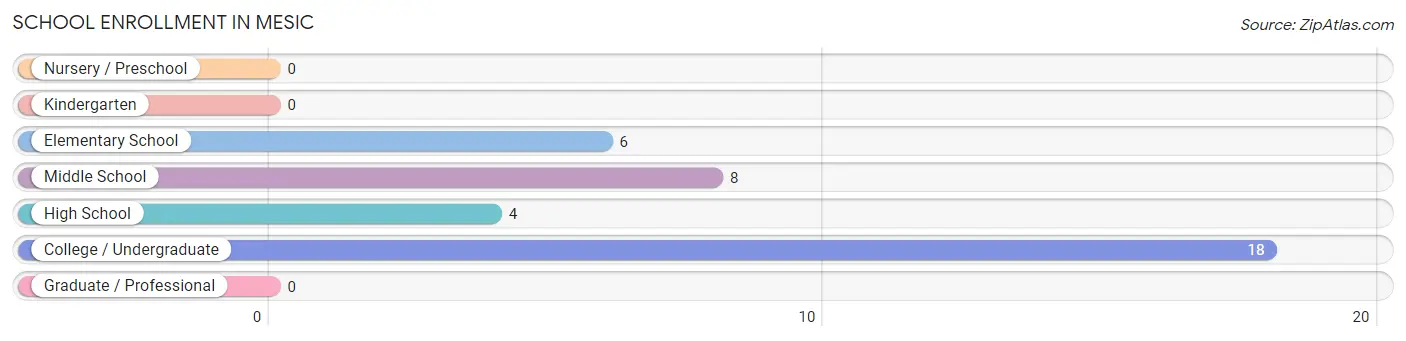
| School Level | # Students | % Students |
| Nursery / Preschool | 0 | 0.0% |
| Kindergarten | 0 | 0.0% |
| Elementary School | 6 | 16.7% |
| Middle School | 8 | 22.2% |
| High School | 4 | 11.1% |
| College / Undergraduate | 18 | 50.0% |
| Graduate / Professional | 0 | 0.0% |
| Total | 36 | 100.0% |
School Enrollment by Age by Funding Source in Mesic
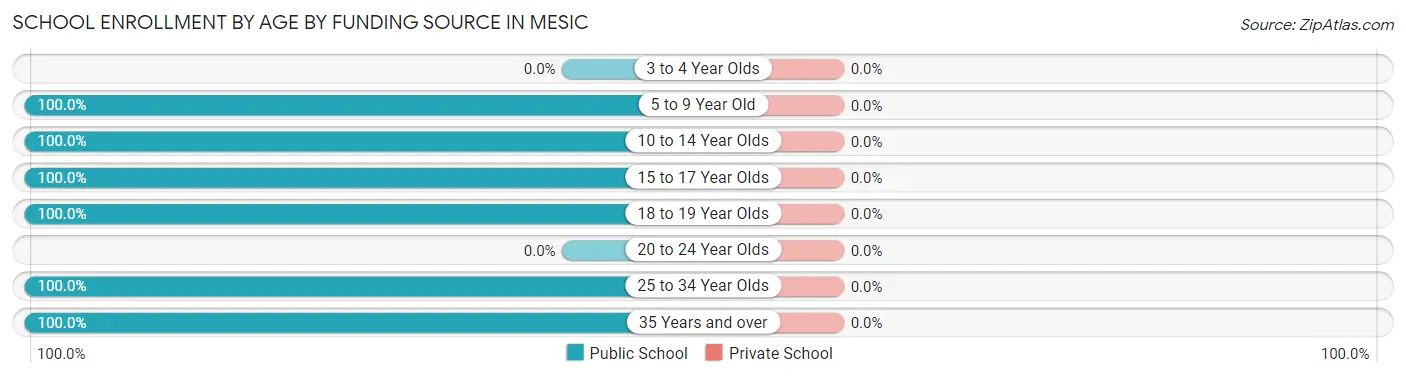
| Age Bracket | Public School | Private School |
| 3 to 4 Year Olds | 0 (0.0%) | 0 (0.0%) |
| 5 to 9 Year Old | 6 (100.0%) | 0 (0.0%) |
| 10 to 14 Year Olds | 8 (100.0%) | 0 (0.0%) |
| 15 to 17 Year Olds | 4 (100.0%) | 0 (0.0%) |
| 18 to 19 Year Olds | 6 (100.0%) | 0 (0.0%) |
| 20 to 24 Year Olds | 0 (0.0%) | 0 (0.0%) |
| 25 to 34 Year Olds | 7 (100.0%) | 0 (0.0%) |
| 35 Years and over | 5 (100.0%) | 0 (0.0%) |
| Total | 36 (100.0%) | 0 (0.0%) |
Educational Attainment by Field of Study in Mesic
Social sciences (6 | 35.3%), science & technology (4 | 23.5%), business (3 | 17.6%), education (3 | 17.6%), and bio, nature & agricultural (1 | 5.9%) are the most common fields of study among 17 individuals in Mesic who have obtained a bachelor's degree or higher.
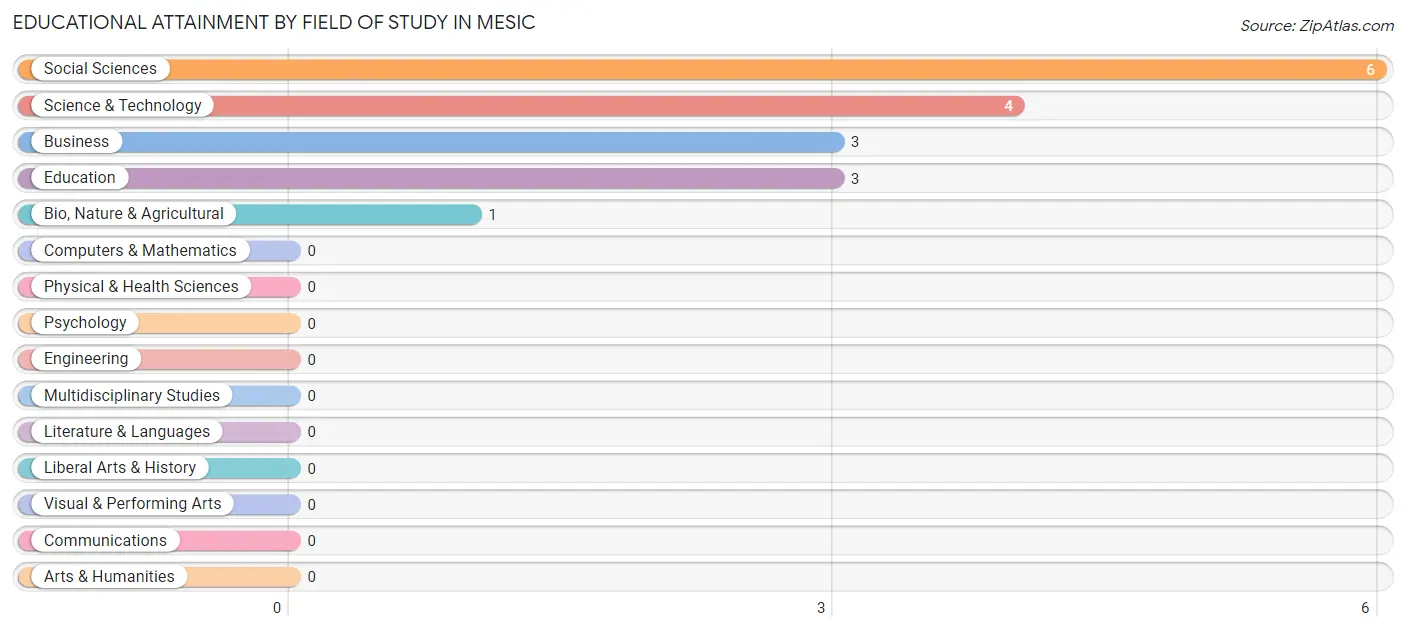
| Field of Study | # Graduates | % Graduates |
| Computers & Mathematics | 0 | 0.0% |
| Bio, Nature & Agricultural | 1 | 5.9% |
| Physical & Health Sciences | 0 | 0.0% |
| Psychology | 0 | 0.0% |
| Social Sciences | 6 | 35.3% |
| Engineering | 0 | 0.0% |
| Multidisciplinary Studies | 0 | 0.0% |
| Science & Technology | 4 | 23.5% |
| Business | 3 | 17.6% |
| Education | 3 | 17.6% |
| Literature & Languages | 0 | 0.0% |
| Liberal Arts & History | 0 | 0.0% |
| Visual & Performing Arts | 0 | 0.0% |
| Communications | 0 | 0.0% |
| Arts & Humanities | 0 | 0.0% |
| Total | 17 | 100.0% |
Transportation & Commute in Mesic
Vehicle Availability by Sex in Mesic
The most prevalent vehicle ownership categories in Mesic are males with 4 vehicles (20, accounting for 47.6%) and females with 4 vehicles (12, making up 105.3%).
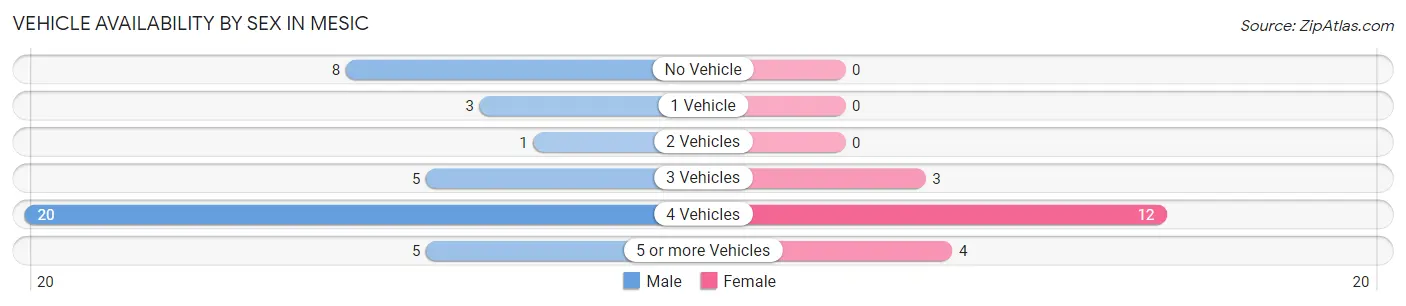
| Vehicles Available | Male | Female |
| No Vehicle | 8 (19.1%) | 0 (0.0%) |
| 1 Vehicle | 3 (7.1%) | 0 (0.0%) |
| 2 Vehicles | 1 (2.4%) | 0 (0.0%) |
| 3 Vehicles | 5 (11.9%) | 3 (15.8%) |
| 4 Vehicles | 20 (47.6%) | 12 (63.2%) |
| 5 or more Vehicles | 5 (11.9%) | 4 (21.0%) |
| Total | 42 (100.0%) | 19 (100.0%) |
Commute Time in Mesic
The most frequently occuring commute durations in Mesic are 10 to 14 minutes (36 commuters, 59.0%), 20 to 24 minutes (10 commuters, 16.4%), and 30 to 34 minutes (7 commuters, 11.5%).
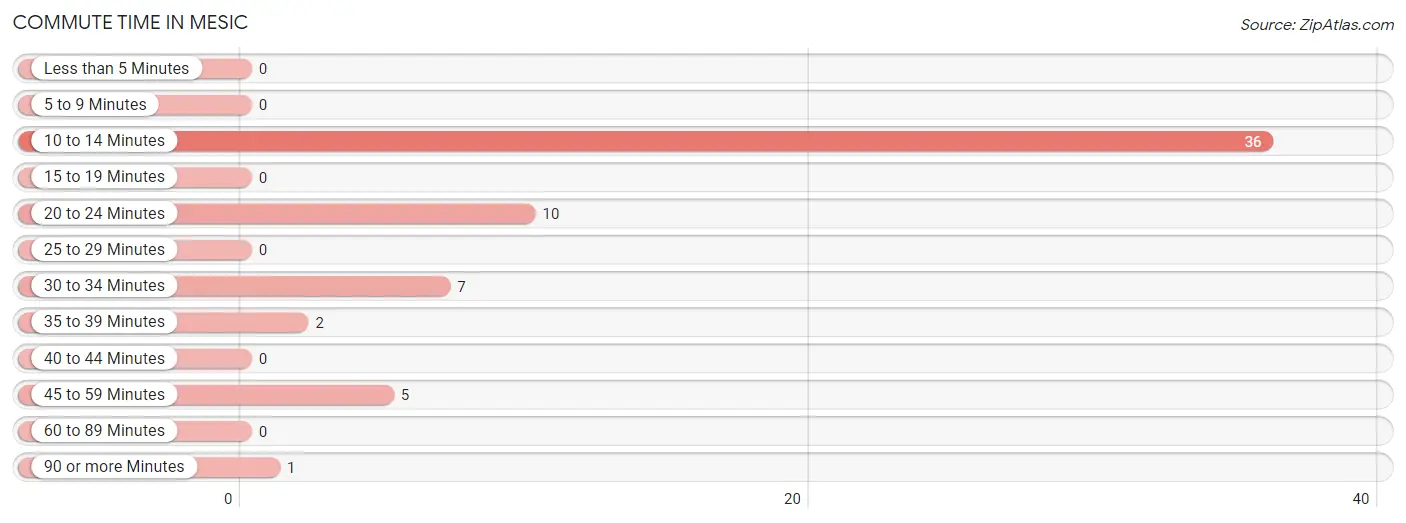
| Commute Time | # Commuters | % Commuters |
| Less than 5 Minutes | 0 | 0.0% |
| 5 to 9 Minutes | 0 | 0.0% |
| 10 to 14 Minutes | 36 | 59.0% |
| 15 to 19 Minutes | 0 | 0.0% |
| 20 to 24 Minutes | 10 | 16.4% |
| 25 to 29 Minutes | 0 | 0.0% |
| 30 to 34 Minutes | 7 | 11.5% |
| 35 to 39 Minutes | 2 | 3.3% |
| 40 to 44 Minutes | 0 | 0.0% |
| 45 to 59 Minutes | 5 | 8.2% |
| 60 to 89 Minutes | 0 | 0.0% |
| 90 or more Minutes | 1 | 1.6% |
Commute Time by Sex in Mesic
The most common commute times in Mesic are 10 to 14 minutes (28 commuters, 66.7%) for males and 10 to 14 minutes (8 commuters, 42.1%) for females.
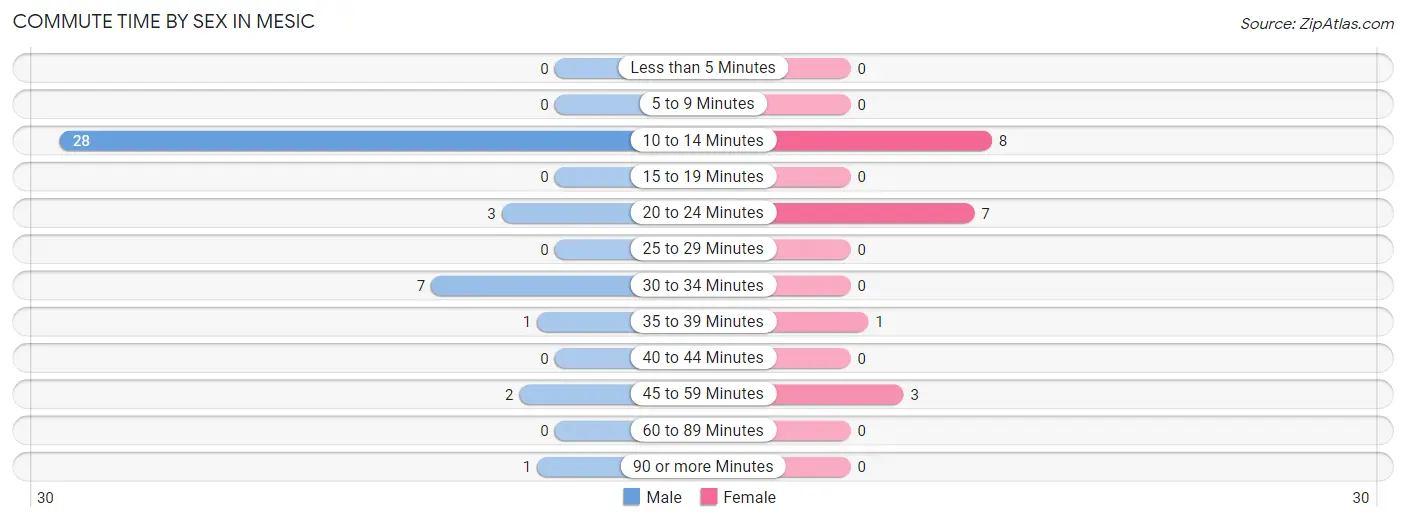
| Commute Time | Male | Female |
| Less than 5 Minutes | 0 (0.0%) | 0 (0.0%) |
| 5 to 9 Minutes | 0 (0.0%) | 0 (0.0%) |
| 10 to 14 Minutes | 28 (66.7%) | 8 (42.1%) |
| 15 to 19 Minutes | 0 (0.0%) | 0 (0.0%) |
| 20 to 24 Minutes | 3 (7.1%) | 7 (36.8%) |
| 25 to 29 Minutes | 0 (0.0%) | 0 (0.0%) |
| 30 to 34 Minutes | 7 (16.7%) | 0 (0.0%) |
| 35 to 39 Minutes | 1 (2.4%) | 1 (5.3%) |
| 40 to 44 Minutes | 0 (0.0%) | 0 (0.0%) |
| 45 to 59 Minutes | 2 (4.8%) | 3 (15.8%) |
| 60 to 89 Minutes | 0 (0.0%) | 0 (0.0%) |
| 90 or more Minutes | 1 (2.4%) | 0 (0.0%) |
Time of Departure to Work by Sex in Mesic
The most frequent times of departure to work in Mesic are 7:00 AM to 7:29 AM (18, 42.9%) for males and 12:00 PM to 3:59 PM (15, 78.9%) for females.
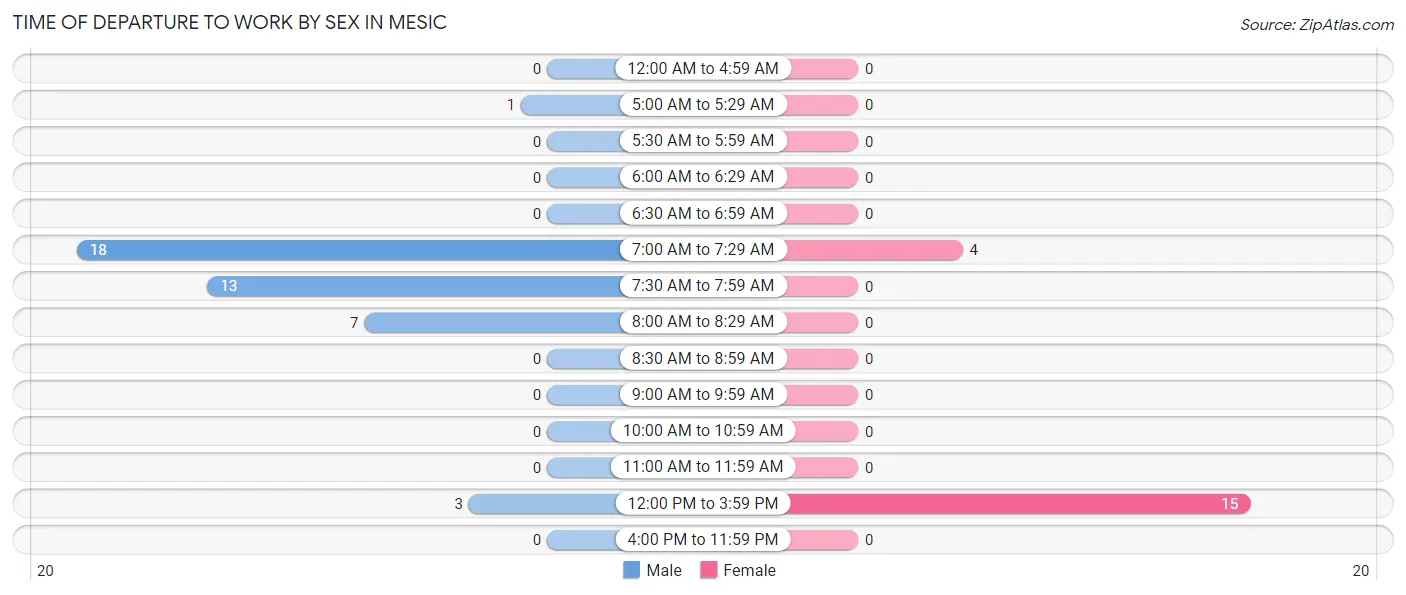
| Time of Departure | Male | Female |
| 12:00 AM to 4:59 AM | 0 (0.0%) | 0 (0.0%) |
| 5:00 AM to 5:29 AM | 1 (2.4%) | 0 (0.0%) |
| 5:30 AM to 5:59 AM | 0 (0.0%) | 0 (0.0%) |
| 6:00 AM to 6:29 AM | 0 (0.0%) | 0 (0.0%) |
| 6:30 AM to 6:59 AM | 0 (0.0%) | 0 (0.0%) |
| 7:00 AM to 7:29 AM | 18 (42.9%) | 4 (21.0%) |
| 7:30 AM to 7:59 AM | 13 (30.9%) | 0 (0.0%) |
| 8:00 AM to 8:29 AM | 7 (16.7%) | 0 (0.0%) |
| 8:30 AM to 8:59 AM | 0 (0.0%) | 0 (0.0%) |
| 9:00 AM to 9:59 AM | 0 (0.0%) | 0 (0.0%) |
| 10:00 AM to 10:59 AM | 0 (0.0%) | 0 (0.0%) |
| 11:00 AM to 11:59 AM | 0 (0.0%) | 0 (0.0%) |
| 12:00 PM to 3:59 PM | 3 (7.1%) | 15 (78.9%) |
| 4:00 PM to 11:59 PM | 0 (0.0%) | 0 (0.0%) |
| Total | 42 (100.0%) | 19 (100.0%) |
Housing Occupancy in Mesic
Occupancy by Ownership in Mesic
Of the total 71 dwellings in Mesic, owner-occupied units account for 61 (85.9%), while renter-occupied units make up 10 (14.1%).
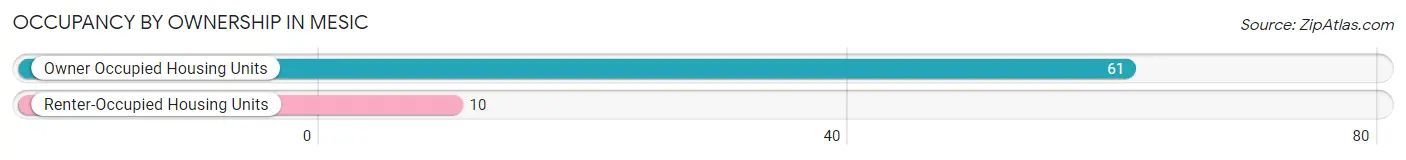
| Occupancy | # Housing Units | % Housing Units |
| Owner Occupied Housing Units | 61 | 85.9% |
| Renter-Occupied Housing Units | 10 | 14.1% |
| Total Occupied Housing Units | 71 | 100.0% |
Occupancy by Household Size in Mesic
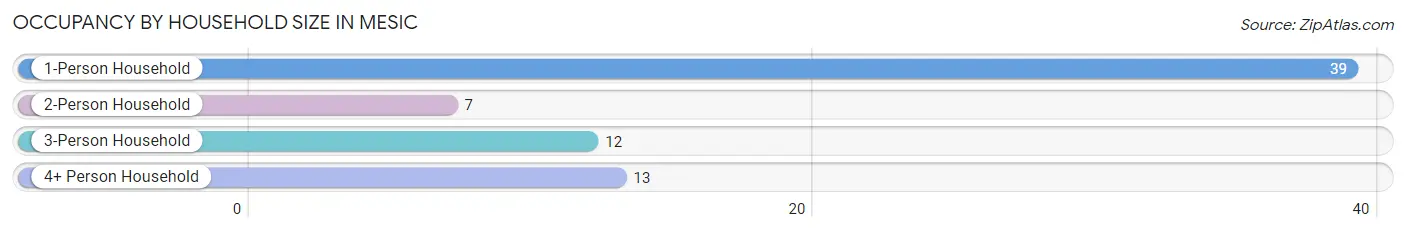
| Household Size | # Housing Units | % Housing Units |
| 1-Person Household | 39 | 54.9% |
| 2-Person Household | 7 | 9.9% |
| 3-Person Household | 12 | 16.9% |
| 4+ Person Household | 13 | 18.3% |
| Total Housing Units | 71 | 100.0% |
Occupancy by Ownership by Household Size in Mesic
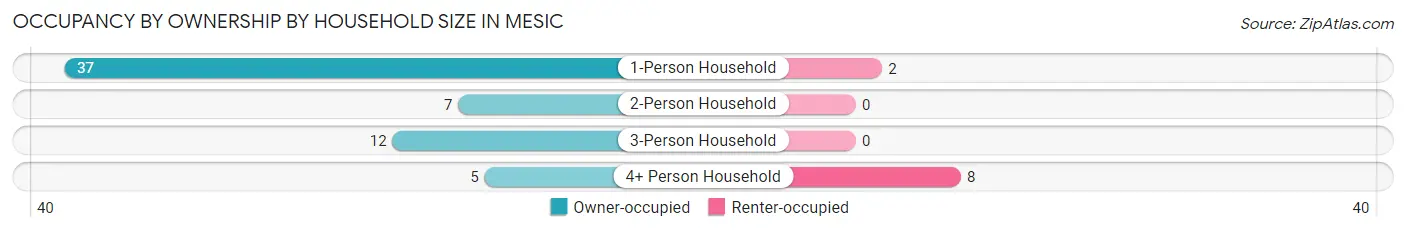
| Household Size | Owner-occupied | Renter-occupied |
| 1-Person Household | 37 (94.9%) | 2 (5.1%) |
| 2-Person Household | 7 (100.0%) | 0 (0.0%) |
| 3-Person Household | 12 (100.0%) | 0 (0.0%) |
| 4+ Person Household | 5 (38.5%) | 8 (61.5%) |
| Total Housing Units | 61 (85.9%) | 10 (14.1%) |
Occupancy by Educational Attainment in Mesic
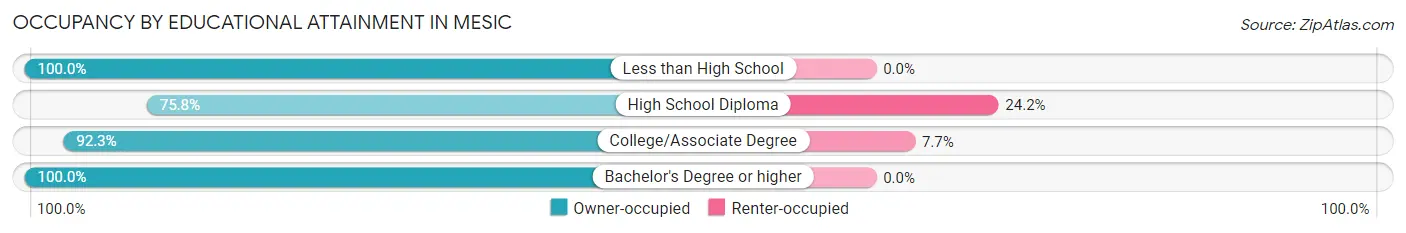
| Household Size | Owner-occupied | Renter-occupied |
| Less than High School | 8 (100.0%) | 0 (0.0%) |
| High School Diploma | 25 (75.8%) | 8 (24.2%) |
| College/Associate Degree | 24 (92.3%) | 2 (7.7%) |
| Bachelor's Degree or higher | 4 (100.0%) | 0 (0.0%) |
Occupancy by Age of Householder in Mesic
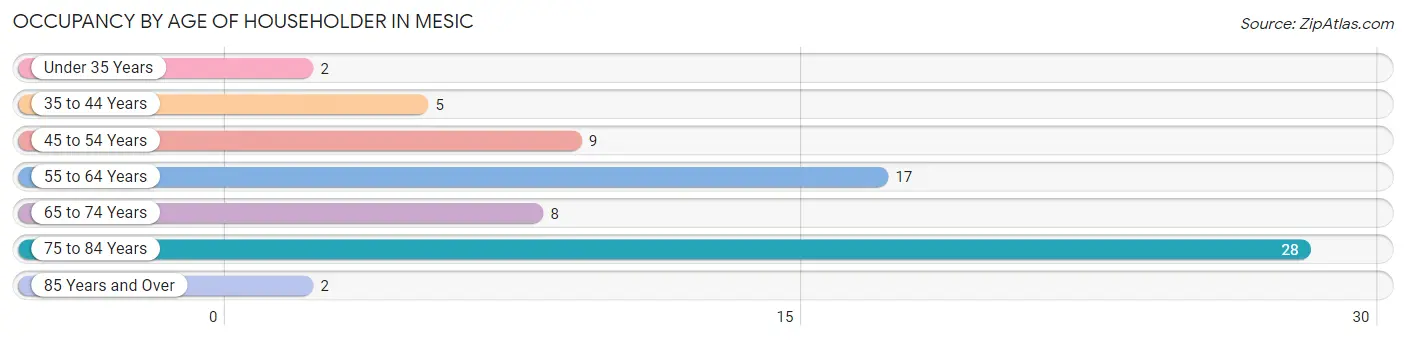
| Age Bracket | # Households | % Households |
| Under 35 Years | 2 | 2.8% |
| 35 to 44 Years | 5 | 7.0% |
| 45 to 54 Years | 9 | 12.7% |
| 55 to 64 Years | 17 | 23.9% |
| 65 to 74 Years | 8 | 11.3% |
| 75 to 84 Years | 28 | 39.4% |
| 85 Years and Over | 2 | 2.8% |
| Total | 71 | 100.0% |
Housing Finances in Mesic
Median Income by Occupancy in Mesic
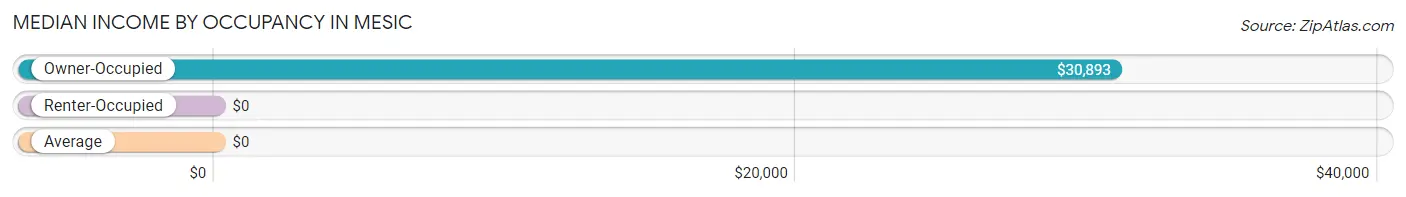
| Occupancy Type | # Households | Median Income |
| Owner-Occupied | 61 (85.9%) | $30,893 |
| Renter-Occupied | 10 (14.1%) | $0 |
| Average | 71 (100.0%) | $0 |
Occupancy by Householder Income Bracket in Mesic
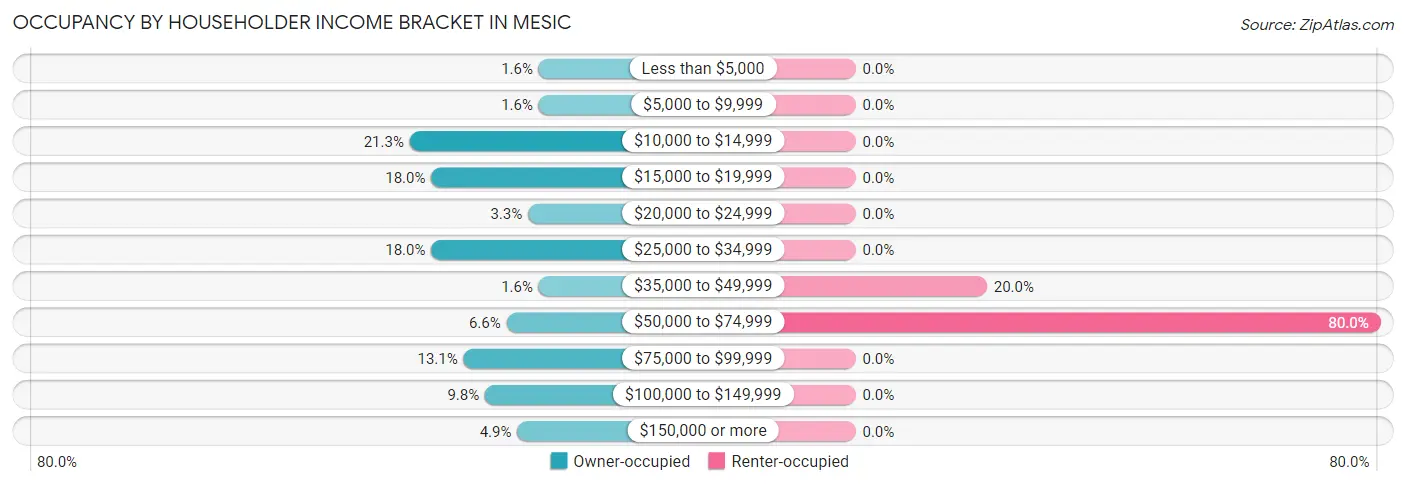
| Income Bracket | Owner-occupied | Renter-occupied |
| Less than $5,000 | 1 (1.6%) | 0 (0.0%) |
| $5,000 to $9,999 | 1 (1.6%) | 0 (0.0%) |
| $10,000 to $14,999 | 13 (21.3%) | 0 (0.0%) |
| $15,000 to $19,999 | 11 (18.0%) | 0 (0.0%) |
| $20,000 to $24,999 | 2 (3.3%) | 0 (0.0%) |
| $25,000 to $34,999 | 11 (18.0%) | 0 (0.0%) |
| $35,000 to $49,999 | 1 (1.6%) | 2 (20.0%) |
| $50,000 to $74,999 | 4 (6.6%) | 8 (80.0%) |
| $75,000 to $99,999 | 8 (13.1%) | 0 (0.0%) |
| $100,000 to $149,999 | 6 (9.8%) | 0 (0.0%) |
| $150,000 or more | 3 (4.9%) | 0 (0.0%) |
| Total | 61 (100.0%) | 10 (100.0%) |
Monthly Housing Cost Tiers in Mesic
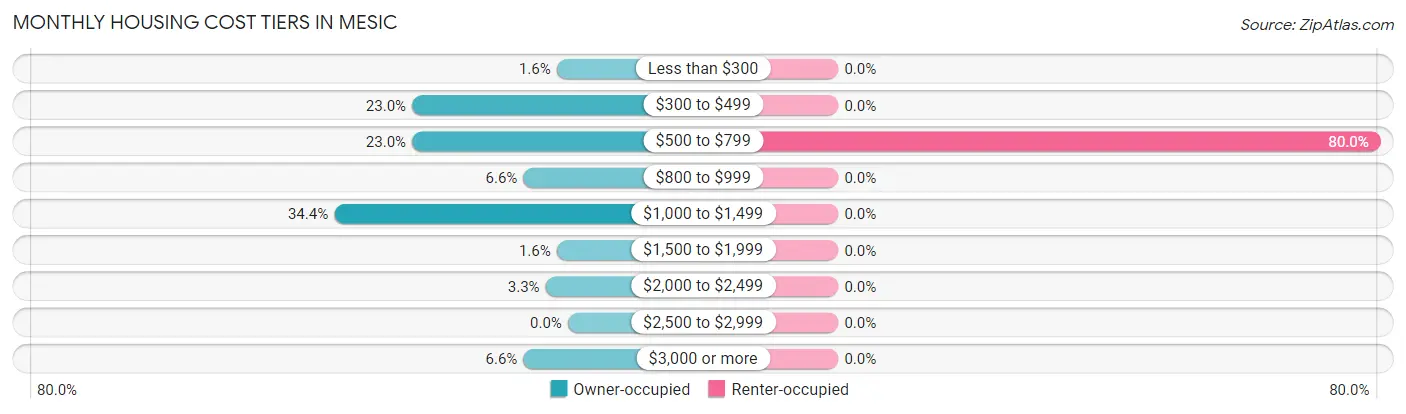
| Monthly Cost | Owner-occupied | Renter-occupied |
| Less than $300 | 1 (1.6%) | 0 (0.0%) |
| $300 to $499 | 14 (23.0%) | 0 (0.0%) |
| $500 to $799 | 14 (23.0%) | 8 (80.0%) |
| $800 to $999 | 4 (6.6%) | 0 (0.0%) |
| $1,000 to $1,499 | 21 (34.4%) | 0 (0.0%) |
| $1,500 to $1,999 | 1 (1.6%) | 0 (0.0%) |
| $2,000 to $2,499 | 2 (3.3%) | 0 (0.0%) |
| $2,500 to $2,999 | 0 (0.0%) | 0 (0.0%) |
| $3,000 or more | 4 (6.6%) | 0 (0.0%) |
| Total | 61 (100.0%) | 10 (100.0%) |
Physical Housing Characteristics in Mesic
Housing Structures in Mesic
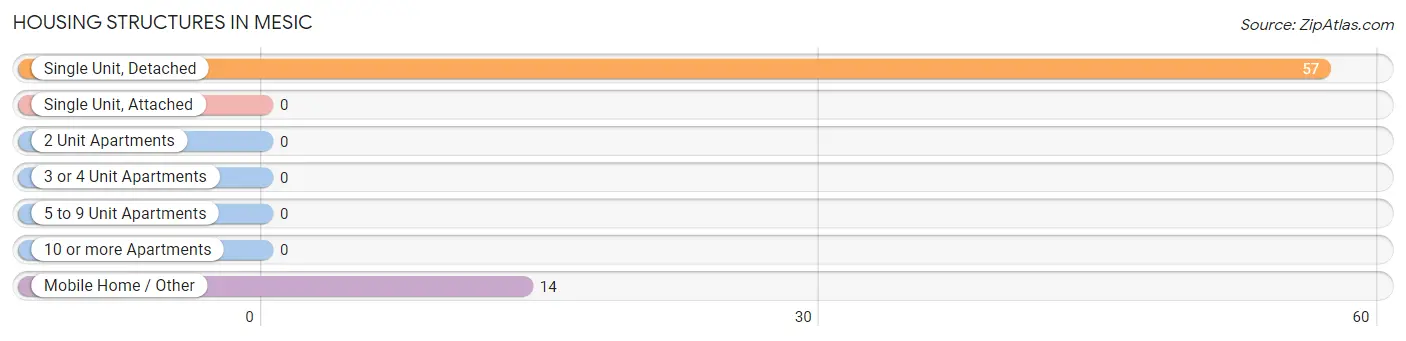
| Structure Type | # Housing Units | % Housing Units |
| Single Unit, Detached | 57 | 80.3% |
| Single Unit, Attached | 0 | 0.0% |
| 2 Unit Apartments | 0 | 0.0% |
| 3 or 4 Unit Apartments | 0 | 0.0% |
| 5 to 9 Unit Apartments | 0 | 0.0% |
| 10 or more Apartments | 0 | 0.0% |
| Mobile Home / Other | 14 | 19.7% |
| Total | 71 | 100.0% |
Housing Structures by Occupancy in Mesic
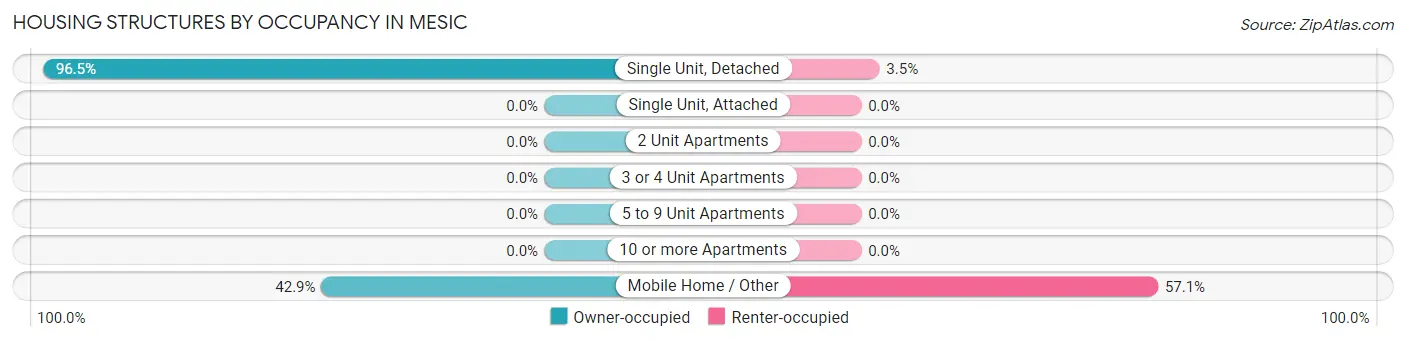
| Structure Type | Owner-occupied | Renter-occupied |
| Single Unit, Detached | 55 (96.5%) | 2 (3.5%) |
| Single Unit, Attached | 0 (0.0%) | 0 (0.0%) |
| 2 Unit Apartments | 0 (0.0%) | 0 (0.0%) |
| 3 or 4 Unit Apartments | 0 (0.0%) | 0 (0.0%) |
| 5 to 9 Unit Apartments | 0 (0.0%) | 0 (0.0%) |
| 10 or more Apartments | 0 (0.0%) | 0 (0.0%) |
| Mobile Home / Other | 6 (42.9%) | 8 (57.1%) |
| Total | 61 (85.9%) | 10 (14.1%) |
Housing Structures by Number of Rooms in Mesic
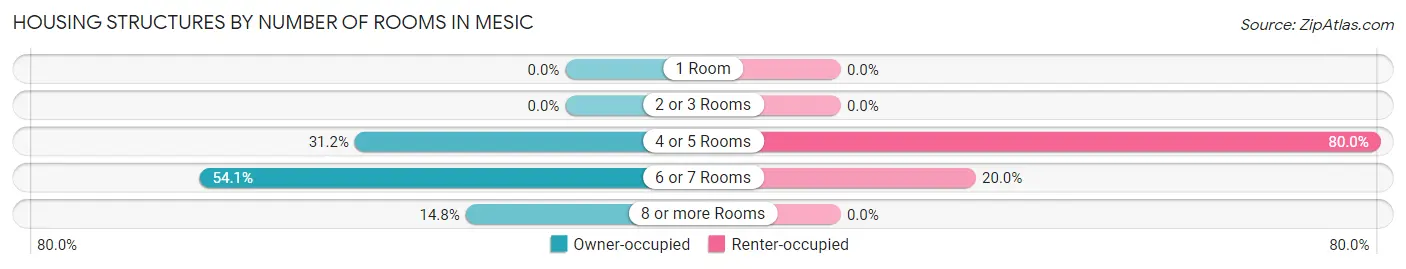
| Number of Rooms | Owner-occupied | Renter-occupied |
| 1 Room | 0 (0.0%) | 0 (0.0%) |
| 2 or 3 Rooms | 0 (0.0%) | 0 (0.0%) |
| 4 or 5 Rooms | 19 (31.1%) | 8 (80.0%) |
| 6 or 7 Rooms | 33 (54.1%) | 2 (20.0%) |
| 8 or more Rooms | 9 (14.7%) | 0 (0.0%) |
| Total | 61 (100.0%) | 10 (100.0%) |
Housing Structure by Heating Type in Mesic
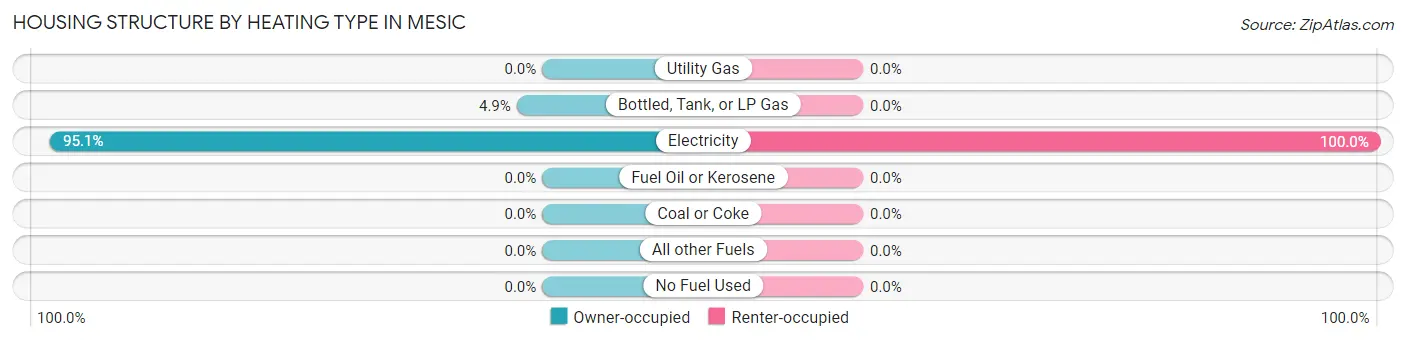
| Heating Type | Owner-occupied | Renter-occupied |
| Utility Gas | 0 (0.0%) | 0 (0.0%) |
| Bottled, Tank, or LP Gas | 3 (4.9%) | 0 (0.0%) |
| Electricity | 58 (95.1%) | 10 (100.0%) |
| Fuel Oil or Kerosene | 0 (0.0%) | 0 (0.0%) |
| Coal or Coke | 0 (0.0%) | 0 (0.0%) |
| All other Fuels | 0 (0.0%) | 0 (0.0%) |
| No Fuel Used | 0 (0.0%) | 0 (0.0%) |
| Total | 61 (100.0%) | 10 (100.0%) |
Household Vehicle Usage in Mesic
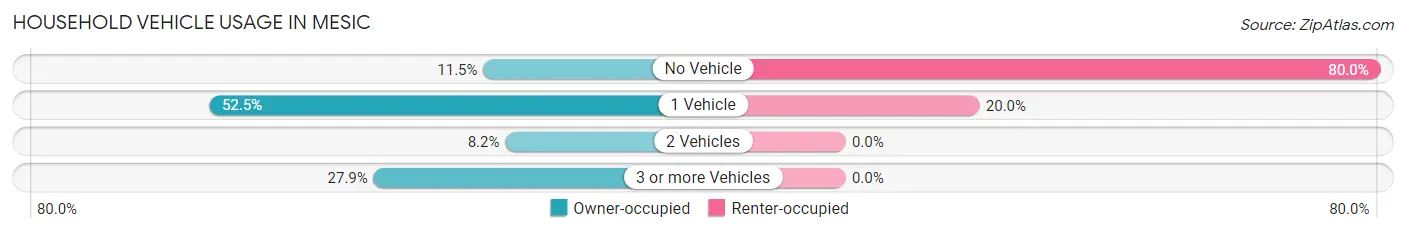
| Vehicles per Household | Owner-occupied | Renter-occupied |
| No Vehicle | 7 (11.5%) | 8 (80.0%) |
| 1 Vehicle | 32 (52.5%) | 2 (20.0%) |
| 2 Vehicles | 5 (8.2%) | 0 (0.0%) |
| 3 or more Vehicles | 17 (27.9%) | 0 (0.0%) |
| Total | 61 (100.0%) | 10 (100.0%) |
Real Estate & Mortgages in Mesic
Real Estate and Mortgage Overview in Mesic
| Characteristic | Without Mortgage | With Mortgage |
| Housing Units | 27 | 34 |
| Median Property Value | $82,800 | $145,600 |
| Median Household Income | $19,861 | $3 |
| Monthly Housing Costs | $505 | $4 |
| Real Estate Taxes | - | - |
Property Value by Mortgage Status in Mesic
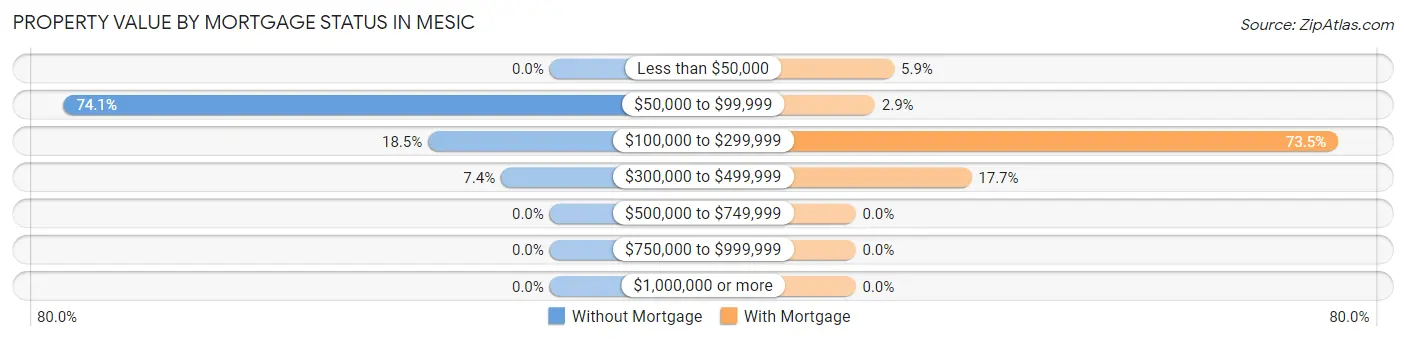
| Property Value | Without Mortgage | With Mortgage |
| Less than $50,000 | 0 (0.0%) | 2 (5.9%) |
| $50,000 to $99,999 | 20 (74.1%) | 1 (2.9%) |
| $100,000 to $299,999 | 5 (18.5%) | 25 (73.5%) |
| $300,000 to $499,999 | 2 (7.4%) | 6 (17.6%) |
| $500,000 to $749,999 | 0 (0.0%) | 0 (0.0%) |
| $750,000 to $999,999 | 0 (0.0%) | 0 (0.0%) |
| $1,000,000 or more | 0 (0.0%) | 0 (0.0%) |
| Total | 27 (100.0%) | 34 (100.0%) |
Household Income by Mortgage Status in Mesic
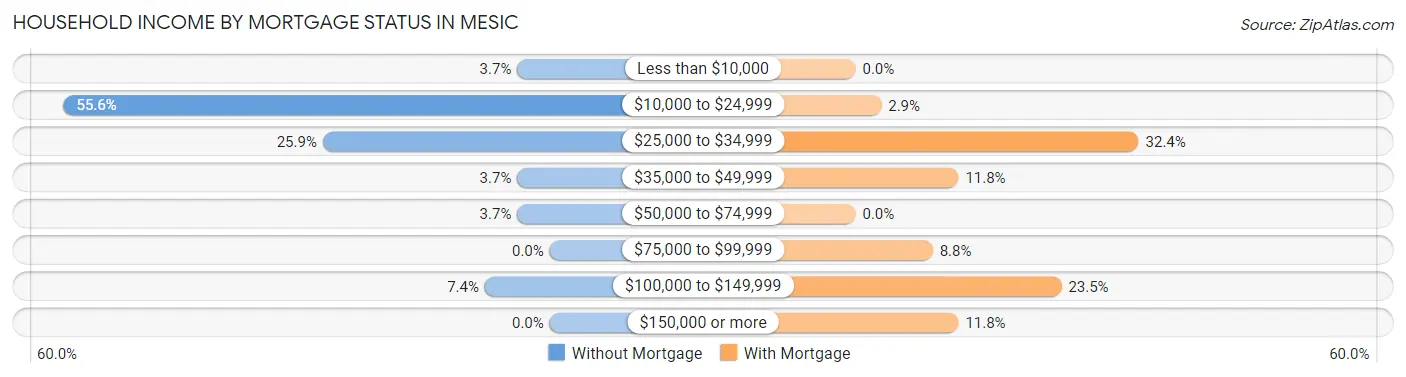
| Household Income | Without Mortgage | With Mortgage |
| Less than $10,000 | 1 (3.7%) | 0 (0.0%) |
| $10,000 to $24,999 | 15 (55.6%) | 1 (2.9%) |
| $25,000 to $34,999 | 7 (25.9%) | 11 (32.4%) |
| $35,000 to $49,999 | 1 (3.7%) | 4 (11.8%) |
| $50,000 to $74,999 | 1 (3.7%) | 0 (0.0%) |
| $75,000 to $99,999 | 0 (0.0%) | 3 (8.8%) |
| $100,000 to $149,999 | 2 (7.4%) | 8 (23.5%) |
| $150,000 or more | 0 (0.0%) | 4 (11.8%) |
| Total | 27 (100.0%) | 34 (100.0%) |
Property Value to Household Income Ratio in Mesic
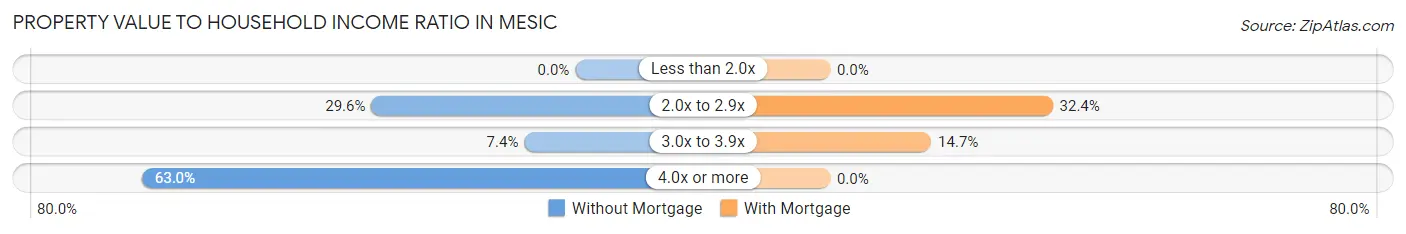
| Value-to-Income Ratio | Without Mortgage | With Mortgage |
| Less than 2.0x | 0 (0.0%) | 0 (0.0%) |
| 2.0x to 2.9x | 8 (29.6%) | 11 (32.4%) |
| 3.0x to 3.9x | 2 (7.4%) | 5 (14.7%) |
| 4.0x or more | 17 (63.0%) | 0 (0.0%) |
| Total | 27 (100.0%) | 34 (100.0%) |
Real Estate Taxes by Mortgage Status in Mesic
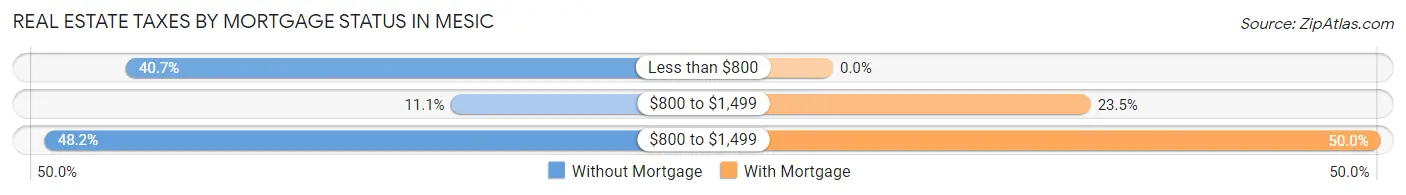
| Property Taxes | Without Mortgage | With Mortgage |
| Less than $800 | 11 (40.7%) | 0 (0.0%) |
| $800 to $1,499 | 3 (11.1%) | 8 (23.5%) |
| $800 to $1,499 | 13 (48.1%) | 17 (50.0%) |
| Total | 27 (100.0%) | 34 (100.0%) |
Health & Disability in Mesic
Health Insurance Coverage by Age in Mesic
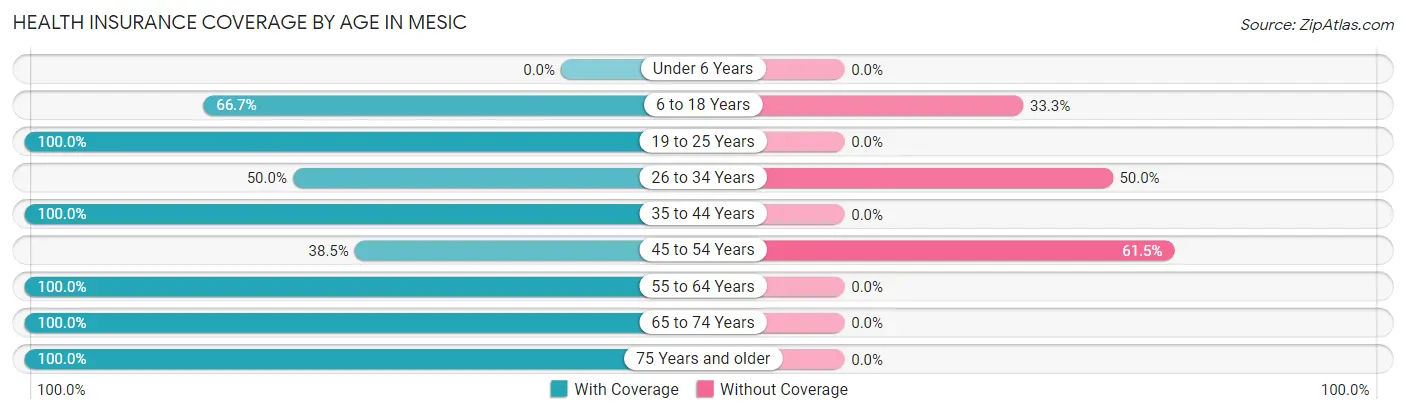
| Age Bracket | With Coverage | Without Coverage |
| Under 6 Years | 0 (0.0%) | 0 (0.0%) |
| 6 to 18 Years | 12 (66.7%) | 6 (33.3%) |
| 19 to 25 Years | 14 (100.0%) | 0 (0.0%) |
| 26 to 34 Years | 14 (50.0%) | 14 (50.0%) |
| 35 to 44 Years | 11 (100.0%) | 0 (0.0%) |
| 45 to 54 Years | 10 (38.5%) | 16 (61.5%) |
| 55 to 64 Years | 27 (100.0%) | 0 (0.0%) |
| 65 to 74 Years | 23 (100.0%) | 0 (0.0%) |
| 75 Years and older | 36 (100.0%) | 0 (0.0%) |
| Total | 147 (80.3%) | 36 (19.7%) |
Health Insurance Coverage by Citizenship Status in Mesic
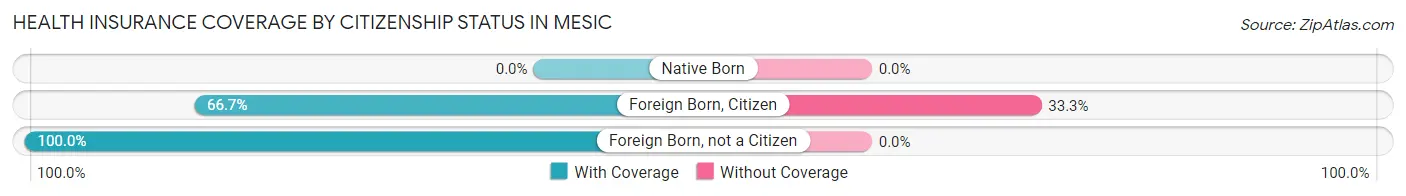
| Citizenship Status | With Coverage | Without Coverage |
| Native Born | 0 (0.0%) | 0 (0.0%) |
| Foreign Born, Citizen | 12 (66.7%) | 6 (33.3%) |
| Foreign Born, not a Citizen | 14 (100.0%) | 0 (0.0%) |
Health Insurance Coverage by Household Income in Mesic
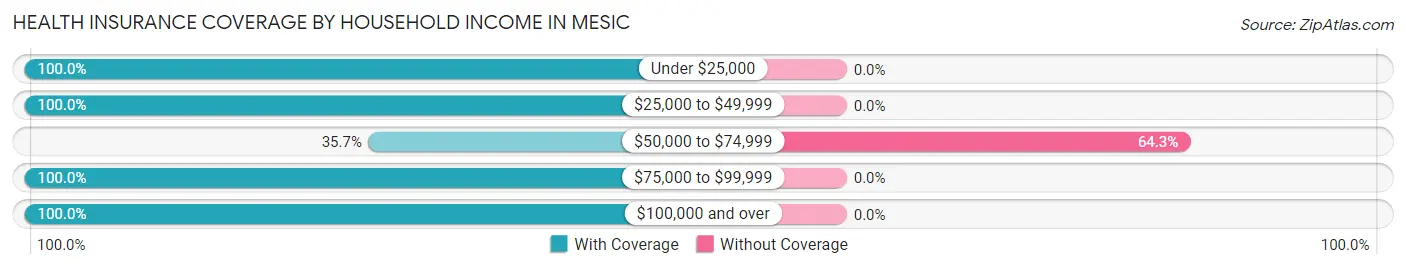
| Household Income | With Coverage | Without Coverage |
| Under $25,000 | 33 (100.0%) | 0 (0.0%) |
| $25,000 to $49,999 | 18 (100.0%) | 0 (0.0%) |
| $50,000 to $74,999 | 20 (35.7%) | 36 (64.3%) |
| $75,000 to $99,999 | 24 (100.0%) | 0 (0.0%) |
| $100,000 and over | 52 (100.0%) | 0 (0.0%) |
Public vs Private Health Insurance Coverage by Age in Mesic
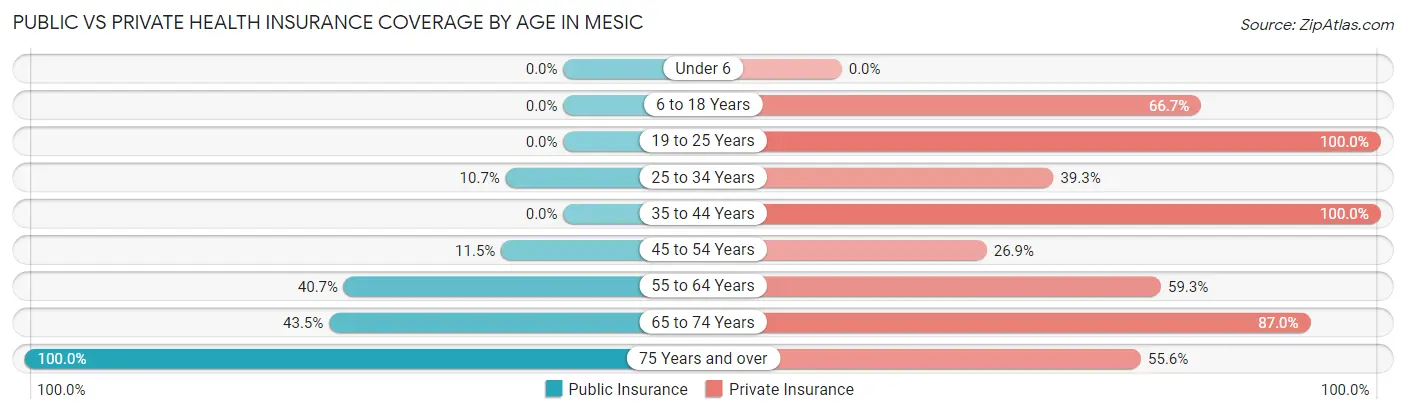
| Age Bracket | Public Insurance | Private Insurance |
| Under 6 | 0 (0.0%) | 0 (0.0%) |
| 6 to 18 Years | 0 (0.0%) | 12 (66.7%) |
| 19 to 25 Years | 0 (0.0%) | 14 (100.0%) |
| 25 to 34 Years | 3 (10.7%) | 11 (39.3%) |
| 35 to 44 Years | 0 (0.0%) | 11 (100.0%) |
| 45 to 54 Years | 3 (11.5%) | 7 (26.9%) |
| 55 to 64 Years | 11 (40.7%) | 16 (59.3%) |
| 65 to 74 Years | 10 (43.5%) | 20 (87.0%) |
| 75 Years and over | 36 (100.0%) | 20 (55.6%) |
| Total | 63 (34.4%) | 111 (60.7%) |
Disability Status by Sex by Age in Mesic
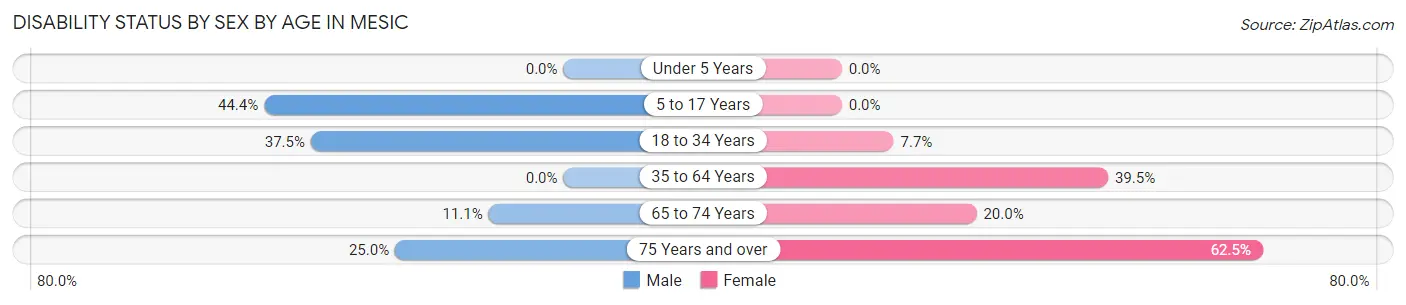
| Age Bracket | Male | Female |
| Under 5 Years | 0 (0.0%) | 0 (0.0%) |
| 5 to 17 Years | 4 (44.4%) | 0 (0.0%) |
| 18 to 34 Years | 6 (37.5%) | 2 (7.7%) |
| 35 to 64 Years | 0 (0.0%) | 17 (39.5%) |
| 65 to 74 Years | 2 (11.1%) | 1 (20.0%) |
| 75 Years and over | 1 (25.0%) | 20 (62.5%) |
Disability Class by Sex by Age in Mesic
Disability Class: Hearing Difficulty
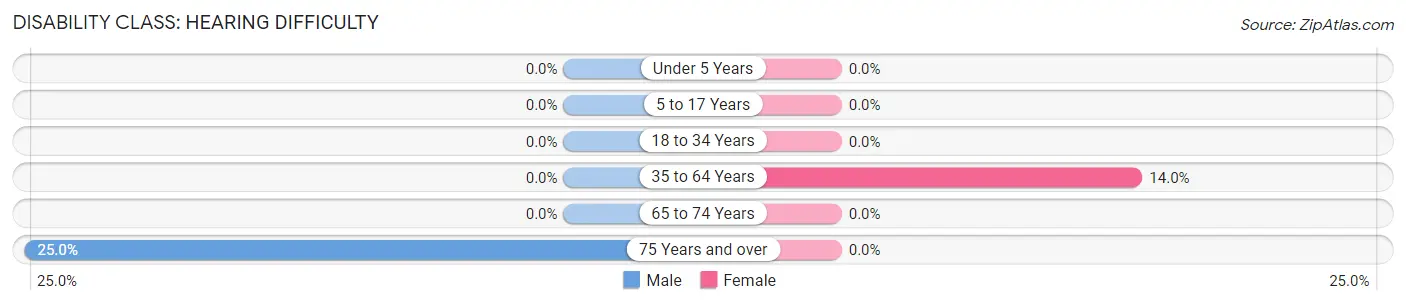
| Age Bracket | Male | Female |
| Under 5 Years | 0 (0.0%) | 0 (0.0%) |
| 5 to 17 Years | 0 (0.0%) | 0 (0.0%) |
| 18 to 34 Years | 0 (0.0%) | 0 (0.0%) |
| 35 to 64 Years | 0 (0.0%) | 6 (14.0%) |
| 65 to 74 Years | 0 (0.0%) | 0 (0.0%) |
| 75 Years and over | 1 (25.0%) | 0 (0.0%) |
Disability Class: Vision Difficulty
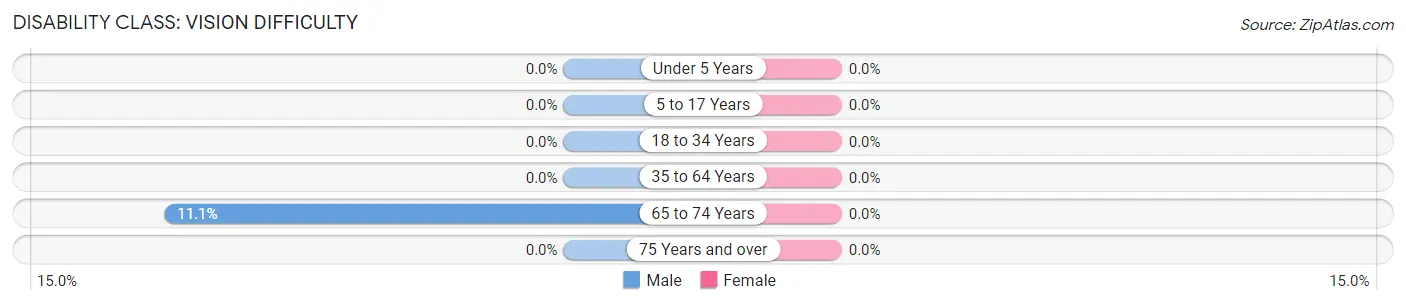
| Age Bracket | Male | Female |
| Under 5 Years | 0 (0.0%) | 0 (0.0%) |
| 5 to 17 Years | 0 (0.0%) | 0 (0.0%) |
| 18 to 34 Years | 0 (0.0%) | 0 (0.0%) |
| 35 to 64 Years | 0 (0.0%) | 0 (0.0%) |
| 65 to 74 Years | 2 (11.1%) | 0 (0.0%) |
| 75 Years and over | 0 (0.0%) | 0 (0.0%) |
Disability Class: Cognitive Difficulty
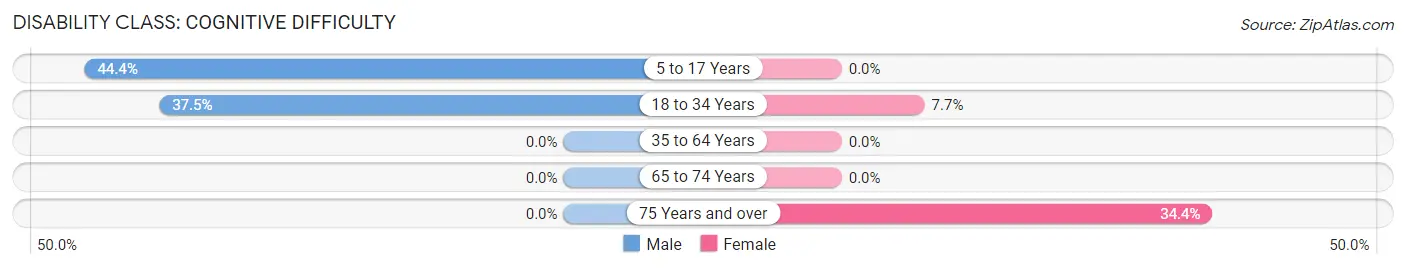
| Age Bracket | Male | Female |
| 5 to 17 Years | 4 (44.4%) | 0 (0.0%) |
| 18 to 34 Years | 6 (37.5%) | 2 (7.7%) |
| 35 to 64 Years | 0 (0.0%) | 0 (0.0%) |
| 65 to 74 Years | 0 (0.0%) | 0 (0.0%) |
| 75 Years and over | 0 (0.0%) | 11 (34.4%) |
Disability Class: Ambulatory Difficulty
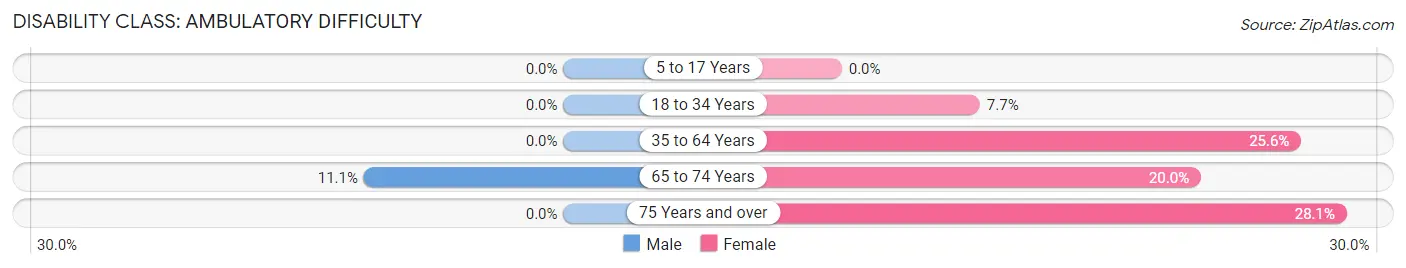
| Age Bracket | Male | Female |
| 5 to 17 Years | 0 (0.0%) | 0 (0.0%) |
| 18 to 34 Years | 0 (0.0%) | 2 (7.7%) |
| 35 to 64 Years | 0 (0.0%) | 11 (25.6%) |
| 65 to 74 Years | 2 (11.1%) | 1 (20.0%) |
| 75 Years and over | 0 (0.0%) | 9 (28.1%) |
Disability Class: Self-Care Difficulty
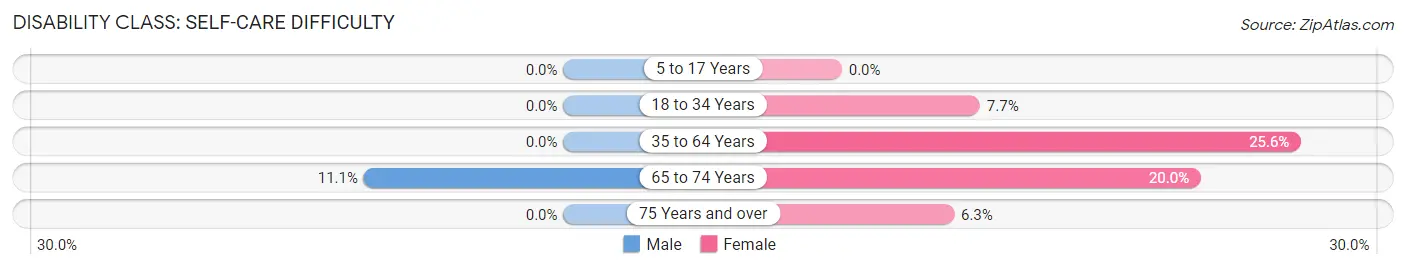
| Age Bracket | Male | Female |
| 5 to 17 Years | 0 (0.0%) | 0 (0.0%) |
| 18 to 34 Years | 0 (0.0%) | 2 (7.7%) |
| 35 to 64 Years | 0 (0.0%) | 11 (25.6%) |
| 65 to 74 Years | 2 (11.1%) | 1 (20.0%) |
| 75 Years and over | 0 (0.0%) | 2 (6.2%) |
Technology Access in Mesic
Computing Device Access in Mesic
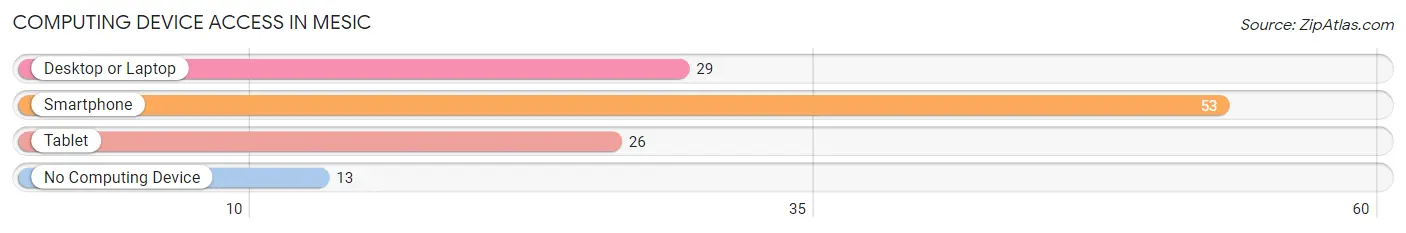
| Device Type | # Households | % Households |
| Desktop or Laptop | 29 | 40.8% |
| Smartphone | 53 | 74.7% |
| Tablet | 26 | 36.6% |
| No Computing Device | 13 | 18.3% |
| Total | 71 | 100.0% |
Internet Access in Mesic
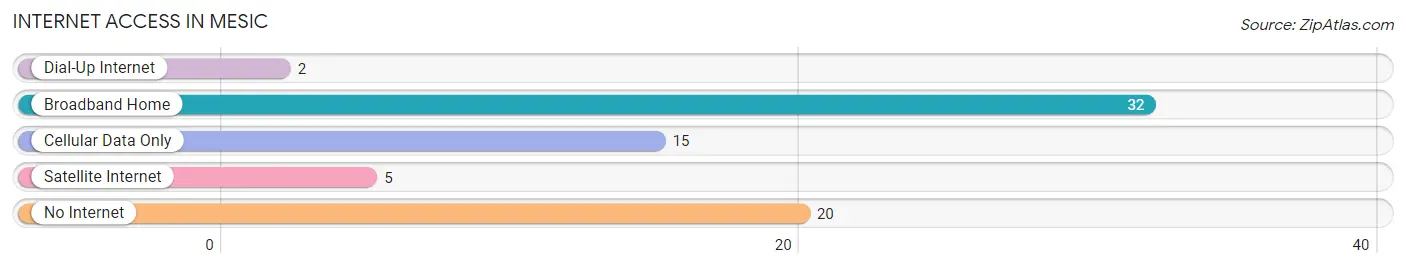
| Internet Type | # Households | % Households |
| Dial-Up Internet | 2 | 2.8% |
| Broadband Home | 32 | 45.1% |
| Cellular Data Only | 15 | 21.1% |
| Satellite Internet | 5 | 7.0% |
| No Internet | 20 | 28.2% |
| Total | 71 | 100.0% |
Mesic Summary
NC History
North Carolina is one of the original 13 colonies and was the first state to declare its independence from Britain in 1776. The state was named after King Charles I of England, and its capital is Raleigh. North Carolina was the site of the first English settlement in the New World, the Lost Colony of Roanoke, which was established in 1587. The state was also the site of the first successful powered flight, which took place in 1903 at Kitty Hawk.
North Carolina has a long and varied history. During the American Revolution, the state was a major battleground, with several major battles taking place in the state. After the war, the state became a major center of the cotton and tobacco industries, and was a major producer of naval stores. During the Civil War, the state was divided, with the western part of the state joining the Confederacy and the eastern part remaining loyal to the Union. After the war, the state experienced a period of economic growth, with the development of the textile industry and the growth of the banking and insurance industries.
Geography
North Carolina is located in the southeastern United States, bordered by Virginia to the north, Tennessee to the west, South Carolina and Georgia to the south, and the Atlantic Ocean to the east. The state is divided into three distinct geographic regions: the Coastal Plain, the Piedmont, and the Appalachian Mountains. The Coastal Plain is a flat, low-lying region that is home to the state’s major cities, including Raleigh, Charlotte, and Wilmington. The Piedmont is a hilly region that is home to the state’s major industries, including textiles, furniture, and tobacco. The Appalachian Mountains are the highest mountains in the eastern United States, and are home to the state’s highest peak, Mount Mitchell.
Economy
North Carolina’s economy is largely based on agriculture, manufacturing, and services. The state is a major producer of tobacco, cotton, and soybeans, and is also a major producer of furniture, textiles, and paper products. The state is also home to a number of major corporations, including Bank of America, Duke Energy, and Lowe’s. The state’s major industries include banking, insurance, and technology.
Demographics
As of the 2010 census, North Carolina had a population of 9.5 million people. The state is racially diverse, with the largest racial group being white (68.5%), followed by African American (21.5%), Hispanic (8.4%), and Asian (1.6%). The state is also home to a large number of Native American tribes, including the Lumbee, the Catawba, and the Cherokee. The state’s largest cities are Charlotte, Raleigh, and Greensboro. The state’s largest metropolitan area is the Raleigh-Durham-Chapel Hill area, which is home to over 2 million people.
Common Questions
What is Per Capita Income in Mesic?
Per Capita income in Mesic is $29,497.
What is the Median Family Income in Mesic?
Median Family Income in Mesic is $78,750.
What is Inequality or Gini Index in Mesic?
Inequality or Gini Index in Mesic is 0.54.
What is the Total Population of Mesic?
Total Population of Mesic is 183.
What is the Total Male Population of Mesic?
Total Male Population of Mesic is 68.
What is the Total Female Population of Mesic?
Total Female Population of Mesic is 115.
What is the Ratio of Males per 100 Females in Mesic?
There are 59.13 Males per 100 Females in Mesic.
What is the Ratio of Females per 100 Males in Mesic?
There are 169.12 Females per 100 Males in Mesic.
What is the Median Population Age in Mesic?
Median Population Age in Mesic is 53.4 Years.
What is the Average Family Size in Mesic
Average Family Size in Mesic is 4.5 People.
What is the Average Household Size in Mesic
Average Household Size in Mesic is 2.6 People.
How Large is the Labor Force in Mesic?
There are 70 People in the Labor Forcein in Mesic.
What is the Percentage of People in the Labor Force in Mesic?
41.4% of People are in the Labor Force in Mesic.
What is the Unemployment Rate in Mesic?
Unemployment Rate in Mesic is 4.3%.