Old Fort, NC Map & Demographics
Old Fort Map
Old Fort Overview
$24,756
PER CAPITA INCOME
$50,927
AVG FAMILY INCOME
$41,125
AVG HOUSEHOLD INCOME
13.0%
WAGE / INCOME GAP [ % ]
87.0¢/ $1
WAGE / INCOME GAP [ $ ]
$13,875
FAMILY INCOME DEFICIT
0.37
INEQUALITY / GINI INDEX
658
TOTAL POPULATION
296
MALE POPULATION
362
FEMALE POPULATION
81.77
MALES / 100 FEMALES
122.30
FEMALES / 100 MALES
52.4
MEDIAN AGE
2.5
AVG FAMILY SIZE
1.9
AVG HOUSEHOLD SIZE
288
LABOR FORCE [ PEOPLE ]
52.3%
PERCENT IN LABOR FORCE
5.6%
UNEMPLOYMENT RATE
Old Fort Zip Codes
Old Fort Area Codes
Income in Old Fort
Income Overview in Old Fort
Per Capita Income in Old Fort is $24,756, while median incomes of families and households are $50,927 and $41,125 respectively.
| Characteristic | Number | Measure |
| Per Capita Income | 658 | $24,756 |
| Median Family Income | 203 | $50,927 |
| Mean Family Income | 203 | $59,803 |
| Median Household Income | 331 | $41,125 |
| Mean Household Income | 331 | $49,427 |
| Income Deficit | 203 | $13,875 |
| Wage / Income Gap (%) | 658 | 13.01% |
| Wage / Income Gap ($) | 658 | 86.99¢ per $1 |
| Gini / Inequality Index | 658 | 0.37 |
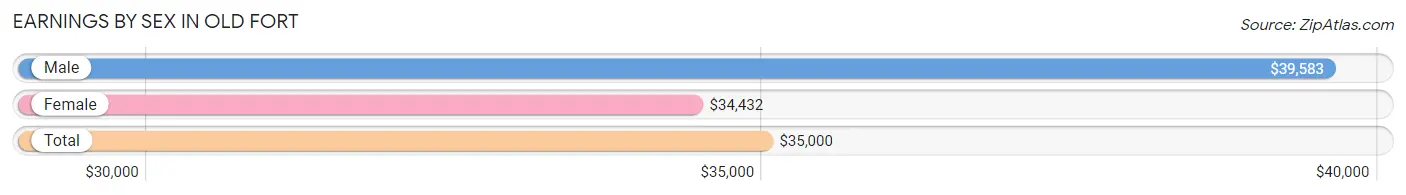
Earnings by Sex in Old Fort
Average Earnings in Old Fort are $35,000, $39,583 for men and $34,432 for women, a difference of 13.0%.
| Sex | Number | Average Earnings |
| Male | 127 (44.1%) | $39,583 |
| Female | 161 (55.9%) | $34,432 |
| Total | 288 (100.0%) | $35,000 |
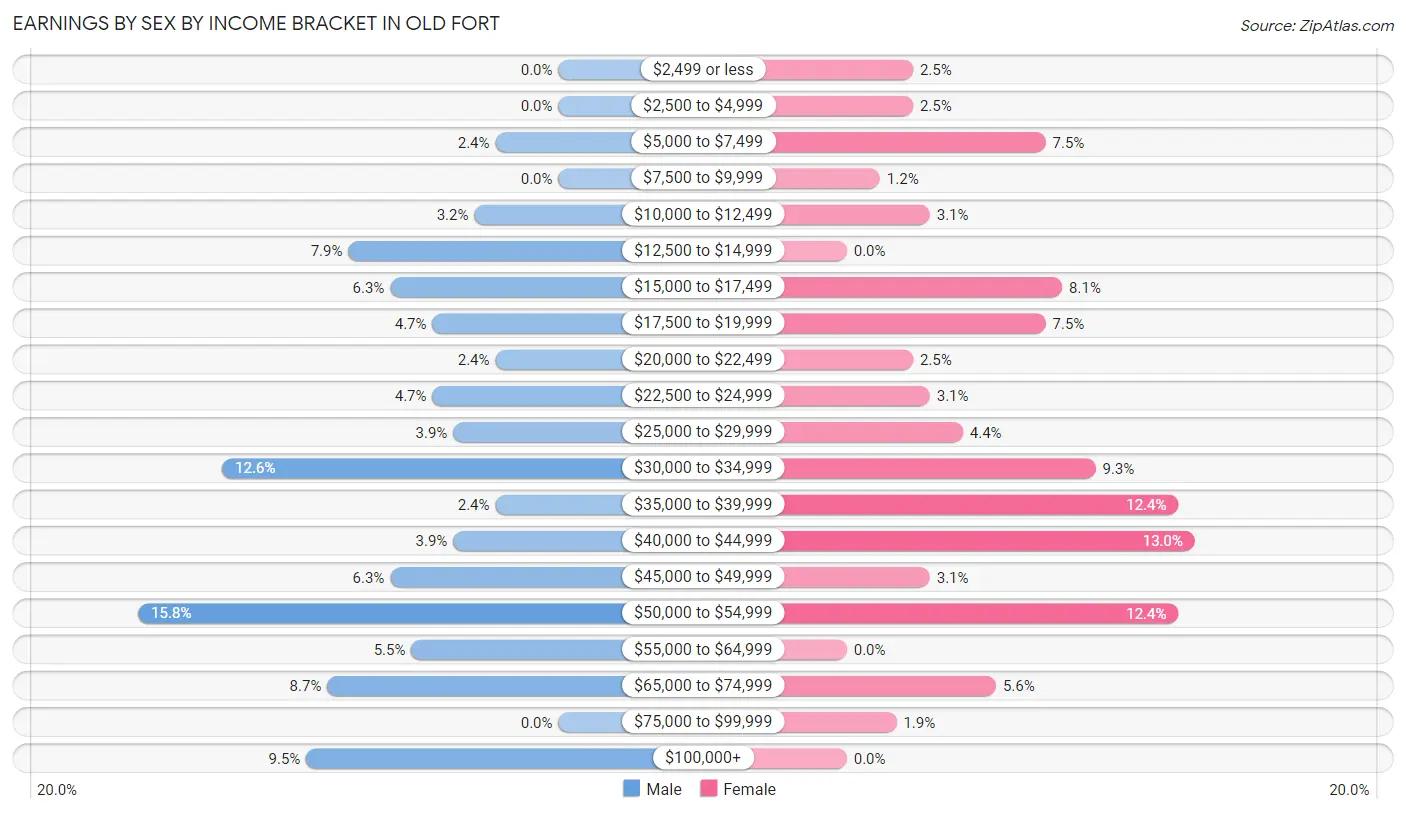
Earnings by Sex by Income Bracket in Old Fort
The most common earnings brackets in Old Fort are $50,000 to $54,999 for men (20 | 15.8%) and $40,000 to $44,999 for women (21 | 13.0%).
| Income | Male | Female |
| $2,499 or less | 0 (0.0%) | 4 (2.5%) |
| $2,500 to $4,999 | 0 (0.0%) | 4 (2.5%) |
| $5,000 to $7,499 | 3 (2.4%) | 12 (7.4%) |
| $7,500 to $9,999 | 0 (0.0%) | 2 (1.2%) |
| $10,000 to $12,499 | 4 (3.2%) | 5 (3.1%) |
| $12,500 to $14,999 | 10 (7.9%) | 0 (0.0%) |
| $15,000 to $17,499 | 8 (6.3%) | 13 (8.1%) |
| $17,500 to $19,999 | 6 (4.7%) | 12 (7.4%) |
| $20,000 to $22,499 | 3 (2.4%) | 4 (2.5%) |
| $22,500 to $24,999 | 6 (4.7%) | 5 (3.1%) |
| $25,000 to $29,999 | 5 (3.9%) | 7 (4.3%) |
| $30,000 to $34,999 | 16 (12.6%) | 15 (9.3%) |
| $35,000 to $39,999 | 3 (2.4%) | 20 (12.4%) |
| $40,000 to $44,999 | 5 (3.9%) | 21 (13.0%) |
| $45,000 to $49,999 | 8 (6.3%) | 5 (3.1%) |
| $50,000 to $54,999 | 20 (15.8%) | 20 (12.4%) |
| $55,000 to $64,999 | 7 (5.5%) | 0 (0.0%) |
| $65,000 to $74,999 | 11 (8.7%) | 9 (5.6%) |
| $75,000 to $99,999 | 0 (0.0%) | 3 (1.9%) |
| $100,000+ | 12 (9.5%) | 0 (0.0%) |
| Total | 127 (100.0%) | 161 (100.0%) |
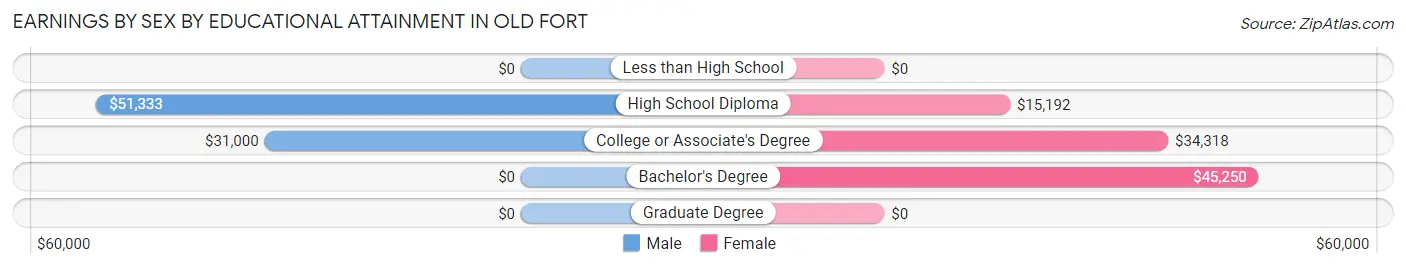
Earnings by Sex by Educational Attainment in Old Fort
Average earnings in Old Fort are $40,500 for men and $35,583 for women, a difference of 12.1%. Men with an educational attainment of high school diploma enjoy the highest average annual earnings of $51,333, while those with college or associate's degree education earn the least with $31,000. Women with an educational attainment of bachelor's degree earn the most with the average annual earnings of $45,250, while those with high school diploma education have the smallest earnings of $15,192.
| Educational Attainment | Male Income | Female Income |
| Less than High School | - | - |
| High School Diploma | $51,333 | $15,192 |
| College or Associate's Degree | $31,000 | $34,318 |
| Bachelor's Degree | - | - |
| Graduate Degree | - | - |
| Total | $40,500 | $35,583 |
Family Income in Old Fort
Family Income Brackets in Old Fort
According to the Old Fort family income data, there are 70 families falling into the $50,000 to $74,999 income range, which is the most common income bracket and makes up 34.5% of all families.
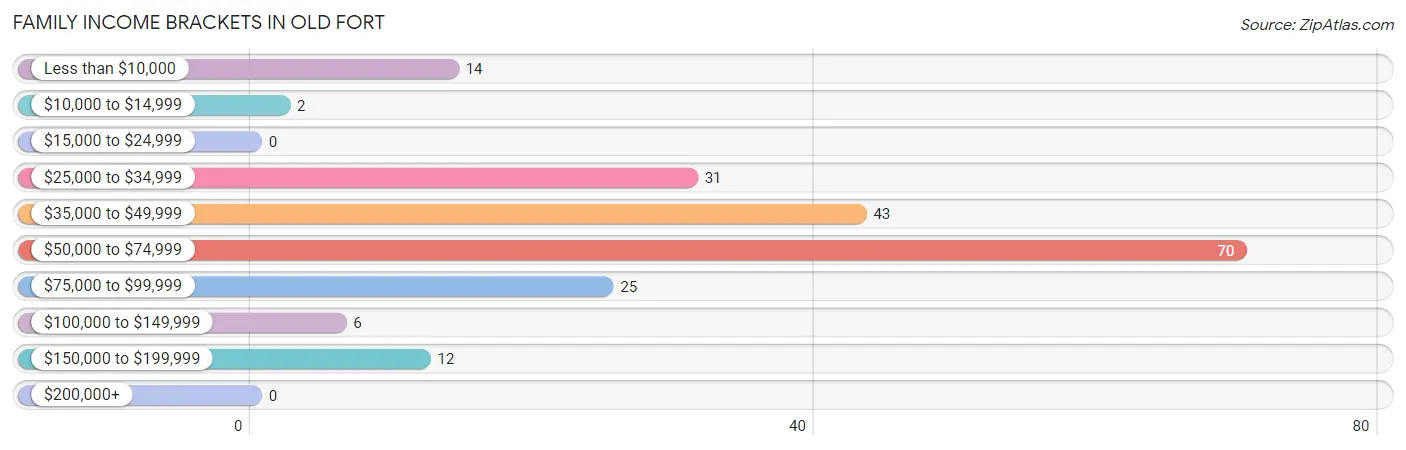
| Income Bracket | # Families | % Families |
| Less than $10,000 | 14 | 6.9% |
| $10,000 to $14,999 | 2 | 1.0% |
| $15,000 to $24,999 | 0 | 0.0% |
| $25,000 to $34,999 | 31 | 15.3% |
| $35,000 to $49,999 | 43 | 21.2% |
| $50,000 to $74,999 | 70 | 34.5% |
| $75,000 to $99,999 | 25 | 12.3% |
| $100,000 to $149,999 | 6 | 3.0% |
| $150,000 to $199,999 | 12 | 5.9% |
| $200,000+ | 0 | 0.0% |
Family Income by Famaliy Size in Old Fort
3-person families (69 | 34.0%) account for the highest median family income in Old Fort with $52,366 per family, while 2-person families (120 | 59.1%) have the highest median income of $19,881 per family member.
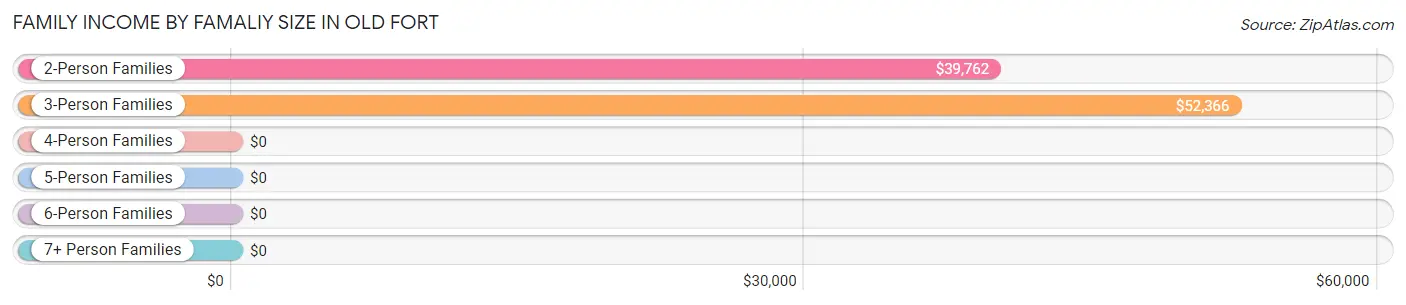
| Income Bracket | # Families | Median Income |
| 2-Person Families | 120 (59.1%) | $39,762 |
| 3-Person Families | 69 (34.0%) | $52,366 |
| 4-Person Families | 8 (3.9%) | $0 |
| 5-Person Families | 0 (0.0%) | $0 |
| 6-Person Families | 3 (1.5%) | $0 |
| 7+ Person Families | 3 (1.5%) | $0 |
| Total | 203 (100.0%) | $50,927 |
Family Income by Number of Earners in Old Fort
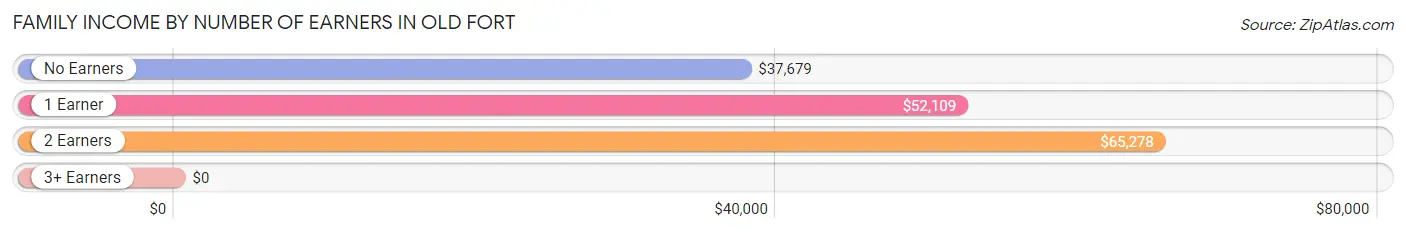
| Number of Earners | # Families | Median Income |
| No Earners | 67 (33.0%) | $37,679 |
| 1 Earner | 69 (34.0%) | $52,109 |
| 2 Earners | 64 (31.5%) | $65,278 |
| 3+ Earners | 3 (1.5%) | $0 |
| Total | 203 (100.0%) | $50,927 |
Household Income in Old Fort
Household Income Brackets in Old Fort
With 81 households falling in the category, the $50,000 to $74,999 income range is the most frequent in Old Fort, accounting for 24.5% of all households.
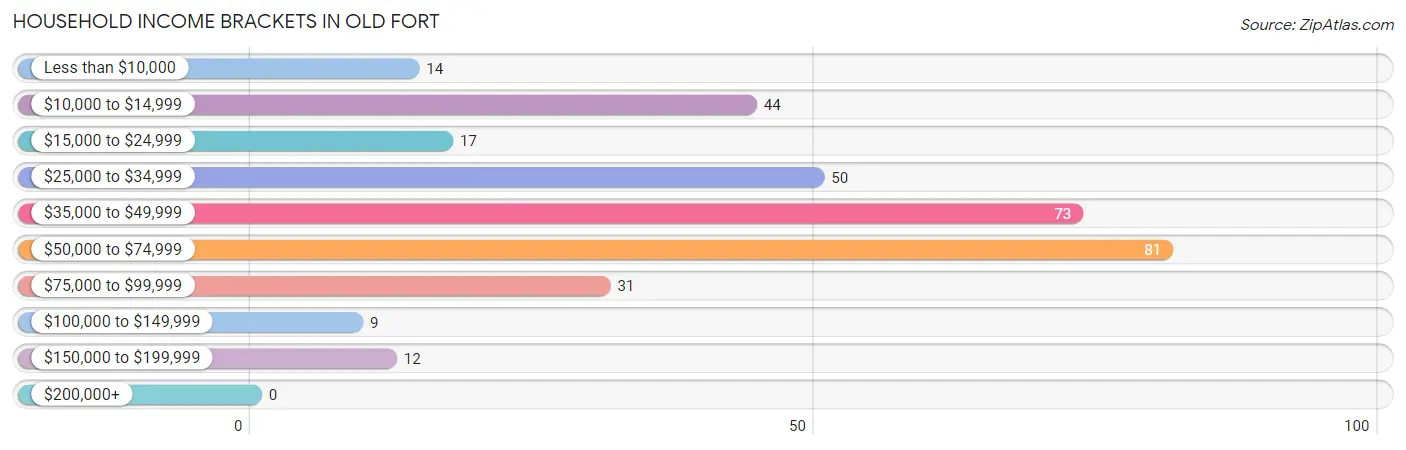
| Income Bracket | # Households | % Households |
| Less than $10,000 | 14 | 4.2% |
| $10,000 to $14,999 | 44 | 13.3% |
| $15,000 to $24,999 | 17 | 5.1% |
| $25,000 to $34,999 | 50 | 15.1% |
| $35,000 to $49,999 | 73 | 22.1% |
| $50,000 to $74,999 | 81 | 24.5% |
| $75,000 to $99,999 | 31 | 9.4% |
| $100,000 to $149,999 | 9 | 2.7% |
| $150,000 to $199,999 | 12 | 3.6% |
| $200,000+ | 0 | 0.0% |
Household Income by Householder Age in Old Fort
The median household income in Old Fort is $41,125, with the highest median household income of $48,125 found in the 45 to 64 years age bracket for the primary householder. A total of 137 households (41.4%) fall into this category.
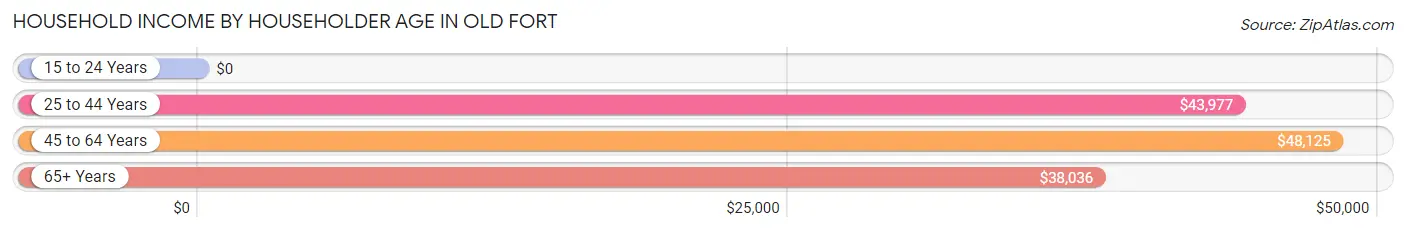
| Income Bracket | # Households | Median Income |
| 15 to 24 Years | 0 (0.0%) | $0 |
| 25 to 44 Years | 77 (23.3%) | $43,977 |
| 45 to 64 Years | 137 (41.4%) | $48,125 |
| 65+ Years | 117 (35.3%) | $38,036 |
| Total | 331 (100.0%) | $41,125 |
Poverty in Old Fort
Income Below Poverty by Sex and Age in Old Fort
With 13.9% poverty level for males and 17.1% for females among the residents of Old Fort, 55 to 64 year old males and 55 to 64 year old females are the most vulnerable to poverty, with 14 males (50.0%) and 21 females (36.8%) in their respective age groups living below the poverty level.
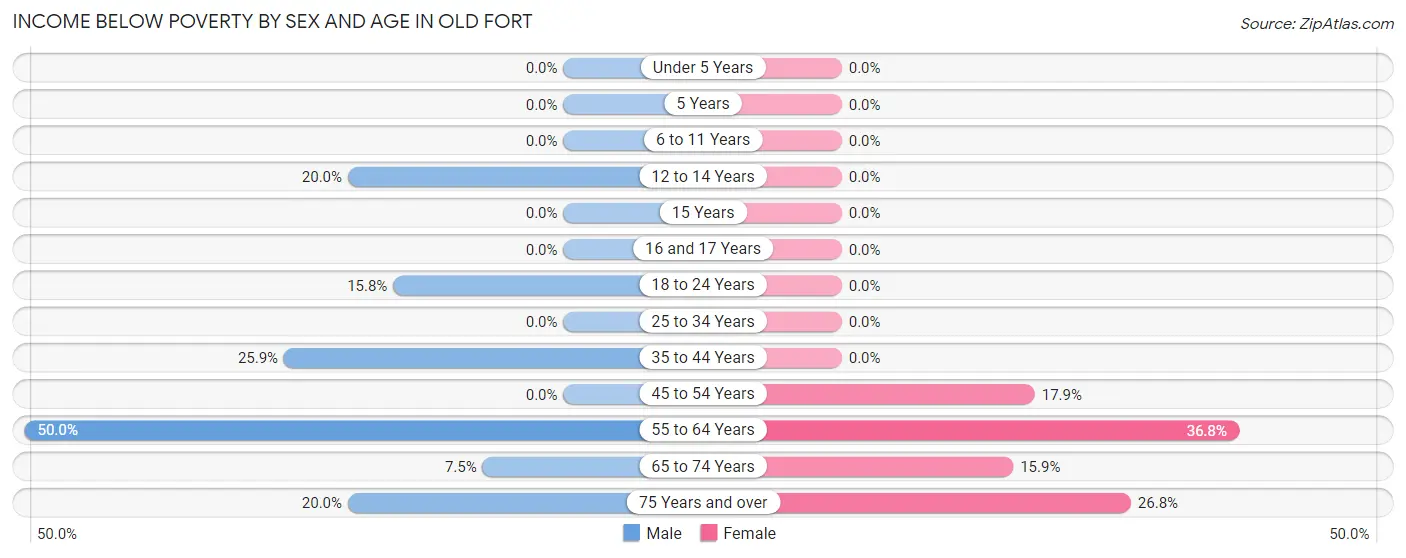
| Age Bracket | Male | Female |
| Under 5 Years | 0 (0.0%) | 0 (0.0%) |
| 5 Years | 0 (0.0%) | 0 (0.0%) |
| 6 to 11 Years | 0 (0.0%) | 0 (0.0%) |
| 12 to 14 Years | 6 (20.0%) | 0 (0.0%) |
| 15 Years | 0 (0.0%) | 0 (0.0%) |
| 16 and 17 Years | 0 (0.0%) | 0 (0.0%) |
| 18 to 24 Years | 3 (15.8%) | 0 (0.0%) |
| 25 to 34 Years | 0 (0.0%) | 0 (0.0%) |
| 35 to 44 Years | 7 (25.9%) | 0 (0.0%) |
| 45 to 54 Years | 0 (0.0%) | 12 (17.9%) |
| 55 to 64 Years | 14 (50.0%) | 21 (36.8%) |
| 65 to 74 Years | 3 (7.5%) | 7 (15.9%) |
| 75 Years and over | 8 (20.0%) | 22 (26.8%) |
| Total | 41 (13.9%) | 62 (17.1%) |
Income Above Poverty by Sex and Age in Old Fort
According to the poverty statistics in Old Fort, males aged under 5 years and females aged under 5 years are the age groups that are most secure financially, with 100.0% of males and 100.0% of females in these age groups living above the poverty line.
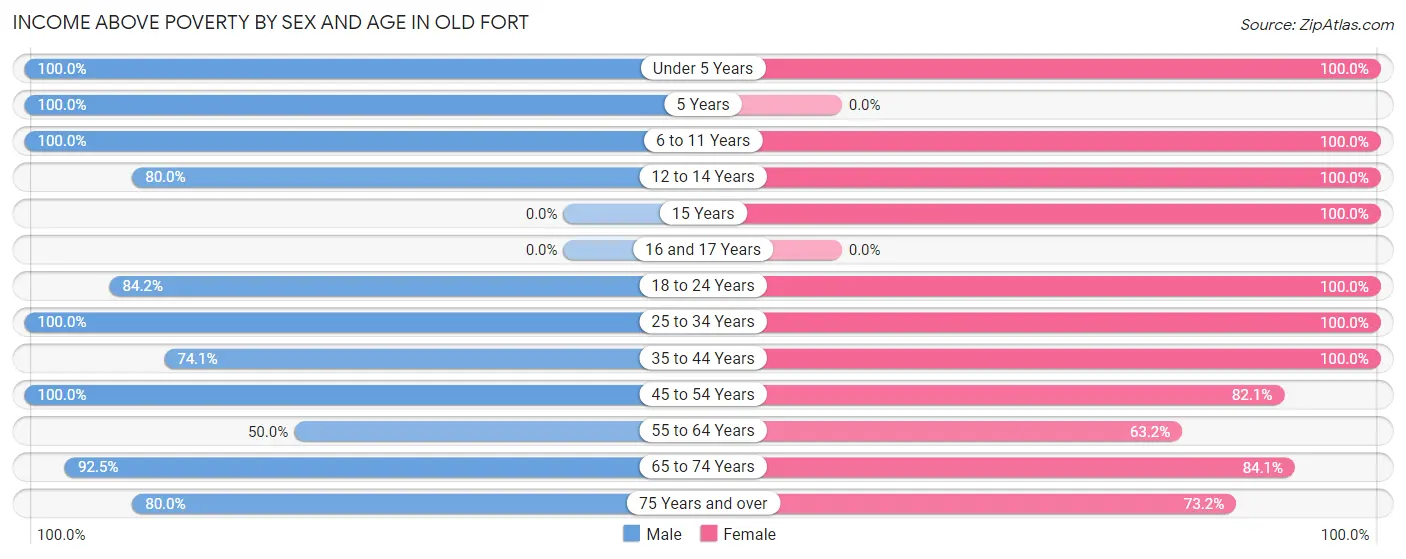
| Age Bracket | Male | Female |
| Under 5 Years | 3 (100.0%) | 13 (100.0%) |
| 5 Years | 9 (100.0%) | 0 (0.0%) |
| 6 to 11 Years | 29 (100.0%) | 17 (100.0%) |
| 12 to 14 Years | 24 (80.0%) | 3 (100.0%) |
| 15 Years | 0 (0.0%) | 3 (100.0%) |
| 16 and 17 Years | 0 (0.0%) | 0 (0.0%) |
| 18 to 24 Years | 16 (84.2%) | 15 (100.0%) |
| 25 to 34 Years | 28 (100.0%) | 32 (100.0%) |
| 35 to 44 Years | 20 (74.1%) | 29 (100.0%) |
| 45 to 54 Years | 43 (100.0%) | 55 (82.1%) |
| 55 to 64 Years | 14 (50.0%) | 36 (63.2%) |
| 65 to 74 Years | 37 (92.5%) | 37 (84.1%) |
| 75 Years and over | 32 (80.0%) | 60 (73.2%) |
| Total | 255 (86.2%) | 300 (82.9%) |
Income Below Poverty Among Married-Couple Families in Old Fort
The poverty statistics for married-couple families in Old Fort show that 12.1% or 16 of the total 132 families live below the poverty line. Families with 1 or 2 children have the highest poverty rate of 18.8%, comprising of 6 families. On the other hand, families with 5 or more children have the lowest poverty rate of 0.0%, which includes 0 families.
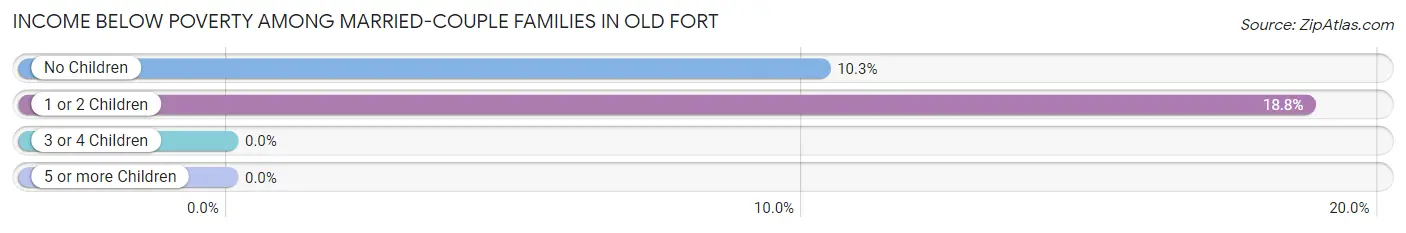
| Children | Above Poverty | Below Poverty |
| No Children | 87 (89.7%) | 10 (10.3%) |
| 1 or 2 Children | 26 (81.2%) | 6 (18.8%) |
| 3 or 4 Children | 0 (0.0%) | 0 (0.0%) |
| 5 or more Children | 3 (100.0%) | 0 (0.0%) |
| Total | 116 (87.9%) | 16 (12.1%) |
Income Below Poverty Among Single-Parent Households in Old Fort
| Children | Single Father | Single Mother |
| No Children | 0 (0.0%) | 0 (0.0%) |
| 1 or 2 Children | 0 (0.0%) | 0 (0.0%) |
| 3 or 4 Children | 0 (0.0%) | 0 (0.0%) |
| 5 or more Children | 0 (0.0%) | 0 (0.0%) |
| Total | 0 (0.0%) | 0 (0.0%) |
Income Below Poverty Among Married-Couple vs Single-Parent Households in Old Fort
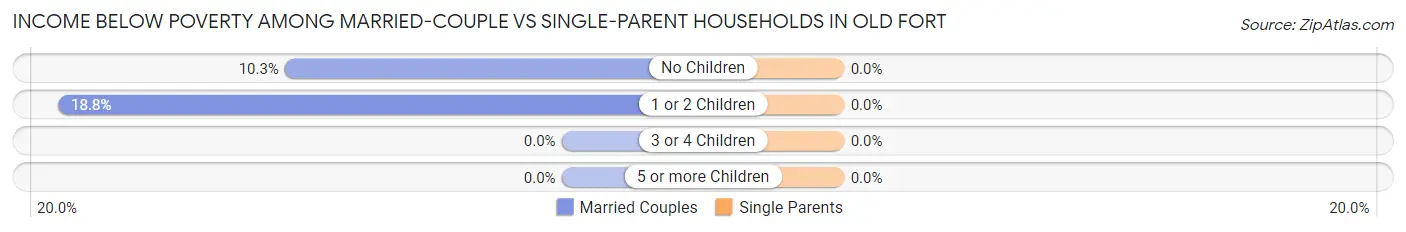
| Children | Married-Couple Families | Single-Parent Households |
| No Children | 10 (10.3%) | 0 (0.0%) |
| 1 or 2 Children | 6 (18.8%) | 0 (0.0%) |
| 3 or 4 Children | 0 (0.0%) | 0 (0.0%) |
| 5 or more Children | 0 (0.0%) | 0 (0.0%) |
| Total | 16 (12.1%) | 0 (0.0%) |
Race in Old Fort
The most populous races in Old Fort are White / Caucasian (580 | 88.1%), Two or more Races (40 | 6.1%), and Black / African American (28 | 4.3%).
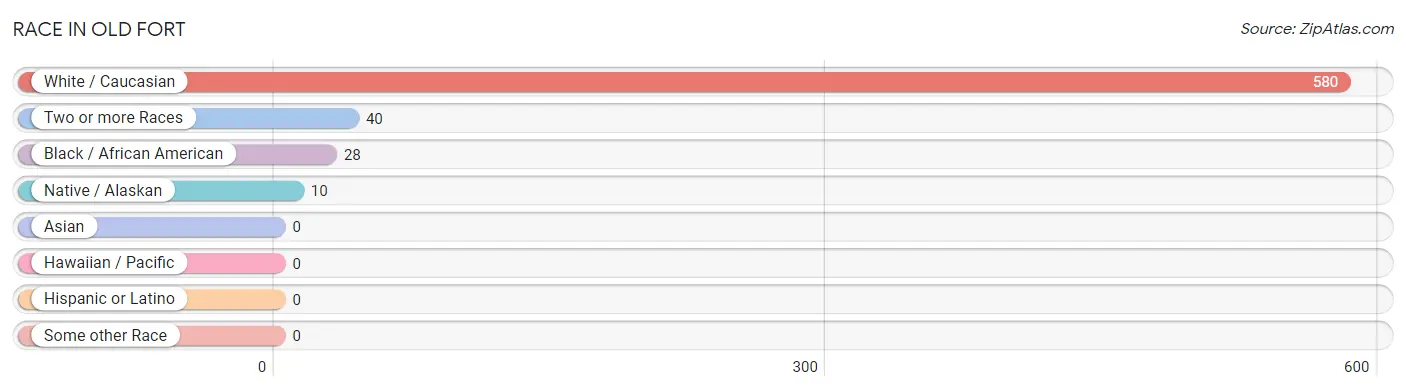
| Race | # Population | % Population |
| Asian | 0 | 0.0% |
| Black / African American | 28 | 4.3% |
| Hawaiian / Pacific | 0 | 0.0% |
| Hispanic or Latino | 0 | 0.0% |
| Native / Alaskan | 10 | 1.5% |
| White / Caucasian | 580 | 88.1% |
| Two or more Races | 40 | 6.1% |
| Some other Race | 0 | 0.0% |
| Total | 658 | 100.0% |
Ancestry in Old Fort
The most populous ancestries reported in Old Fort are Irish (153 | 23.3%), American (129 | 19.6%), German (98 | 14.9%), English (96 | 14.6%), and Scotch-Irish (22 | 3.3%), together accounting for 75.7% of all Old Fort residents.
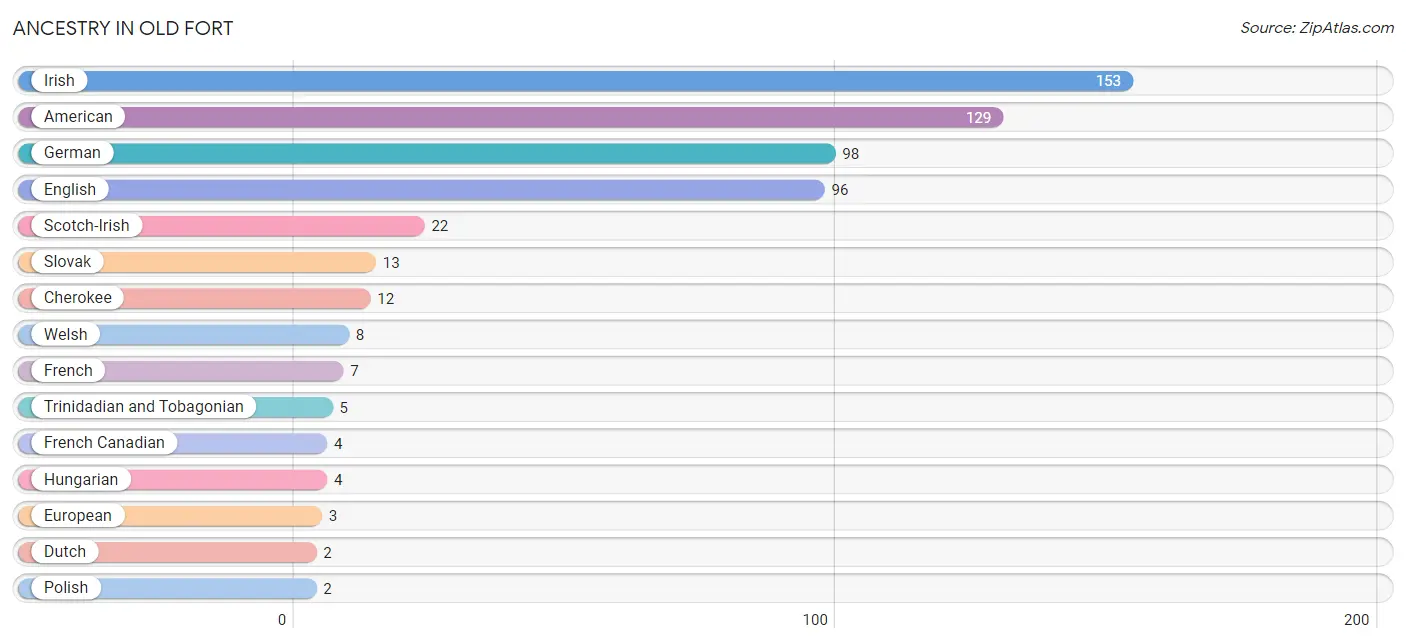
| Ancestry | # Population | % Population |
| American | 129 | 19.6% |
| Cherokee | 12 | 1.8% |
| Dutch | 2 | 0.3% |
| English | 96 | 14.6% |
| European | 3 | 0.5% |
| French | 7 | 1.1% |
| French Canadian | 4 | 0.6% |
| German | 98 | 14.9% |
| Hungarian | 4 | 0.6% |
| Irish | 153 | 23.3% |
| Polish | 2 | 0.3% |
| Scotch-Irish | 22 | 3.3% |
| Slovak | 13 | 2.0% |
| Swedish | 2 | 0.3% |
| Trinidadian and Tobagonian | 5 | 0.8% |
| Welsh | 8 | 1.2% | View All 16 Rows |
Immigrants in Old Fort
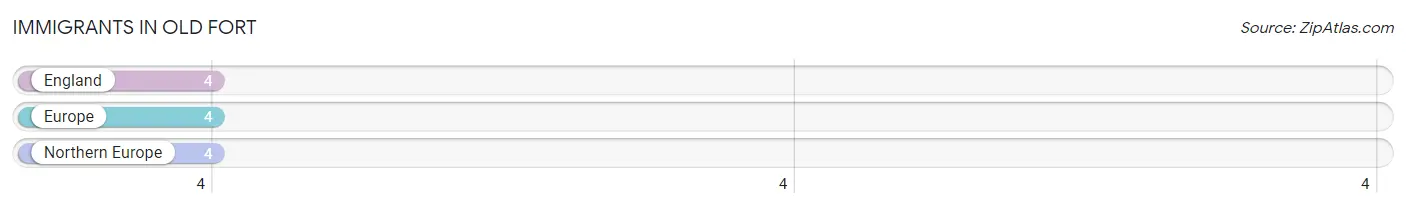
The most numerous immigrant groups reported in Old Fort came from England (4 | 0.6%), Europe (4 | 0.6%), and Northern Europe (4 | 0.6%), together accounting for 1.8% of all Old Fort residents.
| Immigration Origin | # Population | % Population |
| England | 4 | 0.6% |
| Europe | 4 | 0.6% |
| Northern Europe | 4 | 0.6% | View All 3 Rows |
Sex and Age in Old Fort
Sex and Age in Old Fort
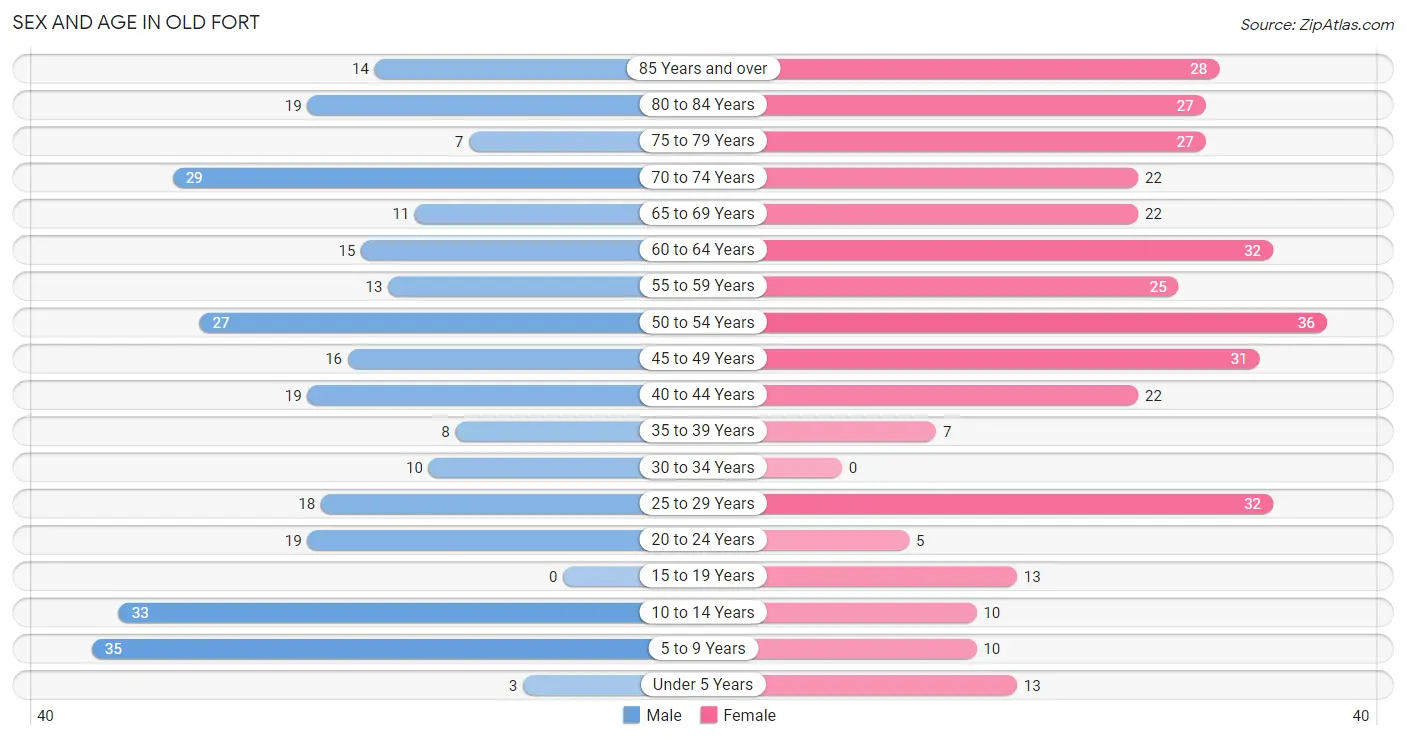
The most populous age groups in Old Fort are 5 to 9 Years (35 | 11.8%) for men and 50 to 54 Years (36 | 9.9%) for women.
| Age Bracket | Male | Female |
| Under 5 Years | 3 (1.0%) | 13 (3.6%) |
| 5 to 9 Years | 35 (11.8%) | 10 (2.8%) |
| 10 to 14 Years | 33 (11.2%) | 10 (2.8%) |
| 15 to 19 Years | 0 (0.0%) | 13 (3.6%) |
| 20 to 24 Years | 19 (6.4%) | 5 (1.4%) |
| 25 to 29 Years | 18 (6.1%) | 32 (8.8%) |
| 30 to 34 Years | 10 (3.4%) | 0 (0.0%) |
| 35 to 39 Years | 8 (2.7%) | 7 (1.9%) |
| 40 to 44 Years | 19 (6.4%) | 22 (6.1%) |
| 45 to 49 Years | 16 (5.4%) | 31 (8.6%) |
| 50 to 54 Years | 27 (9.1%) | 36 (9.9%) |
| 55 to 59 Years | 13 (4.4%) | 25 (6.9%) |
| 60 to 64 Years | 15 (5.1%) | 32 (8.8%) |
| 65 to 69 Years | 11 (3.7%) | 22 (6.1%) |
| 70 to 74 Years | 29 (9.8%) | 22 (6.1%) |
| 75 to 79 Years | 7 (2.4%) | 27 (7.5%) |
| 80 to 84 Years | 19 (6.4%) | 27 (7.5%) |
| 85 Years and over | 14 (4.7%) | 28 (7.7%) |
| Total | 296 (100.0%) | 362 (100.0%) |
Families and Households in Old Fort
Median Family Size in Old Fort
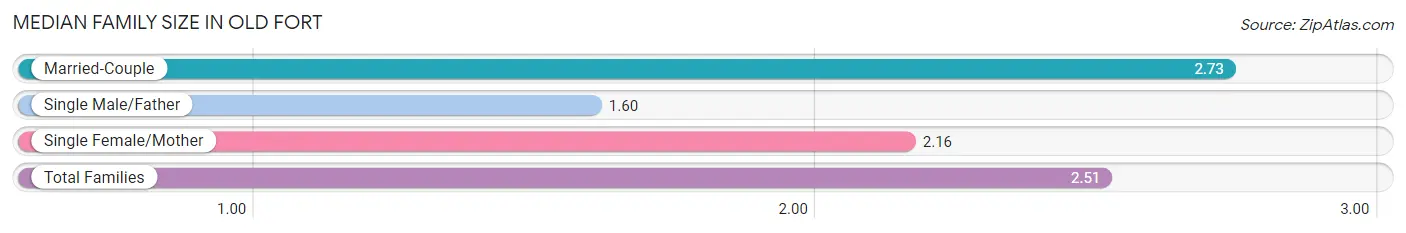
The median family size in Old Fort is 2.51 persons per family, with married-couple families (132 | 65.0%) accounting for the largest median family size of 2.73 persons per family. On the other hand, single male/father families (10 | 4.9%) represent the smallest median family size with 1.60 persons per family.
| Family Type | # Families | Family Size |
| Married-Couple | 132 (65.0%) | 2.73 |
| Single Male/Father | 10 (4.9%) | 1.60 |
| Single Female/Mother | 61 (30.0%) | 2.16 |
| Total Families | 203 (100.0%) | 2.51 |
Median Household Size in Old Fort
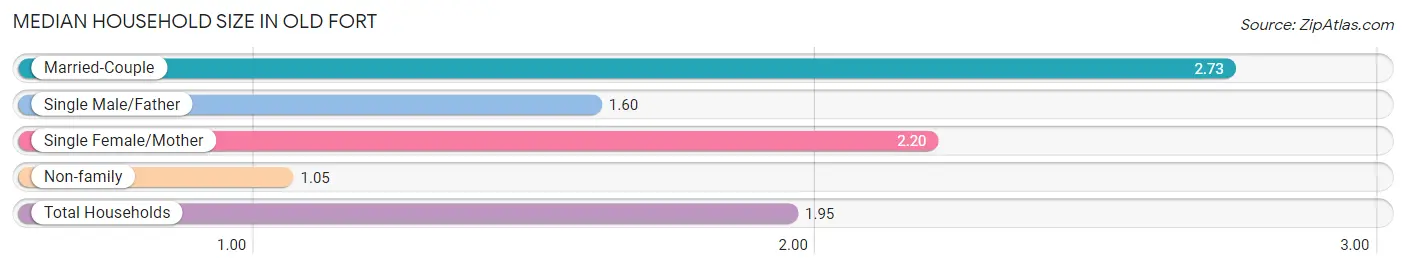
The median household size in Old Fort is 1.95 persons per household, with married-couple households (132 | 39.9%) accounting for the largest median household size of 2.73 persons per household. non-family households (128 | 38.7%) represent the smallest median household size with 1.05 persons per household.
| Household Type | # Households | Household Size |
| Married-Couple | 132 (39.9%) | 2.73 |
| Single Male/Father | 10 (3.0%) | 1.60 |
| Single Female/Mother | 61 (18.4%) | 2.20 |
| Non-family | 128 (38.7%) | 1.05 |
| Total Households | 331 (100.0%) | 1.95 |
Household Size by Marriage Status in Old Fort
Out of a total of 331 households in Old Fort, 203 (61.3%) are family households, while 128 (38.7%) are nonfamily households. The most numerous type of family households are 2-person households, comprising 117, and the most common type of nonfamily households are 1-person households, comprising 125.
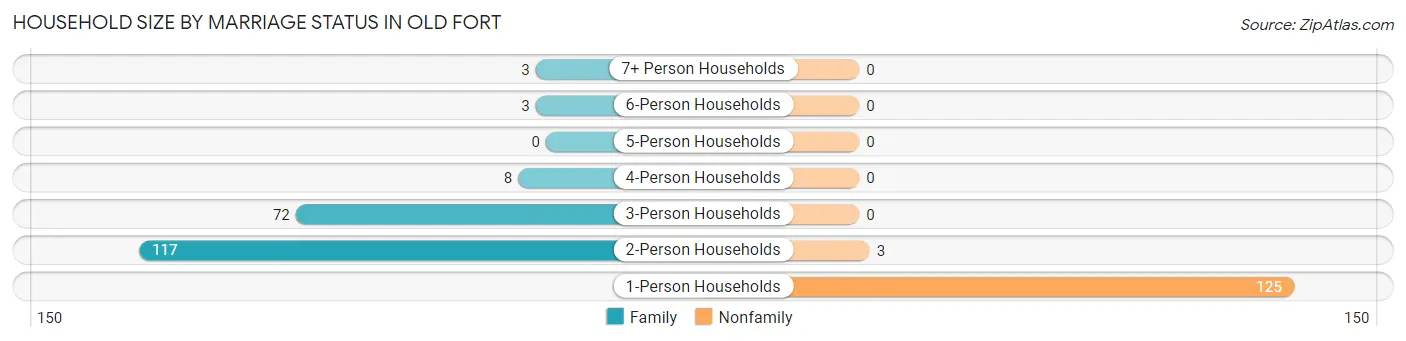
| Household Size | Family Households | Nonfamily Households |
| 1-Person Households | - | 125 (37.8%) |
| 2-Person Households | 117 (35.3%) | 3 (0.9%) |
| 3-Person Households | 72 (21.7%) | 0 (0.0%) |
| 4-Person Households | 8 (2.4%) | 0 (0.0%) |
| 5-Person Households | 0 (0.0%) | 0 (0.0%) |
| 6-Person Households | 3 (0.9%) | 0 (0.0%) |
| 7+ Person Households | 3 (0.9%) | 0 (0.0%) |
| Total | 203 (61.3%) | 128 (38.7%) |
Female Fertility in Old Fort
Fertility by Age in Old Fort
| Age Bracket | Women with Births | Births / 1,000 Women |
| 15 to 19 years | 0 (0.0%) | 0.0 |
| 20 to 34 years | 0 (0.0%) | 0.0 |
| 35 to 50 years | 0 (0.0%) | 0.0 |
| Total | 0 (0.0%) | 0.0 |
Fertility by Age by Marriage Status in Old Fort
| Age Bracket | Married | Unmarried |
| 15 to 19 years | 0 (0.0%) | 0 (0.0%) |
| 20 to 34 years | 0 (0.0%) | 0 (0.0%) |
| 35 to 50 years | 0 (0.0%) | 0 (0.0%) |
| Total | 0 (0.0%) | 0 (0.0%) |
Fertility by Education in Old Fort
| Educational Attainment | Women with Births | Births / 1,000 Women |
| Less than High School | 0 (0.0%) | 0.0 |
| High School Diploma | 0 (0.0%) | 0.0 |
| College or Associate's Degree | 0 (0.0%) | 0.0 |
| Bachelor's Degree | 0 (0.0%) | 0.0 |
| Graduate Degree | 0 (0.0%) | 0.0 |
| Total | 0 (0.0%) | 0.0 |
Fertility by Education by Marriage Status in Old Fort
| Educational Attainment | Married | Unmarried |
| Less than High School | 0 (0.0%) | 0 (0.0%) |
| High School Diploma | 0 (0.0%) | 0 (0.0%) |
| College or Associate's Degree | 0 (0.0%) | 0 (0.0%) |
| Bachelor's Degree | 0 (0.0%) | 0 (0.0%) |
| Graduate Degree | 0 (0.0%) | 0 (0.0%) |
| Total | 0 (0.0%) | 0 (0.0%) |
Employment Characteristics in Old Fort
Employment by Class of Employer in Old Fort
Among the 272 employed individuals in Old Fort, private company employees (168 | 61.8%), state government employees (36 | 13.2%), and not-for-profit organizations (35 | 12.9%) make up the most common classes of employment.
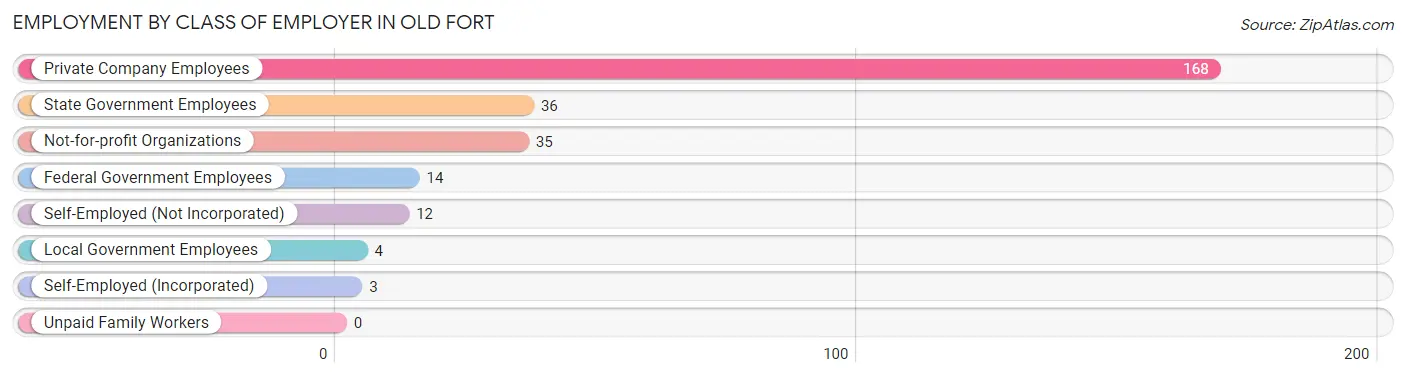
| Employer Class | # Employees | % Employees |
| Private Company Employees | 168 | 61.8% |
| Self-Employed (Incorporated) | 3 | 1.1% |
| Self-Employed (Not Incorporated) | 12 | 4.4% |
| Not-for-profit Organizations | 35 | 12.9% |
| Local Government Employees | 4 | 1.5% |
| State Government Employees | 36 | 13.2% |
| Federal Government Employees | 14 | 5.1% |
| Unpaid Family Workers | 0 | 0.0% |
| Total | 272 | 100.0% |
Employment Status by Age in Old Fort
According to the labor force statistics for Old Fort, out of the total population over 16 years of age (551), 52.3% or 288 individuals are in the labor force, with 5.6% or 16 of them unemployed. The age group with the highest labor force participation rate is 16 to 19 years, with 100.0% or 10 individuals in the labor force. Within the labor force, the 55 to 59 years age range has the highest percentage of unemployed individuals, with 35.3% or 12 of them being unemployed.
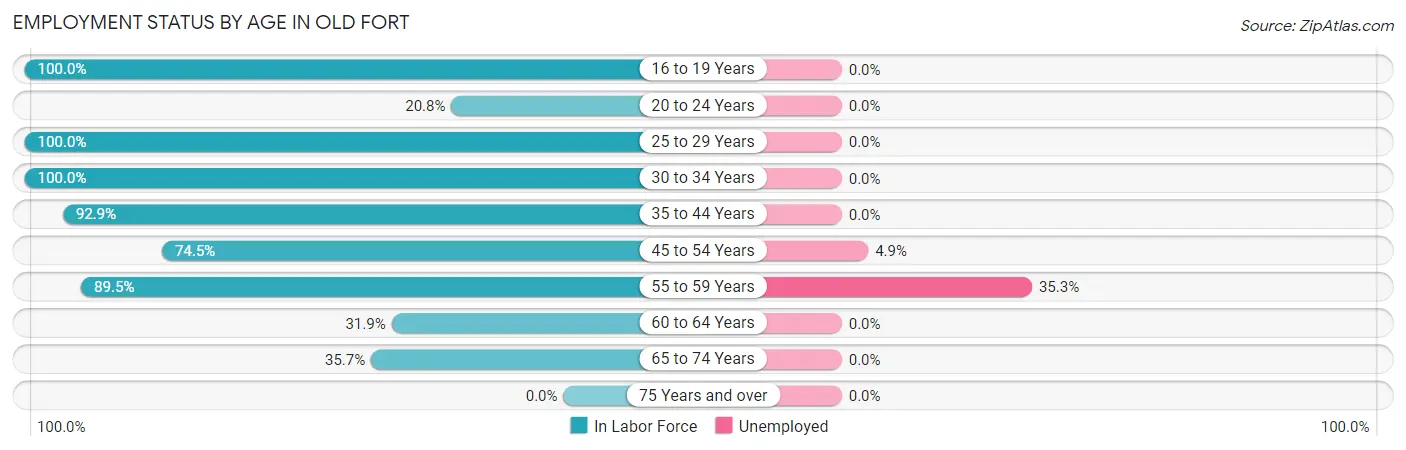
| Age Bracket | In Labor Force | Unemployed |
| 16 to 19 Years | 10 (100.0%) | 0 (0.0%) |
| 20 to 24 Years | 5 (20.8%) | 0 (0.0%) |
| 25 to 29 Years | 50 (100.0%) | 0 (0.0%) |
| 30 to 34 Years | 10 (100.0%) | 0 (0.0%) |
| 35 to 44 Years | 52 (92.9%) | 0 (0.0%) |
| 45 to 54 Years | 82 (74.5%) | 4 (4.9%) |
| 55 to 59 Years | 34 (89.5%) | 12 (35.3%) |
| 60 to 64 Years | 15 (31.9%) | 0 (0.0%) |
| 65 to 74 Years | 30 (35.7%) | 0 (0.0%) |
| 75 Years and over | 0 (0.0%) | 0 (0.0%) |
| Total | 288 (52.3%) | 16 (5.6%) |
Employment Status by Educational Attainment in Old Fort
According to labor force statistics for Old Fort, 78.1% of individuals (243) out of the total population between 25 and 64 years of age (311) are in the labor force, with 6.6% or 16 of them being unemployed. The group with the highest labor force participation rate are those with the educational attainment of bachelor's degree or higher, with 100.0% or 57 individuals in the labor force. Within the labor force, individuals with high school diploma education have the highest percentage of unemployment, with 15.7% or 16 of them being unemployed.
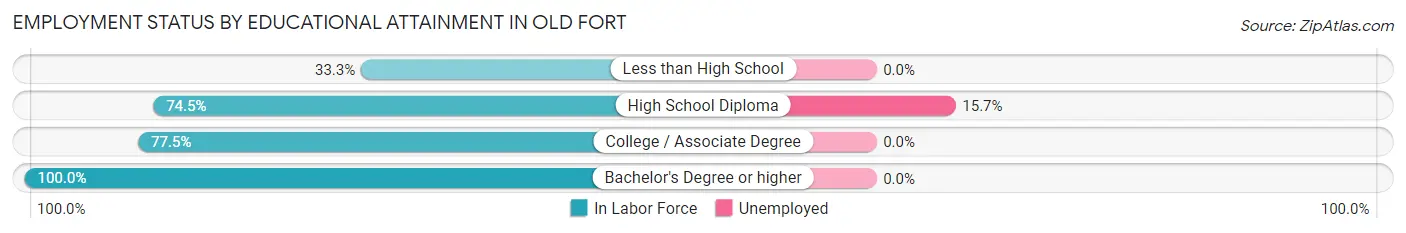
| Educational Attainment | In Labor Force | Unemployed |
| Less than High School | 5 (33.3%) | 0 (0.0%) |
| High School Diploma | 102 (74.5%) | 22 (15.7%) |
| College / Associate Degree | 79 (77.5%) | 0 (0.0%) |
| Bachelor's Degree or higher | 57 (100.0%) | 0 (0.0%) |
| Total | 243 (78.1%) | 21 (6.6%) |
Employment Occupations by Sex in Old Fort
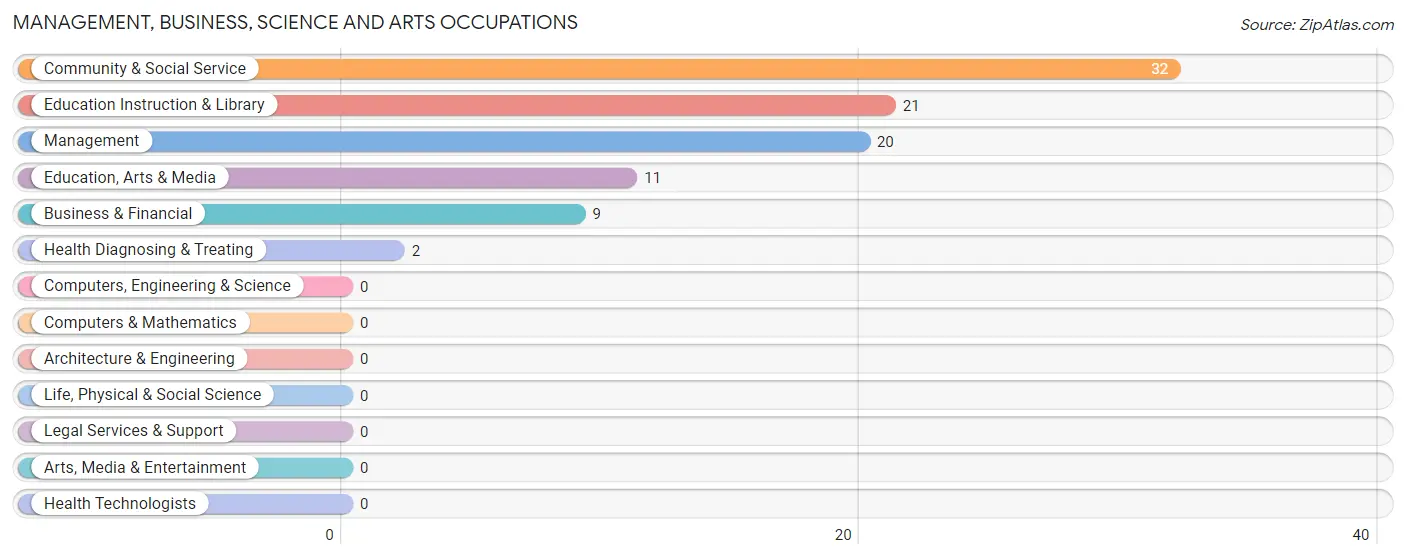
Management, Business, Science and Arts Occupations
The most common Management, Business, Science and Arts occupations in Old Fort are Community & Social Service (32 | 11.8%), Education Instruction & Library (21 | 7.7%), Management (20 | 7.3%), Education, Arts & Media (11 | 4.0%), and Business & Financial (9 | 3.3%).
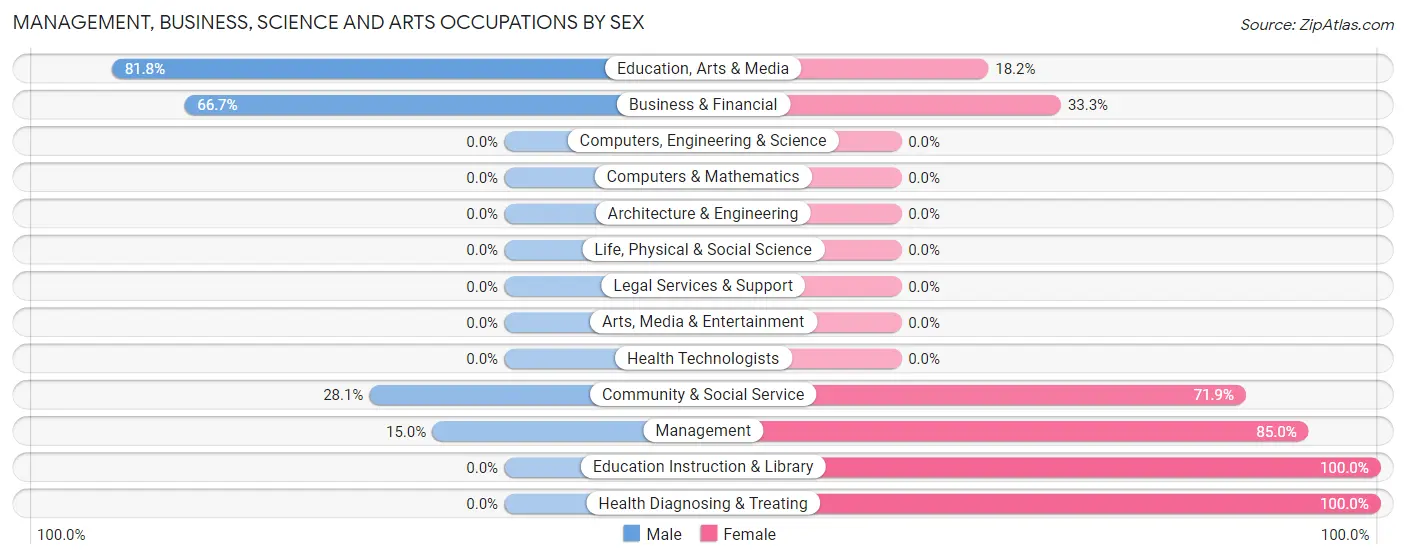
Management, Business, Science and Arts Occupations by Sex
Within the Management, Business, Science and Arts occupations in Old Fort, the most male-oriented occupations are Education, Arts & Media (81.8%), Business & Financial (66.7%), and Community & Social Service (28.1%), while the most female-oriented occupations are Education Instruction & Library (100.0%), Health Diagnosing & Treating (100.0%), and Management (85.0%).
| Occupation | Male | Female |
| Management | 3 (15.0%) | 17 (85.0%) |
| Business & Financial | 6 (66.7%) | 3 (33.3%) |
| Computers, Engineering & Science | 0 (0.0%) | 0 (0.0%) |
| Computers & Mathematics | 0 (0.0%) | 0 (0.0%) |
| Architecture & Engineering | 0 (0.0%) | 0 (0.0%) |
| Life, Physical & Social Science | 0 (0.0%) | 0 (0.0%) |
| Community & Social Service | 9 (28.1%) | 23 (71.9%) |
| Education, Arts & Media | 9 (81.8%) | 2 (18.2%) |
| Legal Services & Support | 0 (0.0%) | 0 (0.0%) |
| Education Instruction & Library | 0 (0.0%) | 21 (100.0%) |
| Arts, Media & Entertainment | 0 (0.0%) | 0 (0.0%) |
| Health Diagnosing & Treating | 0 (0.0%) | 2 (100.0%) |
| Health Technologists | 0 (0.0%) | 0 (0.0%) |
| Total (Category) | 18 (28.6%) | 45 (71.4%) |
| Total (Overall) | 127 (46.7%) | 145 (53.3%) |
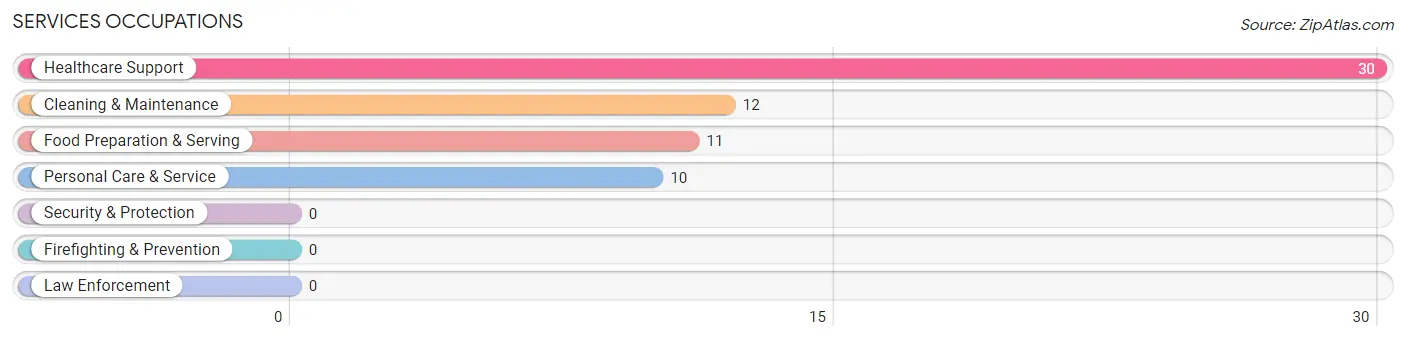
Services Occupations
The most common Services occupations in Old Fort are Healthcare Support (30 | 11.0%), Cleaning & Maintenance (12 | 4.4%), Food Preparation & Serving (11 | 4.0%), and Personal Care & Service (10 | 3.7%).
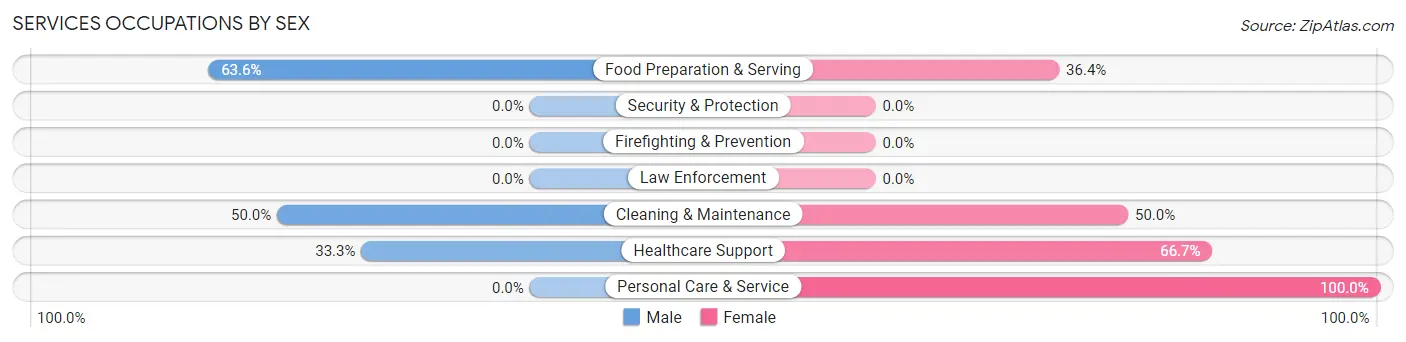
Services Occupations by Sex
Within the Services occupations in Old Fort, the most male-oriented occupations are Food Preparation & Serving (63.6%), Cleaning & Maintenance (50.0%), and Healthcare Support (33.3%), while the most female-oriented occupations are Personal Care & Service (100.0%), Healthcare Support (66.7%), and Cleaning & Maintenance (50.0%).
| Occupation | Male | Female |
| Healthcare Support | 10 (33.3%) | 20 (66.7%) |
| Security & Protection | 0 (0.0%) | 0 (0.0%) |
| Firefighting & Prevention | 0 (0.0%) | 0 (0.0%) |
| Law Enforcement | 0 (0.0%) | 0 (0.0%) |
| Food Preparation & Serving | 7 (63.6%) | 4 (36.4%) |
| Cleaning & Maintenance | 6 (50.0%) | 6 (50.0%) |
| Personal Care & Service | 0 (0.0%) | 10 (100.0%) |
| Total (Category) | 23 (36.5%) | 40 (63.5%) |
| Total (Overall) | 127 (46.7%) | 145 (53.3%) |
Sales and Office Occupations
The most common Sales and Office occupations in Old Fort are Office & Administration (42 | 15.4%), and Sales & Related (13 | 4.8%).
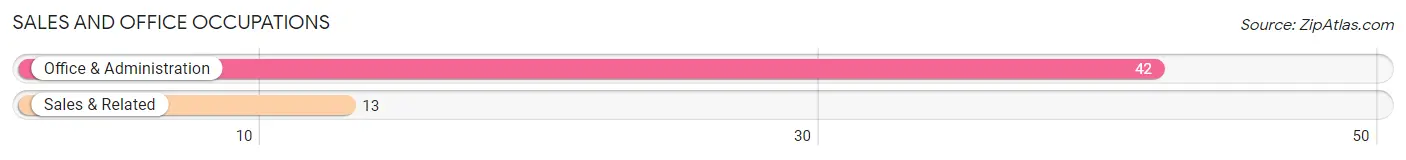
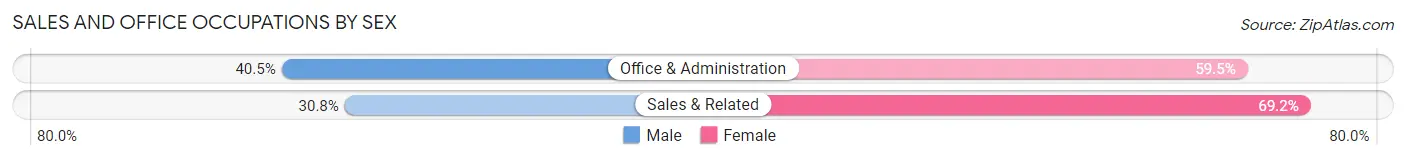
Sales and Office Occupations by Sex
| Occupation | Male | Female |
| Sales & Related | 4 (30.8%) | 9 (69.2%) |
| Office & Administration | 17 (40.5%) | 25 (59.5%) |
| Total (Category) | 21 (38.2%) | 34 (61.8%) |
| Total (Overall) | 127 (46.7%) | 145 (53.3%) |
Natural Resources, Construction and Maintenance Occupations
The most common Natural Resources, Construction and Maintenance occupations in Old Fort are Installation, Maintenance & Repair (18 | 6.6%), and Farming, Fishing & Forestry (5 | 1.8%).
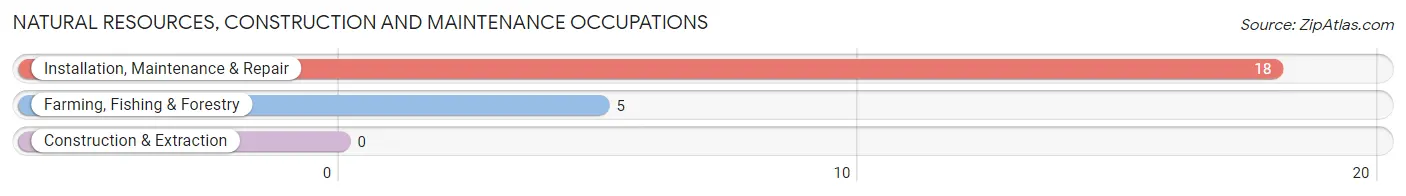
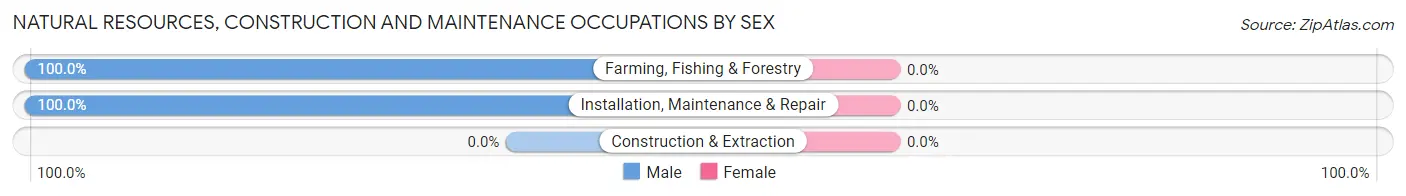
Natural Resources, Construction and Maintenance Occupations by Sex
| Occupation | Male | Female |
| Farming, Fishing & Forestry | 5 (100.0%) | 0 (0.0%) |
| Construction & Extraction | 0 (0.0%) | 0 (0.0%) |
| Installation, Maintenance & Repair | 18 (100.0%) | 0 (0.0%) |
| Total (Category) | 23 (100.0%) | 0 (0.0%) |
| Total (Overall) | 127 (46.7%) | 145 (53.3%) |
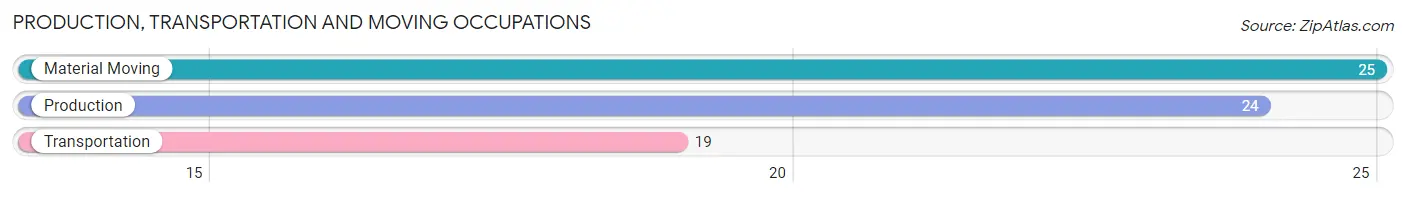
Production, Transportation and Moving Occupations
The most common Production, Transportation and Moving occupations in Old Fort are Material Moving (25 | 9.2%), Production (24 | 8.8%), and Transportation (19 | 7.0%).
Production, Transportation and Moving Occupations by Sex
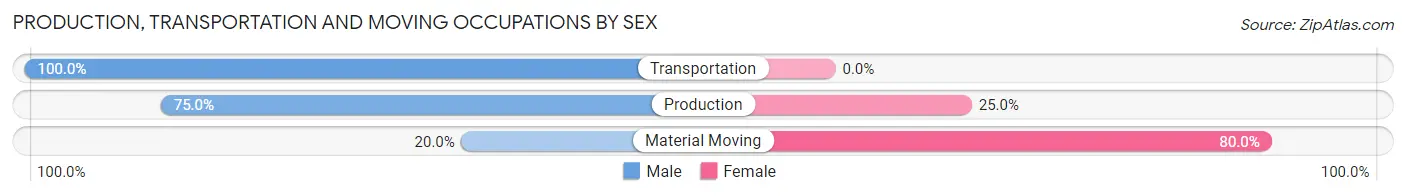
| Occupation | Male | Female |
| Production | 18 (75.0%) | 6 (25.0%) |
| Transportation | 19 (100.0%) | 0 (0.0%) |
| Material Moving | 5 (20.0%) | 20 (80.0%) |
| Total (Category) | 42 (61.8%) | 26 (38.2%) |
| Total (Overall) | 127 (46.7%) | 145 (53.3%) |
Employment Industries by Sex in Old Fort
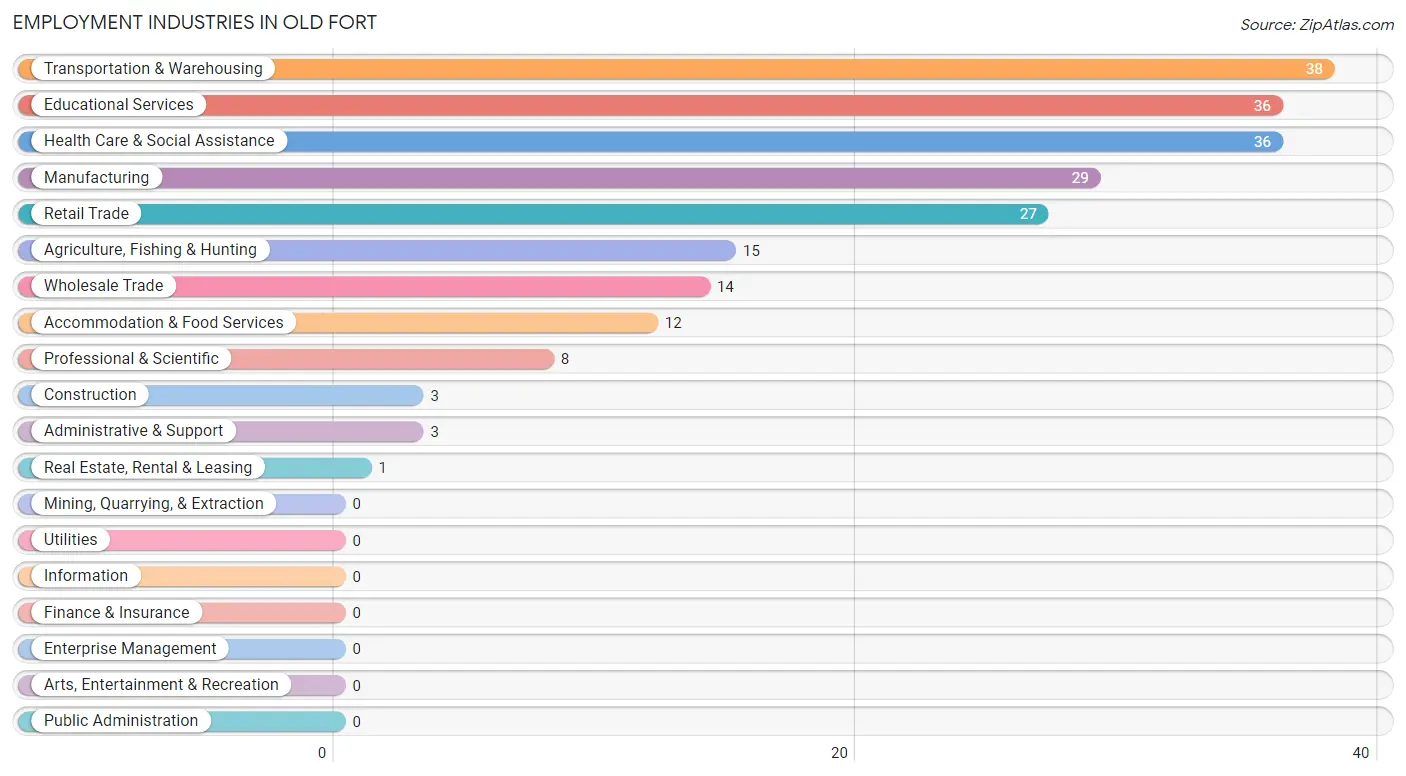
Employment Industries in Old Fort
The major employment industries in Old Fort include Transportation & Warehousing (38 | 14.0%), Educational Services (36 | 13.2%), Health Care & Social Assistance (36 | 13.2%), Manufacturing (29 | 10.7%), and Retail Trade (27 | 9.9%).
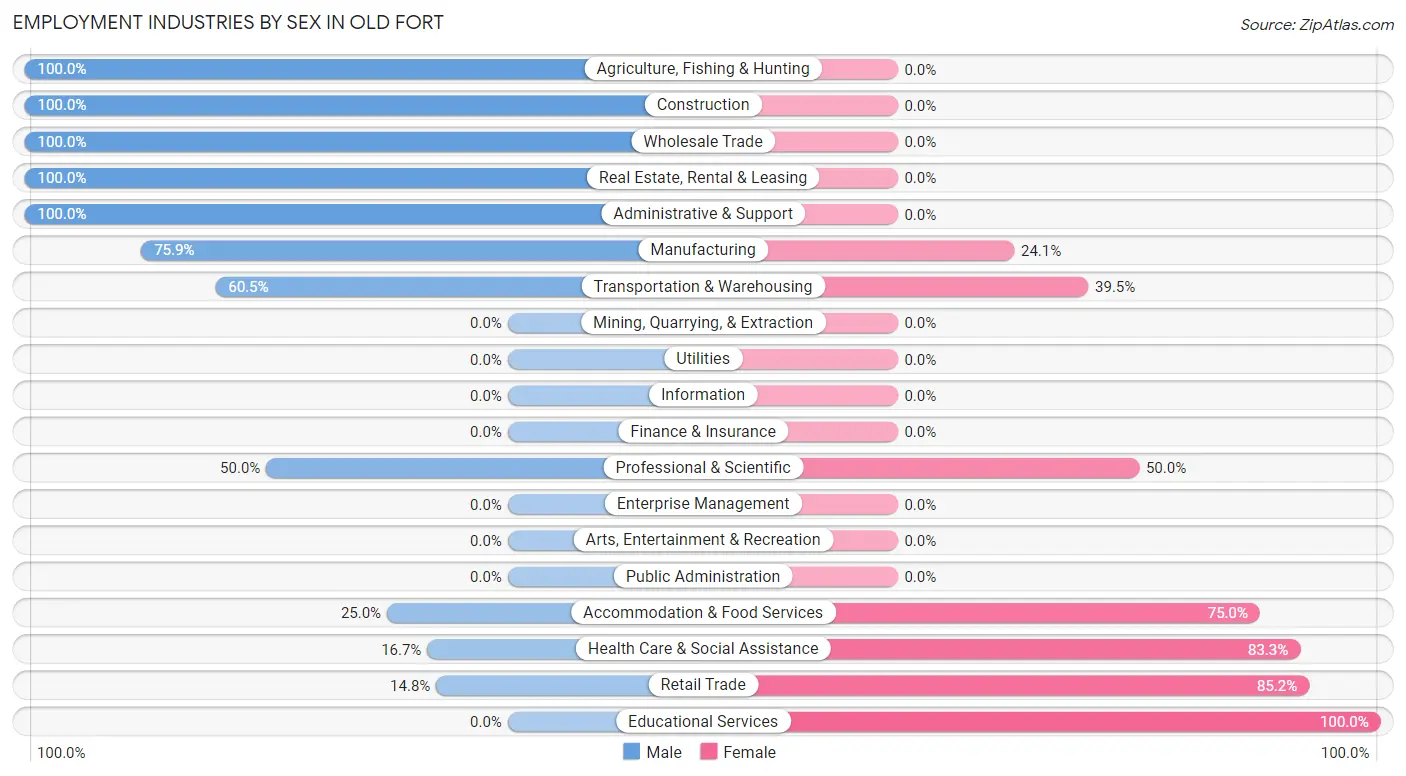
Employment Industries by Sex in Old Fort
The Old Fort industries that see more men than women are Agriculture, Fishing & Hunting (100.0%), Construction (100.0%), and Wholesale Trade (100.0%), whereas the industries that tend to have a higher number of women are Educational Services (100.0%), Retail Trade (85.2%), and Health Care & Social Assistance (83.3%).
| Industry | Male | Female |
| Agriculture, Fishing & Hunting | 15 (100.0%) | 0 (0.0%) |
| Mining, Quarrying, & Extraction | 0 (0.0%) | 0 (0.0%) |
| Construction | 3 (100.0%) | 0 (0.0%) |
| Manufacturing | 22 (75.9%) | 7 (24.1%) |
| Wholesale Trade | 14 (100.0%) | 0 (0.0%) |
| Retail Trade | 4 (14.8%) | 23 (85.2%) |
| Transportation & Warehousing | 23 (60.5%) | 15 (39.5%) |
| Utilities | 0 (0.0%) | 0 (0.0%) |
| Information | 0 (0.0%) | 0 (0.0%) |
| Finance & Insurance | 0 (0.0%) | 0 (0.0%) |
| Real Estate, Rental & Leasing | 1 (100.0%) | 0 (0.0%) |
| Professional & Scientific | 4 (50.0%) | 4 (50.0%) |
| Enterprise Management | 0 (0.0%) | 0 (0.0%) |
| Administrative & Support | 3 (100.0%) | 0 (0.0%) |
| Educational Services | 0 (0.0%) | 36 (100.0%) |
| Health Care & Social Assistance | 6 (16.7%) | 30 (83.3%) |
| Arts, Entertainment & Recreation | 0 (0.0%) | 0 (0.0%) |
| Accommodation & Food Services | 3 (25.0%) | 9 (75.0%) |
| Public Administration | 0 (0.0%) | 0 (0.0%) |
| Total | 127 (46.7%) | 145 (53.3%) |
Education in Old Fort
School Enrollment in Old Fort
The most common levels of schooling among the 131 students in Old Fort are elementary school (36 | 27.5%), middle school (31 | 23.7%), and college / undergraduate (30 | 22.9%).
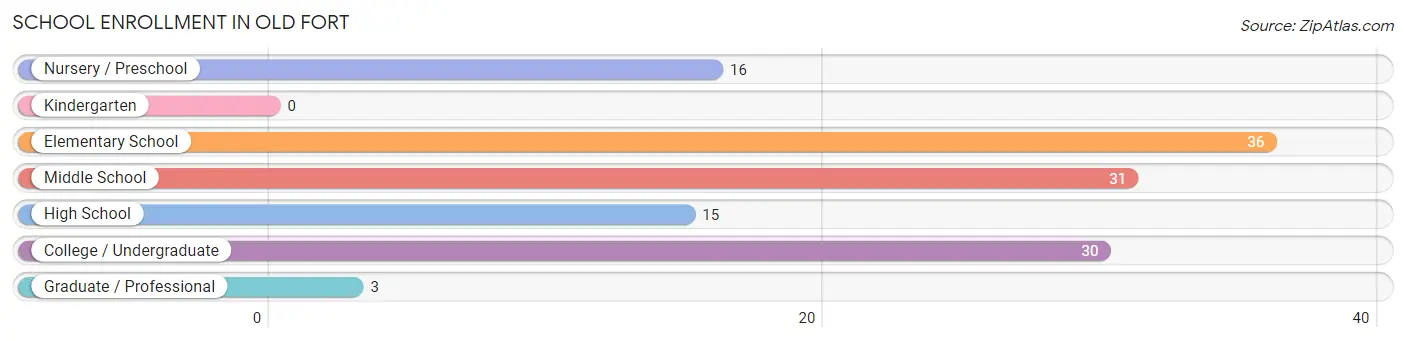
| School Level | # Students | % Students |
| Nursery / Preschool | 16 | 12.2% |
| Kindergarten | 0 | 0.0% |
| Elementary School | 36 | 27.5% |
| Middle School | 31 | 23.7% |
| High School | 15 | 11.5% |
| College / Undergraduate | 30 | 22.9% |
| Graduate / Professional | 3 | 2.3% |
| Total | 131 | 100.0% |
School Enrollment by Age by Funding Source in Old Fort
Out of a total of 131 students who are enrolled in schools in Old Fort, 13 (9.9%) attend a private institution, while the remaining 118 (90.1%) are enrolled in public schools. The age group of 25 to 34 year olds has the highest likelihood of being enrolled in private schools, with 3 (42.9% in the age bracket) enrolled. Conversely, the age group of 3 to 4 year olds has the lowest likelihood of being enrolled in a private school, with 7 (100.0% in the age bracket) attending a public institution.
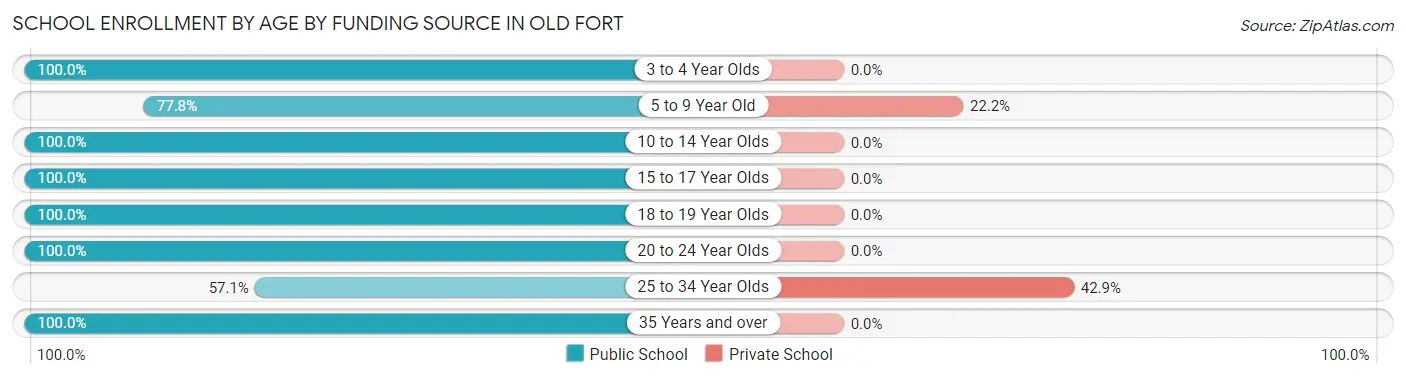
| Age Bracket | Public School | Private School |
| 3 to 4 Year Olds | 7 (100.0%) | 0 (0.0%) |
| 5 to 9 Year Old | 35 (77.8%) | 10 (22.2%) |
| 10 to 14 Year Olds | 43 (100.0%) | 0 (0.0%) |
| 15 to 17 Year Olds | 3 (100.0%) | 0 (0.0%) |
| 18 to 19 Year Olds | 4 (100.0%) | 0 (0.0%) |
| 20 to 24 Year Olds | 19 (100.0%) | 0 (0.0%) |
| 25 to 34 Year Olds | 4 (57.1%) | 3 (42.9%) |
| 35 Years and over | 3 (100.0%) | 0 (0.0%) |
| Total | 118 (90.1%) | 13 (9.9%) |
Educational Attainment by Field of Study in Old Fort
Business (24 | 18.6%), education (23 | 17.8%), social sciences (19 | 14.7%), arts & humanities (18 | 14.0%), and literature & languages (11 | 8.5%) are the most common fields of study among 129 individuals in Old Fort who have obtained a bachelor's degree or higher.
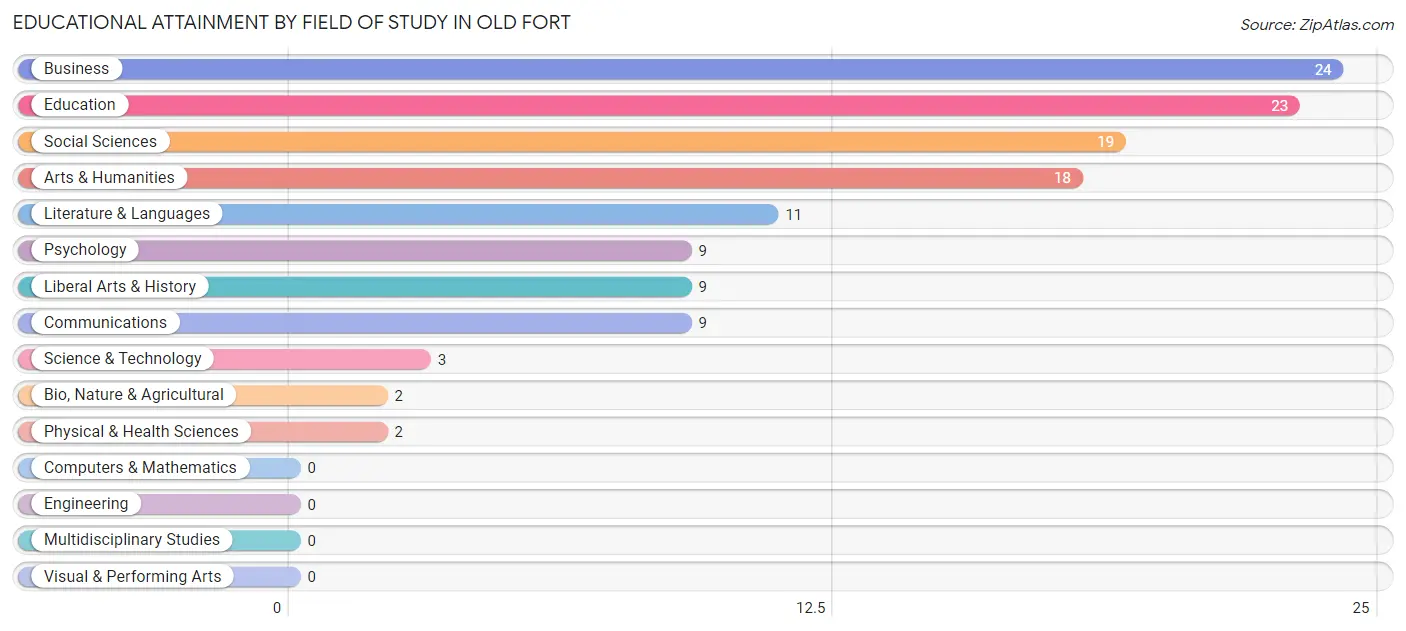
| Field of Study | # Graduates | % Graduates |
| Computers & Mathematics | 0 | 0.0% |
| Bio, Nature & Agricultural | 2 | 1.5% |
| Physical & Health Sciences | 2 | 1.5% |
| Psychology | 9 | 7.0% |
| Social Sciences | 19 | 14.7% |
| Engineering | 0 | 0.0% |
| Multidisciplinary Studies | 0 | 0.0% |
| Science & Technology | 3 | 2.3% |
| Business | 24 | 18.6% |
| Education | 23 | 17.8% |
| Literature & Languages | 11 | 8.5% |
| Liberal Arts & History | 9 | 7.0% |
| Visual & Performing Arts | 0 | 0.0% |
| Communications | 9 | 7.0% |
| Arts & Humanities | 18 | 14.0% |
| Total | 129 | 100.0% |
Transportation & Commute in Old Fort
Vehicle Availability by Sex in Old Fort
The most prevalent vehicle ownership categories in Old Fort are males with 2 vehicles (55, accounting for 43.3%) and females with 2 vehicles (49, making up 37.9%).
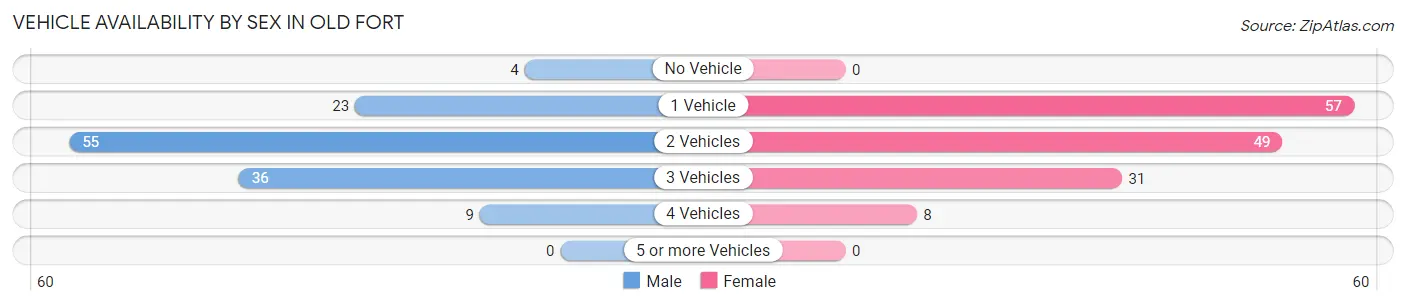
| Vehicles Available | Male | Female |
| No Vehicle | 4 (3.2%) | 0 (0.0%) |
| 1 Vehicle | 23 (18.1%) | 57 (39.3%) |
| 2 Vehicles | 55 (43.3%) | 49 (33.8%) |
| 3 Vehicles | 36 (28.3%) | 31 (21.4%) |
| 4 Vehicles | 9 (7.1%) | 8 (5.5%) |
| 5 or more Vehicles | 0 (0.0%) | 0 (0.0%) |
| Total | 127 (100.0%) | 145 (100.0%) |
Commute Time in Old Fort
The most frequently occuring commute durations in Old Fort are 30 to 34 minutes (69 commuters, 27.9%), 20 to 24 minutes (44 commuters, 17.8%), and 15 to 19 minutes (38 commuters, 15.4%).
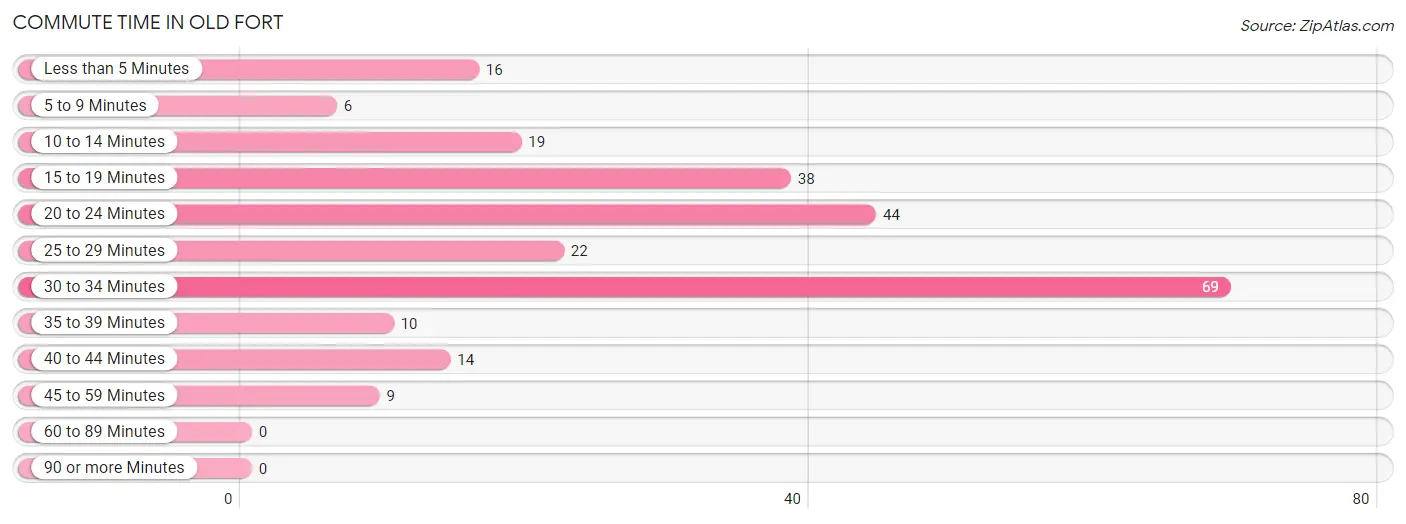
| Commute Time | # Commuters | % Commuters |
| Less than 5 Minutes | 16 | 6.5% |
| 5 to 9 Minutes | 6 | 2.4% |
| 10 to 14 Minutes | 19 | 7.7% |
| 15 to 19 Minutes | 38 | 15.4% |
| 20 to 24 Minutes | 44 | 17.8% |
| 25 to 29 Minutes | 22 | 8.9% |
| 30 to 34 Minutes | 69 | 27.9% |
| 35 to 39 Minutes | 10 | 4.1% |
| 40 to 44 Minutes | 14 | 5.7% |
| 45 to 59 Minutes | 9 | 3.6% |
| 60 to 89 Minutes | 0 | 0.0% |
| 90 or more Minutes | 0 | 0.0% |
Commute Time by Sex in Old Fort
The most common commute times in Old Fort are 30 to 34 minutes (33 commuters, 30.0%) for males and 30 to 34 minutes (36 commuters, 26.3%) for females.
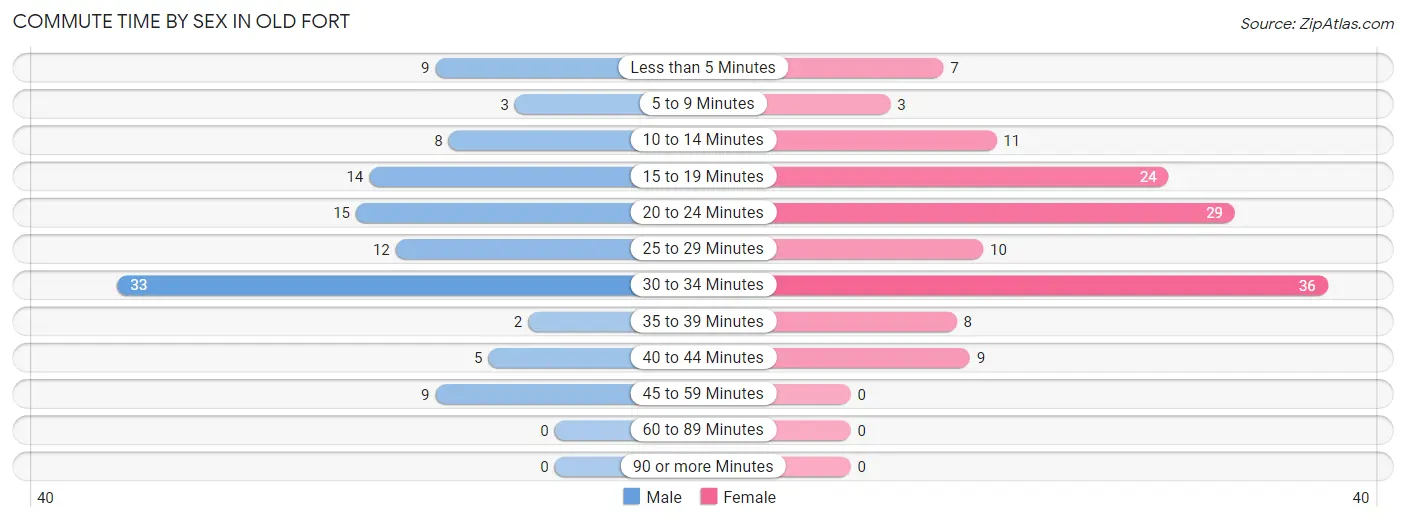
| Commute Time | Male | Female |
| Less than 5 Minutes | 9 (8.2%) | 7 (5.1%) |
| 5 to 9 Minutes | 3 (2.7%) | 3 (2.2%) |
| 10 to 14 Minutes | 8 (7.3%) | 11 (8.0%) |
| 15 to 19 Minutes | 14 (12.7%) | 24 (17.5%) |
| 20 to 24 Minutes | 15 (13.6%) | 29 (21.2%) |
| 25 to 29 Minutes | 12 (10.9%) | 10 (7.3%) |
| 30 to 34 Minutes | 33 (30.0%) | 36 (26.3%) |
| 35 to 39 Minutes | 2 (1.8%) | 8 (5.8%) |
| 40 to 44 Minutes | 5 (4.5%) | 9 (6.6%) |
| 45 to 59 Minutes | 9 (8.2%) | 0 (0.0%) |
| 60 to 89 Minutes | 0 (0.0%) | 0 (0.0%) |
| 90 or more Minutes | 0 (0.0%) | 0 (0.0%) |
Time of Departure to Work by Sex in Old Fort
The most frequent times of departure to work in Old Fort are 7:30 AM to 7:59 AM (29, 26.4%) for males and 8:00 AM to 8:29 AM (44, 32.1%) for females.
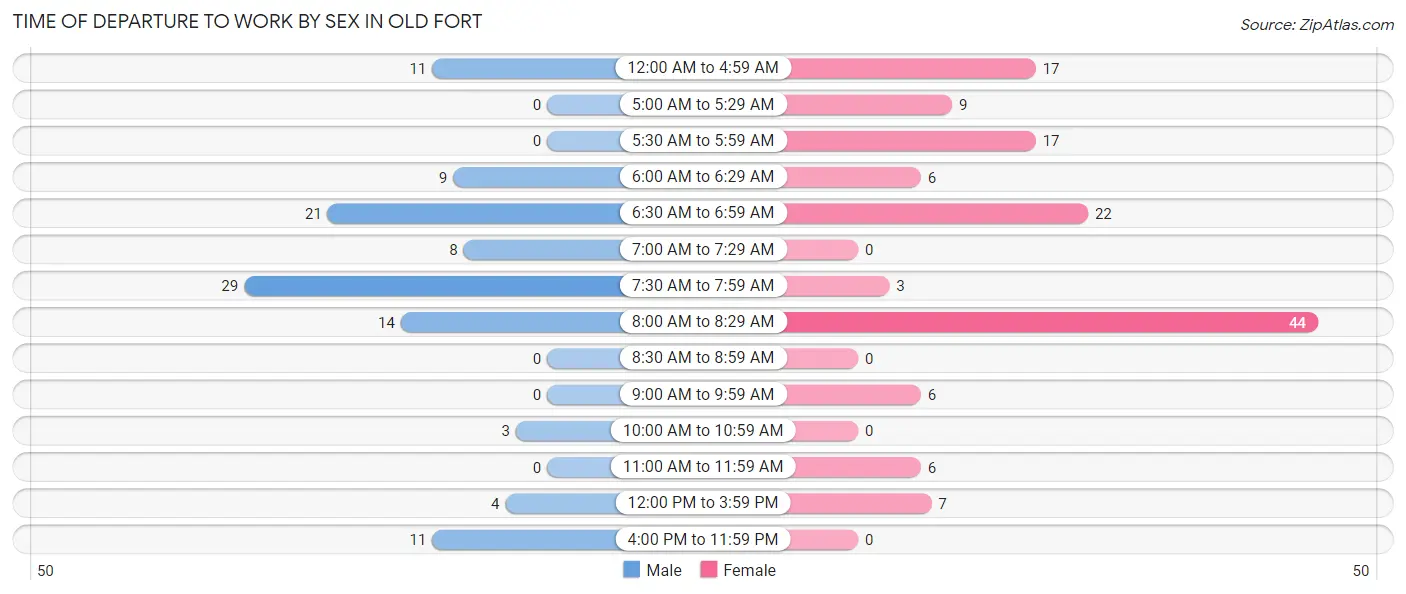
| Time of Departure | Male | Female |
| 12:00 AM to 4:59 AM | 11 (10.0%) | 17 (12.4%) |
| 5:00 AM to 5:29 AM | 0 (0.0%) | 9 (6.6%) |
| 5:30 AM to 5:59 AM | 0 (0.0%) | 17 (12.4%) |
| 6:00 AM to 6:29 AM | 9 (8.2%) | 6 (4.4%) |
| 6:30 AM to 6:59 AM | 21 (19.1%) | 22 (16.1%) |
| 7:00 AM to 7:29 AM | 8 (7.3%) | 0 (0.0%) |
| 7:30 AM to 7:59 AM | 29 (26.4%) | 3 (2.2%) |
| 8:00 AM to 8:29 AM | 14 (12.7%) | 44 (32.1%) |
| 8:30 AM to 8:59 AM | 0 (0.0%) | 0 (0.0%) |
| 9:00 AM to 9:59 AM | 0 (0.0%) | 6 (4.4%) |
| 10:00 AM to 10:59 AM | 3 (2.7%) | 0 (0.0%) |
| 11:00 AM to 11:59 AM | 0 (0.0%) | 6 (4.4%) |
| 12:00 PM to 3:59 PM | 4 (3.6%) | 7 (5.1%) |
| 4:00 PM to 11:59 PM | 11 (10.0%) | 0 (0.0%) |
| Total | 110 (100.0%) | 137 (100.0%) |
Housing Occupancy in Old Fort
Occupancy by Ownership in Old Fort
Of the total 331 dwellings in Old Fort, owner-occupied units account for 190 (57.4%), while renter-occupied units make up 141 (42.6%).
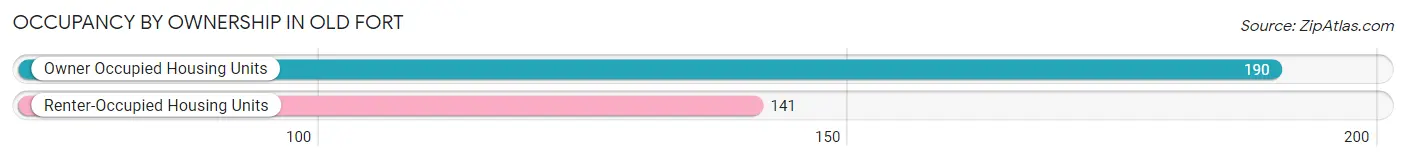
| Occupancy | # Housing Units | % Housing Units |
| Owner Occupied Housing Units | 190 | 57.4% |
| Renter-Occupied Housing Units | 141 | 42.6% |
| Total Occupied Housing Units | 331 | 100.0% |
Occupancy by Household Size in Old Fort
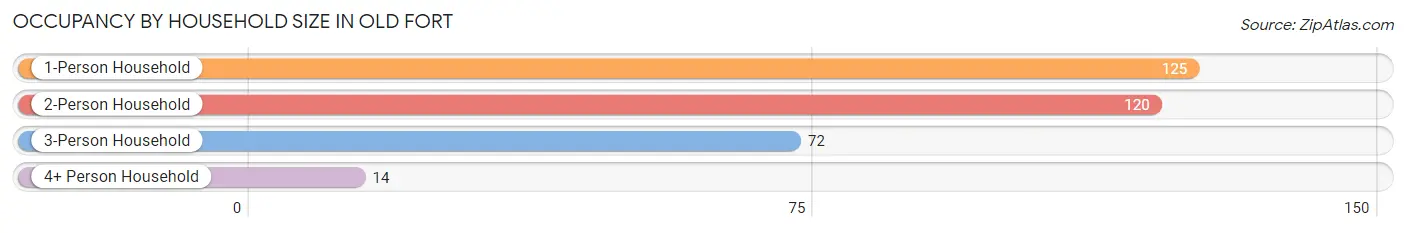
| Household Size | # Housing Units | % Housing Units |
| 1-Person Household | 125 | 37.8% |
| 2-Person Household | 120 | 36.2% |
| 3-Person Household | 72 | 21.7% |
| 4+ Person Household | 14 | 4.2% |
| Total Housing Units | 331 | 100.0% |
Occupancy by Ownership by Household Size in Old Fort
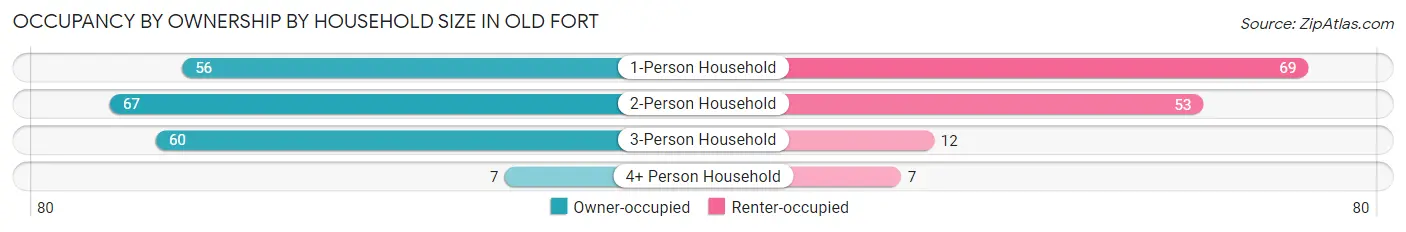
| Household Size | Owner-occupied | Renter-occupied |
| 1-Person Household | 56 (44.8%) | 69 (55.2%) |
| 2-Person Household | 67 (55.8%) | 53 (44.2%) |
| 3-Person Household | 60 (83.3%) | 12 (16.7%) |
| 4+ Person Household | 7 (50.0%) | 7 (50.0%) |
| Total Housing Units | 190 (57.4%) | 141 (42.6%) |
Occupancy by Educational Attainment in Old Fort
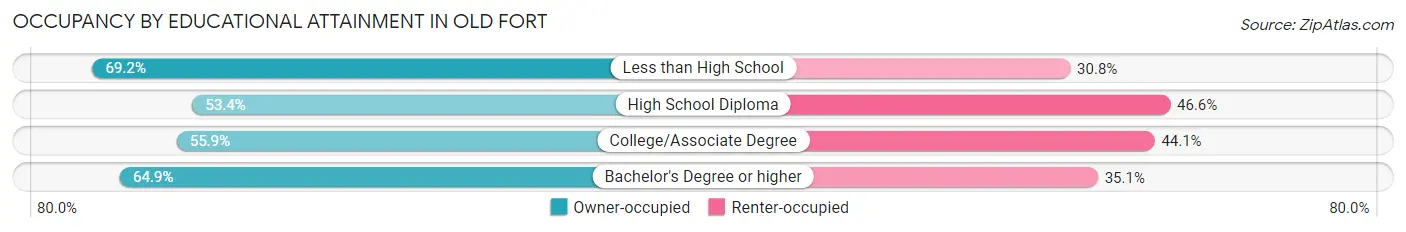
| Household Size | Owner-occupied | Renter-occupied |
| Less than High School | 9 (69.2%) | 4 (30.8%) |
| High School Diploma | 71 (53.4%) | 62 (46.6%) |
| College/Associate Degree | 62 (55.9%) | 49 (44.1%) |
| Bachelor's Degree or higher | 48 (64.9%) | 26 (35.1%) |
Occupancy by Age of Householder in Old Fort
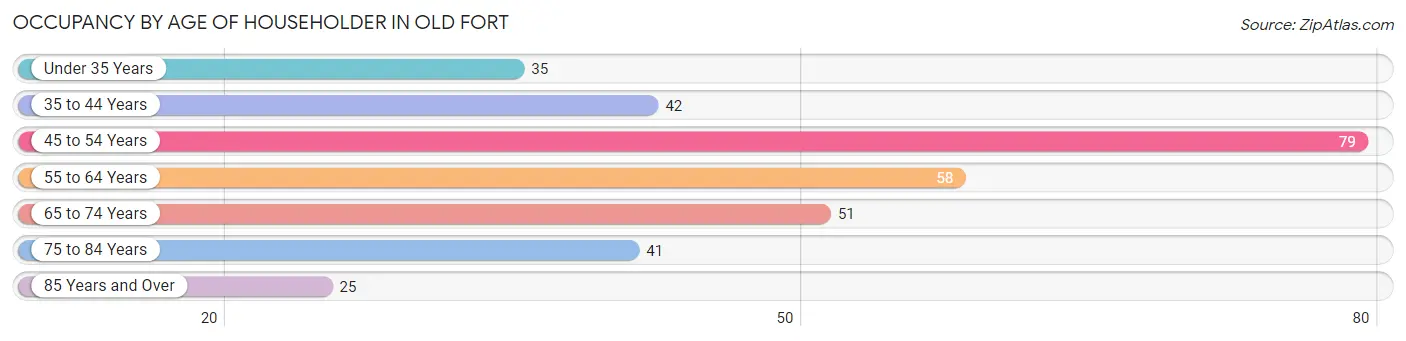
| Age Bracket | # Households | % Households |
| Under 35 Years | 35 | 10.6% |
| 35 to 44 Years | 42 | 12.7% |
| 45 to 54 Years | 79 | 23.9% |
| 55 to 64 Years | 58 | 17.5% |
| 65 to 74 Years | 51 | 15.4% |
| 75 to 84 Years | 41 | 12.4% |
| 85 Years and Over | 25 | 7.5% |
| Total | 331 | 100.0% |
Housing Finances in Old Fort
Median Income by Occupancy in Old Fort
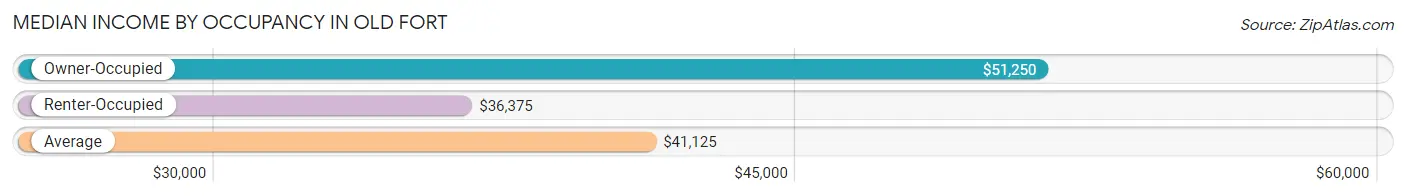
| Occupancy Type | # Households | Median Income |
| Owner-Occupied | 190 (57.4%) | $51,250 |
| Renter-Occupied | 141 (42.6%) | $36,375 |
| Average | 331 (100.0%) | $41,125 |
Occupancy by Householder Income Bracket in Old Fort
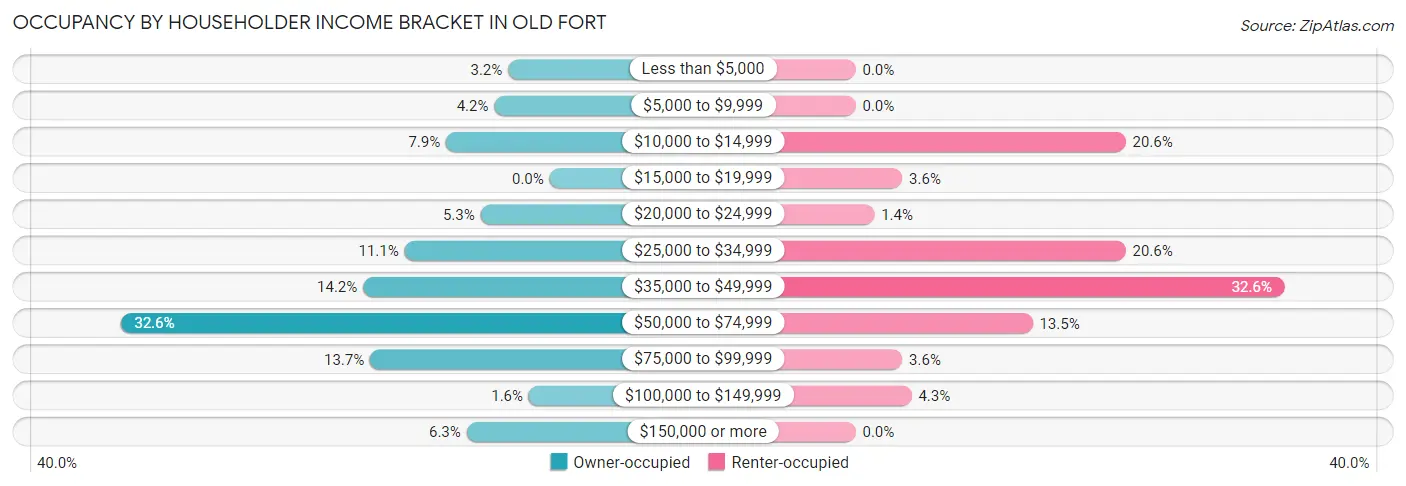
| Income Bracket | Owner-occupied | Renter-occupied |
| Less than $5,000 | 6 (3.2%) | 0 (0.0%) |
| $5,000 to $9,999 | 8 (4.2%) | 0 (0.0%) |
| $10,000 to $14,999 | 15 (7.9%) | 29 (20.6%) |
| $15,000 to $19,999 | 0 (0.0%) | 5 (3.5%) |
| $20,000 to $24,999 | 10 (5.3%) | 2 (1.4%) |
| $25,000 to $34,999 | 21 (11.1%) | 29 (20.6%) |
| $35,000 to $49,999 | 27 (14.2%) | 46 (32.6%) |
| $50,000 to $74,999 | 62 (32.6%) | 19 (13.5%) |
| $75,000 to $99,999 | 26 (13.7%) | 5 (3.5%) |
| $100,000 to $149,999 | 3 (1.6%) | 6 (4.3%) |
| $150,000 or more | 12 (6.3%) | 0 (0.0%) |
| Total | 190 (100.0%) | 141 (100.0%) |
Monthly Housing Cost Tiers in Old Fort
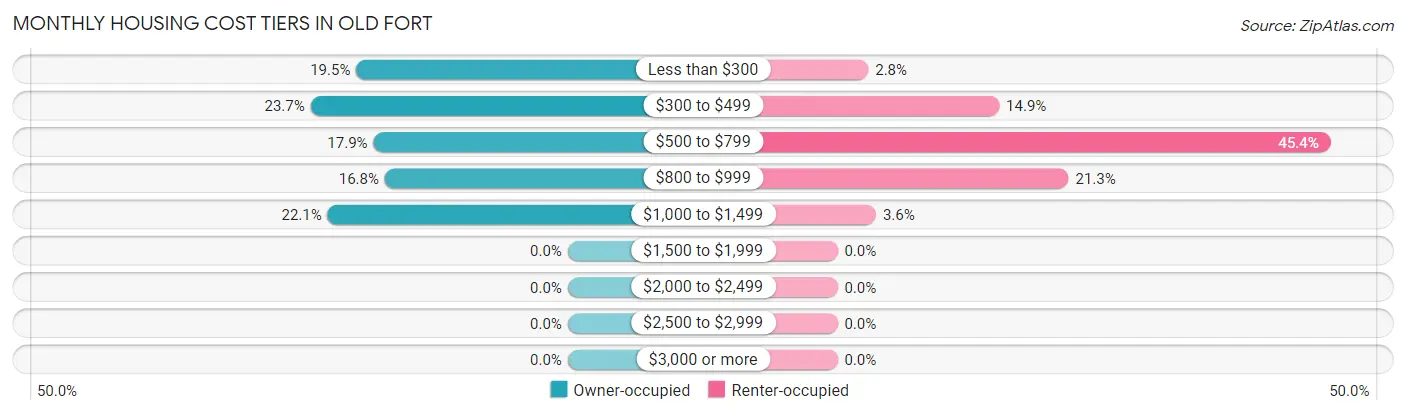
| Monthly Cost | Owner-occupied | Renter-occupied |
| Less than $300 | 37 (19.5%) | 4 (2.8%) |
| $300 to $499 | 45 (23.7%) | 21 (14.9%) |
| $500 to $799 | 34 (17.9%) | 64 (45.4%) |
| $800 to $999 | 32 (16.8%) | 30 (21.3%) |
| $1,000 to $1,499 | 42 (22.1%) | 5 (3.5%) |
| $1,500 to $1,999 | 0 (0.0%) | 0 (0.0%) |
| $2,000 to $2,499 | 0 (0.0%) | 0 (0.0%) |
| $2,500 to $2,999 | 0 (0.0%) | 0 (0.0%) |
| $3,000 or more | 0 (0.0%) | 0 (0.0%) |
| Total | 190 (100.0%) | 141 (100.0%) |
Physical Housing Characteristics in Old Fort
Housing Structures in Old Fort
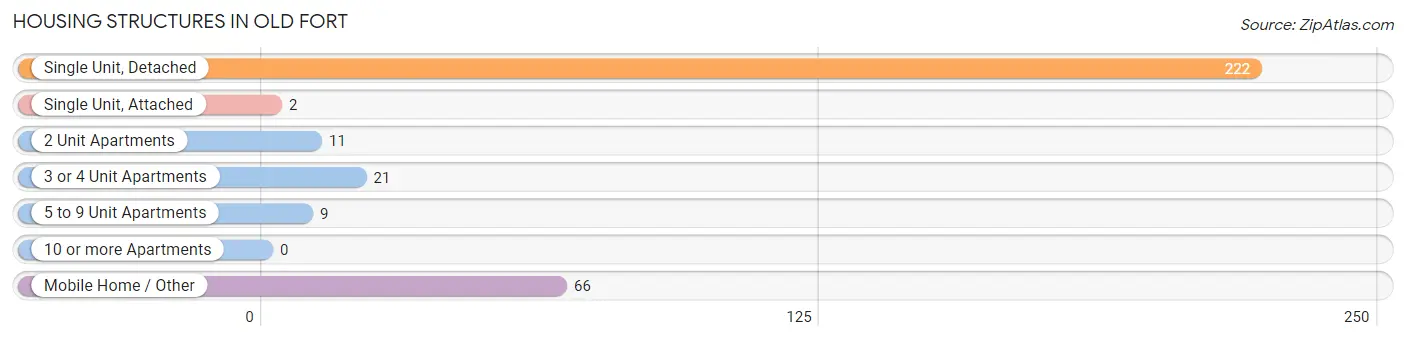
| Structure Type | # Housing Units | % Housing Units |
| Single Unit, Detached | 222 | 67.1% |
| Single Unit, Attached | 2 | 0.6% |
| 2 Unit Apartments | 11 | 3.3% |
| 3 or 4 Unit Apartments | 21 | 6.3% |
| 5 to 9 Unit Apartments | 9 | 2.7% |
| 10 or more Apartments | 0 | 0.0% |
| Mobile Home / Other | 66 | 19.9% |
| Total | 331 | 100.0% |
Housing Structures by Occupancy in Old Fort
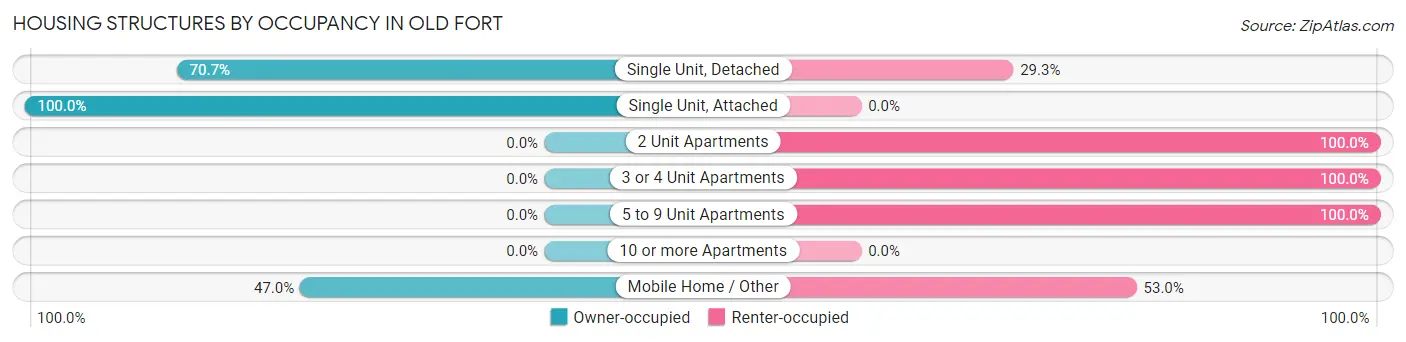
| Structure Type | Owner-occupied | Renter-occupied |
| Single Unit, Detached | 157 (70.7%) | 65 (29.3%) |
| Single Unit, Attached | 2 (100.0%) | 0 (0.0%) |
| 2 Unit Apartments | 0 (0.0%) | 11 (100.0%) |
| 3 or 4 Unit Apartments | 0 (0.0%) | 21 (100.0%) |
| 5 to 9 Unit Apartments | 0 (0.0%) | 9 (100.0%) |
| 10 or more Apartments | 0 (0.0%) | 0 (0.0%) |
| Mobile Home / Other | 31 (47.0%) | 35 (53.0%) |
| Total | 190 (57.4%) | 141 (42.6%) |
Housing Structures by Number of Rooms in Old Fort
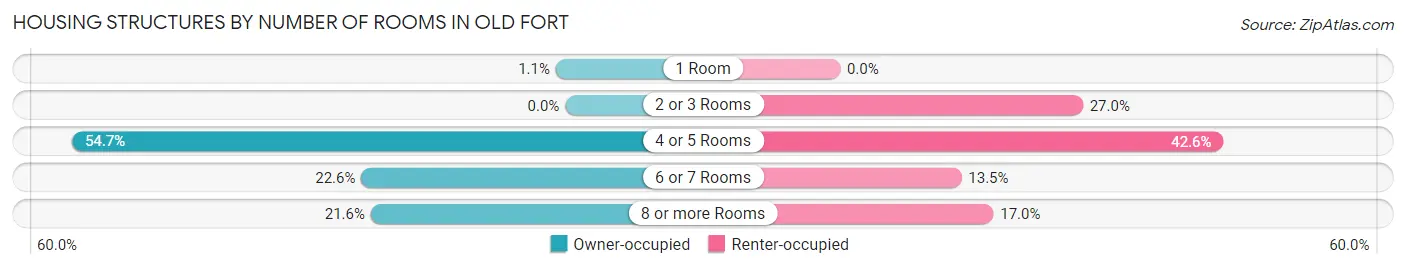
| Number of Rooms | Owner-occupied | Renter-occupied |
| 1 Room | 2 (1.1%) | 0 (0.0%) |
| 2 or 3 Rooms | 0 (0.0%) | 38 (27.0%) |
| 4 or 5 Rooms | 104 (54.7%) | 60 (42.5%) |
| 6 or 7 Rooms | 43 (22.6%) | 19 (13.5%) |
| 8 or more Rooms | 41 (21.6%) | 24 (17.0%) |
| Total | 190 (100.0%) | 141 (100.0%) |
Housing Structure by Heating Type in Old Fort
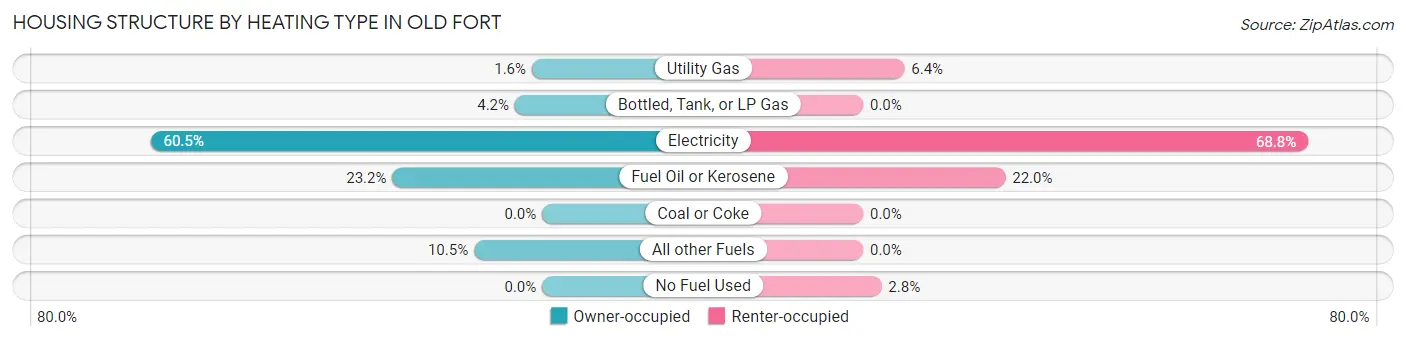
| Heating Type | Owner-occupied | Renter-occupied |
| Utility Gas | 3 (1.6%) | 9 (6.4%) |
| Bottled, Tank, or LP Gas | 8 (4.2%) | 0 (0.0%) |
| Electricity | 115 (60.5%) | 97 (68.8%) |
| Fuel Oil or Kerosene | 44 (23.2%) | 31 (22.0%) |
| Coal or Coke | 0 (0.0%) | 0 (0.0%) |
| All other Fuels | 20 (10.5%) | 0 (0.0%) |
| No Fuel Used | 0 (0.0%) | 4 (2.8%) |
| Total | 190 (100.0%) | 141 (100.0%) |
Household Vehicle Usage in Old Fort
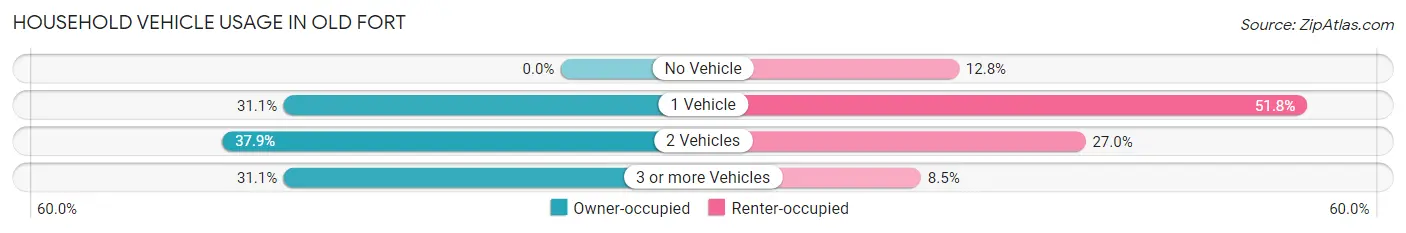
| Vehicles per Household | Owner-occupied | Renter-occupied |
| No Vehicle | 0 (0.0%) | 18 (12.8%) |
| 1 Vehicle | 59 (31.0%) | 73 (51.8%) |
| 2 Vehicles | 72 (37.9%) | 38 (27.0%) |
| 3 or more Vehicles | 59 (31.0%) | 12 (8.5%) |
| Total | 190 (100.0%) | 141 (100.0%) |
Real Estate & Mortgages in Old Fort
Real Estate and Mortgage Overview in Old Fort
| Characteristic | Without Mortgage | With Mortgage |
| Housing Units | 97 | 93 |
| Median Property Value | $93,200 | $120,500 |
| Median Household Income | $39,688 | $12 |
| Monthly Housing Costs | $326 | $0 |
| Real Estate Taxes | $506 | $2 |
Property Value by Mortgage Status in Old Fort
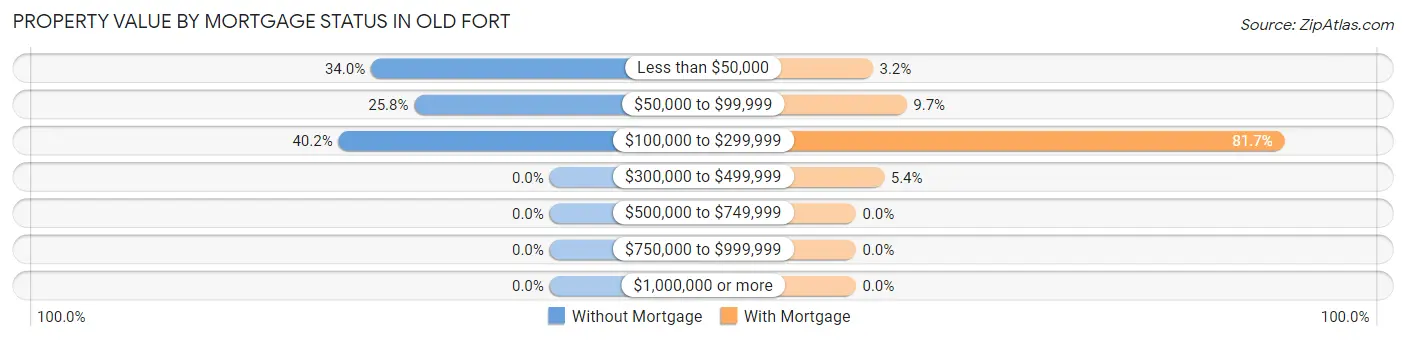
| Property Value | Without Mortgage | With Mortgage |
| Less than $50,000 | 33 (34.0%) | 3 (3.2%) |
| $50,000 to $99,999 | 25 (25.8%) | 9 (9.7%) |
| $100,000 to $299,999 | 39 (40.2%) | 76 (81.7%) |
| $300,000 to $499,999 | 0 (0.0%) | 5 (5.4%) |
| $500,000 to $749,999 | 0 (0.0%) | 0 (0.0%) |
| $750,000 to $999,999 | 0 (0.0%) | 0 (0.0%) |
| $1,000,000 or more | 0 (0.0%) | 0 (0.0%) |
| Total | 97 (100.0%) | 93 (100.0%) |
Household Income by Mortgage Status in Old Fort
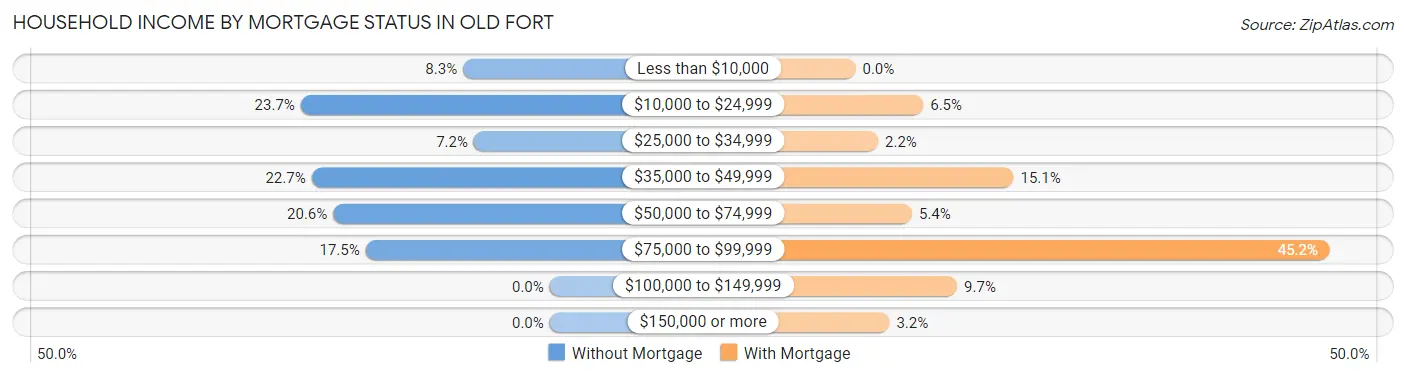
| Household Income | Without Mortgage | With Mortgage |
| Less than $10,000 | 8 (8.3%) | 0 (0.0%) |
| $10,000 to $24,999 | 23 (23.7%) | 6 (6.5%) |
| $25,000 to $34,999 | 7 (7.2%) | 2 (2.1%) |
| $35,000 to $49,999 | 22 (22.7%) | 14 (15.0%) |
| $50,000 to $74,999 | 20 (20.6%) | 5 (5.4%) |
| $75,000 to $99,999 | 17 (17.5%) | 42 (45.2%) |
| $100,000 to $149,999 | 0 (0.0%) | 9 (9.7%) |
| $150,000 or more | 0 (0.0%) | 3 (3.2%) |
| Total | 97 (100.0%) | 93 (100.0%) |
Property Value to Household Income Ratio in Old Fort
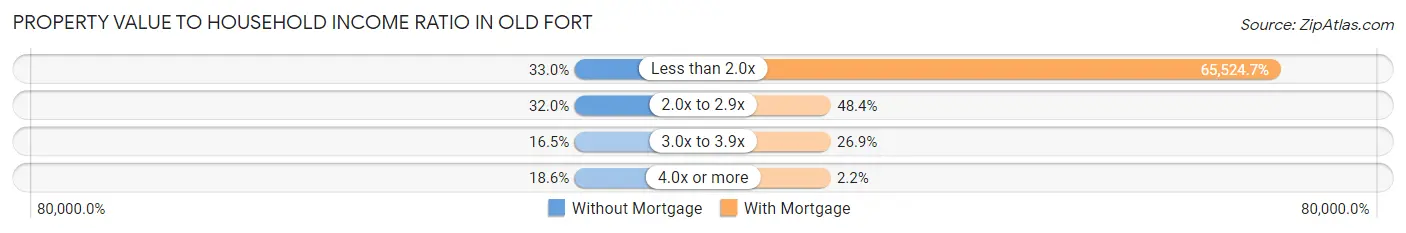
| Value-to-Income Ratio | Without Mortgage | With Mortgage |
| Less than 2.0x | 32 (33.0%) | 60,938 (65,524.7%) |
| 2.0x to 2.9x | 31 (32.0%) | 45 (48.4%) |
| 3.0x to 3.9x | 16 (16.5%) | 25 (26.9%) |
| 4.0x or more | 18 (18.6%) | 2 (2.1%) |
| Total | 97 (100.0%) | 93 (100.0%) |
Real Estate Taxes by Mortgage Status in Old Fort
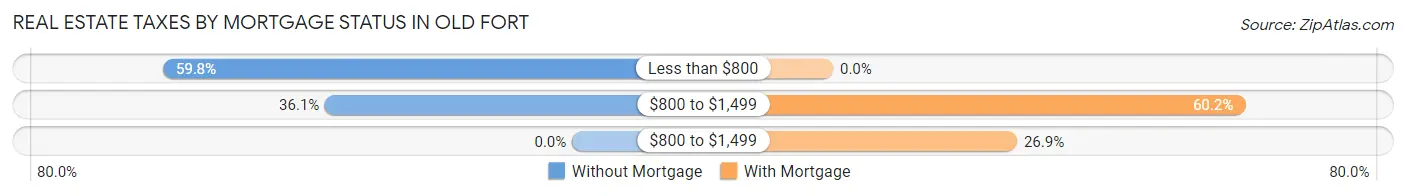
| Property Taxes | Without Mortgage | With Mortgage |
| Less than $800 | 58 (59.8%) | 0 (0.0%) |
| $800 to $1,499 | 35 (36.1%) | 56 (60.2%) |
| $800 to $1,499 | 0 (0.0%) | 25 (26.9%) |
| Total | 97 (100.0%) | 93 (100.0%) |
Health & Disability in Old Fort
Health Insurance Coverage by Age in Old Fort
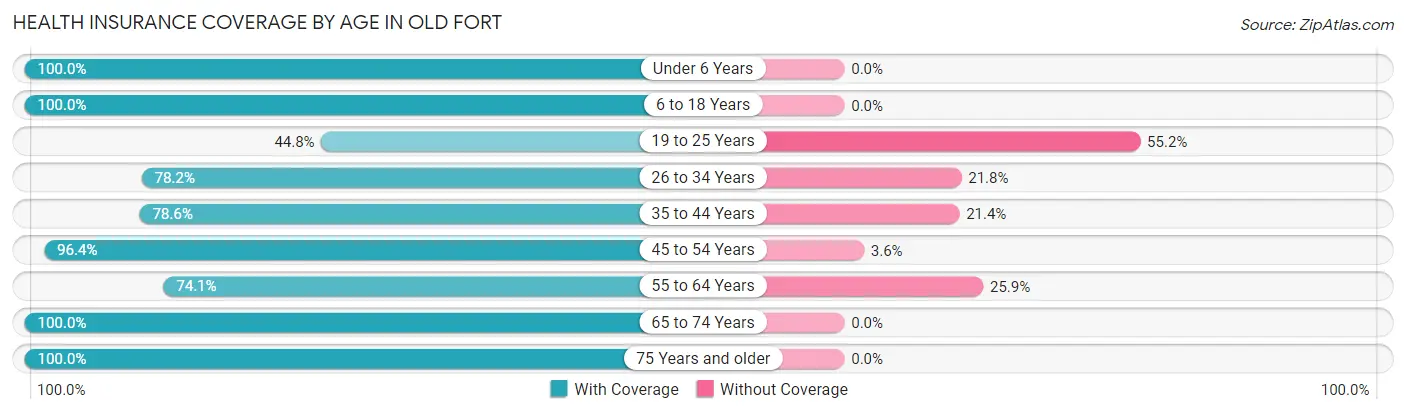
| Age Bracket | With Coverage | Without Coverage |
| Under 6 Years | 25 (100.0%) | 0 (0.0%) |
| 6 to 18 Years | 92 (100.0%) | 0 (0.0%) |
| 19 to 25 Years | 13 (44.8%) | 16 (55.2%) |
| 26 to 34 Years | 43 (78.2%) | 12 (21.8%) |
| 35 to 44 Years | 44 (78.6%) | 12 (21.4%) |
| 45 to 54 Years | 106 (96.4%) | 4 (3.6%) |
| 55 to 64 Years | 63 (74.1%) | 22 (25.9%) |
| 65 to 74 Years | 84 (100.0%) | 0 (0.0%) |
| 75 Years and older | 122 (100.0%) | 0 (0.0%) |
| Total | 592 (90.0%) | 66 (10.0%) |
Health Insurance Coverage by Citizenship Status in Old Fort
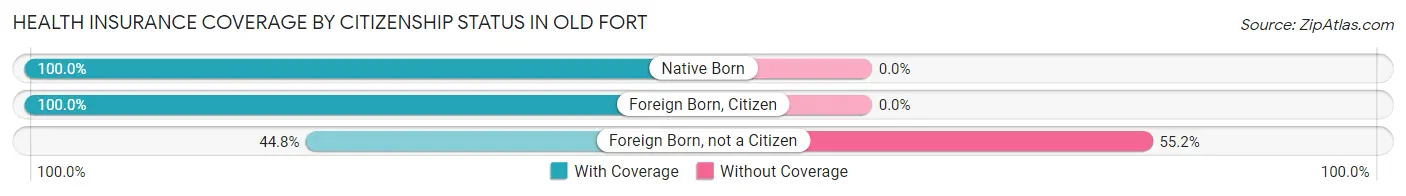
| Citizenship Status | With Coverage | Without Coverage |
| Native Born | 25 (100.0%) | 0 (0.0%) |
| Foreign Born, Citizen | 92 (100.0%) | 0 (0.0%) |
| Foreign Born, not a Citizen | 13 (44.8%) | 16 (55.2%) |
Health Insurance Coverage by Household Income in Old Fort
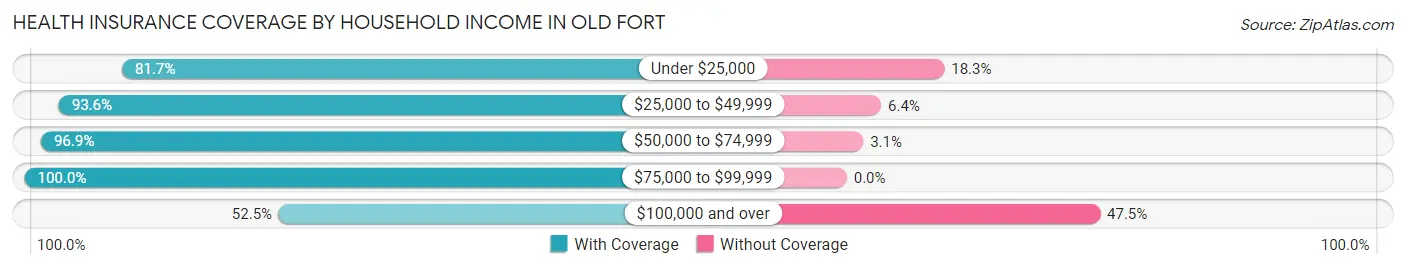
| Household Income | With Coverage | Without Coverage |
| Under $25,000 | 85 (81.7%) | 19 (18.3%) |
| $25,000 to $49,999 | 175 (93.6%) | 12 (6.4%) |
| $50,000 to $74,999 | 220 (96.9%) | 7 (3.1%) |
| $75,000 to $99,999 | 68 (100.0%) | 0 (0.0%) |
| $100,000 and over | 31 (52.5%) | 28 (47.5%) |
Public vs Private Health Insurance Coverage by Age in Old Fort
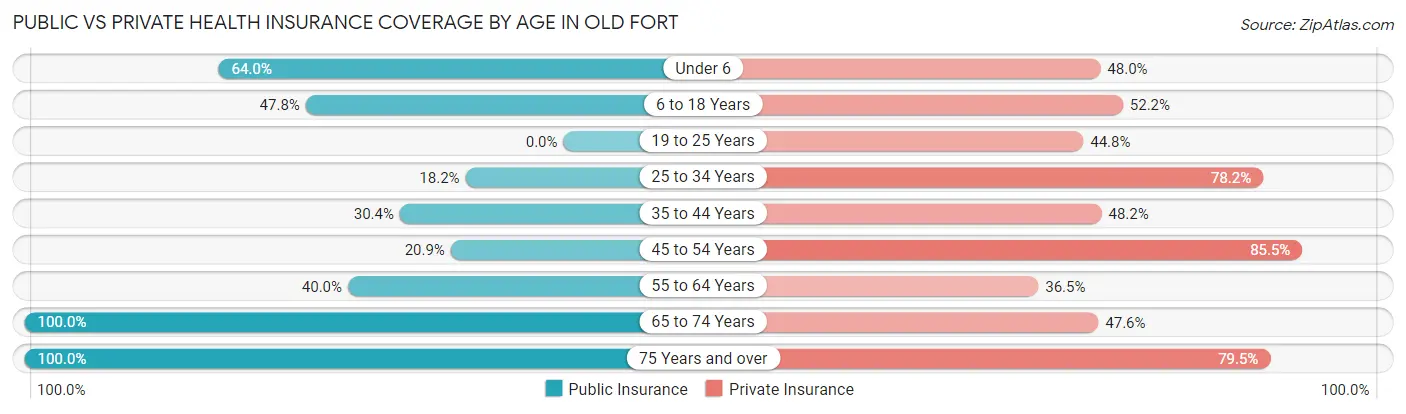
| Age Bracket | Public Insurance | Private Insurance |
| Under 6 | 16 (64.0%) | 12 (48.0%) |
| 6 to 18 Years | 44 (47.8%) | 48 (52.2%) |
| 19 to 25 Years | 0 (0.0%) | 13 (44.8%) |
| 25 to 34 Years | 10 (18.2%) | 43 (78.2%) |
| 35 to 44 Years | 17 (30.4%) | 27 (48.2%) |
| 45 to 54 Years | 23 (20.9%) | 94 (85.5%) |
| 55 to 64 Years | 34 (40.0%) | 31 (36.5%) |
| 65 to 74 Years | 84 (100.0%) | 40 (47.6%) |
| 75 Years and over | 122 (100.0%) | 97 (79.5%) |
| Total | 350 (53.2%) | 405 (61.6%) |
Disability Status by Sex by Age in Old Fort
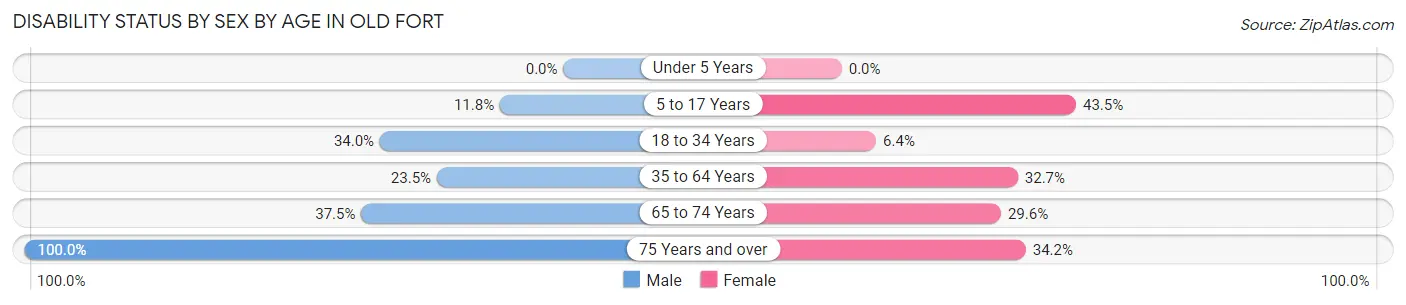
| Age Bracket | Male | Female |
| Under 5 Years | 0 (0.0%) | 0 (0.0%) |
| 5 to 17 Years | 8 (11.8%) | 10 (43.5%) |
| 18 to 34 Years | 16 (34.0%) | 3 (6.4%) |
| 35 to 64 Years | 23 (23.5%) | 50 (32.7%) |
| 65 to 74 Years | 15 (37.5%) | 13 (29.5%) |
| 75 Years and over | 40 (100.0%) | 28 (34.2%) |
Disability Class by Sex by Age in Old Fort
Disability Class: Hearing Difficulty
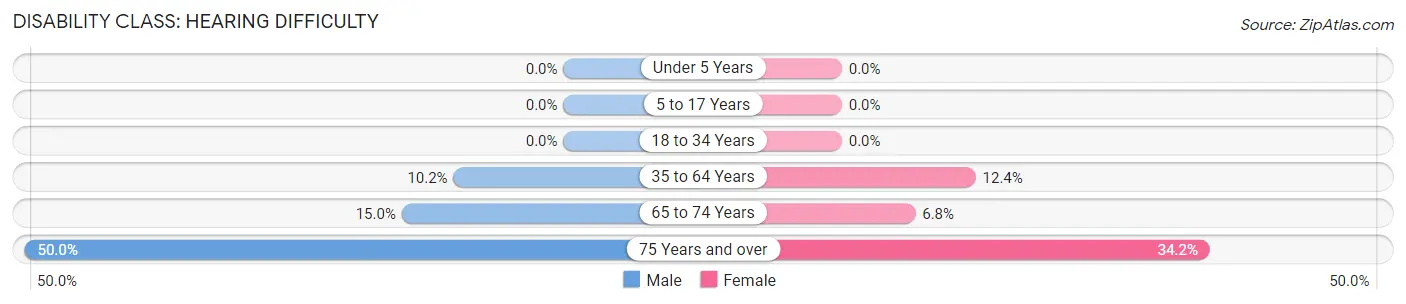
| Age Bracket | Male | Female |
| Under 5 Years | 0 (0.0%) | 0 (0.0%) |
| 5 to 17 Years | 0 (0.0%) | 0 (0.0%) |
| 18 to 34 Years | 0 (0.0%) | 0 (0.0%) |
| 35 to 64 Years | 10 (10.2%) | 19 (12.4%) |
| 65 to 74 Years | 6 (15.0%) | 3 (6.8%) |
| 75 Years and over | 20 (50.0%) | 28 (34.2%) |
Disability Class: Vision Difficulty
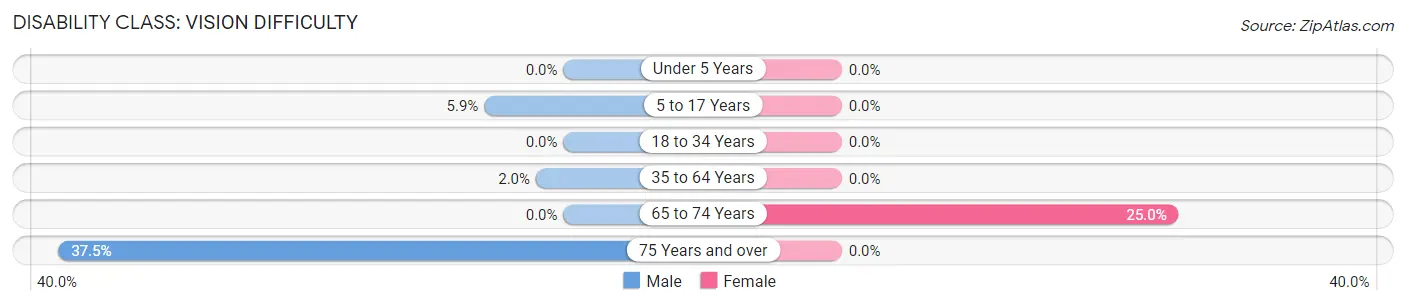
| Age Bracket | Male | Female |
| Under 5 Years | 0 (0.0%) | 0 (0.0%) |
| 5 to 17 Years | 4 (5.9%) | 0 (0.0%) |
| 18 to 34 Years | 0 (0.0%) | 0 (0.0%) |
| 35 to 64 Years | 2 (2.0%) | 0 (0.0%) |
| 65 to 74 Years | 0 (0.0%) | 11 (25.0%) |
| 75 Years and over | 15 (37.5%) | 0 (0.0%) |
Disability Class: Cognitive Difficulty
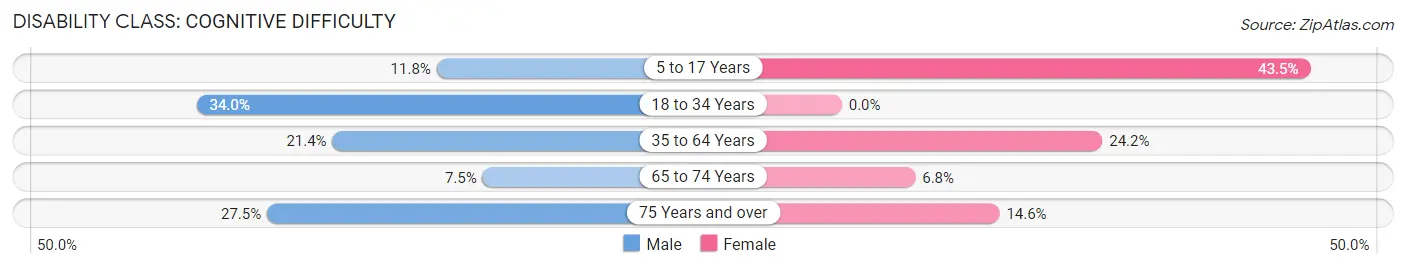
| Age Bracket | Male | Female |
| 5 to 17 Years | 8 (11.8%) | 10 (43.5%) |
| 18 to 34 Years | 16 (34.0%) | 0 (0.0%) |
| 35 to 64 Years | 21 (21.4%) | 37 (24.2%) |
| 65 to 74 Years | 3 (7.5%) | 3 (6.8%) |
| 75 Years and over | 11 (27.5%) | 12 (14.6%) |
Disability Class: Ambulatory Difficulty
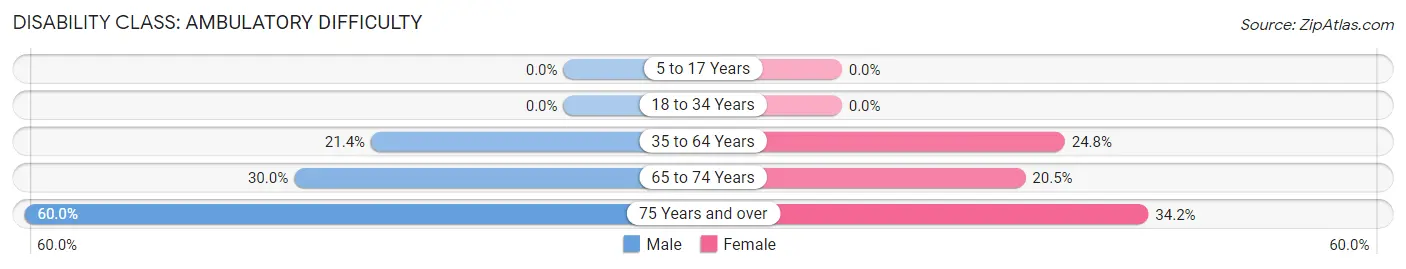
| Age Bracket | Male | Female |
| 5 to 17 Years | 0 (0.0%) | 0 (0.0%) |
| 18 to 34 Years | 0 (0.0%) | 0 (0.0%) |
| 35 to 64 Years | 21 (21.4%) | 38 (24.8%) |
| 65 to 74 Years | 12 (30.0%) | 9 (20.4%) |
| 75 Years and over | 24 (60.0%) | 28 (34.2%) |
Disability Class: Self-Care Difficulty
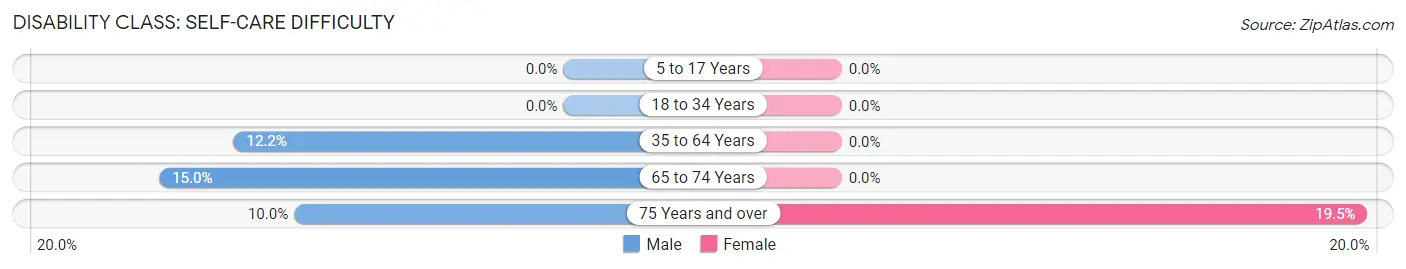
| Age Bracket | Male | Female |
| 5 to 17 Years | 0 (0.0%) | 0 (0.0%) |
| 18 to 34 Years | 0 (0.0%) | 0 (0.0%) |
| 35 to 64 Years | 12 (12.2%) | 0 (0.0%) |
| 65 to 74 Years | 6 (15.0%) | 0 (0.0%) |
| 75 Years and over | 4 (10.0%) | 16 (19.5%) |
Technology Access in Old Fort
Computing Device Access in Old Fort
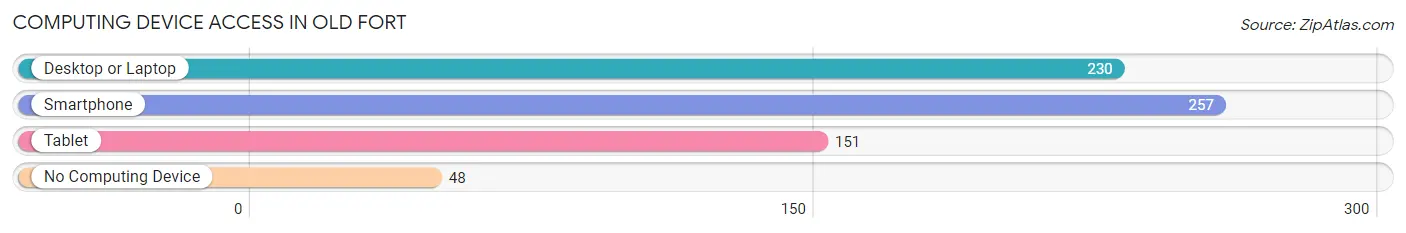
| Device Type | # Households | % Households |
| Desktop or Laptop | 230 | 69.5% |
| Smartphone | 257 | 77.6% |
| Tablet | 151 | 45.6% |
| No Computing Device | 48 | 14.5% |
| Total | 331 | 100.0% |
Internet Access in Old Fort
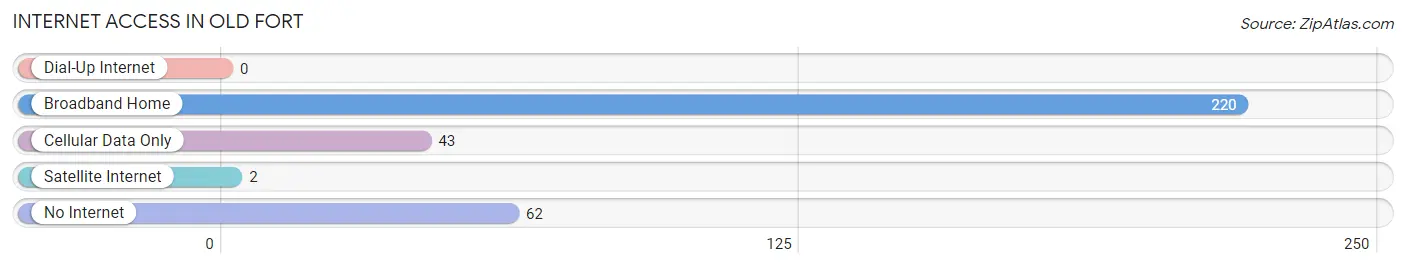
| Internet Type | # Households | % Households |
| Dial-Up Internet | 0 | 0.0% |
| Broadband Home | 220 | 66.5% |
| Cellular Data Only | 43 | 13.0% |
| Satellite Internet | 2 | 0.6% |
| No Internet | 62 | 18.7% |
| Total | 331 | 100.0% |
Old Fort Summary
Fort, North Carolina is a small town located in McDowell County in the western part of the state. It is situated in the foothills of the Blue Ridge Mountains and is part of the Hickory-Lenoir-Morganton Metropolitan Statistical Area. The town was founded in 1776 and is the oldest settlement in the county. It is named after the old fort that was built in the area during the Revolutionary War.
Geography
Fort is located in the foothills of the Blue Ridge Mountains in western North Carolina. It is situated in the Catawba River Valley and is surrounded by the Pisgah National Forest. The town is located at an elevation of 1,400 feet and has a total area of 1.2 square miles. The climate is humid subtropical with hot summers and mild winters.
Economy
The economy of Fort is largely based on agriculture and tourism. The town is home to several farms that produce a variety of crops, including corn, soybeans, and tobacco. The town is also home to several small businesses, including restaurants, shops, and a winery. Tourism is also an important part of the local economy, with visitors coming to the area to enjoy the natural beauty of the Blue Ridge Mountains.
Demographics
As of the 2010 census, the population of Fort was 1,845. The racial makeup of the town was 94.3% White, 2.3% African American, 0.3% Native American, 0.3% Asian, 0.1% Pacific Islander, and 2.6% from other races. The median household income was $30,938 and the median family income was $37,813. The per capita income was $17,845.
History
Fort was founded in 1776 by settlers from Virginia and Pennsylvania. The town was named after the old fort that was built in the area during the Revolutionary War. The fort was used to protect the settlers from Native American attacks. The town was incorporated in 1891 and has remained relatively unchanged since then.
In the late 19th century, Fort became a popular tourist destination due to its proximity to the Blue Ridge Mountains. The town was home to several resorts and hotels, as well as a number of summer homes. The town also became a popular destination for outdoor activities, such as fishing, hunting, and camping.
In the early 20th century, Fort experienced a period of economic decline due to the Great Depression and the decline of the railroad industry. The town was able to recover in the 1950s and 1960s due to the growth of the tourism industry. Today, Fort is a popular destination for outdoor activities and is home to several small businesses.
Common Questions
What is Per Capita Income in Old Fort?
Per Capita income in Old Fort is $24,756.
What is the Median Family Income in Old Fort?
Median Family Income in Old Fort is $50,927.
What is the Median Household income in Old Fort?
Median Household Income in Old Fort is $41,125.
What is Income or Wage Gap in Old Fort?
Income or Wage Gap in Old Fort is 13.0%.
Women in Old Fort earn 87.0 cents for every dollar earned by a man.
What is Family Income Deficit in Old Fort?
Family Income Deficit in Old Fort is $13,875.
Families that are below poverty line in Old Fort earn $13,875 less on average than the poverty threshold level.
What is Inequality or Gini Index in Old Fort?
Inequality or Gini Index in Old Fort is 0.37.
What is the Total Population of Old Fort?
Total Population of Old Fort is 658.
What is the Total Male Population of Old Fort?
Total Male Population of Old Fort is 296.
What is the Total Female Population of Old Fort?
Total Female Population of Old Fort is 362.
What is the Ratio of Males per 100 Females in Old Fort?
There are 81.77 Males per 100 Females in Old Fort.
What is the Ratio of Females per 100 Males in Old Fort?
There are 122.30 Females per 100 Males in Old Fort.
What is the Median Population Age in Old Fort?
Median Population Age in Old Fort is 52.4 Years.
What is the Average Family Size in Old Fort
Average Family Size in Old Fort is 2.5 People.
What is the Average Household Size in Old Fort
Average Household Size in Old Fort is 1.9 People.
How Large is the Labor Force in Old Fort?
There are 288 People in the Labor Forcein in Old Fort.
What is the Percentage of People in the Labor Force in Old Fort?
52.3% of People are in the Labor Force in Old Fort.
What is the Unemployment Rate in Old Fort?
Unemployment Rate in Old Fort is 5.6%.