Cashiers, NC Map & Demographics
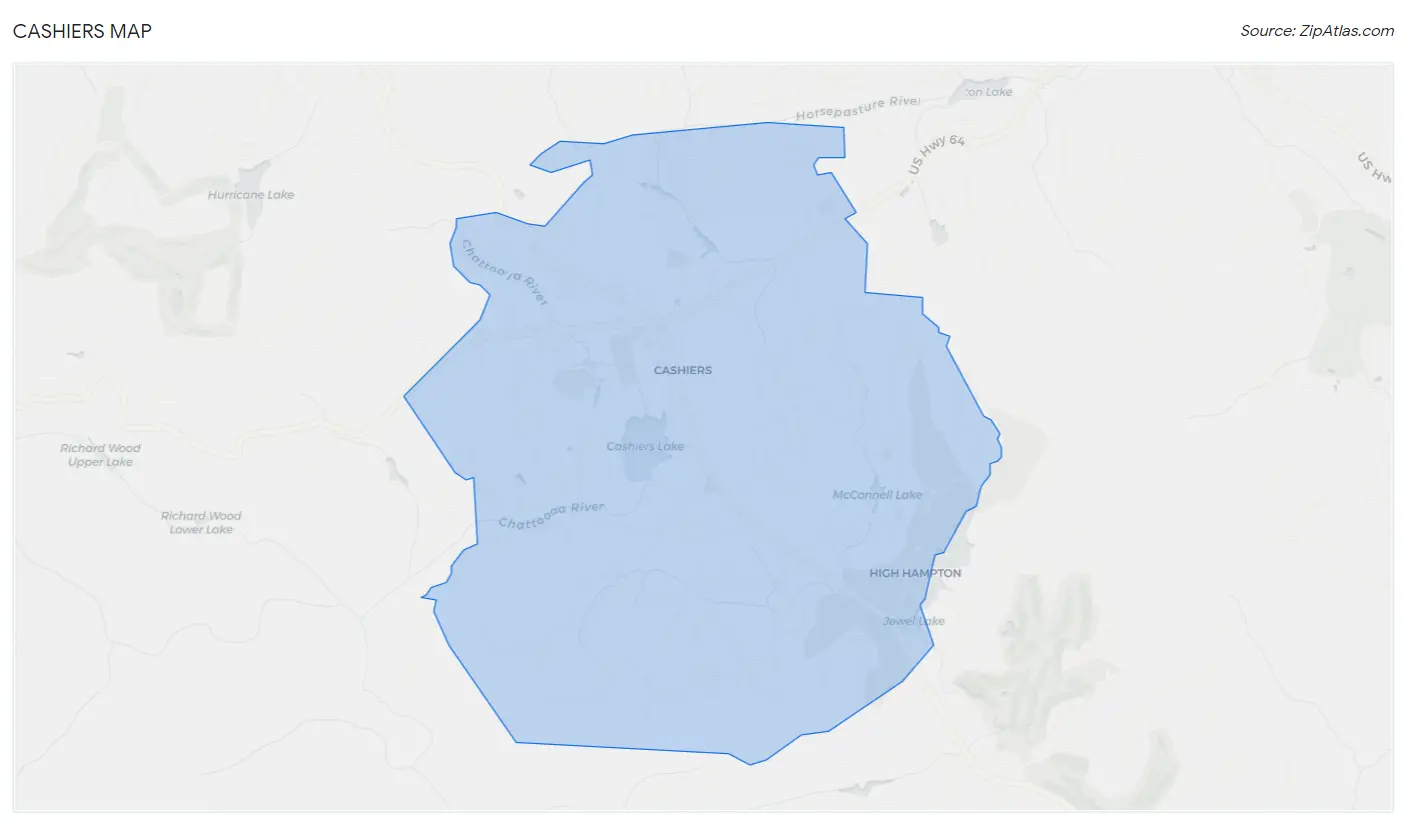
Cashiers Map
Cashiers Overview
$54,735
PER CAPITA INCOME
$78,250
AVG FAMILY INCOME
$78,150
AVG HOUSEHOLD INCOME
0.39
INEQUALITY / GINI INDEX
752
TOTAL POPULATION
365
MALE POPULATION
387
FEMALE POPULATION
94.32
MALES / 100 FEMALES
106.03
FEMALES / 100 MALES
46.9
MEDIAN AGE
2.6
AVG FAMILY SIZE
2.1
AVG HOUSEHOLD SIZE
480
LABOR FORCE [ PEOPLE ]
76.8%
PERCENT IN LABOR FORCE
Cashiers Zip Codes
Cashiers Area Codes
Income in Cashiers
Income Overview in Cashiers
Per Capita Income in Cashiers is $54,735, while median incomes of families and households are $78,250 and $78,150 respectively.
| Characteristic | Number | Measure |
| Per Capita Income | 752 | $54,735 |
| Median Family Income | 255 | $78,250 |
| Mean Family Income | 255 | $133,218 |
| Median Household Income | 355 | $78,150 |
| Mean Household Income | 355 | $117,760 |
| Income Deficit | 255 | $0 |
| Wage / Income Gap (%) | 752 | 0.00% |
| Wage / Income Gap ($) | 752 | 100.00¢ per $1 |
| Gini / Inequality Index | 752 | 0.39 |
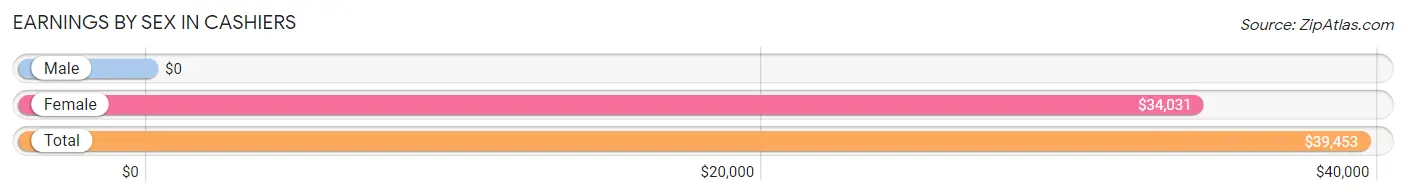
Earnings by Sex in Cashiers
| Sex | Number | Average Earnings |
| Male | 241 (50.2%) | $0 |
| Female | 239 (49.8%) | $34,031 |
| Total | 480 (100.0%) | $39,453 |
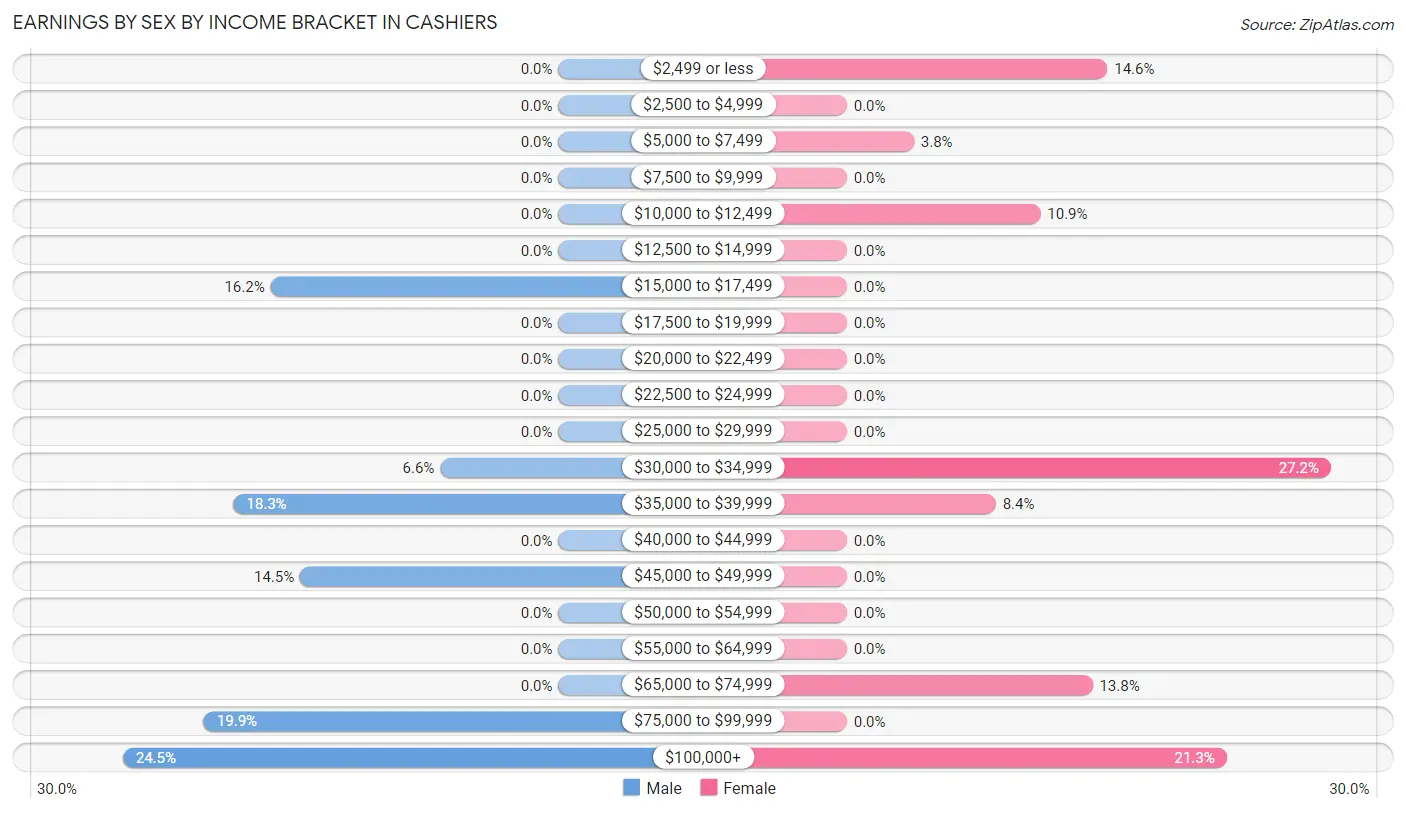
Earnings by Sex by Income Bracket in Cashiers
The most common earnings brackets in Cashiers are $100,000+ for men (59 | 24.5%) and $30,000 to $34,999 for women (65 | 27.2%).
| Income | Male | Female |
| $2,499 or less | 0 (0.0%) | 35 (14.6%) |
| $2,500 to $4,999 | 0 (0.0%) | 0 (0.0%) |
| $5,000 to $7,499 | 0 (0.0%) | 9 (3.8%) |
| $7,500 to $9,999 | 0 (0.0%) | 0 (0.0%) |
| $10,000 to $12,499 | 0 (0.0%) | 26 (10.9%) |
| $12,500 to $14,999 | 0 (0.0%) | 0 (0.0%) |
| $15,000 to $17,499 | 39 (16.2%) | 0 (0.0%) |
| $17,500 to $19,999 | 0 (0.0%) | 0 (0.0%) |
| $20,000 to $22,499 | 0 (0.0%) | 0 (0.0%) |
| $22,500 to $24,999 | 0 (0.0%) | 0 (0.0%) |
| $25,000 to $29,999 | 0 (0.0%) | 0 (0.0%) |
| $30,000 to $34,999 | 16 (6.6%) | 65 (27.2%) |
| $35,000 to $39,999 | 44 (18.3%) | 20 (8.4%) |
| $40,000 to $44,999 | 0 (0.0%) | 0 (0.0%) |
| $45,000 to $49,999 | 35 (14.5%) | 0 (0.0%) |
| $50,000 to $54,999 | 0 (0.0%) | 0 (0.0%) |
| $55,000 to $64,999 | 0 (0.0%) | 0 (0.0%) |
| $65,000 to $74,999 | 0 (0.0%) | 33 (13.8%) |
| $75,000 to $99,999 | 48 (19.9%) | 0 (0.0%) |
| $100,000+ | 59 (24.5%) | 51 (21.3%) |
| Total | 241 (100.0%) | 239 (100.0%) |
Earnings by Sex by Educational Attainment in Cashiers
| Educational Attainment | Male Income | Female Income |
| Less than High School | - | - |
| High School Diploma | - | - |
| College or Associate's Degree | - | - |
| Bachelor's Degree | - | - |
| Graduate Degree | - | - |
| Total | - | - |
Family Income in Cashiers
Family Income Brackets in Cashiers
According to the Cashiers family income data, there are 86 families falling into the $50,000 to $74,999 income range, which is the most common income bracket and makes up 33.7% of all families.
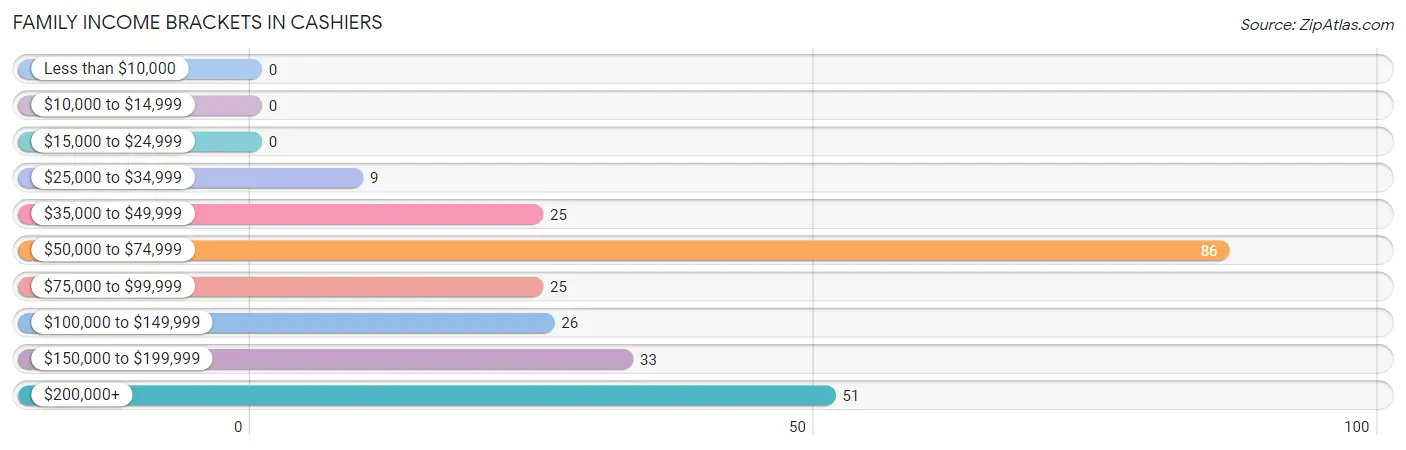
| Income Bracket | # Families | % Families |
| Less than $10,000 | 0 | 0.0% |
| $10,000 to $14,999 | 0 | 0.0% |
| $15,000 to $24,999 | 0 | 0.0% |
| $25,000 to $34,999 | 9 | 3.5% |
| $35,000 to $49,999 | 25 | 9.8% |
| $50,000 to $74,999 | 86 | 33.7% |
| $75,000 to $99,999 | 25 | 9.8% |
| $100,000 to $149,999 | 26 | 10.2% |
| $150,000 to $199,999 | 33 | 12.9% |
| $200,000+ | 51 | 20.0% |
Family Income by Famaliy Size in Cashiers
2-person families (166 | 65.1%) account for the highest median family income in Cashiers with $155,076 per family, while 2-person families (166 | 65.1%) have the highest median income of $77,538 per family member.
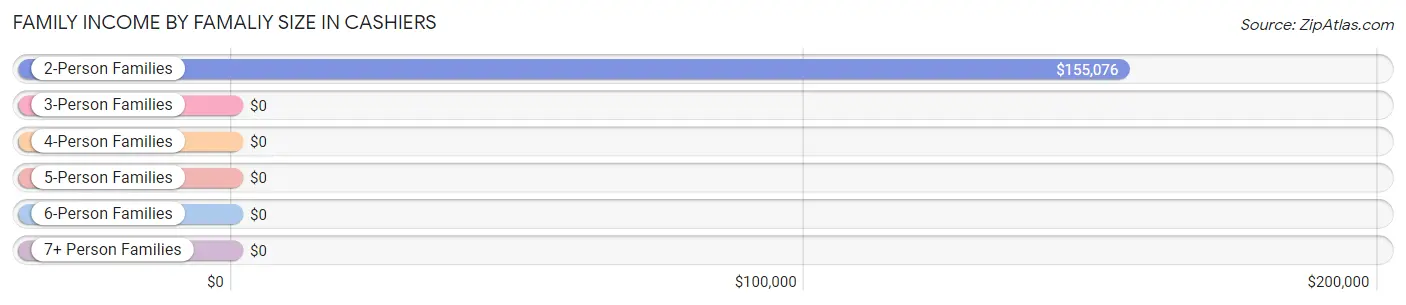
| Income Bracket | # Families | Median Income |
| 2-Person Families | 166 (65.1%) | $155,076 |
| 3-Person Families | 44 (17.2%) | $0 |
| 4-Person Families | 45 (17.6%) | $0 |
| 5-Person Families | 0 (0.0%) | $0 |
| 6-Person Families | 0 (0.0%) | $0 |
| 7+ Person Families | 0 (0.0%) | $0 |
| Total | 255 (100.0%) | $78,250 |
Family Income by Number of Earners in Cashiers
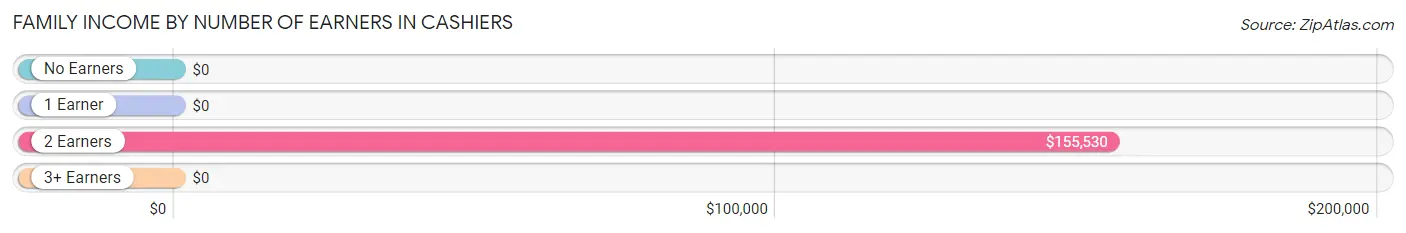
| Number of Earners | # Families | Median Income |
| No Earners | 47 (18.4%) | $0 |
| 1 Earner | 29 (11.4%) | $0 |
| 2 Earners | 154 (60.4%) | $155,530 |
| 3+ Earners | 25 (9.8%) | $0 |
| Total | 255 (100.0%) | $78,250 |
Household Income in Cashiers
Household Income Brackets in Cashiers
With 86 households falling in the category, the $50,000 to $74,999 income range is the most frequent in Cashiers, accounting for 24.2% of all households.
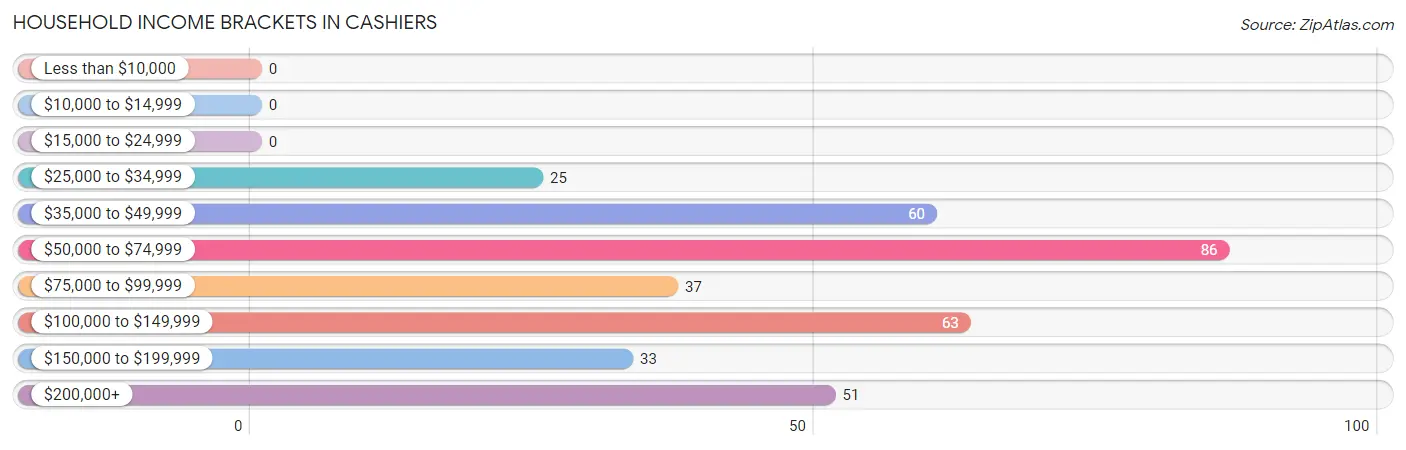
| Income Bracket | # Households | % Households |
| Less than $10,000 | 0 | 0.0% |
| $10,000 to $14,999 | 0 | 0.0% |
| $15,000 to $24,999 | 0 | 0.0% |
| $25,000 to $34,999 | 25 | 7.0% |
| $35,000 to $49,999 | 60 | 16.9% |
| $50,000 to $74,999 | 86 | 24.2% |
| $75,000 to $99,999 | 37 | 10.4% |
| $100,000 to $149,999 | 63 | 17.7% |
| $150,000 to $199,999 | 33 | 9.3% |
| $200,000+ | 51 | 14.4% |
Household Income by Householder Age in Cashiers
The median household income in Cashiers is $78,150, with the highest median household income of $105,240 found in the 65+ years age bracket for the primary householder. A total of 99 households (27.9%) fall into this category.
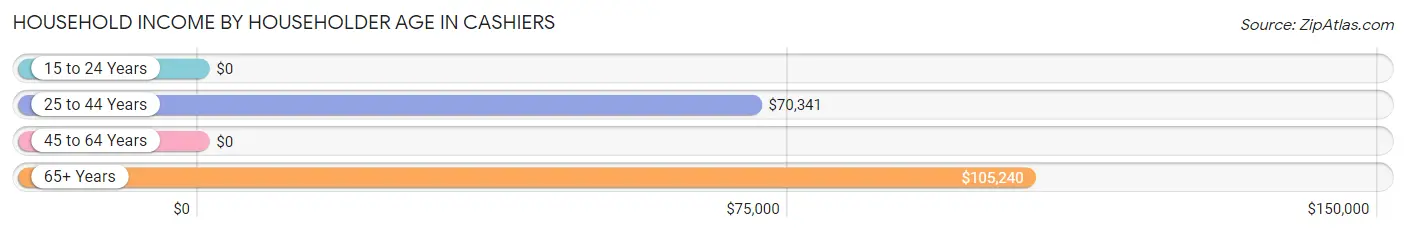
| Income Bracket | # Households | Median Income |
| 15 to 24 Years | 0 (0.0%) | $0 |
| 25 to 44 Years | 122 (34.4%) | $70,341 |
| 45 to 64 Years | 134 (37.8%) | $0 |
| 65+ Years | 99 (27.9%) | $105,240 |
| Total | 355 (100.0%) | $78,150 |
Poverty in Cashiers
Income Below Poverty by Sex and Age in Cashiers
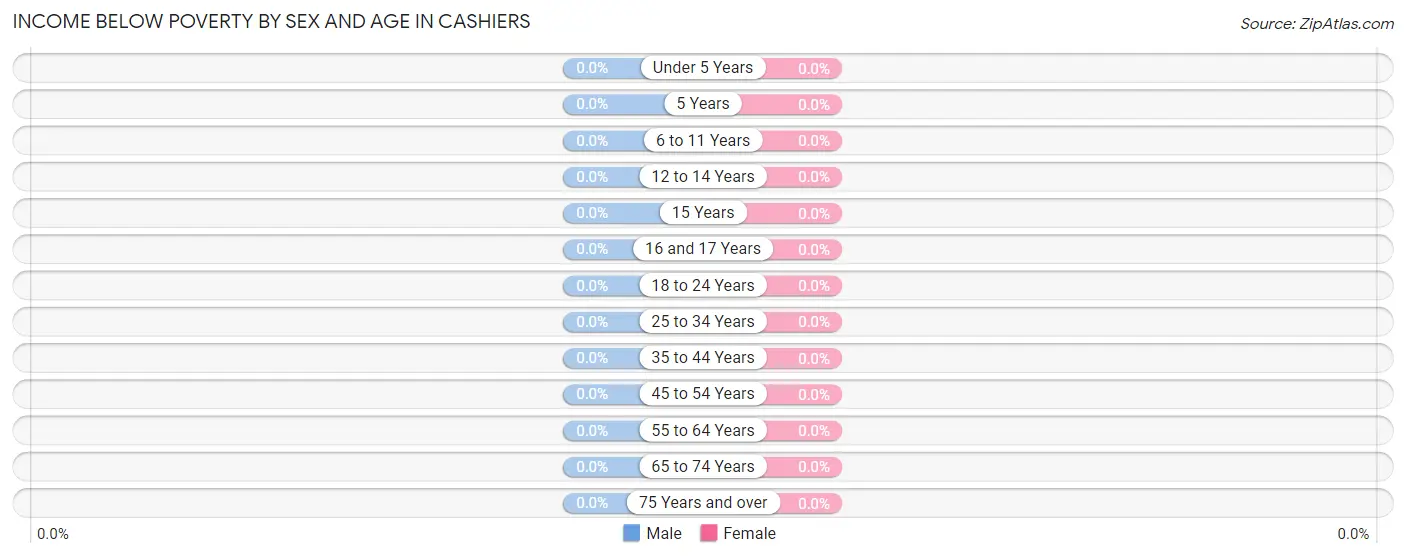
| Age Bracket | Male | Female |
| Under 5 Years | 0 (0.0%) | 0 (0.0%) |
| 5 Years | 0 (0.0%) | 0 (0.0%) |
| 6 to 11 Years | 0 (0.0%) | 0 (0.0%) |
| 12 to 14 Years | 0 (0.0%) | 0 (0.0%) |
| 15 Years | 0 (0.0%) | 0 (0.0%) |
| 16 and 17 Years | 0 (0.0%) | 0 (0.0%) |
| 18 to 24 Years | 0 (0.0%) | 0 (0.0%) |
| 25 to 34 Years | 0 (0.0%) | 0 (0.0%) |
| 35 to 44 Years | 0 (0.0%) | 0 (0.0%) |
| 45 to 54 Years | 0 (0.0%) | 0 (0.0%) |
| 55 to 64 Years | 0 (0.0%) | 0 (0.0%) |
| 65 to 74 Years | 0 (0.0%) | 0 (0.0%) |
| 75 Years and over | 0 (0.0%) | 0 (0.0%) |
| Total | 0 (0.0%) | 0 (0.0%) |
Income Above Poverty by Sex and Age in Cashiers
According to the poverty statistics in Cashiers, males aged 6 to 11 years and females aged under 5 years are the age groups that are most secure financially, with 100.0% of males and 100.0% of females in these age groups living above the poverty line.
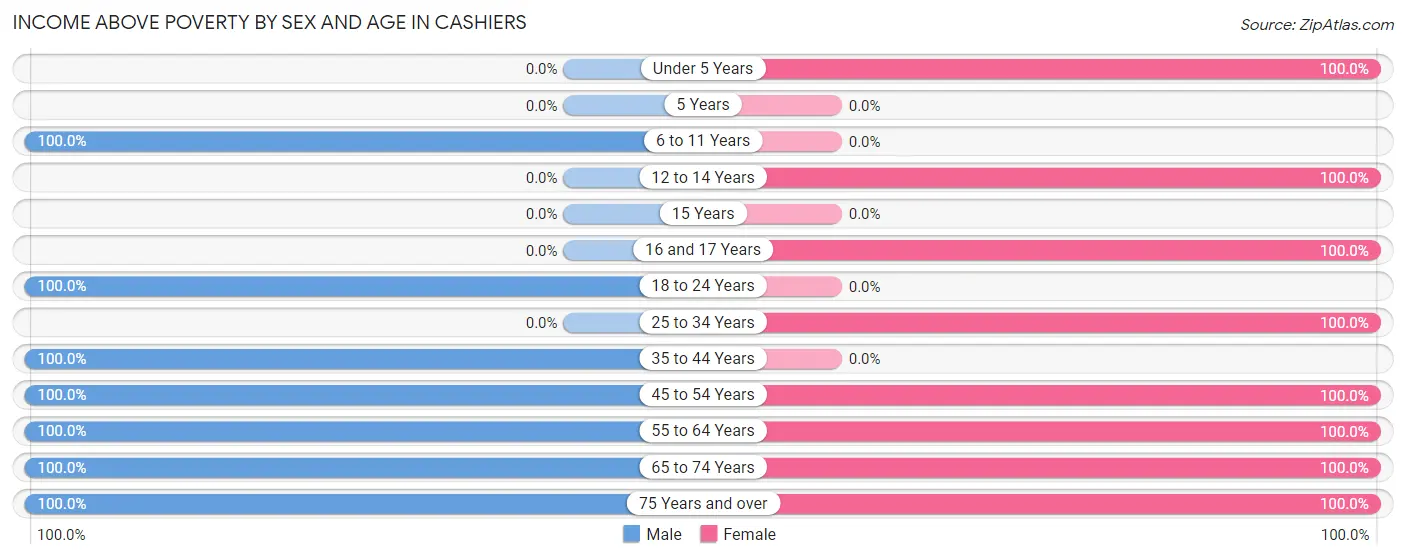
| Age Bracket | Male | Female |
| Under 5 Years | 0 (0.0%) | 26 (100.0%) |
| 5 Years | 0 (0.0%) | 0 (0.0%) |
| 6 to 11 Years | 51 (100.0%) | 0 (0.0%) |
| 12 to 14 Years | 0 (0.0%) | 50 (100.0%) |
| 15 Years | 0 (0.0%) | 0 (0.0%) |
| 16 and 17 Years | 0 (0.0%) | 35 (100.0%) |
| 18 to 24 Years | 12 (100.0%) | 0 (0.0%) |
| 25 to 34 Years | 0 (0.0%) | 60 (100.0%) |
| 35 to 44 Years | 119 (100.0%) | 0 (0.0%) |
| 45 to 54 Years | 16 (100.0%) | 25 (100.0%) |
| 55 to 64 Years | 84 (100.0%) | 93 (100.0%) |
| 65 to 74 Years | 27 (100.0%) | 26 (100.0%) |
| 75 Years and over | 56 (100.0%) | 72 (100.0%) |
| Total | 365 (100.0%) | 387 (100.0%) |
Income Below Poverty Among Married-Couple Families in Cashiers
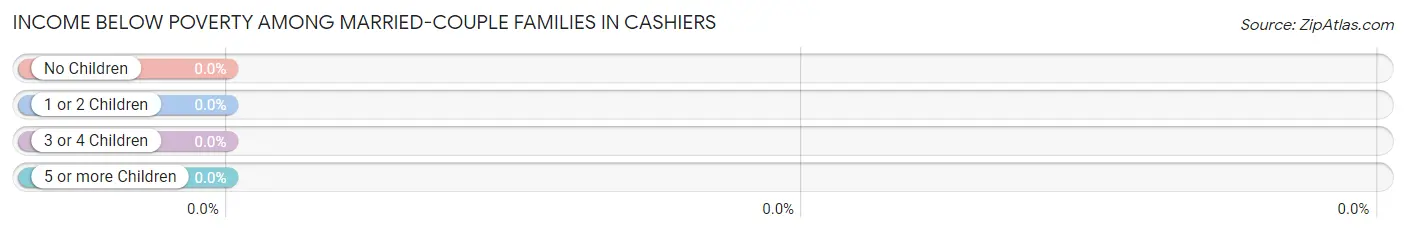
| Children | Above Poverty | Below Poverty |
| No Children | 166 (100.0%) | 0 (0.0%) |
| 1 or 2 Children | 64 (100.0%) | 0 (0.0%) |
| 3 or 4 Children | 0 (0.0%) | 0 (0.0%) |
| 5 or more Children | 0 (0.0%) | 0 (0.0%) |
| Total | 230 (100.0%) | 0 (0.0%) |
Income Below Poverty Among Single-Parent Households in Cashiers
| Children | Single Father | Single Mother |
| No Children | 0 (0.0%) | 0 (0.0%) |
| 1 or 2 Children | 0 (0.0%) | 0 (0.0%) |
| 3 or 4 Children | 0 (0.0%) | 0 (0.0%) |
| 5 or more Children | 0 (0.0%) | 0 (0.0%) |
| Total | 0 (0.0%) | 0 (0.0%) |
Income Below Poverty Among Married-Couple vs Single-Parent Households in Cashiers
| Children | Married-Couple Families | Single-Parent Households |
| No Children | 0 (0.0%) | 0 (0.0%) |
| 1 or 2 Children | 0 (0.0%) | 0 (0.0%) |
| 3 or 4 Children | 0 (0.0%) | 0 (0.0%) |
| 5 or more Children | 0 (0.0%) | 0 (0.0%) |
| Total | 0 (0.0%) | 0 (0.0%) |
Race in Cashiers
The most populous races in Cashiers are White / Caucasian (535 | 71.1%), Two or more Races (217 | 28.9%), and Hispanic or Latino (123 | 16.4%).
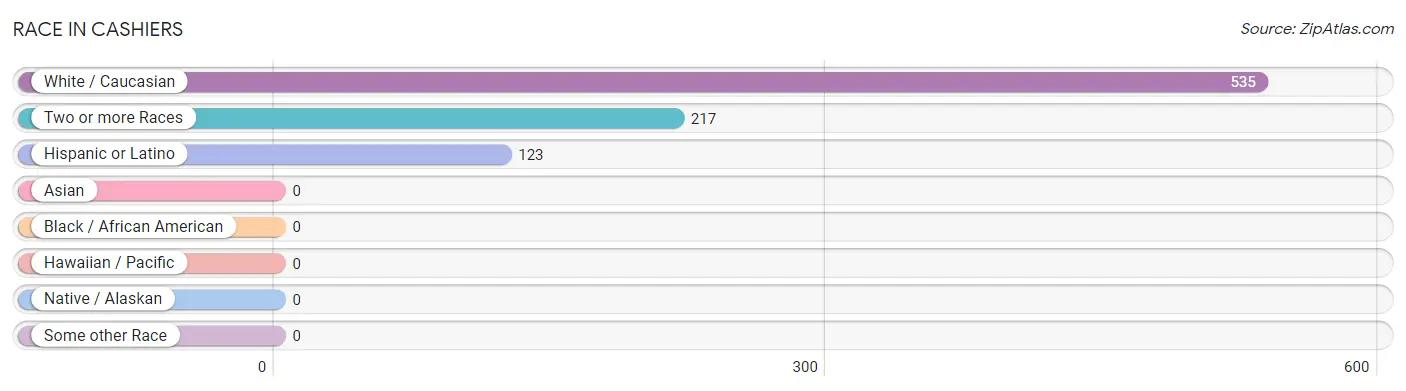
| Race | # Population | % Population |
| Asian | 0 | 0.0% |
| Black / African American | 0 | 0.0% |
| Hawaiian / Pacific | 0 | 0.0% |
| Hispanic or Latino | 123 | 16.4% |
| Native / Alaskan | 0 | 0.0% |
| White / Caucasian | 535 | 71.1% |
| Two or more Races | 217 | 28.9% |
| Some other Race | 0 | 0.0% |
| Total | 752 | 100.0% |
Ancestry in Cashiers
The most populous ancestries reported in Cashiers are American (226 | 30.0%), German (189 | 25.1%), Mexican (123 | 16.4%), Scotch-Irish (84 | 11.2%), and Scottish (27 | 3.6%), together accounting for 86.3% of all Cashiers residents.
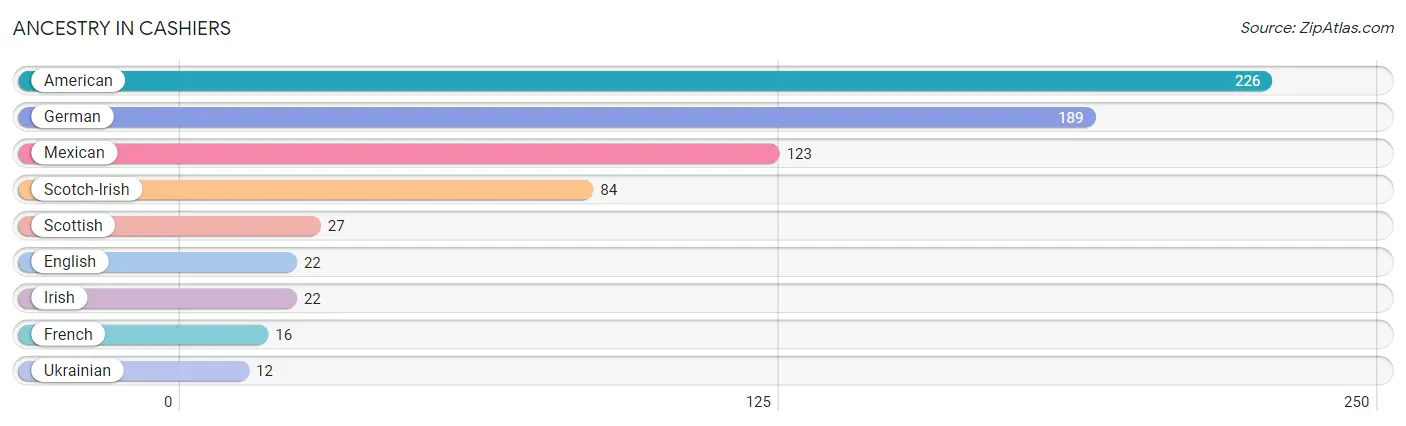
| Ancestry | # Population | % Population |
| American | 226 | 30.0% |
| English | 22 | 2.9% |
| French | 16 | 2.1% |
| German | 189 | 25.1% |
| Irish | 22 | 2.9% |
| Mexican | 123 | 16.4% |
| Scotch-Irish | 84 | 11.2% |
| Scottish | 27 | 3.6% |
| Ukrainian | 12 | 1.6% | View All 9 Rows |
Immigrants in Cashiers
The most numerous immigrant groups reported in Cashiers came from Central America (37 | 4.9%), Latin America (37 | 4.9%), Mexico (37 | 4.9%), Eastern Europe (12 | 1.6%), and Europe (12 | 1.6%), together accounting for 18.0% of all Cashiers residents.
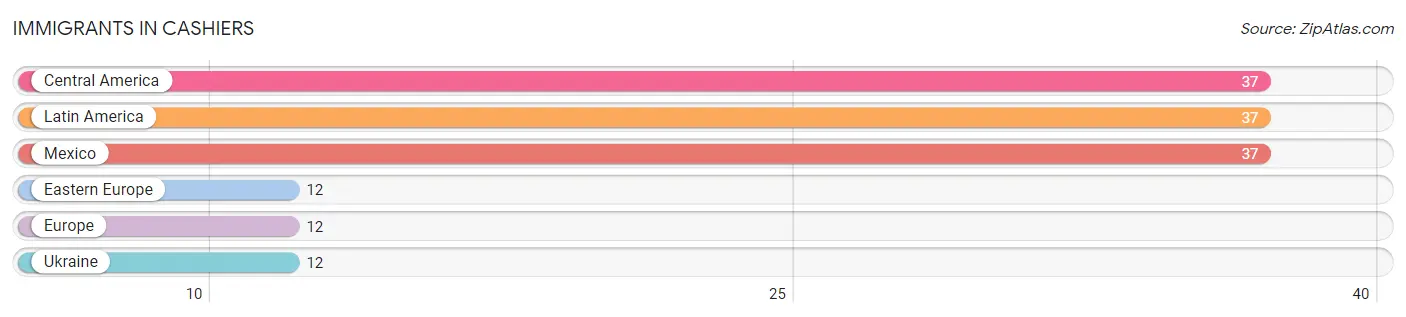
| Immigration Origin | # Population | % Population |
| Central America | 37 | 4.9% |
| Eastern Europe | 12 | 1.6% |
| Europe | 12 | 1.6% |
| Latin America | 37 | 4.9% |
| Mexico | 37 | 4.9% |
| Ukraine | 12 | 1.6% | View All 6 Rows |
Sex and Age in Cashiers
Sex and Age in Cashiers
The most populous age groups in Cashiers are 60 to 64 Years (84 | 23.0%) for men and 60 to 64 Years (93 | 24.0%) for women.
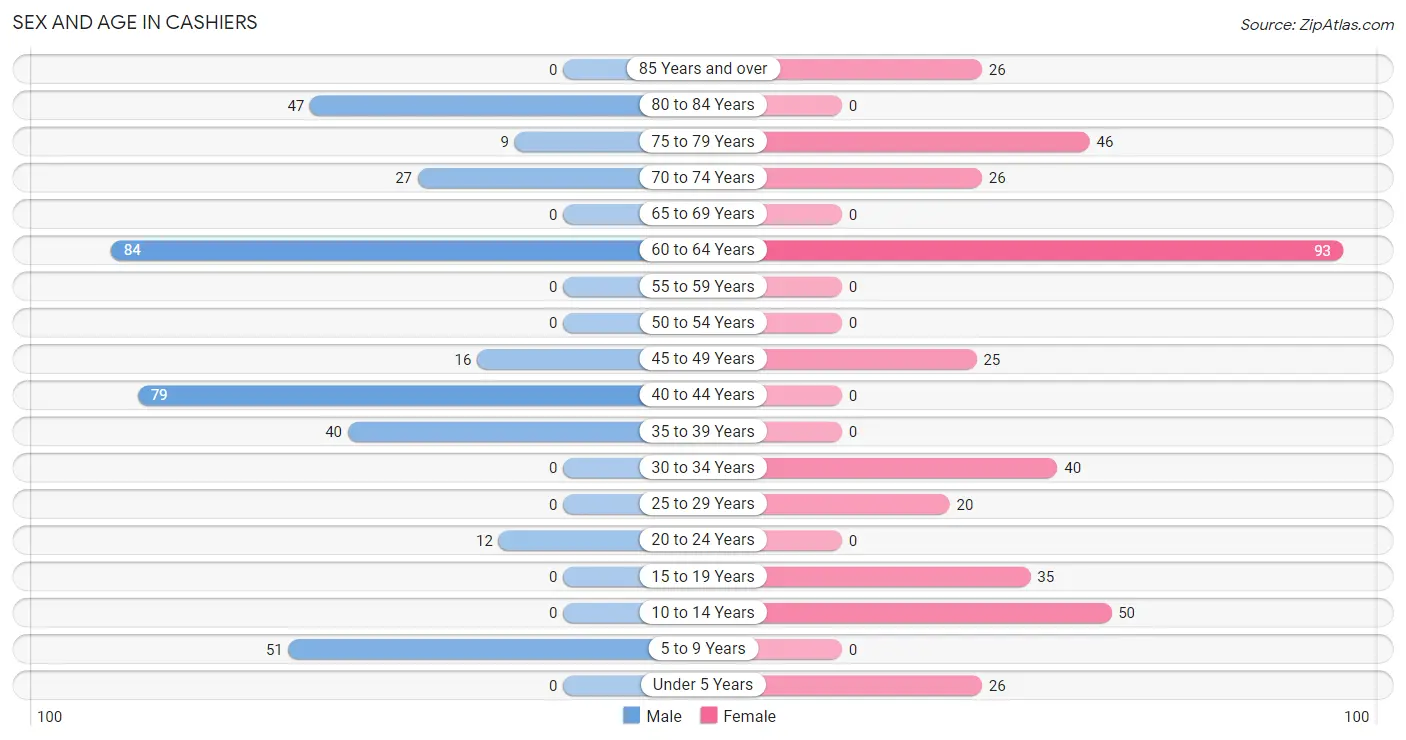
| Age Bracket | Male | Female |
| Under 5 Years | 0 (0.0%) | 26 (6.7%) |
| 5 to 9 Years | 51 (14.0%) | 0 (0.0%) |
| 10 to 14 Years | 0 (0.0%) | 50 (12.9%) |
| 15 to 19 Years | 0 (0.0%) | 35 (9.0%) |
| 20 to 24 Years | 12 (3.3%) | 0 (0.0%) |
| 25 to 29 Years | 0 (0.0%) | 20 (5.2%) |
| 30 to 34 Years | 0 (0.0%) | 40 (10.3%) |
| 35 to 39 Years | 40 (11.0%) | 0 (0.0%) |
| 40 to 44 Years | 79 (21.6%) | 0 (0.0%) |
| 45 to 49 Years | 16 (4.4%) | 25 (6.5%) |
| 50 to 54 Years | 0 (0.0%) | 0 (0.0%) |
| 55 to 59 Years | 0 (0.0%) | 0 (0.0%) |
| 60 to 64 Years | 84 (23.0%) | 93 (24.0%) |
| 65 to 69 Years | 0 (0.0%) | 0 (0.0%) |
| 70 to 74 Years | 27 (7.4%) | 26 (6.7%) |
| 75 to 79 Years | 9 (2.5%) | 46 (11.9%) |
| 80 to 84 Years | 47 (12.9%) | 0 (0.0%) |
| 85 Years and over | 0 (0.0%) | 26 (6.7%) |
| Total | 365 (100.0%) | 387 (100.0%) |
Families and Households in Cashiers
Median Family Size in Cashiers
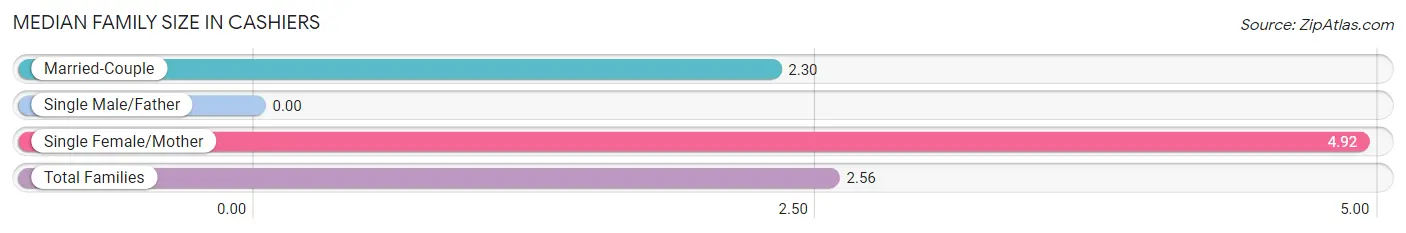
| Family Type | # Families | Family Size |
| Married-Couple | 230 (90.2%) | 2.30 |
| Single Male/Father | 0 (0.0%) | - |
| Single Female/Mother | 25 (9.8%) | 4.92 |
| Total Families | 255 (100.0%) | 2.56 |
Median Household Size in Cashiers
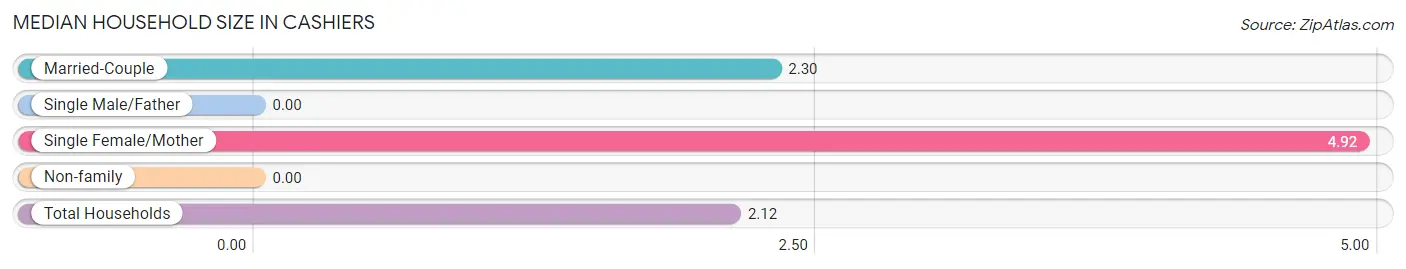
| Household Type | # Households | Household Size |
| Married-Couple | 230 (64.8%) | 2.30 |
| Single Male/Father | 0 (0.0%) | - |
| Single Female/Mother | 25 (7.0%) | 4.92 |
| Non-family | 100 (28.2%) | - |
| Total Households | 355 (100.0%) | 2.12 |
Household Size by Marriage Status in Cashiers
Out of a total of 355 households in Cashiers, 255 (71.8%) are family households, while 100 (28.2%) are nonfamily households. The most numerous type of family households are 2-person households, comprising 166, and the most common type of nonfamily households are 1-person households, comprising 100.
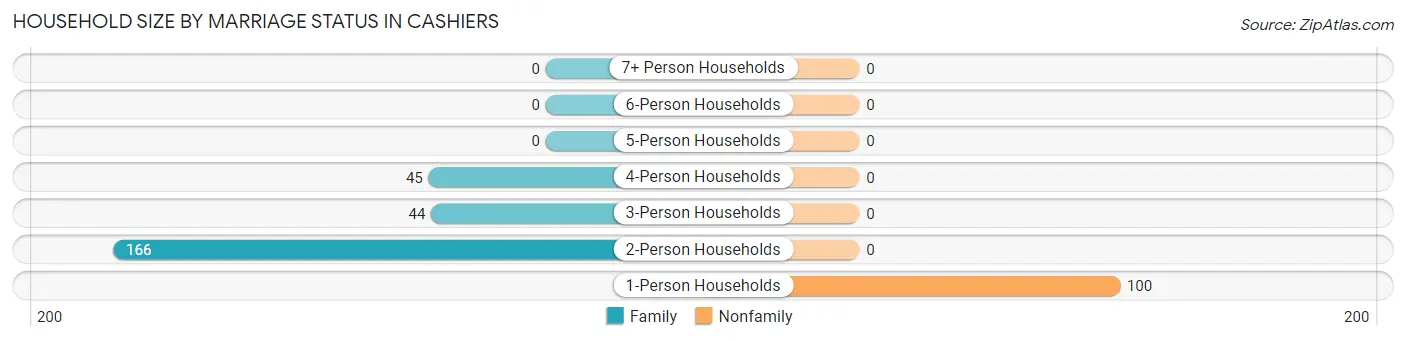
| Household Size | Family Households | Nonfamily Households |
| 1-Person Households | - | 100 (28.2%) |
| 2-Person Households | 166 (46.8%) | 0 (0.0%) |
| 3-Person Households | 44 (12.4%) | 0 (0.0%) |
| 4-Person Households | 45 (12.7%) | 0 (0.0%) |
| 5-Person Households | 0 (0.0%) | 0 (0.0%) |
| 6-Person Households | 0 (0.0%) | 0 (0.0%) |
| 7+ Person Households | 0 (0.0%) | 0 (0.0%) |
| Total | 255 (71.8%) | 100 (28.2%) |
Female Fertility in Cashiers
Fertility by Age in Cashiers
| Age Bracket | Women with Births | Births / 1,000 Women |
| 15 to 19 years | 0 (0.0%) | 0.0 |
| 20 to 34 years | 0 (0.0%) | 0.0 |
| 35 to 50 years | 0 (0.0%) | 0.0 |
| Total | 0 (0.0%) | 0.0 |
Fertility by Age by Marriage Status in Cashiers
| Age Bracket | Married | Unmarried |
| 15 to 19 years | 0 (0.0%) | 0 (0.0%) |
| 20 to 34 years | 0 (0.0%) | 0 (0.0%) |
| 35 to 50 years | 0 (0.0%) | 0 (0.0%) |
| Total | 0 (0.0%) | 0 (0.0%) |
Fertility by Education in Cashiers
| Educational Attainment | Women with Births | Births / 1,000 Women |
| Less than High School | 0 (0.0%) | 0.0 |
| High School Diploma | 0 (0.0%) | 0.0 |
| College or Associate's Degree | 0 (0.0%) | 0.0 |
| Bachelor's Degree | 0 (0.0%) | 0.0 |
| Graduate Degree | 0 (0.0%) | 0.0 |
| Total | 0 (0.0%) | 0.0 |
Fertility by Education by Marriage Status in Cashiers
| Educational Attainment | Married | Unmarried |
| Less than High School | 0 (0.0%) | 0 (0.0%) |
| High School Diploma | 0 (0.0%) | 0 (0.0%) |
| College or Associate's Degree | 0 (0.0%) | 0 (0.0%) |
| Bachelor's Degree | 0 (0.0%) | 0 (0.0%) |
| Graduate Degree | 0 (0.0%) | 0 (0.0%) |
| Total | 0 (0.0%) | 0 (0.0%) |
Employment Characteristics in Cashiers
Employment by Class of Employer in Cashiers
Among the 418 employed individuals in Cashiers, private company employees (235 | 56.2%), local government employees (73 | 17.5%), and self-employed (not incorporated) (63 | 15.1%) make up the most common classes of employment.
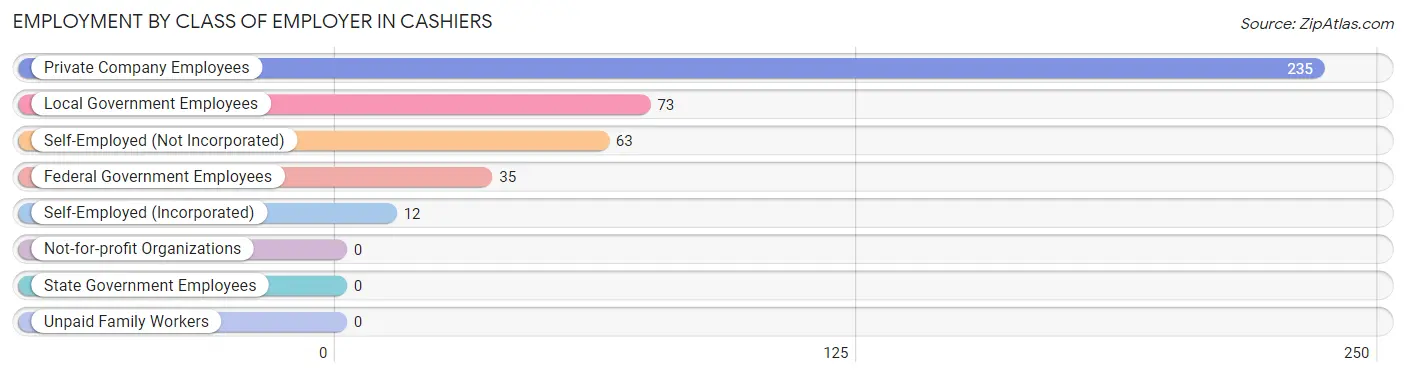
| Employer Class | # Employees | % Employees |
| Private Company Employees | 235 | 56.2% |
| Self-Employed (Incorporated) | 12 | 2.9% |
| Self-Employed (Not Incorporated) | 63 | 15.1% |
| Not-for-profit Organizations | 0 | 0.0% |
| Local Government Employees | 73 | 17.5% |
| State Government Employees | 0 | 0.0% |
| Federal Government Employees | 35 | 8.4% |
| Unpaid Family Workers | 0 | 0.0% |
| Total | 418 | 100.0% |
Employment Status by Age in Cashiers
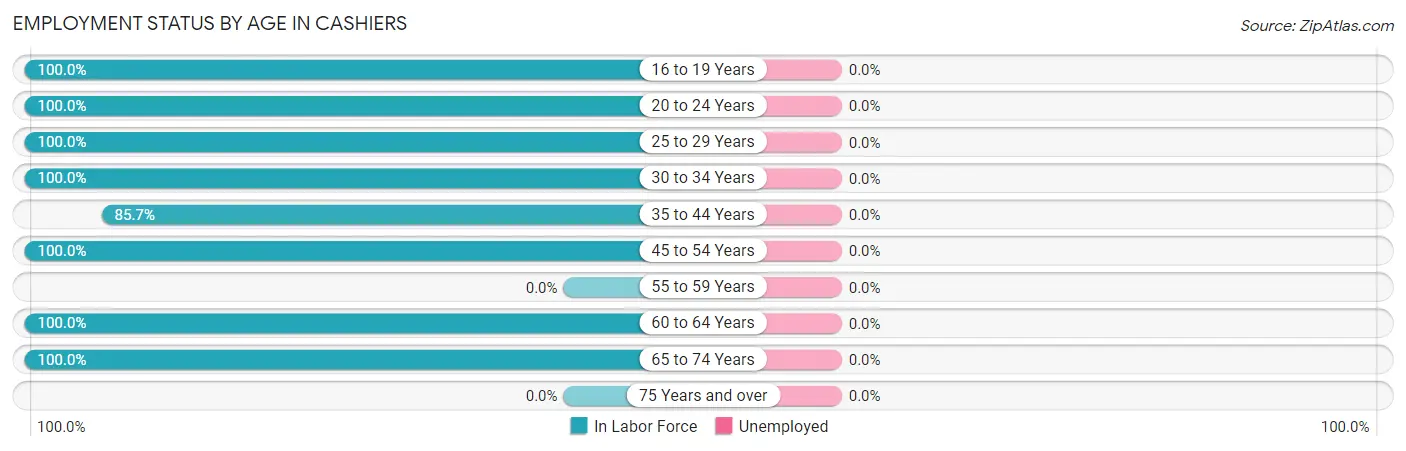
| Age Bracket | In Labor Force | Unemployed |
| 16 to 19 Years | 35 (100.0%) | 0 (0.0%) |
| 20 to 24 Years | 12 (100.0%) | 0 (0.0%) |
| 25 to 29 Years | 20 (100.0%) | 0 (0.0%) |
| 30 to 34 Years | 40 (100.0%) | 0 (0.0%) |
| 35 to 44 Years | 102 (85.7%) | 0 (0.0%) |
| 45 to 54 Years | 41 (100.0%) | 0 (0.0%) |
| 55 to 59 Years | 0 (0.0%) | 0 (0.0%) |
| 60 to 64 Years | 177 (100.0%) | 0 (0.0%) |
| 65 to 74 Years | 53 (100.0%) | 0 (0.0%) |
| 75 Years and over | 0 (0.0%) | 0 (0.0%) |
| Total | 480 (76.8%) | 0 (0.0%) |
Employment Status by Educational Attainment in Cashiers
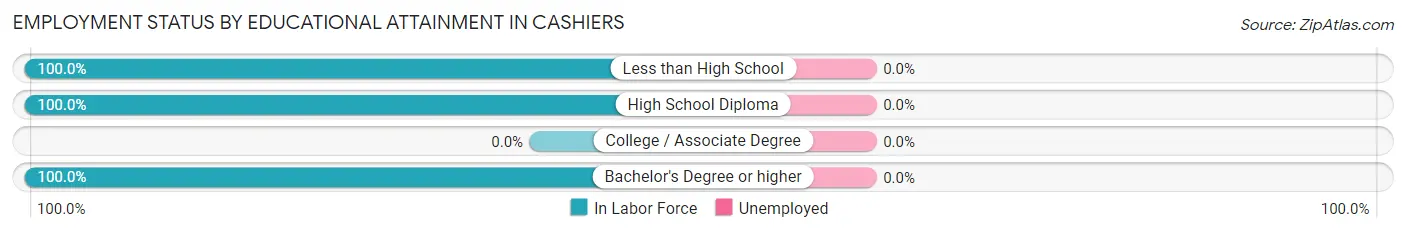
| Educational Attainment | In Labor Force | Unemployed |
| Less than High School | 25 (100.0%) | 0 (0.0%) |
| High School Diploma | 212 (100.0%) | 0 (0.0%) |
| College / Associate Degree | 0 (0.0%) | 0 (0.0%) |
| Bachelor's Degree or higher | 143 (100.0%) | 0 (0.0%) |
| Total | 380 (95.7%) | 0 (0.0%) |
Employment Occupations by Sex in Cashiers
Management, Business, Science and Arts Occupations
The most common Management, Business, Science and Arts occupations in Cashiers are Management (51 | 10.6%), Community & Social Service (42 | 8.7%), and Education Instruction & Library (42 | 8.7%).
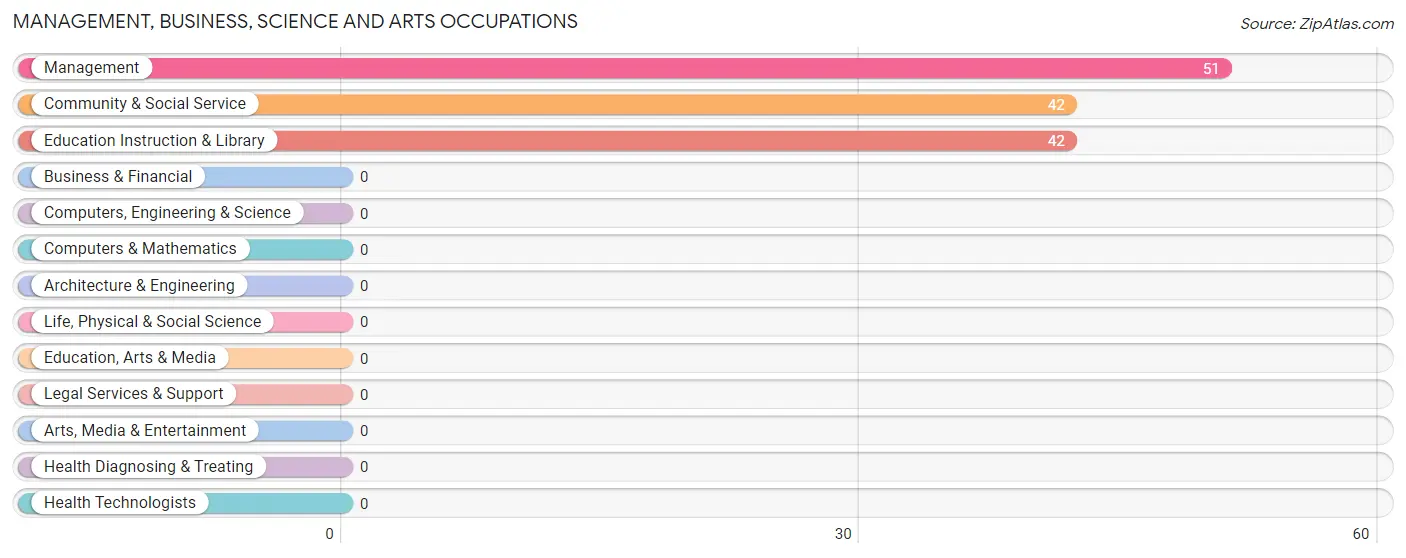
Management, Business, Science and Arts Occupations by Sex
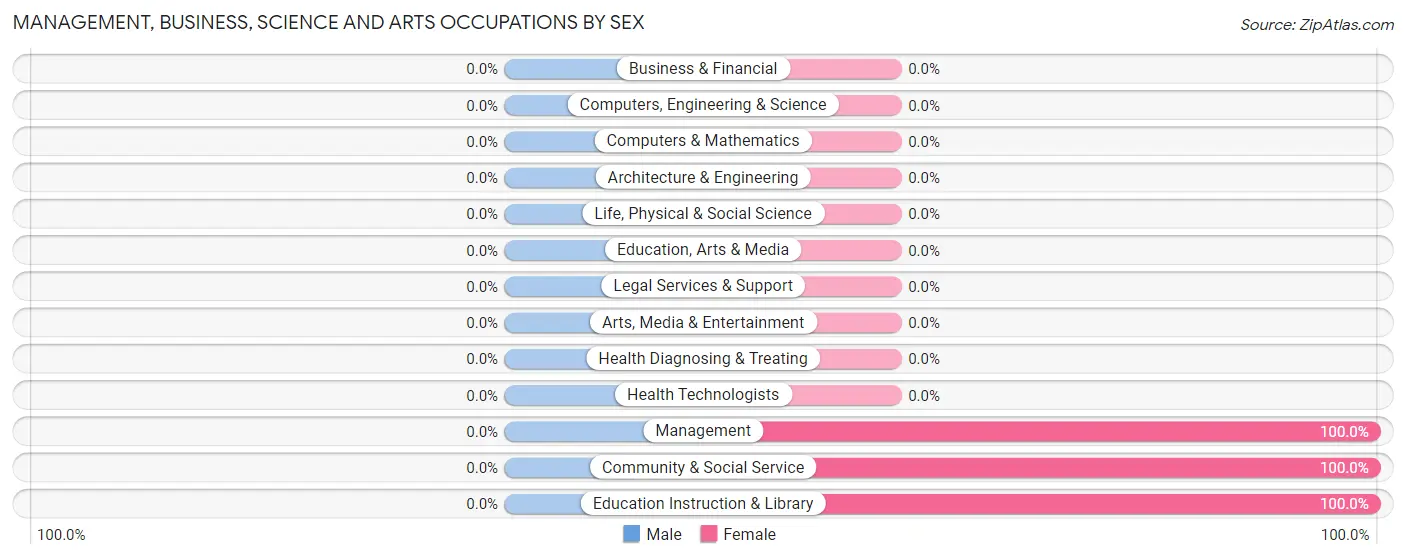
| Occupation | Male | Female |
| Management | 0 (0.0%) | 51 (100.0%) |
| Business & Financial | 0 (0.0%) | 0 (0.0%) |
| Computers, Engineering & Science | 0 (0.0%) | 0 (0.0%) |
| Computers & Mathematics | 0 (0.0%) | 0 (0.0%) |
| Architecture & Engineering | 0 (0.0%) | 0 (0.0%) |
| Life, Physical & Social Science | 0 (0.0%) | 0 (0.0%) |
| Community & Social Service | 0 (0.0%) | 42 (100.0%) |
| Education, Arts & Media | 0 (0.0%) | 0 (0.0%) |
| Legal Services & Support | 0 (0.0%) | 0 (0.0%) |
| Education Instruction & Library | 0 (0.0%) | 42 (100.0%) |
| Arts, Media & Entertainment | 0 (0.0%) | 0 (0.0%) |
| Health Diagnosing & Treating | 0 (0.0%) | 0 (0.0%) |
| Health Technologists | 0 (0.0%) | 0 (0.0%) |
| Total (Category) | 0 (0.0%) | 93 (100.0%) |
| Total (Overall) | 241 (50.2%) | 239 (49.8%) |
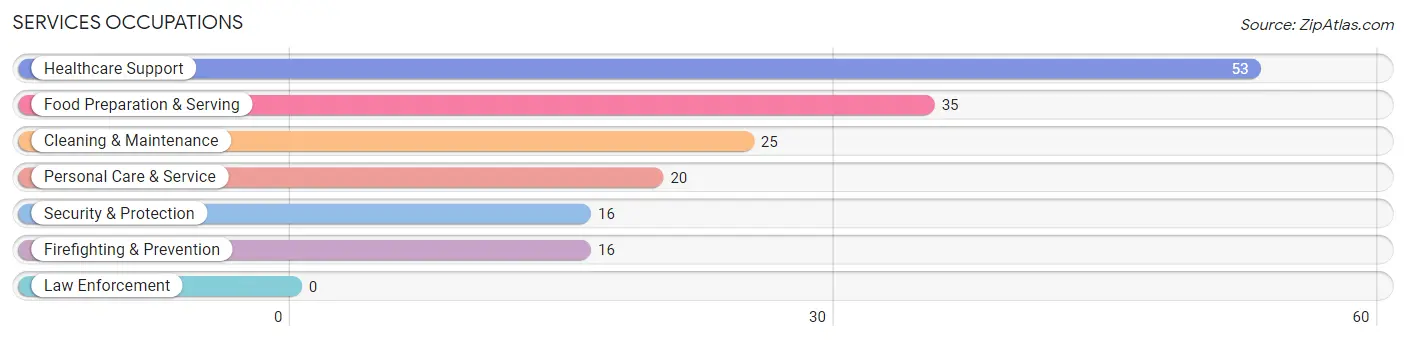
Services Occupations
The most common Services occupations in Cashiers are Healthcare Support (53 | 11.0%), Food Preparation & Serving (35 | 7.3%), Cleaning & Maintenance (25 | 5.2%), Personal Care & Service (20 | 4.2%), and Security & Protection (16 | 3.3%).
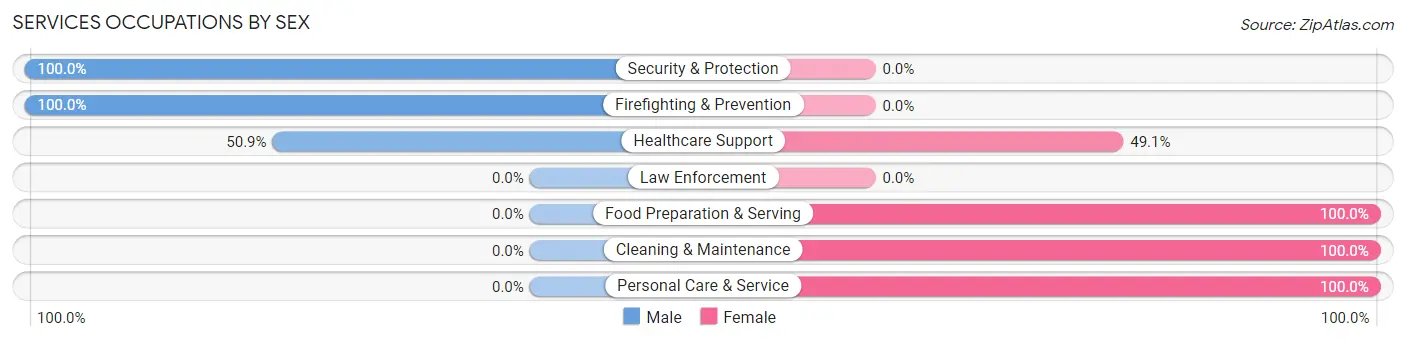
Services Occupations by Sex
Within the Services occupations in Cashiers, the most male-oriented occupations are Security & Protection (100.0%), Firefighting & Prevention (100.0%), and Healthcare Support (50.9%), while the most female-oriented occupations are Food Preparation & Serving (100.0%), Cleaning & Maintenance (100.0%), and Personal Care & Service (100.0%).
| Occupation | Male | Female |
| Healthcare Support | 27 (50.9%) | 26 (49.1%) |
| Security & Protection | 16 (100.0%) | 0 (0.0%) |
| Firefighting & Prevention | 16 (100.0%) | 0 (0.0%) |
| Law Enforcement | 0 (0.0%) | 0 (0.0%) |
| Food Preparation & Serving | 0 (0.0%) | 35 (100.0%) |
| Cleaning & Maintenance | 0 (0.0%) | 25 (100.0%) |
| Personal Care & Service | 0 (0.0%) | 20 (100.0%) |
| Total (Category) | 43 (28.9%) | 106 (71.1%) |
| Total (Overall) | 241 (50.2%) | 239 (49.8%) |
Sales and Office Occupations
The most common Sales and Office occupations in Cashiers are Office & Administration (111 | 23.1%), and Sales & Related (60 | 12.5%).
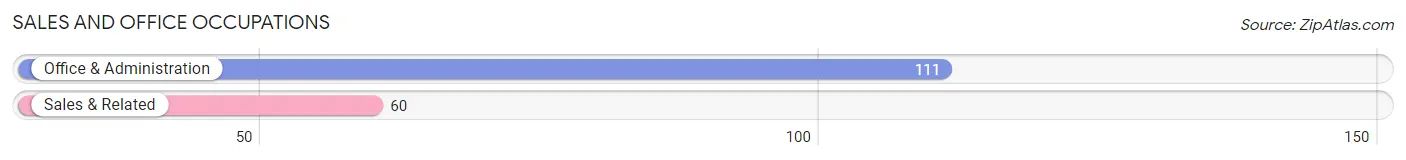
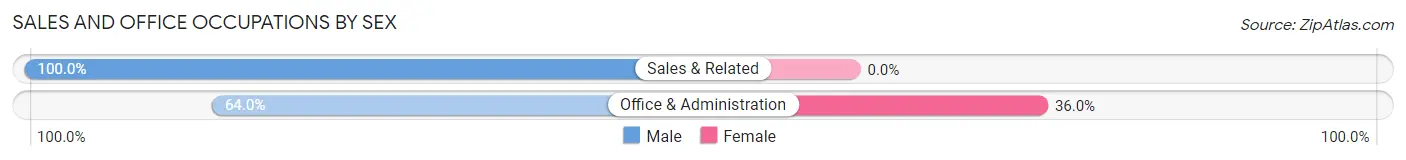
Sales and Office Occupations by Sex
| Occupation | Male | Female |
| Sales & Related | 60 (100.0%) | 0 (0.0%) |
| Office & Administration | 71 (64.0%) | 40 (36.0%) |
| Total (Category) | 131 (76.6%) | 40 (23.4%) |
| Total (Overall) | 241 (50.2%) | 239 (49.8%) |
Natural Resources, Construction and Maintenance Occupations
The most common Natural Resources, Construction and Maintenance occupations in Cashiers are , and Construction & Extraction (67 | 14.0%).
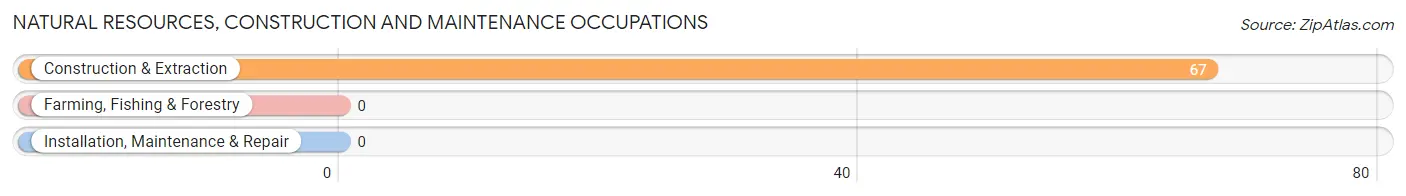
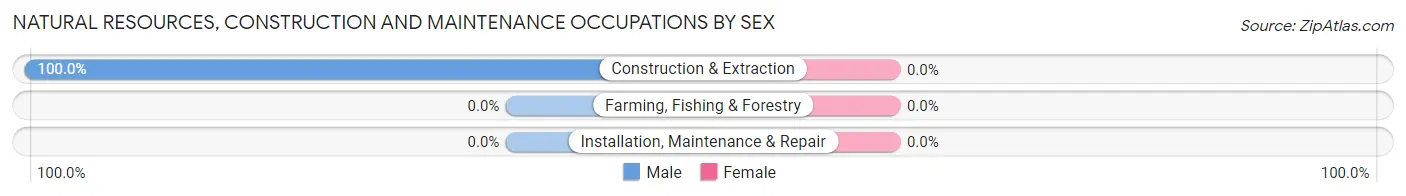
Natural Resources, Construction and Maintenance Occupations by Sex
| Occupation | Male | Female |
| Farming, Fishing & Forestry | 0 (0.0%) | 0 (0.0%) |
| Construction & Extraction | 67 (100.0%) | 0 (0.0%) |
| Installation, Maintenance & Repair | 0 (0.0%) | 0 (0.0%) |
| Total (Category) | 67 (100.0%) | 0 (0.0%) |
| Total (Overall) | 241 (50.2%) | 239 (49.8%) |
Production, Transportation and Moving Occupations
Production, Transportation and Moving Occupations by Sex
| Occupation | Male | Female |
| Production | 0 (0.0%) | 0 (0.0%) |
| Transportation | 0 (0.0%) | 0 (0.0%) |
| Material Moving | 0 (0.0%) | 0 (0.0%) |
| Total (Category) | 0 (0.0%) | 0 (0.0%) |
| Total (Overall) | 241 (50.2%) | 239 (49.8%) |
Employment Industries by Sex in Cashiers
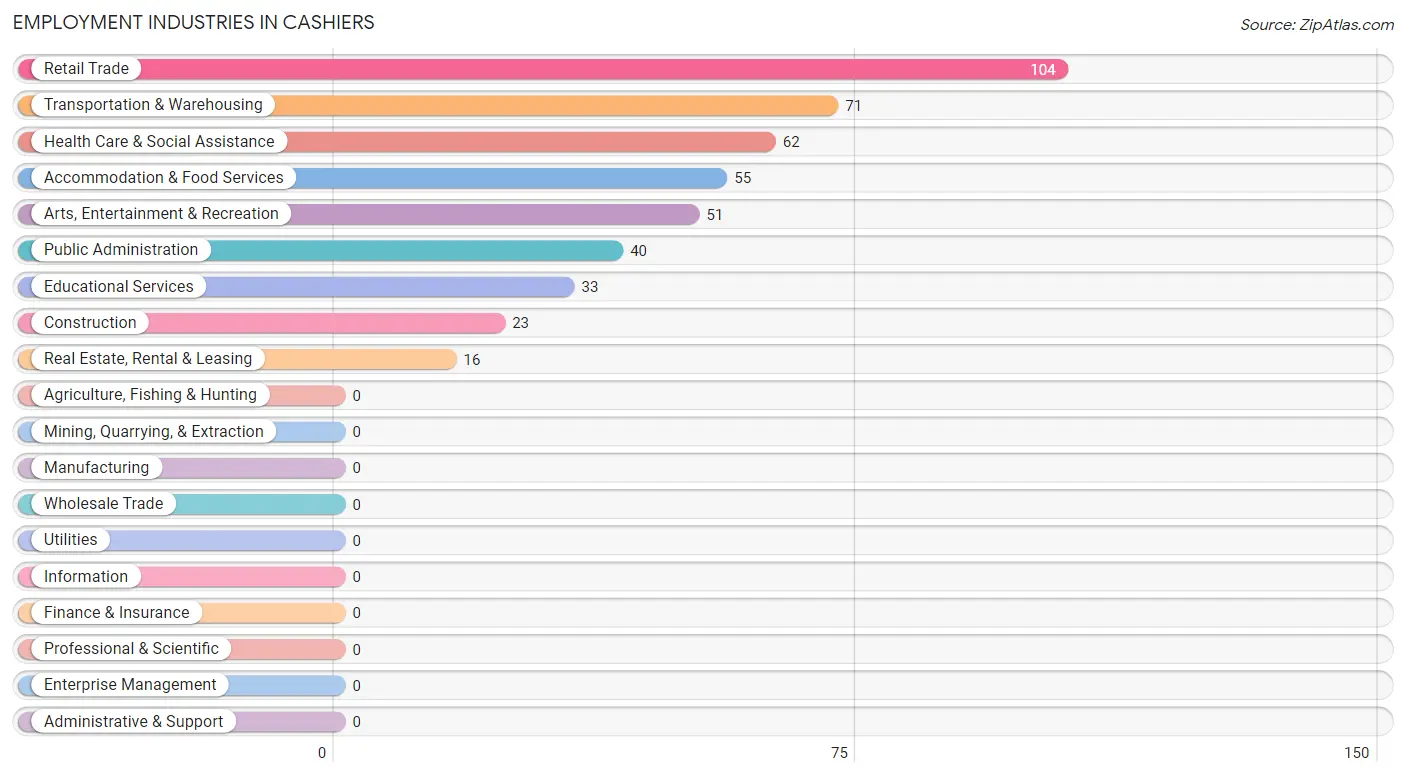
Employment Industries in Cashiers
The major employment industries in Cashiers include Retail Trade (104 | 21.7%), Transportation & Warehousing (71 | 14.8%), Health Care & Social Assistance (62 | 12.9%), Accommodation & Food Services (55 | 11.5%), and Arts, Entertainment & Recreation (51 | 10.6%).
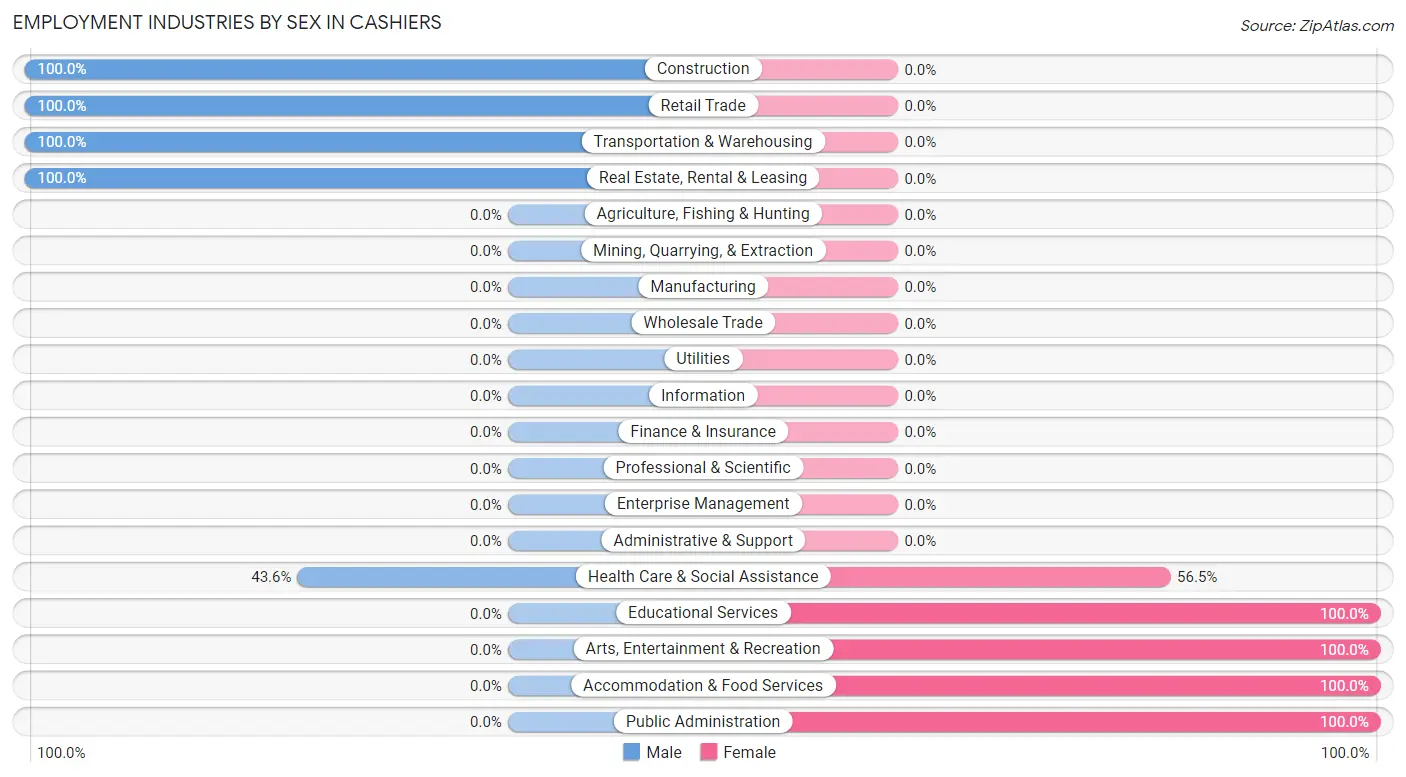
Employment Industries by Sex in Cashiers
The Cashiers industries that see more men than women are Construction (100.0%), Retail Trade (100.0%), and Transportation & Warehousing (100.0%), whereas the industries that tend to have a higher number of women are Educational Services (100.0%), Arts, Entertainment & Recreation (100.0%), and Accommodation & Food Services (100.0%).
| Industry | Male | Female |
| Agriculture, Fishing & Hunting | 0 (0.0%) | 0 (0.0%) |
| Mining, Quarrying, & Extraction | 0 (0.0%) | 0 (0.0%) |
| Construction | 23 (100.0%) | 0 (0.0%) |
| Manufacturing | 0 (0.0%) | 0 (0.0%) |
| Wholesale Trade | 0 (0.0%) | 0 (0.0%) |
| Retail Trade | 104 (100.0%) | 0 (0.0%) |
| Transportation & Warehousing | 71 (100.0%) | 0 (0.0%) |
| Utilities | 0 (0.0%) | 0 (0.0%) |
| Information | 0 (0.0%) | 0 (0.0%) |
| Finance & Insurance | 0 (0.0%) | 0 (0.0%) |
| Real Estate, Rental & Leasing | 16 (100.0%) | 0 (0.0%) |
| Professional & Scientific | 0 (0.0%) | 0 (0.0%) |
| Enterprise Management | 0 (0.0%) | 0 (0.0%) |
| Administrative & Support | 0 (0.0%) | 0 (0.0%) |
| Educational Services | 0 (0.0%) | 33 (100.0%) |
| Health Care & Social Assistance | 27 (43.5%) | 35 (56.5%) |
| Arts, Entertainment & Recreation | 0 (0.0%) | 51 (100.0%) |
| Accommodation & Food Services | 0 (0.0%) | 55 (100.0%) |
| Public Administration | 0 (0.0%) | 40 (100.0%) |
| Total | 241 (50.2%) | 239 (49.8%) |
Education in Cashiers
School Enrollment in Cashiers
The most common levels of schooling among the 166 students in Cashiers are elementary school (51 | 30.7%), middle school (50 | 30.1%), and high school (35 | 21.1%).
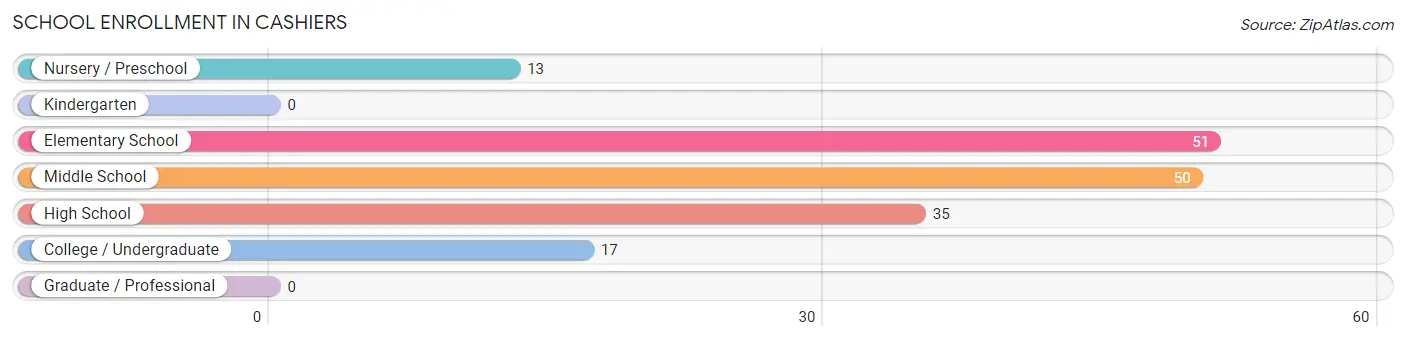
| School Level | # Students | % Students |
| Nursery / Preschool | 13 | 7.8% |
| Kindergarten | 0 | 0.0% |
| Elementary School | 51 | 30.7% |
| Middle School | 50 | 30.1% |
| High School | 35 | 21.1% |
| College / Undergraduate | 17 | 10.2% |
| Graduate / Professional | 0 | 0.0% |
| Total | 166 | 100.0% |
School Enrollment by Age by Funding Source in Cashiers
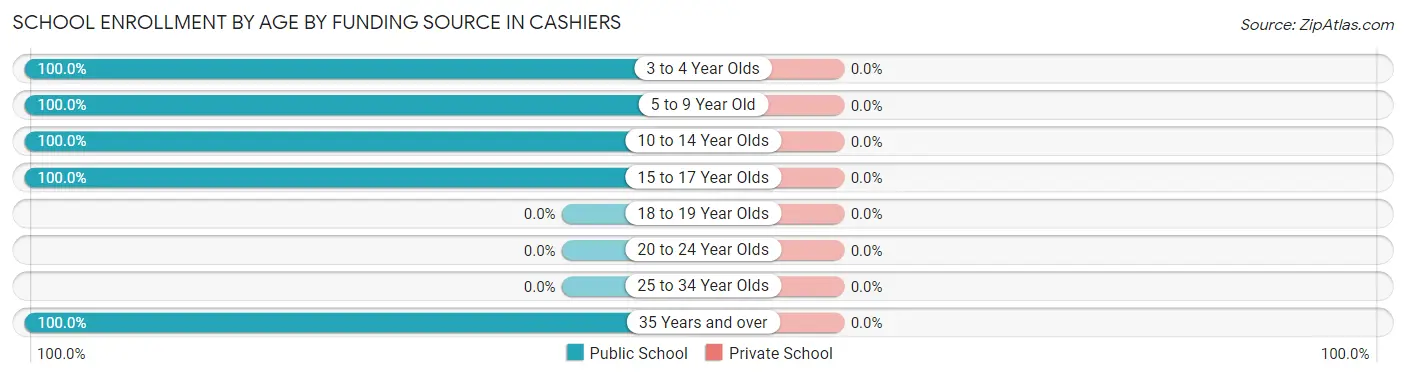
| Age Bracket | Public School | Private School |
| 3 to 4 Year Olds | 13 (100.0%) | 0 (0.0%) |
| 5 to 9 Year Old | 51 (100.0%) | 0 (0.0%) |
| 10 to 14 Year Olds | 50 (100.0%) | 0 (0.0%) |
| 15 to 17 Year Olds | 35 (100.0%) | 0 (0.0%) |
| 18 to 19 Year Olds | 0 (0.0%) | 0 (0.0%) |
| 20 to 24 Year Olds | 0 (0.0%) | 0 (0.0%) |
| 25 to 34 Year Olds | 0 (0.0%) | 0 (0.0%) |
| 35 Years and over | 17 (100.0%) | 0 (0.0%) |
| Total | 166 (100.0%) | 0 (0.0%) |
Educational Attainment by Field of Study in Cashiers
Business (116 | 48.7%), science & technology (36 | 15.1%), education (26 | 10.9%), liberal arts & history (22 | 9.2%), and visual & performing arts (22 | 9.2%) are the most common fields of study among 238 individuals in Cashiers who have obtained a bachelor's degree or higher.
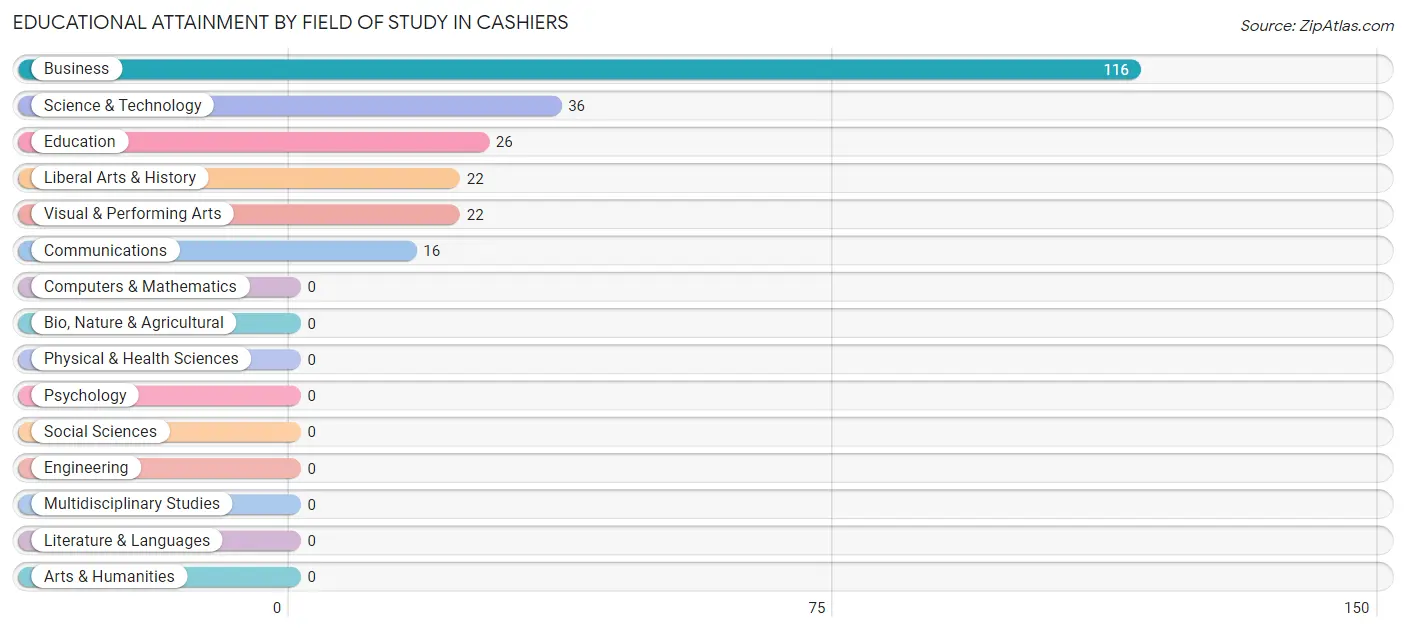
| Field of Study | # Graduates | % Graduates |
| Computers & Mathematics | 0 | 0.0% |
| Bio, Nature & Agricultural | 0 | 0.0% |
| Physical & Health Sciences | 0 | 0.0% |
| Psychology | 0 | 0.0% |
| Social Sciences | 0 | 0.0% |
| Engineering | 0 | 0.0% |
| Multidisciplinary Studies | 0 | 0.0% |
| Science & Technology | 36 | 15.1% |
| Business | 116 | 48.7% |
| Education | 26 | 10.9% |
| Literature & Languages | 0 | 0.0% |
| Liberal Arts & History | 22 | 9.2% |
| Visual & Performing Arts | 22 | 9.2% |
| Communications | 16 | 6.7% |
| Arts & Humanities | 0 | 0.0% |
| Total | 238 | 100.0% |
Transportation & Commute in Cashiers
Vehicle Availability by Sex in Cashiers
The most prevalent vehicle ownership categories in Cashiers are males with 3 vehicles (104, accounting for 50.7%) and females with 3 vehicles (151, making up 48.8%).
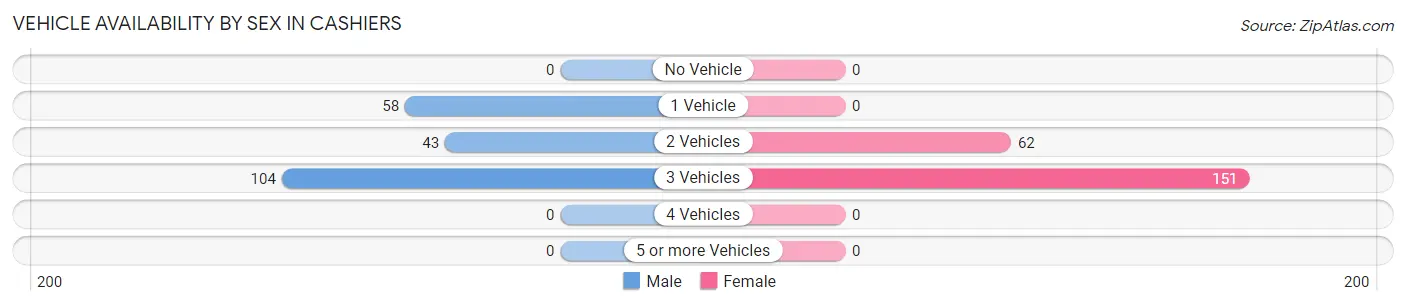
| Vehicles Available | Male | Female |
| No Vehicle | 0 (0.0%) | 0 (0.0%) |
| 1 Vehicle | 58 (28.3%) | 0 (0.0%) |
| 2 Vehicles | 43 (21.0%) | 62 (29.1%) |
| 3 Vehicles | 104 (50.7%) | 151 (70.9%) |
| 4 Vehicles | 0 (0.0%) | 0 (0.0%) |
| 5 or more Vehicles | 0 (0.0%) | 0 (0.0%) |
| Total | 205 (100.0%) | 213 (100.0%) |
Commute Time in Cashiers
The most frequently occuring commute durations in Cashiers are 5 to 9 minutes (186 commuters, 44.5%), 15 to 19 minutes (80 commuters, 19.1%), and 30 to 34 minutes (62 commuters, 14.8%).
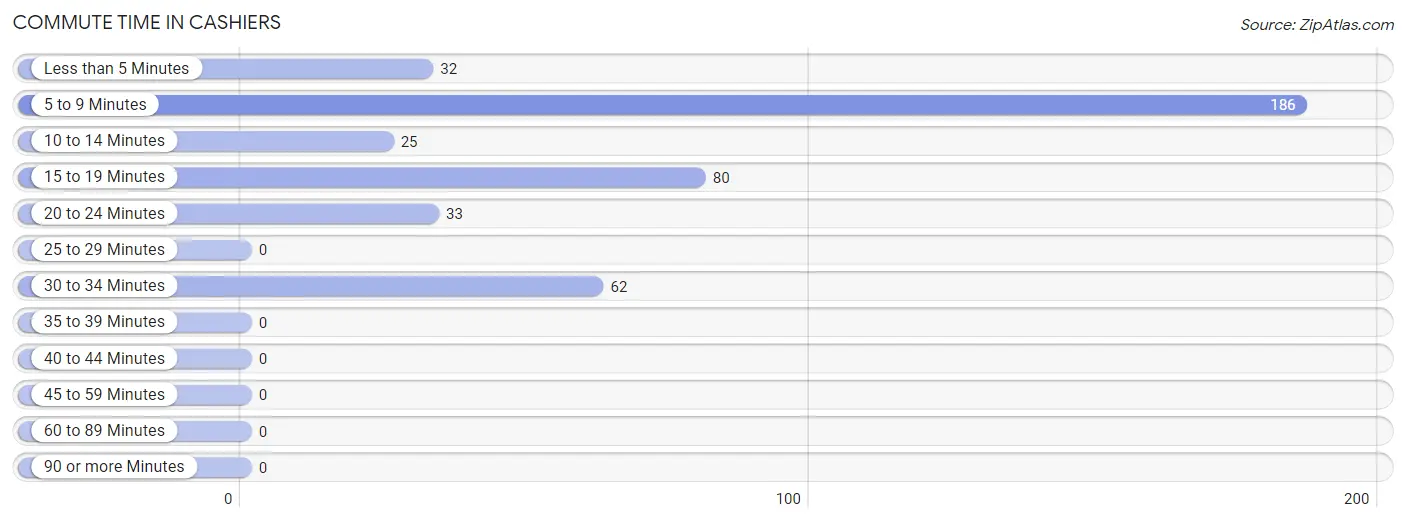
| Commute Time | # Commuters | % Commuters |
| Less than 5 Minutes | 32 | 7.7% |
| 5 to 9 Minutes | 186 | 44.5% |
| 10 to 14 Minutes | 25 | 6.0% |
| 15 to 19 Minutes | 80 | 19.1% |
| 20 to 24 Minutes | 33 | 7.9% |
| 25 to 29 Minutes | 0 | 0.0% |
| 30 to 34 Minutes | 62 | 14.8% |
| 35 to 39 Minutes | 0 | 0.0% |
| 40 to 44 Minutes | 0 | 0.0% |
| 45 to 59 Minutes | 0 | 0.0% |
| 60 to 89 Minutes | 0 | 0.0% |
| 90 or more Minutes | 0 | 0.0% |
Commute Time by Sex in Cashiers
The most common commute times in Cashiers are 30 to 34 minutes (62 commuters, 30.2%) for males and 5 to 9 minutes (126 commuters, 59.2%) for females.
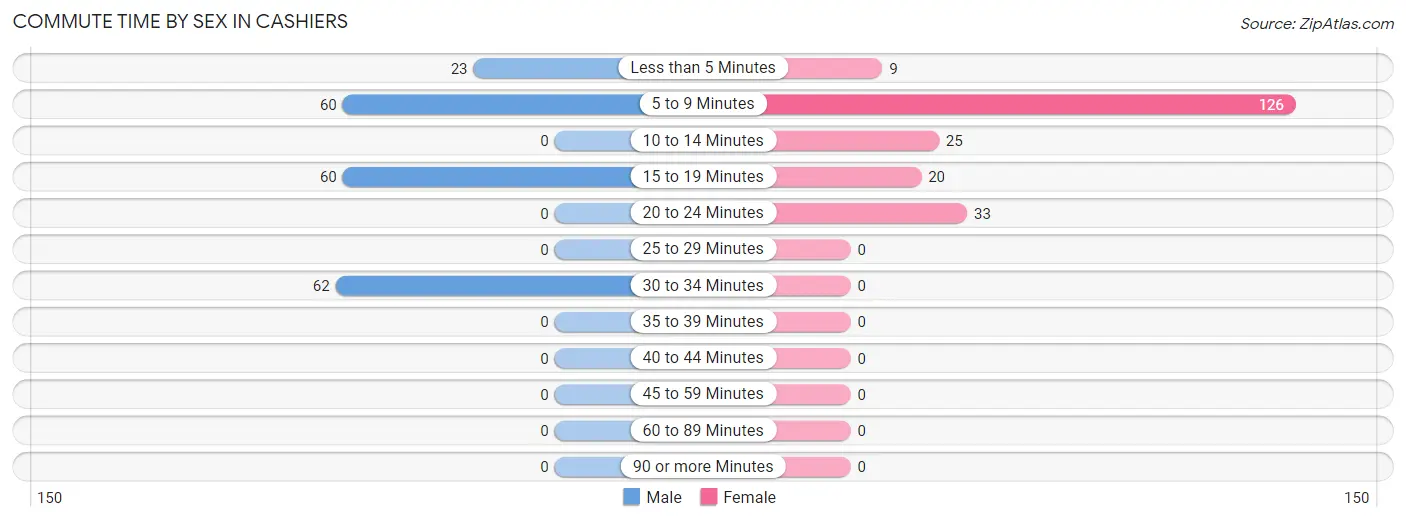
| Commute Time | Male | Female |
| Less than 5 Minutes | 23 (11.2%) | 9 (4.2%) |
| 5 to 9 Minutes | 60 (29.3%) | 126 (59.2%) |
| 10 to 14 Minutes | 0 (0.0%) | 25 (11.7%) |
| 15 to 19 Minutes | 60 (29.3%) | 20 (9.4%) |
| 20 to 24 Minutes | 0 (0.0%) | 33 (15.5%) |
| 25 to 29 Minutes | 0 (0.0%) | 0 (0.0%) |
| 30 to 34 Minutes | 62 (30.2%) | 0 (0.0%) |
| 35 to 39 Minutes | 0 (0.0%) | 0 (0.0%) |
| 40 to 44 Minutes | 0 (0.0%) | 0 (0.0%) |
| 45 to 59 Minutes | 0 (0.0%) | 0 (0.0%) |
| 60 to 89 Minutes | 0 (0.0%) | 0 (0.0%) |
| 90 or more Minutes | 0 (0.0%) | 0 (0.0%) |
Time of Departure to Work by Sex in Cashiers
The most frequent times of departure to work in Cashiers are 8:00 AM to 8:29 AM (94, 45.9%) for males and 8:00 AM to 8:29 AM (69, 32.4%) for females.
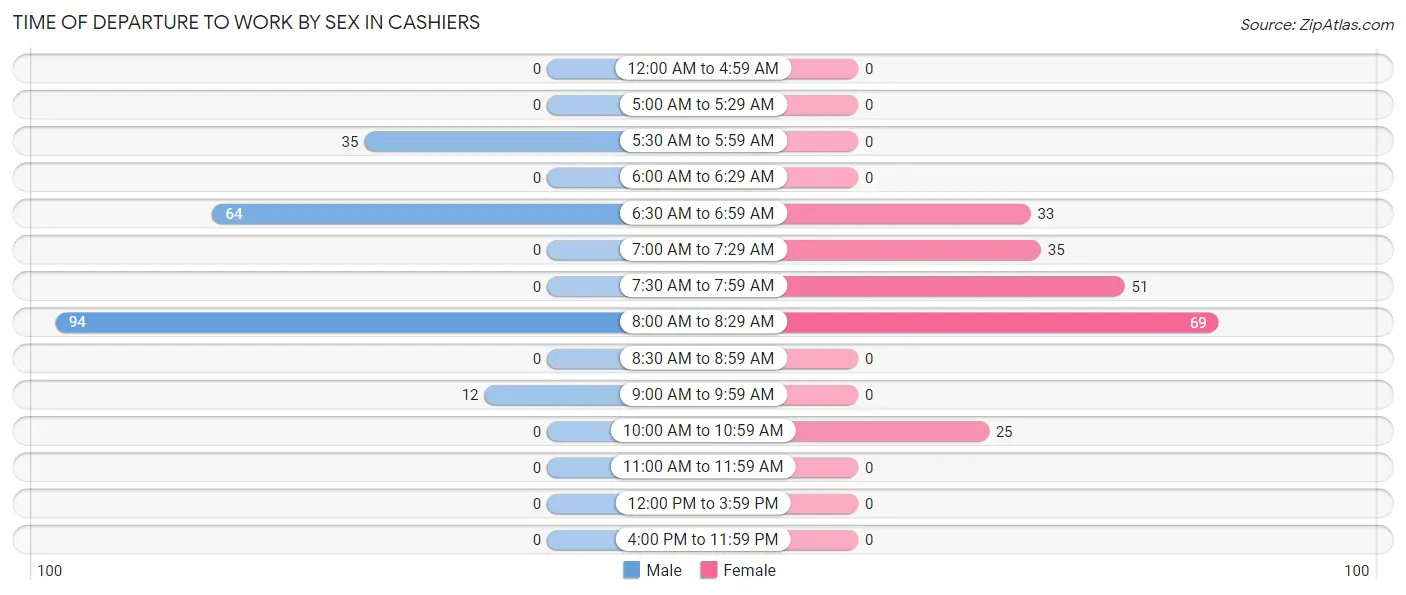
| Time of Departure | Male | Female |
| 12:00 AM to 4:59 AM | 0 (0.0%) | 0 (0.0%) |
| 5:00 AM to 5:29 AM | 0 (0.0%) | 0 (0.0%) |
| 5:30 AM to 5:59 AM | 35 (17.1%) | 0 (0.0%) |
| 6:00 AM to 6:29 AM | 0 (0.0%) | 0 (0.0%) |
| 6:30 AM to 6:59 AM | 64 (31.2%) | 33 (15.5%) |
| 7:00 AM to 7:29 AM | 0 (0.0%) | 35 (16.4%) |
| 7:30 AM to 7:59 AM | 0 (0.0%) | 51 (23.9%) |
| 8:00 AM to 8:29 AM | 94 (45.9%) | 69 (32.4%) |
| 8:30 AM to 8:59 AM | 0 (0.0%) | 0 (0.0%) |
| 9:00 AM to 9:59 AM | 12 (5.9%) | 0 (0.0%) |
| 10:00 AM to 10:59 AM | 0 (0.0%) | 25 (11.7%) |
| 11:00 AM to 11:59 AM | 0 (0.0%) | 0 (0.0%) |
| 12:00 PM to 3:59 PM | 0 (0.0%) | 0 (0.0%) |
| 4:00 PM to 11:59 PM | 0 (0.0%) | 0 (0.0%) |
| Total | 205 (100.0%) | 213 (100.0%) |
Housing Occupancy in Cashiers
Occupancy by Ownership in Cashiers
Of the total 355 dwellings in Cashiers, owner-occupied units account for 294 (82.8%), while renter-occupied units make up 61 (17.2%).
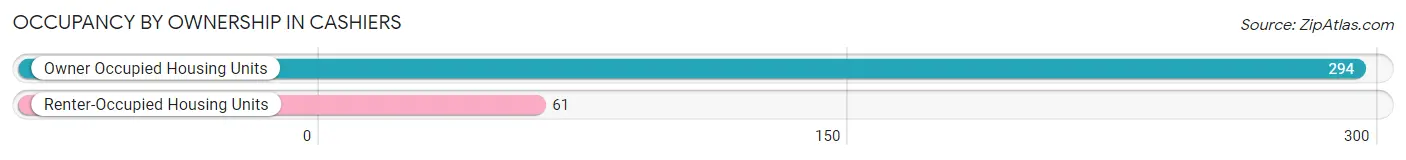
| Occupancy | # Housing Units | % Housing Units |
| Owner Occupied Housing Units | 294 | 82.8% |
| Renter-Occupied Housing Units | 61 | 17.2% |
| Total Occupied Housing Units | 355 | 100.0% |
Occupancy by Household Size in Cashiers
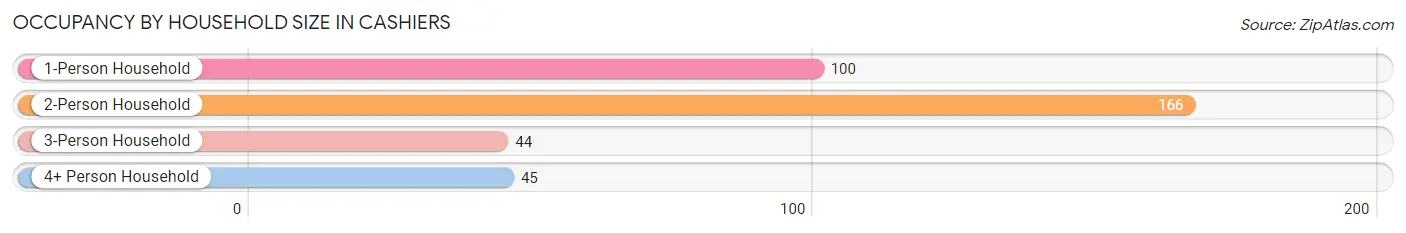
| Household Size | # Housing Units | % Housing Units |
| 1-Person Household | 100 | 28.2% |
| 2-Person Household | 166 | 46.8% |
| 3-Person Household | 44 | 12.4% |
| 4+ Person Household | 45 | 12.7% |
| Total Housing Units | 355 | 100.0% |
Occupancy by Ownership by Household Size in Cashiers
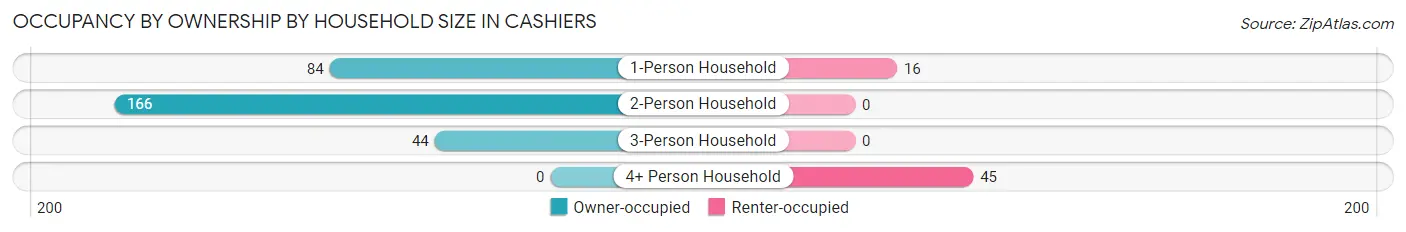
| Household Size | Owner-occupied | Renter-occupied |
| 1-Person Household | 84 (84.0%) | 16 (16.0%) |
| 2-Person Household | 166 (100.0%) | 0 (0.0%) |
| 3-Person Household | 44 (100.0%) | 0 (0.0%) |
| 4+ Person Household | 0 (0.0%) | 45 (100.0%) |
| Total Housing Units | 294 (82.8%) | 61 (17.2%) |
Occupancy by Educational Attainment in Cashiers
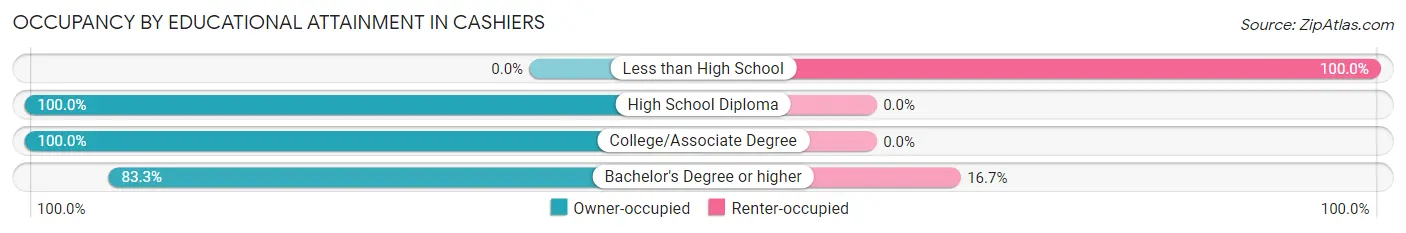
| Household Size | Owner-occupied | Renter-occupied |
| Less than High School | 0 (0.0%) | 25 (100.0%) |
| High School Diploma | 88 (100.0%) | 0 (0.0%) |
| College/Associate Degree | 26 (100.0%) | 0 (0.0%) |
| Bachelor's Degree or higher | 180 (83.3%) | 36 (16.7%) |
Occupancy by Age of Householder in Cashiers
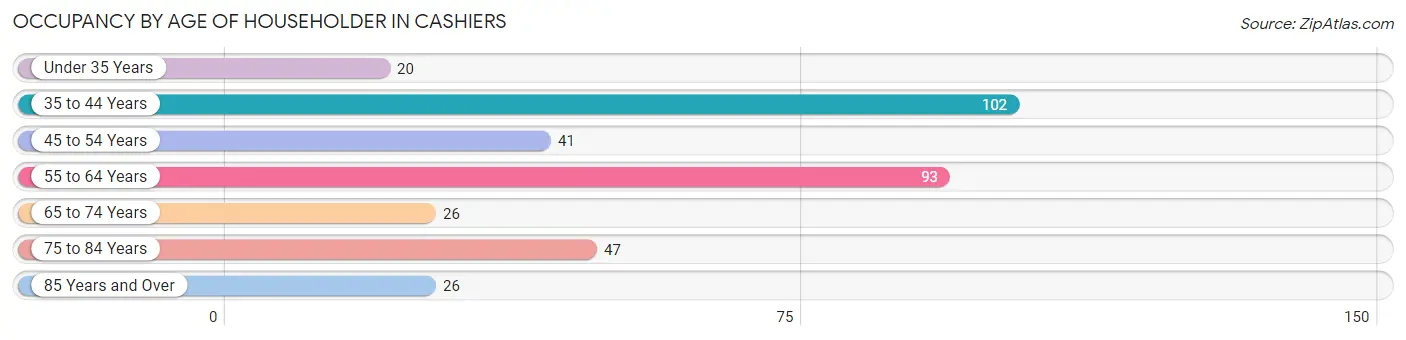
| Age Bracket | # Households | % Households |
| Under 35 Years | 20 | 5.6% |
| 35 to 44 Years | 102 | 28.7% |
| 45 to 54 Years | 41 | 11.6% |
| 55 to 64 Years | 93 | 26.2% |
| 65 to 74 Years | 26 | 7.3% |
| 75 to 84 Years | 47 | 13.2% |
| 85 Years and Over | 26 | 7.3% |
| Total | 355 | 100.0% |
Housing Finances in Cashiers
Median Income by Occupancy in Cashiers
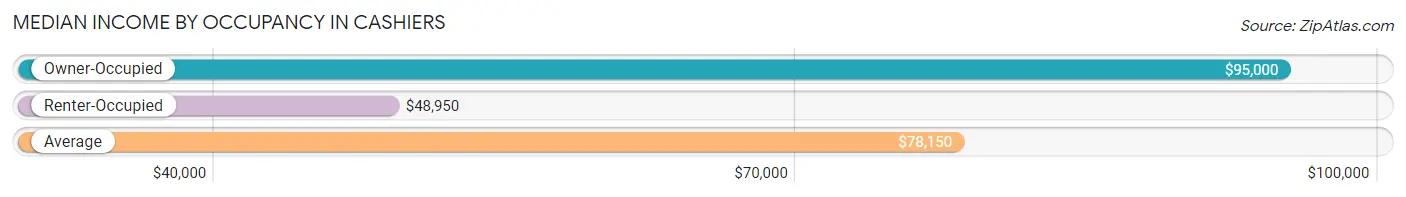
| Occupancy Type | # Households | Median Income |
| Owner-Occupied | 294 (82.8%) | $95,000 |
| Renter-Occupied | 61 (17.2%) | $48,950 |
| Average | 355 (100.0%) | $78,150 |
Occupancy by Householder Income Bracket in Cashiers
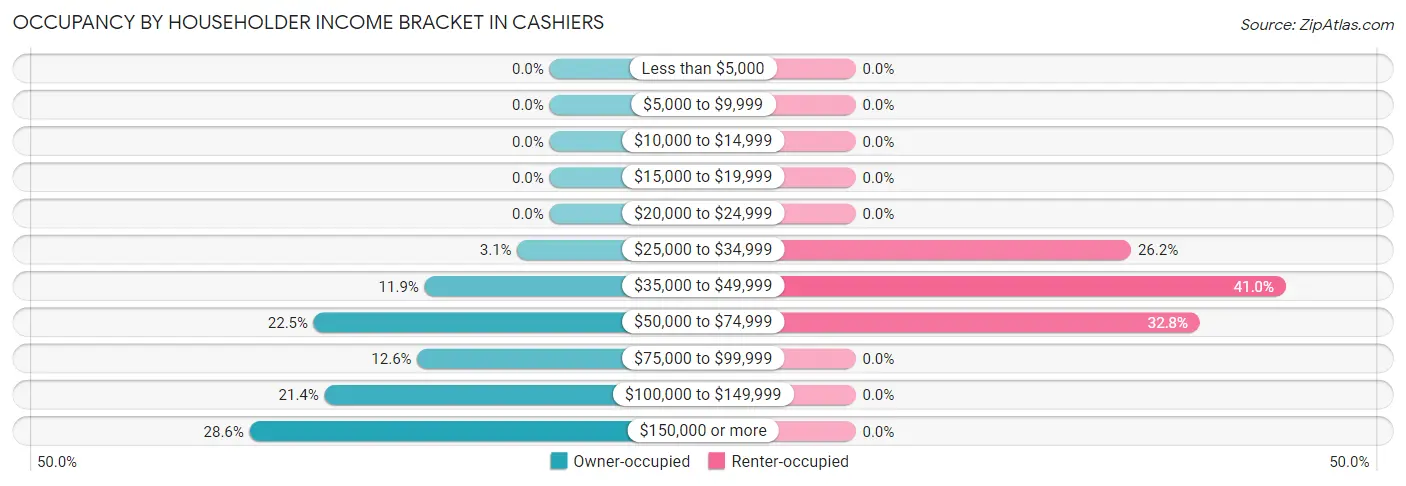
| Income Bracket | Owner-occupied | Renter-occupied |
| Less than $5,000 | 0 (0.0%) | 0 (0.0%) |
| $5,000 to $9,999 | 0 (0.0%) | 0 (0.0%) |
| $10,000 to $14,999 | 0 (0.0%) | 0 (0.0%) |
| $15,000 to $19,999 | 0 (0.0%) | 0 (0.0%) |
| $20,000 to $24,999 | 0 (0.0%) | 0 (0.0%) |
| $25,000 to $34,999 | 9 (3.1%) | 16 (26.2%) |
| $35,000 to $49,999 | 35 (11.9%) | 25 (41.0%) |
| $50,000 to $74,999 | 66 (22.5%) | 20 (32.8%) |
| $75,000 to $99,999 | 37 (12.6%) | 0 (0.0%) |
| $100,000 to $149,999 | 63 (21.4%) | 0 (0.0%) |
| $150,000 or more | 84 (28.6%) | 0 (0.0%) |
| Total | 294 (100.0%) | 61 (100.0%) |
Monthly Housing Cost Tiers in Cashiers
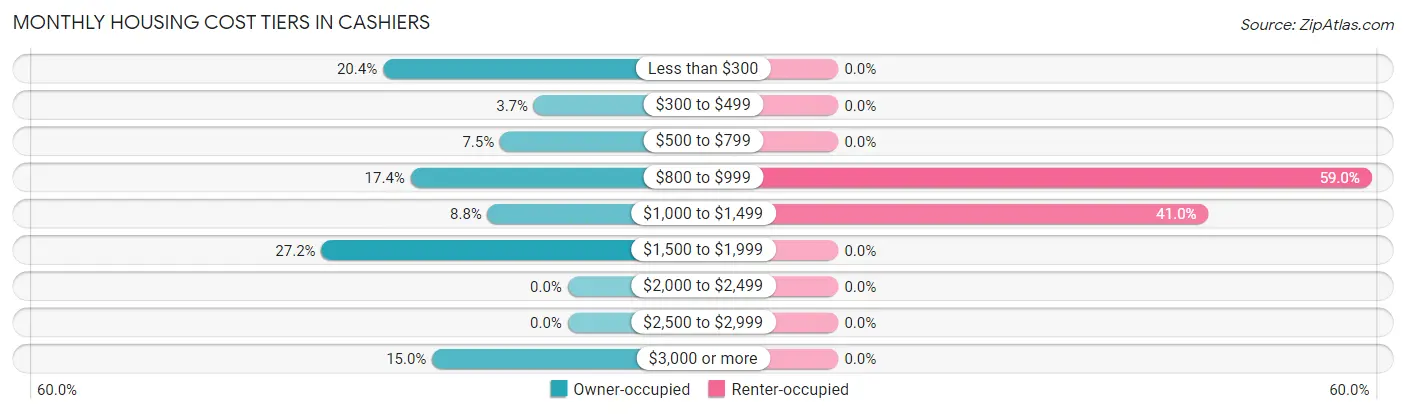
| Monthly Cost | Owner-occupied | Renter-occupied |
| Less than $300 | 60 (20.4%) | 0 (0.0%) |
| $300 to $499 | 11 (3.7%) | 0 (0.0%) |
| $500 to $799 | 22 (7.5%) | 0 (0.0%) |
| $800 to $999 | 51 (17.3%) | 36 (59.0%) |
| $1,000 to $1,499 | 26 (8.8%) | 25 (41.0%) |
| $1,500 to $1,999 | 80 (27.2%) | 0 (0.0%) |
| $2,000 to $2,499 | 0 (0.0%) | 0 (0.0%) |
| $2,500 to $2,999 | 0 (0.0%) | 0 (0.0%) |
| $3,000 or more | 44 (15.0%) | 0 (0.0%) |
| Total | 294 (100.0%) | 61 (100.0%) |
Physical Housing Characteristics in Cashiers
Housing Structures in Cashiers
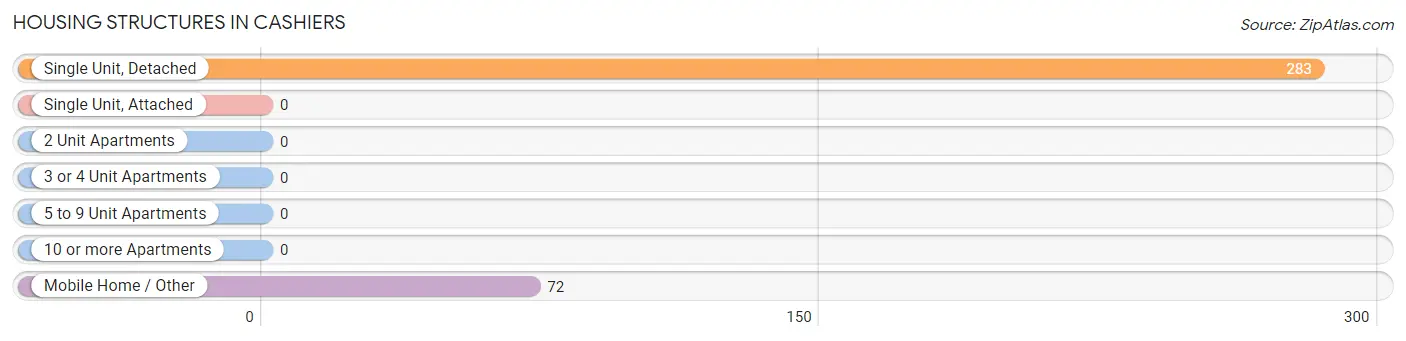
| Structure Type | # Housing Units | % Housing Units |
| Single Unit, Detached | 283 | 79.7% |
| Single Unit, Attached | 0 | 0.0% |
| 2 Unit Apartments | 0 | 0.0% |
| 3 or 4 Unit Apartments | 0 | 0.0% |
| 5 to 9 Unit Apartments | 0 | 0.0% |
| 10 or more Apartments | 0 | 0.0% |
| Mobile Home / Other | 72 | 20.3% |
| Total | 355 | 100.0% |
Housing Structures by Occupancy in Cashiers
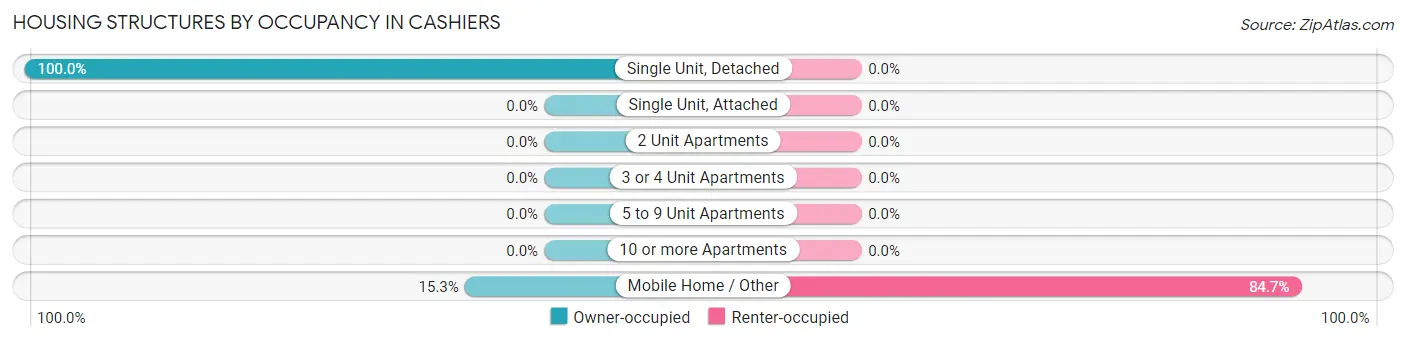
| Structure Type | Owner-occupied | Renter-occupied |
| Single Unit, Detached | 283 (100.0%) | 0 (0.0%) |
| Single Unit, Attached | 0 (0.0%) | 0 (0.0%) |
| 2 Unit Apartments | 0 (0.0%) | 0 (0.0%) |
| 3 or 4 Unit Apartments | 0 (0.0%) | 0 (0.0%) |
| 5 to 9 Unit Apartments | 0 (0.0%) | 0 (0.0%) |
| 10 or more Apartments | 0 (0.0%) | 0 (0.0%) |
| Mobile Home / Other | 11 (15.3%) | 61 (84.7%) |
| Total | 294 (82.8%) | 61 (17.2%) |
Housing Structures by Number of Rooms in Cashiers
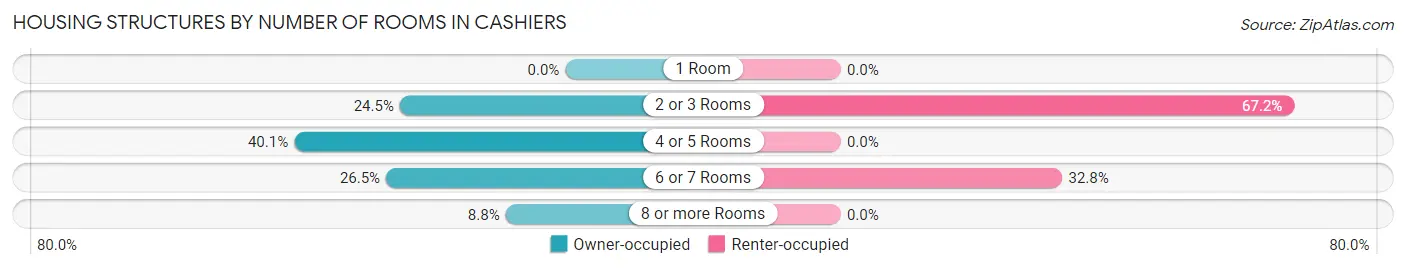
| Number of Rooms | Owner-occupied | Renter-occupied |
| 1 Room | 0 (0.0%) | 0 (0.0%) |
| 2 or 3 Rooms | 72 (24.5%) | 41 (67.2%) |
| 4 or 5 Rooms | 118 (40.1%) | 0 (0.0%) |
| 6 or 7 Rooms | 78 (26.5%) | 20 (32.8%) |
| 8 or more Rooms | 26 (8.8%) | 0 (0.0%) |
| Total | 294 (100.0%) | 61 (100.0%) |
Housing Structure by Heating Type in Cashiers
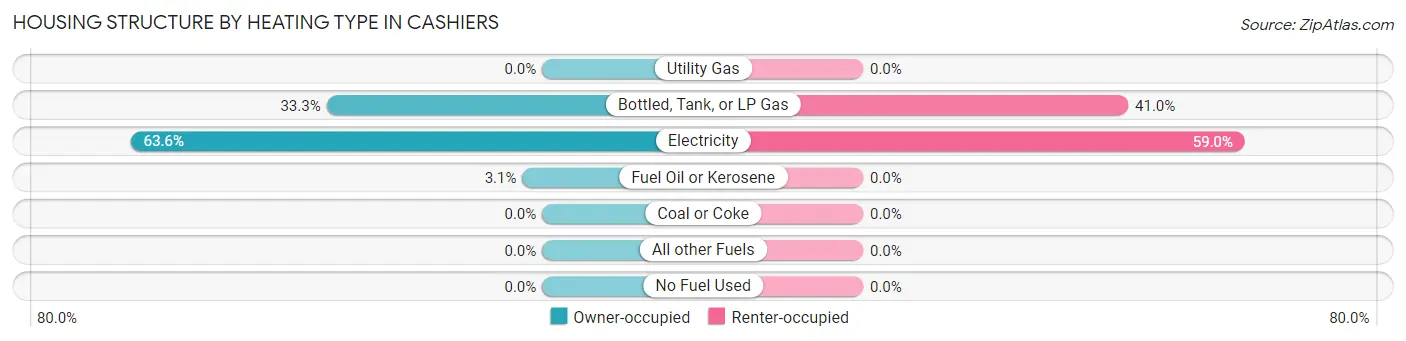
| Heating Type | Owner-occupied | Renter-occupied |
| Utility Gas | 0 (0.0%) | 0 (0.0%) |
| Bottled, Tank, or LP Gas | 98 (33.3%) | 25 (41.0%) |
| Electricity | 187 (63.6%) | 36 (59.0%) |
| Fuel Oil or Kerosene | 9 (3.1%) | 0 (0.0%) |
| Coal or Coke | 0 (0.0%) | 0 (0.0%) |
| All other Fuels | 0 (0.0%) | 0 (0.0%) |
| No Fuel Used | 0 (0.0%) | 0 (0.0%) |
| Total | 294 (100.0%) | 61 (100.0%) |
Household Vehicle Usage in Cashiers
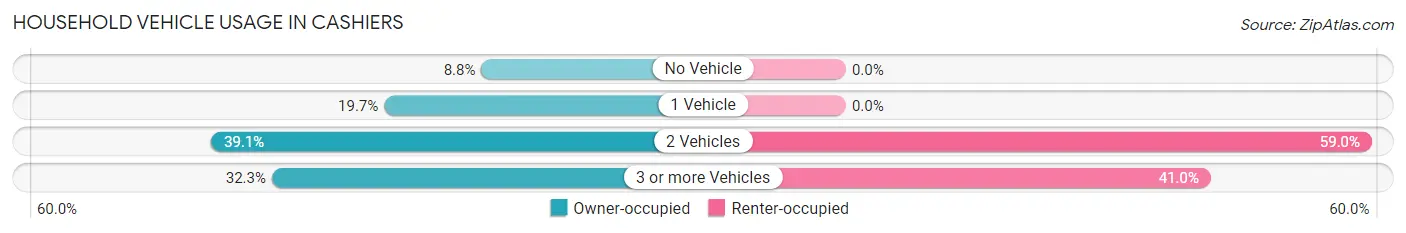
| Vehicles per Household | Owner-occupied | Renter-occupied |
| No Vehicle | 26 (8.8%) | 0 (0.0%) |
| 1 Vehicle | 58 (19.7%) | 0 (0.0%) |
| 2 Vehicles | 115 (39.1%) | 36 (59.0%) |
| 3 or more Vehicles | 95 (32.3%) | 25 (41.0%) |
| Total | 294 (100.0%) | 61 (100.0%) |
Real Estate & Mortgages in Cashiers
Real Estate and Mortgage Overview in Cashiers
| Characteristic | Without Mortgage | With Mortgage |
| Housing Units | 119 | 175 |
| Median Property Value | - | - |
| Median Household Income | - | - |
| Monthly Housing Costs | - | - |
| Real Estate Taxes | - | - |
Property Value by Mortgage Status in Cashiers
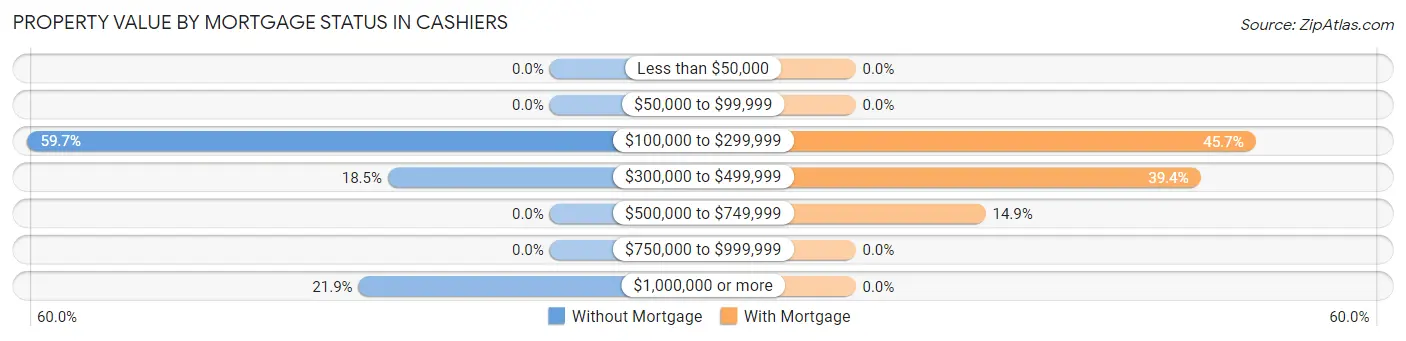
| Property Value | Without Mortgage | With Mortgage |
| Less than $50,000 | 0 (0.0%) | 0 (0.0%) |
| $50,000 to $99,999 | 0 (0.0%) | 0 (0.0%) |
| $100,000 to $299,999 | 71 (59.7%) | 80 (45.7%) |
| $300,000 to $499,999 | 22 (18.5%) | 69 (39.4%) |
| $500,000 to $749,999 | 0 (0.0%) | 26 (14.9%) |
| $750,000 to $999,999 | 0 (0.0%) | 0 (0.0%) |
| $1,000,000 or more | 26 (21.8%) | 0 (0.0%) |
| Total | 119 (100.0%) | 175 (100.0%) |
Household Income by Mortgage Status in Cashiers
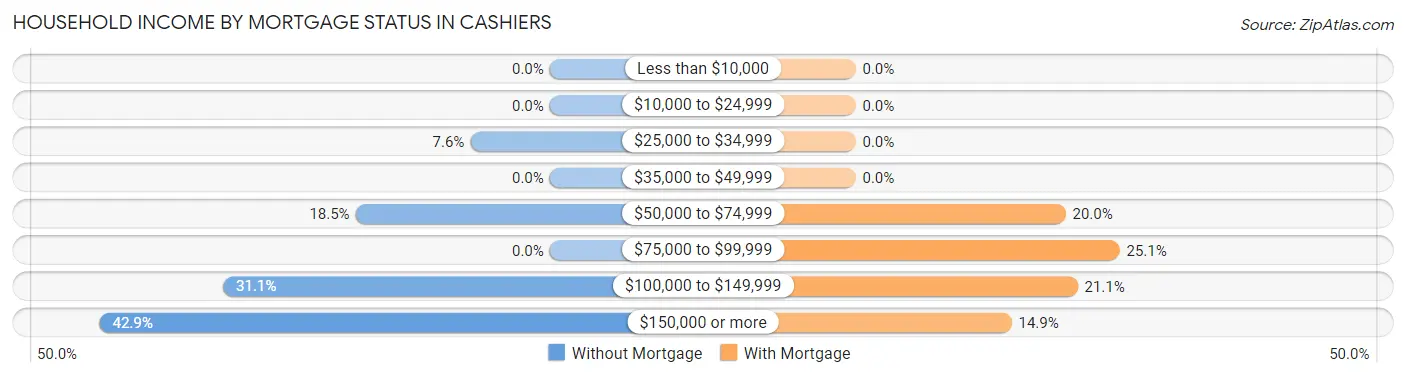
| Household Income | Without Mortgage | With Mortgage |
| Less than $10,000 | 0 (0.0%) | 0 (0.0%) |
| $10,000 to $24,999 | 0 (0.0%) | 0 (0.0%) |
| $25,000 to $34,999 | 9 (7.6%) | 0 (0.0%) |
| $35,000 to $49,999 | 0 (0.0%) | 0 (0.0%) |
| $50,000 to $74,999 | 22 (18.5%) | 35 (20.0%) |
| $75,000 to $99,999 | 0 (0.0%) | 44 (25.1%) |
| $100,000 to $149,999 | 37 (31.1%) | 37 (21.1%) |
| $150,000 or more | 51 (42.9%) | 26 (14.9%) |
| Total | 119 (100.0%) | 175 (100.0%) |
Property Value to Household Income Ratio in Cashiers
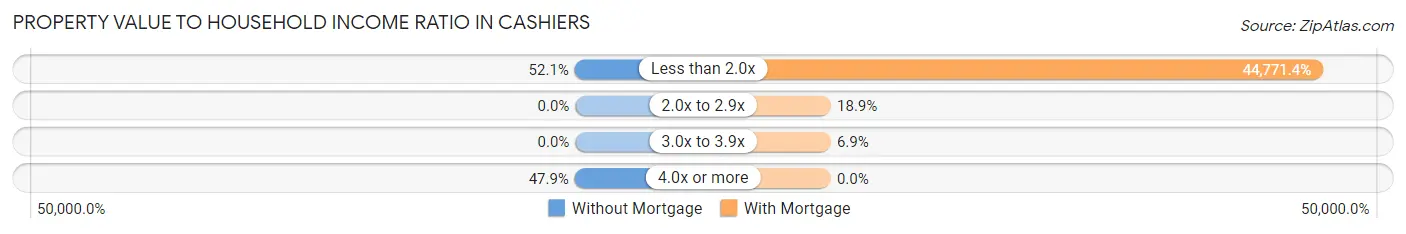
| Value-to-Income Ratio | Without Mortgage | With Mortgage |
| Less than 2.0x | 62 (52.1%) | 78,350 (44,771.4%) |
| 2.0x to 2.9x | 0 (0.0%) | 33 (18.9%) |
| 3.0x to 3.9x | 0 (0.0%) | 12 (6.9%) |
| 4.0x or more | 57 (47.9%) | 0 (0.0%) |
| Total | 119 (100.0%) | 175 (100.0%) |
Real Estate Taxes by Mortgage Status in Cashiers
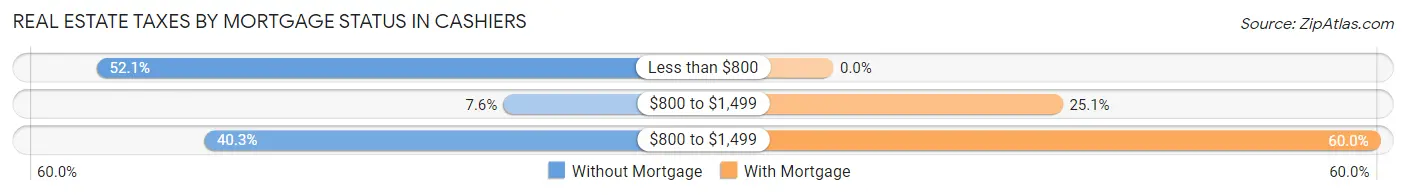
| Property Taxes | Without Mortgage | With Mortgage |
| Less than $800 | 62 (52.1%) | 0 (0.0%) |
| $800 to $1,499 | 9 (7.6%) | 44 (25.1%) |
| $800 to $1,499 | 48 (40.3%) | 105 (60.0%) |
| Total | 119 (100.0%) | 175 (100.0%) |
Health & Disability in Cashiers
Health Insurance Coverage by Age in Cashiers
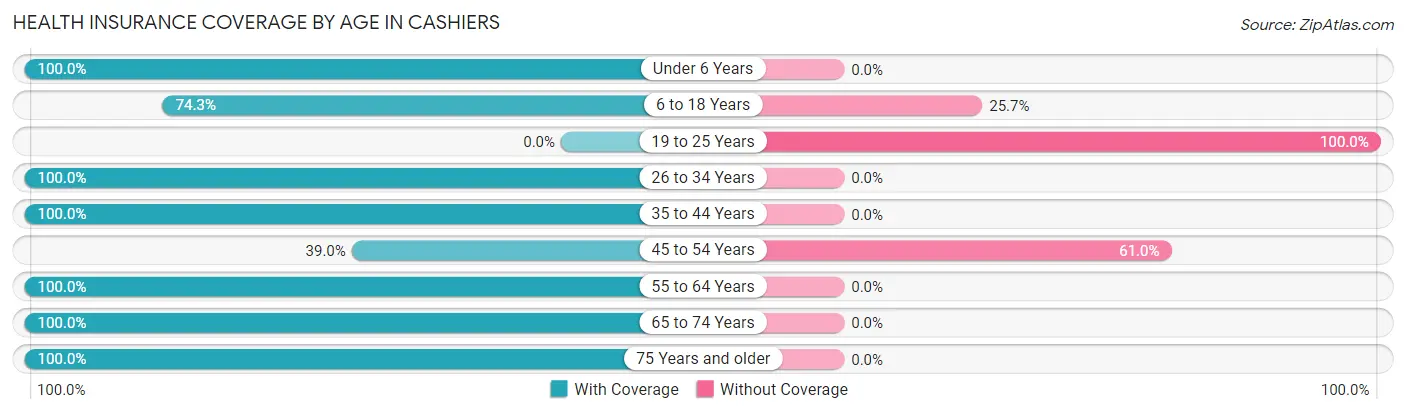
| Age Bracket | With Coverage | Without Coverage |
| Under 6 Years | 26 (100.0%) | 0 (0.0%) |
| 6 to 18 Years | 101 (74.3%) | 35 (25.7%) |
| 19 to 25 Years | 0 (0.0%) | 12 (100.0%) |
| 26 to 34 Years | 60 (100.0%) | 0 (0.0%) |
| 35 to 44 Years | 119 (100.0%) | 0 (0.0%) |
| 45 to 54 Years | 16 (39.0%) | 25 (61.0%) |
| 55 to 64 Years | 177 (100.0%) | 0 (0.0%) |
| 65 to 74 Years | 53 (100.0%) | 0 (0.0%) |
| 75 Years and older | 128 (100.0%) | 0 (0.0%) |
| Total | 680 (90.4%) | 72 (9.6%) |
Health Insurance Coverage by Citizenship Status in Cashiers
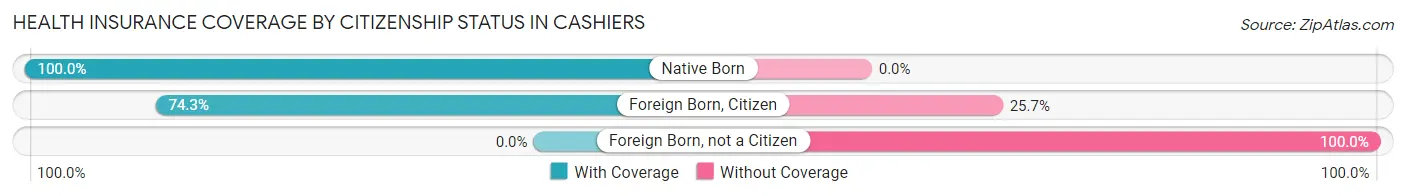
| Citizenship Status | With Coverage | Without Coverage |
| Native Born | 26 (100.0%) | 0 (0.0%) |
| Foreign Born, Citizen | 101 (74.3%) | 35 (25.7%) |
| Foreign Born, not a Citizen | 0 (0.0%) | 12 (100.0%) |
Health Insurance Coverage by Household Income in Cashiers
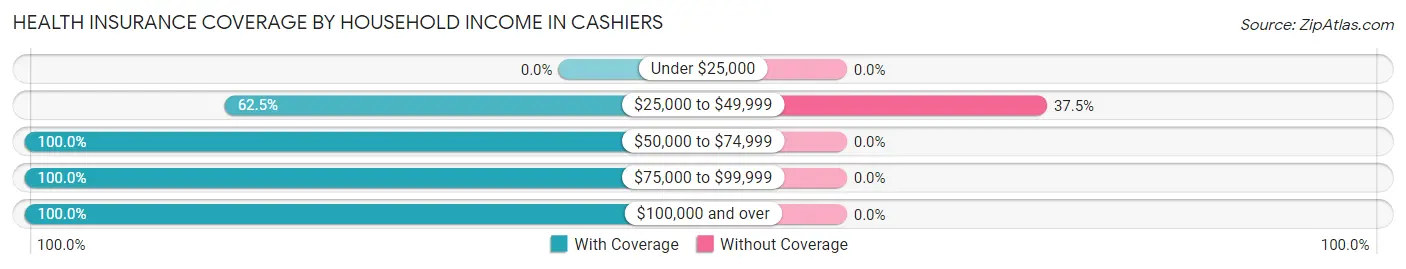
| Household Income | With Coverage | Without Coverage |
| Under $25,000 | 0 (0.0%) | 0 (0.0%) |
| $25,000 to $49,999 | 120 (62.5%) | 72 (37.5%) |
| $50,000 to $74,999 | 241 (100.0%) | 0 (0.0%) |
| $75,000 to $99,999 | 61 (100.0%) | 0 (0.0%) |
| $100,000 and over | 258 (100.0%) | 0 (0.0%) |
Public vs Private Health Insurance Coverage by Age in Cashiers
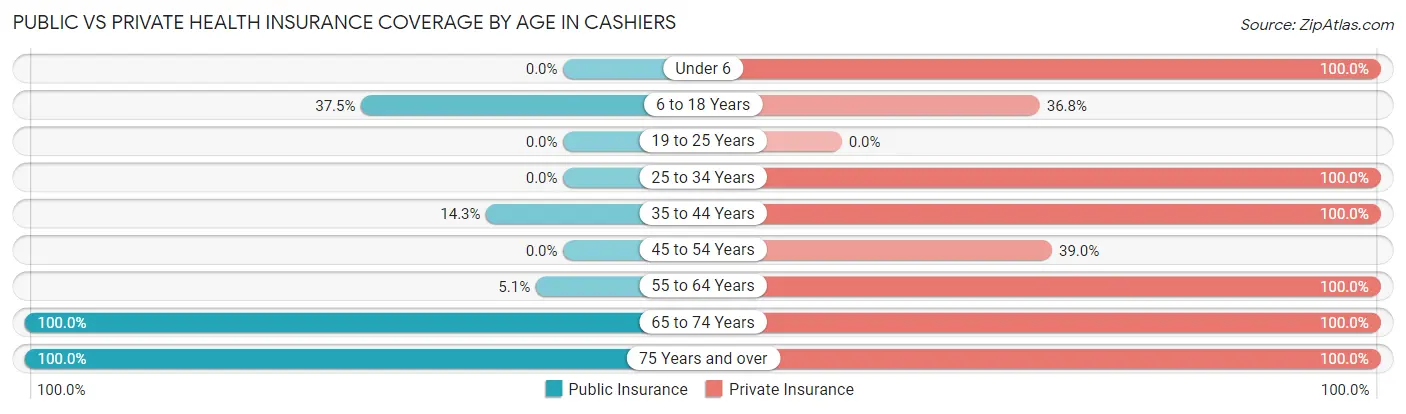
| Age Bracket | Public Insurance | Private Insurance |
| Under 6 | 0 (0.0%) | 26 (100.0%) |
| 6 to 18 Years | 51 (37.5%) | 50 (36.8%) |
| 19 to 25 Years | 0 (0.0%) | 0 (0.0%) |
| 25 to 34 Years | 0 (0.0%) | 60 (100.0%) |
| 35 to 44 Years | 17 (14.3%) | 119 (100.0%) |
| 45 to 54 Years | 0 (0.0%) | 16 (39.0%) |
| 55 to 64 Years | 9 (5.1%) | 177 (100.0%) |
| 65 to 74 Years | 53 (100.0%) | 53 (100.0%) |
| 75 Years and over | 128 (100.0%) | 128 (100.0%) |
| Total | 258 (34.3%) | 629 (83.6%) |
Disability Status by Sex by Age in Cashiers
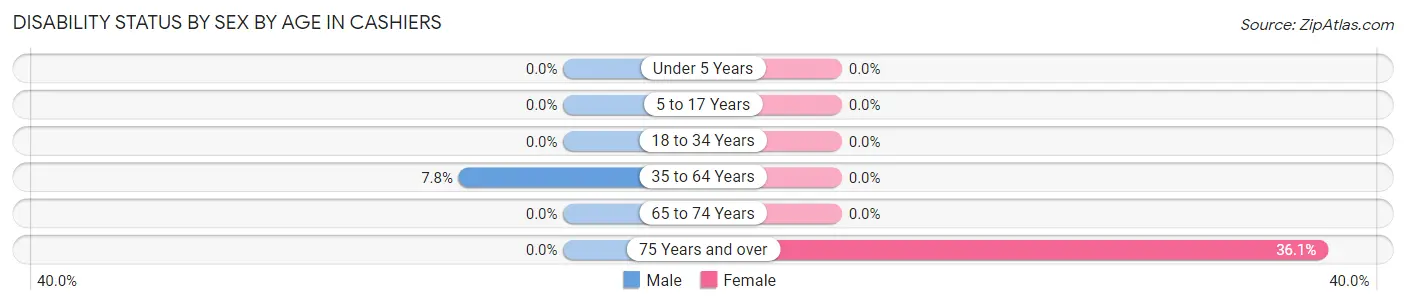
| Age Bracket | Male | Female |
| Under 5 Years | 0 (0.0%) | 0 (0.0%) |
| 5 to 17 Years | 0 (0.0%) | 0 (0.0%) |
| 18 to 34 Years | 0 (0.0%) | 0 (0.0%) |
| 35 to 64 Years | 17 (7.8%) | 0 (0.0%) |
| 65 to 74 Years | 0 (0.0%) | 0 (0.0%) |
| 75 Years and over | 0 (0.0%) | 26 (36.1%) |
Disability Class by Sex by Age in Cashiers
Disability Class: Hearing Difficulty
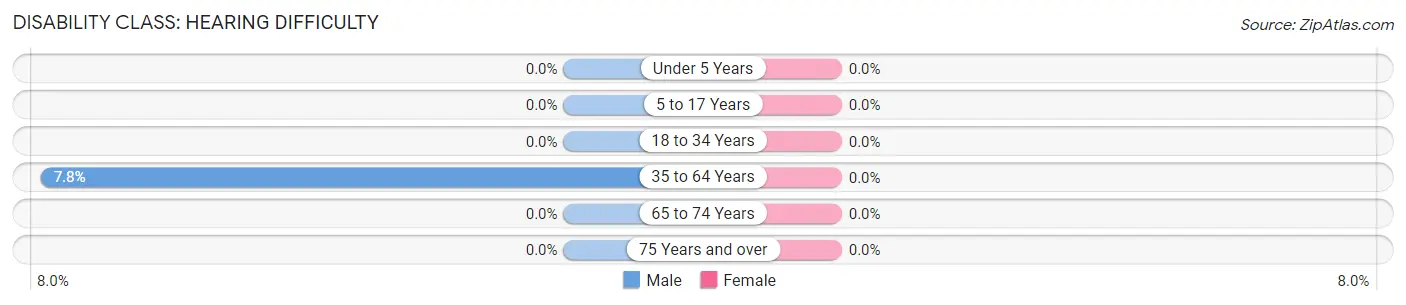
| Age Bracket | Male | Female |
| Under 5 Years | 0 (0.0%) | 0 (0.0%) |
| 5 to 17 Years | 0 (0.0%) | 0 (0.0%) |
| 18 to 34 Years | 0 (0.0%) | 0 (0.0%) |
| 35 to 64 Years | 17 (7.8%) | 0 (0.0%) |
| 65 to 74 Years | 0 (0.0%) | 0 (0.0%) |
| 75 Years and over | 0 (0.0%) | 0 (0.0%) |
Disability Class: Vision Difficulty
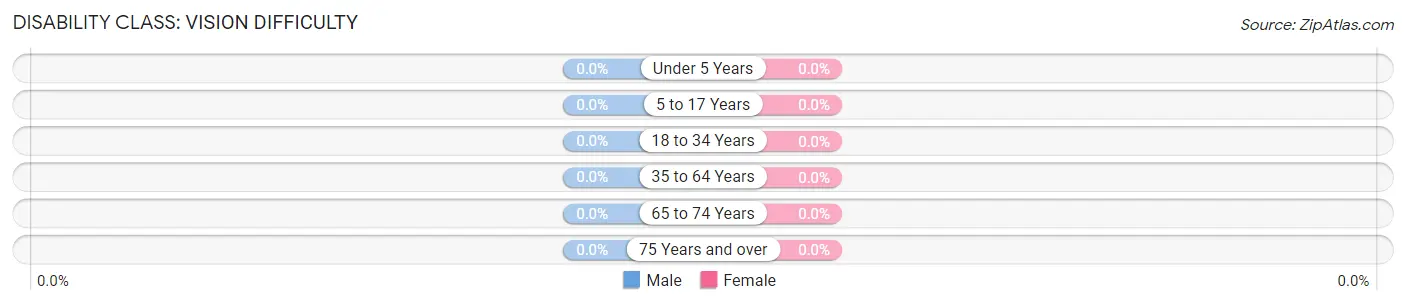
| Age Bracket | Male | Female |
| Under 5 Years | 0 (0.0%) | 0 (0.0%) |
| 5 to 17 Years | 0 (0.0%) | 0 (0.0%) |
| 18 to 34 Years | 0 (0.0%) | 0 (0.0%) |
| 35 to 64 Years | 0 (0.0%) | 0 (0.0%) |
| 65 to 74 Years | 0 (0.0%) | 0 (0.0%) |
| 75 Years and over | 0 (0.0%) | 0 (0.0%) |
Disability Class: Cognitive Difficulty
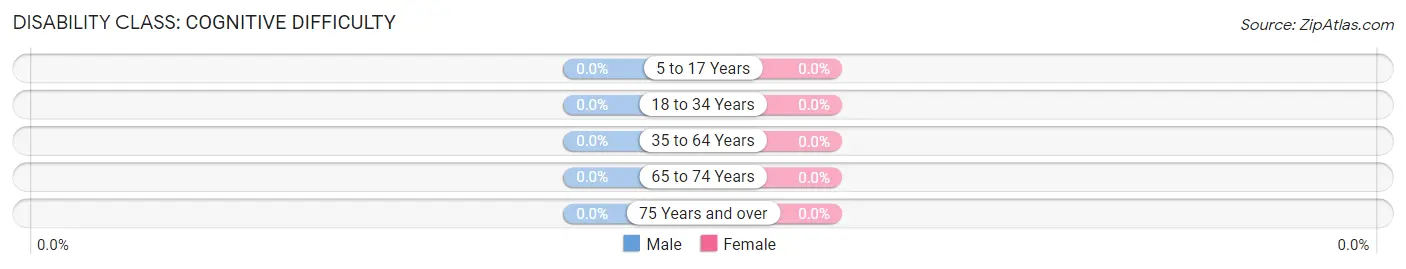
| Age Bracket | Male | Female |
| 5 to 17 Years | 0 (0.0%) | 0 (0.0%) |
| 18 to 34 Years | 0 (0.0%) | 0 (0.0%) |
| 35 to 64 Years | 0 (0.0%) | 0 (0.0%) |
| 65 to 74 Years | 0 (0.0%) | 0 (0.0%) |
| 75 Years and over | 0 (0.0%) | 0 (0.0%) |
Disability Class: Ambulatory Difficulty

| Age Bracket | Male | Female |
| 5 to 17 Years | 0 (0.0%) | 0 (0.0%) |
| 18 to 34 Years | 0 (0.0%) | 0 (0.0%) |
| 35 to 64 Years | 17 (7.8%) | 0 (0.0%) |
| 65 to 74 Years | 0 (0.0%) | 0 (0.0%) |
| 75 Years and over | 0 (0.0%) | 26 (36.1%) |
Disability Class: Self-Care Difficulty
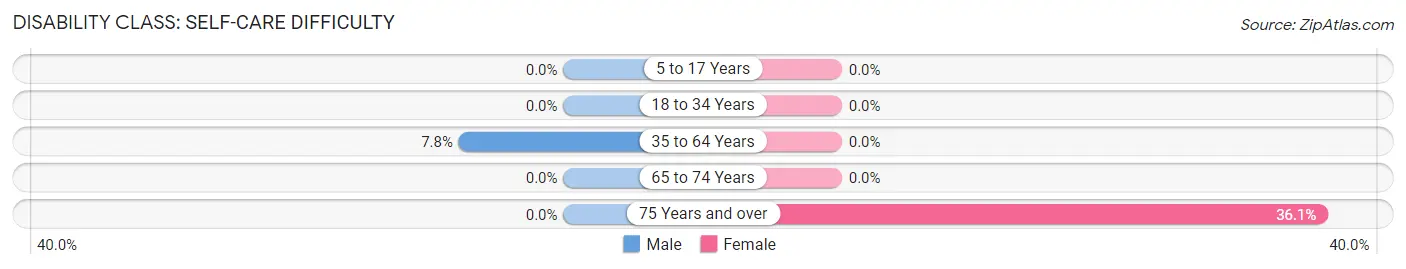
| Age Bracket | Male | Female |
| 5 to 17 Years | 0 (0.0%) | 0 (0.0%) |
| 18 to 34 Years | 0 (0.0%) | 0 (0.0%) |
| 35 to 64 Years | 17 (7.8%) | 0 (0.0%) |
| 65 to 74 Years | 0 (0.0%) | 0 (0.0%) |
| 75 Years and over | 0 (0.0%) | 26 (36.1%) |
Technology Access in Cashiers
Computing Device Access in Cashiers
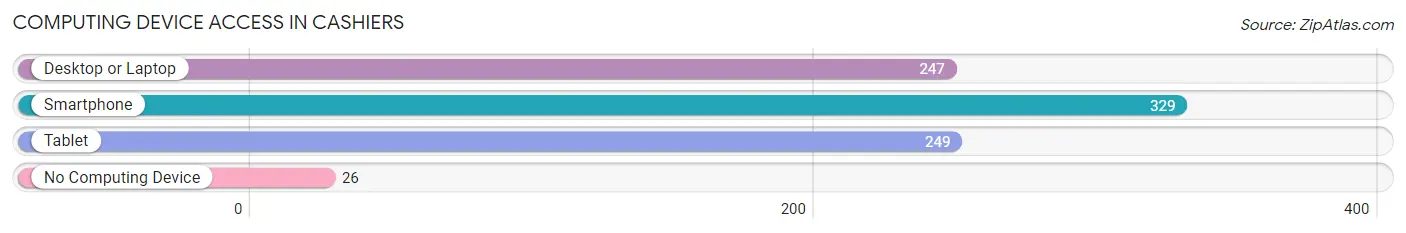
| Device Type | # Households | % Households |
| Desktop or Laptop | 247 | 69.6% |
| Smartphone | 329 | 92.7% |
| Tablet | 249 | 70.1% |
| No Computing Device | 26 | 7.3% |
| Total | 355 | 100.0% |
Internet Access in Cashiers
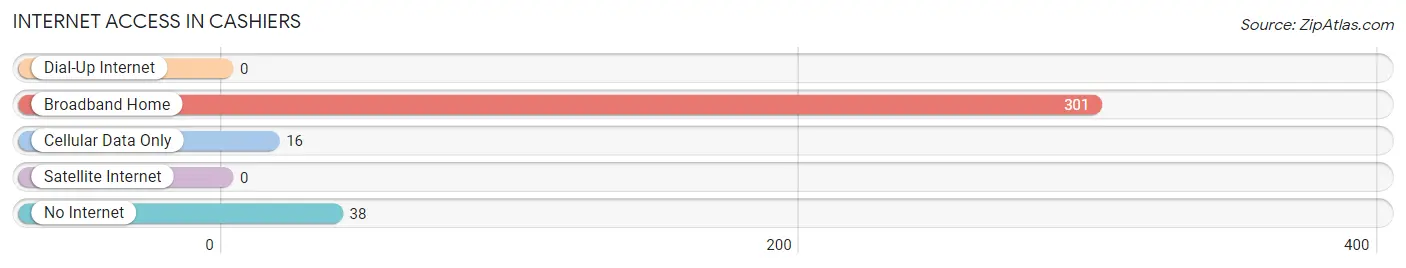
| Internet Type | # Households | % Households |
| Dial-Up Internet | 0 | 0.0% |
| Broadband Home | 301 | 84.8% |
| Cellular Data Only | 16 | 4.5% |
| Satellite Internet | 0 | 0.0% |
| No Internet | 38 | 10.7% |
| Total | 355 | 100.0% |
Cashiers Summary
Cashiers, North Carolina is a small mountain town located in the Blue Ridge Mountains of Jackson County. It is situated at an elevation of 3,000 feet and is surrounded by the Nantahala National Forest. The town is known for its picturesque views, outdoor activities, and its unique shopping and dining experiences.
History
The area that is now Cashiers was first settled in the late 1700s by the Cherokee Indians. The town was originally known as “White Town” and was a trading post for the Cherokee. In 1848, the town was renamed Cashiers after a local storekeeper, John Cashier. The town was officially incorporated in 1875.
In the late 1800s, Cashiers became a popular summer destination for wealthy families from the South. The town was known for its cool mountain air and its beautiful views. The town was also home to several resorts, including the Cashiers Inn, which was built in 1891.
In the early 1900s, Cashiers began to attract more visitors from outside the South. The town was known for its outdoor activities, such as fishing, hunting, and hiking. The town also became a popular destination for golfers, as several golf courses were built in the area.
Geography
Cashiers is located in the Blue Ridge Mountains of Jackson County. The town is situated at an elevation of 3,000 feet and is surrounded by the Nantahala National Forest. The town is located near several mountain peaks, including Whiteside Mountain, which is the highest peak in the Eastern United States.
The town is located near several lakes, including Lake Glenville, Lake Toxaway, and Lake Jocassee. The town is also located near several rivers, including the Tuckasegee River and the Little Tennessee River.
Economy
The economy of Cashiers is largely based on tourism. The town is known for its outdoor activities, such as fishing, hunting, and hiking. The town is also home to several golf courses, which attract visitors from all over the country.
The town is also home to several restaurants, shops, and galleries. The town is known for its unique shopping and dining experiences.
Demographics
As of the 2010 census, the population of Cashiers was 1,817. The town is predominantly white, with 92.3% of the population identifying as white. The median household income in the town is $45,000.
Conclusion
Cashiers, North Carolina is a small mountain town located in the Blue Ridge Mountains of Jackson County. The town is known for its picturesque views, outdoor activities, and its unique shopping and dining experiences. The economy of Cashiers is largely based on tourism, and the town is home to several restaurants, shops, and galleries. As of the 2010 census, the population of Cashiers was 1,817. The town is predominantly white, with 92.3% of the population identifying as white.
Common Questions
What is Per Capita Income in Cashiers?
Per Capita income in Cashiers is $54,735.
What is the Median Family Income in Cashiers?
Median Family Income in Cashiers is $78,250.
What is the Median Household income in Cashiers?
Median Household Income in Cashiers is $78,150.
What is Inequality or Gini Index in Cashiers?
Inequality or Gini Index in Cashiers is 0.39.
What is the Total Population of Cashiers?
Total Population of Cashiers is 752.
What is the Total Male Population of Cashiers?
Total Male Population of Cashiers is 365.
What is the Total Female Population of Cashiers?
Total Female Population of Cashiers is 387.
What is the Ratio of Males per 100 Females in Cashiers?
There are 94.32 Males per 100 Females in Cashiers.
What is the Ratio of Females per 100 Males in Cashiers?
There are 106.03 Females per 100 Males in Cashiers.
What is the Median Population Age in Cashiers?
Median Population Age in Cashiers is 46.9 Years.
What is the Average Family Size in Cashiers
Average Family Size in Cashiers is 2.6 People.
What is the Average Household Size in Cashiers
Average Household Size in Cashiers is 2.1 People.
How Large is the Labor Force in Cashiers?
There are 480 People in the Labor Forcein in Cashiers.
What is the Percentage of People in the Labor Force in Cashiers?
76.8% of People are in the Labor Force in Cashiers.