Lucama, NC
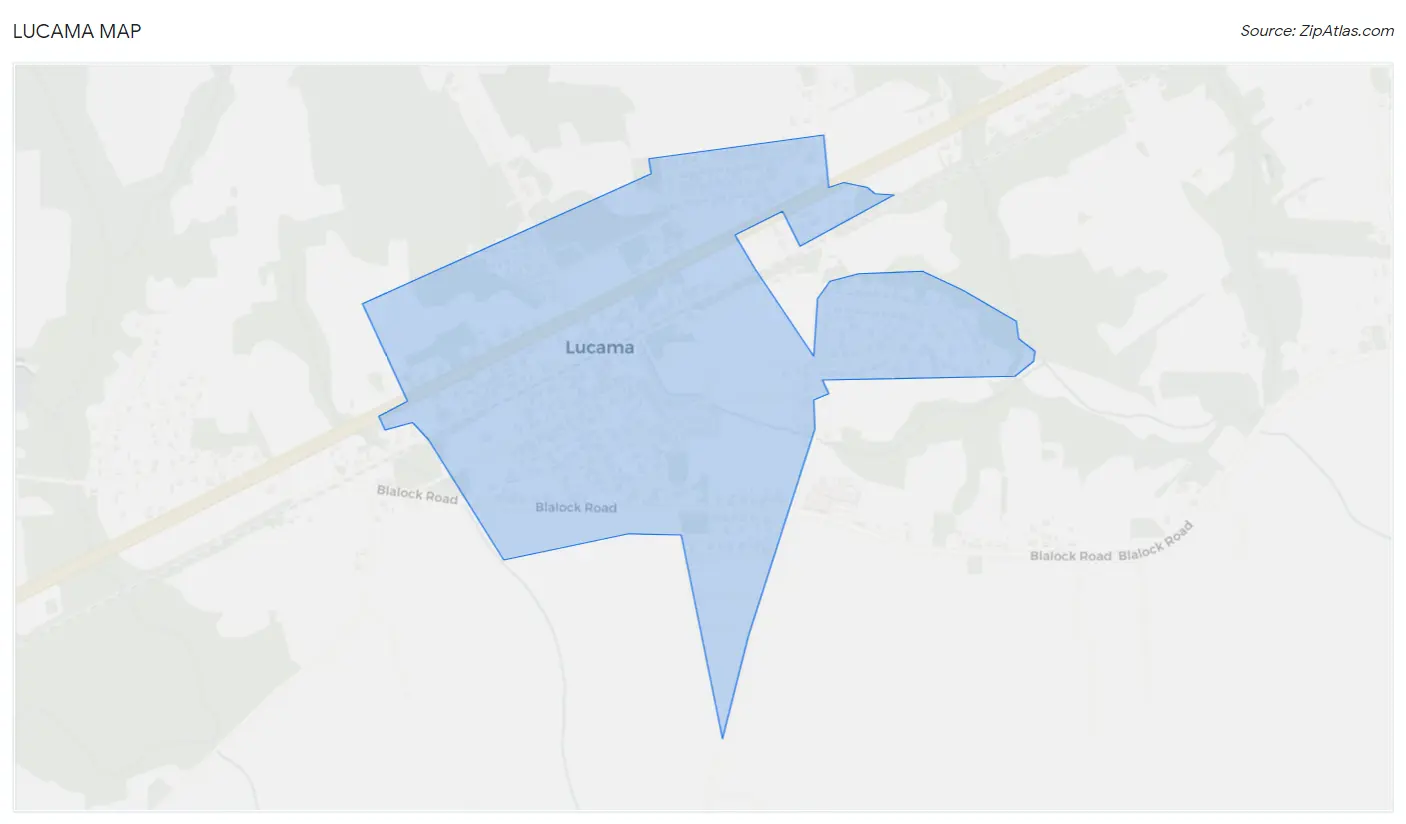
Lucama Map
Lucama Overview
1,058
TOTAL POPULATION
518
MALE POPULATION
540
FEMALE POPULATION
95.93
MALES / 100 FEMALES
104.25
FEMALES / 100 MALES
29.7
MEDIAN AGE
3.4
AVG FAMILY SIZE
2.7
AVG HOUSEHOLD SIZE
$18,643
PER CAPITA INCOME
$43,929
AVG FAMILY INCOME
$37,750
AVG HOUSEHOLD INCOME
29.0%
WAGE / INCOME GAP [ % ]
71.0¢/ $1
WAGE / INCOME GAP [ $ ]
0.42
INEQUALITY / GINI INDEX
476
LABOR FORCE [ PEOPLE ]
64.5%
PERCENT IN LABOR FORCE
11.1%
UNEMPLOYMENT RATE
Lucama Zip Codes
Lucama Area Codes
Race in Lucama
The most populous races in Lucama are White / Caucasian (554 | 52.4%), Black / African American (467 | 44.1%), and Hispanic or Latino (118 | 11.2%).
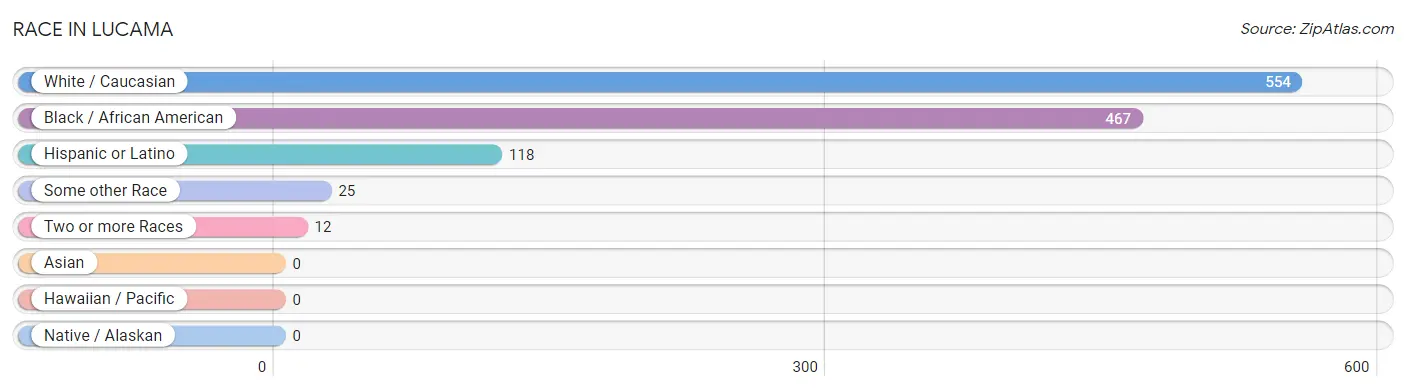
| Race | # Population | % Population |
| Asian | 0 | 0.0% |
| Black / African American | 467 | 44.1% |
| Hawaiian / Pacific | 0 | 0.0% |
| Hispanic or Latino | 118 | 11.2% |
| Native / Alaskan | 0 | 0.0% |
| White / Caucasian | 554 | 52.4% |
| Two or more Races | 12 | 1.1% |
| Some other Race | 25 | 2.4% |
| Total | 1,058 | 100.0% |
Ancestry in Lucama
The most populous ancestries reported in Lucama are American (278 | 26.3%), Mexican (118 | 11.2%), English (54 | 5.1%), Irish (22 | 2.1%), and German (8 | 0.8%), together accounting for 45.4% of all Lucama residents.
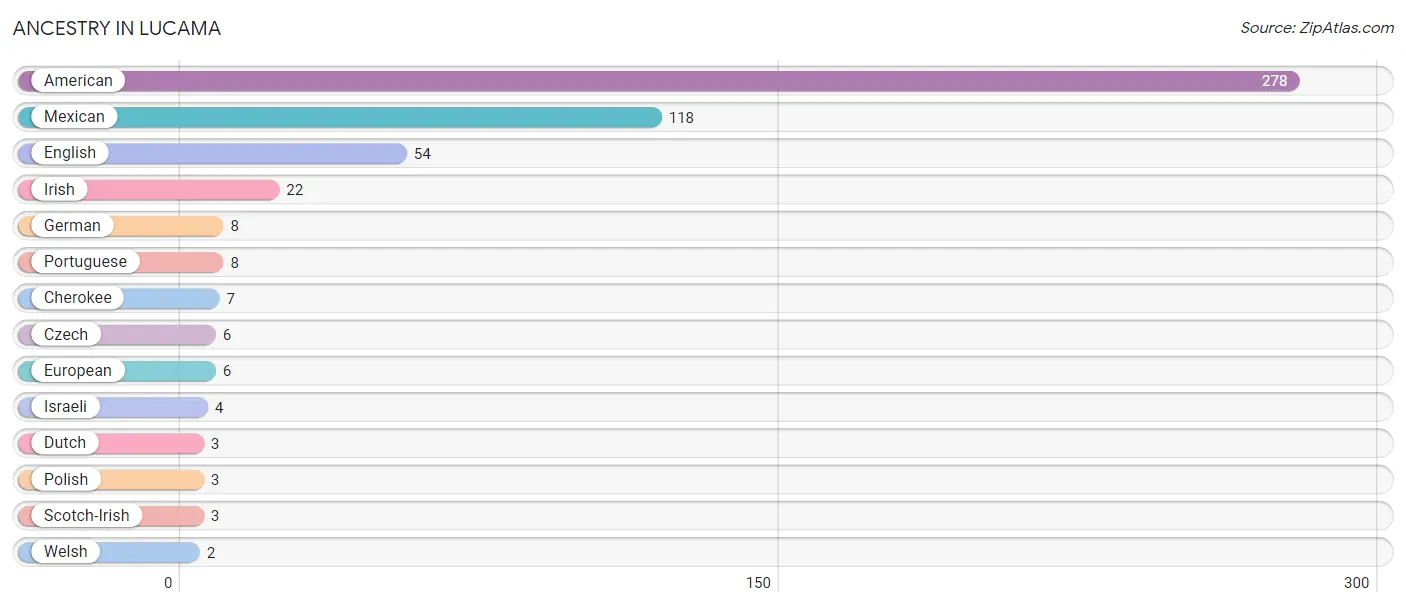
| Ancestry | # Population | % Population |
| American | 278 | 26.3% |
| Cherokee | 7 | 0.7% |
| Czech | 6 | 0.6% |
| Dutch | 3 | 0.3% |
| English | 54 | 5.1% |
| European | 6 | 0.6% |
| German | 8 | 0.8% |
| Irish | 22 | 2.1% |
| Israeli | 4 | 0.4% |
| Mexican | 118 | 11.2% |
| Polish | 3 | 0.3% |
| Portuguese | 8 | 0.8% |
| Scotch-Irish | 3 | 0.3% |
| Welsh | 2 | 0.2% | View All 14 Rows |
Immigrants in Lucama
The most numerous immigrant groups reported in Lucama came from Central America (89 | 8.4%), Latin America (89 | 8.4%), and Mexico (89 | 8.4%), together accounting for 25.2% of all Lucama residents.
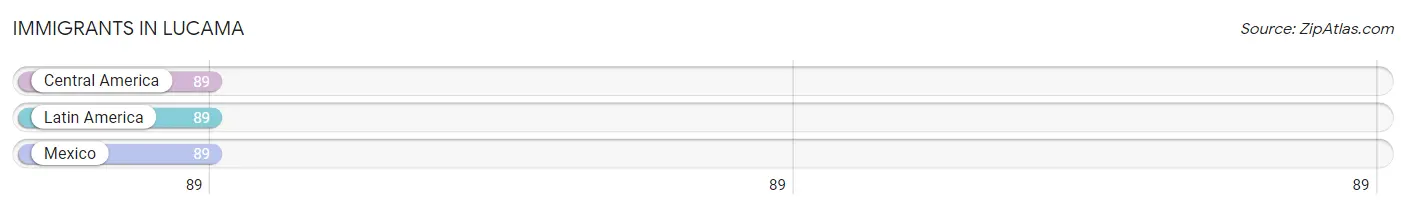
| Immigration Origin | # Population | % Population |
| Central America | 89 | 8.4% |
| Latin America | 89 | 8.4% |
| Mexico | 89 | 8.4% | View All 3 Rows |
Sex and Age in Lucama
Sex and Age in Lucama
The most populous age groups in Lucama are Under 5 Years (96 | 18.5%) for men and 5 to 9 Years (77 | 14.3%) for women.
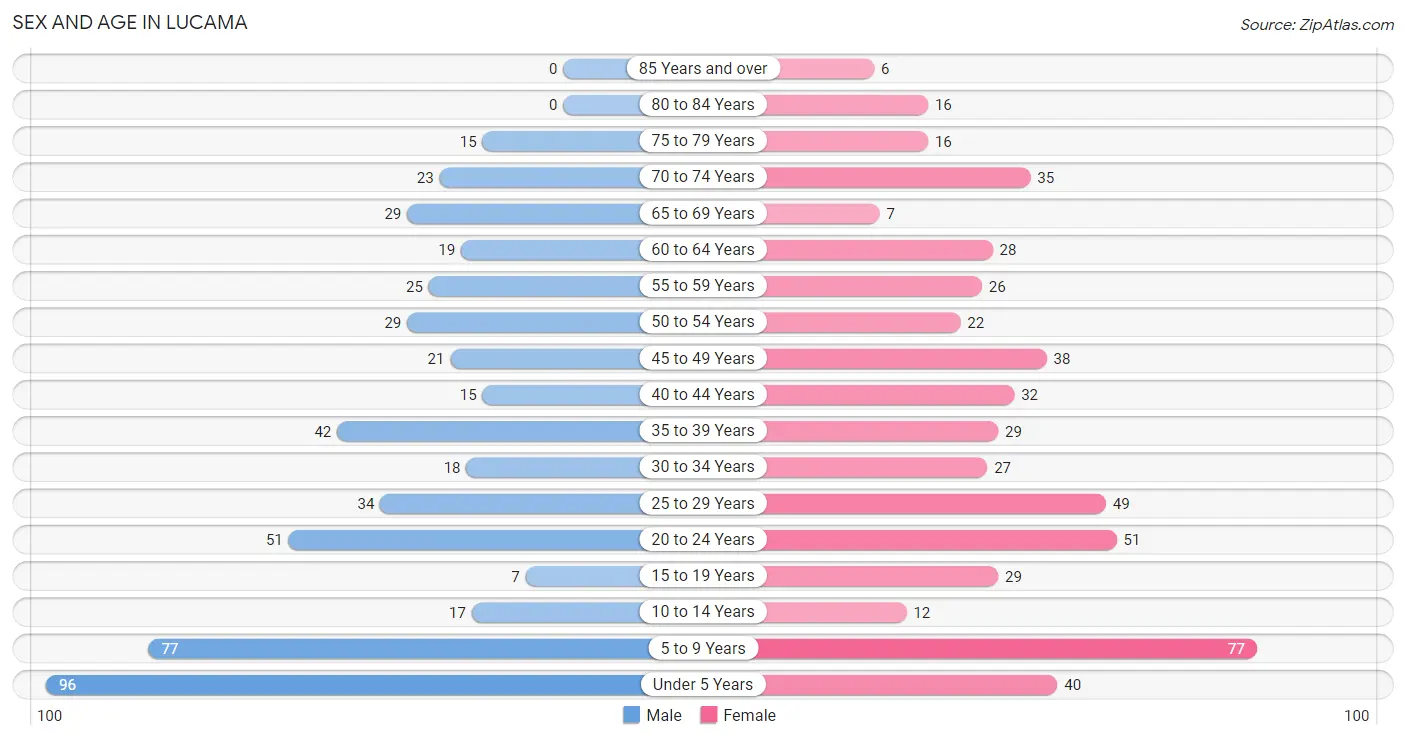
| Age Bracket | Male | Female |
| Under 5 Years | 96 (18.5%) | 40 (7.4%) |
| 5 to 9 Years | 77 (14.9%) | 77 (14.3%) |
| 10 to 14 Years | 17 (3.3%) | 12 (2.2%) |
| 15 to 19 Years | 7 (1.3%) | 29 (5.4%) |
| 20 to 24 Years | 51 (9.9%) | 51 (9.4%) |
| 25 to 29 Years | 34 (6.6%) | 49 (9.1%) |
| 30 to 34 Years | 18 (3.5%) | 27 (5.0%) |
| 35 to 39 Years | 42 (8.1%) | 29 (5.4%) |
| 40 to 44 Years | 15 (2.9%) | 32 (5.9%) |
| 45 to 49 Years | 21 (4.1%) | 38 (7.0%) |
| 50 to 54 Years | 29 (5.6%) | 22 (4.1%) |
| 55 to 59 Years | 25 (4.8%) | 26 (4.8%) |
| 60 to 64 Years | 19 (3.7%) | 28 (5.2%) |
| 65 to 69 Years | 29 (5.6%) | 7 (1.3%) |
| 70 to 74 Years | 23 (4.4%) | 35 (6.5%) |
| 75 to 79 Years | 15 (2.9%) | 16 (3.0%) |
| 80 to 84 Years | 0 (0.0%) | 16 (3.0%) |
| 85 Years and over | 0 (0.0%) | 6 (1.1%) |
| Total | 518 (100.0%) | 540 (100.0%) |
Families and Households in Lucama
Median Family Size in Lucama
The median family size in Lucama is 3.39 persons per family, with single female/mother families (54 | 20.3%) accounting for the largest median family size of 3.91 persons per family. On the other hand, single male/father families (18 | 6.8%) represent the smallest median family size with 1.89 persons per family.
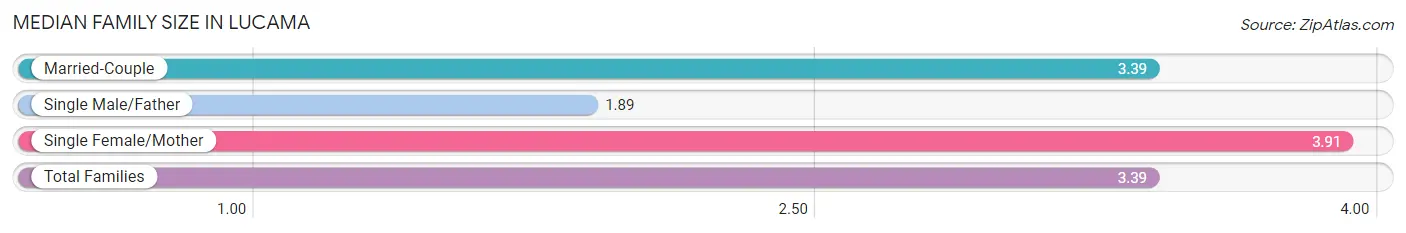
| Family Type | # Families | Family Size |
| Married-Couple | 194 (72.9%) | 3.39 |
| Single Male/Father | 18 (6.8%) | 1.89 |
| Single Female/Mother | 54 (20.3%) | 3.91 |
| Total Families | 266 (100.0%) | 3.39 |
Median Household Size in Lucama
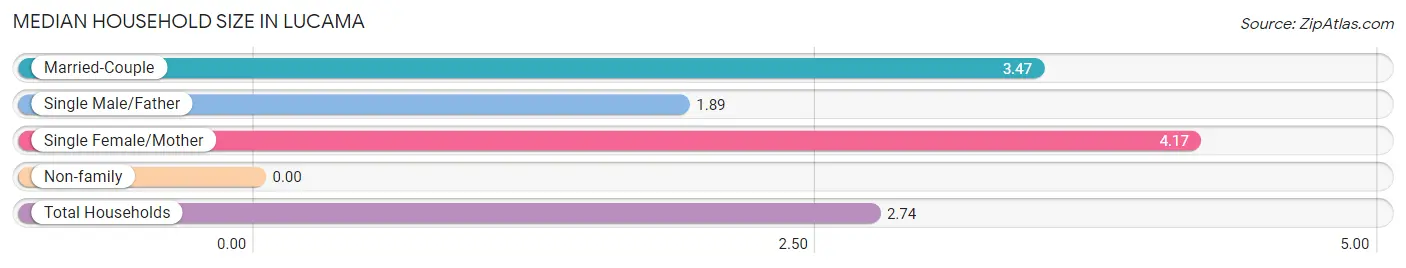
| Household Type | # Households | Household Size |
| Married-Couple | 194 (50.6%) | 3.47 |
| Single Male/Father | 18 (4.7%) | 1.89 |
| Single Female/Mother | 54 (14.1%) | 4.17 |
| Non-family | 117 (30.5%) | - |
| Total Households | 383 (100.0%) | 2.74 |
Household Size by Marriage Status in Lucama
Out of a total of 383 households in Lucama, 266 (69.5%) are family households, while 117 (30.5%) are nonfamily households. The most numerous type of family households are 2-person households, comprising 95, and the most common type of nonfamily households are 1-person households, comprising 117.
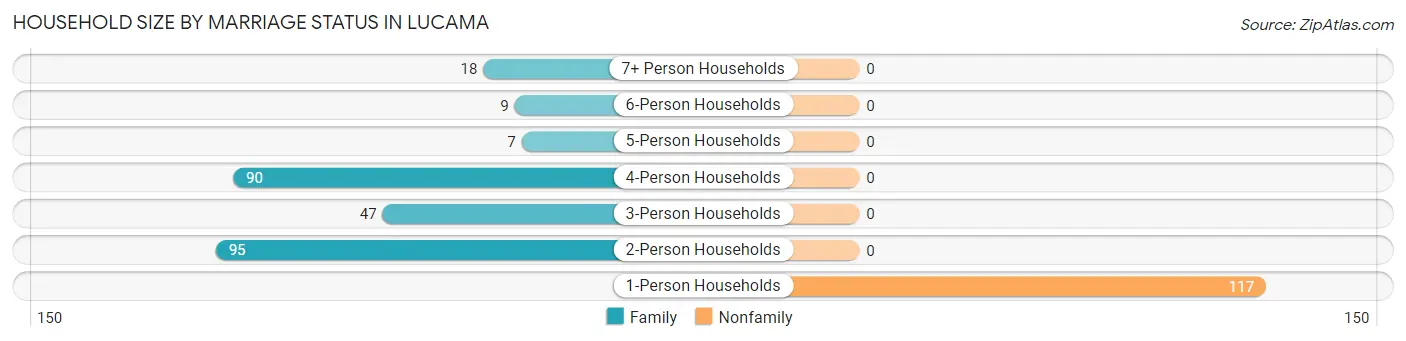
| Household Size | Family Households | Nonfamily Households |
| 1-Person Households | - | 117 (30.5%) |
| 2-Person Households | 95 (24.8%) | 0 (0.0%) |
| 3-Person Households | 47 (12.3%) | 0 (0.0%) |
| 4-Person Households | 90 (23.5%) | 0 (0.0%) |
| 5-Person Households | 7 (1.8%) | 0 (0.0%) |
| 6-Person Households | 9 (2.4%) | 0 (0.0%) |
| 7+ Person Households | 18 (4.7%) | 0 (0.0%) |
| Total | 266 (69.5%) | 117 (30.5%) |
Female Fertility in Lucama
Fertility by Age in Lucama
Average fertility rate in Lucama is 75.0 births per 1,000 women. Women in the age bracket of 20 to 34 years have the highest fertility rate with 150.0 births per 1,000 women. Women in the age bracket of 20 to 34 years acount for 100.0% of all women with births.
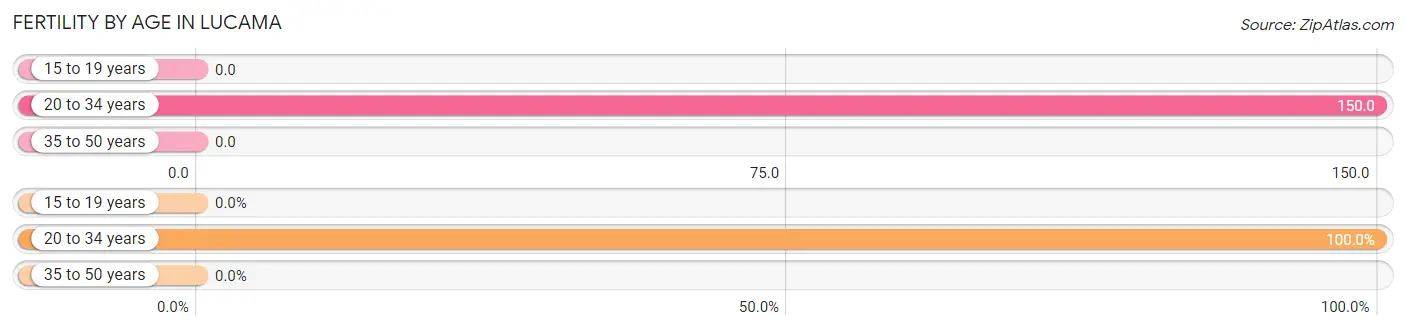
| Age Bracket | Women with Births | Births / 1,000 Women |
| 15 to 19 years | 0 (0.0%) | 0.0 |
| 20 to 34 years | 19 (100.0%) | 150.0 |
| 35 to 50 years | 0 (0.0%) | 0.0 |
| Total | 19 (100.0%) | 75.0 |
Fertility by Age by Marriage Status in Lucama
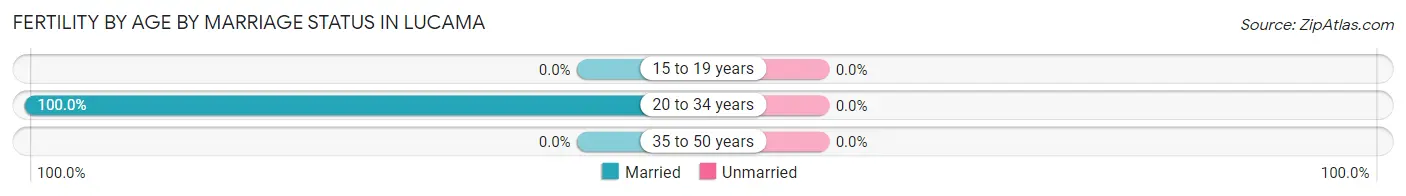
| Age Bracket | Married | Unmarried |
| 15 to 19 years | 0 (0.0%) | 0 (0.0%) |
| 20 to 34 years | 19 (100.0%) | 0 (0.0%) |
| 35 to 50 years | 0 (0.0%) | 0 (0.0%) |
| Total | 19 (100.0%) | 0 (0.0%) |
Fertility by Education in Lucama
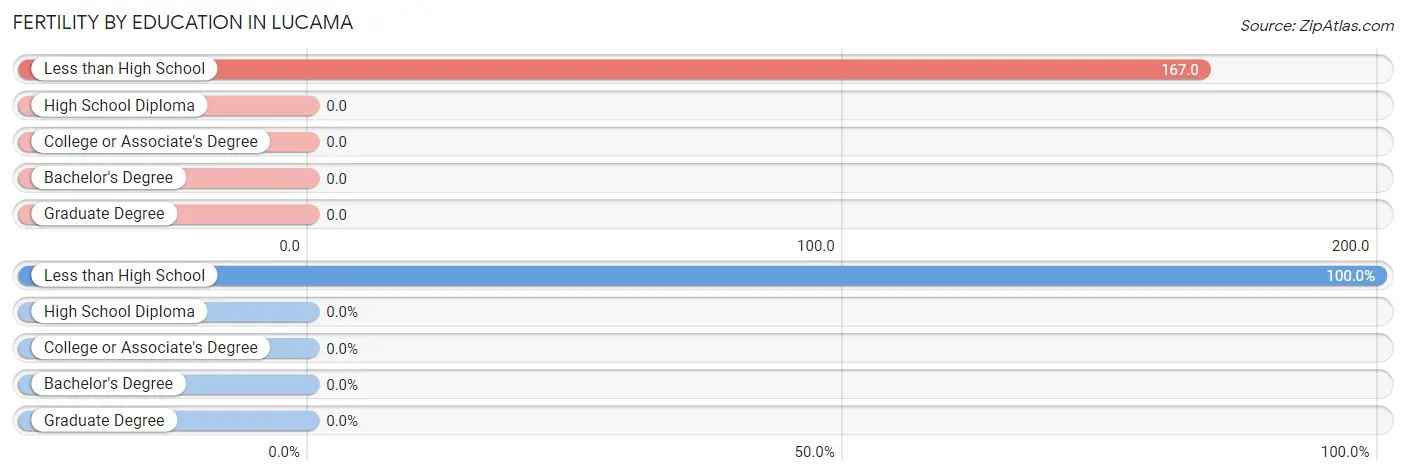
| Educational Attainment | Women with Births | Births / 1,000 Women |
| Less than High School | 19 (100.0%) | 167.0 |
| High School Diploma | 0 (0.0%) | 0.0 |
| College or Associate's Degree | 0 (0.0%) | 0.0 |
| Bachelor's Degree | 0 (0.0%) | 0.0 |
| Graduate Degree | 0 (0.0%) | 0.0 |
| Total | 19 (100.0%) | 75.0 |
Fertility by Education by Marriage Status in Lucama
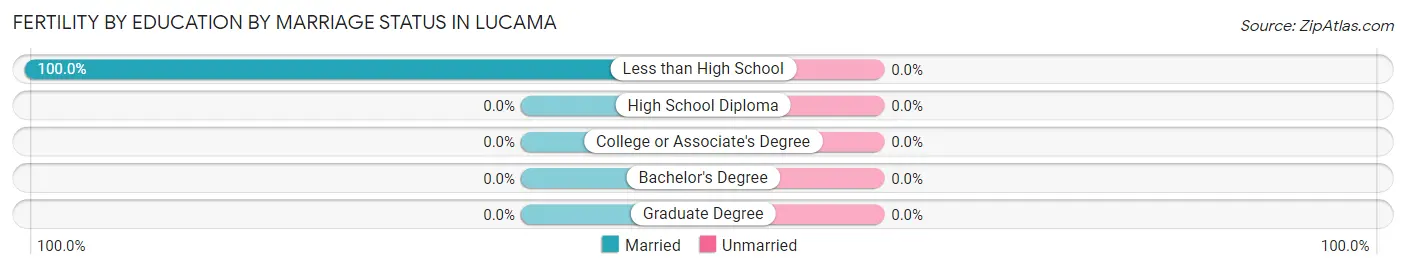
| Educational Attainment | Married | Unmarried |
| Less than High School | 19 (100.0%) | 0 (0.0%) |
| High School Diploma | 0 (0.0%) | 0 (0.0%) |
| College or Associate's Degree | 0 (0.0%) | 0 (0.0%) |
| Bachelor's Degree | 0 (0.0%) | 0 (0.0%) |
| Graduate Degree | 0 (0.0%) | 0 (0.0%) |
| Total | 19 (100.0%) | 0 (0.0%) |
Income in Lucama
Income Overview in Lucama
Per Capita Income in Lucama is $18,643, while median incomes of families and households are $43,929 and $37,750 respectively.
| Characteristic | Number | Measure |
| Per Capita Income | 1,058 | $18,643 |
| Median Family Income | 266 | $43,929 |
| Mean Family Income | 266 | $56,784 |
| Median Household Income | 383 | $37,750 |
| Mean Household Income | 383 | $50,502 |
| Income Deficit | 266 | $0 |
| Wage / Income Gap (%) | 1,058 | 29.01% |
| Wage / Income Gap ($) | 1,058 | 70.99¢ per $1 |
| Gini / Inequality Index | 1,058 | 0.42 |
Earnings by Sex in Lucama
Average Earnings in Lucama are $19,864, $26,211 for men and $18,608 for women, a difference of 29.0%.
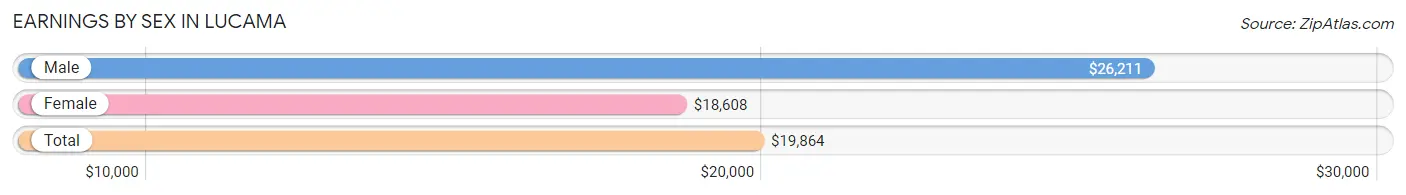
| Sex | Number | Average Earnings |
| Male | 249 (51.7%) | $26,211 |
| Female | 233 (48.3%) | $18,608 |
| Total | 482 (100.0%) | $19,864 |
Earnings by Sex by Income Bracket in Lucama
The most common earnings brackets in Lucama are $65,000 to $74,999 for men (45 | 18.1%) and $17,500 to $19,999 for women (44 | 18.9%).
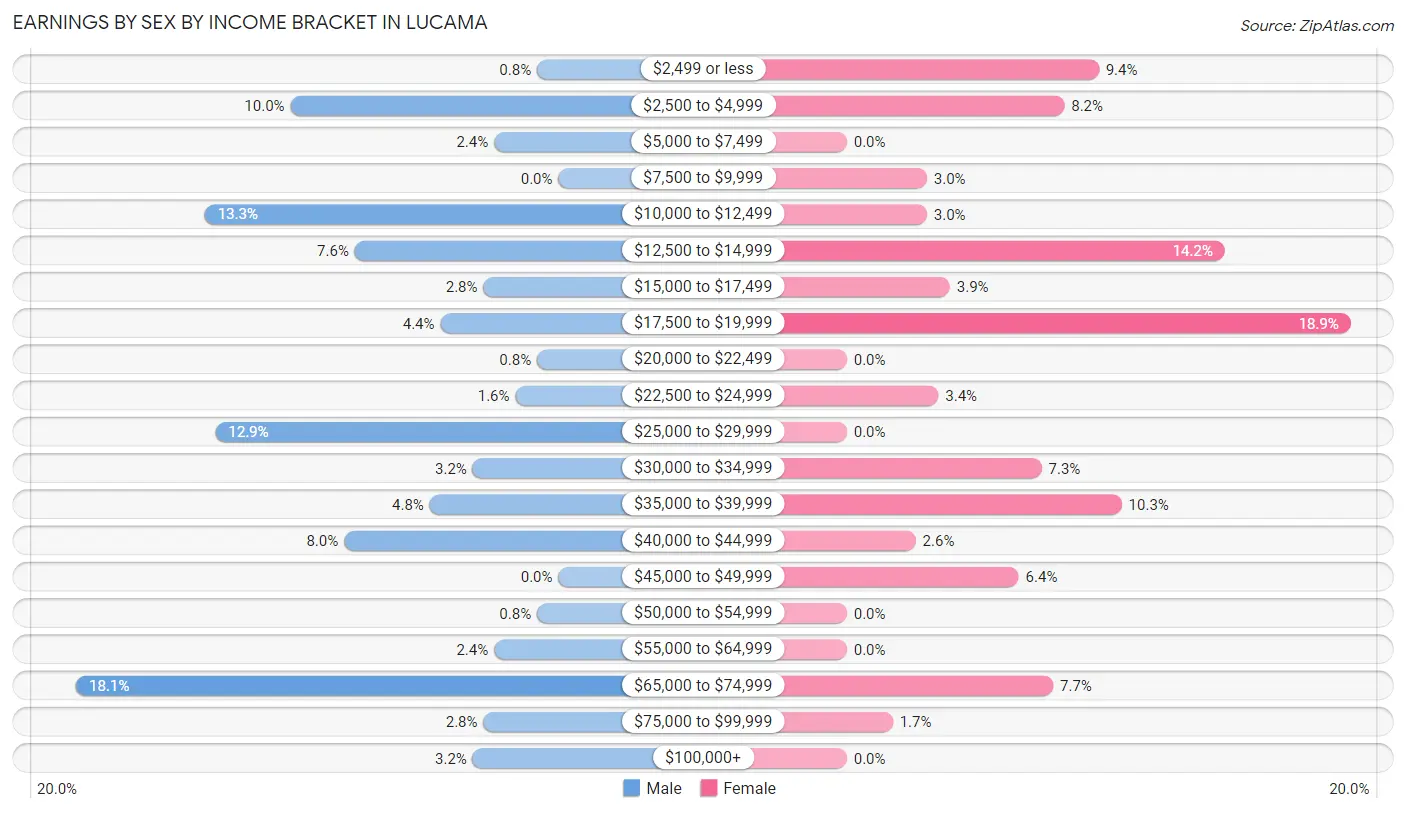
| Income | Male | Female |
| $2,499 or less | 2 (0.8%) | 22 (9.4%) |
| $2,500 to $4,999 | 25 (10.0%) | 19 (8.2%) |
| $5,000 to $7,499 | 6 (2.4%) | 0 (0.0%) |
| $7,500 to $9,999 | 0 (0.0%) | 7 (3.0%) |
| $10,000 to $12,499 | 33 (13.3%) | 7 (3.0%) |
| $12,500 to $14,999 | 19 (7.6%) | 33 (14.2%) |
| $15,000 to $17,499 | 7 (2.8%) | 9 (3.9%) |
| $17,500 to $19,999 | 11 (4.4%) | 44 (18.9%) |
| $20,000 to $22,499 | 2 (0.8%) | 0 (0.0%) |
| $22,500 to $24,999 | 4 (1.6%) | 8 (3.4%) |
| $25,000 to $29,999 | 32 (12.9%) | 0 (0.0%) |
| $30,000 to $34,999 | 8 (3.2%) | 17 (7.3%) |
| $35,000 to $39,999 | 12 (4.8%) | 24 (10.3%) |
| $40,000 to $44,999 | 20 (8.0%) | 6 (2.6%) |
| $45,000 to $49,999 | 0 (0.0%) | 15 (6.4%) |
| $50,000 to $54,999 | 2 (0.8%) | 0 (0.0%) |
| $55,000 to $64,999 | 6 (2.4%) | 0 (0.0%) |
| $65,000 to $74,999 | 45 (18.1%) | 18 (7.7%) |
| $75,000 to $99,999 | 7 (2.8%) | 4 (1.7%) |
| $100,000+ | 8 (3.2%) | 0 (0.0%) |
| Total | 249 (100.0%) | 233 (100.0%) |
Earnings by Sex by Educational Attainment in Lucama
Average earnings in Lucama are $26,211 for men and $19,318 for women, a difference of 26.3%. Men with an educational attainment of bachelor's degree enjoy the highest average annual earnings of $44,118, while those with high school diploma education earn the least with $26,836. Women with an educational attainment of less than high school earn the most with the average annual earnings of $14,205, while those with less than high school education have the smallest earnings of $14,205.
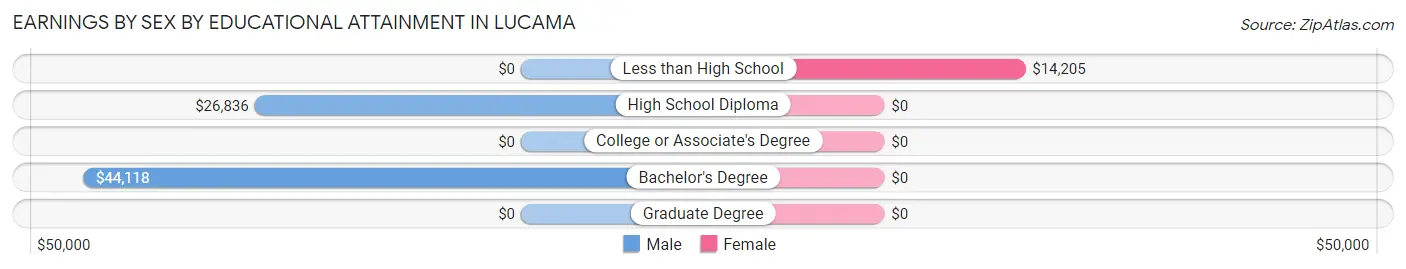
| Educational Attainment | Male Income | Female Income |
| Less than High School | - | - |
| High School Diploma | $26,836 | $0 |
| College or Associate's Degree | - | - |
| Bachelor's Degree | $44,118 | $0 |
| Graduate Degree | - | - |
| Total | $26,211 | $19,318 |
Family Income in Lucama
Family Income Brackets in Lucama
According to the Lucama family income data, there are 75 families falling into the $15,000 to $24,999 income range, which is the most common income bracket and makes up 28.2% of all families. Conversely, the $200,000+ income bracket is the least frequent group with only 1 families (0.4%) belonging to this category.
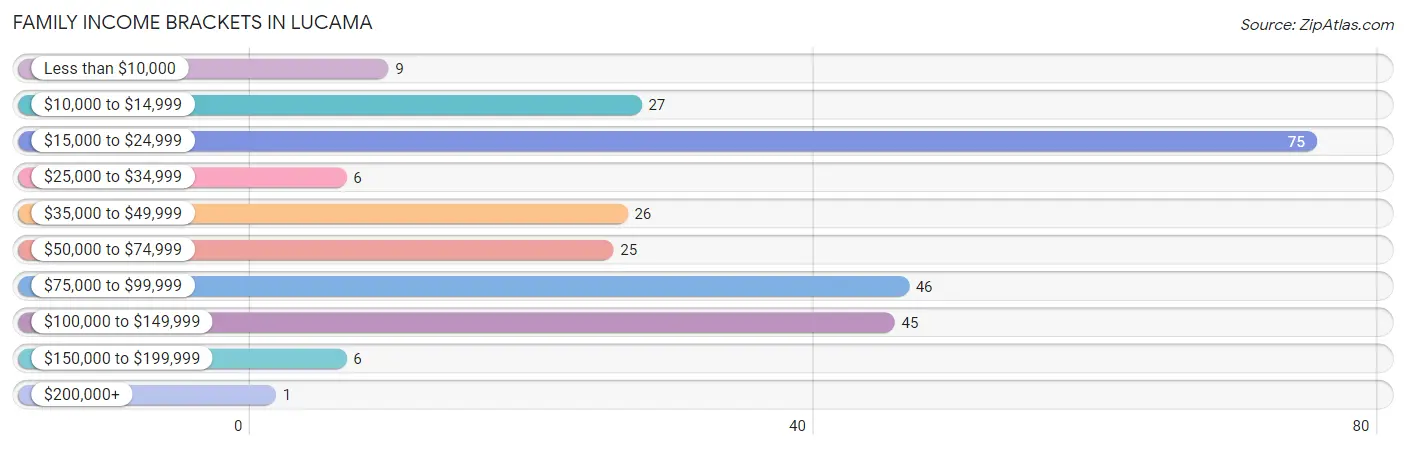
| Income Bracket | # Families | % Families |
| Less than $10,000 | 9 | 3.4% |
| $10,000 to $14,999 | 27 | 10.2% |
| $15,000 to $24,999 | 75 | 28.2% |
| $25,000 to $34,999 | 6 | 2.3% |
| $35,000 to $49,999 | 26 | 9.8% |
| $50,000 to $74,999 | 25 | 9.4% |
| $75,000 to $99,999 | 46 | 17.3% |
| $100,000 to $149,999 | 45 | 16.9% |
| $150,000 to $199,999 | 6 | 2.3% |
| $200,000+ | 1 | 0.4% |
Family Income by Famaliy Size in Lucama
2-person families (107 | 40.2%) account for the highest median family income in Lucama with $60,125 per family, while 2-person families (107 | 40.2%) have the highest median income of $30,062 per family member.
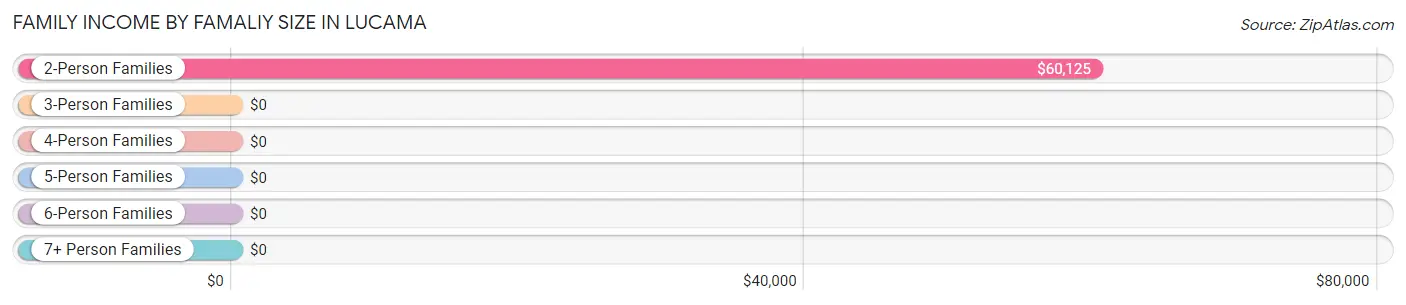
| Income Bracket | # Families | Median Income |
| 2-Person Families | 107 (40.2%) | $60,125 |
| 3-Person Families | 47 (17.7%) | $0 |
| 4-Person Families | 78 (29.3%) | $0 |
| 5-Person Families | 7 (2.6%) | $0 |
| 6-Person Families | 9 (3.4%) | $0 |
| 7+ Person Families | 18 (6.8%) | $0 |
| Total | 266 (100.0%) | $43,929 |
Family Income by Number of Earners in Lucama
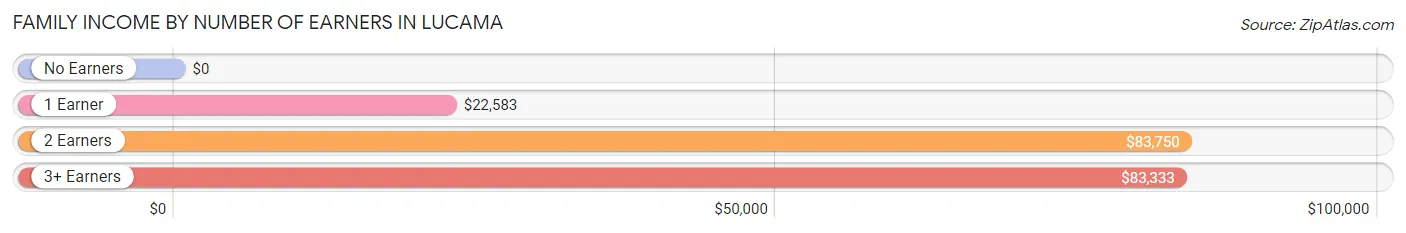
| Number of Earners | # Families | Median Income |
| No Earners | 31 (11.7%) | $0 |
| 1 Earner | 127 (47.7%) | $22,583 |
| 2 Earners | 78 (29.3%) | $83,750 |
| 3+ Earners | 30 (11.3%) | $83,333 |
| Total | 266 (100.0%) | $43,929 |
Household Income in Lucama
Household Income Brackets in Lucama
With 127 households falling in the category, the $15,000 to $24,999 income range is the most frequent in Lucama, accounting for 33.2% of all households. In contrast, only 1 households (0.3%) fall into the $200,000+ income bracket, making it the least populous group.
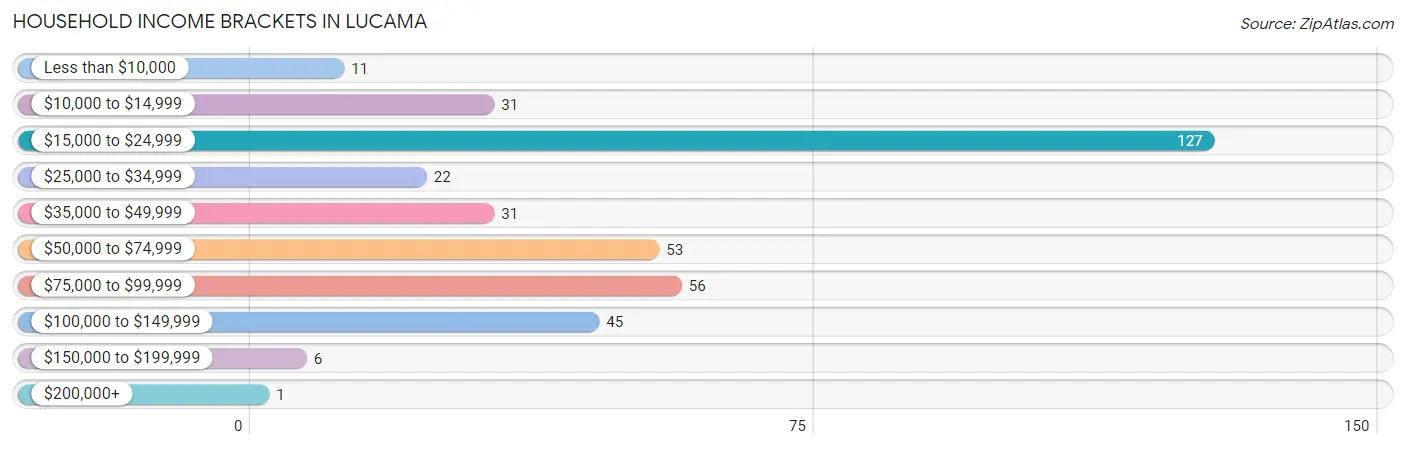
| Income Bracket | # Households | % Households |
| Less than $10,000 | 11 | 2.9% |
| $10,000 to $14,999 | 31 | 8.1% |
| $15,000 to $24,999 | 127 | 33.2% |
| $25,000 to $34,999 | 22 | 5.7% |
| $35,000 to $49,999 | 31 | 8.1% |
| $50,000 to $74,999 | 53 | 13.8% |
| $75,000 to $99,999 | 56 | 14.6% |
| $100,000 to $149,999 | 45 | 11.7% |
| $150,000 to $199,999 | 6 | 1.6% |
| $200,000+ | 1 | 0.3% |
Household Income by Householder Age in Lucama
The median household income in Lucama is $37,750, with the highest median household income of $60,375 found in the 65+ years age bracket for the primary householder. A total of 77 households (20.1%) fall into this category. Meanwhile, the 15 to 24 years age bracket for the primary householder has the lowest median household income of $0, with 51 households (13.3%) in this group.
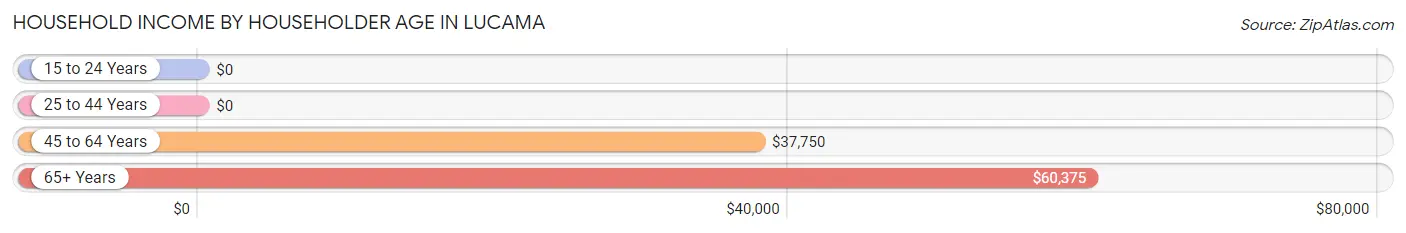
| Income Bracket | # Households | Median Income |
| 15 to 24 Years | 51 (13.3%) | $0 |
| 25 to 44 Years | 144 (37.6%) | $0 |
| 45 to 64 Years | 111 (29.0%) | $37,750 |
| 65+ Years | 77 (20.1%) | $60,375 |
| Total | 383 (100.0%) | $37,750 |
Poverty in Lucama
Income Below Poverty by Sex and Age in Lucama
With 29.3% poverty level for males and 35.8% for females among the residents of Lucama, 25 to 34 year old males and under 5 year old females are the most vulnerable to poverty, with 28 males (53.8%) and 34 females (85.0%) in their respective age groups living below the poverty level.
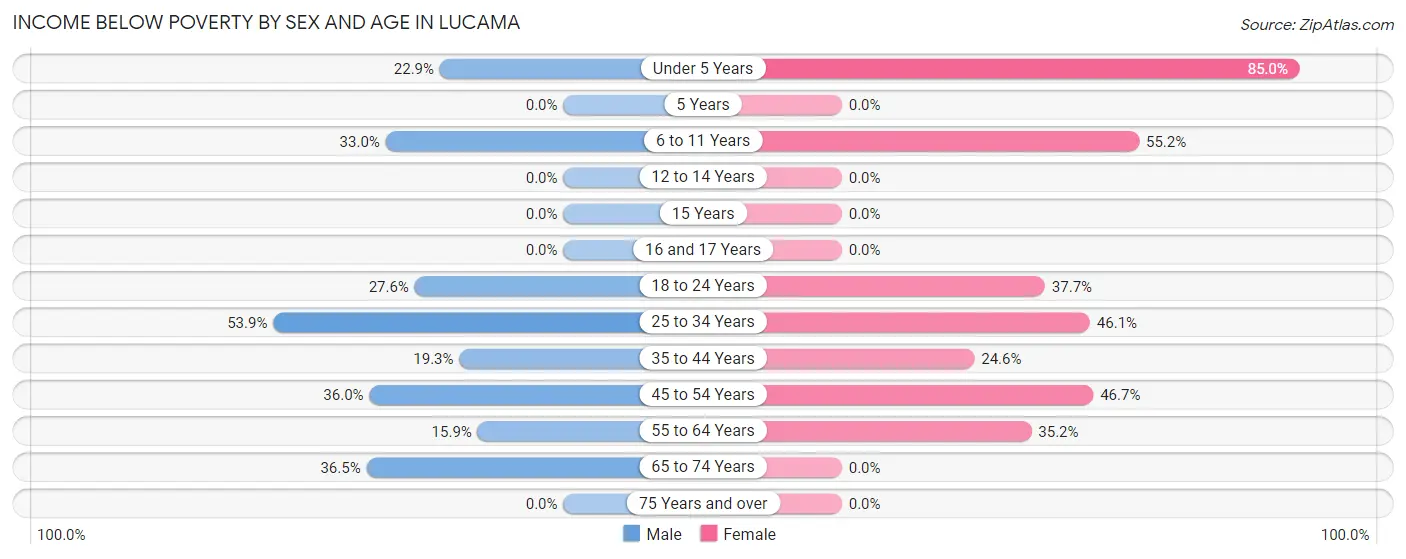
| Age Bracket | Male | Female |
| Under 5 Years | 22 (22.9%) | 34 (85.0%) |
| 5 Years | 0 (0.0%) | 0 (0.0%) |
| 6 to 11 Years | 31 (33.0%) | 32 (55.2%) |
| 12 to 14 Years | 0 (0.0%) | 0 (0.0%) |
| 15 Years | 0 (0.0%) | 0 (0.0%) |
| 16 and 17 Years | 0 (0.0%) | 0 (0.0%) |
| 18 to 24 Years | 16 (27.6%) | 23 (37.7%) |
| 25 to 34 Years | 28 (53.8%) | 35 (46.1%) |
| 35 to 44 Years | 11 (19.3%) | 15 (24.6%) |
| 45 to 54 Years | 18 (36.0%) | 28 (46.7%) |
| 55 to 64 Years | 7 (15.9%) | 19 (35.2%) |
| 65 to 74 Years | 19 (36.5%) | 0 (0.0%) |
| 75 Years and over | 0 (0.0%) | 0 (0.0%) |
| Total | 152 (29.3%) | 186 (35.8%) |
Income Above Poverty by Sex and Age in Lucama
According to the poverty statistics in Lucama, males aged 75 years and over and females aged 5 years are the age groups that are most secure financially, with 100.0% of males and 100.0% of females in these age groups living above the poverty line.
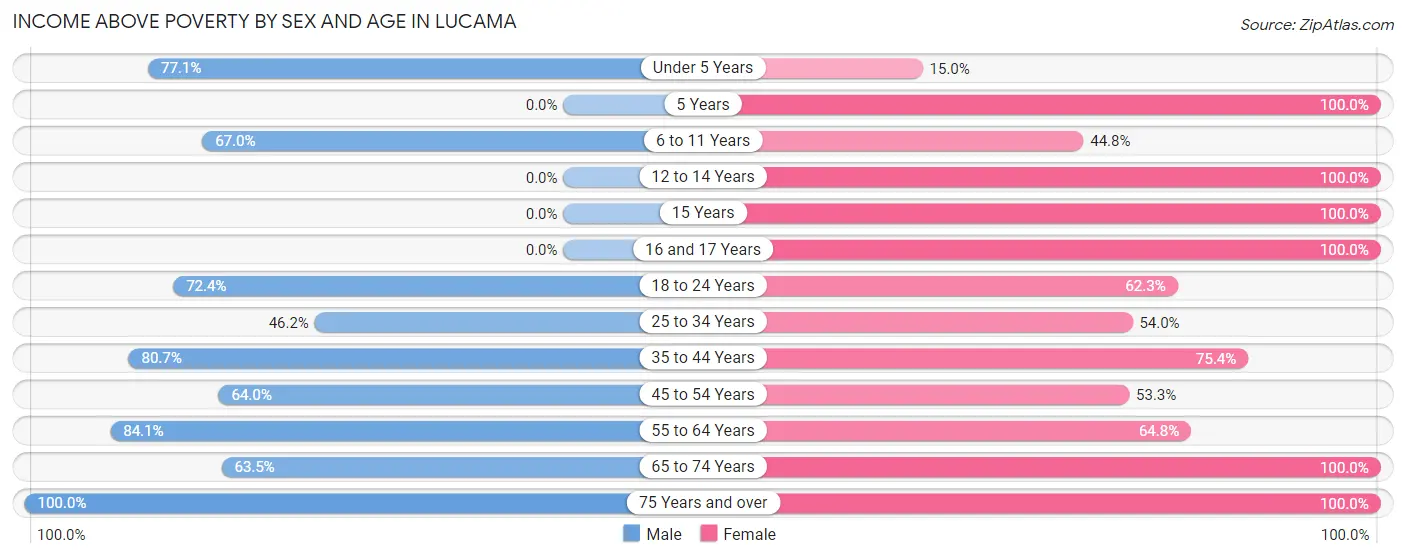
| Age Bracket | Male | Female |
| Under 5 Years | 74 (77.1%) | 6 (15.0%) |
| 5 Years | 0 (0.0%) | 14 (100.0%) |
| 6 to 11 Years | 63 (67.0%) | 26 (44.8%) |
| 12 to 14 Years | 0 (0.0%) | 5 (100.0%) |
| 15 Years | 0 (0.0%) | 1 (100.0%) |
| 16 and 17 Years | 0 (0.0%) | 18 (100.0%) |
| 18 to 24 Years | 42 (72.4%) | 38 (62.3%) |
| 25 to 34 Years | 24 (46.2%) | 41 (53.9%) |
| 35 to 44 Years | 46 (80.7%) | 46 (75.4%) |
| 45 to 54 Years | 32 (64.0%) | 32 (53.3%) |
| 55 to 64 Years | 37 (84.1%) | 35 (64.8%) |
| 65 to 74 Years | 33 (63.5%) | 42 (100.0%) |
| 75 Years and over | 15 (100.0%) | 29 (100.0%) |
| Total | 366 (70.7%) | 333 (64.2%) |
Income Below Poverty Among Married-Couple Families in Lucama
The poverty statistics for married-couple families in Lucama show that 27.8% or 54 of the total 194 families live below the poverty line. Families with 1 or 2 children have the highest poverty rate of 46.3%, comprising of 37 families. On the other hand, families with 3 or 4 children have the lowest poverty rate of 0.0%, which includes 0 families.
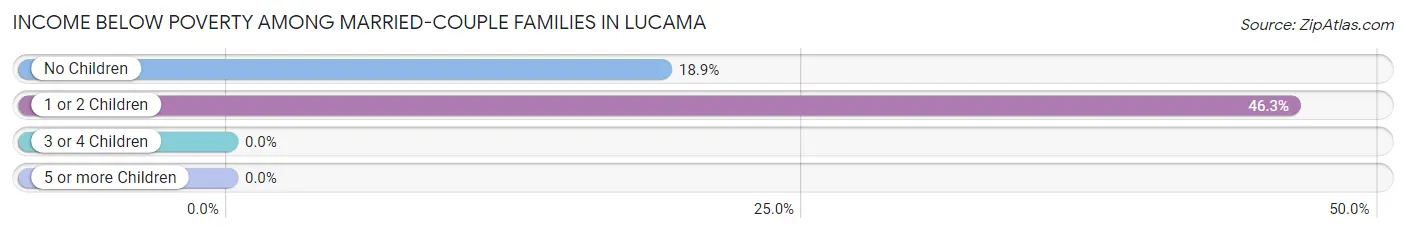
| Children | Above Poverty | Below Poverty |
| No Children | 73 (81.1%) | 17 (18.9%) |
| 1 or 2 Children | 43 (53.7%) | 37 (46.3%) |
| 3 or 4 Children | 24 (100.0%) | 0 (0.0%) |
| 5 or more Children | 0 (0.0%) | 0 (0.0%) |
| Total | 140 (72.2%) | 54 (27.8%) |
Income Below Poverty Among Single-Parent Households in Lucama
According to the poverty data in Lucama, 100.0% or 18 single-father households and 44.4% or 24 single-mother households are living below the poverty line. Among single-father households, those with 1 or 2 children have the highest poverty rate, with 18 households (100.0%) experiencing poverty. Likewise, among single-mother households, those with 3 or 4 children have the highest poverty rate, with 13 households (100.0%) falling below the poverty line.
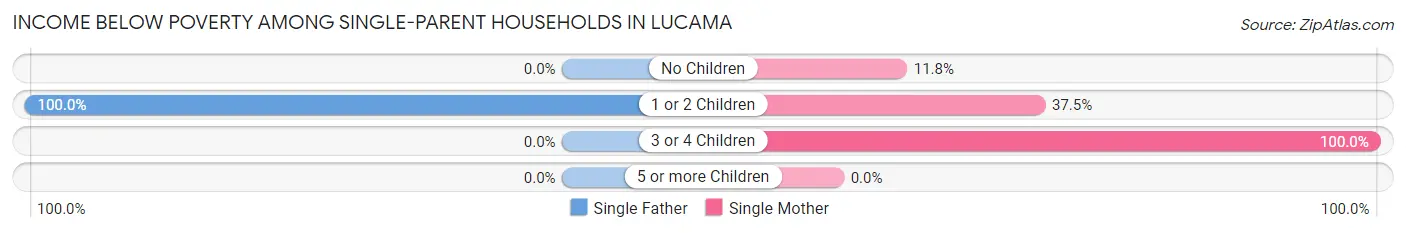
| Children | Single Father | Single Mother |
| No Children | 0 (0.0%) | 2 (11.8%) |
| 1 or 2 Children | 18 (100.0%) | 9 (37.5%) |
| 3 or 4 Children | 0 (0.0%) | 13 (100.0%) |
| 5 or more Children | 0 (0.0%) | 0 (0.0%) |
| Total | 18 (100.0%) | 24 (44.4%) |
Income Below Poverty Among Married-Couple vs Single-Parent Households in Lucama
The poverty data for Lucama shows that 54 of the married-couple family households (27.8%) and 42 of the single-parent households (58.3%) are living below the poverty level. Within the married-couple family households, those with 1 or 2 children have the highest poverty rate, with 37 households (46.3%) falling below the poverty line. Among the single-parent households, those with 3 or 4 children have the highest poverty rate, with 13 household (100.0%) living below poverty.
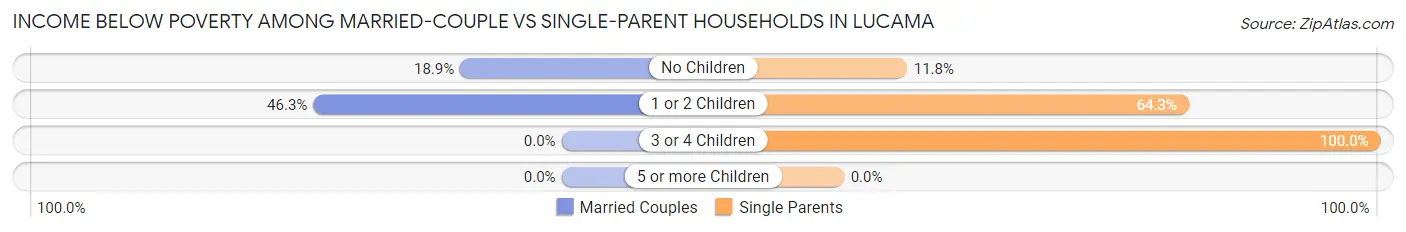
| Children | Married-Couple Families | Single-Parent Households |
| No Children | 17 (18.9%) | 2 (11.8%) |
| 1 or 2 Children | 37 (46.3%) | 27 (64.3%) |
| 3 or 4 Children | 0 (0.0%) | 13 (100.0%) |
| 5 or more Children | 0 (0.0%) | 0 (0.0%) |
| Total | 54 (27.8%) | 42 (58.3%) |
Employment Characteristics in Lucama
Employment by Class of Employer in Lucama
Among the 407 employed individuals in Lucama, private company employees (300 | 73.7%), local government employees (43 | 10.6%), and self-employed (not incorporated) (22 | 5.4%) make up the most common classes of employment.
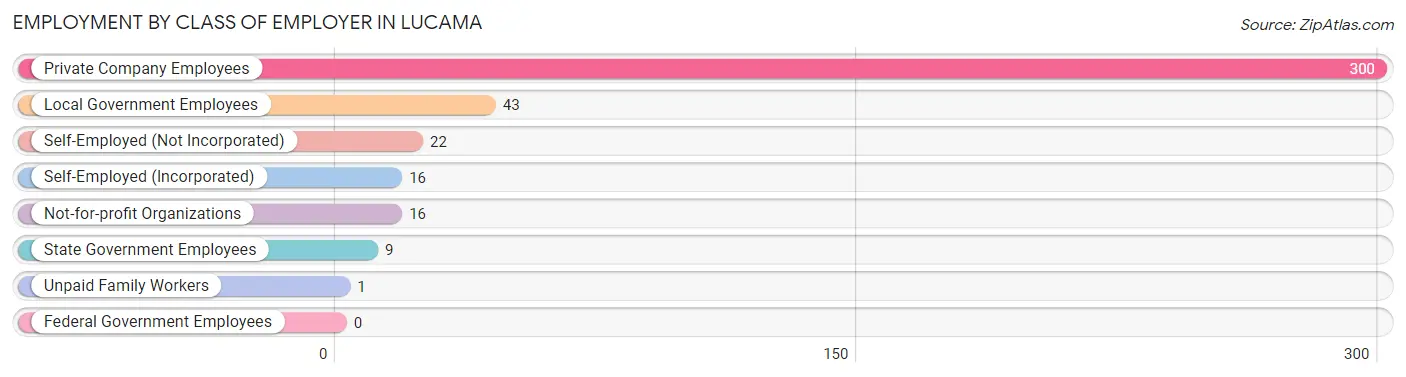
| Employer Class | # Employees | % Employees |
| Private Company Employees | 300 | 73.7% |
| Self-Employed (Incorporated) | 16 | 3.9% |
| Self-Employed (Not Incorporated) | 22 | 5.4% |
| Not-for-profit Organizations | 16 | 3.9% |
| Local Government Employees | 43 | 10.6% |
| State Government Employees | 9 | 2.2% |
| Federal Government Employees | 0 | 0.0% |
| Unpaid Family Workers | 1 | 0.3% |
| Total | 407 | 100.0% |
Employment Status by Age in Lucama
According to the labor force statistics for Lucama, out of the total population over 16 years of age (738), 64.5% or 476 individuals are in the labor force, with 11.1% or 53 of them unemployed. The age group with the highest labor force participation rate is 20 to 24 years, with 100.0% or 102 individuals in the labor force. Within the labor force, the 55 to 59 years age range has the highest percentage of unemployed individuals, with 46.7% or 14 of them being unemployed.
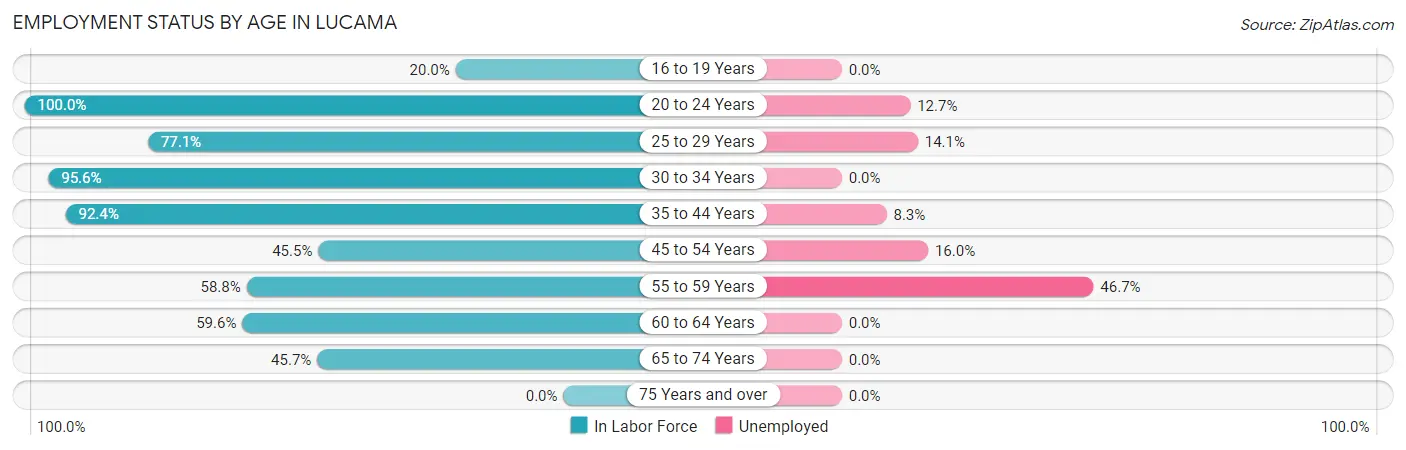
| Age Bracket | In Labor Force | Unemployed |
| 16 to 19 Years | 7 (20.0%) | 0 (0.0%) |
| 20 to 24 Years | 102 (100.0%) | 13 (12.7%) |
| 25 to 29 Years | 64 (77.1%) | 9 (14.1%) |
| 30 to 34 Years | 43 (95.6%) | 0 (0.0%) |
| 35 to 44 Years | 109 (92.4%) | 9 (8.3%) |
| 45 to 54 Years | 50 (45.5%) | 8 (16.0%) |
| 55 to 59 Years | 30 (58.8%) | 14 (46.7%) |
| 60 to 64 Years | 28 (59.6%) | 0 (0.0%) |
| 65 to 74 Years | 43 (45.7%) | 0 (0.0%) |
| 75 Years and over | 0 (0.0%) | 0 (0.0%) |
| Total | 476 (64.5%) | 53 (11.1%) |
Employment Status by Educational Attainment in Lucama
According to labor force statistics for Lucama, 71.4% of individuals (324) out of the total population between 25 and 64 years of age (454) are in the labor force, with 12.3% or 40 of them being unemployed. The group with the highest labor force participation rate are those with the educational attainment of bachelor's degree or higher, with 100.0% or 51 individuals in the labor force. Within the labor force, individuals with less than high school education have the highest percentage of unemployment, with 20.7% or 18 of them being unemployed.
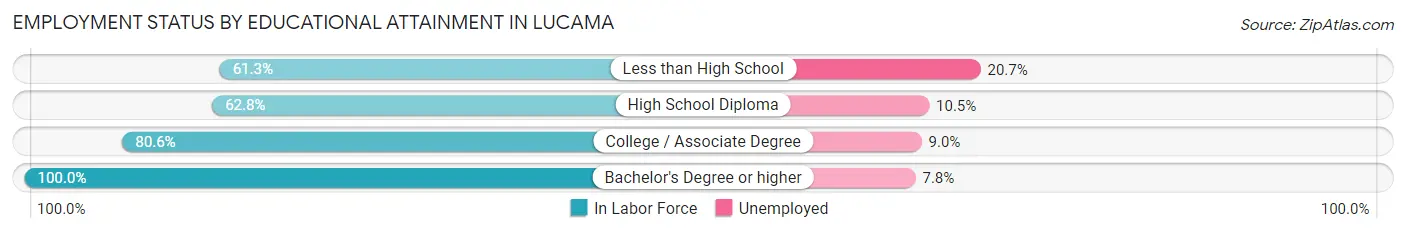
| Educational Attainment | In Labor Force | Unemployed |
| Less than High School | 87 (61.3%) | 29 (20.7%) |
| High School Diploma | 86 (62.8%) | 14 (10.5%) |
| College / Associate Degree | 100 (80.6%) | 11 (9.0%) |
| Bachelor's Degree or higher | 51 (100.0%) | 4 (7.8%) |
| Total | 324 (71.4%) | 56 (12.3%) |
Employment Occupations by Sex in Lucama
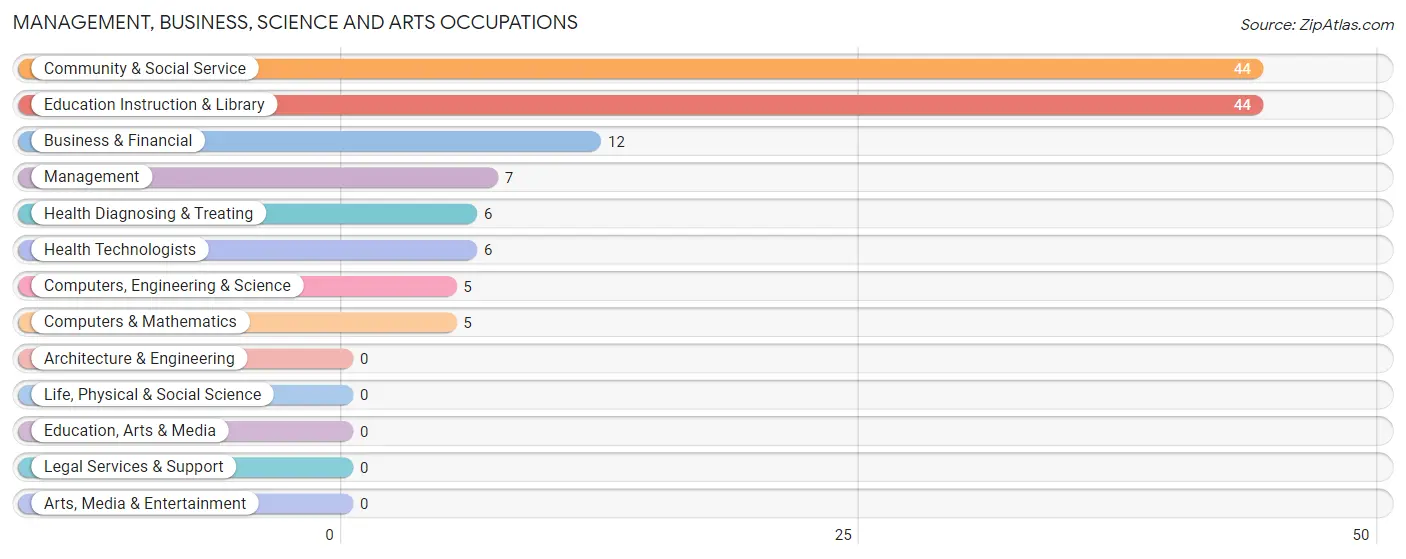
Management, Business, Science and Arts Occupations
The most common Management, Business, Science and Arts occupations in Lucama are Community & Social Service (44 | 10.4%), Education Instruction & Library (44 | 10.4%), Business & Financial (12 | 2.8%), Management (7 | 1.7%), and Health Diagnosing & Treating (6 | 1.4%).
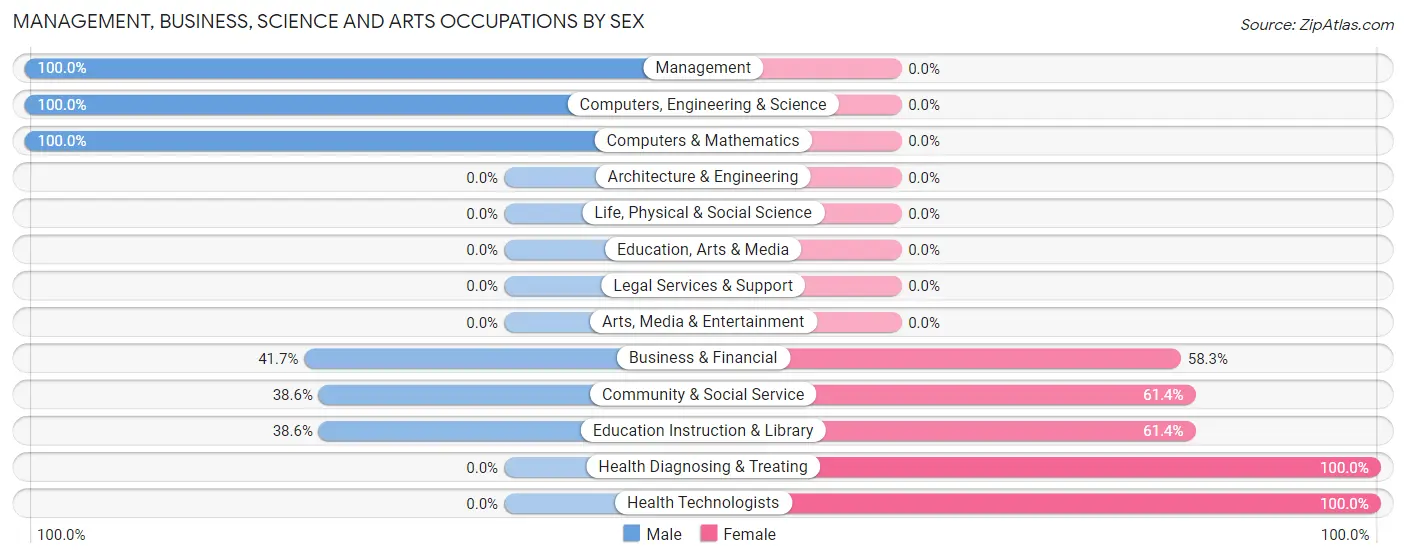
Management, Business, Science and Arts Occupations by Sex
Within the Management, Business, Science and Arts occupations in Lucama, the most male-oriented occupations are Management (100.0%), Computers, Engineering & Science (100.0%), and Computers & Mathematics (100.0%), while the most female-oriented occupations are Health Diagnosing & Treating (100.0%), Health Technologists (100.0%), and Community & Social Service (61.4%).
| Occupation | Male | Female |
| Management | 7 (100.0%) | 0 (0.0%) |
| Business & Financial | 5 (41.7%) | 7 (58.3%) |
| Computers, Engineering & Science | 5 (100.0%) | 0 (0.0%) |
| Computers & Mathematics | 5 (100.0%) | 0 (0.0%) |
| Architecture & Engineering | 0 (0.0%) | 0 (0.0%) |
| Life, Physical & Social Science | 0 (0.0%) | 0 (0.0%) |
| Community & Social Service | 17 (38.6%) | 27 (61.4%) |
| Education, Arts & Media | 0 (0.0%) | 0 (0.0%) |
| Legal Services & Support | 0 (0.0%) | 0 (0.0%) |
| Education Instruction & Library | 17 (38.6%) | 27 (61.4%) |
| Arts, Media & Entertainment | 0 (0.0%) | 0 (0.0%) |
| Health Diagnosing & Treating | 0 (0.0%) | 6 (100.0%) |
| Health Technologists | 0 (0.0%) | 6 (100.0%) |
| Total (Category) | 34 (46.0%) | 40 (54.0%) |
| Total (Overall) | 239 (56.5%) | 184 (43.5%) |
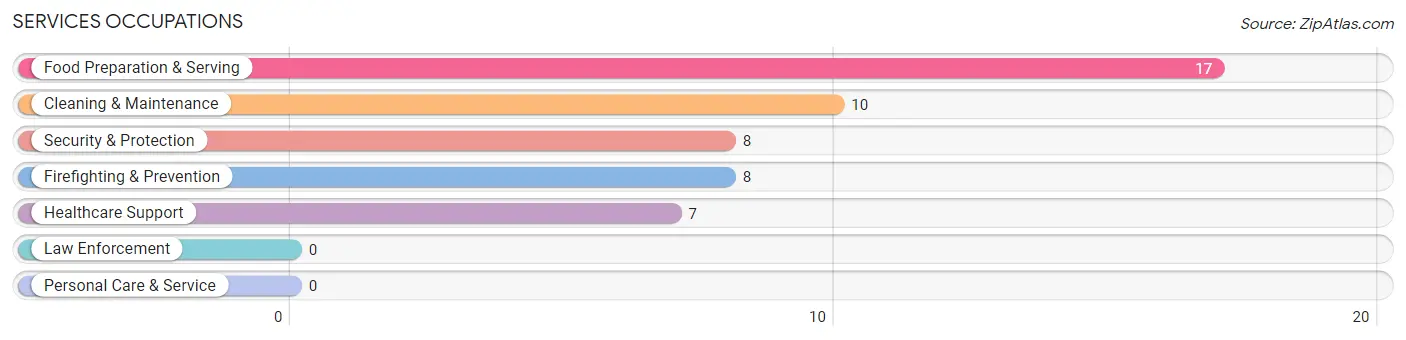
Services Occupations
The most common Services occupations in Lucama are Food Preparation & Serving (17 | 4.0%), Cleaning & Maintenance (10 | 2.4%), Security & Protection (8 | 1.9%), Firefighting & Prevention (8 | 1.9%), and Healthcare Support (7 | 1.7%).
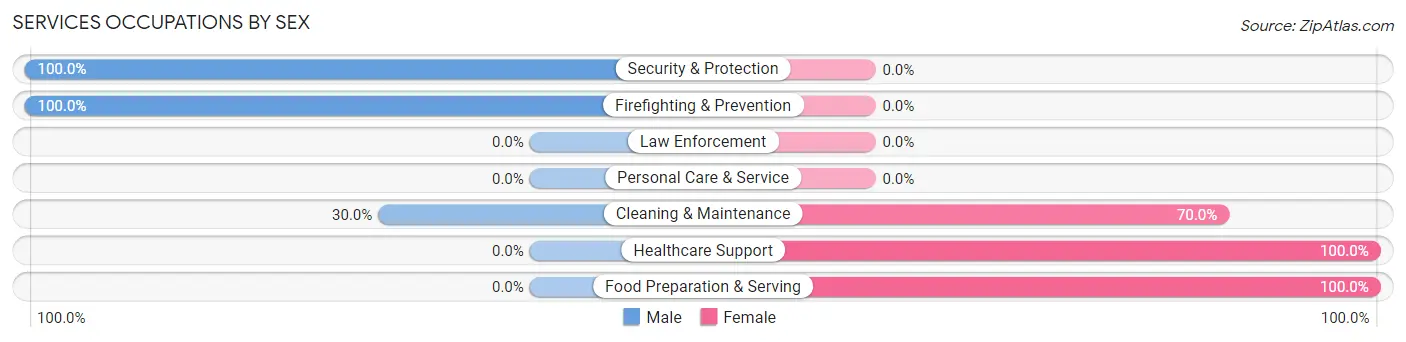
Services Occupations by Sex
Within the Services occupations in Lucama, the most male-oriented occupations are Security & Protection (100.0%), Firefighting & Prevention (100.0%), and Cleaning & Maintenance (30.0%), while the most female-oriented occupations are Healthcare Support (100.0%), Food Preparation & Serving (100.0%), and Cleaning & Maintenance (70.0%).
| Occupation | Male | Female |
| Healthcare Support | 0 (0.0%) | 7 (100.0%) |
| Security & Protection | 8 (100.0%) | 0 (0.0%) |
| Firefighting & Prevention | 8 (100.0%) | 0 (0.0%) |
| Law Enforcement | 0 (0.0%) | 0 (0.0%) |
| Food Preparation & Serving | 0 (0.0%) | 17 (100.0%) |
| Cleaning & Maintenance | 3 (30.0%) | 7 (70.0%) |
| Personal Care & Service | 0 (0.0%) | 0 (0.0%) |
| Total (Category) | 11 (26.2%) | 31 (73.8%) |
| Total (Overall) | 239 (56.5%) | 184 (43.5%) |
Sales and Office Occupations
The most common Sales and Office occupations in Lucama are Sales & Related (53 | 12.5%), and Office & Administration (27 | 6.4%).
Sales and Office Occupations by Sex

| Occupation | Male | Female |
| Sales & Related | 22 (41.5%) | 31 (58.5%) |
| Office & Administration | 0 (0.0%) | 27 (100.0%) |
| Total (Category) | 22 (27.5%) | 58 (72.5%) |
| Total (Overall) | 239 (56.5%) | 184 (43.5%) |
Natural Resources, Construction and Maintenance Occupations
The most common Natural Resources, Construction and Maintenance occupations in Lucama are Farming, Fishing & Forestry (46 | 10.9%), Construction & Extraction (37 | 8.7%), and Installation, Maintenance & Repair (27 | 6.4%).
Natural Resources, Construction and Maintenance Occupations by Sex
| Occupation | Male | Female |
| Farming, Fishing & Forestry | 39 (84.8%) | 7 (15.2%) |
| Construction & Extraction | 37 (100.0%) | 0 (0.0%) |
| Installation, Maintenance & Repair | 27 (100.0%) | 0 (0.0%) |
| Total (Category) | 103 (93.6%) | 7 (6.4%) |
| Total (Overall) | 239 (56.5%) | 184 (43.5%) |
Production, Transportation and Moving Occupations
The most common Production, Transportation and Moving occupations in Lucama are Production (84 | 19.9%), Transportation (26 | 6.1%), and Material Moving (7 | 1.7%).
Production, Transportation and Moving Occupations by Sex
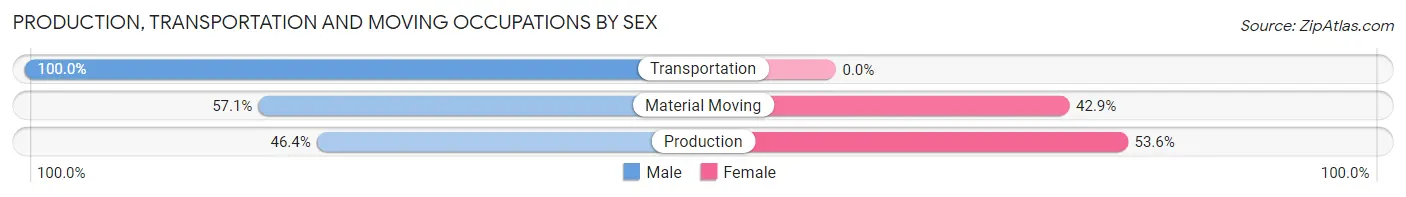
| Occupation | Male | Female |
| Production | 39 (46.4%) | 45 (53.6%) |
| Transportation | 26 (100.0%) | 0 (0.0%) |
| Material Moving | 4 (57.1%) | 3 (42.9%) |
| Total (Category) | 69 (59.0%) | 48 (41.0%) |
| Total (Overall) | 239 (56.5%) | 184 (43.5%) |
Employment Industries by Sex in Lucama
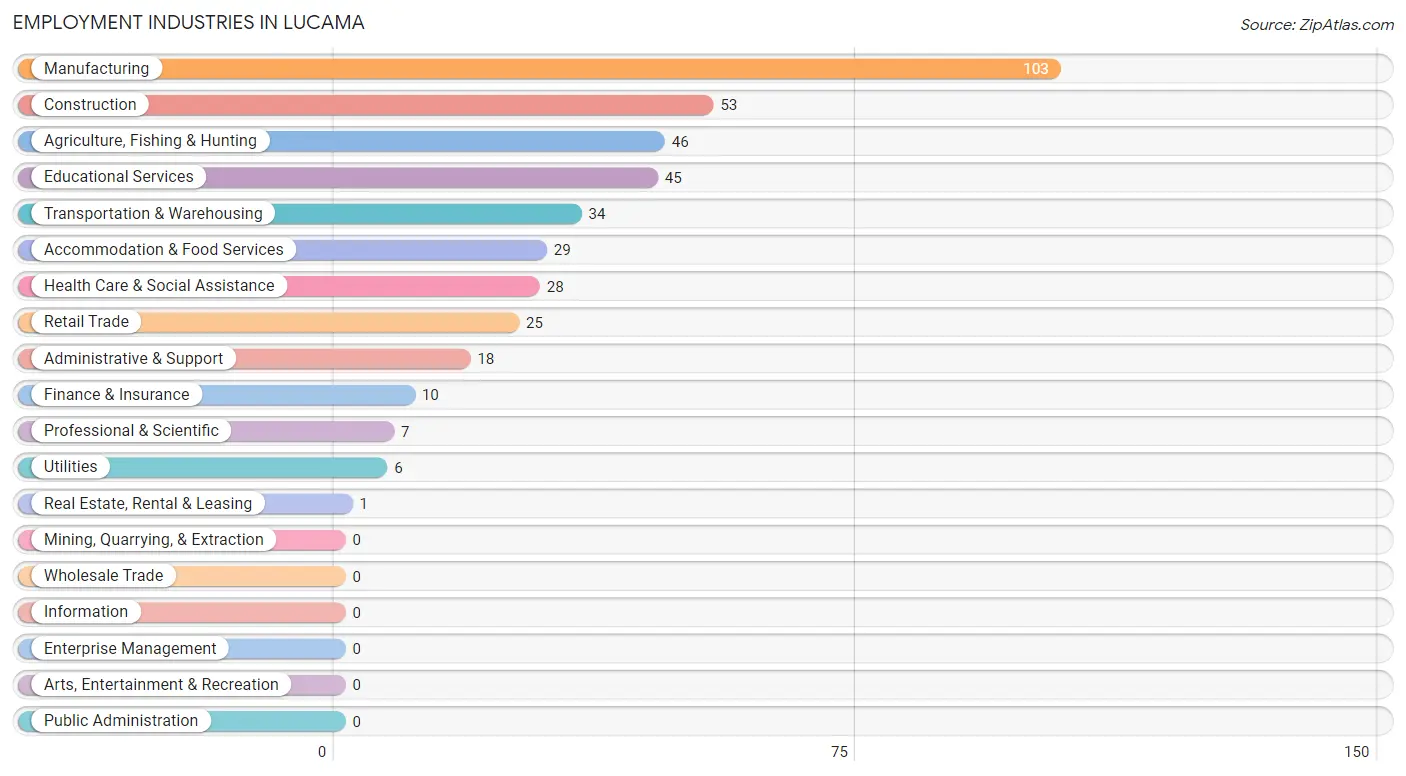
Employment Industries in Lucama
The major employment industries in Lucama include Manufacturing (103 | 24.3%), Construction (53 | 12.5%), Agriculture, Fishing & Hunting (46 | 10.9%), Educational Services (45 | 10.6%), and Transportation & Warehousing (34 | 8.0%).
Employment Industries by Sex in Lucama
The Lucama industries that see more men than women are Construction (100.0%), Utilities (100.0%), and Real Estate, Rental & Leasing (100.0%), whereas the industries that tend to have a higher number of women are Finance & Insurance (100.0%), Professional & Scientific (100.0%), and Accommodation & Food Services (100.0%).
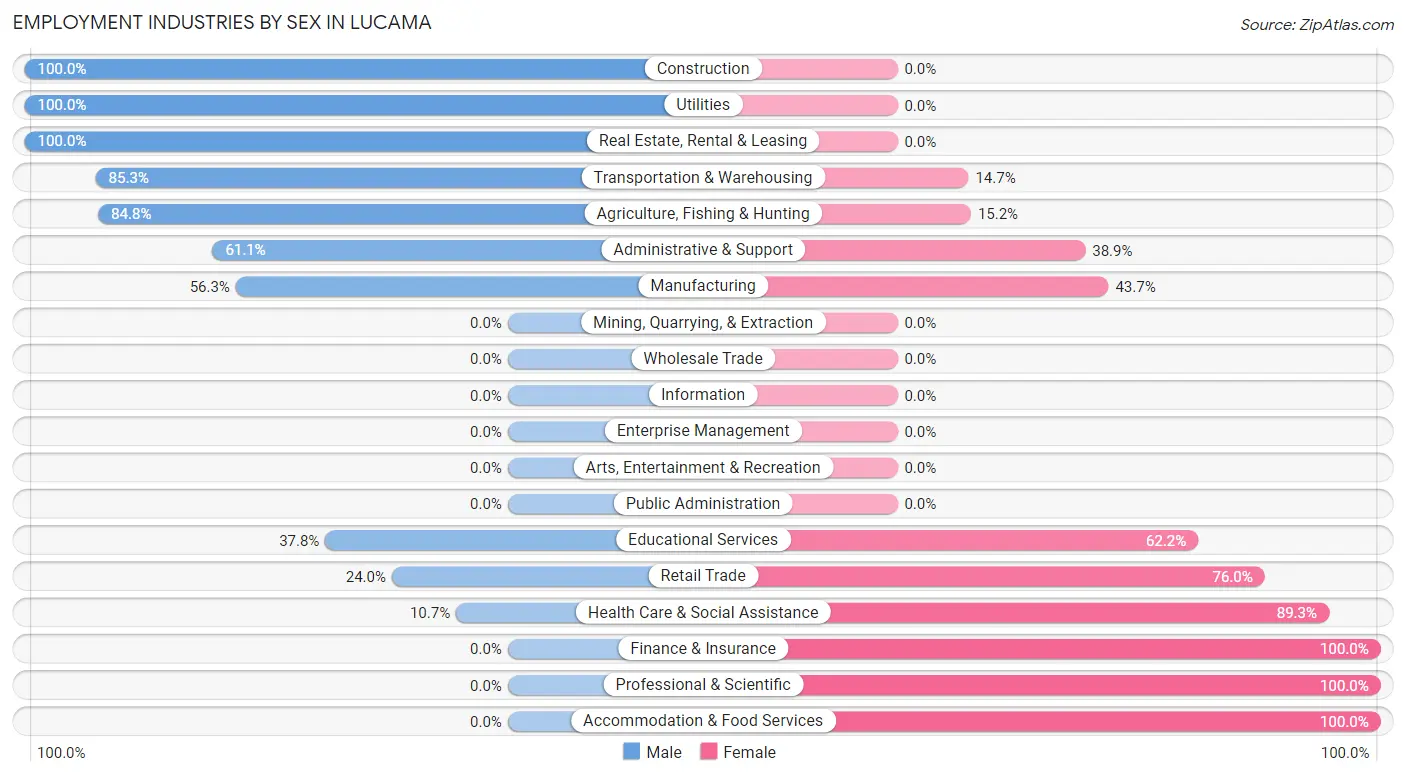
| Industry | Male | Female |
| Agriculture, Fishing & Hunting | 39 (84.8%) | 7 (15.2%) |
| Mining, Quarrying, & Extraction | 0 (0.0%) | 0 (0.0%) |
| Construction | 53 (100.0%) | 0 (0.0%) |
| Manufacturing | 58 (56.3%) | 45 (43.7%) |
| Wholesale Trade | 0 (0.0%) | 0 (0.0%) |
| Retail Trade | 6 (24.0%) | 19 (76.0%) |
| Transportation & Warehousing | 29 (85.3%) | 5 (14.7%) |
| Utilities | 6 (100.0%) | 0 (0.0%) |
| Information | 0 (0.0%) | 0 (0.0%) |
| Finance & Insurance | 0 (0.0%) | 10 (100.0%) |
| Real Estate, Rental & Leasing | 1 (100.0%) | 0 (0.0%) |
| Professional & Scientific | 0 (0.0%) | 7 (100.0%) |
| Enterprise Management | 0 (0.0%) | 0 (0.0%) |
| Administrative & Support | 11 (61.1%) | 7 (38.9%) |
| Educational Services | 17 (37.8%) | 28 (62.2%) |
| Health Care & Social Assistance | 3 (10.7%) | 25 (89.3%) |
| Arts, Entertainment & Recreation | 0 (0.0%) | 0 (0.0%) |
| Accommodation & Food Services | 0 (0.0%) | 29 (100.0%) |
| Public Administration | 0 (0.0%) | 0 (0.0%) |
| Total | 239 (56.5%) | 184 (43.5%) |
Education in Lucama
School Enrollment in Lucama
The most common levels of schooling among the 246 students in Lucama are elementary school (131 | 53.2%), nursery / preschool (52 | 21.1%), and high school (29 | 11.8%).
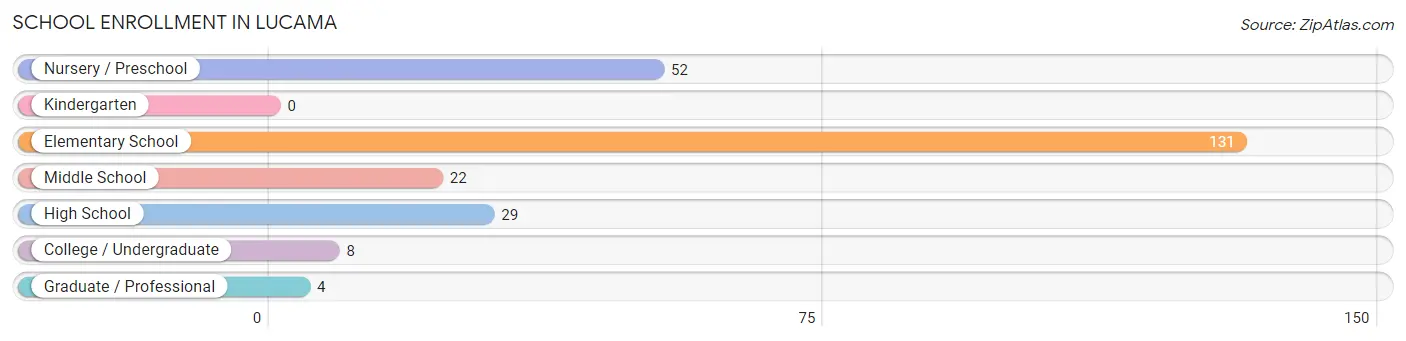
| School Level | # Students | % Students |
| Nursery / Preschool | 52 | 21.1% |
| Kindergarten | 0 | 0.0% |
| Elementary School | 131 | 53.2% |
| Middle School | 22 | 8.9% |
| High School | 29 | 11.8% |
| College / Undergraduate | 8 | 3.3% |
| Graduate / Professional | 4 | 1.6% |
| Total | 246 | 100.0% |
School Enrollment by Age by Funding Source in Lucama
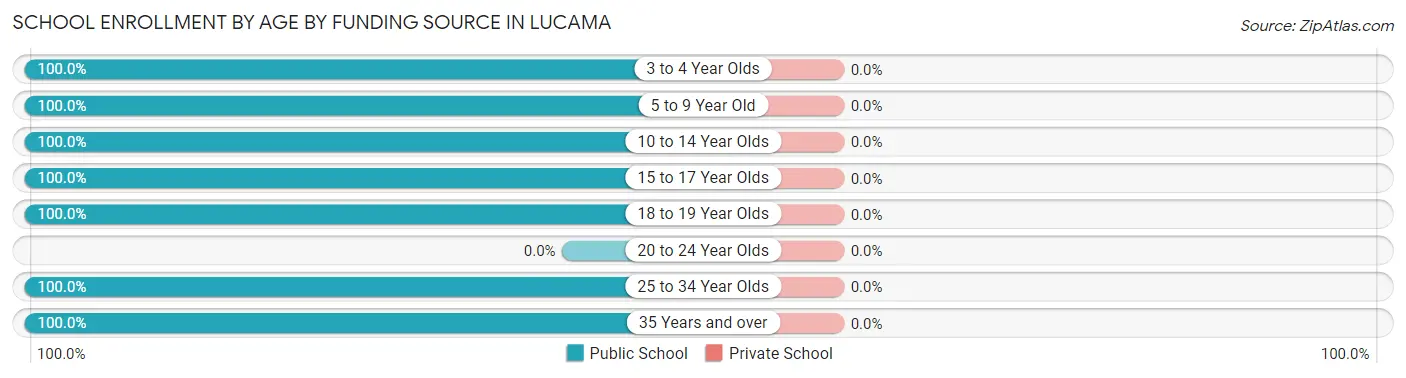
| Age Bracket | Public School | Private School |
| 3 to 4 Year Olds | 52 (100.0%) | 0 (0.0%) |
| 5 to 9 Year Old | 124 (100.0%) | 0 (0.0%) |
| 10 to 14 Year Olds | 29 (100.0%) | 0 (0.0%) |
| 15 to 17 Year Olds | 19 (100.0%) | 0 (0.0%) |
| 18 to 19 Year Olds | 10 (100.0%) | 0 (0.0%) |
| 20 to 24 Year Olds | 0 (0.0%) | 0 (0.0%) |
| 25 to 34 Year Olds | 8 (100.0%) | 0 (0.0%) |
| 35 Years and over | 4 (100.0%) | 0 (0.0%) |
| Total | 246 (100.0%) | 0 (0.0%) |
Educational Attainment by Field of Study in Lucama
Education (21 | 34.4%), science & technology (17 | 27.9%), communications (7 | 11.5%), liberal arts & history (5 | 8.2%), and bio, nature & agricultural (4 | 6.6%) are the most common fields of study among 61 individuals in Lucama who have obtained a bachelor's degree or higher.
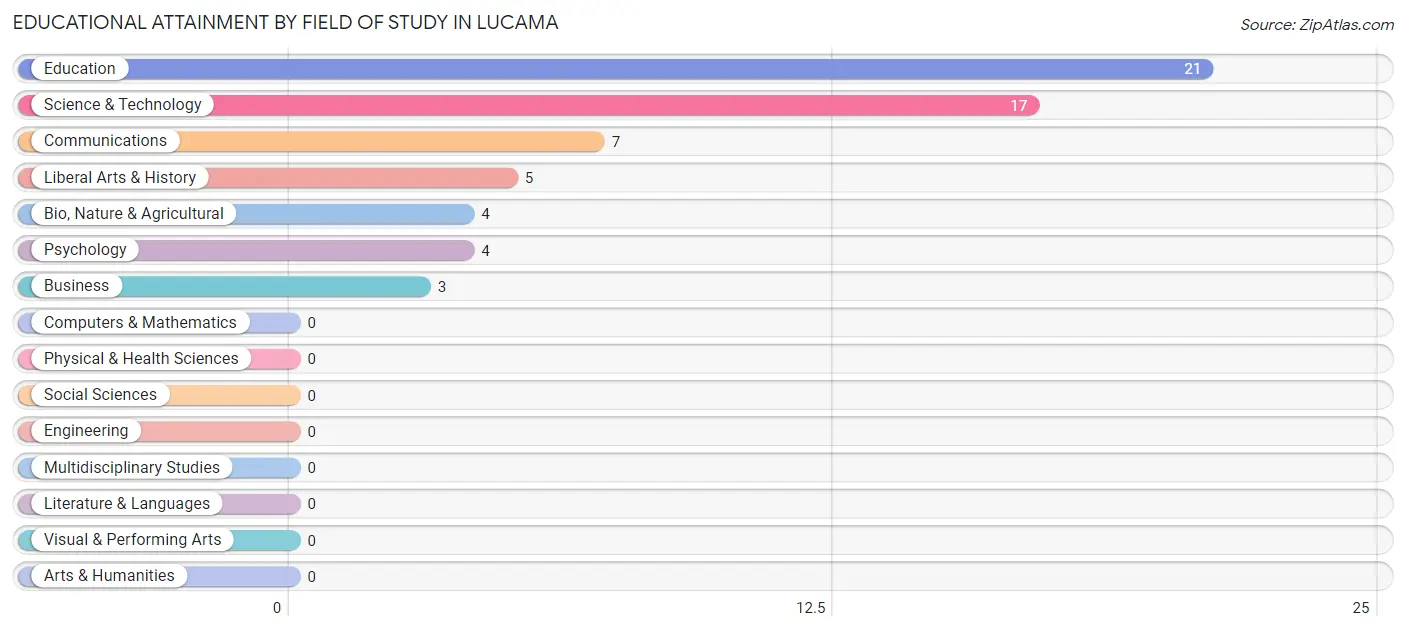
| Field of Study | # Graduates | % Graduates |
| Computers & Mathematics | 0 | 0.0% |
| Bio, Nature & Agricultural | 4 | 6.6% |
| Physical & Health Sciences | 0 | 0.0% |
| Psychology | 4 | 6.6% |
| Social Sciences | 0 | 0.0% |
| Engineering | 0 | 0.0% |
| Multidisciplinary Studies | 0 | 0.0% |
| Science & Technology | 17 | 27.9% |
| Business | 3 | 4.9% |
| Education | 21 | 34.4% |
| Literature & Languages | 0 | 0.0% |
| Liberal Arts & History | 5 | 8.2% |
| Visual & Performing Arts | 0 | 0.0% |
| Communications | 7 | 11.5% |
| Arts & Humanities | 0 | 0.0% |
| Total | 61 | 100.0% |
Transportation & Commute in Lucama
Vehicle Availability by Sex in Lucama
The most prevalent vehicle ownership categories in Lucama are males with 2 vehicles (147, accounting for 65.9%) and females with 2 vehicles (121, making up 79.9%).
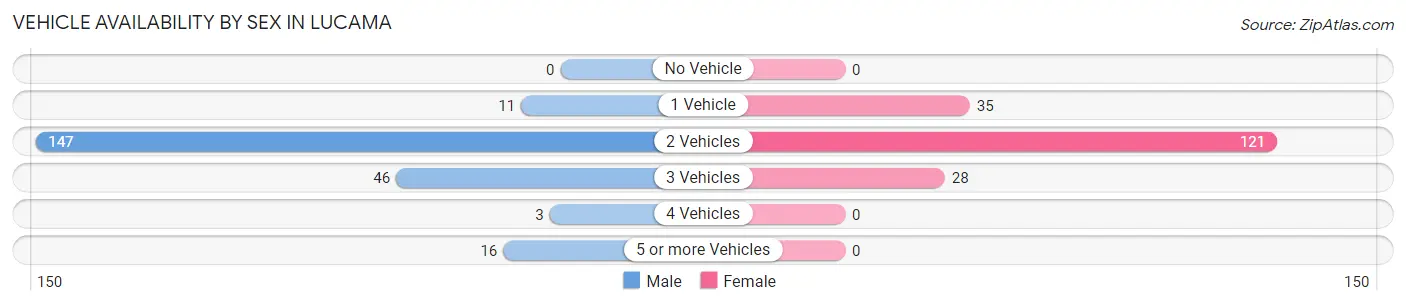
| Vehicles Available | Male | Female |
| No Vehicle | 0 (0.0%) | 0 (0.0%) |
| 1 Vehicle | 11 (4.9%) | 35 (19.0%) |
| 2 Vehicles | 147 (65.9%) | 121 (65.8%) |
| 3 Vehicles | 46 (20.6%) | 28 (15.2%) |
| 4 Vehicles | 3 (1.3%) | 0 (0.0%) |
| 5 or more Vehicles | 16 (7.2%) | 0 (0.0%) |
| Total | 223 (100.0%) | 184 (100.0%) |
Commute Time in Lucama
The most frequently occuring commute durations in Lucama are 15 to 19 minutes (131 commuters, 34.1%), 10 to 14 minutes (117 commuters, 30.5%), and 20 to 24 minutes (51 commuters, 13.3%).
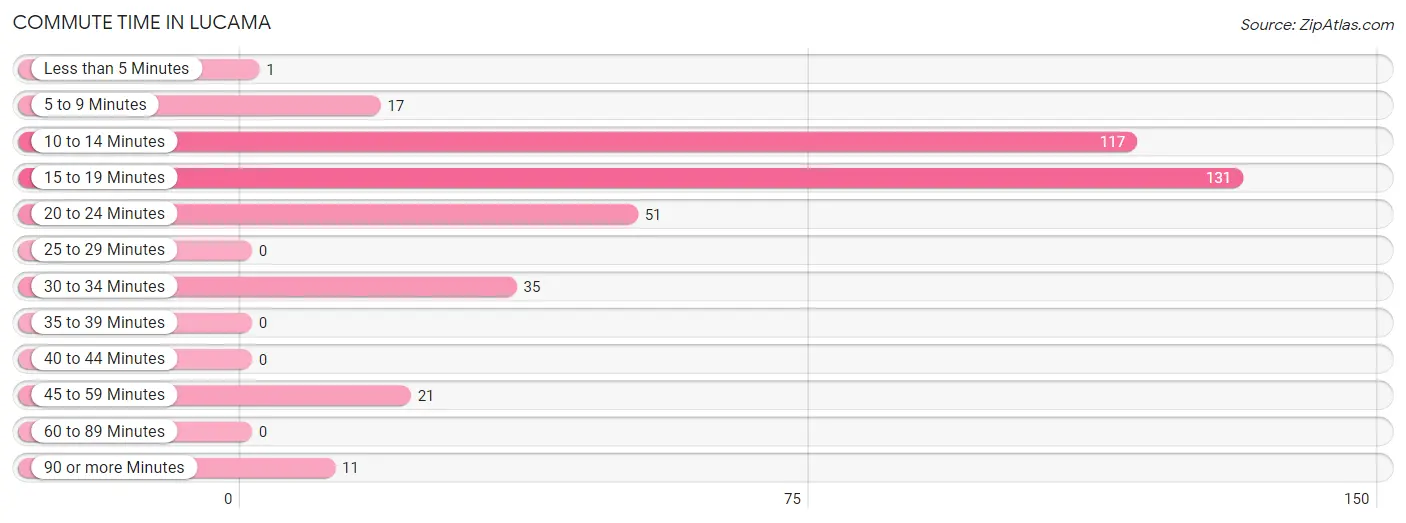
| Commute Time | # Commuters | % Commuters |
| Less than 5 Minutes | 1 | 0.3% |
| 5 to 9 Minutes | 17 | 4.4% |
| 10 to 14 Minutes | 117 | 30.5% |
| 15 to 19 Minutes | 131 | 34.1% |
| 20 to 24 Minutes | 51 | 13.3% |
| 25 to 29 Minutes | 0 | 0.0% |
| 30 to 34 Minutes | 35 | 9.1% |
| 35 to 39 Minutes | 0 | 0.0% |
| 40 to 44 Minutes | 0 | 0.0% |
| 45 to 59 Minutes | 21 | 5.5% |
| 60 to 89 Minutes | 0 | 0.0% |
| 90 or more Minutes | 11 | 2.9% |
Commute Time by Sex in Lucama
The most common commute times in Lucama are 15 to 19 minutes (76 commuters, 36.7%) for males and 10 to 14 minutes (65 commuters, 36.7%) for females.
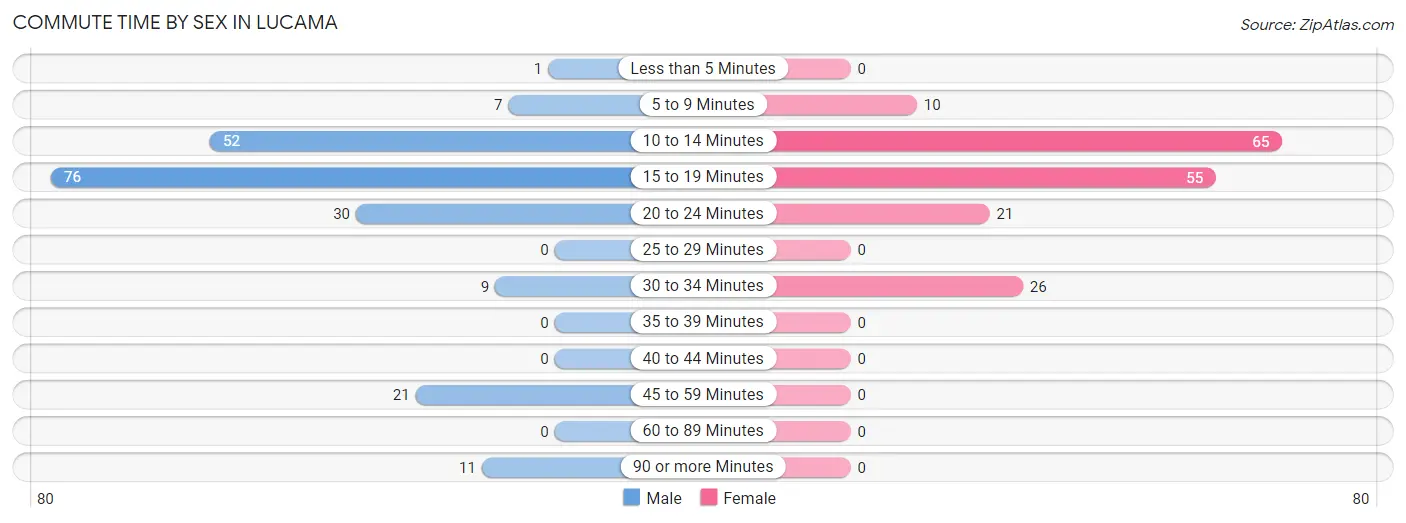
| Commute Time | Male | Female |
| Less than 5 Minutes | 1 (0.5%) | 0 (0.0%) |
| 5 to 9 Minutes | 7 (3.4%) | 10 (5.7%) |
| 10 to 14 Minutes | 52 (25.1%) | 65 (36.7%) |
| 15 to 19 Minutes | 76 (36.7%) | 55 (31.1%) |
| 20 to 24 Minutes | 30 (14.5%) | 21 (11.9%) |
| 25 to 29 Minutes | 0 (0.0%) | 0 (0.0%) |
| 30 to 34 Minutes | 9 (4.3%) | 26 (14.7%) |
| 35 to 39 Minutes | 0 (0.0%) | 0 (0.0%) |
| 40 to 44 Minutes | 0 (0.0%) | 0 (0.0%) |
| 45 to 59 Minutes | 21 (10.1%) | 0 (0.0%) |
| 60 to 89 Minutes | 0 (0.0%) | 0 (0.0%) |
| 90 or more Minutes | 11 (5.3%) | 0 (0.0%) |
Time of Departure to Work by Sex in Lucama
The most frequent times of departure to work in Lucama are 7:00 AM to 7:29 AM (67, 32.4%) for males and 6:30 AM to 6:59 AM (36, 20.3%) for females.
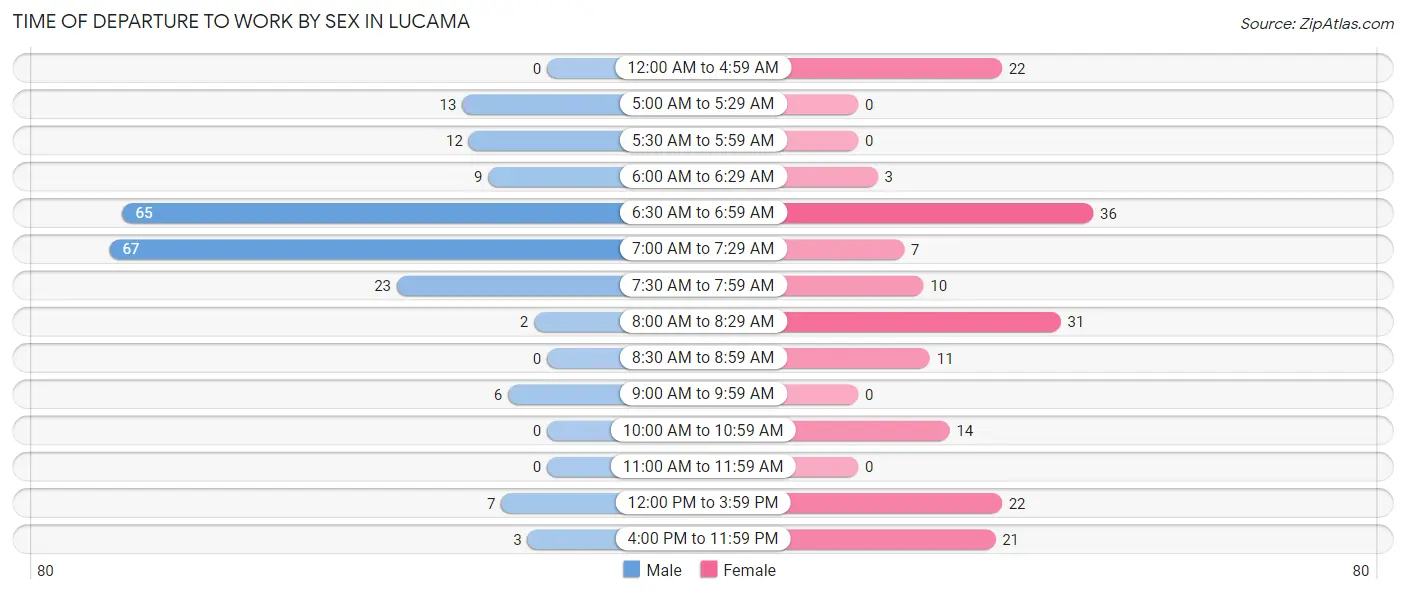
| Time of Departure | Male | Female |
| 12:00 AM to 4:59 AM | 0 (0.0%) | 22 (12.4%) |
| 5:00 AM to 5:29 AM | 13 (6.3%) | 0 (0.0%) |
| 5:30 AM to 5:59 AM | 12 (5.8%) | 0 (0.0%) |
| 6:00 AM to 6:29 AM | 9 (4.3%) | 3 (1.7%) |
| 6:30 AM to 6:59 AM | 65 (31.4%) | 36 (20.3%) |
| 7:00 AM to 7:29 AM | 67 (32.4%) | 7 (4.0%) |
| 7:30 AM to 7:59 AM | 23 (11.1%) | 10 (5.7%) |
| 8:00 AM to 8:29 AM | 2 (1.0%) | 31 (17.5%) |
| 8:30 AM to 8:59 AM | 0 (0.0%) | 11 (6.2%) |
| 9:00 AM to 9:59 AM | 6 (2.9%) | 0 (0.0%) |
| 10:00 AM to 10:59 AM | 0 (0.0%) | 14 (7.9%) |
| 11:00 AM to 11:59 AM | 0 (0.0%) | 0 (0.0%) |
| 12:00 PM to 3:59 PM | 7 (3.4%) | 22 (12.4%) |
| 4:00 PM to 11:59 PM | 3 (1.5%) | 21 (11.9%) |
| Total | 207 (100.0%) | 177 (100.0%) |
Housing Occupancy in Lucama
Occupancy by Ownership in Lucama
Of the total 383 dwellings in Lucama, owner-occupied units account for 200 (52.2%), while renter-occupied units make up 183 (47.8%).
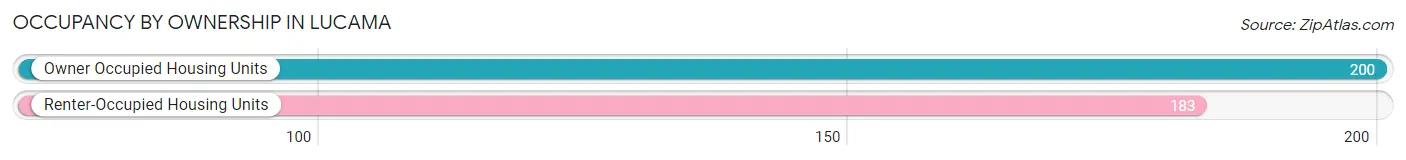
| Occupancy | # Housing Units | % Housing Units |
| Owner Occupied Housing Units | 200 | 52.2% |
| Renter-Occupied Housing Units | 183 | 47.8% |
| Total Occupied Housing Units | 383 | 100.0% |
Occupancy by Household Size in Lucama
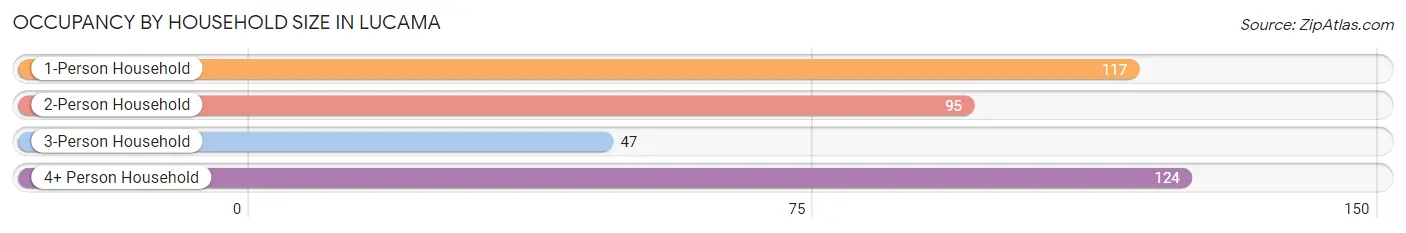
| Household Size | # Housing Units | % Housing Units |
| 1-Person Household | 117 | 30.5% |
| 2-Person Household | 95 | 24.8% |
| 3-Person Household | 47 | 12.3% |
| 4+ Person Household | 124 | 32.4% |
| Total Housing Units | 383 | 100.0% |
Occupancy by Ownership by Household Size in Lucama
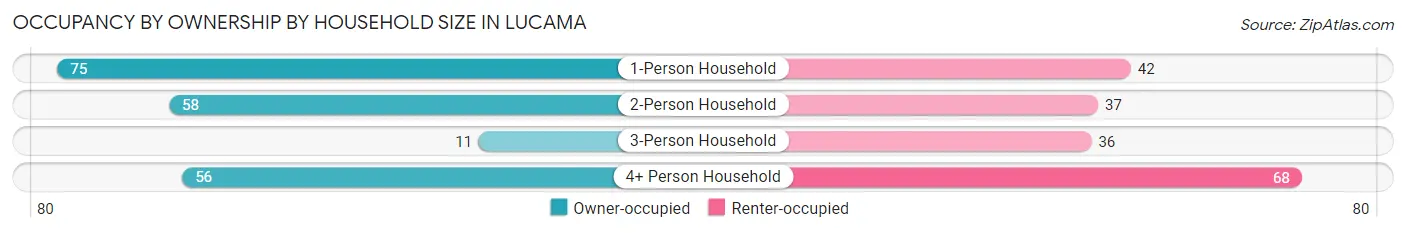
| Household Size | Owner-occupied | Renter-occupied |
| 1-Person Household | 75 (64.1%) | 42 (35.9%) |
| 2-Person Household | 58 (61.1%) | 37 (39.0%) |
| 3-Person Household | 11 (23.4%) | 36 (76.6%) |
| 4+ Person Household | 56 (45.2%) | 68 (54.8%) |
| Total Housing Units | 200 (52.2%) | 183 (47.8%) |
Occupancy by Educational Attainment in Lucama
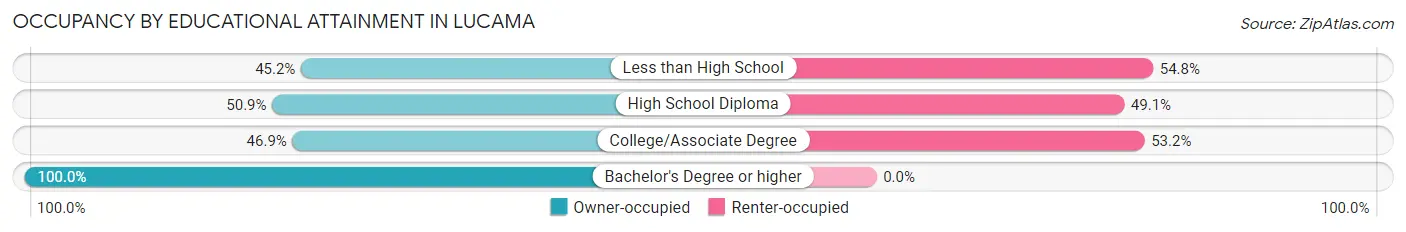
| Household Size | Owner-occupied | Renter-occupied |
| Less than High School | 42 (45.2%) | 51 (54.8%) |
| High School Diploma | 58 (50.9%) | 56 (49.1%) |
| College/Associate Degree | 67 (46.9%) | 76 (53.1%) |
| Bachelor's Degree or higher | 33 (100.0%) | 0 (0.0%) |
Occupancy by Age of Householder in Lucama
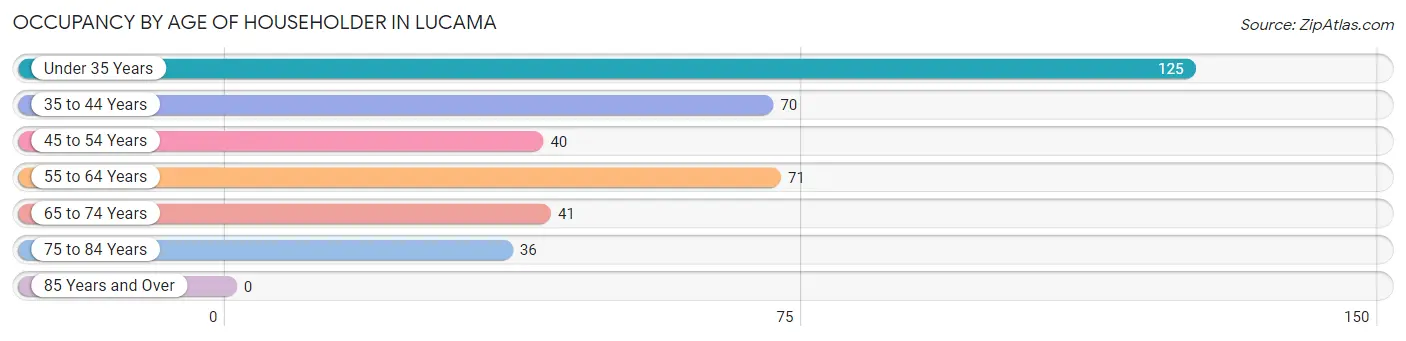
| Age Bracket | # Households | % Households |
| Under 35 Years | 125 | 32.6% |
| 35 to 44 Years | 70 | 18.3% |
| 45 to 54 Years | 40 | 10.4% |
| 55 to 64 Years | 71 | 18.5% |
| 65 to 74 Years | 41 | 10.7% |
| 75 to 84 Years | 36 | 9.4% |
| 85 Years and Over | 0 | 0.0% |
| Total | 383 | 100.0% |
Housing Finances in Lucama
Median Income by Occupancy in Lucama
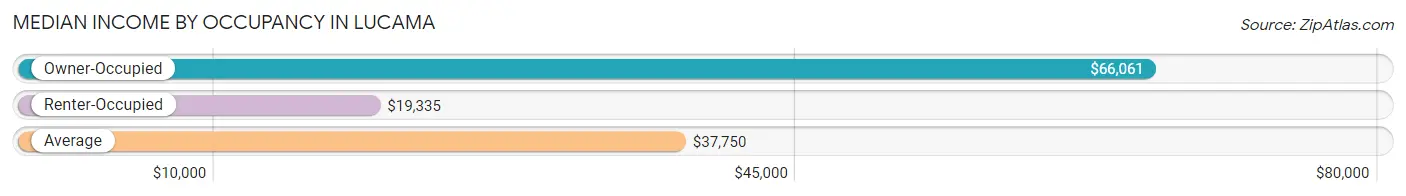
| Occupancy Type | # Households | Median Income |
| Owner-Occupied | 200 (52.2%) | $66,061 |
| Renter-Occupied | 183 (47.8%) | $19,335 |
| Average | 383 (100.0%) | $37,750 |
Occupancy by Householder Income Bracket in Lucama
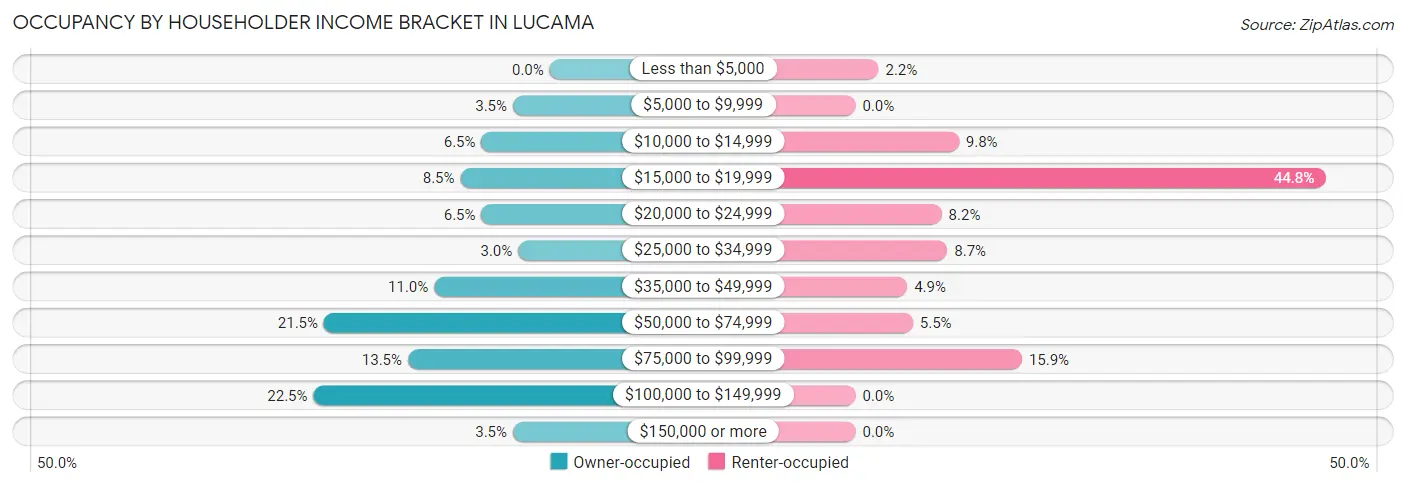
| Income Bracket | Owner-occupied | Renter-occupied |
| Less than $5,000 | 0 (0.0%) | 4 (2.2%) |
| $5,000 to $9,999 | 7 (3.5%) | 0 (0.0%) |
| $10,000 to $14,999 | 13 (6.5%) | 18 (9.8%) |
| $15,000 to $19,999 | 17 (8.5%) | 82 (44.8%) |
| $20,000 to $24,999 | 13 (6.5%) | 15 (8.2%) |
| $25,000 to $34,999 | 6 (3.0%) | 16 (8.7%) |
| $35,000 to $49,999 | 22 (11.0%) | 9 (4.9%) |
| $50,000 to $74,999 | 43 (21.5%) | 10 (5.5%) |
| $75,000 to $99,999 | 27 (13.5%) | 29 (15.9%) |
| $100,000 to $149,999 | 45 (22.5%) | 0 (0.0%) |
| $150,000 or more | 7 (3.5%) | 0 (0.0%) |
| Total | 200 (100.0%) | 183 (100.0%) |
Monthly Housing Cost Tiers in Lucama
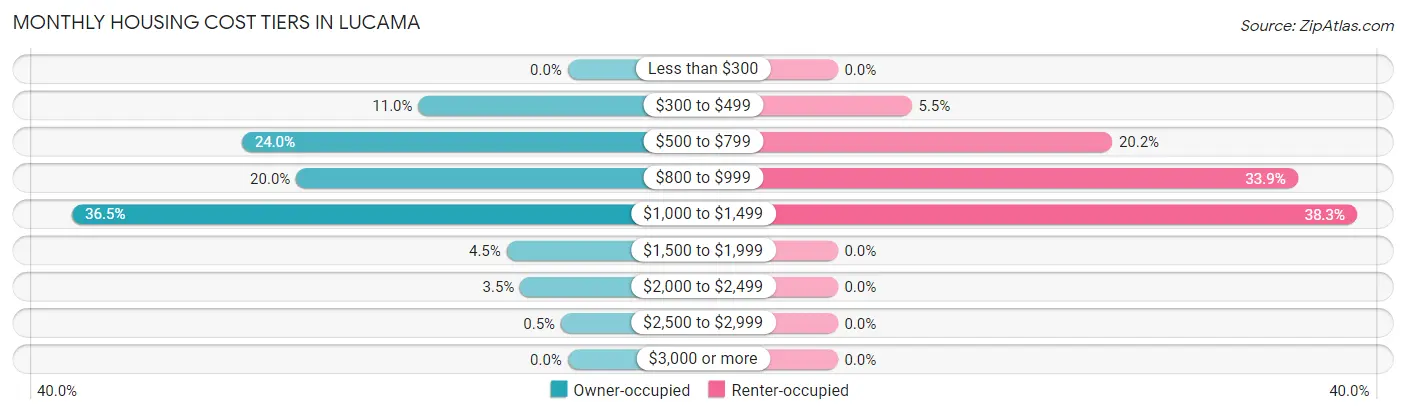
| Monthly Cost | Owner-occupied | Renter-occupied |
| Less than $300 | 0 (0.0%) | 0 (0.0%) |
| $300 to $499 | 22 (11.0%) | 10 (5.5%) |
| $500 to $799 | 48 (24.0%) | 37 (20.2%) |
| $800 to $999 | 40 (20.0%) | 62 (33.9%) |
| $1,000 to $1,499 | 73 (36.5%) | 70 (38.3%) |
| $1,500 to $1,999 | 9 (4.5%) | 0 (0.0%) |
| $2,000 to $2,499 | 7 (3.5%) | 0 (0.0%) |
| $2,500 to $2,999 | 1 (0.5%) | 0 (0.0%) |
| $3,000 or more | 0 (0.0%) | 0 (0.0%) |
| Total | 200 (100.0%) | 183 (100.0%) |
Physical Housing Characteristics in Lucama
Housing Structures in Lucama
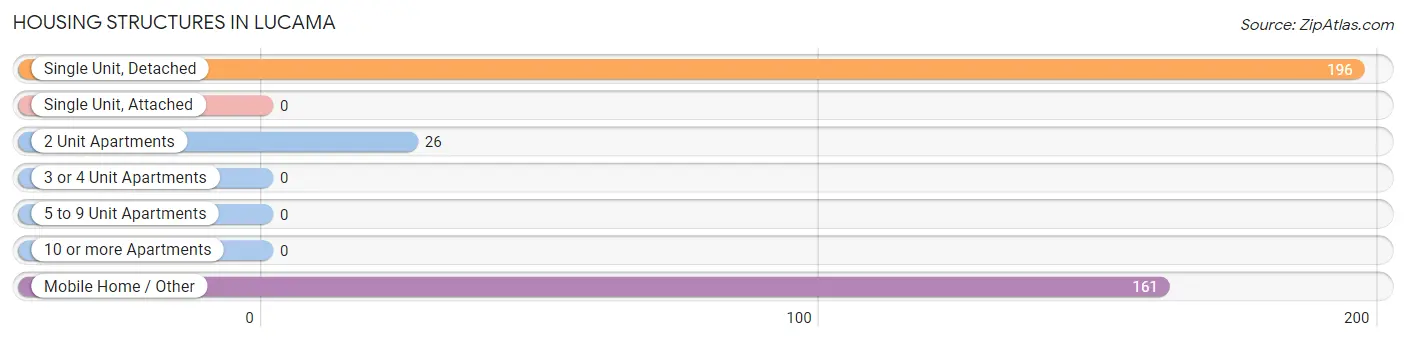
| Structure Type | # Housing Units | % Housing Units |
| Single Unit, Detached | 196 | 51.2% |
| Single Unit, Attached | 0 | 0.0% |
| 2 Unit Apartments | 26 | 6.8% |
| 3 or 4 Unit Apartments | 0 | 0.0% |
| 5 to 9 Unit Apartments | 0 | 0.0% |
| 10 or more Apartments | 0 | 0.0% |
| Mobile Home / Other | 161 | 42.0% |
| Total | 383 | 100.0% |
Housing Structures by Occupancy in Lucama
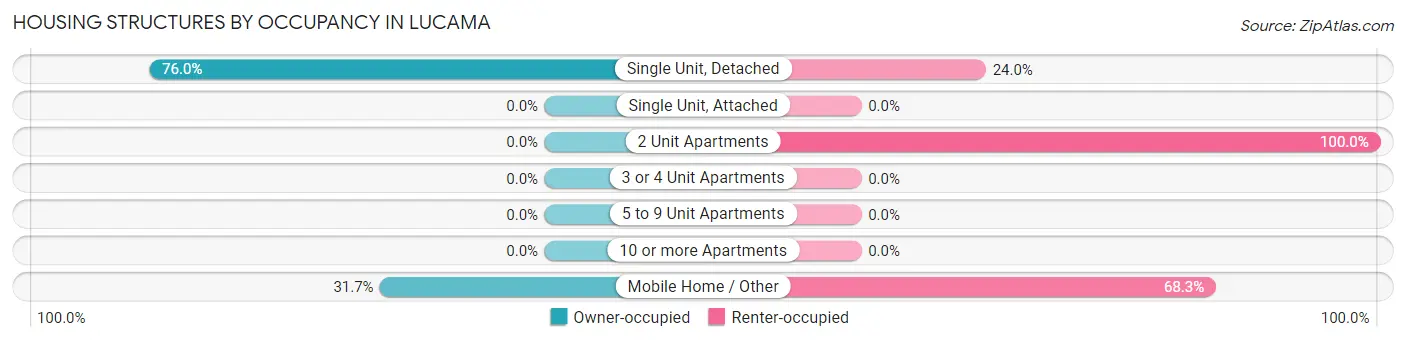
| Structure Type | Owner-occupied | Renter-occupied |
| Single Unit, Detached | 149 (76.0%) | 47 (24.0%) |
| Single Unit, Attached | 0 (0.0%) | 0 (0.0%) |
| 2 Unit Apartments | 0 (0.0%) | 26 (100.0%) |
| 3 or 4 Unit Apartments | 0 (0.0%) | 0 (0.0%) |
| 5 to 9 Unit Apartments | 0 (0.0%) | 0 (0.0%) |
| 10 or more Apartments | 0 (0.0%) | 0 (0.0%) |
| Mobile Home / Other | 51 (31.7%) | 110 (68.3%) |
| Total | 200 (52.2%) | 183 (47.8%) |
Housing Structures by Number of Rooms in Lucama
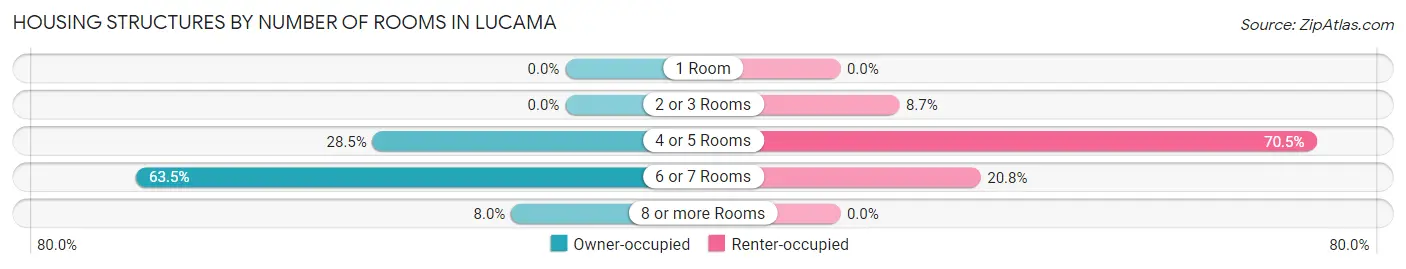
| Number of Rooms | Owner-occupied | Renter-occupied |
| 1 Room | 0 (0.0%) | 0 (0.0%) |
| 2 or 3 Rooms | 0 (0.0%) | 16 (8.7%) |
| 4 or 5 Rooms | 57 (28.5%) | 129 (70.5%) |
| 6 or 7 Rooms | 127 (63.5%) | 38 (20.8%) |
| 8 or more Rooms | 16 (8.0%) | 0 (0.0%) |
| Total | 200 (100.0%) | 183 (100.0%) |
Housing Structure by Heating Type in Lucama
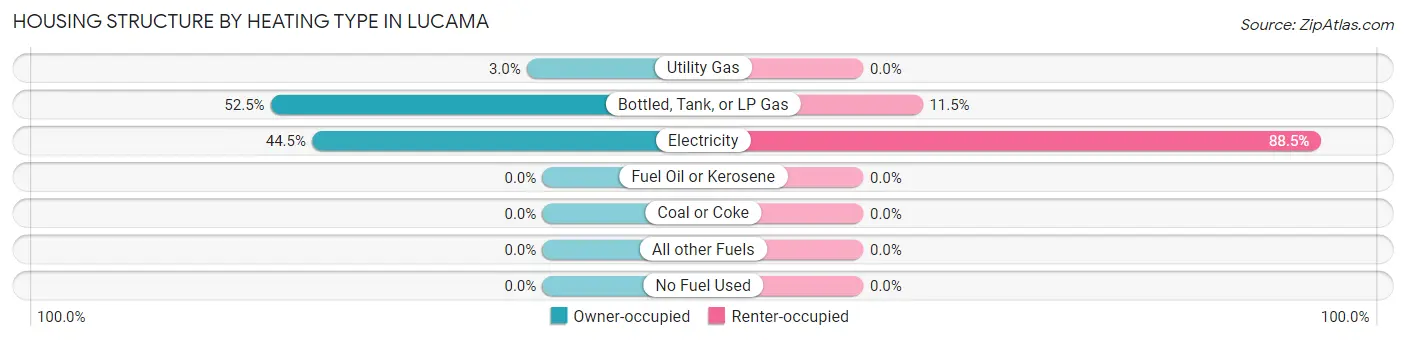
| Heating Type | Owner-occupied | Renter-occupied |
| Utility Gas | 6 (3.0%) | 0 (0.0%) |
| Bottled, Tank, or LP Gas | 105 (52.5%) | 21 (11.5%) |
| Electricity | 89 (44.5%) | 162 (88.5%) |
| Fuel Oil or Kerosene | 0 (0.0%) | 0 (0.0%) |
| Coal or Coke | 0 (0.0%) | 0 (0.0%) |
| All other Fuels | 0 (0.0%) | 0 (0.0%) |
| No Fuel Used | 0 (0.0%) | 0 (0.0%) |
| Total | 200 (100.0%) | 183 (100.0%) |
Household Vehicle Usage in Lucama
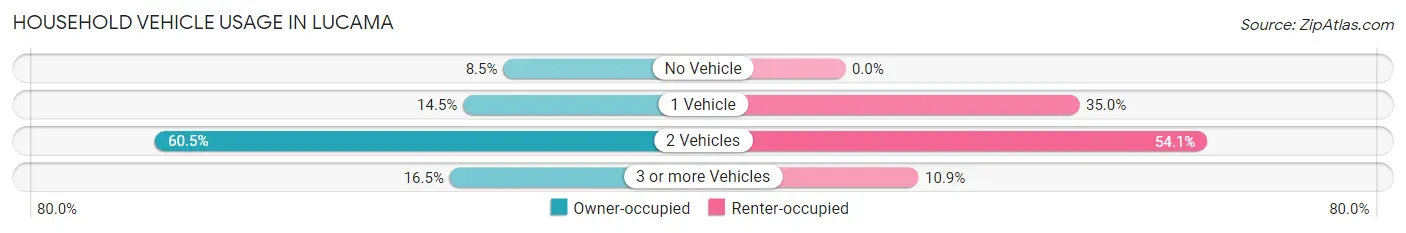
| Vehicles per Household | Owner-occupied | Renter-occupied |
| No Vehicle | 17 (8.5%) | 0 (0.0%) |
| 1 Vehicle | 29 (14.5%) | 64 (35.0%) |
| 2 Vehicles | 121 (60.5%) | 99 (54.1%) |
| 3 or more Vehicles | 33 (16.5%) | 20 (10.9%) |
| Total | 200 (100.0%) | 183 (100.0%) |
Real Estate & Mortgages in Lucama
Real Estate and Mortgage Overview in Lucama
| Characteristic | Without Mortgage | With Mortgage |
| Housing Units | 71 | 129 |
| Median Property Value | $86,500 | $112,300 |
| Median Household Income | $80,125 | $3 |
| Monthly Housing Costs | $590 | $0 |
| Real Estate Taxes | $1,138 | $0 |
Property Value by Mortgage Status in Lucama
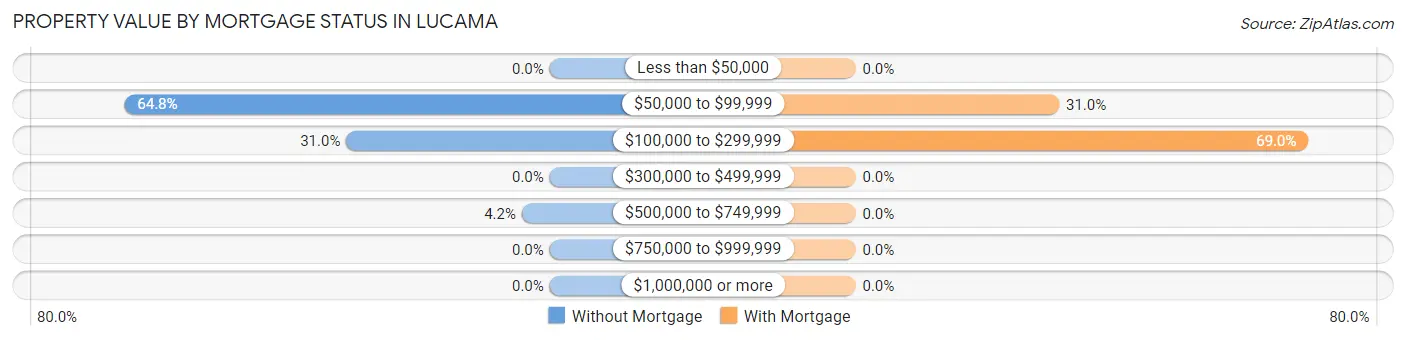
| Property Value | Without Mortgage | With Mortgage |
| Less than $50,000 | 0 (0.0%) | 0 (0.0%) |
| $50,000 to $99,999 | 46 (64.8%) | 40 (31.0%) |
| $100,000 to $299,999 | 22 (31.0%) | 89 (69.0%) |
| $300,000 to $499,999 | 0 (0.0%) | 0 (0.0%) |
| $500,000 to $749,999 | 3 (4.2%) | 0 (0.0%) |
| $750,000 to $999,999 | 0 (0.0%) | 0 (0.0%) |
| $1,000,000 or more | 0 (0.0%) | 0 (0.0%) |
| Total | 71 (100.0%) | 129 (100.0%) |
Household Income by Mortgage Status in Lucama
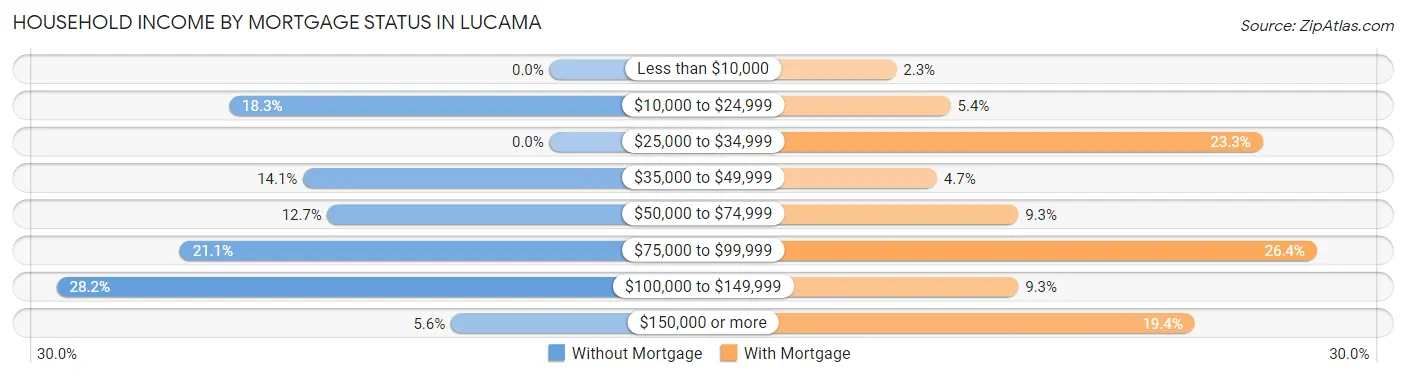
| Household Income | Without Mortgage | With Mortgage |
| Less than $10,000 | 0 (0.0%) | 3 (2.3%) |
| $10,000 to $24,999 | 13 (18.3%) | 7 (5.4%) |
| $25,000 to $34,999 | 0 (0.0%) | 30 (23.3%) |
| $35,000 to $49,999 | 10 (14.1%) | 6 (4.6%) |
| $50,000 to $74,999 | 9 (12.7%) | 12 (9.3%) |
| $75,000 to $99,999 | 15 (21.1%) | 34 (26.4%) |
| $100,000 to $149,999 | 20 (28.2%) | 12 (9.3%) |
| $150,000 or more | 4 (5.6%) | 25 (19.4%) |
| Total | 71 (100.0%) | 129 (100.0%) |
Property Value to Household Income Ratio in Lucama
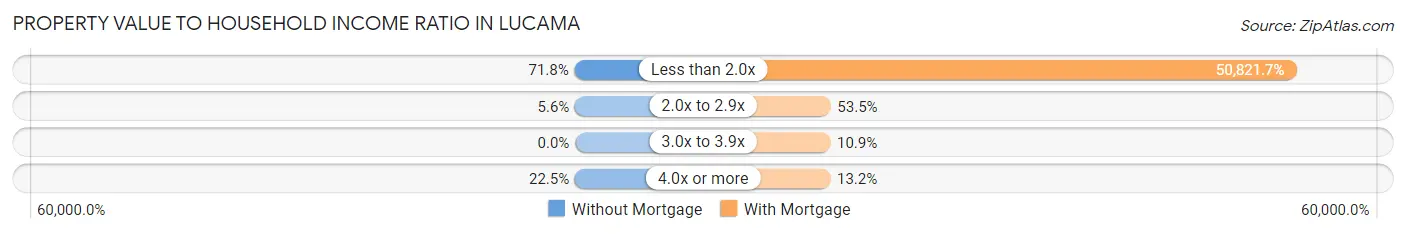
| Value-to-Income Ratio | Without Mortgage | With Mortgage |
| Less than 2.0x | 51 (71.8%) | 65,560 (50,821.7%) |
| 2.0x to 2.9x | 4 (5.6%) | 69 (53.5%) |
| 3.0x to 3.9x | 0 (0.0%) | 14 (10.8%) |
| 4.0x or more | 16 (22.5%) | 17 (13.2%) |
| Total | 71 (100.0%) | 129 (100.0%) |
Real Estate Taxes by Mortgage Status in Lucama
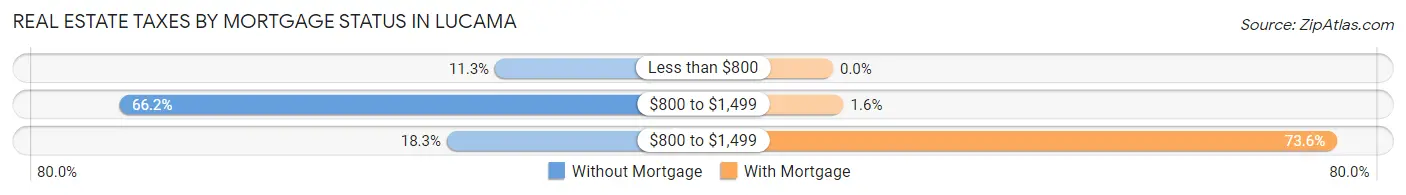
| Property Taxes | Without Mortgage | With Mortgage |
| Less than $800 | 8 (11.3%) | 0 (0.0%) |
| $800 to $1,499 | 47 (66.2%) | 2 (1.5%) |
| $800 to $1,499 | 13 (18.3%) | 95 (73.6%) |
| Total | 71 (100.0%) | 129 (100.0%) |
Health & Disability in Lucama
Health Insurance Coverage by Age in Lucama
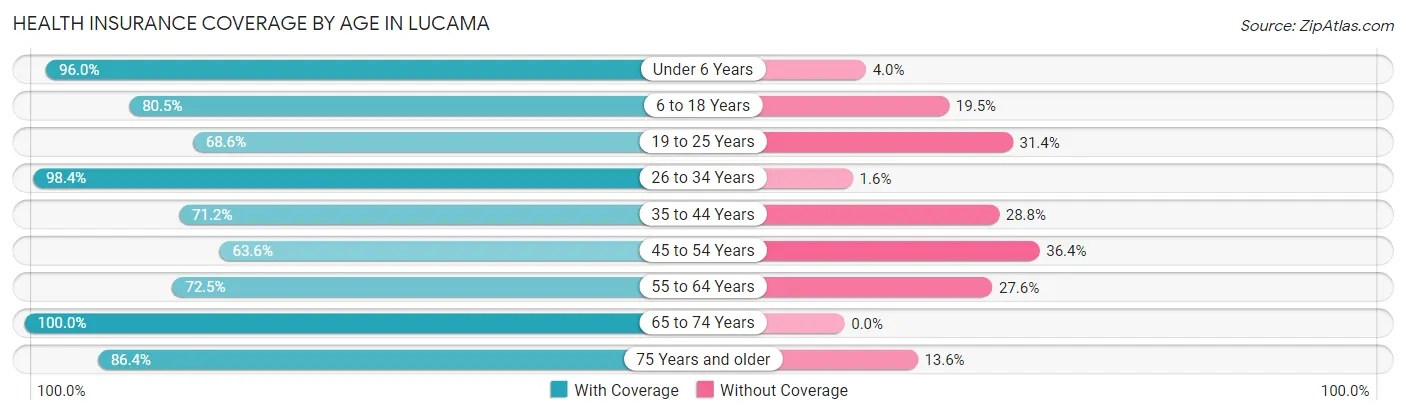
| Age Bracket | With Coverage | Without Coverage |
| Under 6 Years | 144 (96.0%) | 6 (4.0%) |
| 6 to 18 Years | 165 (80.5%) | 40 (19.5%) |
| 19 to 25 Years | 70 (68.6%) | 32 (31.4%) |
| 26 to 34 Years | 126 (98.4%) | 2 (1.6%) |
| 35 to 44 Years | 84 (71.2%) | 34 (28.8%) |
| 45 to 54 Years | 70 (63.6%) | 40 (36.4%) |
| 55 to 64 Years | 71 (72.5%) | 27 (27.6%) |
| 65 to 74 Years | 94 (100.0%) | 0 (0.0%) |
| 75 Years and older | 38 (86.4%) | 6 (13.6%) |
| Total | 862 (82.2%) | 187 (17.8%) |
Health Insurance Coverage by Citizenship Status in Lucama
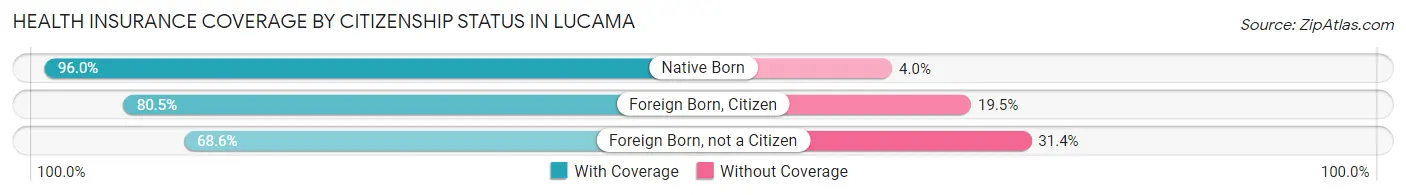
| Citizenship Status | With Coverage | Without Coverage |
| Native Born | 144 (96.0%) | 6 (4.0%) |
| Foreign Born, Citizen | 165 (80.5%) | 40 (19.5%) |
| Foreign Born, not a Citizen | 70 (68.6%) | 32 (31.4%) |
Health Insurance Coverage by Household Income in Lucama
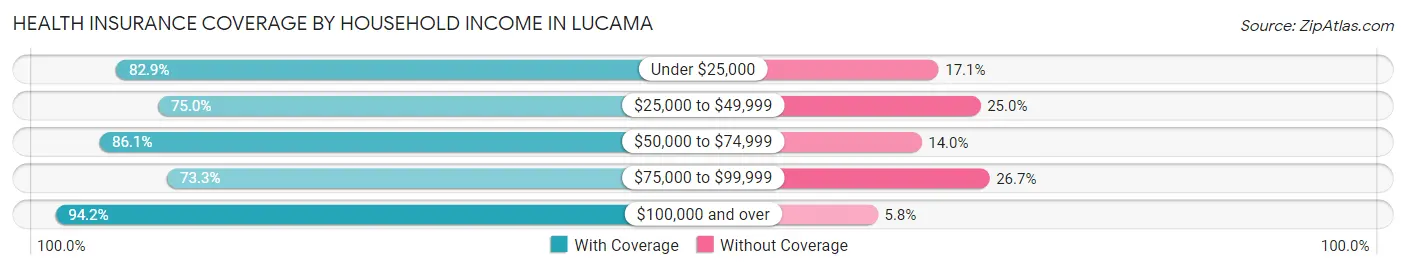
| Household Income | With Coverage | Without Coverage |
| Under $25,000 | 348 (82.9%) | 72 (17.1%) |
| $25,000 to $49,999 | 87 (75.0%) | 29 (25.0%) |
| $50,000 to $74,999 | 74 (86.1%) | 12 (14.0%) |
| $75,000 to $99,999 | 173 (73.3%) | 63 (26.7%) |
| $100,000 and over | 180 (94.2%) | 11 (5.8%) |
Public vs Private Health Insurance Coverage by Age in Lucama
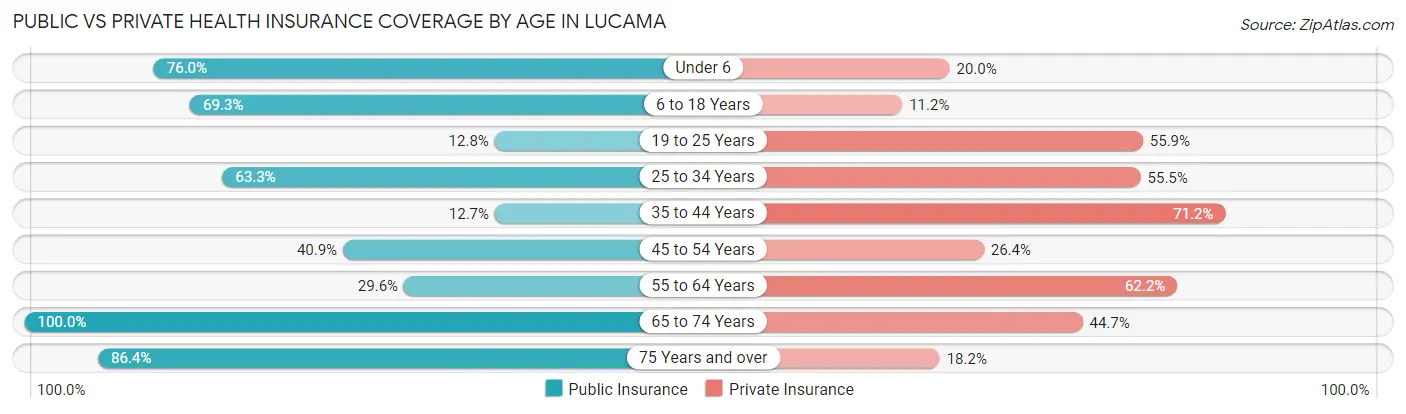
| Age Bracket | Public Insurance | Private Insurance |
| Under 6 | 114 (76.0%) | 30 (20.0%) |
| 6 to 18 Years | 142 (69.3%) | 23 (11.2%) |
| 19 to 25 Years | 13 (12.8%) | 57 (55.9%) |
| 25 to 34 Years | 81 (63.3%) | 71 (55.5%) |
| 35 to 44 Years | 15 (12.7%) | 84 (71.2%) |
| 45 to 54 Years | 45 (40.9%) | 29 (26.4%) |
| 55 to 64 Years | 29 (29.6%) | 61 (62.2%) |
| 65 to 74 Years | 94 (100.0%) | 42 (44.7%) |
| 75 Years and over | 38 (86.4%) | 8 (18.2%) |
| Total | 571 (54.4%) | 405 (38.6%) |
Disability Status by Sex by Age in Lucama
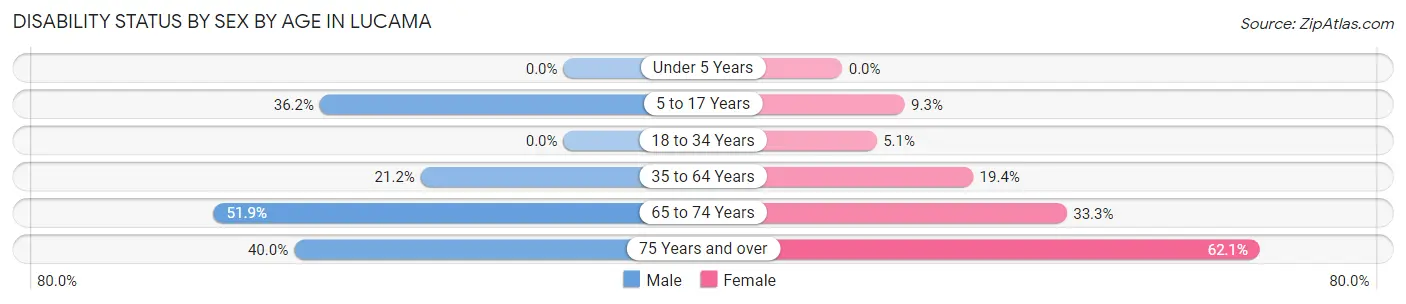
| Age Bracket | Male | Female |
| Under 5 Years | 0 (0.0%) | 0 (0.0%) |
| 5 to 17 Years | 34 (36.2%) | 10 (9.3%) |
| 18 to 34 Years | 0 (0.0%) | 7 (5.1%) |
| 35 to 64 Years | 32 (21.2%) | 34 (19.4%) |
| 65 to 74 Years | 27 (51.9%) | 14 (33.3%) |
| 75 Years and over | 6 (40.0%) | 18 (62.1%) |
Disability Class by Sex by Age in Lucama
Disability Class: Hearing Difficulty
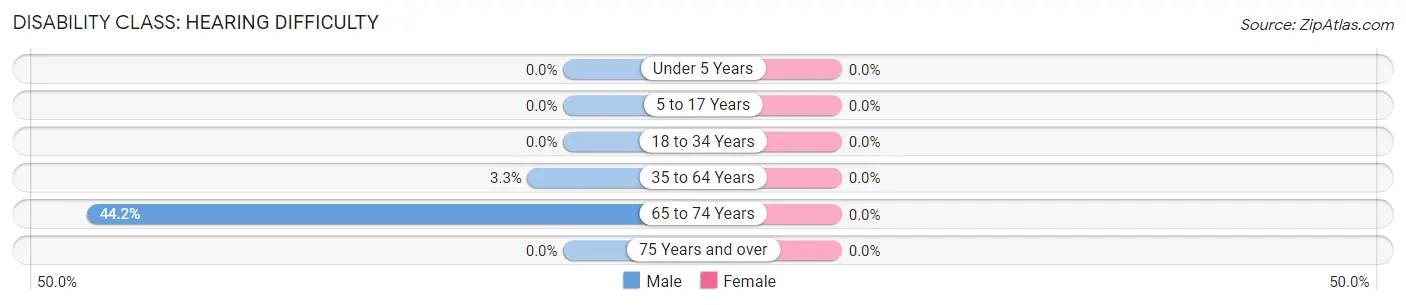
| Age Bracket | Male | Female |
| Under 5 Years | 0 (0.0%) | 0 (0.0%) |
| 5 to 17 Years | 0 (0.0%) | 0 (0.0%) |
| 18 to 34 Years | 0 (0.0%) | 0 (0.0%) |
| 35 to 64 Years | 5 (3.3%) | 0 (0.0%) |
| 65 to 74 Years | 23 (44.2%) | 0 (0.0%) |
| 75 Years and over | 0 (0.0%) | 0 (0.0%) |
Disability Class: Vision Difficulty
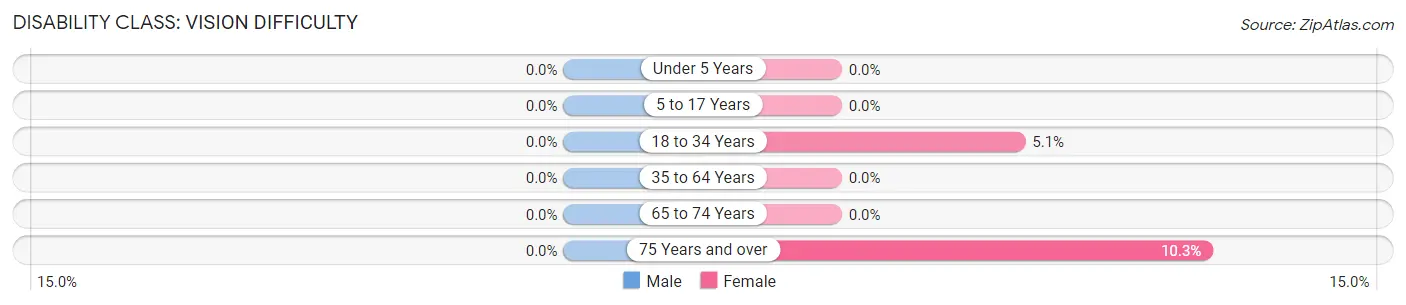
| Age Bracket | Male | Female |
| Under 5 Years | 0 (0.0%) | 0 (0.0%) |
| 5 to 17 Years | 0 (0.0%) | 0 (0.0%) |
| 18 to 34 Years | 0 (0.0%) | 7 (5.1%) |
| 35 to 64 Years | 0 (0.0%) | 0 (0.0%) |
| 65 to 74 Years | 0 (0.0%) | 0 (0.0%) |
| 75 Years and over | 0 (0.0%) | 3 (10.3%) |
Disability Class: Cognitive Difficulty
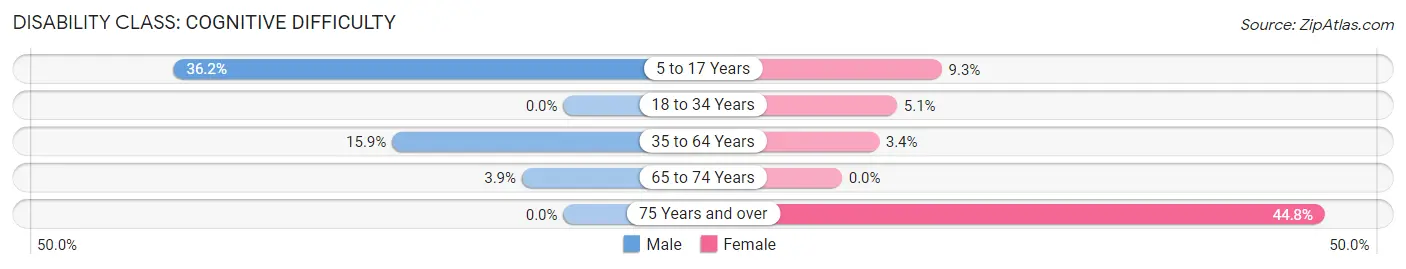
| Age Bracket | Male | Female |
| 5 to 17 Years | 34 (36.2%) | 10 (9.3%) |
| 18 to 34 Years | 0 (0.0%) | 7 (5.1%) |
| 35 to 64 Years | 24 (15.9%) | 6 (3.4%) |
| 65 to 74 Years | 2 (3.8%) | 0 (0.0%) |
| 75 Years and over | 0 (0.0%) | 13 (44.8%) |
Disability Class: Ambulatory Difficulty
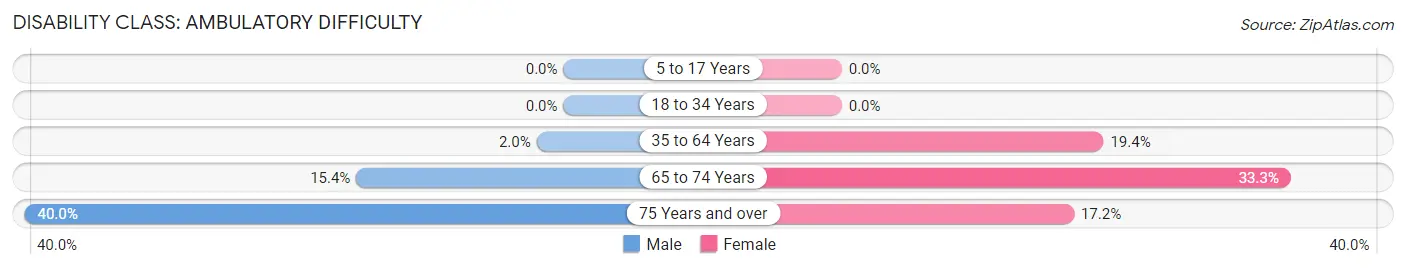
| Age Bracket | Male | Female |
| 5 to 17 Years | 0 (0.0%) | 0 (0.0%) |
| 18 to 34 Years | 0 (0.0%) | 0 (0.0%) |
| 35 to 64 Years | 3 (2.0%) | 34 (19.4%) |
| 65 to 74 Years | 8 (15.4%) | 14 (33.3%) |
| 75 Years and over | 6 (40.0%) | 5 (17.2%) |
Disability Class: Self-Care Difficulty
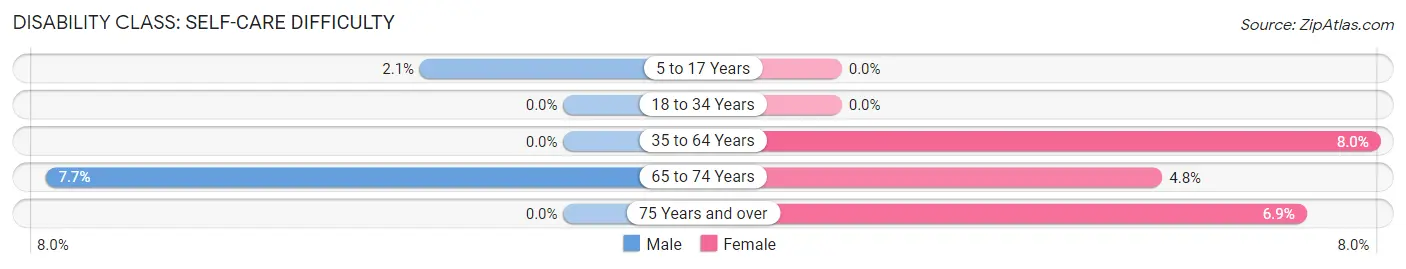
| Age Bracket | Male | Female |
| 5 to 17 Years | 2 (2.1%) | 0 (0.0%) |
| 18 to 34 Years | 0 (0.0%) | 0 (0.0%) |
| 35 to 64 Years | 0 (0.0%) | 14 (8.0%) |
| 65 to 74 Years | 4 (7.7%) | 2 (4.8%) |
| 75 Years and over | 0 (0.0%) | 2 (6.9%) |
Technology Access in Lucama
Computing Device Access in Lucama
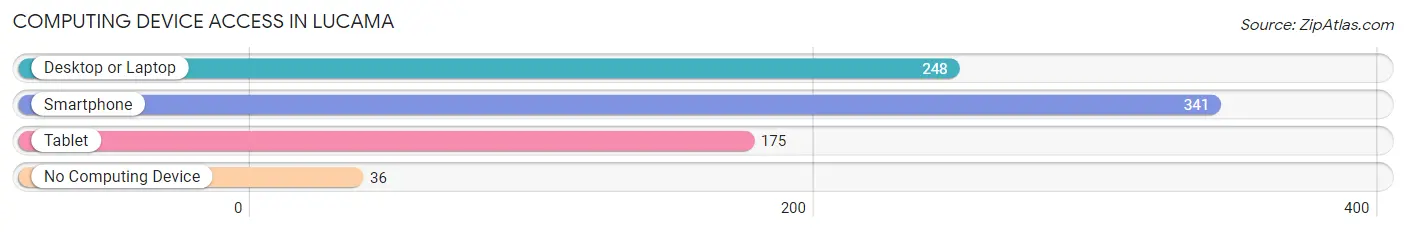
| Device Type | # Households | % Households |
| Desktop or Laptop | 248 | 64.7% |
| Smartphone | 341 | 89.0% |
| Tablet | 175 | 45.7% |
| No Computing Device | 36 | 9.4% |
| Total | 383 | 100.0% |
Internet Access in Lucama
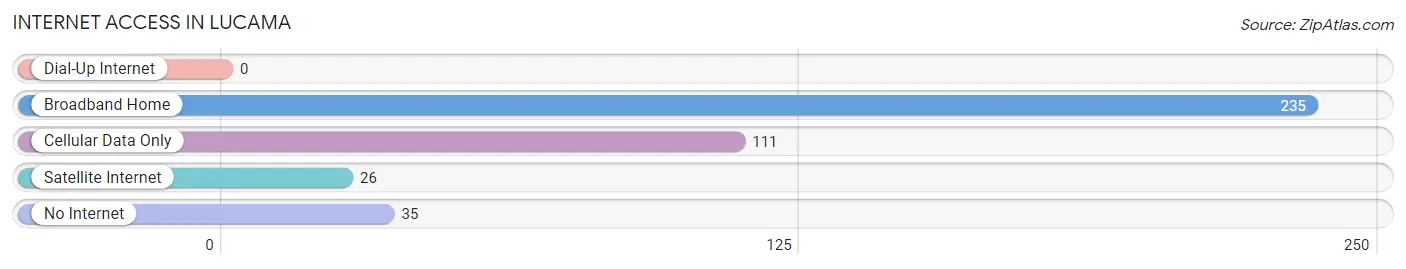
| Internet Type | # Households | % Households |
| Dial-Up Internet | 0 | 0.0% |
| Broadband Home | 235 | 61.4% |
| Cellular Data Only | 111 | 29.0% |
| Satellite Internet | 26 | 6.8% |
| No Internet | 35 | 9.1% |
| Total | 383 | 100.0% |
Lucama Summary
Lucama is a small town located in Wilson County, North Carolina. It is situated about 20 miles east of the city of Wilson and about 40 miles east of Raleigh, the state capital. The town was founded in 1891 and incorporated in 1901. As of the 2010 census, the population of Lucama was 1,945.
Geography
Lucama is located at 35°37'25"N 78°7'25"W (35.623607, -78.123545). It is situated in the Coastal Plain region of North Carolina, and is part of the larger Greenville-Spartanburg-Anderson Combined Statistical Area. The town is located on the banks of the Contentnea Creek, which flows into the Neuse River. The town is surrounded by farmland and is located near the intersection of US 301 and NC 581.
Climate
Lucama has a humid subtropical climate, with hot, humid summers and mild winters. The average annual temperature is around 68°F (20°C). The average annual precipitation is around 47 inches (119 cm).
Demographics
As of the 2010 census, there were 1,945 people, 745 households, and 517 families residing in the town. The population density was 1,092.3 people per square mile (421.7/km2). The racial makeup of the town was 68.2% White, 28.2% African American, 0.3% Native American, 0.7% Asian, 0.1% Pacific Islander, 0.9% from other races, and 1.6% from two or more races. Hispanic or Latino of any race were 2.3% of the population.
Economy
Lucama is a small, rural town with a primarily agricultural economy. The town is home to several small businesses, including a grocery store, a hardware store, and a few restaurants. The town is also home to a number of farms, which produce a variety of crops, including corn, soybeans, cotton, and tobacco.
The town is also home to a number of manufacturing companies, including a furniture manufacturer, a plastics manufacturer, and a metal fabrication company. The town is also home to a number of trucking companies, which provide transportation services to the surrounding area.
Education
Lucama is served by the Wilson County Schools system. The town is home to Lucama Elementary School, which serves students in grades K-5. The town is also home to a number of private schools, including a Christian school and a Montessori school.
Conclusion
Lucama is a small, rural town located in Wilson County, North Carolina. It is situated about 20 miles east of the city of Wilson and about 40 miles east of Raleigh, the state capital. The town was founded in 1891 and incorporated in 1901. As of the 2010 census, the population of Lucama was 1,945. The town has a humid subtropical climate, with hot, humid summers and mild winters. The town has a primarily agricultural economy, with a number of small businesses and farms. The town is served by the Wilson County Schools system, and is home to a number of private schools.
Common Questions
What is the Total Population of Lucama?
Total Population of Lucama is 1,058.
What is the Total Male Population of Lucama?
Total Male Population of Lucama is 518.
What is the Total Female Population of Lucama?
Total Female Population of Lucama is 540.
What is the Ratio of Males per 100 Females in Lucama?
There are 95.93 Males per 100 Females in Lucama.
What is the Ratio of Females per 100 Males in Lucama?
There are 104.25 Females per 100 Males in Lucama.
What is the Median Population Age in Lucama?
Median Population Age in Lucama is 29.7 Years.
What is the Average Family Size in Lucama
Average Family Size in Lucama is 3.4 People.
What is the Average Household Size in Lucama
Average Household Size in Lucama is 2.7 People.
What is Per Capita Income in Lucama?
Per Capita income in Lucama is $18,643.
What is the Median Family Income in Lucama?
Median Family Income in Lucama is $43,929.
What is the Median Household income in Lucama?
Median Household Income in Lucama is $37,750.
What is Income or Wage Gap in Lucama?
Income or Wage Gap in Lucama is 29.0%.
Women in Lucama earn 71.0 cents for every dollar earned by a man.
What is Inequality or Gini Index in Lucama?
Inequality or Gini Index in Lucama is 0.42.
How Large is the Labor Force in Lucama?
There are 476 People in the Labor Forcein in Lucama.
What is the Percentage of People in the Labor Force in Lucama?
64.5% of People are in the Labor Force in Lucama.
What is the Unemployment Rate in Lucama?
Unemployment Rate in Lucama is 11.1%.