Tyro, NC Map & Demographics
Tyro Map
Tyro Overview
$26,669
PER CAPITA INCOME
$57,857
AVG FAMILY INCOME
$55,995
AVG HOUSEHOLD INCOME
8.3%
WAGE / INCOME GAP [ % ]
91.7¢/ $1
WAGE / INCOME GAP [ $ ]
0.41
INEQUALITY / GINI INDEX
3,460
TOTAL POPULATION
1,816
MALE POPULATION
1,644
FEMALE POPULATION
110.46
MALES / 100 FEMALES
90.53
FEMALES / 100 MALES
36.2
MEDIAN AGE
2.9
AVG FAMILY SIZE
2.7
AVG HOUSEHOLD SIZE
1,662
LABOR FORCE [ PEOPLE ]
57.4%
PERCENT IN LABOR FORCE
2.9%
UNEMPLOYMENT RATE
Income in Tyro
Income Overview in Tyro
Per Capita Income in Tyro is $26,669, while median incomes of families and households are $57,857 and $55,995 respectively.
| Characteristic | Number | Measure |
| Per Capita Income | 3,460 | $26,669 |
| Median Family Income | 1,004 | $57,857 |
| Mean Family Income | 1,004 | $75,219 |
| Median Household Income | 1,297 | $55,995 |
| Mean Household Income | 1,297 | $70,316 |
| Income Deficit | 1,004 | $0 |
| Wage / Income Gap (%) | 3,460 | 8.26% |
| Wage / Income Gap ($) | 3,460 | 91.74¢ per $1 |
| Gini / Inequality Index | 3,460 | 0.41 |
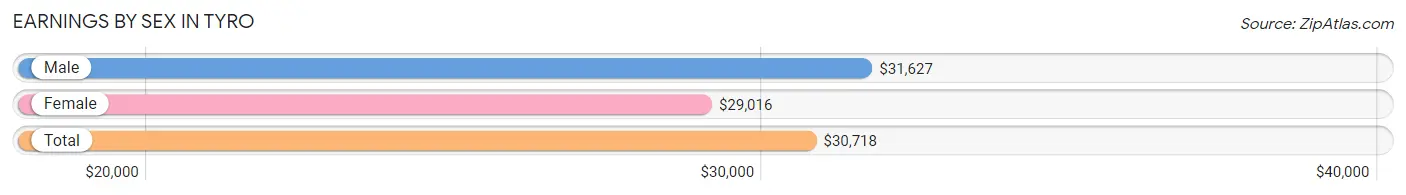
Earnings by Sex in Tyro
Average Earnings in Tyro are $30,718, $31,627 for men and $29,016 for women, a difference of 8.3%.
| Sex | Number | Average Earnings |
| Male | 981 (55.5%) | $31,627 |
| Female | 785 (44.5%) | $29,016 |
| Total | 1,766 (100.0%) | $30,718 |
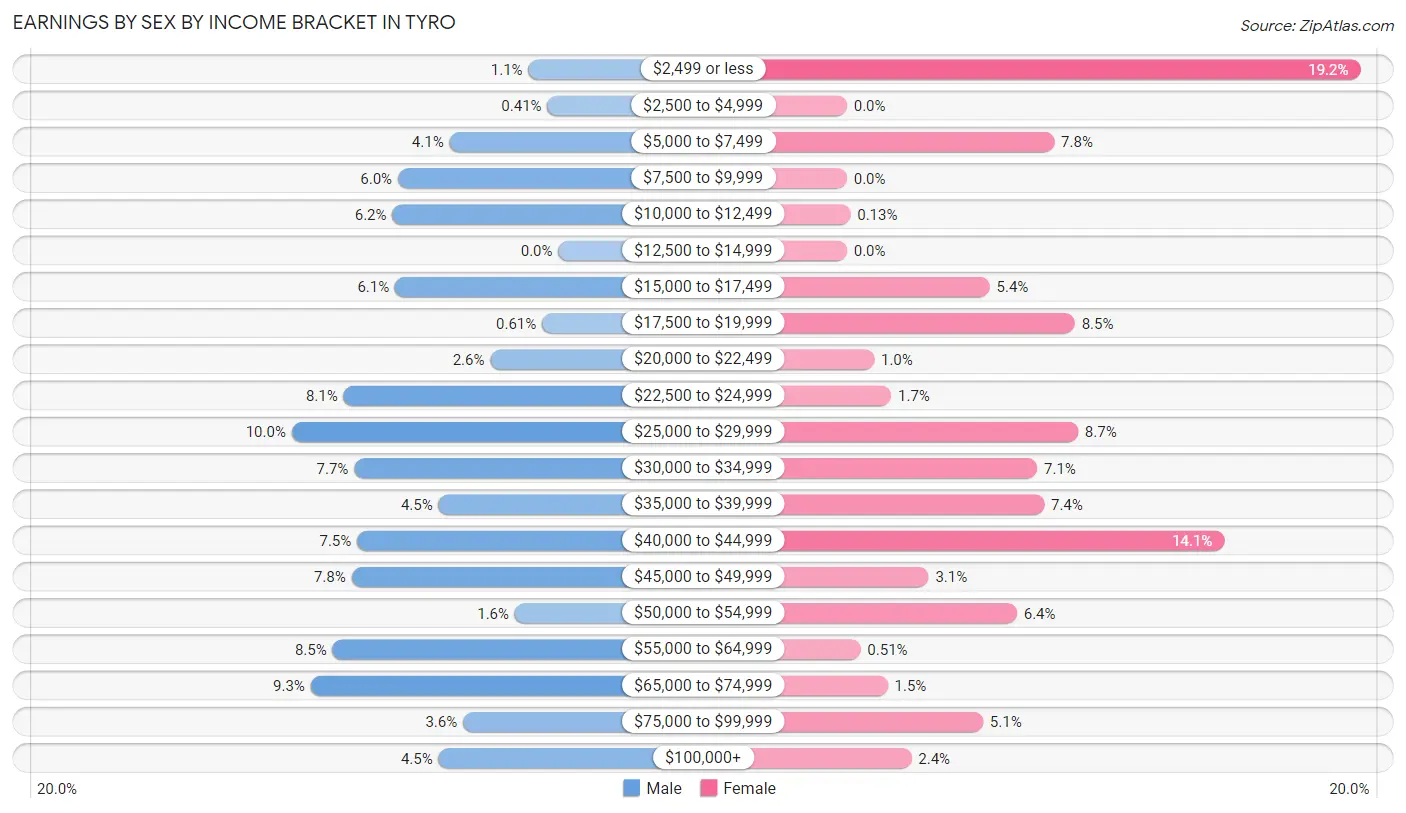
Earnings by Sex by Income Bracket in Tyro
The most common earnings brackets in Tyro are $25,000 to $29,999 for men (98 | 10.0%) and $2,499 or less for women (151 | 19.2%).
| Income | Male | Female |
| $2,499 or less | 11 (1.1%) | 151 (19.2%) |
| $2,500 to $4,999 | 4 (0.4%) | 0 (0.0%) |
| $5,000 to $7,499 | 40 (4.1%) | 61 (7.8%) |
| $7,500 to $9,999 | 59 (6.0%) | 0 (0.0%) |
| $10,000 to $12,499 | 61 (6.2%) | 1 (0.1%) |
| $12,500 to $14,999 | 0 (0.0%) | 0 (0.0%) |
| $15,000 to $17,499 | 60 (6.1%) | 42 (5.3%) |
| $17,500 to $19,999 | 6 (0.6%) | 67 (8.5%) |
| $20,000 to $22,499 | 25 (2.5%) | 8 (1.0%) |
| $22,500 to $24,999 | 79 (8.1%) | 13 (1.7%) |
| $25,000 to $29,999 | 98 (10.0%) | 68 (8.7%) |
| $30,000 to $34,999 | 75 (7.6%) | 56 (7.1%) |
| $35,000 to $39,999 | 44 (4.5%) | 58 (7.4%) |
| $40,000 to $44,999 | 74 (7.5%) | 111 (14.1%) |
| $45,000 to $49,999 | 76 (7.7%) | 24 (3.1%) |
| $50,000 to $54,999 | 16 (1.6%) | 50 (6.4%) |
| $55,000 to $64,999 | 83 (8.5%) | 4 (0.5%) |
| $65,000 to $74,999 | 91 (9.3%) | 12 (1.5%) |
| $75,000 to $99,999 | 35 (3.6%) | 40 (5.1%) |
| $100,000+ | 44 (4.5%) | 19 (2.4%) |
| Total | 981 (100.0%) | 785 (100.0%) |
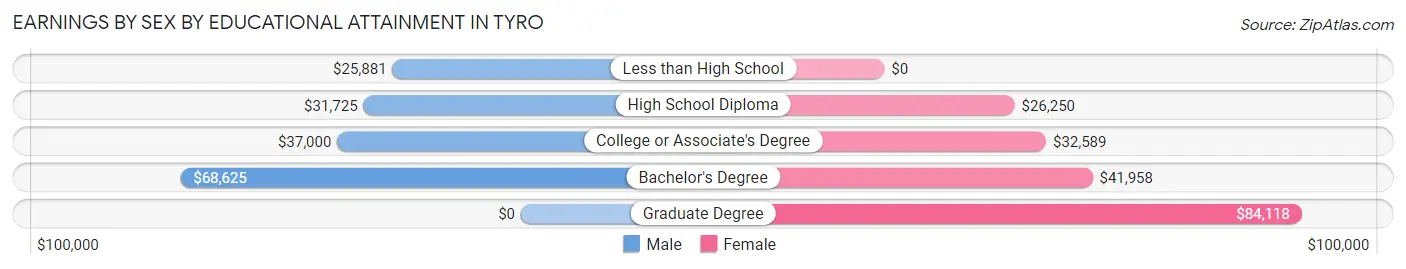
Earnings by Sex by Educational Attainment in Tyro
Average earnings in Tyro are $35,489 for men and $34,688 for women, a difference of 2.3%. Men with an educational attainment of bachelor's degree enjoy the highest average annual earnings of $68,625, while those with less than high school education earn the least with $25,881. Women with an educational attainment of graduate degree earn the most with the average annual earnings of $84,118, while those with high school diploma education have the smallest earnings of $26,250.
| Educational Attainment | Male Income | Female Income |
| Less than High School | $25,881 | $0 |
| High School Diploma | $31,725 | $26,250 |
| College or Associate's Degree | $37,000 | $32,589 |
| Bachelor's Degree | $68,625 | $41,958 |
| Graduate Degree | - | - |
| Total | $35,489 | $34,688 |
Family Income in Tyro
Family Income Brackets in Tyro
According to the Tyro family income data, there are 183 families falling into the $75,000 to $99,999 income range, which is the most common income bracket and makes up 18.2% of all families.
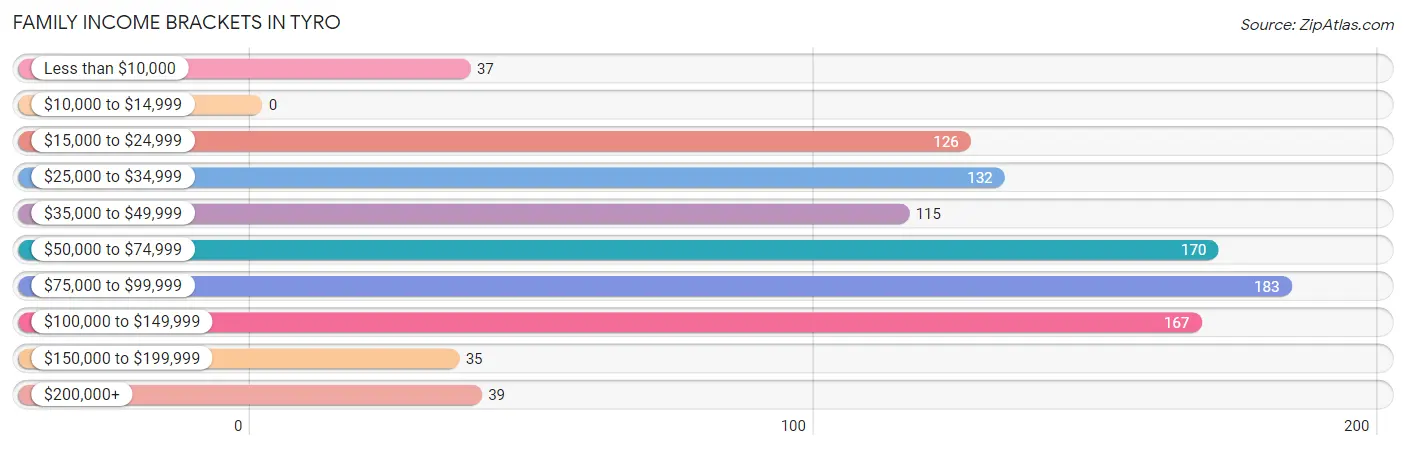
| Income Bracket | # Families | % Families |
| Less than $10,000 | 37 | 3.7% |
| $10,000 to $14,999 | 0 | 0.0% |
| $15,000 to $24,999 | 126 | 12.5% |
| $25,000 to $34,999 | 132 | 13.1% |
| $35,000 to $49,999 | 115 | 11.5% |
| $50,000 to $74,999 | 170 | 16.9% |
| $75,000 to $99,999 | 183 | 18.2% |
| $100,000 to $149,999 | 167 | 16.6% |
| $150,000 to $199,999 | 35 | 3.5% |
| $200,000+ | 39 | 3.9% |
Family Income by Famaliy Size in Tyro
3-person families (145 | 14.4%) account for the highest median family income in Tyro with $100,817 per family, while 3-person families (145 | 14.4%) have the highest median income of $33,606 per family member.
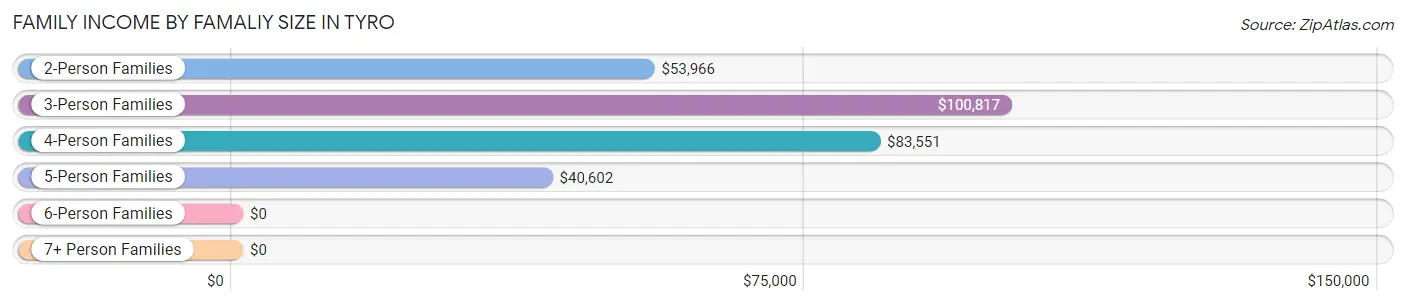
| Income Bracket | # Families | Median Income |
| 2-Person Families | 580 (57.8%) | $53,966 |
| 3-Person Families | 145 (14.4%) | $100,817 |
| 4-Person Families | 185 (18.4%) | $83,551 |
| 5-Person Families | 57 (5.7%) | $40,602 |
| 6-Person Families | 35 (3.5%) | $0 |
| 7+ Person Families | 2 (0.2%) | $0 |
| Total | 1,004 (100.0%) | $57,857 |
Family Income by Number of Earners in Tyro
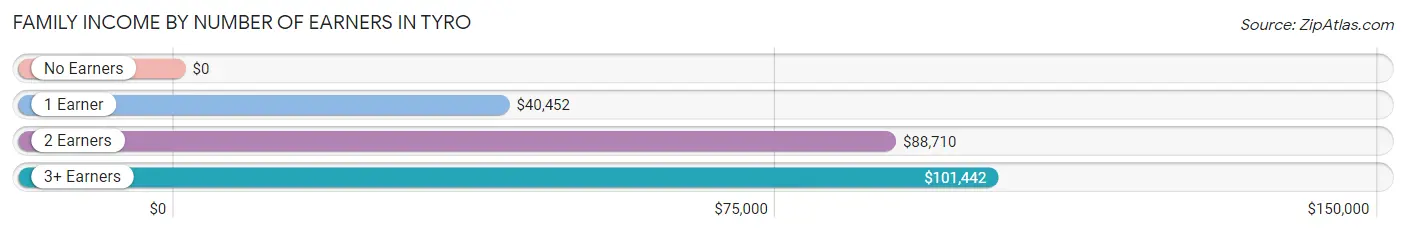
| Number of Earners | # Families | Median Income |
| No Earners | 185 (18.4%) | $0 |
| 1 Earner | 363 (36.2%) | $40,452 |
| 2 Earners | 358 (35.7%) | $88,710 |
| 3+ Earners | 98 (9.8%) | $101,442 |
| Total | 1,004 (100.0%) | $57,857 |
Household Income in Tyro
Household Income Brackets in Tyro
With 233 households falling in the category, the $100,000 to $149,999 income range is the most frequent in Tyro, accounting for 18.0% of all households.
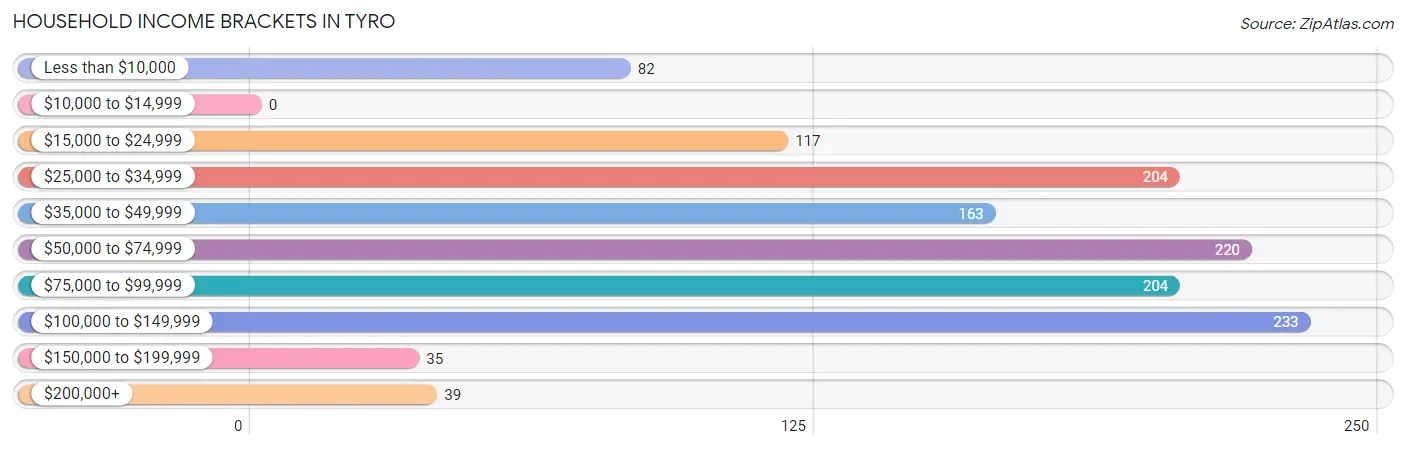
| Income Bracket | # Households | % Households |
| Less than $10,000 | 82 | 6.3% |
| $10,000 to $14,999 | 0 | 0.0% |
| $15,000 to $24,999 | 117 | 9.0% |
| $25,000 to $34,999 | 204 | 15.7% |
| $35,000 to $49,999 | 163 | 12.6% |
| $50,000 to $74,999 | 220 | 17.0% |
| $75,000 to $99,999 | 204 | 15.7% |
| $100,000 to $149,999 | 233 | 18.0% |
| $150,000 to $199,999 | 35 | 2.7% |
| $200,000+ | 39 | 3.0% |
Household Income by Householder Age in Tyro
The median household income in Tyro is $55,995, with the highest median household income of $62,827 found in the 45 to 64 years age bracket for the primary householder. A total of 631 households (48.6%) fall into this category. Meanwhile, the 15 to 24 years age bracket for the primary householder has the lowest median household income of $0, with 16 households (1.2%) in this group.
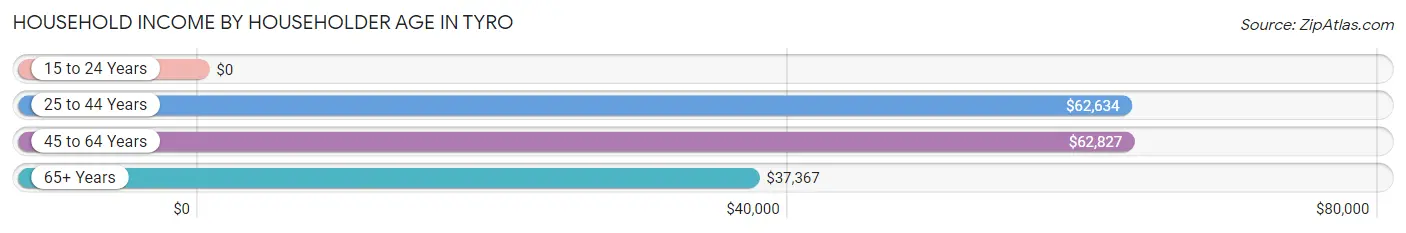
| Income Bracket | # Households | Median Income |
| 15 to 24 Years | 16 (1.2%) | $0 |
| 25 to 44 Years | 341 (26.3%) | $62,634 |
| 45 to 64 Years | 631 (48.6%) | $62,827 |
| 65+ Years | 309 (23.8%) | $37,367 |
| Total | 1,297 (100.0%) | $55,995 |
Poverty in Tyro
Income Below Poverty by Sex and Age in Tyro
With 19.5% poverty level for males and 15.6% for females among the residents of Tyro, 5 year old males and under 5 year old females are the most vulnerable to poverty, with 29 males (100.0%) and 64 females (46.7%) in their respective age groups living below the poverty level.
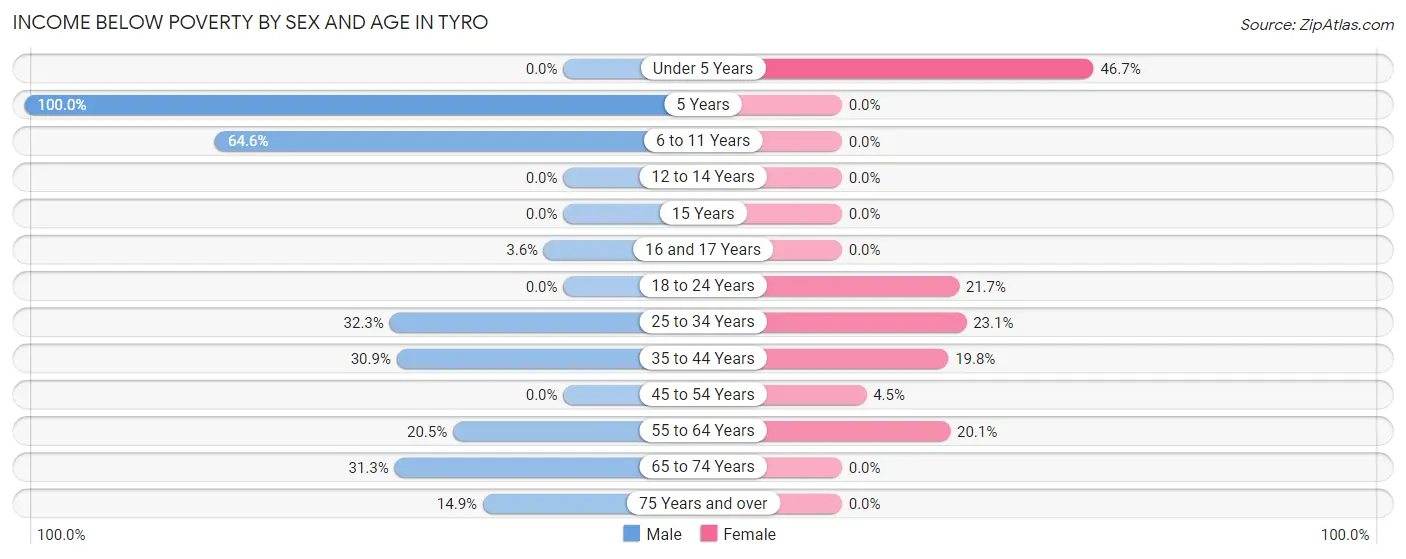
| Age Bracket | Male | Female |
| Under 5 Years | 0 (0.0%) | 64 (46.7%) |
| 5 Years | 29 (100.0%) | 0 (0.0%) |
| 6 to 11 Years | 53 (64.6%) | 0 (0.0%) |
| 12 to 14 Years | 0 (0.0%) | 0 (0.0%) |
| 15 Years | 0 (0.0%) | 0 (0.0%) |
| 16 and 17 Years | 4 (3.6%) | 0 (0.0%) |
| 18 to 24 Years | 0 (0.0%) | 28 (21.7%) |
| 25 to 34 Years | 89 (32.3%) | 88 (23.1%) |
| 35 to 44 Years | 30 (30.9%) | 16 (19.8%) |
| 45 to 54 Years | 0 (0.0%) | 13 (4.5%) |
| 55 to 64 Years | 69 (20.5%) | 47 (20.1%) |
| 65 to 74 Years | 68 (31.3%) | 0 (0.0%) |
| 75 Years and over | 10 (14.9%) | 0 (0.0%) |
| Total | 352 (19.5%) | 256 (15.6%) |
Income Above Poverty by Sex and Age in Tyro
According to the poverty statistics in Tyro, males aged under 5 years and females aged 6 to 11 years are the age groups that are most secure financially, with 100.0% of males and 100.0% of females in these age groups living above the poverty line.
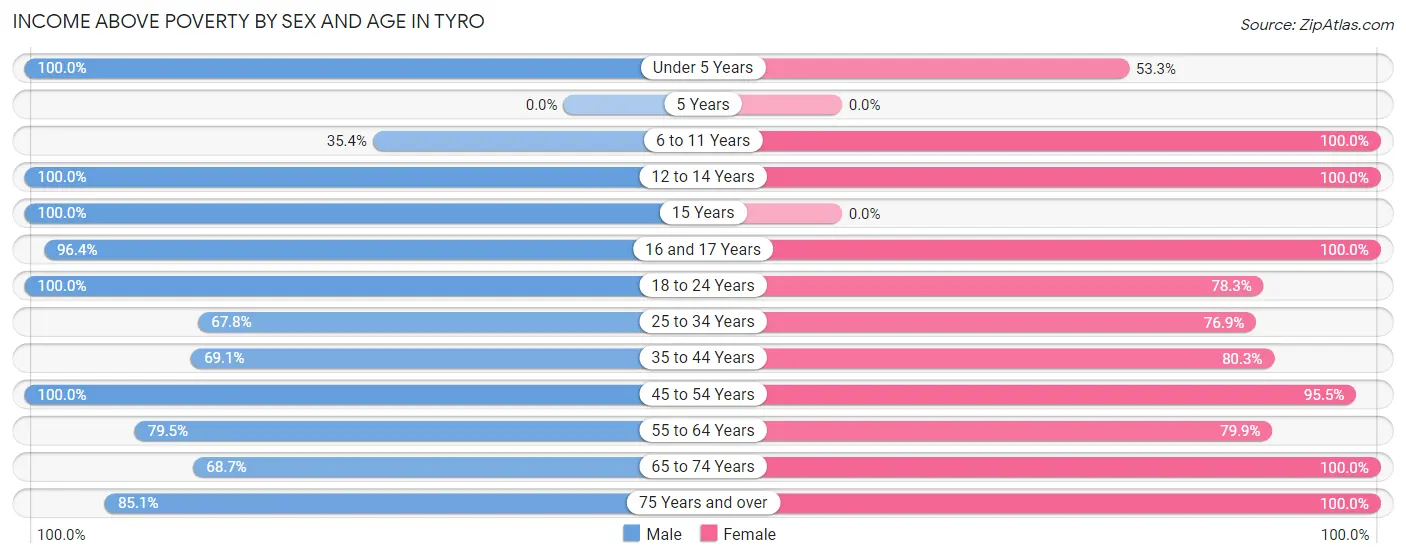
| Age Bracket | Male | Female |
| Under 5 Years | 89 (100.0%) | 73 (53.3%) |
| 5 Years | 0 (0.0%) | 0 (0.0%) |
| 6 to 11 Years | 29 (35.4%) | 90 (100.0%) |
| 12 to 14 Years | 57 (100.0%) | 65 (100.0%) |
| 15 Years | 9 (100.0%) | 0 (0.0%) |
| 16 and 17 Years | 107 (96.4%) | 19 (100.0%) |
| 18 to 24 Years | 199 (100.0%) | 101 (78.3%) |
| 25 to 34 Years | 187 (67.7%) | 293 (76.9%) |
| 35 to 44 Years | 67 (69.1%) | 65 (80.2%) |
| 45 to 54 Years | 240 (100.0%) | 274 (95.5%) |
| 55 to 64 Years | 268 (79.5%) | 187 (79.9%) |
| 65 to 74 Years | 149 (68.7%) | 130 (100.0%) |
| 75 Years and over | 57 (85.1%) | 91 (100.0%) |
| Total | 1,458 (80.5%) | 1,388 (84.4%) |
Income Below Poverty Among Married-Couple Families in Tyro
The poverty statistics for married-couple families in Tyro show that 11.5% or 84 of the total 731 families live below the poverty line. Families with no children have the highest poverty rate of 11.7%, comprising of 49 families. On the other hand, families with 3 or 4 children have the lowest poverty rate of 0.0%, which includes 0 families.
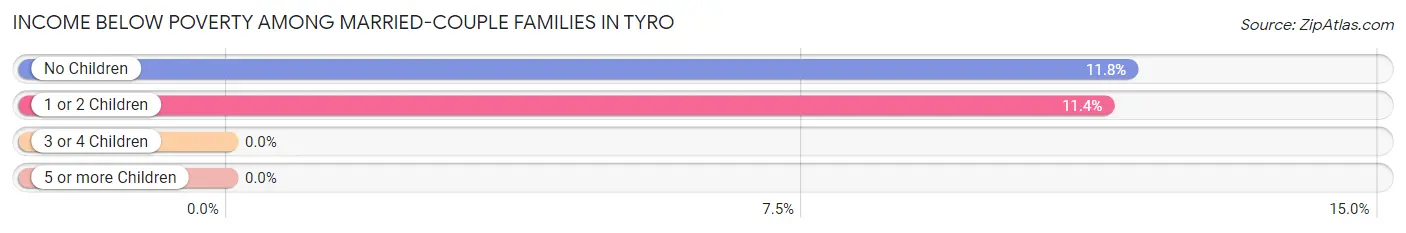
| Children | Above Poverty | Below Poverty |
| No Children | 368 (88.2%) | 49 (11.7%) |
| 1 or 2 Children | 271 (88.6%) | 35 (11.4%) |
| 3 or 4 Children | 8 (100.0%) | 0 (0.0%) |
| 5 or more Children | 0 (0.0%) | 0 (0.0%) |
| Total | 647 (88.5%) | 84 (11.5%) |
Income Below Poverty Among Single-Parent Households in Tyro
According to the poverty data in Tyro, 34.5% or 40 single-father households and 24.2% or 38 single-mother households are living below the poverty line. Among single-father households, those with 1 or 2 children have the highest poverty rate, with 40 households (83.3%) experiencing poverty. Likewise, among single-mother households, those with 1 or 2 children have the highest poverty rate, with 38 households (49.3%) falling below the poverty line.
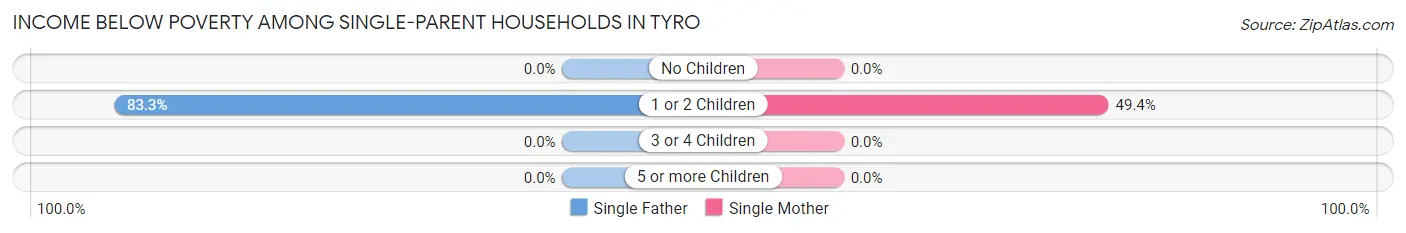
| Children | Single Father | Single Mother |
| No Children | 0 (0.0%) | 0 (0.0%) |
| 1 or 2 Children | 40 (83.3%) | 38 (49.3%) |
| 3 or 4 Children | 0 (0.0%) | 0 (0.0%) |
| 5 or more Children | 0 (0.0%) | 0 (0.0%) |
| Total | 40 (34.5%) | 38 (24.2%) |
Income Below Poverty Among Married-Couple vs Single-Parent Households in Tyro
The poverty data for Tyro shows that 84 of the married-couple family households (11.5%) and 78 of the single-parent households (28.6%) are living below the poverty level. Within the married-couple family households, those with no children have the highest poverty rate, with 49 households (11.7%) falling below the poverty line. Among the single-parent households, those with 1 or 2 children have the highest poverty rate, with 78 household (62.4%) living below poverty.
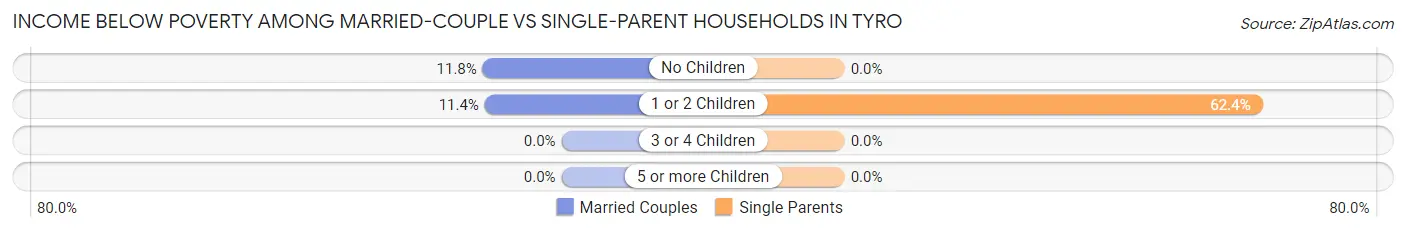
| Children | Married-Couple Families | Single-Parent Households |
| No Children | 49 (11.7%) | 0 (0.0%) |
| 1 or 2 Children | 35 (11.4%) | 78 (62.4%) |
| 3 or 4 Children | 0 (0.0%) | 0 (0.0%) |
| 5 or more Children | 0 (0.0%) | 0 (0.0%) |
| Total | 84 (11.5%) | 78 (28.6%) |
Race in Tyro
The most populous races in Tyro are White / Caucasian (3,341 | 96.6%), Two or more Races (60 | 1.7%), and Black / African American (59 | 1.7%).
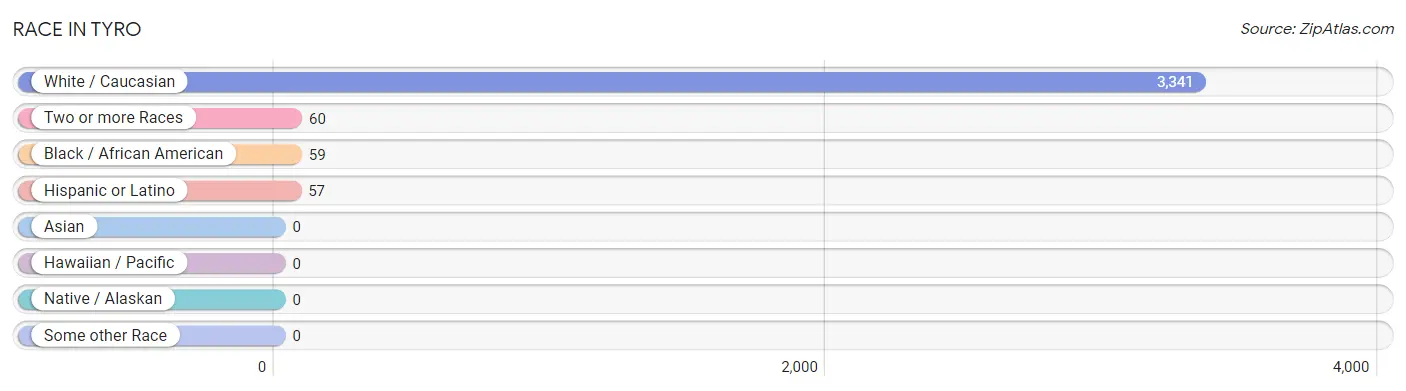
| Race | # Population | % Population |
| Asian | 0 | 0.0% |
| Black / African American | 59 | 1.7% |
| Hawaiian / Pacific | 0 | 0.0% |
| Hispanic or Latino | 57 | 1.7% |
| Native / Alaskan | 0 | 0.0% |
| White / Caucasian | 3,341 | 96.6% |
| Two or more Races | 60 | 1.7% |
| Some other Race | 0 | 0.0% |
| Total | 3,460 | 100.0% |
Ancestry in Tyro
The most populous ancestries reported in Tyro are American (402 | 11.6%), German (336 | 9.7%), English (331 | 9.6%), Irish (316 | 9.1%), and Scottish (73 | 2.1%), together accounting for 42.1% of all Tyro residents.
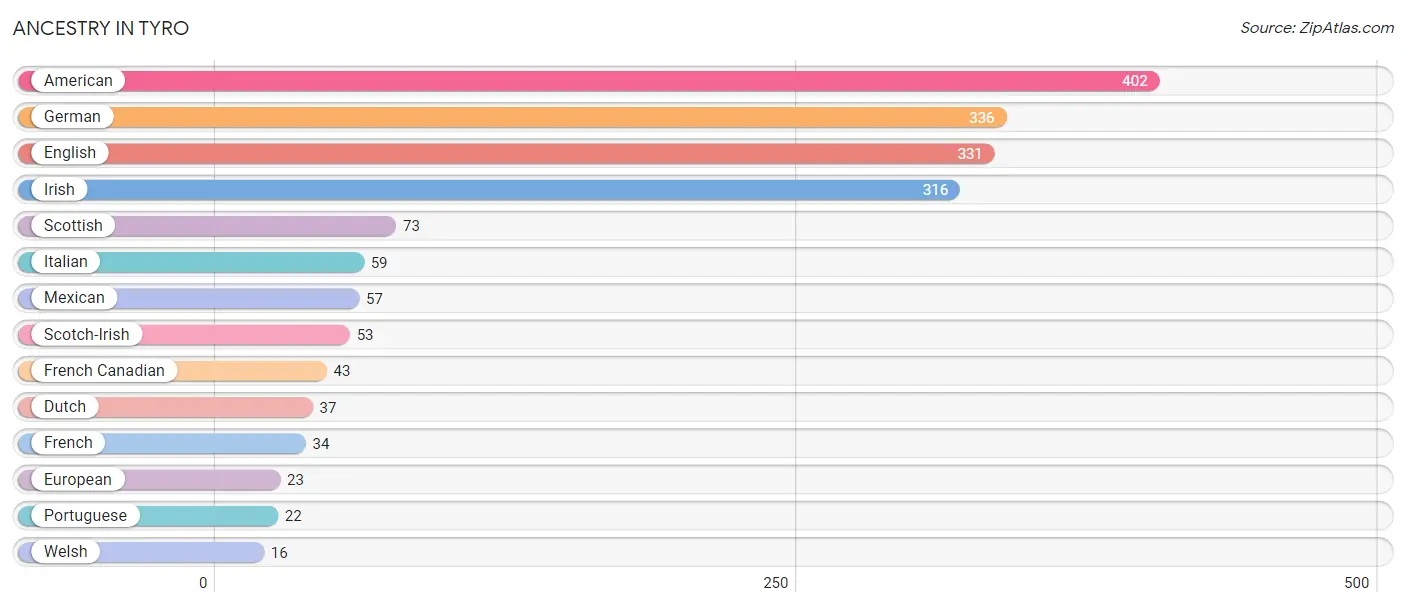
| Ancestry | # Population | % Population |
| American | 402 | 11.6% |
| Dutch | 37 | 1.1% |
| English | 331 | 9.6% |
| European | 23 | 0.7% |
| French | 34 | 1.0% |
| French Canadian | 43 | 1.2% |
| German | 336 | 9.7% |
| Irish | 316 | 9.1% |
| Italian | 59 | 1.7% |
| Mexican | 57 | 1.7% |
| Portuguese | 22 | 0.6% |
| Scotch-Irish | 53 | 1.5% |
| Scottish | 73 | 2.1% |
| Welsh | 16 | 0.5% | View All 14 Rows |
Immigrants in Tyro
The most numerous immigrant groups reported in Tyro came from Central America (20 | 0.6%), Latin America (20 | 0.6%), and Mexico (20 | 0.6%), together accounting for 1.7% of all Tyro residents.
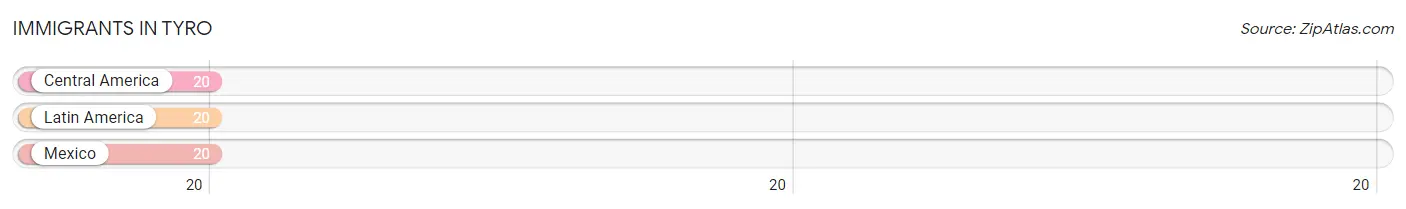
| Immigration Origin | # Population | % Population |
| Central America | 20 | 0.6% |
| Latin America | 20 | 0.6% |
| Mexico | 20 | 0.6% | View All 3 Rows |
Sex and Age in Tyro
Sex and Age in Tyro
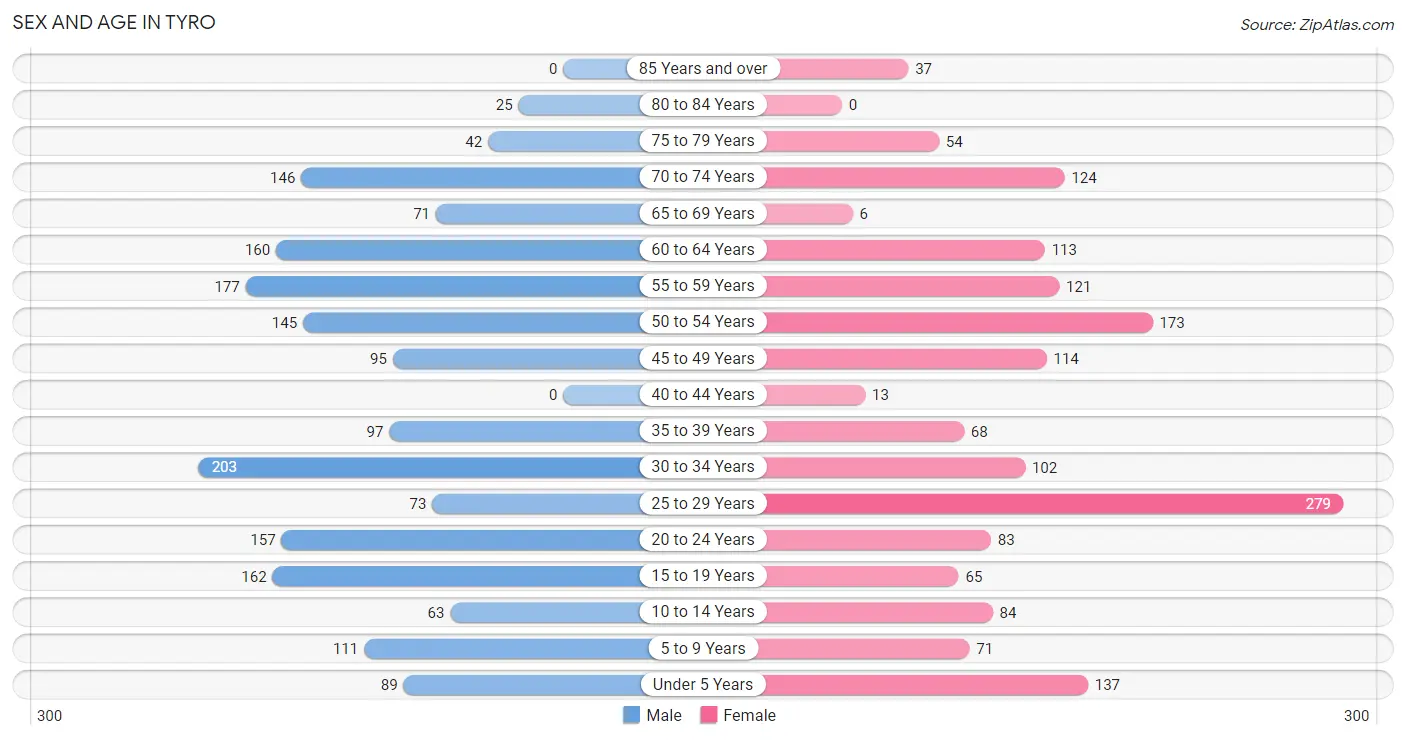
The most populous age groups in Tyro are 30 to 34 Years (203 | 11.2%) for men and 25 to 29 Years (279 | 17.0%) for women.
| Age Bracket | Male | Female |
| Under 5 Years | 89 (4.9%) | 137 (8.3%) |
| 5 to 9 Years | 111 (6.1%) | 71 (4.3%) |
| 10 to 14 Years | 63 (3.5%) | 84 (5.1%) |
| 15 to 19 Years | 162 (8.9%) | 65 (4.0%) |
| 20 to 24 Years | 157 (8.6%) | 83 (5.1%) |
| 25 to 29 Years | 73 (4.0%) | 279 (17.0%) |
| 30 to 34 Years | 203 (11.2%) | 102 (6.2%) |
| 35 to 39 Years | 97 (5.3%) | 68 (4.1%) |
| 40 to 44 Years | 0 (0.0%) | 13 (0.8%) |
| 45 to 49 Years | 95 (5.2%) | 114 (6.9%) |
| 50 to 54 Years | 145 (8.0%) | 173 (10.5%) |
| 55 to 59 Years | 177 (9.8%) | 121 (7.4%) |
| 60 to 64 Years | 160 (8.8%) | 113 (6.9%) |
| 65 to 69 Years | 71 (3.9%) | 6 (0.4%) |
| 70 to 74 Years | 146 (8.0%) | 124 (7.5%) |
| 75 to 79 Years | 42 (2.3%) | 54 (3.3%) |
| 80 to 84 Years | 25 (1.4%) | 0 (0.0%) |
| 85 Years and over | 0 (0.0%) | 37 (2.2%) |
| Total | 1,816 (100.0%) | 1,644 (100.0%) |
Families and Households in Tyro
Median Family Size in Tyro
The median family size in Tyro is 2.93 persons per family, with married-couple families (731 | 72.8%) accounting for the largest median family size of 3.03 persons per family. On the other hand, single male/father families (116 | 11.6%) represent the smallest median family size with 2.55 persons per family.
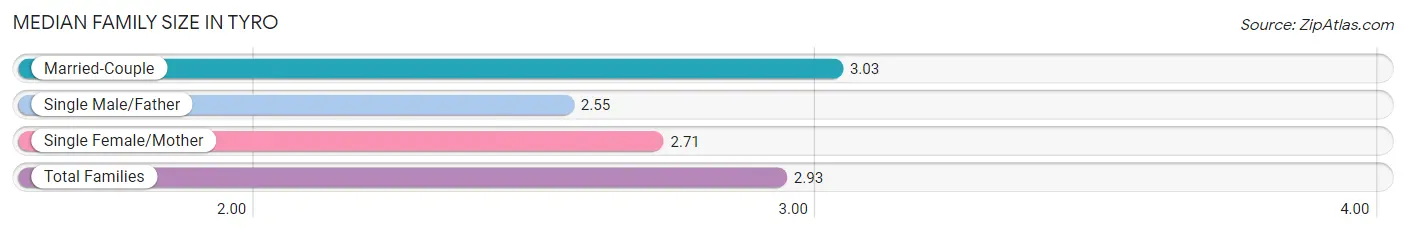
| Family Type | # Families | Family Size |
| Married-Couple | 731 (72.8%) | 3.03 |
| Single Male/Father | 116 (11.6%) | 2.55 |
| Single Female/Mother | 157 (15.6%) | 2.71 |
| Total Families | 1,004 (100.0%) | 2.93 |
Median Household Size in Tyro
The median household size in Tyro is 2.67 persons per household, with single male/father households (116 | 8.9%) accounting for the largest median household size of 3.12 persons per household. non-family households (293 | 22.6%) represent the smallest median household size with 1.34 persons per household.
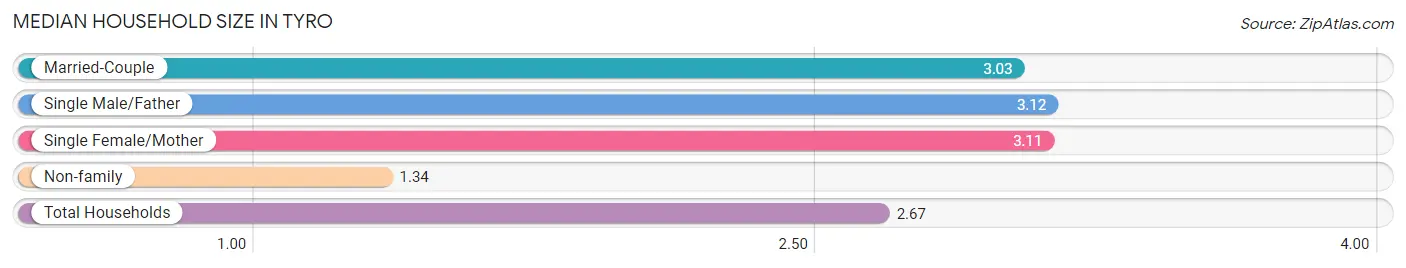
| Household Type | # Households | Household Size |
| Married-Couple | 731 (56.4%) | 3.03 |
| Single Male/Father | 116 (8.9%) | 3.12 |
| Single Female/Mother | 157 (12.1%) | 3.11 |
| Non-family | 293 (22.6%) | 1.34 |
| Total Households | 1,297 (100.0%) | 2.67 |
Household Size by Marriage Status in Tyro
Out of a total of 1,297 households in Tyro, 1,004 (77.4%) are family households, while 293 (22.6%) are nonfamily households. The most numerous type of family households are 2-person households, comprising 488, and the most common type of nonfamily households are 1-person households, comprising 229.
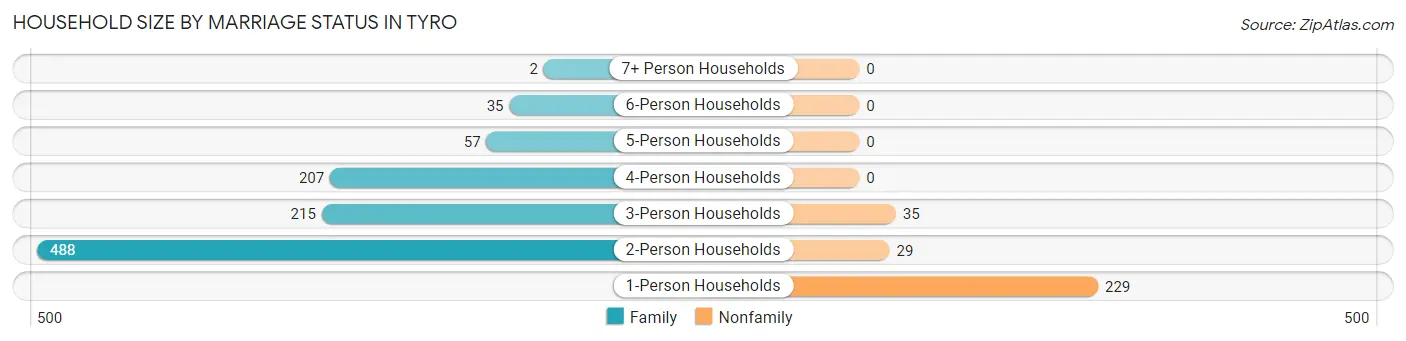
| Household Size | Family Households | Nonfamily Households |
| 1-Person Households | - | 229 (17.7%) |
| 2-Person Households | 488 (37.6%) | 29 (2.2%) |
| 3-Person Households | 215 (16.6%) | 35 (2.7%) |
| 4-Person Households | 207 (16.0%) | 0 (0.0%) |
| 5-Person Households | 57 (4.4%) | 0 (0.0%) |
| 6-Person Households | 35 (2.7%) | 0 (0.0%) |
| 7+ Person Households | 2 (0.2%) | 0 (0.0%) |
| Total | 1,004 (77.4%) | 293 (22.6%) |
Female Fertility in Tyro
Fertility by Age in Tyro
Average fertility rate in Tyro is 109.0 births per 1,000 women. Women in the age bracket of 20 to 34 years have the highest fertility rate with 151.0 births per 1,000 women. Women in the age bracket of 20 to 34 years acount for 78.6% of all women with births.
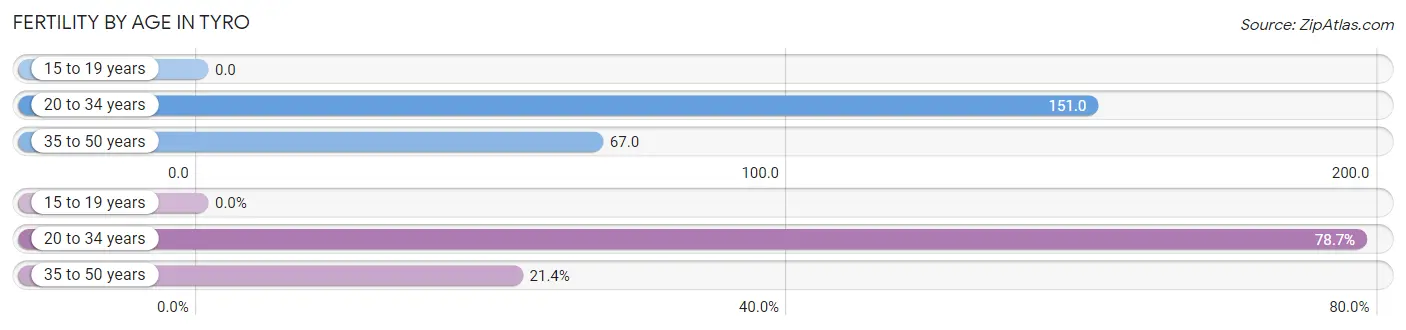
| Age Bracket | Women with Births | Births / 1,000 Women |
| 15 to 19 years | 0 (0.0%) | 0.0 |
| 20 to 34 years | 70 (78.6%) | 151.0 |
| 35 to 50 years | 19 (21.3%) | 67.0 |
| Total | 89 (100.0%) | 109.0 |
Fertility by Age by Marriage Status in Tyro
37.1% of women with births (89) in Tyro are married. The highest percentage of unmarried women with births falls into 20 to 34 years age bracket with 80.0% of them unmarried at the time of birth, while the lowest percentage of unmarried women with births belong to 35 to 50 years age bracket with 0.0% of them unmarried.
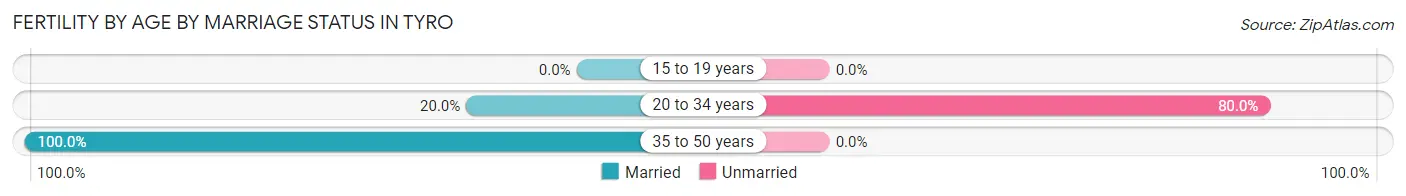
| Age Bracket | Married | Unmarried |
| 15 to 19 years | 0 (0.0%) | 0 (0.0%) |
| 20 to 34 years | 14 (20.0%) | 56 (80.0%) |
| 35 to 50 years | 19 (100.0%) | 0 (0.0%) |
| Total | 33 (37.1%) | 56 (62.9%) |
Fertility by Education in Tyro
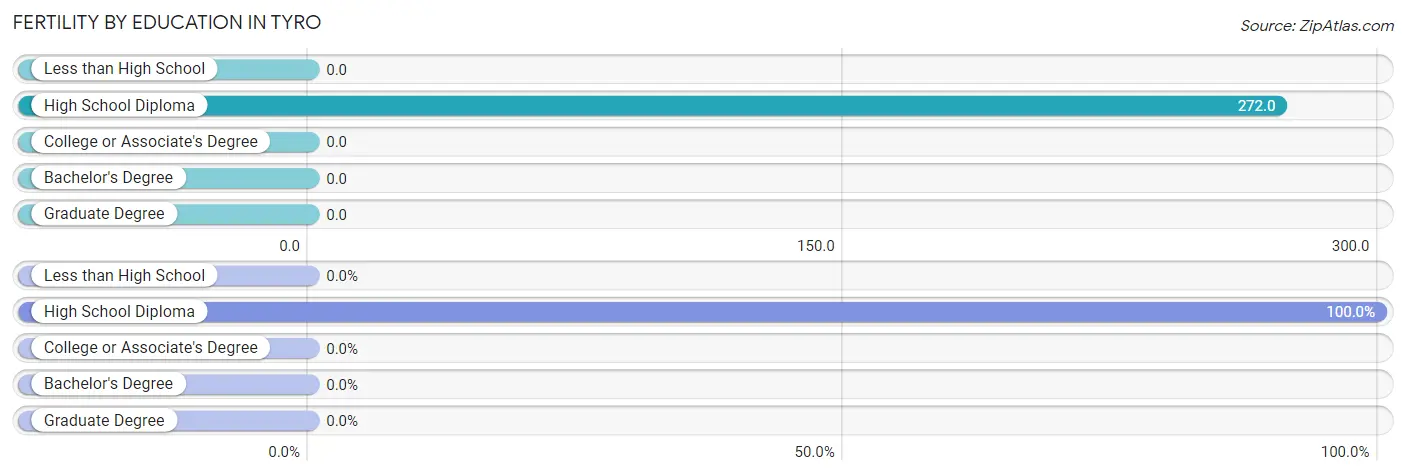
| Educational Attainment | Women with Births | Births / 1,000 Women |
| Less than High School | 0 (0.0%) | 0.0 |
| High School Diploma | 89 (100.0%) | 272.0 |
| College or Associate's Degree | 0 (0.0%) | 0.0 |
| Bachelor's Degree | 0 (0.0%) | 0.0 |
| Graduate Degree | 0 (0.0%) | 0.0 |
| Total | 89 (100.0%) | 109.0 |
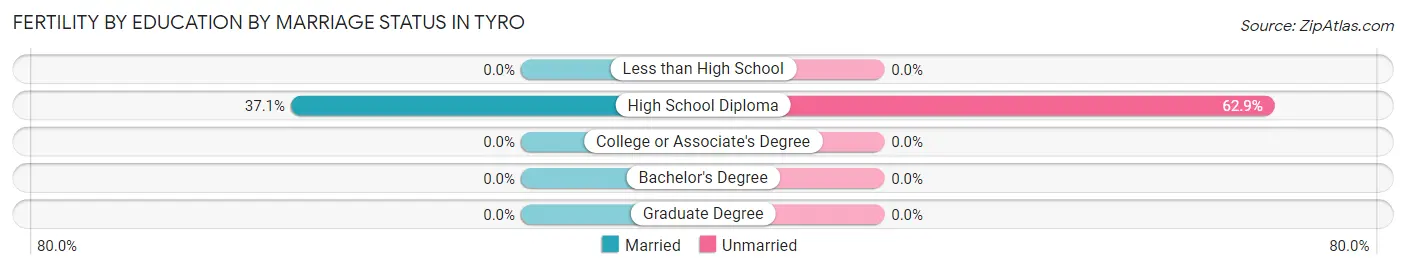
Fertility by Education by Marriage Status in Tyro
62.9% of women with births in Tyro are unmarried. Women with the educational attainment of high school diploma are most likely to be married with 37.1% of them married at childbirth, while women with the educational attainment of high school diploma are least likely to be married with 62.9% of them unmarried at childbirth.
| Educational Attainment | Married | Unmarried |
| Less than High School | 0 (0.0%) | 0 (0.0%) |
| High School Diploma | 33 (37.1%) | 56 (62.9%) |
| College or Associate's Degree | 0 (0.0%) | 0 (0.0%) |
| Bachelor's Degree | 0 (0.0%) | 0 (0.0%) |
| Graduate Degree | 0 (0.0%) | 0 (0.0%) |
| Total | 33 (37.1%) | 56 (62.9%) |
Employment Characteristics in Tyro
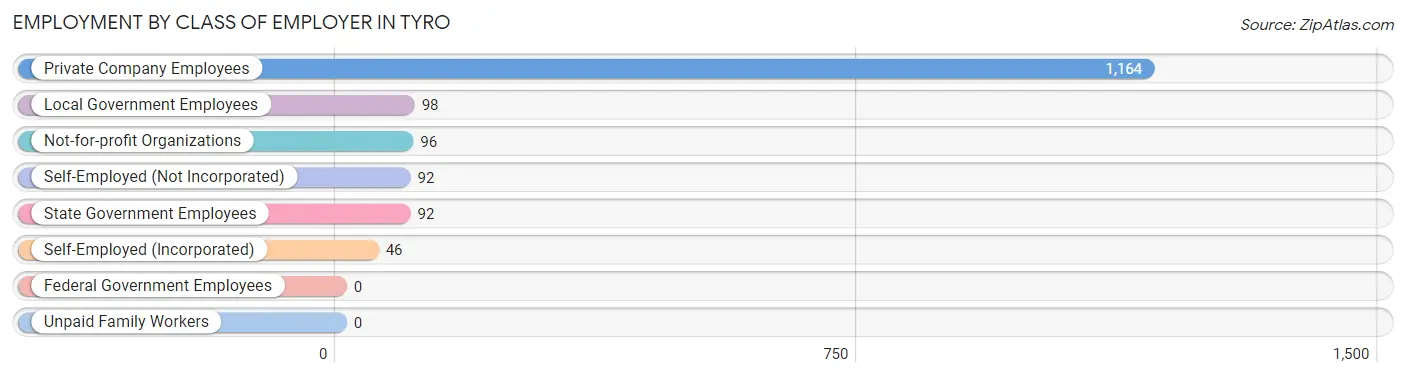
Employment by Class of Employer in Tyro
Among the 1,588 employed individuals in Tyro, private company employees (1,164 | 73.3%), local government employees (98 | 6.2%), and not-for-profit organizations (96 | 6.0%) make up the most common classes of employment.
| Employer Class | # Employees | % Employees |
| Private Company Employees | 1,164 | 73.3% |
| Self-Employed (Incorporated) | 46 | 2.9% |
| Self-Employed (Not Incorporated) | 92 | 5.8% |
| Not-for-profit Organizations | 96 | 6.0% |
| Local Government Employees | 98 | 6.2% |
| State Government Employees | 92 | 5.8% |
| Federal Government Employees | 0 | 0.0% |
| Unpaid Family Workers | 0 | 0.0% |
| Total | 1,588 | 100.0% |
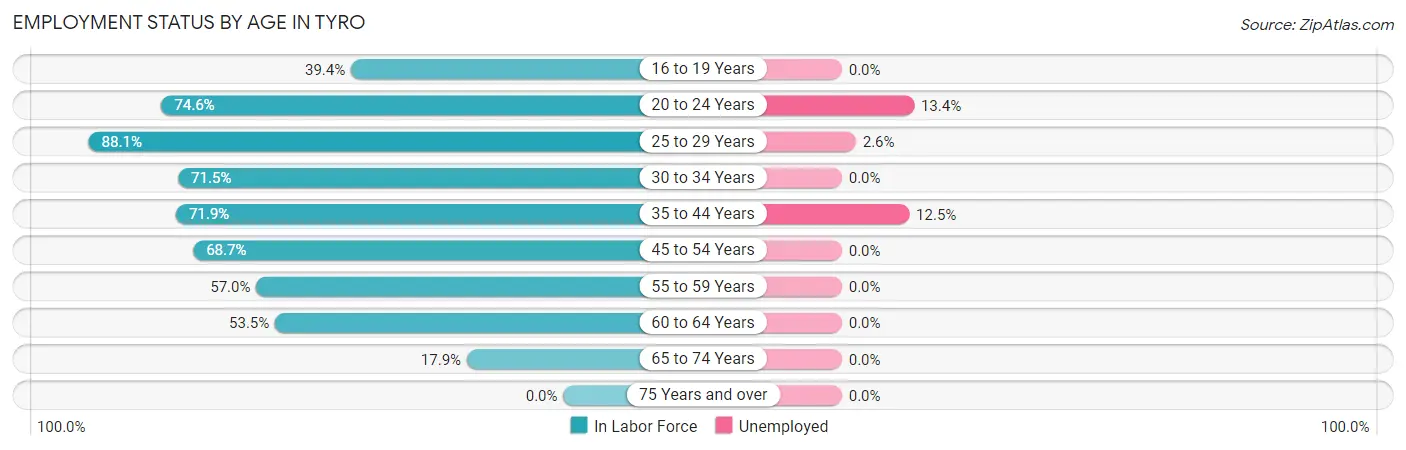
Employment Status by Age in Tyro
According to the labor force statistics for Tyro, out of the total population over 16 years of age (2,896), 57.4% or 1,662 individuals are in the labor force, with 2.9% or 48 of them unemployed. The age group with the highest labor force participation rate is 25 to 29 years, with 88.1% or 310 individuals in the labor force. Within the labor force, the 20 to 24 years age range has the highest percentage of unemployed individuals, with 13.4% or 24 of them being unemployed.
| Age Bracket | In Labor Force | Unemployed |
| 16 to 19 Years | 86 (39.4%) | 0 (0.0%) |
| 20 to 24 Years | 179 (74.6%) | 24 (13.4%) |
| 25 to 29 Years | 310 (88.1%) | 8 (2.6%) |
| 30 to 34 Years | 218 (71.5%) | 0 (0.0%) |
| 35 to 44 Years | 128 (71.9%) | 16 (12.5%) |
| 45 to 54 Years | 362 (68.7%) | 0 (0.0%) |
| 55 to 59 Years | 170 (57.0%) | 0 (0.0%) |
| 60 to 64 Years | 146 (53.5%) | 0 (0.0%) |
| 65 to 74 Years | 62 (17.9%) | 0 (0.0%) |
| 75 Years and over | 0 (0.0%) | 0 (0.0%) |
| Total | 1,662 (57.4%) | 48 (2.9%) |
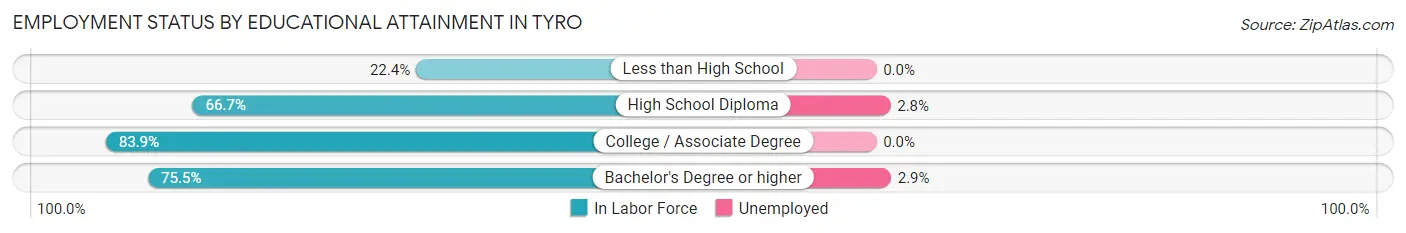
Employment Status by Educational Attainment in Tyro
According to labor force statistics for Tyro, 69.0% of individuals (1,334) out of the total population between 25 and 64 years of age (1,933) are in the labor force, with 1.8% or 24 of them being unemployed. The group with the highest labor force participation rate are those with the educational attainment of college / associate degree, with 83.9% or 454 individuals in the labor force. Within the labor force, individuals with bachelor's degree or higher education have the highest percentage of unemployment, with 2.9% or 8 of them being unemployed.
| Educational Attainment | In Labor Force | Unemployed |
| Less than High School | 41 (22.4%) | 0 (0.0%) |
| High School Diploma | 562 (66.7%) | 24 (2.8%) |
| College / Associate Degree | 454 (83.9%) | 0 (0.0%) |
| Bachelor's Degree or higher | 277 (75.5%) | 11 (2.9%) |
| Total | 1,334 (69.0%) | 35 (1.8%) |
Employment Occupations by Sex in Tyro
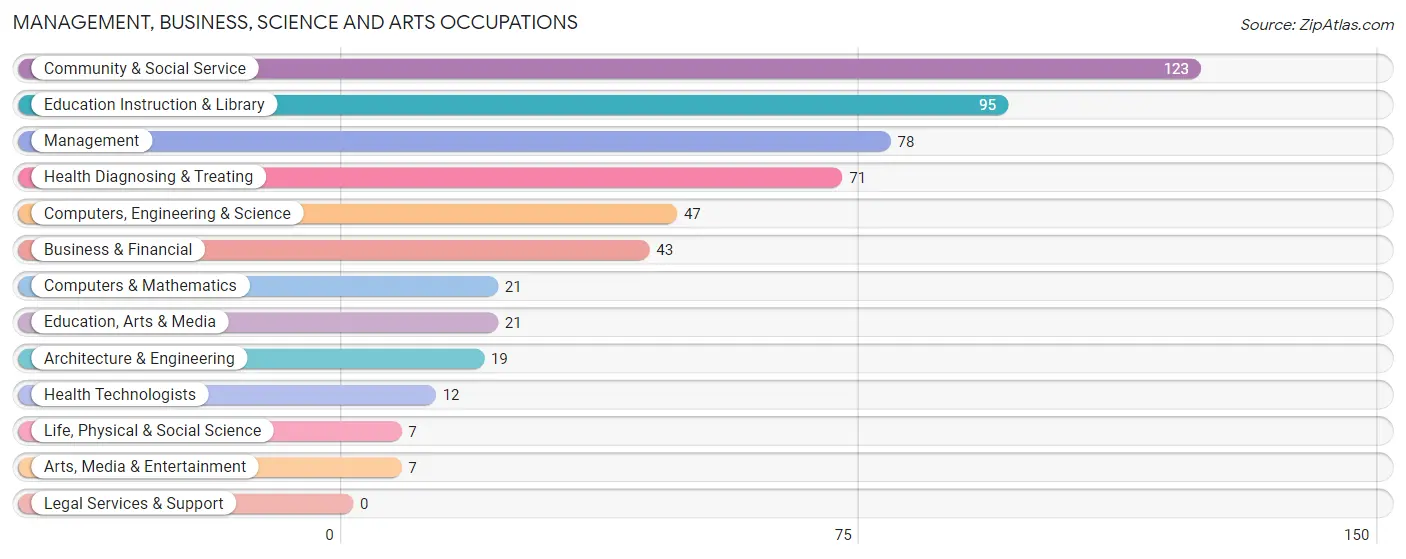
Management, Business, Science and Arts Occupations
The most common Management, Business, Science and Arts occupations in Tyro are Community & Social Service (123 | 7.6%), Education Instruction & Library (95 | 5.9%), Management (78 | 4.8%), Health Diagnosing & Treating (71 | 4.4%), and Computers, Engineering & Science (47 | 2.9%).
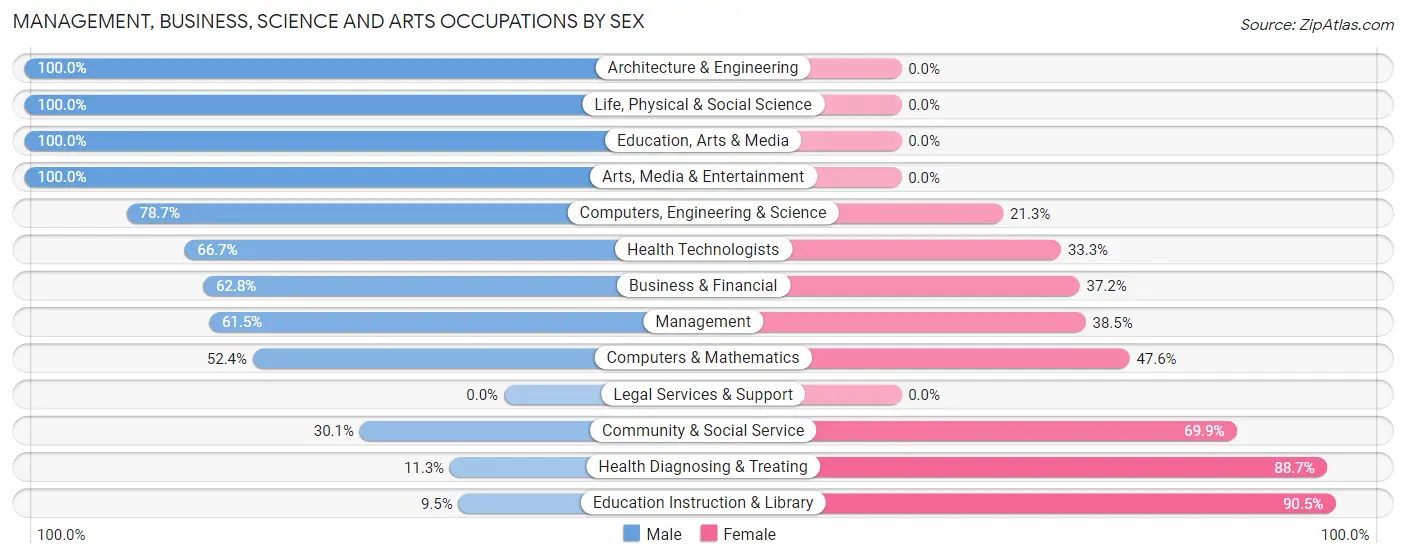
Management, Business, Science and Arts Occupations by Sex
Within the Management, Business, Science and Arts occupations in Tyro, the most male-oriented occupations are Architecture & Engineering (100.0%), Life, Physical & Social Science (100.0%), and Education, Arts & Media (100.0%), while the most female-oriented occupations are Education Instruction & Library (90.5%), Health Diagnosing & Treating (88.7%), and Community & Social Service (69.9%).
| Occupation | Male | Female |
| Management | 48 (61.5%) | 30 (38.5%) |
| Business & Financial | 27 (62.8%) | 16 (37.2%) |
| Computers, Engineering & Science | 37 (78.7%) | 10 (21.3%) |
| Computers & Mathematics | 11 (52.4%) | 10 (47.6%) |
| Architecture & Engineering | 19 (100.0%) | 0 (0.0%) |
| Life, Physical & Social Science | 7 (100.0%) | 0 (0.0%) |
| Community & Social Service | 37 (30.1%) | 86 (69.9%) |
| Education, Arts & Media | 21 (100.0%) | 0 (0.0%) |
| Legal Services & Support | 0 (0.0%) | 0 (0.0%) |
| Education Instruction & Library | 9 (9.5%) | 86 (90.5%) |
| Arts, Media & Entertainment | 7 (100.0%) | 0 (0.0%) |
| Health Diagnosing & Treating | 8 (11.3%) | 63 (88.7%) |
| Health Technologists | 8 (66.7%) | 4 (33.3%) |
| Total (Category) | 157 (43.4%) | 205 (56.6%) |
| Total (Overall) | 916 (56.8%) | 697 (43.2%) |
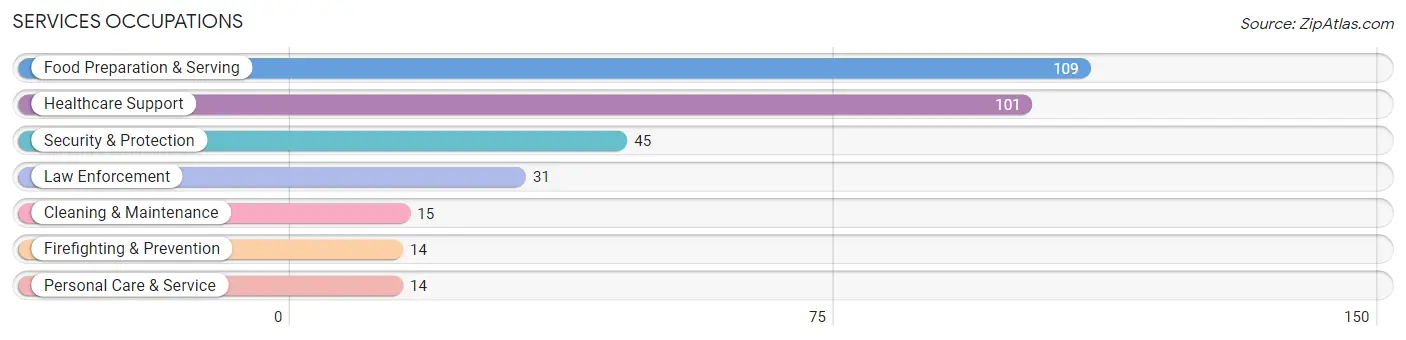
Services Occupations
The most common Services occupations in Tyro are Food Preparation & Serving (109 | 6.8%), Healthcare Support (101 | 6.3%), Security & Protection (45 | 2.8%), Law Enforcement (31 | 1.9%), and Cleaning & Maintenance (15 | 0.9%).
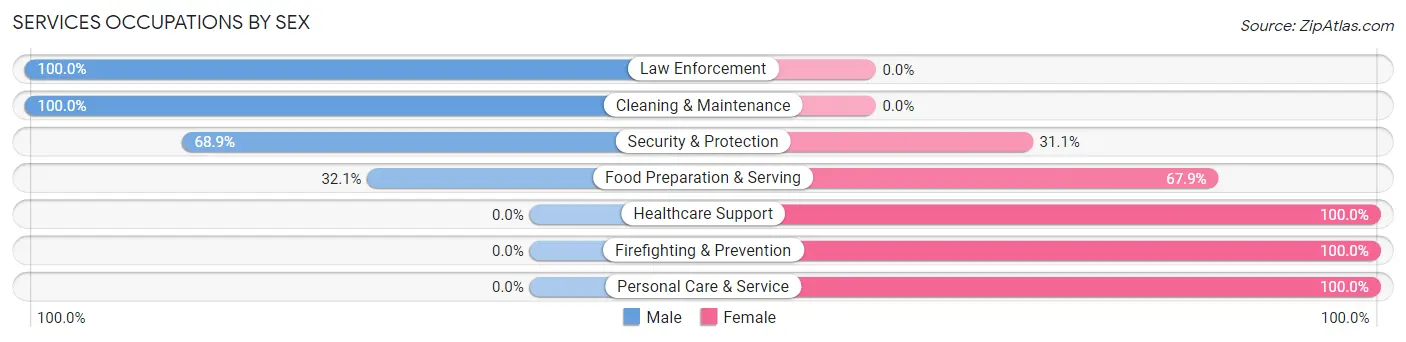
Services Occupations by Sex
Within the Services occupations in Tyro, the most male-oriented occupations are Law Enforcement (100.0%), Cleaning & Maintenance (100.0%), and Security & Protection (68.9%), while the most female-oriented occupations are Healthcare Support (100.0%), Firefighting & Prevention (100.0%), and Personal Care & Service (100.0%).
| Occupation | Male | Female |
| Healthcare Support | 0 (0.0%) | 101 (100.0%) |
| Security & Protection | 31 (68.9%) | 14 (31.1%) |
| Firefighting & Prevention | 0 (0.0%) | 14 (100.0%) |
| Law Enforcement | 31 (100.0%) | 0 (0.0%) |
| Food Preparation & Serving | 35 (32.1%) | 74 (67.9%) |
| Cleaning & Maintenance | 15 (100.0%) | 0 (0.0%) |
| Personal Care & Service | 0 (0.0%) | 14 (100.0%) |
| Total (Category) | 81 (28.5%) | 203 (71.5%) |
| Total (Overall) | 916 (56.8%) | 697 (43.2%) |
Sales and Office Occupations
The most common Sales and Office occupations in Tyro are Sales & Related (252 | 15.6%), and Office & Administration (100 | 6.2%).
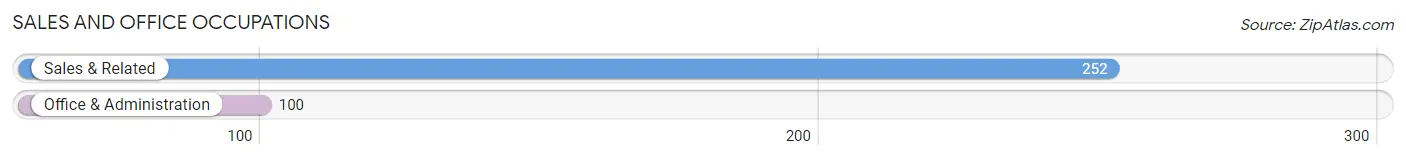
Sales and Office Occupations by Sex
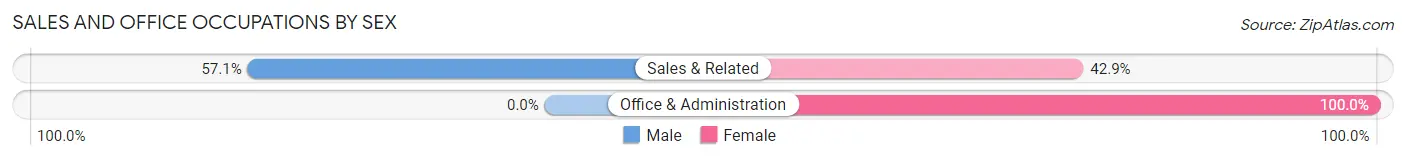
| Occupation | Male | Female |
| Sales & Related | 144 (57.1%) | 108 (42.9%) |
| Office & Administration | 0 (0.0%) | 100 (100.0%) |
| Total (Category) | 144 (40.9%) | 208 (59.1%) |
| Total (Overall) | 916 (56.8%) | 697 (43.2%) |
Natural Resources, Construction and Maintenance Occupations
The most common Natural Resources, Construction and Maintenance occupations in Tyro are Installation, Maintenance & Repair (111 | 6.9%), and Construction & Extraction (54 | 3.4%).
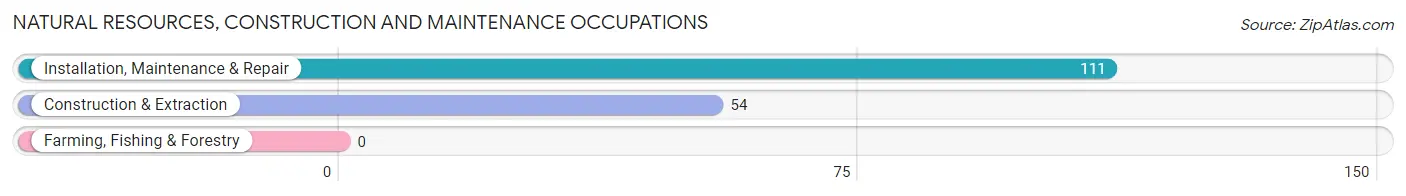
Natural Resources, Construction and Maintenance Occupations by Sex
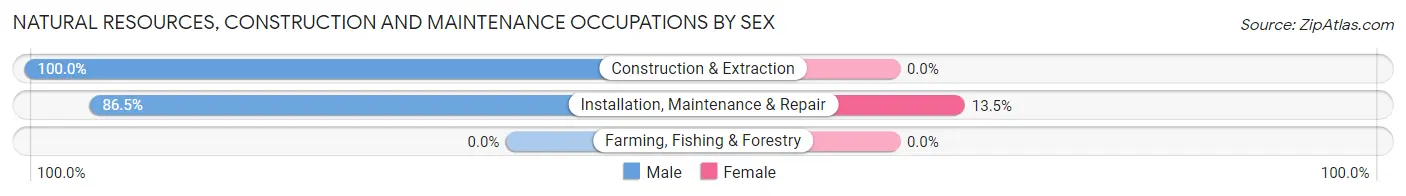
| Occupation | Male | Female |
| Farming, Fishing & Forestry | 0 (0.0%) | 0 (0.0%) |
| Construction & Extraction | 54 (100.0%) | 0 (0.0%) |
| Installation, Maintenance & Repair | 96 (86.5%) | 15 (13.5%) |
| Total (Category) | 150 (90.9%) | 15 (9.1%) |
| Total (Overall) | 916 (56.8%) | 697 (43.2%) |
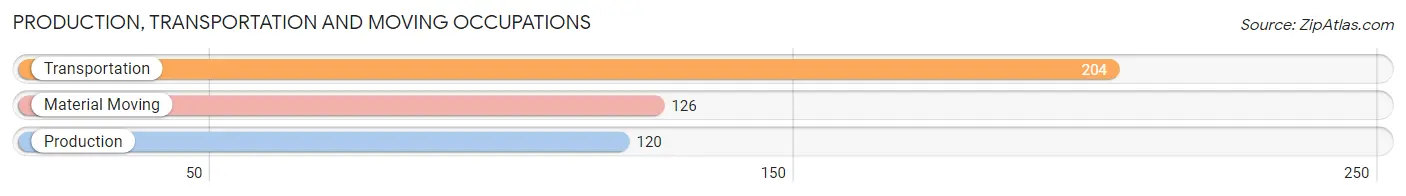
Production, Transportation and Moving Occupations
The most common Production, Transportation and Moving occupations in Tyro are Transportation (204 | 12.7%), Material Moving (126 | 7.8%), and Production (120 | 7.4%).
Production, Transportation and Moving Occupations by Sex
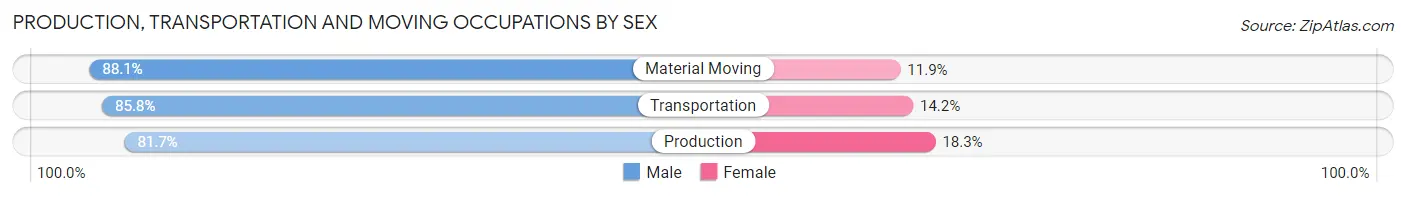
| Occupation | Male | Female |
| Production | 98 (81.7%) | 22 (18.3%) |
| Transportation | 175 (85.8%) | 29 (14.2%) |
| Material Moving | 111 (88.1%) | 15 (11.9%) |
| Total (Category) | 384 (85.3%) | 66 (14.7%) |
| Total (Overall) | 916 (56.8%) | 697 (43.2%) |
Employment Industries by Sex in Tyro
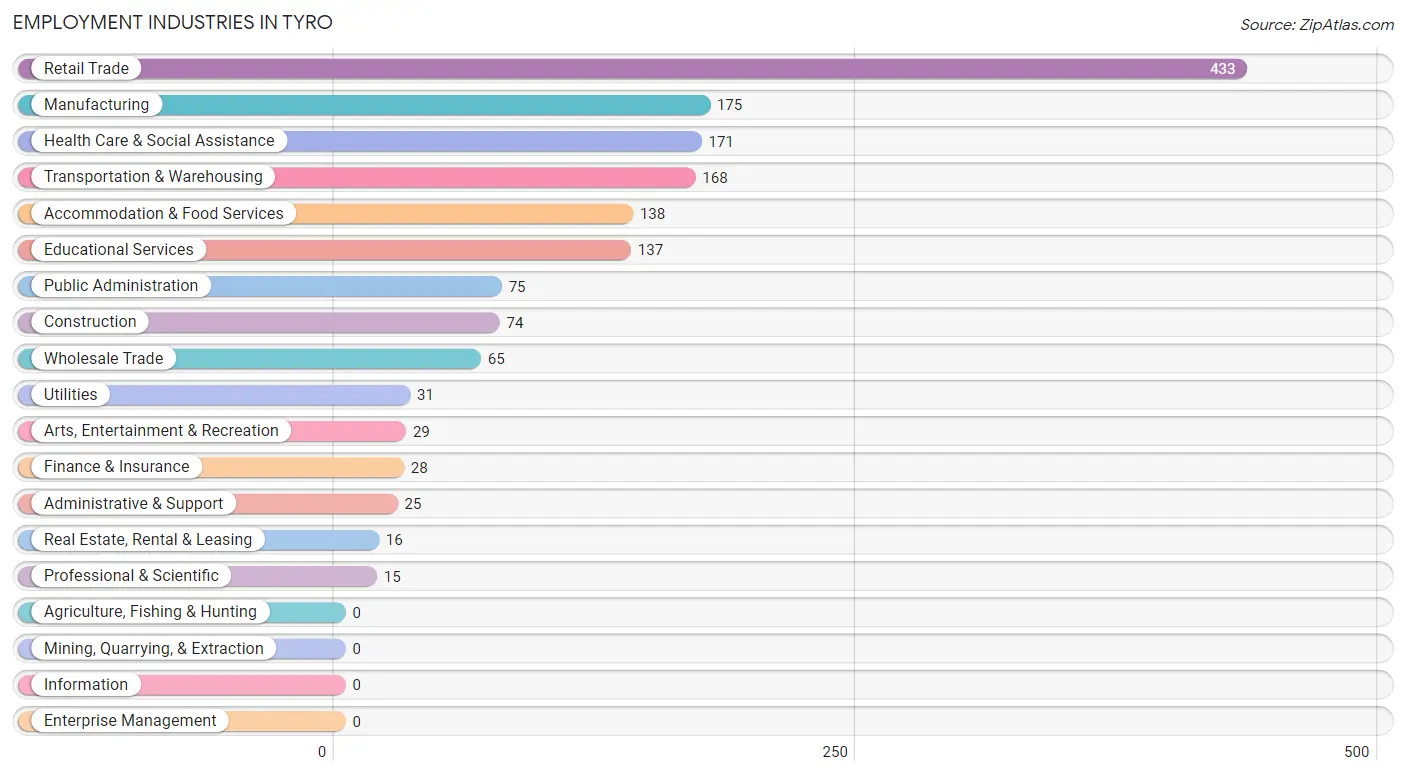
Employment Industries in Tyro
The major employment industries in Tyro include Retail Trade (433 | 26.8%), Manufacturing (175 | 10.8%), Health Care & Social Assistance (171 | 10.6%), Transportation & Warehousing (168 | 10.4%), and Accommodation & Food Services (138 | 8.6%).
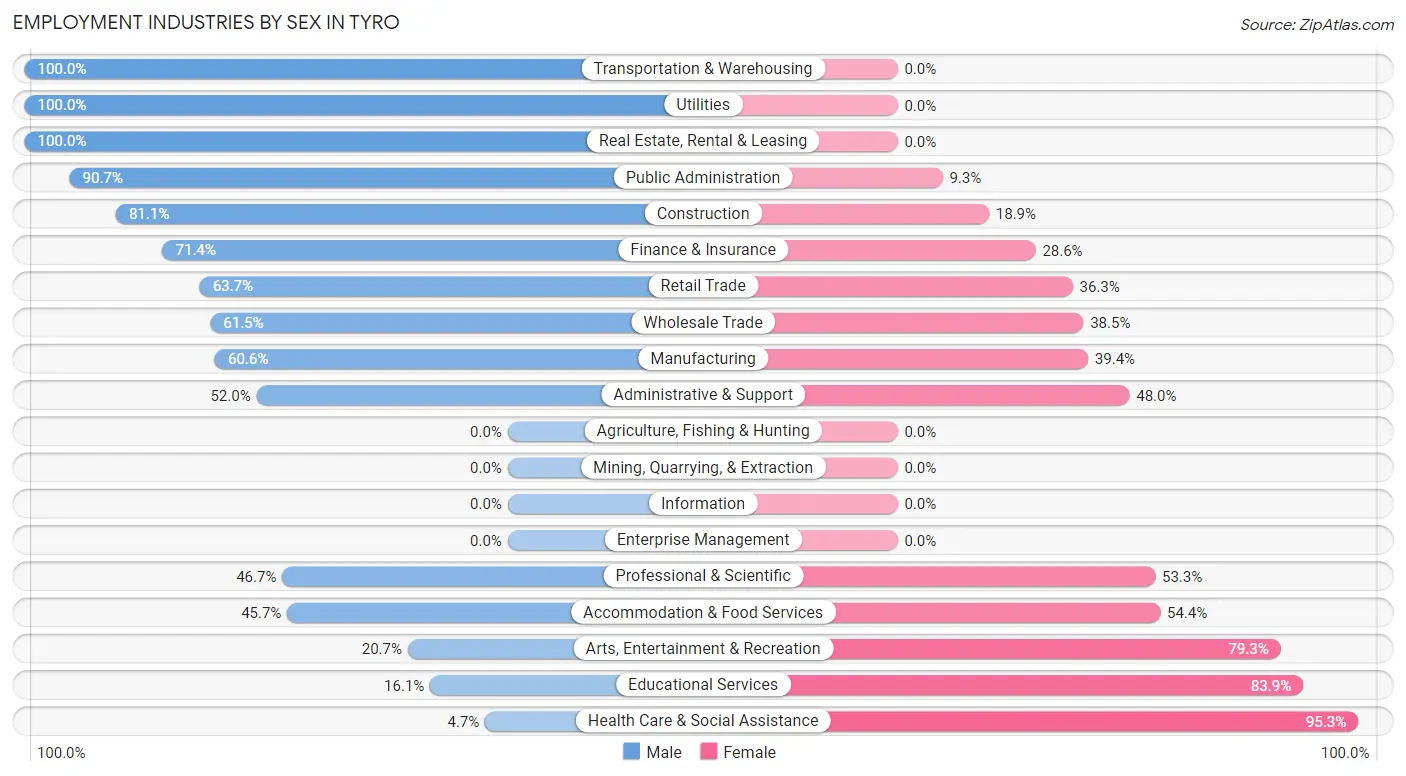
Employment Industries by Sex in Tyro
The Tyro industries that see more men than women are Transportation & Warehousing (100.0%), Utilities (100.0%), and Real Estate, Rental & Leasing (100.0%), whereas the industries that tend to have a higher number of women are Health Care & Social Assistance (95.3%), Educational Services (83.9%), and Arts, Entertainment & Recreation (79.3%).
| Industry | Male | Female |
| Agriculture, Fishing & Hunting | 0 (0.0%) | 0 (0.0%) |
| Mining, Quarrying, & Extraction | 0 (0.0%) | 0 (0.0%) |
| Construction | 60 (81.1%) | 14 (18.9%) |
| Manufacturing | 106 (60.6%) | 69 (39.4%) |
| Wholesale Trade | 40 (61.5%) | 25 (38.5%) |
| Retail Trade | 276 (63.7%) | 157 (36.3%) |
| Transportation & Warehousing | 168 (100.0%) | 0 (0.0%) |
| Utilities | 31 (100.0%) | 0 (0.0%) |
| Information | 0 (0.0%) | 0 (0.0%) |
| Finance & Insurance | 20 (71.4%) | 8 (28.6%) |
| Real Estate, Rental & Leasing | 16 (100.0%) | 0 (0.0%) |
| Professional & Scientific | 7 (46.7%) | 8 (53.3%) |
| Enterprise Management | 0 (0.0%) | 0 (0.0%) |
| Administrative & Support | 13 (52.0%) | 12 (48.0%) |
| Educational Services | 22 (16.1%) | 115 (83.9%) |
| Health Care & Social Assistance | 8 (4.7%) | 163 (95.3%) |
| Arts, Entertainment & Recreation | 6 (20.7%) | 23 (79.3%) |
| Accommodation & Food Services | 63 (45.7%) | 75 (54.3%) |
| Public Administration | 68 (90.7%) | 7 (9.3%) |
| Total | 916 (56.8%) | 697 (43.2%) |
Education in Tyro
School Enrollment in Tyro
The most common levels of schooling among the 627 students in Tyro are high school (188 | 30.0%), elementary school (153 | 24.4%), and middle school (140 | 22.3%).
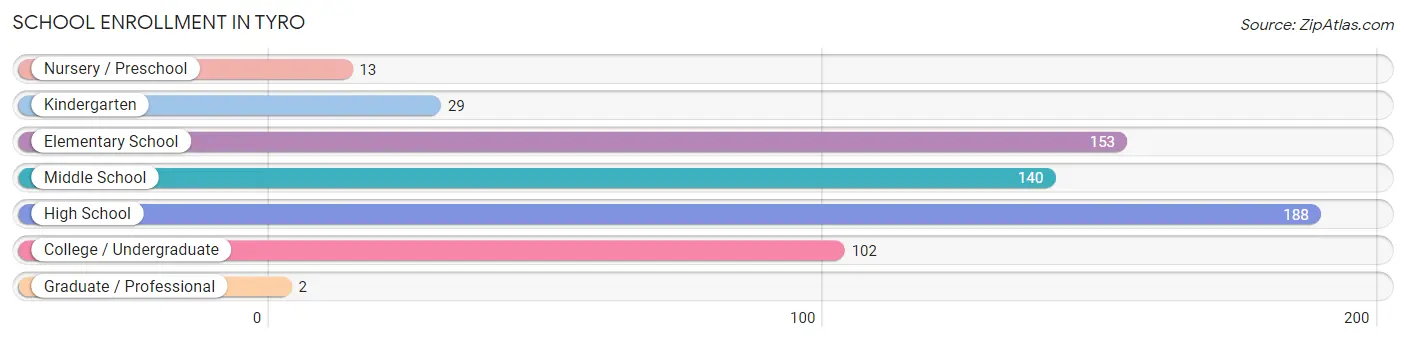
| School Level | # Students | % Students |
| Nursery / Preschool | 13 | 2.1% |
| Kindergarten | 29 | 4.6% |
| Elementary School | 153 | 24.4% |
| Middle School | 140 | 22.3% |
| High School | 188 | 30.0% |
| College / Undergraduate | 102 | 16.3% |
| Graduate / Professional | 2 | 0.3% |
| Total | 627 | 100.0% |
School Enrollment by Age by Funding Source in Tyro
Out of a total of 627 students who are enrolled in schools in Tyro, 61 (9.7%) attend a private institution, while the remaining 566 (90.3%) are enrolled in public schools. The age group of 3 to 4 year olds has the highest likelihood of being enrolled in private schools, with 13 (100.0% in the age bracket) enrolled. Conversely, the age group of 5 to 9 year old has the lowest likelihood of being enrolled in a private school, with 182 (100.0% in the age bracket) attending a public institution.
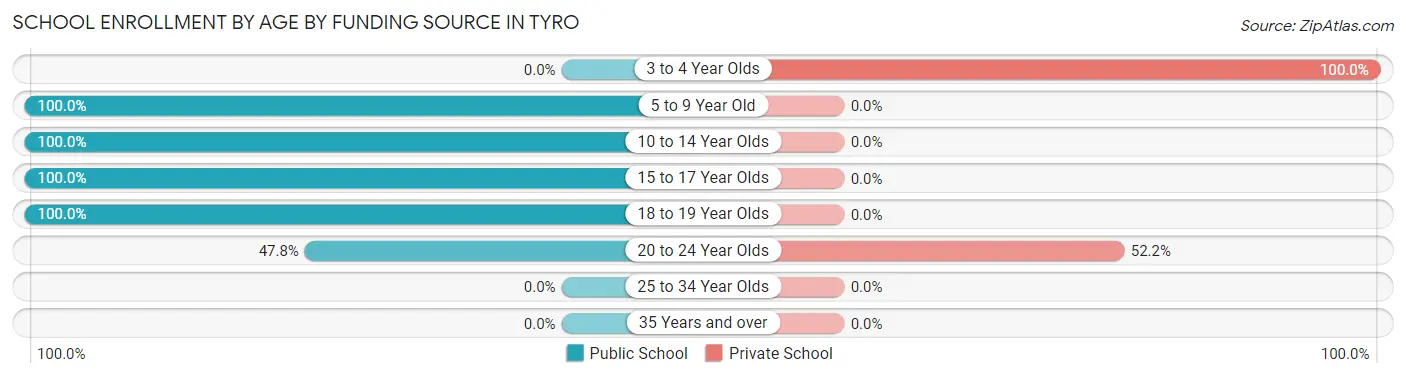
| Age Bracket | Public School | Private School |
| 3 to 4 Year Olds | 0 (0.0%) | 13 (100.0%) |
| 5 to 9 Year Old | 182 (100.0%) | 0 (0.0%) |
| 10 to 14 Year Olds | 140 (100.0%) | 0 (0.0%) |
| 15 to 17 Year Olds | 133 (100.0%) | 0 (0.0%) |
| 18 to 19 Year Olds | 67 (100.0%) | 0 (0.0%) |
| 20 to 24 Year Olds | 44 (47.8%) | 48 (52.2%) |
| 25 to 34 Year Olds | 0 (0.0%) | 0 (0.0%) |
| 35 Years and over | 0 (0.0%) | 0 (0.0%) |
| Total | 566 (90.3%) | 61 (9.7%) |
Educational Attainment by Field of Study in Tyro
Business (106 | 23.3%), science & technology (92 | 20.2%), education (61 | 13.4%), arts & humanities (39 | 8.6%), and psychology (38 | 8.4%) are the most common fields of study among 455 individuals in Tyro who have obtained a bachelor's degree or higher.
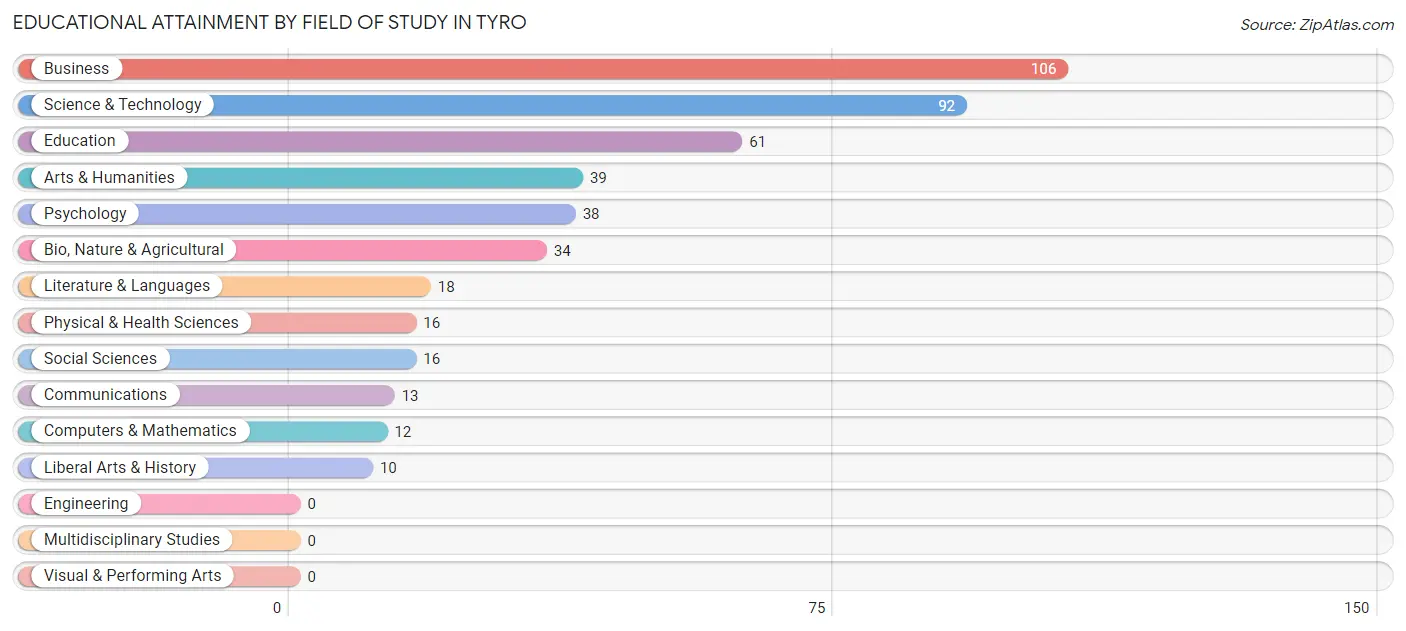
| Field of Study | # Graduates | % Graduates |
| Computers & Mathematics | 12 | 2.6% |
| Bio, Nature & Agricultural | 34 | 7.5% |
| Physical & Health Sciences | 16 | 3.5% |
| Psychology | 38 | 8.4% |
| Social Sciences | 16 | 3.5% |
| Engineering | 0 | 0.0% |
| Multidisciplinary Studies | 0 | 0.0% |
| Science & Technology | 92 | 20.2% |
| Business | 106 | 23.3% |
| Education | 61 | 13.4% |
| Literature & Languages | 18 | 4.0% |
| Liberal Arts & History | 10 | 2.2% |
| Visual & Performing Arts | 0 | 0.0% |
| Communications | 13 | 2.9% |
| Arts & Humanities | 39 | 8.6% |
| Total | 455 | 100.0% |
Transportation & Commute in Tyro
Vehicle Availability by Sex in Tyro
The most prevalent vehicle ownership categories in Tyro are males with 3 vehicles (280, accounting for 31.4%) and females with 3 vehicles (197, making up 40.2%).
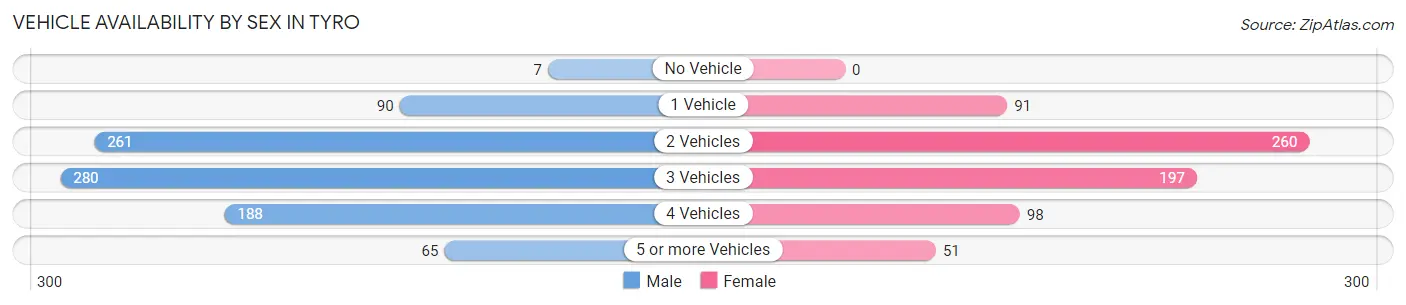
| Vehicles Available | Male | Female |
| No Vehicle | 7 (0.8%) | 0 (0.0%) |
| 1 Vehicle | 90 (10.1%) | 91 (13.1%) |
| 2 Vehicles | 261 (29.3%) | 260 (37.3%) |
| 3 Vehicles | 280 (31.4%) | 197 (28.3%) |
| 4 Vehicles | 188 (21.1%) | 98 (14.1%) |
| 5 or more Vehicles | 65 (7.3%) | 51 (7.3%) |
| Total | 891 (100.0%) | 697 (100.0%) |
Commute Time in Tyro
The most frequently occuring commute durations in Tyro are 15 to 19 minutes (329 commuters, 21.7%), 20 to 24 minutes (314 commuters, 20.7%), and 10 to 14 minutes (180 commuters, 11.8%).
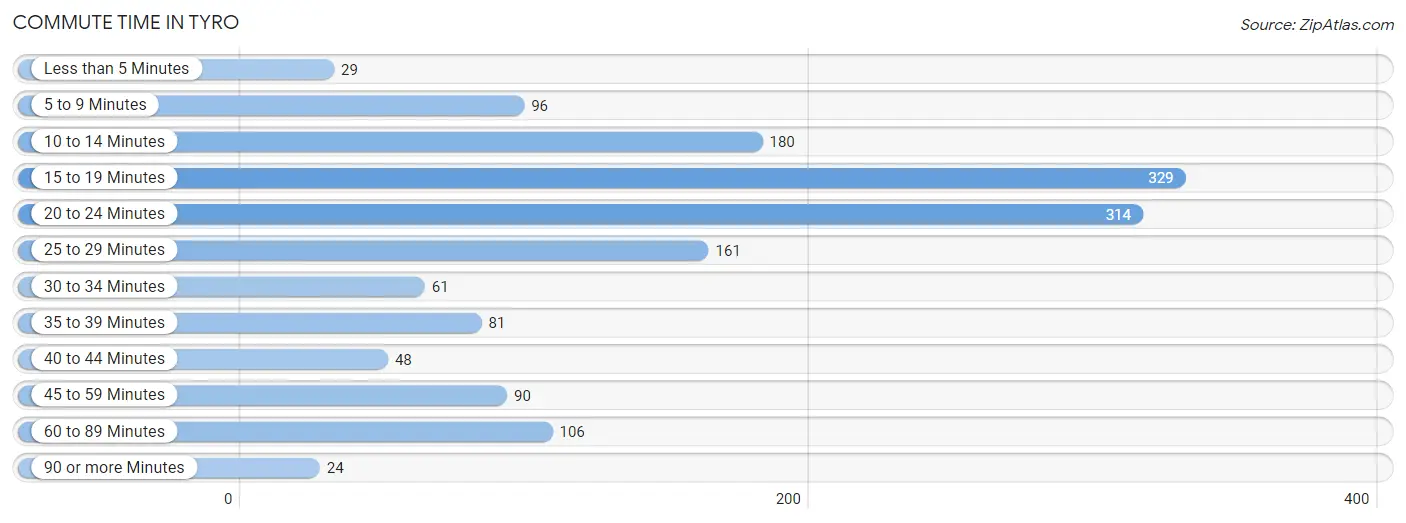
| Commute Time | # Commuters | % Commuters |
| Less than 5 Minutes | 29 | 1.9% |
| 5 to 9 Minutes | 96 | 6.3% |
| 10 to 14 Minutes | 180 | 11.8% |
| 15 to 19 Minutes | 329 | 21.7% |
| 20 to 24 Minutes | 314 | 20.7% |
| 25 to 29 Minutes | 161 | 10.6% |
| 30 to 34 Minutes | 61 | 4.0% |
| 35 to 39 Minutes | 81 | 5.3% |
| 40 to 44 Minutes | 48 | 3.2% |
| 45 to 59 Minutes | 90 | 5.9% |
| 60 to 89 Minutes | 106 | 7.0% |
| 90 or more Minutes | 24 | 1.6% |
Commute Time by Sex in Tyro
The most common commute times in Tyro are 15 to 19 minutes (232 commuters, 26.6%) for males and 20 to 24 minutes (161 commuters, 24.9%) for females.
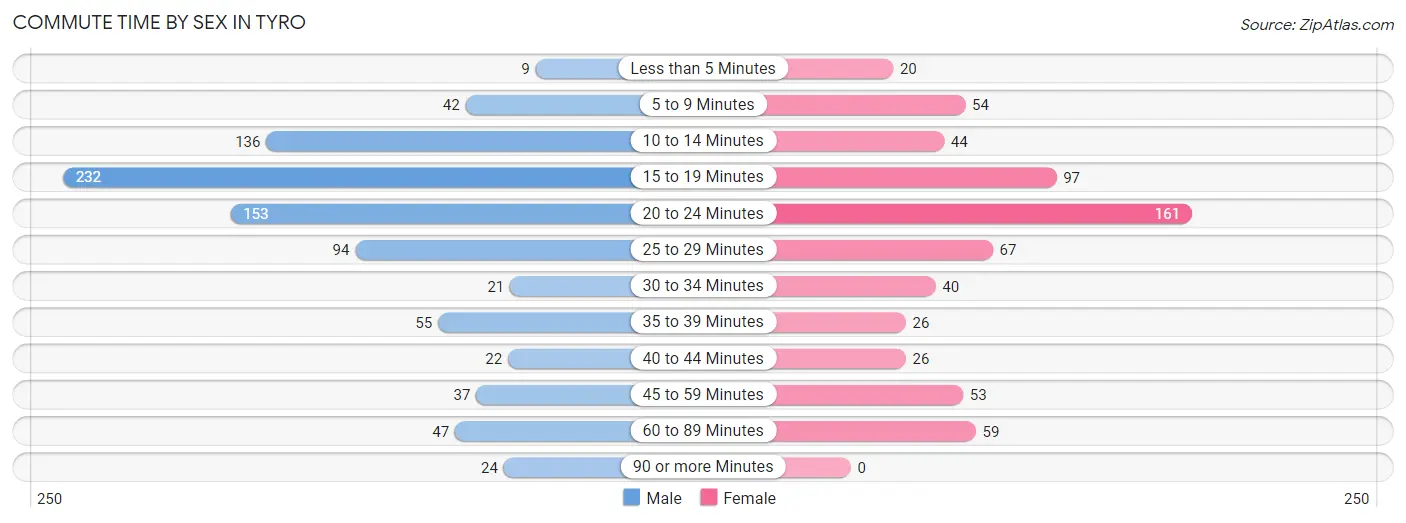
| Commute Time | Male | Female |
| Less than 5 Minutes | 9 (1.0%) | 20 (3.1%) |
| 5 to 9 Minutes | 42 (4.8%) | 54 (8.4%) |
| 10 to 14 Minutes | 136 (15.6%) | 44 (6.8%) |
| 15 to 19 Minutes | 232 (26.6%) | 97 (15.0%) |
| 20 to 24 Minutes | 153 (17.5%) | 161 (24.9%) |
| 25 to 29 Minutes | 94 (10.8%) | 67 (10.4%) |
| 30 to 34 Minutes | 21 (2.4%) | 40 (6.2%) |
| 35 to 39 Minutes | 55 (6.3%) | 26 (4.0%) |
| 40 to 44 Minutes | 22 (2.5%) | 26 (4.0%) |
| 45 to 59 Minutes | 37 (4.2%) | 53 (8.2%) |
| 60 to 89 Minutes | 47 (5.4%) | 59 (9.1%) |
| 90 or more Minutes | 24 (2.8%) | 0 (0.0%) |
Time of Departure to Work by Sex in Tyro
The most frequent times of departure to work in Tyro are 5:00 AM to 5:29 AM (164, 18.8%) for males and 7:00 AM to 7:29 AM (128, 19.8%) for females.
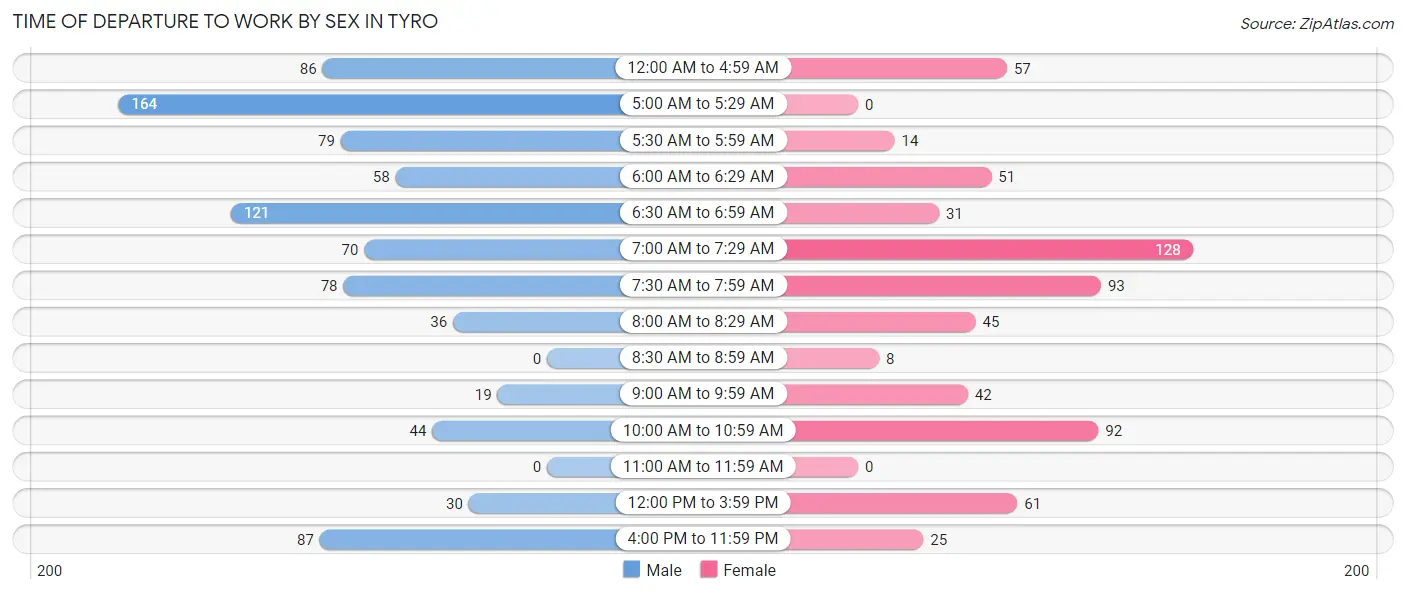
| Time of Departure | Male | Female |
| 12:00 AM to 4:59 AM | 86 (9.9%) | 57 (8.8%) |
| 5:00 AM to 5:29 AM | 164 (18.8%) | 0 (0.0%) |
| 5:30 AM to 5:59 AM | 79 (9.1%) | 14 (2.2%) |
| 6:00 AM to 6:29 AM | 58 (6.7%) | 51 (7.9%) |
| 6:30 AM to 6:59 AM | 121 (13.9%) | 31 (4.8%) |
| 7:00 AM to 7:29 AM | 70 (8.0%) | 128 (19.8%) |
| 7:30 AM to 7:59 AM | 78 (8.9%) | 93 (14.4%) |
| 8:00 AM to 8:29 AM | 36 (4.1%) | 45 (7.0%) |
| 8:30 AM to 8:59 AM | 0 (0.0%) | 8 (1.2%) |
| 9:00 AM to 9:59 AM | 19 (2.2%) | 42 (6.5%) |
| 10:00 AM to 10:59 AM | 44 (5.1%) | 92 (14.2%) |
| 11:00 AM to 11:59 AM | 0 (0.0%) | 0 (0.0%) |
| 12:00 PM to 3:59 PM | 30 (3.4%) | 61 (9.4%) |
| 4:00 PM to 11:59 PM | 87 (10.0%) | 25 (3.9%) |
| Total | 872 (100.0%) | 647 (100.0%) |
Housing Occupancy in Tyro
Occupancy by Ownership in Tyro
Of the total 1,297 dwellings in Tyro, owner-occupied units account for 1,071 (82.6%), while renter-occupied units make up 226 (17.4%).
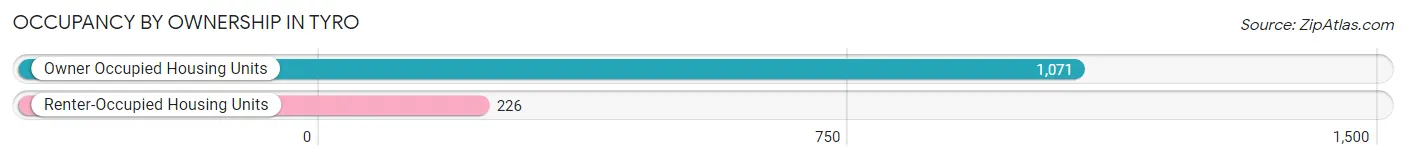
| Occupancy | # Housing Units | % Housing Units |
| Owner Occupied Housing Units | 1,071 | 82.6% |
| Renter-Occupied Housing Units | 226 | 17.4% |
| Total Occupied Housing Units | 1,297 | 100.0% |
Occupancy by Household Size in Tyro
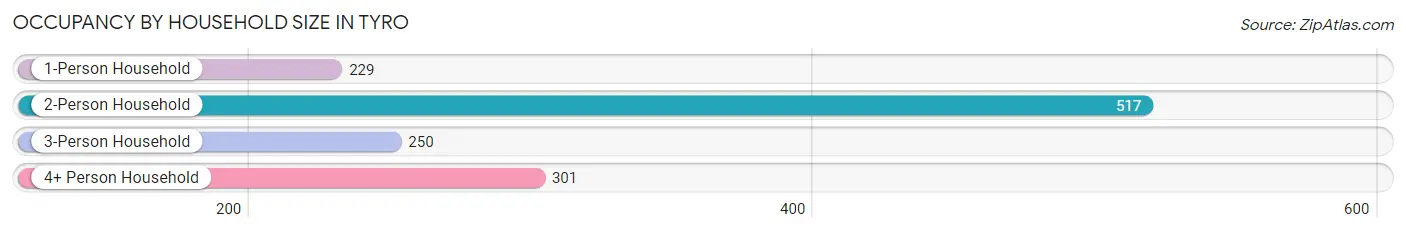
| Household Size | # Housing Units | % Housing Units |
| 1-Person Household | 229 | 17.7% |
| 2-Person Household | 517 | 39.9% |
| 3-Person Household | 250 | 19.3% |
| 4+ Person Household | 301 | 23.2% |
| Total Housing Units | 1,297 | 100.0% |
Occupancy by Ownership by Household Size in Tyro
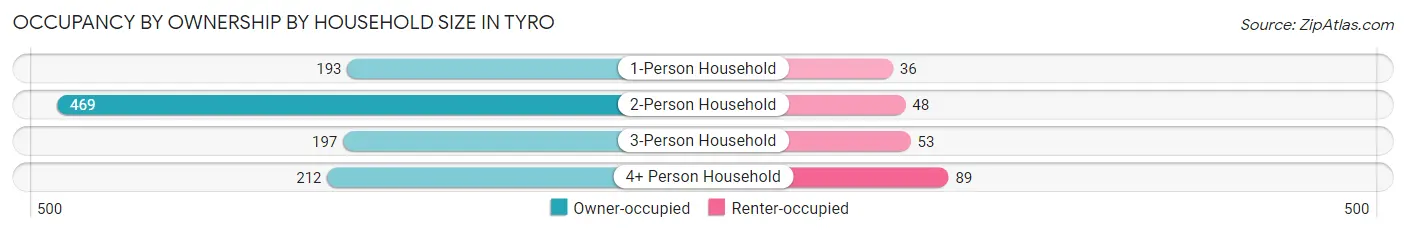
| Household Size | Owner-occupied | Renter-occupied |
| 1-Person Household | 193 (84.3%) | 36 (15.7%) |
| 2-Person Household | 469 (90.7%) | 48 (9.3%) |
| 3-Person Household | 197 (78.8%) | 53 (21.2%) |
| 4+ Person Household | 212 (70.4%) | 89 (29.6%) |
| Total Housing Units | 1,071 (82.6%) | 226 (17.4%) |
Occupancy by Educational Attainment in Tyro
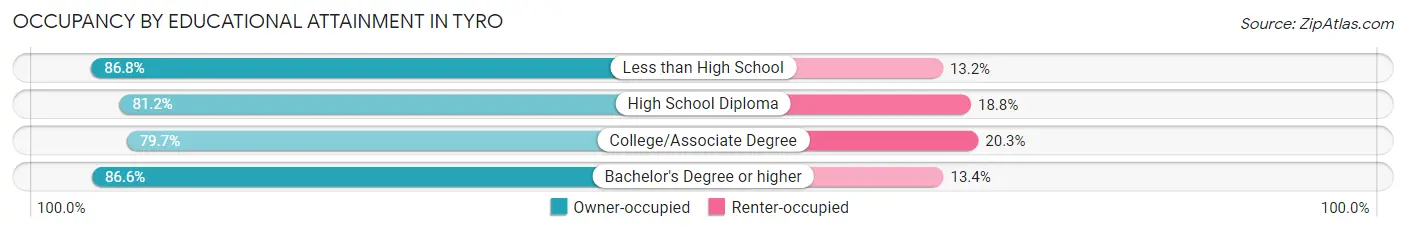
| Household Size | Owner-occupied | Renter-occupied |
| Less than High School | 118 (86.8%) | 18 (13.2%) |
| High School Diploma | 397 (81.2%) | 92 (18.8%) |
| College/Associate Degree | 303 (79.7%) | 77 (20.3%) |
| Bachelor's Degree or higher | 253 (86.6%) | 39 (13.4%) |
Occupancy by Age of Householder in Tyro
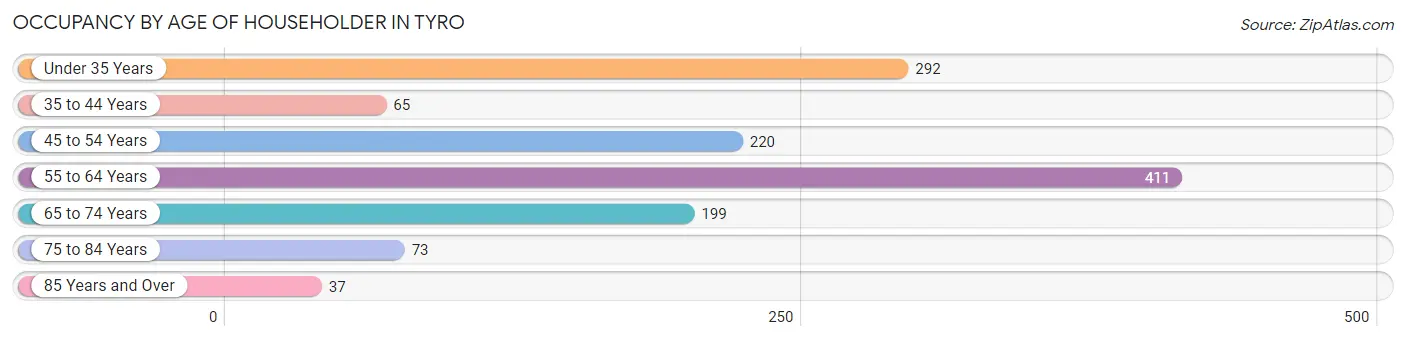
| Age Bracket | # Households | % Households |
| Under 35 Years | 292 | 22.5% |
| 35 to 44 Years | 65 | 5.0% |
| 45 to 54 Years | 220 | 17.0% |
| 55 to 64 Years | 411 | 31.7% |
| 65 to 74 Years | 199 | 15.3% |
| 75 to 84 Years | 73 | 5.6% |
| 85 Years and Over | 37 | 2.9% |
| Total | 1,297 | 100.0% |
Housing Finances in Tyro
Median Income by Occupancy in Tyro
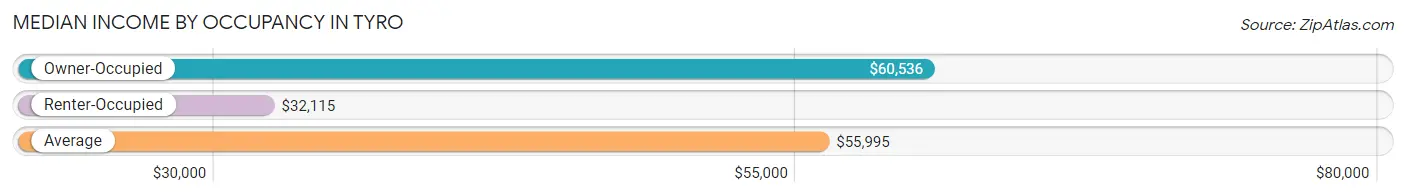
| Occupancy Type | # Households | Median Income |
| Owner-Occupied | 1,071 (82.6%) | $60,536 |
| Renter-Occupied | 226 (17.4%) | $32,115 |
| Average | 1,297 (100.0%) | $55,995 |
Occupancy by Householder Income Bracket in Tyro
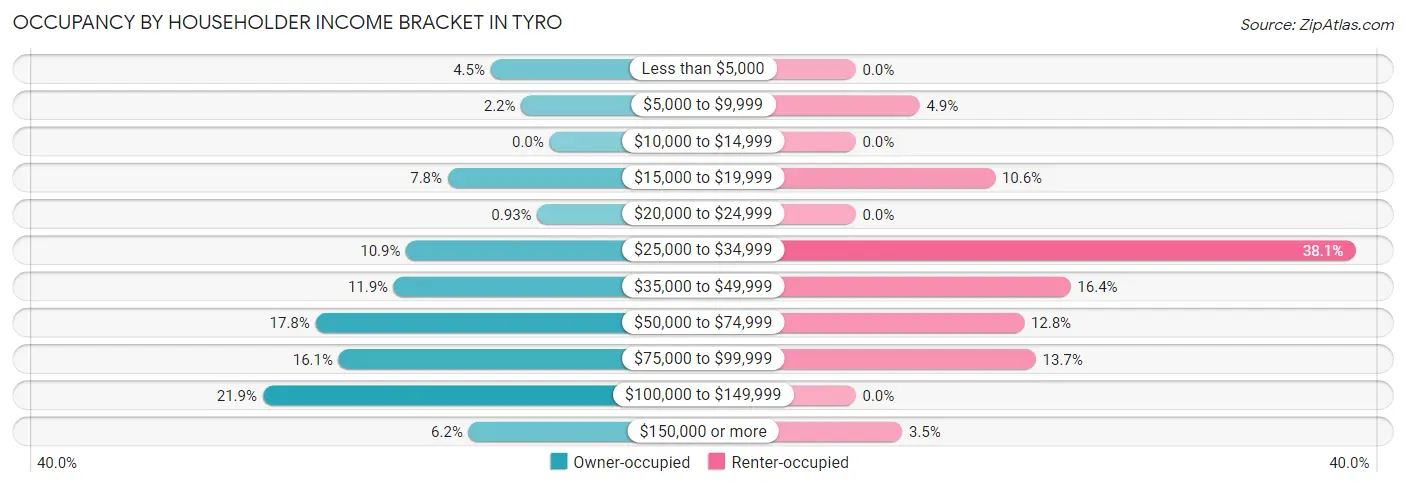
| Income Bracket | Owner-occupied | Renter-occupied |
| Less than $5,000 | 48 (4.5%) | 0 (0.0%) |
| $5,000 to $9,999 | 23 (2.1%) | 11 (4.9%) |
| $10,000 to $14,999 | 0 (0.0%) | 0 (0.0%) |
| $15,000 to $19,999 | 83 (7.7%) | 24 (10.6%) |
| $20,000 to $24,999 | 10 (0.9%) | 0 (0.0%) |
| $25,000 to $34,999 | 117 (10.9%) | 86 (38.1%) |
| $35,000 to $49,999 | 127 (11.9%) | 37 (16.4%) |
| $50,000 to $74,999 | 191 (17.8%) | 29 (12.8%) |
| $75,000 to $99,999 | 172 (16.1%) | 31 (13.7%) |
| $100,000 to $149,999 | 234 (21.8%) | 0 (0.0%) |
| $150,000 or more | 66 (6.2%) | 8 (3.5%) |
| Total | 1,071 (100.0%) | 226 (100.0%) |
Monthly Housing Cost Tiers in Tyro
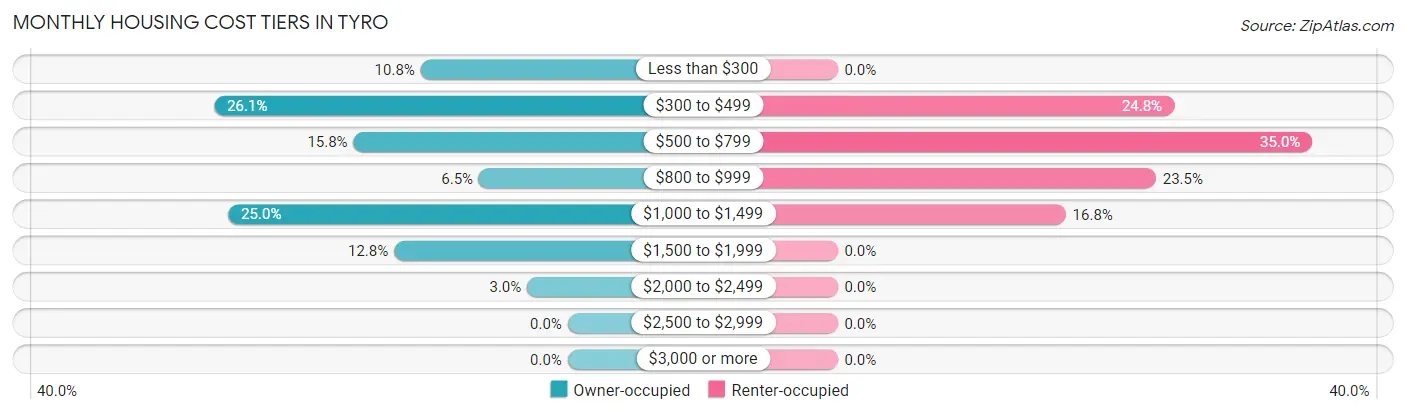
| Monthly Cost | Owner-occupied | Renter-occupied |
| Less than $300 | 116 (10.8%) | 0 (0.0%) |
| $300 to $499 | 279 (26.1%) | 56 (24.8%) |
| $500 to $799 | 169 (15.8%) | 79 (35.0%) |
| $800 to $999 | 70 (6.5%) | 53 (23.4%) |
| $1,000 to $1,499 | 268 (25.0%) | 38 (16.8%) |
| $1,500 to $1,999 | 137 (12.8%) | 0 (0.0%) |
| $2,000 to $2,499 | 32 (3.0%) | 0 (0.0%) |
| $2,500 to $2,999 | 0 (0.0%) | 0 (0.0%) |
| $3,000 or more | 0 (0.0%) | 0 (0.0%) |
| Total | 1,071 (100.0%) | 226 (100.0%) |
Physical Housing Characteristics in Tyro
Housing Structures in Tyro
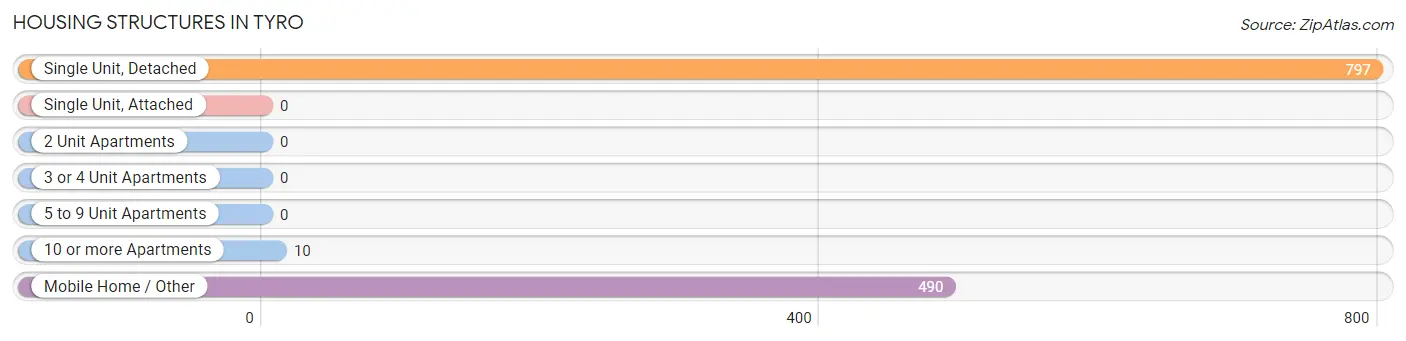
| Structure Type | # Housing Units | % Housing Units |
| Single Unit, Detached | 797 | 61.5% |
| Single Unit, Attached | 0 | 0.0% |
| 2 Unit Apartments | 0 | 0.0% |
| 3 or 4 Unit Apartments | 0 | 0.0% |
| 5 to 9 Unit Apartments | 0 | 0.0% |
| 10 or more Apartments | 10 | 0.8% |
| Mobile Home / Other | 490 | 37.8% |
| Total | 1,297 | 100.0% |
Housing Structures by Occupancy in Tyro
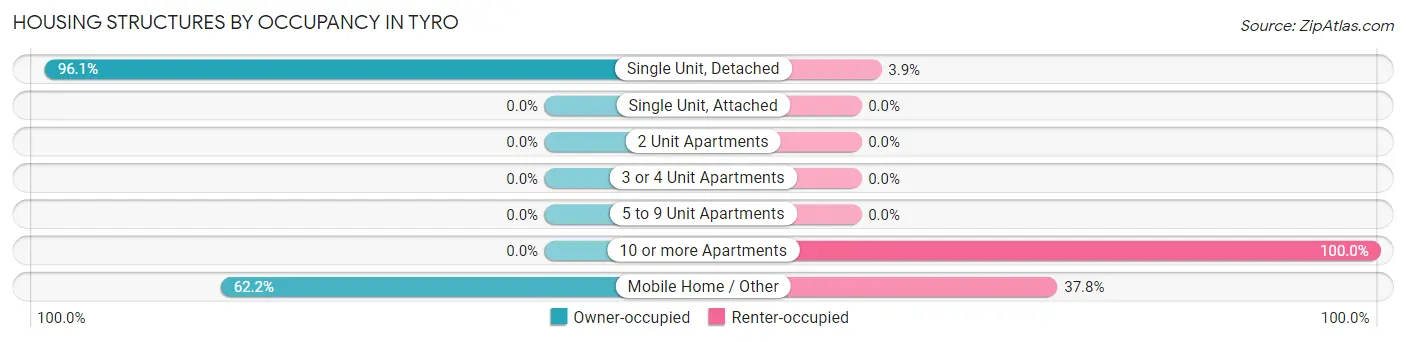
| Structure Type | Owner-occupied | Renter-occupied |
| Single Unit, Detached | 766 (96.1%) | 31 (3.9%) |
| Single Unit, Attached | 0 (0.0%) | 0 (0.0%) |
| 2 Unit Apartments | 0 (0.0%) | 0 (0.0%) |
| 3 or 4 Unit Apartments | 0 (0.0%) | 0 (0.0%) |
| 5 to 9 Unit Apartments | 0 (0.0%) | 0 (0.0%) |
| 10 or more Apartments | 0 (0.0%) | 10 (100.0%) |
| Mobile Home / Other | 305 (62.2%) | 185 (37.8%) |
| Total | 1,071 (82.6%) | 226 (17.4%) |
Housing Structures by Number of Rooms in Tyro
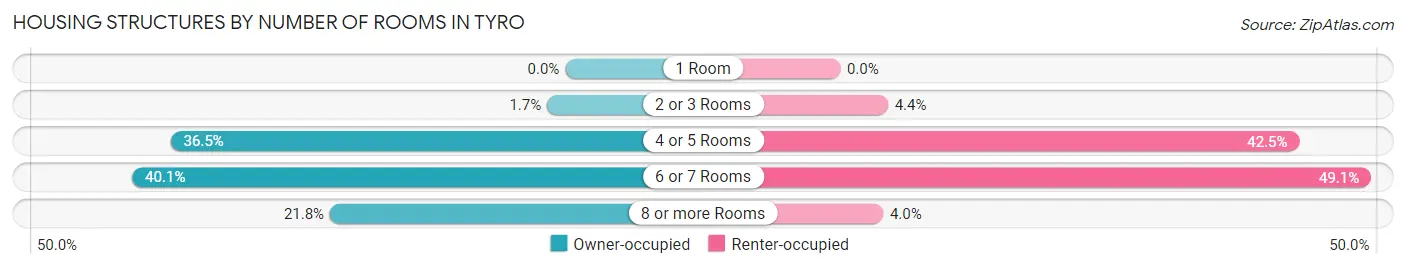
| Number of Rooms | Owner-occupied | Renter-occupied |
| 1 Room | 0 (0.0%) | 0 (0.0%) |
| 2 or 3 Rooms | 18 (1.7%) | 10 (4.4%) |
| 4 or 5 Rooms | 391 (36.5%) | 96 (42.5%) |
| 6 or 7 Rooms | 429 (40.1%) | 111 (49.1%) |
| 8 or more Rooms | 233 (21.8%) | 9 (4.0%) |
| Total | 1,071 (100.0%) | 226 (100.0%) |
Housing Structure by Heating Type in Tyro
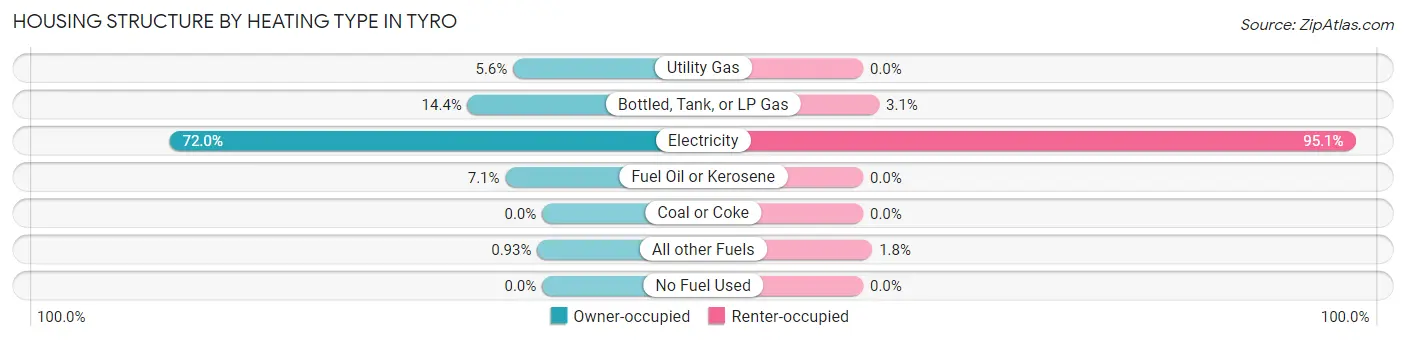
| Heating Type | Owner-occupied | Renter-occupied |
| Utility Gas | 60 (5.6%) | 0 (0.0%) |
| Bottled, Tank, or LP Gas | 154 (14.4%) | 7 (3.1%) |
| Electricity | 771 (72.0%) | 215 (95.1%) |
| Fuel Oil or Kerosene | 76 (7.1%) | 0 (0.0%) |
| Coal or Coke | 0 (0.0%) | 0 (0.0%) |
| All other Fuels | 10 (0.9%) | 4 (1.8%) |
| No Fuel Used | 0 (0.0%) | 0 (0.0%) |
| Total | 1,071 (100.0%) | 226 (100.0%) |
Household Vehicle Usage in Tyro
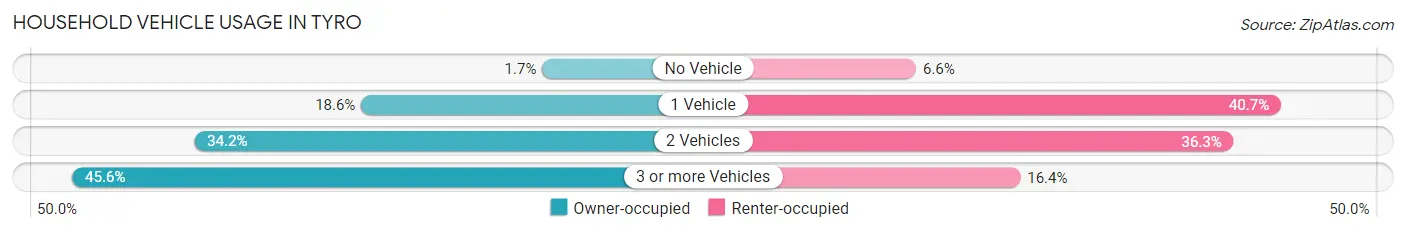
| Vehicles per Household | Owner-occupied | Renter-occupied |
| No Vehicle | 18 (1.7%) | 15 (6.6%) |
| 1 Vehicle | 199 (18.6%) | 92 (40.7%) |
| 2 Vehicles | 366 (34.2%) | 82 (36.3%) |
| 3 or more Vehicles | 488 (45.6%) | 37 (16.4%) |
| Total | 1,071 (100.0%) | 226 (100.0%) |
Real Estate & Mortgages in Tyro
Real Estate and Mortgage Overview in Tyro
| Characteristic | Without Mortgage | With Mortgage |
| Housing Units | 489 | 582 |
| Median Property Value | $114,200 | $202,100 |
| Median Household Income | $40,452 | $66 |
| Monthly Housing Costs | $431 | $0 |
| Real Estate Taxes | $1,021 | $0 |
Property Value by Mortgage Status in Tyro
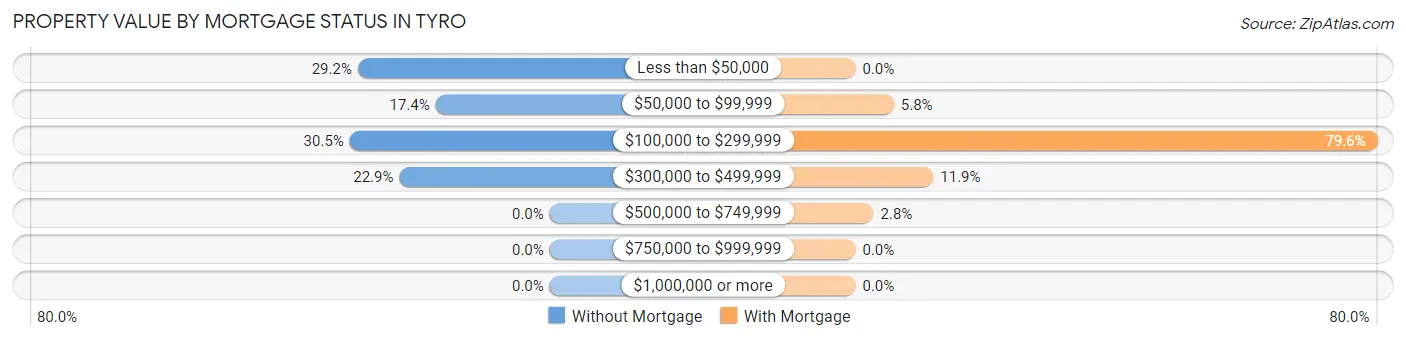
| Property Value | Without Mortgage | With Mortgage |
| Less than $50,000 | 143 (29.2%) | 0 (0.0%) |
| $50,000 to $99,999 | 85 (17.4%) | 34 (5.8%) |
| $100,000 to $299,999 | 149 (30.5%) | 463 (79.5%) |
| $300,000 to $499,999 | 112 (22.9%) | 69 (11.9%) |
| $500,000 to $749,999 | 0 (0.0%) | 16 (2.8%) |
| $750,000 to $999,999 | 0 (0.0%) | 0 (0.0%) |
| $1,000,000 or more | 0 (0.0%) | 0 (0.0%) |
| Total | 489 (100.0%) | 582 (100.0%) |
Household Income by Mortgage Status in Tyro
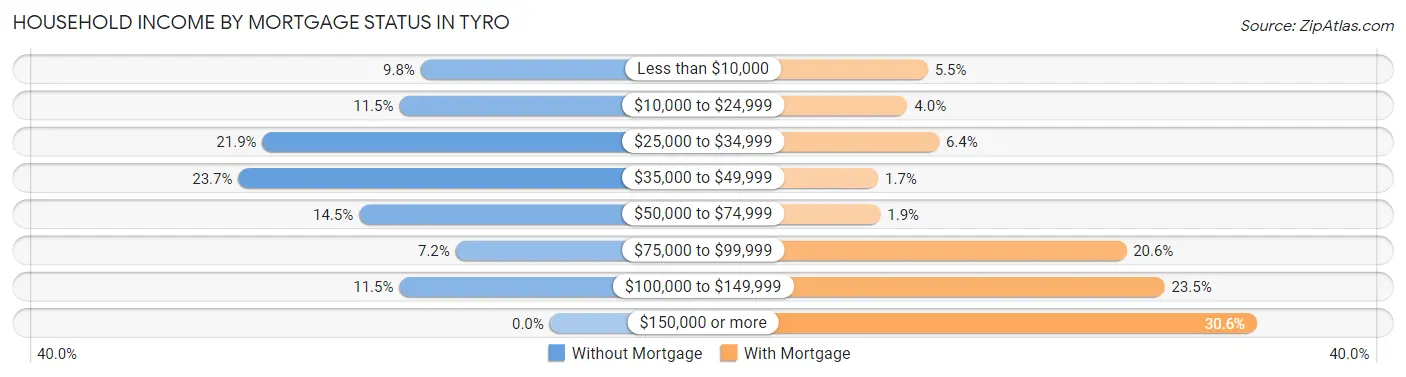
| Household Income | Without Mortgage | With Mortgage |
| Less than $10,000 | 48 (9.8%) | 32 (5.5%) |
| $10,000 to $24,999 | 56 (11.5%) | 23 (4.0%) |
| $25,000 to $34,999 | 107 (21.9%) | 37 (6.4%) |
| $35,000 to $49,999 | 116 (23.7%) | 10 (1.7%) |
| $50,000 to $74,999 | 71 (14.5%) | 11 (1.9%) |
| $75,000 to $99,999 | 35 (7.2%) | 120 (20.6%) |
| $100,000 to $149,999 | 56 (11.5%) | 137 (23.5%) |
| $150,000 or more | 0 (0.0%) | 178 (30.6%) |
| Total | 489 (100.0%) | 582 (100.0%) |
Property Value to Household Income Ratio in Tyro
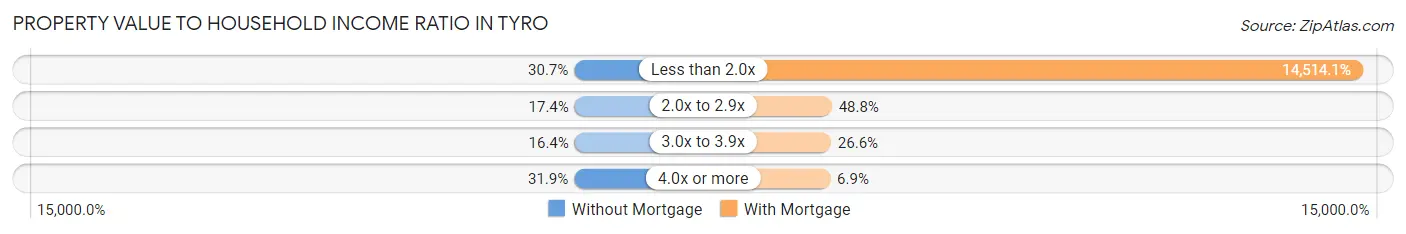
| Value-to-Income Ratio | Without Mortgage | With Mortgage |
| Less than 2.0x | 150 (30.7%) | 84,472 (14,514.1%) |
| 2.0x to 2.9x | 85 (17.4%) | 284 (48.8%) |
| 3.0x to 3.9x | 80 (16.4%) | 155 (26.6%) |
| 4.0x or more | 156 (31.9%) | 40 (6.9%) |
| Total | 489 (100.0%) | 582 (100.0%) |
Real Estate Taxes by Mortgage Status in Tyro
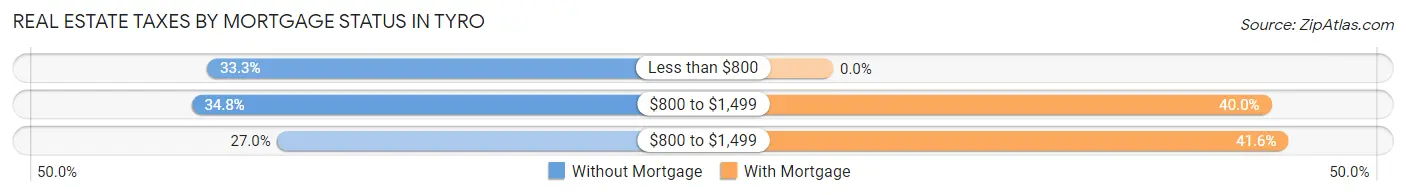
| Property Taxes | Without Mortgage | With Mortgage |
| Less than $800 | 163 (33.3%) | 0 (0.0%) |
| $800 to $1,499 | 170 (34.8%) | 233 (40.0%) |
| $800 to $1,499 | 132 (27.0%) | 242 (41.6%) |
| Total | 489 (100.0%) | 582 (100.0%) |
Health & Disability in Tyro
Health Insurance Coverage by Age in Tyro
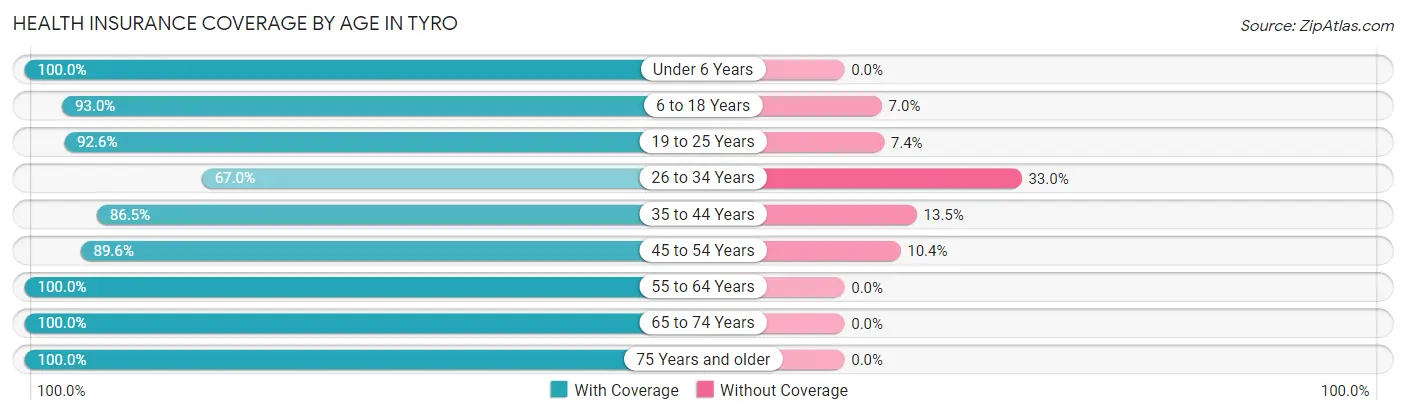
| Age Bracket | With Coverage | Without Coverage |
| Under 6 Years | 255 (100.0%) | 0 (0.0%) |
| 6 to 18 Years | 414 (93.0%) | 31 (7.0%) |
| 19 to 25 Years | 377 (92.6%) | 30 (7.4%) |
| 26 to 34 Years | 383 (67.0%) | 189 (33.0%) |
| 35 to 44 Years | 154 (86.5%) | 24 (13.5%) |
| 45 to 54 Years | 472 (89.6%) | 55 (10.4%) |
| 55 to 64 Years | 571 (100.0%) | 0 (0.0%) |
| 65 to 74 Years | 347 (100.0%) | 0 (0.0%) |
| 75 Years and older | 158 (100.0%) | 0 (0.0%) |
| Total | 3,131 (90.5%) | 329 (9.5%) |
Health Insurance Coverage by Citizenship Status in Tyro
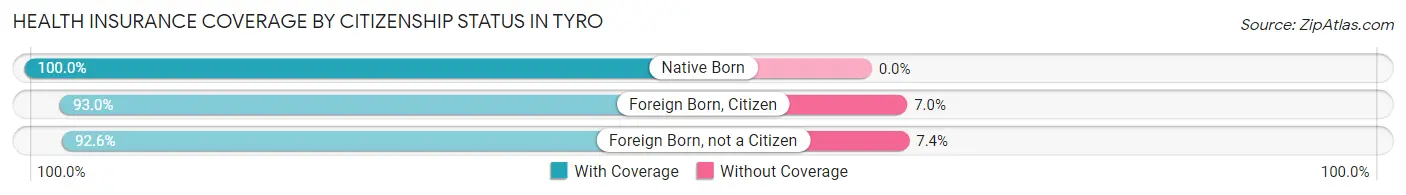
| Citizenship Status | With Coverage | Without Coverage |
| Native Born | 255 (100.0%) | 0 (0.0%) |
| Foreign Born, Citizen | 414 (93.0%) | 31 (7.0%) |
| Foreign Born, not a Citizen | 377 (92.6%) | 30 (7.4%) |
Health Insurance Coverage by Household Income in Tyro
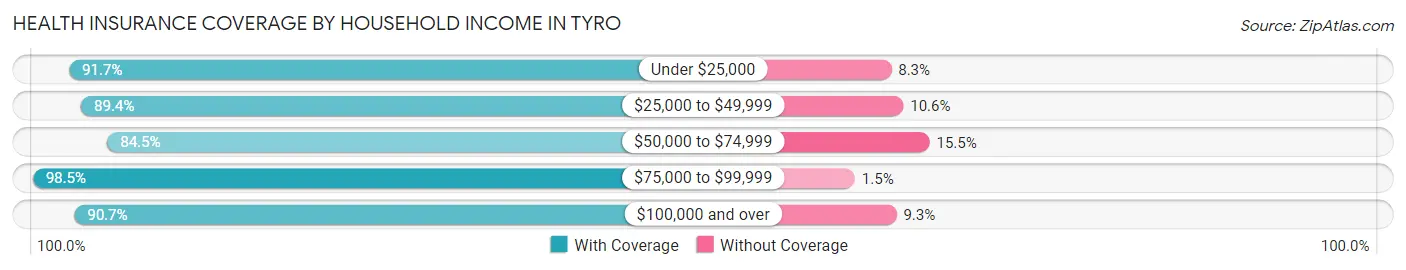
| Household Income | With Coverage | Without Coverage |
| Under $25,000 | 297 (91.7%) | 27 (8.3%) |
| $25,000 to $49,999 | 979 (89.4%) | 116 (10.6%) |
| $50,000 to $74,999 | 578 (84.5%) | 106 (15.5%) |
| $75,000 to $99,999 | 585 (98.5%) | 9 (1.5%) |
| $100,000 and over | 692 (90.7%) | 71 (9.3%) |
Public vs Private Health Insurance Coverage by Age in Tyro
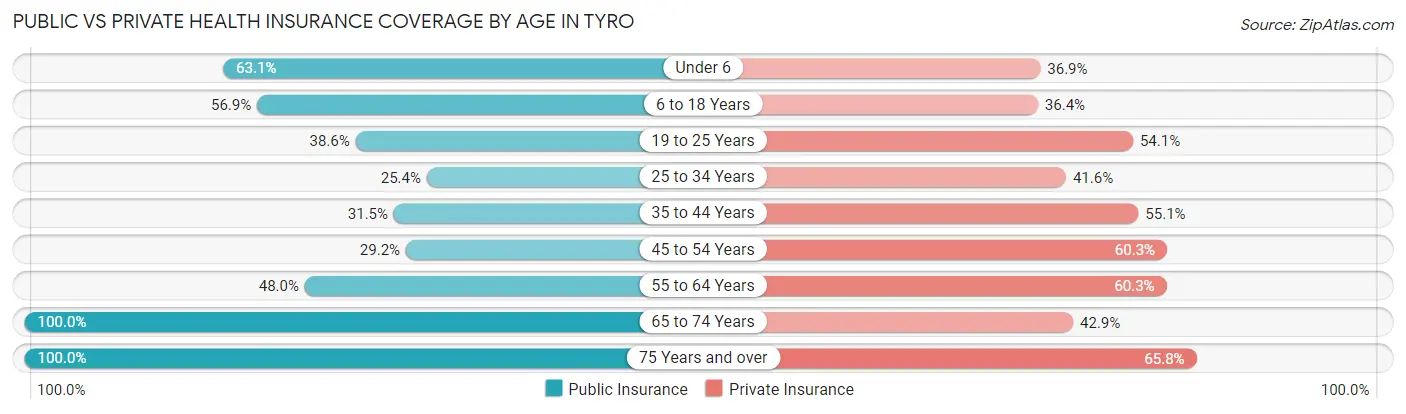
| Age Bracket | Public Insurance | Private Insurance |
| Under 6 | 161 (63.1%) | 94 (36.9%) |
| 6 to 18 Years | 253 (56.9%) | 162 (36.4%) |
| 19 to 25 Years | 157 (38.6%) | 220 (54.0%) |
| 25 to 34 Years | 145 (25.4%) | 238 (41.6%) |
| 35 to 44 Years | 56 (31.5%) | 98 (55.1%) |
| 45 to 54 Years | 154 (29.2%) | 318 (60.3%) |
| 55 to 64 Years | 274 (48.0%) | 344 (60.3%) |
| 65 to 74 Years | 347 (100.0%) | 149 (42.9%) |
| 75 Years and over | 158 (100.0%) | 104 (65.8%) |
| Total | 1,705 (49.3%) | 1,727 (49.9%) |
Disability Status by Sex by Age in Tyro
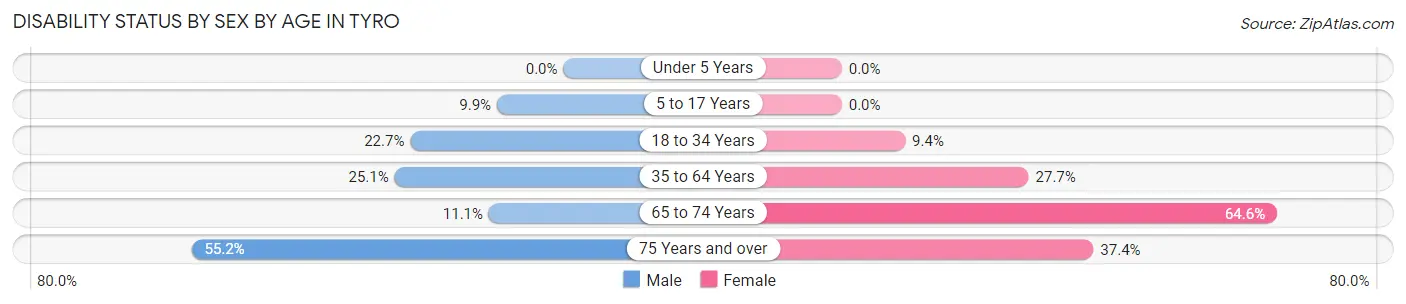
| Age Bracket | Male | Female |
| Under 5 Years | 0 (0.0%) | 0 (0.0%) |
| 5 to 17 Years | 29 (9.9%) | 0 (0.0%) |
| 18 to 34 Years | 108 (22.7%) | 48 (9.4%) |
| 35 to 64 Years | 169 (25.1%) | 167 (27.7%) |
| 65 to 74 Years | 24 (11.1%) | 84 (64.6%) |
| 75 Years and over | 37 (55.2%) | 34 (37.4%) |
Disability Class by Sex by Age in Tyro
Disability Class: Hearing Difficulty
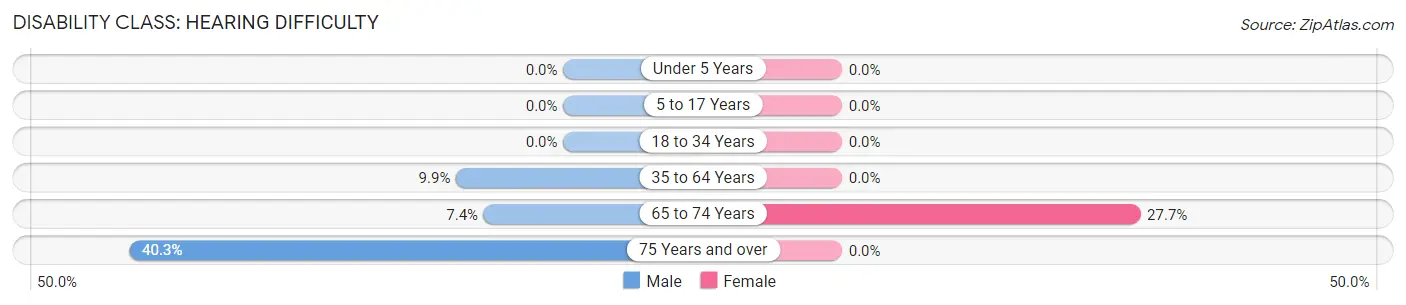
| Age Bracket | Male | Female |
| Under 5 Years | 0 (0.0%) | 0 (0.0%) |
| 5 to 17 Years | 0 (0.0%) | 0 (0.0%) |
| 18 to 34 Years | 0 (0.0%) | 0 (0.0%) |
| 35 to 64 Years | 67 (9.9%) | 0 (0.0%) |
| 65 to 74 Years | 16 (7.4%) | 36 (27.7%) |
| 75 Years and over | 27 (40.3%) | 0 (0.0%) |
Disability Class: Vision Difficulty
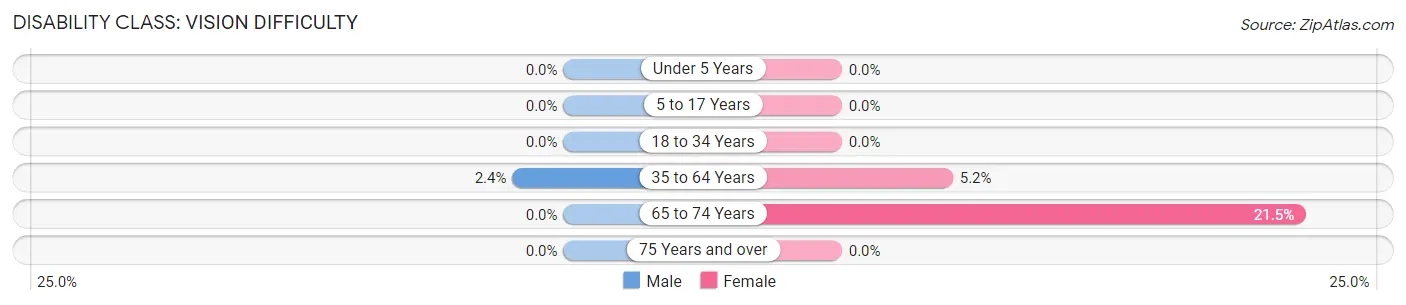
| Age Bracket | Male | Female |
| Under 5 Years | 0 (0.0%) | 0 (0.0%) |
| 5 to 17 Years | 0 (0.0%) | 0 (0.0%) |
| 18 to 34 Years | 0 (0.0%) | 0 (0.0%) |
| 35 to 64 Years | 16 (2.4%) | 31 (5.1%) |
| 65 to 74 Years | 0 (0.0%) | 28 (21.5%) |
| 75 Years and over | 0 (0.0%) | 0 (0.0%) |
Disability Class: Cognitive Difficulty
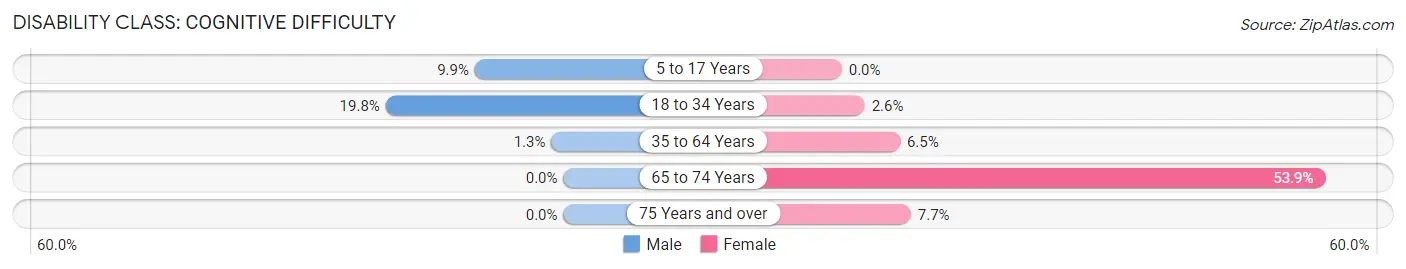
| Age Bracket | Male | Female |
| 5 to 17 Years | 29 (9.9%) | 0 (0.0%) |
| 18 to 34 Years | 94 (19.8%) | 13 (2.5%) |
| 35 to 64 Years | 9 (1.3%) | 39 (6.5%) |
| 65 to 74 Years | 0 (0.0%) | 70 (53.8%) |
| 75 Years and over | 0 (0.0%) | 7 (7.7%) |
Disability Class: Ambulatory Difficulty
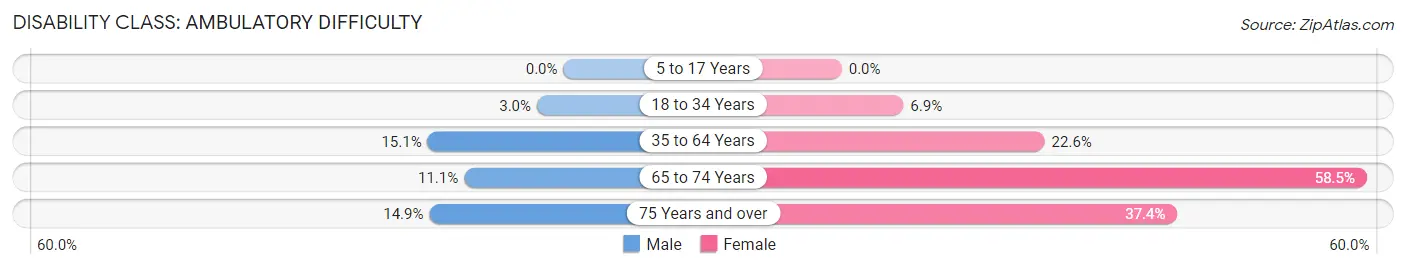
| Age Bracket | Male | Female |
| 5 to 17 Years | 0 (0.0%) | 0 (0.0%) |
| 18 to 34 Years | 14 (2.9%) | 35 (6.9%) |
| 35 to 64 Years | 102 (15.1%) | 136 (22.6%) |
| 65 to 74 Years | 24 (11.1%) | 76 (58.5%) |
| 75 Years and over | 10 (14.9%) | 34 (37.4%) |
Disability Class: Self-Care Difficulty
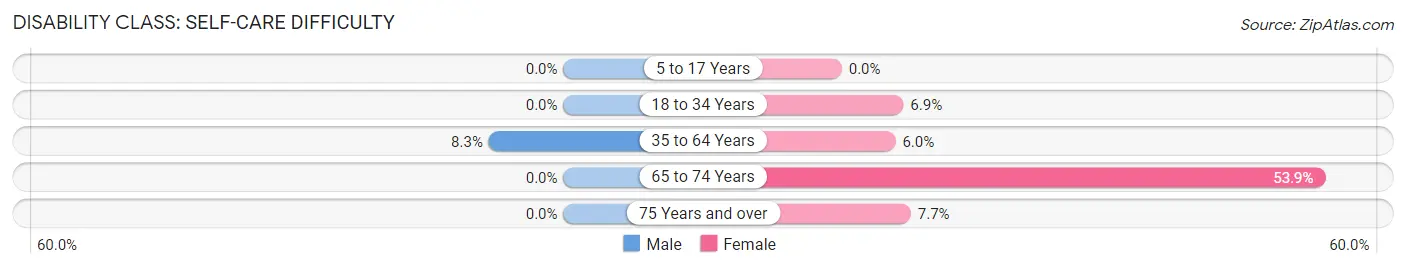
| Age Bracket | Male | Female |
| 5 to 17 Years | 0 (0.0%) | 0 (0.0%) |
| 18 to 34 Years | 0 (0.0%) | 35 (6.9%) |
| 35 to 64 Years | 56 (8.3%) | 36 (6.0%) |
| 65 to 74 Years | 0 (0.0%) | 70 (53.8%) |
| 75 Years and over | 0 (0.0%) | 7 (7.7%) |
Technology Access in Tyro
Computing Device Access in Tyro
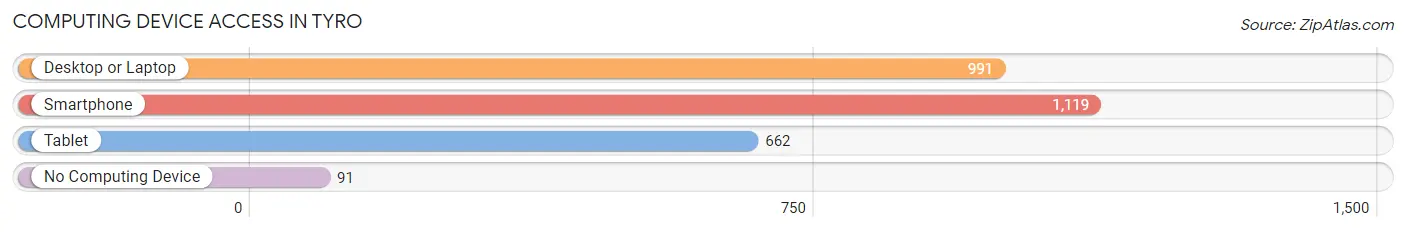
| Device Type | # Households | % Households |
| Desktop or Laptop | 991 | 76.4% |
| Smartphone | 1,119 | 86.3% |
| Tablet | 662 | 51.0% |
| No Computing Device | 91 | 7.0% |
| Total | 1,297 | 100.0% |
Internet Access in Tyro
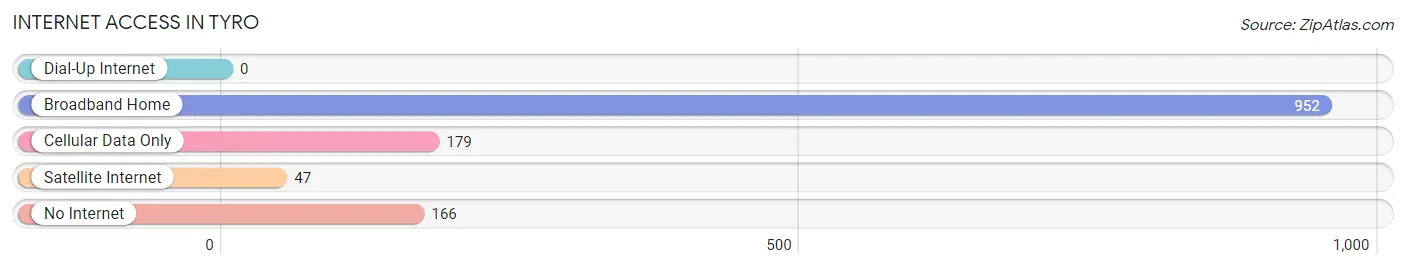
| Internet Type | # Households | % Households |
| Dial-Up Internet | 0 | 0.0% |
| Broadband Home | 952 | 73.4% |
| Cellular Data Only | 179 | 13.8% |
| Satellite Internet | 47 | 3.6% |
| No Internet | 166 | 12.8% |
| Total | 1,297 | 100.0% |
Tyro Summary
Tyro is a small unincorporated community located in Davidson County, North Carolina. It is situated in the foothills of the Blue Ridge Mountains, approximately 20 miles north of Winston-Salem. The population of Tyro was estimated to be 1,845 in the 2010 census.
History
The area that is now Tyro was first settled in the late 1700s by German and Scots-Irish immigrants. The town was originally known as “Tyrone”, after the Irish county of Tyrone. The name was later changed to “Tyro”, which is derived from the Greek word for “hero”.
The town was officially incorporated in 1891. During the late 19th and early 20th centuries, Tyro was a thriving agricultural community. The town was home to several cotton mills, a grist mill, and a sawmill.
Geography
Tyro is located in the foothills of the Blue Ridge Mountains, approximately 20 miles north of Winston-Salem. The town is situated in the Yadkin Valley, which is known for its rolling hills and lush forests. The town is bordered by the towns of Lexington and Thomasville to the north, and the towns of Welcome and Wallburg to the south.
The town is located at an elevation of 890 feet above sea level. The climate in Tyro is mild, with average temperatures ranging from the mid-50s in the winter to the mid-80s in the summer.
Economy
The economy of Tyro is largely based on agriculture. The town is home to several farms, which produce a variety of crops, including corn, soybeans, wheat, and hay. The town is also home to several small businesses, including a grocery store, a hardware store, and a restaurant.
Demographics
As of the 2010 census, the population of Tyro was 1,845. The racial makeup of the town was 94.3% White, 3.2% African American, 0.7% Native American, 0.3% Asian, and 1.5% from other races. The median household income in Tyro was $37,917, and the median family income was $45,917.
Conclusion
Tyro is a small unincorporated community located in Davidson County, North Carolina. It is situated in the foothills of the Blue Ridge Mountains, approximately 20 miles north of Winston-Salem. The town was originally settled in the late 1700s by German and Scots-Irish immigrants, and was officially incorporated in 1891. The economy of Tyro is largely based on agriculture, and the town is home to several small businesses. As of the 2010 census, the population of Tyro was 1,845.
Common Questions
What is Per Capita Income in Tyro?
Per Capita income in Tyro is $26,669.
What is the Median Family Income in Tyro?
Median Family Income in Tyro is $57,857.
What is the Median Household income in Tyro?
Median Household Income in Tyro is $55,995.
What is Income or Wage Gap in Tyro?
Income or Wage Gap in Tyro is 8.3%.
Women in Tyro earn 91.7 cents for every dollar earned by a man.
What is Inequality or Gini Index in Tyro?
Inequality or Gini Index in Tyro is 0.41.
What is the Total Population of Tyro?
Total Population of Tyro is 3,460.
What is the Total Male Population of Tyro?
Total Male Population of Tyro is 1,816.
What is the Total Female Population of Tyro?
Total Female Population of Tyro is 1,644.
What is the Ratio of Males per 100 Females in Tyro?
There are 110.46 Males per 100 Females in Tyro.
What is the Ratio of Females per 100 Males in Tyro?
There are 90.53 Females per 100 Males in Tyro.
What is the Median Population Age in Tyro?
Median Population Age in Tyro is 36.2 Years.
What is the Average Family Size in Tyro
Average Family Size in Tyro is 2.9 People.
What is the Average Household Size in Tyro
Average Household Size in Tyro is 2.7 People.
How Large is the Labor Force in Tyro?
There are 1,662 People in the Labor Forcein in Tyro.
What is the Percentage of People in the Labor Force in Tyro?
57.4% of People are in the Labor Force in Tyro.
What is the Unemployment Rate in Tyro?
Unemployment Rate in Tyro is 2.9%.