Havelock, NC Map & Demographics
Havelock Map
Havelock Overview
$26,646
PER CAPITA INCOME
$65,829
AVG FAMILY INCOME
$56,492
AVG HOUSEHOLD INCOME
15.6%
WAGE / INCOME GAP [ % ]
84.4¢/ $1
WAGE / INCOME GAP [ $ ]
0.38
INEQUALITY / GINI INDEX
16,759
TOTAL POPULATION
9,750
MALE POPULATION
7,009
FEMALE POPULATION
139.11
MALES / 100 FEMALES
71.89
FEMALES / 100 MALES
23.8
MEDIAN AGE
3.1
AVG FAMILY SIZE
2.7
AVG HOUSEHOLD SIZE
9,594
LABOR FORCE [ PEOPLE ]
75.1%
PERCENT IN LABOR FORCE
4.7%
UNEMPLOYMENT RATE
Havelock Zip Codes
Havelock Area Codes
Income in Havelock
Income Overview in Havelock
Per Capita Income in Havelock is $26,646, while median incomes of families and households are $65,829 and $56,492 respectively.
| Characteristic | Number | Measure |
| Per Capita Income | 16,759 | $26,646 |
| Median Family Income | 3,825 | $65,829 |
| Mean Family Income | 3,825 | $75,326 |
| Median Household Income | 5,153 | $56,492 |
| Mean Household Income | 5,153 | $69,180 |
| Income Deficit | 3,825 | $0 |
| Wage / Income Gap (%) | 16,759 | 15.56% |
| Wage / Income Gap ($) | 16,759 | 84.44¢ per $1 |
| Gini / Inequality Index | 16,759 | 0.38 |
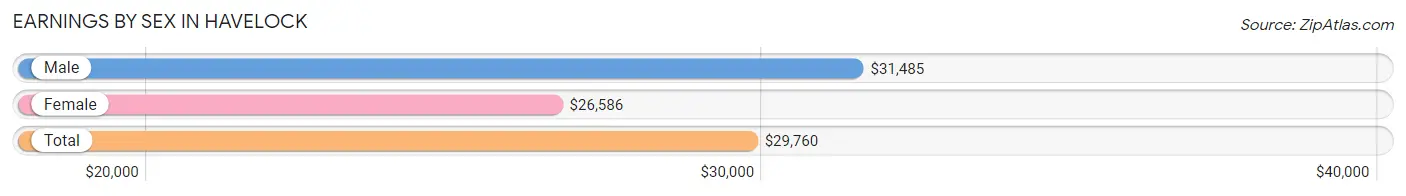
Earnings by Sex in Havelock
Average Earnings in Havelock are $29,760, $31,485 for men and $26,586 for women, a difference of 15.6%.
| Sex | Number | Average Earnings |
| Male | 6,725 (68.0%) | $31,485 |
| Female | 3,160 (32.0%) | $26,586 |
| Total | 9,885 (100.0%) | $29,760 |
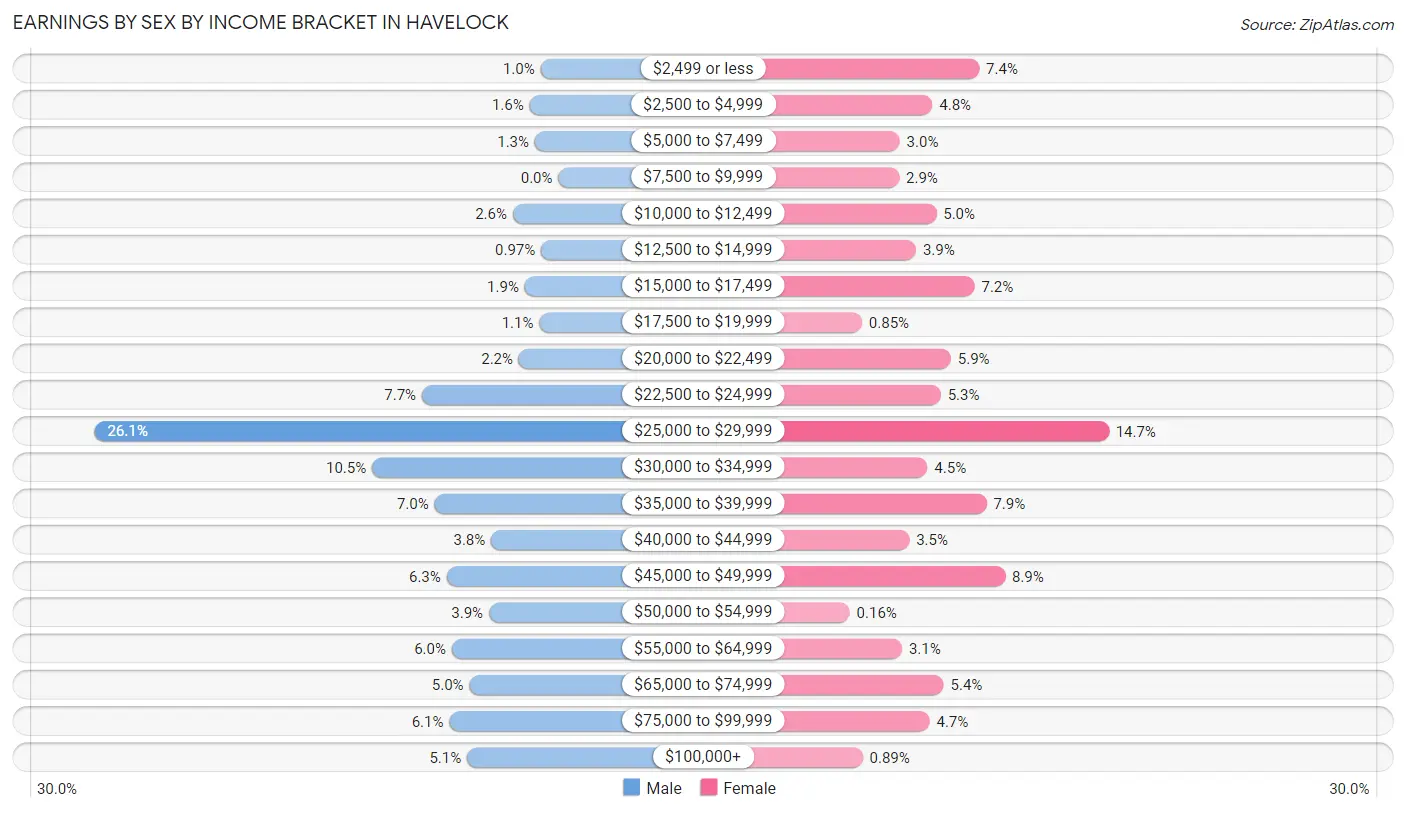
Earnings by Sex by Income Bracket in Havelock
The most common earnings brackets in Havelock are $25,000 to $29,999 for men (1,753 | 26.1%) and $25,000 to $29,999 for women (465 | 14.7%).
| Income | Male | Female |
| $2,499 or less | 67 (1.0%) | 235 (7.4%) |
| $2,500 to $4,999 | 109 (1.6%) | 152 (4.8%) |
| $5,000 to $7,499 | 89 (1.3%) | 94 (3.0%) |
| $7,500 to $9,999 | 0 (0.0%) | 93 (2.9%) |
| $10,000 to $12,499 | 172 (2.6%) | 159 (5.0%) |
| $12,500 to $14,999 | 65 (1.0%) | 123 (3.9%) |
| $15,000 to $17,499 | 127 (1.9%) | 227 (7.2%) |
| $17,500 to $19,999 | 72 (1.1%) | 27 (0.9%) |
| $20,000 to $22,499 | 149 (2.2%) | 185 (5.9%) |
| $22,500 to $24,999 | 516 (7.7%) | 167 (5.3%) |
| $25,000 to $29,999 | 1,753 (26.1%) | 465 (14.7%) |
| $30,000 to $34,999 | 704 (10.5%) | 143 (4.5%) |
| $35,000 to $39,999 | 468 (7.0%) | 248 (7.9%) |
| $40,000 to $44,999 | 254 (3.8%) | 111 (3.5%) |
| $45,000 to $49,999 | 422 (6.3%) | 281 (8.9%) |
| $50,000 to $54,999 | 262 (3.9%) | 5 (0.2%) |
| $55,000 to $64,999 | 403 (6.0%) | 98 (3.1%) |
| $65,000 to $74,999 | 336 (5.0%) | 172 (5.4%) |
| $75,000 to $99,999 | 412 (6.1%) | 147 (4.6%) |
| $100,000+ | 345 (5.1%) | 28 (0.9%) |
| Total | 6,725 (100.0%) | 3,160 (100.0%) |
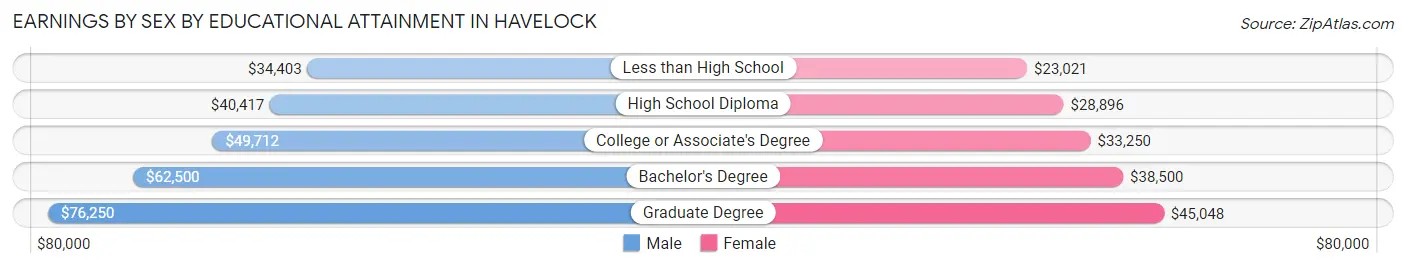
Earnings by Sex by Educational Attainment in Havelock
Average earnings in Havelock are $50,128 for men and $32,500 for women, a difference of 35.2%. Men with an educational attainment of graduate degree enjoy the highest average annual earnings of $76,250, while those with less than high school education earn the least with $34,403. Women with an educational attainment of graduate degree earn the most with the average annual earnings of $45,048, while those with less than high school education have the smallest earnings of $23,021.
| Educational Attainment | Male Income | Female Income |
| Less than High School | $34,403 | $23,021 |
| High School Diploma | $40,417 | $28,896 |
| College or Associate's Degree | $49,712 | $33,250 |
| Bachelor's Degree | $62,500 | $38,500 |
| Graduate Degree | $76,250 | $45,048 |
| Total | $50,128 | $32,500 |
Family Income in Havelock
Family Income Brackets in Havelock
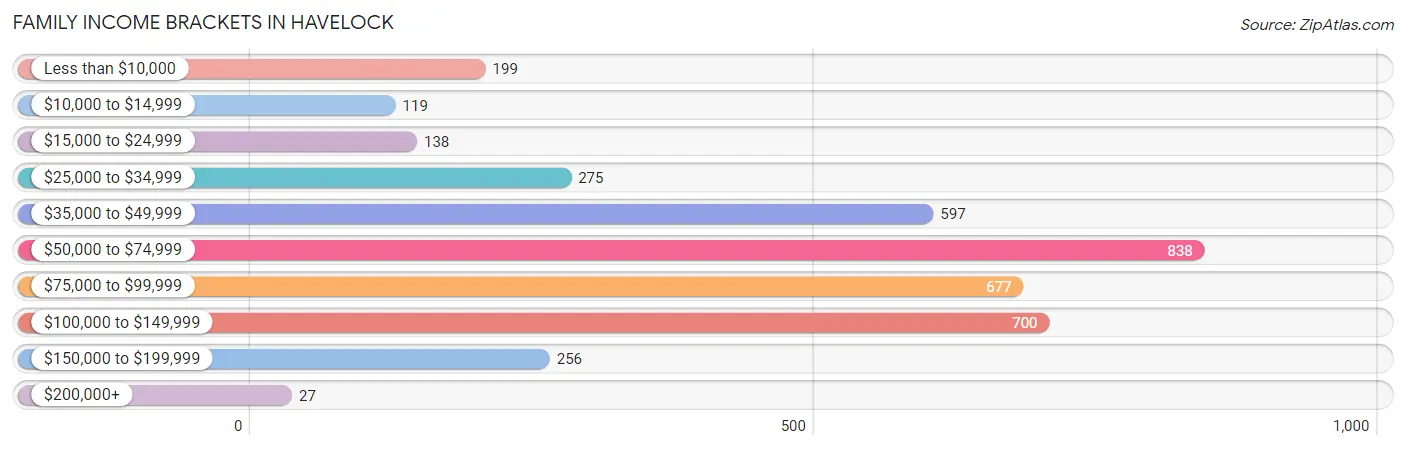
According to the Havelock family income data, there are 838 families falling into the $50,000 to $74,999 income range, which is the most common income bracket and makes up 21.9% of all families. Conversely, the $200,000+ income bracket is the least frequent group with only 27 families (0.7%) belonging to this category.
| Income Bracket | # Families | % Families |
| Less than $10,000 | 199 | 5.2% |
| $10,000 to $14,999 | 119 | 3.1% |
| $15,000 to $24,999 | 138 | 3.6% |
| $25,000 to $34,999 | 275 | 7.2% |
| $35,000 to $49,999 | 597 | 15.6% |
| $50,000 to $74,999 | 838 | 21.9% |
| $75,000 to $99,999 | 677 | 17.7% |
| $100,000 to $149,999 | 700 | 18.3% |
| $150,000 to $199,999 | 256 | 6.7% |
| $200,000+ | 27 | 0.7% |
Family Income by Famaliy Size in Havelock
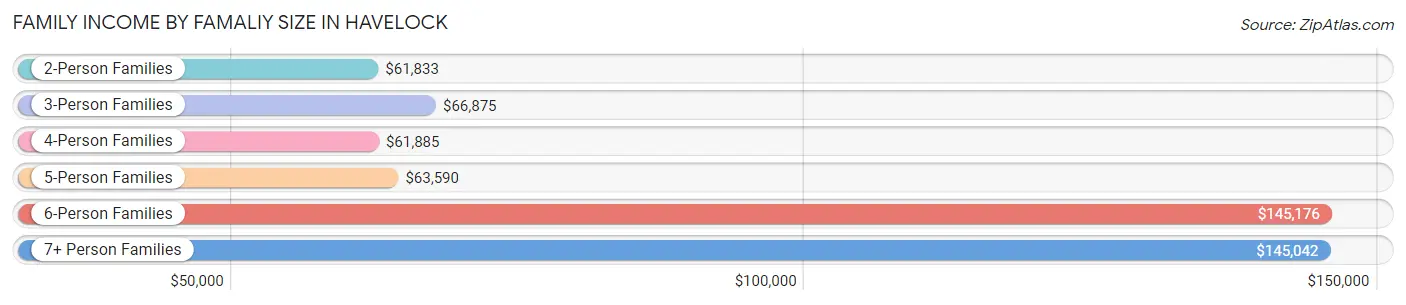
6-person families (119 | 3.1%) account for the highest median family income in Havelock with $145,176 per family, while 2-person families (1,834 | 47.9%) have the highest median income of $30,916 per family member.
| Income Bracket | # Families | Median Income |
| 2-Person Families | 1,834 (47.9%) | $61,833 |
| 3-Person Families | 831 (21.7%) | $66,875 |
| 4-Person Families | 743 (19.4%) | $61,885 |
| 5-Person Families | 221 (5.8%) | $63,590 |
| 6-Person Families | 119 (3.1%) | $145,176 |
| 7+ Person Families | 77 (2.0%) | $145,042 |
| Total | 3,825 (100.0%) | $65,829 |
Family Income by Number of Earners in Havelock
| Number of Earners | # Families | Median Income |
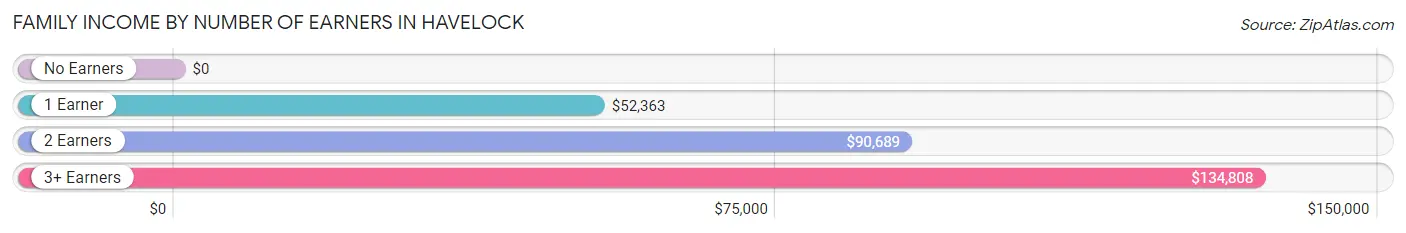
| No Earners | 490 (12.8%) | $0 |
| 1 Earner | 1,647 (43.1%) | $52,363 |
| 2 Earners | 1,456 (38.1%) | $90,689 |
| 3+ Earners | 232 (6.1%) | $134,808 |
| Total | 3,825 (100.0%) | $65,829 |
Household Income in Havelock
Household Income Brackets in Havelock
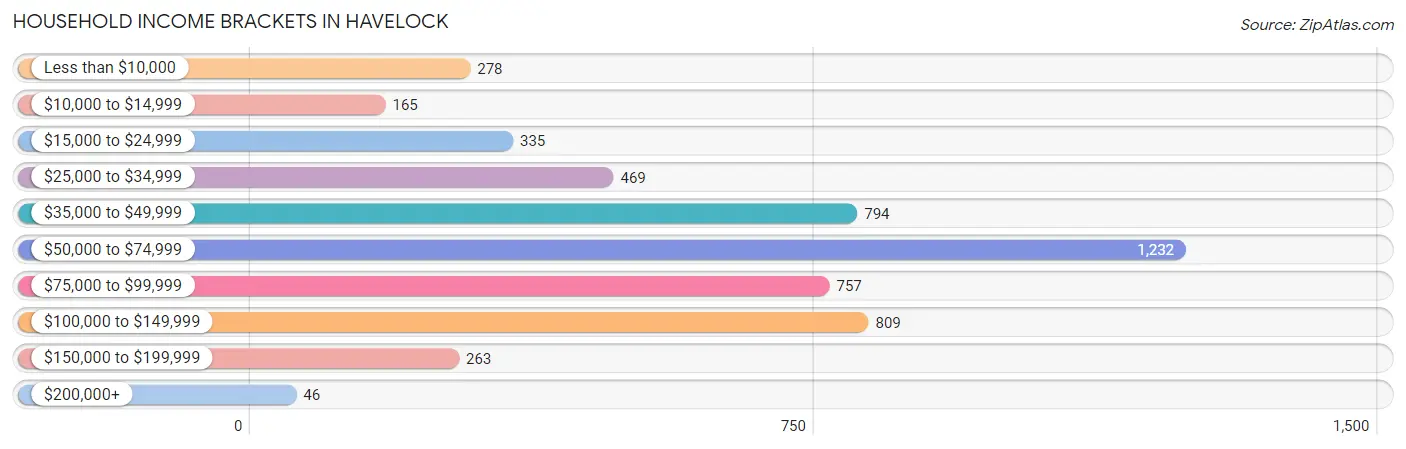
With 1,232 households falling in the category, the $50,000 to $74,999 income range is the most frequent in Havelock, accounting for 23.9% of all households. In contrast, only 46 households (0.9%) fall into the $200,000+ income bracket, making it the least populous group.
| Income Bracket | # Households | % Households |
| Less than $10,000 | 278 | 5.4% |
| $10,000 to $14,999 | 165 | 3.2% |
| $15,000 to $24,999 | 335 | 6.5% |
| $25,000 to $34,999 | 469 | 9.1% |
| $35,000 to $49,999 | 794 | 15.4% |
| $50,000 to $74,999 | 1,232 | 23.9% |
| $75,000 to $99,999 | 757 | 14.7% |
| $100,000 to $149,999 | 809 | 15.7% |
| $150,000 to $199,999 | 263 | 5.1% |
| $200,000+ | 46 | 0.9% |
Household Income by Householder Age in Havelock
The median household income in Havelock is $56,492, with the highest median household income of $66,266 found in the 25 to 44 years age bracket for the primary householder. A total of 2,149 households (41.7%) fall into this category. Meanwhile, the 15 to 24 years age bracket for the primary householder has the lowest median household income of $45,635, with 933 households (18.1%) in this group.
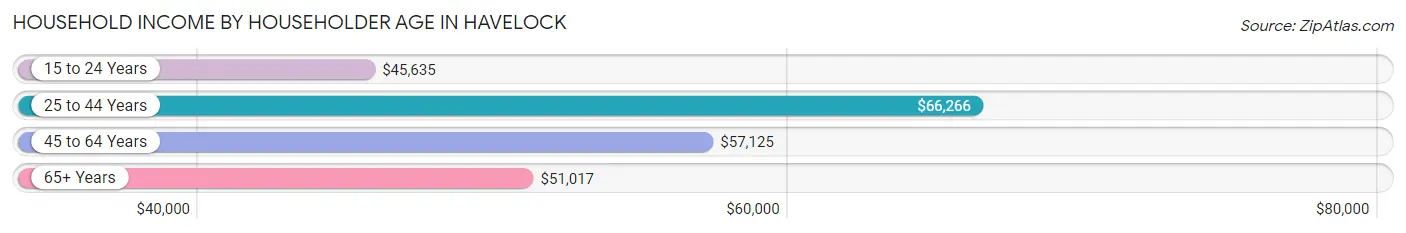
| Income Bracket | # Households | Median Income |
| 15 to 24 Years | 933 (18.1%) | $45,635 |
| 25 to 44 Years | 2,149 (41.7%) | $66,266 |
| 45 to 64 Years | 1,385 (26.9%) | $57,125 |
| 65+ Years | 686 (13.3%) | $51,017 |
| Total | 5,153 (100.0%) | $56,492 |
Poverty in Havelock
Income Below Poverty by Sex and Age in Havelock
With 13.2% poverty level for males and 14.5% for females among the residents of Havelock, 5 year old males and 6 to 11 year old females are the most vulnerable to poverty, with 75 males (53.6%) and 151 females (21.4%) in their respective age groups living below the poverty level.
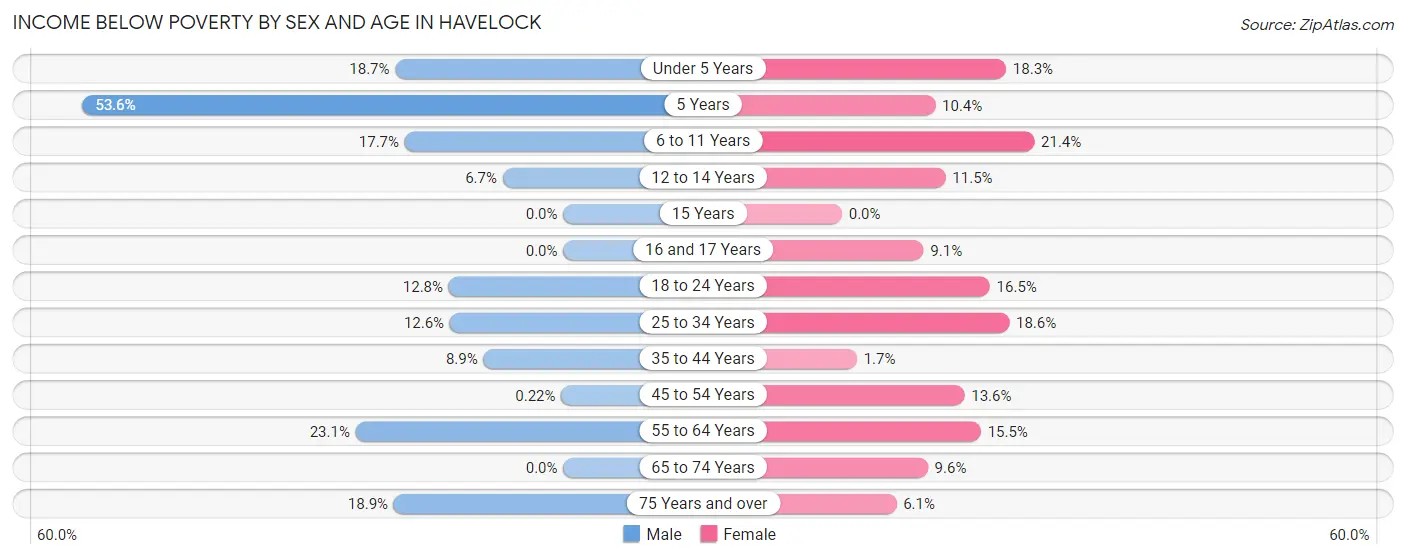
| Age Bracket | Male | Female |
| Under 5 Years | 130 (18.7%) | 153 (18.3%) |
| 5 Years | 75 (53.6%) | 8 (10.4%) |
| 6 to 11 Years | 158 (17.6%) | 151 (21.4%) |
| 12 to 14 Years | 12 (6.7%) | 24 (11.5%) |
| 15 Years | 0 (0.0%) | 0 (0.0%) |
| 16 and 17 Years | 0 (0.0%) | 6 (9.1%) |
| 18 to 24 Years | 152 (12.8%) | 186 (16.5%) |
| 25 to 34 Years | 149 (12.6%) | 209 (18.6%) |
| 35 to 44 Years | 84 (8.9%) | 12 (1.7%) |
| 45 to 54 Years | 1 (0.2%) | 63 (13.6%) |
| 55 to 64 Years | 138 (23.1%) | 121 (15.5%) |
| 65 to 74 Years | 0 (0.0%) | 37 (9.6%) |
| 75 Years and over | 10 (18.9%) | 10 (6.1%) |
| Total | 909 (13.2%) | 980 (14.5%) |
Income Above Poverty by Sex and Age in Havelock
According to the poverty statistics in Havelock, males aged 15 years and females aged 15 years are the age groups that are most secure financially, with 100.0% of males and 100.0% of females in these age groups living above the poverty line.
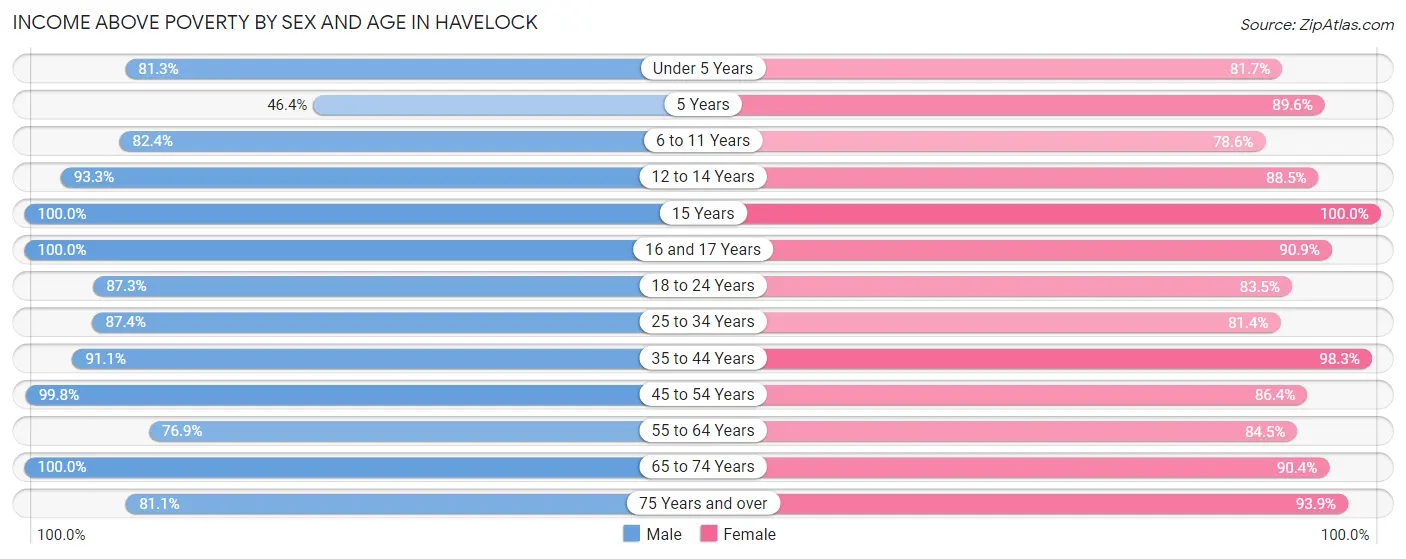
| Age Bracket | Male | Female |
| Under 5 Years | 565 (81.3%) | 684 (81.7%) |
| 5 Years | 65 (46.4%) | 69 (89.6%) |
| 6 to 11 Years | 737 (82.4%) | 554 (78.6%) |
| 12 to 14 Years | 166 (93.3%) | 184 (88.5%) |
| 15 Years | 100 (100.0%) | 83 (100.0%) |
| 16 and 17 Years | 121 (100.0%) | 60 (90.9%) |
| 18 to 24 Years | 1,040 (87.3%) | 943 (83.5%) |
| 25 to 34 Years | 1,031 (87.4%) | 913 (81.4%) |
| 35 to 44 Years | 861 (91.1%) | 711 (98.3%) |
| 45 to 54 Years | 444 (99.8%) | 399 (86.4%) |
| 55 to 64 Years | 459 (76.9%) | 661 (84.5%) |
| 65 to 74 Years | 369 (100.0%) | 350 (90.4%) |
| 75 Years and over | 43 (81.1%) | 155 (93.9%) |
| Total | 6,001 (86.9%) | 5,766 (85.5%) |
Income Below Poverty Among Married-Couple Families in Havelock
The poverty statistics for married-couple families in Havelock show that 8.8% or 260 of the total 2,968 families live below the poverty line. Families with 3 or 4 children have the highest poverty rate of 39.4%, comprising of 82 families. On the other hand, families with 5 or more children have the lowest poverty rate of 0.0%, which includes 0 families.
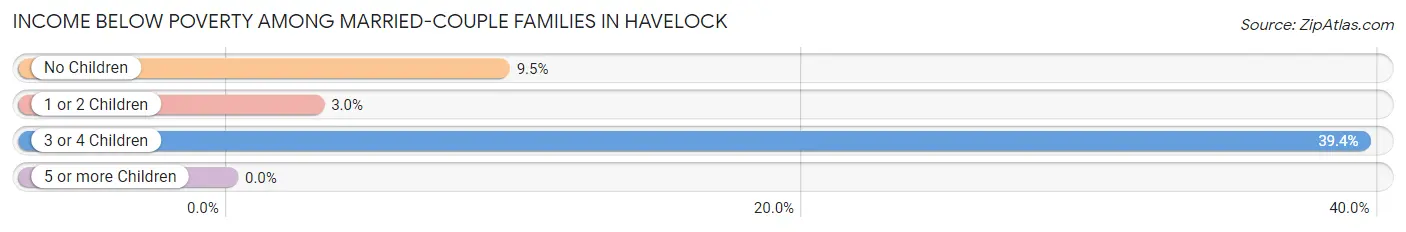
| Children | Above Poverty | Below Poverty |
| No Children | 1,359 (90.5%) | 142 (9.5%) |
| 1 or 2 Children | 1,163 (97.0%) | 36 (3.0%) |
| 3 or 4 Children | 126 (60.6%) | 82 (39.4%) |
| 5 or more Children | 60 (100.0%) | 0 (0.0%) |
| Total | 2,708 (91.2%) | 260 (8.8%) |
Income Below Poverty Among Single-Parent Households in Havelock
According to the poverty data in Havelock, 26.7% or 104 single-father households and 30.4% or 142 single-mother households are living below the poverty line. Among single-father households, those with 1 or 2 children have the highest poverty rate, with 104 households (31.7%) experiencing poverty. Likewise, among single-mother households, those with 3 or 4 children have the highest poverty rate, with 61 households (73.5%) falling below the poverty line.
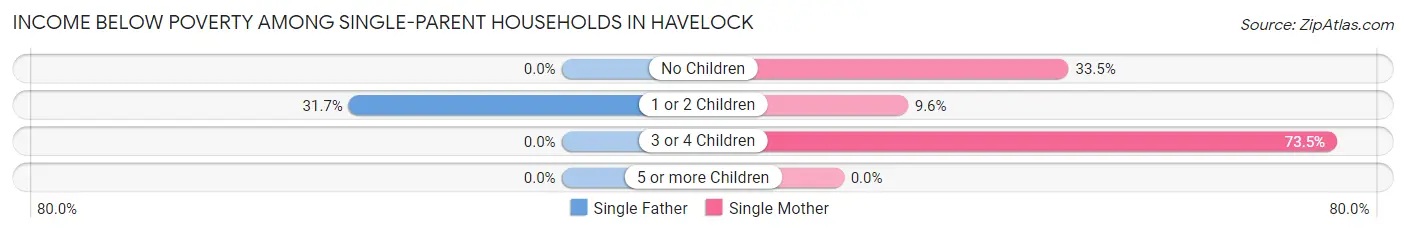
| Children | Single Father | Single Mother |
| No Children | 0 (0.0%) | 62 (33.5%) |
| 1 or 2 Children | 104 (31.7%) | 19 (9.6%) |
| 3 or 4 Children | 0 (0.0%) | 61 (73.5%) |
| 5 or more Children | 0 (0.0%) | 0 (0.0%) |
| Total | 104 (26.7%) | 142 (30.4%) |
Income Below Poverty Among Married-Couple vs Single-Parent Households in Havelock
The poverty data for Havelock shows that 260 of the married-couple family households (8.8%) and 246 of the single-parent households (28.7%) are living below the poverty level. Within the married-couple family households, those with 3 or 4 children have the highest poverty rate, with 82 households (39.4%) falling below the poverty line. Among the single-parent households, those with 3 or 4 children have the highest poverty rate, with 61 household (73.5%) living below poverty.
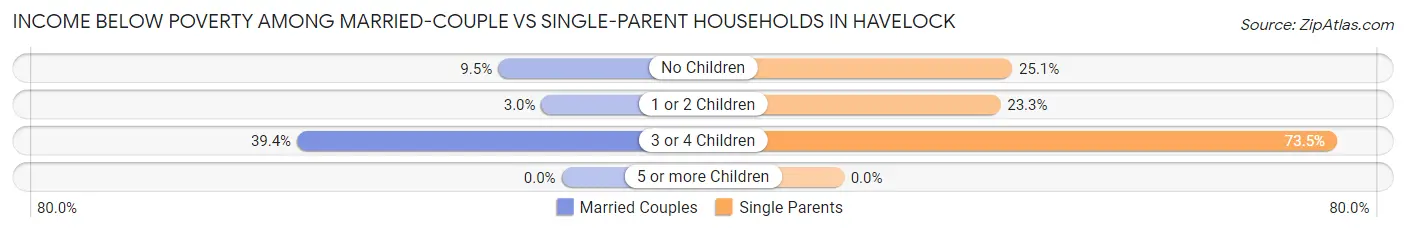
| Children | Married-Couple Families | Single-Parent Households |
| No Children | 142 (9.5%) | 62 (25.1%) |
| 1 or 2 Children | 36 (3.0%) | 123 (23.3%) |
| 3 or 4 Children | 82 (39.4%) | 61 (73.5%) |
| 5 or more Children | 0 (0.0%) | 0 (0.0%) |
| Total | 260 (8.8%) | 246 (28.7%) |
Race in Havelock
The most populous races in Havelock are White / Caucasian (10,961 | 65.4%), Black / African American (2,772 | 16.5%), and Hispanic or Latino (2,769 | 16.5%).
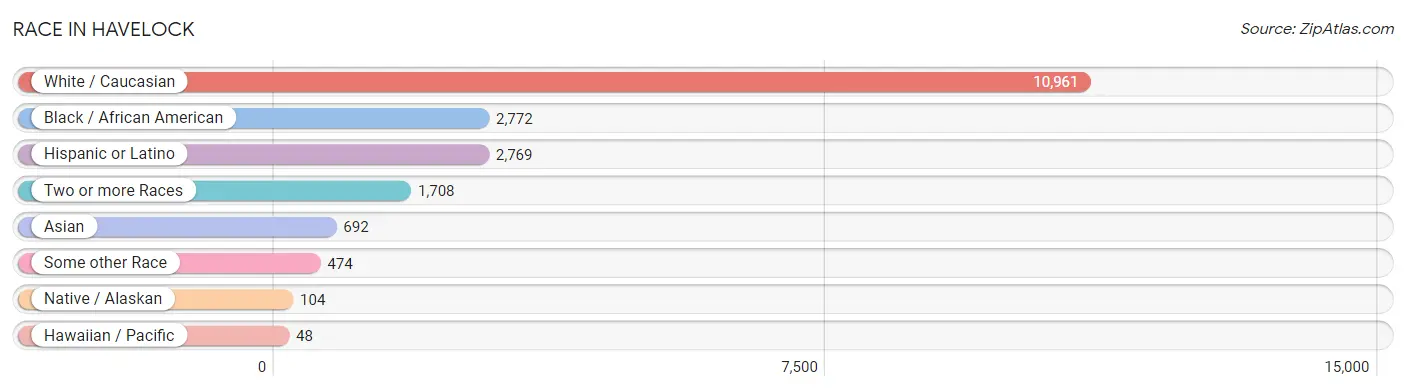
| Race | # Population | % Population |
| Asian | 692 | 4.1% |
| Black / African American | 2,772 | 16.5% |
| Hawaiian / Pacific | 48 | 0.3% |
| Hispanic or Latino | 2,769 | 16.5% |
| Native / Alaskan | 104 | 0.6% |
| White / Caucasian | 10,961 | 65.4% |
| Two or more Races | 1,708 | 10.2% |
| Some other Race | 474 | 2.8% |
| Total | 16,759 | 100.0% |
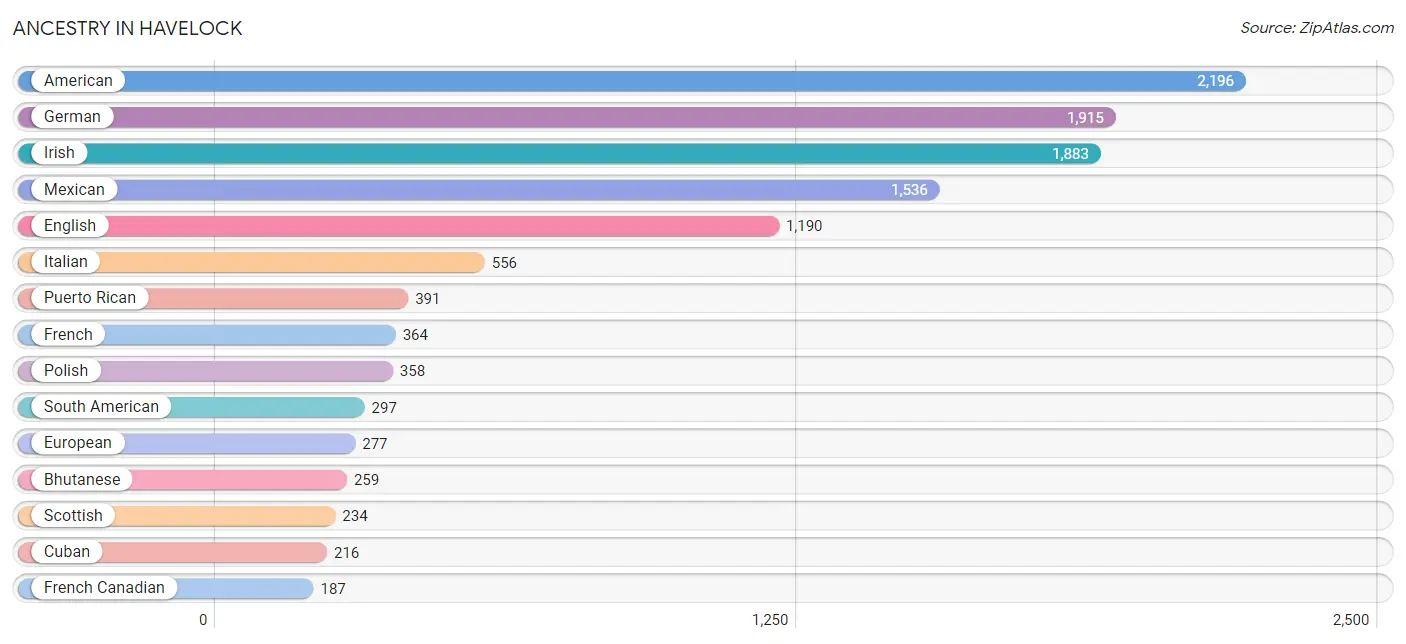
Ancestry in Havelock
The most populous ancestries reported in Havelock are American (2,196 | 13.1%), German (1,915 | 11.4%), Irish (1,883 | 11.2%), Mexican (1,536 | 9.2%), and English (1,190 | 7.1%), together accounting for 52.0% of all Havelock residents.
| Ancestry | # Population | % Population |
| African | 11 | 0.1% |
| American | 2,196 | 13.1% |
| Arab | 27 | 0.2% |
| Argentinean | 23 | 0.1% |
| Bangladeshi | 16 | 0.1% |
| Belgian | 7 | 0.0% |
| Bhutanese | 259 | 1.5% |
| Blackfeet | 16 | 0.1% |
| Brazilian | 71 | 0.4% |
| British | 96 | 0.6% |
| Burmese | 68 | 0.4% |
| Canadian | 61 | 0.4% |
| Central American | 119 | 0.7% |
| Cherokee | 128 | 0.8% |
| Chinese | 5 | 0.0% |
| Colombian | 109 | 0.6% |
| Costa Rican | 44 | 0.3% |
| Cuban | 216 | 1.3% |
| Czech | 22 | 0.1% |
| Czechoslovakian | 7 | 0.0% |
| Danish | 25 | 0.2% |
| Dominican | 94 | 0.6% |
| Dutch | 124 | 0.7% |
| Eastern European | 44 | 0.3% |
| Ecuadorian | 126 | 0.7% |
| English | 1,190 | 7.1% |
| European | 277 | 1.7% |
| Finnish | 18 | 0.1% |
| French | 364 | 2.2% |
| French Canadian | 187 | 1.1% |
| German | 1,915 | 11.4% |
| Guamanian / Chamorro | 29 | 0.2% |
| Guatemalan | 7 | 0.0% |
| Haitian | 57 | 0.3% |
| Honduran | 7 | 0.0% |
| Hungarian | 11 | 0.1% |
| Indian (Asian) | 61 | 0.4% |
| Irish | 1,883 | 11.2% |
| Italian | 556 | 3.3% |
| Jamaican | 44 | 0.3% |
| Japanese | 82 | 0.5% |
| Kenyan | 25 | 0.2% |
| Korean | 147 | 0.9% |
| Laotian | 99 | 0.6% |
| Lebanese | 22 | 0.1% |
| Mexican | 1,536 | 9.2% |
| Mexican American Indian | 41 | 0.2% |
| Navajo | 29 | 0.2% |
| Nigerian | 4 | 0.0% |
| Norwegian | 70 | 0.4% |
| Paraguayan | 27 | 0.2% |
| Pennsylvania German | 9 | 0.1% |
| Peruvian | 12 | 0.1% |
| Polish | 358 | 2.1% |
| Portuguese | 93 | 0.5% |
| Puerto Rican | 391 | 2.3% |
| Russian | 134 | 0.8% |
| Salvadoran | 61 | 0.4% |
| Samoan | 19 | 0.1% |
| Scandinavian | 8 | 0.1% |
| Scotch-Irish | 121 | 0.7% |
| Scottish | 234 | 1.4% |
| Serbian | 28 | 0.2% |
| Slavic | 30 | 0.2% |
| South American | 297 | 1.8% |
| Spaniard | 32 | 0.2% |
| Spanish | 17 | 0.1% |
| Sri Lankan | 89 | 0.5% |
| Subsaharan African | 40 | 0.2% |
| Swedish | 141 | 0.8% |
| Swiss | 47 | 0.3% |
| Syrian | 5 | 0.0% |
| Thai | 64 | 0.4% |
| Ukrainian | 28 | 0.2% |
| Ute | 10 | 0.1% |
| Welsh | 60 | 0.4% | View All 76 Rows |
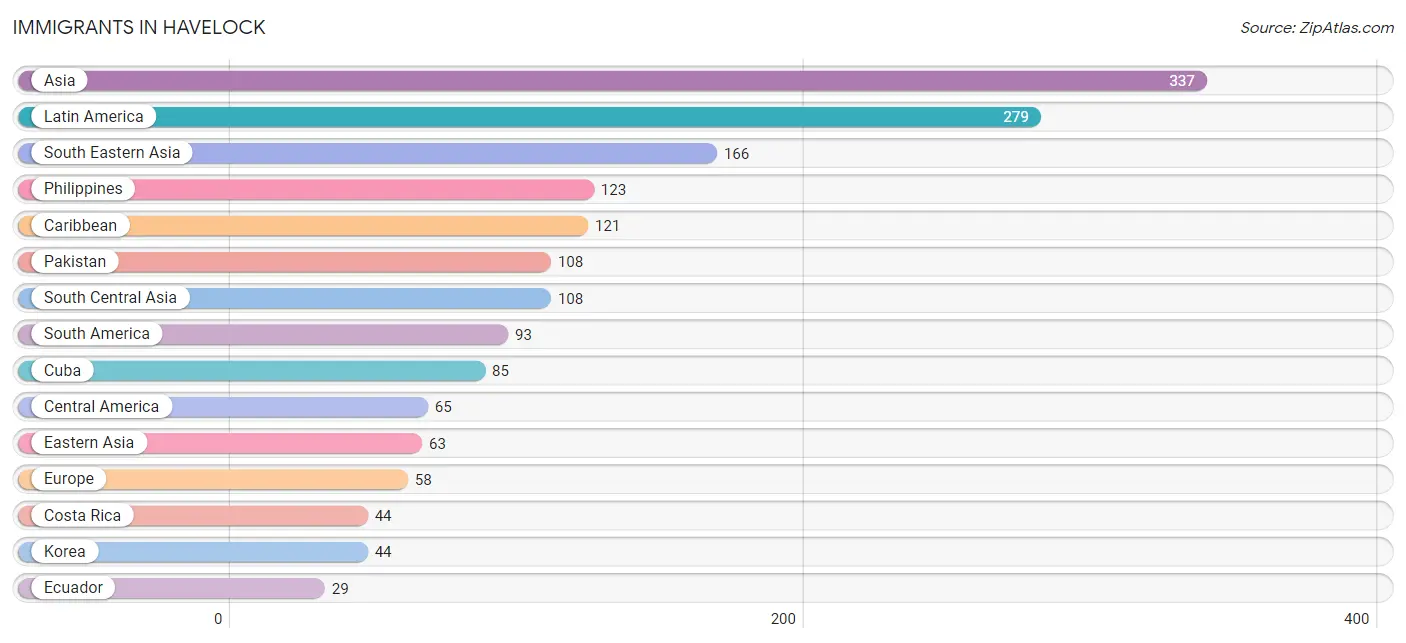
Immigrants in Havelock
The most numerous immigrant groups reported in Havelock came from Asia (337 | 2.0%), Latin America (279 | 1.7%), South Eastern Asia (166 | 1.0%), Philippines (123 | 0.7%), and Caribbean (121 | 0.7%), together accounting for 6.1% of all Havelock residents.
| Immigration Origin | # Population | % Population |
| Africa | 3 | 0.0% |
| Asia | 337 | 2.0% |
| Brazil | 25 | 0.2% |
| Canada | 28 | 0.2% |
| Caribbean | 121 | 0.7% |
| Central America | 65 | 0.4% |
| Costa Rica | 44 | 0.3% |
| Cuba | 85 | 0.5% |
| Eastern Asia | 63 | 0.4% |
| Eastern Europe | 17 | 0.1% |
| Ecuador | 29 | 0.2% |
| El Salvador | 8 | 0.1% |
| Europe | 58 | 0.4% |
| Germany | 28 | 0.2% |
| Haiti | 11 | 0.1% |
| Italy | 13 | 0.1% |
| Jamaica | 25 | 0.2% |
| Japan | 19 | 0.1% |
| Korea | 44 | 0.3% |
| Laos | 9 | 0.1% |
| Latin America | 279 | 1.7% |
| Liberia | 3 | 0.0% |
| Mexico | 13 | 0.1% |
| Oceania | 19 | 0.1% |
| Pakistan | 108 | 0.6% |
| Peru | 12 | 0.1% |
| Philippines | 123 | 0.7% |
| Poland | 9 | 0.1% |
| Russia | 8 | 0.1% |
| South America | 93 | 0.5% |
| South Central Asia | 108 | 0.6% |
| South Eastern Asia | 166 | 1.0% |
| Southern Europe | 13 | 0.1% |
| Thailand | 7 | 0.0% |
| Vietnam | 27 | 0.2% |
| Western Africa | 3 | 0.0% |
| Western Europe | 28 | 0.2% | View All 37 Rows |
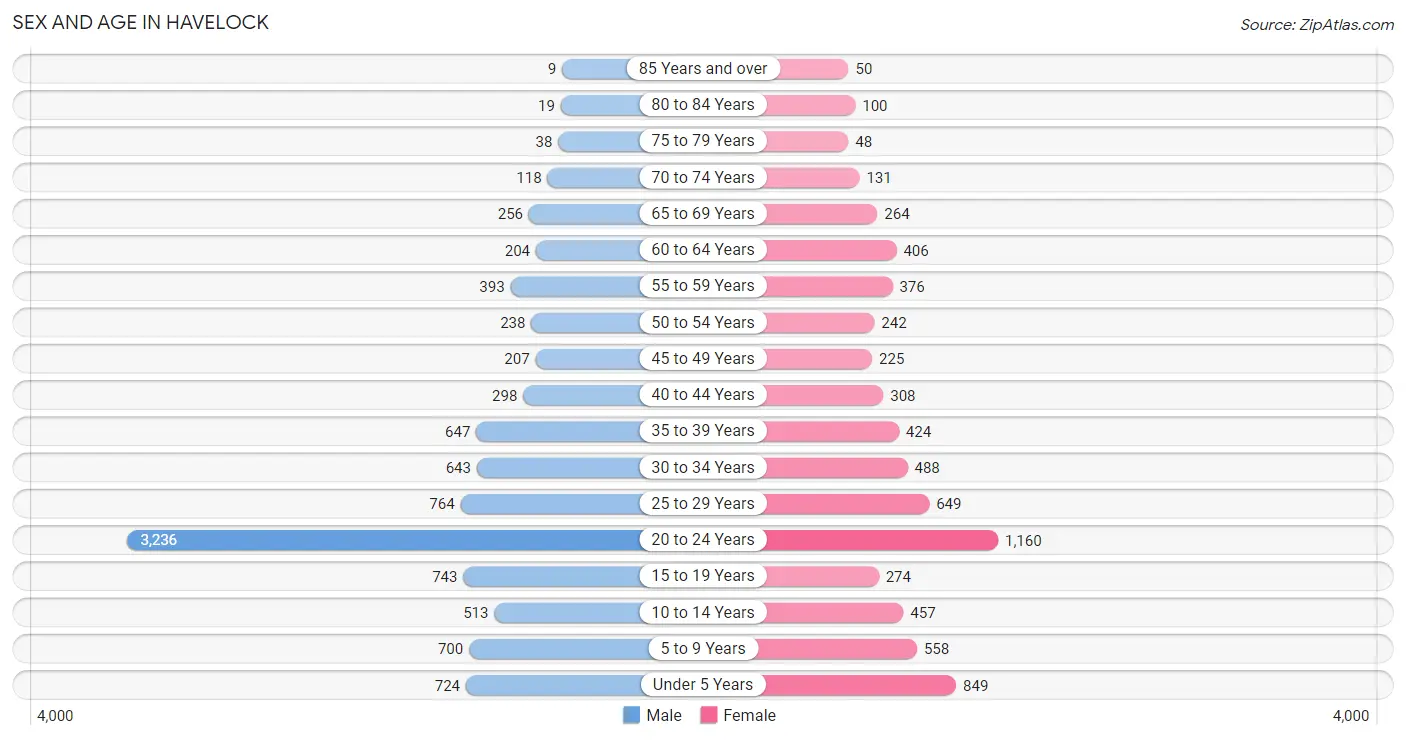
Sex and Age in Havelock
Sex and Age in Havelock
The most populous age groups in Havelock are 20 to 24 Years (3,236 | 33.2%) for men and 20 to 24 Years (1,160 | 16.6%) for women.
| Age Bracket | Male | Female |
| Under 5 Years | 724 (7.4%) | 849 (12.1%) |
| 5 to 9 Years | 700 (7.2%) | 558 (8.0%) |
| 10 to 14 Years | 513 (5.3%) | 457 (6.5%) |
| 15 to 19 Years | 743 (7.6%) | 274 (3.9%) |
| 20 to 24 Years | 3,236 (33.2%) | 1,160 (16.6%) |
| 25 to 29 Years | 764 (7.8%) | 649 (9.3%) |
| 30 to 34 Years | 643 (6.6%) | 488 (7.0%) |
| 35 to 39 Years | 647 (6.6%) | 424 (6.0%) |
| 40 to 44 Years | 298 (3.1%) | 308 (4.4%) |
| 45 to 49 Years | 207 (2.1%) | 225 (3.2%) |
| 50 to 54 Years | 238 (2.4%) | 242 (3.5%) |
| 55 to 59 Years | 393 (4.0%) | 376 (5.4%) |
| 60 to 64 Years | 204 (2.1%) | 406 (5.8%) |
| 65 to 69 Years | 256 (2.6%) | 264 (3.8%) |
| 70 to 74 Years | 118 (1.2%) | 131 (1.9%) |
| 75 to 79 Years | 38 (0.4%) | 48 (0.7%) |
| 80 to 84 Years | 19 (0.2%) | 100 (1.4%) |
| 85 Years and over | 9 (0.1%) | 50 (0.7%) |
| Total | 9,750 (100.0%) | 7,009 (100.0%) |
Families and Households in Havelock
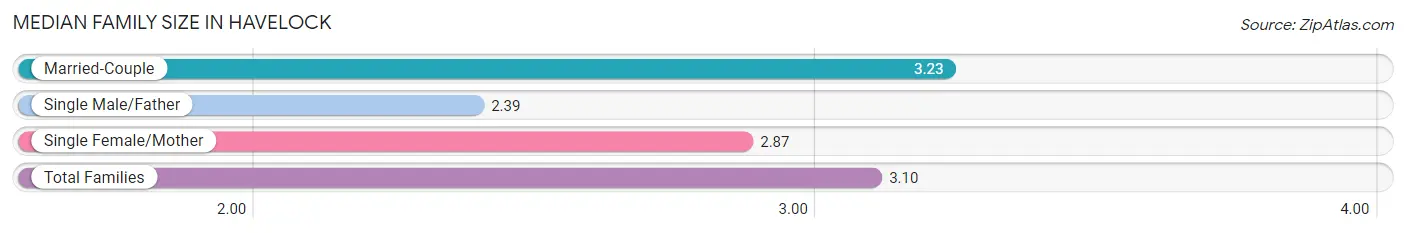
Median Family Size in Havelock
The median family size in Havelock is 3.10 persons per family, with married-couple families (2,968 | 77.6%) accounting for the largest median family size of 3.23 persons per family. On the other hand, single male/father families (390 | 10.2%) represent the smallest median family size with 2.39 persons per family.
| Family Type | # Families | Family Size |
| Married-Couple | 2,968 (77.6%) | 3.23 |
| Single Male/Father | 390 (10.2%) | 2.39 |
| Single Female/Mother | 467 (12.2%) | 2.87 |
| Total Families | 3,825 (100.0%) | 3.10 |
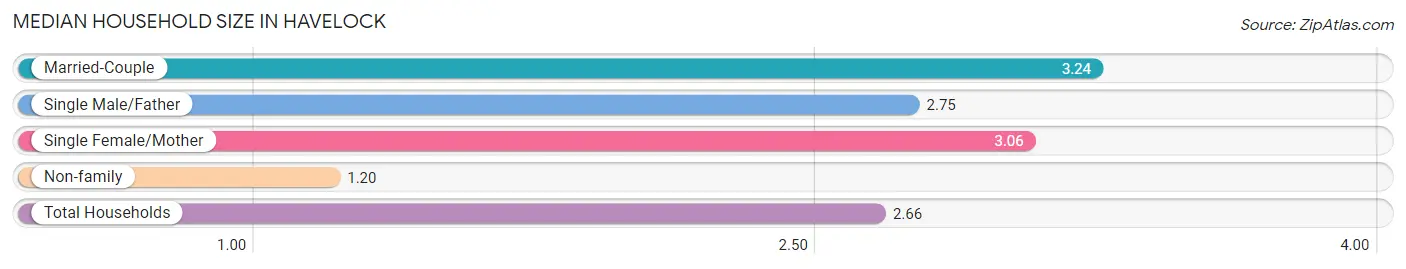
Median Household Size in Havelock
The median household size in Havelock is 2.66 persons per household, with married-couple households (2,968 | 57.6%) accounting for the largest median household size of 3.24 persons per household. non-family households (1,328 | 25.8%) represent the smallest median household size with 1.20 persons per household.
| Household Type | # Households | Household Size |
| Married-Couple | 2,968 (57.6%) | 3.24 |
| Single Male/Father | 390 (7.6%) | 2.75 |
| Single Female/Mother | 467 (9.1%) | 3.06 |
| Non-family | 1,328 (25.8%) | 1.20 |
| Total Households | 5,153 (100.0%) | 2.66 |
Household Size by Marriage Status in Havelock
Out of a total of 5,153 households in Havelock, 3,825 (74.2%) are family households, while 1,328 (25.8%) are nonfamily households. The most numerous type of family households are 2-person households, comprising 1,753, and the most common type of nonfamily households are 1-person households, comprising 1,101.
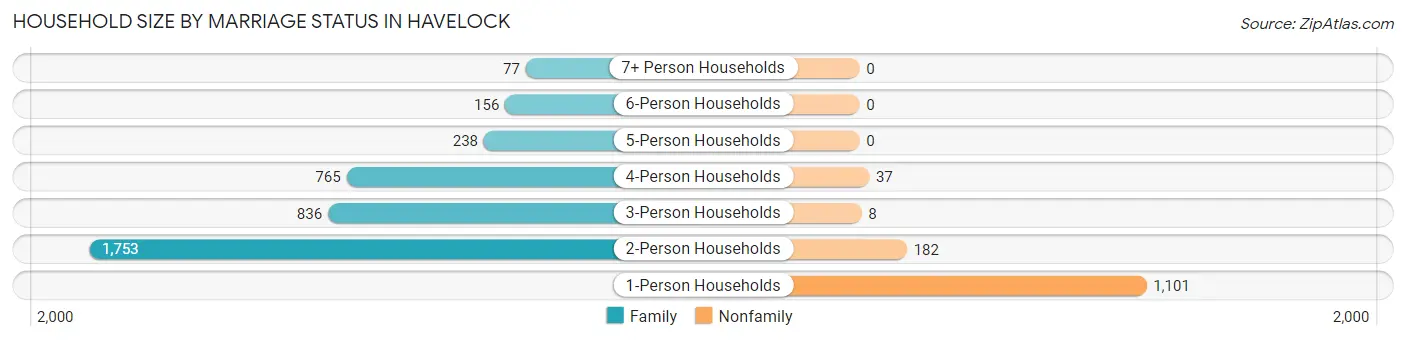
| Household Size | Family Households | Nonfamily Households |
| 1-Person Households | - | 1,101 (21.4%) |
| 2-Person Households | 1,753 (34.0%) | 182 (3.5%) |
| 3-Person Households | 836 (16.2%) | 8 (0.2%) |
| 4-Person Households | 765 (14.8%) | 37 (0.7%) |
| 5-Person Households | 238 (4.6%) | 0 (0.0%) |
| 6-Person Households | 156 (3.0%) | 0 (0.0%) |
| 7+ Person Households | 77 (1.5%) | 0 (0.0%) |
| Total | 3,825 (74.2%) | 1,328 (25.8%) |
Female Fertility in Havelock
Fertility by Age in Havelock
Average fertility rate in Havelock is 117.0 births per 1,000 women. Women in the age bracket of 20 to 34 years have the highest fertility rate with 161.0 births per 1,000 women. Women in the age bracket of 20 to 34 years acount for 87.2% of all women with births.
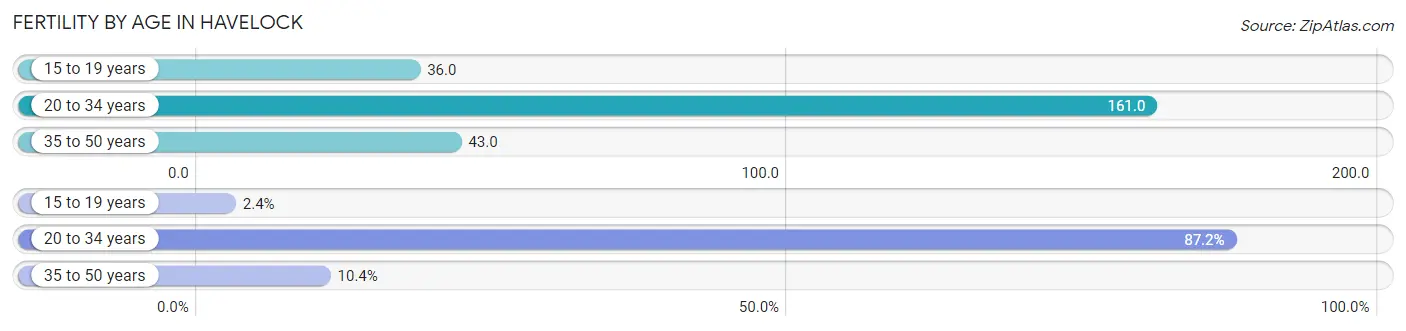
| Age Bracket | Women with Births | Births / 1,000 Women |
| 15 to 19 years | 10 (2.4%) | 36.0 |
| 20 to 34 years | 369 (87.2%) | 161.0 |
| 35 to 50 years | 44 (10.4%) | 43.0 |
| Total | 423 (100.0%) | 117.0 |
Fertility by Age by Marriage Status in Havelock
98.1% of women with births (423) in Havelock are married. The highest percentage of unmarried women with births falls into 20 to 34 years age bracket with 2.2% of them unmarried at the time of birth, while the lowest percentage of unmarried women with births belong to 15 to 19 years age bracket with 0.0% of them unmarried.
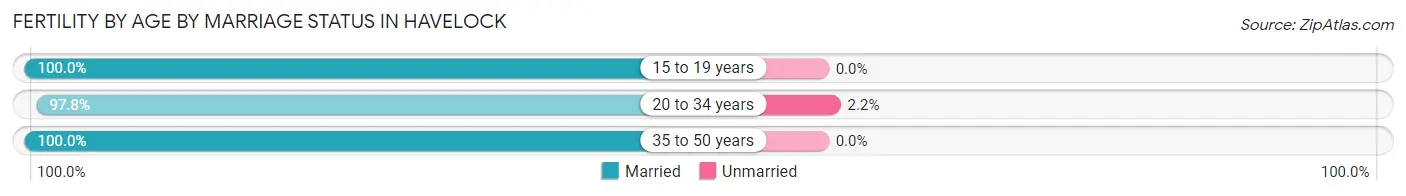
| Age Bracket | Married | Unmarried |
| 15 to 19 years | 10 (100.0%) | 0 (0.0%) |
| 20 to 34 years | 361 (97.8%) | 8 (2.2%) |
| 35 to 50 years | 44 (100.0%) | 0 (0.0%) |
| Total | 415 (98.1%) | 8 (1.9%) |
Fertility by Education in Havelock
Average fertility rate in Havelock is 117.0 births per 1,000 women. Women with the education attainment of graduate degree have the highest fertility rate of 309.0 births per 1,000 women, while women with the education attainment of bachelor's degree have the lowest fertility at 24.0 births per 1,000 women. Women with the education attainment of college or associate's degree represent 61.0% of all women with births.
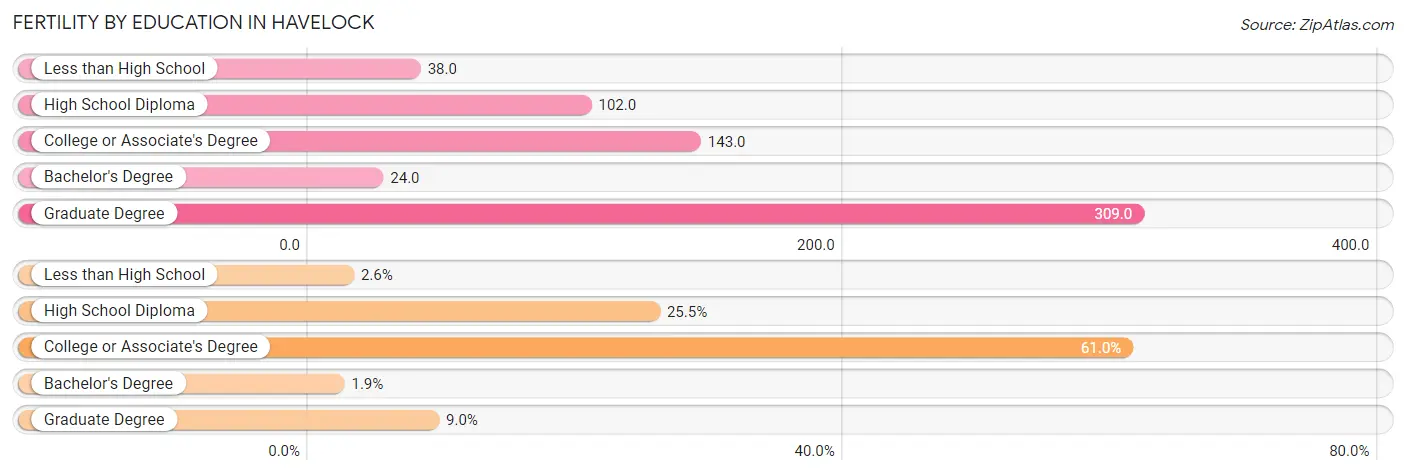
| Educational Attainment | Women with Births | Births / 1,000 Women |
| Less than High School | 11 (2.6%) | 38.0 |
| High School Diploma | 108 (25.5%) | 102.0 |
| College or Associate's Degree | 258 (61.0%) | 143.0 |
| Bachelor's Degree | 8 (1.9%) | 24.0 |
| Graduate Degree | 38 (9.0%) | 309.0 |
| Total | 423 (100.0%) | 117.0 |
Fertility by Education by Marriage Status in Havelock
1.9% of women with births in Havelock are unmarried. Women with the educational attainment of college or associate's degree are most likely to be married with 100.0% of them married at childbirth, while women with the educational attainment of less than high school are least likely to be married with 36.4% of them unmarried at childbirth.
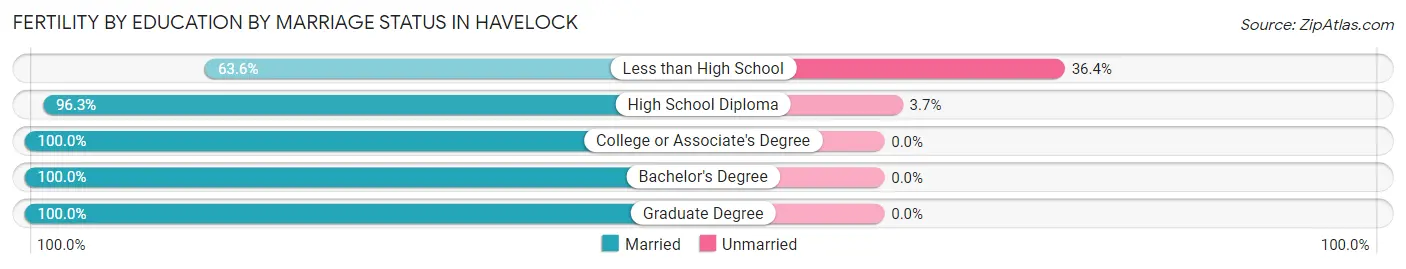
| Educational Attainment | Married | Unmarried |
| Less than High School | 7 (63.6%) | 4 (36.4%) |
| High School Diploma | 104 (96.3%) | 4 (3.7%) |
| College or Associate's Degree | 258 (100.0%) | 0 (0.0%) |
| Bachelor's Degree | 8 (100.0%) | 0 (0.0%) |
| Graduate Degree | 38 (100.0%) | 0 (0.0%) |
| Total | 415 (98.1%) | 8 (1.9%) |
Employment Characteristics in Havelock
Employment by Class of Employer in Havelock
Among the 9,283 employed individuals in Havelock, federal government employees (4,869 | 52.4%), private company employees (3,472 | 37.4%), and not-for-profit organizations (342 | 3.7%) make up the most common classes of employment.
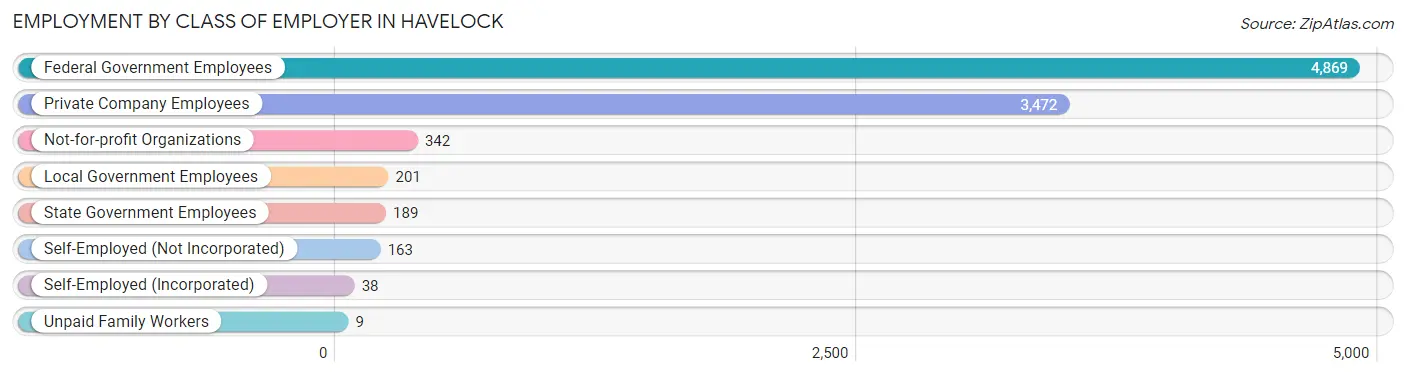
| Employer Class | # Employees | % Employees |
| Private Company Employees | 3,472 | 37.4% |
| Self-Employed (Incorporated) | 38 | 0.4% |
| Self-Employed (Not Incorporated) | 163 | 1.8% |
| Not-for-profit Organizations | 342 | 3.7% |
| Local Government Employees | 201 | 2.2% |
| State Government Employees | 189 | 2.0% |
| Federal Government Employees | 4,869 | 52.4% |
| Unpaid Family Workers | 9 | 0.1% |
| Total | 9,283 | 100.0% |
Employment Status by Age in Havelock
According to the labor force statistics for Havelock, out of the total population over 16 years of age (12,775), 75.1% or 9,594 individuals are in the labor force, with 4.7% or 451 of them unemployed. The age group with the highest labor force participation rate is 20 to 24 years, with 86.8% or 3,816 individuals in the labor force. Within the labor force, the 16 to 19 years age range has the highest percentage of unemployed individuals, with 15.5% or 112 of them being unemployed.
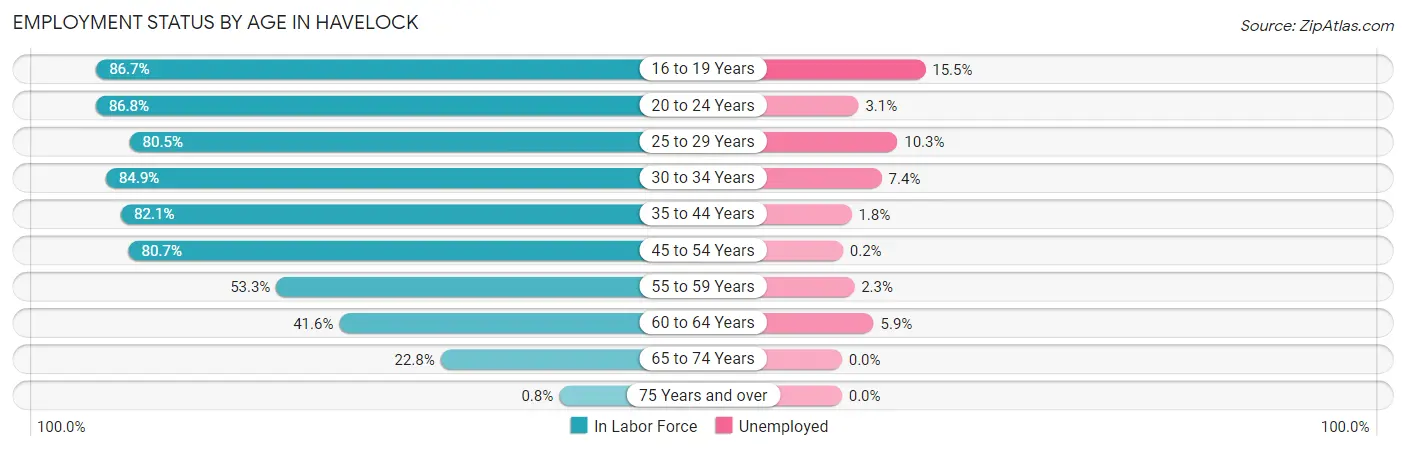
| Age Bracket | In Labor Force | Unemployed |
| 16 to 19 Years | 723 (86.7%) | 112 (15.5%) |
| 20 to 24 Years | 3,816 (86.8%) | 118 (3.1%) |
| 25 to 29 Years | 1,137 (80.5%) | 117 (10.3%) |
| 30 to 34 Years | 960 (84.9%) | 71 (7.4%) |
| 35 to 44 Years | 1,377 (82.1%) | 25 (1.8%) |
| 45 to 54 Years | 736 (80.7%) | 1 (0.2%) |
| 55 to 59 Years | 410 (53.3%) | 9 (2.3%) |
| 60 to 64 Years | 254 (41.6%) | 15 (5.9%) |
| 65 to 74 Years | 175 (22.8%) | 0 (0.0%) |
| 75 Years and over | 2 (0.8%) | 0 (0.0%) |
| Total | 9,594 (75.1%) | 451 (4.7%) |
Employment Status by Educational Attainment in Havelock
According to labor force statistics for Havelock, 74.8% of individuals (4,871) out of the total population between 25 and 64 years of age (6,512) are in the labor force, with 4.5% or 219 of them being unemployed. The group with the highest labor force participation rate are those with the educational attainment of bachelor's degree or higher, with 88.7% or 924 individuals in the labor force. Within the labor force, individuals with high school diploma education have the highest percentage of unemployment, with 7.0% or 93 of them being unemployed.
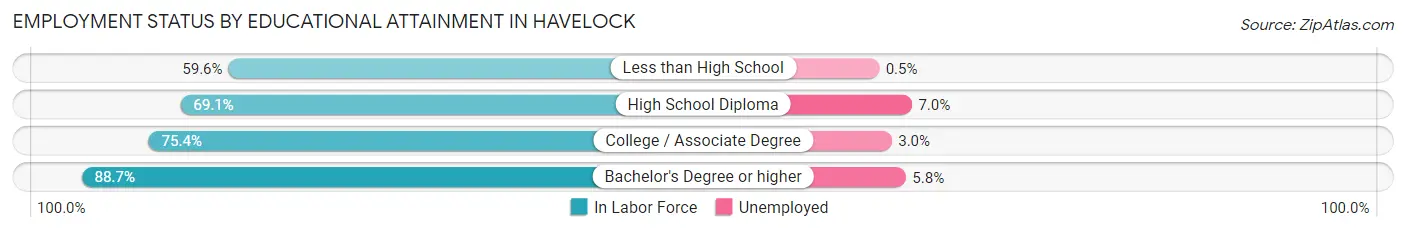
| Educational Attainment | In Labor Force | Unemployed |
| Less than High School | 195 (59.6%) | 2 (0.5%) |
| High School Diploma | 1,334 (69.1%) | 135 (7.0%) |
| College / Associate Degree | 2,422 (75.4%) | 96 (3.0%) |
| Bachelor's Degree or higher | 924 (88.7%) | 60 (5.8%) |
| Total | 4,871 (74.8%) | 293 (4.5%) |
Employment Occupations by Sex in Havelock
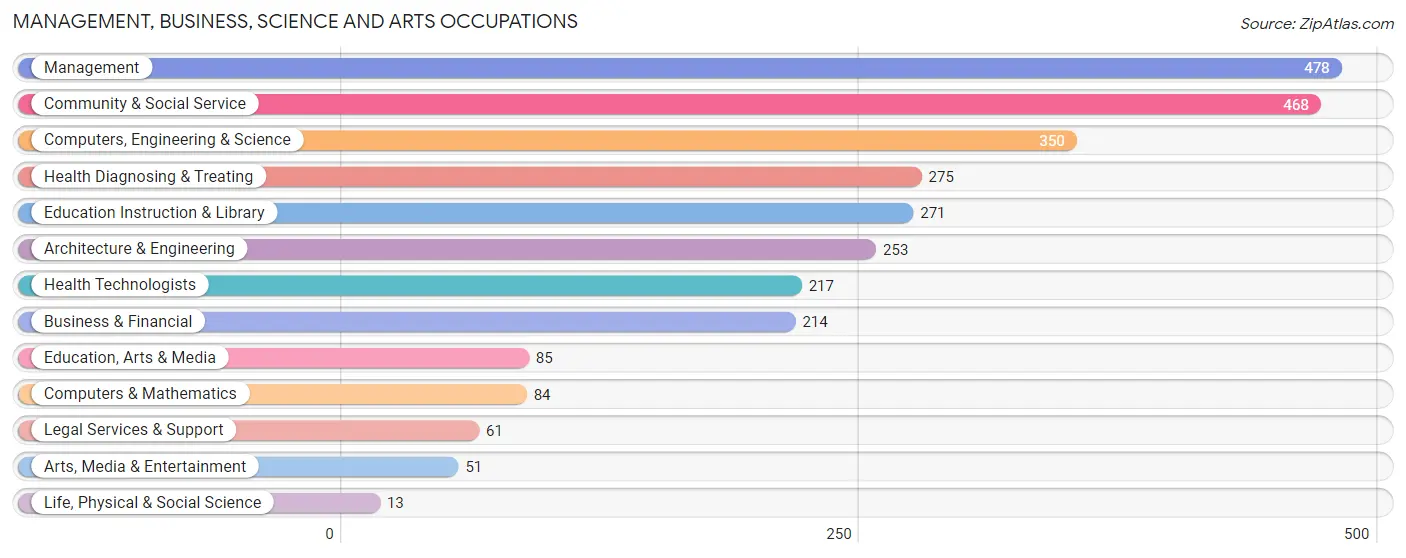
Management, Business, Science and Arts Occupations
The most common Management, Business, Science and Arts occupations in Havelock are Management (478 | 9.2%), Community & Social Service (468 | 9.0%), Computers, Engineering & Science (350 | 6.7%), Health Diagnosing & Treating (275 | 5.3%), and Education Instruction & Library (271 | 5.2%).
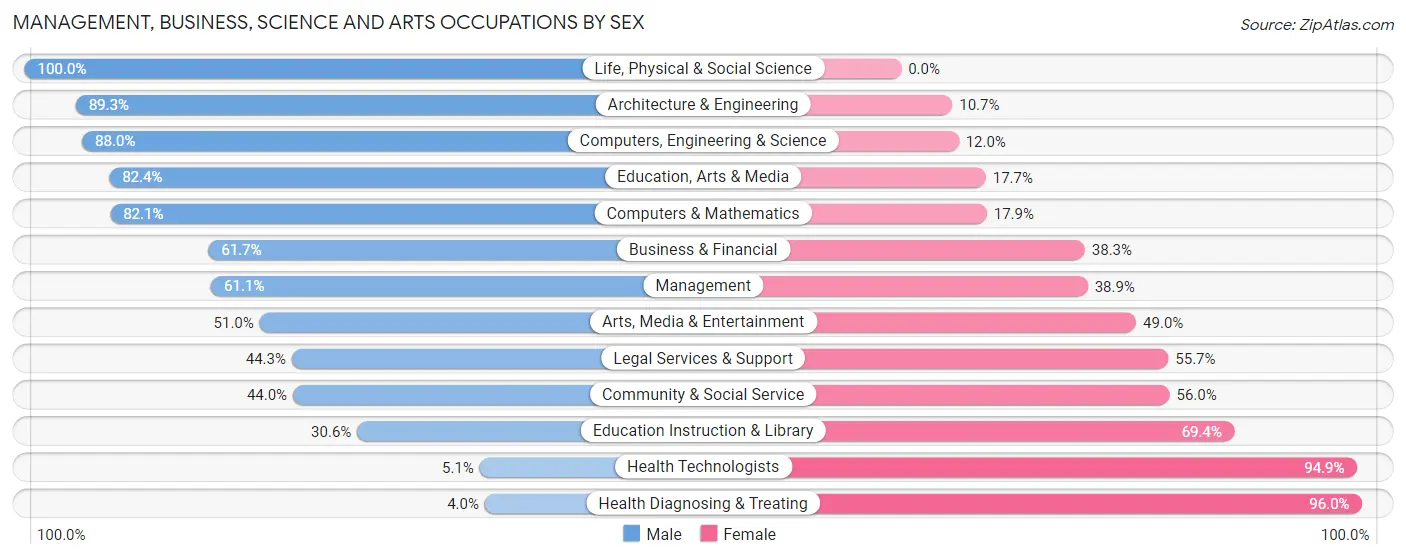
Management, Business, Science and Arts Occupations by Sex
Within the Management, Business, Science and Arts occupations in Havelock, the most male-oriented occupations are Life, Physical & Social Science (100.0%), Architecture & Engineering (89.3%), and Computers, Engineering & Science (88.0%), while the most female-oriented occupations are Health Diagnosing & Treating (96.0%), Health Technologists (94.9%), and Education Instruction & Library (69.4%).
| Occupation | Male | Female |
| Management | 292 (61.1%) | 186 (38.9%) |
| Business & Financial | 132 (61.7%) | 82 (38.3%) |
| Computers, Engineering & Science | 308 (88.0%) | 42 (12.0%) |
| Computers & Mathematics | 69 (82.1%) | 15 (17.9%) |
| Architecture & Engineering | 226 (89.3%) | 27 (10.7%) |
| Life, Physical & Social Science | 13 (100.0%) | 0 (0.0%) |
| Community & Social Service | 206 (44.0%) | 262 (56.0%) |
| Education, Arts & Media | 70 (82.4%) | 15 (17.6%) |
| Legal Services & Support | 27 (44.3%) | 34 (55.7%) |
| Education Instruction & Library | 83 (30.6%) | 188 (69.4%) |
| Arts, Media & Entertainment | 26 (51.0%) | 25 (49.0%) |
| Health Diagnosing & Treating | 11 (4.0%) | 264 (96.0%) |
| Health Technologists | 11 (5.1%) | 206 (94.9%) |
| Total (Category) | 949 (53.2%) | 836 (46.8%) |
| Total (Overall) | 2,680 (51.5%) | 2,523 (48.5%) |
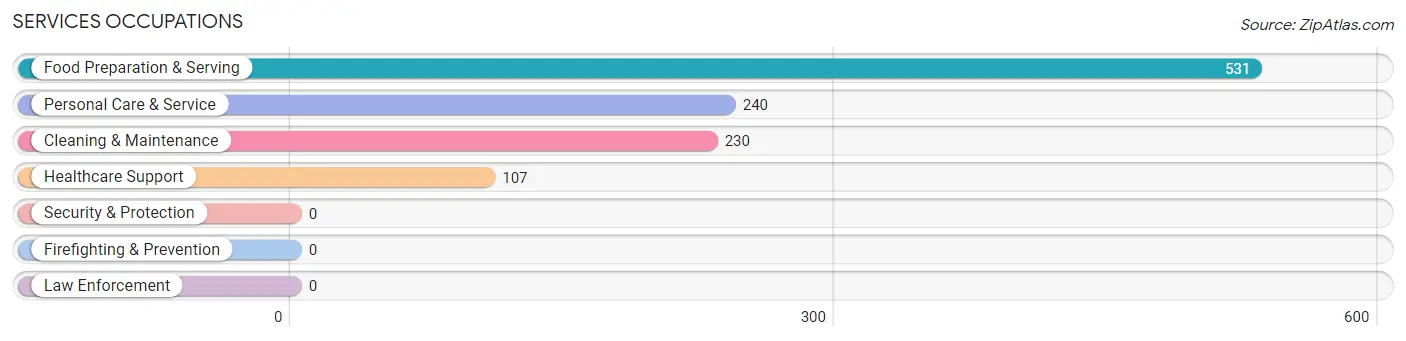
Services Occupations
The most common Services occupations in Havelock are Food Preparation & Serving (531 | 10.2%), Personal Care & Service (240 | 4.6%), Cleaning & Maintenance (230 | 4.4%), and Healthcare Support (107 | 2.1%).
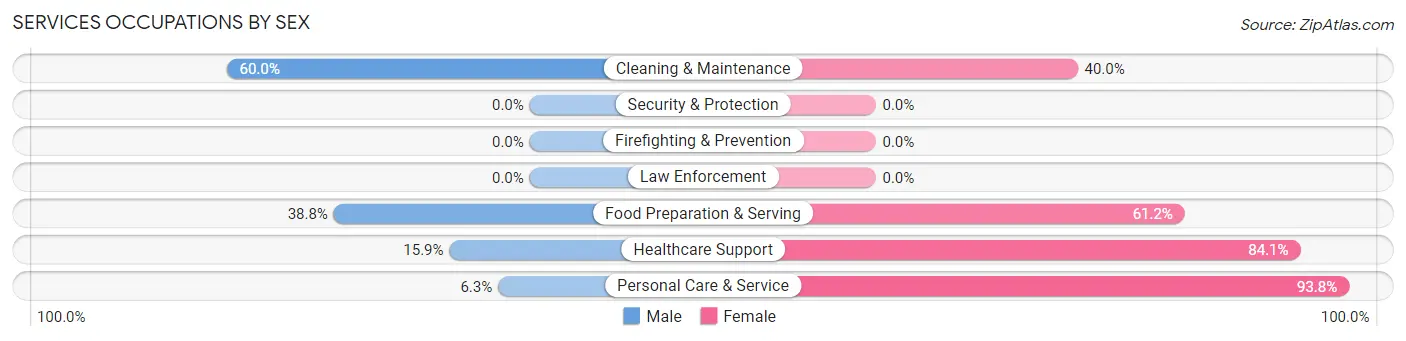
Services Occupations by Sex
Within the Services occupations in Havelock, the most male-oriented occupations are Cleaning & Maintenance (60.0%), Food Preparation & Serving (38.8%), and Healthcare Support (15.9%), while the most female-oriented occupations are Personal Care & Service (93.8%), Healthcare Support (84.1%), and Food Preparation & Serving (61.2%).
| Occupation | Male | Female |
| Healthcare Support | 17 (15.9%) | 90 (84.1%) |
| Security & Protection | 0 (0.0%) | 0 (0.0%) |
| Firefighting & Prevention | 0 (0.0%) | 0 (0.0%) |
| Law Enforcement | 0 (0.0%) | 0 (0.0%) |
| Food Preparation & Serving | 206 (38.8%) | 325 (61.2%) |
| Cleaning & Maintenance | 138 (60.0%) | 92 (40.0%) |
| Personal Care & Service | 15 (6.2%) | 225 (93.8%) |
| Total (Category) | 376 (33.9%) | 732 (66.1%) |
| Total (Overall) | 2,680 (51.5%) | 2,523 (48.5%) |
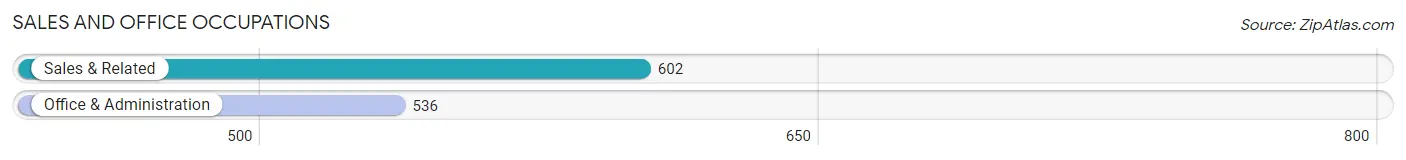
Sales and Office Occupations
The most common Sales and Office occupations in Havelock are Sales & Related (602 | 11.6%), and Office & Administration (536 | 10.3%).
Sales and Office Occupations by Sex
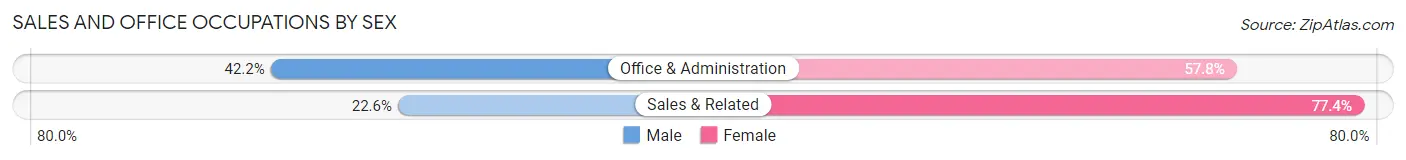
| Occupation | Male | Female |
| Sales & Related | 136 (22.6%) | 466 (77.4%) |
| Office & Administration | 226 (42.2%) | 310 (57.8%) |
| Total (Category) | 362 (31.8%) | 776 (68.2%) |
| Total (Overall) | 2,680 (51.5%) | 2,523 (48.5%) |
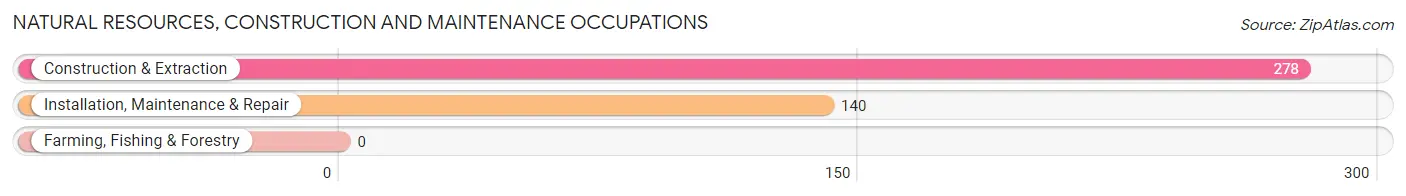
Natural Resources, Construction and Maintenance Occupations
The most common Natural Resources, Construction and Maintenance occupations in Havelock are Construction & Extraction (278 | 5.3%), and Installation, Maintenance & Repair (140 | 2.7%).
Natural Resources, Construction and Maintenance Occupations by Sex
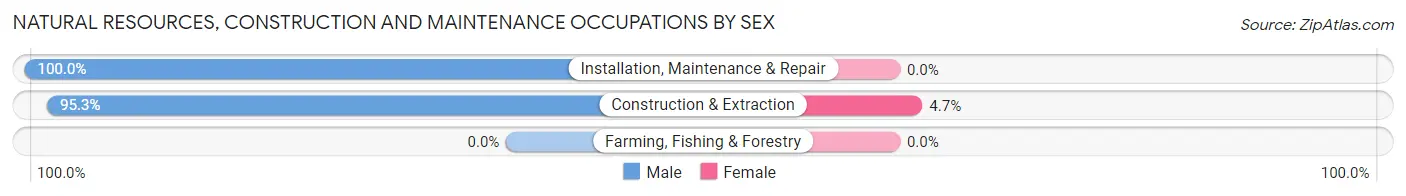
| Occupation | Male | Female |
| Farming, Fishing & Forestry | 0 (0.0%) | 0 (0.0%) |
| Construction & Extraction | 265 (95.3%) | 13 (4.7%) |
| Installation, Maintenance & Repair | 140 (100.0%) | 0 (0.0%) |
| Total (Category) | 405 (96.9%) | 13 (3.1%) |
| Total (Overall) | 2,680 (51.5%) | 2,523 (48.5%) |
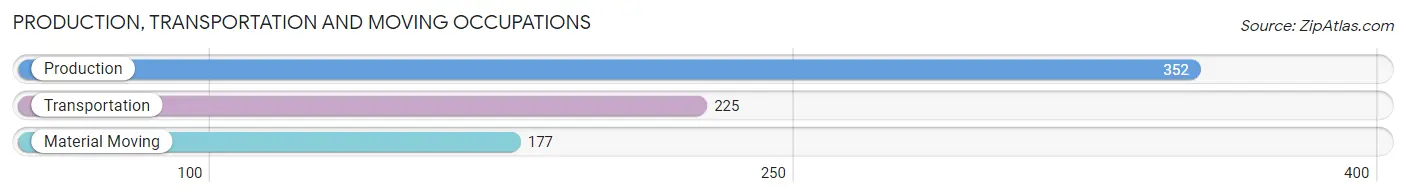
Production, Transportation and Moving Occupations
The most common Production, Transportation and Moving occupations in Havelock are Production (352 | 6.8%), Transportation (225 | 4.3%), and Material Moving (177 | 3.4%).
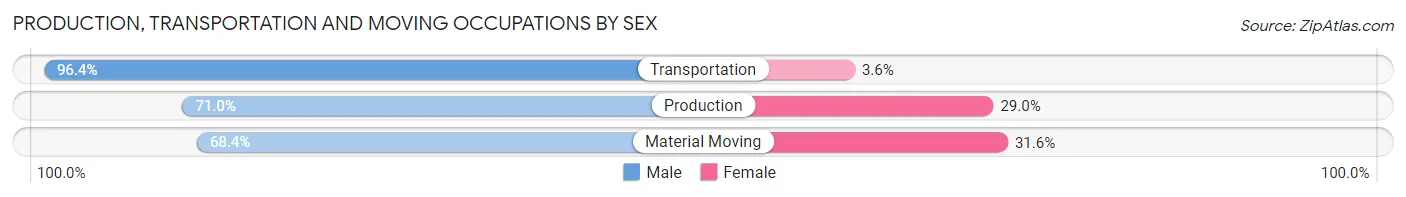
Production, Transportation and Moving Occupations by Sex
| Occupation | Male | Female |
| Production | 250 (71.0%) | 102 (29.0%) |
| Transportation | 217 (96.4%) | 8 (3.6%) |
| Material Moving | 121 (68.4%) | 56 (31.6%) |
| Total (Category) | 588 (78.0%) | 166 (22.0%) |
| Total (Overall) | 2,680 (51.5%) | 2,523 (48.5%) |
Employment Industries by Sex in Havelock
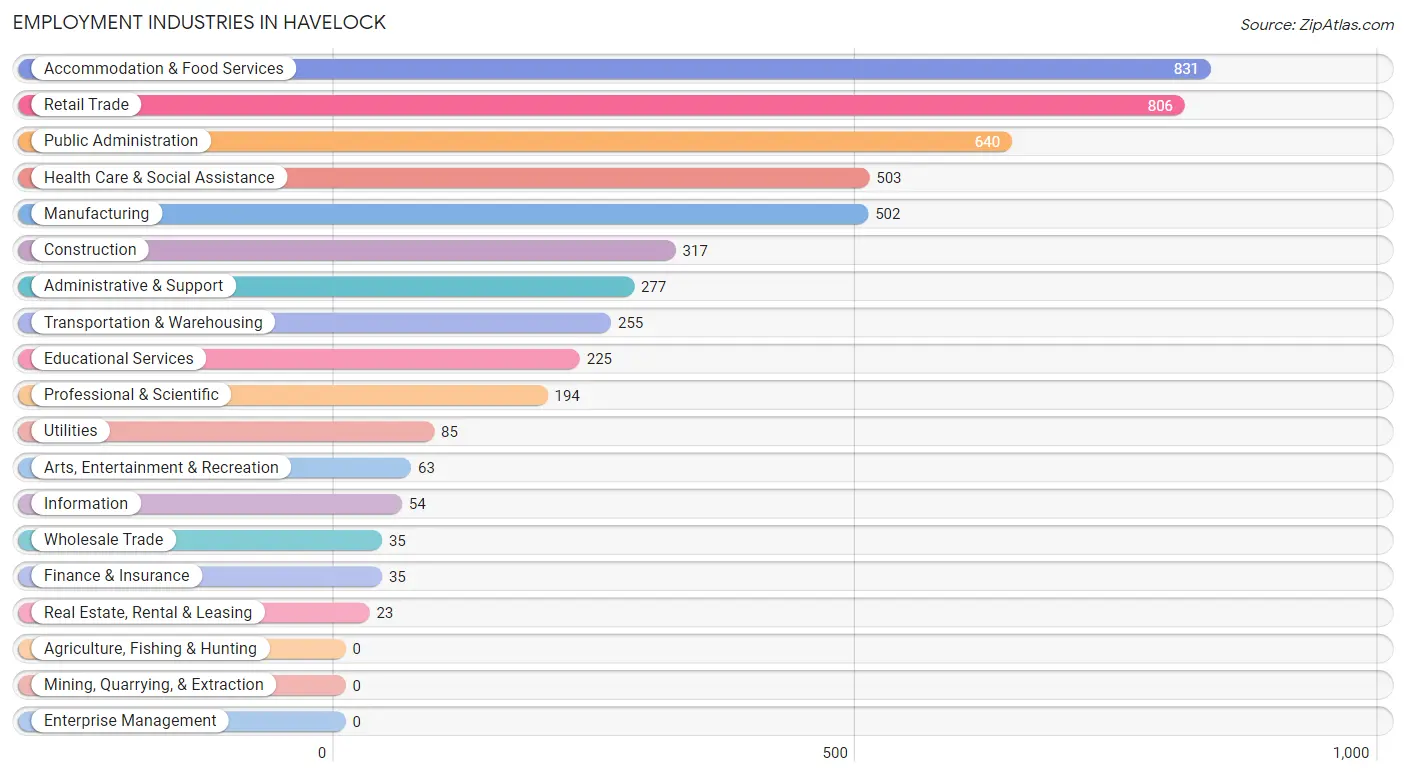
Employment Industries in Havelock
The major employment industries in Havelock include Accommodation & Food Services (831 | 16.0%), Retail Trade (806 | 15.5%), Public Administration (640 | 12.3%), Health Care & Social Assistance (503 | 9.7%), and Manufacturing (502 | 9.7%).
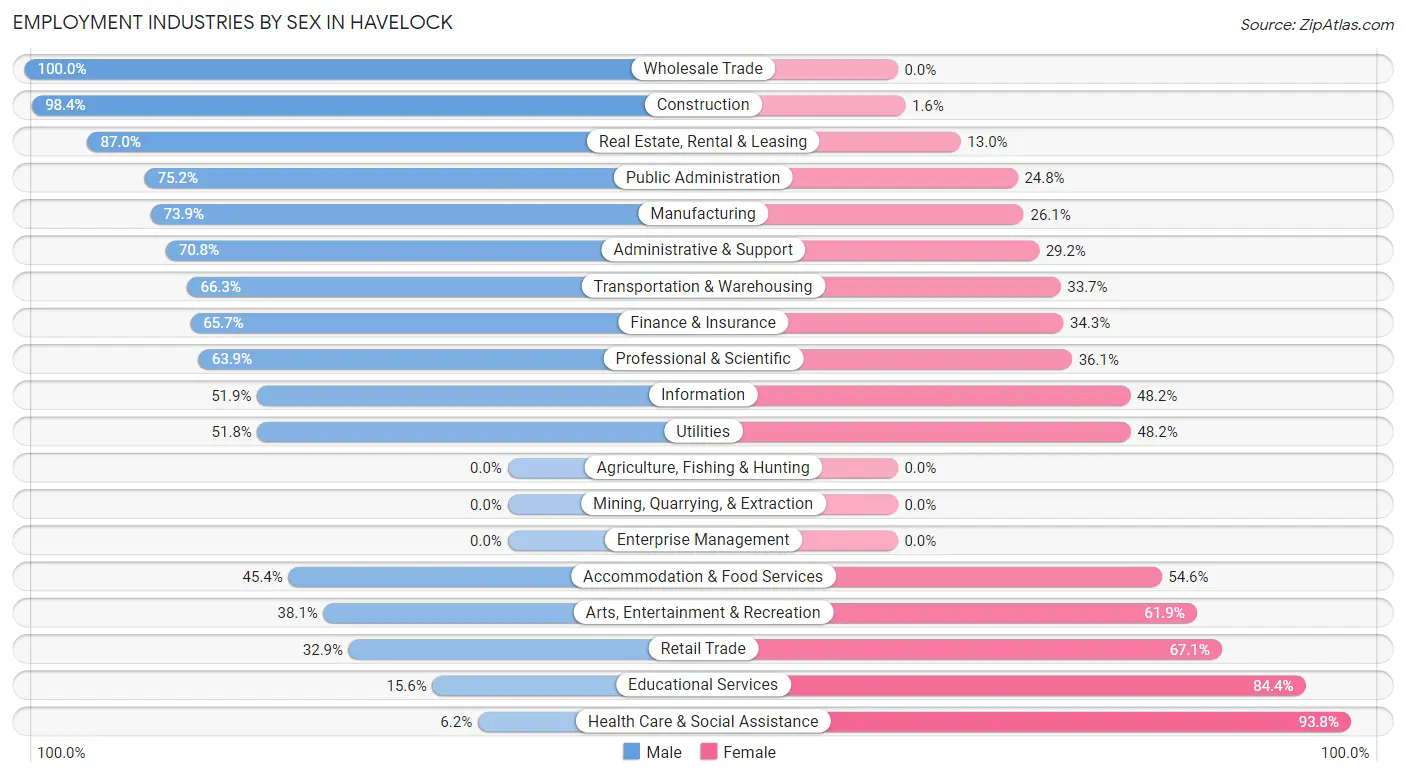
Employment Industries by Sex in Havelock
The Havelock industries that see more men than women are Wholesale Trade (100.0%), Construction (98.4%), and Real Estate, Rental & Leasing (87.0%), whereas the industries that tend to have a higher number of women are Health Care & Social Assistance (93.8%), Educational Services (84.4%), and Retail Trade (67.1%).
| Industry | Male | Female |
| Agriculture, Fishing & Hunting | 0 (0.0%) | 0 (0.0%) |
| Mining, Quarrying, & Extraction | 0 (0.0%) | 0 (0.0%) |
| Construction | 312 (98.4%) | 5 (1.6%) |
| Manufacturing | 371 (73.9%) | 131 (26.1%) |
| Wholesale Trade | 35 (100.0%) | 0 (0.0%) |
| Retail Trade | 265 (32.9%) | 541 (67.1%) |
| Transportation & Warehousing | 169 (66.3%) | 86 (33.7%) |
| Utilities | 44 (51.8%) | 41 (48.2%) |
| Information | 28 (51.8%) | 26 (48.1%) |
| Finance & Insurance | 23 (65.7%) | 12 (34.3%) |
| Real Estate, Rental & Leasing | 20 (87.0%) | 3 (13.0%) |
| Professional & Scientific | 124 (63.9%) | 70 (36.1%) |
| Enterprise Management | 0 (0.0%) | 0 (0.0%) |
| Administrative & Support | 196 (70.8%) | 81 (29.2%) |
| Educational Services | 35 (15.6%) | 190 (84.4%) |
| Health Care & Social Assistance | 31 (6.2%) | 472 (93.8%) |
| Arts, Entertainment & Recreation | 24 (38.1%) | 39 (61.9%) |
| Accommodation & Food Services | 377 (45.4%) | 454 (54.6%) |
| Public Administration | 481 (75.2%) | 159 (24.8%) |
| Total | 2,680 (51.5%) | 2,523 (48.5%) |
Education in Havelock
School Enrollment in Havelock
The most common levels of schooling among the 3,773 students in Havelock are elementary school (1,091 | 28.9%), college / undergraduate (1,059 | 28.1%), and middle school (693 | 18.4%).
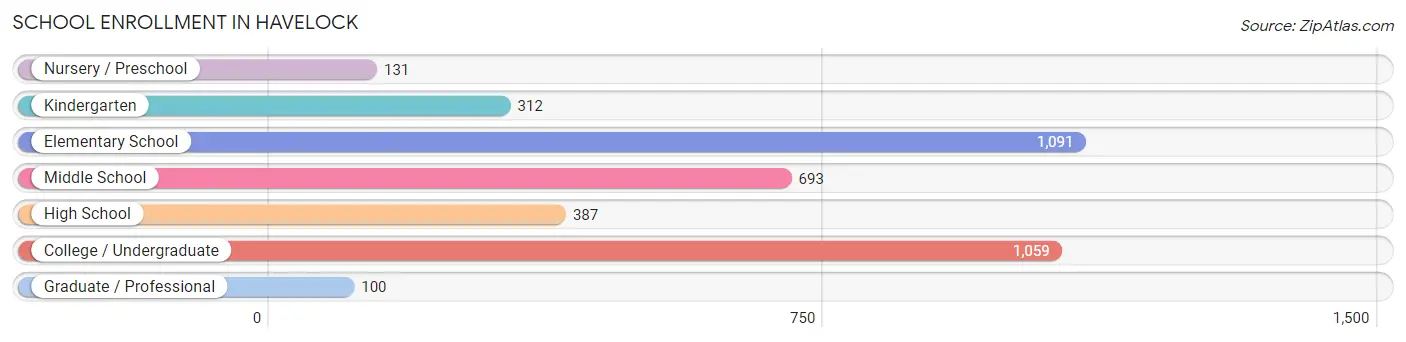
| School Level | # Students | % Students |
| Nursery / Preschool | 131 | 3.5% |
| Kindergarten | 312 | 8.3% |
| Elementary School | 1,091 | 28.9% |
| Middle School | 693 | 18.4% |
| High School | 387 | 10.3% |
| College / Undergraduate | 1,059 | 28.1% |
| Graduate / Professional | 100 | 2.6% |
| Total | 3,773 | 100.0% |
School Enrollment by Age by Funding Source in Havelock
Out of a total of 3,773 students who are enrolled in schools in Havelock, 657 (17.4%) attend a private institution, while the remaining 3,116 (82.6%) are enrolled in public schools. The age group of 35 years and over has the highest likelihood of being enrolled in private schools, with 147 (61.5% in the age bracket) enrolled. Conversely, the age group of 18 to 19 year olds has the lowest likelihood of being enrolled in a private school, with 100 (100.0% in the age bracket) attending a public institution.
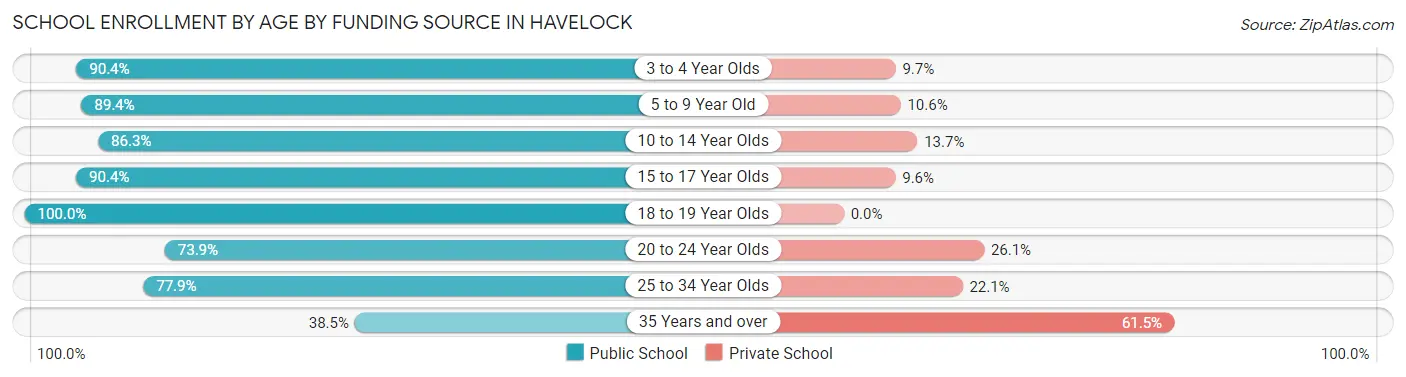
| Age Bracket | Public School | Private School |
| 3 to 4 Year Olds | 103 (90.3%) | 11 (9.7%) |
| 5 to 9 Year Old | 1,073 (89.4%) | 127 (10.6%) |
| 10 to 14 Year Olds | 806 (86.3%) | 128 (13.7%) |
| 15 to 17 Year Olds | 301 (90.4%) | 32 (9.6%) |
| 18 to 19 Year Olds | 100 (100.0%) | 0 (0.0%) |
| 20 to 24 Year Olds | 393 (73.9%) | 139 (26.1%) |
| 25 to 34 Year Olds | 250 (77.9%) | 71 (22.1%) |
| 35 Years and over | 92 (38.5%) | 147 (61.5%) |
| Total | 3,116 (82.6%) | 657 (17.4%) |
Educational Attainment by Field of Study in Havelock
Education (251 | 18.5%), business (186 | 13.7%), arts & humanities (179 | 13.2%), engineering (148 | 10.9%), and bio, nature & agricultural (103 | 7.6%) are the most common fields of study among 1,355 individuals in Havelock who have obtained a bachelor's degree or higher.
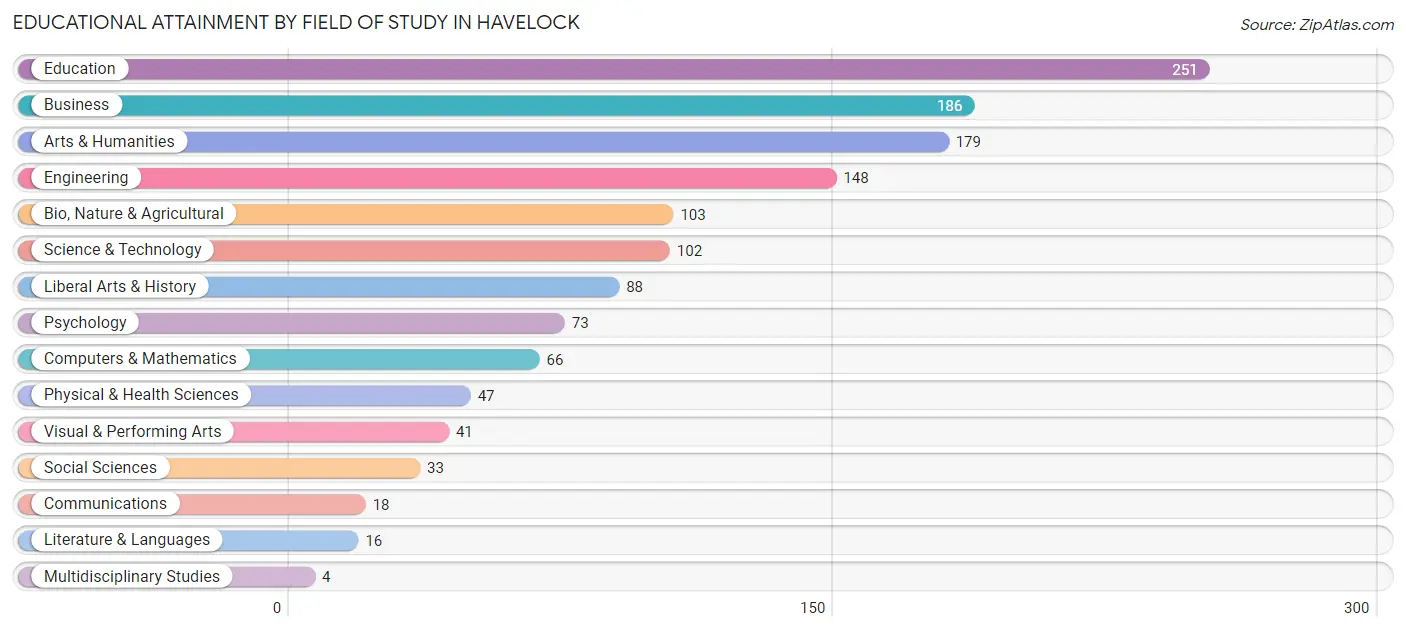
| Field of Study | # Graduates | % Graduates |
| Computers & Mathematics | 66 | 4.9% |
| Bio, Nature & Agricultural | 103 | 7.6% |
| Physical & Health Sciences | 47 | 3.5% |
| Psychology | 73 | 5.4% |
| Social Sciences | 33 | 2.4% |
| Engineering | 148 | 10.9% |
| Multidisciplinary Studies | 4 | 0.3% |
| Science & Technology | 102 | 7.5% |
| Business | 186 | 13.7% |
| Education | 251 | 18.5% |
| Literature & Languages | 16 | 1.2% |
| Liberal Arts & History | 88 | 6.5% |
| Visual & Performing Arts | 41 | 3.0% |
| Communications | 18 | 1.3% |
| Arts & Humanities | 179 | 13.2% |
| Total | 1,355 | 100.0% |
Transportation & Commute in Havelock
Vehicle Availability by Sex in Havelock
The most prevalent vehicle ownership categories in Havelock are males with 2 vehicles (1,842, accounting for 48.8%) and females with 2 vehicles (932, making up 72.7%).
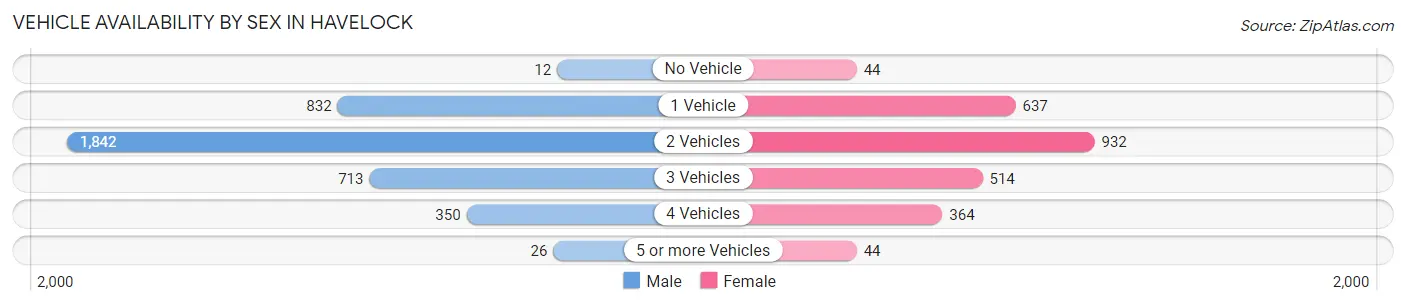
| Vehicles Available | Male | Female |
| No Vehicle | 12 (0.3%) | 44 (1.7%) |
| 1 Vehicle | 832 (22.0%) | 637 (25.1%) |
| 2 Vehicles | 1,842 (48.8%) | 932 (36.8%) |
| 3 Vehicles | 713 (18.9%) | 514 (20.3%) |
| 4 Vehicles | 350 (9.3%) | 364 (14.4%) |
| 5 or more Vehicles | 26 (0.7%) | 44 (1.7%) |
| Total | 3,775 (100.0%) | 2,535 (100.0%) |
Commute Time in Havelock
The most frequently occuring commute durations in Havelock are 5 to 9 minutes (2,376 commuters, 26.8%), 10 to 14 minutes (2,054 commuters, 23.2%), and 30 to 34 minutes (1,097 commuters, 12.4%).
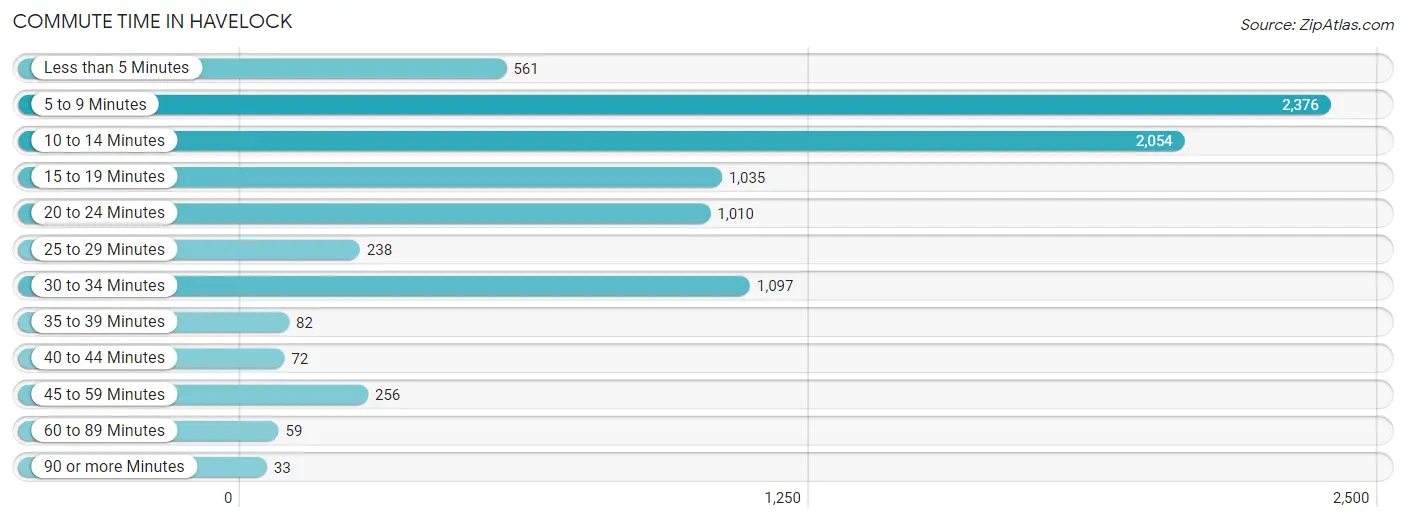
| Commute Time | # Commuters | % Commuters |
| Less than 5 Minutes | 561 | 6.3% |
| 5 to 9 Minutes | 2,376 | 26.8% |
| 10 to 14 Minutes | 2,054 | 23.2% |
| 15 to 19 Minutes | 1,035 | 11.7% |
| 20 to 24 Minutes | 1,010 | 11.4% |
| 25 to 29 Minutes | 238 | 2.7% |
| 30 to 34 Minutes | 1,097 | 12.4% |
| 35 to 39 Minutes | 82 | 0.9% |
| 40 to 44 Minutes | 72 | 0.8% |
| 45 to 59 Minutes | 256 | 2.9% |
| 60 to 89 Minutes | 59 | 0.7% |
| 90 or more Minutes | 33 | 0.4% |
Commute Time by Sex in Havelock
The most common commute times in Havelock are 5 to 9 minutes (1,937 commuters, 30.8%) for males and 30 to 34 minutes (669 commuters, 26.0%) for females.
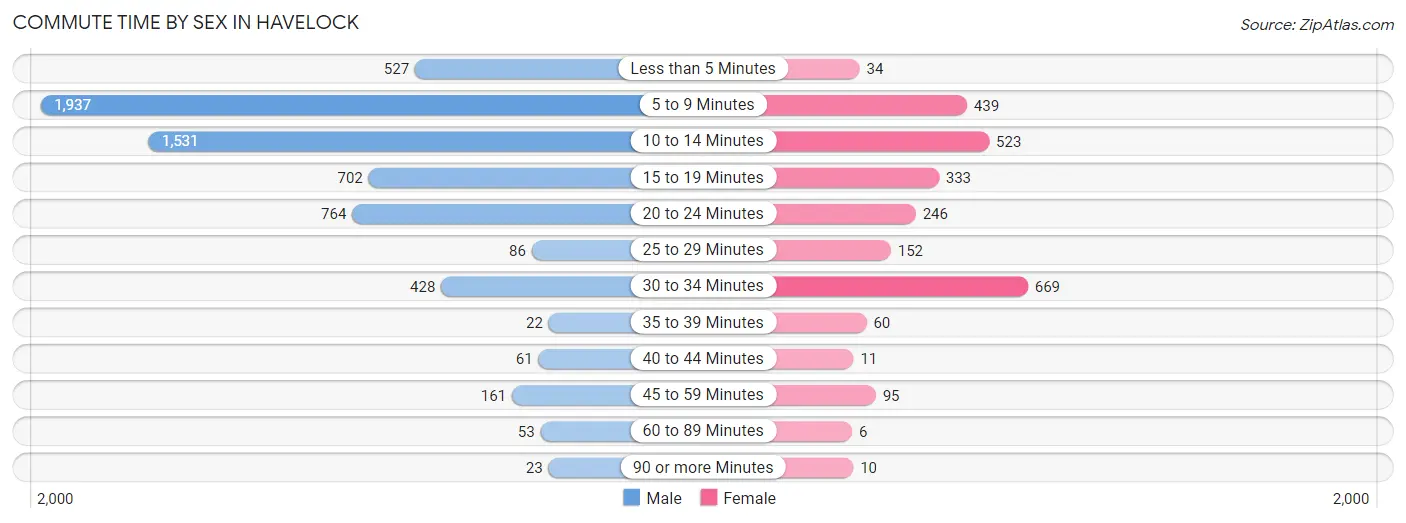
| Commute Time | Male | Female |
| Less than 5 Minutes | 527 (8.4%) | 34 (1.3%) |
| 5 to 9 Minutes | 1,937 (30.8%) | 439 (17.0%) |
| 10 to 14 Minutes | 1,531 (24.3%) | 523 (20.3%) |
| 15 to 19 Minutes | 702 (11.2%) | 333 (12.9%) |
| 20 to 24 Minutes | 764 (12.1%) | 246 (9.5%) |
| 25 to 29 Minutes | 86 (1.4%) | 152 (5.9%) |
| 30 to 34 Minutes | 428 (6.8%) | 669 (26.0%) |
| 35 to 39 Minutes | 22 (0.4%) | 60 (2.3%) |
| 40 to 44 Minutes | 61 (1.0%) | 11 (0.4%) |
| 45 to 59 Minutes | 161 (2.6%) | 95 (3.7%) |
| 60 to 89 Minutes | 53 (0.8%) | 6 (0.2%) |
| 90 or more Minutes | 23 (0.4%) | 10 (0.4%) |
Time of Departure to Work by Sex in Havelock
The most frequent times of departure to work in Havelock are 7:00 AM to 7:29 AM (1,656, 26.3%) for males and 7:00 AM to 7:29 AM (443, 17.2%) for females.
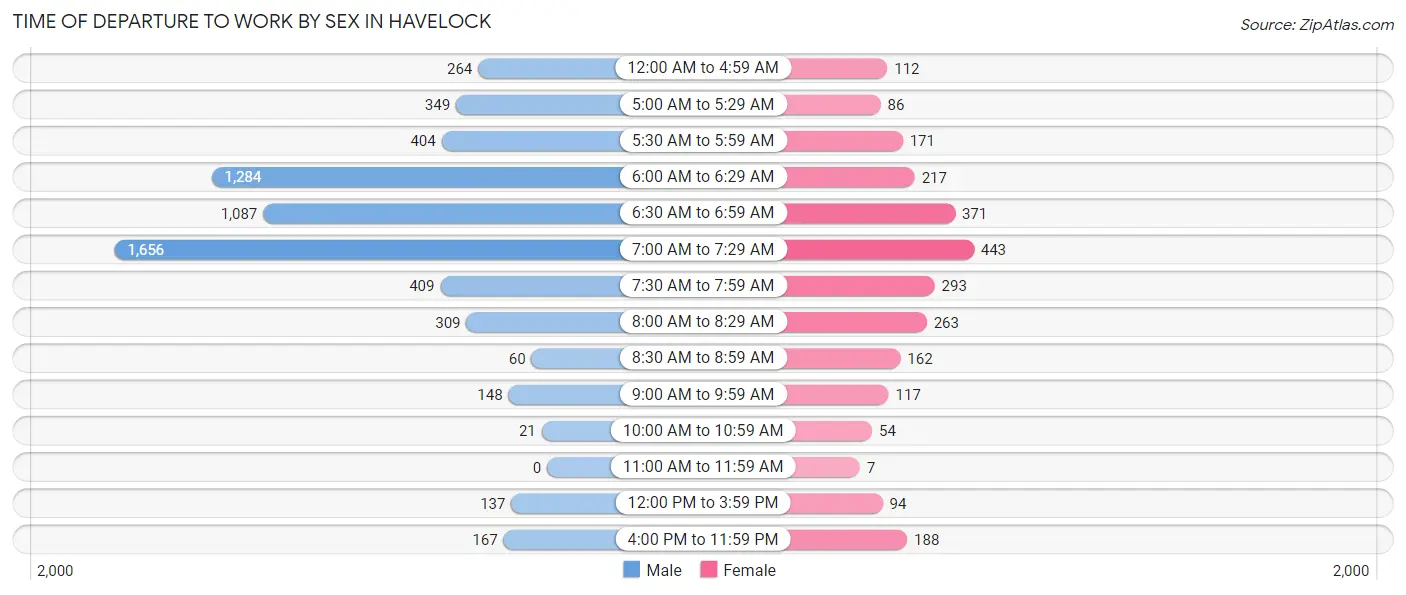
| Time of Departure | Male | Female |
| 12:00 AM to 4:59 AM | 264 (4.2%) | 112 (4.3%) |
| 5:00 AM to 5:29 AM | 349 (5.5%) | 86 (3.3%) |
| 5:30 AM to 5:59 AM | 404 (6.4%) | 171 (6.6%) |
| 6:00 AM to 6:29 AM | 1,284 (20.4%) | 217 (8.4%) |
| 6:30 AM to 6:59 AM | 1,087 (17.3%) | 371 (14.4%) |
| 7:00 AM to 7:29 AM | 1,656 (26.3%) | 443 (17.2%) |
| 7:30 AM to 7:59 AM | 409 (6.5%) | 293 (11.4%) |
| 8:00 AM to 8:29 AM | 309 (4.9%) | 263 (10.2%) |
| 8:30 AM to 8:59 AM | 60 (0.9%) | 162 (6.3%) |
| 9:00 AM to 9:59 AM | 148 (2.4%) | 117 (4.5%) |
| 10:00 AM to 10:59 AM | 21 (0.3%) | 54 (2.1%) |
| 11:00 AM to 11:59 AM | 0 (0.0%) | 7 (0.3%) |
| 12:00 PM to 3:59 PM | 137 (2.2%) | 94 (3.6%) |
| 4:00 PM to 11:59 PM | 167 (2.6%) | 188 (7.3%) |
| Total | 6,295 (100.0%) | 2,578 (100.0%) |
Housing Occupancy in Havelock
Occupancy by Ownership in Havelock
Of the total 5,153 dwellings in Havelock, owner-occupied units account for 2,176 (42.2%), while renter-occupied units make up 2,977 (57.8%).
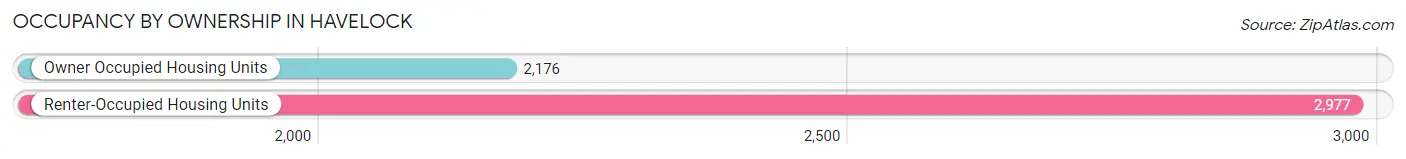
| Occupancy | # Housing Units | % Housing Units |
| Owner Occupied Housing Units | 2,176 | 42.2% |
| Renter-Occupied Housing Units | 2,977 | 57.8% |
| Total Occupied Housing Units | 5,153 | 100.0% |
Occupancy by Household Size in Havelock
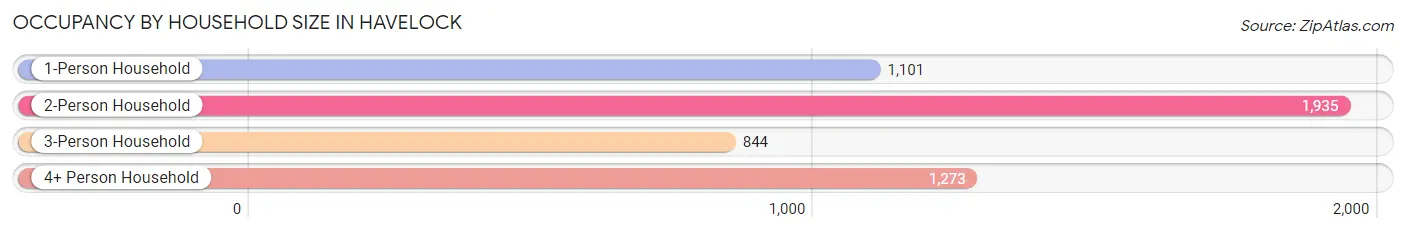
| Household Size | # Housing Units | % Housing Units |
| 1-Person Household | 1,101 | 21.4% |
| 2-Person Household | 1,935 | 37.6% |
| 3-Person Household | 844 | 16.4% |
| 4+ Person Household | 1,273 | 24.7% |
| Total Housing Units | 5,153 | 100.0% |
Occupancy by Ownership by Household Size in Havelock
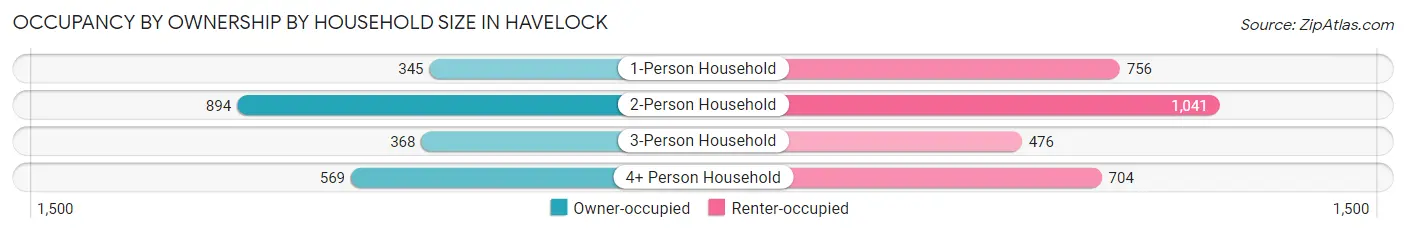
| Household Size | Owner-occupied | Renter-occupied |
| 1-Person Household | 345 (31.3%) | 756 (68.7%) |
| 2-Person Household | 894 (46.2%) | 1,041 (53.8%) |
| 3-Person Household | 368 (43.6%) | 476 (56.4%) |
| 4+ Person Household | 569 (44.7%) | 704 (55.3%) |
| Total Housing Units | 2,176 (42.2%) | 2,977 (57.8%) |
Occupancy by Educational Attainment in Havelock
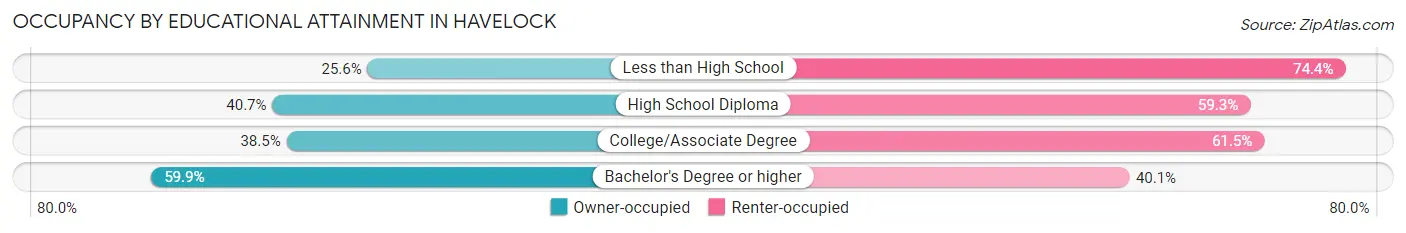
| Household Size | Owner-occupied | Renter-occupied |
| Less than High School | 64 (25.6%) | 186 (74.4%) |
| High School Diploma | 591 (40.7%) | 861 (59.3%) |
| College/Associate Degree | 980 (38.5%) | 1,568 (61.5%) |
| Bachelor's Degree or higher | 541 (59.9%) | 362 (40.1%) |
Occupancy by Age of Householder in Havelock
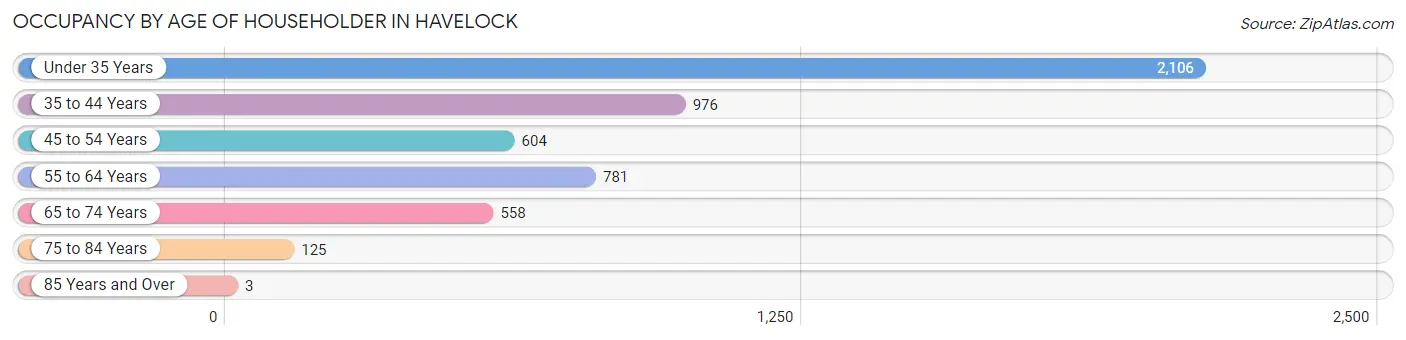
| Age Bracket | # Households | % Households |
| Under 35 Years | 2,106 | 40.9% |
| 35 to 44 Years | 976 | 18.9% |
| 45 to 54 Years | 604 | 11.7% |
| 55 to 64 Years | 781 | 15.2% |
| 65 to 74 Years | 558 | 10.8% |
| 75 to 84 Years | 125 | 2.4% |
| 85 Years and Over | 3 | 0.1% |
| Total | 5,153 | 100.0% |
Housing Finances in Havelock
Median Income by Occupancy in Havelock
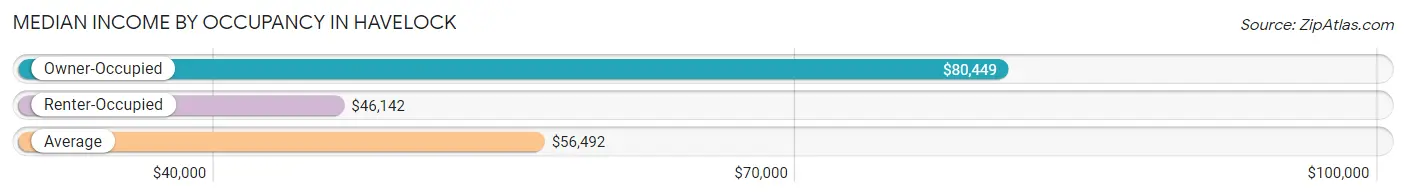
| Occupancy Type | # Households | Median Income |
| Owner-Occupied | 2,176 (42.2%) | $80,449 |
| Renter-Occupied | 2,977 (57.8%) | $46,142 |
| Average | 5,153 (100.0%) | $56,492 |
Occupancy by Householder Income Bracket in Havelock
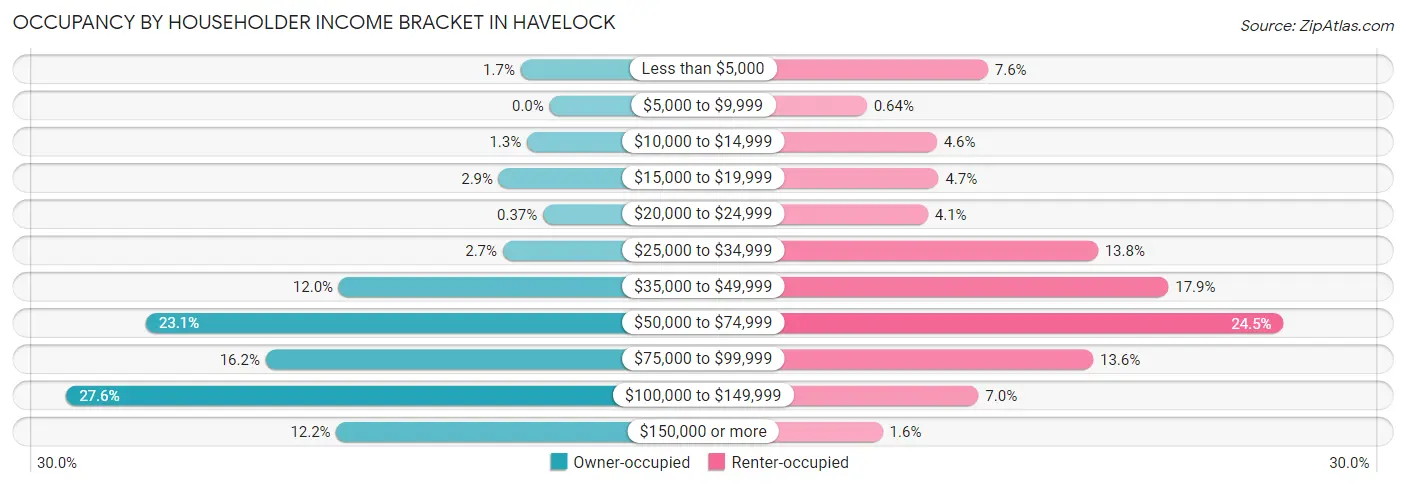
| Income Bracket | Owner-occupied | Renter-occupied |
| Less than $5,000 | 36 (1.7%) | 225 (7.6%) |
| $5,000 to $9,999 | 0 (0.0%) | 19 (0.6%) |
| $10,000 to $14,999 | 28 (1.3%) | 138 (4.6%) |
| $15,000 to $19,999 | 63 (2.9%) | 141 (4.7%) |
| $20,000 to $24,999 | 8 (0.4%) | 123 (4.1%) |
| $25,000 to $34,999 | 58 (2.7%) | 412 (13.8%) |
| $35,000 to $49,999 | 262 (12.0%) | 532 (17.9%) |
| $50,000 to $74,999 | 502 (23.1%) | 728 (24.4%) |
| $75,000 to $99,999 | 353 (16.2%) | 404 (13.6%) |
| $100,000 to $149,999 | 601 (27.6%) | 209 (7.0%) |
| $150,000 or more | 265 (12.2%) | 46 (1.5%) |
| Total | 2,176 (100.0%) | 2,977 (100.0%) |
Monthly Housing Cost Tiers in Havelock
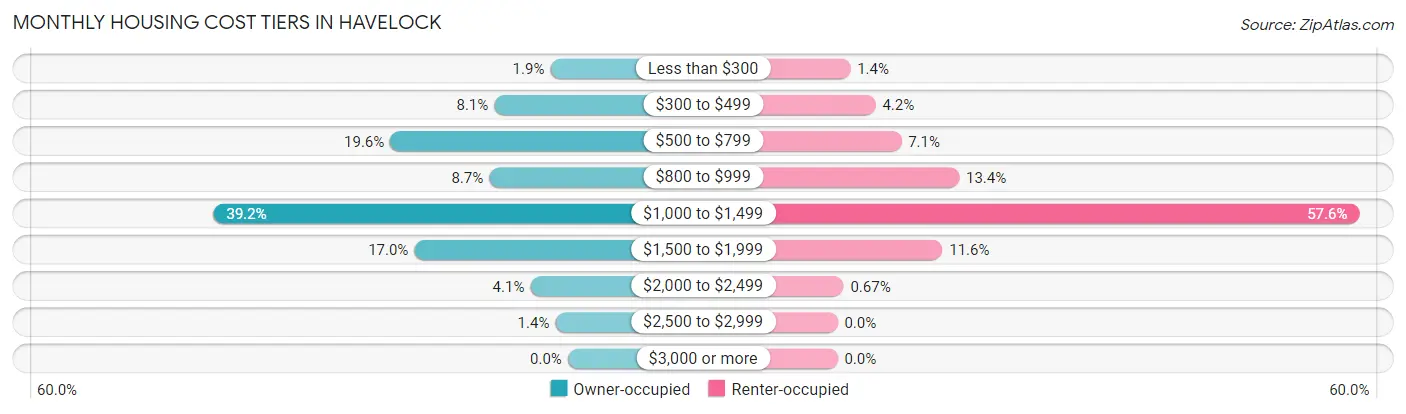
| Monthly Cost | Owner-occupied | Renter-occupied |
| Less than $300 | 42 (1.9%) | 42 (1.4%) |
| $300 to $499 | 177 (8.1%) | 125 (4.2%) |
| $500 to $799 | 427 (19.6%) | 210 (7.0%) |
| $800 to $999 | 189 (8.7%) | 400 (13.4%) |
| $1,000 to $1,499 | 852 (39.2%) | 1,716 (57.6%) |
| $1,500 to $1,999 | 369 (17.0%) | 345 (11.6%) |
| $2,000 to $2,499 | 90 (4.1%) | 20 (0.7%) |
| $2,500 to $2,999 | 30 (1.4%) | 0 (0.0%) |
| $3,000 or more | 0 (0.0%) | 0 (0.0%) |
| Total | 2,176 (100.0%) | 2,977 (100.0%) |
Physical Housing Characteristics in Havelock
Housing Structures in Havelock
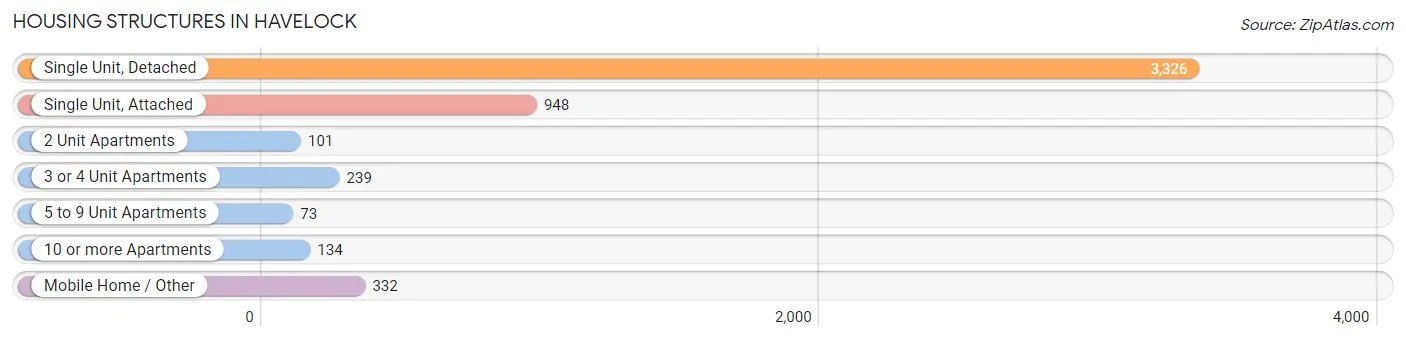
| Structure Type | # Housing Units | % Housing Units |
| Single Unit, Detached | 3,326 | 64.5% |
| Single Unit, Attached | 948 | 18.4% |
| 2 Unit Apartments | 101 | 2.0% |
| 3 or 4 Unit Apartments | 239 | 4.6% |
| 5 to 9 Unit Apartments | 73 | 1.4% |
| 10 or more Apartments | 134 | 2.6% |
| Mobile Home / Other | 332 | 6.4% |
| Total | 5,153 | 100.0% |
Housing Structures by Occupancy in Havelock
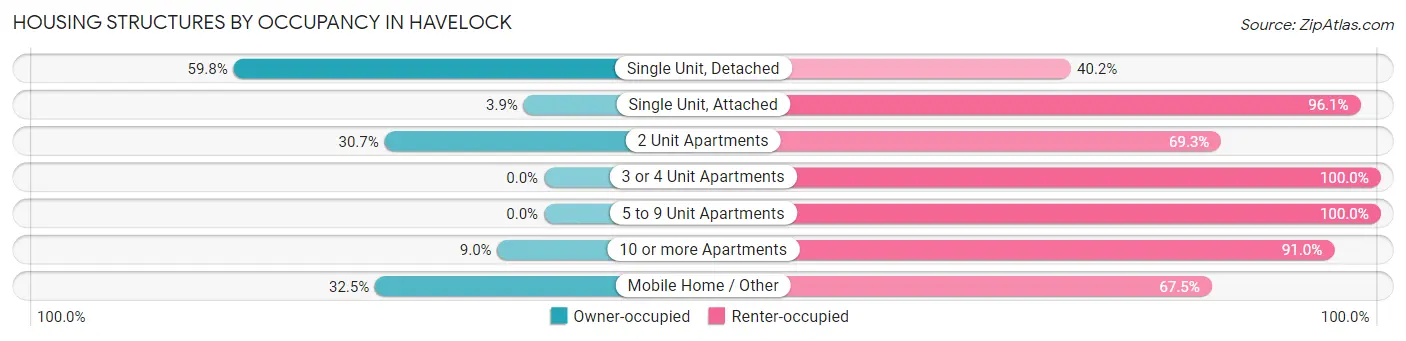
| Structure Type | Owner-occupied | Renter-occupied |
| Single Unit, Detached | 1,988 (59.8%) | 1,338 (40.2%) |
| Single Unit, Attached | 37 (3.9%) | 911 (96.1%) |
| 2 Unit Apartments | 31 (30.7%) | 70 (69.3%) |
| 3 or 4 Unit Apartments | 0 (0.0%) | 239 (100.0%) |
| 5 to 9 Unit Apartments | 0 (0.0%) | 73 (100.0%) |
| 10 or more Apartments | 12 (9.0%) | 122 (91.0%) |
| Mobile Home / Other | 108 (32.5%) | 224 (67.5%) |
| Total | 2,176 (42.2%) | 2,977 (57.8%) |
Housing Structures by Number of Rooms in Havelock
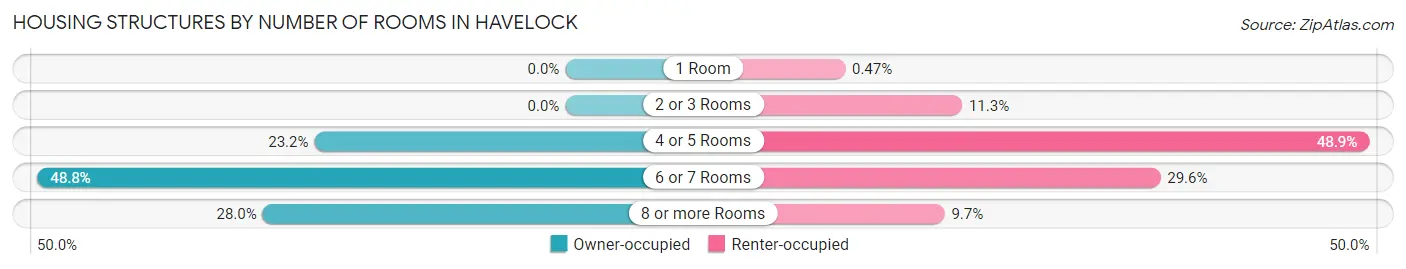
| Number of Rooms | Owner-occupied | Renter-occupied |
| 1 Room | 0 (0.0%) | 14 (0.5%) |
| 2 or 3 Rooms | 0 (0.0%) | 336 (11.3%) |
| 4 or 5 Rooms | 505 (23.2%) | 1,457 (48.9%) |
| 6 or 7 Rooms | 1,062 (48.8%) | 882 (29.6%) |
| 8 or more Rooms | 609 (28.0%) | 288 (9.7%) |
| Total | 2,176 (100.0%) | 2,977 (100.0%) |
Housing Structure by Heating Type in Havelock
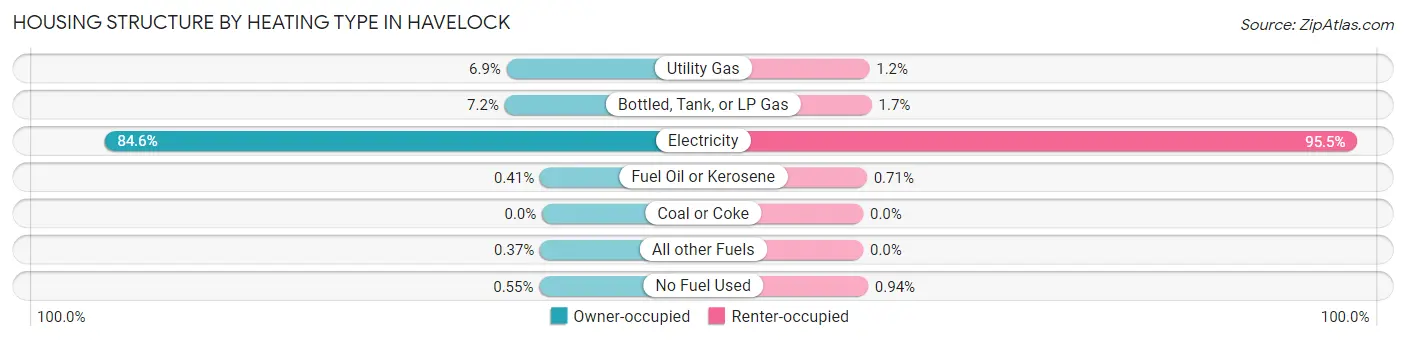
| Heating Type | Owner-occupied | Renter-occupied |
| Utility Gas | 149 (6.9%) | 36 (1.2%) |
| Bottled, Tank, or LP Gas | 157 (7.2%) | 49 (1.7%) |
| Electricity | 1,841 (84.6%) | 2,843 (95.5%) |
| Fuel Oil or Kerosene | 9 (0.4%) | 21 (0.7%) |
| Coal or Coke | 0 (0.0%) | 0 (0.0%) |
| All other Fuels | 8 (0.4%) | 0 (0.0%) |
| No Fuel Used | 12 (0.5%) | 28 (0.9%) |
| Total | 2,176 (100.0%) | 2,977 (100.0%) |
Household Vehicle Usage in Havelock
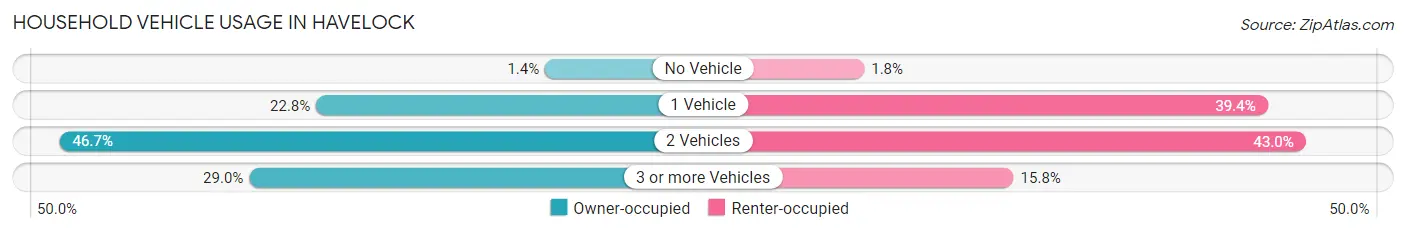
| Vehicles per Household | Owner-occupied | Renter-occupied |
| No Vehicle | 31 (1.4%) | 54 (1.8%) |
| 1 Vehicle | 496 (22.8%) | 1,174 (39.4%) |
| 2 Vehicles | 1,017 (46.7%) | 1,280 (43.0%) |
| 3 or more Vehicles | 632 (29.0%) | 469 (15.8%) |
| Total | 2,176 (100.0%) | 2,977 (100.0%) |
Real Estate & Mortgages in Havelock
Real Estate and Mortgage Overview in Havelock
| Characteristic | Without Mortgage | With Mortgage |
| Housing Units | 537 | 1,639 |
| Median Property Value | $159,800 | $172,200 |
| Median Household Income | $91,382 | $202 |
| Monthly Housing Costs | $543 | $0 |
| Real Estate Taxes | $1,747 | $79 |
Property Value by Mortgage Status in Havelock
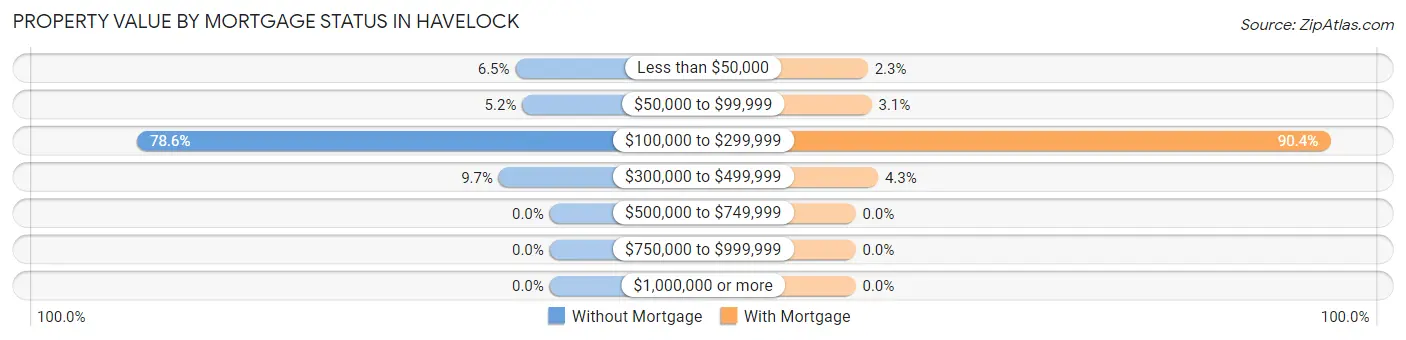
| Property Value | Without Mortgage | With Mortgage |
| Less than $50,000 | 35 (6.5%) | 38 (2.3%) |
| $50,000 to $99,999 | 28 (5.2%) | 50 (3.0%) |
| $100,000 to $299,999 | 422 (78.6%) | 1,481 (90.4%) |
| $300,000 to $499,999 | 52 (9.7%) | 70 (4.3%) |
| $500,000 to $749,999 | 0 (0.0%) | 0 (0.0%) |
| $750,000 to $999,999 | 0 (0.0%) | 0 (0.0%) |
| $1,000,000 or more | 0 (0.0%) | 0 (0.0%) |
| Total | 537 (100.0%) | 1,639 (100.0%) |
Household Income by Mortgage Status in Havelock
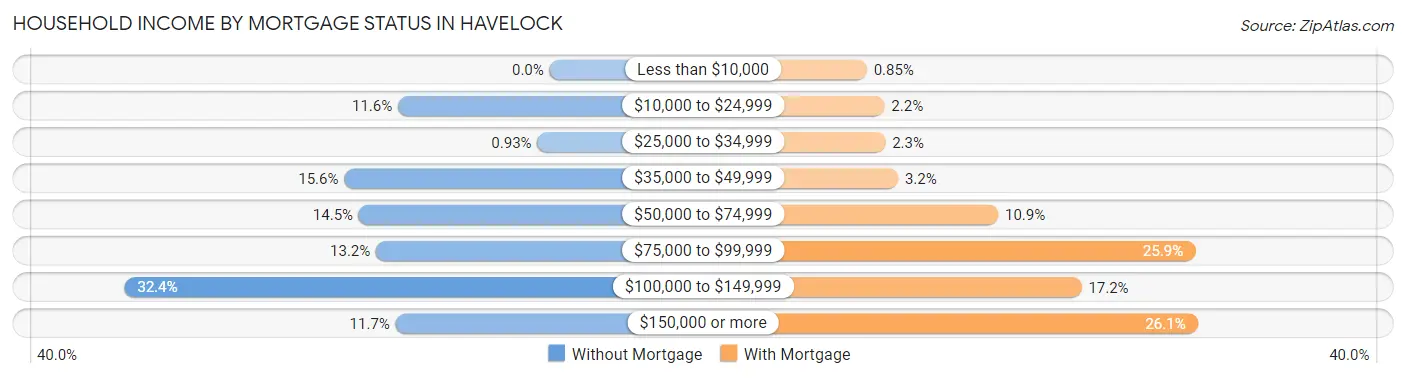
| Household Income | Without Mortgage | With Mortgage |
| Less than $10,000 | 0 (0.0%) | 14 (0.9%) |
| $10,000 to $24,999 | 62 (11.6%) | 36 (2.2%) |
| $25,000 to $34,999 | 5 (0.9%) | 37 (2.3%) |
| $35,000 to $49,999 | 84 (15.6%) | 53 (3.2%) |
| $50,000 to $74,999 | 78 (14.5%) | 178 (10.9%) |
| $75,000 to $99,999 | 71 (13.2%) | 424 (25.9%) |
| $100,000 to $149,999 | 174 (32.4%) | 282 (17.2%) |
| $150,000 or more | 63 (11.7%) | 427 (26.1%) |
| Total | 537 (100.0%) | 1,639 (100.0%) |
Property Value to Household Income Ratio in Havelock
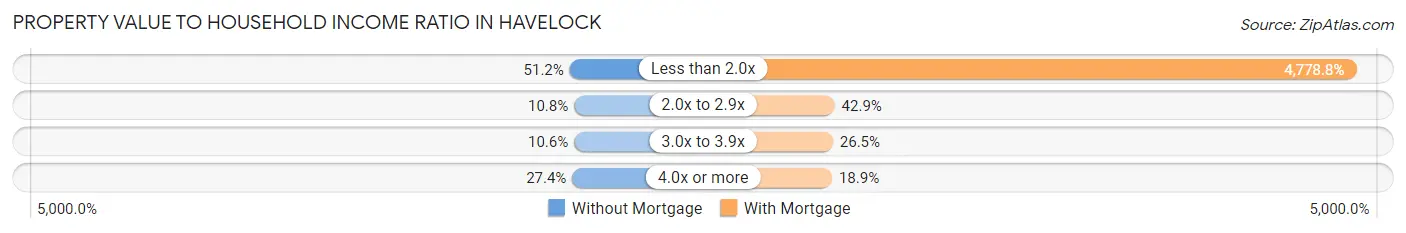
| Value-to-Income Ratio | Without Mortgage | With Mortgage |
| Less than 2.0x | 275 (51.2%) | 78,324 (4,778.8%) |
| 2.0x to 2.9x | 58 (10.8%) | 703 (42.9%) |
| 3.0x to 3.9x | 57 (10.6%) | 435 (26.5%) |
| 4.0x or more | 147 (27.4%) | 309 (18.9%) |
| Total | 537 (100.0%) | 1,639 (100.0%) |
Real Estate Taxes by Mortgage Status in Havelock
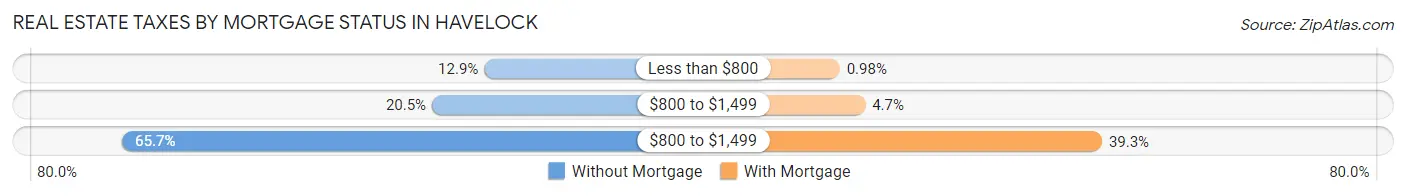
| Property Taxes | Without Mortgage | With Mortgage |
| Less than $800 | 69 (12.9%) | 16 (1.0%) |
| $800 to $1,499 | 110 (20.5%) | 77 (4.7%) |
| $800 to $1,499 | 353 (65.7%) | 644 (39.3%) |
| Total | 537 (100.0%) | 1,639 (100.0%) |
Health & Disability in Havelock
Health Insurance Coverage by Age in Havelock
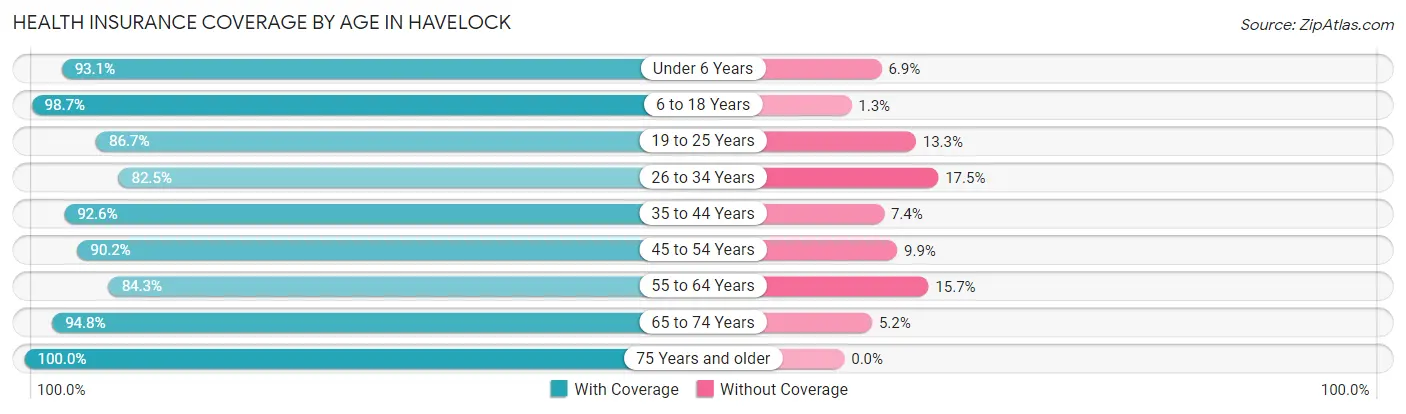
| Age Bracket | With Coverage | Without Coverage |
| Under 6 Years | 1,666 (93.1%) | 124 (6.9%) |
| 6 to 18 Years | 2,400 (98.7%) | 32 (1.3%) |
| 19 to 25 Years | 1,806 (86.7%) | 278 (13.3%) |
| 26 to 34 Years | 1,361 (82.5%) | 289 (17.5%) |
| 35 to 44 Years | 1,352 (92.6%) | 108 (7.4%) |
| 45 to 54 Years | 732 (90.1%) | 80 (9.9%) |
| 55 to 64 Years | 1,150 (84.3%) | 214 (15.7%) |
| 65 to 74 Years | 717 (94.8%) | 39 (5.2%) |
| 75 Years and older | 218 (100.0%) | 0 (0.0%) |
| Total | 11,402 (90.7%) | 1,164 (9.3%) |
Health Insurance Coverage by Citizenship Status in Havelock
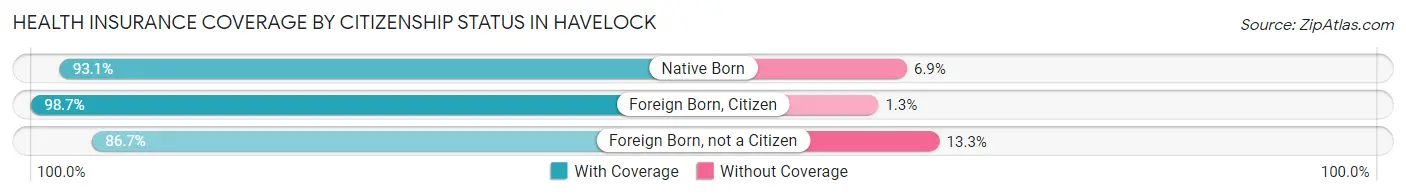
| Citizenship Status | With Coverage | Without Coverage |
| Native Born | 1,666 (93.1%) | 124 (6.9%) |
| Foreign Born, Citizen | 2,400 (98.7%) | 32 (1.3%) |
| Foreign Born, not a Citizen | 1,806 (86.7%) | 278 (13.3%) |
Health Insurance Coverage by Household Income in Havelock
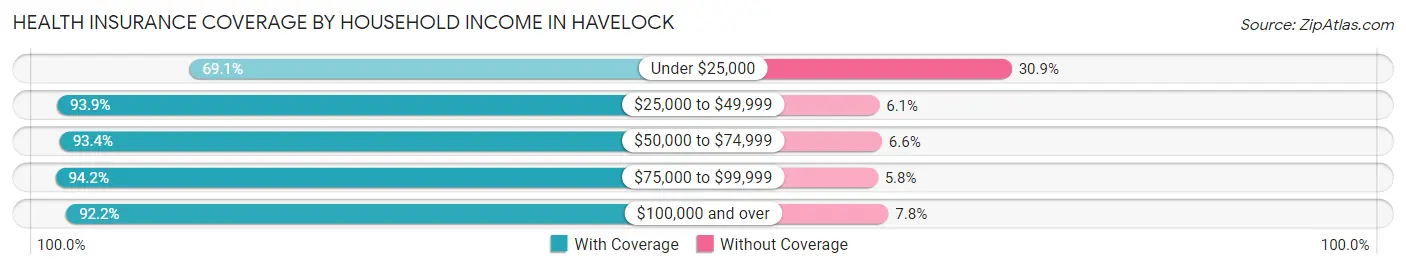
| Household Income | With Coverage | Without Coverage |
| Under $25,000 | 919 (69.1%) | 411 (30.9%) |
| $25,000 to $49,999 | 2,605 (93.9%) | 169 (6.1%) |
| $50,000 to $74,999 | 2,724 (93.4%) | 192 (6.6%) |
| $75,000 to $99,999 | 1,903 (94.2%) | 117 (5.8%) |
| $100,000 and over | 3,251 (92.2%) | 275 (7.8%) |
Public vs Private Health Insurance Coverage by Age in Havelock
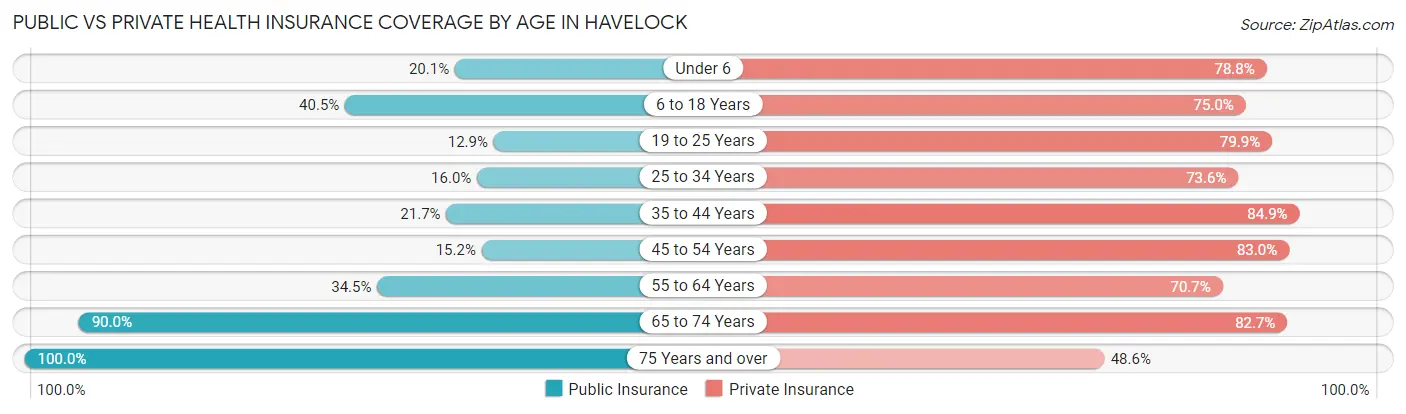
| Age Bracket | Public Insurance | Private Insurance |
| Under 6 | 360 (20.1%) | 1,411 (78.8%) |
| 6 to 18 Years | 985 (40.5%) | 1,823 (75.0%) |
| 19 to 25 Years | 269 (12.9%) | 1,664 (79.8%) |
| 25 to 34 Years | 264 (16.0%) | 1,214 (73.6%) |
| 35 to 44 Years | 317 (21.7%) | 1,240 (84.9%) |
| 45 to 54 Years | 123 (15.1%) | 674 (83.0%) |
| 55 to 64 Years | 471 (34.5%) | 964 (70.7%) |
| 65 to 74 Years | 680 (89.9%) | 625 (82.7%) |
| 75 Years and over | 218 (100.0%) | 106 (48.6%) |
| Total | 3,687 (29.3%) | 9,721 (77.4%) |
Disability Status by Sex by Age in Havelock
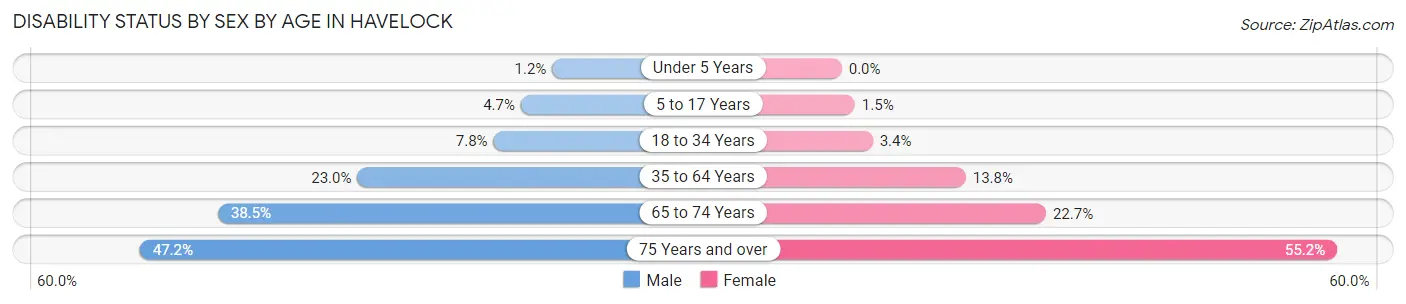
| Age Bracket | Male | Female |
| Under 5 Years | 9 (1.2%) | 0 (0.0%) |
| 5 to 17 Years | 68 (4.7%) | 17 (1.5%) |
| 18 to 34 Years | 123 (7.8%) | 76 (3.4%) |
| 35 to 64 Years | 384 (23.0%) | 271 (13.8%) |
| 65 to 74 Years | 142 (38.5%) | 88 (22.7%) |
| 75 Years and over | 25 (47.2%) | 91 (55.1%) |
Disability Class by Sex by Age in Havelock
Disability Class: Hearing Difficulty
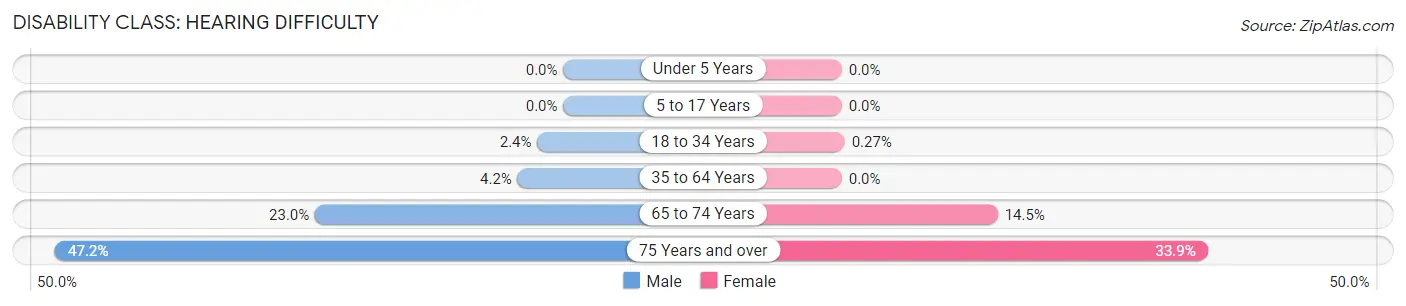
| Age Bracket | Male | Female |
| Under 5 Years | 0 (0.0%) | 0 (0.0%) |
| 5 to 17 Years | 0 (0.0%) | 0 (0.0%) |
| 18 to 34 Years | 38 (2.4%) | 6 (0.3%) |
| 35 to 64 Years | 71 (4.2%) | 0 (0.0%) |
| 65 to 74 Years | 85 (23.0%) | 56 (14.5%) |
| 75 Years and over | 25 (47.2%) | 56 (33.9%) |
Disability Class: Vision Difficulty
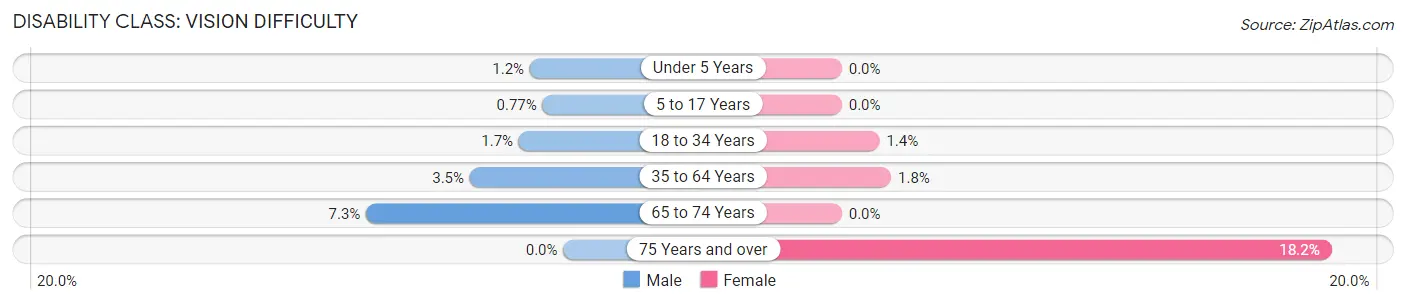
| Age Bracket | Male | Female |
| Under 5 Years | 9 (1.2%) | 0 (0.0%) |
| 5 to 17 Years | 11 (0.8%) | 0 (0.0%) |
| 18 to 34 Years | 26 (1.7%) | 31 (1.4%) |
| 35 to 64 Years | 58 (3.5%) | 36 (1.8%) |
| 65 to 74 Years | 27 (7.3%) | 0 (0.0%) |
| 75 Years and over | 0 (0.0%) | 30 (18.2%) |
Disability Class: Cognitive Difficulty
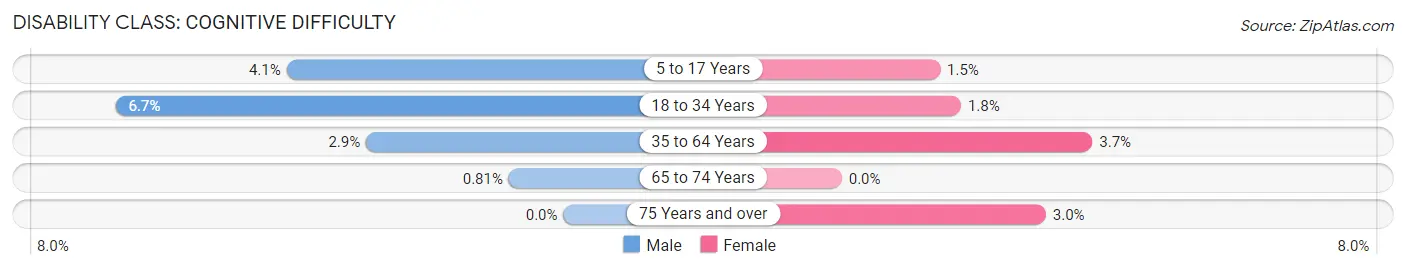
| Age Bracket | Male | Female |
| 5 to 17 Years | 59 (4.1%) | 17 (1.5%) |
| 18 to 34 Years | 105 (6.7%) | 39 (1.8%) |
| 35 to 64 Years | 49 (2.9%) | 73 (3.7%) |
| 65 to 74 Years | 3 (0.8%) | 0 (0.0%) |
| 75 Years and over | 0 (0.0%) | 5 (3.0%) |
Disability Class: Ambulatory Difficulty
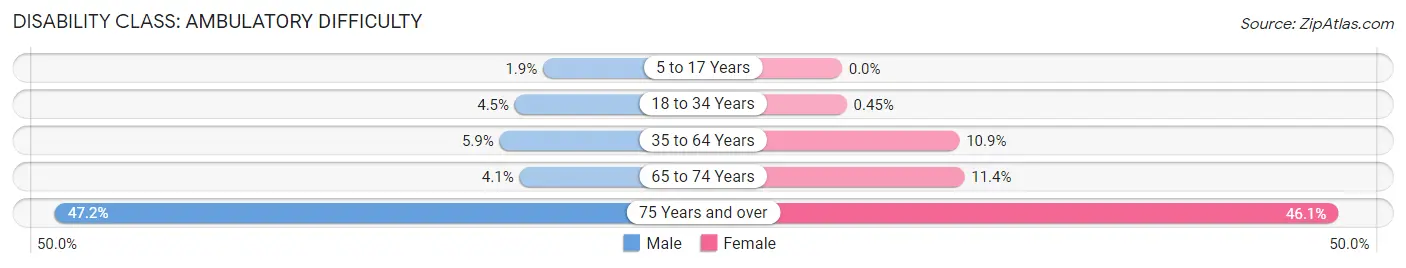
| Age Bracket | Male | Female |
| 5 to 17 Years | 27 (1.9%) | 0 (0.0%) |
| 18 to 34 Years | 71 (4.5%) | 10 (0.4%) |
| 35 to 64 Years | 99 (5.9%) | 214 (10.9%) |
| 65 to 74 Years | 15 (4.1%) | 44 (11.4%) |
| 75 Years and over | 25 (47.2%) | 76 (46.1%) |
Disability Class: Self-Care Difficulty
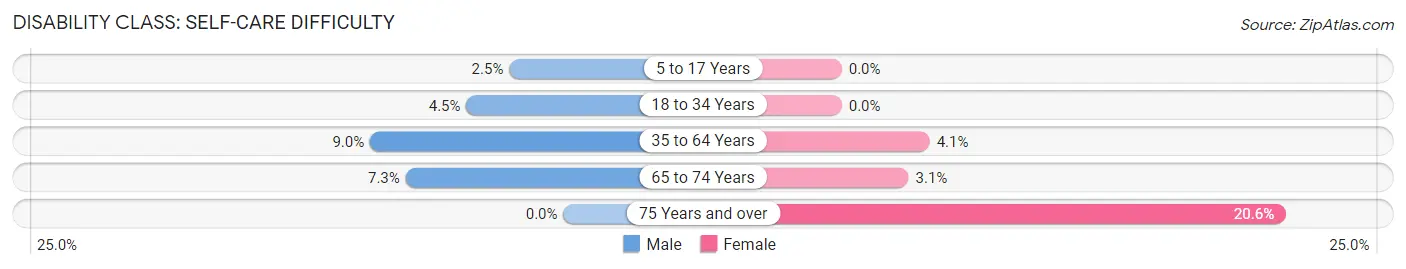
| Age Bracket | Male | Female |
| 5 to 17 Years | 36 (2.5%) | 0 (0.0%) |
| 18 to 34 Years | 71 (4.5%) | 0 (0.0%) |
| 35 to 64 Years | 150 (9.0%) | 80 (4.1%) |
| 65 to 74 Years | 27 (7.3%) | 12 (3.1%) |
| 75 Years and over | 0 (0.0%) | 34 (20.6%) |
Technology Access in Havelock
Computing Device Access in Havelock
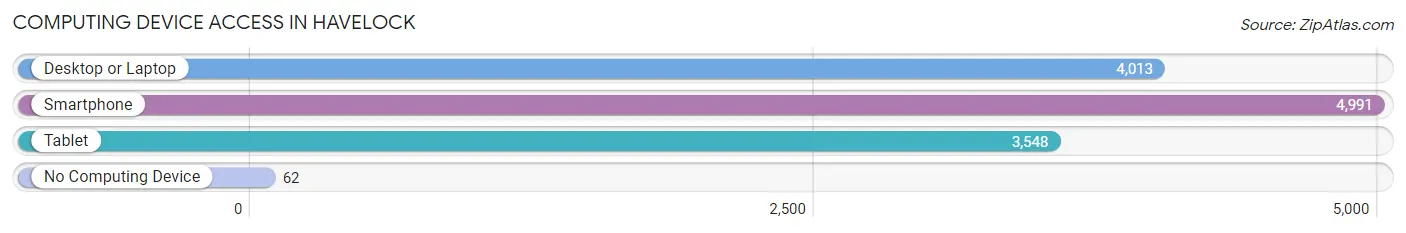
| Device Type | # Households | % Households |
| Desktop or Laptop | 4,013 | 77.9% |
| Smartphone | 4,991 | 96.9% |
| Tablet | 3,548 | 68.9% |
| No Computing Device | 62 | 1.2% |
| Total | 5,153 | 100.0% |
Internet Access in Havelock
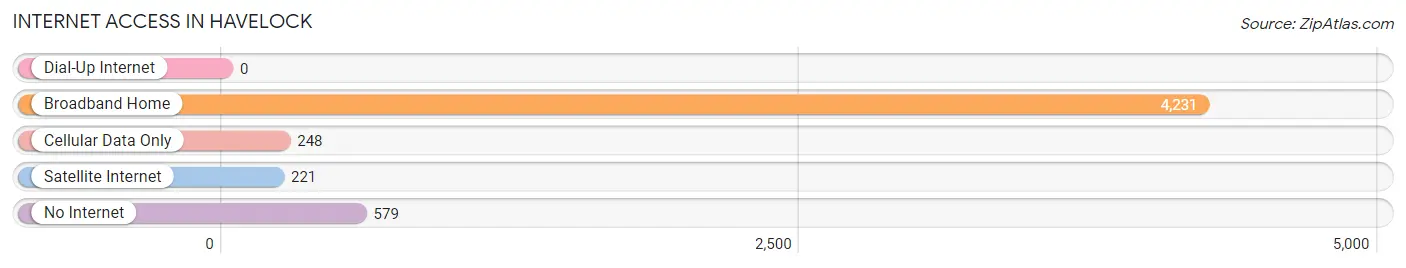
| Internet Type | # Households | % Households |
| Dial-Up Internet | 0 | 0.0% |
| Broadband Home | 4,231 | 82.1% |
| Cellular Data Only | 248 | 4.8% |
| Satellite Internet | 221 | 4.3% |
| No Internet | 579 | 11.2% |
| Total | 5,153 | 100.0% |
Havelock Summary
Havelock, North Carolina is a small city located in Craven County, North Carolina. It is situated on the banks of the Neuse River, approximately 30 miles east of New Bern, the county seat. The city is part of the New Bern Metropolitan Statistical Area and is home to approximately 20,000 people.
History
Havelock was founded in 1883 by the Atlantic Coast Line Railroad. The city was named after the British Admiral, Sir Henry Havelock, who was a hero of the Indian Rebellion of 1857. The city was incorporated in 1949 and has since grown to become the second largest city in Craven County.
Geography
Havelock is located in the Coastal Plain region of North Carolina. The city is situated on the banks of the Neuse River, approximately 30 miles east of New Bern. The city is bordered by the Croatan National Forest to the north and the Neuse River to the south. The city has a total area of 8.3 square miles, of which 8.2 square miles is land and 0.1 square miles is water.
Economy
Havelock’s economy is largely based on the military. The city is home to Marine Corps Air Station Cherry Point, which is the largest employer in the city. The base is home to the 2nd Marine Aircraft Wing and provides a significant economic impact to the city. Other major employers in the city include the Craven County School System, Vidant Medical Center, and the City of Havelock.
Demographics
As of the 2010 census, Havelock had a population of 20,735. The racial makeup of the city was 73.3% White, 16.2% African American, 0.7% Native American, 2.2% Asian, 0.1% Pacific Islander, 4.3% from other races, and 3.2% from two or more races. Hispanic or Latino of any race were 8.3% of the population.
The median income for a household in the city was $41,945, and the median income for a family was $50,945. The per capita income for the city was $20,945. About 11.2% of families and 14.2% of the population were below the poverty line, including 19.2% of those under age 18 and 8.2% of those age 65 or over.
Havelock is a small city with a rich history and a diverse population. The city is home to a large military base, which provides a significant economic impact to the city. The city also has a variety of businesses and industries that provide employment opportunities for its citizens. Havelock is a great place to live, work, and play.
Common Questions
What is Per Capita Income in Havelock?
Per Capita income in Havelock is $26,646.
What is the Median Family Income in Havelock?
Median Family Income in Havelock is $65,829.
What is the Median Household income in Havelock?
Median Household Income in Havelock is $56,492.
What is Income or Wage Gap in Havelock?
Income or Wage Gap in Havelock is 15.6%.
Women in Havelock earn 84.4 cents for every dollar earned by a man.
What is Inequality or Gini Index in Havelock?
Inequality or Gini Index in Havelock is 0.38.
What is the Total Population of Havelock?
Total Population of Havelock is 16,759.
What is the Total Male Population of Havelock?
Total Male Population of Havelock is 9,750.
What is the Total Female Population of Havelock?
Total Female Population of Havelock is 7,009.
What is the Ratio of Males per 100 Females in Havelock?
There are 139.11 Males per 100 Females in Havelock.
What is the Ratio of Females per 100 Males in Havelock?
There are 71.89 Females per 100 Males in Havelock.
What is the Median Population Age in Havelock?
Median Population Age in Havelock is 23.8 Years.
What is the Average Family Size in Havelock
Average Family Size in Havelock is 3.1 People.
What is the Average Household Size in Havelock
Average Household Size in Havelock is 2.7 People.
How Large is the Labor Force in Havelock?
There are 9,594 People in the Labor Forcein in Havelock.
What is the Percentage of People in the Labor Force in Havelock?
75.1% of People are in the Labor Force in Havelock.
What is the Unemployment Rate in Havelock?
Unemployment Rate in Havelock is 4.7%.