Pinetops, NC Map & Demographics
Pinetops Map
Pinetops Overview
$27,273
PER CAPITA INCOME
$57,917
AVG FAMILY INCOME
$44,643
AVG HOUSEHOLD INCOME
53.4%
WAGE / INCOME GAP [ % ]
46.6¢/ $1
WAGE / INCOME GAP [ $ ]
0.48
INEQUALITY / GINI INDEX
1,374
TOTAL POPULATION
593
MALE POPULATION
781
FEMALE POPULATION
75.93
MALES / 100 FEMALES
131.70
FEMALES / 100 MALES
42.5
MEDIAN AGE
2.7
AVG FAMILY SIZE
2.2
AVG HOUSEHOLD SIZE
581
LABOR FORCE [ PEOPLE ]
52.4%
PERCENT IN LABOR FORCE
5.3%
UNEMPLOYMENT RATE
Pinetops Zip Codes
Pinetops Area Codes
Income in Pinetops
Income Overview in Pinetops
Per Capita Income in Pinetops is $27,273, while median incomes of families and households are $57,917 and $44,643 respectively.
| Characteristic | Number | Measure |
| Per Capita Income | 1,374 | $27,273 |
| Median Family Income | 416 | $57,917 |
| Mean Family Income | 416 | $74,635 |
| Median Household Income | 612 | $44,643 |
| Mean Household Income | 612 | $63,694 |
| Income Deficit | 416 | $0 |
| Wage / Income Gap (%) | 1,374 | 53.38% |
| Wage / Income Gap ($) | 1,374 | 46.62¢ per $1 |
| Gini / Inequality Index | 1,374 | 0.48 |
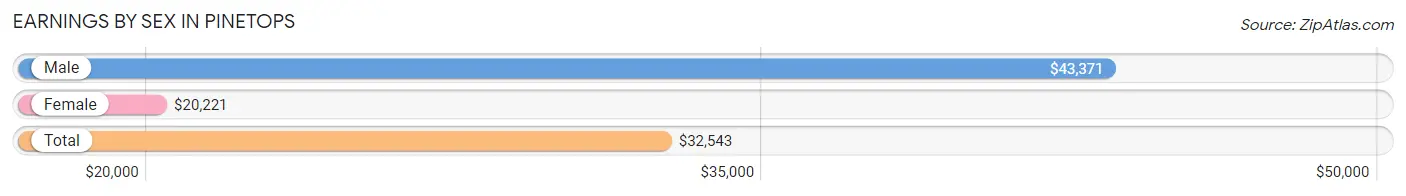
Earnings by Sex in Pinetops
Average Earnings in Pinetops are $32,543, $43,371 for men and $20,221 for women, a difference of 53.4%.
| Sex | Number | Average Earnings |
| Male | 287 (47.2%) | $43,371 |
| Female | 321 (52.8%) | $20,221 |
| Total | 608 (100.0%) | $32,543 |
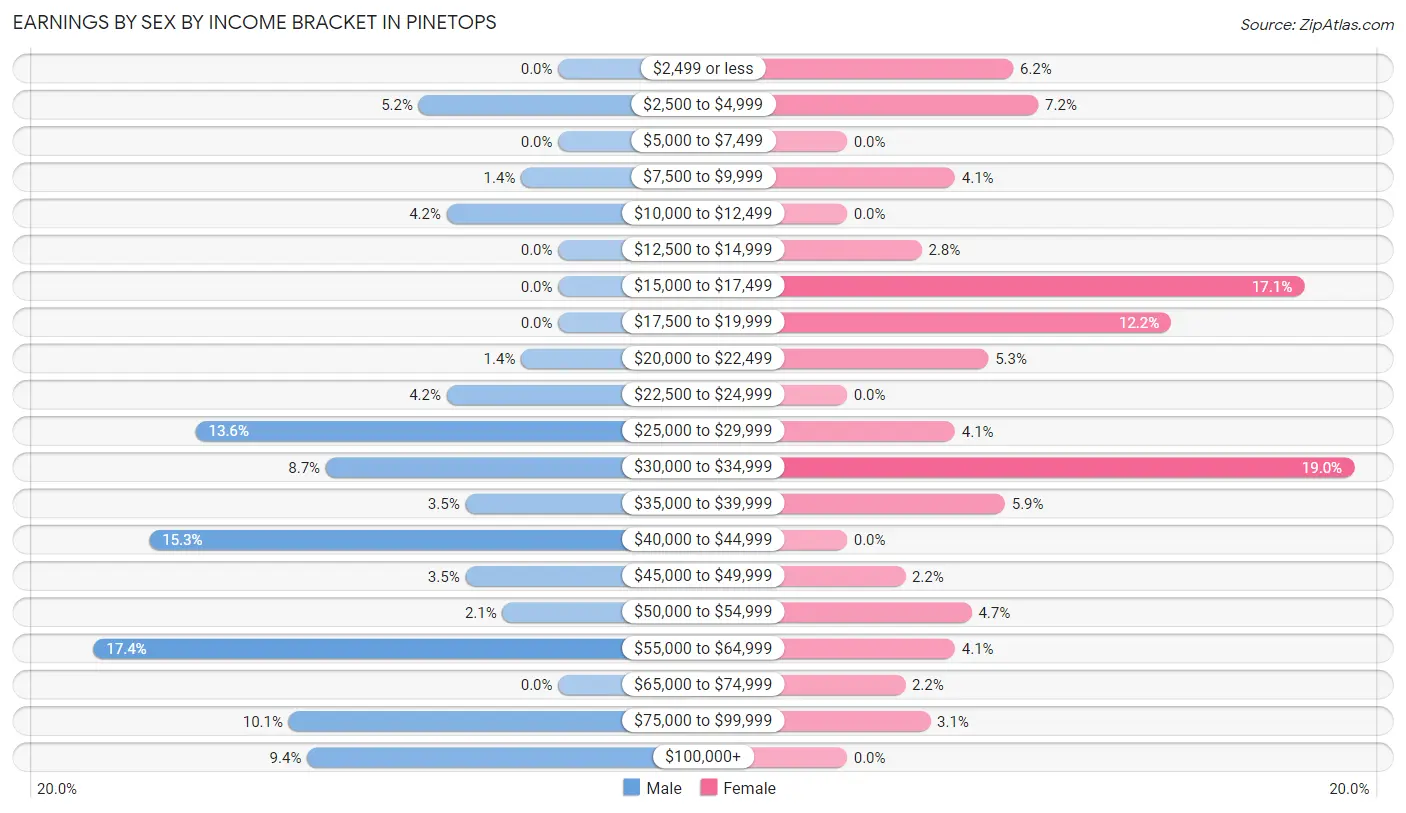
Earnings by Sex by Income Bracket in Pinetops
The most common earnings brackets in Pinetops are $55,000 to $64,999 for men (50 | 17.4%) and $30,000 to $34,999 for women (61 | 19.0%).
| Income | Male | Female |
| $2,499 or less | 0 (0.0%) | 20 (6.2%) |
| $2,500 to $4,999 | 15 (5.2%) | 23 (7.2%) |
| $5,000 to $7,499 | 0 (0.0%) | 0 (0.0%) |
| $7,500 to $9,999 | 4 (1.4%) | 13 (4.1%) |
| $10,000 to $12,499 | 12 (4.2%) | 0 (0.0%) |
| $12,500 to $14,999 | 0 (0.0%) | 9 (2.8%) |
| $15,000 to $17,499 | 0 (0.0%) | 55 (17.1%) |
| $17,500 to $19,999 | 0 (0.0%) | 39 (12.1%) |
| $20,000 to $22,499 | 4 (1.4%) | 17 (5.3%) |
| $22,500 to $24,999 | 12 (4.2%) | 0 (0.0%) |
| $25,000 to $29,999 | 39 (13.6%) | 13 (4.1%) |
| $30,000 to $34,999 | 25 (8.7%) | 61 (19.0%) |
| $35,000 to $39,999 | 10 (3.5%) | 19 (5.9%) |
| $40,000 to $44,999 | 44 (15.3%) | 0 (0.0%) |
| $45,000 to $49,999 | 10 (3.5%) | 7 (2.2%) |
| $50,000 to $54,999 | 6 (2.1%) | 15 (4.7%) |
| $55,000 to $64,999 | 50 (17.4%) | 13 (4.1%) |
| $65,000 to $74,999 | 0 (0.0%) | 7 (2.2%) |
| $75,000 to $99,999 | 29 (10.1%) | 10 (3.1%) |
| $100,000+ | 27 (9.4%) | 0 (0.0%) |
| Total | 287 (100.0%) | 321 (100.0%) |
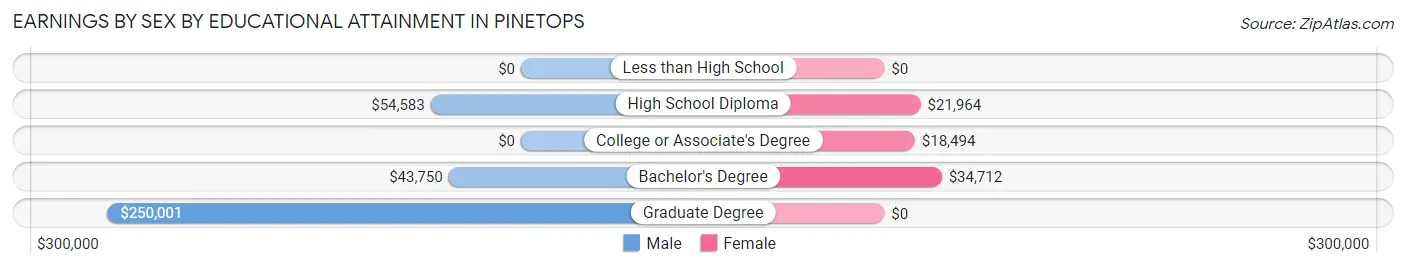
Earnings by Sex by Educational Attainment in Pinetops
Average earnings in Pinetops are $44,545 for men and $21,250 for women, a difference of 52.3%. Men with an educational attainment of graduate degree enjoy the highest average annual earnings of $250,001, while those with bachelor's degree education earn the least with $43,750. Women with an educational attainment of bachelor's degree earn the most with the average annual earnings of $34,712, while those with college or associate's degree education have the smallest earnings of $18,494.
| Educational Attainment | Male Income | Female Income |
| Less than High School | - | - |
| High School Diploma | $54,583 | $21,964 |
| College or Associate's Degree | - | - |
| Bachelor's Degree | $43,750 | $34,712 |
| Graduate Degree | $250,001 | $0 |
| Total | $44,545 | $21,250 |
Family Income in Pinetops
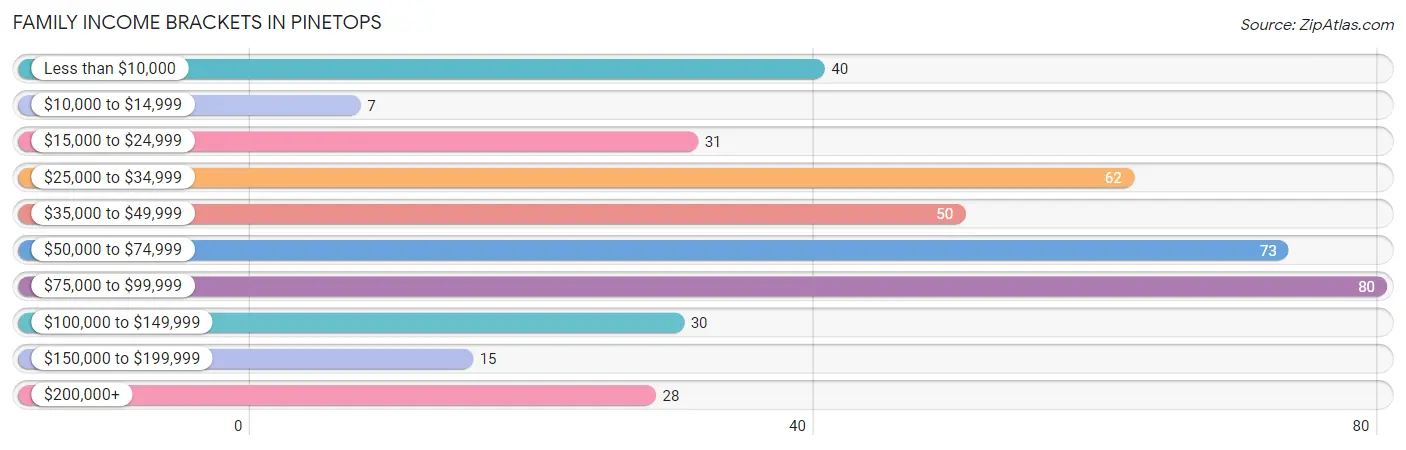
Family Income Brackets in Pinetops
According to the Pinetops family income data, there are 80 families falling into the $75,000 to $99,999 income range, which is the most common income bracket and makes up 19.2% of all families. Conversely, the $10,000 to $14,999 income bracket is the least frequent group with only 7 families (1.7%) belonging to this category.
| Income Bracket | # Families | % Families |
| Less than $10,000 | 40 | 9.6% |
| $10,000 to $14,999 | 7 | 1.7% |
| $15,000 to $24,999 | 31 | 7.5% |
| $25,000 to $34,999 | 62 | 14.9% |
| $35,000 to $49,999 | 50 | 12.0% |
| $50,000 to $74,999 | 73 | 17.5% |
| $75,000 to $99,999 | 80 | 19.2% |
| $100,000 to $149,999 | 30 | 7.2% |
| $150,000 to $199,999 | 15 | 3.6% |
| $200,000+ | 28 | 6.7% |
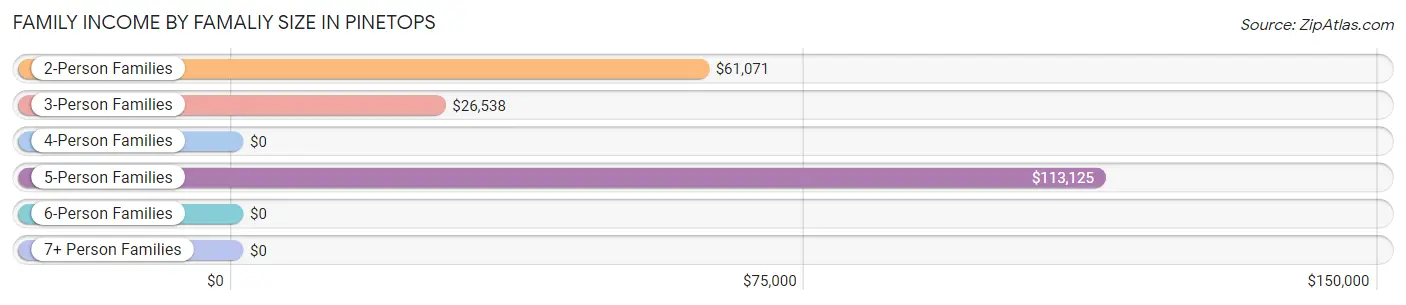
Family Income by Famaliy Size in Pinetops
5-person families (17 | 4.1%) account for the highest median family income in Pinetops with $113,125 per family, while 2-person families (250 | 60.1%) have the highest median income of $30,536 per family member.
| Income Bracket | # Families | Median Income |
| 2-Person Families | 250 (60.1%) | $61,071 |
| 3-Person Families | 60 (14.4%) | $26,538 |
| 4-Person Families | 77 (18.5%) | $0 |
| 5-Person Families | 17 (4.1%) | $113,125 |
| 6-Person Families | 12 (2.9%) | $0 |
| 7+ Person Families | 0 (0.0%) | $0 |
| Total | 416 (100.0%) | $57,917 |
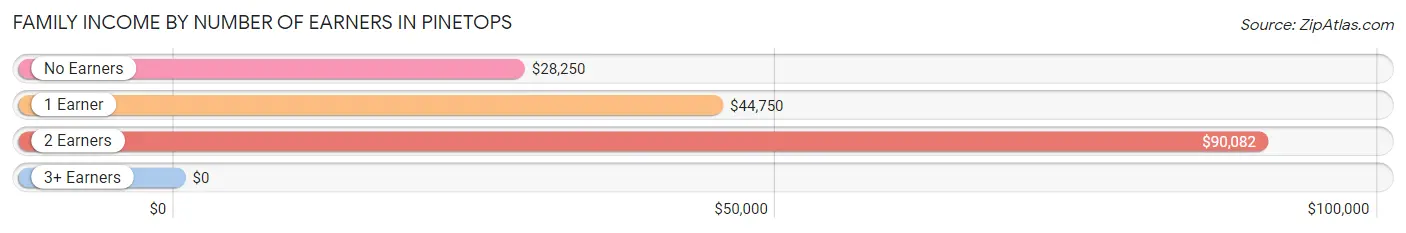
Family Income by Number of Earners in Pinetops
| Number of Earners | # Families | Median Income |
| No Earners | 119 (28.6%) | $28,250 |
| 1 Earner | 100 (24.0%) | $44,750 |
| 2 Earners | 193 (46.4%) | $90,082 |
| 3+ Earners | 4 (1.0%) | $0 |
| Total | 416 (100.0%) | $57,917 |
Household Income in Pinetops
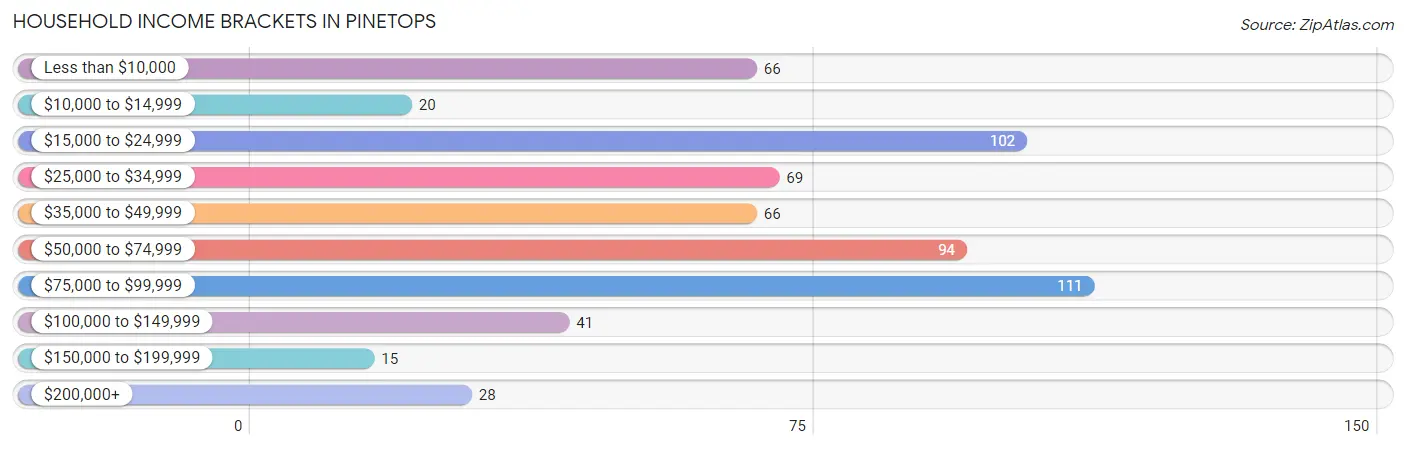
Household Income Brackets in Pinetops
With 111 households falling in the category, the $75,000 to $99,999 income range is the most frequent in Pinetops, accounting for 18.1% of all households. In contrast, only 15 households (2.5%) fall into the $150,000 to $199,999 income bracket, making it the least populous group.
| Income Bracket | # Households | % Households |
| Less than $10,000 | 66 | 10.8% |
| $10,000 to $14,999 | 20 | 3.3% |
| $15,000 to $24,999 | 102 | 16.7% |
| $25,000 to $34,999 | 69 | 11.3% |
| $35,000 to $49,999 | 66 | 10.8% |
| $50,000 to $74,999 | 94 | 15.4% |
| $75,000 to $99,999 | 111 | 18.1% |
| $100,000 to $149,999 | 41 | 6.7% |
| $150,000 to $199,999 | 15 | 2.5% |
| $200,000+ | 28 | 4.6% |
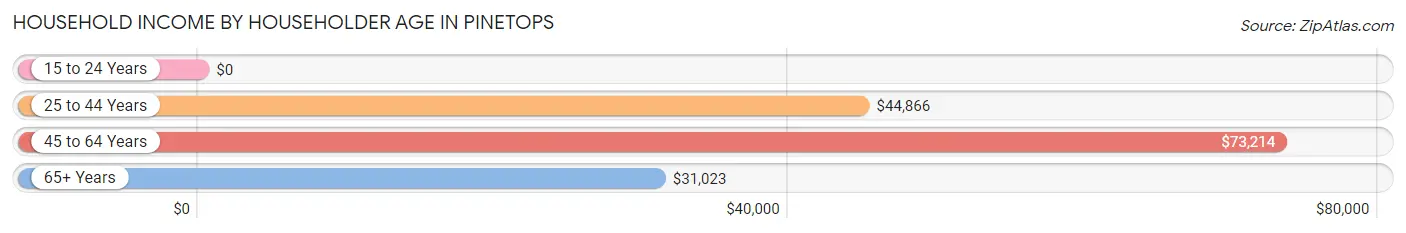
Household Income by Householder Age in Pinetops
The median household income in Pinetops is $44,643, with the highest median household income of $73,214 found in the 45 to 64 years age bracket for the primary householder. A total of 208 households (34.0%) fall into this category. Meanwhile, the 15 to 24 years age bracket for the primary householder has the lowest median household income of $0, with 8 households (1.3%) in this group.
| Income Bracket | # Households | Median Income |
| 15 to 24 Years | 8 (1.3%) | $0 |
| 25 to 44 Years | 165 (27.0%) | $44,866 |
| 45 to 64 Years | 208 (34.0%) | $73,214 |
| 65+ Years | 231 (37.8%) | $31,023 |
| Total | 612 (100.0%) | $44,643 |
Poverty in Pinetops
Income Below Poverty by Sex and Age in Pinetops
With 13.5% poverty level for males and 21.1% for females among the residents of Pinetops, 12 to 14 year old males and 15 year old females are the most vulnerable to poverty, with 8 males (66.7%) and 6 females (100.0%) in their respective age groups living below the poverty level.
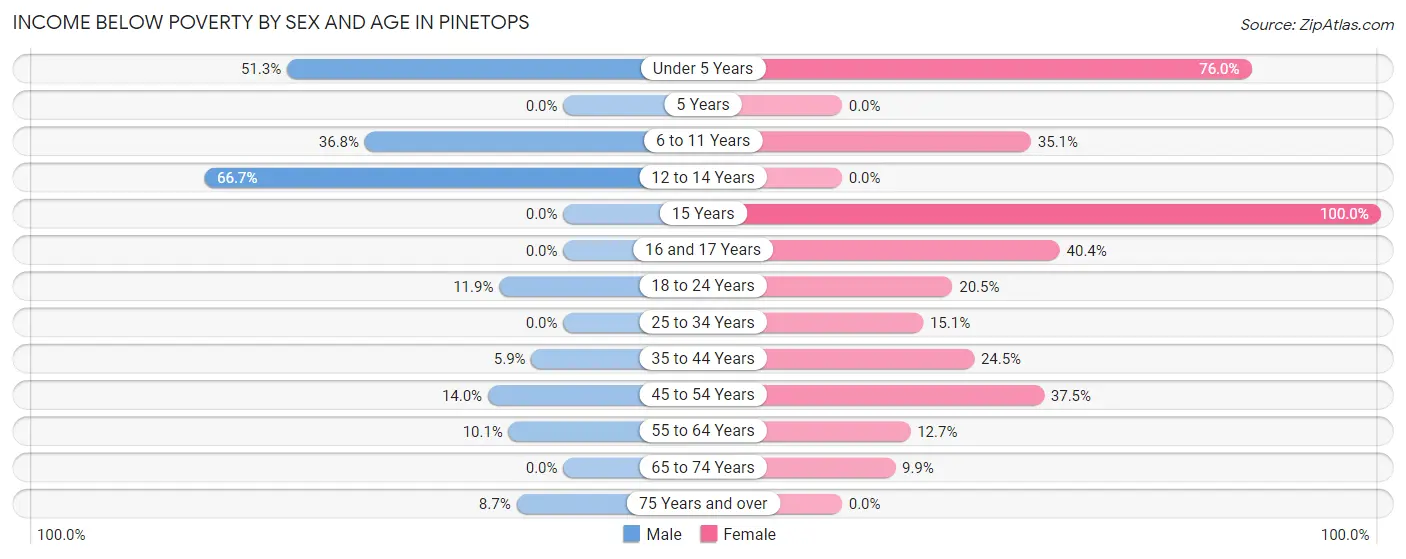
| Age Bracket | Male | Female |
| Under 5 Years | 20 (51.3%) | 19 (76.0%) |
| 5 Years | 0 (0.0%) | 0 (0.0%) |
| 6 to 11 Years | 21 (36.8%) | 20 (35.1%) |
| 12 to 14 Years | 8 (66.7%) | 0 (0.0%) |
| 15 Years | 0 (0.0%) | 6 (100.0%) |
| 16 and 17 Years | 0 (0.0%) | 19 (40.4%) |
| 18 to 24 Years | 5 (11.9%) | 8 (20.5%) |
| 25 to 34 Years | 0 (0.0%) | 11 (15.1%) |
| 35 to 44 Years | 7 (5.9%) | 26 (24.5%) |
| 45 to 54 Years | 7 (14.0%) | 24 (37.5%) |
| 55 to 64 Years | 7 (10.1%) | 16 (12.7%) |
| 65 to 74 Years | 0 (0.0%) | 16 (9.9%) |
| 75 Years and over | 4 (8.7%) | 0 (0.0%) |
| Total | 79 (13.5%) | 165 (21.1%) |
Income Above Poverty by Sex and Age in Pinetops
According to the poverty statistics in Pinetops, males aged 5 years and females aged 5 years are the age groups that are most secure financially, with 100.0% of males and 100.0% of females in these age groups living above the poverty line.
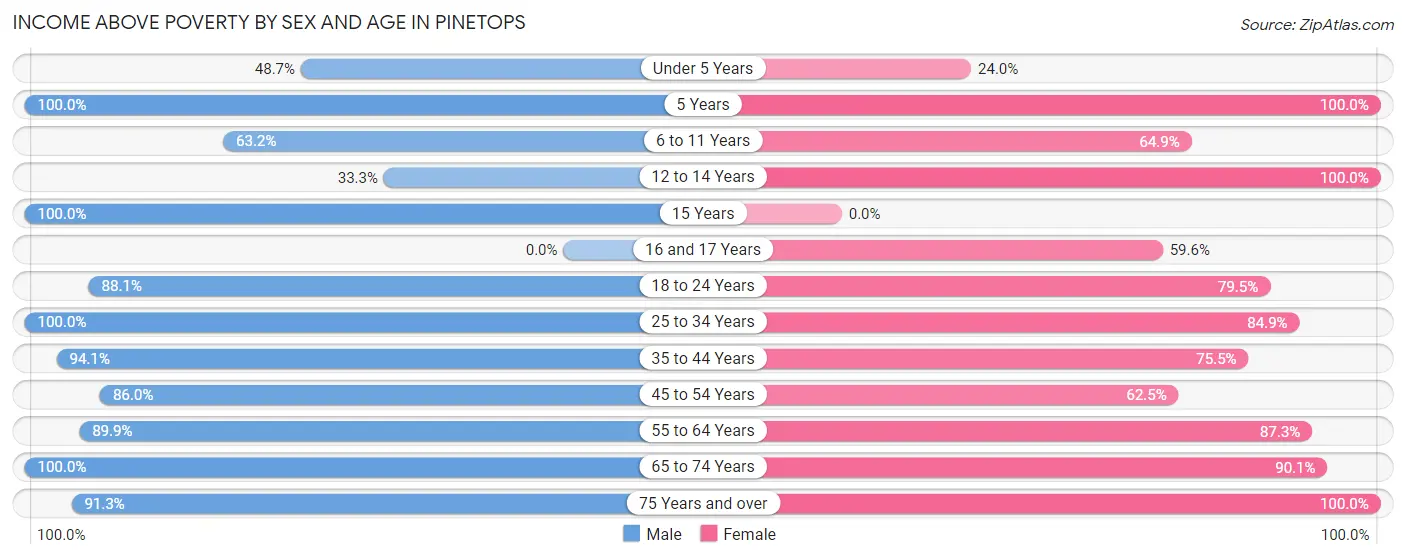
| Age Bracket | Male | Female |
| Under 5 Years | 19 (48.7%) | 6 (24.0%) |
| 5 Years | 4 (100.0%) | 10 (100.0%) |
| 6 to 11 Years | 36 (63.2%) | 37 (64.9%) |
| 12 to 14 Years | 4 (33.3%) | 25 (100.0%) |
| 15 Years | 23 (100.0%) | 0 (0.0%) |
| 16 and 17 Years | 0 (0.0%) | 28 (59.6%) |
| 18 to 24 Years | 37 (88.1%) | 31 (79.5%) |
| 25 to 34 Years | 45 (100.0%) | 62 (84.9%) |
| 35 to 44 Years | 111 (94.1%) | 80 (75.5%) |
| 45 to 54 Years | 43 (86.0%) | 40 (62.5%) |
| 55 to 64 Years | 62 (89.9%) | 110 (87.3%) |
| 65 to 74 Years | 81 (100.0%) | 146 (90.1%) |
| 75 Years and over | 42 (91.3%) | 41 (100.0%) |
| Total | 507 (86.5%) | 616 (78.9%) |
Income Below Poverty Among Married-Couple Families in Pinetops
The poverty statistics for married-couple families in Pinetops show that 3.7% or 7 of the total 189 families live below the poverty line. Families with no children have the highest poverty rate of 5.7%, comprising of 7 families. On the other hand, families with 1 or 2 children have the lowest poverty rate of 0.0%, which includes 0 families.
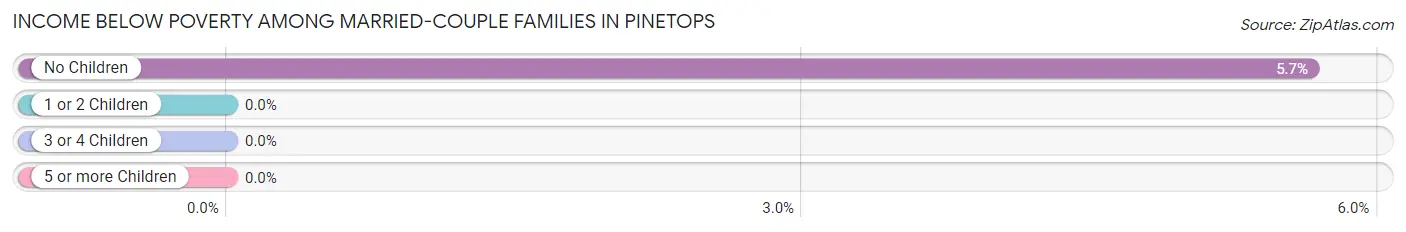
| Children | Above Poverty | Below Poverty |
| No Children | 117 (94.4%) | 7 (5.7%) |
| 1 or 2 Children | 65 (100.0%) | 0 (0.0%) |
| 3 or 4 Children | 0 (0.0%) | 0 (0.0%) |
| 5 or more Children | 0 (0.0%) | 0 (0.0%) |
| Total | 182 (96.3%) | 7 (3.7%) |
Income Below Poverty Among Single-Parent Households in Pinetops
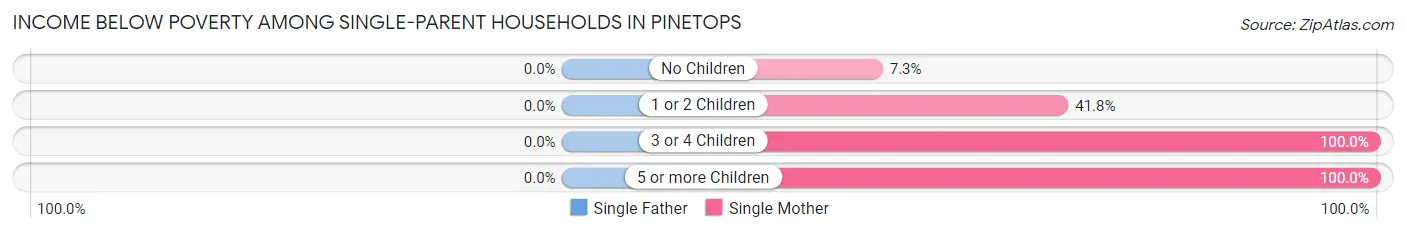
| Children | Single Father | Single Mother |
| No Children | 0 (0.0%) | 7 (7.3%) |
| 1 or 2 Children | 0 (0.0%) | 41 (41.8%) |
| 3 or 4 Children | 0 (0.0%) | 3 (100.0%) |
| 5 or more Children | 0 (0.0%) | 12 (100.0%) |
| Total | 0 (0.0%) | 63 (30.1%) |
Income Below Poverty Among Married-Couple vs Single-Parent Households in Pinetops
The poverty data for Pinetops shows that 7 of the married-couple family households (3.7%) and 63 of the single-parent households (27.8%) are living below the poverty level. Within the married-couple family households, those with no children have the highest poverty rate, with 7 households (5.7%) falling below the poverty line. Among the single-parent households, those with 3 or 4 children have the highest poverty rate, with 3 household (100.0%) living below poverty.
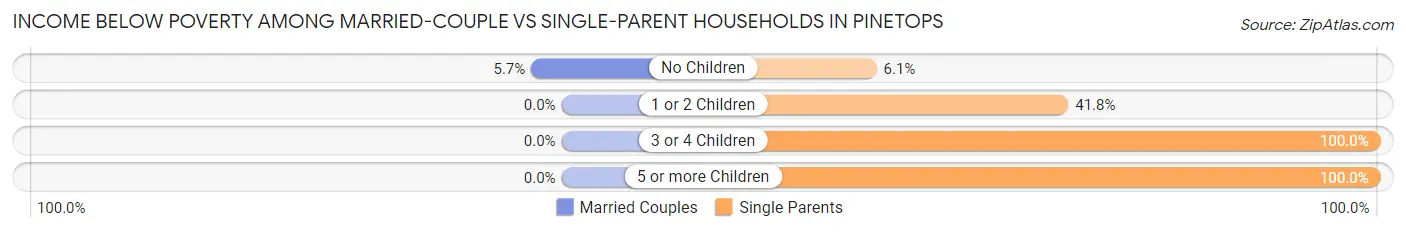
| Children | Married-Couple Families | Single-Parent Households |
| No Children | 7 (5.7%) | 7 (6.1%) |
| 1 or 2 Children | 0 (0.0%) | 41 (41.8%) |
| 3 or 4 Children | 0 (0.0%) | 3 (100.0%) |
| 5 or more Children | 0 (0.0%) | 12 (100.0%) |
| Total | 7 (3.7%) | 63 (27.8%) |
Race in Pinetops
The most populous races in Pinetops are Black / African American (861 | 62.7%), White / Caucasian (473 | 34.4%), and Two or more Races (40 | 2.9%).
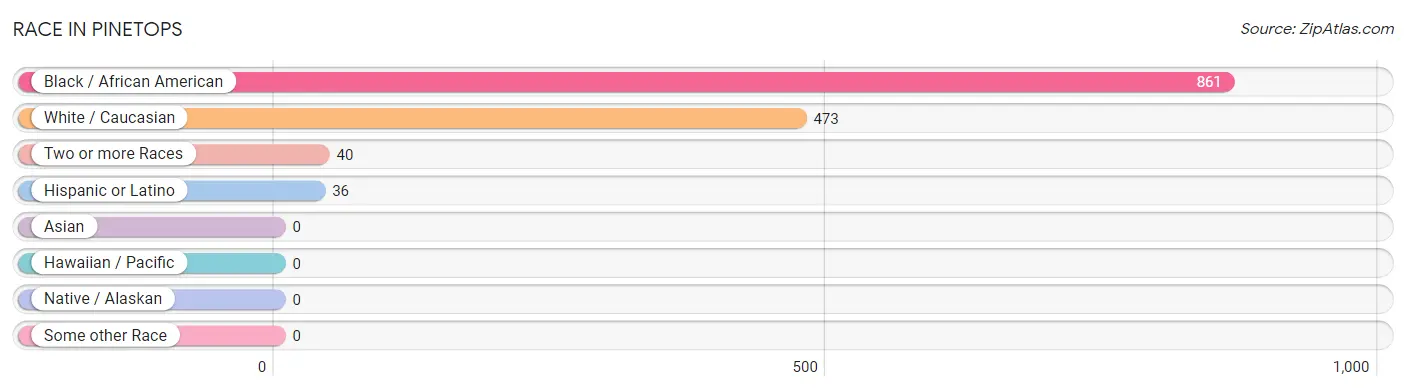
| Race | # Population | % Population |
| Asian | 0 | 0.0% |
| Black / African American | 861 | 62.7% |
| Hawaiian / Pacific | 0 | 0.0% |
| Hispanic or Latino | 36 | 2.6% |
| Native / Alaskan | 0 | 0.0% |
| White / Caucasian | 473 | 34.4% |
| Two or more Races | 40 | 2.9% |
| Some other Race | 0 | 0.0% |
| Total | 1,374 | 100.0% |
Ancestry in Pinetops
The most populous ancestries reported in Pinetops are American (219 | 15.9%), Irish (75 | 5.5%), German (36 | 2.6%), Italian (29 | 2.1%), and English (16 | 1.2%), together accounting for 27.3% of all Pinetops residents.
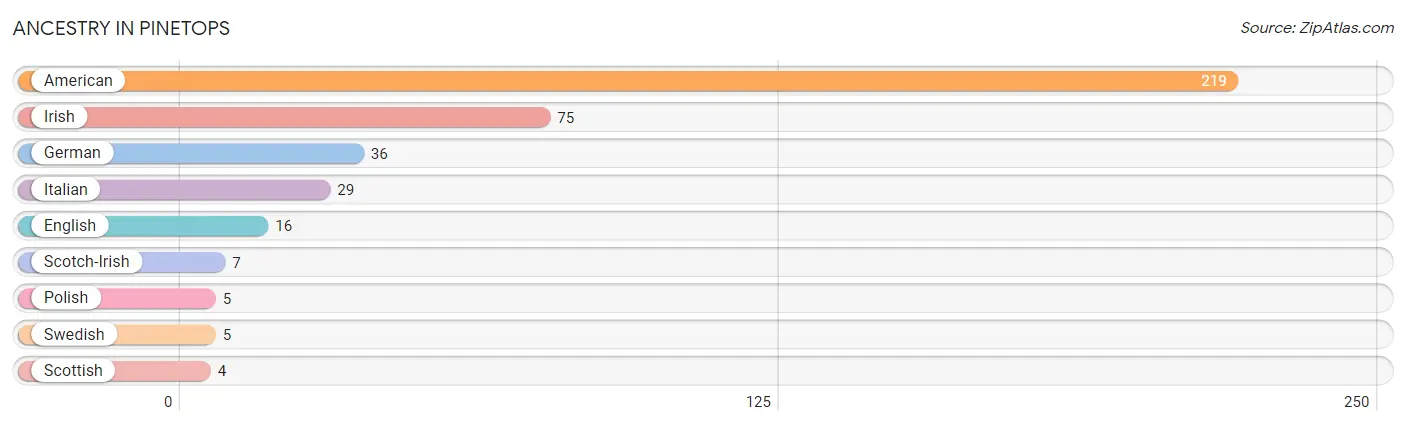
| Ancestry | # Population | % Population |
| American | 219 | 15.9% |
| English | 16 | 1.2% |
| German | 36 | 2.6% |
| Irish | 75 | 5.5% |
| Italian | 29 | 2.1% |
| Polish | 5 | 0.4% |
| Scotch-Irish | 7 | 0.5% |
| Scottish | 4 | 0.3% |
| Swedish | 5 | 0.4% | View All 9 Rows |
Immigrants in Pinetops
The most numerous immigrant groups reported in Pinetops came from Central America (17 | 1.2%), Guatemala (17 | 1.2%), Latin America (17 | 1.2%), Africa (8 | 0.6%), and Western Africa (8 | 0.6%), together accounting for 4.9% of all Pinetops residents.
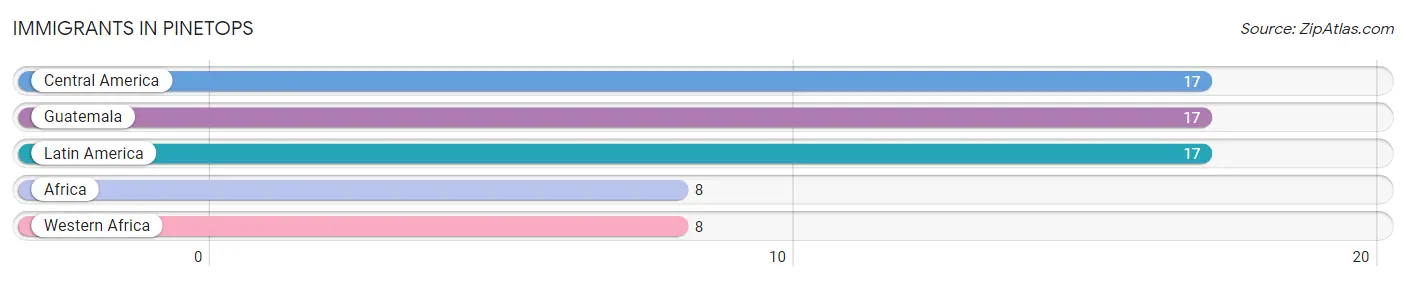
| Immigration Origin | # Population | % Population |
| Africa | 8 | 0.6% |
| Central America | 17 | 1.2% |
| Guatemala | 17 | 1.2% |
| Latin America | 17 | 1.2% |
| Western Africa | 8 | 0.6% | View All 5 Rows |
Sex and Age in Pinetops
Sex and Age in Pinetops
The most populous age groups in Pinetops are 35 to 39 Years (89 | 15.0%) for men and 65 to 69 Years (86 | 11.0%) for women.
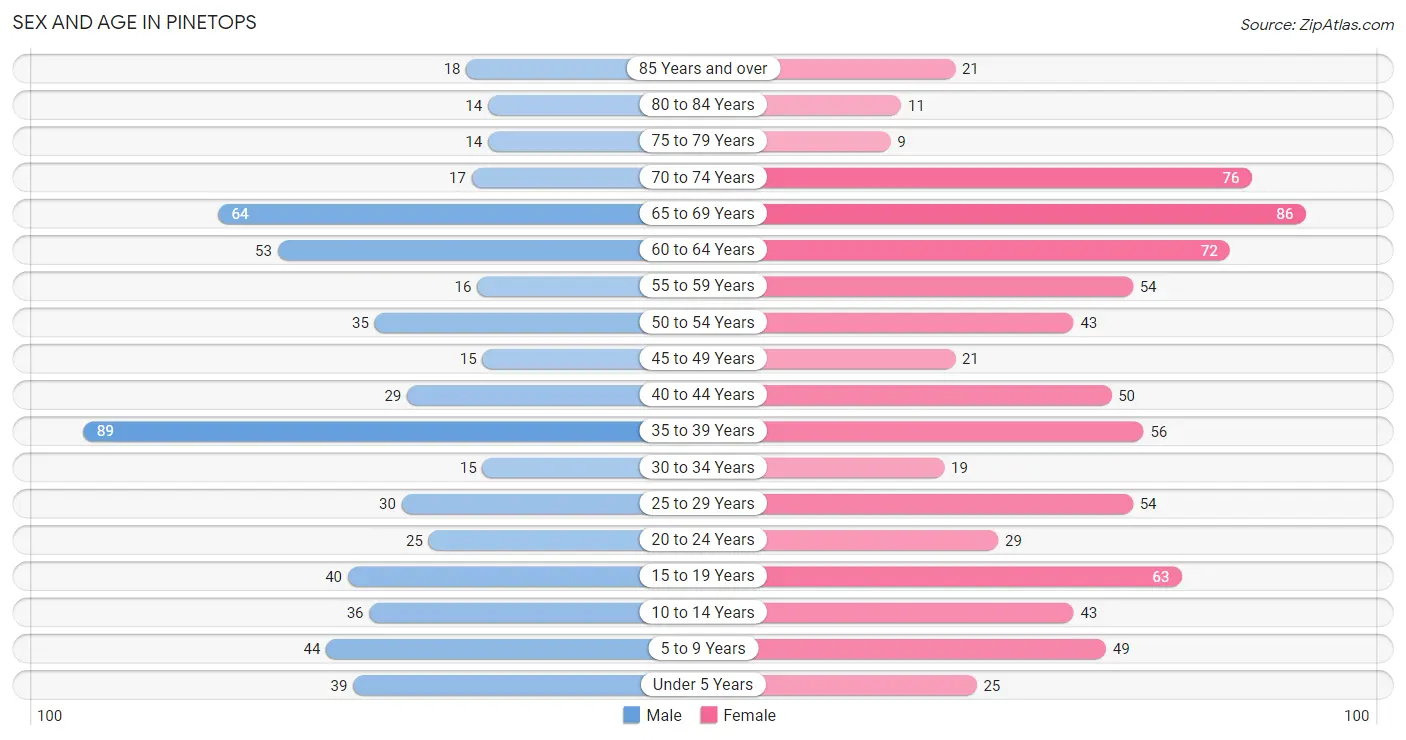
| Age Bracket | Male | Female |
| Under 5 Years | 39 (6.6%) | 25 (3.2%) |
| 5 to 9 Years | 44 (7.4%) | 49 (6.3%) |
| 10 to 14 Years | 36 (6.1%) | 43 (5.5%) |
| 15 to 19 Years | 40 (6.8%) | 63 (8.1%) |
| 20 to 24 Years | 25 (4.2%) | 29 (3.7%) |
| 25 to 29 Years | 30 (5.1%) | 54 (6.9%) |
| 30 to 34 Years | 15 (2.5%) | 19 (2.4%) |
| 35 to 39 Years | 89 (15.0%) | 56 (7.2%) |
| 40 to 44 Years | 29 (4.9%) | 50 (6.4%) |
| 45 to 49 Years | 15 (2.5%) | 21 (2.7%) |
| 50 to 54 Years | 35 (5.9%) | 43 (5.5%) |
| 55 to 59 Years | 16 (2.7%) | 54 (6.9%) |
| 60 to 64 Years | 53 (8.9%) | 72 (9.2%) |
| 65 to 69 Years | 64 (10.8%) | 86 (11.0%) |
| 70 to 74 Years | 17 (2.9%) | 76 (9.7%) |
| 75 to 79 Years | 14 (2.4%) | 9 (1.1%) |
| 80 to 84 Years | 14 (2.4%) | 11 (1.4%) |
| 85 Years and over | 18 (3.0%) | 21 (2.7%) |
| Total | 593 (100.0%) | 781 (100.0%) |
Families and Households in Pinetops
Median Family Size in Pinetops
The median family size in Pinetops is 2.73 persons per family, with single female/mother families (209 | 50.2%) accounting for the largest median family size of 2.83 persons per family. On the other hand, single male/father families (18 | 4.3%) represent the smallest median family size with 2.33 persons per family.
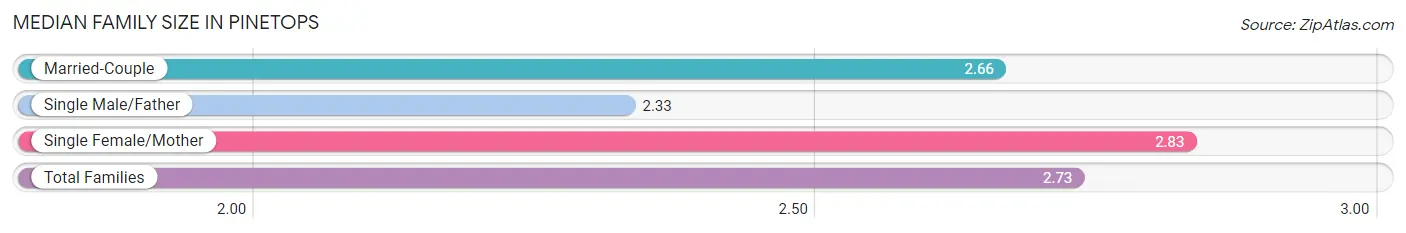
| Family Type | # Families | Family Size |
| Married-Couple | 189 (45.4%) | 2.66 |
| Single Male/Father | 18 (4.3%) | 2.33 |
| Single Female/Mother | 209 (50.2%) | 2.83 |
| Total Families | 416 (100.0%) | 2.73 |
Median Household Size in Pinetops
The median household size in Pinetops is 2.25 persons per household, with single female/mother households (209 | 34.2%) accounting for the largest median household size of 2.83 persons per household. non-family households (196 | 32.0%) represent the smallest median household size with 1.21 persons per household.
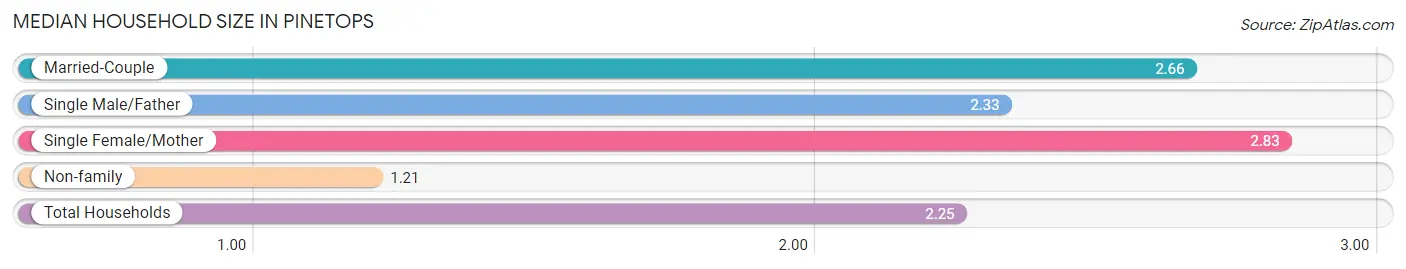
| Household Type | # Households | Household Size |
| Married-Couple | 189 (30.9%) | 2.66 |
| Single Male/Father | 18 (2.9%) | 2.33 |
| Single Female/Mother | 209 (34.2%) | 2.83 |
| Non-family | 196 (32.0%) | 1.21 |
| Total Households | 612 (100.0%) | 2.25 |
Household Size by Marriage Status in Pinetops
Out of a total of 612 households in Pinetops, 416 (68.0%) are family households, while 196 (32.0%) are nonfamily households. The most numerous type of family households are 2-person households, comprising 250, and the most common type of nonfamily households are 1-person households, comprising 166.
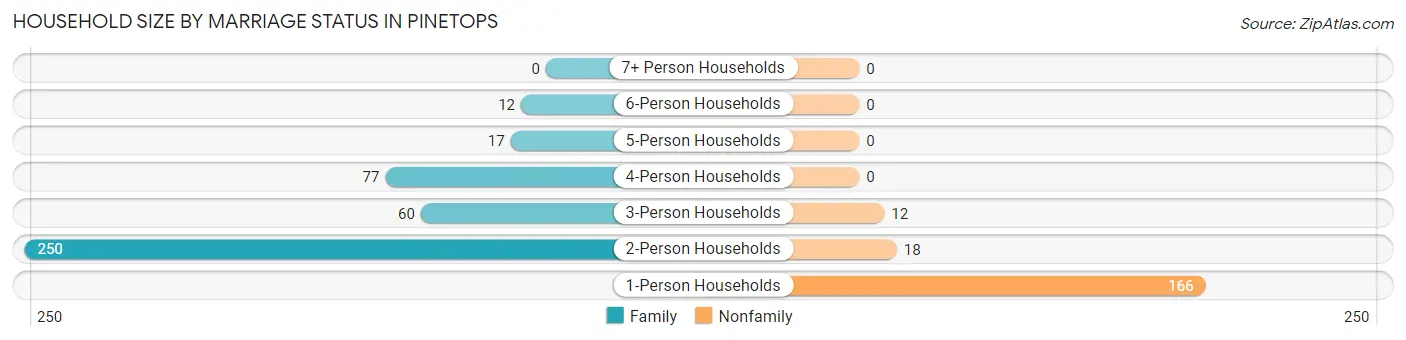
| Household Size | Family Households | Nonfamily Households |
| 1-Person Households | - | 166 (27.1%) |
| 2-Person Households | 250 (40.8%) | 18 (2.9%) |
| 3-Person Households | 60 (9.8%) | 12 (2.0%) |
| 4-Person Households | 77 (12.6%) | 0 (0.0%) |
| 5-Person Households | 17 (2.8%) | 0 (0.0%) |
| 6-Person Households | 12 (2.0%) | 0 (0.0%) |
| 7+ Person Households | 0 (0.0%) | 0 (0.0%) |
| Total | 416 (68.0%) | 196 (32.0%) |
Female Fertility in Pinetops
Fertility by Age in Pinetops
| Age Bracket | Women with Births | Births / 1,000 Women |
| 15 to 19 years | 0 (0.0%) | 0.0 |
| 20 to 34 years | 0 (0.0%) | 0.0 |
| 35 to 50 years | 0 (0.0%) | 0.0 |
| Total | 0 (0.0%) | 0.0 |
Fertility by Age by Marriage Status in Pinetops
| Age Bracket | Married | Unmarried |
| 15 to 19 years | 0 (0.0%) | 0 (0.0%) |
| 20 to 34 years | 0 (0.0%) | 0 (0.0%) |
| 35 to 50 years | 0 (0.0%) | 0 (0.0%) |
| Total | 0 (0.0%) | 0 (0.0%) |
Fertility by Education in Pinetops
| Educational Attainment | Women with Births | Births / 1,000 Women |
| Less than High School | 0 (0.0%) | 0.0 |
| High School Diploma | 0 (0.0%) | 0.0 |
| College or Associate's Degree | 0 (0.0%) | 0.0 |
| Bachelor's Degree | 0 (0.0%) | 0.0 |
| Graduate Degree | 0 (0.0%) | 0.0 |
| Total | 0 (0.0%) | 0.0 |
Fertility by Education by Marriage Status in Pinetops
| Educational Attainment | Married | Unmarried |
| Less than High School | 0 (0.0%) | 0 (0.0%) |
| High School Diploma | 0 (0.0%) | 0 (0.0%) |
| College or Associate's Degree | 0 (0.0%) | 0 (0.0%) |
| Bachelor's Degree | 0 (0.0%) | 0 (0.0%) |
| Graduate Degree | 0 (0.0%) | 0 (0.0%) |
| Total | 0 (0.0%) | 0 (0.0%) |
Employment Characteristics in Pinetops
Employment by Class of Employer in Pinetops
Among the 497 employed individuals in Pinetops, private company employees (351 | 70.6%), self-employed (not incorporated) (46 | 9.3%), and self-employed (incorporated) (30 | 6.0%) make up the most common classes of employment.
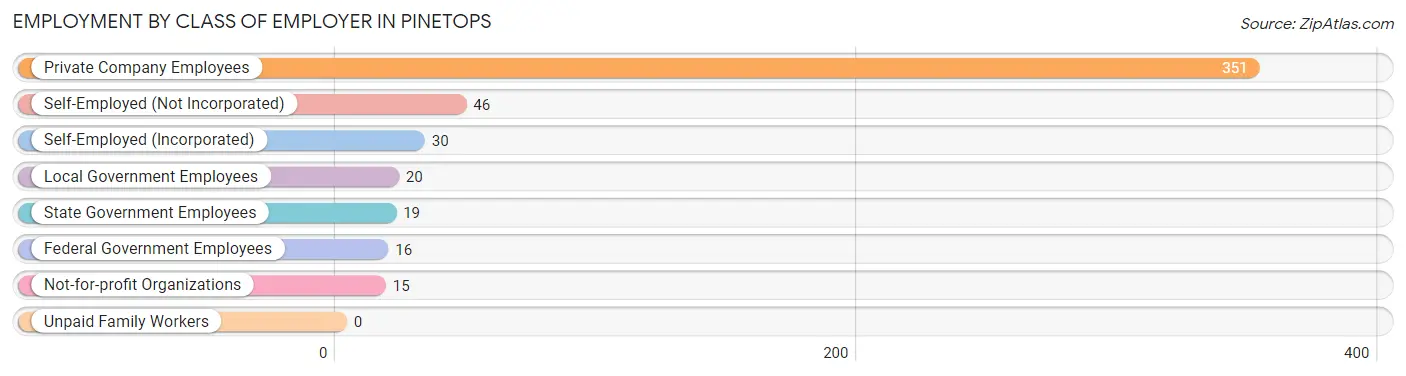
| Employer Class | # Employees | % Employees |
| Private Company Employees | 351 | 70.6% |
| Self-Employed (Incorporated) | 30 | 6.0% |
| Self-Employed (Not Incorporated) | 46 | 9.3% |
| Not-for-profit Organizations | 15 | 3.0% |
| Local Government Employees | 20 | 4.0% |
| State Government Employees | 19 | 3.8% |
| Federal Government Employees | 16 | 3.2% |
| Unpaid Family Workers | 0 | 0.0% |
| Total | 497 | 100.0% |
Employment Status by Age in Pinetops
According to the labor force statistics for Pinetops, out of the total population over 16 years of age (1,109), 52.4% or 581 individuals are in the labor force, with 5.3% or 31 of them unemployed. The age group with the highest labor force participation rate is 30 to 34 years, with 100.0% or 34 individuals in the labor force. Within the labor force, the 20 to 24 years age range has the highest percentage of unemployed individuals, with 38.1% or 8 of them being unemployed.
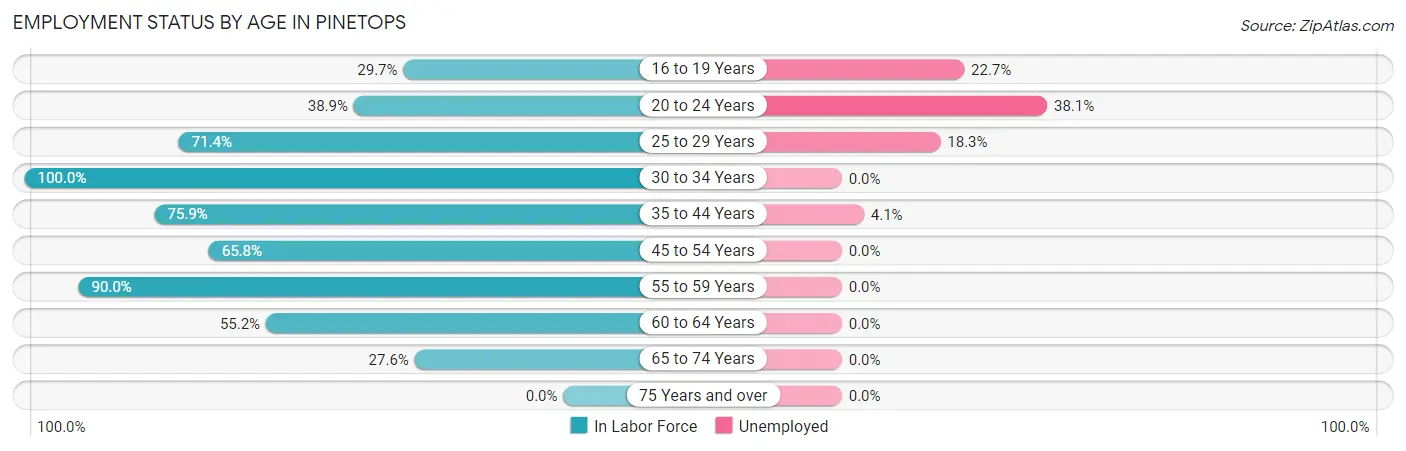
| Age Bracket | In Labor Force | Unemployed |
| 16 to 19 Years | 22 (29.7%) | 5 (22.7%) |
| 20 to 24 Years | 21 (38.9%) | 8 (38.1%) |
| 25 to 29 Years | 60 (71.4%) | 11 (18.3%) |
| 30 to 34 Years | 34 (100.0%) | 0 (0.0%) |
| 35 to 44 Years | 170 (75.9%) | 7 (4.1%) |
| 45 to 54 Years | 75 (65.8%) | 0 (0.0%) |
| 55 to 59 Years | 63 (90.0%) | 0 (0.0%) |
| 60 to 64 Years | 69 (55.2%) | 0 (0.0%) |
| 65 to 74 Years | 67 (27.6%) | 0 (0.0%) |
| 75 Years and over | 0 (0.0%) | 0 (0.0%) |
| Total | 581 (52.4%) | 31 (5.3%) |
Employment Status by Educational Attainment in Pinetops
According to labor force statistics for Pinetops, 72.4% of individuals (471) out of the total population between 25 and 64 years of age (651) are in the labor force, with 3.8% or 18 of them being unemployed. The group with the highest labor force participation rate are those with the educational attainment of bachelor's degree or higher, with 100.0% or 71 individuals in the labor force. Within the labor force, individuals with less than high school education have the highest percentage of unemployment, with 7.7% or 7 of them being unemployed.
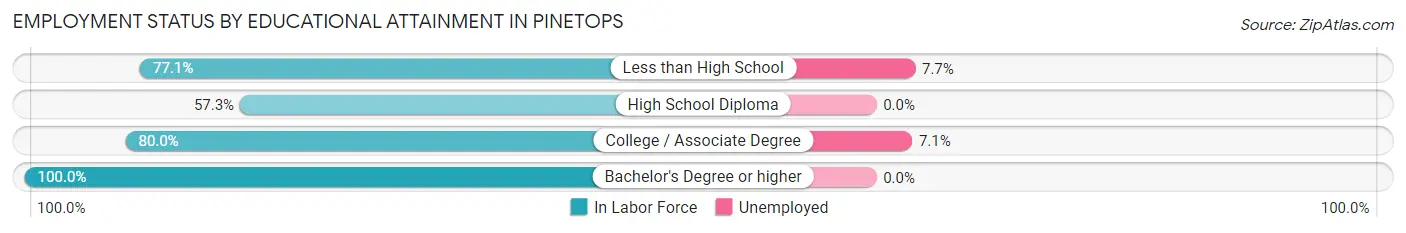
| Educational Attainment | In Labor Force | Unemployed |
| Less than High School | 91 (77.1%) | 9 (7.7%) |
| High School Diploma | 153 (57.3%) | 0 (0.0%) |
| College / Associate Degree | 156 (80.0%) | 14 (7.1%) |
| Bachelor's Degree or higher | 71 (100.0%) | 0 (0.0%) |
| Total | 471 (72.4%) | 25 (3.8%) |
Employment Occupations by Sex in Pinetops
Management, Business, Science and Arts Occupations
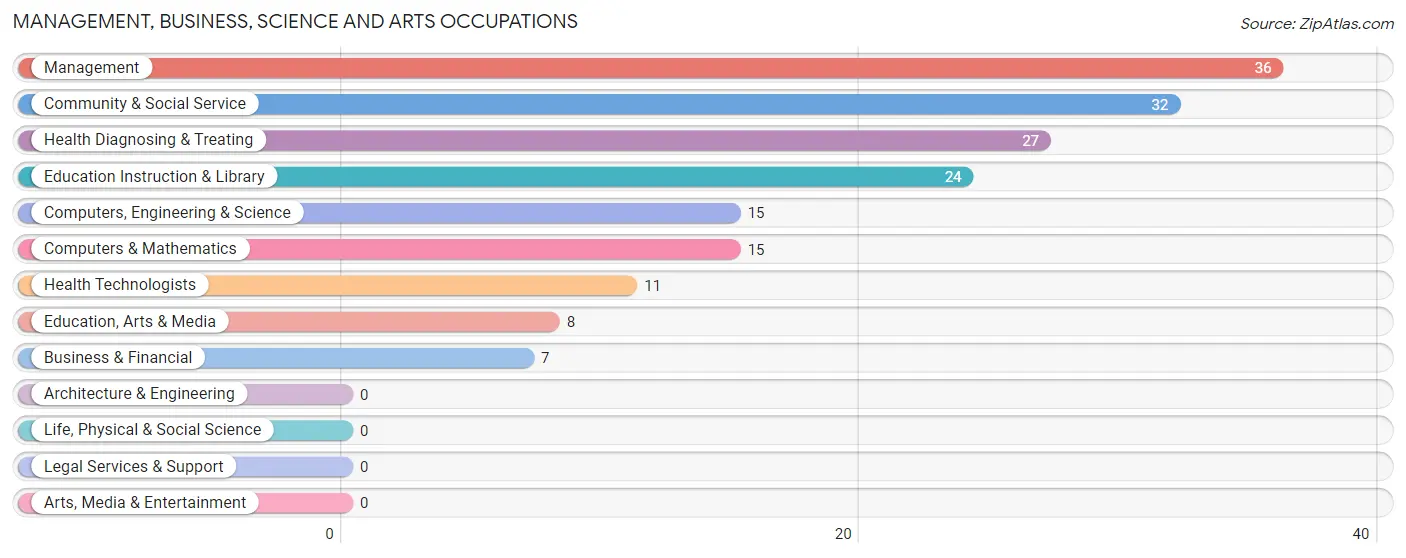
The most common Management, Business, Science and Arts occupations in Pinetops are Management (36 | 6.6%), Community & Social Service (32 | 5.8%), Health Diagnosing & Treating (27 | 4.9%), Education Instruction & Library (24 | 4.4%), and Computers, Engineering & Science (15 | 2.7%).
Management, Business, Science and Arts Occupations by Sex
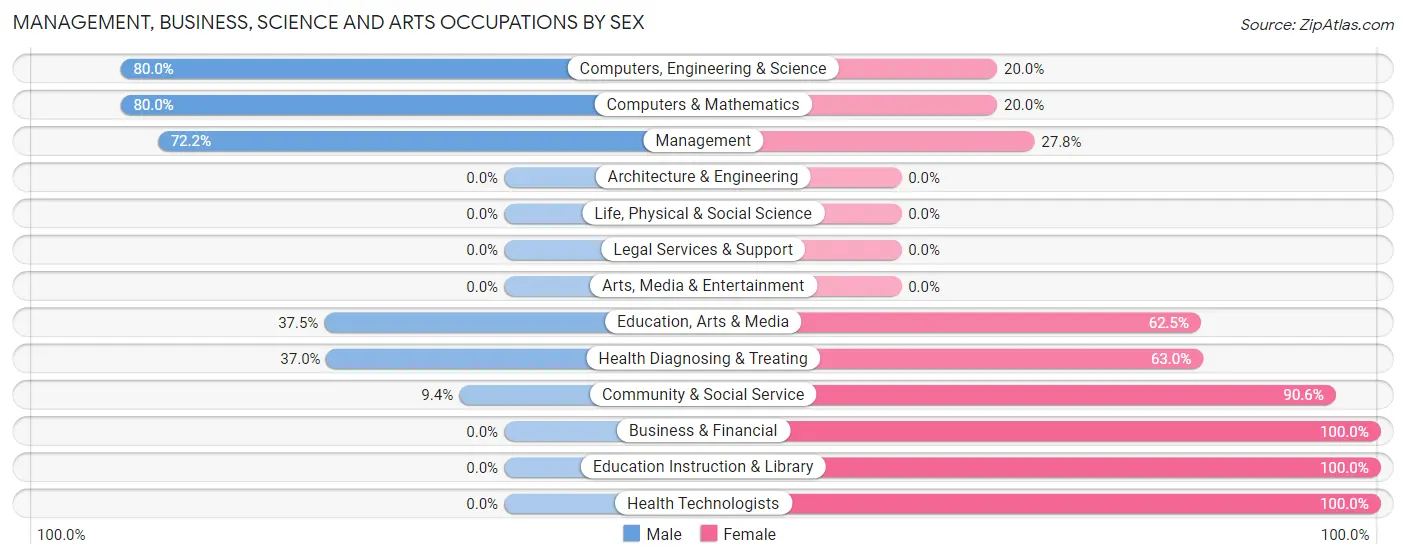
Within the Management, Business, Science and Arts occupations in Pinetops, the most male-oriented occupations are Computers, Engineering & Science (80.0%), Computers & Mathematics (80.0%), and Management (72.2%), while the most female-oriented occupations are Business & Financial (100.0%), Education Instruction & Library (100.0%), and Health Technologists (100.0%).
| Occupation | Male | Female |
| Management | 26 (72.2%) | 10 (27.8%) |
| Business & Financial | 0 (0.0%) | 7 (100.0%) |
| Computers, Engineering & Science | 12 (80.0%) | 3 (20.0%) |
| Computers & Mathematics | 12 (80.0%) | 3 (20.0%) |
| Architecture & Engineering | 0 (0.0%) | 0 (0.0%) |
| Life, Physical & Social Science | 0 (0.0%) | 0 (0.0%) |
| Community & Social Service | 3 (9.4%) | 29 (90.6%) |
| Education, Arts & Media | 3 (37.5%) | 5 (62.5%) |
| Legal Services & Support | 0 (0.0%) | 0 (0.0%) |
| Education Instruction & Library | 0 (0.0%) | 24 (100.0%) |
| Arts, Media & Entertainment | 0 (0.0%) | 0 (0.0%) |
| Health Diagnosing & Treating | 10 (37.0%) | 17 (63.0%) |
| Health Technologists | 0 (0.0%) | 11 (100.0%) |
| Total (Category) | 51 (43.6%) | 66 (56.4%) |
| Total (Overall) | 272 (49.4%) | 278 (50.5%) |
Services Occupations
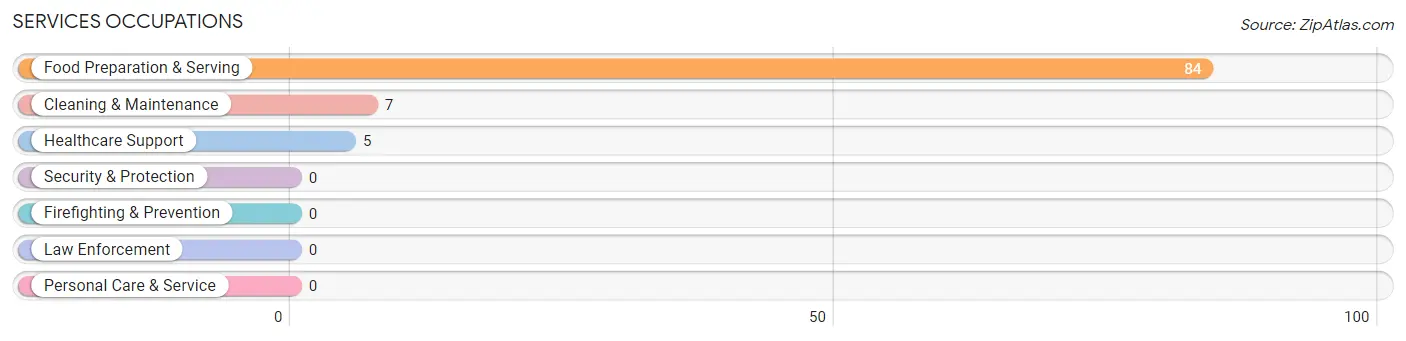
The most common Services occupations in Pinetops are Food Preparation & Serving (84 | 15.3%), Cleaning & Maintenance (7 | 1.3%), and Healthcare Support (5 | 0.9%).
Services Occupations by Sex
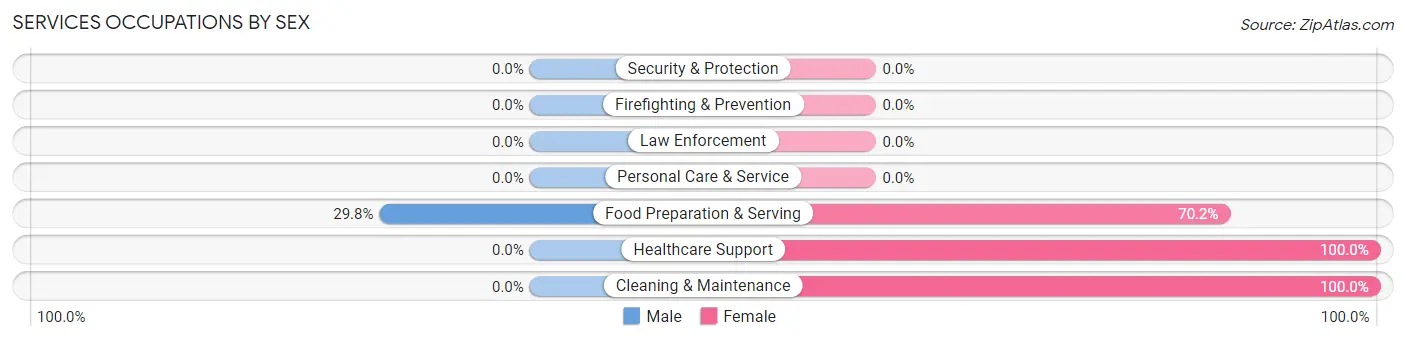
| Occupation | Male | Female |
| Healthcare Support | 0 (0.0%) | 5 (100.0%) |
| Security & Protection | 0 (0.0%) | 0 (0.0%) |
| Firefighting & Prevention | 0 (0.0%) | 0 (0.0%) |
| Law Enforcement | 0 (0.0%) | 0 (0.0%) |
| Food Preparation & Serving | 25 (29.8%) | 59 (70.2%) |
| Cleaning & Maintenance | 0 (0.0%) | 7 (100.0%) |
| Personal Care & Service | 0 (0.0%) | 0 (0.0%) |
| Total (Category) | 25 (26.0%) | 71 (74.0%) |
| Total (Overall) | 272 (49.4%) | 278 (50.5%) |
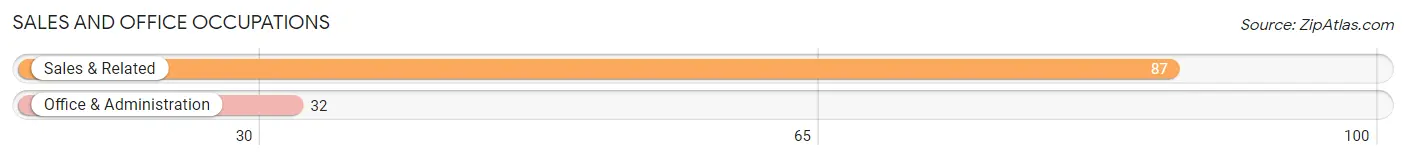
Sales and Office Occupations
The most common Sales and Office occupations in Pinetops are Sales & Related (87 | 15.8%), and Office & Administration (32 | 5.8%).
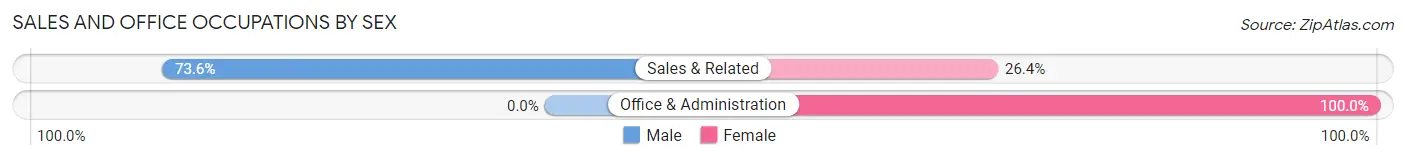
Sales and Office Occupations by Sex
| Occupation | Male | Female |
| Sales & Related | 64 (73.6%) | 23 (26.4%) |
| Office & Administration | 0 (0.0%) | 32 (100.0%) |
| Total (Category) | 64 (53.8%) | 55 (46.2%) |
| Total (Overall) | 272 (49.4%) | 278 (50.5%) |
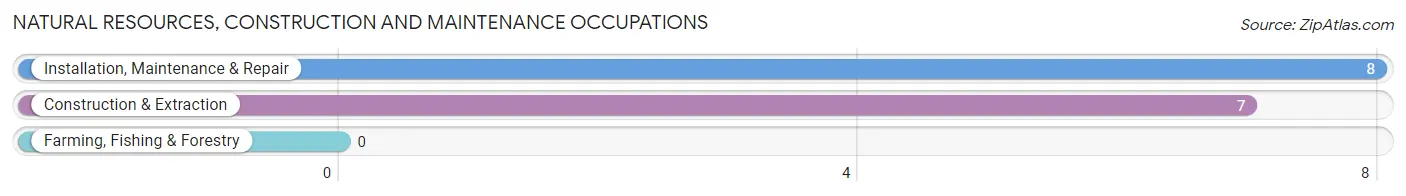
Natural Resources, Construction and Maintenance Occupations
The most common Natural Resources, Construction and Maintenance occupations in Pinetops are Installation, Maintenance & Repair (8 | 1.5%), and Construction & Extraction (7 | 1.3%).
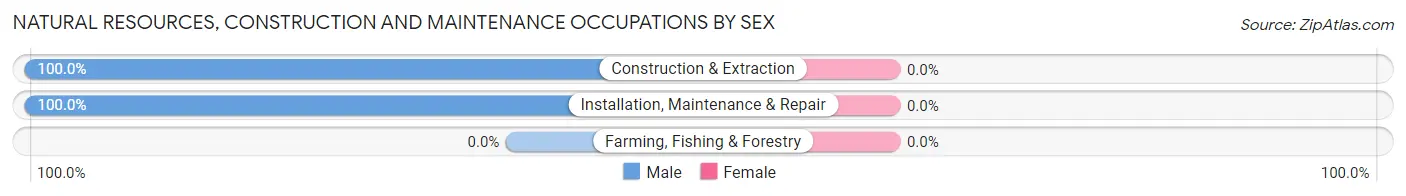
Natural Resources, Construction and Maintenance Occupations by Sex
| Occupation | Male | Female |
| Farming, Fishing & Forestry | 0 (0.0%) | 0 (0.0%) |
| Construction & Extraction | 7 (100.0%) | 0 (0.0%) |
| Installation, Maintenance & Repair | 8 (100.0%) | 0 (0.0%) |
| Total (Category) | 15 (100.0%) | 0 (0.0%) |
| Total (Overall) | 272 (49.4%) | 278 (50.5%) |
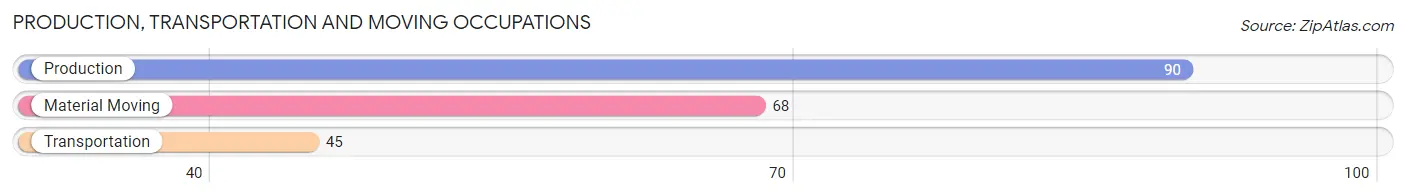
Production, Transportation and Moving Occupations
The most common Production, Transportation and Moving occupations in Pinetops are Production (90 | 16.4%), Material Moving (68 | 12.4%), and Transportation (45 | 8.2%).
Production, Transportation and Moving Occupations by Sex
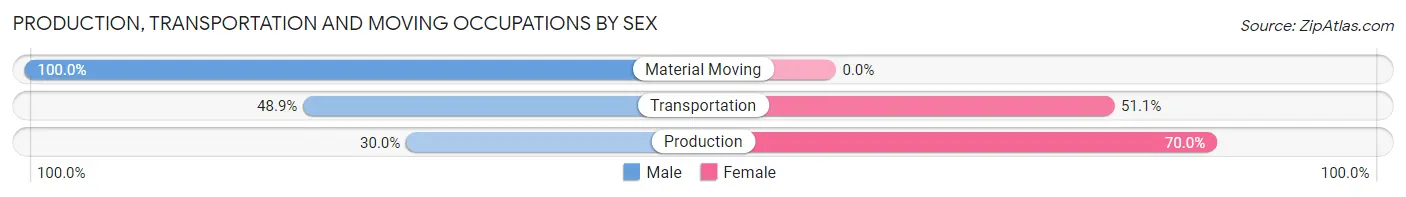
| Occupation | Male | Female |
| Production | 27 (30.0%) | 63 (70.0%) |
| Transportation | 22 (48.9%) | 23 (51.1%) |
| Material Moving | 68 (100.0%) | 0 (0.0%) |
| Total (Category) | 117 (57.6%) | 86 (42.4%) |
| Total (Overall) | 272 (49.4%) | 278 (50.5%) |
Employment Industries by Sex in Pinetops
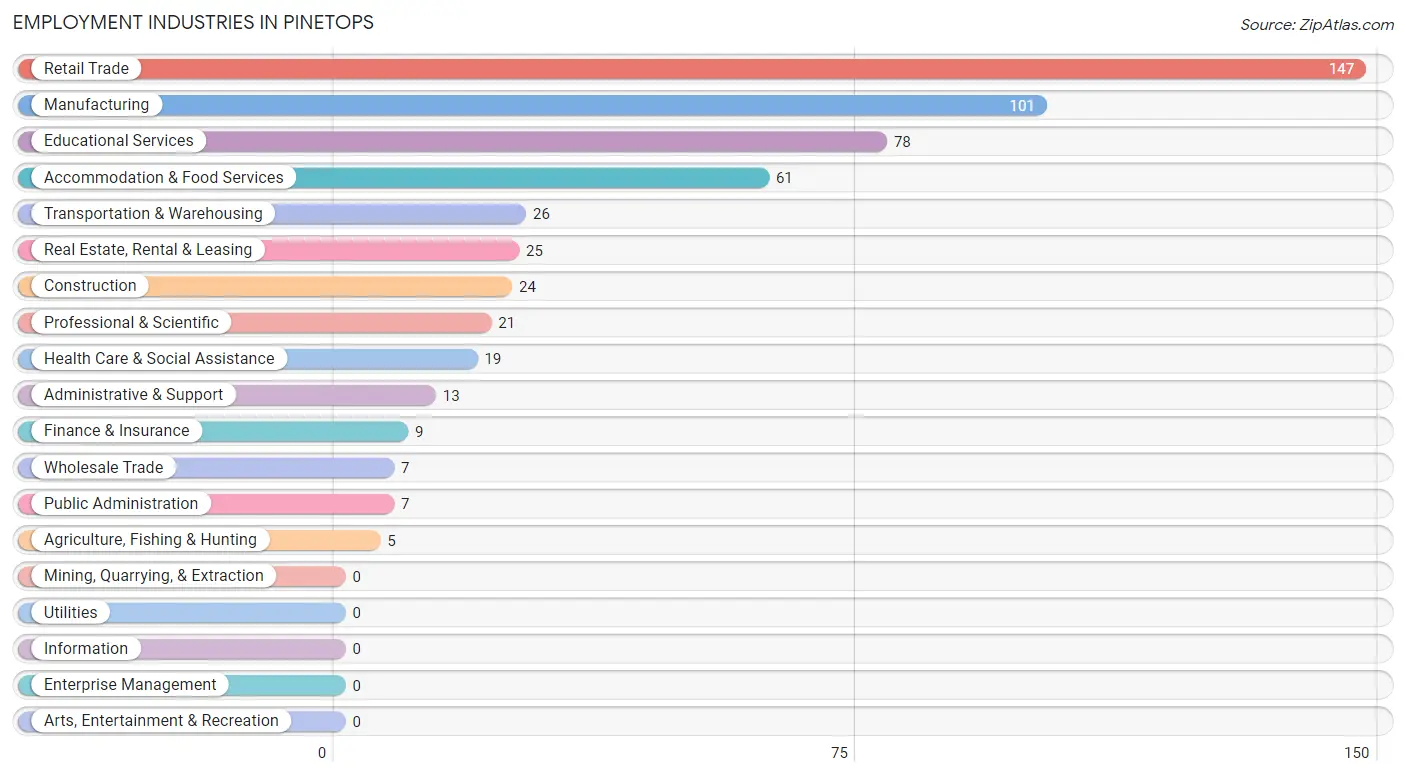
Employment Industries in Pinetops
The major employment industries in Pinetops include Retail Trade (147 | 26.7%), Manufacturing (101 | 18.4%), Educational Services (78 | 14.2%), Accommodation & Food Services (61 | 11.1%), and Transportation & Warehousing (26 | 4.7%).
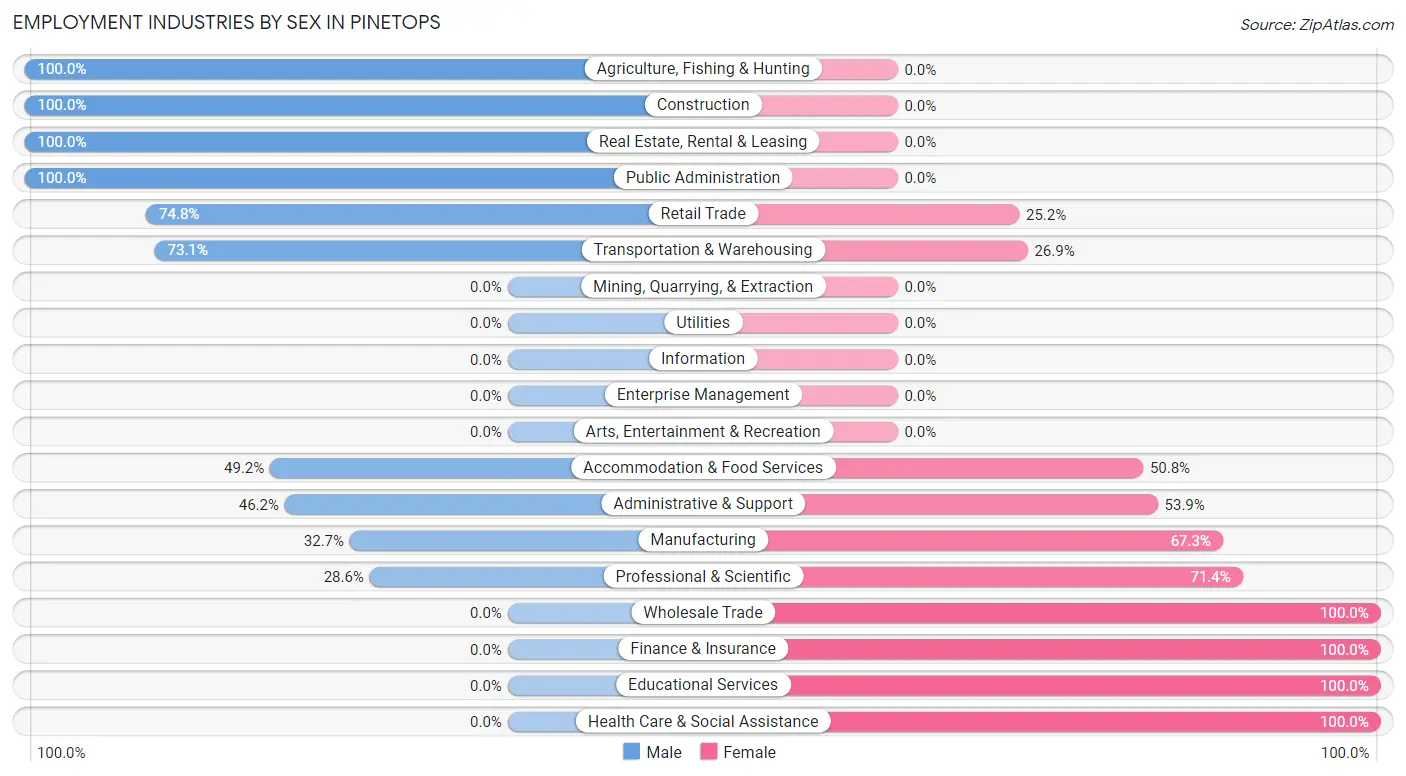
Employment Industries by Sex in Pinetops
The Pinetops industries that see more men than women are Agriculture, Fishing & Hunting (100.0%), Construction (100.0%), and Real Estate, Rental & Leasing (100.0%), whereas the industries that tend to have a higher number of women are Wholesale Trade (100.0%), Finance & Insurance (100.0%), and Educational Services (100.0%).
| Industry | Male | Female |
| Agriculture, Fishing & Hunting | 5 (100.0%) | 0 (0.0%) |
| Mining, Quarrying, & Extraction | 0 (0.0%) | 0 (0.0%) |
| Construction | 24 (100.0%) | 0 (0.0%) |
| Manufacturing | 33 (32.7%) | 68 (67.3%) |
| Wholesale Trade | 0 (0.0%) | 7 (100.0%) |
| Retail Trade | 110 (74.8%) | 37 (25.2%) |
| Transportation & Warehousing | 19 (73.1%) | 7 (26.9%) |
| Utilities | 0 (0.0%) | 0 (0.0%) |
| Information | 0 (0.0%) | 0 (0.0%) |
| Finance & Insurance | 0 (0.0%) | 9 (100.0%) |
| Real Estate, Rental & Leasing | 25 (100.0%) | 0 (0.0%) |
| Professional & Scientific | 6 (28.6%) | 15 (71.4%) |
| Enterprise Management | 0 (0.0%) | 0 (0.0%) |
| Administrative & Support | 6 (46.2%) | 7 (53.8%) |
| Educational Services | 0 (0.0%) | 78 (100.0%) |
| Health Care & Social Assistance | 0 (0.0%) | 19 (100.0%) |
| Arts, Entertainment & Recreation | 0 (0.0%) | 0 (0.0%) |
| Accommodation & Food Services | 30 (49.2%) | 31 (50.8%) |
| Public Administration | 7 (100.0%) | 0 (0.0%) |
| Total | 272 (49.4%) | 278 (50.5%) |
Education in Pinetops
School Enrollment in Pinetops
The most common levels of schooling among the 285 students in Pinetops are high school (76 | 26.7%), elementary school (72 | 25.3%), and middle school (64 | 22.5%).
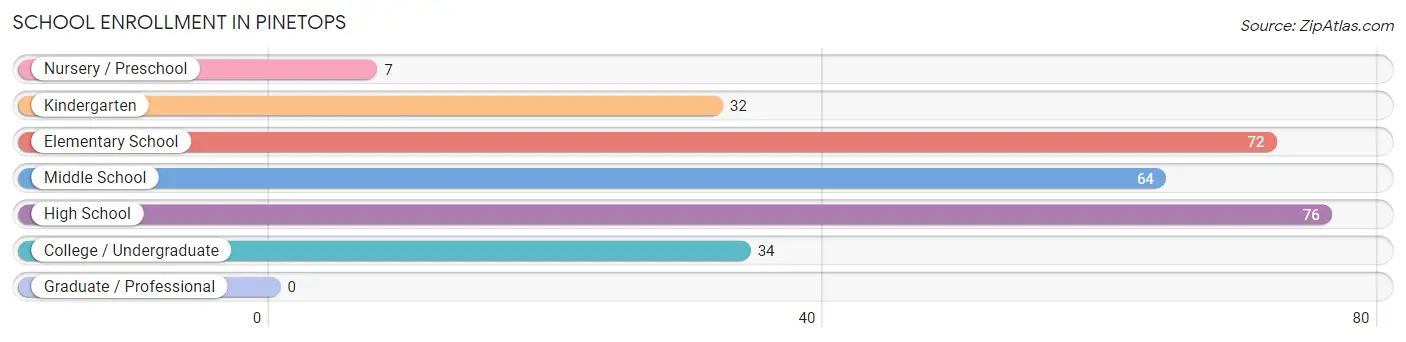
| School Level | # Students | % Students |
| Nursery / Preschool | 7 | 2.5% |
| Kindergarten | 32 | 11.2% |
| Elementary School | 72 | 25.3% |
| Middle School | 64 | 22.5% |
| High School | 76 | 26.7% |
| College / Undergraduate | 34 | 11.9% |
| Graduate / Professional | 0 | 0.0% |
| Total | 285 | 100.0% |
School Enrollment by Age by Funding Source in Pinetops
Out of a total of 285 students who are enrolled in schools in Pinetops, 15 (5.3%) attend a private institution, while the remaining 270 (94.7%) are enrolled in public schools. The age group of 10 to 14 year olds has the highest likelihood of being enrolled in private schools, with 15 (19.0% in the age bracket) enrolled. Conversely, the age group of 3 to 4 year olds has the lowest likelihood of being enrolled in a private school, with 3 (100.0% in the age bracket) attending a public institution.
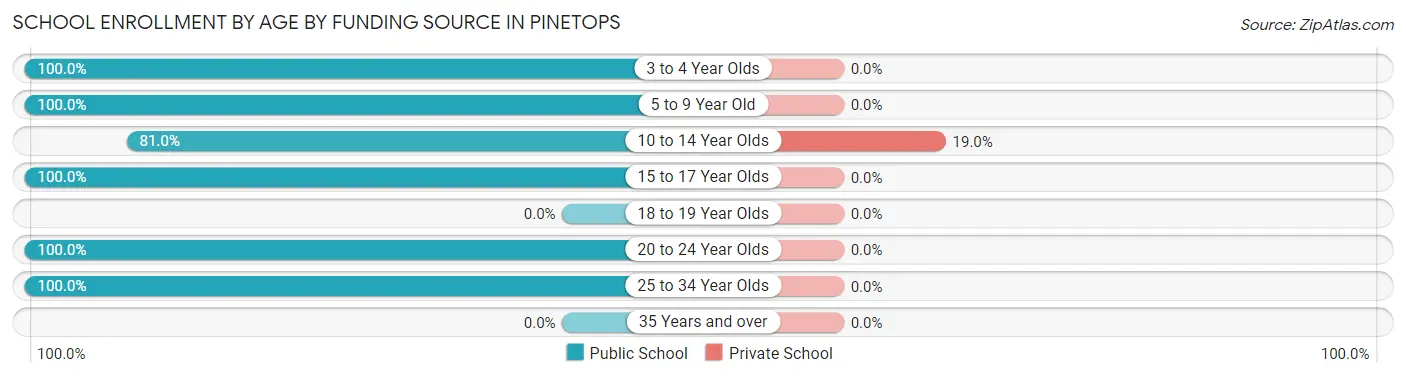
| Age Bracket | Public School | Private School |
| 3 to 4 Year Olds | 3 (100.0%) | 0 (0.0%) |
| 5 to 9 Year Old | 93 (100.0%) | 0 (0.0%) |
| 10 to 14 Year Olds | 64 (81.0%) | 15 (19.0%) |
| 15 to 17 Year Olds | 76 (100.0%) | 0 (0.0%) |
| 18 to 19 Year Olds | 0 (0.0%) | 0 (0.0%) |
| 20 to 24 Year Olds | 27 (100.0%) | 0 (0.0%) |
| 25 to 34 Year Olds | 7 (100.0%) | 0 (0.0%) |
| 35 Years and over | 0 (0.0%) | 0 (0.0%) |
| Total | 270 (94.7%) | 15 (5.3%) |
Educational Attainment by Field of Study in Pinetops
Education (36 | 27.1%), social sciences (25 | 18.8%), bio, nature & agricultural (21 | 15.8%), science & technology (21 | 15.8%), and business (11 | 8.3%) are the most common fields of study among 133 individuals in Pinetops who have obtained a bachelor's degree or higher.
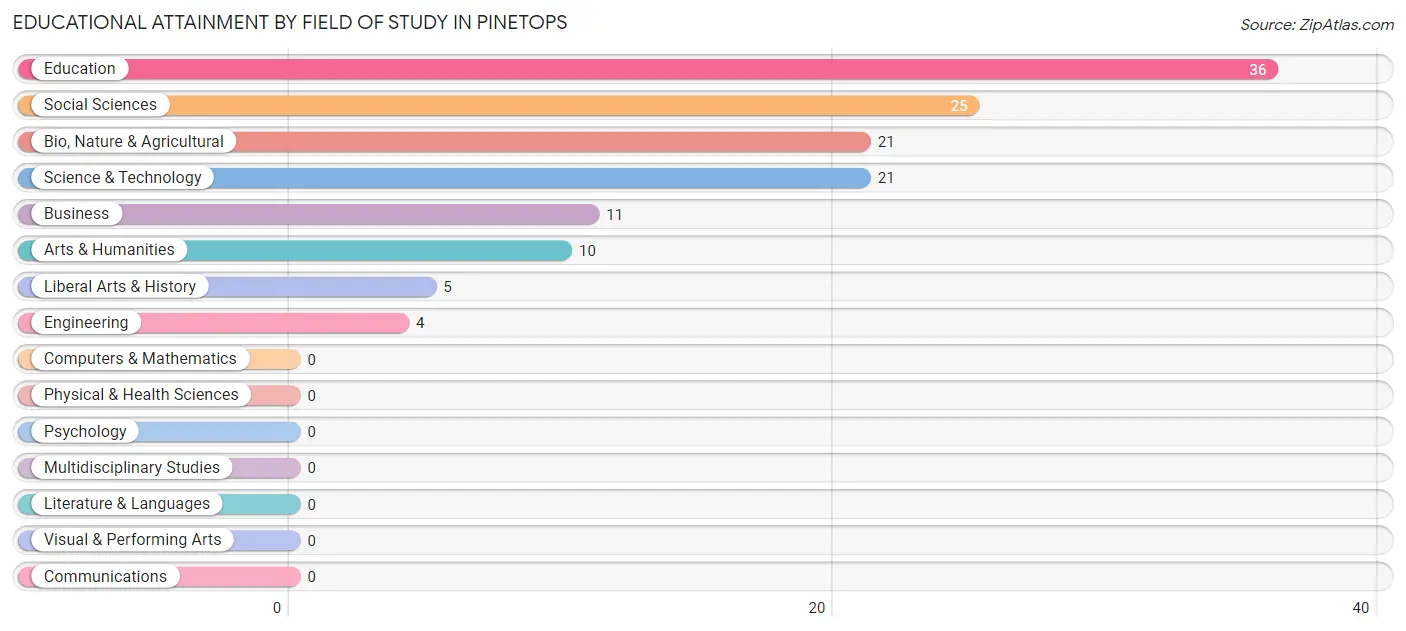
| Field of Study | # Graduates | % Graduates |
| Computers & Mathematics | 0 | 0.0% |
| Bio, Nature & Agricultural | 21 | 15.8% |
| Physical & Health Sciences | 0 | 0.0% |
| Psychology | 0 | 0.0% |
| Social Sciences | 25 | 18.8% |
| Engineering | 4 | 3.0% |
| Multidisciplinary Studies | 0 | 0.0% |
| Science & Technology | 21 | 15.8% |
| Business | 11 | 8.3% |
| Education | 36 | 27.1% |
| Literature & Languages | 0 | 0.0% |
| Liberal Arts & History | 5 | 3.8% |
| Visual & Performing Arts | 0 | 0.0% |
| Communications | 0 | 0.0% |
| Arts & Humanities | 10 | 7.5% |
| Total | 133 | 100.0% |
Transportation & Commute in Pinetops
Vehicle Availability by Sex in Pinetops
The most prevalent vehicle ownership categories in Pinetops are males with 2 vehicles (135, accounting for 50.9%) and females with 2 vehicles (134, making up 58.2%).
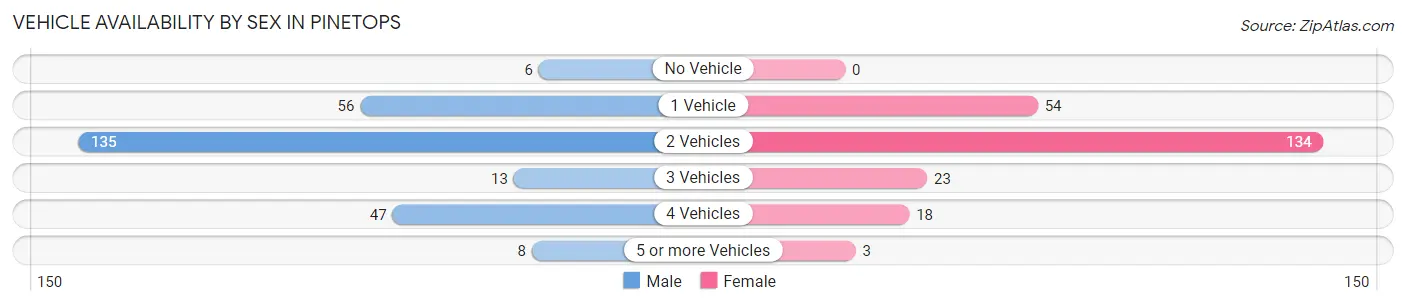
| Vehicles Available | Male | Female |
| No Vehicle | 6 (2.3%) | 0 (0.0%) |
| 1 Vehicle | 56 (21.1%) | 54 (23.3%) |
| 2 Vehicles | 135 (50.9%) | 134 (57.8%) |
| 3 Vehicles | 13 (4.9%) | 23 (9.9%) |
| 4 Vehicles | 47 (17.7%) | 18 (7.8%) |
| 5 or more Vehicles | 8 (3.0%) | 3 (1.3%) |
| Total | 265 (100.0%) | 232 (100.0%) |
Commute Time in Pinetops
The most frequently occuring commute durations in Pinetops are 30 to 34 minutes (150 commuters, 32.1%), 5 to 9 minutes (132 commuters, 28.3%), and 15 to 19 minutes (53 commuters, 11.4%).
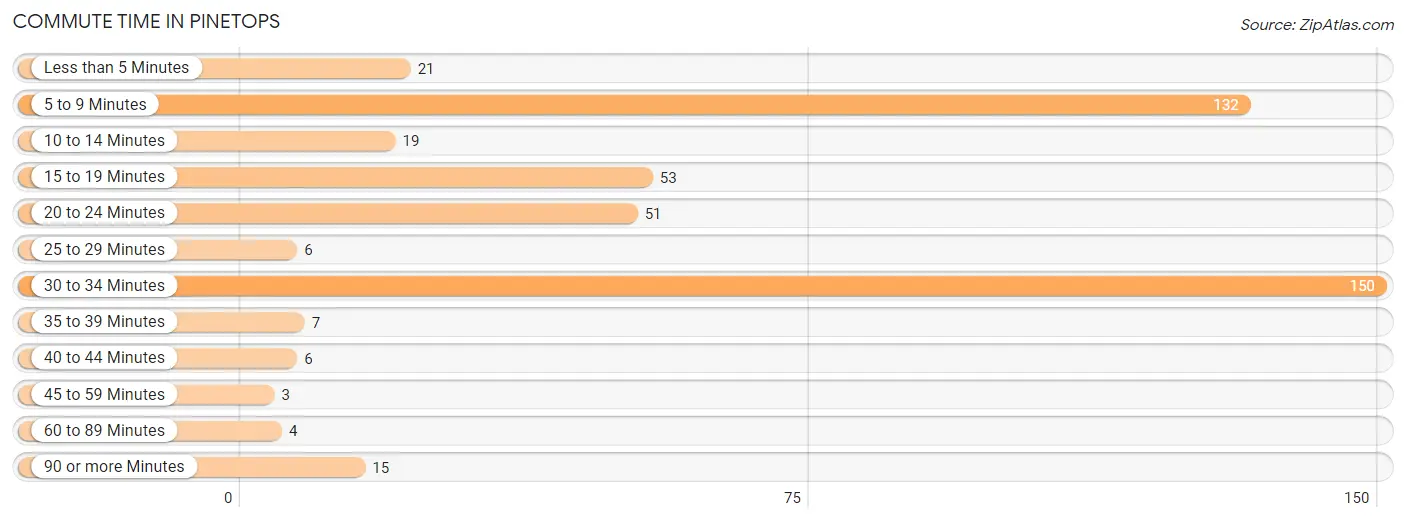
| Commute Time | # Commuters | % Commuters |
| Less than 5 Minutes | 21 | 4.5% |
| 5 to 9 Minutes | 132 | 28.3% |
| 10 to 14 Minutes | 19 | 4.1% |
| 15 to 19 Minutes | 53 | 11.4% |
| 20 to 24 Minutes | 51 | 10.9% |
| 25 to 29 Minutes | 6 | 1.3% |
| 30 to 34 Minutes | 150 | 32.1% |
| 35 to 39 Minutes | 7 | 1.5% |
| 40 to 44 Minutes | 6 | 1.3% |
| 45 to 59 Minutes | 3 | 0.6% |
| 60 to 89 Minutes | 4 | 0.9% |
| 90 or more Minutes | 15 | 3.2% |
Commute Time by Sex in Pinetops
The most common commute times in Pinetops are 30 to 34 minutes (101 commuters, 38.1%) for males and 5 to 9 minutes (87 commuters, 43.1%) for females.
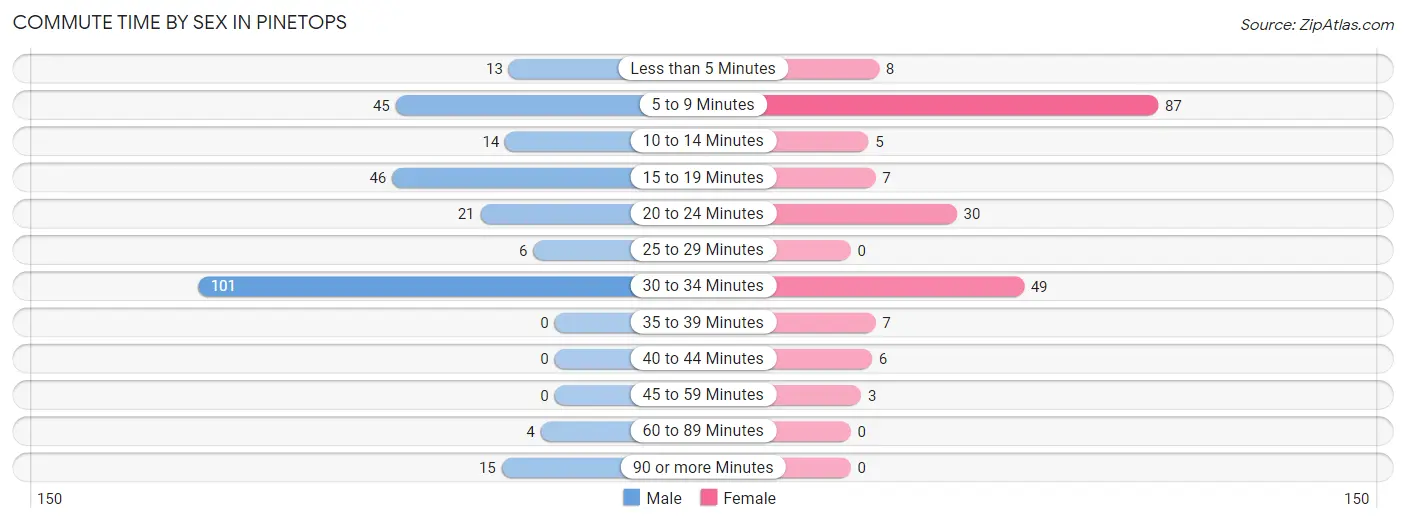
| Commute Time | Male | Female |
| Less than 5 Minutes | 13 (4.9%) | 8 (4.0%) |
| 5 to 9 Minutes | 45 (17.0%) | 87 (43.1%) |
| 10 to 14 Minutes | 14 (5.3%) | 5 (2.5%) |
| 15 to 19 Minutes | 46 (17.4%) | 7 (3.5%) |
| 20 to 24 Minutes | 21 (7.9%) | 30 (14.8%) |
| 25 to 29 Minutes | 6 (2.3%) | 0 (0.0%) |
| 30 to 34 Minutes | 101 (38.1%) | 49 (24.3%) |
| 35 to 39 Minutes | 0 (0.0%) | 7 (3.5%) |
| 40 to 44 Minutes | 0 (0.0%) | 6 (3.0%) |
| 45 to 59 Minutes | 0 (0.0%) | 3 (1.5%) |
| 60 to 89 Minutes | 4 (1.5%) | 0 (0.0%) |
| 90 or more Minutes | 15 (5.7%) | 0 (0.0%) |
Time of Departure to Work by Sex in Pinetops
The most frequent times of departure to work in Pinetops are 6:30 AM to 6:59 AM (74, 27.9%) for males and 6:30 AM to 6:59 AM (63, 31.2%) for females.
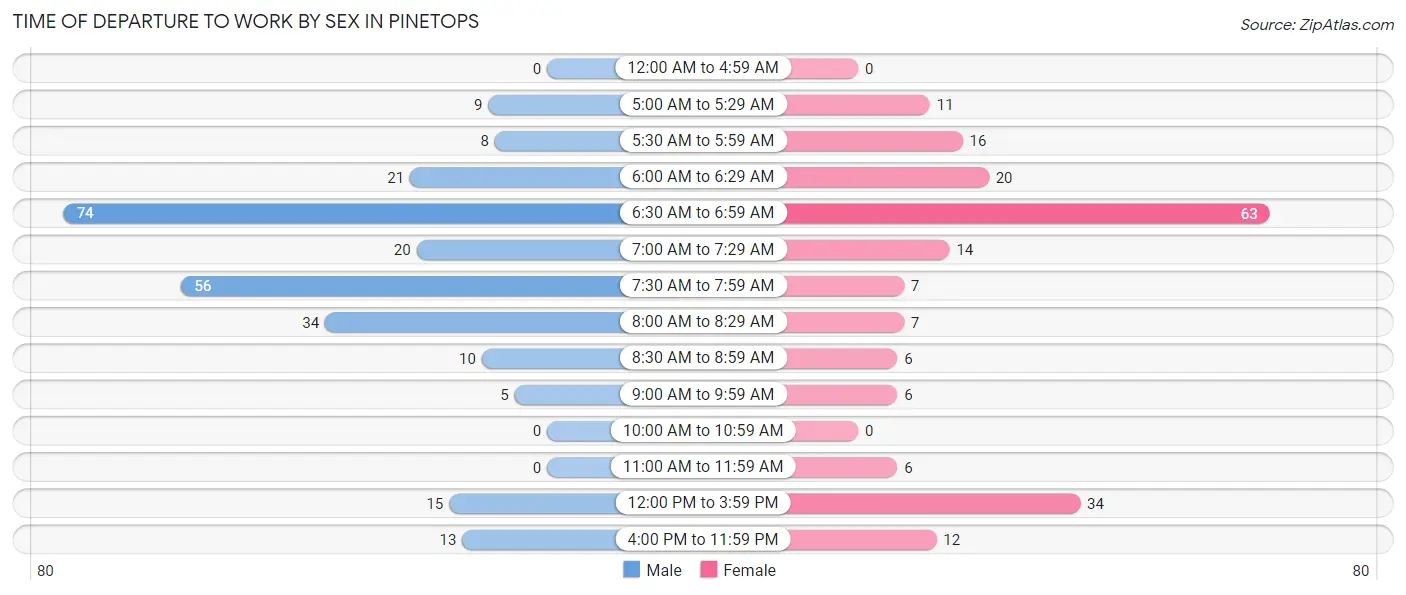
| Time of Departure | Male | Female |
| 12:00 AM to 4:59 AM | 0 (0.0%) | 0 (0.0%) |
| 5:00 AM to 5:29 AM | 9 (3.4%) | 11 (5.4%) |
| 5:30 AM to 5:59 AM | 8 (3.0%) | 16 (7.9%) |
| 6:00 AM to 6:29 AM | 21 (7.9%) | 20 (9.9%) |
| 6:30 AM to 6:59 AM | 74 (27.9%) | 63 (31.2%) |
| 7:00 AM to 7:29 AM | 20 (7.5%) | 14 (6.9%) |
| 7:30 AM to 7:59 AM | 56 (21.1%) | 7 (3.5%) |
| 8:00 AM to 8:29 AM | 34 (12.8%) | 7 (3.5%) |
| 8:30 AM to 8:59 AM | 10 (3.8%) | 6 (3.0%) |
| 9:00 AM to 9:59 AM | 5 (1.9%) | 6 (3.0%) |
| 10:00 AM to 10:59 AM | 0 (0.0%) | 0 (0.0%) |
| 11:00 AM to 11:59 AM | 0 (0.0%) | 6 (3.0%) |
| 12:00 PM to 3:59 PM | 15 (5.7%) | 34 (16.8%) |
| 4:00 PM to 11:59 PM | 13 (4.9%) | 12 (5.9%) |
| Total | 265 (100.0%) | 202 (100.0%) |
Housing Occupancy in Pinetops
Occupancy by Ownership in Pinetops
Of the total 612 dwellings in Pinetops, owner-occupied units account for 318 (52.0%), while renter-occupied units make up 294 (48.0%).
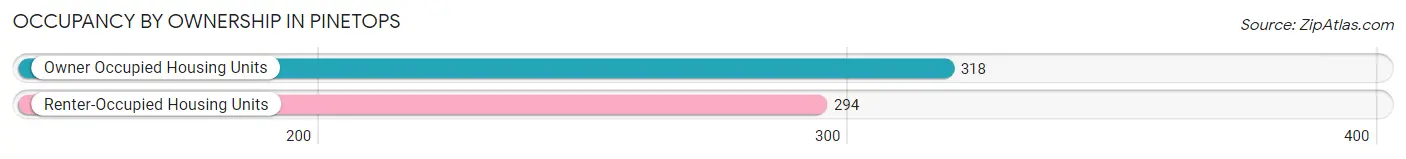
| Occupancy | # Housing Units | % Housing Units |
| Owner Occupied Housing Units | 318 | 52.0% |
| Renter-Occupied Housing Units | 294 | 48.0% |
| Total Occupied Housing Units | 612 | 100.0% |
Occupancy by Household Size in Pinetops
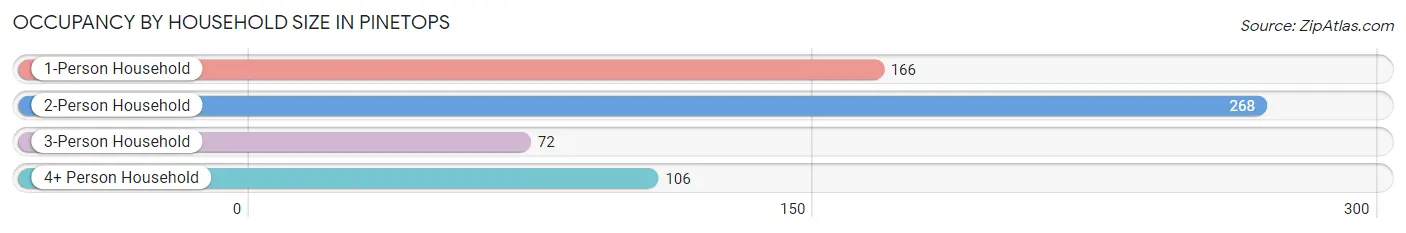
| Household Size | # Housing Units | % Housing Units |
| 1-Person Household | 166 | 27.1% |
| 2-Person Household | 268 | 43.8% |
| 3-Person Household | 72 | 11.8% |
| 4+ Person Household | 106 | 17.3% |
| Total Housing Units | 612 | 100.0% |
Occupancy by Ownership by Household Size in Pinetops
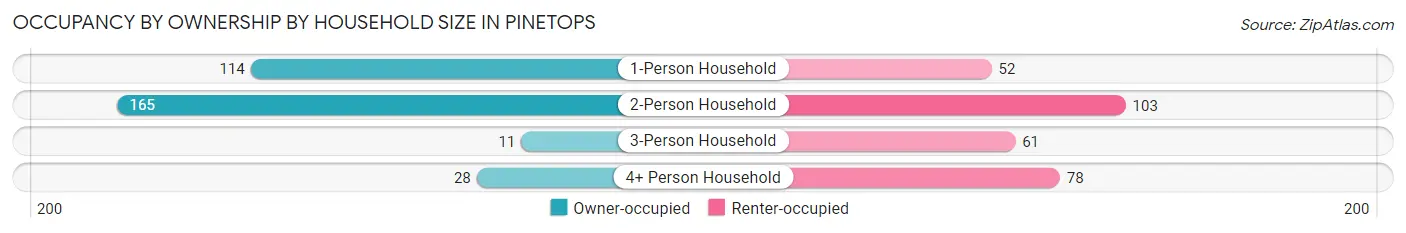
| Household Size | Owner-occupied | Renter-occupied |
| 1-Person Household | 114 (68.7%) | 52 (31.3%) |
| 2-Person Household | 165 (61.6%) | 103 (38.4%) |
| 3-Person Household | 11 (15.3%) | 61 (84.7%) |
| 4+ Person Household | 28 (26.4%) | 78 (73.6%) |
| Total Housing Units | 318 (52.0%) | 294 (48.0%) |
Occupancy by Educational Attainment in Pinetops
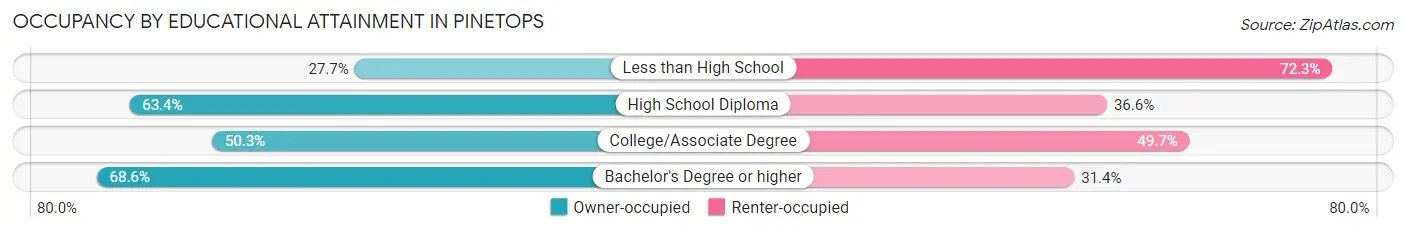
| Household Size | Owner-occupied | Renter-occupied |
| Less than High School | 39 (27.7%) | 102 (72.3%) |
| High School Diploma | 142 (63.4%) | 82 (36.6%) |
| College/Associate Degree | 89 (50.3%) | 88 (49.7%) |
| Bachelor's Degree or higher | 48 (68.6%) | 22 (31.4%) |
Occupancy by Age of Householder in Pinetops
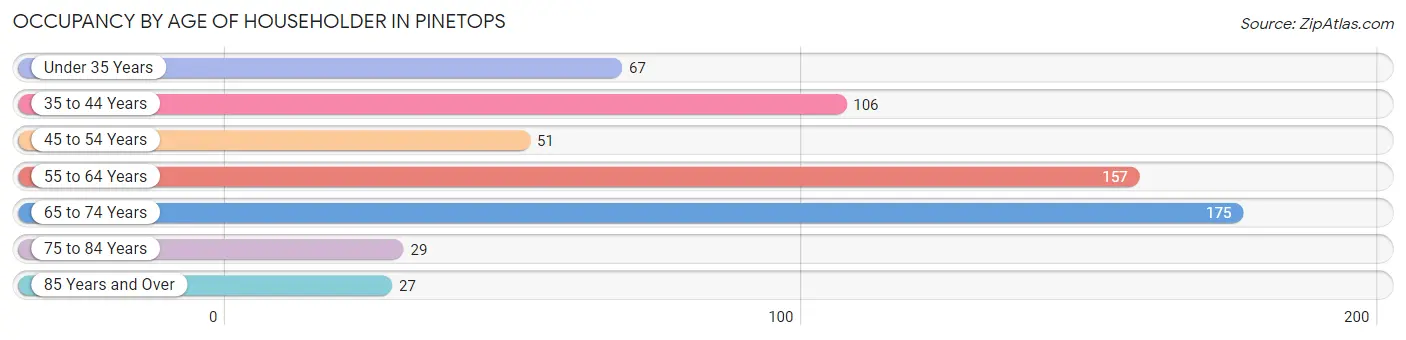
| Age Bracket | # Households | % Households |
| Under 35 Years | 67 | 11.0% |
| 35 to 44 Years | 106 | 17.3% |
| 45 to 54 Years | 51 | 8.3% |
| 55 to 64 Years | 157 | 25.7% |
| 65 to 74 Years | 175 | 28.6% |
| 75 to 84 Years | 29 | 4.7% |
| 85 Years and Over | 27 | 4.4% |
| Total | 612 | 100.0% |
Housing Finances in Pinetops
Median Income by Occupancy in Pinetops
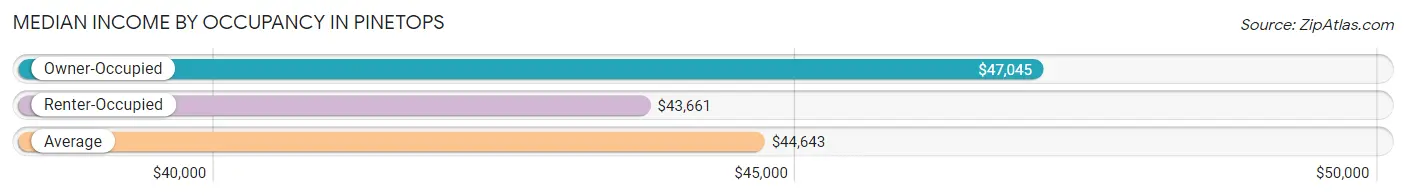
| Occupancy Type | # Households | Median Income |
| Owner-Occupied | 318 (52.0%) | $47,045 |
| Renter-Occupied | 294 (48.0%) | $43,661 |
| Average | 612 (100.0%) | $44,643 |
Occupancy by Householder Income Bracket in Pinetops
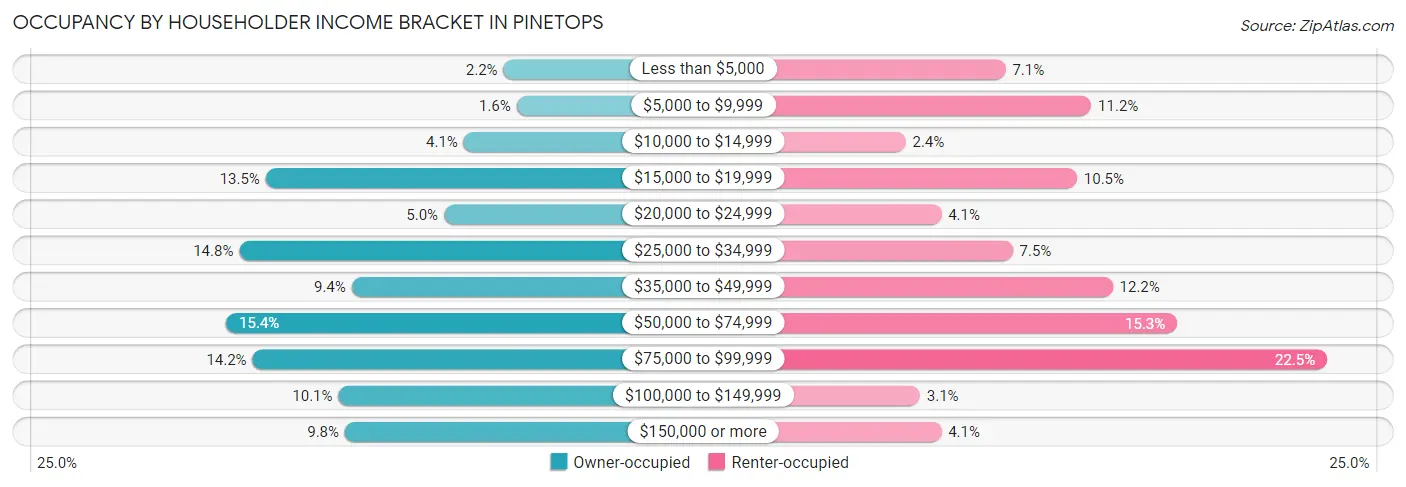
| Income Bracket | Owner-occupied | Renter-occupied |
| Less than $5,000 | 7 (2.2%) | 21 (7.1%) |
| $5,000 to $9,999 | 5 (1.6%) | 33 (11.2%) |
| $10,000 to $14,999 | 13 (4.1%) | 7 (2.4%) |
| $15,000 to $19,999 | 43 (13.5%) | 31 (10.5%) |
| $20,000 to $24,999 | 16 (5.0%) | 12 (4.1%) |
| $25,000 to $34,999 | 47 (14.8%) | 22 (7.5%) |
| $35,000 to $49,999 | 30 (9.4%) | 36 (12.2%) |
| $50,000 to $74,999 | 49 (15.4%) | 45 (15.3%) |
| $75,000 to $99,999 | 45 (14.1%) | 66 (22.5%) |
| $100,000 to $149,999 | 32 (10.1%) | 9 (3.1%) |
| $150,000 or more | 31 (9.8%) | 12 (4.1%) |
| Total | 318 (100.0%) | 294 (100.0%) |
Monthly Housing Cost Tiers in Pinetops
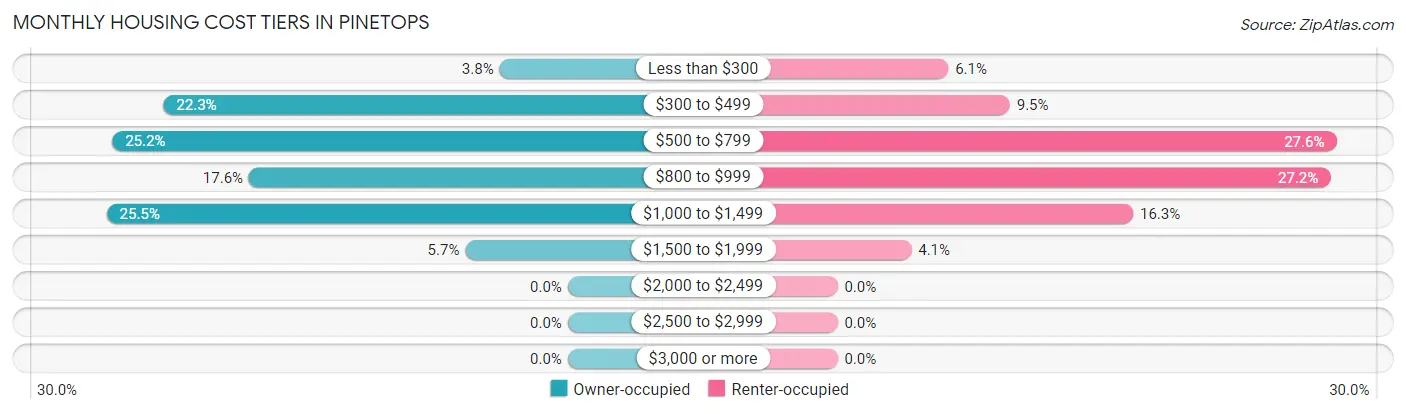
| Monthly Cost | Owner-occupied | Renter-occupied |
| Less than $300 | 12 (3.8%) | 18 (6.1%) |
| $300 to $499 | 71 (22.3%) | 28 (9.5%) |
| $500 to $799 | 80 (25.2%) | 81 (27.6%) |
| $800 to $999 | 56 (17.6%) | 80 (27.2%) |
| $1,000 to $1,499 | 81 (25.5%) | 48 (16.3%) |
| $1,500 to $1,999 | 18 (5.7%) | 12 (4.1%) |
| $2,000 to $2,499 | 0 (0.0%) | 0 (0.0%) |
| $2,500 to $2,999 | 0 (0.0%) | 0 (0.0%) |
| $3,000 or more | 0 (0.0%) | 0 (0.0%) |
| Total | 318 (100.0%) | 294 (100.0%) |
Physical Housing Characteristics in Pinetops
Housing Structures in Pinetops
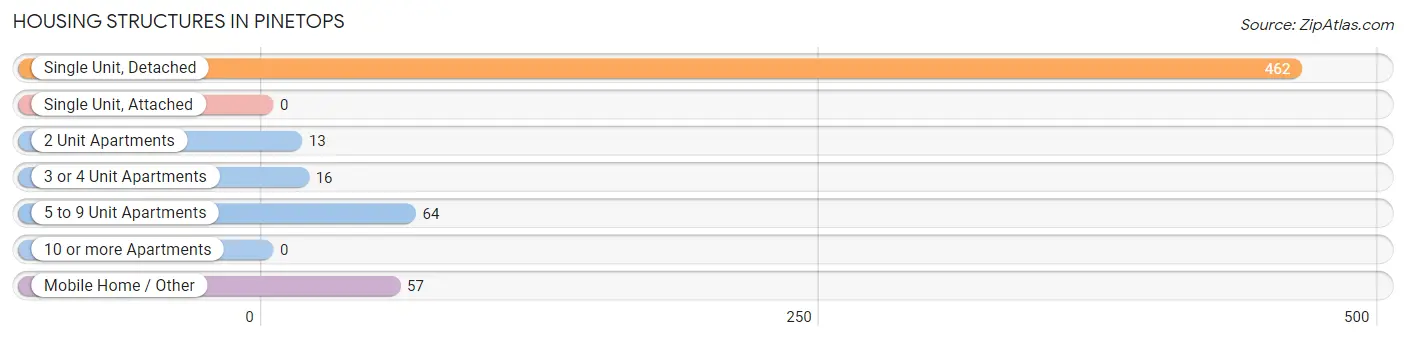
| Structure Type | # Housing Units | % Housing Units |
| Single Unit, Detached | 462 | 75.5% |
| Single Unit, Attached | 0 | 0.0% |
| 2 Unit Apartments | 13 | 2.1% |
| 3 or 4 Unit Apartments | 16 | 2.6% |
| 5 to 9 Unit Apartments | 64 | 10.5% |
| 10 or more Apartments | 0 | 0.0% |
| Mobile Home / Other | 57 | 9.3% |
| Total | 612 | 100.0% |
Housing Structures by Occupancy in Pinetops
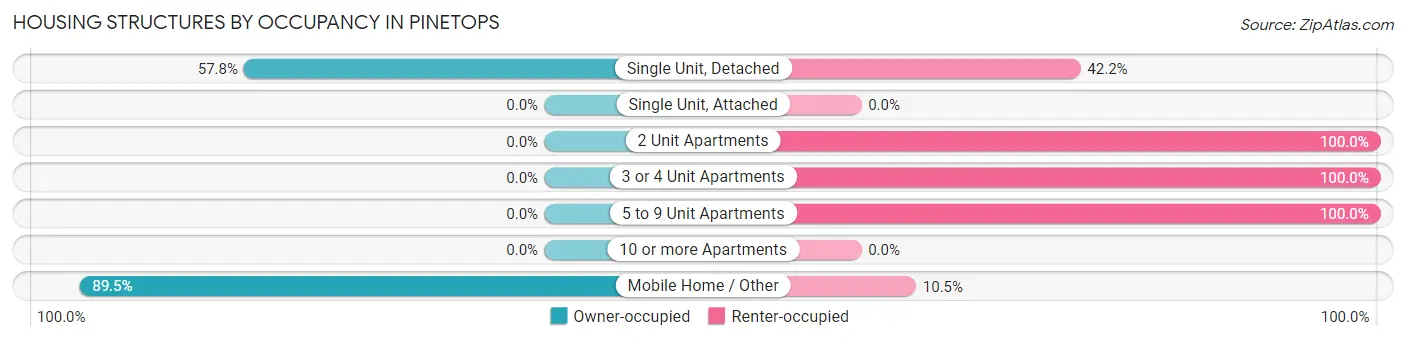
| Structure Type | Owner-occupied | Renter-occupied |
| Single Unit, Detached | 267 (57.8%) | 195 (42.2%) |
| Single Unit, Attached | 0 (0.0%) | 0 (0.0%) |
| 2 Unit Apartments | 0 (0.0%) | 13 (100.0%) |
| 3 or 4 Unit Apartments | 0 (0.0%) | 16 (100.0%) |
| 5 to 9 Unit Apartments | 0 (0.0%) | 64 (100.0%) |
| 10 or more Apartments | 0 (0.0%) | 0 (0.0%) |
| Mobile Home / Other | 51 (89.5%) | 6 (10.5%) |
| Total | 318 (52.0%) | 294 (48.0%) |
Housing Structures by Number of Rooms in Pinetops
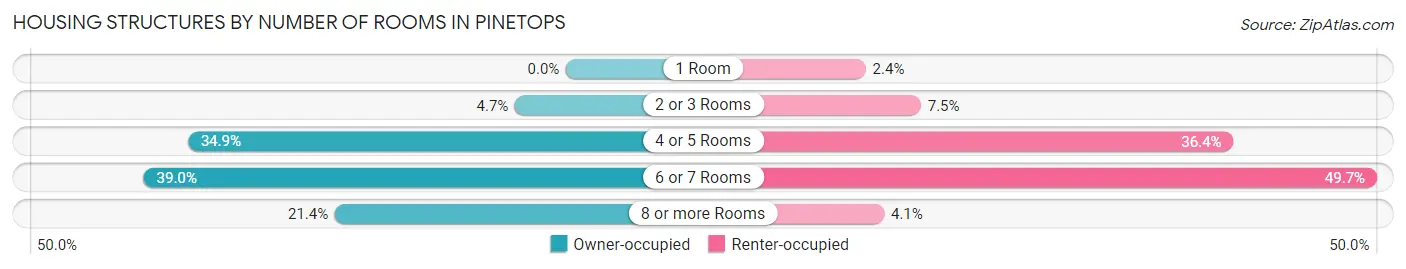
| Number of Rooms | Owner-occupied | Renter-occupied |
| 1 Room | 0 (0.0%) | 7 (2.4%) |
| 2 or 3 Rooms | 15 (4.7%) | 22 (7.5%) |
| 4 or 5 Rooms | 111 (34.9%) | 107 (36.4%) |
| 6 or 7 Rooms | 124 (39.0%) | 146 (49.7%) |
| 8 or more Rooms | 68 (21.4%) | 12 (4.1%) |
| Total | 318 (100.0%) | 294 (100.0%) |
Housing Structure by Heating Type in Pinetops
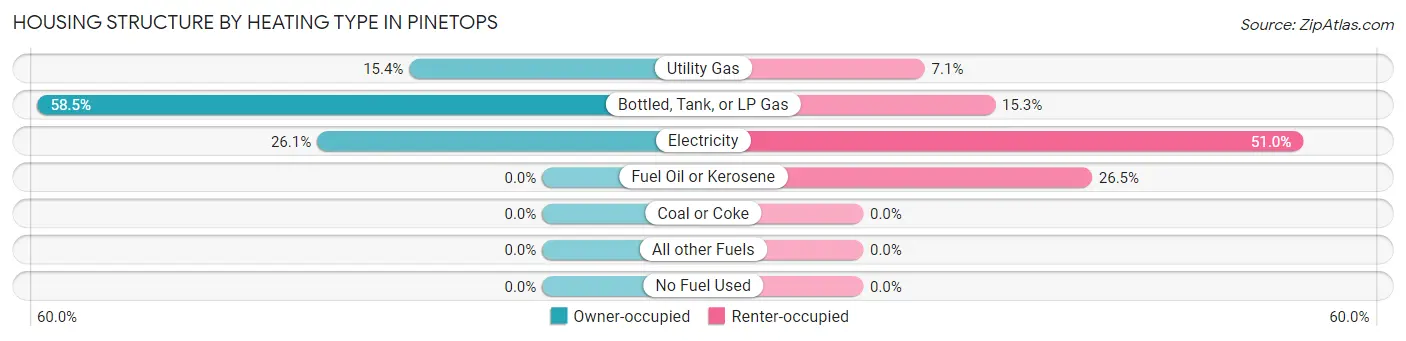
| Heating Type | Owner-occupied | Renter-occupied |
| Utility Gas | 49 (15.4%) | 21 (7.1%) |
| Bottled, Tank, or LP Gas | 186 (58.5%) | 45 (15.3%) |
| Electricity | 83 (26.1%) | 150 (51.0%) |
| Fuel Oil or Kerosene | 0 (0.0%) | 78 (26.5%) |
| Coal or Coke | 0 (0.0%) | 0 (0.0%) |
| All other Fuels | 0 (0.0%) | 0 (0.0%) |
| No Fuel Used | 0 (0.0%) | 0 (0.0%) |
| Total | 318 (100.0%) | 294 (100.0%) |
Household Vehicle Usage in Pinetops
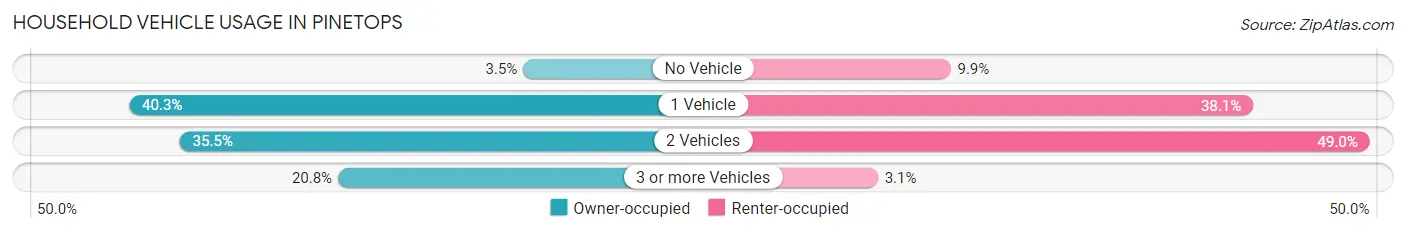
| Vehicles per Household | Owner-occupied | Renter-occupied |
| No Vehicle | 11 (3.5%) | 29 (9.9%) |
| 1 Vehicle | 128 (40.3%) | 112 (38.1%) |
| 2 Vehicles | 113 (35.5%) | 144 (49.0%) |
| 3 or more Vehicles | 66 (20.7%) | 9 (3.1%) |
| Total | 318 (100.0%) | 294 (100.0%) |
Real Estate & Mortgages in Pinetops
Real Estate and Mortgage Overview in Pinetops
| Characteristic | Without Mortgage | With Mortgage |
| Housing Units | 197 | 121 |
| Median Property Value | $110,400 | $133,500 |
| Median Household Income | $44,375 | $13 |
| Monthly Housing Costs | $560 | $0 |
| Real Estate Taxes | $1,230 | $0 |
Property Value by Mortgage Status in Pinetops
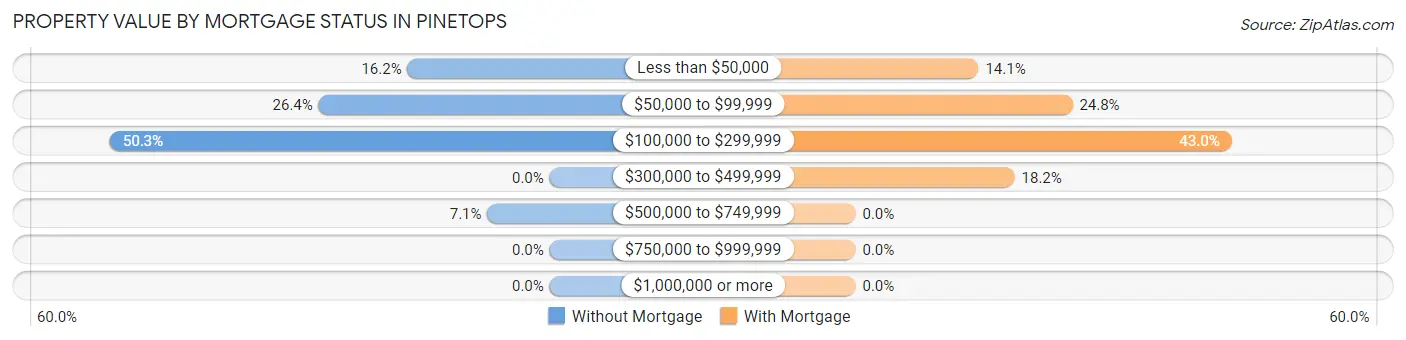
| Property Value | Without Mortgage | With Mortgage |
| Less than $50,000 | 32 (16.2%) | 17 (14.1%) |
| $50,000 to $99,999 | 52 (26.4%) | 30 (24.8%) |
| $100,000 to $299,999 | 99 (50.2%) | 52 (43.0%) |
| $300,000 to $499,999 | 0 (0.0%) | 22 (18.2%) |
| $500,000 to $749,999 | 14 (7.1%) | 0 (0.0%) |
| $750,000 to $999,999 | 0 (0.0%) | 0 (0.0%) |
| $1,000,000 or more | 0 (0.0%) | 0 (0.0%) |
| Total | 197 (100.0%) | 121 (100.0%) |
Household Income by Mortgage Status in Pinetops
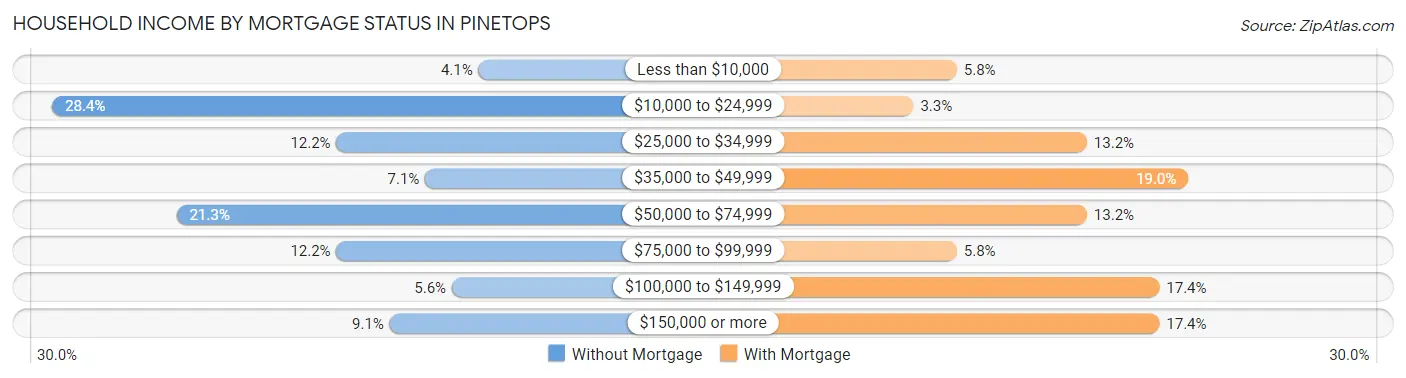
| Household Income | Without Mortgage | With Mortgage |
| Less than $10,000 | 8 (4.1%) | 7 (5.8%) |
| $10,000 to $24,999 | 56 (28.4%) | 4 (3.3%) |
| $25,000 to $34,999 | 24 (12.2%) | 16 (13.2%) |
| $35,000 to $49,999 | 14 (7.1%) | 23 (19.0%) |
| $50,000 to $74,999 | 42 (21.3%) | 16 (13.2%) |
| $75,000 to $99,999 | 24 (12.2%) | 7 (5.8%) |
| $100,000 to $149,999 | 11 (5.6%) | 21 (17.4%) |
| $150,000 or more | 18 (9.1%) | 21 (17.4%) |
| Total | 197 (100.0%) | 121 (100.0%) |
Property Value to Household Income Ratio in Pinetops
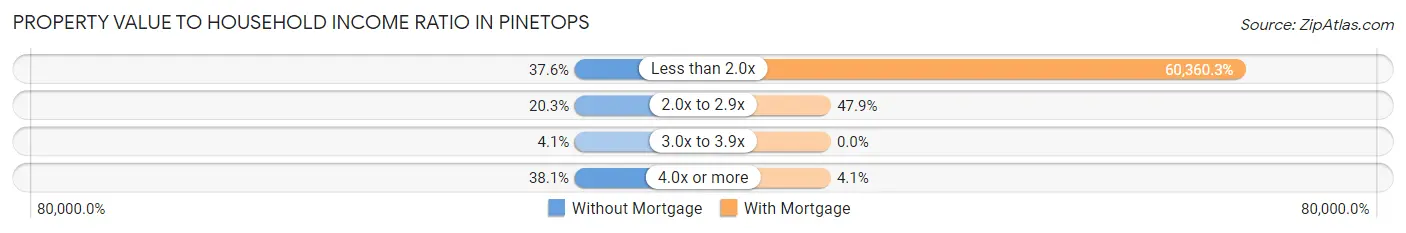
| Value-to-Income Ratio | Without Mortgage | With Mortgage |
| Less than 2.0x | 74 (37.6%) | 73,036 (60,360.3%) |
| 2.0x to 2.9x | 40 (20.3%) | 58 (47.9%) |
| 3.0x to 3.9x | 8 (4.1%) | 0 (0.0%) |
| 4.0x or more | 75 (38.1%) | 5 (4.1%) |
| Total | 197 (100.0%) | 121 (100.0%) |
Real Estate Taxes by Mortgage Status in Pinetops
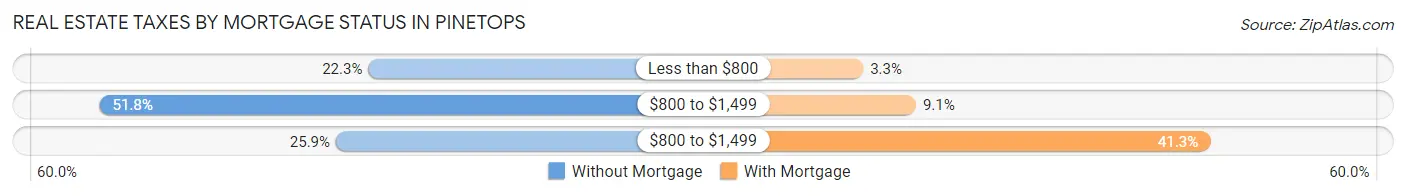
| Property Taxes | Without Mortgage | With Mortgage |
| Less than $800 | 44 (22.3%) | 4 (3.3%) |
| $800 to $1,499 | 102 (51.8%) | 11 (9.1%) |
| $800 to $1,499 | 51 (25.9%) | 50 (41.3%) |
| Total | 197 (100.0%) | 121 (100.0%) |
Health & Disability in Pinetops
Health Insurance Coverage by Age in Pinetops
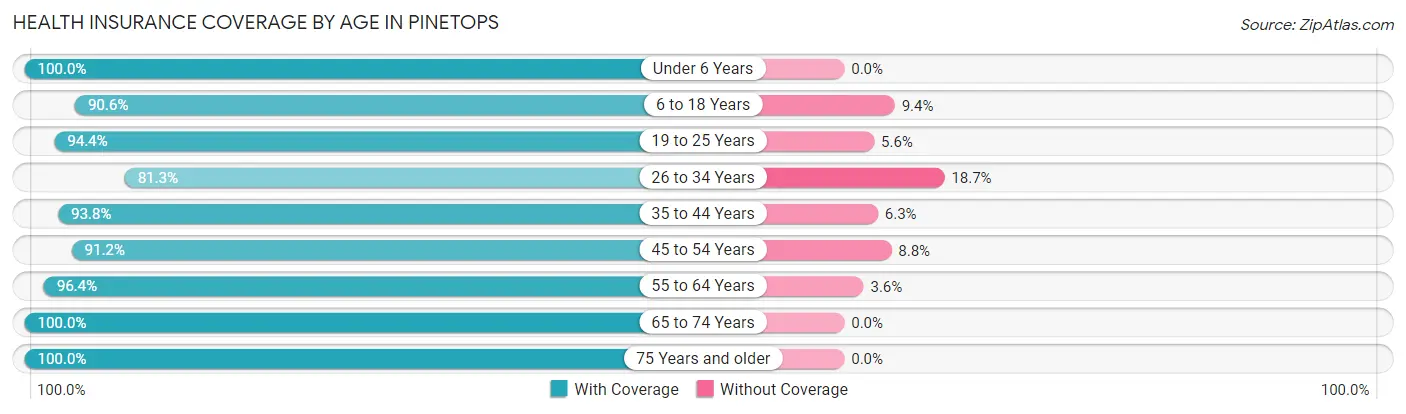
| Age Bracket | With Coverage | Without Coverage |
| Under 6 Years | 78 (100.0%) | 0 (0.0%) |
| 6 to 18 Years | 212 (90.6%) | 22 (9.4%) |
| 19 to 25 Years | 102 (94.4%) | 6 (5.6%) |
| 26 to 34 Years | 74 (81.3%) | 17 (18.7%) |
| 35 to 44 Years | 210 (93.8%) | 14 (6.2%) |
| 45 to 54 Years | 104 (91.2%) | 10 (8.8%) |
| 55 to 64 Years | 188 (96.4%) | 7 (3.6%) |
| 65 to 74 Years | 243 (100.0%) | 0 (0.0%) |
| 75 Years and older | 87 (100.0%) | 0 (0.0%) |
| Total | 1,298 (94.5%) | 76 (5.5%) |
Health Insurance Coverage by Citizenship Status in Pinetops
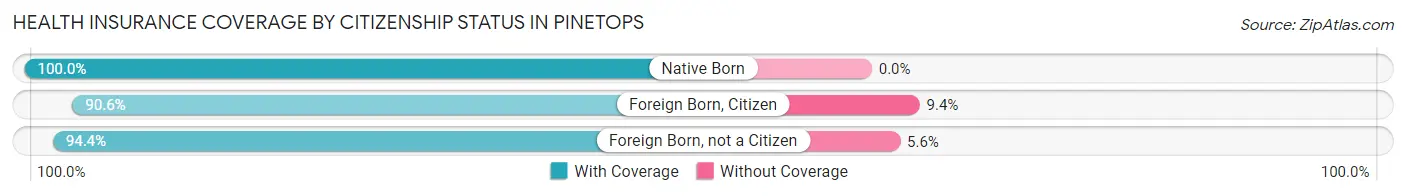
| Citizenship Status | With Coverage | Without Coverage |
| Native Born | 78 (100.0%) | 0 (0.0%) |
| Foreign Born, Citizen | 212 (90.6%) | 22 (9.4%) |
| Foreign Born, not a Citizen | 102 (94.4%) | 6 (5.6%) |
Health Insurance Coverage by Household Income in Pinetops
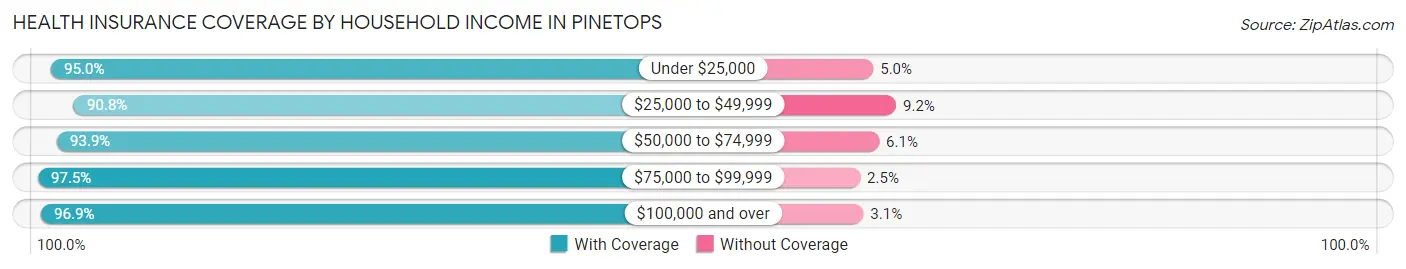
| Household Income | With Coverage | Without Coverage |
| Under $25,000 | 326 (95.0%) | 17 (5.0%) |
| $25,000 to $49,999 | 334 (90.8%) | 34 (9.2%) |
| $50,000 to $74,999 | 186 (93.9%) | 12 (6.1%) |
| $75,000 to $99,999 | 234 (97.5%) | 6 (2.5%) |
| $100,000 and over | 218 (96.9%) | 7 (3.1%) |
Public vs Private Health Insurance Coverage by Age in Pinetops
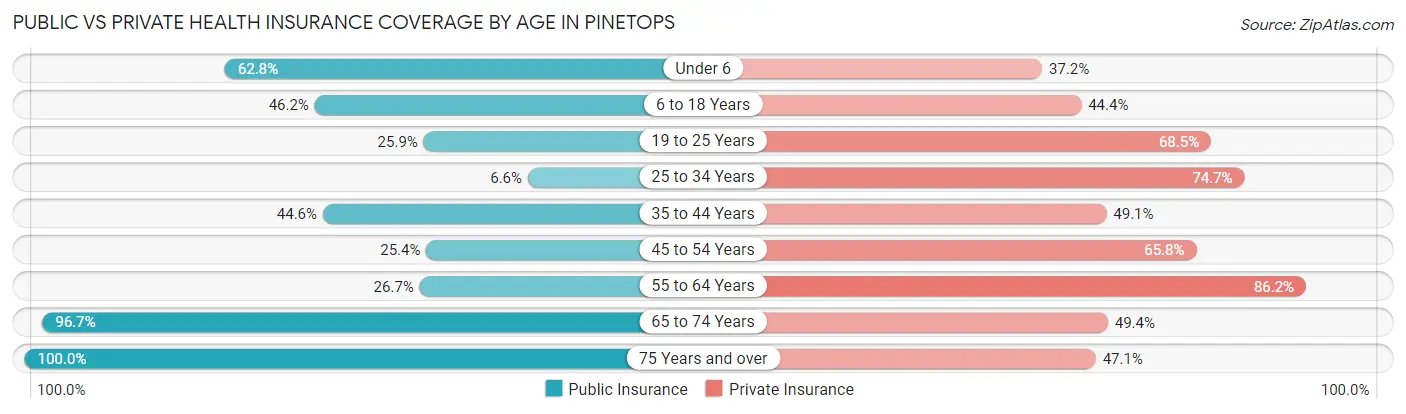
| Age Bracket | Public Insurance | Private Insurance |
| Under 6 | 49 (62.8%) | 29 (37.2%) |
| 6 to 18 Years | 108 (46.2%) | 104 (44.4%) |
| 19 to 25 Years | 28 (25.9%) | 74 (68.5%) |
| 25 to 34 Years | 6 (6.6%) | 68 (74.7%) |
| 35 to 44 Years | 100 (44.6%) | 110 (49.1%) |
| 45 to 54 Years | 29 (25.4%) | 75 (65.8%) |
| 55 to 64 Years | 52 (26.7%) | 168 (86.2%) |
| 65 to 74 Years | 235 (96.7%) | 120 (49.4%) |
| 75 Years and over | 87 (100.0%) | 41 (47.1%) |
| Total | 694 (50.5%) | 789 (57.4%) |
Disability Status by Sex by Age in Pinetops
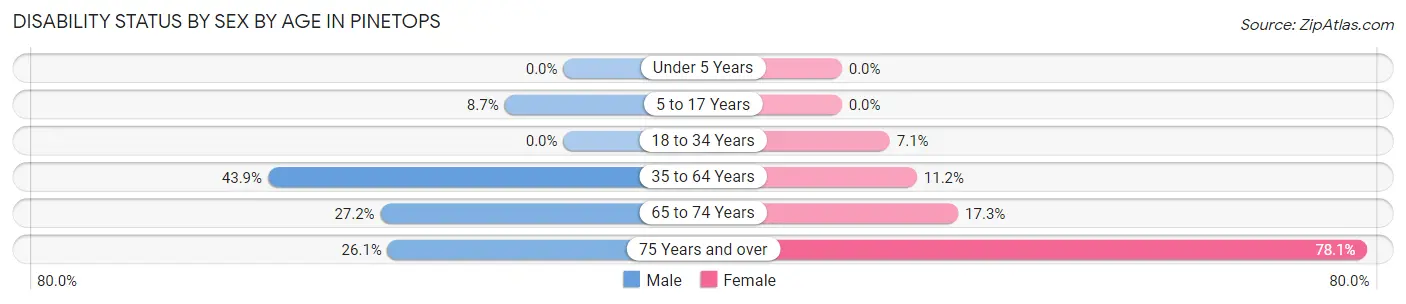
| Age Bracket | Male | Female |
| Under 5 Years | 0 (0.0%) | 0 (0.0%) |
| 5 to 17 Years | 9 (8.7%) | 0 (0.0%) |
| 18 to 34 Years | 0 (0.0%) | 8 (7.1%) |
| 35 to 64 Years | 104 (43.9%) | 33 (11.2%) |
| 65 to 74 Years | 22 (27.2%) | 28 (17.3%) |
| 75 Years and over | 12 (26.1%) | 32 (78.0%) |
Disability Class by Sex by Age in Pinetops
Disability Class: Hearing Difficulty
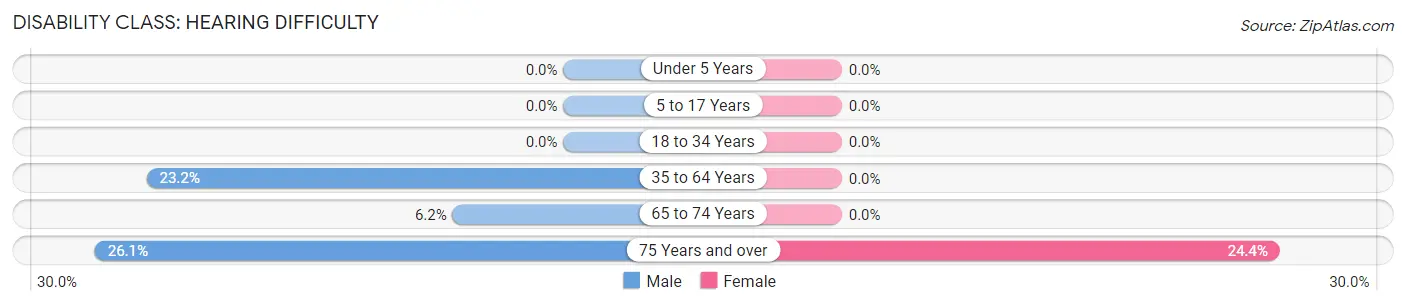
| Age Bracket | Male | Female |
| Under 5 Years | 0 (0.0%) | 0 (0.0%) |
| 5 to 17 Years | 0 (0.0%) | 0 (0.0%) |
| 18 to 34 Years | 0 (0.0%) | 0 (0.0%) |
| 35 to 64 Years | 55 (23.2%) | 0 (0.0%) |
| 65 to 74 Years | 5 (6.2%) | 0 (0.0%) |
| 75 Years and over | 12 (26.1%) | 10 (24.4%) |
Disability Class: Vision Difficulty
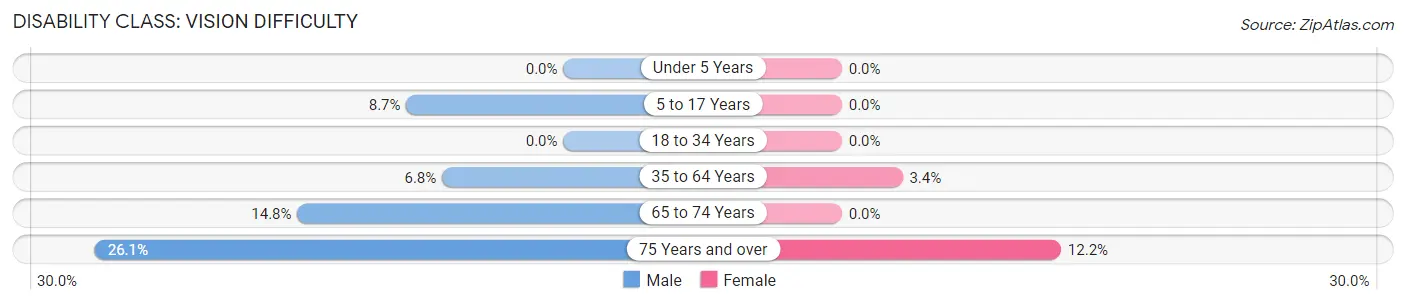
| Age Bracket | Male | Female |
| Under 5 Years | 0 (0.0%) | 0 (0.0%) |
| 5 to 17 Years | 9 (8.7%) | 0 (0.0%) |
| 18 to 34 Years | 0 (0.0%) | 0 (0.0%) |
| 35 to 64 Years | 16 (6.8%) | 10 (3.4%) |
| 65 to 74 Years | 12 (14.8%) | 0 (0.0%) |
| 75 Years and over | 12 (26.1%) | 5 (12.2%) |
Disability Class: Cognitive Difficulty
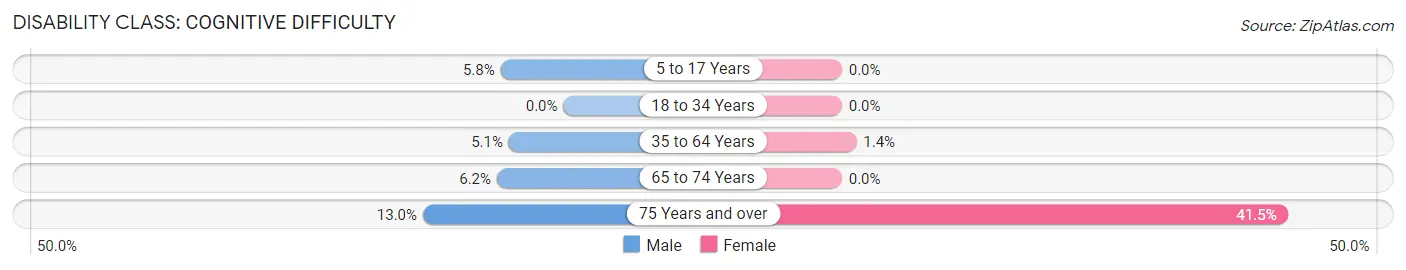
| Age Bracket | Male | Female |
| 5 to 17 Years | 6 (5.8%) | 0 (0.0%) |
| 18 to 34 Years | 0 (0.0%) | 0 (0.0%) |
| 35 to 64 Years | 12 (5.1%) | 4 (1.3%) |
| 65 to 74 Years | 5 (6.2%) | 0 (0.0%) |
| 75 Years and over | 6 (13.0%) | 17 (41.5%) |
Disability Class: Ambulatory Difficulty
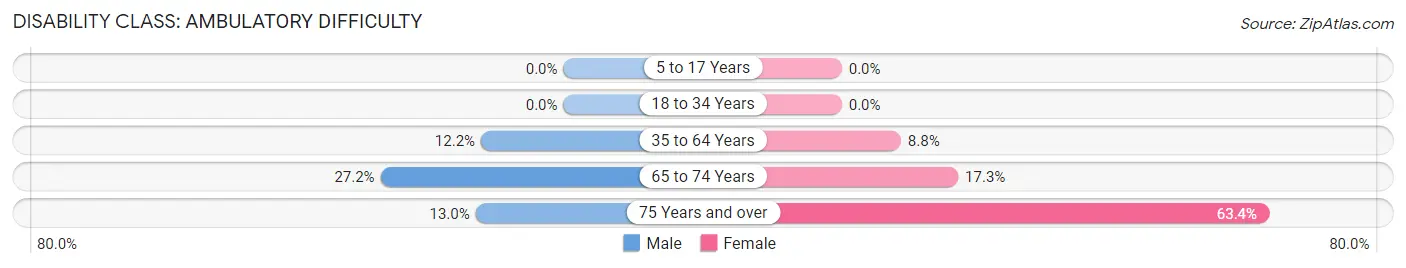
| Age Bracket | Male | Female |
| 5 to 17 Years | 0 (0.0%) | 0 (0.0%) |
| 18 to 34 Years | 0 (0.0%) | 0 (0.0%) |
| 35 to 64 Years | 29 (12.2%) | 26 (8.8%) |
| 65 to 74 Years | 22 (27.2%) | 28 (17.3%) |
| 75 Years and over | 6 (13.0%) | 26 (63.4%) |
Disability Class: Self-Care Difficulty
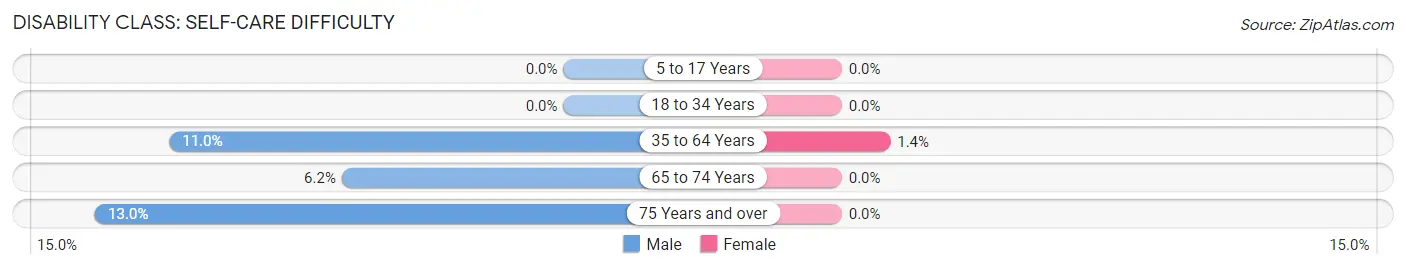
| Age Bracket | Male | Female |
| 5 to 17 Years | 0 (0.0%) | 0 (0.0%) |
| 18 to 34 Years | 0 (0.0%) | 0 (0.0%) |
| 35 to 64 Years | 26 (11.0%) | 4 (1.3%) |
| 65 to 74 Years | 5 (6.2%) | 0 (0.0%) |
| 75 Years and over | 6 (13.0%) | 0 (0.0%) |
Technology Access in Pinetops
Computing Device Access in Pinetops
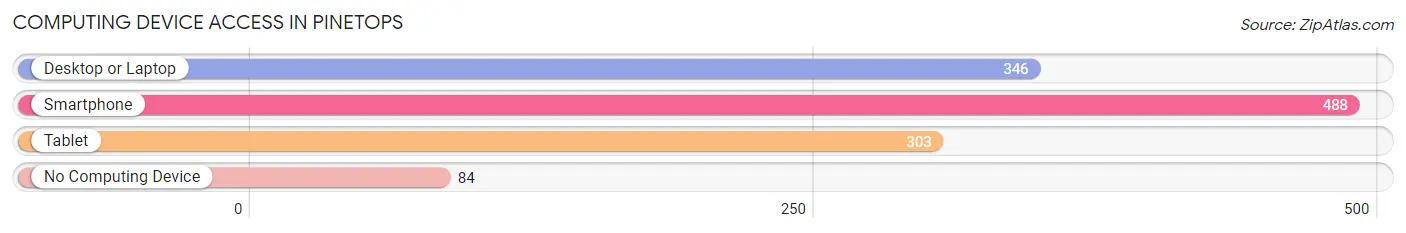
| Device Type | # Households | % Households |
| Desktop or Laptop | 346 | 56.5% |
| Smartphone | 488 | 79.7% |
| Tablet | 303 | 49.5% |
| No Computing Device | 84 | 13.7% |
| Total | 612 | 100.0% |
Internet Access in Pinetops
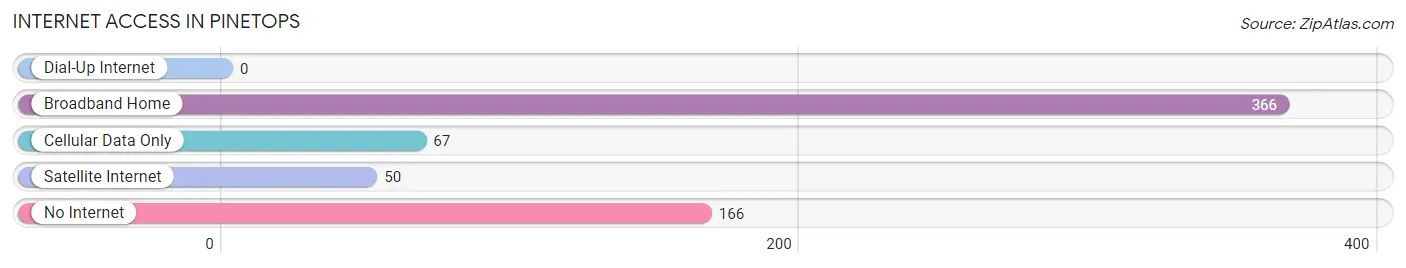
| Internet Type | # Households | % Households |
| Dial-Up Internet | 0 | 0.0% |
| Broadband Home | 366 | 59.8% |
| Cellular Data Only | 67 | 11.0% |
| Satellite Internet | 50 | 8.2% |
| No Internet | 166 | 27.1% |
| Total | 612 | 100.0% |
Pinetops Summary
Pinetops, North Carolina is a small town located in Edgecombe County, North Carolina. It is situated in the northeastern part of the state, about 25 miles east of Rocky Mount. The town was founded in 1891 and was named after the abundance of pine trees in the area. The population of Pinetops was 1,717 as of the 2010 census.
Geography
Pinetops is located at 35°45'25"N 77°45'45"W (35.7569, -77.7625). It is situated in the northeastern part of the state, about 25 miles east of Rocky Mount. The town is located in the Coastal Plain region of North Carolina, and is surrounded by rolling hills and forests. The town is situated on the Tar River, which flows through the town and provides a source of recreation for the residents.
Climate
Pinetops has a humid subtropical climate, with hot, humid summers and mild winters. The average annual temperature is around 68°F (20°C). The average annual precipitation is around 47 inches (119 cm).
Demographics
As of the 2010 census, the population of Pinetops was 1,717. The racial makeup of the town was 57.2% White, 37.7% African American, 0.3% Native American, 0.3% Asian, 0.1% Pacific Islander, and 4.4% from other races. The median household income was $25,938, and the median family income was $31,250.
Economy
The economy of Pinetops is largely based on agriculture and manufacturing. The town is home to several small businesses, including a lumber mill, a furniture factory, and a textile mill. The town also has a few retail stores, restaurants, and other small businesses.
The town is also home to Pinetops-Tarboro Airport, which provides air transportation to the surrounding area. The airport is used for both private and commercial flights.
History
Pinetops was founded in 1891 and was named after the abundance of pine trees in the area. The town was originally a farming community, and the main crops grown were cotton, corn, and tobacco.
In the early 1900s, the town began to grow and develop. The first bank was established in 1906, and the first post office was established in 1907. The town was incorporated in 1909.
In the 1920s, the town began to experience a period of growth and prosperity. The first telephone service was established in 1921, and the first electric service was established in 1923. The town also saw the construction of several new buildings, including a new school and a new courthouse.
In the 1950s, the town began to experience a period of decline. The population began to decline, and many of the businesses in the town closed. The town was also hit hard by the Great Depression.
In the 1970s, the town began to experience a period of revitalization. The population began to increase, and new businesses began to open. The town also saw the construction of a new library and a new hospital.
Today, Pinetops is a small town with a population of around 1,700. The town is still largely agricultural, but it has also seen a resurgence in manufacturing and retail businesses. The town is also home to Pinetops-Tarboro Airport, which provides air transportation to the surrounding area.
Common Questions
What is Per Capita Income in Pinetops?
Per Capita income in Pinetops is $27,273.
What is the Median Family Income in Pinetops?
Median Family Income in Pinetops is $57,917.
What is the Median Household income in Pinetops?
Median Household Income in Pinetops is $44,643.
What is Income or Wage Gap in Pinetops?
Income or Wage Gap in Pinetops is 53.4%.
Women in Pinetops earn 46.6 cents for every dollar earned by a man.
What is Inequality or Gini Index in Pinetops?
Inequality or Gini Index in Pinetops is 0.48.
What is the Total Population of Pinetops?
Total Population of Pinetops is 1,374.
What is the Total Male Population of Pinetops?
Total Male Population of Pinetops is 593.
What is the Total Female Population of Pinetops?
Total Female Population of Pinetops is 781.
What is the Ratio of Males per 100 Females in Pinetops?
There are 75.93 Males per 100 Females in Pinetops.
What is the Ratio of Females per 100 Males in Pinetops?
There are 131.70 Females per 100 Males in Pinetops.
What is the Median Population Age in Pinetops?
Median Population Age in Pinetops is 42.5 Years.
What is the Average Family Size in Pinetops
Average Family Size in Pinetops is 2.7 People.
What is the Average Household Size in Pinetops
Average Household Size in Pinetops is 2.2 People.
How Large is the Labor Force in Pinetops?
There are 581 People in the Labor Forcein in Pinetops.
What is the Percentage of People in the Labor Force in Pinetops?
52.4% of People are in the Labor Force in Pinetops.
What is the Unemployment Rate in Pinetops?
Unemployment Rate in Pinetops is 5.3%.