Lewisville, NC Map & Demographics
Lewisville Map
Lewisville Overview
$39,681
PER CAPITA INCOME
$102,650
AVG FAMILY INCOME
$86,641
AVG HOUSEHOLD INCOME
22.9%
WAGE / INCOME GAP [ % ]
77.1¢/ $1
WAGE / INCOME GAP [ $ ]
0.42
INEQUALITY / GINI INDEX
13,509
TOTAL POPULATION
6,319
MALE POPULATION
7,190
FEMALE POPULATION
87.89
MALES / 100 FEMALES
113.78
FEMALES / 100 MALES
40.8
MEDIAN AGE
3.3
AVG FAMILY SIZE
2.7
AVG HOUSEHOLD SIZE
6,682
LABOR FORCE [ PEOPLE ]
66.2%
PERCENT IN LABOR FORCE
3.6%
UNEMPLOYMENT RATE
Lewisville Zip Codes
Lewisville Area Codes
Income in Lewisville
Income Overview in Lewisville
Per Capita Income in Lewisville is $39,681, while median incomes of families and households are $102,650 and $86,641 respectively.
| Characteristic | Number | Measure |
| Per Capita Income | 13,509 | $39,681 |
| Median Family Income | 3,512 | $102,650 |
| Mean Family Income | 3,512 | $124,631 |
| Median Household Income | 4,928 | $86,641 |
| Mean Household Income | 4,928 | $106,547 |
| Income Deficit | 3,512 | $0 |
| Wage / Income Gap (%) | 13,509 | 22.87% |
| Wage / Income Gap ($) | 13,509 | 77.13¢ per $1 |
| Gini / Inequality Index | 13,509 | 0.42 |
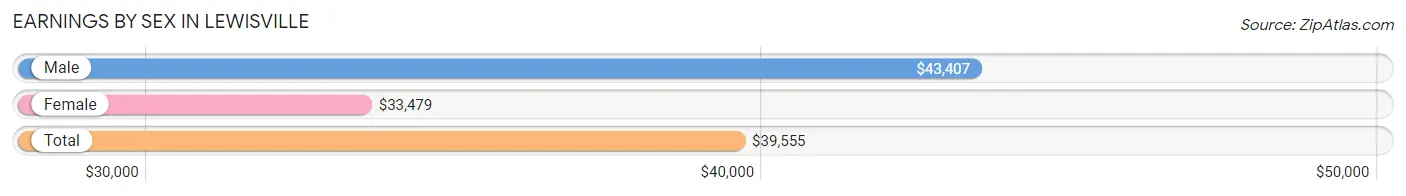
Earnings by Sex in Lewisville
Average Earnings in Lewisville are $39,555, $43,407 for men and $33,479 for women, a difference of 22.9%.
| Sex | Number | Average Earnings |
| Male | 3,607 (52.1%) | $43,407 |
| Female | 3,320 (47.9%) | $33,479 |
| Total | 6,927 (100.0%) | $39,555 |
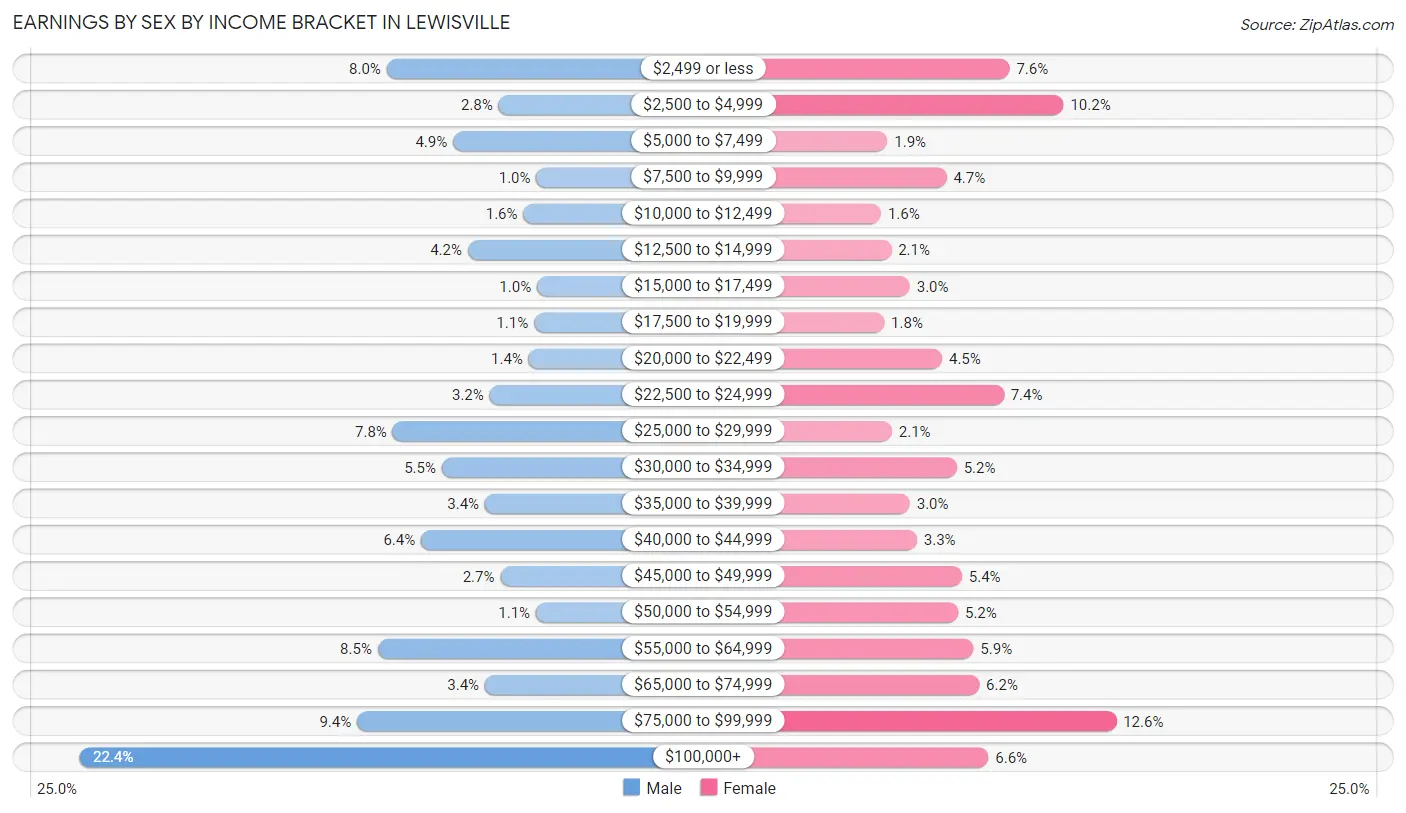
Earnings by Sex by Income Bracket in Lewisville
The most common earnings brackets in Lewisville are $100,000+ for men (808 | 22.4%) and $75,000 to $99,999 for women (419 | 12.6%).
| Income | Male | Female |
| $2,499 or less | 290 (8.0%) | 253 (7.6%) |
| $2,500 to $4,999 | 101 (2.8%) | 337 (10.2%) |
| $5,000 to $7,499 | 178 (4.9%) | 63 (1.9%) |
| $7,500 to $9,999 | 37 (1.0%) | 155 (4.7%) |
| $10,000 to $12,499 | 59 (1.6%) | 53 (1.6%) |
| $12,500 to $14,999 | 153 (4.2%) | 69 (2.1%) |
| $15,000 to $17,499 | 36 (1.0%) | 98 (2.9%) |
| $17,500 to $19,999 | 41 (1.1%) | 58 (1.8%) |
| $20,000 to $22,499 | 50 (1.4%) | 148 (4.5%) |
| $22,500 to $24,999 | 116 (3.2%) | 244 (7.3%) |
| $25,000 to $29,999 | 280 (7.8%) | 70 (2.1%) |
| $30,000 to $34,999 | 197 (5.5%) | 171 (5.1%) |
| $35,000 to $39,999 | 124 (3.4%) | 98 (2.9%) |
| $40,000 to $44,999 | 232 (6.4%) | 109 (3.3%) |
| $45,000 to $49,999 | 98 (2.7%) | 179 (5.4%) |
| $50,000 to $54,999 | 38 (1.1%) | 173 (5.2%) |
| $55,000 to $64,999 | 305 (8.5%) | 197 (5.9%) |
| $65,000 to $74,999 | 124 (3.4%) | 206 (6.2%) |
| $75,000 to $99,999 | 340 (9.4%) | 419 (12.6%) |
| $100,000+ | 808 (22.4%) | 220 (6.6%) |
| Total | 3,607 (100.0%) | 3,320 (100.0%) |
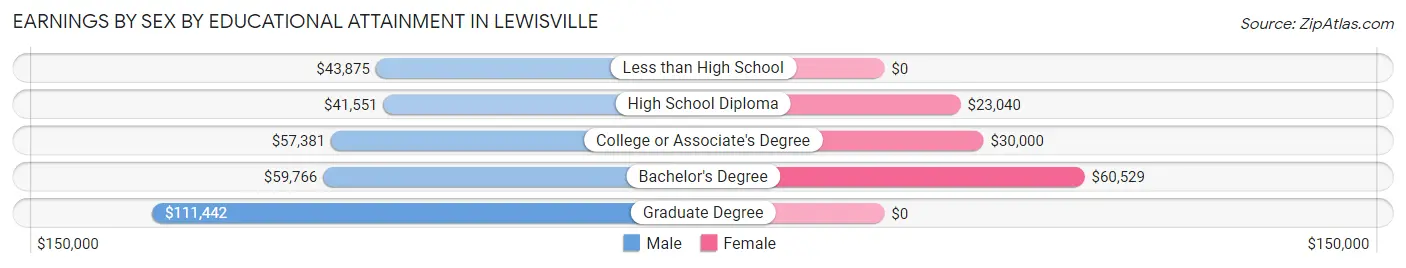
Earnings by Sex by Educational Attainment in Lewisville
Average earnings in Lewisville are $55,636 for men and $35,877 for women, a difference of 35.5%. Men with an educational attainment of graduate degree enjoy the highest average annual earnings of $111,442, while those with high school diploma education earn the least with $41,551. Women with an educational attainment of bachelor's degree earn the most with the average annual earnings of $60,529, while those with high school diploma education have the smallest earnings of $23,040.
| Educational Attainment | Male Income | Female Income |
| Less than High School | $43,875 | $0 |
| High School Diploma | $41,551 | $23,040 |
| College or Associate's Degree | $57,381 | $30,000 |
| Bachelor's Degree | $59,766 | $60,529 |
| Graduate Degree | $111,442 | $0 |
| Total | $55,636 | $35,877 |
Family Income in Lewisville
Family Income Brackets in Lewisville
According to the Lewisville family income data, there are 1,004 families falling into the $100,000 to $149,999 income range, which is the most common income bracket and makes up 28.6% of all families.
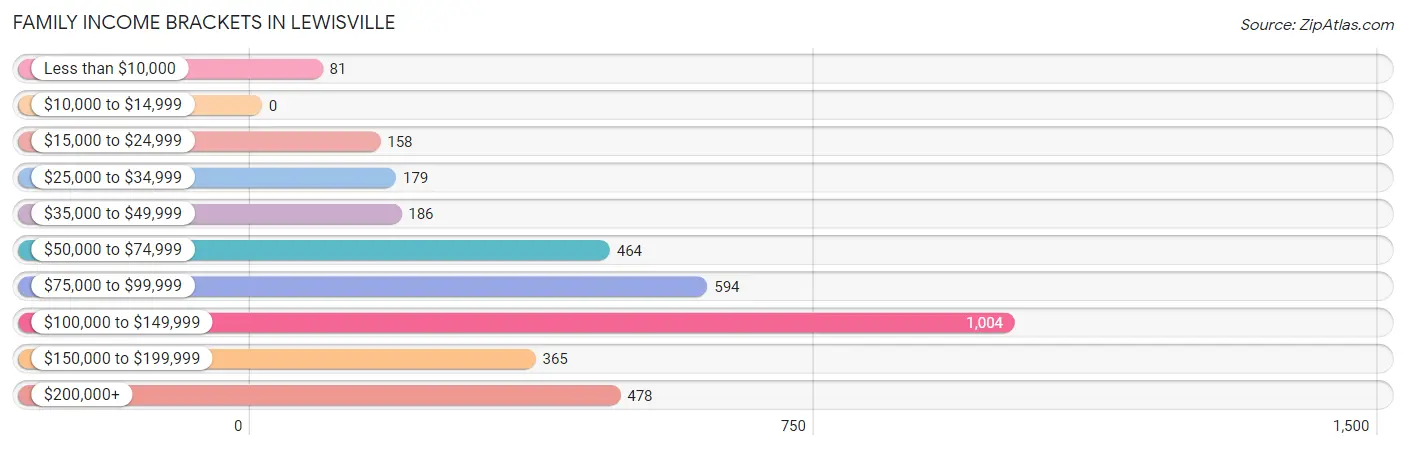
| Income Bracket | # Families | % Families |
| Less than $10,000 | 81 | 2.3% |
| $10,000 to $14,999 | 0 | 0.0% |
| $15,000 to $24,999 | 158 | 4.5% |
| $25,000 to $34,999 | 179 | 5.1% |
| $35,000 to $49,999 | 186 | 5.3% |
| $50,000 to $74,999 | 464 | 13.2% |
| $75,000 to $99,999 | 594 | 16.9% |
| $100,000 to $149,999 | 1,004 | 28.6% |
| $150,000 to $199,999 | 365 | 10.4% |
| $200,000+ | 478 | 13.6% |
Family Income by Famaliy Size in Lewisville
6-person families (61 | 1.7%) account for the highest median family income in Lewisville with $131,335 per family, while 2-person families (1,621 | 46.2%) have the highest median income of $41,051 per family member.
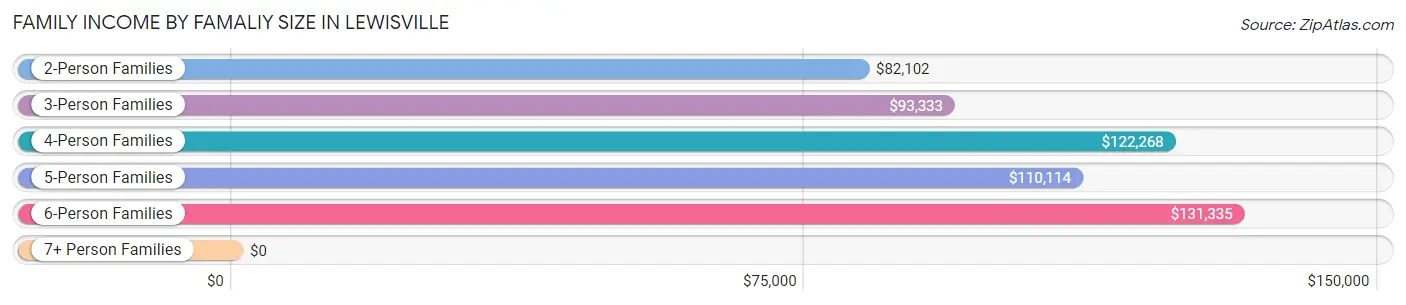
| Income Bracket | # Families | Median Income |
| 2-Person Families | 1,621 (46.2%) | $82,102 |
| 3-Person Families | 722 (20.6%) | $93,333 |
| 4-Person Families | 806 (23.0%) | $122,268 |
| 5-Person Families | 271 (7.7%) | $110,114 |
| 6-Person Families | 61 (1.7%) | $131,335 |
| 7+ Person Families | 31 (0.9%) | $0 |
| Total | 3,512 (100.0%) | $102,650 |
Family Income by Number of Earners in Lewisville
The median family income in Lewisville is $102,650, with families comprising 3+ earners (354) having the highest median family income of $125,313, while families with no earners (533) have the lowest median family income of $71,741, accounting for 10.1% and 15.2% of families, respectively.
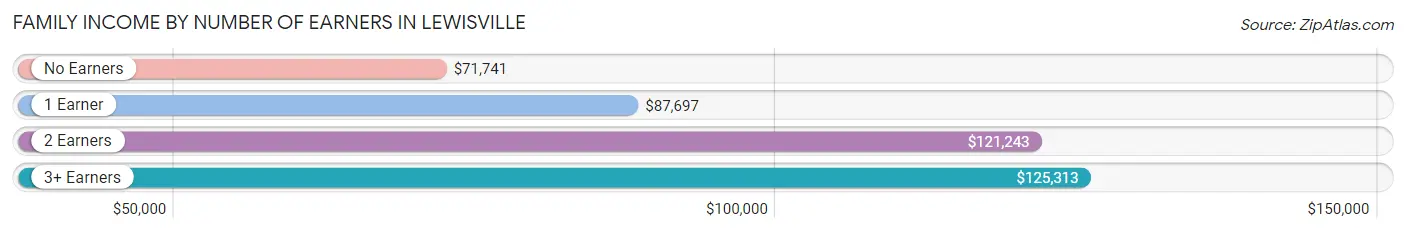
| Number of Earners | # Families | Median Income |
| No Earners | 533 (15.2%) | $71,741 |
| 1 Earner | 1,047 (29.8%) | $87,697 |
| 2 Earners | 1,578 (44.9%) | $121,243 |
| 3+ Earners | 354 (10.1%) | $125,313 |
| Total | 3,512 (100.0%) | $102,650 |
Household Income in Lewisville
Household Income Brackets in Lewisville
With 1,143 households falling in the category, the $100,000 to $149,999 income range is the most frequent in Lewisville, accounting for 23.2% of all households. In contrast, only 69 households (1.4%) fall into the $10,000 to $14,999 income bracket, making it the least populous group.
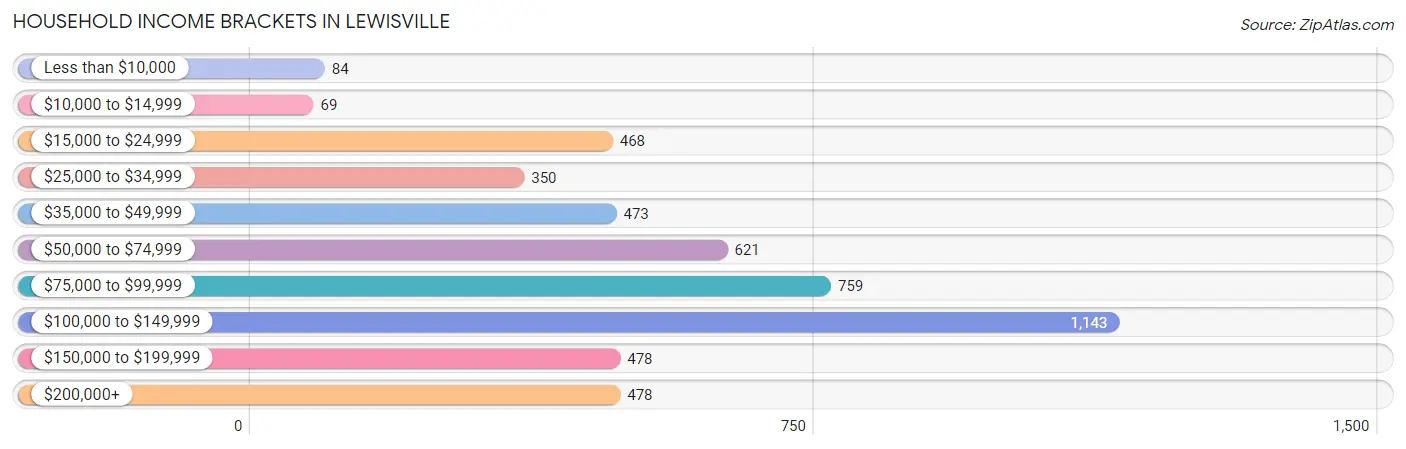
| Income Bracket | # Households | % Households |
| Less than $10,000 | 84 | 1.7% |
| $10,000 to $14,999 | 69 | 1.4% |
| $15,000 to $24,999 | 468 | 9.5% |
| $25,000 to $34,999 | 350 | 7.1% |
| $35,000 to $49,999 | 473 | 9.6% |
| $50,000 to $74,999 | 621 | 12.6% |
| $75,000 to $99,999 | 759 | 15.4% |
| $100,000 to $149,999 | 1,143 | 23.2% |
| $150,000 to $199,999 | 478 | 9.7% |
| $200,000+ | 478 | 9.7% |
Household Income by Householder Age in Lewisville
The median household income in Lewisville is $86,641, with the highest median household income of $98,125 found in the 25 to 44 years age bracket for the primary householder. A total of 1,552 households (31.5%) fall into this category.
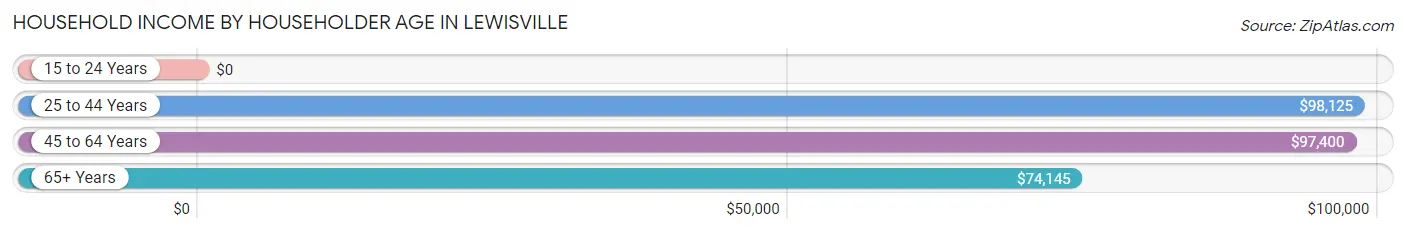
| Income Bracket | # Households | Median Income |
| 15 to 24 Years | 0 (0.0%) | $0 |
| 25 to 44 Years | 1,552 (31.5%) | $98,125 |
| 45 to 64 Years | 1,834 (37.2%) | $97,400 |
| 65+ Years | 1,542 (31.3%) | $74,145 |
| Total | 4,928 (100.0%) | $86,641 |
Poverty in Lewisville
Income Below Poverty by Sex and Age in Lewisville
With 7.1% poverty level for males and 11.4% for females among the residents of Lewisville, 18 to 24 year old males and 5 year old females are the most vulnerable to poverty, with 184 males (40.4%) and 62 females (41.6%) in their respective age groups living below the poverty level.
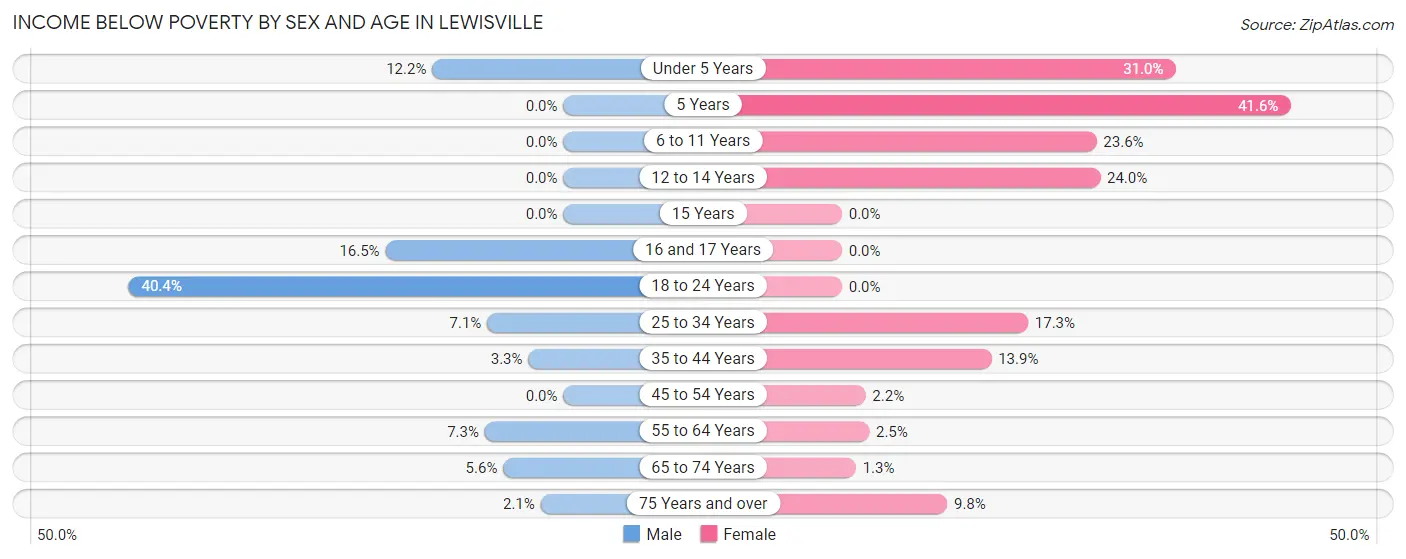
| Age Bracket | Male | Female |
| Under 5 Years | 51 (12.2%) | 104 (30.9%) |
| 5 Years | 0 (0.0%) | 62 (41.6%) |
| 6 to 11 Years | 0 (0.0%) | 199 (23.6%) |
| 12 to 14 Years | 0 (0.0%) | 99 (24.0%) |
| 15 Years | 0 (0.0%) | 0 (0.0%) |
| 16 and 17 Years | 36 (16.5%) | 0 (0.0%) |
| 18 to 24 Years | 184 (40.4%) | 0 (0.0%) |
| 25 to 34 Years | 46 (7.1%) | 100 (17.3%) |
| 35 to 44 Years | 31 (3.3%) | 154 (13.9%) |
| 45 to 54 Years | 0 (0.0%) | 18 (2.2%) |
| 55 to 64 Years | 57 (7.3%) | 24 (2.5%) |
| 65 to 74 Years | 36 (5.6%) | 13 (1.3%) |
| 75 Years and over | 8 (2.1%) | 46 (9.8%) |
| Total | 449 (7.1%) | 819 (11.4%) |
Income Above Poverty by Sex and Age in Lewisville
According to the poverty statistics in Lewisville, males aged 5 years and females aged 15 years are the age groups that are most secure financially, with 100.0% of males and 100.0% of females in these age groups living above the poverty line.
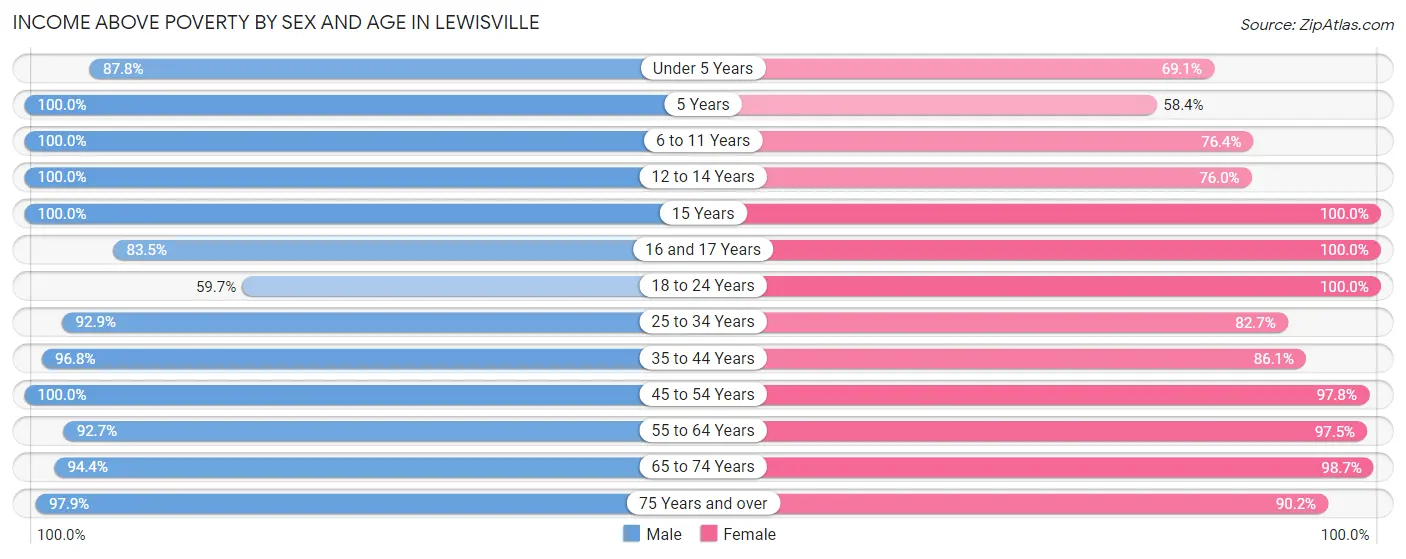
| Age Bracket | Male | Female |
| Under 5 Years | 368 (87.8%) | 232 (69.1%) |
| 5 Years | 46 (100.0%) | 87 (58.4%) |
| 6 to 11 Years | 686 (100.0%) | 643 (76.4%) |
| 12 to 14 Years | 362 (100.0%) | 314 (76.0%) |
| 15 Years | 93 (100.0%) | 35 (100.0%) |
| 16 and 17 Years | 182 (83.5%) | 68 (100.0%) |
| 18 to 24 Years | 272 (59.7%) | 379 (100.0%) |
| 25 to 34 Years | 605 (92.9%) | 479 (82.7%) |
| 35 to 44 Years | 923 (96.8%) | 956 (86.1%) |
| 45 to 54 Years | 615 (100.0%) | 803 (97.8%) |
| 55 to 64 Years | 725 (92.7%) | 923 (97.5%) |
| 65 to 74 Years | 609 (94.4%) | 998 (98.7%) |
| 75 Years and over | 372 (97.9%) | 425 (90.2%) |
| Total | 5,858 (92.9%) | 6,342 (88.6%) |
Income Below Poverty Among Married-Couple Families in Lewisville
The poverty statistics for married-couple families in Lewisville show that 1.1% or 31 of the total 2,847 families live below the poverty line. Families with 3 or 4 children have the highest poverty rate of 14.8%, comprising of 31 families. On the other hand, families with no children have the lowest poverty rate of 0.0%, which includes 0 families.
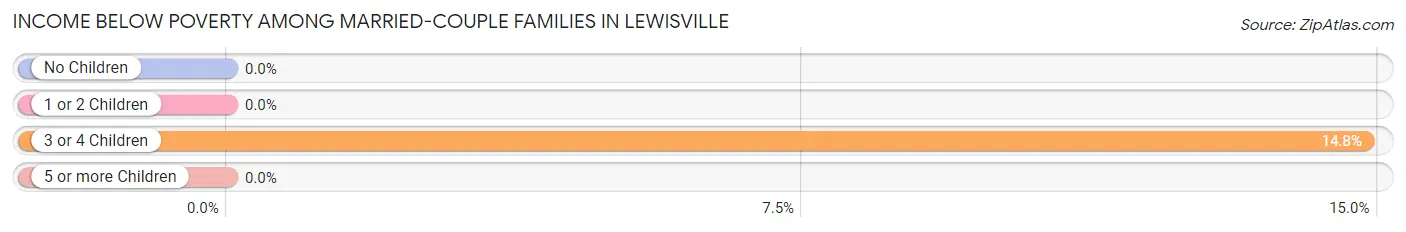
| Children | Above Poverty | Below Poverty |
| No Children | 1,571 (100.0%) | 0 (0.0%) |
| 1 or 2 Children | 1,067 (100.0%) | 0 (0.0%) |
| 3 or 4 Children | 178 (85.2%) | 31 (14.8%) |
| 5 or more Children | 0 (0.0%) | 0 (0.0%) |
| Total | 2,816 (98.9%) | 31 (1.1%) |
Income Below Poverty Among Single-Parent Households in Lewisville
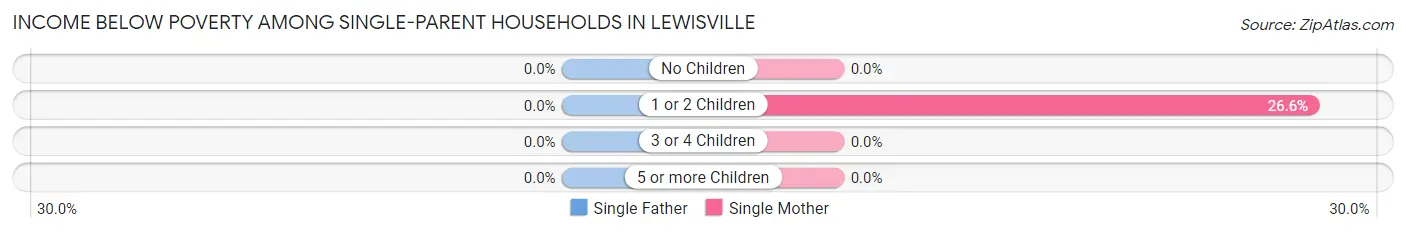
| Children | Single Father | Single Mother |
| No Children | 0 (0.0%) | 0 (0.0%) |
| 1 or 2 Children | 0 (0.0%) | 91 (26.6%) |
| 3 or 4 Children | 0 (0.0%) | 0 (0.0%) |
| 5 or more Children | 0 (0.0%) | 0 (0.0%) |
| Total | 0 (0.0%) | 91 (16.9%) |
Income Below Poverty Among Married-Couple vs Single-Parent Households in Lewisville
The poverty data for Lewisville shows that 31 of the married-couple family households (1.1%) and 91 of the single-parent households (13.7%) are living below the poverty level. Within the married-couple family households, those with 3 or 4 children have the highest poverty rate, with 31 households (14.8%) falling below the poverty line. Among the single-parent households, those with 1 or 2 children have the highest poverty rate, with 91 household (22.9%) living below poverty.
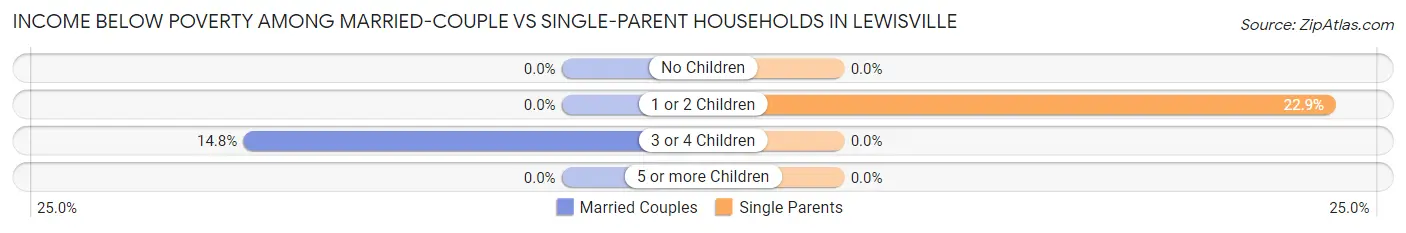
| Children | Married-Couple Families | Single-Parent Households |
| No Children | 0 (0.0%) | 0 (0.0%) |
| 1 or 2 Children | 0 (0.0%) | 91 (22.9%) |
| 3 or 4 Children | 31 (14.8%) | 0 (0.0%) |
| 5 or more Children | 0 (0.0%) | 0 (0.0%) |
| Total | 31 (1.1%) | 91 (13.7%) |
Race in Lewisville
The most populous races in Lewisville are White / Caucasian (11,186 | 82.8%), Black / African American (1,770 | 13.1%), and Hispanic or Latino (468 | 3.5%).
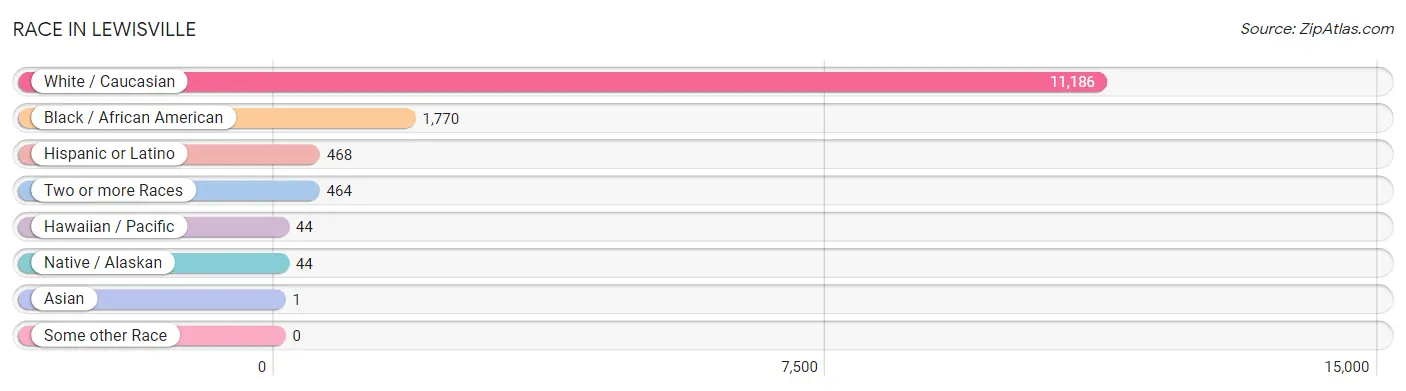
| Race | # Population | % Population |
| Asian | 1 | 0.0% |
| Black / African American | 1,770 | 13.1% |
| Hawaiian / Pacific | 44 | 0.3% |
| Hispanic or Latino | 468 | 3.5% |
| Native / Alaskan | 44 | 0.3% |
| White / Caucasian | 11,186 | 82.8% |
| Two or more Races | 464 | 3.4% |
| Some other Race | 0 | 0.0% |
| Total | 13,509 | 100.0% |
Ancestry in Lewisville
The most populous ancestries reported in Lewisville are English (2,746 | 20.3%), Irish (2,239 | 16.6%), German (2,194 | 16.2%), American (1,178 | 8.7%), and European (459 | 3.4%), together accounting for 65.3% of all Lewisville residents.
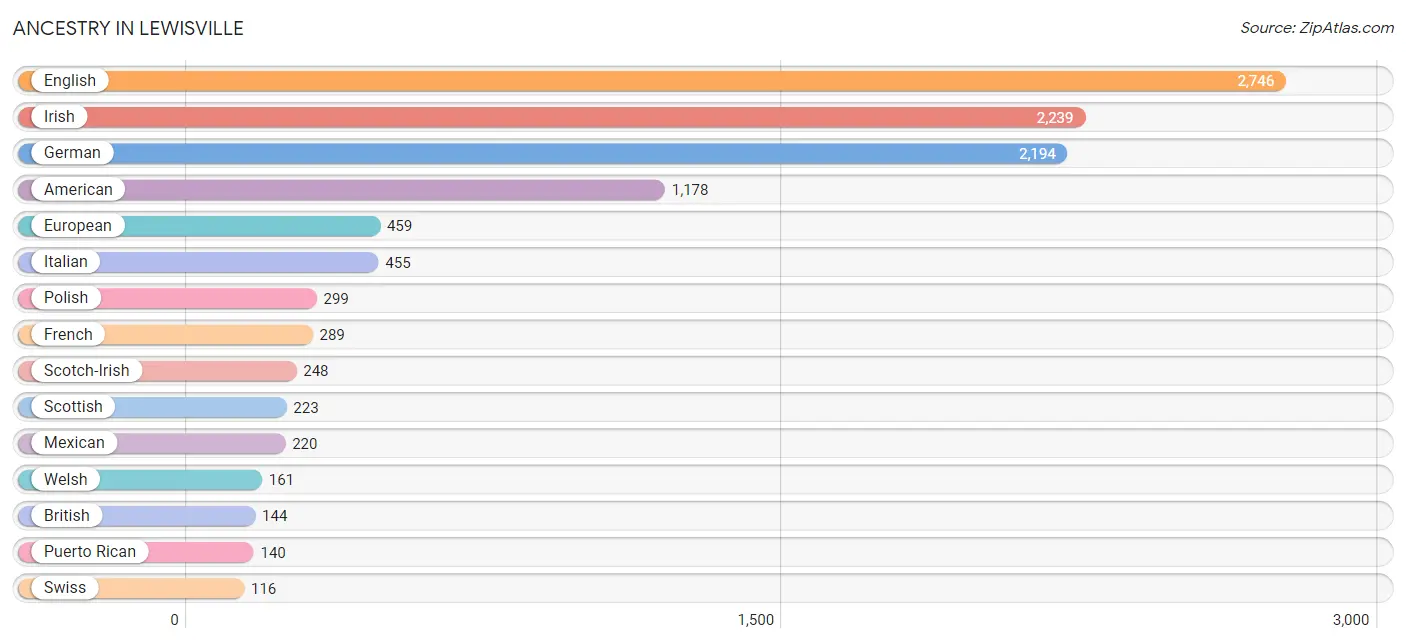
| Ancestry | # Population | % Population |
| American | 1,178 | 8.7% |
| Arab | 25 | 0.2% |
| Barbadian | 6 | 0.0% |
| Belgian | 21 | 0.2% |
| Bhutanese | 59 | 0.4% |
| British | 144 | 1.1% |
| Burmese | 15 | 0.1% |
| Canadian | 17 | 0.1% |
| Cherokee | 13 | 0.1% |
| Colombian | 10 | 0.1% |
| Danish | 26 | 0.2% |
| Dutch | 102 | 0.8% |
| Eastern European | 14 | 0.1% |
| English | 2,746 | 20.3% |
| European | 459 | 3.4% |
| Filipino | 1 | 0.0% |
| Finnish | 39 | 0.3% |
| French | 289 | 2.1% |
| French Canadian | 63 | 0.5% |
| German | 2,194 | 16.2% |
| Greek | 21 | 0.2% |
| Hungarian | 9 | 0.1% |
| Indian (Asian) | 15 | 0.1% |
| Irish | 2,239 | 16.6% |
| Iroquois | 34 | 0.3% |
| Italian | 455 | 3.4% |
| Korean | 87 | 0.6% |
| Lebanese | 25 | 0.2% |
| Lumbee | 7 | 0.1% |
| Mexican | 220 | 1.6% |
| Native Hawaiian | 59 | 0.4% |
| Norwegian | 99 | 0.7% |
| Polish | 299 | 2.2% |
| Portuguese | 67 | 0.5% |
| Puerto Rican | 140 | 1.0% |
| Romanian | 83 | 0.6% |
| Russian | 50 | 0.4% |
| Scandinavian | 96 | 0.7% |
| Scotch-Irish | 248 | 1.8% |
| Scottish | 223 | 1.7% |
| Slovak | 26 | 0.2% |
| Slovene | 9 | 0.1% |
| South American | 59 | 0.4% |
| Spaniard | 29 | 0.2% |
| Spanish | 20 | 0.2% |
| Swedish | 20 | 0.2% |
| Swiss | 116 | 0.9% |
| Thai | 51 | 0.4% |
| Ukrainian | 9 | 0.1% |
| Uruguayan | 49 | 0.4% |
| Welsh | 161 | 1.2% | View All 51 Rows |
Immigrants in Lewisville
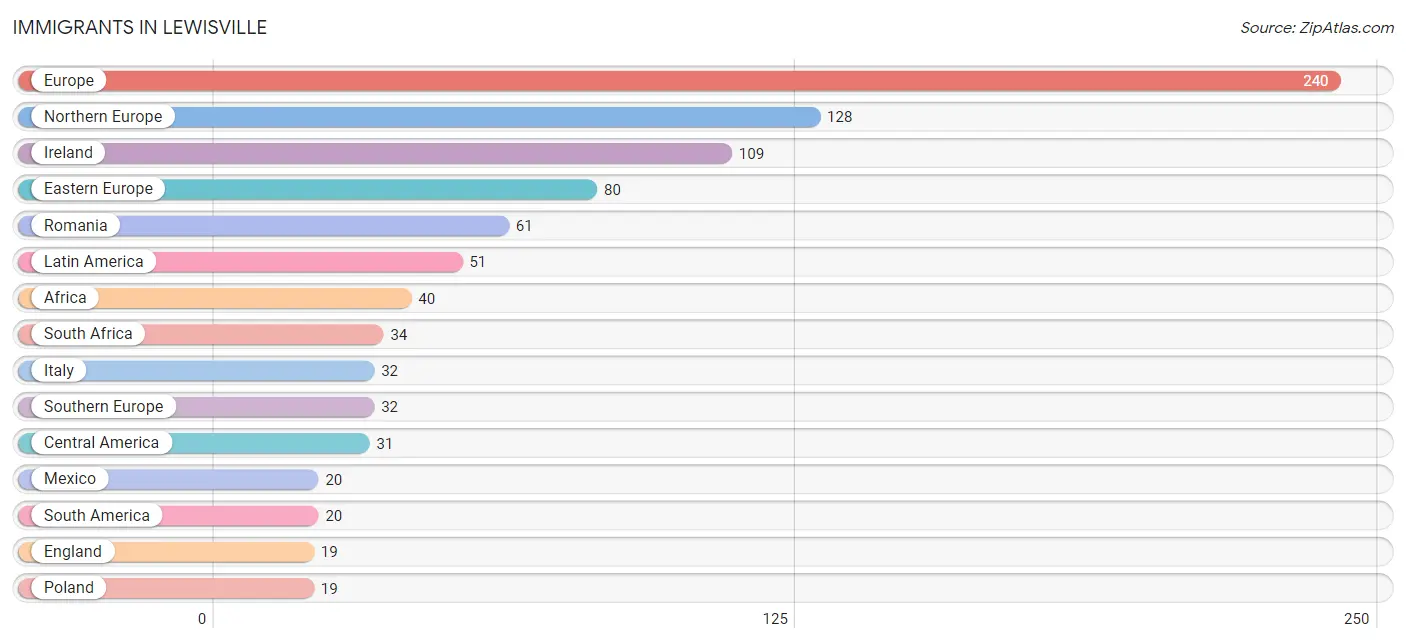
The most numerous immigrant groups reported in Lewisville came from Europe (240 | 1.8%), Northern Europe (128 | 0.9%), Ireland (109 | 0.8%), Eastern Europe (80 | 0.6%), and Romania (61 | 0.4%), together accounting for 4.6% of all Lewisville residents.
| Immigration Origin | # Population | % Population |
| Africa | 40 | 0.3% |
| Asia | 1 | 0.0% |
| Australia | 8 | 0.1% |
| Brazil | 10 | 0.1% |
| Canada | 17 | 0.1% |
| Central America | 31 | 0.2% |
| China | 1 | 0.0% |
| Costa Rica | 11 | 0.1% |
| Eastern Asia | 1 | 0.0% |
| Eastern Europe | 80 | 0.6% |
| England | 19 | 0.1% |
| Europe | 240 | 1.8% |
| Ireland | 109 | 0.8% |
| Italy | 32 | 0.2% |
| Latin America | 51 | 0.4% |
| Mexico | 20 | 0.2% |
| Nigeria | 6 | 0.0% |
| Northern Europe | 128 | 0.9% |
| Oceania | 8 | 0.1% |
| Poland | 19 | 0.1% |
| Romania | 61 | 0.4% |
| South Africa | 34 | 0.3% |
| South America | 20 | 0.2% |
| Southern Europe | 32 | 0.2% |
| Taiwan | 1 | 0.0% |
| Uruguay | 10 | 0.1% |
| Western Africa | 6 | 0.0% | View All 27 Rows |
Sex and Age in Lewisville
Sex and Age in Lewisville
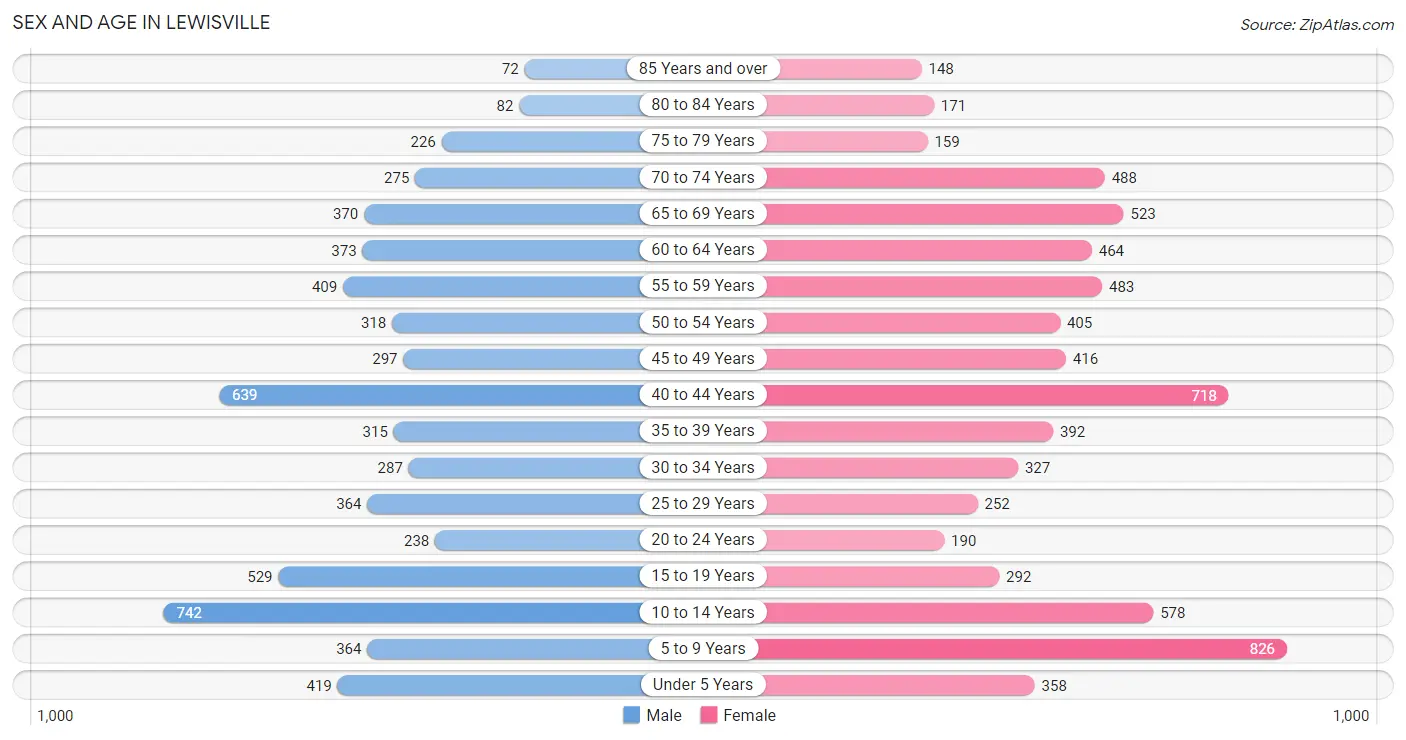
The most populous age groups in Lewisville are 10 to 14 Years (742 | 11.7%) for men and 5 to 9 Years (826 | 11.5%) for women.
| Age Bracket | Male | Female |
| Under 5 Years | 419 (6.6%) | 358 (5.0%) |
| 5 to 9 Years | 364 (5.8%) | 826 (11.5%) |
| 10 to 14 Years | 742 (11.7%) | 578 (8.0%) |
| 15 to 19 Years | 529 (8.4%) | 292 (4.1%) |
| 20 to 24 Years | 238 (3.8%) | 190 (2.6%) |
| 25 to 29 Years | 364 (5.8%) | 252 (3.5%) |
| 30 to 34 Years | 287 (4.5%) | 327 (4.5%) |
| 35 to 39 Years | 315 (5.0%) | 392 (5.4%) |
| 40 to 44 Years | 639 (10.1%) | 718 (10.0%) |
| 45 to 49 Years | 297 (4.7%) | 416 (5.8%) |
| 50 to 54 Years | 318 (5.0%) | 405 (5.6%) |
| 55 to 59 Years | 409 (6.5%) | 483 (6.7%) |
| 60 to 64 Years | 373 (5.9%) | 464 (6.5%) |
| 65 to 69 Years | 370 (5.9%) | 523 (7.3%) |
| 70 to 74 Years | 275 (4.3%) | 488 (6.8%) |
| 75 to 79 Years | 226 (3.6%) | 159 (2.2%) |
| 80 to 84 Years | 82 (1.3%) | 171 (2.4%) |
| 85 Years and over | 72 (1.1%) | 148 (2.1%) |
| Total | 6,319 (100.0%) | 7,190 (100.0%) |
Families and Households in Lewisville
Median Family Size in Lewisville
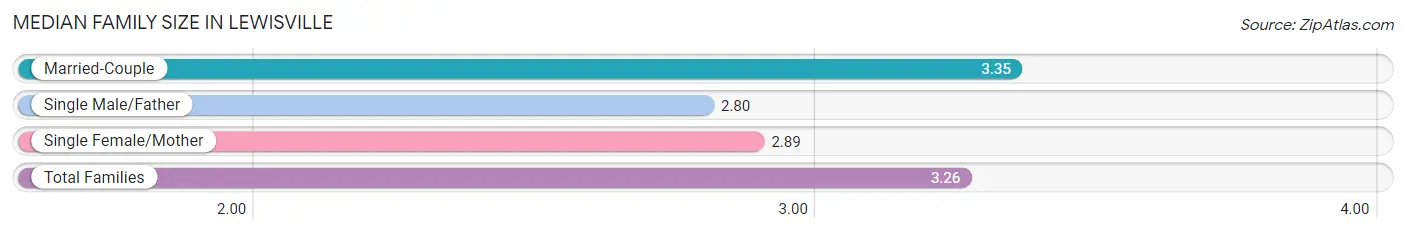
The median family size in Lewisville is 3.26 persons per family, with married-couple families (2,847 | 81.1%) accounting for the largest median family size of 3.35 persons per family. On the other hand, single male/father families (125 | 3.6%) represent the smallest median family size with 2.80 persons per family.
| Family Type | # Families | Family Size |
| Married-Couple | 2,847 (81.1%) | 3.35 |
| Single Male/Father | 125 (3.6%) | 2.80 |
| Single Female/Mother | 540 (15.4%) | 2.89 |
| Total Families | 3,512 (100.0%) | 3.26 |
Median Household Size in Lewisville
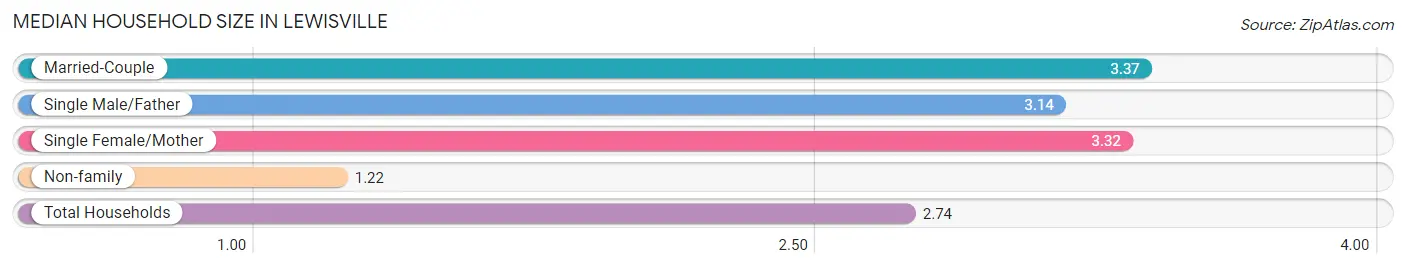
The median household size in Lewisville is 2.74 persons per household, with married-couple households (2,847 | 57.8%) accounting for the largest median household size of 3.37 persons per household. non-family households (1,416 | 28.7%) represent the smallest median household size with 1.22 persons per household.
| Household Type | # Households | Household Size |
| Married-Couple | 2,847 (57.8%) | 3.37 |
| Single Male/Father | 125 (2.5%) | 3.14 |
| Single Female/Mother | 540 (11.0%) | 3.32 |
| Non-family | 1,416 (28.7%) | 1.22 |
| Total Households | 4,928 (100.0%) | 2.74 |
Household Size by Marriage Status in Lewisville
Out of a total of 4,928 households in Lewisville, 3,512 (71.3%) are family households, while 1,416 (28.7%) are nonfamily households. The most numerous type of family households are 2-person households, comprising 1,514, and the most common type of nonfamily households are 1-person households, comprising 1,160.
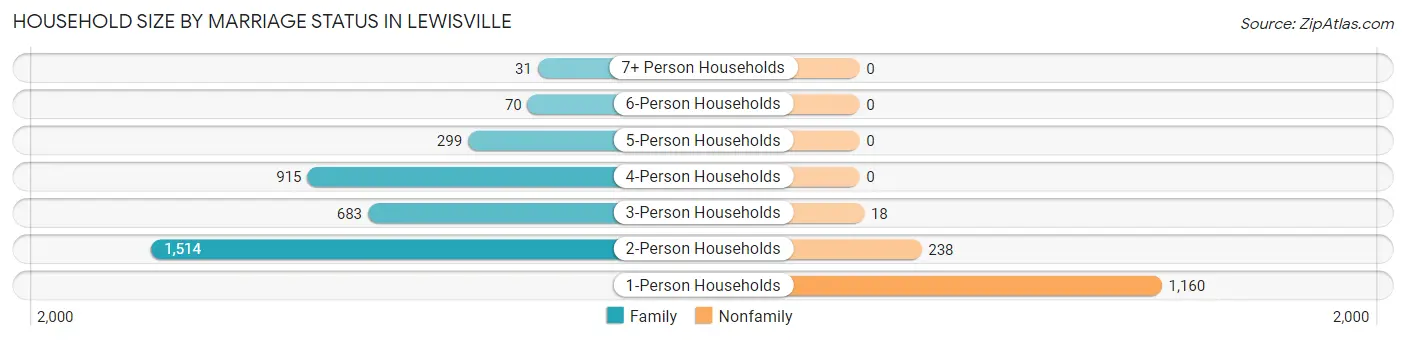
| Household Size | Family Households | Nonfamily Households |
| 1-Person Households | - | 1,160 (23.5%) |
| 2-Person Households | 1,514 (30.7%) | 238 (4.8%) |
| 3-Person Households | 683 (13.9%) | 18 (0.4%) |
| 4-Person Households | 915 (18.6%) | 0 (0.0%) |
| 5-Person Households | 299 (6.1%) | 0 (0.0%) |
| 6-Person Households | 70 (1.4%) | 0 (0.0%) |
| 7+ Person Households | 31 (0.6%) | 0 (0.0%) |
| Total | 3,512 (71.3%) | 1,416 (28.7%) |
Female Fertility in Lewisville
Fertility by Age in Lewisville
Average fertility rate in Lewisville is 25.0 births per 1,000 women. Women in the age bracket of 20 to 34 years have the highest fertility rate with 47.0 births per 1,000 women. Women in the age bracket of 20 to 34 years acount for 55.4% of all women with births.
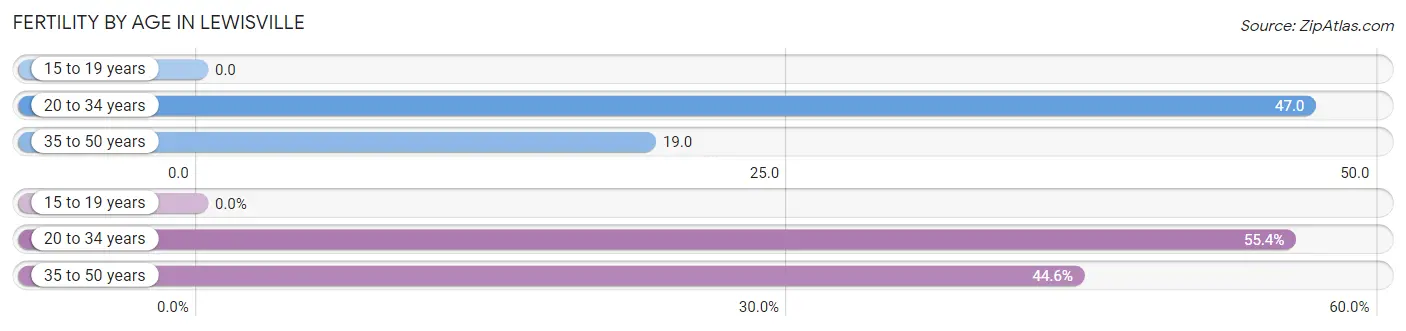
| Age Bracket | Women with Births | Births / 1,000 Women |
| 15 to 19 years | 0 (0.0%) | 0.0 |
| 20 to 34 years | 36 (55.4%) | 47.0 |
| 35 to 50 years | 29 (44.6%) | 19.0 |
| Total | 65 (100.0%) | 25.0 |
Fertility by Age by Marriage Status in Lewisville
72.3% of women with births (65) in Lewisville are married. The highest percentage of unmarried women with births falls into 35 to 50 years age bracket with 62.1% of them unmarried at the time of birth, while the lowest percentage of unmarried women with births belong to 20 to 34 years age bracket with 0.0% of them unmarried.
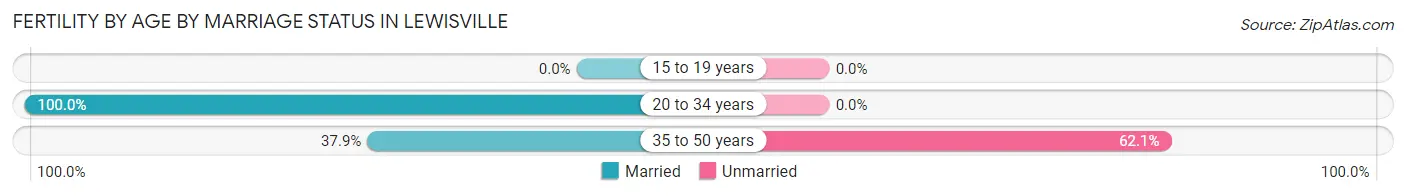
| Age Bracket | Married | Unmarried |
| 15 to 19 years | 0 (0.0%) | 0 (0.0%) |
| 20 to 34 years | 36 (100.0%) | 0 (0.0%) |
| 35 to 50 years | 11 (37.9%) | 18 (62.1%) |
| Total | 47 (72.3%) | 18 (27.7%) |
Fertility by Education in Lewisville
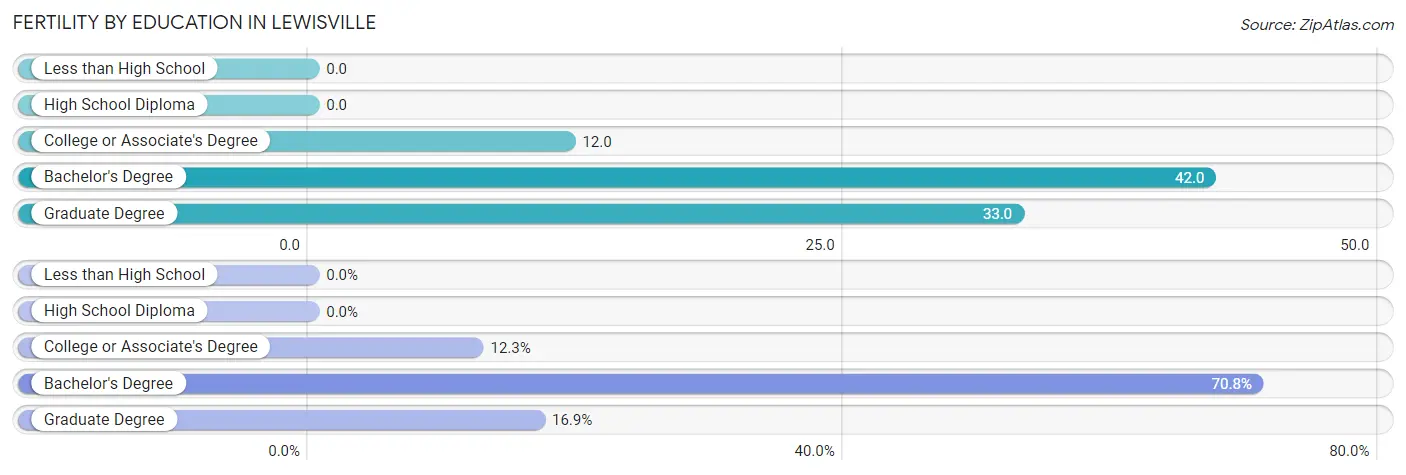
| Educational Attainment | Women with Births | Births / 1,000 Women |
| Less than High School | 0 (0.0%) | 0.0 |
| High School Diploma | 0 (0.0%) | 0.0 |
| College or Associate's Degree | 8 (12.3%) | 12.0 |
| Bachelor's Degree | 46 (70.8%) | 42.0 |
| Graduate Degree | 11 (16.9%) | 33.0 |
| Total | 65 (100.0%) | 25.0 |
Fertility by Education by Marriage Status in Lewisville
27.7% of women with births in Lewisville are unmarried. Women with the educational attainment of college or associate's degree are most likely to be married with 100.0% of them married at childbirth, while women with the educational attainment of bachelor's degree are least likely to be married with 39.1% of them unmarried at childbirth.
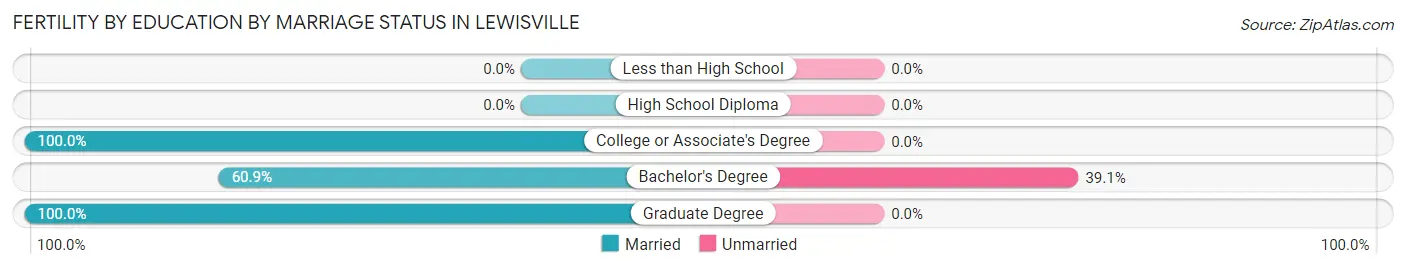
| Educational Attainment | Married | Unmarried |
| Less than High School | 0 (0.0%) | 0 (0.0%) |
| High School Diploma | 0 (0.0%) | 0 (0.0%) |
| College or Associate's Degree | 8 (100.0%) | 0 (0.0%) |
| Bachelor's Degree | 28 (60.9%) | 18 (39.1%) |
| Graduate Degree | 11 (100.0%) | 0 (0.0%) |
| Total | 47 (72.3%) | 18 (27.7%) |
Employment Characteristics in Lewisville
Employment by Class of Employer in Lewisville
Among the 6,175 employed individuals in Lewisville, private company employees (4,129 | 66.9%), not-for-profit organizations (735 | 11.9%), and self-employed (incorporated) (425 | 6.9%) make up the most common classes of employment.
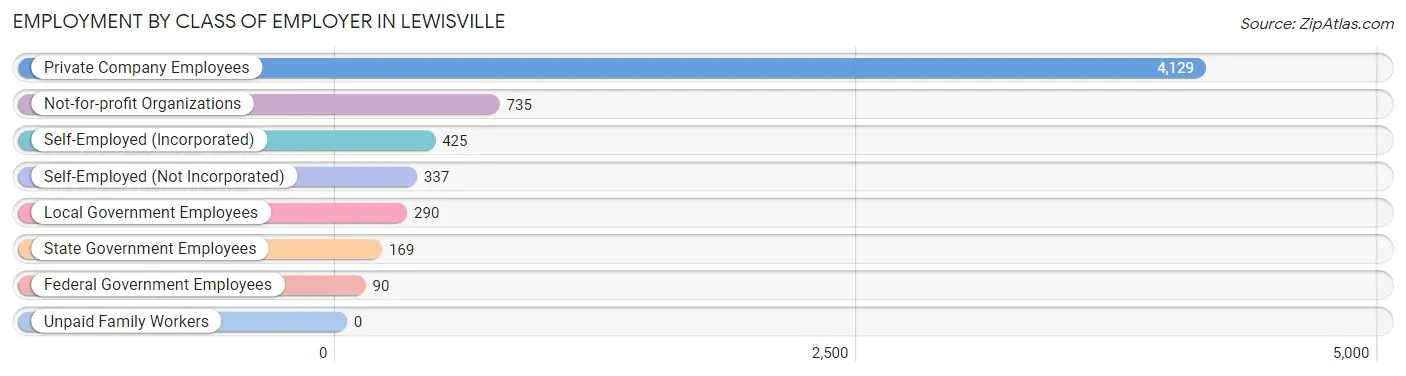
| Employer Class | # Employees | % Employees |
| Private Company Employees | 4,129 | 66.9% |
| Self-Employed (Incorporated) | 425 | 6.9% |
| Self-Employed (Not Incorporated) | 337 | 5.5% |
| Not-for-profit Organizations | 735 | 11.9% |
| Local Government Employees | 290 | 4.7% |
| State Government Employees | 169 | 2.7% |
| Federal Government Employees | 90 | 1.5% |
| Unpaid Family Workers | 0 | 0.0% |
| Total | 6,175 | 100.0% |
Employment Status by Age in Lewisville
According to the labor force statistics for Lewisville, out of the total population over 16 years of age (10,094), 66.2% or 6,682 individuals are in the labor force, with 3.6% or 241 of them unemployed. The age group with the highest labor force participation rate is 30 to 34 years, with 92.5% or 568 individuals in the labor force. Within the labor force, the 16 to 19 years age range has the highest percentage of unemployed individuals, with 18.1% or 64 of them being unemployed.
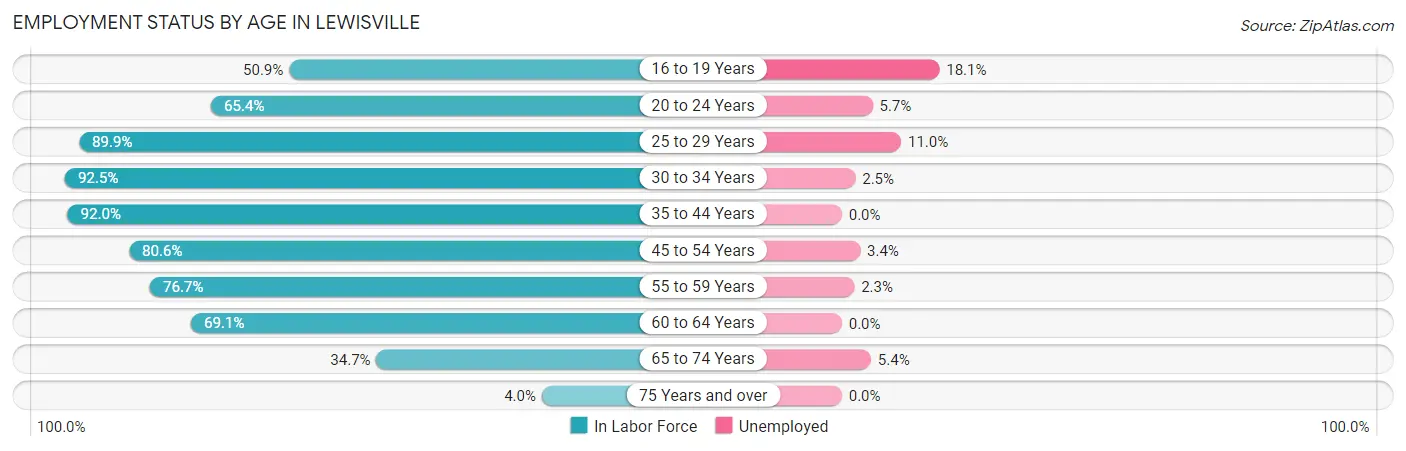
| Age Bracket | In Labor Force | Unemployed |
| 16 to 19 Years | 353 (50.9%) | 64 (18.1%) |
| 20 to 24 Years | 280 (65.4%) | 16 (5.7%) |
| 25 to 29 Years | 554 (89.9%) | 61 (11.0%) |
| 30 to 34 Years | 568 (92.5%) | 14 (2.5%) |
| 35 to 44 Years | 1,899 (92.0%) | 0 (0.0%) |
| 45 to 54 Years | 1,157 (80.6%) | 39 (3.4%) |
| 55 to 59 Years | 684 (76.7%) | 16 (2.3%) |
| 60 to 64 Years | 578 (69.1%) | 0 (0.0%) |
| 65 to 74 Years | 575 (34.7%) | 31 (5.4%) |
| 75 Years and over | 34 (4.0%) | 0 (0.0%) |
| Total | 6,682 (66.2%) | 241 (3.6%) |
Employment Status by Educational Attainment in Lewisville
According to labor force statistics for Lewisville, 84.2% of individuals (5,438) out of the total population between 25 and 64 years of age (6,459) are in the labor force, with 2.4% or 131 of them being unemployed. The group with the highest labor force participation rate are those with the educational attainment of less than high school, with 89.2% or 173 individuals in the labor force. Within the labor force, individuals with high school diploma education have the highest percentage of unemployment, with 6.6% or 60 of them being unemployed.
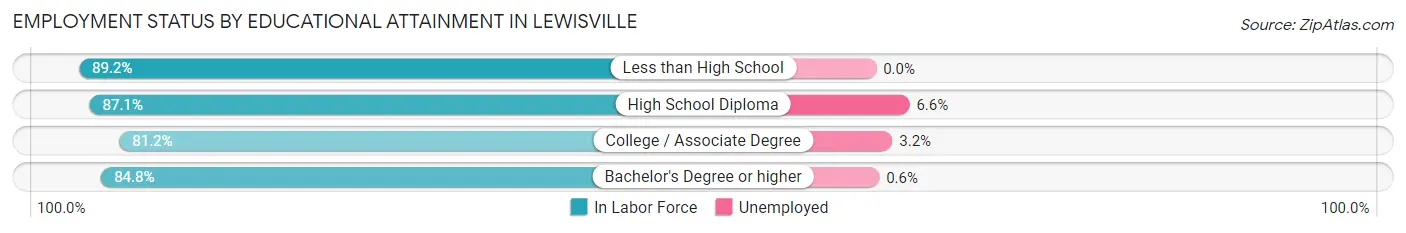
| Educational Attainment | In Labor Force | Unemployed |
| Less than High School | 173 (89.2%) | 0 (0.0%) |
| High School Diploma | 915 (87.1%) | 69 (6.6%) |
| College / Associate Degree | 1,572 (81.2%) | 62 (3.2%) |
| Bachelor's Degree or higher | 2,781 (84.8%) | 20 (0.6%) |
| Total | 5,438 (84.2%) | 155 (2.4%) |
Employment Occupations by Sex in Lewisville
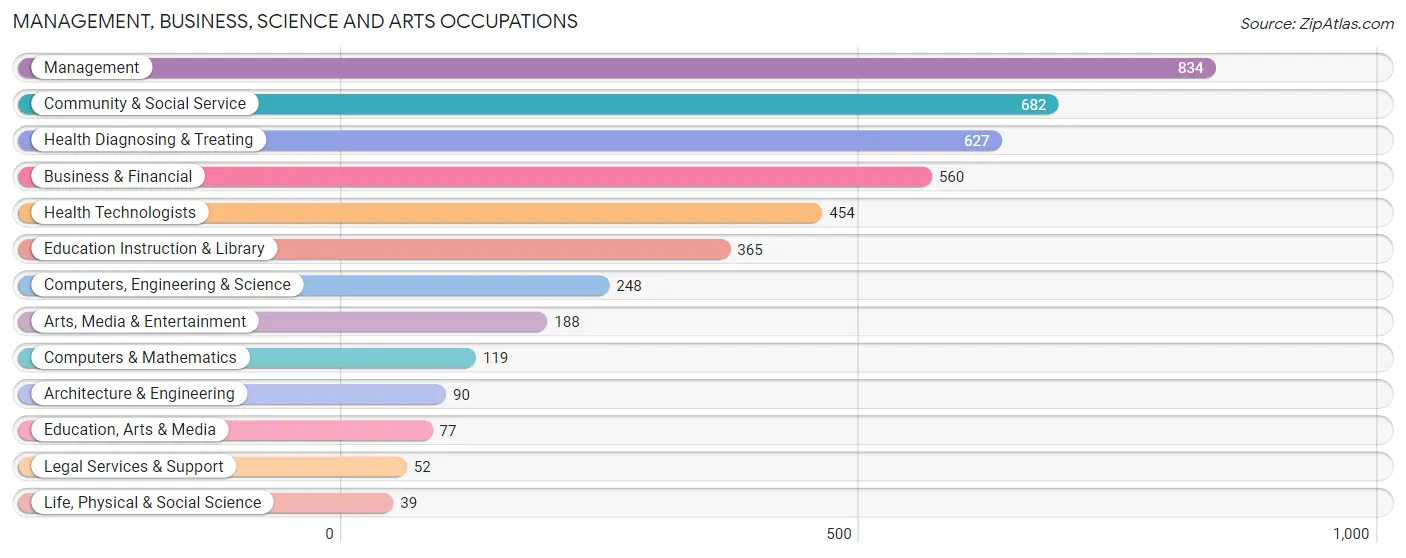
Management, Business, Science and Arts Occupations
The most common Management, Business, Science and Arts occupations in Lewisville are Management (834 | 13.0%), Community & Social Service (682 | 10.6%), Health Diagnosing & Treating (627 | 9.8%), Business & Financial (560 | 8.7%), and Health Technologists (454 | 7.1%).
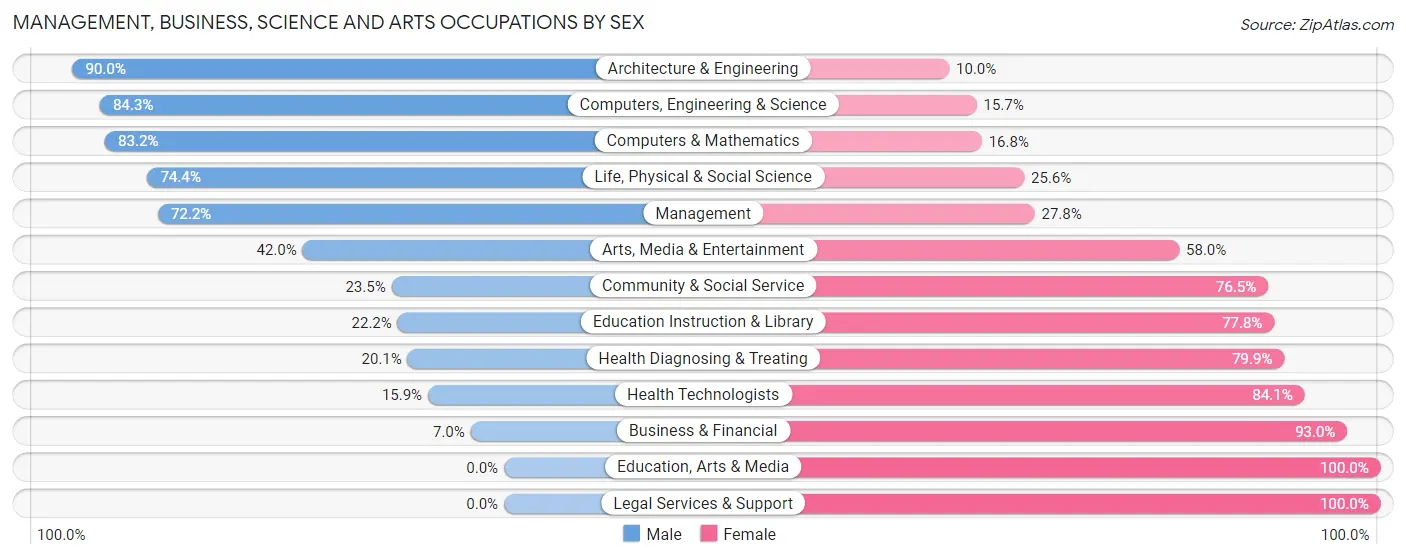
Management, Business, Science and Arts Occupations by Sex
Within the Management, Business, Science and Arts occupations in Lewisville, the most male-oriented occupations are Architecture & Engineering (90.0%), Computers, Engineering & Science (84.3%), and Computers & Mathematics (83.2%), while the most female-oriented occupations are Education, Arts & Media (100.0%), Legal Services & Support (100.0%), and Business & Financial (93.0%).
| Occupation | Male | Female |
| Management | 602 (72.2%) | 232 (27.8%) |
| Business & Financial | 39 (7.0%) | 521 (93.0%) |
| Computers, Engineering & Science | 209 (84.3%) | 39 (15.7%) |
| Computers & Mathematics | 99 (83.2%) | 20 (16.8%) |
| Architecture & Engineering | 81 (90.0%) | 9 (10.0%) |
| Life, Physical & Social Science | 29 (74.4%) | 10 (25.6%) |
| Community & Social Service | 160 (23.5%) | 522 (76.5%) |
| Education, Arts & Media | 0 (0.0%) | 77 (100.0%) |
| Legal Services & Support | 0 (0.0%) | 52 (100.0%) |
| Education Instruction & Library | 81 (22.2%) | 284 (77.8%) |
| Arts, Media & Entertainment | 79 (42.0%) | 109 (58.0%) |
| Health Diagnosing & Treating | 126 (20.1%) | 501 (79.9%) |
| Health Technologists | 72 (15.9%) | 382 (84.1%) |
| Total (Category) | 1,136 (38.5%) | 1,815 (61.5%) |
| Total (Overall) | 3,314 (51.7%) | 3,091 (48.3%) |
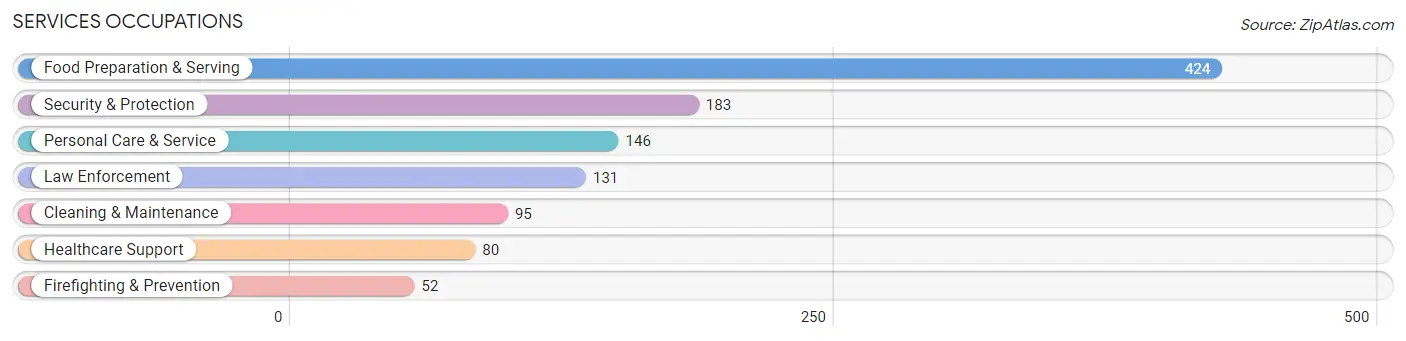
Services Occupations
The most common Services occupations in Lewisville are Food Preparation & Serving (424 | 6.6%), Security & Protection (183 | 2.9%), Personal Care & Service (146 | 2.3%), Law Enforcement (131 | 2.1%), and Cleaning & Maintenance (95 | 1.5%).
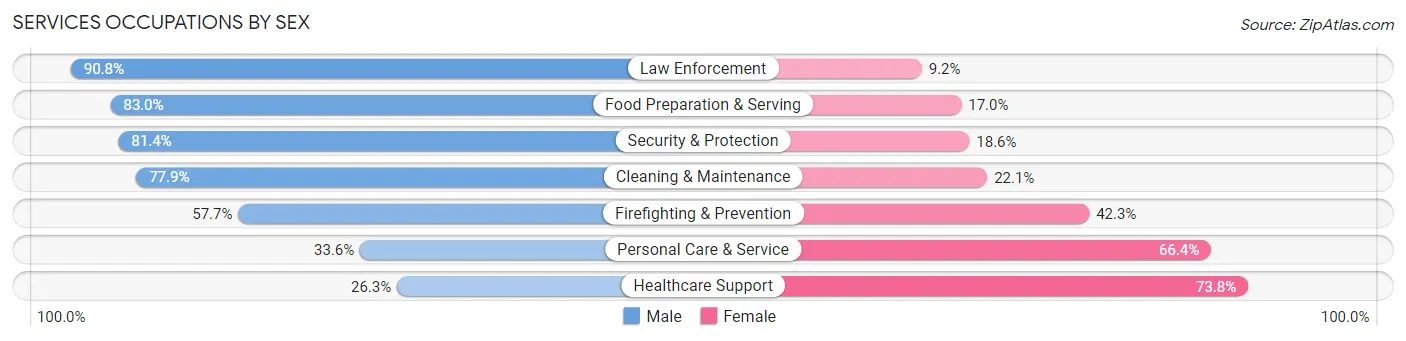
Services Occupations by Sex
Within the Services occupations in Lewisville, the most male-oriented occupations are Law Enforcement (90.8%), Food Preparation & Serving (83.0%), and Security & Protection (81.4%), while the most female-oriented occupations are Healthcare Support (73.8%), Personal Care & Service (66.4%), and Firefighting & Prevention (42.3%).
| Occupation | Male | Female |
| Healthcare Support | 21 (26.3%) | 59 (73.8%) |
| Security & Protection | 149 (81.4%) | 34 (18.6%) |
| Firefighting & Prevention | 30 (57.7%) | 22 (42.3%) |
| Law Enforcement | 119 (90.8%) | 12 (9.2%) |
| Food Preparation & Serving | 352 (83.0%) | 72 (17.0%) |
| Cleaning & Maintenance | 74 (77.9%) | 21 (22.1%) |
| Personal Care & Service | 49 (33.6%) | 97 (66.4%) |
| Total (Category) | 645 (69.5%) | 283 (30.5%) |
| Total (Overall) | 3,314 (51.7%) | 3,091 (48.3%) |
Sales and Office Occupations
The most common Sales and Office occupations in Lewisville are Office & Administration (767 | 12.0%), and Sales & Related (545 | 8.5%).

Sales and Office Occupations by Sex
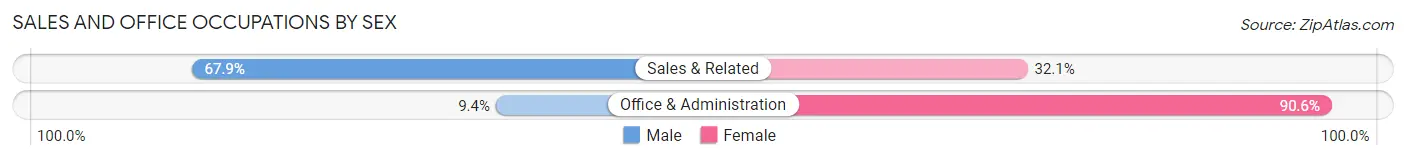
| Occupation | Male | Female |
| Sales & Related | 370 (67.9%) | 175 (32.1%) |
| Office & Administration | 72 (9.4%) | 695 (90.6%) |
| Total (Category) | 442 (33.7%) | 870 (66.3%) |
| Total (Overall) | 3,314 (51.7%) | 3,091 (48.3%) |
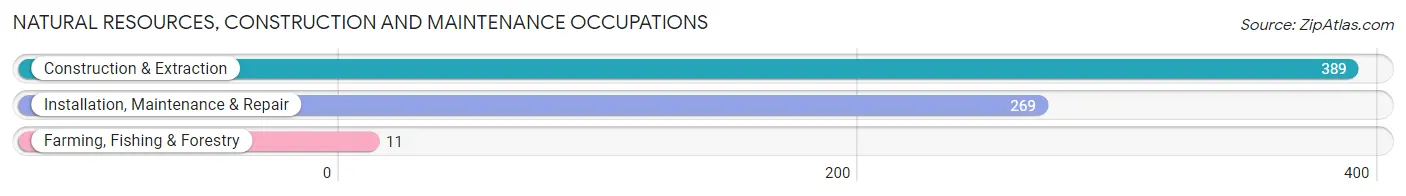
Natural Resources, Construction and Maintenance Occupations
The most common Natural Resources, Construction and Maintenance occupations in Lewisville are Construction & Extraction (389 | 6.1%), Installation, Maintenance & Repair (269 | 4.2%), and Farming, Fishing & Forestry (11 | 0.2%).
Natural Resources, Construction and Maintenance Occupations by Sex
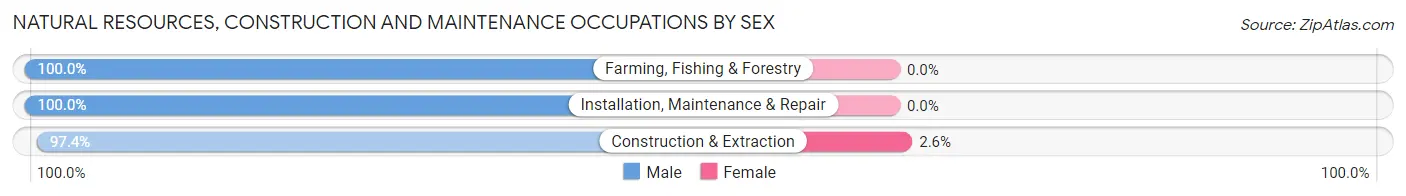
| Occupation | Male | Female |
| Farming, Fishing & Forestry | 11 (100.0%) | 0 (0.0%) |
| Construction & Extraction | 379 (97.4%) | 10 (2.6%) |
| Installation, Maintenance & Repair | 269 (100.0%) | 0 (0.0%) |
| Total (Category) | 659 (98.5%) | 10 (1.5%) |
| Total (Overall) | 3,314 (51.7%) | 3,091 (48.3%) |
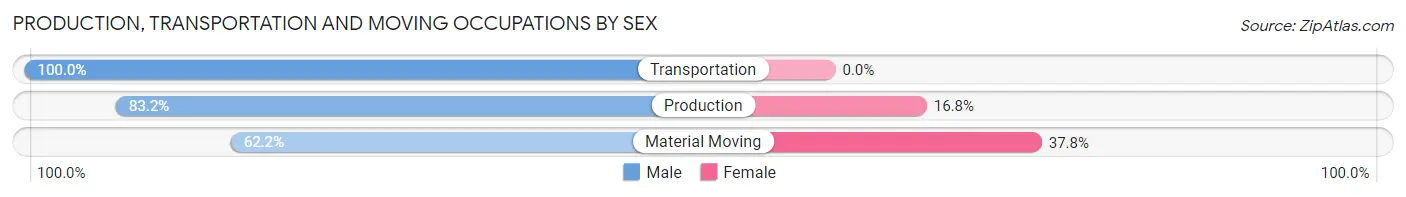
Production, Transportation and Moving Occupations
The most common Production, Transportation and Moving occupations in Lewisville are Material Moving (222 | 3.5%), Production (173 | 2.7%), and Transportation (150 | 2.3%).
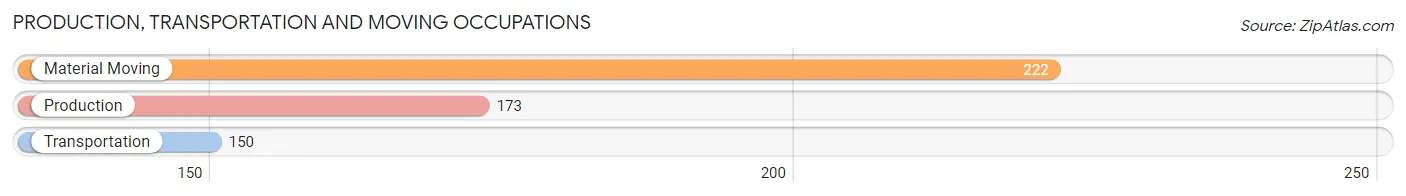
Production, Transportation and Moving Occupations by Sex
| Occupation | Male | Female |
| Production | 144 (83.2%) | 29 (16.8%) |
| Transportation | 150 (100.0%) | 0 (0.0%) |
| Material Moving | 138 (62.2%) | 84 (37.8%) |
| Total (Category) | 432 (79.3%) | 113 (20.7%) |
| Total (Overall) | 3,314 (51.7%) | 3,091 (48.3%) |
Employment Industries by Sex in Lewisville
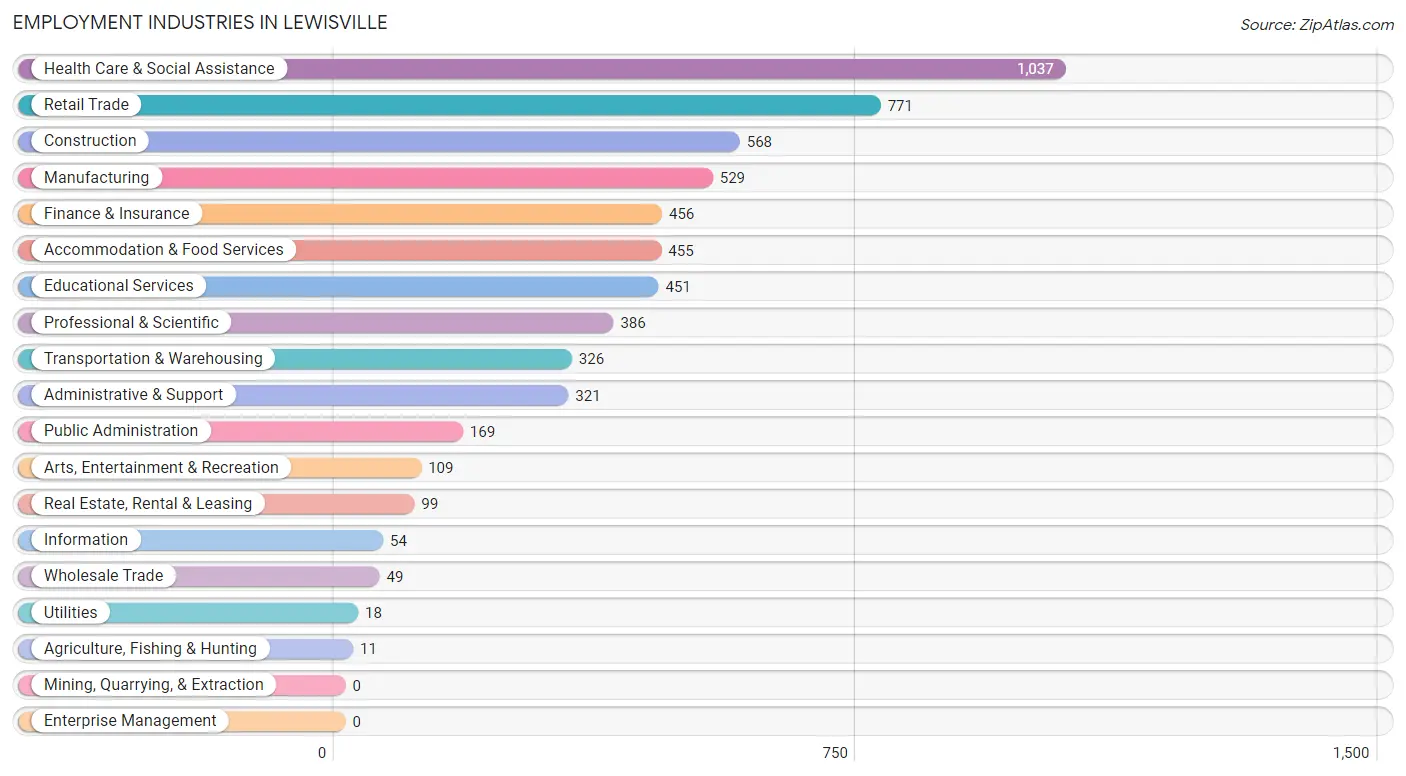
Employment Industries in Lewisville
The major employment industries in Lewisville include Health Care & Social Assistance (1,037 | 16.2%), Retail Trade (771 | 12.0%), Construction (568 | 8.9%), Manufacturing (529 | 8.3%), and Finance & Insurance (456 | 7.1%).
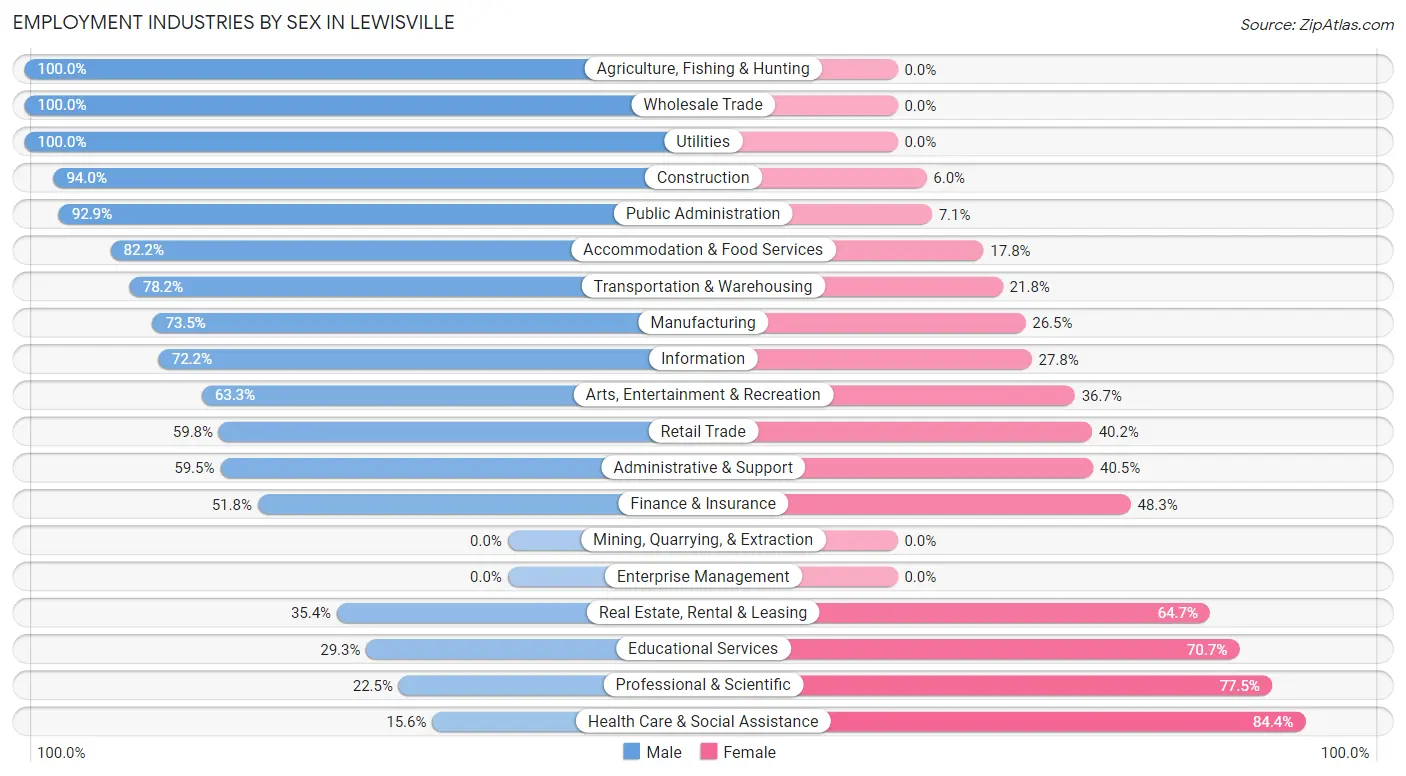
Employment Industries by Sex in Lewisville
The Lewisville industries that see more men than women are Agriculture, Fishing & Hunting (100.0%), Wholesale Trade (100.0%), and Utilities (100.0%), whereas the industries that tend to have a higher number of women are Health Care & Social Assistance (84.4%), Professional & Scientific (77.5%), and Educational Services (70.7%).
| Industry | Male | Female |
| Agriculture, Fishing & Hunting | 11 (100.0%) | 0 (0.0%) |
| Mining, Quarrying, & Extraction | 0 (0.0%) | 0 (0.0%) |
| Construction | 534 (94.0%) | 34 (6.0%) |
| Manufacturing | 389 (73.5%) | 140 (26.5%) |
| Wholesale Trade | 49 (100.0%) | 0 (0.0%) |
| Retail Trade | 461 (59.8%) | 310 (40.2%) |
| Transportation & Warehousing | 255 (78.2%) | 71 (21.8%) |
| Utilities | 18 (100.0%) | 0 (0.0%) |
| Information | 39 (72.2%) | 15 (27.8%) |
| Finance & Insurance | 236 (51.7%) | 220 (48.2%) |
| Real Estate, Rental & Leasing | 35 (35.3%) | 64 (64.6%) |
| Professional & Scientific | 87 (22.5%) | 299 (77.5%) |
| Enterprise Management | 0 (0.0%) | 0 (0.0%) |
| Administrative & Support | 191 (59.5%) | 130 (40.5%) |
| Educational Services | 132 (29.3%) | 319 (70.7%) |
| Health Care & Social Assistance | 162 (15.6%) | 875 (84.4%) |
| Arts, Entertainment & Recreation | 69 (63.3%) | 40 (36.7%) |
| Accommodation & Food Services | 374 (82.2%) | 81 (17.8%) |
| Public Administration | 157 (92.9%) | 12 (7.1%) |
| Total | 3,314 (51.7%) | 3,091 (48.3%) |
Education in Lewisville
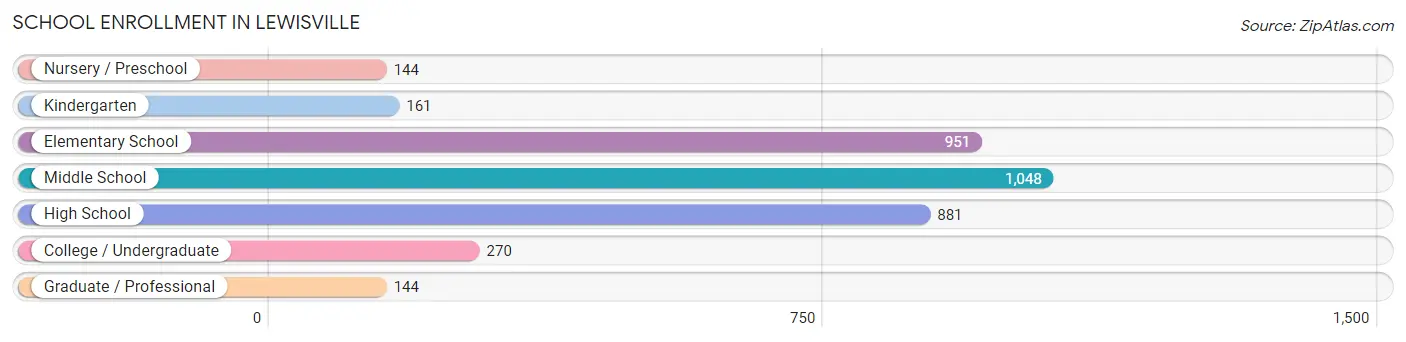
School Enrollment in Lewisville
The most common levels of schooling among the 3,599 students in Lewisville are middle school (1,048 | 29.1%), elementary school (951 | 26.4%), and high school (881 | 24.5%).
| School Level | # Students | % Students |
| Nursery / Preschool | 144 | 4.0% |
| Kindergarten | 161 | 4.5% |
| Elementary School | 951 | 26.4% |
| Middle School | 1,048 | 29.1% |
| High School | 881 | 24.5% |
| College / Undergraduate | 270 | 7.5% |
| Graduate / Professional | 144 | 4.0% |
| Total | 3,599 | 100.0% |
School Enrollment by Age by Funding Source in Lewisville
Out of a total of 3,599 students who are enrolled in schools in Lewisville, 1,047 (29.1%) attend a private institution, while the remaining 2,552 (70.9%) are enrolled in public schools. The age group of 3 to 4 year olds has the highest likelihood of being enrolled in private schools, with 73 (62.4% in the age bracket) enrolled. Conversely, the age group of 25 to 34 year olds has the lowest likelihood of being enrolled in a private school, with 54 (100.0% in the age bracket) attending a public institution.
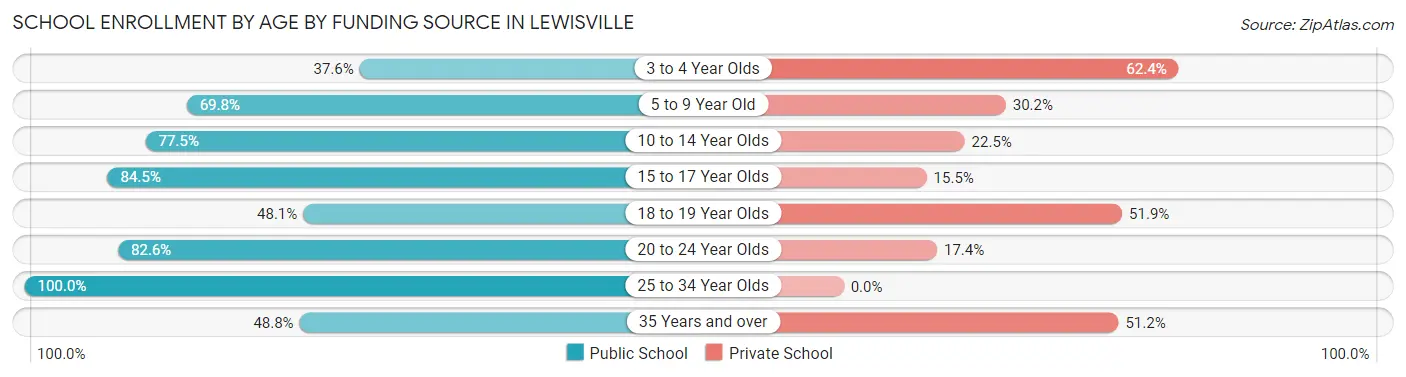
| Age Bracket | Public School | Private School |
| 3 to 4 Year Olds | 44 (37.6%) | 73 (62.4%) |
| 5 to 9 Year Old | 779 (69.8%) | 337 (30.2%) |
| 10 to 14 Year Olds | 1,014 (77.5%) | 295 (22.5%) |
| 15 to 17 Year Olds | 350 (84.5%) | 64 (15.5%) |
| 18 to 19 Year Olds | 129 (48.1%) | 139 (51.9%) |
| 20 to 24 Year Olds | 57 (82.6%) | 12 (17.4%) |
| 25 to 34 Year Olds | 54 (100.0%) | 0 (0.0%) |
| 35 Years and over | 123 (48.8%) | 129 (51.2%) |
| Total | 2,552 (70.9%) | 1,047 (29.1%) |
Educational Attainment by Field of Study in Lewisville
Business (961 | 22.0%), science & technology (510 | 11.7%), communications (505 | 11.6%), education (292 | 6.7%), and arts & humanities (291 | 6.7%) are the most common fields of study among 4,364 individuals in Lewisville who have obtained a bachelor's degree or higher.
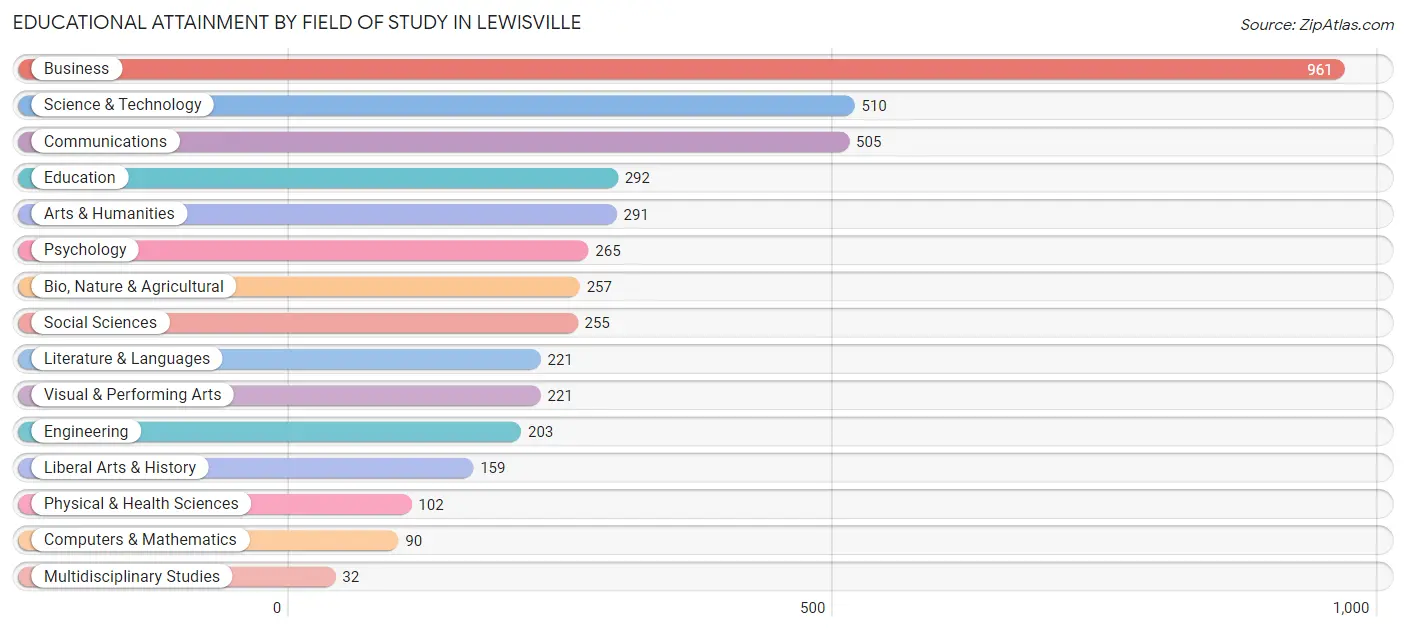
| Field of Study | # Graduates | % Graduates |
| Computers & Mathematics | 90 | 2.1% |
| Bio, Nature & Agricultural | 257 | 5.9% |
| Physical & Health Sciences | 102 | 2.3% |
| Psychology | 265 | 6.1% |
| Social Sciences | 255 | 5.8% |
| Engineering | 203 | 4.6% |
| Multidisciplinary Studies | 32 | 0.7% |
| Science & Technology | 510 | 11.7% |
| Business | 961 | 22.0% |
| Education | 292 | 6.7% |
| Literature & Languages | 221 | 5.1% |
| Liberal Arts & History | 159 | 3.6% |
| Visual & Performing Arts | 221 | 5.1% |
| Communications | 505 | 11.6% |
| Arts & Humanities | 291 | 6.7% |
| Total | 4,364 | 100.0% |
Transportation & Commute in Lewisville
Vehicle Availability by Sex in Lewisville
The most prevalent vehicle ownership categories in Lewisville are males with 2 vehicles (1,399, accounting for 41.9%) and females with 2 vehicles (1,093, making up 49.3%).
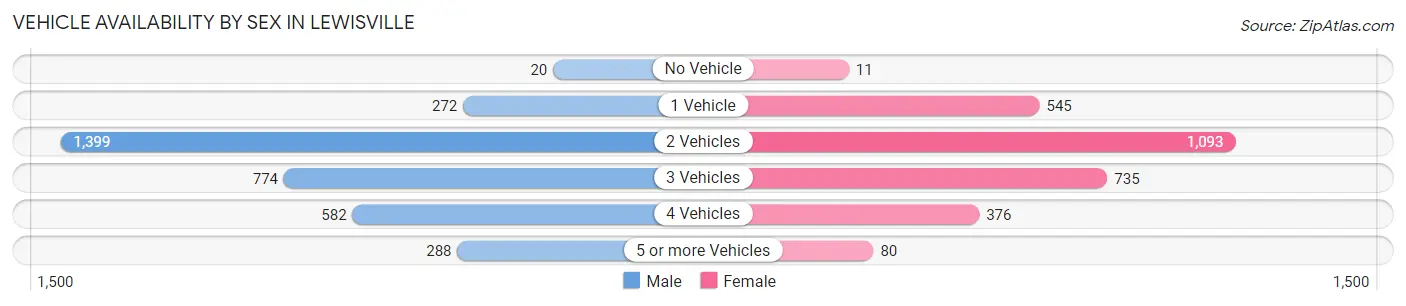
| Vehicles Available | Male | Female |
| No Vehicle | 20 (0.6%) | 11 (0.4%) |
| 1 Vehicle | 272 (8.2%) | 545 (19.2%) |
| 2 Vehicles | 1,399 (41.9%) | 1,093 (38.5%) |
| 3 Vehicles | 774 (23.2%) | 735 (25.9%) |
| 4 Vehicles | 582 (17.4%) | 376 (13.2%) |
| 5 or more Vehicles | 288 (8.6%) | 80 (2.8%) |
| Total | 3,335 (100.0%) | 2,840 (100.0%) |
Commute Time in Lewisville
The most frequently occuring commute durations in Lewisville are 15 to 19 minutes (1,160 commuters, 22.0%), 20 to 24 minutes (1,018 commuters, 19.3%), and 10 to 14 minutes (783 commuters, 14.8%).
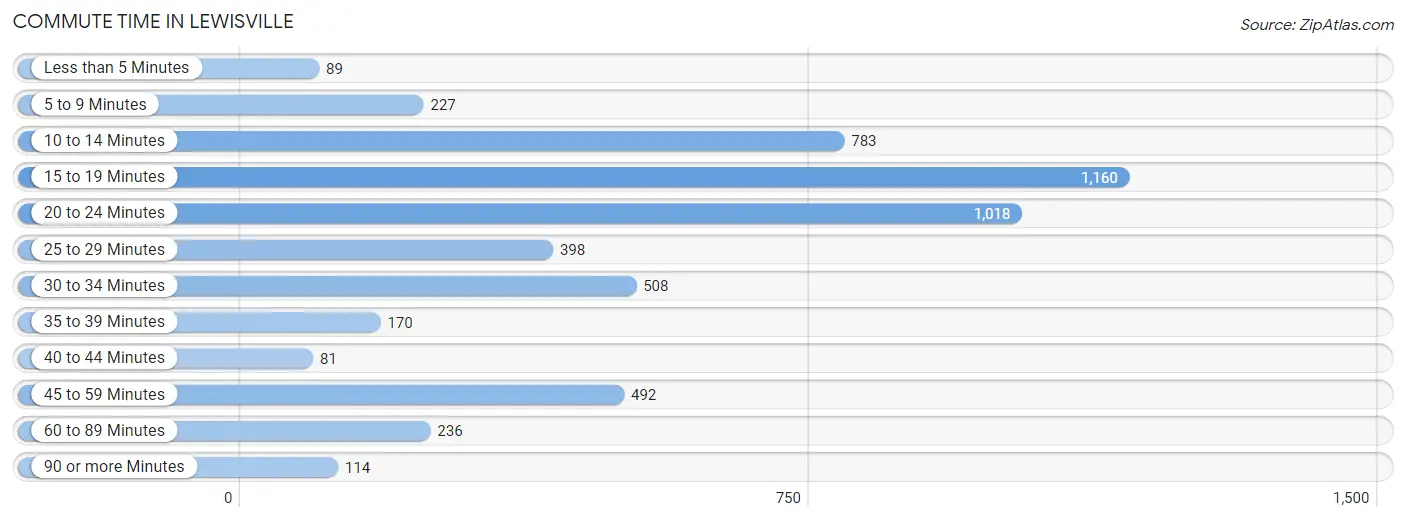
| Commute Time | # Commuters | % Commuters |
| Less than 5 Minutes | 89 | 1.7% |
| 5 to 9 Minutes | 227 | 4.3% |
| 10 to 14 Minutes | 783 | 14.8% |
| 15 to 19 Minutes | 1,160 | 22.0% |
| 20 to 24 Minutes | 1,018 | 19.3% |
| 25 to 29 Minutes | 398 | 7.5% |
| 30 to 34 Minutes | 508 | 9.6% |
| 35 to 39 Minutes | 170 | 3.2% |
| 40 to 44 Minutes | 81 | 1.5% |
| 45 to 59 Minutes | 492 | 9.3% |
| 60 to 89 Minutes | 236 | 4.5% |
| 90 or more Minutes | 114 | 2.2% |
Commute Time by Sex in Lewisville
The most common commute times in Lewisville are 15 to 19 minutes (731 commuters, 24.6%) for males and 20 to 24 minutes (528 commuters, 22.9%) for females.
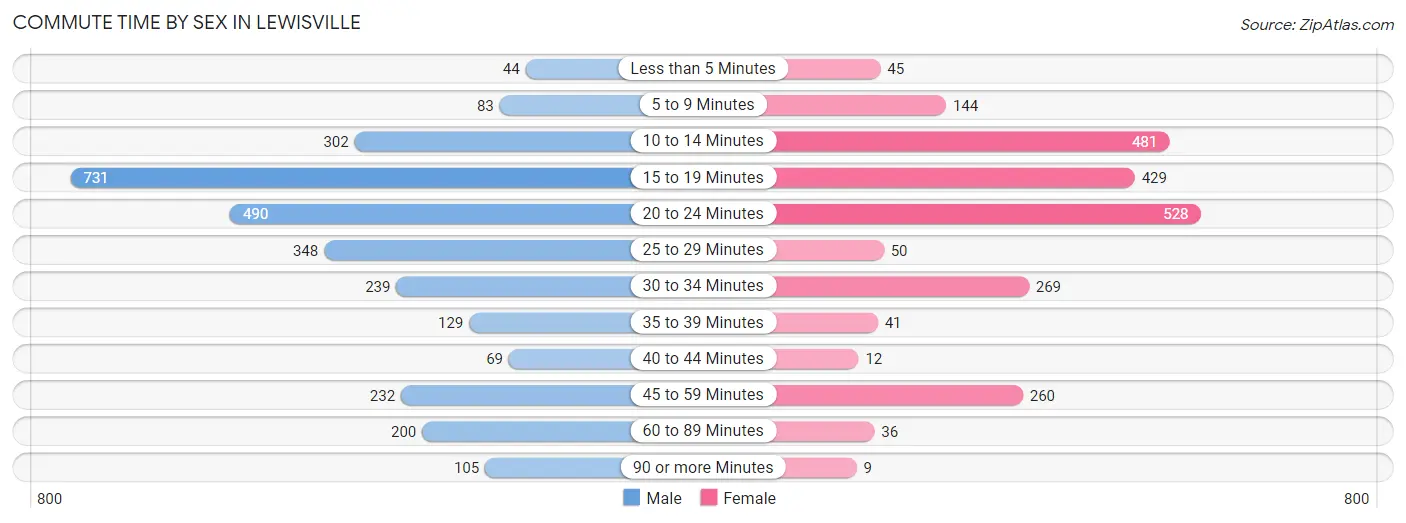
| Commute Time | Male | Female |
| Less than 5 Minutes | 44 (1.5%) | 45 (1.9%) |
| 5 to 9 Minutes | 83 (2.8%) | 144 (6.2%) |
| 10 to 14 Minutes | 302 (10.2%) | 481 (20.9%) |
| 15 to 19 Minutes | 731 (24.6%) | 429 (18.6%) |
| 20 to 24 Minutes | 490 (16.5%) | 528 (22.9%) |
| 25 to 29 Minutes | 348 (11.7%) | 50 (2.2%) |
| 30 to 34 Minutes | 239 (8.0%) | 269 (11.7%) |
| 35 to 39 Minutes | 129 (4.3%) | 41 (1.8%) |
| 40 to 44 Minutes | 69 (2.3%) | 12 (0.5%) |
| 45 to 59 Minutes | 232 (7.8%) | 260 (11.3%) |
| 60 to 89 Minutes | 200 (6.7%) | 36 (1.6%) |
| 90 or more Minutes | 105 (3.5%) | 9 (0.4%) |
Time of Departure to Work by Sex in Lewisville
The most frequent times of departure to work in Lewisville are 7:00 AM to 7:29 AM (527, 17.7%) for males and 7:00 AM to 7:29 AM (380, 16.5%) for females.
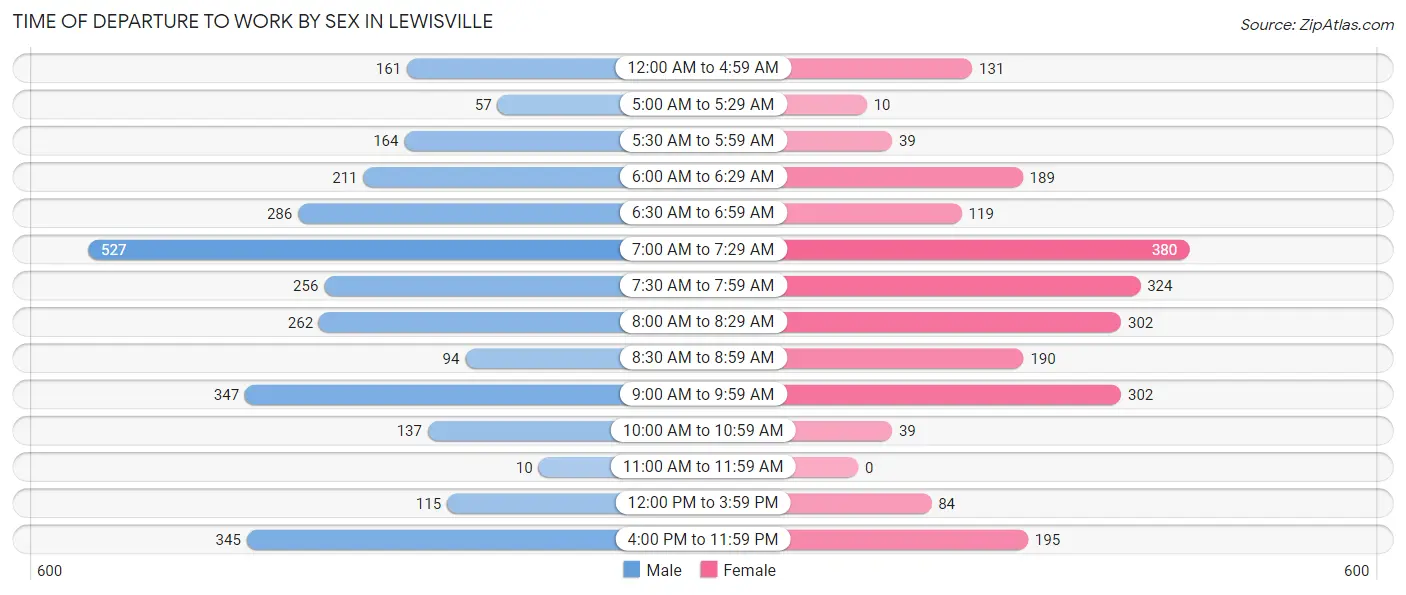
| Time of Departure | Male | Female |
| 12:00 AM to 4:59 AM | 161 (5.4%) | 131 (5.7%) |
| 5:00 AM to 5:29 AM | 57 (1.9%) | 10 (0.4%) |
| 5:30 AM to 5:59 AM | 164 (5.5%) | 39 (1.7%) |
| 6:00 AM to 6:29 AM | 211 (7.1%) | 189 (8.2%) |
| 6:30 AM to 6:59 AM | 286 (9.6%) | 119 (5.2%) |
| 7:00 AM to 7:29 AM | 527 (17.7%) | 380 (16.5%) |
| 7:30 AM to 7:59 AM | 256 (8.6%) | 324 (14.1%) |
| 8:00 AM to 8:29 AM | 262 (8.8%) | 302 (13.1%) |
| 8:30 AM to 8:59 AM | 94 (3.2%) | 190 (8.3%) |
| 9:00 AM to 9:59 AM | 347 (11.7%) | 302 (13.1%) |
| 10:00 AM to 10:59 AM | 137 (4.6%) | 39 (1.7%) |
| 11:00 AM to 11:59 AM | 10 (0.3%) | 0 (0.0%) |
| 12:00 PM to 3:59 PM | 115 (3.9%) | 84 (3.6%) |
| 4:00 PM to 11:59 PM | 345 (11.6%) | 195 (8.5%) |
| Total | 2,972 (100.0%) | 2,304 (100.0%) |
Housing Occupancy in Lewisville
Occupancy by Ownership in Lewisville
Of the total 4,928 dwellings in Lewisville, owner-occupied units account for 4,117 (83.5%), while renter-occupied units make up 811 (16.5%).
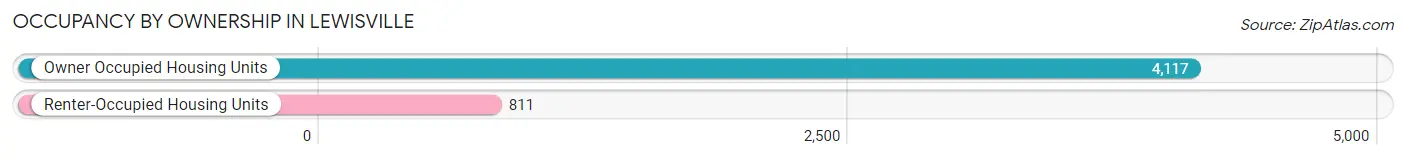
| Occupancy | # Housing Units | % Housing Units |
| Owner Occupied Housing Units | 4,117 | 83.5% |
| Renter-Occupied Housing Units | 811 | 16.5% |
| Total Occupied Housing Units | 4,928 | 100.0% |
Occupancy by Household Size in Lewisville
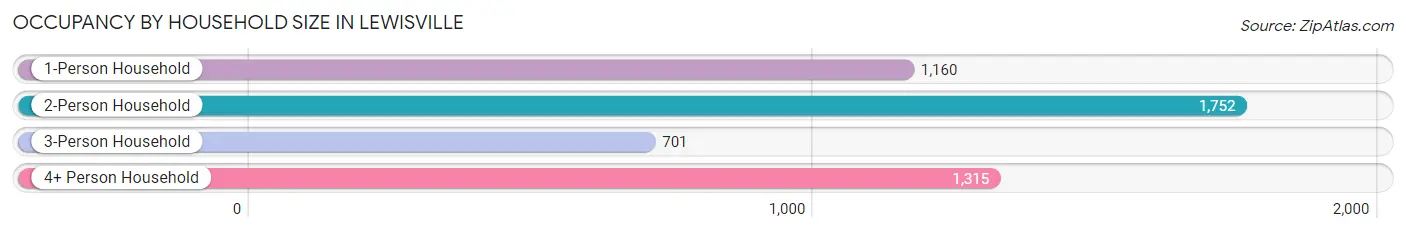
| Household Size | # Housing Units | % Housing Units |
| 1-Person Household | 1,160 | 23.5% |
| 2-Person Household | 1,752 | 35.5% |
| 3-Person Household | 701 | 14.2% |
| 4+ Person Household | 1,315 | 26.7% |
| Total Housing Units | 4,928 | 100.0% |
Occupancy by Ownership by Household Size in Lewisville
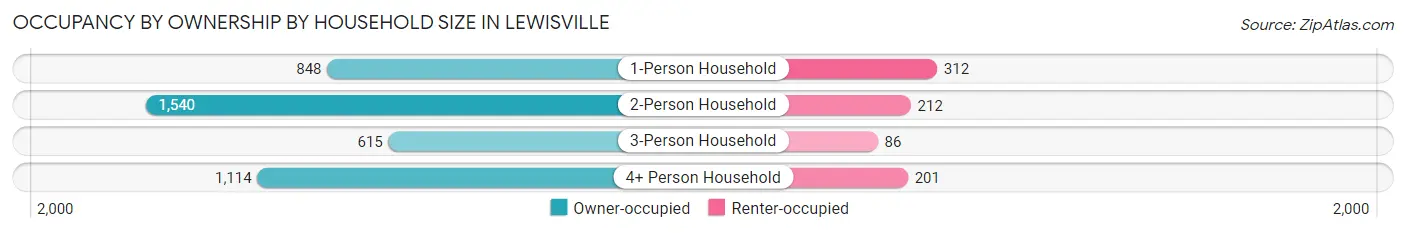
| Household Size | Owner-occupied | Renter-occupied |
| 1-Person Household | 848 (73.1%) | 312 (26.9%) |
| 2-Person Household | 1,540 (87.9%) | 212 (12.1%) |
| 3-Person Household | 615 (87.7%) | 86 (12.3%) |
| 4+ Person Household | 1,114 (84.7%) | 201 (15.3%) |
| Total Housing Units | 4,117 (83.5%) | 811 (16.5%) |
Occupancy by Educational Attainment in Lewisville
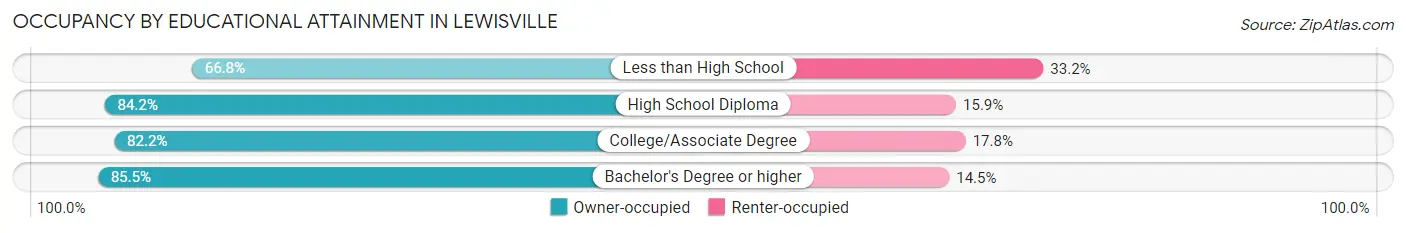
| Household Size | Owner-occupied | Renter-occupied |
| Less than High School | 125 (66.8%) | 62 (33.2%) |
| High School Diploma | 775 (84.2%) | 146 (15.9%) |
| College/Associate Degree | 1,236 (82.2%) | 267 (17.8%) |
| Bachelor's Degree or higher | 1,981 (85.5%) | 336 (14.5%) |
Occupancy by Age of Householder in Lewisville
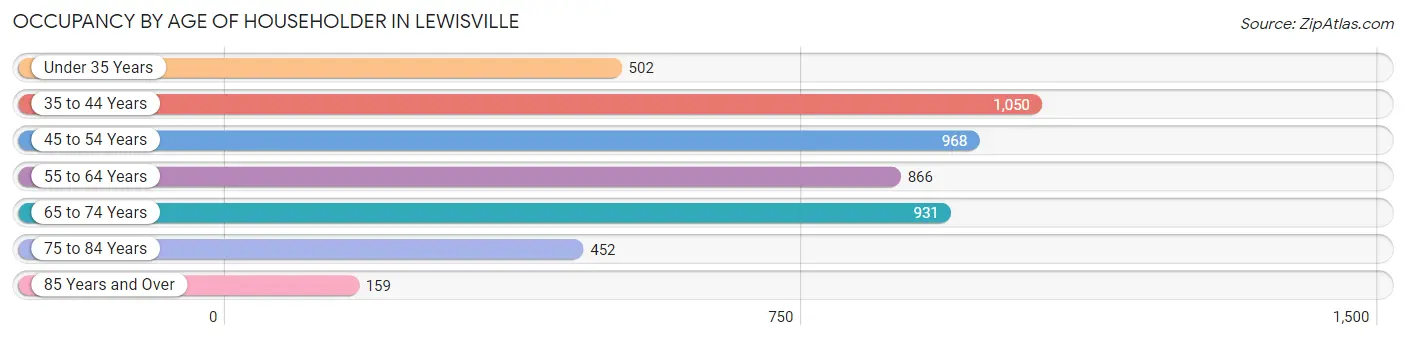
| Age Bracket | # Households | % Households |
| Under 35 Years | 502 | 10.2% |
| 35 to 44 Years | 1,050 | 21.3% |
| 45 to 54 Years | 968 | 19.6% |
| 55 to 64 Years | 866 | 17.6% |
| 65 to 74 Years | 931 | 18.9% |
| 75 to 84 Years | 452 | 9.2% |
| 85 Years and Over | 159 | 3.2% |
| Total | 4,928 | 100.0% |
Housing Finances in Lewisville
Median Income by Occupancy in Lewisville
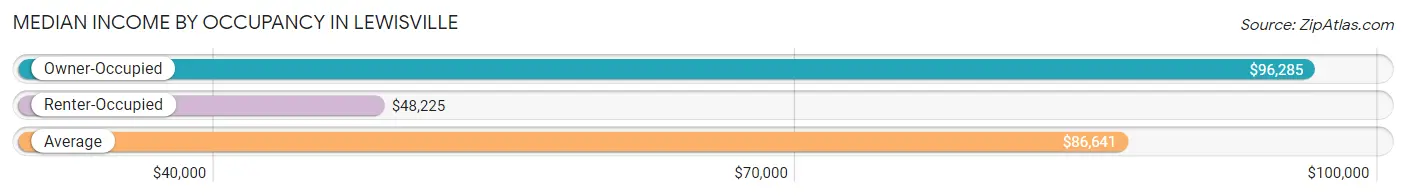
| Occupancy Type | # Households | Median Income |
| Owner-Occupied | 4,117 (83.5%) | $96,285 |
| Renter-Occupied | 811 (16.5%) | $48,225 |
| Average | 4,928 (100.0%) | $86,641 |
Occupancy by Householder Income Bracket in Lewisville
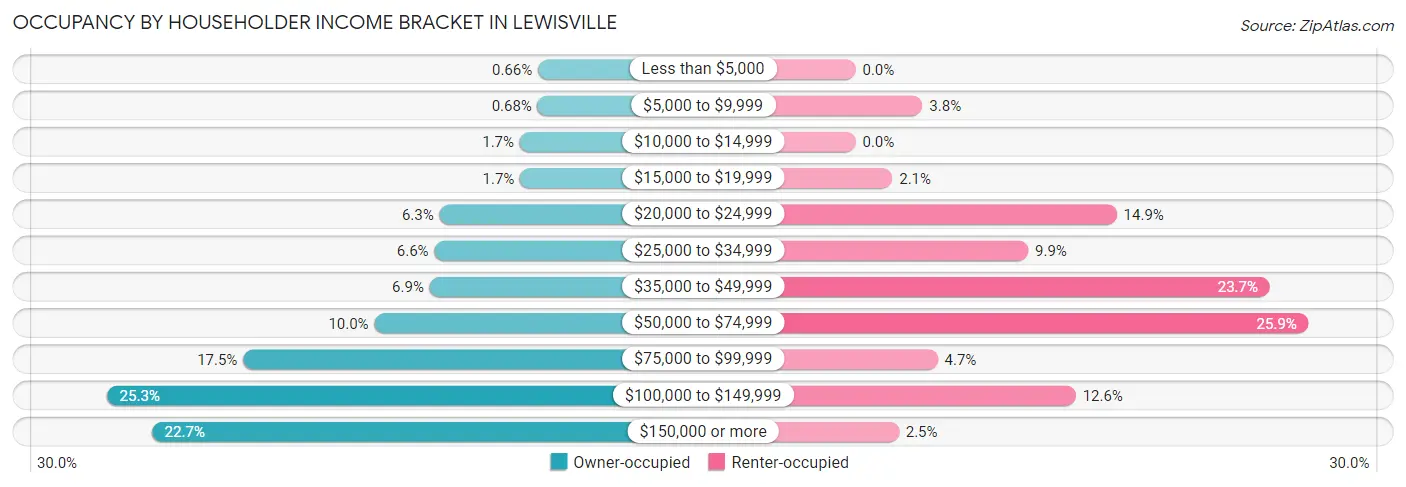
| Income Bracket | Owner-occupied | Renter-occupied |
| Less than $5,000 | 27 (0.7%) | 0 (0.0%) |
| $5,000 to $9,999 | 28 (0.7%) | 31 (3.8%) |
| $10,000 to $14,999 | 70 (1.7%) | 0 (0.0%) |
| $15,000 to $19,999 | 69 (1.7%) | 17 (2.1%) |
| $20,000 to $24,999 | 259 (6.3%) | 121 (14.9%) |
| $25,000 to $34,999 | 271 (6.6%) | 80 (9.9%) |
| $35,000 to $49,999 | 282 (6.9%) | 192 (23.7%) |
| $50,000 to $74,999 | 412 (10.0%) | 210 (25.9%) |
| $75,000 to $99,999 | 721 (17.5%) | 38 (4.7%) |
| $100,000 to $149,999 | 1,042 (25.3%) | 102 (12.6%) |
| $150,000 or more | 936 (22.7%) | 20 (2.5%) |
| Total | 4,117 (100.0%) | 811 (100.0%) |
Monthly Housing Cost Tiers in Lewisville
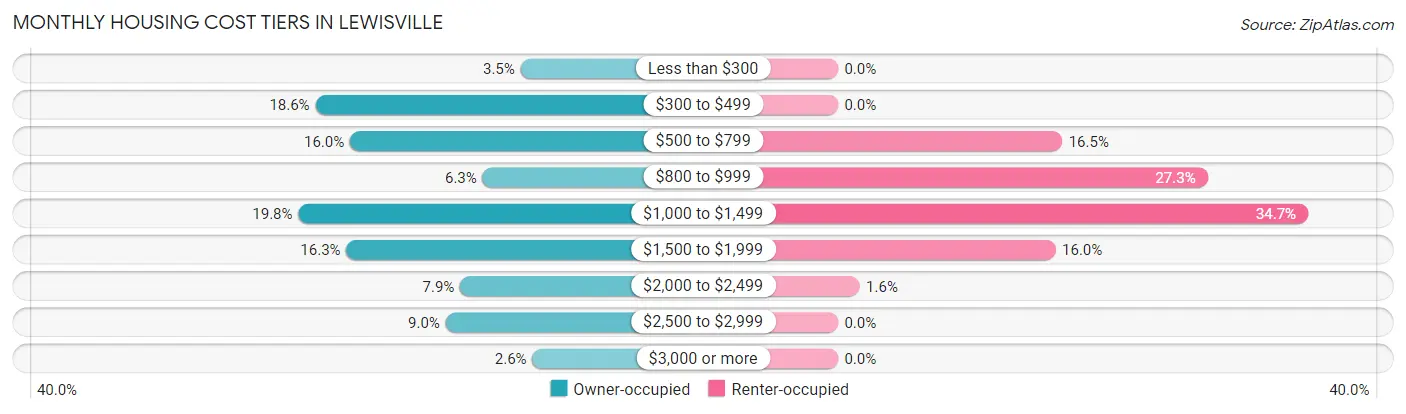
| Monthly Cost | Owner-occupied | Renter-occupied |
| Less than $300 | 143 (3.5%) | 0 (0.0%) |
| $300 to $499 | 765 (18.6%) | 0 (0.0%) |
| $500 to $799 | 660 (16.0%) | 134 (16.5%) |
| $800 to $999 | 258 (6.3%) | 221 (27.3%) |
| $1,000 to $1,499 | 817 (19.8%) | 281 (34.6%) |
| $1,500 to $1,999 | 671 (16.3%) | 130 (16.0%) |
| $2,000 to $2,499 | 326 (7.9%) | 13 (1.6%) |
| $2,500 to $2,999 | 370 (9.0%) | 0 (0.0%) |
| $3,000 or more | 107 (2.6%) | 0 (0.0%) |
| Total | 4,117 (100.0%) | 811 (100.0%) |
Physical Housing Characteristics in Lewisville
Housing Structures in Lewisville
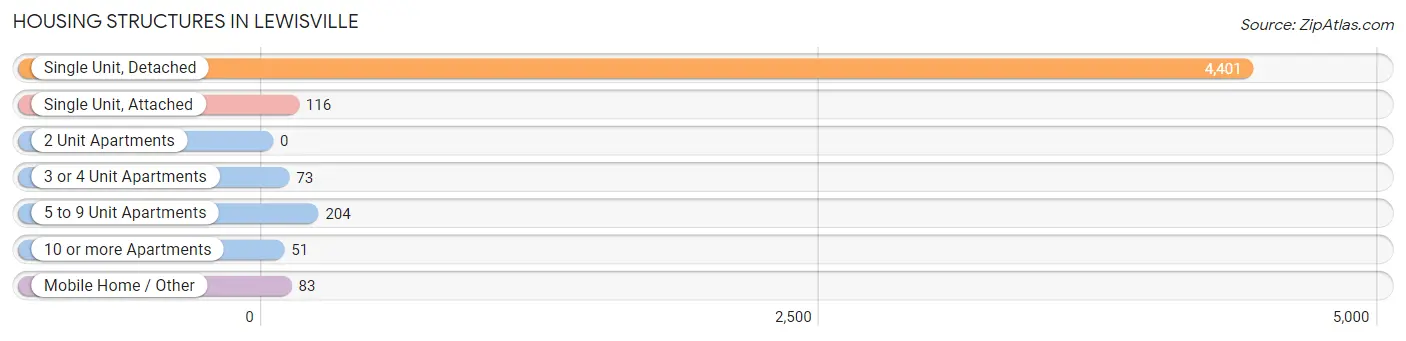
| Structure Type | # Housing Units | % Housing Units |
| Single Unit, Detached | 4,401 | 89.3% |
| Single Unit, Attached | 116 | 2.4% |
| 2 Unit Apartments | 0 | 0.0% |
| 3 or 4 Unit Apartments | 73 | 1.5% |
| 5 to 9 Unit Apartments | 204 | 4.1% |
| 10 or more Apartments | 51 | 1.0% |
| Mobile Home / Other | 83 | 1.7% |
| Total | 4,928 | 100.0% |
Housing Structures by Occupancy in Lewisville
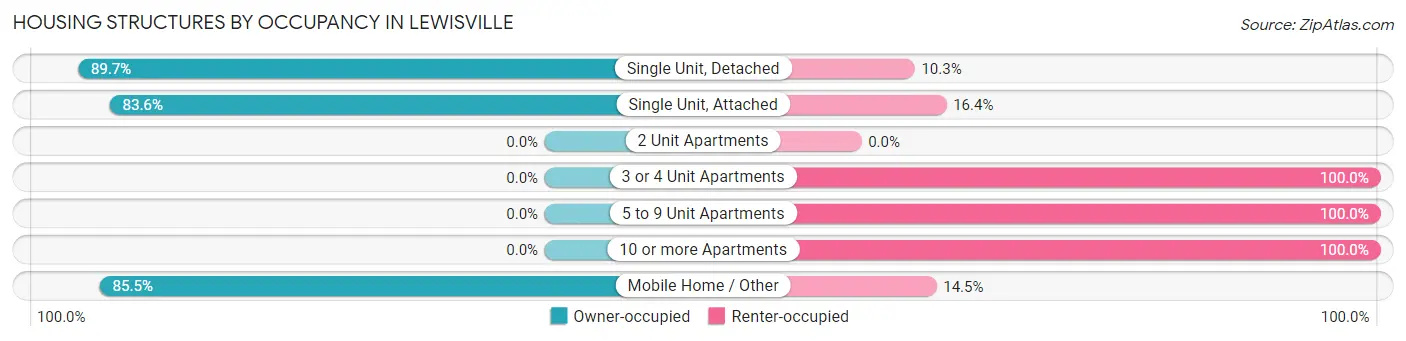
| Structure Type | Owner-occupied | Renter-occupied |
| Single Unit, Detached | 3,949 (89.7%) | 452 (10.3%) |
| Single Unit, Attached | 97 (83.6%) | 19 (16.4%) |
| 2 Unit Apartments | 0 (0.0%) | 0 (0.0%) |
| 3 or 4 Unit Apartments | 0 (0.0%) | 73 (100.0%) |
| 5 to 9 Unit Apartments | 0 (0.0%) | 204 (100.0%) |
| 10 or more Apartments | 0 (0.0%) | 51 (100.0%) |
| Mobile Home / Other | 71 (85.5%) | 12 (14.5%) |
| Total | 4,117 (83.5%) | 811 (16.5%) |
Housing Structures by Number of Rooms in Lewisville
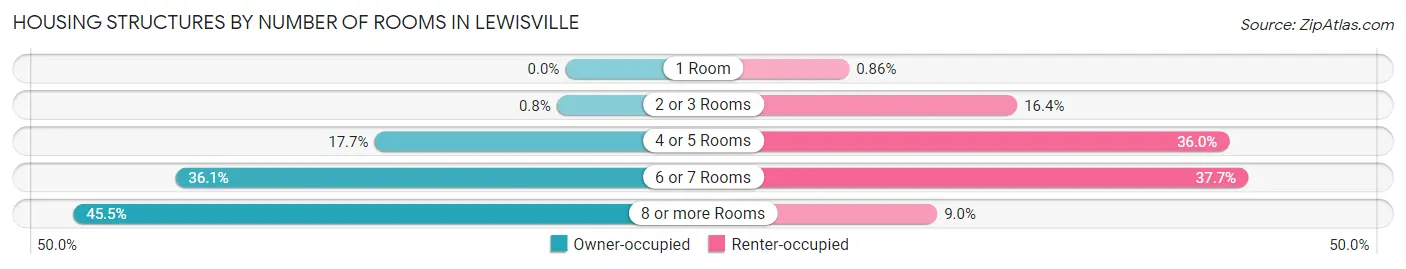
| Number of Rooms | Owner-occupied | Renter-occupied |
| 1 Room | 0 (0.0%) | 7 (0.9%) |
| 2 or 3 Rooms | 33 (0.8%) | 133 (16.4%) |
| 4 or 5 Rooms | 727 (17.7%) | 292 (36.0%) |
| 6 or 7 Rooms | 1,484 (36.0%) | 306 (37.7%) |
| 8 or more Rooms | 1,873 (45.5%) | 73 (9.0%) |
| Total | 4,117 (100.0%) | 811 (100.0%) |
Housing Structure by Heating Type in Lewisville
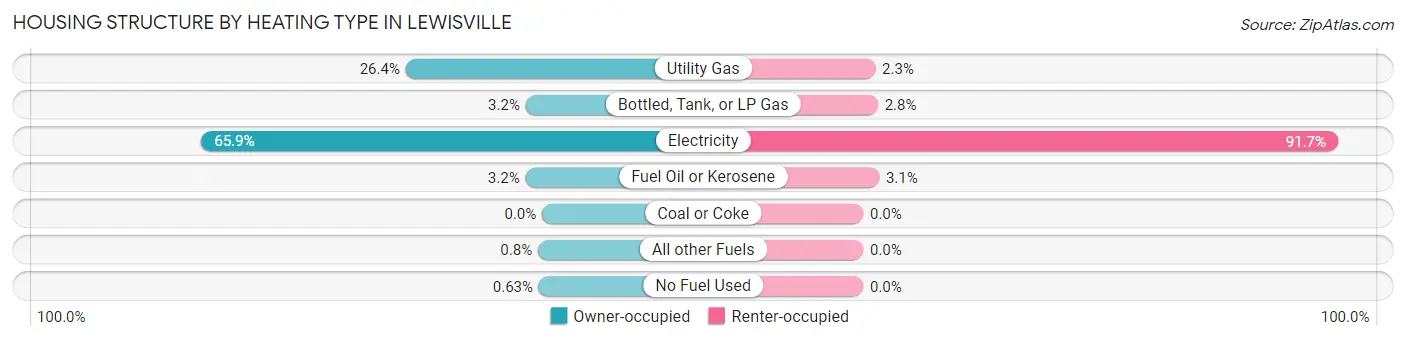
| Heating Type | Owner-occupied | Renter-occupied |
| Utility Gas | 1,085 (26.4%) | 19 (2.3%) |
| Bottled, Tank, or LP Gas | 130 (3.2%) | 23 (2.8%) |
| Electricity | 2,711 (65.8%) | 744 (91.7%) |
| Fuel Oil or Kerosene | 132 (3.2%) | 25 (3.1%) |
| Coal or Coke | 0 (0.0%) | 0 (0.0%) |
| All other Fuels | 33 (0.8%) | 0 (0.0%) |
| No Fuel Used | 26 (0.6%) | 0 (0.0%) |
| Total | 4,117 (100.0%) | 811 (100.0%) |
Household Vehicle Usage in Lewisville
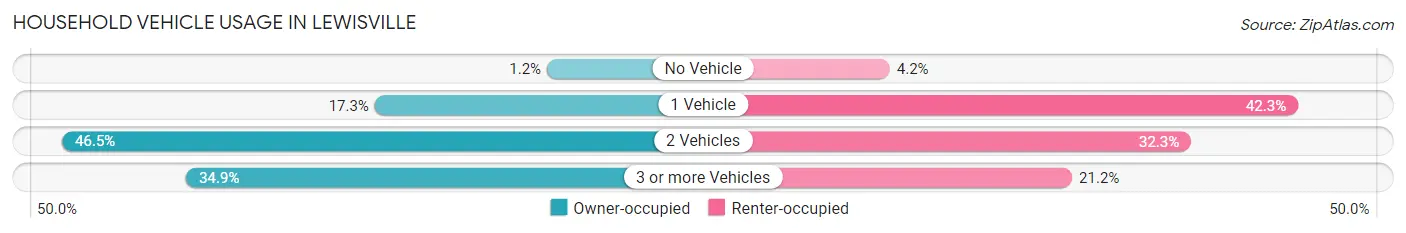
| Vehicles per Household | Owner-occupied | Renter-occupied |
| No Vehicle | 51 (1.2%) | 34 (4.2%) |
| 1 Vehicle | 713 (17.3%) | 343 (42.3%) |
| 2 Vehicles | 1,915 (46.5%) | 262 (32.3%) |
| 3 or more Vehicles | 1,438 (34.9%) | 172 (21.2%) |
| Total | 4,117 (100.0%) | 811 (100.0%) |
Real Estate & Mortgages in Lewisville
Real Estate and Mortgage Overview in Lewisville
| Characteristic | Without Mortgage | With Mortgage |
| Housing Units | 1,595 | 2,522 |
| Median Property Value | $256,300 | $255,900 |
| Median Household Income | $71,941 | $713 |
| Monthly Housing Costs | $477 | $107 |
| Real Estate Taxes | $2,059 | $51 |
Property Value by Mortgage Status in Lewisville
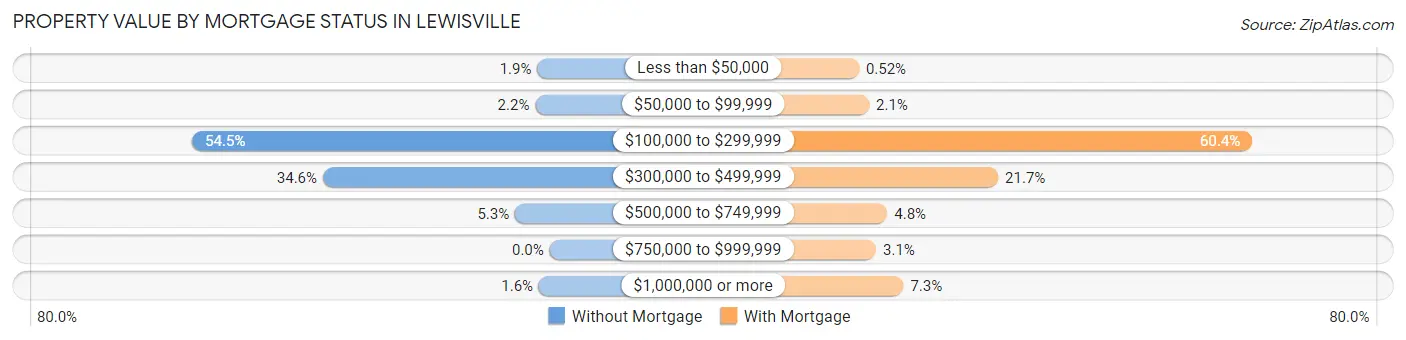
| Property Value | Without Mortgage | With Mortgage |
| Less than $50,000 | 30 (1.9%) | 13 (0.5%) |
| $50,000 to $99,999 | 35 (2.2%) | 52 (2.1%) |
| $100,000 to $299,999 | 869 (54.5%) | 1,524 (60.4%) |
| $300,000 to $499,999 | 551 (34.5%) | 548 (21.7%) |
| $500,000 to $749,999 | 84 (5.3%) | 122 (4.8%) |
| $750,000 to $999,999 | 0 (0.0%) | 79 (3.1%) |
| $1,000,000 or more | 26 (1.6%) | 184 (7.3%) |
| Total | 1,595 (100.0%) | 2,522 (100.0%) |
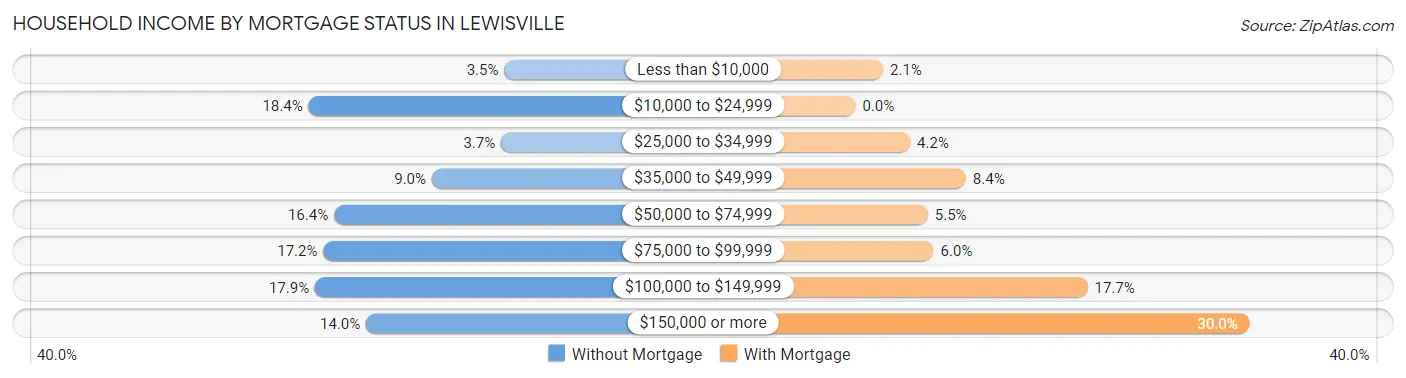
Household Income by Mortgage Status in Lewisville
| Household Income | Without Mortgage | With Mortgage |
| Less than $10,000 | 55 (3.5%) | 53 (2.1%) |
| $10,000 to $24,999 | 293 (18.4%) | 0 (0.0%) |
| $25,000 to $34,999 | 59 (3.7%) | 105 (4.2%) |
| $35,000 to $49,999 | 143 (9.0%) | 212 (8.4%) |
| $50,000 to $74,999 | 262 (16.4%) | 139 (5.5%) |
| $75,000 to $99,999 | 275 (17.2%) | 150 (5.9%) |
| $100,000 to $149,999 | 285 (17.9%) | 446 (17.7%) |
| $150,000 or more | 223 (14.0%) | 757 (30.0%) |
| Total | 1,595 (100.0%) | 2,522 (100.0%) |
Property Value to Household Income Ratio in Lewisville
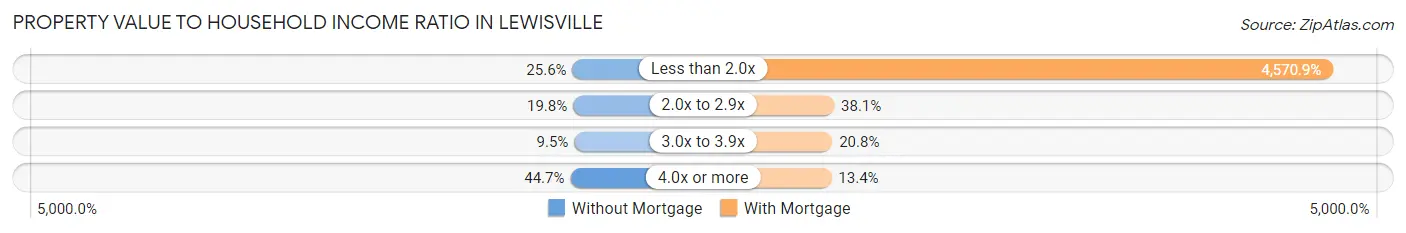
| Value-to-Income Ratio | Without Mortgage | With Mortgage |
| Less than 2.0x | 408 (25.6%) | 115,278 (4,570.9%) |
| 2.0x to 2.9x | 315 (19.8%) | 960 (38.1%) |
| 3.0x to 3.9x | 151 (9.5%) | 524 (20.8%) |
| 4.0x or more | 713 (44.7%) | 339 (13.4%) |
| Total | 1,595 (100.0%) | 2,522 (100.0%) |
Real Estate Taxes by Mortgage Status in Lewisville
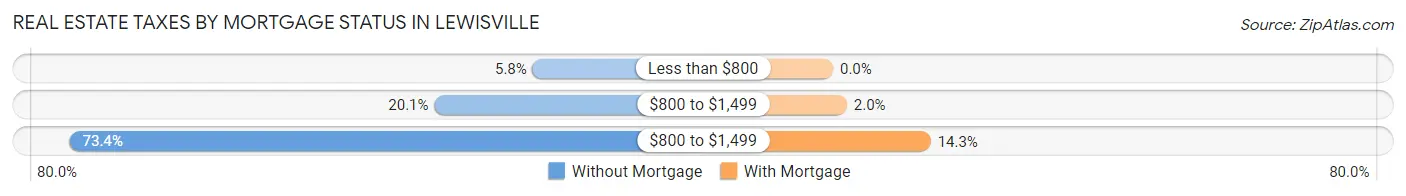
| Property Taxes | Without Mortgage | With Mortgage |
| Less than $800 | 92 (5.8%) | 0 (0.0%) |
| $800 to $1,499 | 321 (20.1%) | 51 (2.0%) |
| $800 to $1,499 | 1,171 (73.4%) | 360 (14.3%) |
| Total | 1,595 (100.0%) | 2,522 (100.0%) |
Health & Disability in Lewisville
Health Insurance Coverage by Age in Lewisville
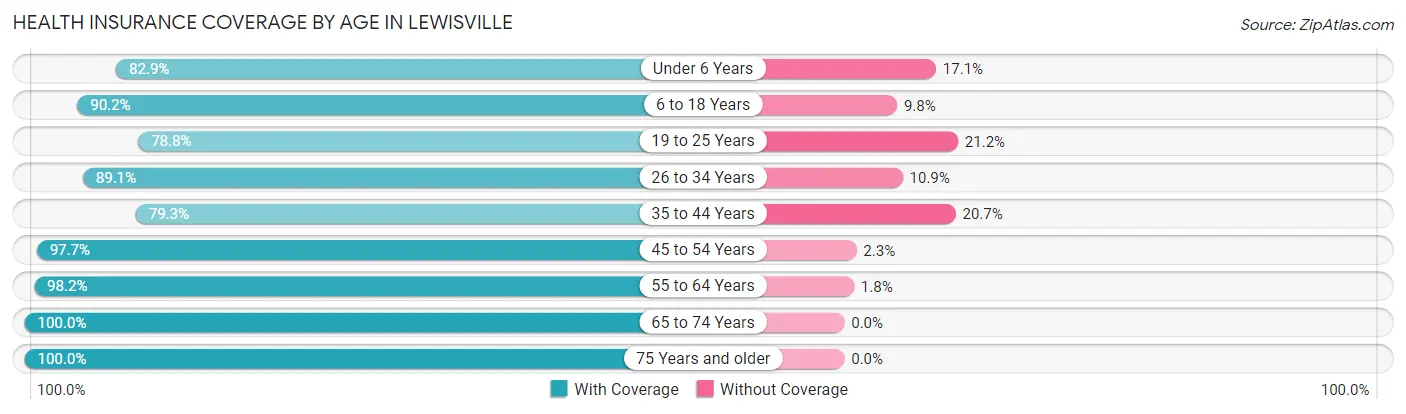
| Age Bracket | With Coverage | Without Coverage |
| Under 6 Years | 806 (82.9%) | 166 (17.1%) |
| 6 to 18 Years | 2,703 (90.2%) | 295 (9.8%) |
| 19 to 25 Years | 532 (78.8%) | 143 (21.2%) |
| 26 to 34 Years | 984 (89.1%) | 120 (10.9%) |
| 35 to 44 Years | 1,636 (79.3%) | 428 (20.7%) |
| 45 to 54 Years | 1,384 (97.7%) | 32 (2.3%) |
| 55 to 64 Years | 1,698 (98.2%) | 31 (1.8%) |
| 65 to 74 Years | 1,656 (100.0%) | 0 (0.0%) |
| 75 Years and older | 851 (100.0%) | 0 (0.0%) |
| Total | 12,250 (91.0%) | 1,215 (9.0%) |
Health Insurance Coverage by Citizenship Status in Lewisville
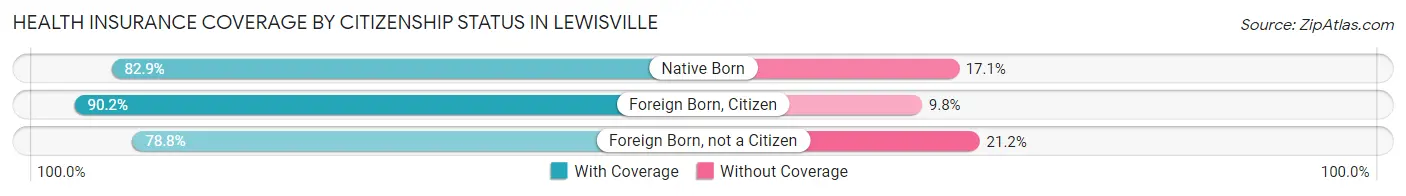
| Citizenship Status | With Coverage | Without Coverage |
| Native Born | 806 (82.9%) | 166 (17.1%) |
| Foreign Born, Citizen | 2,703 (90.2%) | 295 (9.8%) |
| Foreign Born, not a Citizen | 532 (78.8%) | 143 (21.2%) |
Health Insurance Coverage by Household Income in Lewisville
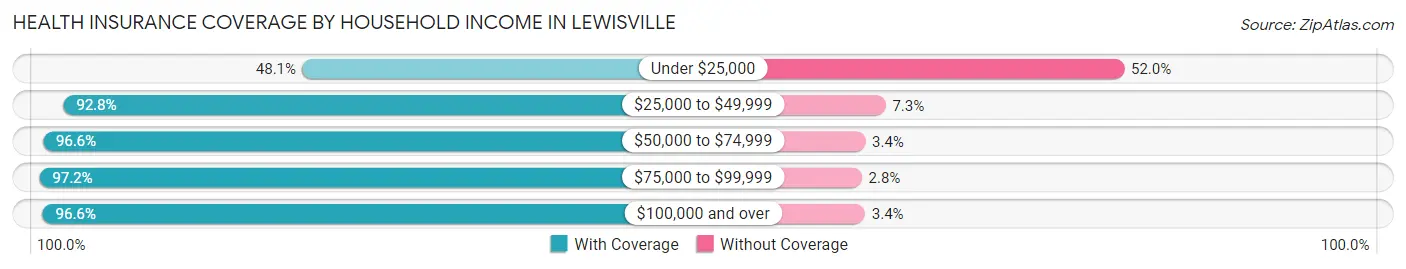
| Household Income | With Coverage | Without Coverage |
| Under $25,000 | 701 (48.0%) | 758 (51.9%) |
| $25,000 to $49,999 | 1,510 (92.7%) | 118 (7.2%) |
| $50,000 to $74,999 | 1,406 (96.6%) | 50 (3.4%) |
| $75,000 to $99,999 | 1,998 (97.2%) | 57 (2.8%) |
| $100,000 and over | 6,635 (96.6%) | 232 (3.4%) |
Public vs Private Health Insurance Coverage by Age in Lewisville
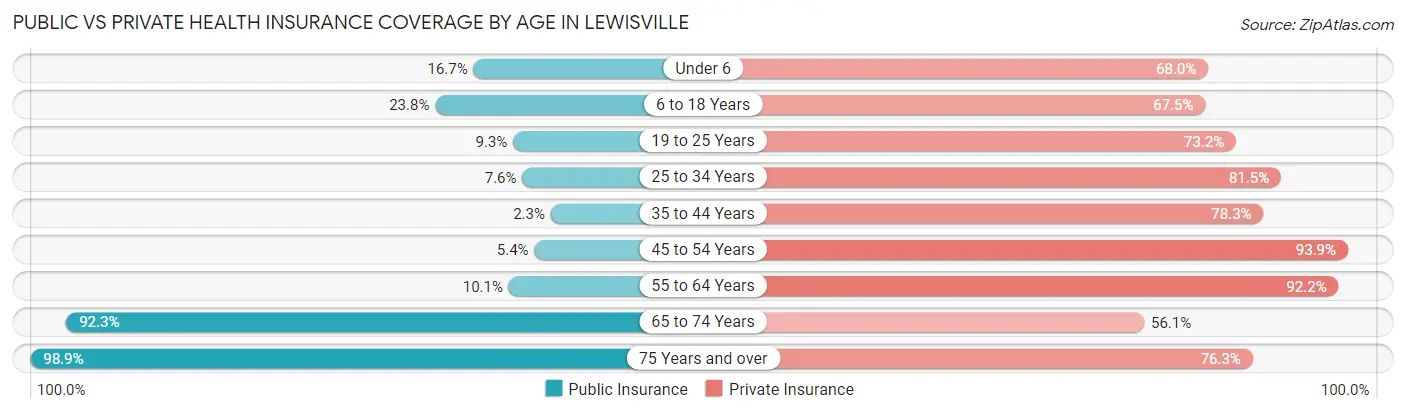
| Age Bracket | Public Insurance | Private Insurance |
| Under 6 | 162 (16.7%) | 661 (68.0%) |
| 6 to 18 Years | 713 (23.8%) | 2,023 (67.5%) |
| 19 to 25 Years | 63 (9.3%) | 494 (73.2%) |
| 25 to 34 Years | 84 (7.6%) | 900 (81.5%) |
| 35 to 44 Years | 48 (2.3%) | 1,615 (78.2%) |
| 45 to 54 Years | 76 (5.4%) | 1,330 (93.9%) |
| 55 to 64 Years | 175 (10.1%) | 1,594 (92.2%) |
| 65 to 74 Years | 1,528 (92.3%) | 929 (56.1%) |
| 75 Years and over | 842 (98.9%) | 649 (76.3%) |
| Total | 3,691 (27.4%) | 10,195 (75.7%) |
Disability Status by Sex by Age in Lewisville
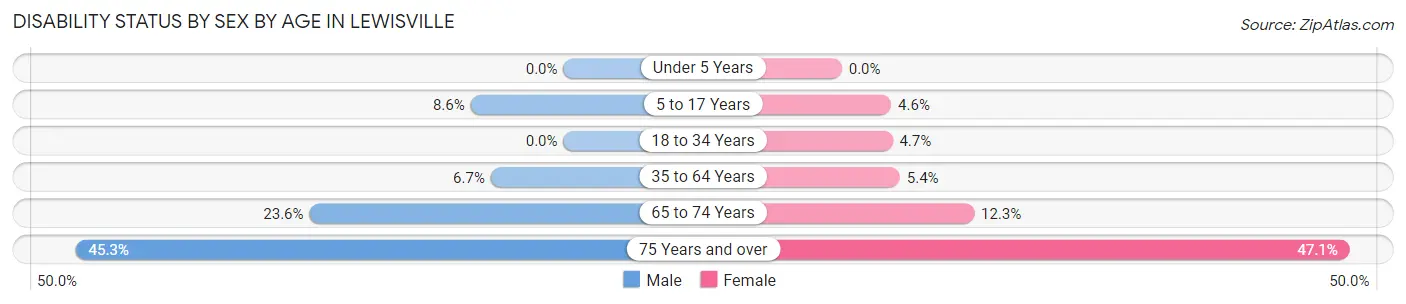
| Age Bracket | Male | Female |
| Under 5 Years | 0 (0.0%) | 0 (0.0%) |
| 5 to 17 Years | 122 (8.6%) | 69 (4.6%) |
| 18 to 34 Years | 0 (0.0%) | 45 (4.7%) |
| 35 to 64 Years | 157 (6.7%) | 155 (5.4%) |
| 65 to 74 Years | 152 (23.6%) | 124 (12.3%) |
| 75 Years and over | 172 (45.3%) | 222 (47.1%) |
Disability Class by Sex by Age in Lewisville
Disability Class: Hearing Difficulty
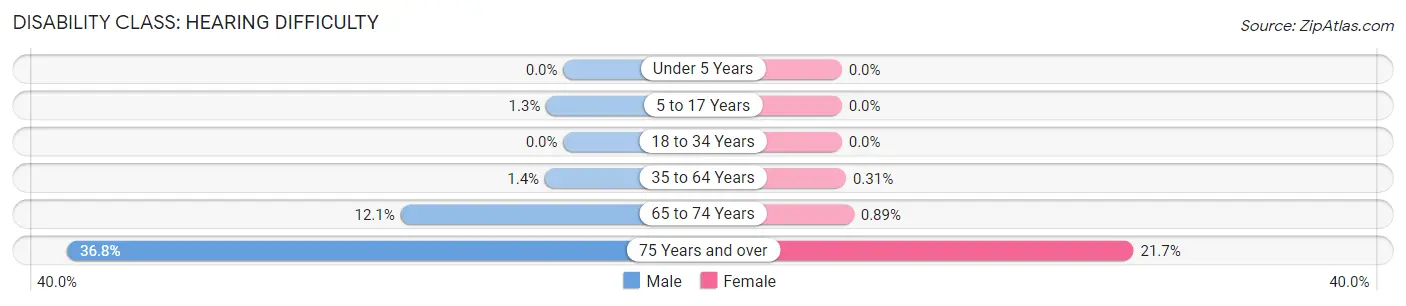
| Age Bracket | Male | Female |
| Under 5 Years | 0 (0.0%) | 0 (0.0%) |
| 5 to 17 Years | 18 (1.3%) | 0 (0.0%) |
| 18 to 34 Years | 0 (0.0%) | 0 (0.0%) |
| 35 to 64 Years | 32 (1.4%) | 9 (0.3%) |
| 65 to 74 Years | 78 (12.1%) | 9 (0.9%) |
| 75 Years and over | 140 (36.8%) | 102 (21.7%) |
Disability Class: Vision Difficulty
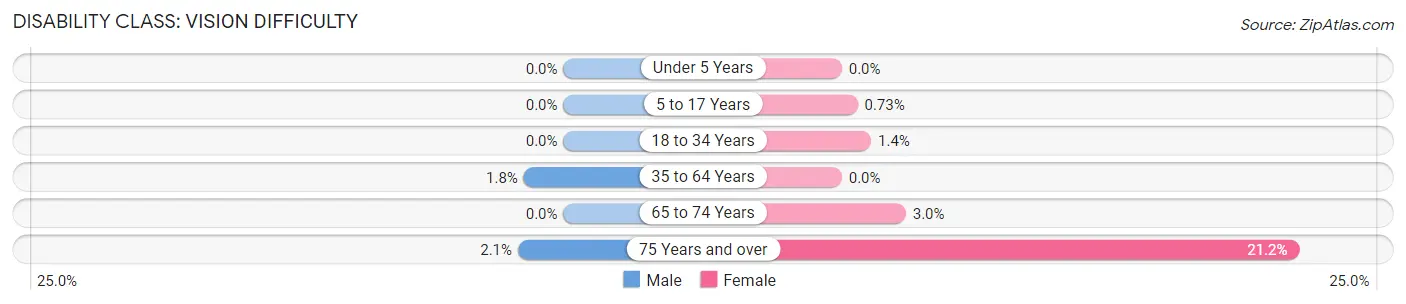
| Age Bracket | Male | Female |
| Under 5 Years | 0 (0.0%) | 0 (0.0%) |
| 5 to 17 Years | 0 (0.0%) | 11 (0.7%) |
| 18 to 34 Years | 0 (0.0%) | 13 (1.4%) |
| 35 to 64 Years | 43 (1.8%) | 0 (0.0%) |
| 65 to 74 Years | 0 (0.0%) | 30 (3.0%) |
| 75 Years and over | 8 (2.1%) | 100 (21.2%) |
Disability Class: Cognitive Difficulty
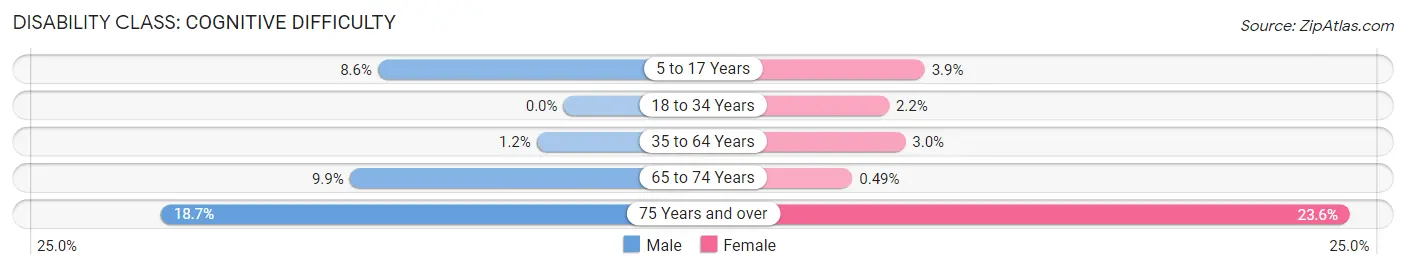
| Age Bracket | Male | Female |
| 5 to 17 Years | 122 (8.6%) | 58 (3.8%) |
| 18 to 34 Years | 0 (0.0%) | 21 (2.2%) |
| 35 to 64 Years | 29 (1.2%) | 85 (2.9%) |
| 65 to 74 Years | 64 (9.9%) | 5 (0.5%) |
| 75 Years and over | 71 (18.7%) | 111 (23.6%) |
Disability Class: Ambulatory Difficulty
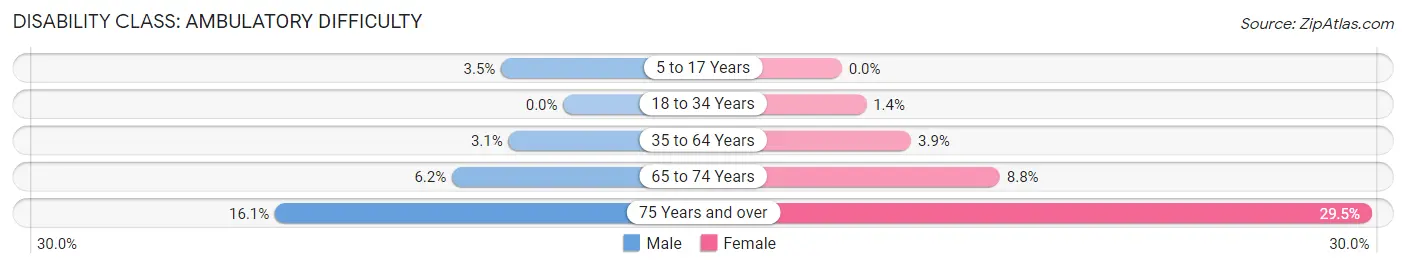
| Age Bracket | Male | Female |
| 5 to 17 Years | 49 (3.5%) | 0 (0.0%) |
| 18 to 34 Years | 0 (0.0%) | 13 (1.4%) |
| 35 to 64 Years | 71 (3.0%) | 111 (3.9%) |
| 65 to 74 Years | 40 (6.2%) | 89 (8.8%) |
| 75 Years and over | 61 (16.1%) | 139 (29.5%) |
Disability Class: Self-Care Difficulty
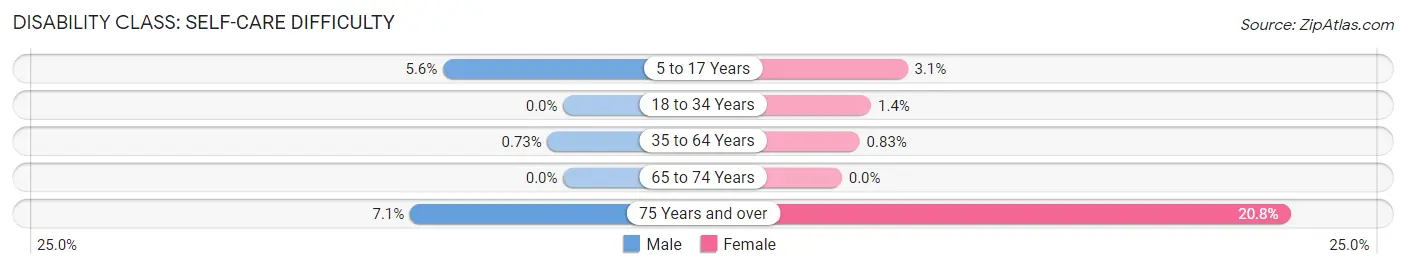
| Age Bracket | Male | Female |
| 5 to 17 Years | 79 (5.6%) | 46 (3.0%) |
| 18 to 34 Years | 0 (0.0%) | 13 (1.4%) |
| 35 to 64 Years | 17 (0.7%) | 24 (0.8%) |
| 65 to 74 Years | 0 (0.0%) | 0 (0.0%) |
| 75 Years and over | 27 (7.1%) | 98 (20.8%) |
Technology Access in Lewisville
Computing Device Access in Lewisville
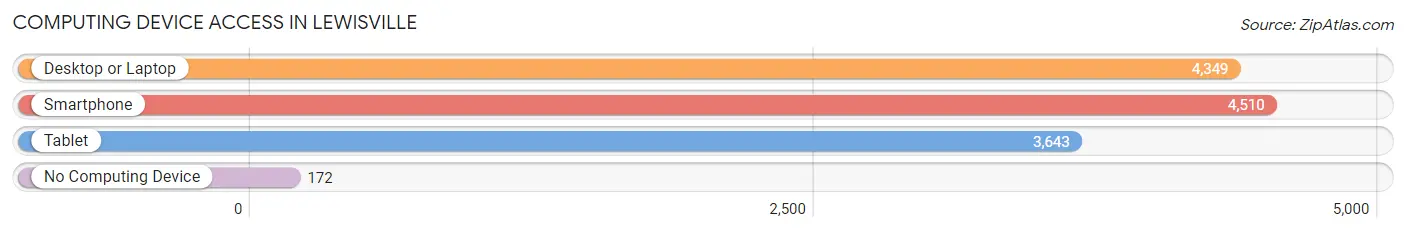
| Device Type | # Households | % Households |
| Desktop or Laptop | 4,349 | 88.2% |
| Smartphone | 4,510 | 91.5% |
| Tablet | 3,643 | 73.9% |
| No Computing Device | 172 | 3.5% |
| Total | 4,928 | 100.0% |
Internet Access in Lewisville
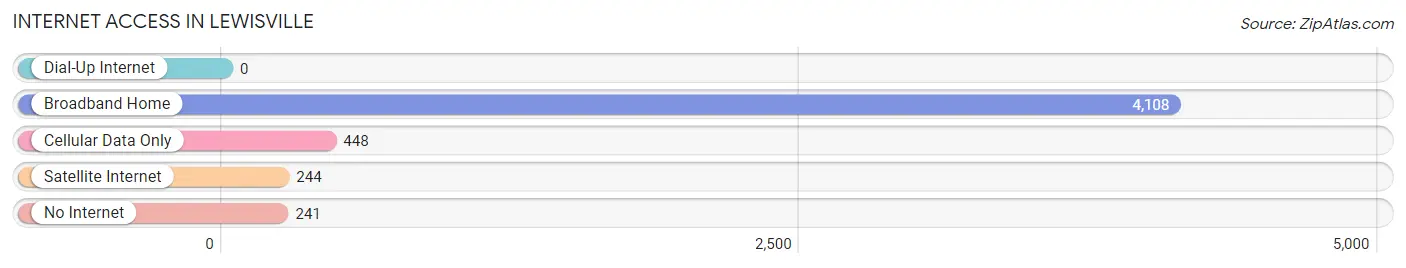
| Internet Type | # Households | % Households |
| Dial-Up Internet | 0 | 0.0% |
| Broadband Home | 4,108 | 83.4% |
| Cellular Data Only | 448 | 9.1% |
| Satellite Internet | 244 | 5.0% |
| No Internet | 241 | 4.9% |
| Total | 4,928 | 100.0% |
Lewisville Summary
Lewisville is a small town located in Forsyth County, North Carolina. It is situated in the Piedmont Triad region of the state, and is part of the Winston-Salem metropolitan area. The town has a population of approximately 4,000 people, and is known for its small-town charm and friendly atmosphere.
Geography
Lewisville is located in the Piedmont Triad region of North Carolina, and is situated in the foothills of the Blue Ridge Mountains. The town is located in the Yadkin Valley, and is bordered by the towns of Clemmons, Kernersville, and Winston-Salem. The town is situated along the banks of the Yadkin River, and is surrounded by rolling hills and lush forests. The town is located at an elevation of 890 feet above sea level.
History
Lewisville was founded in 1845 by a group of settlers from Virginia. The town was named after the Lewis family, who were among the first settlers. The town was originally a farming community, and the main crops grown were tobacco, cotton, and corn. In the late 19th century, the town began to grow and develop, and by the early 20th century, it had become a thriving community.
In the 1950s, Lewisville experienced a period of rapid growth and development. The town was incorporated in 1956, and the population grew from 1,000 to 4,000 in just a few years. The town was also home to several businesses, including a cotton mill, a furniture factory, and a canning factory.
Economy
The economy of Lewisville is largely based on agriculture and manufacturing. The town is home to several farms, and the main crops grown are tobacco, cotton, and corn. The town is also home to several manufacturing companies, including a furniture factory, a canning factory, and a plastics factory.
The town is also home to several retail stores, restaurants, and other businesses. The town is served by several major highways, including Interstate 40, US Highway 52, and US Highway 421.
Demographics
As of the 2010 census, the population of Lewisville was 4,000. The racial makeup of the town was 87.3% White, 8.2% African American, 0.3% Native American, 0.7% Asian, and 3.5% from other races. The median household income was $41,250, and the median family income was $50,000.
Conclusion
Lewisville is a small town located in Forsyth County, North Carolina. It is situated in the Piedmont Triad region of the state, and is part of the Winston-Salem metropolitan area. The town has a population of approximately 4,000 people, and is known for its small-town charm and friendly atmosphere. The economy of Lewisville is largely based on agriculture and manufacturing, and the town is home to several retail stores, restaurants, and other businesses. The racial makeup of the town is 87.3% White, 8.2% African American, 0.3% Native American, 0.7% Asian, and 3.5% from other races.
Common Questions
What is Per Capita Income in Lewisville?
Per Capita income in Lewisville is $39,681.
What is the Median Family Income in Lewisville?
Median Family Income in Lewisville is $102,650.
What is the Median Household income in Lewisville?
Median Household Income in Lewisville is $86,641.
What is Income or Wage Gap in Lewisville?
Income or Wage Gap in Lewisville is 22.9%.
Women in Lewisville earn 77.1 cents for every dollar earned by a man.
What is Inequality or Gini Index in Lewisville?
Inequality or Gini Index in Lewisville is 0.42.
What is the Total Population of Lewisville?
Total Population of Lewisville is 13,509.
What is the Total Male Population of Lewisville?
Total Male Population of Lewisville is 6,319.
What is the Total Female Population of Lewisville?
Total Female Population of Lewisville is 7,190.
What is the Ratio of Males per 100 Females in Lewisville?
There are 87.89 Males per 100 Females in Lewisville.
What is the Ratio of Females per 100 Males in Lewisville?
There are 113.78 Females per 100 Males in Lewisville.
What is the Median Population Age in Lewisville?
Median Population Age in Lewisville is 40.8 Years.
What is the Average Family Size in Lewisville
Average Family Size in Lewisville is 3.3 People.
What is the Average Household Size in Lewisville
Average Household Size in Lewisville is 2.7 People.
How Large is the Labor Force in Lewisville?
There are 6,682 People in the Labor Forcein in Lewisville.
What is the Percentage of People in the Labor Force in Lewisville?
66.2% of People are in the Labor Force in Lewisville.
What is the Unemployment Rate in Lewisville?
Unemployment Rate in Lewisville is 3.6%.