Cities with the Highest Percentage of Native / Alaskan Population in Mississippi
RELATED REPORTS & OPTIONS
Native / Alaskan
Mississippi
Compare Cities
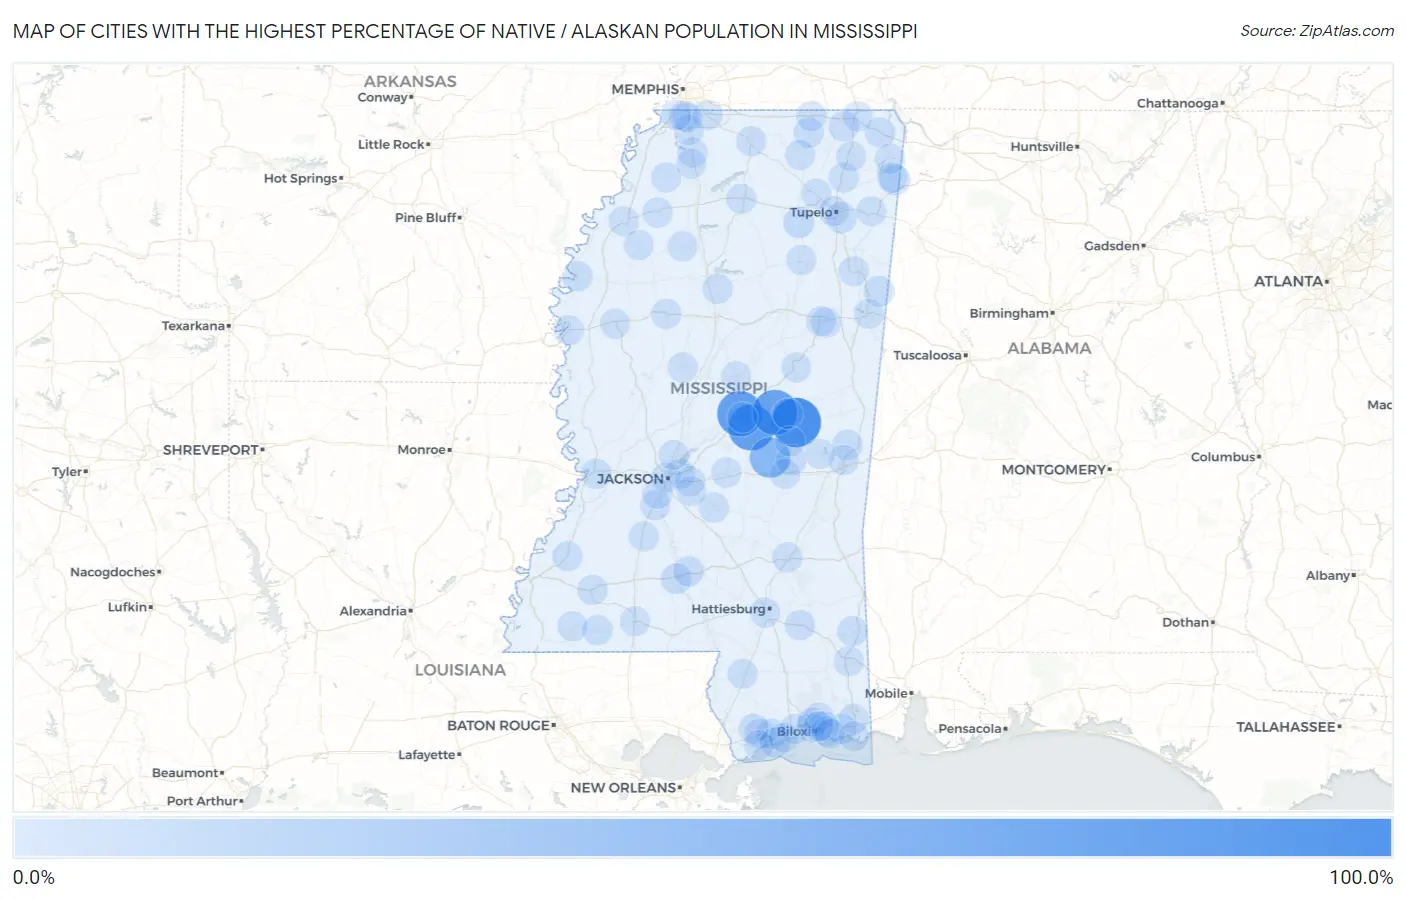
Map of Cities with the Highest Percentage of Native / Alaskan Population in Mississippi
0.0%
100.0%
Cities with the Highest Percentage of Native / Alaskan Population in Mississippi
| City | Native / Alaskan | vs State | vs National | |
| 1. | Tucker | 98.1% | 0.43%(+97.7)#1 | 0.84%(+97.3)#153 |
| 2. | Bogue Chitto Cdp Kemper And Neshoba Counties | 93.4% | 0.43%(+93.0)#2 | 0.84%(+92.6)#262 |
| 3. | Standing Pine | 79.8% | 0.43%(+79.3)#3 | 0.84%(+78.9)#431 |
| 4. | Redwater | 78.0% | 0.43%(+77.6)#4 | 0.84%(+77.2)#446 |
| 5. | Pearl River | 76.5% | 0.43%(+76.1)#5 | 0.84%(+75.7)#464 |
| 6. | Conehatta | 51.5% | 0.43%(+51.0)#6 | 0.84%(+50.6)#607 |
| 7. | Algoma | 4.2% | 0.43%(+3.76)#7 | 0.84%(+3.36)#2,197 |
| 8. | Plantersville | 4.1% | 0.43%(+3.63)#8 | 0.84%(+3.22)#2,246 |
| 9. | Caledonia | 3.3% | 0.43%(+2.91)#9 | 0.84%(+2.50)#2,493 |
| 10. | Golden | 3.3% | 0.43%(+2.87)#10 | 0.84%(+2.46)#2,516 |
| 11. | Monticello | 2.9% | 0.43%(+2.47)#11 | 0.84%(+2.06)#2,710 |
| 12. | Meridian Station | 2.2% | 0.43%(+1.72)#12 | 0.84%(+1.31)#3,250 |
| 13. | Eudora | 2.1% | 0.43%(+1.66)#13 | 0.84%(+1.25)#3,309 |
| 14. | Decatur | 1.7% | 0.43%(+1.29)#14 | 0.84%(+0.879)#3,752 |
| 15. | Union | 1.4% | 0.43%(+1.01)#15 | 0.84%(+0.597)#4,180 |
| 16. | Silver Creek | 1.4% | 0.43%(+1.00)#16 | 0.84%(+0.594)#4,193 |
| 17. | Kossuth | 1.4% | 0.43%(+0.957)#17 | 0.84%(+0.547)#4,274 |
| 18. | Leakesville | 1.4% | 0.43%(+0.923)#18 | 0.84%(+0.513)#4,345 |
| 19. | Liberty | 1.3% | 0.43%(+0.831)#19 | 0.84%(+0.421)#4,508 |
| 20. | Beulah | 1.2% | 0.43%(+0.766)#20 | 0.84%(+0.356)#4,648 |
| 21. | Philadelphia | 1.1% | 0.43%(+0.672)#21 | 0.84%(+0.262)#4,877 |
| 22. | Terry | 1.1% | 0.43%(+0.671)#22 | 0.84%(+0.262)#4,879 |
| 23. | Diamondhead | 0.98% | 0.43%(+0.551)#23 | 0.84%(+0.141)#5,241 |
| 24. | Burnsville | 0.98% | 0.43%(+0.551)#24 | 0.84%(+0.141)#5,242 |
| 25. | Bude | 0.93% | 0.43%(+0.502)#25 | 0.84%(+0.092)#5,416 |
| 26. | Gautier | 0.90% | 0.43%(+0.468)#26 | 0.84%(+0.058)#5,536 |
| 27. | Beechwood | 0.89% | 0.43%(+0.462)#27 | 0.84%(+0.052)#5,554 |
| 28. | New Augusta | 0.89% | 0.43%(+0.455)#28 | 0.84%(+0.045)#5,581 |
| 29. | Delisle | 0.88% | 0.43%(+0.453)#29 | 0.84%(+0.043)#5,586 |
| 30. | Kiln | 0.88% | 0.43%(+0.449)#30 | 0.84%(+0.040)#5,607 |
| 31. | Falkner | 0.86% | 0.43%(+0.430)#31 | 0.84%(+0.020)#5,676 |
| 32. | Corinth | 0.84% | 0.43%(+0.408)#32 | 0.84%(-0.001)#5,776 |
| 33. | Pass Christian | 0.83% | 0.43%(+0.395)#33 | 0.84%(-0.014)#5,822 |
| 34. | Marks | 0.80% | 0.43%(+0.364)#34 | 0.84%(-0.045)#5,936 |
| 35. | Morton | 0.76% | 0.43%(+0.327)#35 | 0.84%(-0.083)#6,096 |
| 36. | Escatawpa | 0.74% | 0.43%(+0.309)#36 | 0.84%(-0.101)#6,165 |
| 37. | Fayette | 0.73% | 0.43%(+0.300)#37 | 0.84%(-0.110)#6,195 |
| 38. | Coldwater | 0.65% | 0.43%(+0.215)#38 | 0.84%(-0.195)#6,585 |
| 39. | Laurel | 0.60% | 0.43%(+0.166)#39 | 0.84%(-0.244)#6,840 |
| 40. | Carthage | 0.60% | 0.43%(+0.165)#40 | 0.84%(-0.245)#6,849 |
| 41. | Tishomingo | 0.57% | 0.43%(+0.139)#41 | 0.84%(-0.271)#7,003 |
| 42. | Flowood | 0.57% | 0.43%(+0.137)#42 | 0.84%(-0.273)#7,018 |
| 43. | Marion | 0.53% | 0.43%(+0.100)#43 | 0.84%(-0.310)#7,235 |
| 44. | Gloster | 0.53% | 0.43%(+0.099)#44 | 0.84%(-0.311)#7,244 |
| 45. | Newton | 0.50% | 0.43%(+0.070)#45 | 0.84%(-0.340)#7,424 |
| 46. | Mississippi State | 0.49% | 0.43%(+0.057)#46 | 0.84%(-0.353)#7,512 |
| 47. | Blue Mountain | 0.45% | 0.43%(+0.023)#47 | 0.84%(-0.387)#7,750 |
| 48. | Horn Lake | 0.44% | 0.43%(+0.003)#48 | 0.84%(-0.406)#7,870 |
| 49. | Latimer | 0.44% | 0.43%(+0.003)#49 | 0.84%(-0.407)#7,871 |
| 50. | Biloxi | 0.43% | 0.43%(-0.004)#50 | 0.84%(-0.414)#7,933 |
| 51. | Clarksdale | 0.42% | 0.43%(-0.012)#51 | 0.84%(-0.422)#7,990 |
| 52. | Baldwyn | 0.41% | 0.43%(-0.023)#52 | 0.84%(-0.433)#8,069 |
| 53. | Hattiesburg | 0.38% | 0.43%(-0.052)#53 | 0.84%(-0.462)#8,311 |
| 54. | Blue Springs | 0.36% | 0.43%(-0.071)#54 | 0.84%(-0.481)#8,489 |
| 55. | Lexington | 0.35% | 0.43%(-0.085)#55 | 0.84%(-0.495)#8,603 |
| 56. | Elliott | 0.32% | 0.43%(-0.114)#56 | 0.84%(-0.524)#8,911 |
| 57. | D Iberville | 0.30% | 0.43%(-0.130)#57 | 0.84%(-0.540)#9,082 |
| 58. | Kosciusko | 0.30% | 0.43%(-0.134)#58 | 0.84%(-0.544)#9,120 |
| 59. | Poplarville | 0.25% | 0.43%(-0.183)#59 | 0.84%(-0.593)#9,656 |
| 60. | Puckett | 0.24% | 0.43%(-0.194)#60 | 0.84%(-0.603)#9,791 |
| 61. | Crenshaw | 0.23% | 0.43%(-0.200)#61 | 0.84%(-0.610)#9,885 |
| 62. | Collinsville | 0.22% | 0.43%(-0.207)#62 | 0.84%(-0.617)#9,980 |
| 63. | Jackson | 0.22% | 0.43%(-0.210)#63 | 0.84%(-0.620)#10,019 |
| 64. | Byram | 0.20% | 0.43%(-0.231)#64 | 0.84%(-0.640)#10,247 |
| 65. | Waveland | 0.20% | 0.43%(-0.234)#65 | 0.84%(-0.644)#10,309 |
| 66. | Aberdeen | 0.18% | 0.43%(-0.251)#66 | 0.84%(-0.661)#10,534 |
| 67. | Lucedale | 0.17% | 0.43%(-0.260)#67 | 0.84%(-0.670)#10,641 |
| 68. | Mccomb | 0.17% | 0.43%(-0.261)#68 | 0.84%(-0.671)#10,651 |
| 69. | Indianola | 0.17% | 0.43%(-0.265)#69 | 0.84%(-0.674)#10,700 |
| 70. | Gulfport | 0.17% | 0.43%(-0.265)#70 | 0.84%(-0.675)#10,706 |
| 71. | Olive Branch | 0.15% | 0.43%(-0.277)#71 | 0.84%(-0.687)#10,870 |
| 72. | Belmont | 0.15% | 0.43%(-0.278)#72 | 0.84%(-0.688)#10,886 |
| 73. | Tupelo | 0.15% | 0.43%(-0.282)#73 | 0.84%(-0.691)#10,932 |
| 74. | Walnut | 0.14% | 0.43%(-0.292)#74 | 0.84%(-0.702)#11,067 |
| 75. | Hazlehurst | 0.14% | 0.43%(-0.293)#75 | 0.84%(-0.703)#11,073 |
| 76. | Brandon | 0.14% | 0.43%(-0.297)#76 | 0.84%(-0.706)#11,123 |
| 77. | Fulton | 0.13% | 0.43%(-0.298)#77 | 0.84%(-0.708)#11,146 |
| 78. | Booneville | 0.13% | 0.43%(-0.299)#78 | 0.84%(-0.709)#11,157 |
| 79. | Houston | 0.13% | 0.43%(-0.299)#79 | 0.84%(-0.709)#11,159 |
| 80. | Ocean Springs | 0.13% | 0.43%(-0.302)#80 | 0.84%(-0.711)#11,196 |
| 81. | Greenwood | 0.11% | 0.43%(-0.319)#81 | 0.84%(-0.729)#11,478 |
| 82. | Gulf Hills | 0.10% | 0.43%(-0.328)#82 | 0.84%(-0.737)#11,582 |
| 83. | Gulf Park Estates | 0.10% | 0.43%(-0.331)#83 | 0.84%(-0.741)#11,626 |
| 84. | Long Beach | 0.083% | 0.43%(-0.349)#84 | 0.84%(-0.758)#11,869 |
| 85. | Louisville | 0.082% | 0.43%(-0.349)#85 | 0.84%(-0.759)#11,884 |
| 86. | Tutwiler | 0.080% | 0.43%(-0.352)#86 | 0.84%(-0.762)#11,918 |
| 87. | Robinhood | 0.077% | 0.43%(-0.354)#87 | 0.84%(-0.764)#11,958 |
| 88. | Starkville | 0.074% | 0.43%(-0.358)#88 | 0.84%(-0.767)#12,017 |
| 89. | Senatobia | 0.072% | 0.43%(-0.359)#89 | 0.84%(-0.769)#12,054 |
| 90. | Oxford | 0.066% | 0.43%(-0.366)#90 | 0.84%(-0.775)#12,146 |
| 91. | Greenville | 0.064% | 0.43%(-0.367)#91 | 0.84%(-0.777)#12,179 |
| 92. | Hernando | 0.064% | 0.43%(-0.368)#92 | 0.84%(-0.778)#12,192 |
| 93. | Columbus | 0.063% | 0.43%(-0.369)#93 | 0.84%(-0.779)#12,206 |
| 94. | Southaven | 0.058% | 0.43%(-0.374)#94 | 0.84%(-0.783)#12,271 |
| 95. | Madison | 0.058% | 0.43%(-0.374)#95 | 0.84%(-0.784)#12,277 |
| 96. | Lynchburg | 0.051% | 0.43%(-0.381)#96 | 0.84%(-0.790)#12,378 |
| 97. | Holly Springs | 0.043% | 0.43%(-0.389)#97 | 0.84%(-0.798)#12,489 |
| 98. | St Martin | 0.038% | 0.43%(-0.394)#98 | 0.84%(-0.803)#12,544 |
| 99. | Charleston | 0.038% | 0.43%(-0.394)#99 | 0.84%(-0.803)#12,547 |
| 100. | Pascagoula | 0.037% | 0.43%(-0.395)#100 | 0.84%(-0.805)#12,566 |
Common Questions
What are the Top 10 Cities with the Highest Percentage of Native / Alaskan Population in Mississippi?
Top 10 Cities with the Highest Percentage of Native / Alaskan Population in Mississippi are:
#1
98.1%
#2
79.8%
#3
78.0%
#4
76.5%
#5
51.5%
#6
4.2%
#7
4.1%
#8
3.3%
#9
3.3%
#10
2.9%
What city has the Highest Percentage of Native / Alaskan Population in Mississippi?
Tucker has the Highest Percentage of Native / Alaskan Population in Mississippi with 98.1%.
What is the Percentage of Native / Alaskan Population in the State of Mississippi?
Percentage of Native / Alaskan Population in Mississippi is 0.43%.
What is the Percentage of Native / Alaskan Population in the United States?
Percentage of Native / Alaskan Population in the United States is 0.84%.