Escatawpa, MS Map & Demographics
Escatawpa Map
Escatawpa Overview
$24,844
PER CAPITA INCOME
$64,354
AVG FAMILY INCOME
$33,529
AVG HOUSEHOLD INCOME
14.8%
WAGE / INCOME GAP [ % ]
85.2¢/ $1
WAGE / INCOME GAP [ $ ]
0.44
INEQUALITY / GINI INDEX
3,239
TOTAL POPULATION
1,382
MALE POPULATION
1,857
FEMALE POPULATION
74.42
MALES / 100 FEMALES
134.37
FEMALES / 100 MALES
50.3
MEDIAN AGE
3.2
AVG FAMILY SIZE
2.3
AVG HOUSEHOLD SIZE
1,128
LABOR FORCE [ PEOPLE ]
39.9%
PERCENT IN LABOR FORCE
15.5%
UNEMPLOYMENT RATE
Escatawpa Area Codes
Income in Escatawpa
Income Overview in Escatawpa
Per Capita Income in Escatawpa is $24,844, while median incomes of families and households are $64,354 and $33,529 respectively.
| Characteristic | Number | Measure |
| Per Capita Income | 3,239 | $24,844 |
| Median Family Income | 733 | $64,354 |
| Mean Family Income | 733 | $72,848 |
| Median Household Income | 1,436 | $33,529 |
| Mean Household Income | 1,436 | $51,953 |
| Income Deficit | 733 | $0 |
| Wage / Income Gap (%) | 3,239 | 14.81% |
| Wage / Income Gap ($) | 3,239 | 85.19¢ per $1 |
| Gini / Inequality Index | 3,239 | 0.44 |
Earnings by Sex in Escatawpa
Average Earnings in Escatawpa are $35,875, $33,899 for men and $39,792 for women, a difference of 14.8%.
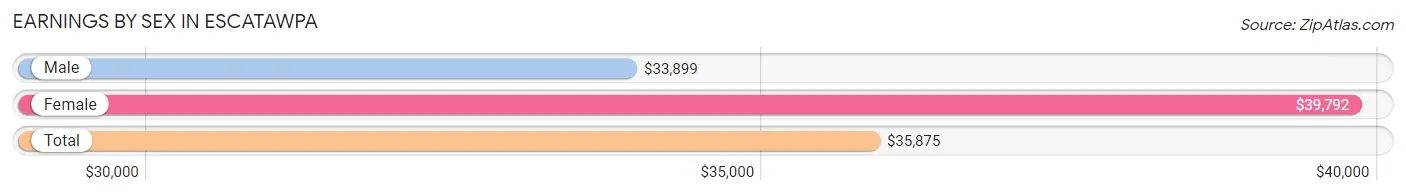
| Sex | Number | Average Earnings |
| Male | 585 (56.1%) | $33,899 |
| Female | 458 (43.9%) | $39,792 |
| Total | 1,043 (100.0%) | $35,875 |
Earnings by Sex by Income Bracket in Escatawpa
The most common earnings brackets in Escatawpa are $30,000 to $34,999 for men (115 | 19.7%) and $45,000 to $49,999 for women (114 | 24.9%).
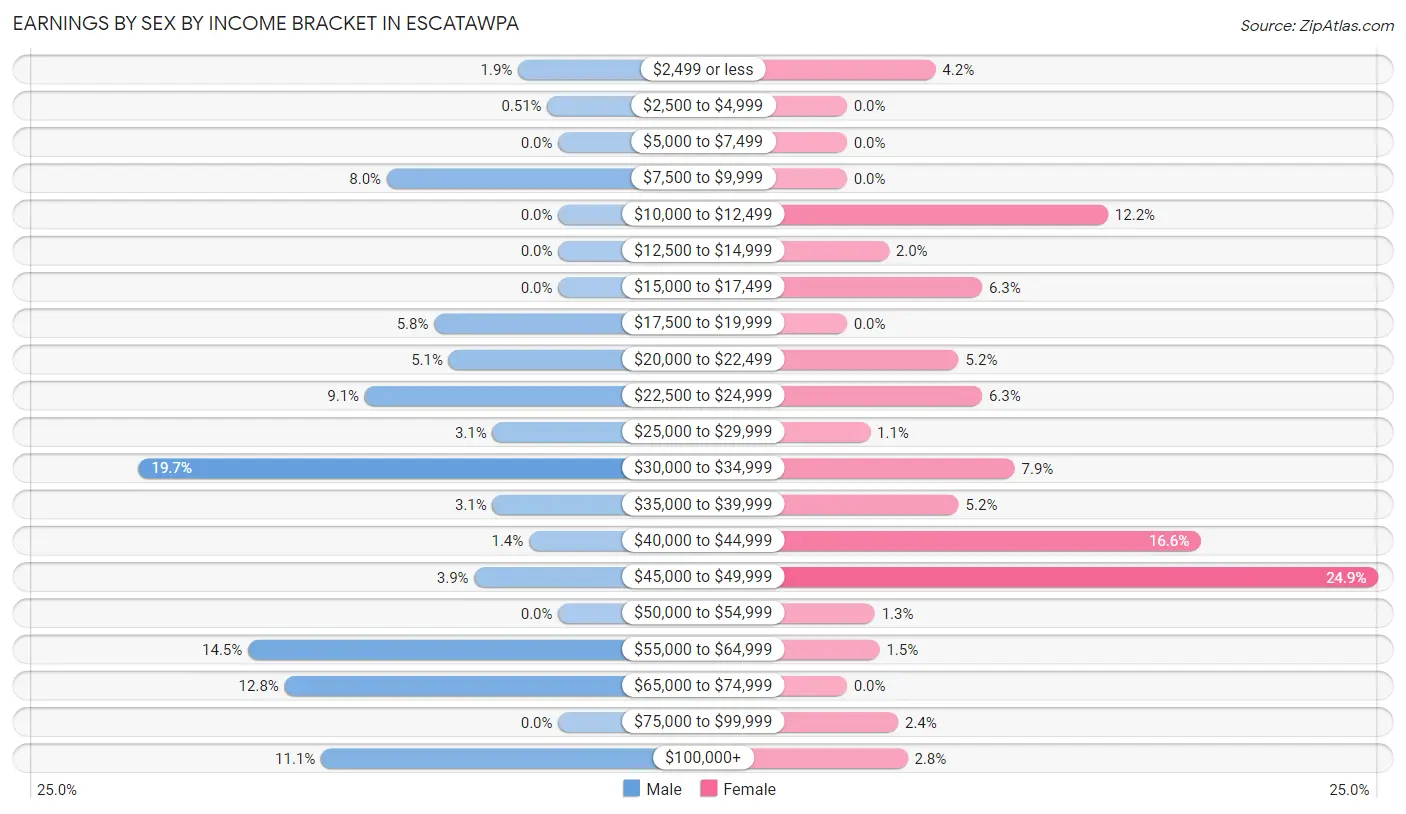
| Income | Male | Female |
| $2,499 or less | 11 (1.9%) | 19 (4.2%) |
| $2,500 to $4,999 | 3 (0.5%) | 0 (0.0%) |
| $5,000 to $7,499 | 0 (0.0%) | 0 (0.0%) |
| $7,500 to $9,999 | 47 (8.0%) | 0 (0.0%) |
| $10,000 to $12,499 | 0 (0.0%) | 56 (12.2%) |
| $12,500 to $14,999 | 0 (0.0%) | 9 (2.0%) |
| $15,000 to $17,499 | 0 (0.0%) | 29 (6.3%) |
| $17,500 to $19,999 | 34 (5.8%) | 0 (0.0%) |
| $20,000 to $22,499 | 30 (5.1%) | 24 (5.2%) |
| $22,500 to $24,999 | 53 (9.1%) | 29 (6.3%) |
| $25,000 to $29,999 | 18 (3.1%) | 5 (1.1%) |
| $30,000 to $34,999 | 115 (19.7%) | 36 (7.9%) |
| $35,000 to $39,999 | 18 (3.1%) | 24 (5.2%) |
| $40,000 to $44,999 | 8 (1.4%) | 76 (16.6%) |
| $45,000 to $49,999 | 23 (3.9%) | 114 (24.9%) |
| $50,000 to $54,999 | 0 (0.0%) | 6 (1.3%) |
| $55,000 to $64,999 | 85 (14.5%) | 7 (1.5%) |
| $65,000 to $74,999 | 75 (12.8%) | 0 (0.0%) |
| $75,000 to $99,999 | 0 (0.0%) | 11 (2.4%) |
| $100,000+ | 65 (11.1%) | 13 (2.8%) |
| Total | 585 (100.0%) | 458 (100.0%) |
Earnings by Sex by Educational Attainment in Escatawpa
Average earnings in Escatawpa are $37,656 for men and $38,958 for women, a difference of 3.3%. Men with an educational attainment of college or associate's degree enjoy the highest average annual earnings of $61,452, while those with high school diploma education earn the least with $32,380. Women with an educational attainment of college or associate's degree earn the most with the average annual earnings of $48,148, while those with bachelor's degree education have the smallest earnings of $40,547.
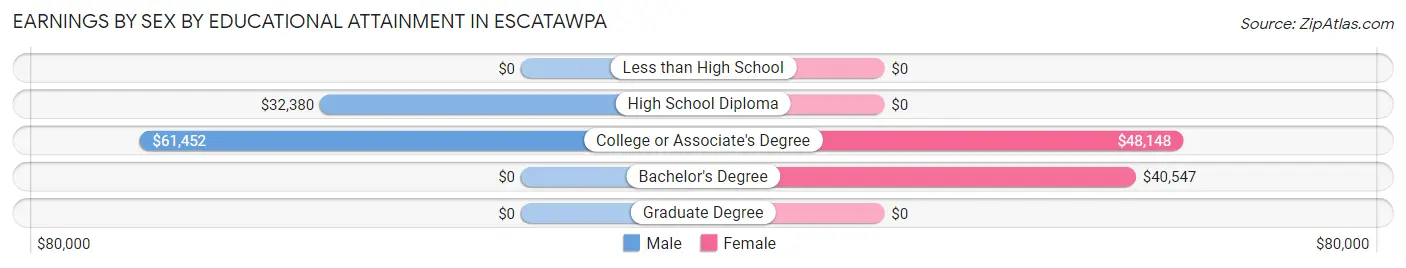
| Educational Attainment | Male Income | Female Income |
| Less than High School | - | - |
| High School Diploma | $32,380 | $0 |
| College or Associate's Degree | $61,452 | $48,148 |
| Bachelor's Degree | - | - |
| Graduate Degree | - | - |
| Total | $37,656 | $38,958 |
Family Income in Escatawpa
Family Income Brackets in Escatawpa
According to the Escatawpa family income data, there are 165 families falling into the $50,000 to $74,999 income range, which is the most common income bracket and makes up 22.5% of all families. Conversely, the $200,000+ income bracket is the least frequent group with only 9 families (1.2%) belonging to this category.
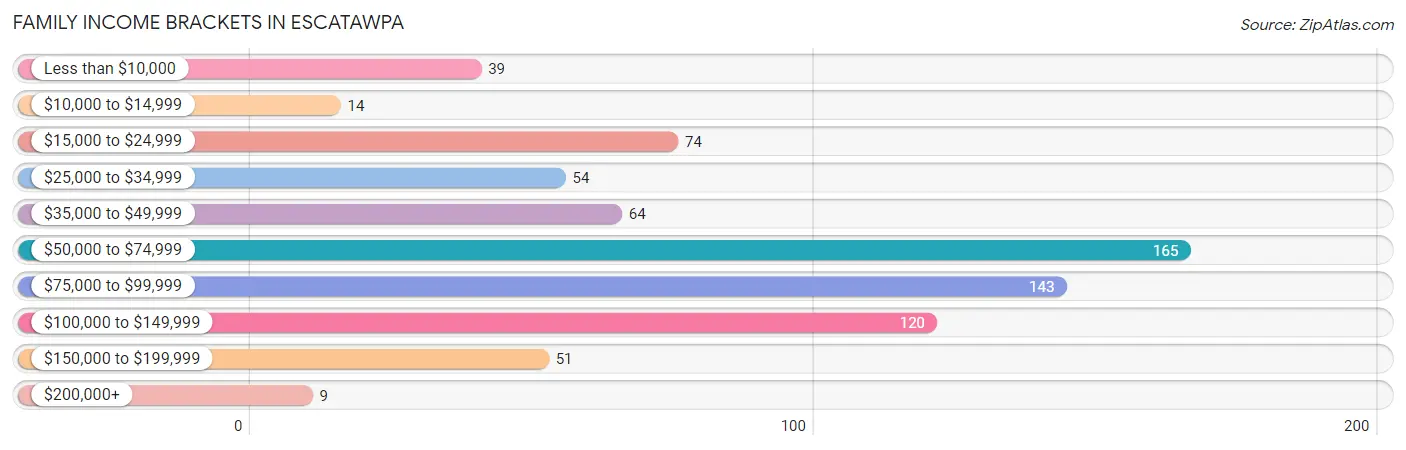
| Income Bracket | # Families | % Families |
| Less than $10,000 | 39 | 5.3% |
| $10,000 to $14,999 | 14 | 1.9% |
| $15,000 to $24,999 | 74 | 10.1% |
| $25,000 to $34,999 | 54 | 7.4% |
| $35,000 to $49,999 | 64 | 8.7% |
| $50,000 to $74,999 | 165 | 22.5% |
| $75,000 to $99,999 | 143 | 19.5% |
| $100,000 to $149,999 | 120 | 16.4% |
| $150,000 to $199,999 | 51 | 7.0% |
| $200,000+ | 9 | 1.2% |
Family Income by Famaliy Size in Escatawpa
4-person families (145 | 19.8%) account for the highest median family income in Escatawpa with $78,147 per family, while 2-person families (356 | 48.6%) have the highest median income of $31,316 per family member.
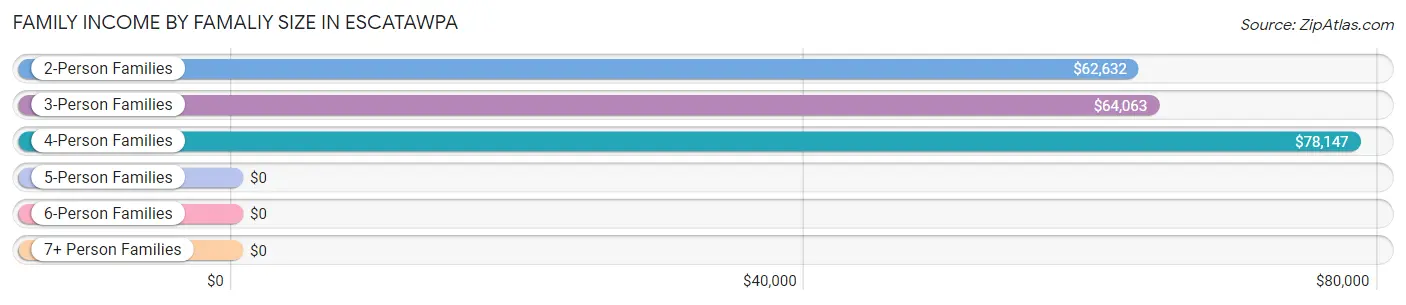
| Income Bracket | # Families | Median Income |
| 2-Person Families | 356 (48.6%) | $62,632 |
| 3-Person Families | 204 (27.8%) | $64,063 |
| 4-Person Families | 145 (19.8%) | $78,147 |
| 5-Person Families | 28 (3.8%) | $0 |
| 6-Person Families | 0 (0.0%) | $0 |
| 7+ Person Families | 0 (0.0%) | $0 |
| Total | 733 (100.0%) | $64,354 |
Family Income by Number of Earners in Escatawpa
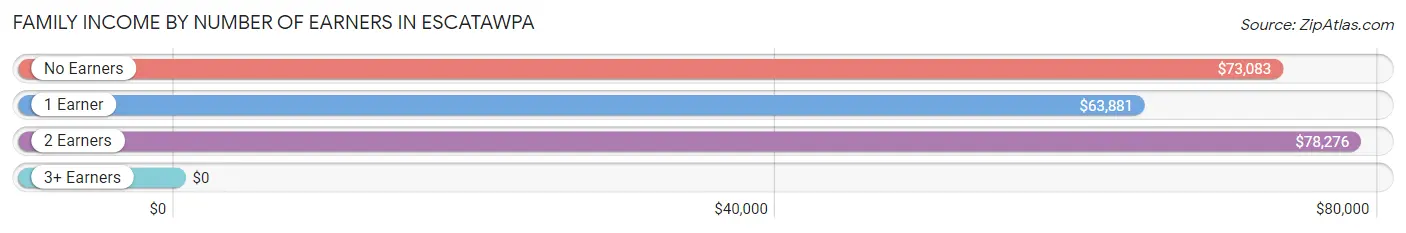
| Number of Earners | # Families | Median Income |
| No Earners | 251 (34.2%) | $73,083 |
| 1 Earner | 317 (43.2%) | $63,881 |
| 2 Earners | 160 (21.8%) | $78,276 |
| 3+ Earners | 5 (0.7%) | $0 |
| Total | 733 (100.0%) | $64,354 |
Household Income in Escatawpa
Household Income Brackets in Escatawpa
With 404 households falling in the category, the $15,000 to $24,999 income range is the most frequent in Escatawpa, accounting for 28.1% of all households. In contrast, only 9 households (0.6%) fall into the $200,000+ income bracket, making it the least populous group.
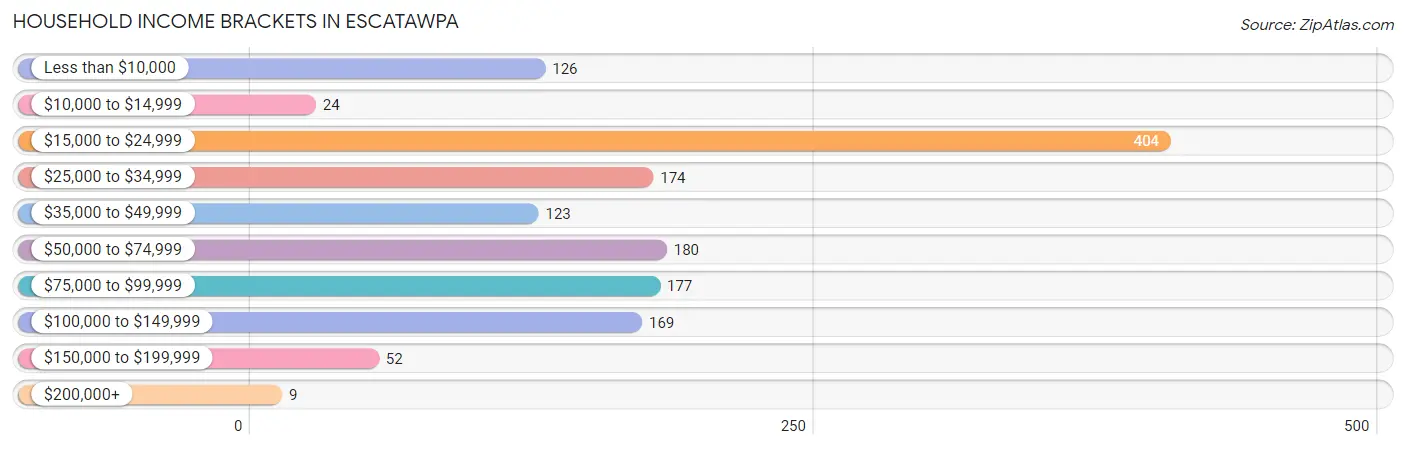
| Income Bracket | # Households | % Households |
| Less than $10,000 | 126 | 8.8% |
| $10,000 to $14,999 | 24 | 1.7% |
| $15,000 to $24,999 | 404 | 28.1% |
| $25,000 to $34,999 | 174 | 12.1% |
| $35,000 to $49,999 | 123 | 8.6% |
| $50,000 to $74,999 | 180 | 12.5% |
| $75,000 to $99,999 | 177 | 12.3% |
| $100,000 to $149,999 | 169 | 11.8% |
| $150,000 to $199,999 | 52 | 3.6% |
| $200,000+ | 9 | 0.6% |
Household Income by Householder Age in Escatawpa
The median household income in Escatawpa is $33,529, with the highest median household income of $62,339 found in the 25 to 44 years age bracket for the primary householder. A total of 164 households (11.4%) fall into this category.
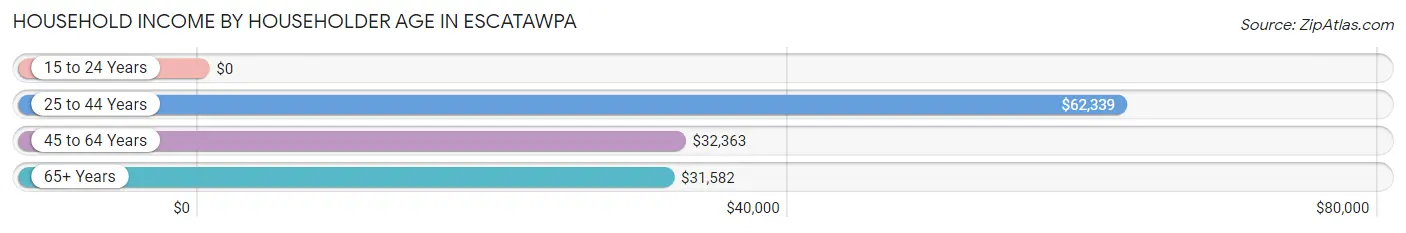
| Income Bracket | # Households | Median Income |
| 15 to 24 Years | 0 (0.0%) | $0 |
| 25 to 44 Years | 164 (11.4%) | $62,339 |
| 45 to 64 Years | 538 (37.5%) | $32,363 |
| 65+ Years | 734 (51.1%) | $31,582 |
| Total | 1,436 (100.0%) | $33,529 |
Poverty in Escatawpa
Income Below Poverty by Sex and Age in Escatawpa
With 11.9% poverty level for males and 17.9% for females among the residents of Escatawpa, 18 to 24 year old males and 6 to 11 year old females are the most vulnerable to poverty, with 26 males (60.5%) and 41 females (100.0%) in their respective age groups living below the poverty level.
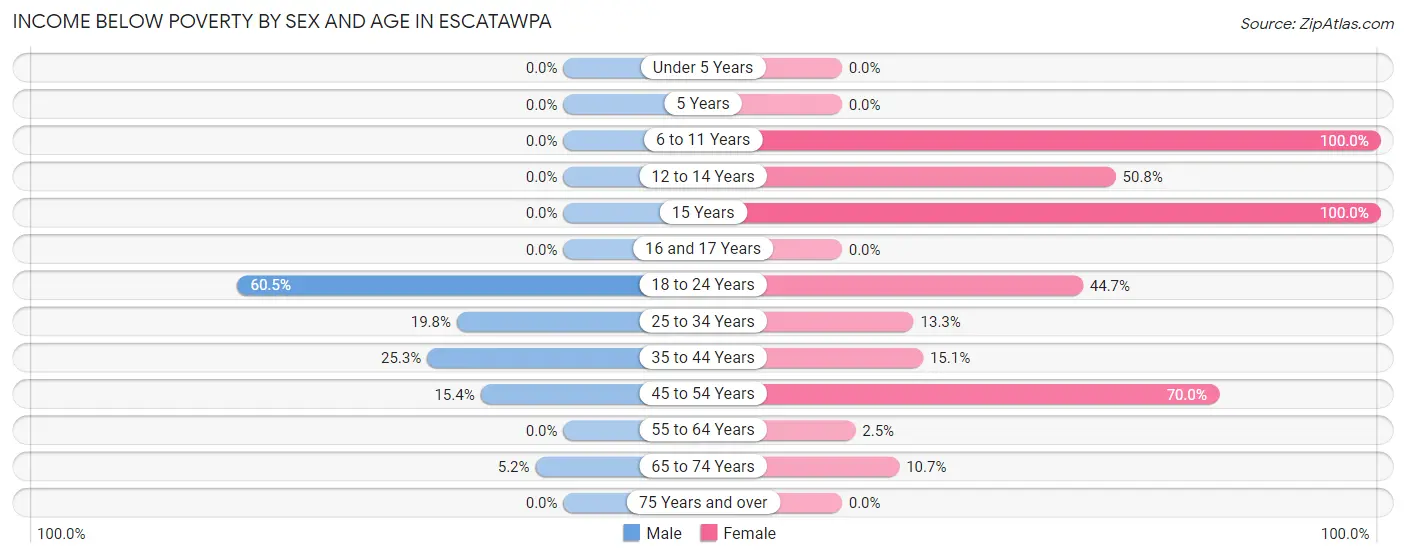
| Age Bracket | Male | Female |
| Under 5 Years | 0 (0.0%) | 0 (0.0%) |
| 5 Years | 0 (0.0%) | 0 (0.0%) |
| 6 to 11 Years | 0 (0.0%) | 41 (100.0%) |
| 12 to 14 Years | 0 (0.0%) | 31 (50.8%) |
| 15 Years | 0 (0.0%) | 8 (100.0%) |
| 16 and 17 Years | 0 (0.0%) | 0 (0.0%) |
| 18 to 24 Years | 26 (60.5%) | 17 (44.7%) |
| 25 to 34 Years | 72 (19.8%) | 18 (13.3%) |
| 35 to 44 Years | 21 (25.3%) | 33 (15.1%) |
| 45 to 54 Years | 34 (15.4%) | 156 (70.0%) |
| 55 to 64 Years | 0 (0.0%) | 9 (2.5%) |
| 65 to 74 Years | 11 (5.2%) | 13 (10.7%) |
| 75 Years and over | 0 (0.0%) | 0 (0.0%) |
| Total | 164 (11.9%) | 326 (17.9%) |
Income Above Poverty by Sex and Age in Escatawpa
According to the poverty statistics in Escatawpa, males aged 5 years and females aged under 5 years are the age groups that are most secure financially, with 100.0% of males and 100.0% of females in these age groups living above the poverty line.
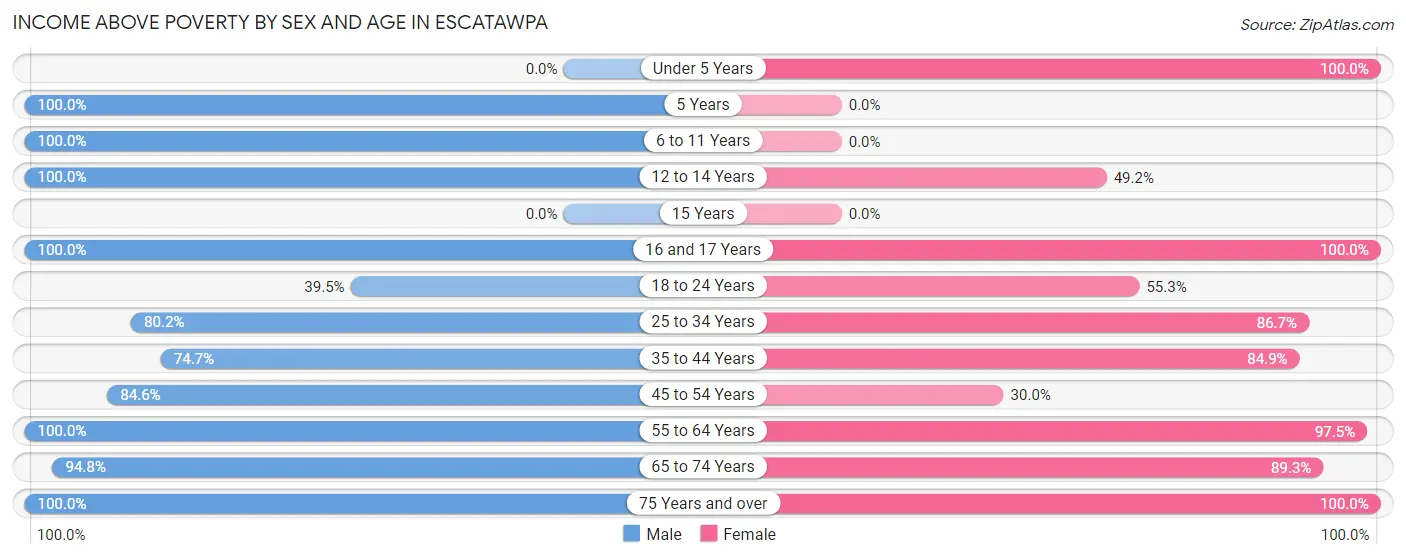
| Age Bracket | Male | Female |
| Under 5 Years | 0 (0.0%) | 150 (100.0%) |
| 5 Years | 29 (100.0%) | 0 (0.0%) |
| 6 to 11 Years | 61 (100.0%) | 0 (0.0%) |
| 12 to 14 Years | 23 (100.0%) | 30 (49.2%) |
| 15 Years | 0 (0.0%) | 0 (0.0%) |
| 16 and 17 Years | 15 (100.0%) | 42 (100.0%) |
| 18 to 24 Years | 17 (39.5%) | 21 (55.3%) |
| 25 to 34 Years | 292 (80.2%) | 117 (86.7%) |
| 35 to 44 Years | 62 (74.7%) | 186 (84.9%) |
| 45 to 54 Years | 187 (84.6%) | 67 (30.0%) |
| 55 to 64 Years | 155 (100.0%) | 348 (97.5%) |
| 65 to 74 Years | 201 (94.8%) | 109 (89.3%) |
| 75 Years and over | 176 (100.0%) | 422 (100.0%) |
| Total | 1,218 (88.1%) | 1,492 (82.1%) |
Income Below Poverty Among Married-Couple Families in Escatawpa
The poverty statistics for married-couple families in Escatawpa show that 9.1% or 45 of the total 496 families live below the poverty line. Families with 1 or 2 children have the highest poverty rate of 23.3%, comprising of 34 families. On the other hand, families with no children have the lowest poverty rate of 3.1%, which includes 11 families.
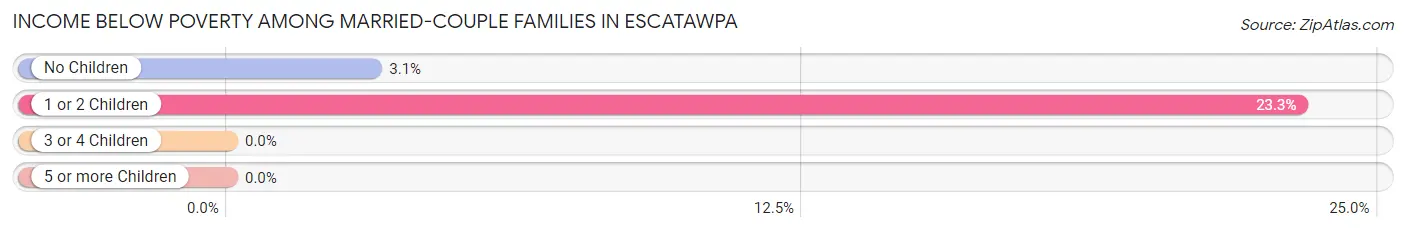
| Children | Above Poverty | Below Poverty |
| No Children | 339 (96.9%) | 11 (3.1%) |
| 1 or 2 Children | 112 (76.7%) | 34 (23.3%) |
| 3 or 4 Children | 0 (0.0%) | 0 (0.0%) |
| 5 or more Children | 0 (0.0%) | 0 (0.0%) |
| Total | 451 (90.9%) | 45 (9.1%) |
Income Below Poverty Among Single-Parent Households in Escatawpa
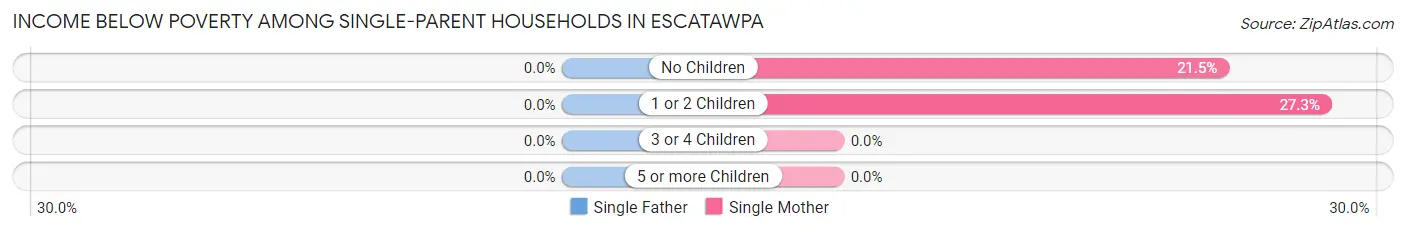
| Children | Single Father | Single Mother |
| No Children | 0 (0.0%) | 14 (21.5%) |
| 1 or 2 Children | 0 (0.0%) | 39 (27.3%) |
| 3 or 4 Children | 0 (0.0%) | 0 (0.0%) |
| 5 or more Children | 0 (0.0%) | 0 (0.0%) |
| Total | 0 (0.0%) | 53 (25.5%) |
Income Below Poverty Among Married-Couple vs Single-Parent Households in Escatawpa
The poverty data for Escatawpa shows that 45 of the married-couple family households (9.1%) and 53 of the single-parent households (22.4%) are living below the poverty level. Within the married-couple family households, those with 1 or 2 children have the highest poverty rate, with 34 households (23.3%) falling below the poverty line. Among the single-parent households, those with 1 or 2 children have the highest poverty rate, with 39 household (22.7%) living below poverty.
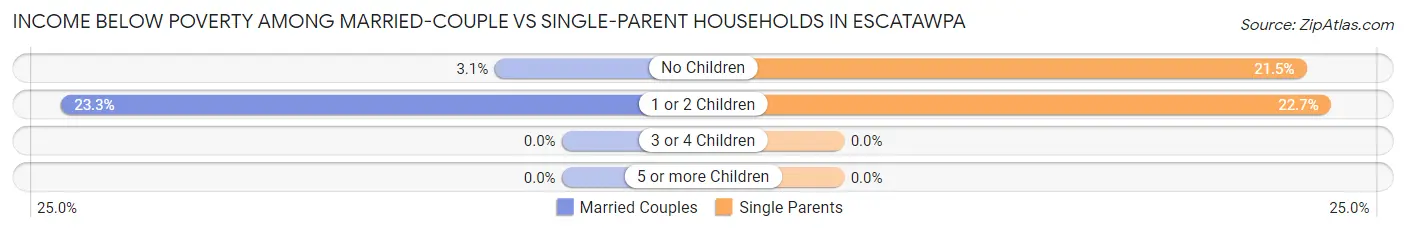
| Children | Married-Couple Families | Single-Parent Households |
| No Children | 11 (3.1%) | 14 (21.5%) |
| 1 or 2 Children | 34 (23.3%) | 39 (22.7%) |
| 3 or 4 Children | 0 (0.0%) | 0 (0.0%) |
| 5 or more Children | 0 (0.0%) | 0 (0.0%) |
| Total | 45 (9.1%) | 53 (22.4%) |
Race in Escatawpa
The most populous races in Escatawpa are White / Caucasian (2,567 | 79.2%), Black / African American (612 | 18.9%), and Native / Alaskan (24 | 0.7%).
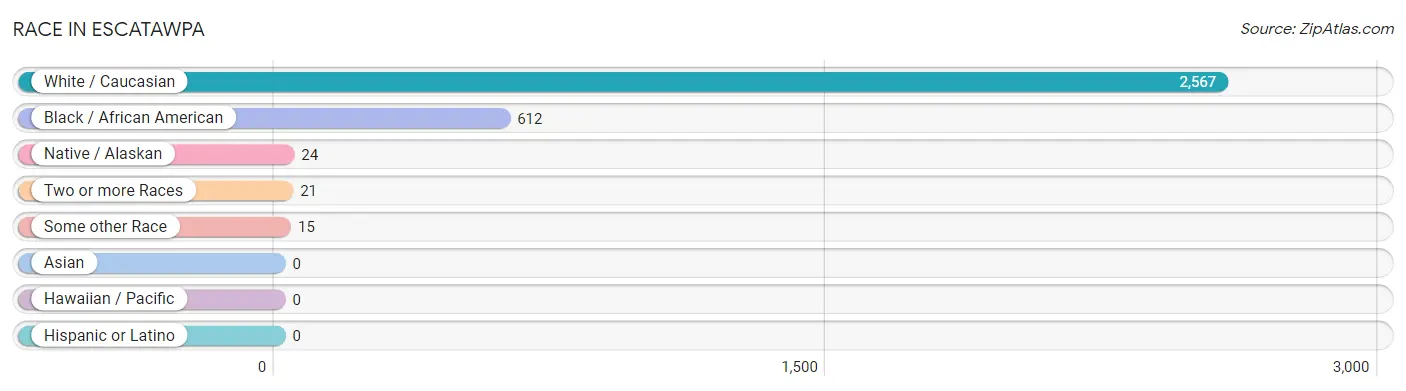
| Race | # Population | % Population |
| Asian | 0 | 0.0% |
| Black / African American | 612 | 18.9% |
| Hawaiian / Pacific | 0 | 0.0% |
| Hispanic or Latino | 0 | 0.0% |
| Native / Alaskan | 24 | 0.7% |
| White / Caucasian | 2,567 | 79.2% |
| Two or more Races | 21 | 0.6% |
| Some other Race | 15 | 0.5% |
| Total | 3,239 | 100.0% |
Ancestry in Escatawpa
The most populous ancestries reported in Escatawpa are English (612 | 18.9%), American (439 | 13.6%), German (293 | 9.0%), Irish (264 | 8.2%), and Scottish (86 | 2.7%), together accounting for 52.3% of all Escatawpa residents.
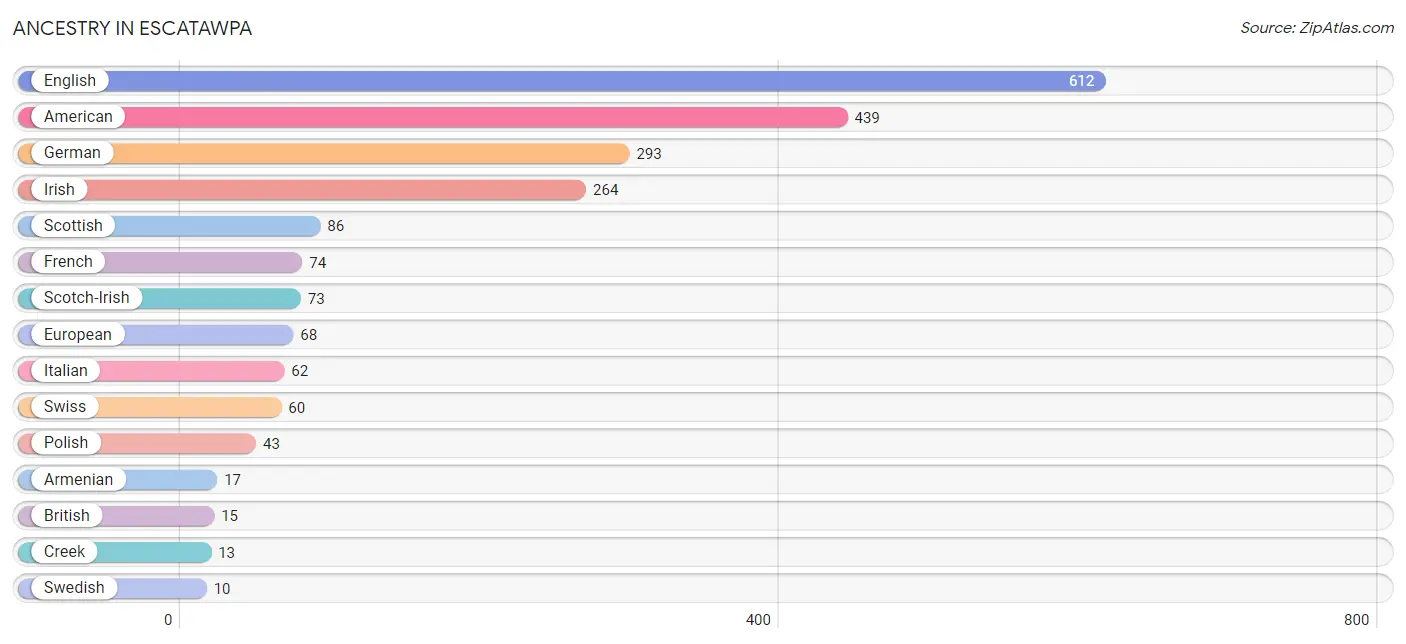
| Ancestry | # Population | % Population |
| American | 439 | 13.6% |
| Armenian | 17 | 0.5% |
| British | 15 | 0.5% |
| Cajun | 3 | 0.1% |
| Cherokee | 3 | 0.1% |
| Creek | 13 | 0.4% |
| English | 612 | 18.9% |
| European | 68 | 2.1% |
| French | 74 | 2.3% |
| German | 293 | 9.0% |
| Irish | 264 | 8.2% |
| Italian | 62 | 1.9% |
| Polish | 43 | 1.3% |
| Scotch-Irish | 73 | 2.2% |
| Scottish | 86 | 2.7% |
| Subsaharan African | 8 | 0.3% |
| Swedish | 10 | 0.3% |
| Swiss | 60 | 1.8% | View All 18 Rows |
Immigrants in Escatawpa
The most numerous immigrant groups reported in Escatawpa came from Europe (20 | 0.6%), Germany (20 | 0.6%), and Western Europe (20 | 0.6%), together accounting for 1.9% of all Escatawpa residents.
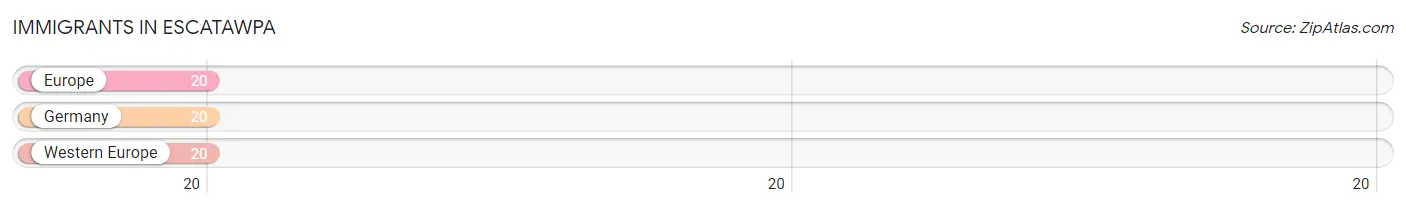
| Immigration Origin | # Population | % Population |
| Europe | 20 | 0.6% |
| Germany | 20 | 0.6% |
| Western Europe | 20 | 0.6% | View All 3 Rows |
Sex and Age in Escatawpa
Sex and Age in Escatawpa
The most populous age groups in Escatawpa are 25 to 29 Years (250 | 18.1%) for men and 85 Years and over (249 | 13.4%) for women.
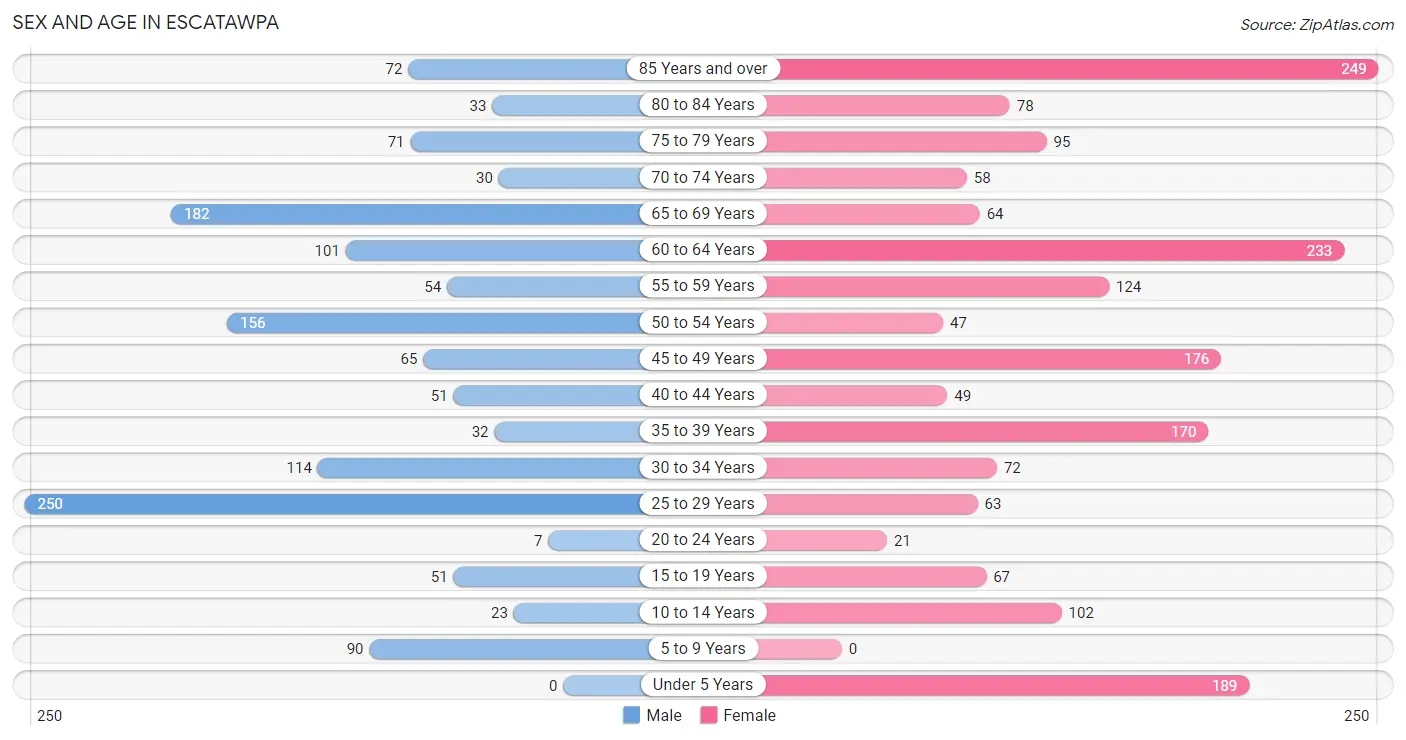
| Age Bracket | Male | Female |
| Under 5 Years | 0 (0.0%) | 189 (10.2%) |
| 5 to 9 Years | 90 (6.5%) | 0 (0.0%) |
| 10 to 14 Years | 23 (1.7%) | 102 (5.5%) |
| 15 to 19 Years | 51 (3.7%) | 67 (3.6%) |
| 20 to 24 Years | 7 (0.5%) | 21 (1.1%) |
| 25 to 29 Years | 250 (18.1%) | 63 (3.4%) |
| 30 to 34 Years | 114 (8.3%) | 72 (3.9%) |
| 35 to 39 Years | 32 (2.3%) | 170 (9.1%) |
| 40 to 44 Years | 51 (3.7%) | 49 (2.6%) |
| 45 to 49 Years | 65 (4.7%) | 176 (9.5%) |
| 50 to 54 Years | 156 (11.3%) | 47 (2.5%) |
| 55 to 59 Years | 54 (3.9%) | 124 (6.7%) |
| 60 to 64 Years | 101 (7.3%) | 233 (12.6%) |
| 65 to 69 Years | 182 (13.2%) | 64 (3.5%) |
| 70 to 74 Years | 30 (2.2%) | 58 (3.1%) |
| 75 to 79 Years | 71 (5.1%) | 95 (5.1%) |
| 80 to 84 Years | 33 (2.4%) | 78 (4.2%) |
| 85 Years and over | 72 (5.2%) | 249 (13.4%) |
| Total | 1,382 (100.0%) | 1,857 (100.0%) |
Families and Households in Escatawpa
Median Family Size in Escatawpa
The median family size in Escatawpa is 3.18 persons per family, with single female/mother families (208 | 28.4%) accounting for the largest median family size of 3.32 persons per family. On the other hand, single male/father families (29 | 4.0%) represent the smallest median family size with 2.83 persons per family.
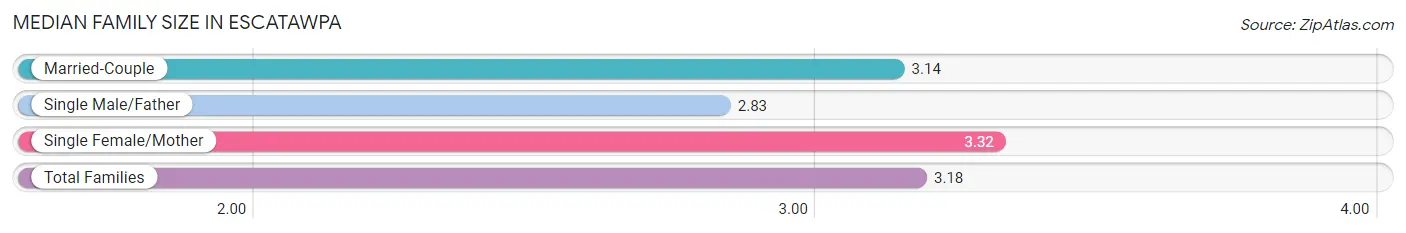
| Family Type | # Families | Family Size |
| Married-Couple | 496 (67.7%) | 3.14 |
| Single Male/Father | 29 (4.0%) | 2.83 |
| Single Female/Mother | 208 (28.4%) | 3.32 |
| Total Families | 733 (100.0%) | 3.18 |
Median Household Size in Escatawpa
The median household size in Escatawpa is 2.26 persons per household, with single female/mother households (208 | 14.5%) accounting for the largest median household size of 3.63 persons per household. non-family households (703 | 49.0%) represent the smallest median household size with 1.20 persons per household.
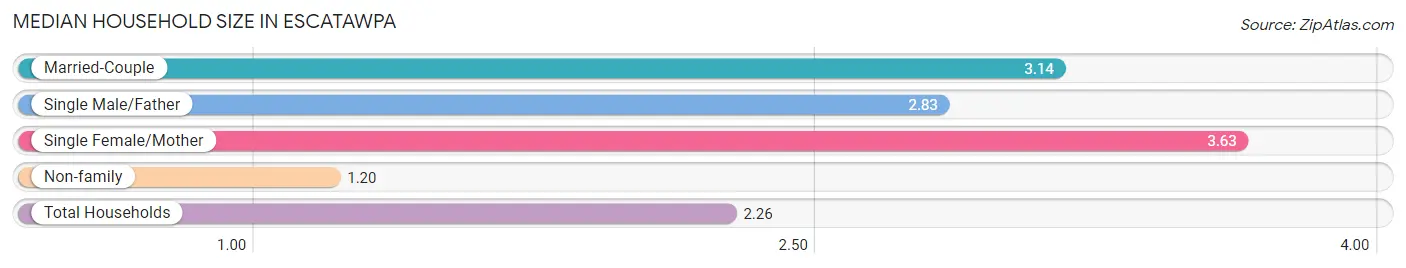
| Household Type | # Households | Household Size |
| Married-Couple | 496 (34.5%) | 3.14 |
| Single Male/Father | 29 (2.0%) | 2.83 |
| Single Female/Mother | 208 (14.5%) | 3.63 |
| Non-family | 703 (49.0%) | 1.20 |
| Total Households | 1,436 (100.0%) | 2.26 |
Household Size by Marriage Status in Escatawpa
Out of a total of 1,436 households in Escatawpa, 733 (51.0%) are family households, while 703 (49.0%) are nonfamily households. The most numerous type of family households are 2-person households, comprising 325, and the most common type of nonfamily households are 1-person households, comprising 621.
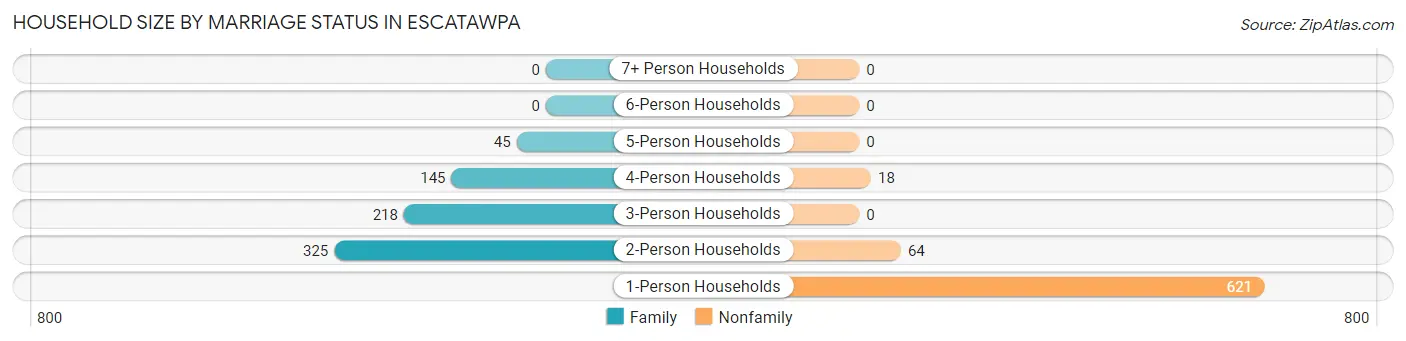
| Household Size | Family Households | Nonfamily Households |
| 1-Person Households | - | 621 (43.2%) |
| 2-Person Households | 325 (22.6%) | 64 (4.5%) |
| 3-Person Households | 218 (15.2%) | 0 (0.0%) |
| 4-Person Households | 145 (10.1%) | 18 (1.3%) |
| 5-Person Households | 45 (3.1%) | 0 (0.0%) |
| 6-Person Households | 0 (0.0%) | 0 (0.0%) |
| 7+ Person Households | 0 (0.0%) | 0 (0.0%) |
| Total | 733 (51.0%) | 703 (49.0%) |
Female Fertility in Escatawpa
Fertility by Age in Escatawpa
Average fertility rate in Escatawpa is 27.0 births per 1,000 women. Women in the age bracket of 15 to 19 years have the highest fertility rate with 254.0 births per 1,000 women. Women in the age bracket of 15 to 19 years acount for 100.0% of all women with births.
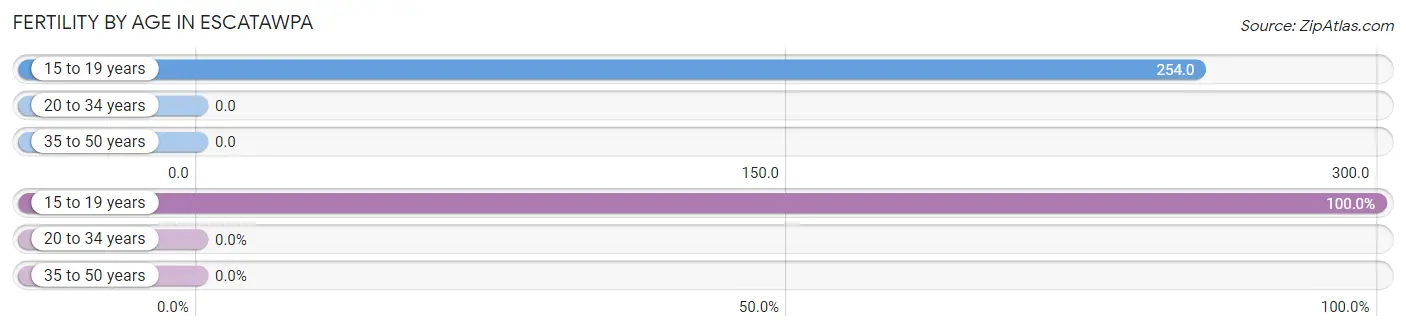
| Age Bracket | Women with Births | Births / 1,000 Women |
| 15 to 19 years | 17 (100.0%) | 254.0 |
| 20 to 34 years | 0 (0.0%) | 0.0 |
| 35 to 50 years | 0 (0.0%) | 0.0 |
| Total | 17 (100.0%) | 27.0 |
Fertility by Age by Marriage Status in Escatawpa
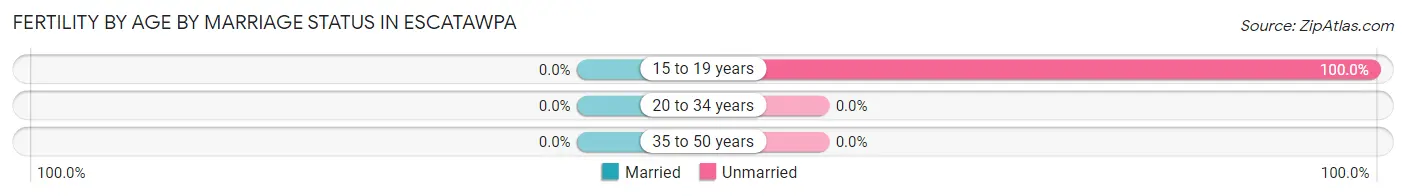
| Age Bracket | Married | Unmarried |
| 15 to 19 years | 0 (0.0%) | 17 (100.0%) |
| 20 to 34 years | 0 (0.0%) | 0 (0.0%) |
| 35 to 50 years | 0 (0.0%) | 0 (0.0%) |
| Total | 0 (0.0%) | 17 (100.0%) |
Fertility by Education in Escatawpa
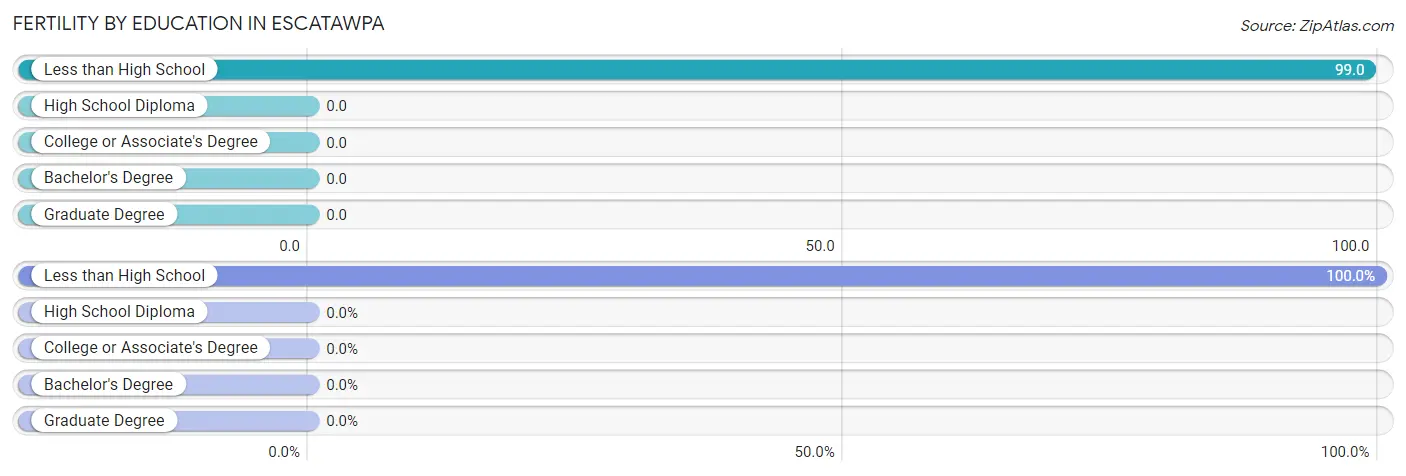
| Educational Attainment | Women with Births | Births / 1,000 Women |
| Less than High School | 17 (100.0%) | 99.0 |
| High School Diploma | 0 (0.0%) | 0.0 |
| College or Associate's Degree | 0 (0.0%) | 0.0 |
| Bachelor's Degree | 0 (0.0%) | 0.0 |
| Graduate Degree | 0 (0.0%) | 0.0 |
| Total | 17 (100.0%) | 27.0 |
Fertility by Education by Marriage Status in Escatawpa
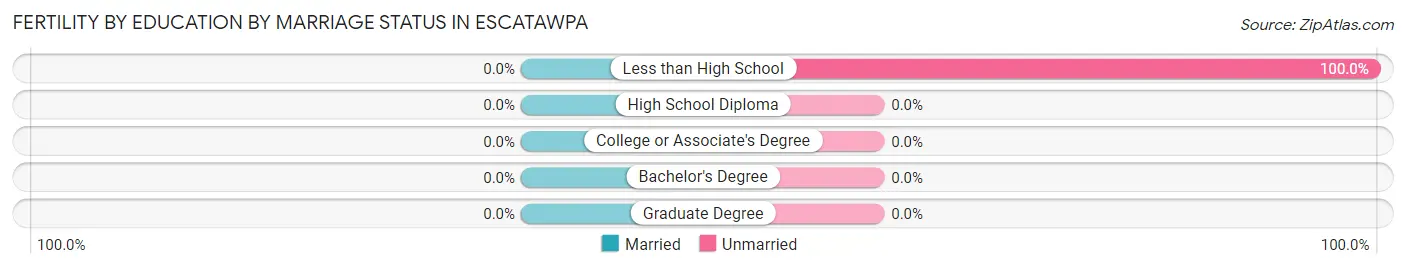
| Educational Attainment | Married | Unmarried |
| Less than High School | 0 (0.0%) | 17 (100.0%) |
| High School Diploma | 0 (0.0%) | 0 (0.0%) |
| College or Associate's Degree | 0 (0.0%) | 0 (0.0%) |
| Bachelor's Degree | 0 (0.0%) | 0 (0.0%) |
| Graduate Degree | 0 (0.0%) | 0 (0.0%) |
| Total | 0 (0.0%) | 17 (100.0%) |
Employment Characteristics in Escatawpa
Employment by Class of Employer in Escatawpa
Among the 862 employed individuals in Escatawpa, private company employees (617 | 71.6%), state government employees (94 | 10.9%), and self-employed (incorporated) (55 | 6.4%) make up the most common classes of employment.
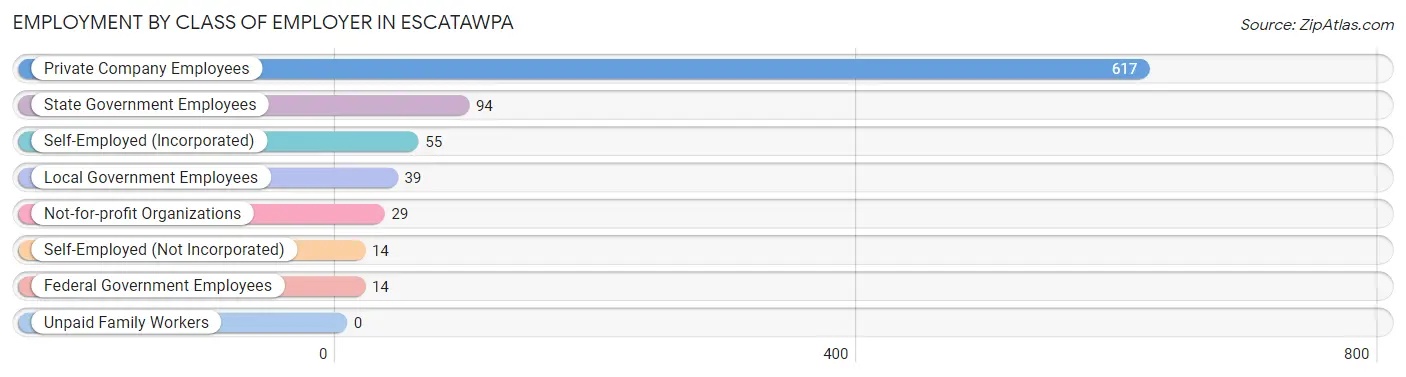
| Employer Class | # Employees | % Employees |
| Private Company Employees | 617 | 71.6% |
| Self-Employed (Incorporated) | 55 | 6.4% |
| Self-Employed (Not Incorporated) | 14 | 1.6% |
| Not-for-profit Organizations | 29 | 3.4% |
| Local Government Employees | 39 | 4.5% |
| State Government Employees | 94 | 10.9% |
| Federal Government Employees | 14 | 1.6% |
| Unpaid Family Workers | 0 | 0.0% |
| Total | 862 | 100.0% |
Employment Status by Age in Escatawpa
According to the labor force statistics for Escatawpa, out of the total population over 16 years of age (2,827), 39.9% or 1,128 individuals are in the labor force, with 15.5% or 175 of them unemployed. The age group with the highest labor force participation rate is 20 to 24 years, with 100.0% or 28 individuals in the labor force. Within the labor force, the 25 to 29 years age range has the highest percentage of unemployed individuals, with 36.1% or 52 of them being unemployed.
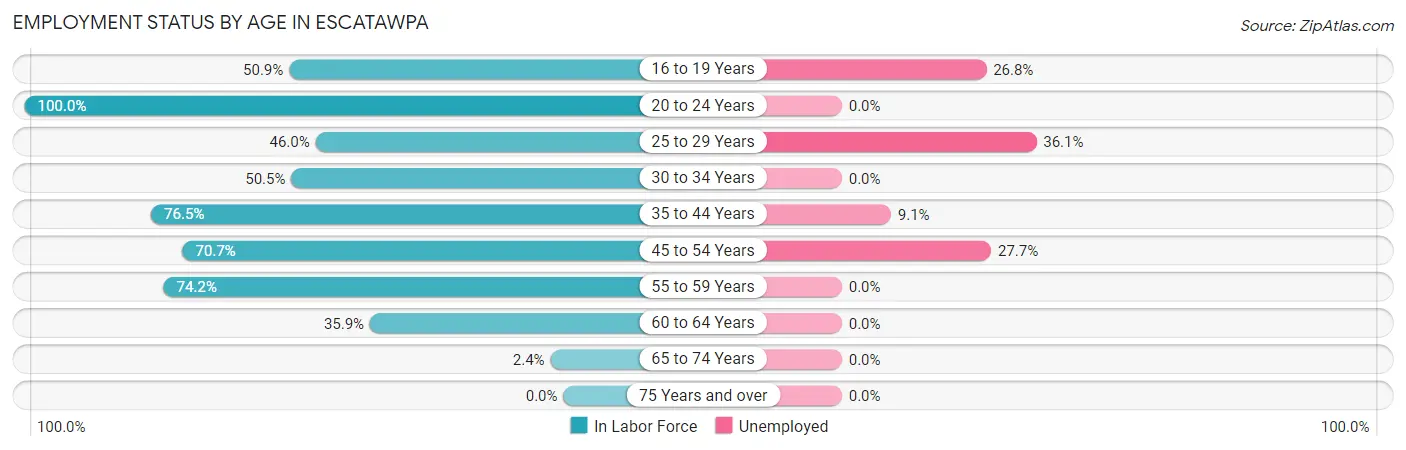
| Age Bracket | In Labor Force | Unemployed |
| 16 to 19 Years | 56 (50.9%) | 15 (26.8%) |
| 20 to 24 Years | 28 (100.0%) | 0 (0.0%) |
| 25 to 29 Years | 144 (46.0%) | 52 (36.1%) |
| 30 to 34 Years | 94 (50.5%) | 0 (0.0%) |
| 35 to 44 Years | 231 (76.5%) | 21 (9.1%) |
| 45 to 54 Years | 314 (70.7%) | 87 (27.7%) |
| 55 to 59 Years | 132 (74.2%) | 0 (0.0%) |
| 60 to 64 Years | 120 (35.9%) | 0 (0.0%) |
| 65 to 74 Years | 8 (2.4%) | 0 (0.0%) |
| 75 Years and over | 0 (0.0%) | 0 (0.0%) |
| Total | 1,128 (39.9%) | 175 (15.5%) |
Employment Status by Educational Attainment in Escatawpa
According to labor force statistics for Escatawpa, 58.9% of individuals (1,035) out of the total population between 25 and 64 years of age (1,757) are in the labor force, with 15.5% or 160 of them being unemployed. The group with the highest labor force participation rate are those with the educational attainment of high school diploma, with 72.3% or 554 individuals in the labor force. Within the labor force, individuals with less than high school education have the highest percentage of unemployment, with 68.8% or 108 of them being unemployed.
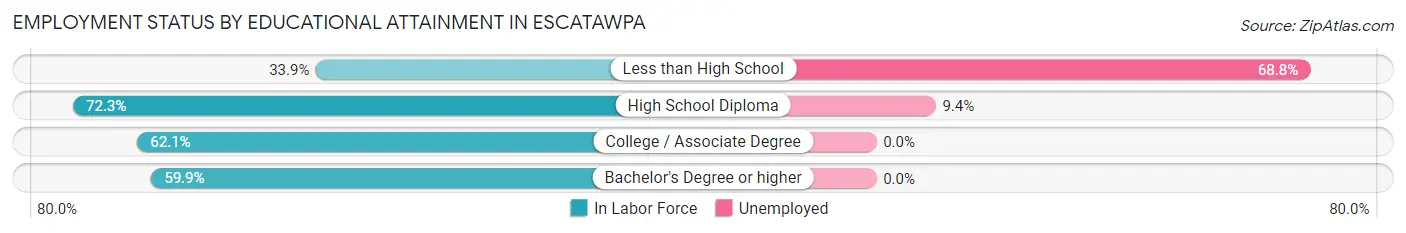
| Educational Attainment | In Labor Force | Unemployed |
| Less than High School | 157 (33.9%) | 319 (68.8%) |
| High School Diploma | 554 (72.3%) | 72 (9.4%) |
| College / Associate Degree | 218 (62.1%) | 0 (0.0%) |
| Bachelor's Degree or higher | 106 (59.9%) | 0 (0.0%) |
| Total | 1,035 (58.9%) | 272 (15.5%) |
Employment Occupations by Sex in Escatawpa
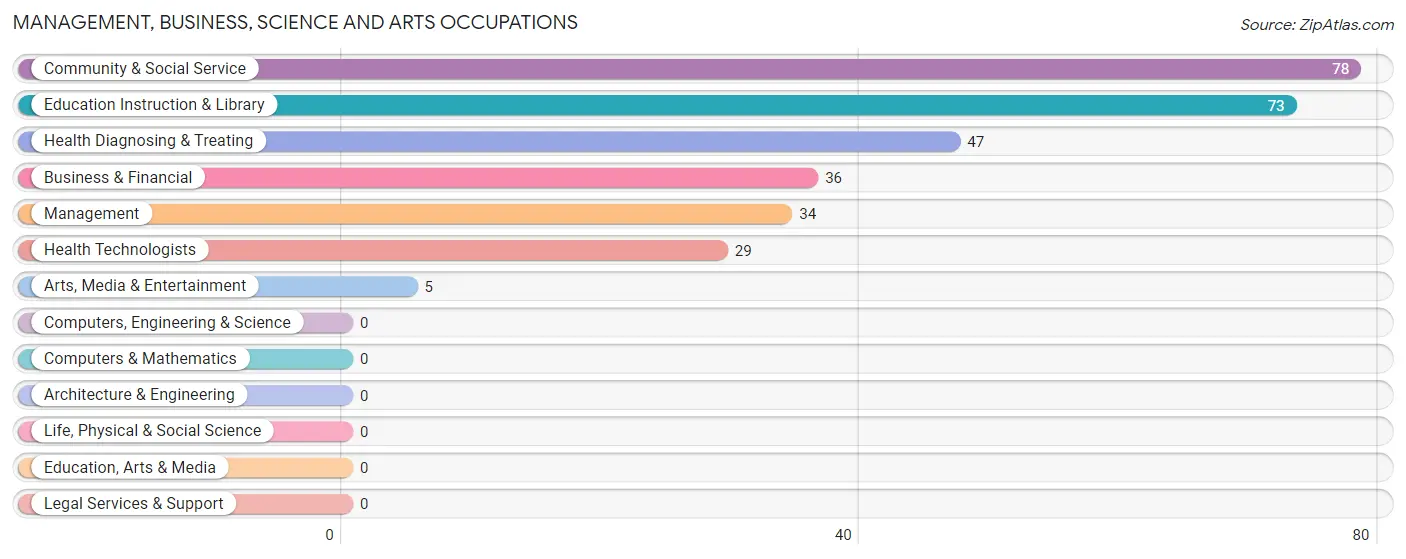
Management, Business, Science and Arts Occupations
The most common Management, Business, Science and Arts occupations in Escatawpa are Community & Social Service (78 | 8.2%), Education Instruction & Library (73 | 7.7%), Health Diagnosing & Treating (47 | 4.9%), Business & Financial (36 | 3.8%), and Management (34 | 3.6%).
Management, Business, Science and Arts Occupations by Sex
Within the Management, Business, Science and Arts occupations in Escatawpa, the most male-oriented occupations are Business & Financial (80.6%), and Management (20.6%), while the most female-oriented occupations are Community & Social Service (100.0%), Education Instruction & Library (100.0%), and Arts, Media & Entertainment (100.0%).
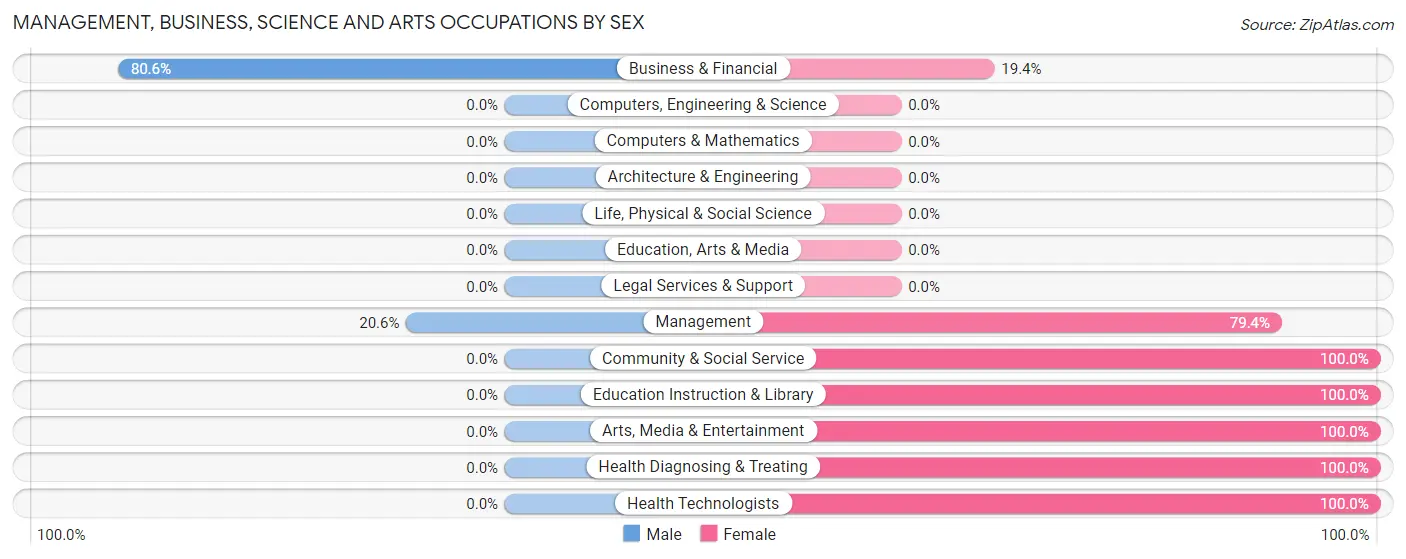
| Occupation | Male | Female |
| Management | 7 (20.6%) | 27 (79.4%) |
| Business & Financial | 29 (80.6%) | 7 (19.4%) |
| Computers, Engineering & Science | 0 (0.0%) | 0 (0.0%) |
| Computers & Mathematics | 0 (0.0%) | 0 (0.0%) |
| Architecture & Engineering | 0 (0.0%) | 0 (0.0%) |
| Life, Physical & Social Science | 0 (0.0%) | 0 (0.0%) |
| Community & Social Service | 0 (0.0%) | 78 (100.0%) |
| Education, Arts & Media | 0 (0.0%) | 0 (0.0%) |
| Legal Services & Support | 0 (0.0%) | 0 (0.0%) |
| Education Instruction & Library | 0 (0.0%) | 73 (100.0%) |
| Arts, Media & Entertainment | 0 (0.0%) | 5 (100.0%) |
| Health Diagnosing & Treating | 0 (0.0%) | 47 (100.0%) |
| Health Technologists | 0 (0.0%) | 29 (100.0%) |
| Total (Category) | 36 (18.5%) | 159 (81.5%) |
| Total (Overall) | 546 (57.4%) | 406 (42.6%) |
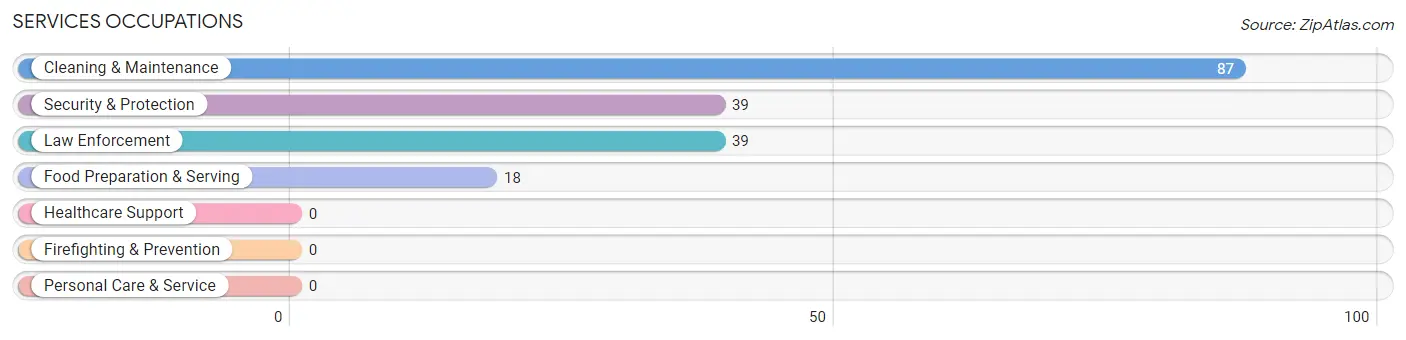
Services Occupations
The most common Services occupations in Escatawpa are Cleaning & Maintenance (87 | 9.1%), Security & Protection (39 | 4.1%), Law Enforcement (39 | 4.1%), and Food Preparation & Serving (18 | 1.9%).
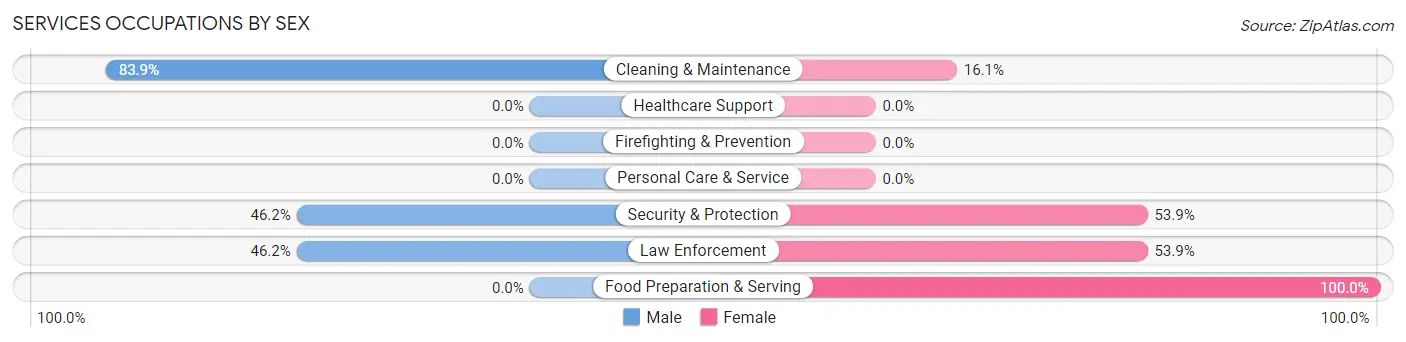
Services Occupations by Sex
Within the Services occupations in Escatawpa, the most male-oriented occupations are Cleaning & Maintenance (83.9%), Security & Protection (46.2%), and Law Enforcement (46.2%), while the most female-oriented occupations are Food Preparation & Serving (100.0%), Security & Protection (53.8%), and Law Enforcement (53.8%).
| Occupation | Male | Female |
| Healthcare Support | 0 (0.0%) | 0 (0.0%) |
| Security & Protection | 18 (46.2%) | 21 (53.8%) |
| Firefighting & Prevention | 0 (0.0%) | 0 (0.0%) |
| Law Enforcement | 18 (46.2%) | 21 (53.8%) |
| Food Preparation & Serving | 0 (0.0%) | 18 (100.0%) |
| Cleaning & Maintenance | 73 (83.9%) | 14 (16.1%) |
| Personal Care & Service | 0 (0.0%) | 0 (0.0%) |
| Total (Category) | 91 (63.2%) | 53 (36.8%) |
| Total (Overall) | 546 (57.4%) | 406 (42.6%) |
Sales and Office Occupations
The most common Sales and Office occupations in Escatawpa are Office & Administration (119 | 12.5%), and Sales & Related (16 | 1.7%).
Sales and Office Occupations by Sex
| Occupation | Male | Female |
| Sales & Related | 7 (43.8%) | 9 (56.2%) |
| Office & Administration | 42 (35.3%) | 77 (64.7%) |
| Total (Category) | 49 (36.3%) | 86 (63.7%) |
| Total (Overall) | 546 (57.4%) | 406 (42.6%) |
Natural Resources, Construction and Maintenance Occupations
The most common Natural Resources, Construction and Maintenance occupations in Escatawpa are Construction & Extraction (220 | 23.1%), and Installation, Maintenance & Repair (58 | 6.1%).
Natural Resources, Construction and Maintenance Occupations by Sex
| Occupation | Male | Female |
| Farming, Fishing & Forestry | 0 (0.0%) | 0 (0.0%) |
| Construction & Extraction | 220 (100.0%) | 0 (0.0%) |
| Installation, Maintenance & Repair | 58 (100.0%) | 0 (0.0%) |
| Total (Category) | 278 (100.0%) | 0 (0.0%) |
| Total (Overall) | 546 (57.4%) | 406 (42.6%) |
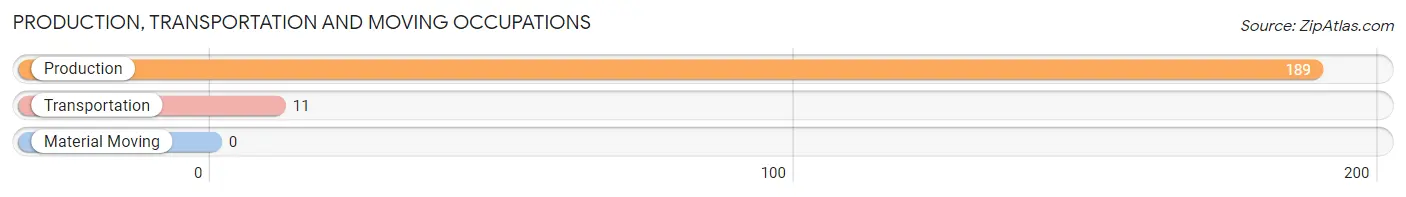
Production, Transportation and Moving Occupations
The most common Production, Transportation and Moving occupations in Escatawpa are Production (189 | 19.9%), and Transportation (11 | 1.2%).
Production, Transportation and Moving Occupations by Sex
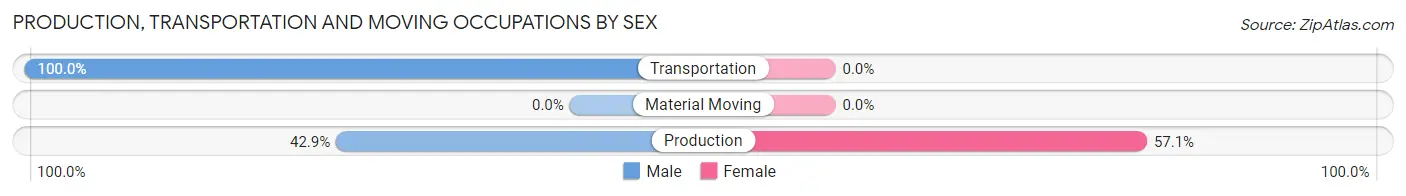
| Occupation | Male | Female |
| Production | 81 (42.9%) | 108 (57.1%) |
| Transportation | 11 (100.0%) | 0 (0.0%) |
| Material Moving | 0 (0.0%) | 0 (0.0%) |
| Total (Category) | 92 (46.0%) | 108 (54.0%) |
| Total (Overall) | 546 (57.4%) | 406 (42.6%) |
Employment Industries by Sex in Escatawpa
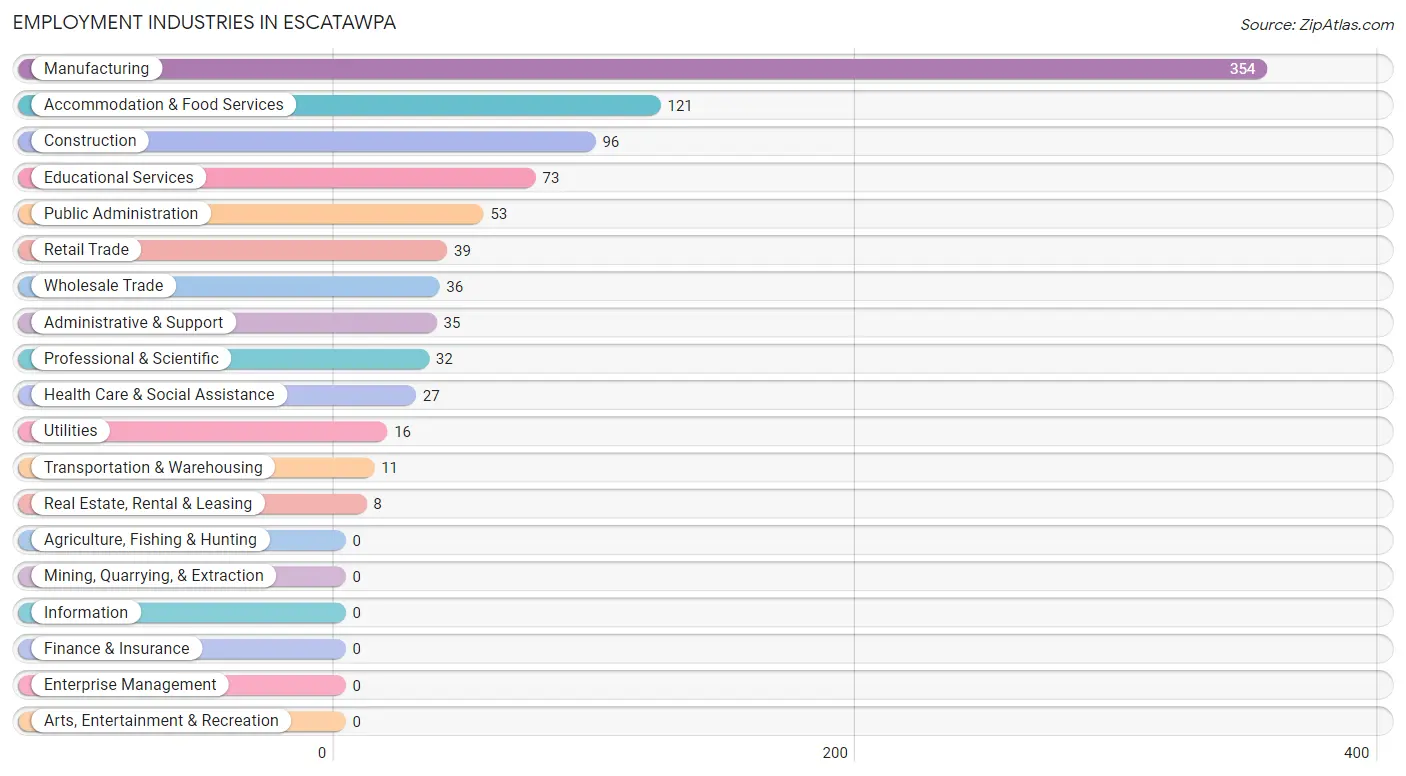
Employment Industries in Escatawpa
The major employment industries in Escatawpa include Manufacturing (354 | 37.2%), Accommodation & Food Services (121 | 12.7%), Construction (96 | 10.1%), Educational Services (73 | 7.7%), and Public Administration (53 | 5.6%).
Employment Industries by Sex in Escatawpa
The Escatawpa industries that see more men than women are Transportation & Warehousing (100.0%), Utilities (100.0%), and Real Estate, Rental & Leasing (100.0%), whereas the industries that tend to have a higher number of women are Professional & Scientific (100.0%), Administrative & Support (100.0%), and Educational Services (100.0%).
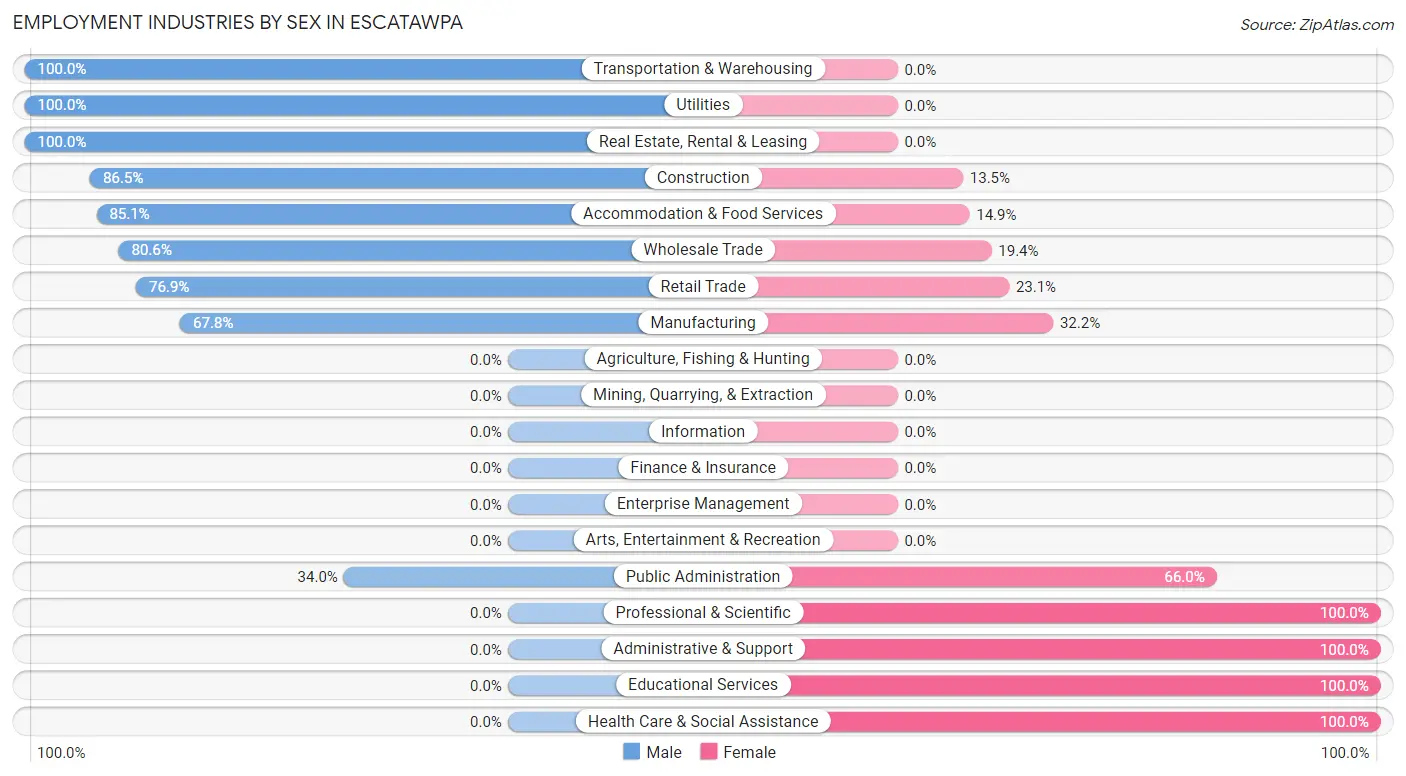
| Industry | Male | Female |
| Agriculture, Fishing & Hunting | 0 (0.0%) | 0 (0.0%) |
| Mining, Quarrying, & Extraction | 0 (0.0%) | 0 (0.0%) |
| Construction | 83 (86.5%) | 13 (13.5%) |
| Manufacturing | 240 (67.8%) | 114 (32.2%) |
| Wholesale Trade | 29 (80.6%) | 7 (19.4%) |
| Retail Trade | 30 (76.9%) | 9 (23.1%) |
| Transportation & Warehousing | 11 (100.0%) | 0 (0.0%) |
| Utilities | 16 (100.0%) | 0 (0.0%) |
| Information | 0 (0.0%) | 0 (0.0%) |
| Finance & Insurance | 0 (0.0%) | 0 (0.0%) |
| Real Estate, Rental & Leasing | 8 (100.0%) | 0 (0.0%) |
| Professional & Scientific | 0 (0.0%) | 32 (100.0%) |
| Enterprise Management | 0 (0.0%) | 0 (0.0%) |
| Administrative & Support | 0 (0.0%) | 35 (100.0%) |
| Educational Services | 0 (0.0%) | 73 (100.0%) |
| Health Care & Social Assistance | 0 (0.0%) | 27 (100.0%) |
| Arts, Entertainment & Recreation | 0 (0.0%) | 0 (0.0%) |
| Accommodation & Food Services | 103 (85.1%) | 18 (14.9%) |
| Public Administration | 18 (34.0%) | 35 (66.0%) |
| Total | 546 (57.4%) | 406 (42.6%) |
Education in Escatawpa
School Enrollment in Escatawpa
The most common levels of schooling among the 316 students in Escatawpa are elementary school (102 | 32.3%), high school (73 | 23.1%), and middle school (61 | 19.3%).
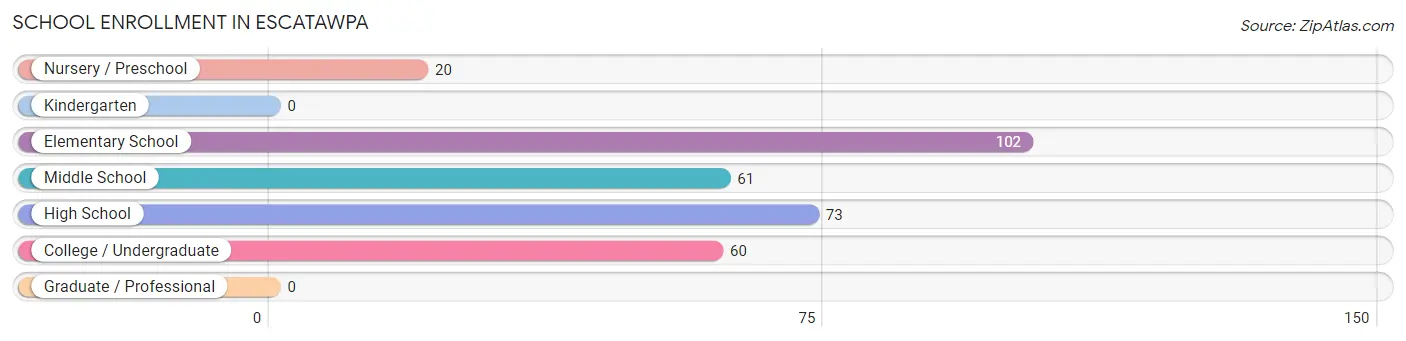
| School Level | # Students | % Students |
| Nursery / Preschool | 20 | 6.3% |
| Kindergarten | 0 | 0.0% |
| Elementary School | 102 | 32.3% |
| Middle School | 61 | 19.3% |
| High School | 73 | 23.1% |
| College / Undergraduate | 60 | 19.0% |
| Graduate / Professional | 0 | 0.0% |
| Total | 316 | 100.0% |
School Enrollment by Age by Funding Source in Escatawpa
Out of a total of 316 students who are enrolled in schools in Escatawpa, 79 (25.0%) attend a private institution, while the remaining 237 (75.0%) are enrolled in public schools. The age group of 3 to 4 year olds has the highest likelihood of being enrolled in private schools, with 20 (100.0% in the age bracket) enrolled. Conversely, the age group of 5 to 9 year old has the lowest likelihood of being enrolled in a private school, with 61 (100.0% in the age bracket) attending a public institution.
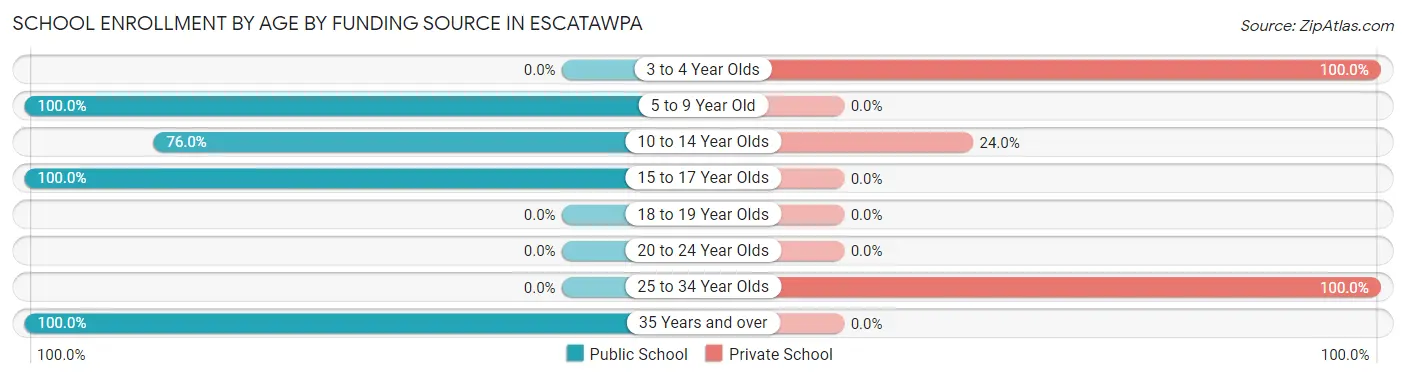
| Age Bracket | Public School | Private School |
| 3 to 4 Year Olds | 0 (0.0%) | 20 (100.0%) |
| 5 to 9 Year Old | 61 (100.0%) | 0 (0.0%) |
| 10 to 14 Year Olds | 95 (76.0%) | 30 (24.0%) |
| 15 to 17 Year Olds | 50 (100.0%) | 0 (0.0%) |
| 18 to 19 Year Olds | 0 (0.0%) | 0 (0.0%) |
| 20 to 24 Year Olds | 0 (0.0%) | 0 (0.0%) |
| 25 to 34 Year Olds | 0 (0.0%) | 29 (100.0%) |
| 35 Years and over | 31 (100.0%) | 0 (0.0%) |
| Total | 237 (75.0%) | 79 (25.0%) |
Educational Attainment by Field of Study in Escatawpa
Education (76 | 19.6%), business (75 | 19.4%), computers & mathematics (60 | 15.5%), communications (60 | 15.5%), and science & technology (56 | 14.5%) are the most common fields of study among 387 individuals in Escatawpa who have obtained a bachelor's degree or higher.
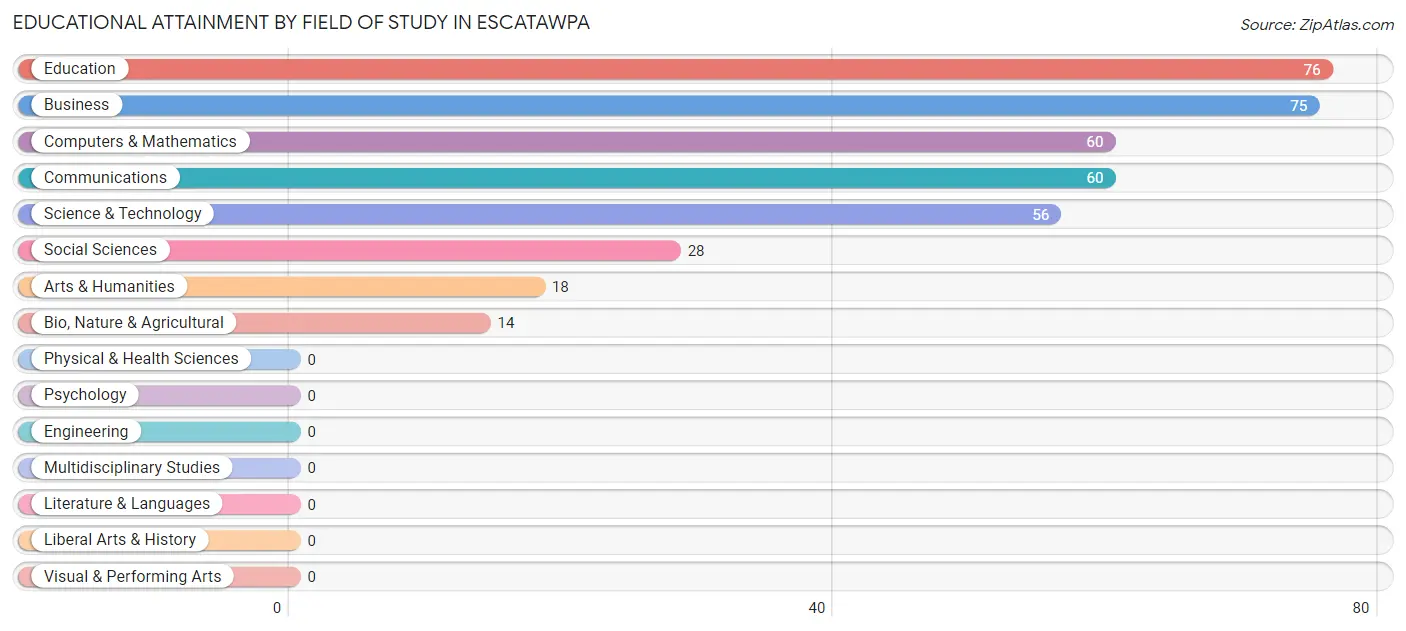
| Field of Study | # Graduates | % Graduates |
| Computers & Mathematics | 60 | 15.5% |
| Bio, Nature & Agricultural | 14 | 3.6% |
| Physical & Health Sciences | 0 | 0.0% |
| Psychology | 0 | 0.0% |
| Social Sciences | 28 | 7.2% |
| Engineering | 0 | 0.0% |
| Multidisciplinary Studies | 0 | 0.0% |
| Science & Technology | 56 | 14.5% |
| Business | 75 | 19.4% |
| Education | 76 | 19.6% |
| Literature & Languages | 0 | 0.0% |
| Liberal Arts & History | 0 | 0.0% |
| Visual & Performing Arts | 0 | 0.0% |
| Communications | 60 | 15.5% |
| Arts & Humanities | 18 | 4.6% |
| Total | 387 | 100.0% |
Transportation & Commute in Escatawpa
Vehicle Availability by Sex in Escatawpa
The most prevalent vehicle ownership categories in Escatawpa are males with 3 vehicles (212, accounting for 43.7%) and females with 3 vehicles (137, making up 56.2%).
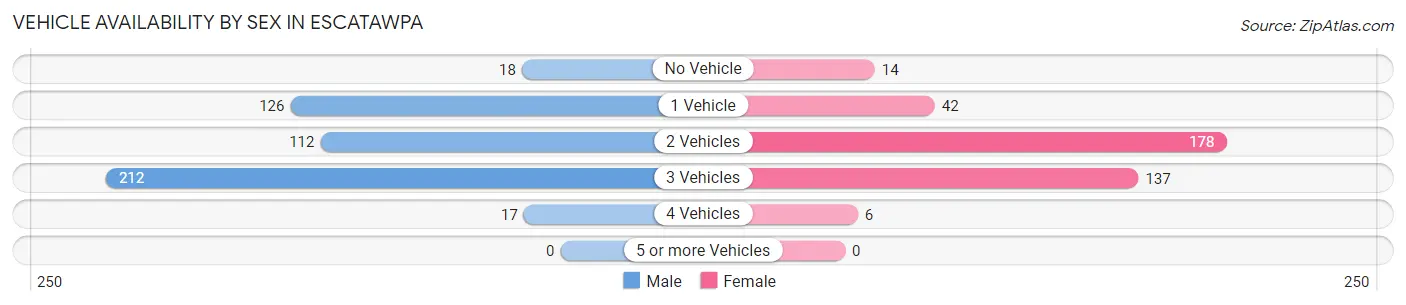
| Vehicles Available | Male | Female |
| No Vehicle | 18 (3.7%) | 14 (3.7%) |
| 1 Vehicle | 126 (26.0%) | 42 (11.1%) |
| 2 Vehicles | 112 (23.1%) | 178 (47.2%) |
| 3 Vehicles | 212 (43.7%) | 137 (36.3%) |
| 4 Vehicles | 17 (3.5%) | 6 (1.6%) |
| 5 or more Vehicles | 0 (0.0%) | 0 (0.0%) |
| Total | 485 (100.0%) | 377 (100.0%) |
Commute Time in Escatawpa
The most frequently occuring commute durations in Escatawpa are 15 to 19 minutes (301 commuters, 34.9%), 30 to 34 minutes (219 commuters, 25.4%), and 10 to 14 minutes (104 commuters, 12.1%).
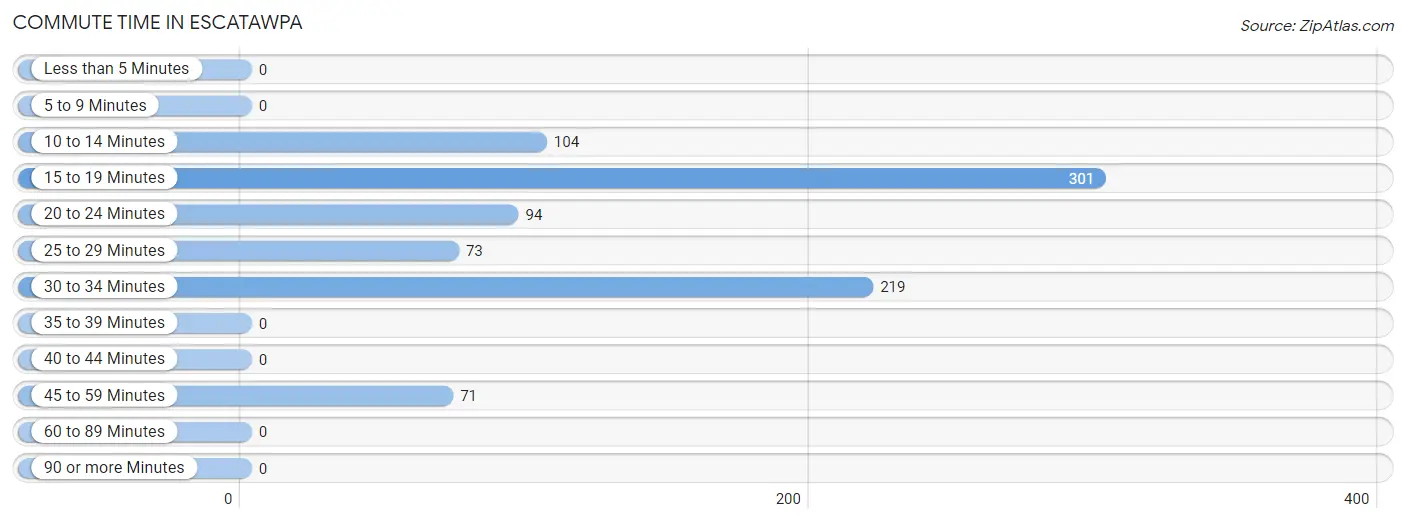
| Commute Time | # Commuters | % Commuters |
| Less than 5 Minutes | 0 | 0.0% |
| 5 to 9 Minutes | 0 | 0.0% |
| 10 to 14 Minutes | 104 | 12.1% |
| 15 to 19 Minutes | 301 | 34.9% |
| 20 to 24 Minutes | 94 | 10.9% |
| 25 to 29 Minutes | 73 | 8.5% |
| 30 to 34 Minutes | 219 | 25.4% |
| 35 to 39 Minutes | 0 | 0.0% |
| 40 to 44 Minutes | 0 | 0.0% |
| 45 to 59 Minutes | 71 | 8.2% |
| 60 to 89 Minutes | 0 | 0.0% |
| 90 or more Minutes | 0 | 0.0% |
Commute Time by Sex in Escatawpa
The most common commute times in Escatawpa are 30 to 34 minutes (148 commuters, 30.5%) for males and 15 to 19 minutes (230 commuters, 61.0%) for females.
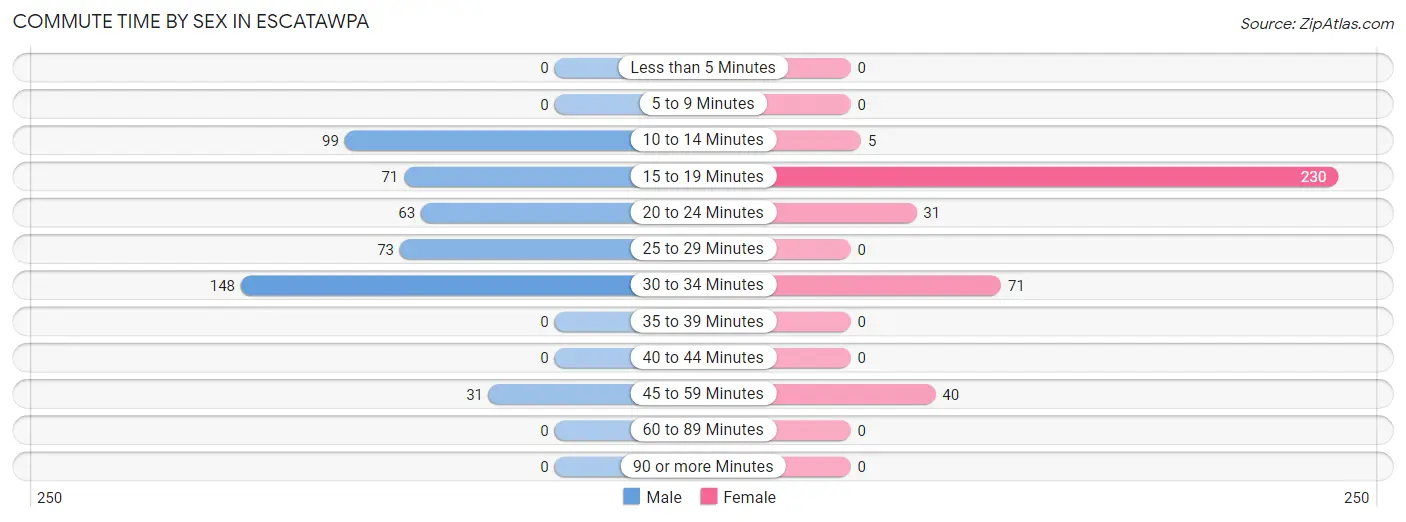
| Commute Time | Male | Female |
| Less than 5 Minutes | 0 (0.0%) | 0 (0.0%) |
| 5 to 9 Minutes | 0 (0.0%) | 0 (0.0%) |
| 10 to 14 Minutes | 99 (20.4%) | 5 (1.3%) |
| 15 to 19 Minutes | 71 (14.6%) | 230 (61.0%) |
| 20 to 24 Minutes | 63 (13.0%) | 31 (8.2%) |
| 25 to 29 Minutes | 73 (15.0%) | 0 (0.0%) |
| 30 to 34 Minutes | 148 (30.5%) | 71 (18.8%) |
| 35 to 39 Minutes | 0 (0.0%) | 0 (0.0%) |
| 40 to 44 Minutes | 0 (0.0%) | 0 (0.0%) |
| 45 to 59 Minutes | 31 (6.4%) | 40 (10.6%) |
| 60 to 89 Minutes | 0 (0.0%) | 0 (0.0%) |
| 90 or more Minutes | 0 (0.0%) | 0 (0.0%) |
Time of Departure to Work by Sex in Escatawpa
The most frequent times of departure to work in Escatawpa are 12:00 AM to 4:59 AM (145, 29.9%) for males and 6:30 AM to 6:59 AM (125, 33.2%) for females.
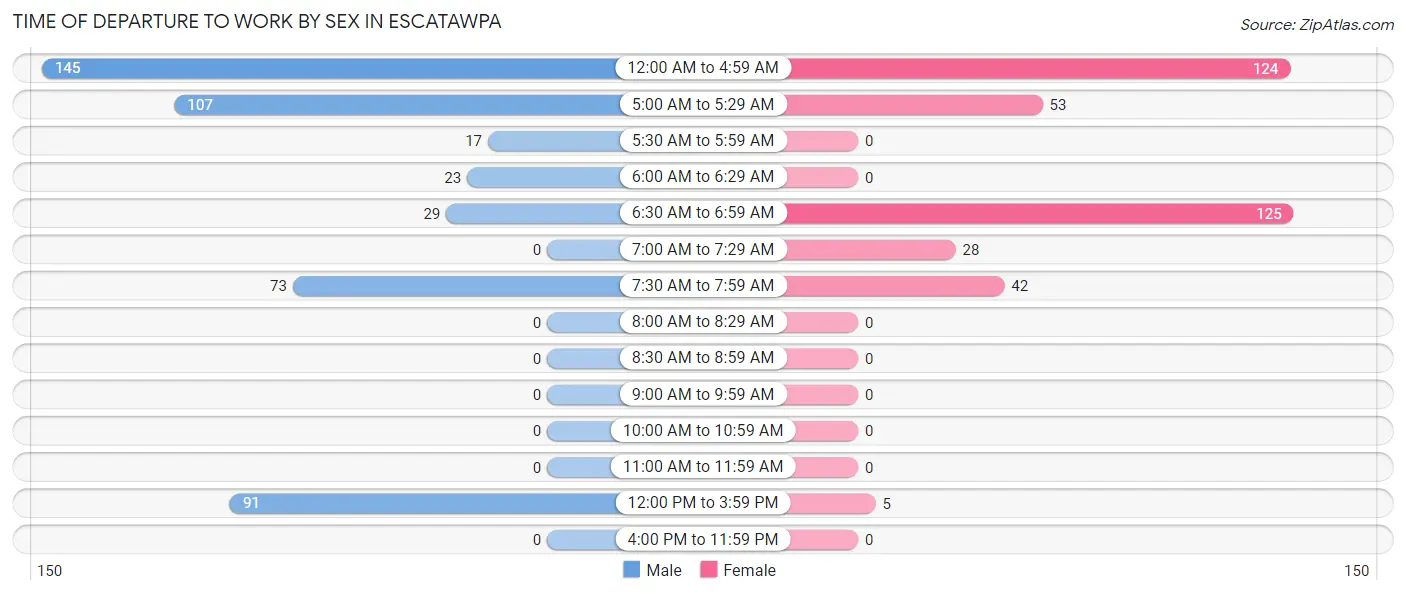
| Time of Departure | Male | Female |
| 12:00 AM to 4:59 AM | 145 (29.9%) | 124 (32.9%) |
| 5:00 AM to 5:29 AM | 107 (22.1%) | 53 (14.1%) |
| 5:30 AM to 5:59 AM | 17 (3.5%) | 0 (0.0%) |
| 6:00 AM to 6:29 AM | 23 (4.7%) | 0 (0.0%) |
| 6:30 AM to 6:59 AM | 29 (6.0%) | 125 (33.2%) |
| 7:00 AM to 7:29 AM | 0 (0.0%) | 28 (7.4%) |
| 7:30 AM to 7:59 AM | 73 (15.0%) | 42 (11.1%) |
| 8:00 AM to 8:29 AM | 0 (0.0%) | 0 (0.0%) |
| 8:30 AM to 8:59 AM | 0 (0.0%) | 0 (0.0%) |
| 9:00 AM to 9:59 AM | 0 (0.0%) | 0 (0.0%) |
| 10:00 AM to 10:59 AM | 0 (0.0%) | 0 (0.0%) |
| 11:00 AM to 11:59 AM | 0 (0.0%) | 0 (0.0%) |
| 12:00 PM to 3:59 PM | 91 (18.8%) | 5 (1.3%) |
| 4:00 PM to 11:59 PM | 0 (0.0%) | 0 (0.0%) |
| Total | 485 (100.0%) | 377 (100.0%) |
Housing Occupancy in Escatawpa
Occupancy by Ownership in Escatawpa
Of the total 1,436 dwellings in Escatawpa, owner-occupied units account for 1,123 (78.2%), while renter-occupied units make up 313 (21.8%).
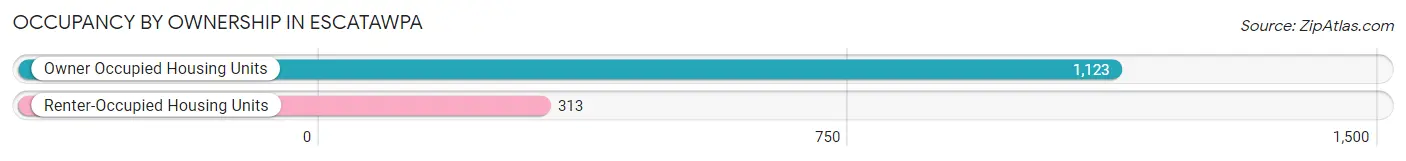
| Occupancy | # Housing Units | % Housing Units |
| Owner Occupied Housing Units | 1,123 | 78.2% |
| Renter-Occupied Housing Units | 313 | 21.8% |
| Total Occupied Housing Units | 1,436 | 100.0% |
Occupancy by Household Size in Escatawpa
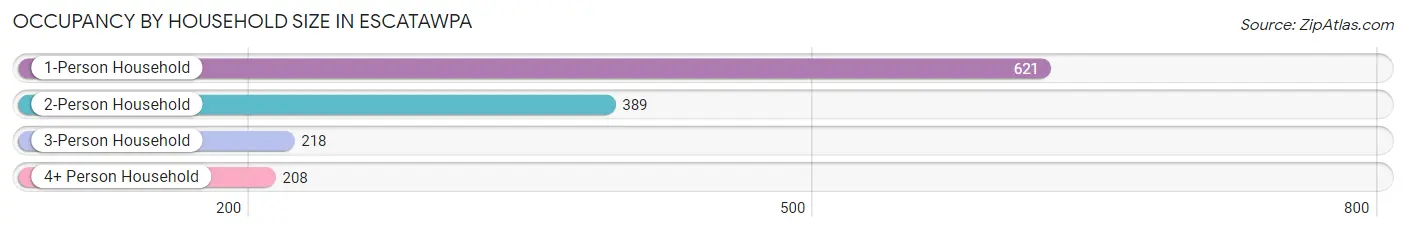
| Household Size | # Housing Units | % Housing Units |
| 1-Person Household | 621 | 43.2% |
| 2-Person Household | 389 | 27.1% |
| 3-Person Household | 218 | 15.2% |
| 4+ Person Household | 208 | 14.5% |
| Total Housing Units | 1,436 | 100.0% |
Occupancy by Ownership by Household Size in Escatawpa
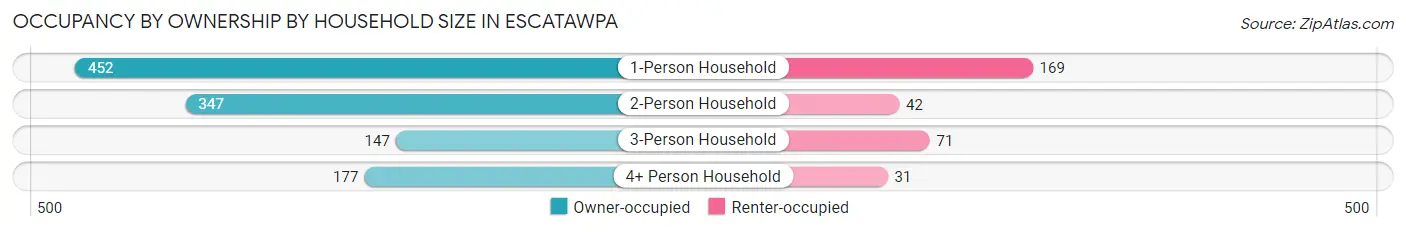
| Household Size | Owner-occupied | Renter-occupied |
| 1-Person Household | 452 (72.8%) | 169 (27.2%) |
| 2-Person Household | 347 (89.2%) | 42 (10.8%) |
| 3-Person Household | 147 (67.4%) | 71 (32.6%) |
| 4+ Person Household | 177 (85.1%) | 31 (14.9%) |
| Total Housing Units | 1,123 (78.2%) | 313 (21.8%) |
Occupancy by Educational Attainment in Escatawpa
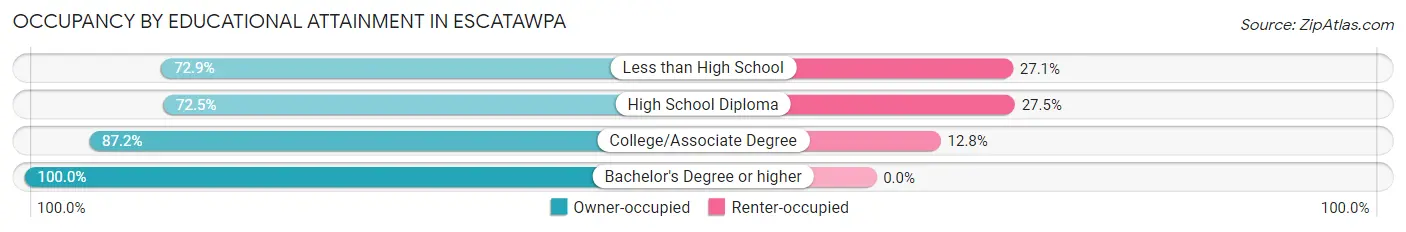
| Household Size | Owner-occupied | Renter-occupied |
| Less than High School | 234 (72.9%) | 87 (27.1%) |
| High School Diploma | 478 (72.5%) | 181 (27.5%) |
| College/Associate Degree | 307 (87.2%) | 45 (12.8%) |
| Bachelor's Degree or higher | 104 (100.0%) | 0 (0.0%) |
Occupancy by Age of Householder in Escatawpa
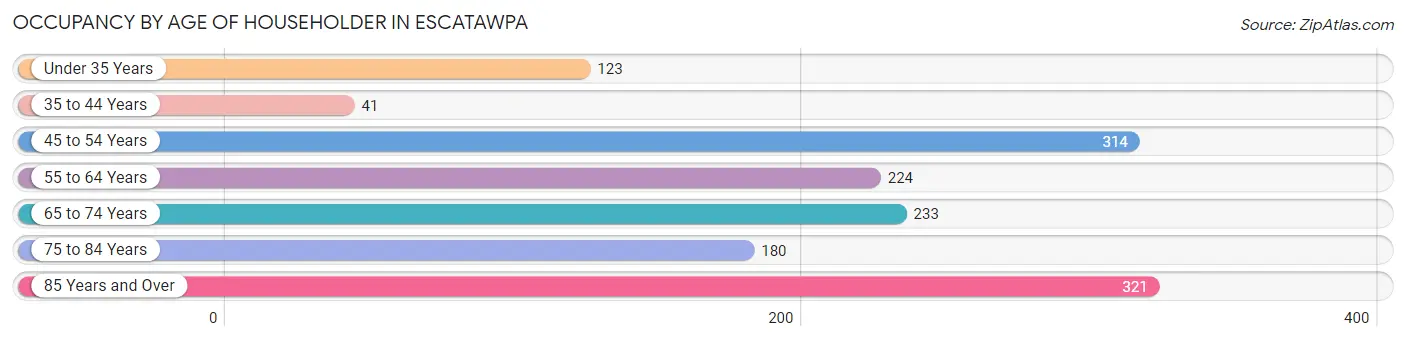
| Age Bracket | # Households | % Households |
| Under 35 Years | 123 | 8.6% |
| 35 to 44 Years | 41 | 2.9% |
| 45 to 54 Years | 314 | 21.9% |
| 55 to 64 Years | 224 | 15.6% |
| 65 to 74 Years | 233 | 16.2% |
| 75 to 84 Years | 180 | 12.5% |
| 85 Years and Over | 321 | 22.4% |
| Total | 1,436 | 100.0% |
Housing Finances in Escatawpa
Median Income by Occupancy in Escatawpa
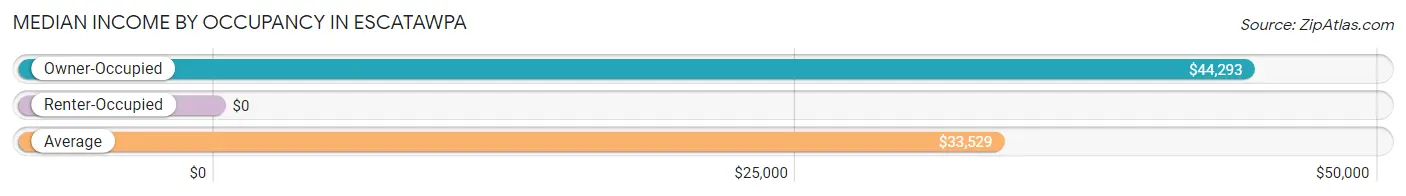
| Occupancy Type | # Households | Median Income |
| Owner-Occupied | 1,123 (78.2%) | $44,293 |
| Renter-Occupied | 313 (21.8%) | $0 |
| Average | 1,436 (100.0%) | $33,529 |
Occupancy by Householder Income Bracket in Escatawpa
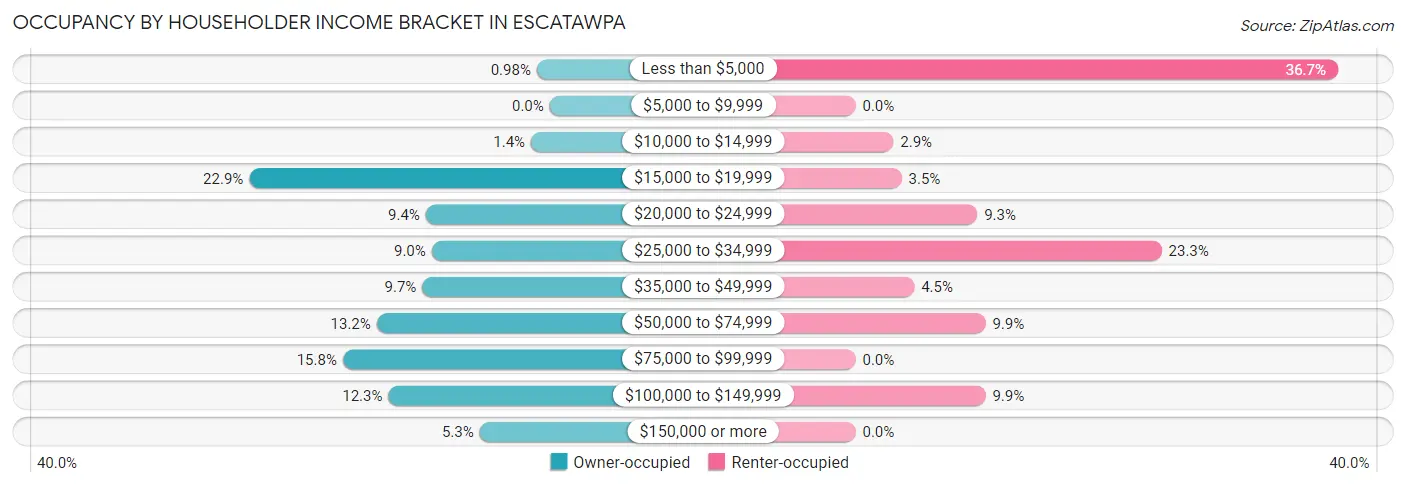
| Income Bracket | Owner-occupied | Renter-occupied |
| Less than $5,000 | 11 (1.0%) | 115 (36.7%) |
| $5,000 to $9,999 | 0 (0.0%) | 0 (0.0%) |
| $10,000 to $14,999 | 16 (1.4%) | 9 (2.9%) |
| $15,000 to $19,999 | 257 (22.9%) | 11 (3.5%) |
| $20,000 to $24,999 | 106 (9.4%) | 29 (9.3%) |
| $25,000 to $34,999 | 101 (9.0%) | 73 (23.3%) |
| $35,000 to $49,999 | 109 (9.7%) | 14 (4.5%) |
| $50,000 to $74,999 | 148 (13.2%) | 31 (9.9%) |
| $75,000 to $99,999 | 177 (15.8%) | 0 (0.0%) |
| $100,000 to $149,999 | 138 (12.3%) | 31 (9.9%) |
| $150,000 or more | 60 (5.3%) | 0 (0.0%) |
| Total | 1,123 (100.0%) | 313 (100.0%) |
Monthly Housing Cost Tiers in Escatawpa
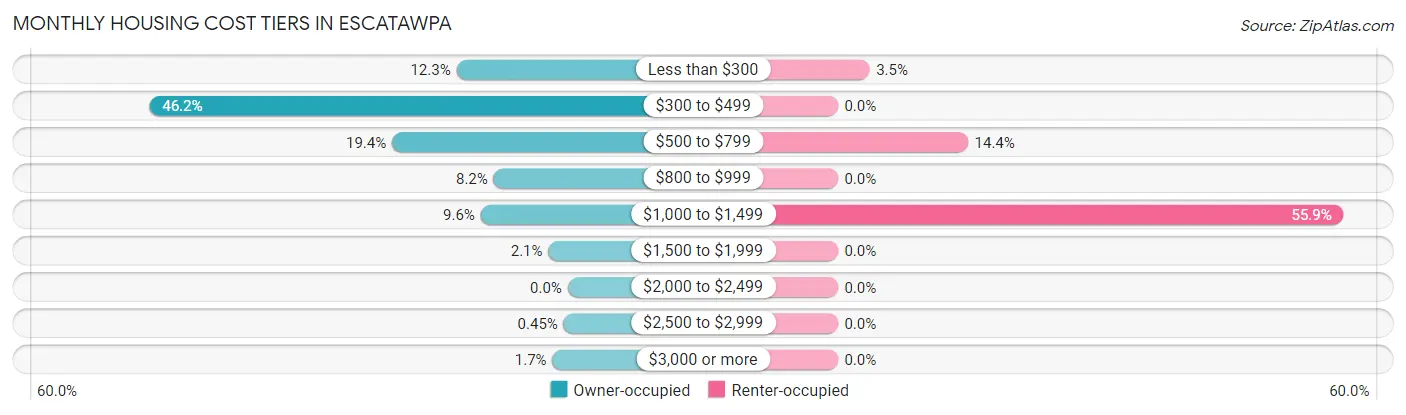
| Monthly Cost | Owner-occupied | Renter-occupied |
| Less than $300 | 138 (12.3%) | 11 (3.5%) |
| $300 to $499 | 519 (46.2%) | 0 (0.0%) |
| $500 to $799 | 218 (19.4%) | 45 (14.4%) |
| $800 to $999 | 92 (8.2%) | 0 (0.0%) |
| $1,000 to $1,499 | 108 (9.6%) | 175 (55.9%) |
| $1,500 to $1,999 | 24 (2.1%) | 0 (0.0%) |
| $2,000 to $2,499 | 0 (0.0%) | 0 (0.0%) |
| $2,500 to $2,999 | 5 (0.4%) | 0 (0.0%) |
| $3,000 or more | 19 (1.7%) | 0 (0.0%) |
| Total | 1,123 (100.0%) | 313 (100.0%) |
Physical Housing Characteristics in Escatawpa
Housing Structures in Escatawpa
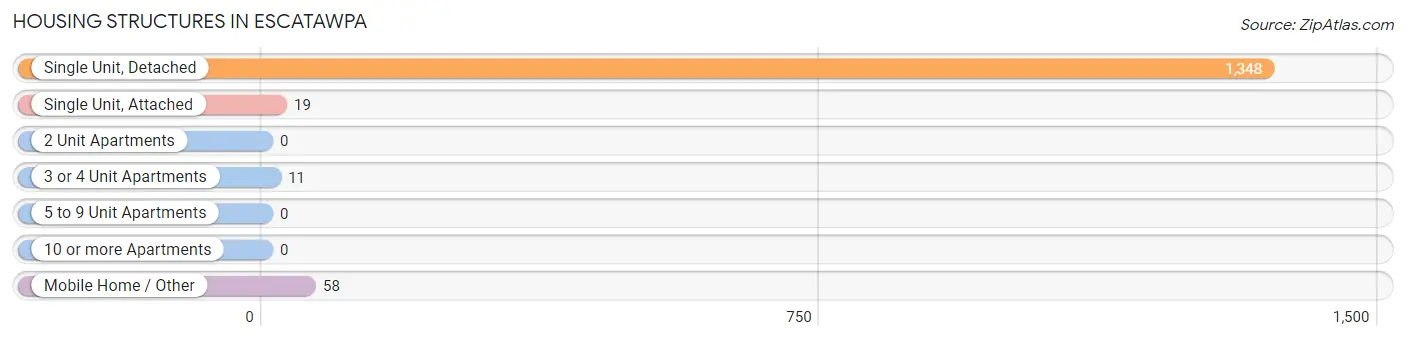
| Structure Type | # Housing Units | % Housing Units |
| Single Unit, Detached | 1,348 | 93.9% |
| Single Unit, Attached | 19 | 1.3% |
| 2 Unit Apartments | 0 | 0.0% |
| 3 or 4 Unit Apartments | 11 | 0.8% |
| 5 to 9 Unit Apartments | 0 | 0.0% |
| 10 or more Apartments | 0 | 0.0% |
| Mobile Home / Other | 58 | 4.0% |
| Total | 1,436 | 100.0% |
Housing Structures by Occupancy in Escatawpa
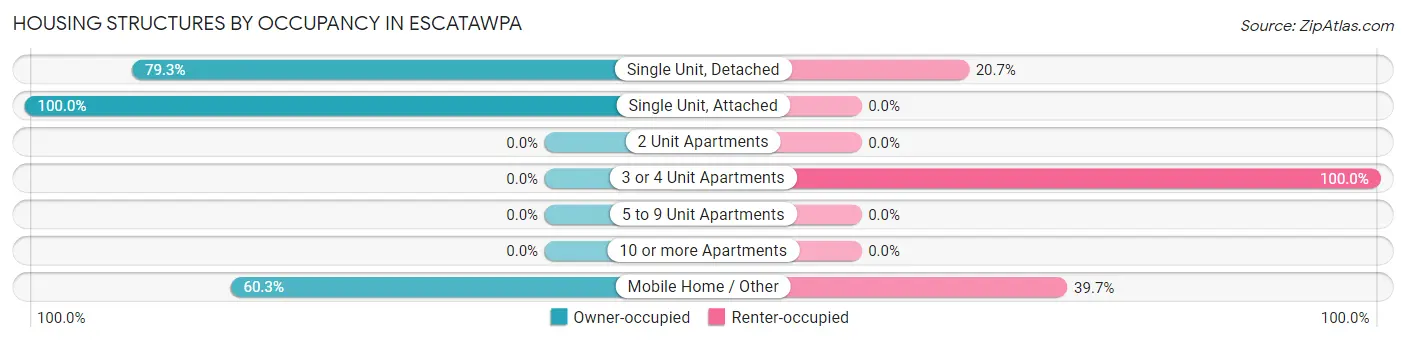
| Structure Type | Owner-occupied | Renter-occupied |
| Single Unit, Detached | 1,069 (79.3%) | 279 (20.7%) |
| Single Unit, Attached | 19 (100.0%) | 0 (0.0%) |
| 2 Unit Apartments | 0 (0.0%) | 0 (0.0%) |
| 3 or 4 Unit Apartments | 0 (0.0%) | 11 (100.0%) |
| 5 to 9 Unit Apartments | 0 (0.0%) | 0 (0.0%) |
| 10 or more Apartments | 0 (0.0%) | 0 (0.0%) |
| Mobile Home / Other | 35 (60.3%) | 23 (39.7%) |
| Total | 1,123 (78.2%) | 313 (21.8%) |
Housing Structures by Number of Rooms in Escatawpa
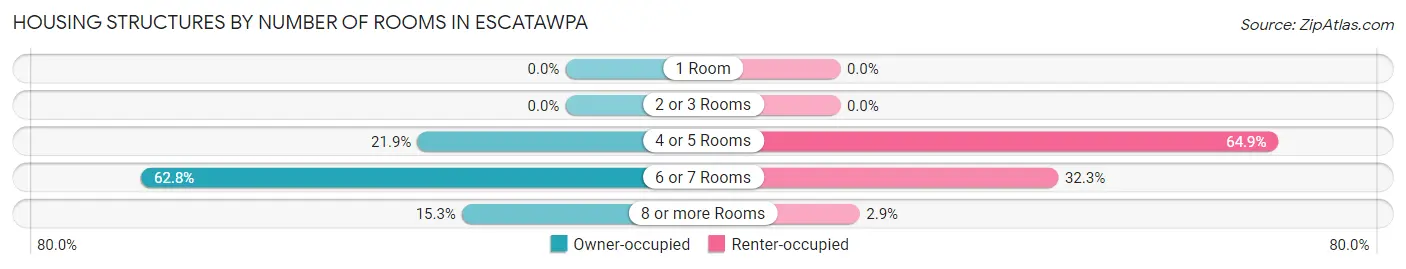
| Number of Rooms | Owner-occupied | Renter-occupied |
| 1 Room | 0 (0.0%) | 0 (0.0%) |
| 2 or 3 Rooms | 0 (0.0%) | 0 (0.0%) |
| 4 or 5 Rooms | 246 (21.9%) | 203 (64.9%) |
| 6 or 7 Rooms | 705 (62.8%) | 101 (32.3%) |
| 8 or more Rooms | 172 (15.3%) | 9 (2.9%) |
| Total | 1,123 (100.0%) | 313 (100.0%) |
Housing Structure by Heating Type in Escatawpa
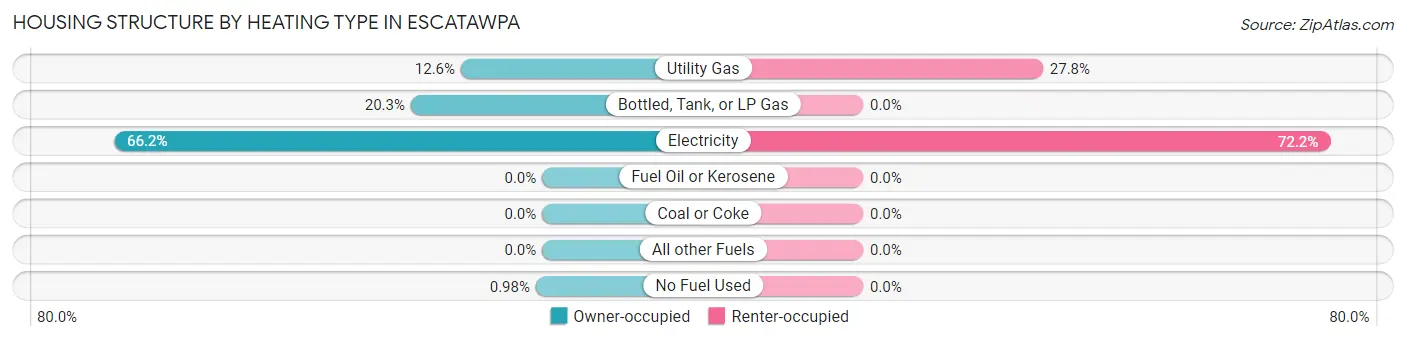
| Heating Type | Owner-occupied | Renter-occupied |
| Utility Gas | 141 (12.6%) | 87 (27.8%) |
| Bottled, Tank, or LP Gas | 228 (20.3%) | 0 (0.0%) |
| Electricity | 743 (66.2%) | 226 (72.2%) |
| Fuel Oil or Kerosene | 0 (0.0%) | 0 (0.0%) |
| Coal or Coke | 0 (0.0%) | 0 (0.0%) |
| All other Fuels | 0 (0.0%) | 0 (0.0%) |
| No Fuel Used | 11 (1.0%) | 0 (0.0%) |
| Total | 1,123 (100.0%) | 313 (100.0%) |
Household Vehicle Usage in Escatawpa
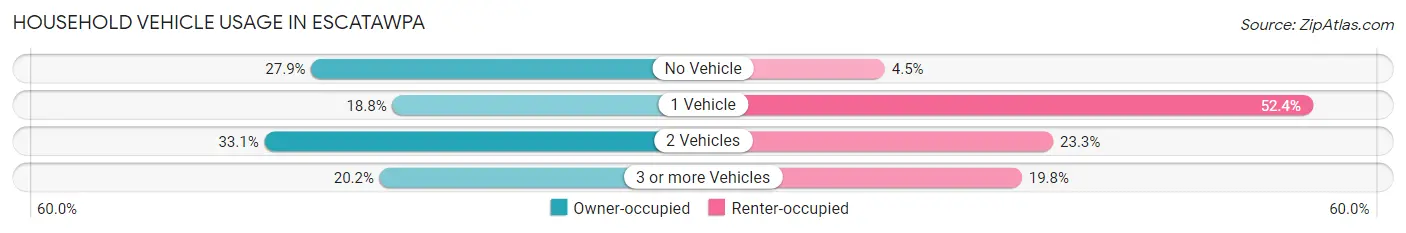
| Vehicles per Household | Owner-occupied | Renter-occupied |
| No Vehicle | 313 (27.9%) | 14 (4.5%) |
| 1 Vehicle | 211 (18.8%) | 164 (52.4%) |
| 2 Vehicles | 372 (33.1%) | 73 (23.3%) |
| 3 or more Vehicles | 227 (20.2%) | 62 (19.8%) |
| Total | 1,123 (100.0%) | 313 (100.0%) |
Real Estate & Mortgages in Escatawpa
Real Estate and Mortgage Overview in Escatawpa
| Characteristic | Without Mortgage | With Mortgage |
| Housing Units | 809 | 314 |
| Median Property Value | $84,600 | $77,200 |
| Median Household Income | - | - |
| Monthly Housing Costs | $342 | $19 |
| Real Estate Taxes | $433 | $43 |
Property Value by Mortgage Status in Escatawpa
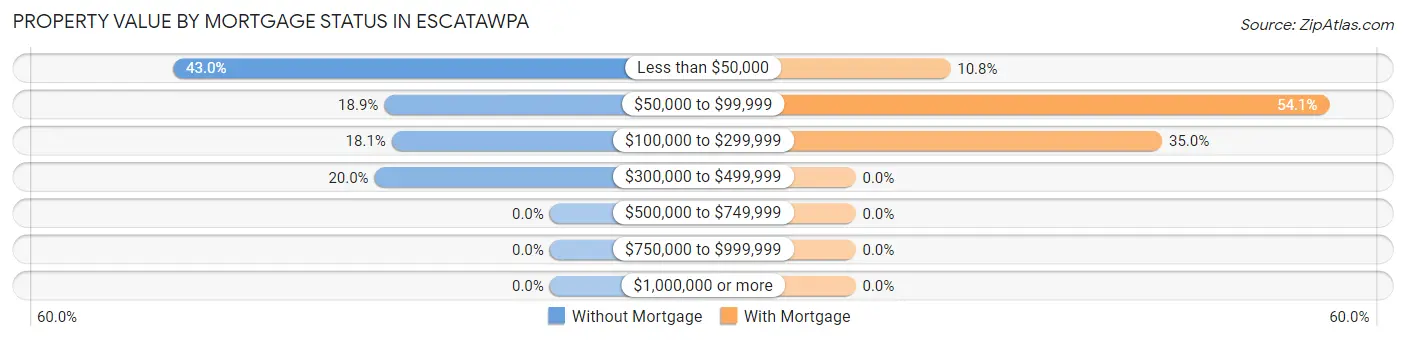
| Property Value | Without Mortgage | With Mortgage |
| Less than $50,000 | 348 (43.0%) | 34 (10.8%) |
| $50,000 to $99,999 | 153 (18.9%) | 170 (54.1%) |
| $100,000 to $299,999 | 146 (18.0%) | 110 (35.0%) |
| $300,000 to $499,999 | 162 (20.0%) | 0 (0.0%) |
| $500,000 to $749,999 | 0 (0.0%) | 0 (0.0%) |
| $750,000 to $999,999 | 0 (0.0%) | 0 (0.0%) |
| $1,000,000 or more | 0 (0.0%) | 0 (0.0%) |
| Total | 809 (100.0%) | 314 (100.0%) |
Household Income by Mortgage Status in Escatawpa
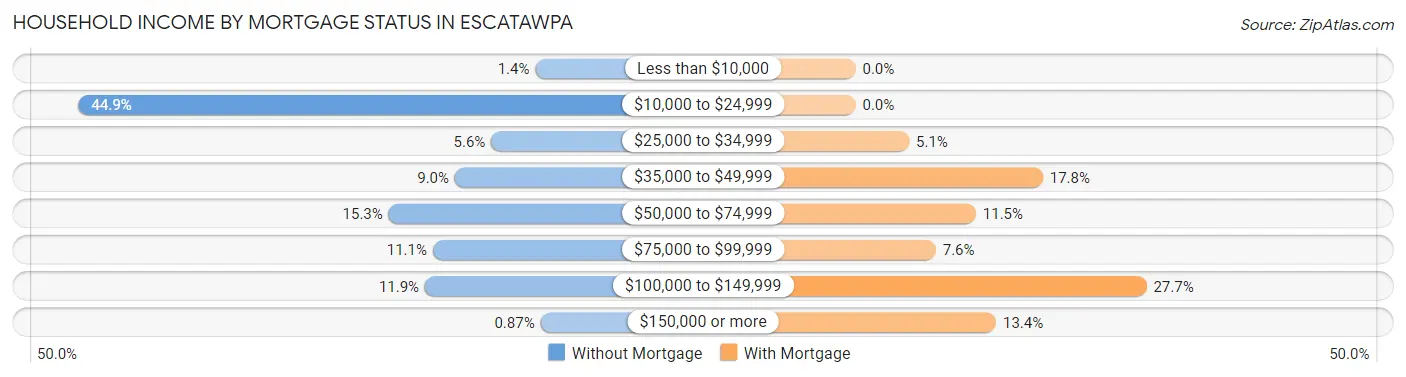
| Household Income | Without Mortgage | With Mortgage |
| Less than $10,000 | 11 (1.4%) | 0 (0.0%) |
| $10,000 to $24,999 | 363 (44.9%) | 0 (0.0%) |
| $25,000 to $34,999 | 45 (5.6%) | 16 (5.1%) |
| $35,000 to $49,999 | 73 (9.0%) | 56 (17.8%) |
| $50,000 to $74,999 | 124 (15.3%) | 36 (11.5%) |
| $75,000 to $99,999 | 90 (11.1%) | 24 (7.6%) |
| $100,000 to $149,999 | 96 (11.9%) | 87 (27.7%) |
| $150,000 or more | 7 (0.9%) | 42 (13.4%) |
| Total | 809 (100.0%) | 314 (100.0%) |
Property Value to Household Income Ratio in Escatawpa

| Value-to-Income Ratio | Without Mortgage | With Mortgage |
| Less than 2.0x | 478 (59.1%) | 78,261 (24,923.9%) |
| 2.0x to 2.9x | 107 (13.2%) | 274 (87.3%) |
| 3.0x to 3.9x | 121 (15.0%) | 5 (1.6%) |
| 4.0x or more | 92 (11.4%) | 0 (0.0%) |
| Total | 809 (100.0%) | 314 (100.0%) |
Real Estate Taxes by Mortgage Status in Escatawpa
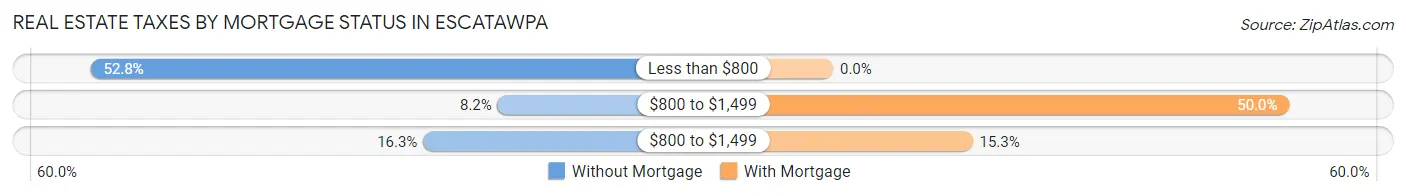
| Property Taxes | Without Mortgage | With Mortgage |
| Less than $800 | 427 (52.8%) | 0 (0.0%) |
| $800 to $1,499 | 66 (8.2%) | 157 (50.0%) |
| $800 to $1,499 | 132 (16.3%) | 48 (15.3%) |
| Total | 809 (100.0%) | 314 (100.0%) |
Health & Disability in Escatawpa
Health Insurance Coverage by Age in Escatawpa
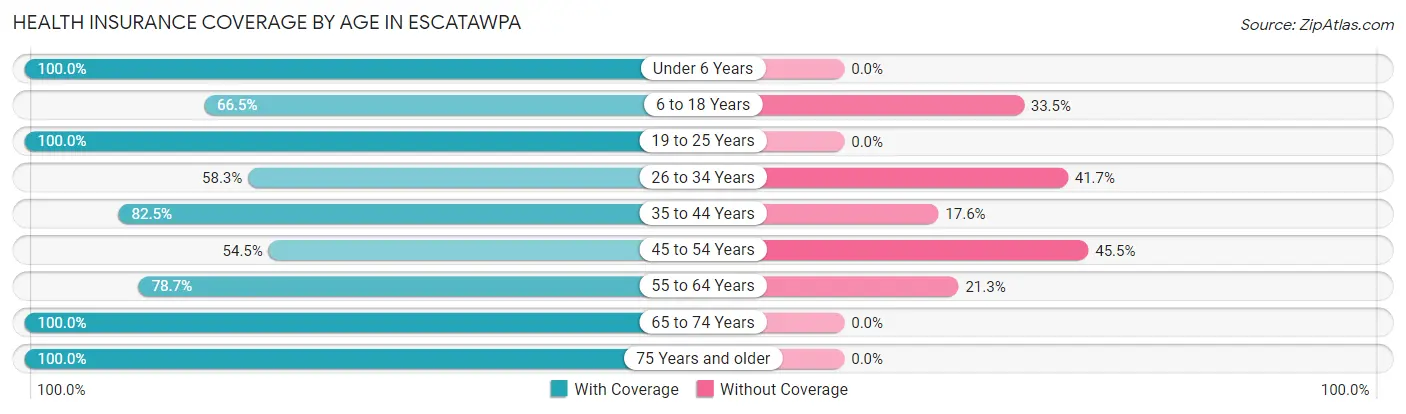
| Age Bracket | With Coverage | Without Coverage |
| Under 6 Years | 218 (100.0%) | 0 (0.0%) |
| 6 to 18 Years | 167 (66.5%) | 84 (33.5%) |
| 19 to 25 Years | 81 (100.0%) | 0 (0.0%) |
| 26 to 34 Years | 291 (58.3%) | 208 (41.7%) |
| 35 to 44 Years | 249 (82.5%) | 53 (17.5%) |
| 45 to 54 Years | 242 (54.5%) | 202 (45.5%) |
| 55 to 64 Years | 403 (78.7%) | 109 (21.3%) |
| 65 to 74 Years | 334 (100.0%) | 0 (0.0%) |
| 75 Years and older | 598 (100.0%) | 0 (0.0%) |
| Total | 2,583 (79.7%) | 656 (20.3%) |
Health Insurance Coverage by Citizenship Status in Escatawpa
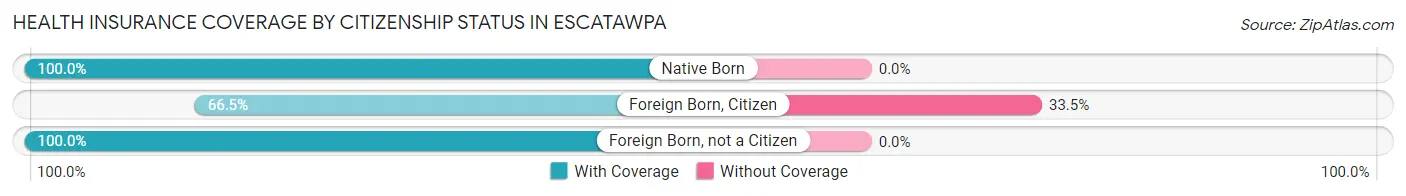
| Citizenship Status | With Coverage | Without Coverage |
| Native Born | 218 (100.0%) | 0 (0.0%) |
| Foreign Born, Citizen | 167 (66.5%) | 84 (33.5%) |
| Foreign Born, not a Citizen | 81 (100.0%) | 0 (0.0%) |
Health Insurance Coverage by Household Income in Escatawpa
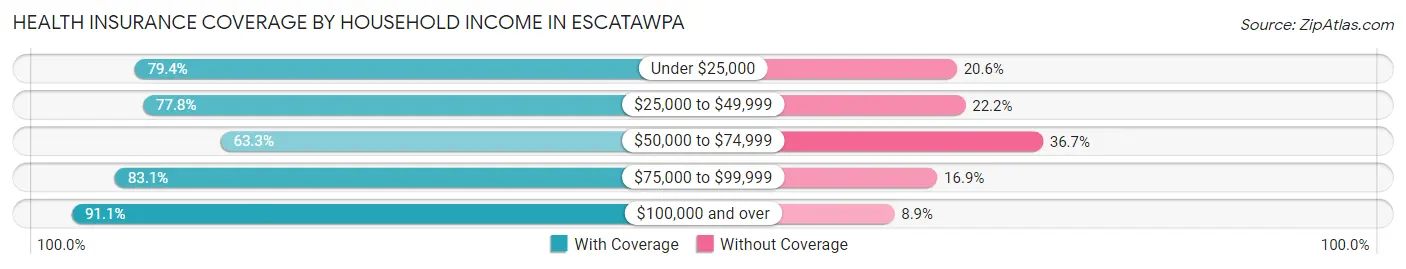
| Household Income | With Coverage | Without Coverage |
| Under $25,000 | 644 (79.4%) | 167 (20.6%) |
| $25,000 to $49,999 | 368 (77.8%) | 105 (22.2%) |
| $50,000 to $74,999 | 386 (63.3%) | 224 (36.7%) |
| $75,000 to $99,999 | 417 (83.1%) | 85 (16.9%) |
| $100,000 and over | 768 (91.1%) | 75 (8.9%) |
Public vs Private Health Insurance Coverage by Age in Escatawpa
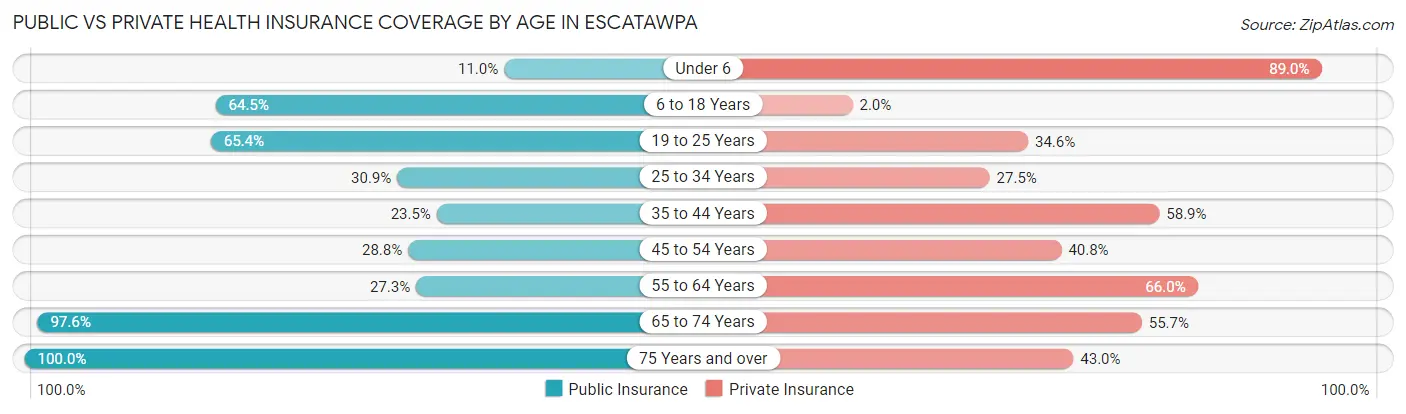
| Age Bracket | Public Insurance | Private Insurance |
| Under 6 | 24 (11.0%) | 194 (89.0%) |
| 6 to 18 Years | 162 (64.5%) | 5 (2.0%) |
| 19 to 25 Years | 53 (65.4%) | 28 (34.6%) |
| 25 to 34 Years | 154 (30.9%) | 137 (27.5%) |
| 35 to 44 Years | 71 (23.5%) | 178 (58.9%) |
| 45 to 54 Years | 128 (28.8%) | 181 (40.8%) |
| 55 to 64 Years | 140 (27.3%) | 338 (66.0%) |
| 65 to 74 Years | 326 (97.6%) | 186 (55.7%) |
| 75 Years and over | 598 (100.0%) | 257 (43.0%) |
| Total | 1,656 (51.1%) | 1,504 (46.4%) |
Disability Status by Sex by Age in Escatawpa
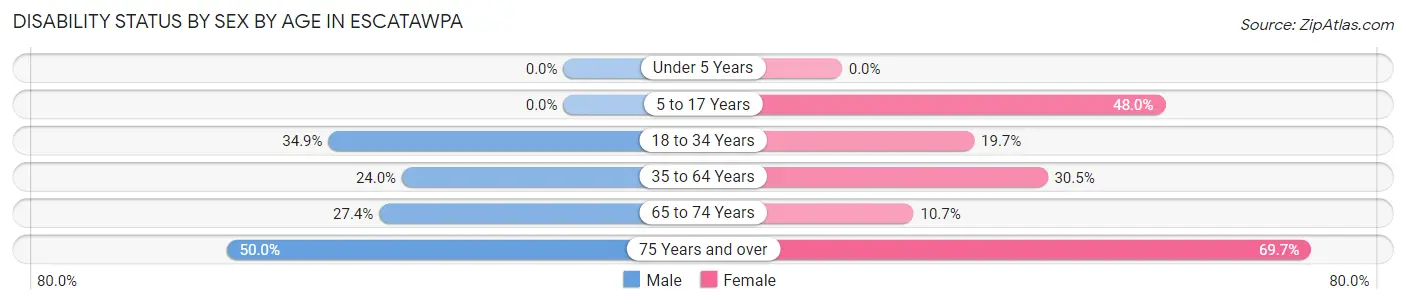
| Age Bracket | Male | Female |
| Under 5 Years | 0 (0.0%) | 0 (0.0%) |
| 5 to 17 Years | 0 (0.0%) | 73 (48.0%) |
| 18 to 34 Years | 142 (34.9%) | 34 (19.7%) |
| 35 to 64 Years | 110 (24.0%) | 244 (30.5%) |
| 65 to 74 Years | 58 (27.4%) | 13 (10.7%) |
| 75 Years and over | 88 (50.0%) | 294 (69.7%) |
Disability Class by Sex by Age in Escatawpa
Disability Class: Hearing Difficulty
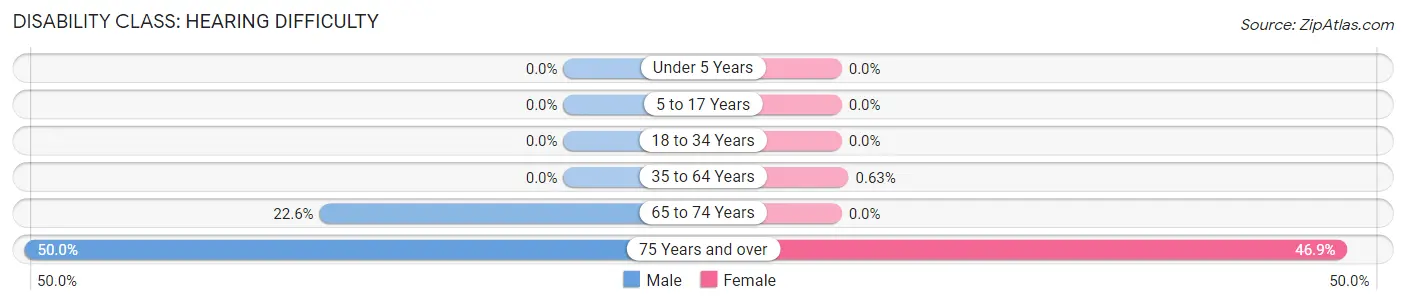
| Age Bracket | Male | Female |
| Under 5 Years | 0 (0.0%) | 0 (0.0%) |
| 5 to 17 Years | 0 (0.0%) | 0 (0.0%) |
| 18 to 34 Years | 0 (0.0%) | 0 (0.0%) |
| 35 to 64 Years | 0 (0.0%) | 5 (0.6%) |
| 65 to 74 Years | 48 (22.6%) | 0 (0.0%) |
| 75 Years and over | 88 (50.0%) | 198 (46.9%) |
Disability Class: Vision Difficulty
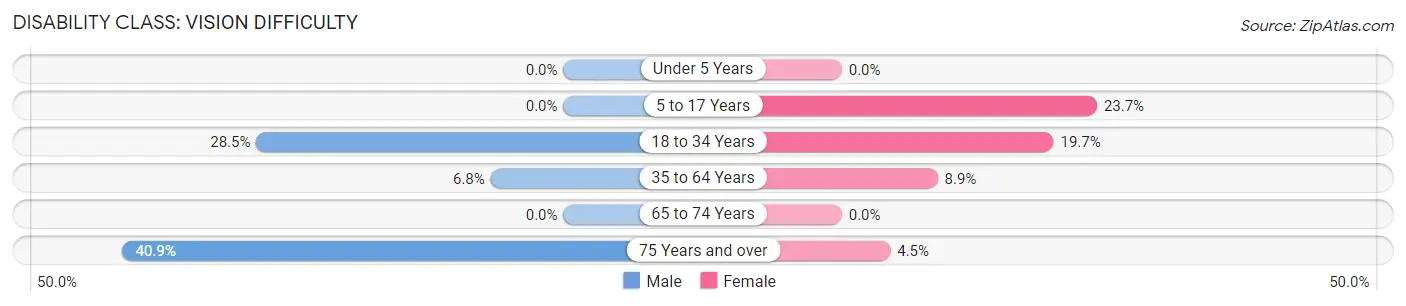
| Age Bracket | Male | Female |
| Under 5 Years | 0 (0.0%) | 0 (0.0%) |
| 5 to 17 Years | 0 (0.0%) | 36 (23.7%) |
| 18 to 34 Years | 116 (28.5%) | 34 (19.7%) |
| 35 to 64 Years | 31 (6.8%) | 71 (8.9%) |
| 65 to 74 Years | 0 (0.0%) | 0 (0.0%) |
| 75 Years and over | 72 (40.9%) | 19 (4.5%) |
Disability Class: Cognitive Difficulty
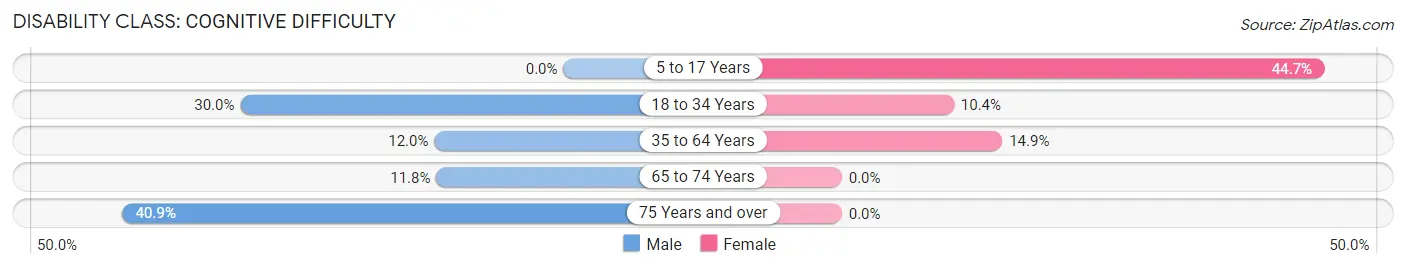
| Age Bracket | Male | Female |
| 5 to 17 Years | 0 (0.0%) | 68 (44.7%) |
| 18 to 34 Years | 122 (30.0%) | 18 (10.4%) |
| 35 to 64 Years | 55 (12.0%) | 119 (14.9%) |
| 65 to 74 Years | 25 (11.8%) | 0 (0.0%) |
| 75 Years and over | 72 (40.9%) | 0 (0.0%) |
Disability Class: Ambulatory Difficulty
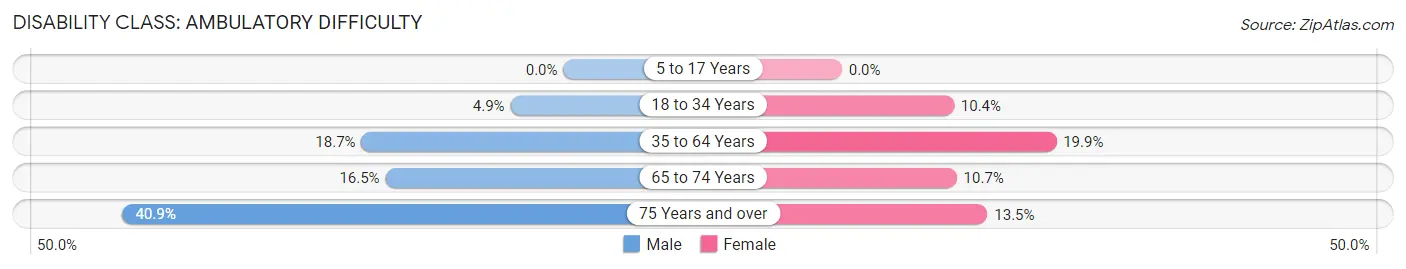
| Age Bracket | Male | Female |
| 5 to 17 Years | 0 (0.0%) | 0 (0.0%) |
| 18 to 34 Years | 20 (4.9%) | 18 (10.4%) |
| 35 to 64 Years | 86 (18.7%) | 159 (19.9%) |
| 65 to 74 Years | 35 (16.5%) | 13 (10.7%) |
| 75 Years and over | 72 (40.9%) | 57 (13.5%) |
Disability Class: Self-Care Difficulty
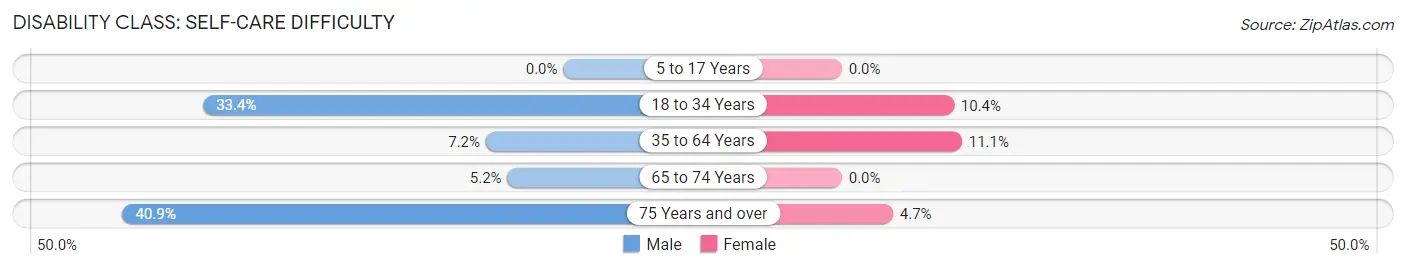
| Age Bracket | Male | Female |
| 5 to 17 Years | 0 (0.0%) | 0 (0.0%) |
| 18 to 34 Years | 136 (33.4%) | 18 (10.4%) |
| 35 to 64 Years | 33 (7.2%) | 89 (11.1%) |
| 65 to 74 Years | 11 (5.2%) | 0 (0.0%) |
| 75 Years and over | 72 (40.9%) | 20 (4.7%) |
Technology Access in Escatawpa
Computing Device Access in Escatawpa
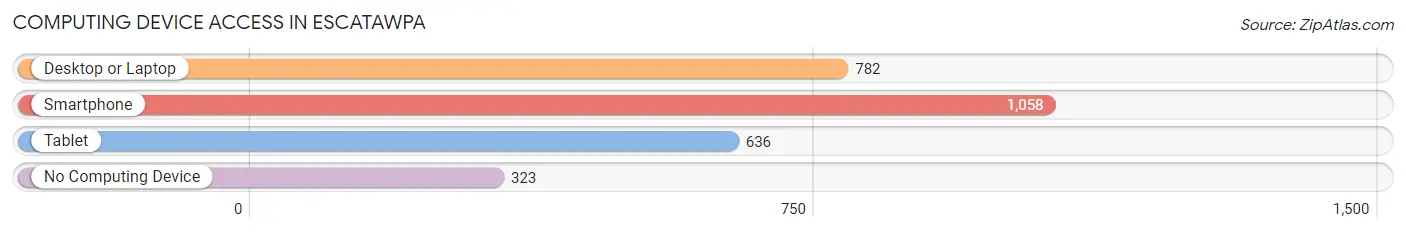
| Device Type | # Households | % Households |
| Desktop or Laptop | 782 | 54.5% |
| Smartphone | 1,058 | 73.7% |
| Tablet | 636 | 44.3% |
| No Computing Device | 323 | 22.5% |
| Total | 1,436 | 100.0% |
Internet Access in Escatawpa
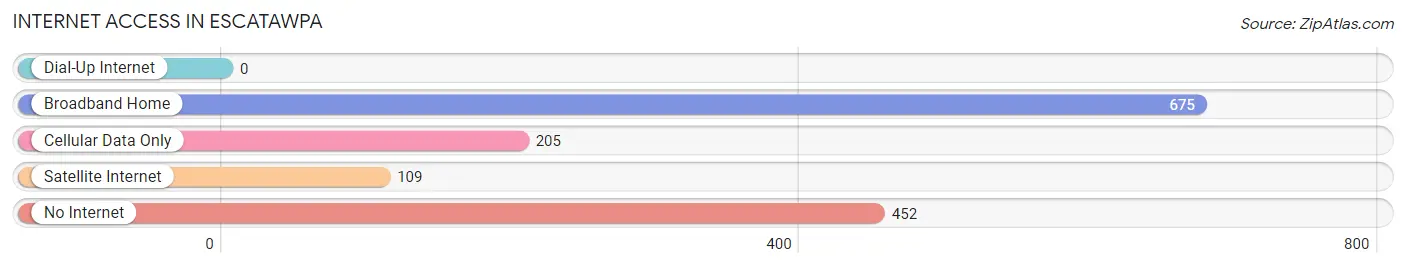
| Internet Type | # Households | % Households |
| Dial-Up Internet | 0 | 0.0% |
| Broadband Home | 675 | 47.0% |
| Cellular Data Only | 205 | 14.3% |
| Satellite Internet | 109 | 7.6% |
| No Internet | 452 | 31.5% |
| Total | 1,436 | 100.0% |
Escatawpa Summary
Escatawpa is a small unincorporated community located in Jackson County, Mississippi. It is situated along the Escatawpa River, approximately 10 miles east of Pascagoula. The community is part of the Pascagoula Metropolitan Statistical Area and has a population of approximately 1,000 people.
History
The area that is now Escatawpa was originally inhabited by the Choctaw Indians. The name Escatawpa is derived from the Choctaw word for “river of the dead”. The first European settlers arrived in the area in the early 1800s. The community was officially established in 1837 and was named after the river.
In the late 1800s, the area was a popular destination for hunters and fishermen. The Escatawpa River was also a major transportation route for the lumber industry. The community was home to several sawmills and other businesses related to the lumber industry.
In the early 1900s, the area began to experience a decline in the lumber industry. This led to a decrease in population and economic activity. The community was also affected by the Great Depression and World War II.
Geography
Escatawpa is located in Jackson County, Mississippi. It is situated along the Escatawpa River, approximately 10 miles east of Pascagoula. The community is part of the Pascagoula Metropolitan Statistical Area and has a population of approximately 1,000 people.
The area is mostly rural and is characterized by rolling hills and forests. The climate is humid subtropical, with hot, humid summers and mild winters. The average annual temperature is around 70 degrees Fahrenheit.
Economy
The economy of Escatawpa is largely based on agriculture and forestry. The area is home to several farms and timber companies. The community is also home to several small businesses, including restaurants, convenience stores, and gas stations.
Demographics
As of the 2010 census, the population of Escatawpa was 1,000 people. The racial makeup of the community was 97.2% White, 0.7% African American, 0.2% Native American, 0.2% Asian, and 1.7% from other races. The median household income was $37,500 and the median family income was $41,250.
Conclusion
Escatawpa is a small unincorporated community located in Jackson County, Mississippi. It is situated along the Escatawpa River, approximately 10 miles east of Pascagoula. The community is part of the Pascagoula Metropolitan Statistical Area and has a population of approximately 1,000 people. The economy of Escatawpa is largely based on agriculture and forestry. The area is home to several farms and timber companies. The racial makeup of the community is 97.2% White, 0.7% African American, 0.2% Native American, 0.2% Asian, and 1.7% from other races. The median household income was $37,500 and the median family income was $41,250.
Common Questions
What is Per Capita Income in Escatawpa?
Per Capita income in Escatawpa is $24,844.
What is the Median Family Income in Escatawpa?
Median Family Income in Escatawpa is $64,354.
What is the Median Household income in Escatawpa?
Median Household Income in Escatawpa is $33,529.
What is Income or Wage Gap in Escatawpa?
Income or Wage Gap in Escatawpa is 14.8%.
Women in Escatawpa earn 85.2 cents for every dollar earned by a man.
What is Inequality or Gini Index in Escatawpa?
Inequality or Gini Index in Escatawpa is 0.44.
What is the Total Population of Escatawpa?
Total Population of Escatawpa is 3,239.
What is the Total Male Population of Escatawpa?
Total Male Population of Escatawpa is 1,382.
What is the Total Female Population of Escatawpa?
Total Female Population of Escatawpa is 1,857.
What is the Ratio of Males per 100 Females in Escatawpa?
There are 74.42 Males per 100 Females in Escatawpa.
What is the Ratio of Females per 100 Males in Escatawpa?
There are 134.37 Females per 100 Males in Escatawpa.
What is the Median Population Age in Escatawpa?
Median Population Age in Escatawpa is 50.3 Years.
What is the Average Family Size in Escatawpa
Average Family Size in Escatawpa is 3.2 People.
What is the Average Household Size in Escatawpa
Average Household Size in Escatawpa is 2.3 People.
How Large is the Labor Force in Escatawpa?
There are 1,128 People in the Labor Forcein in Escatawpa.
What is the Percentage of People in the Labor Force in Escatawpa?
39.9% of People are in the Labor Force in Escatawpa.
What is the Unemployment Rate in Escatawpa?
Unemployment Rate in Escatawpa is 15.5%.