Southaven, MS Map & Demographics
Southaven Map
Southaven Overview
$32,079
PER CAPITA INCOME
$79,548
AVG FAMILY INCOME
$72,513
AVG HOUSEHOLD INCOME
10.3%
WAGE / INCOME GAP [ % ]
89.7¢/ $1
WAGE / INCOME GAP [ $ ]
$12,278
FAMILY INCOME DEFICIT
0.39
INEQUALITY / GINI INDEX
54,908
TOTAL POPULATION
26,886
MALE POPULATION
28,022
FEMALE POPULATION
95.95
MALES / 100 FEMALES
104.23
FEMALES / 100 MALES
35.4
MEDIAN AGE
3.2
AVG FAMILY SIZE
2.7
AVG HOUSEHOLD SIZE
28,691
LABOR FORCE [ PEOPLE ]
67.8%
PERCENT IN LABOR FORCE
4.1%
UNEMPLOYMENT RATE
Southaven Area Codes
Income in Southaven
Income Overview in Southaven
Per Capita Income in Southaven is $32,079, while median incomes of families and households are $79,548 and $72,513 respectively.
| Characteristic | Number | Measure |
| Per Capita Income | 54,908 | $32,079 |
| Median Family Income | 14,497 | $79,548 |
| Mean Family Income | 14,497 | $93,919 |
| Median Household Income | 20,262 | $72,513 |
| Mean Household Income | 20,262 | $84,882 |
| Income Deficit | 14,497 | $12,278 |
| Wage / Income Gap (%) | 54,908 | 10.29% |
| Wage / Income Gap ($) | 54,908 | 89.71¢ per $1 |
| Gini / Inequality Index | 54,908 | 0.39 |
Earnings by Sex in Southaven
Average Earnings in Southaven are $43,682, $46,078 for men and $41,335 for women, a difference of 10.3%.
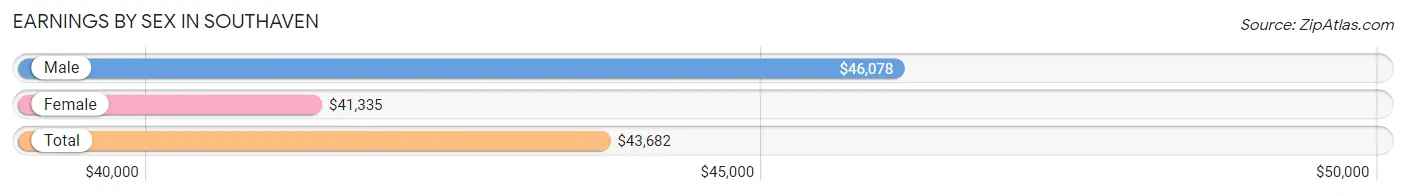
| Sex | Number | Average Earnings |
| Male | 15,146 (50.4%) | $46,078 |
| Female | 14,926 (49.6%) | $41,335 |
| Total | 30,072 (100.0%) | $43,682 |
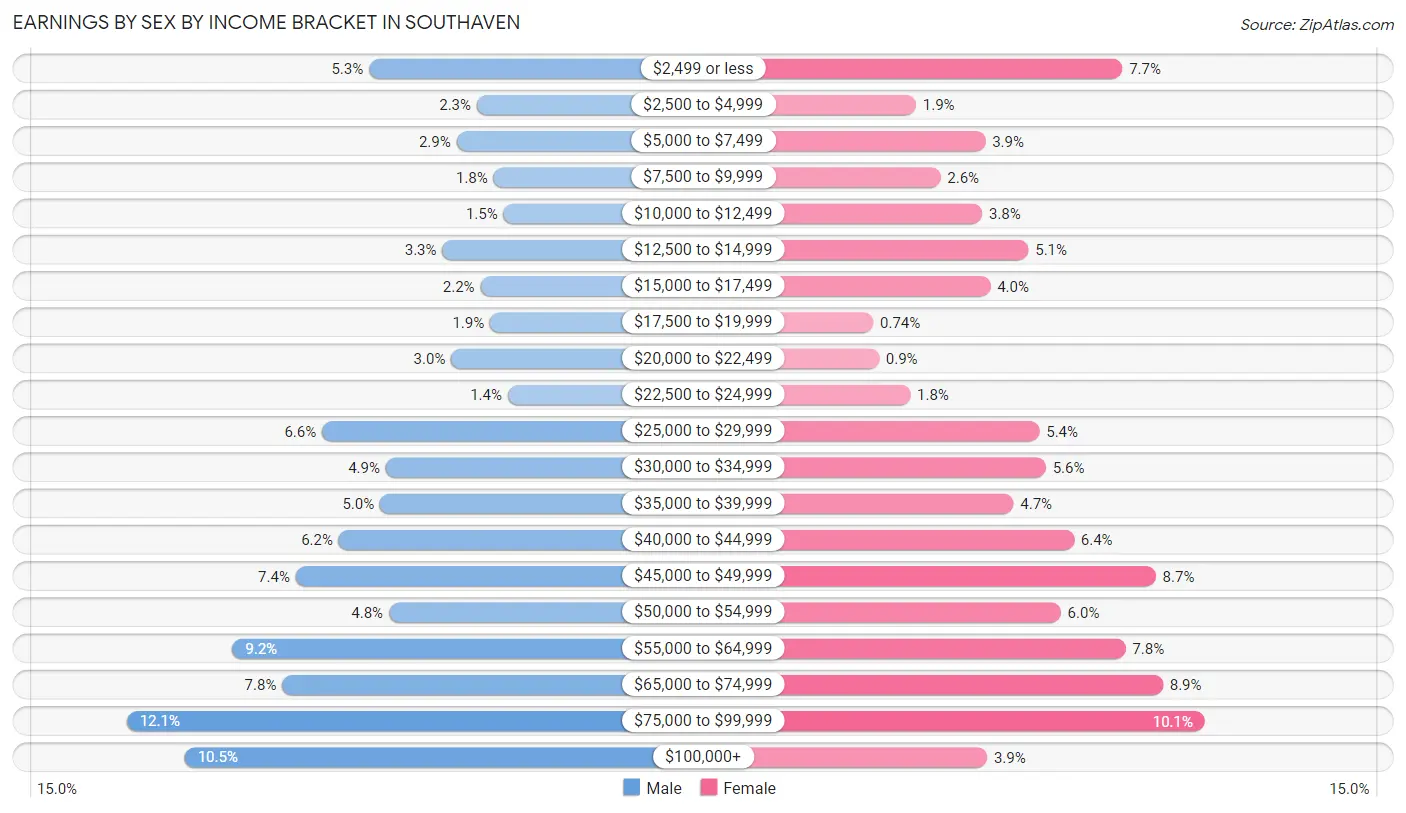
Earnings by Sex by Income Bracket in Southaven
The most common earnings brackets in Southaven are $75,000 to $99,999 for men (1,837 | 12.1%) and $75,000 to $99,999 for women (1,502 | 10.1%).
| Income | Male | Female |
| $2,499 or less | 806 (5.3%) | 1,155 (7.7%) |
| $2,500 to $4,999 | 347 (2.3%) | 289 (1.9%) |
| $5,000 to $7,499 | 433 (2.9%) | 580 (3.9%) |
| $7,500 to $9,999 | 275 (1.8%) | 393 (2.6%) |
| $10,000 to $12,499 | 233 (1.5%) | 567 (3.8%) |
| $12,500 to $14,999 | 494 (3.3%) | 761 (5.1%) |
| $15,000 to $17,499 | 332 (2.2%) | 601 (4.0%) |
| $17,500 to $19,999 | 291 (1.9%) | 110 (0.7%) |
| $20,000 to $22,499 | 456 (3.0%) | 134 (0.9%) |
| $22,500 to $24,999 | 215 (1.4%) | 265 (1.8%) |
| $25,000 to $29,999 | 1,006 (6.6%) | 808 (5.4%) |
| $30,000 to $34,999 | 735 (4.9%) | 834 (5.6%) |
| $35,000 to $39,999 | 759 (5.0%) | 699 (4.7%) |
| $40,000 to $44,999 | 934 (6.2%) | 953 (6.4%) |
| $45,000 to $49,999 | 1,118 (7.4%) | 1,296 (8.7%) |
| $50,000 to $54,999 | 721 (4.8%) | 897 (6.0%) |
| $55,000 to $64,999 | 1,388 (9.2%) | 1,169 (7.8%) |
| $65,000 to $74,999 | 1,175 (7.8%) | 1,325 (8.9%) |
| $75,000 to $99,999 | 1,837 (12.1%) | 1,502 (10.1%) |
| $100,000+ | 1,591 (10.5%) | 588 (3.9%) |
| Total | 15,146 (100.0%) | 14,926 (100.0%) |
Earnings by Sex by Educational Attainment in Southaven
Average earnings in Southaven are $50,856 for men and $46,107 for women, a difference of 9.3%. Men with an educational attainment of graduate degree enjoy the highest average annual earnings of $71,643, while those with less than high school education earn the least with $37,819. Women with an educational attainment of graduate degree earn the most with the average annual earnings of $65,183, while those with less than high school education have the smallest earnings of $22,464.
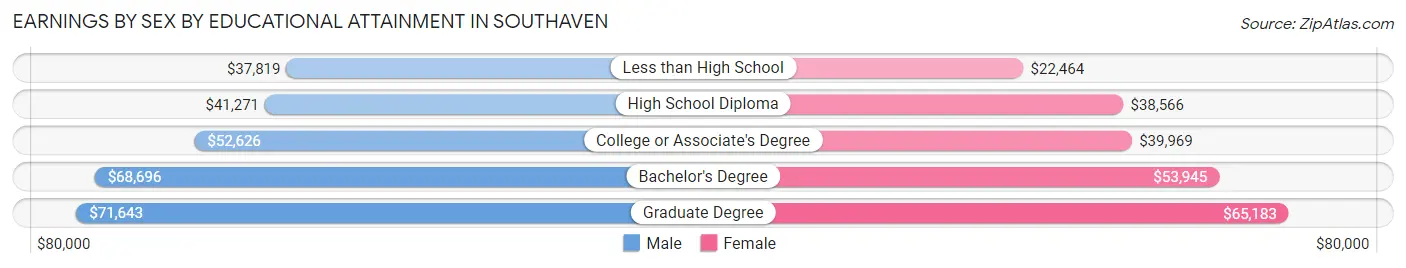
| Educational Attainment | Male Income | Female Income |
| Less than High School | $37,819 | $22,464 |
| High School Diploma | $41,271 | $38,566 |
| College or Associate's Degree | $52,626 | $39,969 |
| Bachelor's Degree | $68,696 | $53,945 |
| Graduate Degree | $71,643 | $65,183 |
| Total | $50,856 | $46,107 |
Family Income in Southaven
Family Income Brackets in Southaven
According to the Southaven family income data, there are 2,957 families falling into the $100,000 to $149,999 income range, which is the most common income bracket and makes up 20.4% of all families. Conversely, the $10,000 to $14,999 income bracket is the least frequent group with only 275 families (1.9%) belonging to this category.
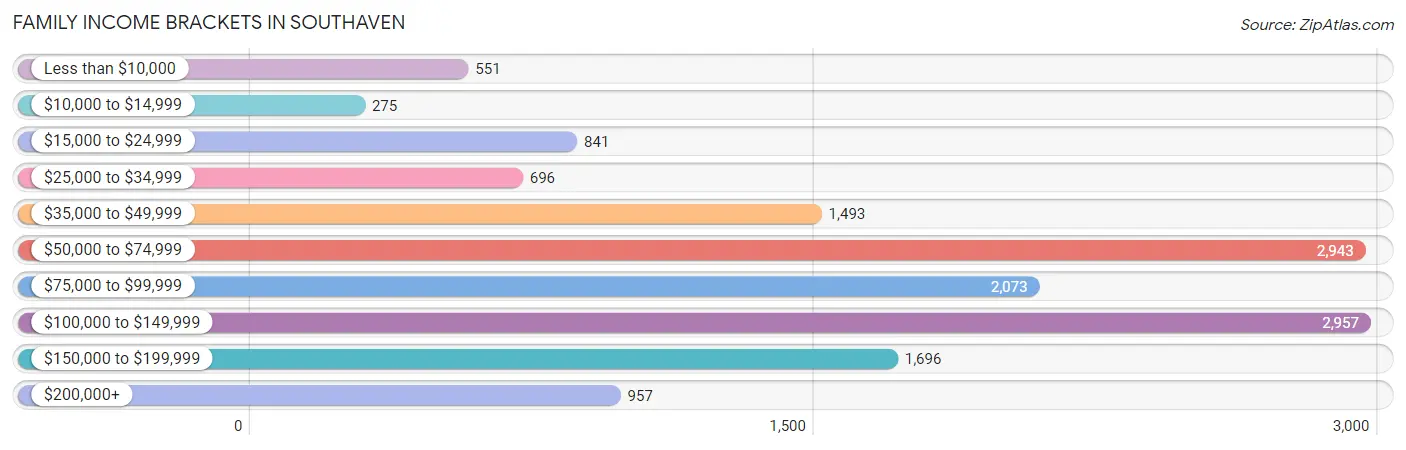
| Income Bracket | # Families | % Families |
| Less than $10,000 | 551 | 3.8% |
| $10,000 to $14,999 | 275 | 1.9% |
| $15,000 to $24,999 | 841 | 5.8% |
| $25,000 to $34,999 | 696 | 4.8% |
| $35,000 to $49,999 | 1,493 | 10.3% |
| $50,000 to $74,999 | 2,943 | 20.3% |
| $75,000 to $99,999 | 2,073 | 14.3% |
| $100,000 to $149,999 | 2,957 | 20.4% |
| $150,000 to $199,999 | 1,696 | 11.7% |
| $200,000+ | 957 | 6.6% |
Family Income by Famaliy Size in Southaven
6-person families (594 | 4.1%) account for the highest median family income in Southaven with $105,714 per family, while 2-person families (5,538 | 38.2%) have the highest median income of $37,626 per family member.
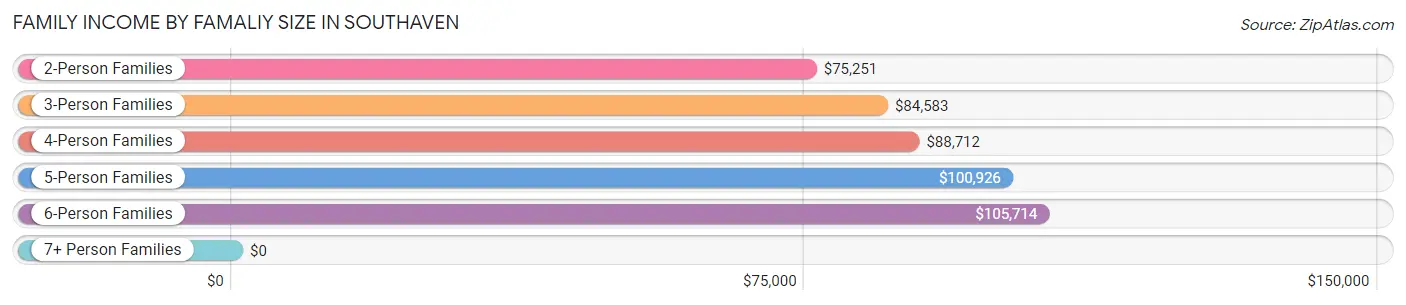
| Income Bracket | # Families | Median Income |
| 2-Person Families | 5,538 (38.2%) | $75,251 |
| 3-Person Families | 4,208 (29.0%) | $84,583 |
| 4-Person Families | 2,660 (18.3%) | $88,712 |
| 5-Person Families | 1,326 (9.1%) | $100,926 |
| 6-Person Families | 594 (4.1%) | $105,714 |
| 7+ Person Families | 171 (1.2%) | $0 |
| Total | 14,497 (100.0%) | $79,548 |
Family Income by Number of Earners in Southaven
The median family income in Southaven is $79,548, with families comprising 3+ earners (2,039) having the highest median family income of $129,536, while families with no earners (1,458) have the lowest median family income of $41,864, accounting for 14.1% and 10.1% of families, respectively.
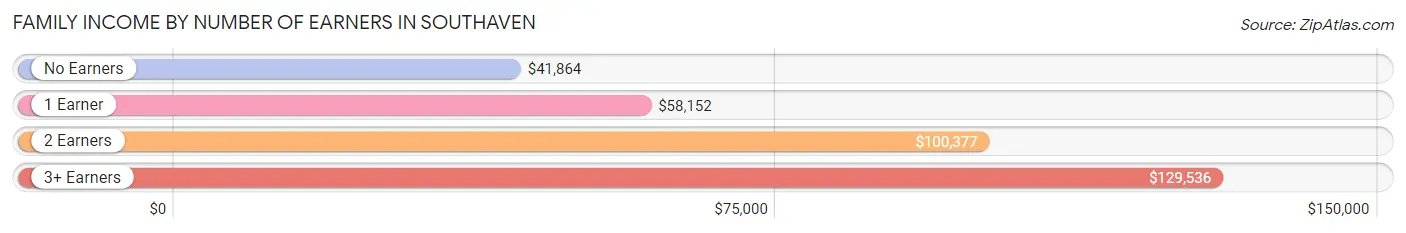
| Number of Earners | # Families | Median Income |
| No Earners | 1,458 (10.1%) | $41,864 |
| 1 Earner | 5,323 (36.7%) | $58,152 |
| 2 Earners | 5,677 (39.2%) | $100,377 |
| 3+ Earners | 2,039 (14.1%) | $129,536 |
| Total | 14,497 (100.0%) | $79,548 |
Household Income in Southaven
Household Income Brackets in Southaven
With 4,093 households falling in the category, the $50,000 to $74,999 income range is the most frequent in Southaven, accounting for 20.2% of all households. In contrast, only 446 households (2.2%) fall into the $10,000 to $14,999 income bracket, making it the least populous group.
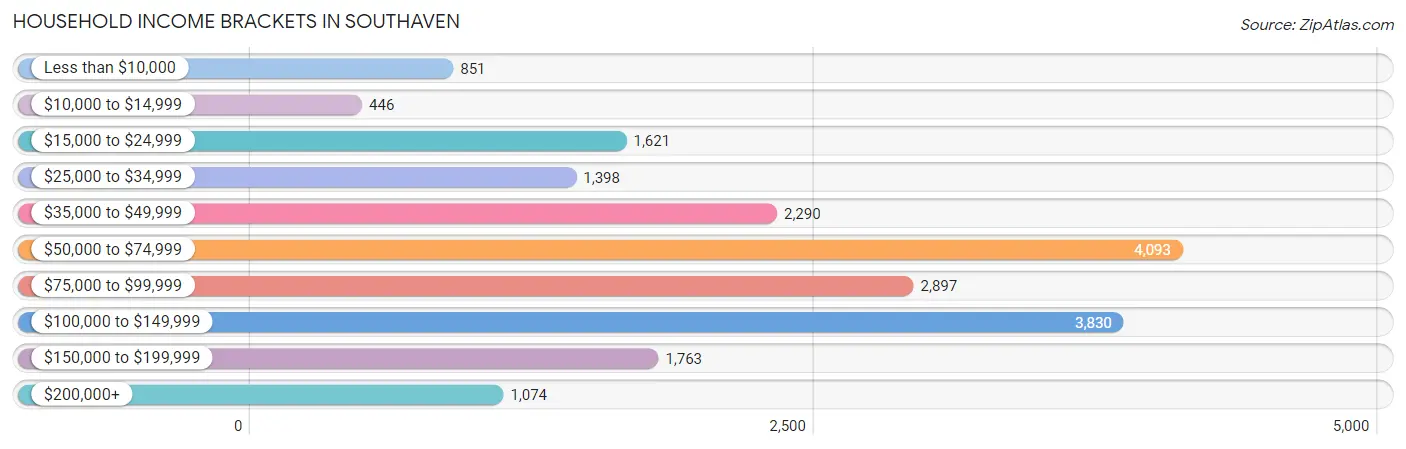
| Income Bracket | # Households | % Households |
| Less than $10,000 | 851 | 4.2% |
| $10,000 to $14,999 | 446 | 2.2% |
| $15,000 to $24,999 | 1,621 | 8.0% |
| $25,000 to $34,999 | 1,398 | 6.9% |
| $35,000 to $49,999 | 2,290 | 11.3% |
| $50,000 to $74,999 | 4,093 | 20.2% |
| $75,000 to $99,999 | 2,897 | 14.3% |
| $100,000 to $149,999 | 3,830 | 18.9% |
| $150,000 to $199,999 | 1,763 | 8.7% |
| $200,000+ | 1,074 | 5.3% |
Household Income by Householder Age in Southaven
The median household income in Southaven is $72,513, with the highest median household income of $93,015 found in the 45 to 64 years age bracket for the primary householder. A total of 7,903 households (39.0%) fall into this category. Meanwhile, the 15 to 24 years age bracket for the primary householder has the lowest median household income of $28,031, with 1,043 households (5.1%) in this group.
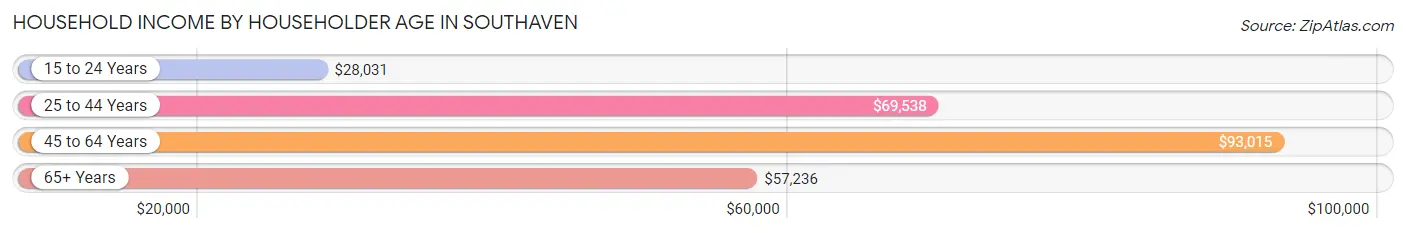
| Income Bracket | # Households | Median Income |
| 15 to 24 Years | 1,043 (5.1%) | $28,031 |
| 25 to 44 Years | 7,224 (35.6%) | $69,538 |
| 45 to 64 Years | 7,903 (39.0%) | $93,015 |
| 65+ Years | 4,092 (20.2%) | $57,236 |
| Total | 20,262 (100.0%) | $72,513 |
Poverty in Southaven
Income Below Poverty by Sex and Age in Southaven
With 11.2% poverty level for males and 15.1% for females among the residents of Southaven, under 5 year old males and 5 year old females are the most vulnerable to poverty, with 531 males (25.6%) and 286 females (50.9%) in their respective age groups living below the poverty level.
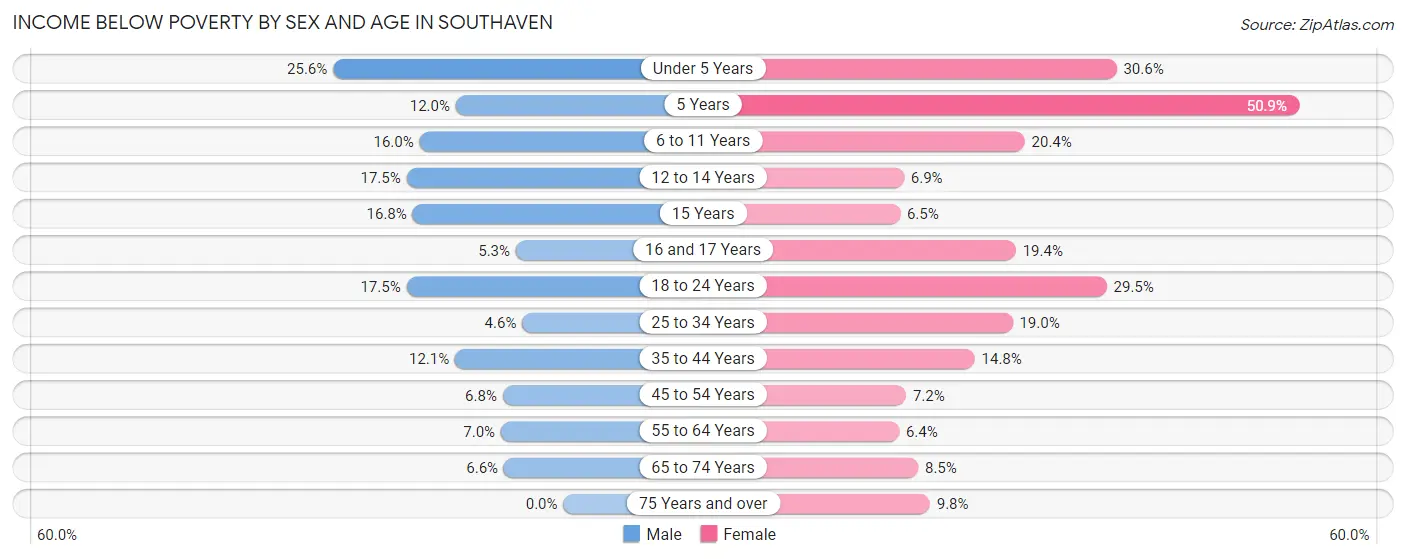
| Age Bracket | Male | Female |
| Under 5 Years | 531 (25.6%) | 346 (30.6%) |
| 5 Years | 29 (12.0%) | 286 (50.9%) |
| 6 to 11 Years | 423 (16.0%) | 347 (20.4%) |
| 12 to 14 Years | 269 (17.5%) | 94 (6.9%) |
| 15 Years | 94 (16.8%) | 37 (6.5%) |
| 16 and 17 Years | 33 (5.3%) | 191 (19.4%) |
| 18 to 24 Years | 477 (17.5%) | 762 (29.5%) |
| 25 to 34 Years | 171 (4.6%) | 729 (19.0%) |
| 35 to 44 Years | 391 (12.1%) | 537 (14.8%) |
| 45 to 54 Years | 236 (6.8%) | 300 (7.1%) |
| 55 to 64 Years | 205 (7.0%) | 216 (6.4%) |
| 65 to 74 Years | 142 (6.6%) | 175 (8.5%) |
| 75 Years and over | 0 (0.0%) | 166 (9.8%) |
| Total | 3,001 (11.2%) | 4,186 (15.1%) |
Income Above Poverty by Sex and Age in Southaven
According to the poverty statistics in Southaven, males aged 75 years and over and females aged 55 to 64 years are the age groups that are most secure financially, with 100.0% of males and 93.6% of females in these age groups living above the poverty line.
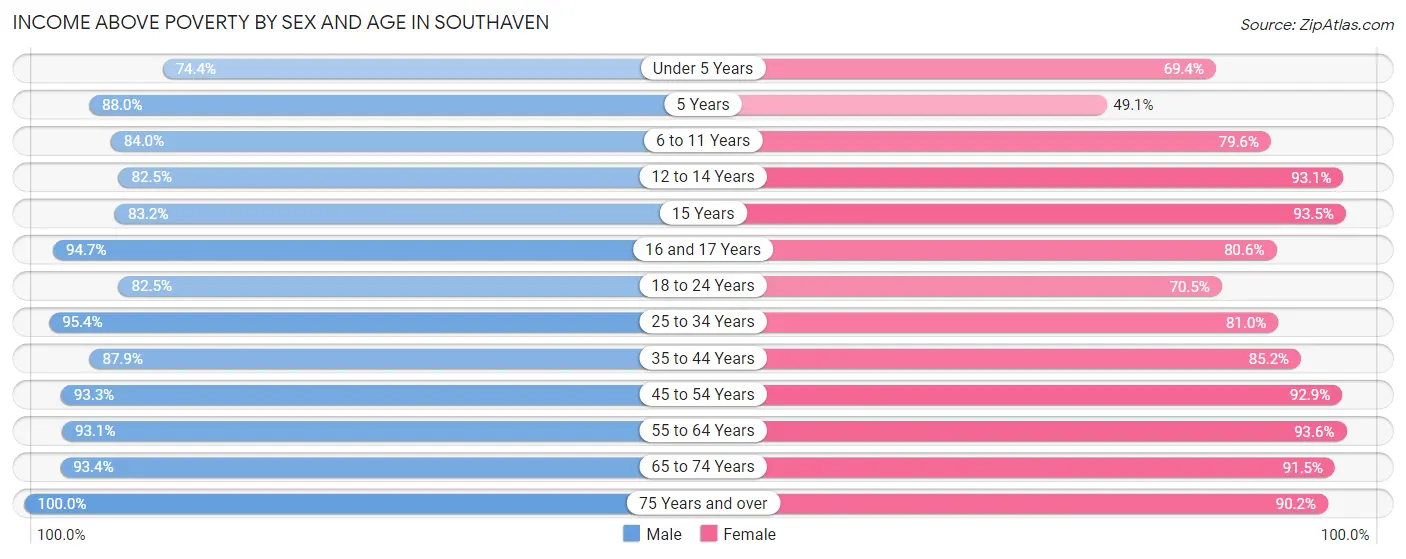
| Age Bracket | Male | Female |
| Under 5 Years | 1,540 (74.4%) | 785 (69.4%) |
| 5 Years | 213 (88.0%) | 276 (49.1%) |
| 6 to 11 Years | 2,218 (84.0%) | 1,357 (79.6%) |
| 12 to 14 Years | 1,272 (82.5%) | 1,266 (93.1%) |
| 15 Years | 466 (83.2%) | 534 (93.5%) |
| 16 and 17 Years | 591 (94.7%) | 795 (80.6%) |
| 18 to 24 Years | 2,254 (82.5%) | 1,822 (70.5%) |
| 25 to 34 Years | 3,565 (95.4%) | 3,106 (81.0%) |
| 35 to 44 Years | 2,850 (87.9%) | 3,095 (85.2%) |
| 45 to 54 Years | 3,262 (93.2%) | 3,895 (92.8%) |
| 55 to 64 Years | 2,743 (93.0%) | 3,174 (93.6%) |
| 65 to 74 Years | 2,002 (93.4%) | 1,886 (91.5%) |
| 75 Years and over | 714 (100.0%) | 1,528 (90.2%) |
| Total | 23,690 (88.8%) | 23,519 (84.9%) |
Income Below Poverty Among Married-Couple Families in Southaven
The poverty statistics for married-couple families in Southaven show that 6.0% or 572 of the total 9,602 families live below the poverty line. Families with 5 or more children have the highest poverty rate of 20.9%, comprising of 9 families. On the other hand, families with no children have the lowest poverty rate of 1.3%, which includes 62 families.
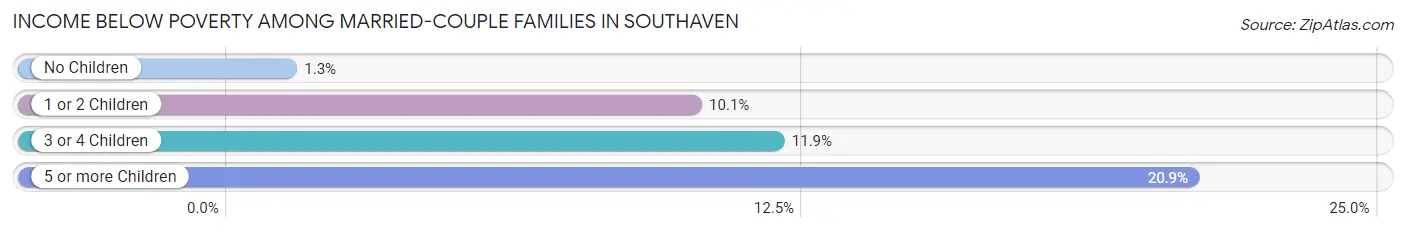
| Children | Above Poverty | Below Poverty |
| No Children | 4,739 (98.7%) | 62 (1.3%) |
| 1 or 2 Children | 3,258 (89.9%) | 366 (10.1%) |
| 3 or 4 Children | 999 (88.1%) | 135 (11.9%) |
| 5 or more Children | 34 (79.1%) | 9 (20.9%) |
| Total | 9,030 (94.0%) | 572 (6.0%) |
Income Below Poverty Among Single-Parent Households in Southaven
According to the poverty data in Southaven, 8.2% or 144 single-father households and 26.6% or 834 single-mother households are living below the poverty line. Among single-father households, those with no children have the highest poverty rate, with 90 households (11.8%) experiencing poverty. Likewise, among single-mother households, those with 5 or more children have the highest poverty rate, with 13 households (61.9%) falling below the poverty line.
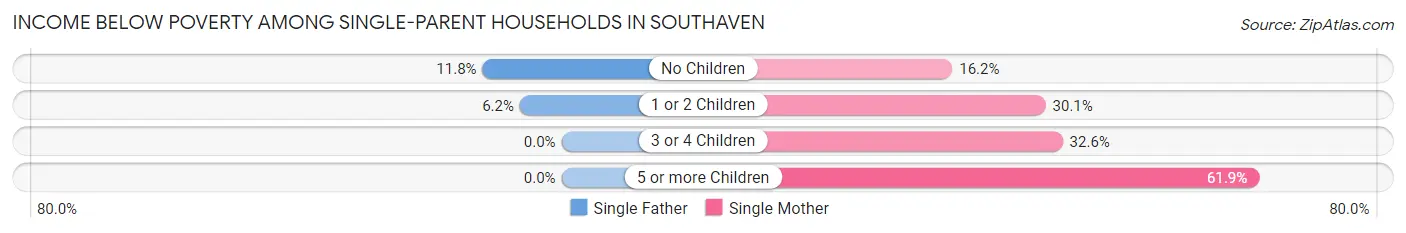
| Children | Single Father | Single Mother |
| No Children | 90 (11.8%) | 141 (16.2%) |
| 1 or 2 Children | 54 (6.2%) | 603 (30.1%) |
| 3 or 4 Children | 0 (0.0%) | 77 (32.6%) |
| 5 or more Children | 0 (0.0%) | 13 (61.9%) |
| Total | 144 (8.2%) | 834 (26.6%) |
Income Below Poverty Among Married-Couple vs Single-Parent Households in Southaven
The poverty data for Southaven shows that 572 of the married-couple family households (6.0%) and 978 of the single-parent households (20.0%) are living below the poverty level. Within the married-couple family households, those with 5 or more children have the highest poverty rate, with 9 households (20.9%) falling below the poverty line. Among the single-parent households, those with 5 or more children have the highest poverty rate, with 13 household (61.9%) living below poverty.
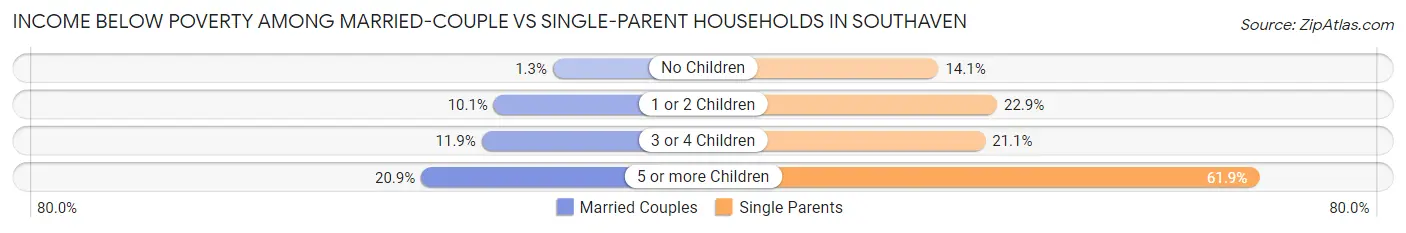
| Children | Married-Couple Families | Single-Parent Households |
| No Children | 62 (1.3%) | 231 (14.1%) |
| 1 or 2 Children | 366 (10.1%) | 657 (22.9%) |
| 3 or 4 Children | 135 (11.9%) | 77 (21.1%) |
| 5 or more Children | 9 (20.9%) | 13 (61.9%) |
| Total | 572 (6.0%) | 978 (20.0%) |
Race in Southaven
The most populous races in Southaven are White / Caucasian (31,147 | 56.7%), Black / African American (19,864 | 36.2%), and Hispanic or Latino (2,871 | 5.2%).
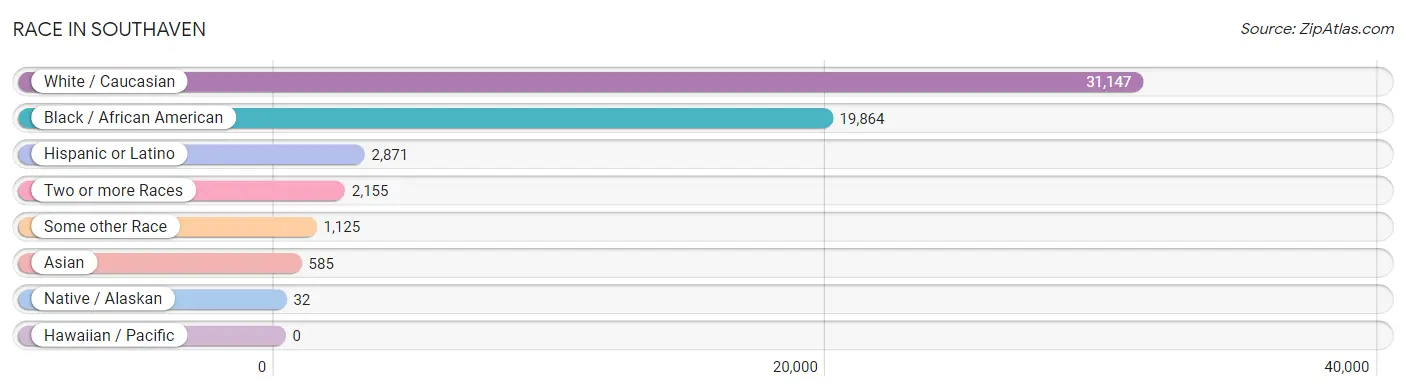
| Race | # Population | % Population |
| Asian | 585 | 1.1% |
| Black / African American | 19,864 | 36.2% |
| Hawaiian / Pacific | 0 | 0.0% |
| Hispanic or Latino | 2,871 | 5.2% |
| Native / Alaskan | 32 | 0.1% |
| White / Caucasian | 31,147 | 56.7% |
| Two or more Races | 2,155 | 3.9% |
| Some other Race | 1,125 | 2.1% |
| Total | 54,908 | 100.0% |
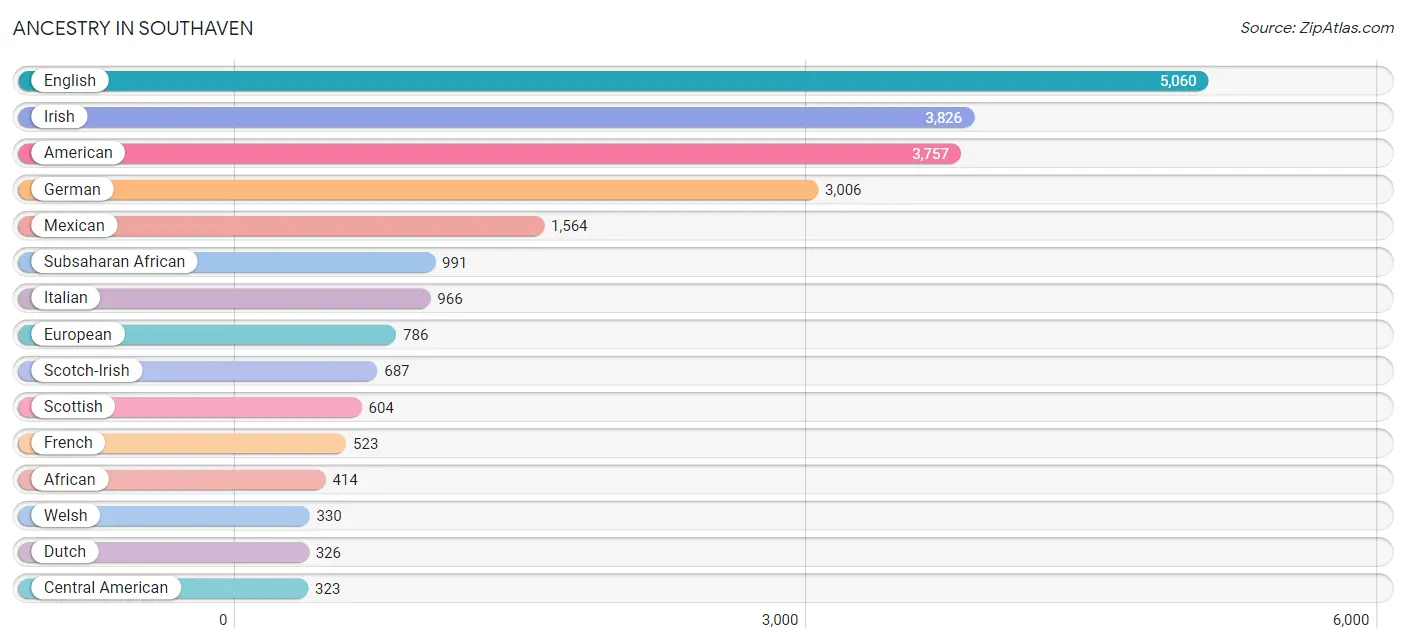
Ancestry in Southaven
The most populous ancestries reported in Southaven are English (5,060 | 9.2%), Irish (3,826 | 7.0%), American (3,757 | 6.8%), German (3,006 | 5.5%), and Mexican (1,564 | 2.9%), together accounting for 31.4% of all Southaven residents.
| Ancestry | # Population | % Population |
| African | 414 | 0.7% |
| American | 3,757 | 6.8% |
| Arab | 184 | 0.3% |
| Australian | 10 | 0.0% |
| Bhutanese | 108 | 0.2% |
| Blackfeet | 22 | 0.0% |
| Bolivian | 14 | 0.0% |
| British | 169 | 0.3% |
| Burmese | 31 | 0.1% |
| Canadian | 16 | 0.0% |
| Celtic | 24 | 0.0% |
| Central American | 323 | 0.6% |
| Central American Indian | 81 | 0.2% |
| Cherokee | 59 | 0.1% |
| Choctaw | 21 | 0.0% |
| Colombian | 257 | 0.5% |
| Costa Rican | 51 | 0.1% |
| Cree | 3 | 0.0% |
| Crow | 1 | 0.0% |
| Cuban | 135 | 0.3% |
| Czech | 10 | 0.0% |
| Danish | 81 | 0.2% |
| Dominican | 124 | 0.2% |
| Dutch | 326 | 0.6% |
| Eastern European | 38 | 0.1% |
| English | 5,060 | 9.2% |
| European | 786 | 1.4% |
| French | 523 | 0.9% |
| French Canadian | 142 | 0.3% |
| German | 3,006 | 5.5% |
| Greek | 45 | 0.1% |
| Guatemalan | 27 | 0.1% |
| Honduran | 13 | 0.0% |
| Hungarian | 10 | 0.0% |
| Indian (Asian) | 153 | 0.3% |
| Irish | 3,826 | 7.0% |
| Italian | 966 | 1.8% |
| Jamaican | 120 | 0.2% |
| Japanese | 91 | 0.2% |
| Kenyan | 14 | 0.0% |
| Korean | 206 | 0.4% |
| Lebanese | 32 | 0.1% |
| Lithuanian | 5 | 0.0% |
| Maltese | 8 | 0.0% |
| Mexican | 1,564 | 2.9% |
| Moroccan | 10 | 0.0% |
| Native Hawaiian | 46 | 0.1% |
| New Zealander | 113 | 0.2% |
| Nicaraguan | 48 | 0.1% |
| Norwegian | 133 | 0.2% |
| Panamanian | 13 | 0.0% |
| Pennsylvania German | 3 | 0.0% |
| Polish | 170 | 0.3% |
| Portuguese | 33 | 0.1% |
| Puerto Rican | 248 | 0.4% |
| Romanian | 15 | 0.0% |
| Russian | 79 | 0.1% |
| Salvadoran | 171 | 0.3% |
| Scandinavian | 39 | 0.1% |
| Scotch-Irish | 687 | 1.3% |
| Scottish | 604 | 1.1% |
| Senegalese | 11 | 0.0% |
| South American | 271 | 0.5% |
| Spaniard | 53 | 0.1% |
| Spanish | 88 | 0.2% |
| Sri Lankan | 187 | 0.3% |
| Subsaharan African | 991 | 1.8% |
| Swedish | 279 | 0.5% |
| Swiss | 50 | 0.1% |
| Thai | 133 | 0.2% |
| Welsh | 330 | 0.6% | View All 71 Rows |
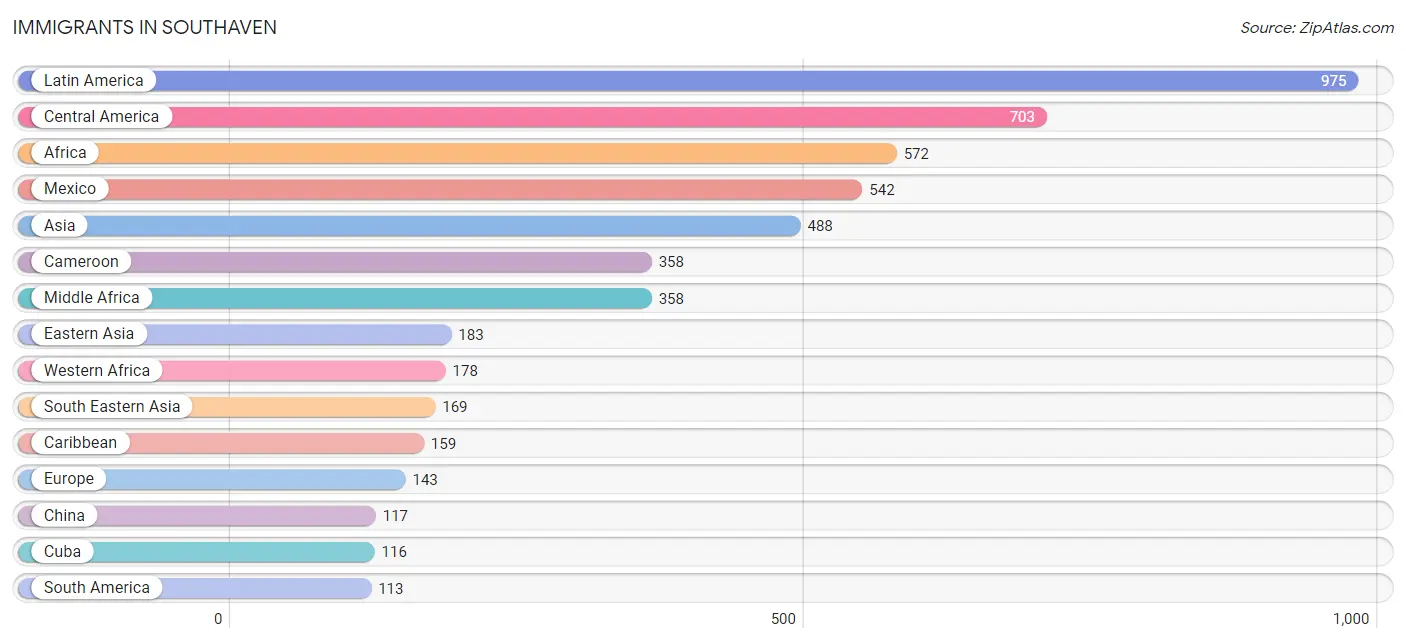
Immigrants in Southaven
The most numerous immigrant groups reported in Southaven came from Latin America (975 | 1.8%), Central America (703 | 1.3%), Africa (572 | 1.0%), Mexico (542 | 1.0%), and Asia (488 | 0.9%), together accounting for 6.0% of all Southaven residents.
| Immigration Origin | # Population | % Population |
| Africa | 572 | 1.0% |
| Asia | 488 | 0.9% |
| Australia | 10 | 0.0% |
| Bolivia | 7 | 0.0% |
| Cambodia | 58 | 0.1% |
| Cameroon | 358 | 0.6% |
| Canada | 1 | 0.0% |
| Caribbean | 159 | 0.3% |
| Central America | 703 | 1.3% |
| China | 117 | 0.2% |
| Colombia | 106 | 0.2% |
| Costa Rica | 21 | 0.0% |
| Cuba | 116 | 0.2% |
| Czechoslovakia | 7 | 0.0% |
| Dominica | 10 | 0.0% |
| Dominican Republic | 33 | 0.1% |
| Eastern Africa | 26 | 0.1% |
| Eastern Asia | 183 | 0.3% |
| Eastern Europe | 75 | 0.1% |
| El Salvador | 59 | 0.1% |
| Europe | 143 | 0.3% |
| Germany | 56 | 0.1% |
| Guatemala | 37 | 0.1% |
| Honduras | 22 | 0.0% |
| India | 109 | 0.2% |
| Ireland | 3 | 0.0% |
| Japan | 61 | 0.1% |
| Kenya | 26 | 0.1% |
| Korea | 5 | 0.0% |
| Latin America | 975 | 1.8% |
| Mexico | 542 | 1.0% |
| Middle Africa | 358 | 0.6% |
| Morocco | 10 | 0.0% |
| Nicaragua | 22 | 0.0% |
| Northern Africa | 10 | 0.0% |
| Northern Europe | 12 | 0.0% |
| Oceania | 68 | 0.1% |
| Philippines | 43 | 0.1% |
| Poland | 15 | 0.0% |
| Romania | 15 | 0.0% |
| Russia | 38 | 0.1% |
| Senegal | 66 | 0.1% |
| Sierra Leone | 35 | 0.1% |
| South America | 113 | 0.2% |
| South Central Asia | 109 | 0.2% |
| South Eastern Asia | 169 | 0.3% |
| Taiwan | 89 | 0.2% |
| Thailand | 9 | 0.0% |
| Vietnam | 59 | 0.1% |
| Western Africa | 178 | 0.3% |
| Western Asia | 27 | 0.1% |
| Western Europe | 56 | 0.1% |
| Yemen | 27 | 0.1% | View All 53 Rows |
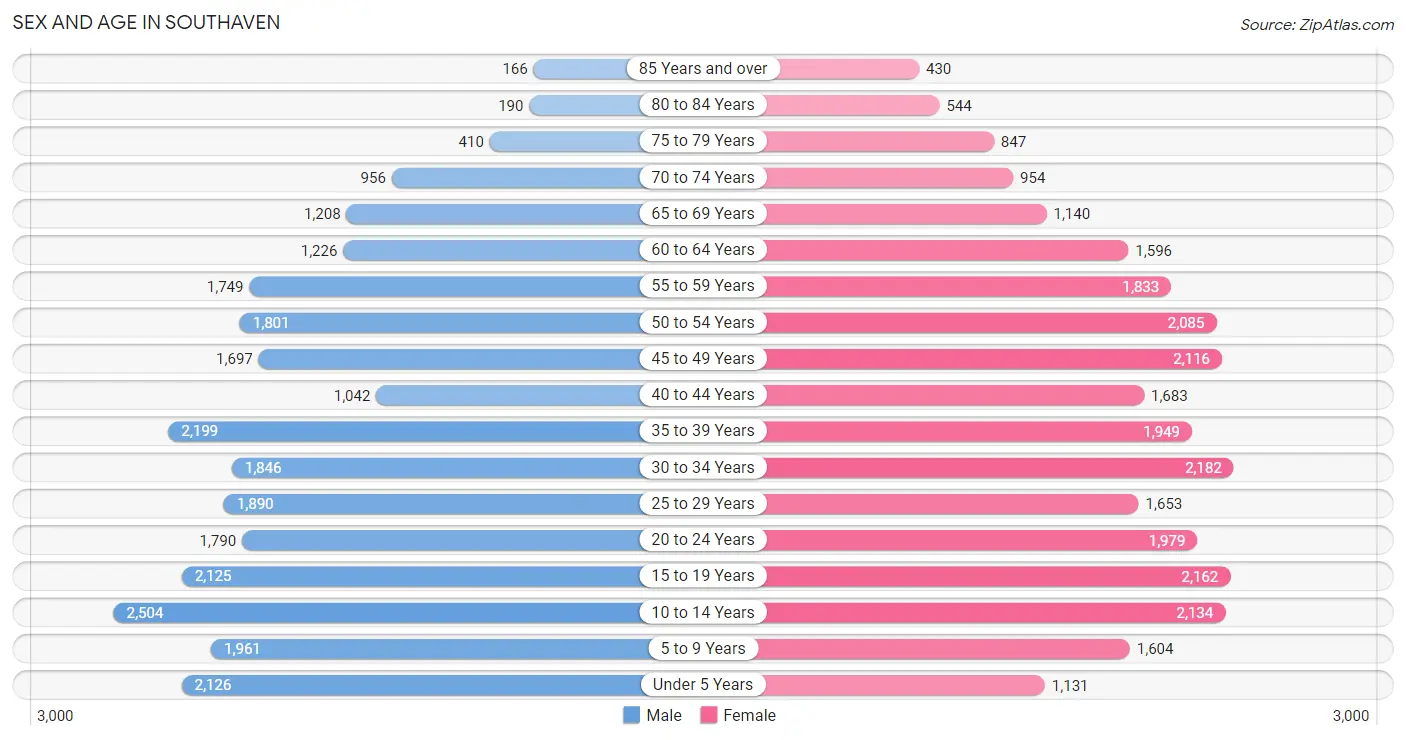
Sex and Age in Southaven
Sex and Age in Southaven
The most populous age groups in Southaven are 10 to 14 Years (2,504 | 9.3%) for men and 30 to 34 Years (2,182 | 7.8%) for women.
| Age Bracket | Male | Female |
| Under 5 Years | 2,126 (7.9%) | 1,131 (4.0%) |
| 5 to 9 Years | 1,961 (7.3%) | 1,604 (5.7%) |
| 10 to 14 Years | 2,504 (9.3%) | 2,134 (7.6%) |
| 15 to 19 Years | 2,125 (7.9%) | 2,162 (7.7%) |
| 20 to 24 Years | 1,790 (6.7%) | 1,979 (7.1%) |
| 25 to 29 Years | 1,890 (7.0%) | 1,653 (5.9%) |
| 30 to 34 Years | 1,846 (6.9%) | 2,182 (7.8%) |
| 35 to 39 Years | 2,199 (8.2%) | 1,949 (7.0%) |
| 40 to 44 Years | 1,042 (3.9%) | 1,683 (6.0%) |
| 45 to 49 Years | 1,697 (6.3%) | 2,116 (7.5%) |
| 50 to 54 Years | 1,801 (6.7%) | 2,085 (7.4%) |
| 55 to 59 Years | 1,749 (6.5%) | 1,833 (6.5%) |
| 60 to 64 Years | 1,226 (4.6%) | 1,596 (5.7%) |
| 65 to 69 Years | 1,208 (4.5%) | 1,140 (4.1%) |
| 70 to 74 Years | 956 (3.6%) | 954 (3.4%) |
| 75 to 79 Years | 410 (1.5%) | 847 (3.0%) |
| 80 to 84 Years | 190 (0.7%) | 544 (1.9%) |
| 85 Years and over | 166 (0.6%) | 430 (1.5%) |
| Total | 26,886 (100.0%) | 28,022 (100.0%) |
Families and Households in Southaven
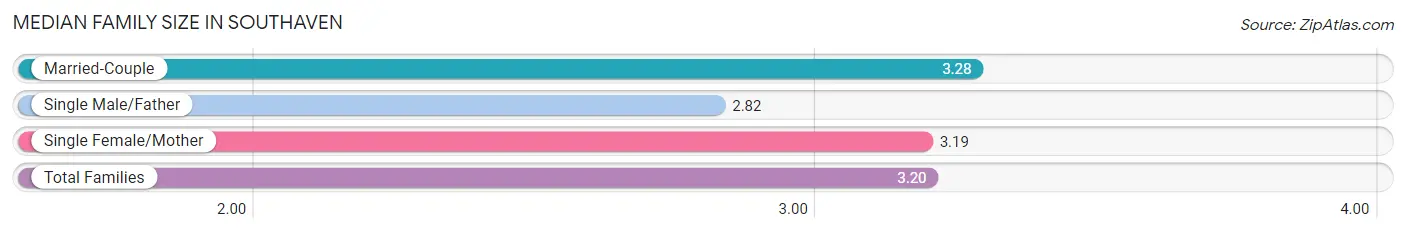
Median Family Size in Southaven
The median family size in Southaven is 3.20 persons per family, with married-couple families (9,602 | 66.2%) accounting for the largest median family size of 3.28 persons per family. On the other hand, single male/father families (1,763 | 12.2%) represent the smallest median family size with 2.82 persons per family.
| Family Type | # Families | Family Size |
| Married-Couple | 9,602 (66.2%) | 3.28 |
| Single Male/Father | 1,763 (12.2%) | 2.82 |
| Single Female/Mother | 3,132 (21.6%) | 3.19 |
| Total Families | 14,497 (100.0%) | 3.20 |
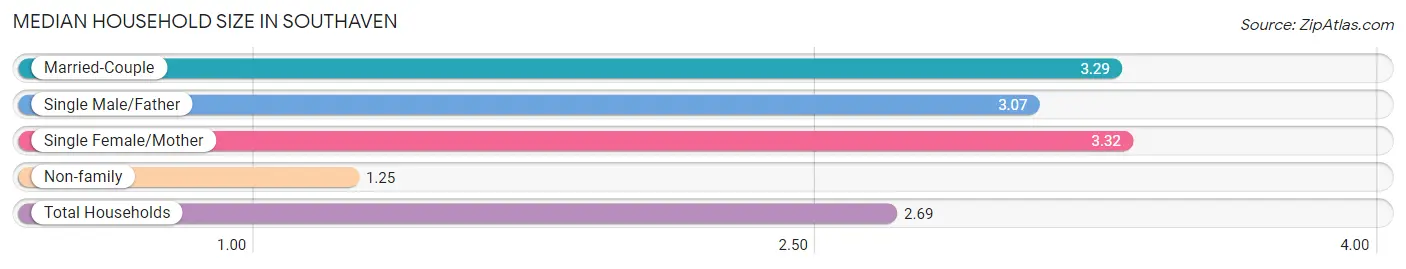
Median Household Size in Southaven
The median household size in Southaven is 2.69 persons per household, with single female/mother households (3,132 | 15.5%) accounting for the largest median household size of 3.32 persons per household. non-family households (5,765 | 28.4%) represent the smallest median household size with 1.25 persons per household.
| Household Type | # Households | Household Size |
| Married-Couple | 9,602 (47.4%) | 3.29 |
| Single Male/Father | 1,763 (8.7%) | 3.07 |
| Single Female/Mother | 3,132 (15.5%) | 3.32 |
| Non-family | 5,765 (28.4%) | 1.25 |
| Total Households | 20,262 (100.0%) | 2.69 |
Household Size by Marriage Status in Southaven
Out of a total of 20,262 households in Southaven, 14,497 (71.6%) are family households, while 5,765 (28.4%) are nonfamily households. The most numerous type of family households are 2-person households, comprising 5,190, and the most common type of nonfamily households are 1-person households, comprising 4,594.
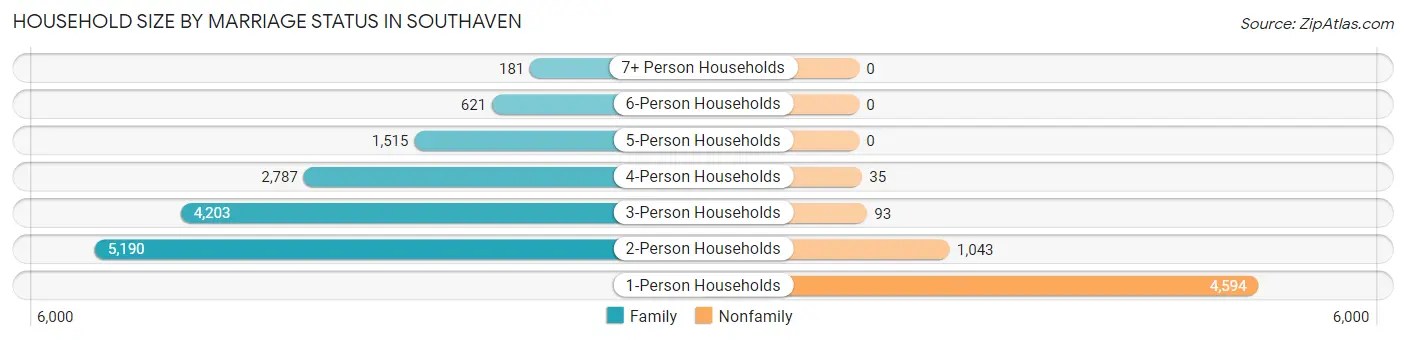
| Household Size | Family Households | Nonfamily Households |
| 1-Person Households | - | 4,594 (22.7%) |
| 2-Person Households | 5,190 (25.6%) | 1,043 (5.1%) |
| 3-Person Households | 4,203 (20.7%) | 93 (0.5%) |
| 4-Person Households | 2,787 (13.8%) | 35 (0.2%) |
| 5-Person Households | 1,515 (7.5%) | 0 (0.0%) |
| 6-Person Households | 621 (3.1%) | 0 (0.0%) |
| 7+ Person Households | 181 (0.9%) | 0 (0.0%) |
| Total | 14,497 (71.6%) | 5,765 (28.4%) |
Female Fertility in Southaven
Fertility by Age in Southaven
Average fertility rate in Southaven is 72.0 births per 1,000 women. Women in the age bracket of 20 to 34 years have the highest fertility rate with 152.0 births per 1,000 women. Women in the age bracket of 20 to 34 years acount for 85.1% of all women with births.
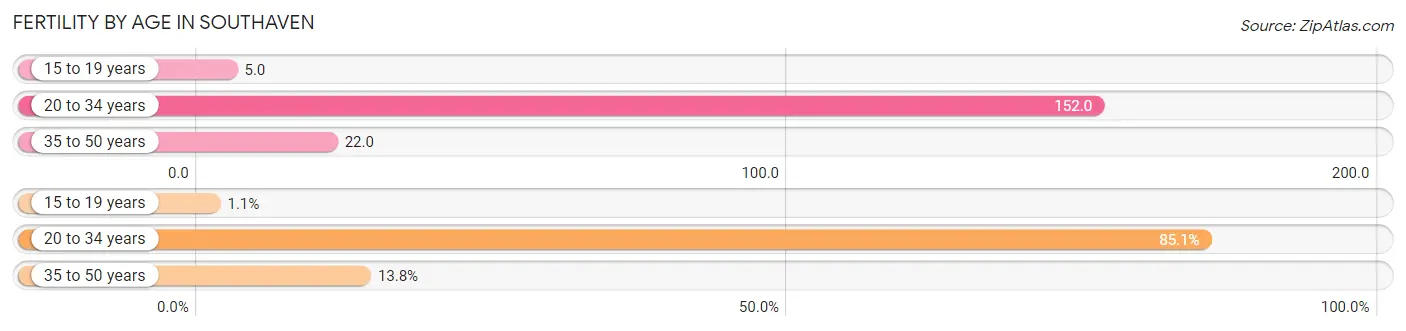
| Age Bracket | Women with Births | Births / 1,000 Women |
| 15 to 19 years | 11 (1.1%) | 5.0 |
| 20 to 34 years | 881 (85.1%) | 152.0 |
| 35 to 50 years | 143 (13.8%) | 22.0 |
| Total | 1,035 (100.0%) | 72.0 |
Fertility by Age by Marriage Status in Southaven
67.6% of women with births (1,035) in Southaven are married. The highest percentage of unmarried women with births falls into 15 to 19 years age bracket with 100.0% of them unmarried at the time of birth, while the lowest percentage of unmarried women with births belong to 35 to 50 years age bracket with 13.3% of them unmarried.
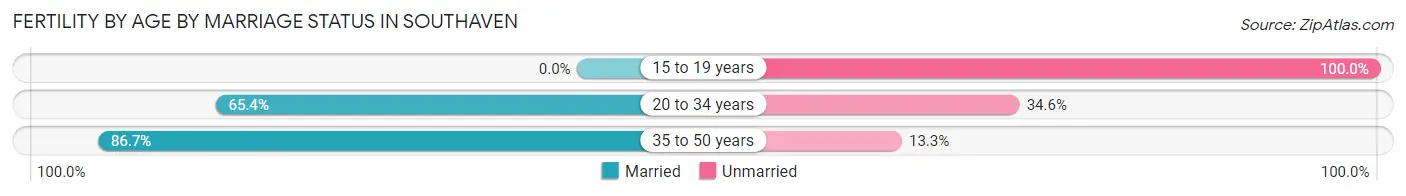
| Age Bracket | Married | Unmarried |
| 15 to 19 years | 0 (0.0%) | 11 (100.0%) |
| 20 to 34 years | 576 (65.4%) | 305 (34.6%) |
| 35 to 50 years | 124 (86.7%) | 19 (13.3%) |
| Total | 700 (67.6%) | 335 (32.4%) |
Fertility by Education in Southaven
Average fertility rate in Southaven is 72.0 births per 1,000 women. Women with the education attainment of graduate degree have the highest fertility rate of 114.0 births per 1,000 women, while women with the education attainment of high school diploma have the lowest fertility at 53.0 births per 1,000 women. Women with the education attainment of college or associate's degree represent 38.5% of all women with births.
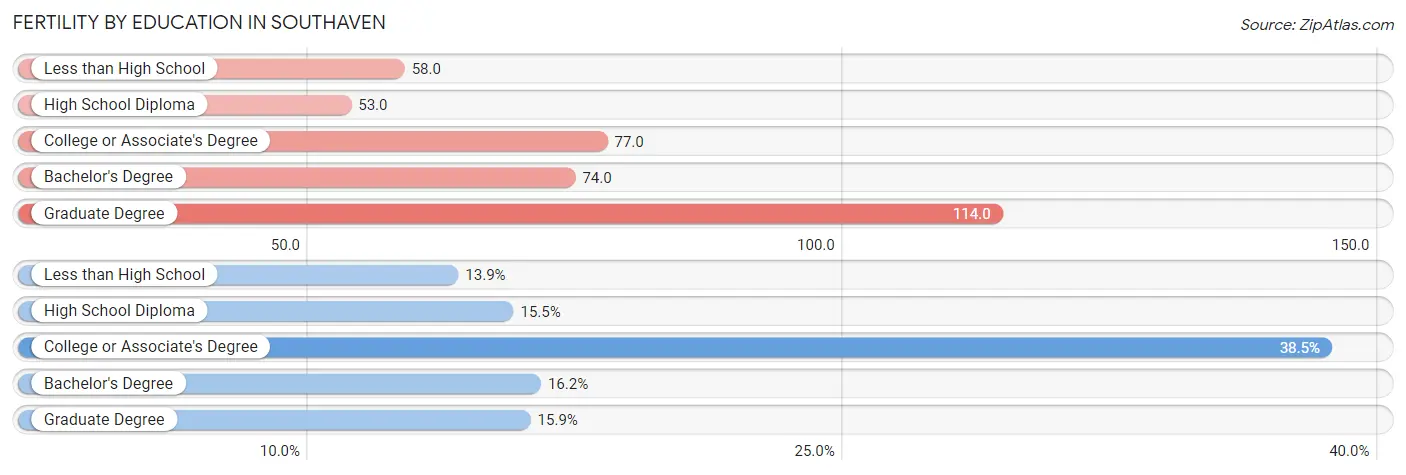
| Educational Attainment | Women with Births | Births / 1,000 Women |
| Less than High School | 144 (13.9%) | 58.0 |
| High School Diploma | 160 (15.5%) | 53.0 |
| College or Associate's Degree | 398 (38.5%) | 77.0 |
| Bachelor's Degree | 168 (16.2%) | 74.0 |
| Graduate Degree | 165 (15.9%) | 114.0 |
| Total | 1,035 (100.0%) | 72.0 |
Fertility by Education by Marriage Status in Southaven
32.4% of women with births in Southaven are unmarried. Women with the educational attainment of bachelor's degree are most likely to be married with 100.0% of them married at childbirth, while women with the educational attainment of less than high school are least likely to be married with 77.8% of them unmarried at childbirth.
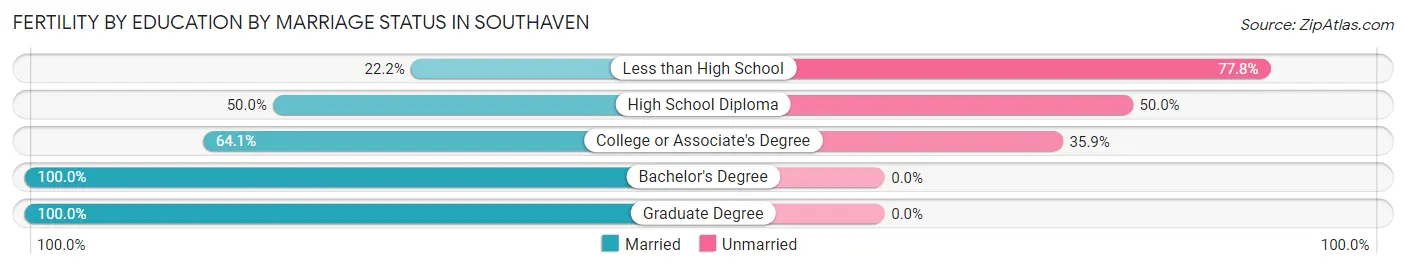
| Educational Attainment | Married | Unmarried |
| Less than High School | 32 (22.2%) | 112 (77.8%) |
| High School Diploma | 80 (50.0%) | 80 (50.0%) |
| College or Associate's Degree | 255 (64.1%) | 143 (35.9%) |
| Bachelor's Degree | 168 (100.0%) | 0 (0.0%) |
| Graduate Degree | 165 (100.0%) | 0 (0.0%) |
| Total | 700 (67.6%) | 335 (32.4%) |
Employment Characteristics in Southaven
Employment by Class of Employer in Southaven
Among the 26,979 employed individuals in Southaven, private company employees (19,129 | 70.9%), not-for-profit organizations (2,357 | 8.7%), and local government employees (1,910 | 7.1%) make up the most common classes of employment.
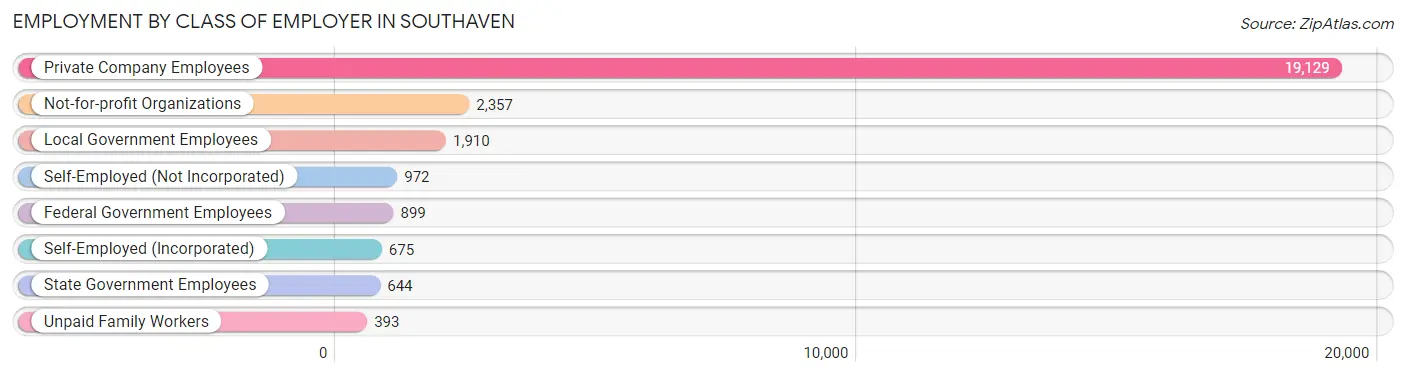
| Employer Class | # Employees | % Employees |
| Private Company Employees | 19,129 | 70.9% |
| Self-Employed (Incorporated) | 675 | 2.5% |
| Self-Employed (Not Incorporated) | 972 | 3.6% |
| Not-for-profit Organizations | 2,357 | 8.7% |
| Local Government Employees | 1,910 | 7.1% |
| State Government Employees | 644 | 2.4% |
| Federal Government Employees | 899 | 3.3% |
| Unpaid Family Workers | 393 | 1.5% |
| Total | 26,979 | 100.0% |
Employment Status by Age in Southaven
According to the labor force statistics for Southaven, out of the total population over 16 years of age (42,317), 67.8% or 28,691 individuals are in the labor force, with 4.1% or 1,176 of them unemployed. The age group with the highest labor force participation rate is 45 to 54 years, with 89.8% or 6,914 individuals in the labor force. Within the labor force, the 20 to 24 years age range has the highest percentage of unemployed individuals, with 11.9% or 292 of them being unemployed.
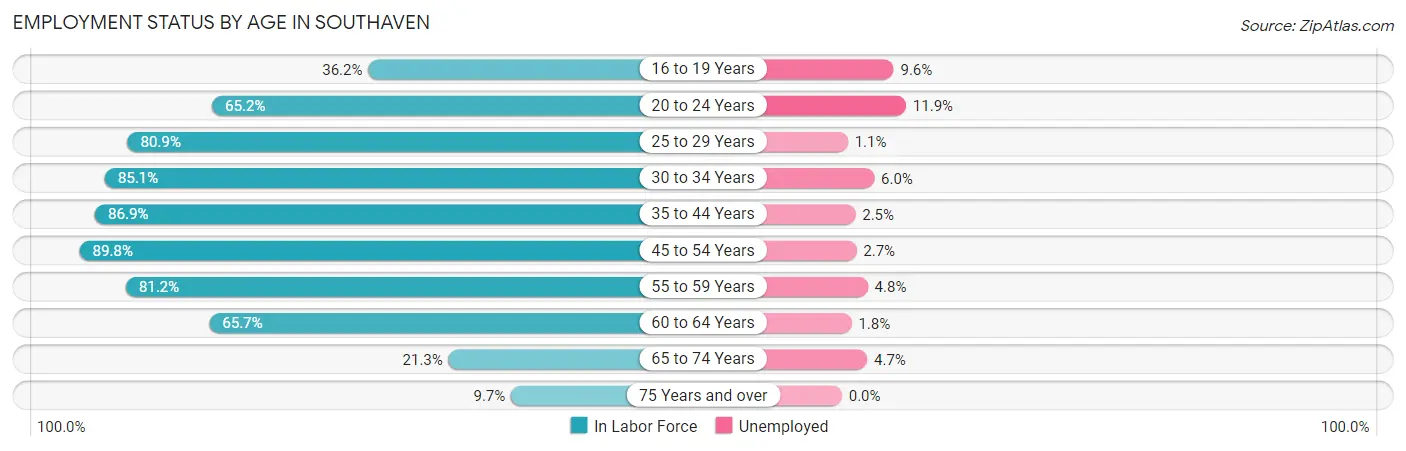
| Age Bracket | In Labor Force | Unemployed |
| 16 to 19 Years | 1,142 (36.2%) | 110 (9.6%) |
| 20 to 24 Years | 2,457 (65.2%) | 292 (11.9%) |
| 25 to 29 Years | 2,866 (80.9%) | 32 (1.1%) |
| 30 to 34 Years | 3,428 (85.1%) | 206 (6.0%) |
| 35 to 44 Years | 5,973 (86.9%) | 149 (2.5%) |
| 45 to 54 Years | 6,914 (89.8%) | 187 (2.7%) |
| 55 to 59 Years | 2,909 (81.2%) | 140 (4.8%) |
| 60 to 64 Years | 1,854 (65.7%) | 33 (1.8%) |
| 65 to 74 Years | 907 (21.3%) | 43 (4.7%) |
| 75 Years and over | 251 (9.7%) | 0 (0.0%) |
| Total | 28,691 (67.8%) | 1,176 (4.1%) |
Employment Status by Educational Attainment in Southaven
According to labor force statistics for Southaven, 83.9% of individuals (23,951) out of the total population between 25 and 64 years of age (28,547) are in the labor force, with 3.1% or 742 of them being unemployed. The group with the highest labor force participation rate are those with the educational attainment of bachelor's degree or higher, with 92.0% or 7,294 individuals in the labor force. Within the labor force, individuals with less than high school education have the highest percentage of unemployment, with 11.0% or 152 of them being unemployed.
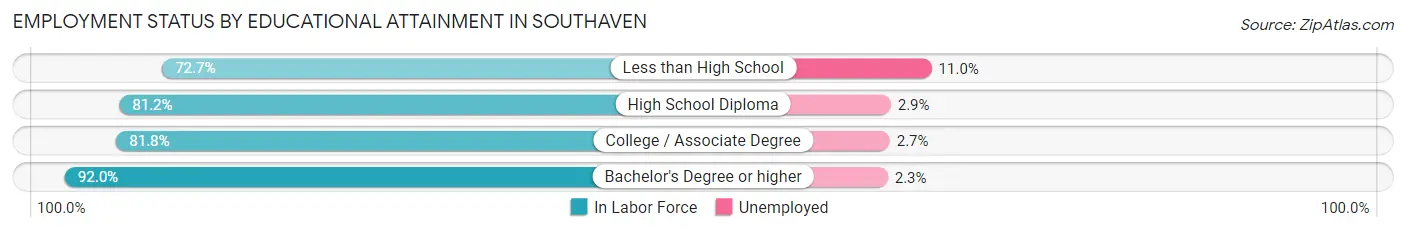
| Educational Attainment | In Labor Force | Unemployed |
| Less than High School | 1,380 (72.7%) | 209 (11.0%) |
| High School Diploma | 6,183 (81.2%) | 221 (2.9%) |
| College / Associate Degree | 9,086 (81.8%) | 300 (2.7%) |
| Bachelor's Degree or higher | 7,294 (92.0%) | 182 (2.3%) |
| Total | 23,951 (83.9%) | 885 (3.1%) |
Employment Occupations by Sex in Southaven
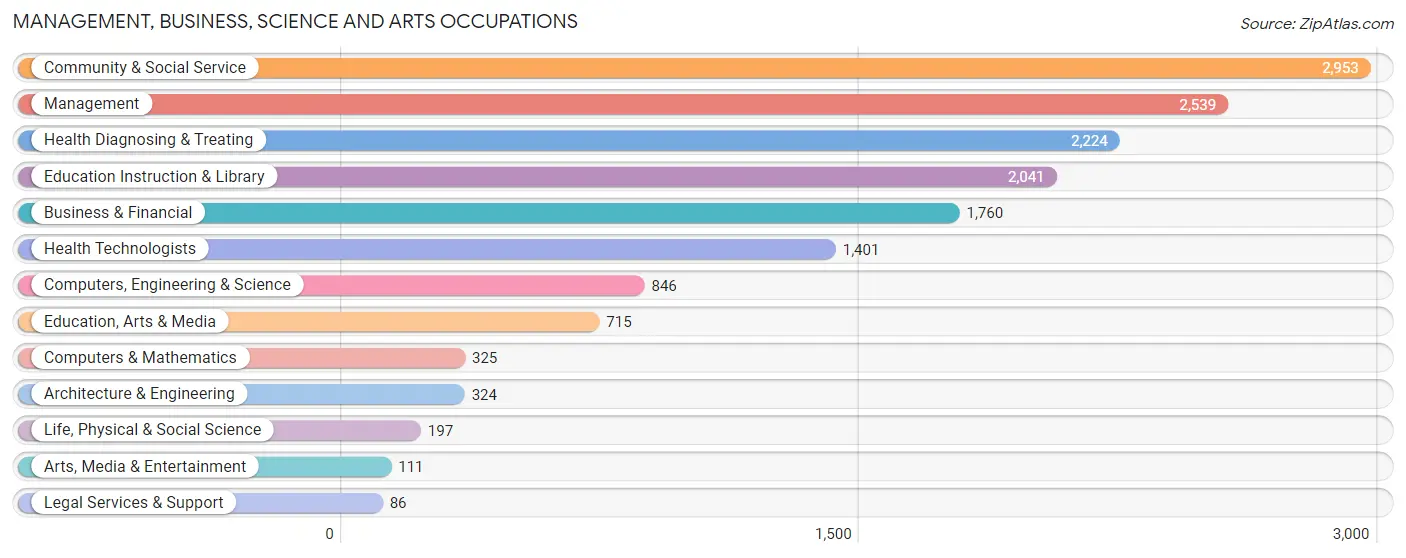
Management, Business, Science and Arts Occupations
The most common Management, Business, Science and Arts occupations in Southaven are Community & Social Service (2,953 | 10.8%), Management (2,539 | 9.3%), Health Diagnosing & Treating (2,224 | 8.1%), Education Instruction & Library (2,041 | 7.4%), and Business & Financial (1,760 | 6.4%).
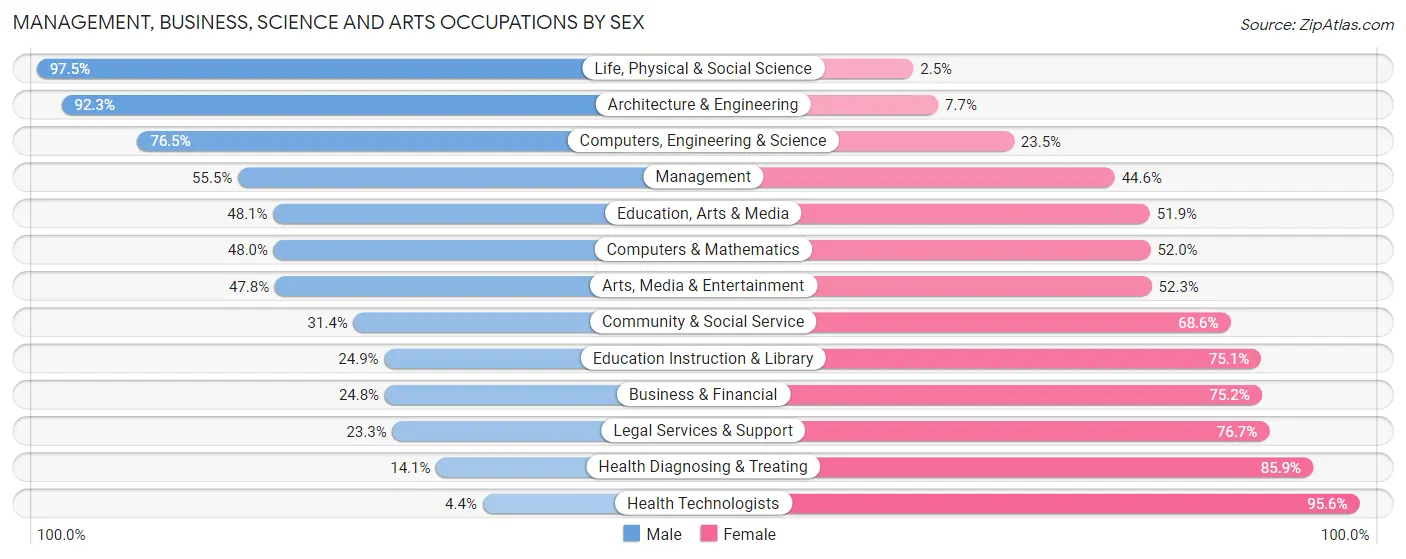
Management, Business, Science and Arts Occupations by Sex
Within the Management, Business, Science and Arts occupations in Southaven, the most male-oriented occupations are Life, Physical & Social Science (97.5%), Architecture & Engineering (92.3%), and Computers, Engineering & Science (76.5%), while the most female-oriented occupations are Health Technologists (95.6%), Health Diagnosing & Treating (85.9%), and Legal Services & Support (76.7%).
| Occupation | Male | Female |
| Management | 1,408 (55.4%) | 1,131 (44.6%) |
| Business & Financial | 437 (24.8%) | 1,323 (75.2%) |
| Computers, Engineering & Science | 647 (76.5%) | 199 (23.5%) |
| Computers & Mathematics | 156 (48.0%) | 169 (52.0%) |
| Architecture & Engineering | 299 (92.3%) | 25 (7.7%) |
| Life, Physical & Social Science | 192 (97.5%) | 5 (2.5%) |
| Community & Social Service | 926 (31.4%) | 2,027 (68.6%) |
| Education, Arts & Media | 344 (48.1%) | 371 (51.9%) |
| Legal Services & Support | 20 (23.3%) | 66 (76.7%) |
| Education Instruction & Library | 509 (24.9%) | 1,532 (75.1%) |
| Arts, Media & Entertainment | 53 (47.7%) | 58 (52.2%) |
| Health Diagnosing & Treating | 314 (14.1%) | 1,910 (85.9%) |
| Health Technologists | 62 (4.4%) | 1,339 (95.6%) |
| Total (Category) | 3,732 (36.2%) | 6,590 (63.8%) |
| Total (Overall) | 13,889 (50.7%) | 13,497 (49.3%) |
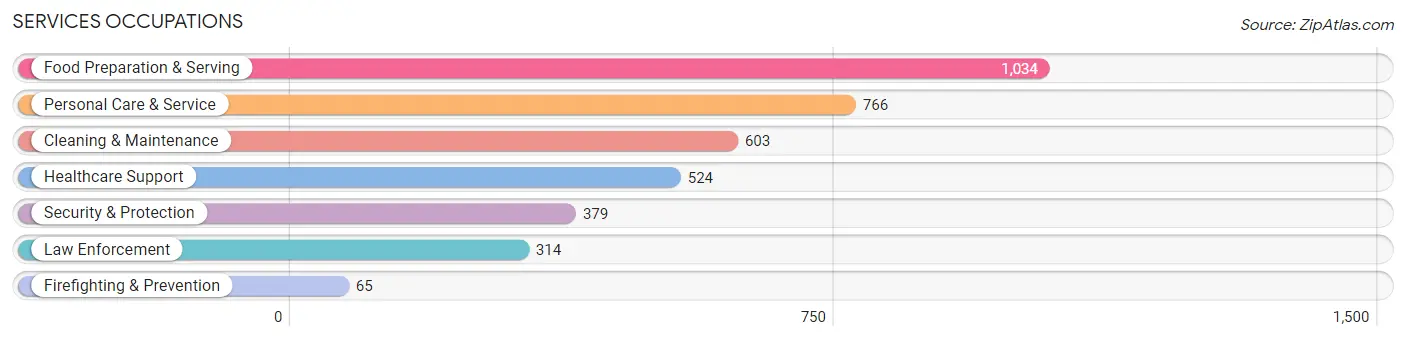
Services Occupations
The most common Services occupations in Southaven are Food Preparation & Serving (1,034 | 3.8%), Personal Care & Service (766 | 2.8%), Cleaning & Maintenance (603 | 2.2%), Healthcare Support (524 | 1.9%), and Security & Protection (379 | 1.4%).
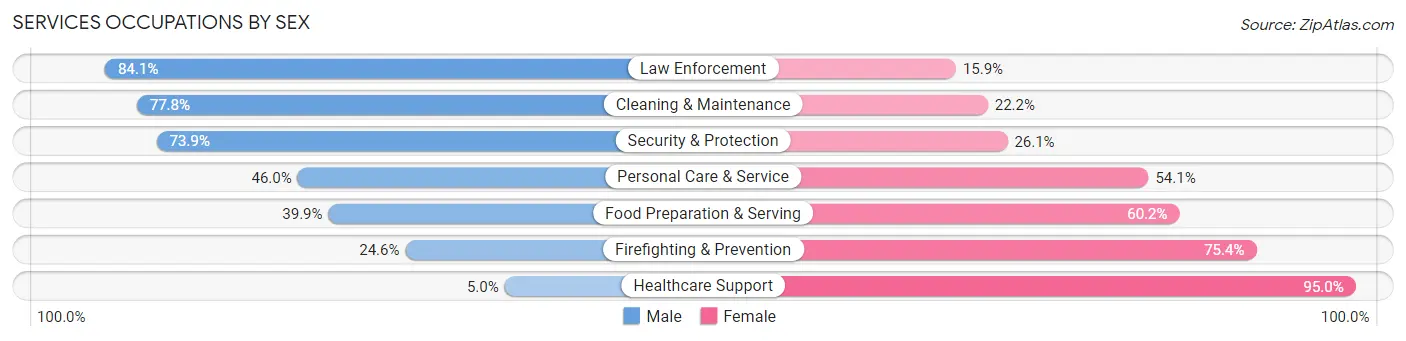
Services Occupations by Sex
Within the Services occupations in Southaven, the most male-oriented occupations are Law Enforcement (84.1%), Cleaning & Maintenance (77.8%), and Security & Protection (73.9%), while the most female-oriented occupations are Healthcare Support (95.0%), Firefighting & Prevention (75.4%), and Food Preparation & Serving (60.2%).
| Occupation | Male | Female |
| Healthcare Support | 26 (5.0%) | 498 (95.0%) |
| Security & Protection | 280 (73.9%) | 99 (26.1%) |
| Firefighting & Prevention | 16 (24.6%) | 49 (75.4%) |
| Law Enforcement | 264 (84.1%) | 50 (15.9%) |
| Food Preparation & Serving | 412 (39.9%) | 622 (60.2%) |
| Cleaning & Maintenance | 469 (77.8%) | 134 (22.2%) |
| Personal Care & Service | 352 (46.0%) | 414 (54.0%) |
| Total (Category) | 1,539 (46.6%) | 1,767 (53.4%) |
| Total (Overall) | 13,889 (50.7%) | 13,497 (49.3%) |
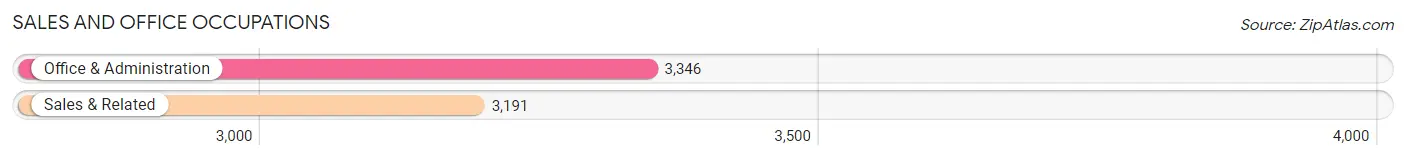
Sales and Office Occupations
The most common Sales and Office occupations in Southaven are Office & Administration (3,346 | 12.2%), and Sales & Related (3,191 | 11.7%).
Sales and Office Occupations by Sex
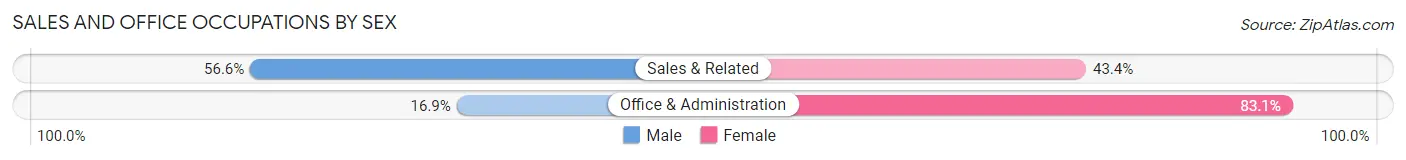
| Occupation | Male | Female |
| Sales & Related | 1,807 (56.6%) | 1,384 (43.4%) |
| Office & Administration | 566 (16.9%) | 2,780 (83.1%) |
| Total (Category) | 2,373 (36.3%) | 4,164 (63.7%) |
| Total (Overall) | 13,889 (50.7%) | 13,497 (49.3%) |
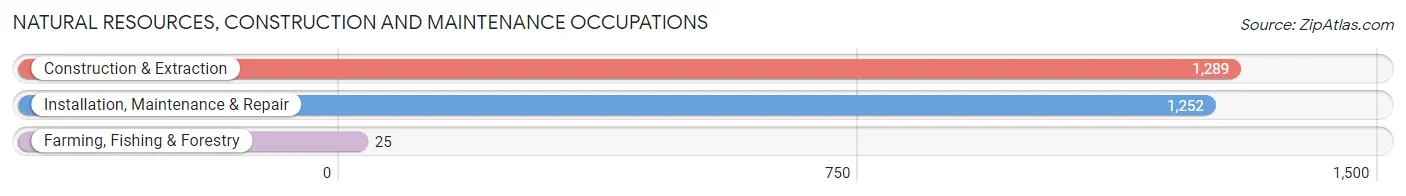
Natural Resources, Construction and Maintenance Occupations
The most common Natural Resources, Construction and Maintenance occupations in Southaven are Construction & Extraction (1,289 | 4.7%), Installation, Maintenance & Repair (1,252 | 4.6%), and Farming, Fishing & Forestry (25 | 0.1%).
Natural Resources, Construction and Maintenance Occupations by Sex
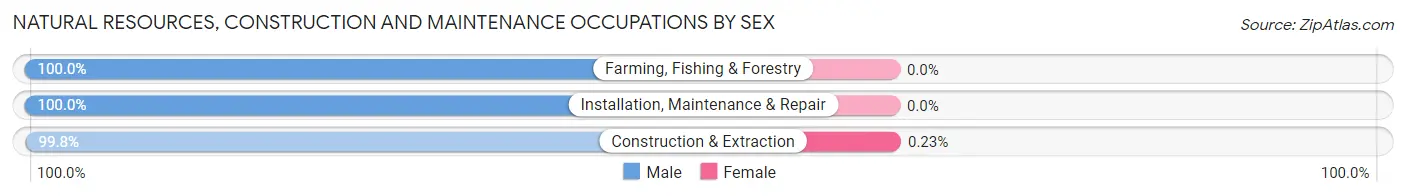
| Occupation | Male | Female |
| Farming, Fishing & Forestry | 25 (100.0%) | 0 (0.0%) |
| Construction & Extraction | 1,286 (99.8%) | 3 (0.2%) |
| Installation, Maintenance & Repair | 1,252 (100.0%) | 0 (0.0%) |
| Total (Category) | 2,563 (99.9%) | 3 (0.1%) |
| Total (Overall) | 13,889 (50.7%) | 13,497 (49.3%) |
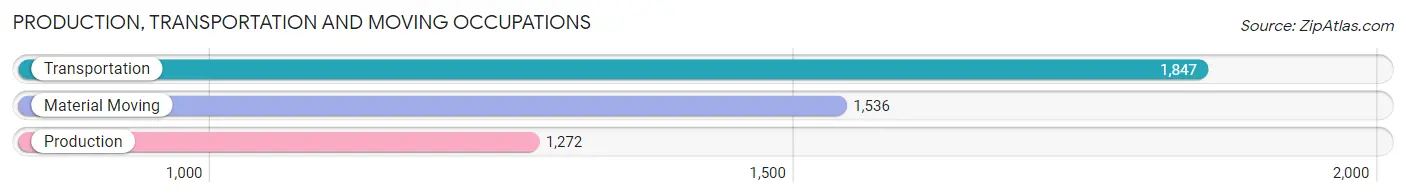
Production, Transportation and Moving Occupations
The most common Production, Transportation and Moving occupations in Southaven are Transportation (1,847 | 6.7%), Material Moving (1,536 | 5.6%), and Production (1,272 | 4.6%).
Production, Transportation and Moving Occupations by Sex
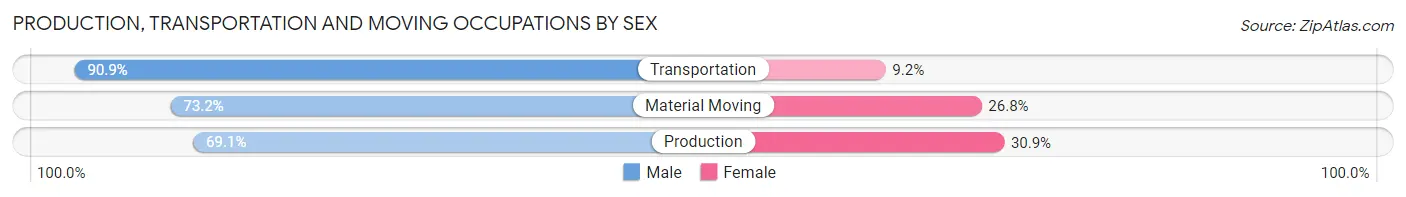
| Occupation | Male | Female |
| Production | 879 (69.1%) | 393 (30.9%) |
| Transportation | 1,678 (90.8%) | 169 (9.1%) |
| Material Moving | 1,125 (73.2%) | 411 (26.8%) |
| Total (Category) | 3,682 (79.1%) | 973 (20.9%) |
| Total (Overall) | 13,889 (50.7%) | 13,497 (49.3%) |
Employment Industries by Sex in Southaven
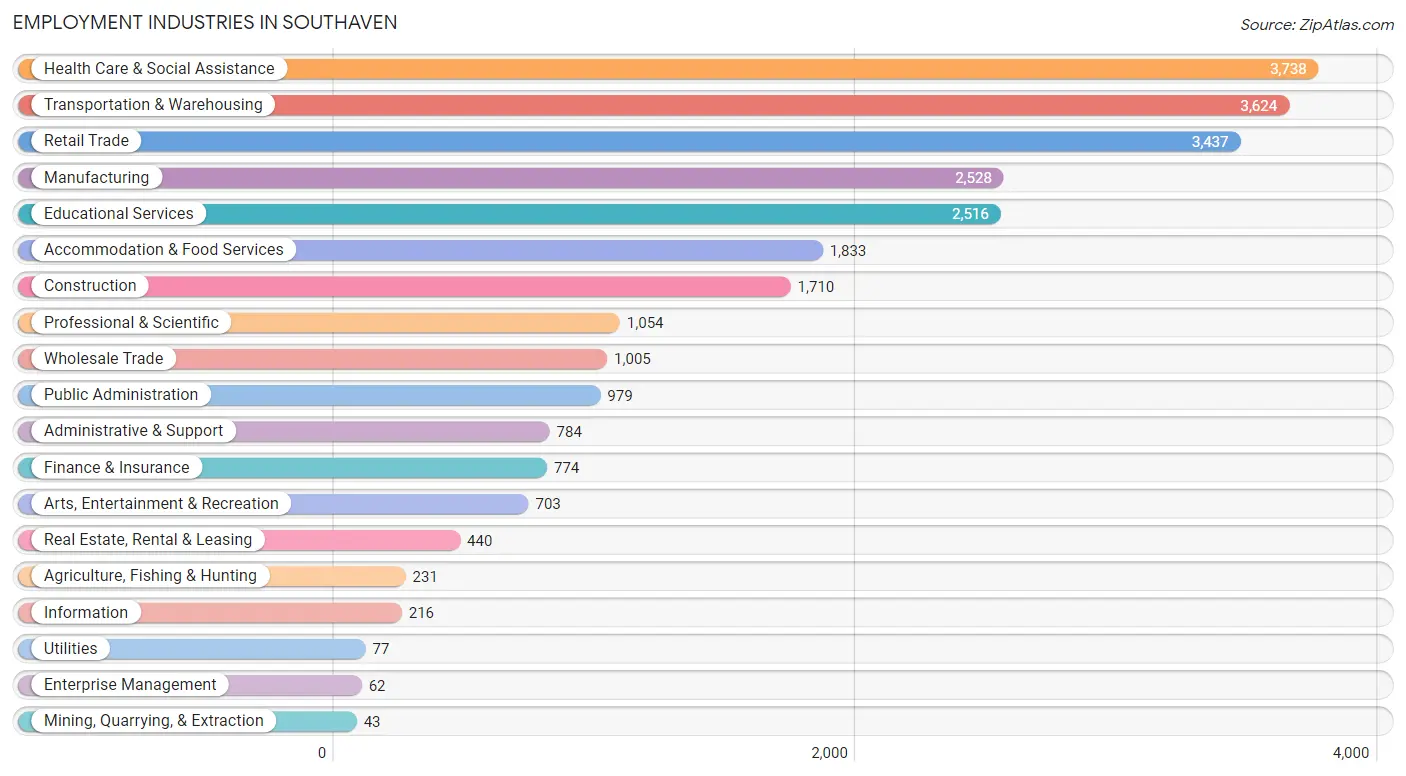
Employment Industries in Southaven
The major employment industries in Southaven include Health Care & Social Assistance (3,738 | 13.7%), Transportation & Warehousing (3,624 | 13.2%), Retail Trade (3,437 | 12.6%), Manufacturing (2,528 | 9.2%), and Educational Services (2,516 | 9.2%).
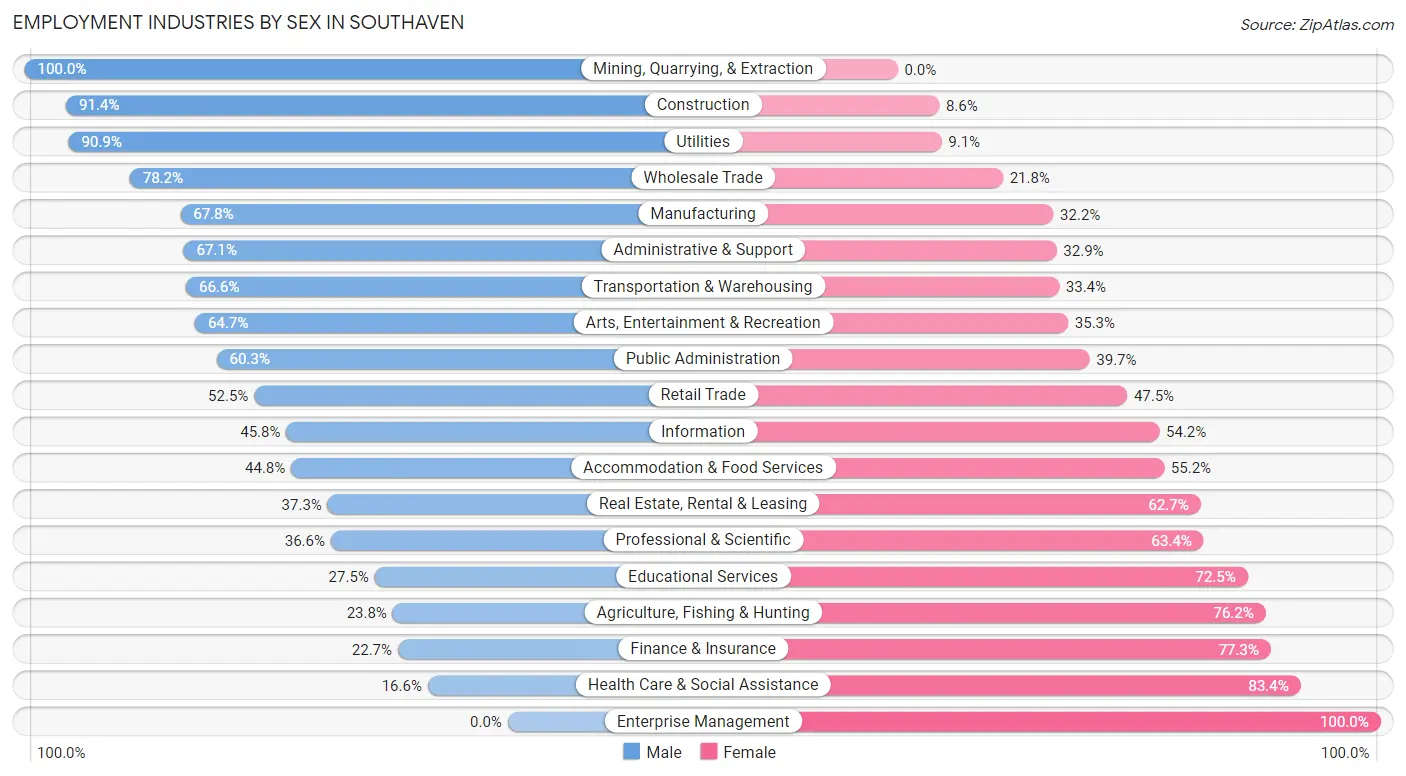
Employment Industries by Sex in Southaven
The Southaven industries that see more men than women are Mining, Quarrying, & Extraction (100.0%), Construction (91.4%), and Utilities (90.9%), whereas the industries that tend to have a higher number of women are Enterprise Management (100.0%), Health Care & Social Assistance (83.4%), and Finance & Insurance (77.3%).
| Industry | Male | Female |
| Agriculture, Fishing & Hunting | 55 (23.8%) | 176 (76.2%) |
| Mining, Quarrying, & Extraction | 43 (100.0%) | 0 (0.0%) |
| Construction | 1,563 (91.4%) | 147 (8.6%) |
| Manufacturing | 1,713 (67.8%) | 815 (32.2%) |
| Wholesale Trade | 786 (78.2%) | 219 (21.8%) |
| Retail Trade | 1,804 (52.5%) | 1,633 (47.5%) |
| Transportation & Warehousing | 2,413 (66.6%) | 1,211 (33.4%) |
| Utilities | 70 (90.9%) | 7 (9.1%) |
| Information | 99 (45.8%) | 117 (54.2%) |
| Finance & Insurance | 176 (22.7%) | 598 (77.3%) |
| Real Estate, Rental & Leasing | 164 (37.3%) | 276 (62.7%) |
| Professional & Scientific | 386 (36.6%) | 668 (63.4%) |
| Enterprise Management | 0 (0.0%) | 62 (100.0%) |
| Administrative & Support | 526 (67.1%) | 258 (32.9%) |
| Educational Services | 693 (27.5%) | 1,823 (72.5%) |
| Health Care & Social Assistance | 619 (16.6%) | 3,119 (83.4%) |
| Arts, Entertainment & Recreation | 455 (64.7%) | 248 (35.3%) |
| Accommodation & Food Services | 822 (44.8%) | 1,011 (55.2%) |
| Public Administration | 590 (60.3%) | 389 (39.7%) |
| Total | 13,889 (50.7%) | 13,497 (49.3%) |
Education in Southaven
School Enrollment in Southaven
The most common levels of schooling among the 14,505 students in Southaven are middle school (3,750 | 25.9%), high school (3,424 | 23.6%), and elementary school (3,209 | 22.1%).
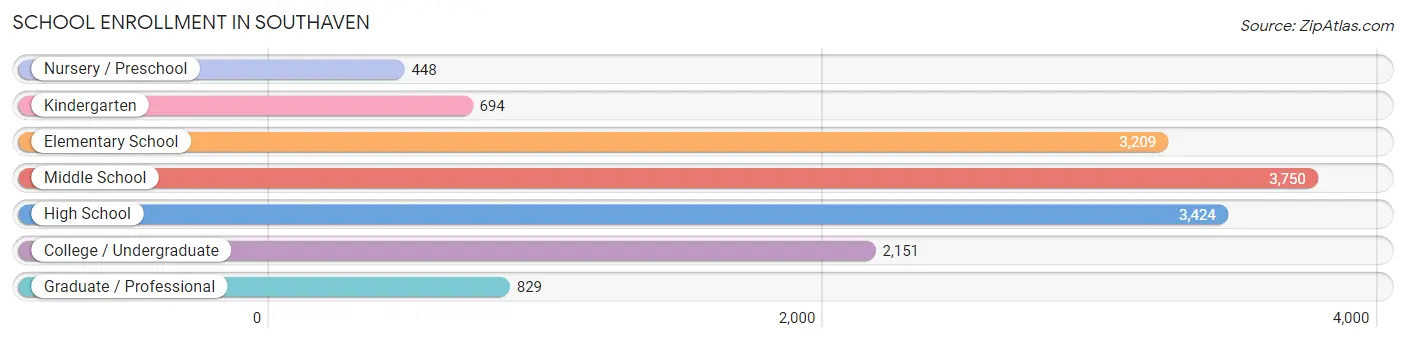
| School Level | # Students | % Students |
| Nursery / Preschool | 448 | 3.1% |
| Kindergarten | 694 | 4.8% |
| Elementary School | 3,209 | 22.1% |
| Middle School | 3,750 | 25.9% |
| High School | 3,424 | 23.6% |
| College / Undergraduate | 2,151 | 14.8% |
| Graduate / Professional | 829 | 5.7% |
| Total | 14,505 | 100.0% |
School Enrollment by Age by Funding Source in Southaven
Out of a total of 14,505 students who are enrolled in schools in Southaven, 2,625 (18.1%) attend a private institution, while the remaining 11,880 (81.9%) are enrolled in public schools. The age group of 3 to 4 year olds has the highest likelihood of being enrolled in private schools, with 202 (47.5% in the age bracket) enrolled. Conversely, the age group of 18 to 19 year olds has the lowest likelihood of being enrolled in a private school, with 812 (89.2% in the age bracket) attending a public institution.
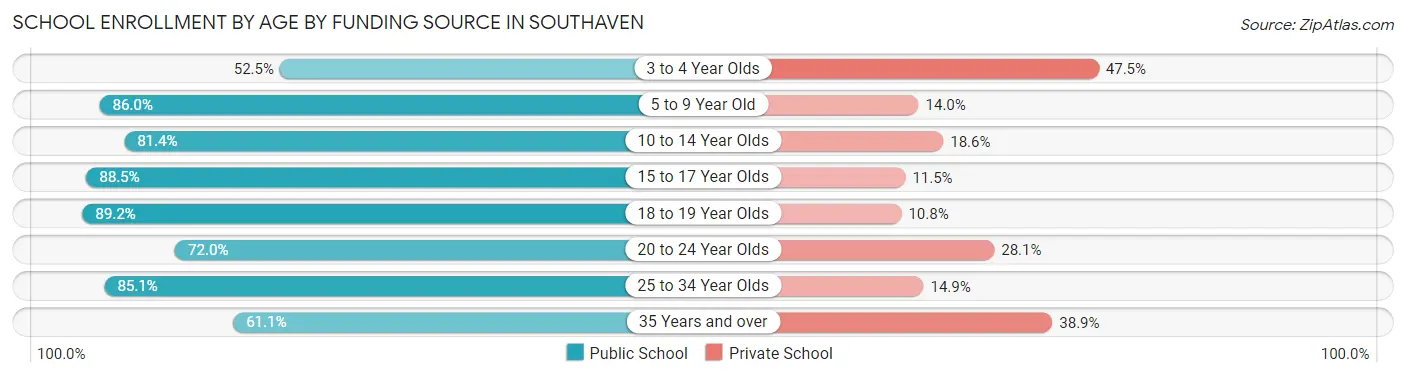
| Age Bracket | Public School | Private School |
| 3 to 4 Year Olds | 223 (52.5%) | 202 (47.5%) |
| 5 to 9 Year Old | 2,890 (86.0%) | 469 (14.0%) |
| 10 to 14 Year Olds | 3,711 (81.4%) | 846 (18.6%) |
| 15 to 17 Year Olds | 2,376 (88.5%) | 309 (11.5%) |
| 18 to 19 Year Olds | 812 (89.2%) | 98 (10.8%) |
| 20 to 24 Year Olds | 785 (72.0%) | 306 (28.1%) |
| 25 to 34 Year Olds | 612 (85.1%) | 107 (14.9%) |
| 35 Years and over | 464 (61.1%) | 295 (38.9%) |
| Total | 11,880 (81.9%) | 2,625 (18.1%) |
Educational Attainment by Field of Study in Southaven
Business (2,178 | 22.3%), education (1,576 | 16.1%), science & technology (1,549 | 15.9%), arts & humanities (1,239 | 12.7%), and bio, nature & agricultural (596 | 6.1%) are the most common fields of study among 9,764 individuals in Southaven who have obtained a bachelor's degree or higher.
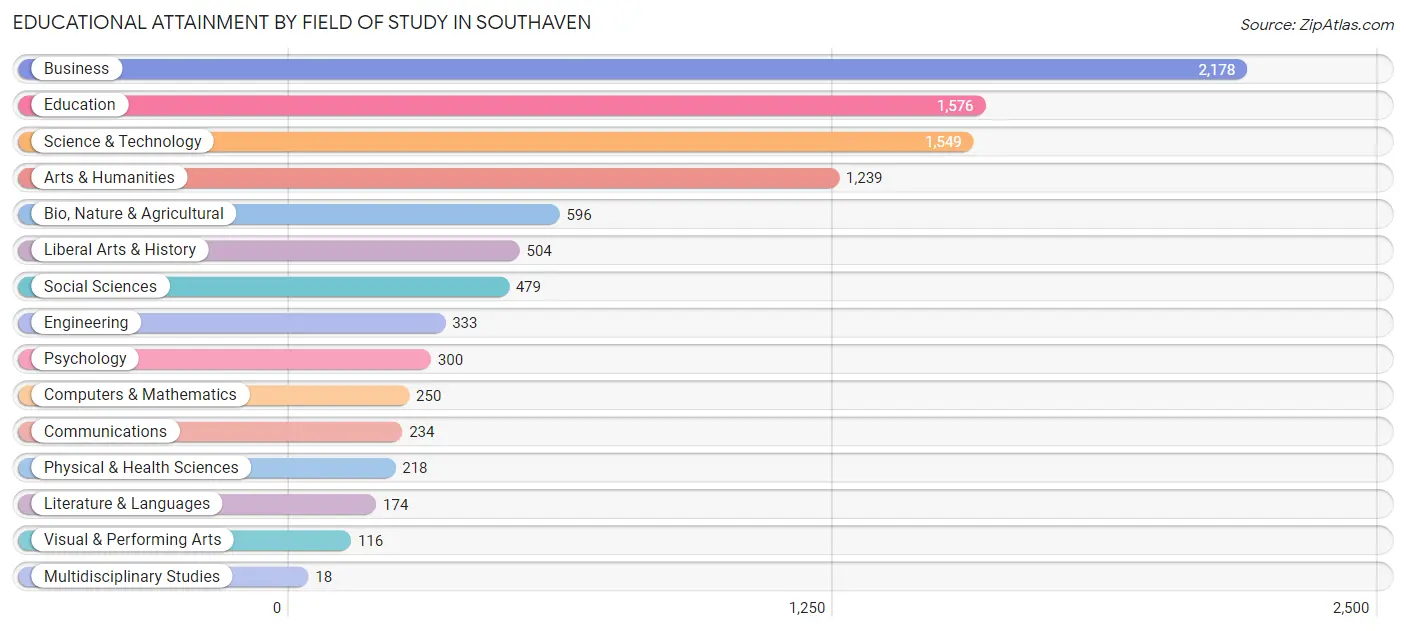
| Field of Study | # Graduates | % Graduates |
| Computers & Mathematics | 250 | 2.6% |
| Bio, Nature & Agricultural | 596 | 6.1% |
| Physical & Health Sciences | 218 | 2.2% |
| Psychology | 300 | 3.1% |
| Social Sciences | 479 | 4.9% |
| Engineering | 333 | 3.4% |
| Multidisciplinary Studies | 18 | 0.2% |
| Science & Technology | 1,549 | 15.9% |
| Business | 2,178 | 22.3% |
| Education | 1,576 | 16.1% |
| Literature & Languages | 174 | 1.8% |
| Liberal Arts & History | 504 | 5.2% |
| Visual & Performing Arts | 116 | 1.2% |
| Communications | 234 | 2.4% |
| Arts & Humanities | 1,239 | 12.7% |
| Total | 9,764 | 100.0% |
Transportation & Commute in Southaven
Vehicle Availability by Sex in Southaven
The most prevalent vehicle ownership categories in Southaven are males with 2 vehicles (5,611, accounting for 41.1%) and females with 2 vehicles (5,686, making up 42.1%).
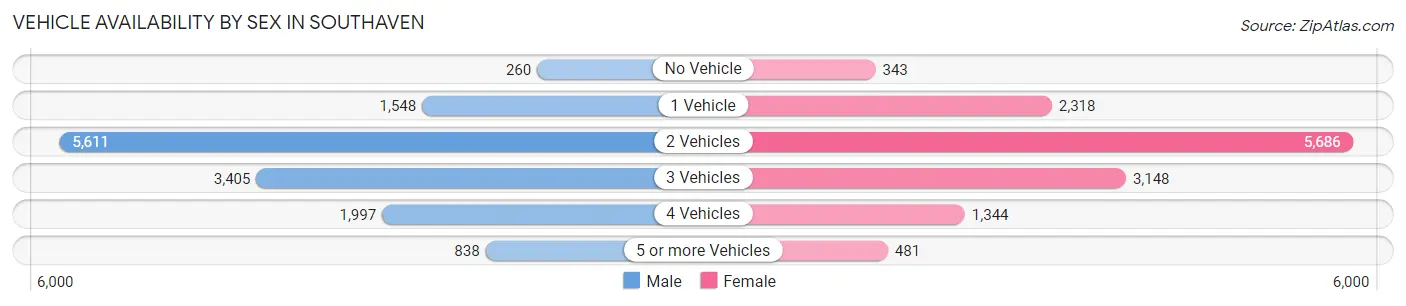
| Vehicles Available | Male | Female |
| No Vehicle | 260 (1.9%) | 343 (2.6%) |
| 1 Vehicle | 1,548 (11.3%) | 2,318 (17.4%) |
| 2 Vehicles | 5,611 (41.1%) | 5,686 (42.7%) |
| 3 Vehicles | 3,405 (24.9%) | 3,148 (23.6%) |
| 4 Vehicles | 1,997 (14.6%) | 1,344 (10.1%) |
| 5 or more Vehicles | 838 (6.1%) | 481 (3.6%) |
| Total | 13,659 (100.0%) | 13,320 (100.0%) |
Commute Time in Southaven
The most frequently occuring commute durations in Southaven are 30 to 34 minutes (4,522 commuters, 17.7%), 15 to 19 minutes (4,193 commuters, 16.5%), and 20 to 24 minutes (3,594 commuters, 14.1%).
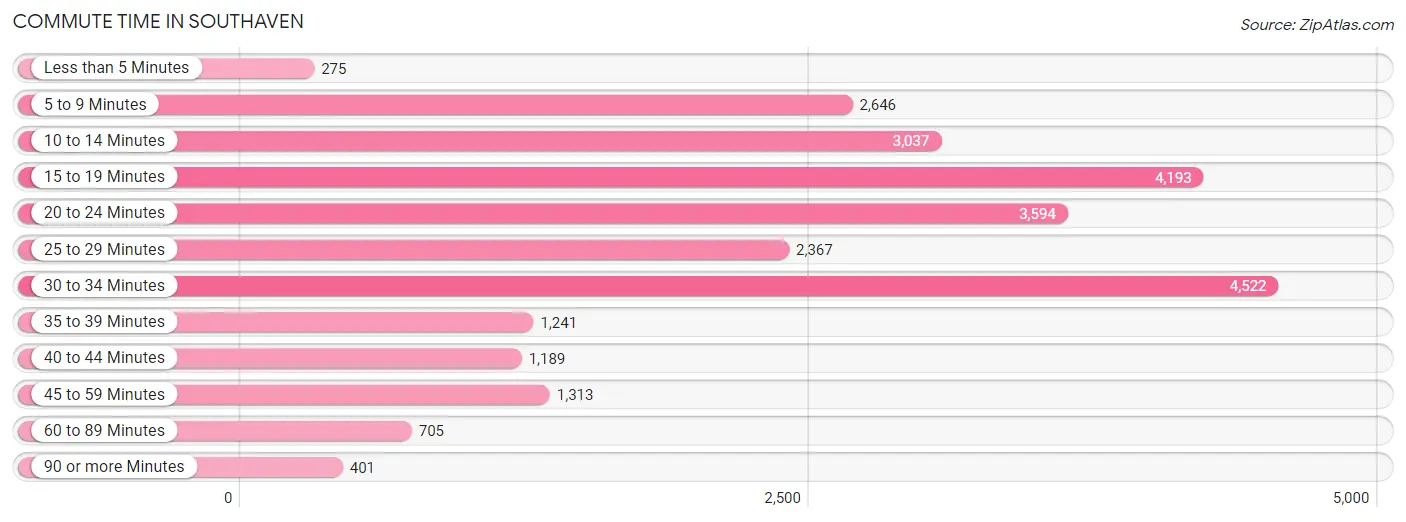
| Commute Time | # Commuters | % Commuters |
| Less than 5 Minutes | 275 | 1.1% |
| 5 to 9 Minutes | 2,646 | 10.4% |
| 10 to 14 Minutes | 3,037 | 11.9% |
| 15 to 19 Minutes | 4,193 | 16.5% |
| 20 to 24 Minutes | 3,594 | 14.1% |
| 25 to 29 Minutes | 2,367 | 9.3% |
| 30 to 34 Minutes | 4,522 | 17.7% |
| 35 to 39 Minutes | 1,241 | 4.9% |
| 40 to 44 Minutes | 1,189 | 4.7% |
| 45 to 59 Minutes | 1,313 | 5.1% |
| 60 to 89 Minutes | 705 | 2.8% |
| 90 or more Minutes | 401 | 1.6% |
Commute Time by Sex in Southaven
The most common commute times in Southaven are 30 to 34 minutes (2,512 commuters, 19.1%) for males and 30 to 34 minutes (2,010 commuters, 16.3%) for females.
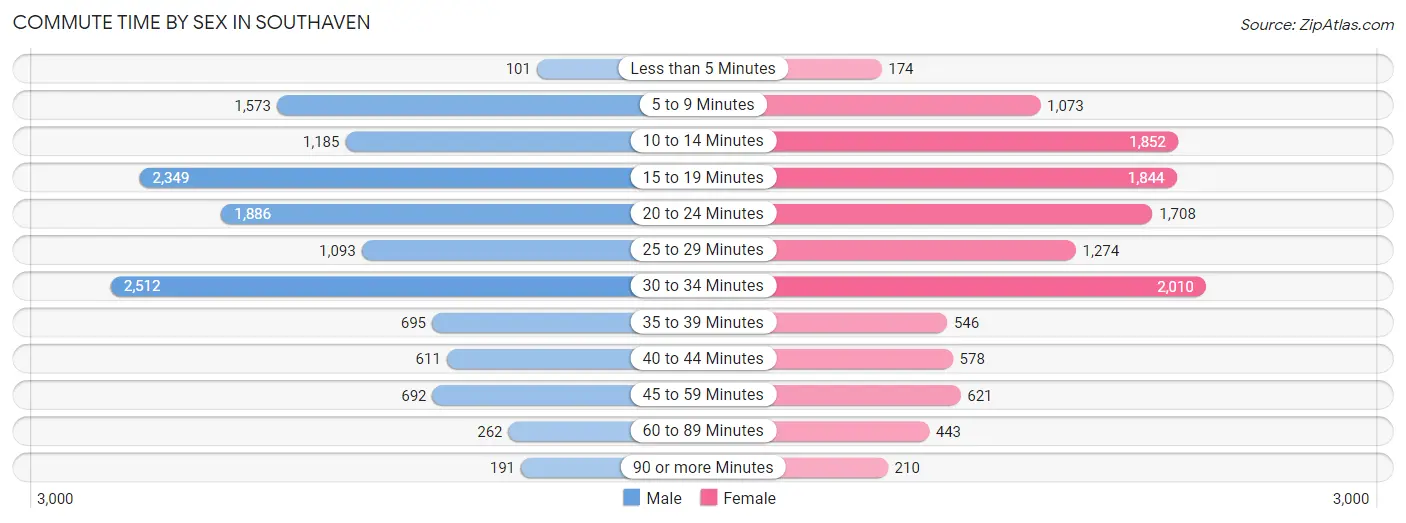
| Commute Time | Male | Female |
| Less than 5 Minutes | 101 (0.8%) | 174 (1.4%) |
| 5 to 9 Minutes | 1,573 (12.0%) | 1,073 (8.7%) |
| 10 to 14 Minutes | 1,185 (9.0%) | 1,852 (15.0%) |
| 15 to 19 Minutes | 2,349 (17.9%) | 1,844 (14.9%) |
| 20 to 24 Minutes | 1,886 (14.3%) | 1,708 (13.9%) |
| 25 to 29 Minutes | 1,093 (8.3%) | 1,274 (10.3%) |
| 30 to 34 Minutes | 2,512 (19.1%) | 2,010 (16.3%) |
| 35 to 39 Minutes | 695 (5.3%) | 546 (4.4%) |
| 40 to 44 Minutes | 611 (4.6%) | 578 (4.7%) |
| 45 to 59 Minutes | 692 (5.3%) | 621 (5.0%) |
| 60 to 89 Minutes | 262 (2.0%) | 443 (3.6%) |
| 90 or more Minutes | 191 (1.5%) | 210 (1.7%) |
Time of Departure to Work by Sex in Southaven
The most frequent times of departure to work in Southaven are 7:00 AM to 7:29 AM (2,077, 15.8%) for males and 7:00 AM to 7:29 AM (2,682, 21.7%) for females.
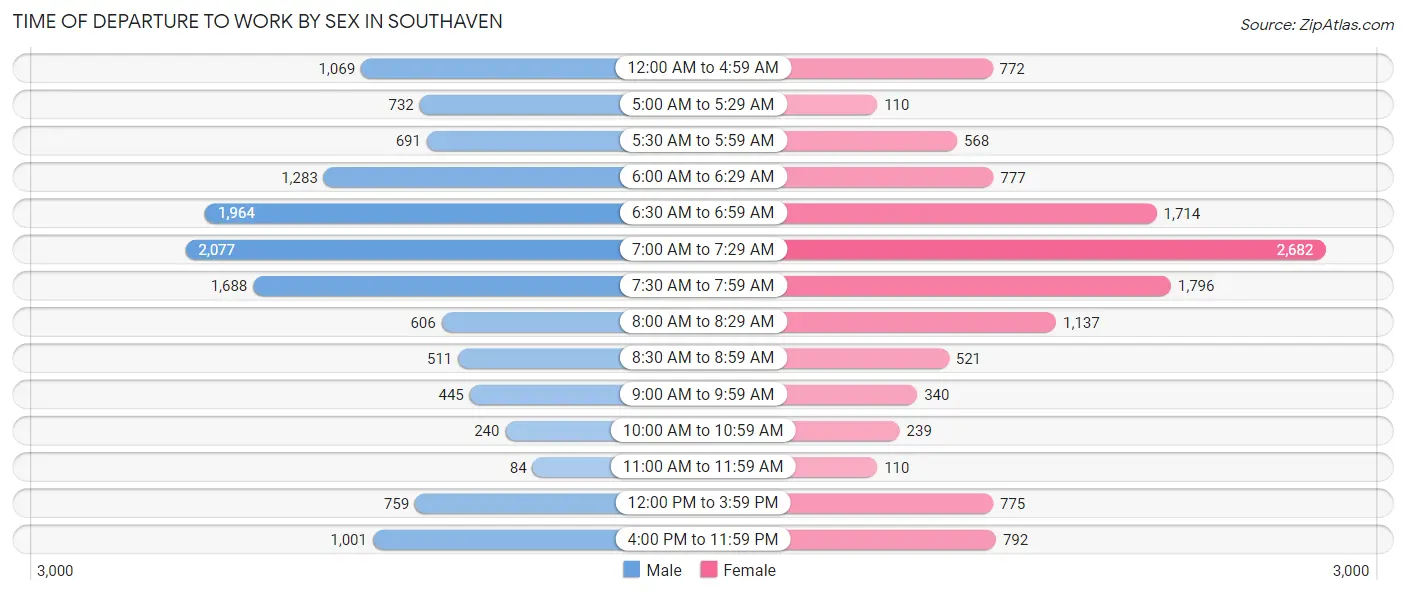
| Time of Departure | Male | Female |
| 12:00 AM to 4:59 AM | 1,069 (8.1%) | 772 (6.3%) |
| 5:00 AM to 5:29 AM | 732 (5.6%) | 110 (0.9%) |
| 5:30 AM to 5:59 AM | 691 (5.2%) | 568 (4.6%) |
| 6:00 AM to 6:29 AM | 1,283 (9.8%) | 777 (6.3%) |
| 6:30 AM to 6:59 AM | 1,964 (14.9%) | 1,714 (13.9%) |
| 7:00 AM to 7:29 AM | 2,077 (15.8%) | 2,682 (21.7%) |
| 7:30 AM to 7:59 AM | 1,688 (12.8%) | 1,796 (14.6%) |
| 8:00 AM to 8:29 AM | 606 (4.6%) | 1,137 (9.2%) |
| 8:30 AM to 8:59 AM | 511 (3.9%) | 521 (4.2%) |
| 9:00 AM to 9:59 AM | 445 (3.4%) | 340 (2.8%) |
| 10:00 AM to 10:59 AM | 240 (1.8%) | 239 (1.9%) |
| 11:00 AM to 11:59 AM | 84 (0.6%) | 110 (0.9%) |
| 12:00 PM to 3:59 PM | 759 (5.8%) | 775 (6.3%) |
| 4:00 PM to 11:59 PM | 1,001 (7.6%) | 792 (6.4%) |
| Total | 13,150 (100.0%) | 12,333 (100.0%) |
Housing Occupancy in Southaven
Occupancy by Ownership in Southaven
Of the total 20,262 dwellings in Southaven, owner-occupied units account for 14,356 (70.9%), while renter-occupied units make up 5,906 (29.1%).
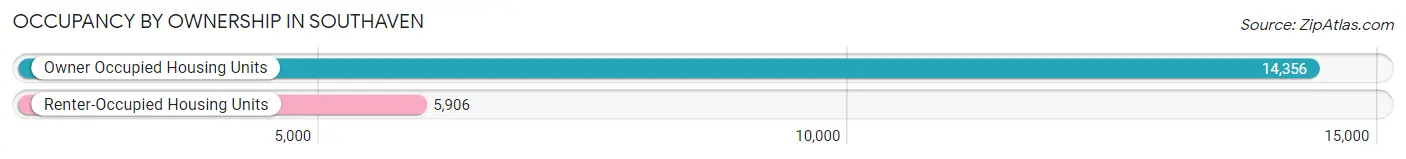
| Occupancy | # Housing Units | % Housing Units |
| Owner Occupied Housing Units | 14,356 | 70.9% |
| Renter-Occupied Housing Units | 5,906 | 29.1% |
| Total Occupied Housing Units | 20,262 | 100.0% |
Occupancy by Household Size in Southaven
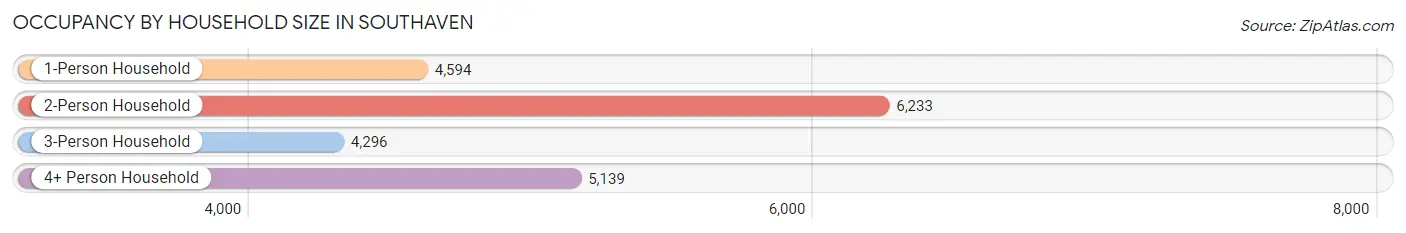
| Household Size | # Housing Units | % Housing Units |
| 1-Person Household | 4,594 | 22.7% |
| 2-Person Household | 6,233 | 30.8% |
| 3-Person Household | 4,296 | 21.2% |
| 4+ Person Household | 5,139 | 25.4% |
| Total Housing Units | 20,262 | 100.0% |
Occupancy by Ownership by Household Size in Southaven
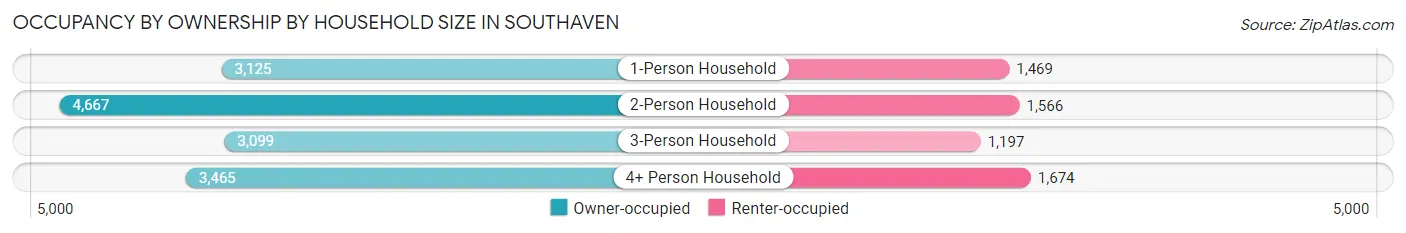
| Household Size | Owner-occupied | Renter-occupied |
| 1-Person Household | 3,125 (68.0%) | 1,469 (32.0%) |
| 2-Person Household | 4,667 (74.9%) | 1,566 (25.1%) |
| 3-Person Household | 3,099 (72.1%) | 1,197 (27.9%) |
| 4+ Person Household | 3,465 (67.4%) | 1,674 (32.6%) |
| Total Housing Units | 14,356 (70.9%) | 5,906 (29.1%) |
Occupancy by Educational Attainment in Southaven
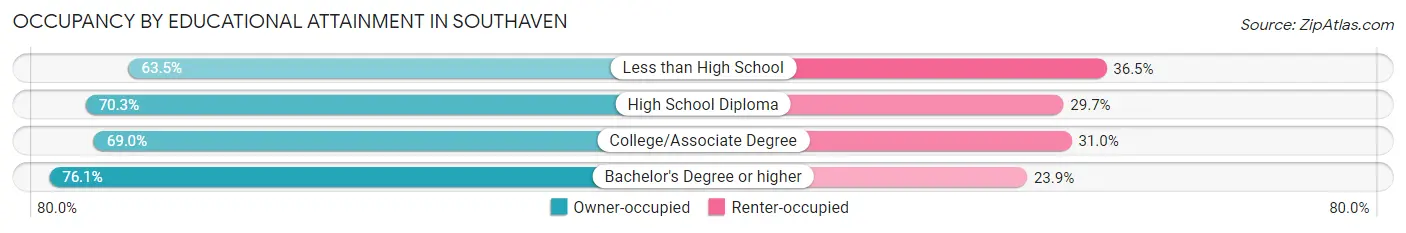
| Household Size | Owner-occupied | Renter-occupied |
| Less than High School | 939 (63.5%) | 540 (36.5%) |
| High School Diploma | 3,910 (70.3%) | 1,652 (29.7%) |
| College/Associate Degree | 5,384 (69.0%) | 2,418 (31.0%) |
| Bachelor's Degree or higher | 4,123 (76.1%) | 1,296 (23.9%) |
Occupancy by Age of Householder in Southaven
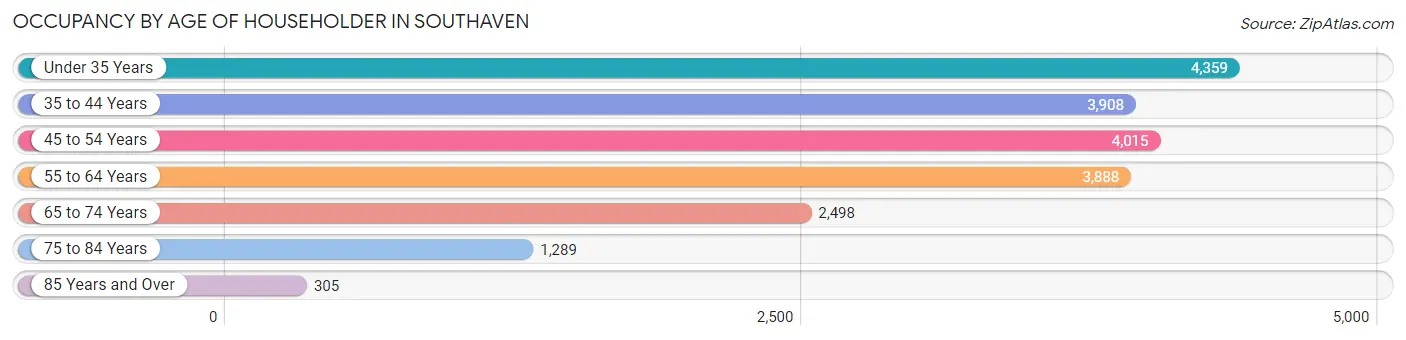
| Age Bracket | # Households | % Households |
| Under 35 Years | 4,359 | 21.5% |
| 35 to 44 Years | 3,908 | 19.3% |
| 45 to 54 Years | 4,015 | 19.8% |
| 55 to 64 Years | 3,888 | 19.2% |
| 65 to 74 Years | 2,498 | 12.3% |
| 75 to 84 Years | 1,289 | 6.4% |
| 85 Years and Over | 305 | 1.5% |
| Total | 20,262 | 100.0% |
Housing Finances in Southaven
Median Income by Occupancy in Southaven
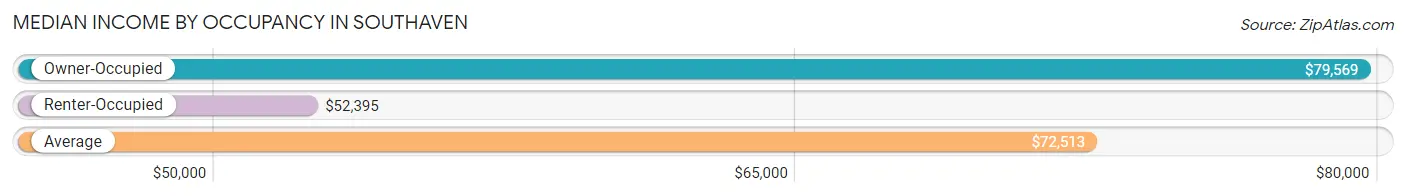
| Occupancy Type | # Households | Median Income |
| Owner-Occupied | 14,356 (70.9%) | $79,569 |
| Renter-Occupied | 5,906 (29.1%) | $52,395 |
| Average | 20,262 (100.0%) | $72,513 |
Occupancy by Householder Income Bracket in Southaven
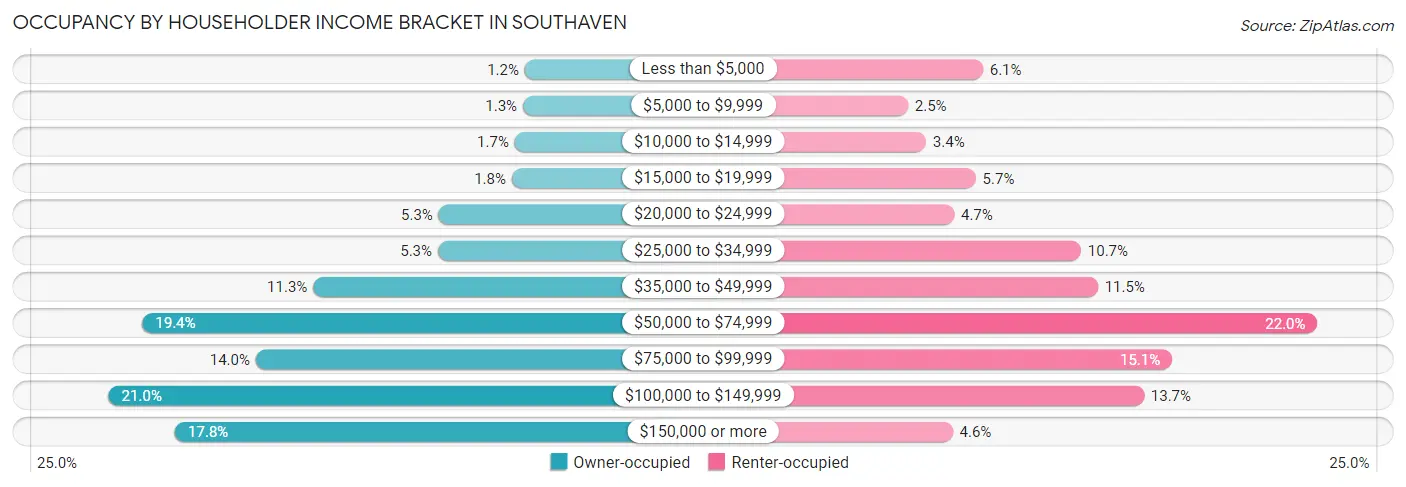
| Income Bracket | Owner-occupied | Renter-occupied |
| Less than $5,000 | 169 (1.2%) | 358 (6.1%) |
| $5,000 to $9,999 | 183 (1.3%) | 147 (2.5%) |
| $10,000 to $14,999 | 239 (1.7%) | 198 (3.4%) |
| $15,000 to $19,999 | 258 (1.8%) | 338 (5.7%) |
| $20,000 to $24,999 | 758 (5.3%) | 277 (4.7%) |
| $25,000 to $34,999 | 764 (5.3%) | 634 (10.7%) |
| $35,000 to $49,999 | 1,617 (11.3%) | 681 (11.5%) |
| $50,000 to $74,999 | 2,784 (19.4%) | 1,299 (22.0%) |
| $75,000 to $99,999 | 2,008 (14.0%) | 890 (15.1%) |
| $100,000 to $149,999 | 3,015 (21.0%) | 811 (13.7%) |
| $150,000 or more | 2,561 (17.8%) | 273 (4.6%) |
| Total | 14,356 (100.0%) | 5,906 (100.0%) |
Monthly Housing Cost Tiers in Southaven
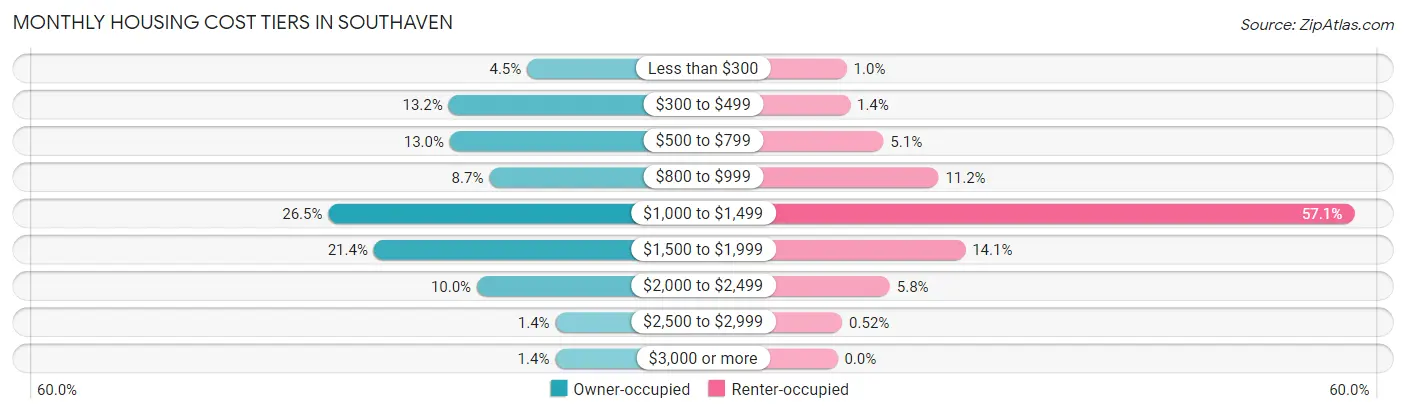
| Monthly Cost | Owner-occupied | Renter-occupied |
| Less than $300 | 644 (4.5%) | 60 (1.0%) |
| $300 to $499 | 1,891 (13.2%) | 82 (1.4%) |
| $500 to $799 | 1,870 (13.0%) | 300 (5.1%) |
| $800 to $999 | 1,244 (8.7%) | 659 (11.2%) |
| $1,000 to $1,499 | 3,797 (26.5%) | 3,370 (57.1%) |
| $1,500 to $1,999 | 3,077 (21.4%) | 834 (14.1%) |
| $2,000 to $2,499 | 1,440 (10.0%) | 342 (5.8%) |
| $2,500 to $2,999 | 195 (1.4%) | 31 (0.5%) |
| $3,000 or more | 198 (1.4%) | 0 (0.0%) |
| Total | 14,356 (100.0%) | 5,906 (100.0%) |
Physical Housing Characteristics in Southaven
Housing Structures in Southaven
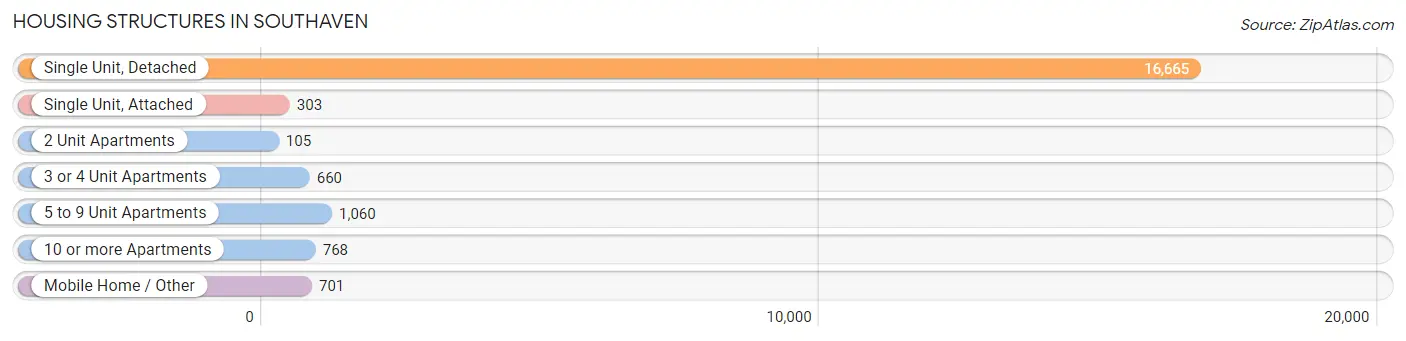
| Structure Type | # Housing Units | % Housing Units |
| Single Unit, Detached | 16,665 | 82.3% |
| Single Unit, Attached | 303 | 1.5% |
| 2 Unit Apartments | 105 | 0.5% |
| 3 or 4 Unit Apartments | 660 | 3.3% |
| 5 to 9 Unit Apartments | 1,060 | 5.2% |
| 10 or more Apartments | 768 | 3.8% |
| Mobile Home / Other | 701 | 3.5% |
| Total | 20,262 | 100.0% |
Housing Structures by Occupancy in Southaven
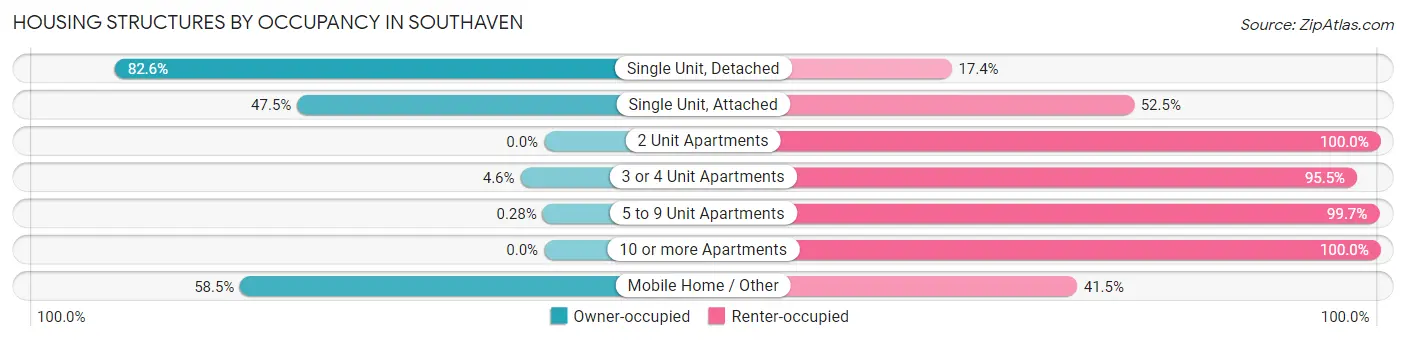
| Structure Type | Owner-occupied | Renter-occupied |
| Single Unit, Detached | 13,769 (82.6%) | 2,896 (17.4%) |
| Single Unit, Attached | 144 (47.5%) | 159 (52.5%) |
| 2 Unit Apartments | 0 (0.0%) | 105 (100.0%) |
| 3 or 4 Unit Apartments | 30 (4.5%) | 630 (95.5%) |
| 5 to 9 Unit Apartments | 3 (0.3%) | 1,057 (99.7%) |
| 10 or more Apartments | 0 (0.0%) | 768 (100.0%) |
| Mobile Home / Other | 410 (58.5%) | 291 (41.5%) |
| Total | 14,356 (70.9%) | 5,906 (29.1%) |
Housing Structures by Number of Rooms in Southaven
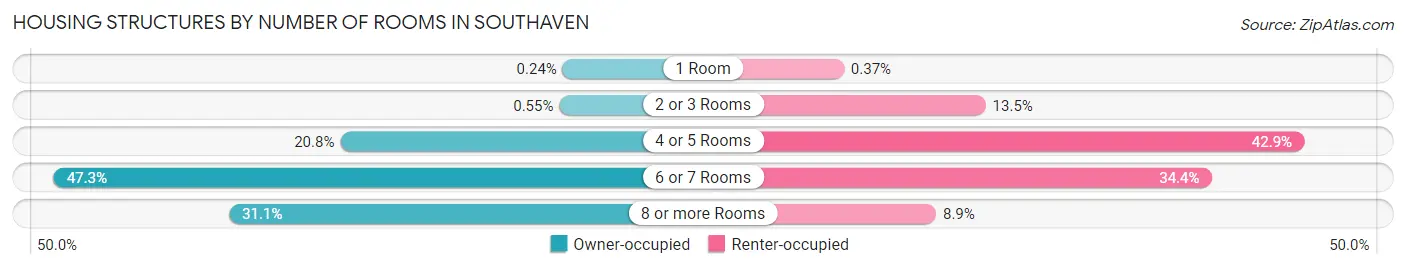
| Number of Rooms | Owner-occupied | Renter-occupied |
| 1 Room | 35 (0.2%) | 22 (0.4%) |
| 2 or 3 Rooms | 79 (0.5%) | 796 (13.5%) |
| 4 or 5 Rooms | 2,988 (20.8%) | 2,534 (42.9%) |
| 6 or 7 Rooms | 6,791 (47.3%) | 2,029 (34.4%) |
| 8 or more Rooms | 4,463 (31.1%) | 525 (8.9%) |
| Total | 14,356 (100.0%) | 5,906 (100.0%) |
Housing Structure by Heating Type in Southaven
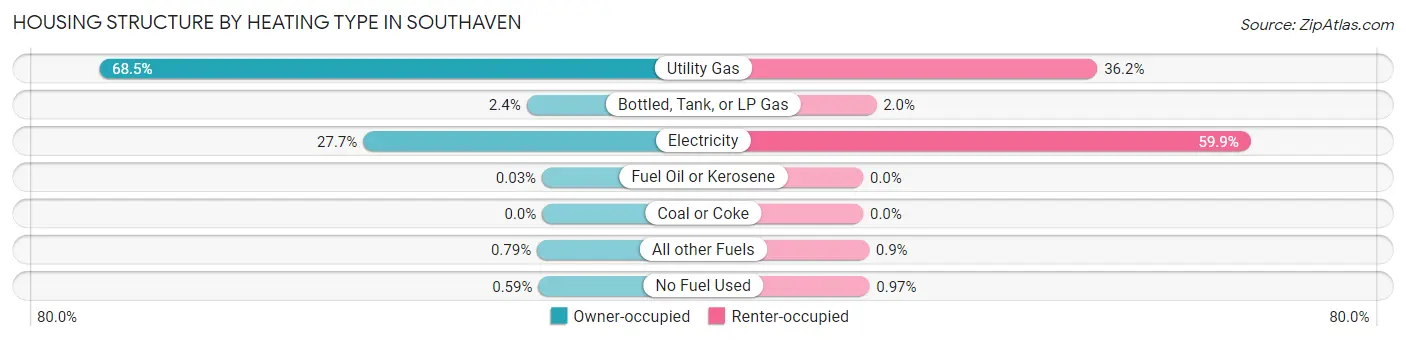
| Heating Type | Owner-occupied | Renter-occupied |
| Utility Gas | 9,833 (68.5%) | 2,138 (36.2%) |
| Bottled, Tank, or LP Gas | 346 (2.4%) | 120 (2.0%) |
| Electricity | 3,973 (27.7%) | 3,538 (59.9%) |
| Fuel Oil or Kerosene | 5 (0.0%) | 0 (0.0%) |
| Coal or Coke | 0 (0.0%) | 0 (0.0%) |
| All other Fuels | 114 (0.8%) | 53 (0.9%) |
| No Fuel Used | 85 (0.6%) | 57 (1.0%) |
| Total | 14,356 (100.0%) | 5,906 (100.0%) |
Household Vehicle Usage in Southaven
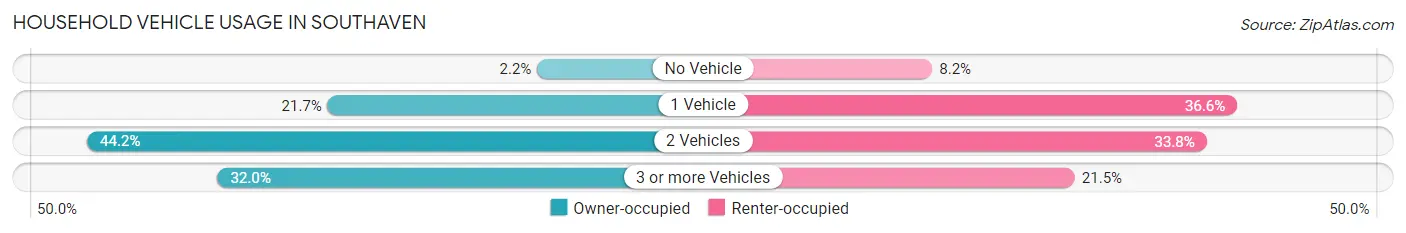
| Vehicles per Household | Owner-occupied | Renter-occupied |
| No Vehicle | 308 (2.1%) | 482 (8.2%) |
| 1 Vehicle | 3,117 (21.7%) | 2,162 (36.6%) |
| 2 Vehicles | 6,339 (44.2%) | 1,994 (33.8%) |
| 3 or more Vehicles | 4,592 (32.0%) | 1,268 (21.5%) |
| Total | 14,356 (100.0%) | 5,906 (100.0%) |
Real Estate & Mortgages in Southaven
Real Estate and Mortgage Overview in Southaven
| Characteristic | Without Mortgage | With Mortgage |
| Housing Units | 3,832 | 10,524 |
| Median Property Value | $166,300 | $210,100 |
| Median Household Income | $60,797 | $2,129 |
| Monthly Housing Costs | $432 | $179 |
| Real Estate Taxes | $1,075 | $687 |
Property Value by Mortgage Status in Southaven
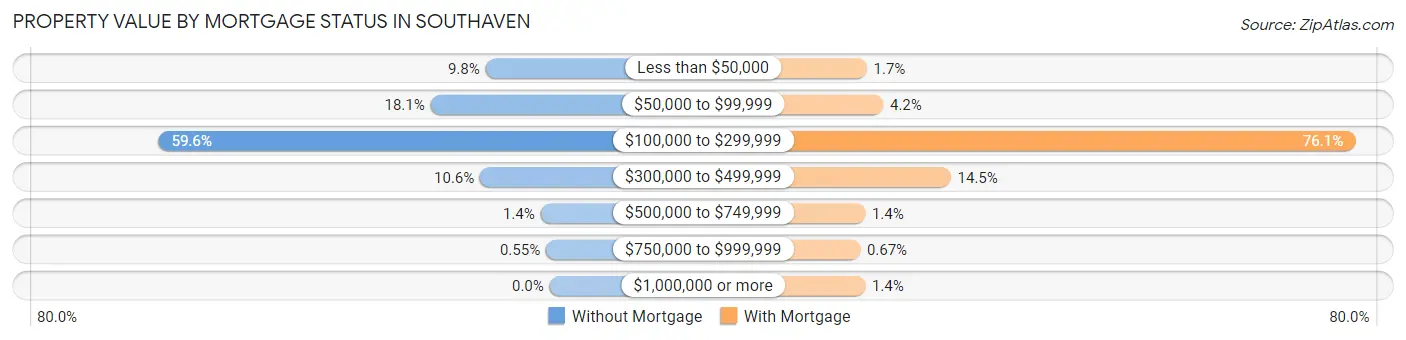
| Property Value | Without Mortgage | With Mortgage |
| Less than $50,000 | 374 (9.8%) | 177 (1.7%) |
| $50,000 to $99,999 | 695 (18.1%) | 441 (4.2%) |
| $100,000 to $299,999 | 2,283 (59.6%) | 8,009 (76.1%) |
| $300,000 to $499,999 | 406 (10.6%) | 1,525 (14.5%) |
| $500,000 to $749,999 | 53 (1.4%) | 152 (1.4%) |
| $750,000 to $999,999 | 21 (0.5%) | 70 (0.7%) |
| $1,000,000 or more | 0 (0.0%) | 150 (1.4%) |
| Total | 3,832 (100.0%) | 10,524 (100.0%) |
Household Income by Mortgage Status in Southaven
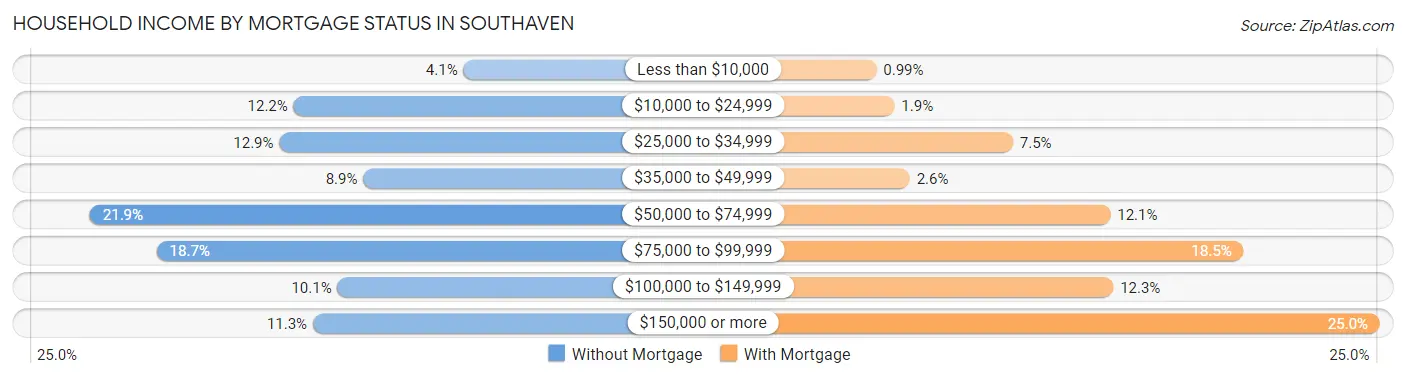
| Household Income | Without Mortgage | With Mortgage |
| Less than $10,000 | 157 (4.1%) | 104 (1.0%) |
| $10,000 to $24,999 | 467 (12.2%) | 195 (1.8%) |
| $25,000 to $34,999 | 493 (12.9%) | 788 (7.5%) |
| $35,000 to $49,999 | 340 (8.9%) | 271 (2.6%) |
| $50,000 to $74,999 | 839 (21.9%) | 1,277 (12.1%) |
| $75,000 to $99,999 | 717 (18.7%) | 1,945 (18.5%) |
| $100,000 to $149,999 | 387 (10.1%) | 1,291 (12.3%) |
| $150,000 or more | 432 (11.3%) | 2,628 (25.0%) |
| Total | 3,832 (100.0%) | 10,524 (100.0%) |
Property Value to Household Income Ratio in Southaven
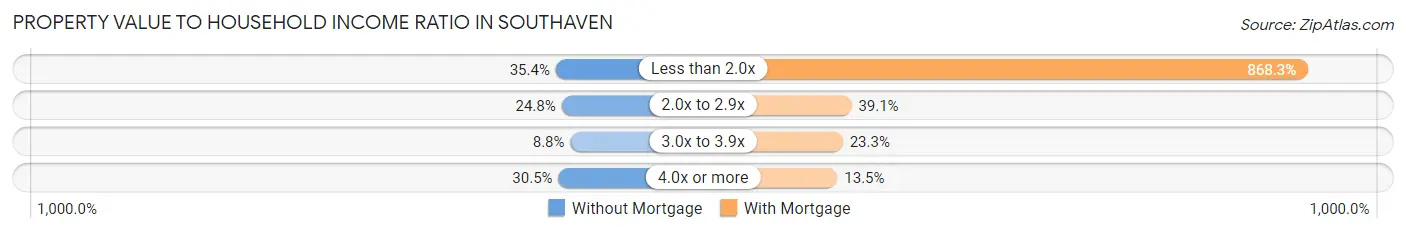
| Value-to-Income Ratio | Without Mortgage | With Mortgage |
| Less than 2.0x | 1,357 (35.4%) | 91,381 (868.3%) |
| 2.0x to 2.9x | 950 (24.8%) | 4,114 (39.1%) |
| 3.0x to 3.9x | 337 (8.8%) | 2,447 (23.3%) |
| 4.0x or more | 1,170 (30.5%) | 1,421 (13.5%) |
| Total | 3,832 (100.0%) | 10,524 (100.0%) |
Real Estate Taxes by Mortgage Status in Southaven
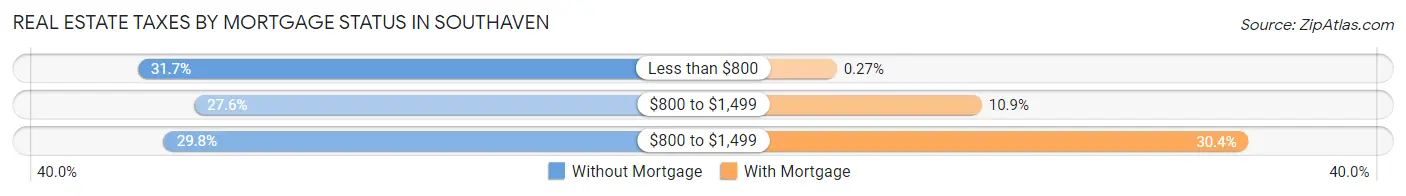
| Property Taxes | Without Mortgage | With Mortgage |
| Less than $800 | 1,216 (31.7%) | 28 (0.3%) |
| $800 to $1,499 | 1,058 (27.6%) | 1,144 (10.9%) |
| $800 to $1,499 | 1,143 (29.8%) | 3,194 (30.3%) |
| Total | 3,832 (100.0%) | 10,524 (100.0%) |
Health & Disability in Southaven
Health Insurance Coverage by Age in Southaven
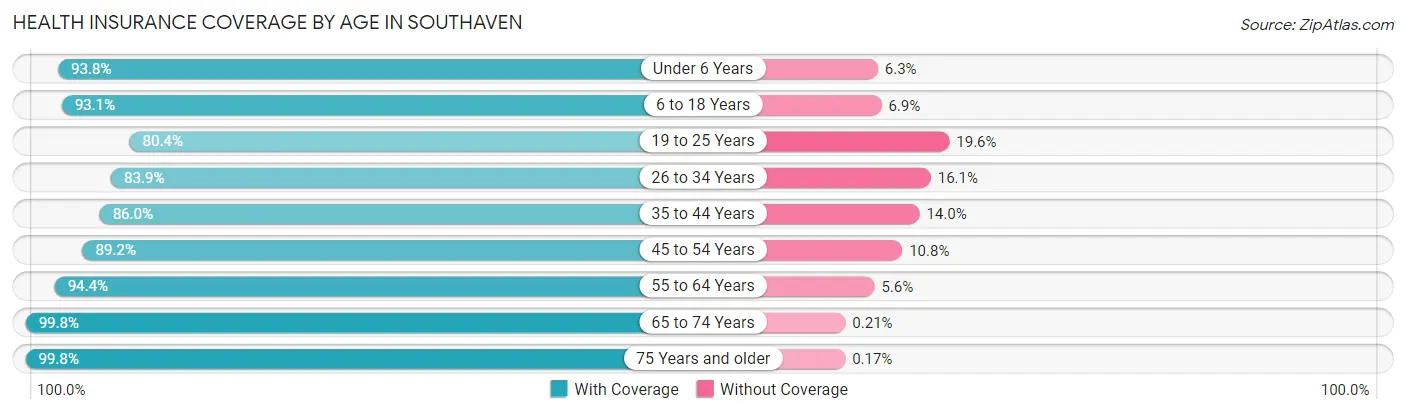
| Age Bracket | With Coverage | Without Coverage |
| Under 6 Years | 3,807 (93.8%) | 254 (6.2%) |
| 6 to 18 Years | 10,197 (93.1%) | 759 (6.9%) |
| 19 to 25 Years | 4,032 (80.4%) | 982 (19.6%) |
| 26 to 34 Years | 5,815 (83.9%) | 1,118 (16.1%) |
| 35 to 44 Years | 5,901 (86.0%) | 962 (14.0%) |
| 45 to 54 Years | 6,862 (89.2%) | 831 (10.8%) |
| 55 to 64 Years | 5,982 (94.4%) | 356 (5.6%) |
| 65 to 74 Years | 4,196 (99.8%) | 9 (0.2%) |
| 75 Years and older | 2,404 (99.8%) | 4 (0.2%) |
| Total | 49,196 (90.3%) | 5,275 (9.7%) |
Health Insurance Coverage by Citizenship Status in Southaven
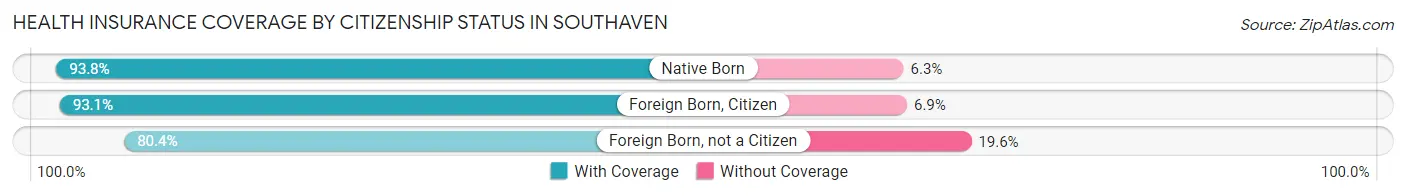
| Citizenship Status | With Coverage | Without Coverage |
| Native Born | 3,807 (93.8%) | 254 (6.2%) |
| Foreign Born, Citizen | 10,197 (93.1%) | 759 (6.9%) |
| Foreign Born, not a Citizen | 4,032 (80.4%) | 982 (19.6%) |
Health Insurance Coverage by Household Income in Southaven
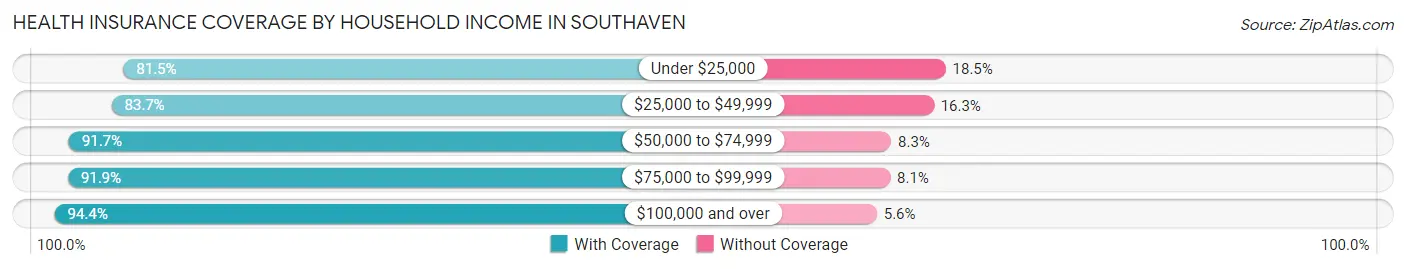
| Household Income | With Coverage | Without Coverage |
| Under $25,000 | 5,639 (81.5%) | 1,281 (18.5%) |
| $25,000 to $49,999 | 6,592 (83.7%) | 1,282 (16.3%) |
| $50,000 to $74,999 | 10,117 (91.7%) | 916 (8.3%) |
| $75,000 to $99,999 | 6,882 (91.9%) | 607 (8.1%) |
| $100,000 and over | 19,966 (94.4%) | 1,189 (5.6%) |
Public vs Private Health Insurance Coverage by Age in Southaven
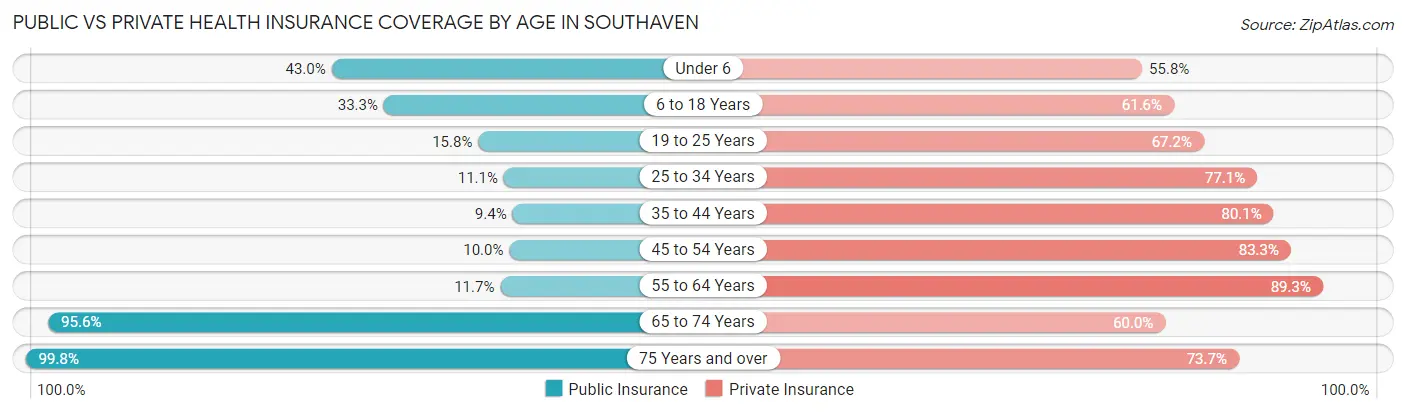
| Age Bracket | Public Insurance | Private Insurance |
| Under 6 | 1,747 (43.0%) | 2,264 (55.7%) |
| 6 to 18 Years | 3,652 (33.3%) | 6,752 (61.6%) |
| 19 to 25 Years | 792 (15.8%) | 3,368 (67.2%) |
| 25 to 34 Years | 766 (11.1%) | 5,343 (77.1%) |
| 35 to 44 Years | 648 (9.4%) | 5,500 (80.1%) |
| 45 to 54 Years | 772 (10.0%) | 6,411 (83.3%) |
| 55 to 64 Years | 742 (11.7%) | 5,657 (89.3%) |
| 65 to 74 Years | 4,021 (95.6%) | 2,524 (60.0%) |
| 75 Years and over | 2,404 (99.8%) | 1,774 (73.7%) |
| Total | 15,544 (28.5%) | 39,593 (72.7%) |
Disability Status by Sex by Age in Southaven
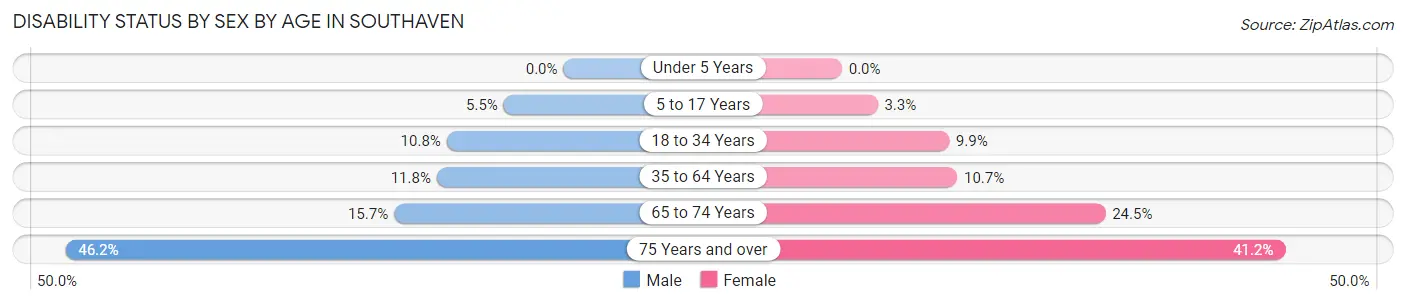
| Age Bracket | Male | Female |
| Under 5 Years | 0 (0.0%) | 0 (0.0%) |
| 5 to 17 Years | 313 (5.5%) | 175 (3.3%) |
| 18 to 34 Years | 687 (10.8%) | 638 (9.9%) |
| 35 to 64 Years | 1,137 (11.7%) | 1,200 (10.7%) |
| 65 to 74 Years | 337 (15.7%) | 504 (24.4%) |
| 75 Years and over | 330 (46.2%) | 697 (41.1%) |
Disability Class by Sex by Age in Southaven
Disability Class: Hearing Difficulty
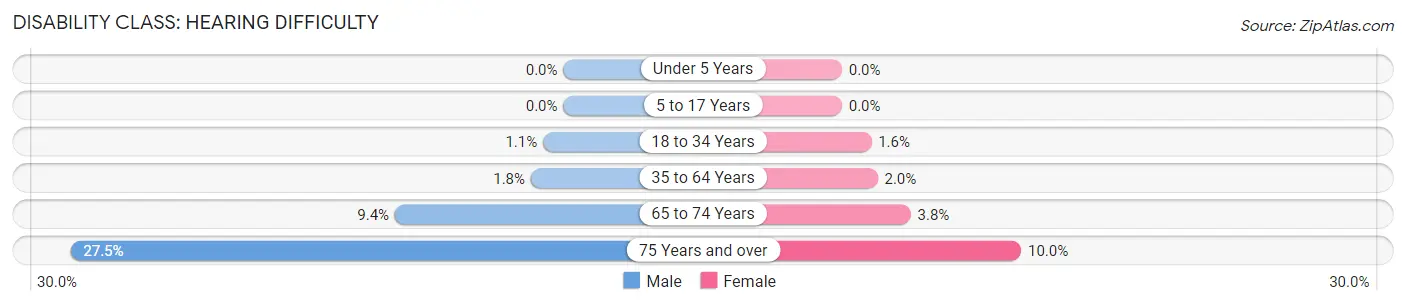
| Age Bracket | Male | Female |
| Under 5 Years | 0 (0.0%) | 0 (0.0%) |
| 5 to 17 Years | 0 (0.0%) | 0 (0.0%) |
| 18 to 34 Years | 72 (1.1%) | 105 (1.6%) |
| 35 to 64 Years | 175 (1.8%) | 223 (2.0%) |
| 65 to 74 Years | 201 (9.4%) | 79 (3.8%) |
| 75 Years and over | 196 (27.5%) | 169 (10.0%) |
Disability Class: Vision Difficulty
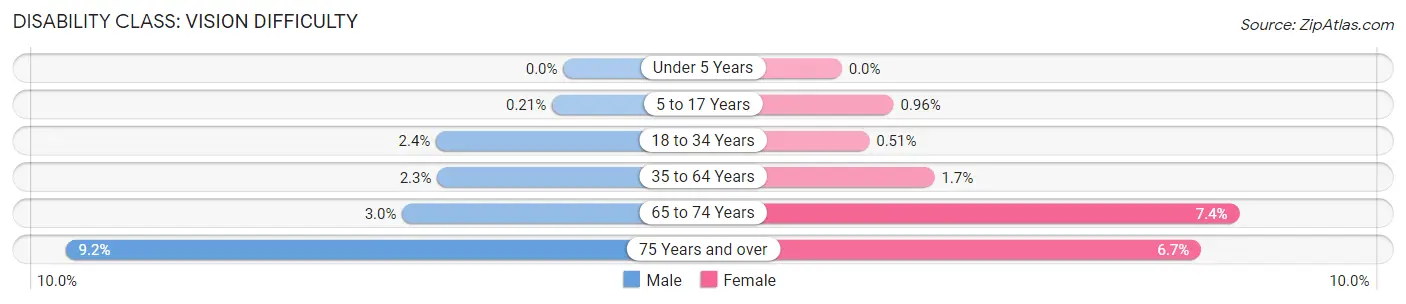
| Age Bracket | Male | Female |
| Under 5 Years | 0 (0.0%) | 0 (0.0%) |
| 5 to 17 Years | 12 (0.2%) | 51 (1.0%) |
| 18 to 34 Years | 150 (2.4%) | 33 (0.5%) |
| 35 to 64 Years | 226 (2.3%) | 193 (1.7%) |
| 65 to 74 Years | 64 (3.0%) | 152 (7.4%) |
| 75 Years and over | 66 (9.2%) | 113 (6.7%) |
Disability Class: Cognitive Difficulty
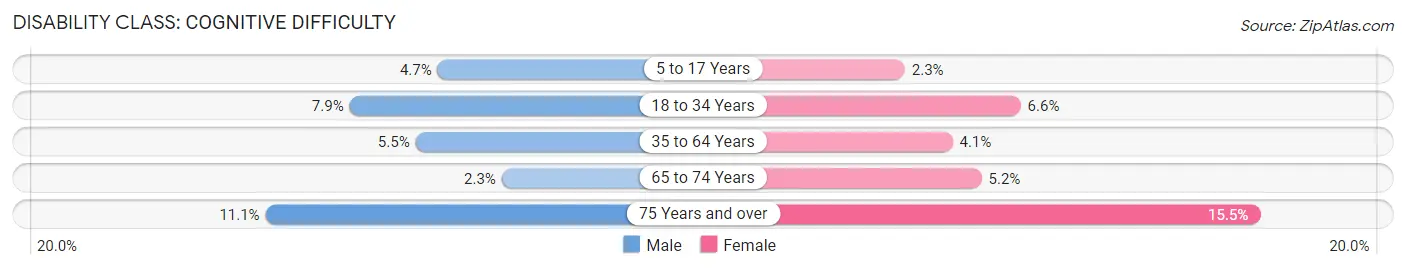
| Age Bracket | Male | Female |
| 5 to 17 Years | 264 (4.7%) | 124 (2.3%) |
| 18 to 34 Years | 504 (7.9%) | 426 (6.6%) |
| 35 to 64 Years | 531 (5.5%) | 461 (4.1%) |
| 65 to 74 Years | 49 (2.3%) | 107 (5.2%) |
| 75 Years and over | 79 (11.1%) | 263 (15.5%) |
Disability Class: Ambulatory Difficulty
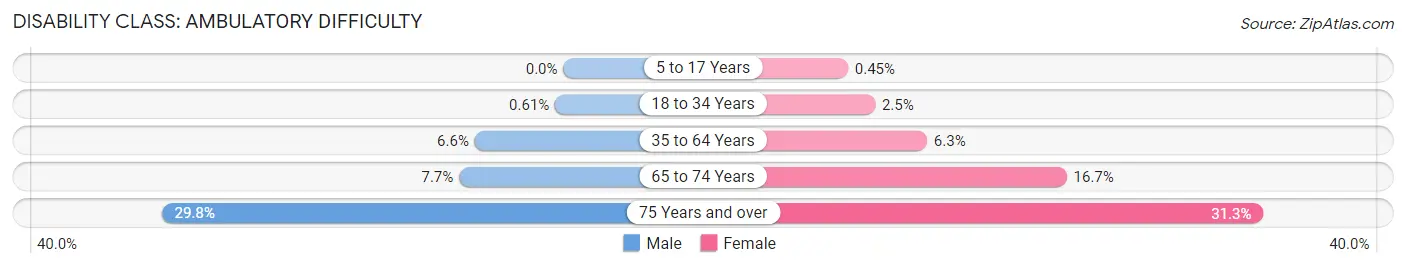
| Age Bracket | Male | Female |
| 5 to 17 Years | 0 (0.0%) | 24 (0.4%) |
| 18 to 34 Years | 39 (0.6%) | 158 (2.5%) |
| 35 to 64 Years | 637 (6.6%) | 709 (6.3%) |
| 65 to 74 Years | 166 (7.7%) | 344 (16.7%) |
| 75 Years and over | 213 (29.8%) | 530 (31.3%) |
Disability Class: Self-Care Difficulty
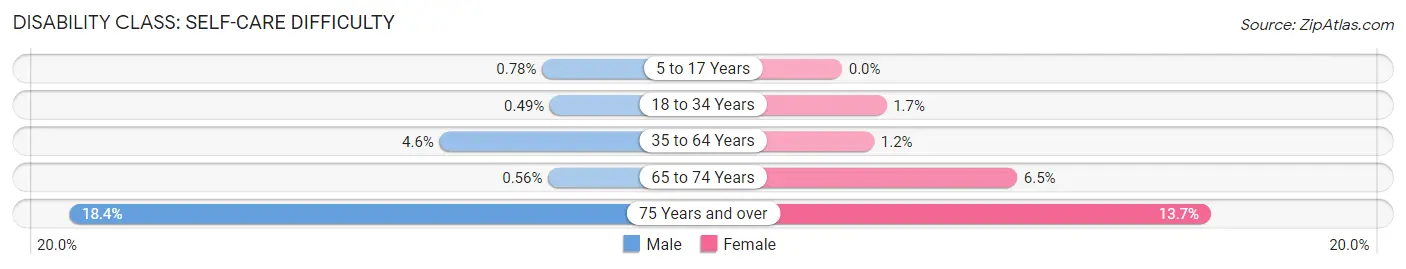
| Age Bracket | Male | Female |
| 5 to 17 Years | 44 (0.8%) | 0 (0.0%) |
| 18 to 34 Years | 31 (0.5%) | 106 (1.7%) |
| 35 to 64 Years | 444 (4.6%) | 133 (1.2%) |
| 65 to 74 Years | 12 (0.6%) | 134 (6.5%) |
| 75 Years and over | 131 (18.3%) | 232 (13.7%) |
Technology Access in Southaven
Computing Device Access in Southaven
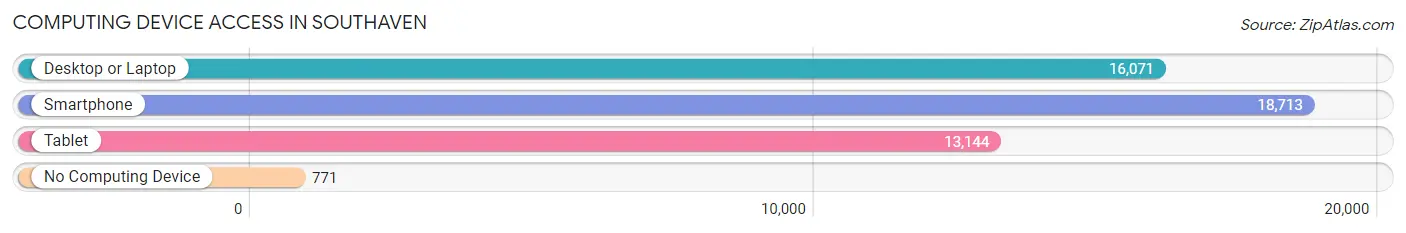
| Device Type | # Households | % Households |
| Desktop or Laptop | 16,071 | 79.3% |
| Smartphone | 18,713 | 92.4% |
| Tablet | 13,144 | 64.9% |
| No Computing Device | 771 | 3.8% |
| Total | 20,262 | 100.0% |
Internet Access in Southaven
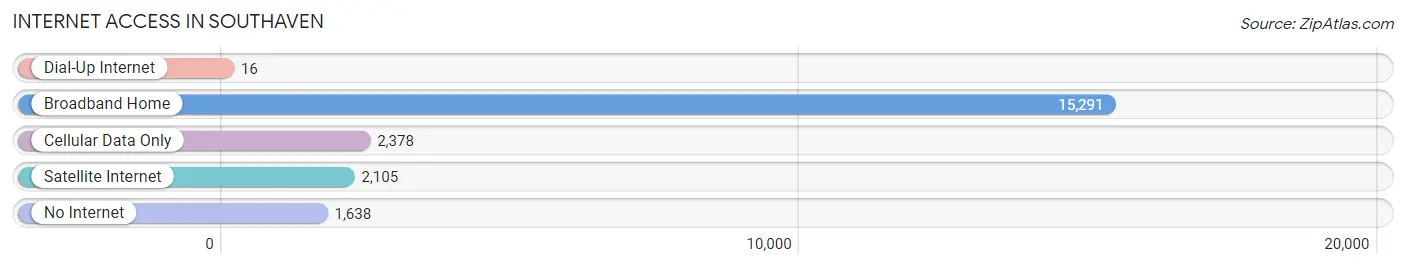
| Internet Type | # Households | % Households |
| Dial-Up Internet | 16 | 0.1% |
| Broadband Home | 15,291 | 75.5% |
| Cellular Data Only | 2,378 | 11.7% |
| Satellite Internet | 2,105 | 10.4% |
| No Internet | 1,638 | 8.1% |
| Total | 20,262 | 100.0% |
Southaven Summary
History
The city of Southaven, Mississippi is located in DeSoto County, just south of Memphis, Tennessee. It is the third largest city in the state and the largest suburb of Memphis. Southaven was founded in 1836 and was originally known as Tchula. The city was renamed Southaven in 1966, and it was officially incorporated in 1980.
Southaven has a rich history that dates back to the early 1800s. The city was originally inhabited by the Chickasaw Indians, who were later forced to relocate to Oklahoma in the 1830s. During the Civil War, Southaven was a major supply depot for the Confederate Army. After the war, the city experienced a period of growth and development, with the construction of the Mississippi Central Railroad in 1873.
In the early 1900s, Southaven began to experience a period of rapid growth and development. The city was home to several cotton gins, sawmills, and other businesses. In the 1950s, the city experienced a population boom, as many people moved to the area to take advantage of the city’s booming economy.
In the late 1960s, Southaven began to experience a period of decline. The city’s economy was hit hard by the decline of the cotton industry, and many businesses began to close. In the 1980s, the city began to experience a period of revitalization, as new businesses began to move into the area.
Today, Southaven is a thriving city with a population of over 50,000. The city is home to a variety of businesses, including retail stores, restaurants, and entertainment venues. Southaven is also home to several parks and recreational areas, as well as a variety of cultural attractions.
Geography
Southaven is located in DeSoto County, Mississippi, just south of Memphis, Tennessee. The city is situated on the banks of the Mississippi River, and it is bordered by the cities of Horn Lake, Olive Branch, and Hernando. Southaven is located in the northwest corner of the state, and it is part of the Memphis metropolitan area.
The city has a total area of 28.3 square miles, of which 28.2 square miles is land and 0.1 square miles is water. Southaven is located in the Mississippi Delta region, and it is characterized by flat terrain and fertile soil. The city is located in a humid subtropical climate zone, and it experiences hot, humid summers and mild winters.
Economy
Southaven’s economy is largely based on retail, manufacturing, and healthcare. The city is home to several major retail stores, including Walmart, Target, and Best Buy. Southaven is also home to several manufacturing companies, including International Paper and Whirlpool. The city is also home to several healthcare facilities, including Baptist Memorial Hospital and St. Francis Hospital.
The city’s economy is also supported by tourism. Southaven is home to several attractions, including the Southaven Towne Center, the Snowden Grove Amphitheater, and the Southaven Museum. The city is also home to several parks and recreational areas, including the Southaven City Park and the Southaven Sports Complex.
Demographics
As of the 2010 census, Southaven had a population of 48,982. The city’s population is largely white (77.3%), followed by African American (17.2%), Hispanic (2.7%), and Asian (1.7%). The median household income in Southaven is $50,945, and the median home value is $150,000. The city’s unemployment rate is 4.2%.
Southaven is home to a variety of religious denominations, including Baptist (37.2%), Methodist (14.2%), and Catholic (7.2%). The city is also home to a variety of educational institutions, including Southaven High School, Northwest Mississippi Community College, and the University of Mississippi Medical Center.
Common Questions
What is Per Capita Income in Southaven?
Per Capita income in Southaven is $32,079.
What is the Median Family Income in Southaven?
Median Family Income in Southaven is $79,548.
What is the Median Household income in Southaven?
Median Household Income in Southaven is $72,513.
What is Income or Wage Gap in Southaven?
Income or Wage Gap in Southaven is 10.3%.
Women in Southaven earn 89.7 cents for every dollar earned by a man.
What is Family Income Deficit in Southaven?
Family Income Deficit in Southaven is $12,278.
Families that are below poverty line in Southaven earn $12,278 less on average than the poverty threshold level.
What is Inequality or Gini Index in Southaven?
Inequality or Gini Index in Southaven is 0.39.
What is the Total Population of Southaven?
Total Population of Southaven is 54,908.
What is the Total Male Population of Southaven?
Total Male Population of Southaven is 26,886.
What is the Total Female Population of Southaven?
Total Female Population of Southaven is 28,022.
What is the Ratio of Males per 100 Females in Southaven?
There are 95.95 Males per 100 Females in Southaven.
What is the Ratio of Females per 100 Males in Southaven?
There are 104.23 Females per 100 Males in Southaven.
What is the Median Population Age in Southaven?
Median Population Age in Southaven is 35.4 Years.
What is the Average Family Size in Southaven
Average Family Size in Southaven is 3.2 People.
What is the Average Household Size in Southaven
Average Household Size in Southaven is 2.7 People.
How Large is the Labor Force in Southaven?
There are 28,691 People in the Labor Forcein in Southaven.
What is the Percentage of People in the Labor Force in Southaven?
67.8% of People are in the Labor Force in Southaven.
What is the Unemployment Rate in Southaven?
Unemployment Rate in Southaven is 4.1%.