Indianola, MS Map & Demographics
Indianola Map
Indianola Overview
$19,563
PER CAPITA INCOME
$49,342
AVG FAMILY INCOME
$36,243
AVG HOUSEHOLD INCOME
24.1%
WAGE / INCOME GAP [ % ]
75.9¢/ $1
WAGE / INCOME GAP [ $ ]
$13,726
FAMILY INCOME DEFICIT
0.46
INEQUALITY / GINI INDEX
9,572
TOTAL POPULATION
4,407
MALE POPULATION
5,165
FEMALE POPULATION
85.32
MALES / 100 FEMALES
117.20
FEMALES / 100 MALES
34.0
MEDIAN AGE
3.5
AVG FAMILY SIZE
2.6
AVG HOUSEHOLD SIZE
4,084
LABOR FORCE [ PEOPLE ]
56.8%
PERCENT IN LABOR FORCE
12.8%
UNEMPLOYMENT RATE
Indianola Zip Codes
Indianola Area Codes
Income in Indianola
Income Overview in Indianola
Per Capita Income in Indianola is $19,563, while median incomes of families and households are $49,342 and $36,243 respectively.
| Characteristic | Number | Measure |
| Per Capita Income | 9,572 | $19,563 |
| Median Family Income | 2,215 | $49,342 |
| Mean Family Income | 2,215 | $60,378 |
| Median Household Income | 3,547 | $36,243 |
| Mean Household Income | 3,547 | $48,691 |
| Income Deficit | 2,215 | $13,726 |
| Wage / Income Gap (%) | 9,572 | 24.11% |
| Wage / Income Gap ($) | 9,572 | 75.89¢ per $1 |
| Gini / Inequality Index | 9,572 | 0.46 |
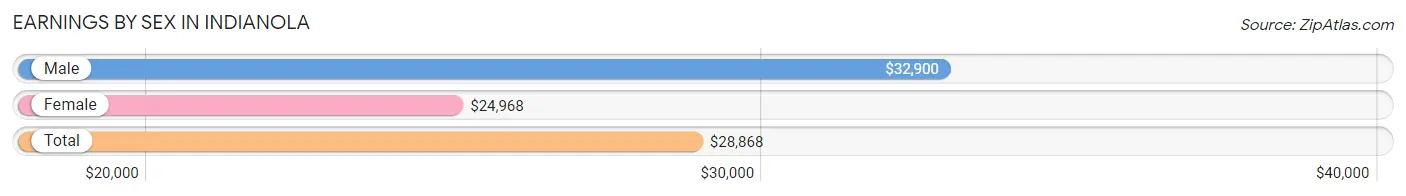
Earnings by Sex in Indianola
Average Earnings in Indianola are $28,868, $32,900 for men and $24,968 for women, a difference of 24.1%.
| Sex | Number | Average Earnings |
| Male | 1,820 (44.5%) | $32,900 |
| Female | 2,269 (55.5%) | $24,968 |
| Total | 4,089 (100.0%) | $28,868 |
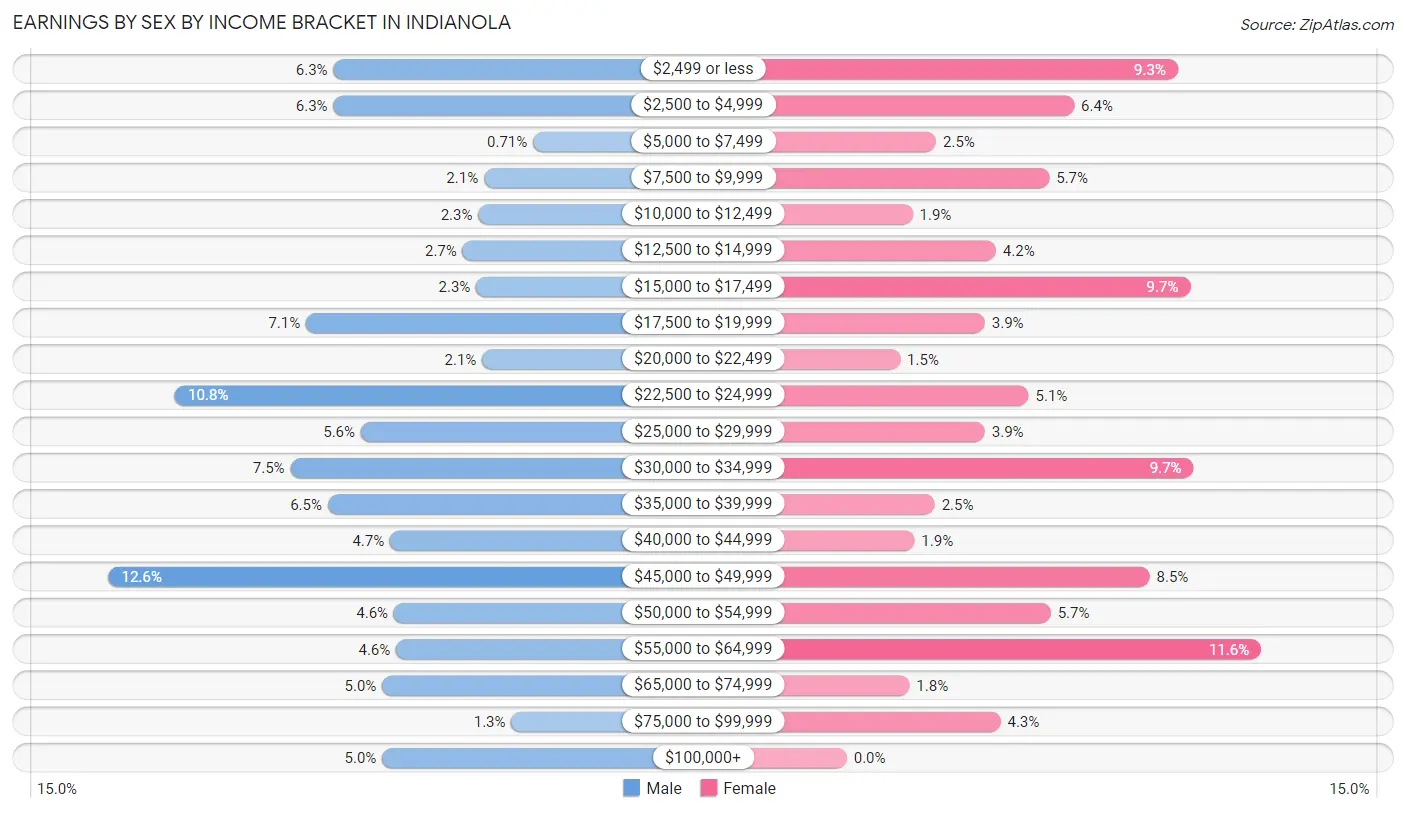
Earnings by Sex by Income Bracket in Indianola
The most common earnings brackets in Indianola are $45,000 to $49,999 for men (230 | 12.6%) and $55,000 to $64,999 for women (264 | 11.6%).
| Income | Male | Female |
| $2,499 or less | 115 (6.3%) | 211 (9.3%) |
| $2,500 to $4,999 | 115 (6.3%) | 145 (6.4%) |
| $5,000 to $7,499 | 13 (0.7%) | 57 (2.5%) |
| $7,500 to $9,999 | 38 (2.1%) | 129 (5.7%) |
| $10,000 to $12,499 | 41 (2.2%) | 42 (1.8%) |
| $12,500 to $14,999 | 49 (2.7%) | 95 (4.2%) |
| $15,000 to $17,499 | 42 (2.3%) | 219 (9.7%) |
| $17,500 to $19,999 | 129 (7.1%) | 88 (3.9%) |
| $20,000 to $22,499 | 39 (2.1%) | 34 (1.5%) |
| $22,500 to $24,999 | 196 (10.8%) | 116 (5.1%) |
| $25,000 to $29,999 | 101 (5.6%) | 88 (3.9%) |
| $30,000 to $34,999 | 137 (7.5%) | 221 (9.7%) |
| $35,000 to $39,999 | 118 (6.5%) | 56 (2.5%) |
| $40,000 to $44,999 | 86 (4.7%) | 43 (1.9%) |
| $45,000 to $49,999 | 230 (12.6%) | 193 (8.5%) |
| $50,000 to $54,999 | 84 (4.6%) | 130 (5.7%) |
| $55,000 to $64,999 | 83 (4.6%) | 264 (11.6%) |
| $65,000 to $74,999 | 90 (5.0%) | 40 (1.8%) |
| $75,000 to $99,999 | 24 (1.3%) | 98 (4.3%) |
| $100,000+ | 90 (5.0%) | 0 (0.0%) |
| Total | 1,820 (100.0%) | 2,269 (100.0%) |
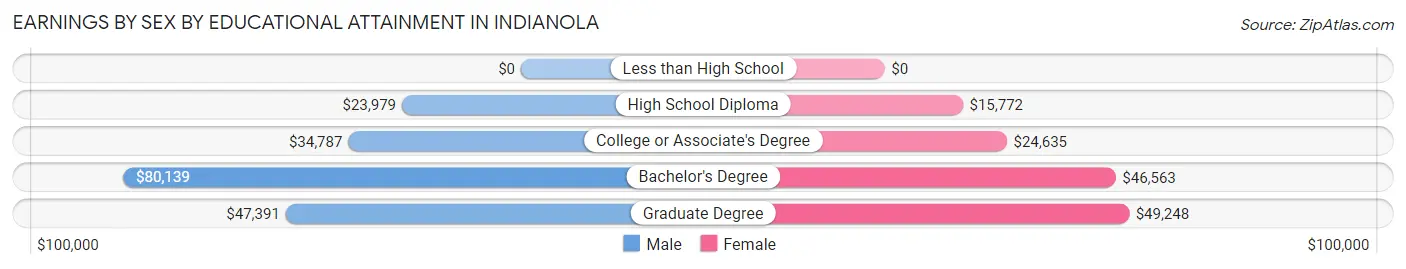
Earnings by Sex by Educational Attainment in Indianola
Average earnings in Indianola are $34,370 for men and $27,000 for women, a difference of 21.4%. Men with an educational attainment of bachelor's degree enjoy the highest average annual earnings of $80,139, while those with high school diploma education earn the least with $23,979. Women with an educational attainment of graduate degree earn the most with the average annual earnings of $49,248, while those with high school diploma education have the smallest earnings of $15,772.
| Educational Attainment | Male Income | Female Income |
| Less than High School | - | - |
| High School Diploma | $23,979 | $15,772 |
| College or Associate's Degree | $34,787 | $24,635 |
| Bachelor's Degree | $80,139 | $46,563 |
| Graduate Degree | $47,391 | $49,248 |
| Total | $34,370 | $27,000 |
Family Income in Indianola
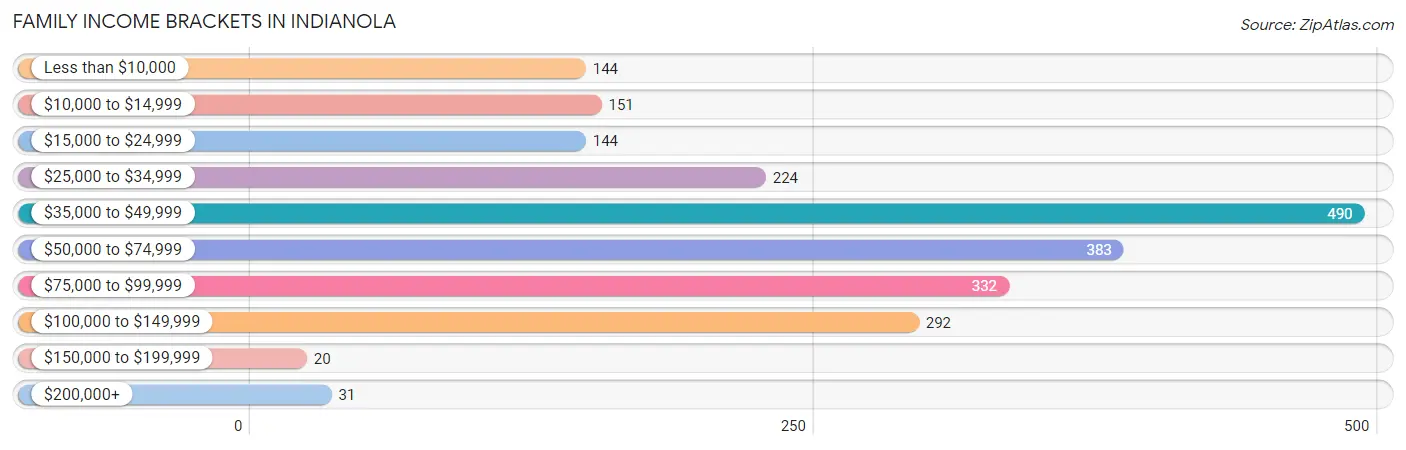
Family Income Brackets in Indianola
According to the Indianola family income data, there are 490 families falling into the $35,000 to $49,999 income range, which is the most common income bracket and makes up 22.1% of all families. Conversely, the $150,000 to $199,999 income bracket is the least frequent group with only 20 families (0.9%) belonging to this category.
| Income Bracket | # Families | % Families |
| Less than $10,000 | 144 | 6.5% |
| $10,000 to $14,999 | 151 | 6.8% |
| $15,000 to $24,999 | 144 | 6.5% |
| $25,000 to $34,999 | 224 | 10.1% |
| $35,000 to $49,999 | 490 | 22.1% |
| $50,000 to $74,999 | 383 | 17.3% |
| $75,000 to $99,999 | 332 | 15.0% |
| $100,000 to $149,999 | 292 | 13.2% |
| $150,000 to $199,999 | 20 | 0.9% |
| $200,000+ | 31 | 1.4% |
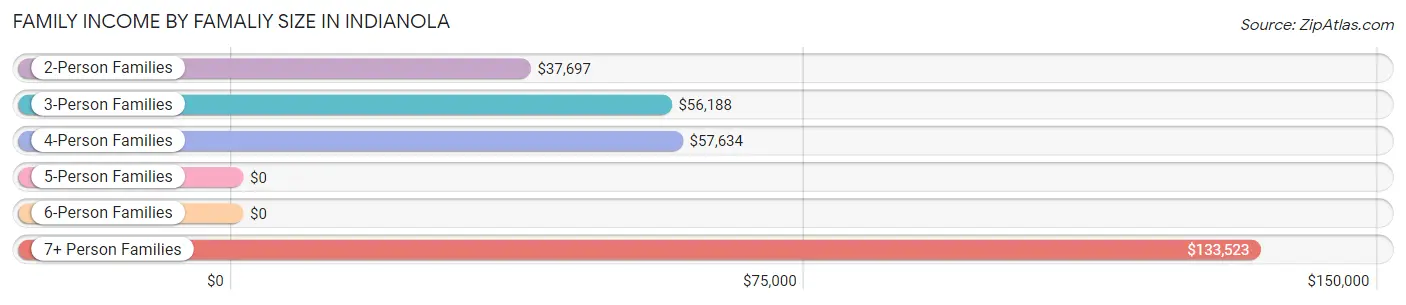
Family Income by Famaliy Size in Indianola
7+ person families (41 | 1.8%) account for the highest median family income in Indianola with $133,523 per family, while 7+ person families (41 | 1.8%) have the highest median income of $19,075 per family member.
| Income Bracket | # Families | Median Income |
| 2-Person Families | 987 (44.6%) | $37,697 |
| 3-Person Families | 458 (20.7%) | $56,188 |
| 4-Person Families | 437 (19.7%) | $57,634 |
| 5-Person Families | 241 (10.9%) | $0 |
| 6-Person Families | 51 (2.3%) | $0 |
| 7+ Person Families | 41 (1.8%) | $133,523 |
| Total | 2,215 (100.0%) | $49,342 |
Family Income by Number of Earners in Indianola
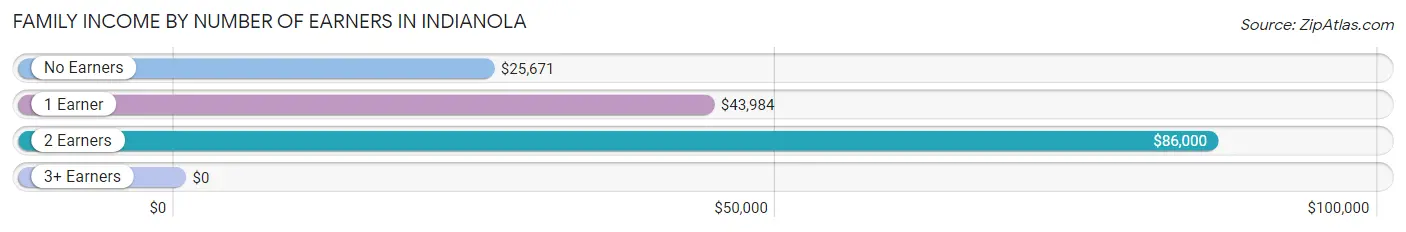
| Number of Earners | # Families | Median Income |
| No Earners | 342 (15.4%) | $25,671 |
| 1 Earner | 953 (43.0%) | $43,984 |
| 2 Earners | 836 (37.7%) | $86,000 |
| 3+ Earners | 84 (3.8%) | $0 |
| Total | 2,215 (100.0%) | $49,342 |
Household Income in Indianola
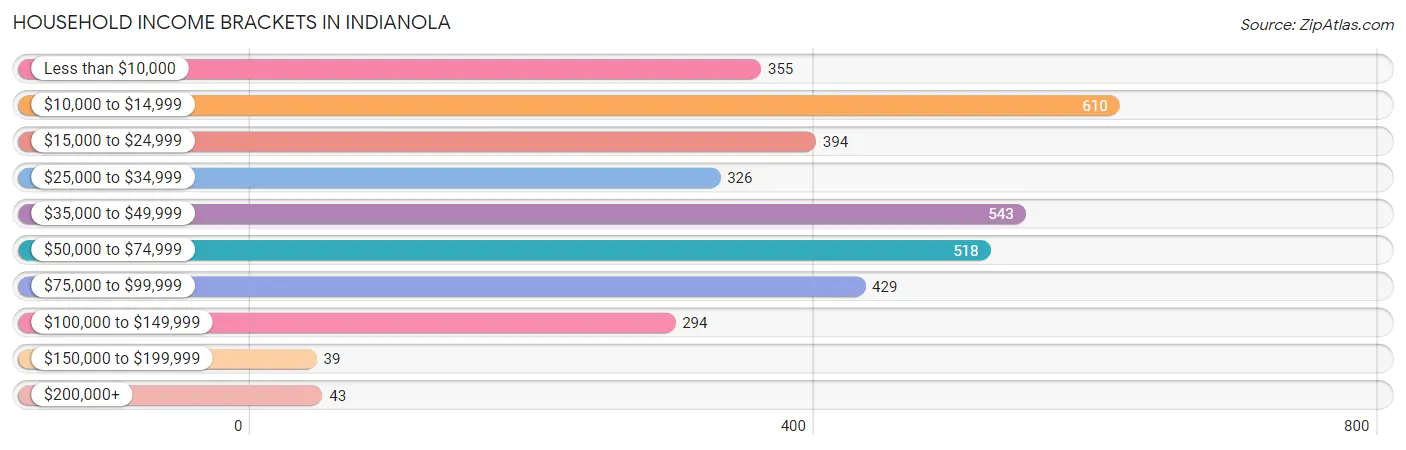
Household Income Brackets in Indianola
With 610 households falling in the category, the $10,000 to $14,999 income range is the most frequent in Indianola, accounting for 17.2% of all households. In contrast, only 39 households (1.1%) fall into the $150,000 to $199,999 income bracket, making it the least populous group.
| Income Bracket | # Households | % Households |
| Less than $10,000 | 355 | 10.0% |
| $10,000 to $14,999 | 610 | 17.2% |
| $15,000 to $24,999 | 394 | 11.1% |
| $25,000 to $34,999 | 326 | 9.2% |
| $35,000 to $49,999 | 543 | 15.3% |
| $50,000 to $74,999 | 518 | 14.6% |
| $75,000 to $99,999 | 429 | 12.1% |
| $100,000 to $149,999 | 294 | 8.3% |
| $150,000 to $199,999 | 39 | 1.1% |
| $200,000+ | 43 | 1.2% |
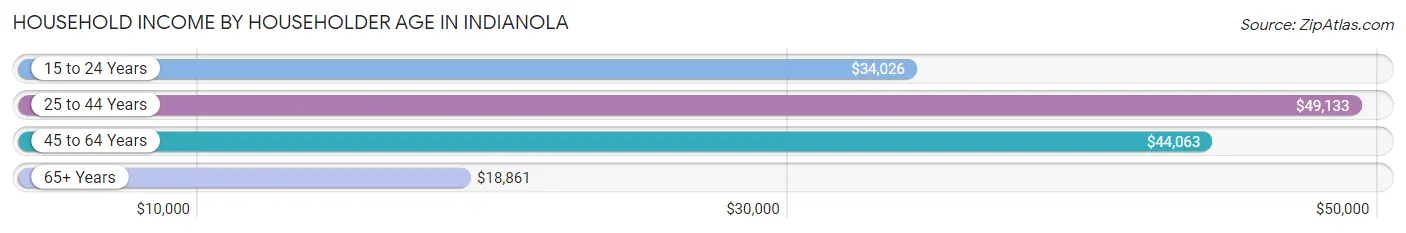
Household Income by Householder Age in Indianola
The median household income in Indianola is $36,243, with the highest median household income of $49,133 found in the 25 to 44 years age bracket for the primary householder. A total of 1,068 households (30.1%) fall into this category. Meanwhile, the 65+ years age bracket for the primary householder has the lowest median household income of $18,861, with 1,163 households (32.8%) in this group.
| Income Bracket | # Households | Median Income |
| 15 to 24 Years | 201 (5.7%) | $34,026 |
| 25 to 44 Years | 1,068 (30.1%) | $49,133 |
| 45 to 64 Years | 1,115 (31.4%) | $44,063 |
| 65+ Years | 1,163 (32.8%) | $18,861 |
| Total | 3,547 (100.0%) | $36,243 |
Poverty in Indianola
Income Below Poverty by Sex and Age in Indianola
With 23.6% poverty level for males and 32.8% for females among the residents of Indianola, 16 and 17 year old males and 12 to 14 year old females are the most vulnerable to poverty, with 108 males (81.8%) and 238 females (73.2%) in their respective age groups living below the poverty level.
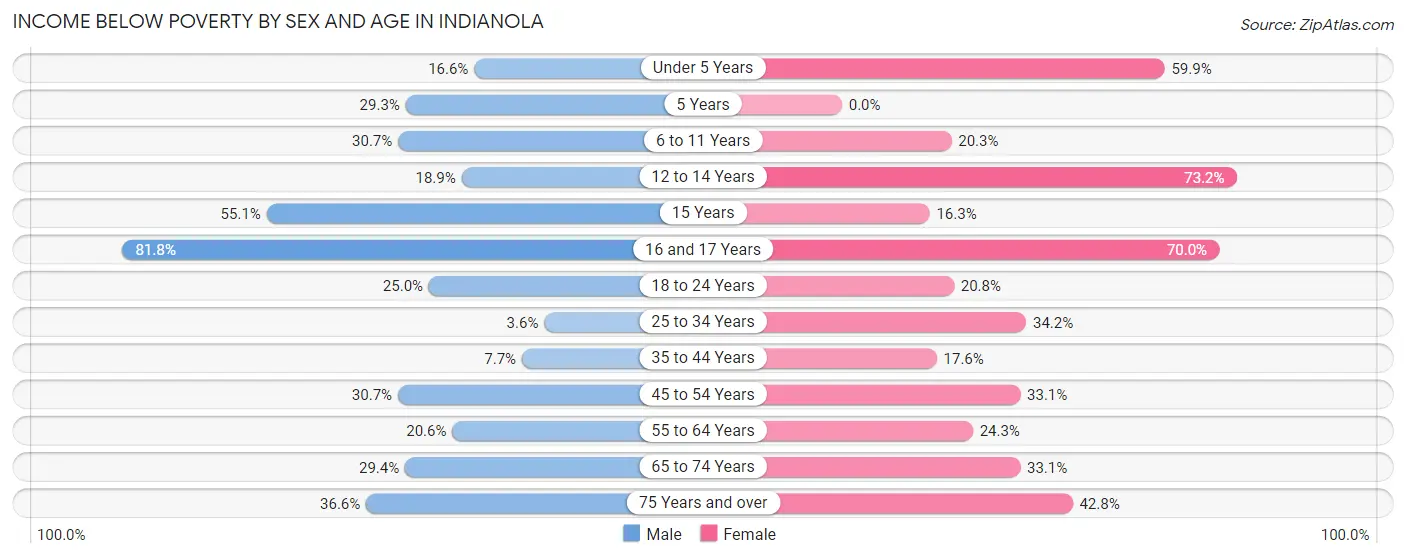
| Age Bracket | Male | Female |
| Under 5 Years | 46 (16.6%) | 124 (59.9%) |
| 5 Years | 12 (29.3%) | 0 (0.0%) |
| 6 to 11 Years | 142 (30.7%) | 86 (20.3%) |
| 12 to 14 Years | 68 (18.9%) | 238 (73.2%) |
| 15 Years | 76 (55.1%) | 21 (16.3%) |
| 16 and 17 Years | 108 (81.8%) | 84 (70.0%) |
| 18 to 24 Years | 118 (24.9%) | 84 (20.8%) |
| 25 to 34 Years | 25 (3.5%) | 210 (34.2%) |
| 35 to 44 Years | 28 (7.7%) | 119 (17.6%) |
| 45 to 54 Years | 129 (30.7%) | 191 (33.1%) |
| 55 to 64 Years | 61 (20.6%) | 156 (24.3%) |
| 65 to 74 Years | 97 (29.4%) | 180 (33.1%) |
| 75 Years and over | 93 (36.6%) | 176 (42.8%) |
| Total | 1,003 (23.6%) | 1,669 (32.8%) |
Income Above Poverty by Sex and Age in Indianola
According to the poverty statistics in Indianola, males aged 25 to 34 years and females aged 5 years are the age groups that are most secure financially, with 96.5% of males and 100.0% of females in these age groups living above the poverty line.
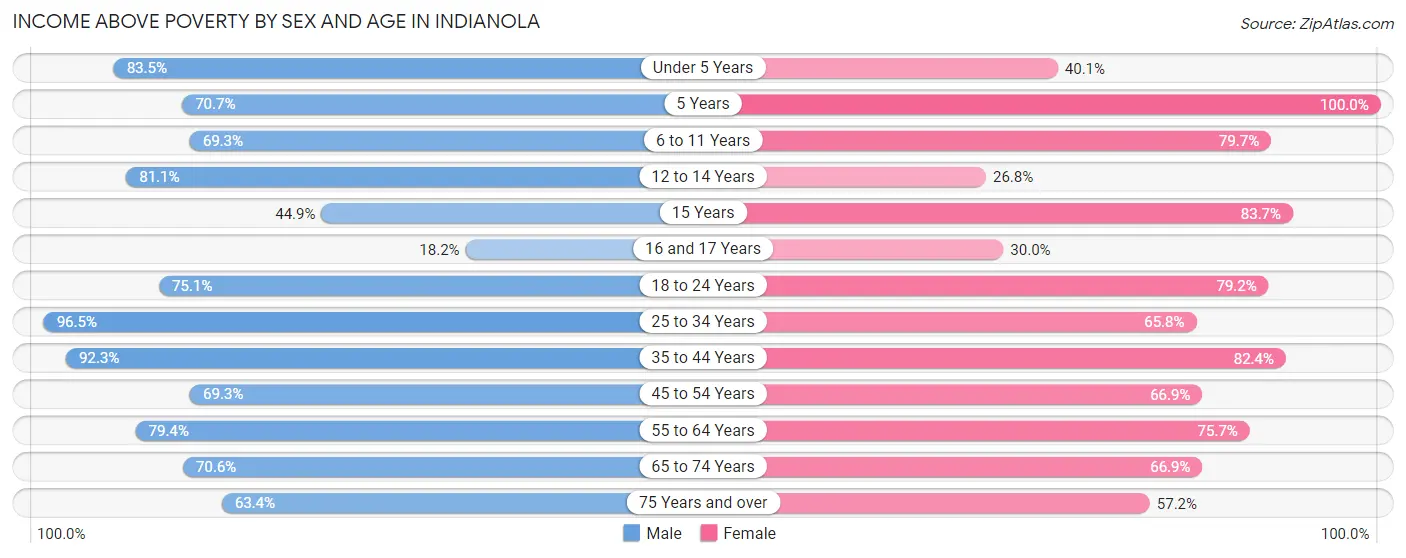
| Age Bracket | Male | Female |
| Under 5 Years | 232 (83.5%) | 83 (40.1%) |
| 5 Years | 29 (70.7%) | 17 (100.0%) |
| 6 to 11 Years | 321 (69.3%) | 337 (79.7%) |
| 12 to 14 Years | 292 (81.1%) | 87 (26.8%) |
| 15 Years | 62 (44.9%) | 108 (83.7%) |
| 16 and 17 Years | 24 (18.2%) | 36 (30.0%) |
| 18 to 24 Years | 355 (75.0%) | 320 (79.2%) |
| 25 to 34 Years | 679 (96.5%) | 404 (65.8%) |
| 35 to 44 Years | 336 (92.3%) | 557 (82.4%) |
| 45 to 54 Years | 291 (69.3%) | 386 (66.9%) |
| 55 to 64 Years | 235 (79.4%) | 486 (75.7%) |
| 65 to 74 Years | 233 (70.6%) | 364 (66.9%) |
| 75 Years and over | 161 (63.4%) | 235 (57.2%) |
| Total | 3,250 (76.4%) | 3,420 (67.2%) |
Income Below Poverty Among Married-Couple Families in Indianola
The poverty statistics for married-couple families in Indianola show that 7.6% or 89 of the total 1,176 families live below the poverty line. Families with no children have the highest poverty rate of 9.9%, comprising of 71 families. On the other hand, families with 3 or 4 children have the lowest poverty rate of 0.0%, which includes 0 families.
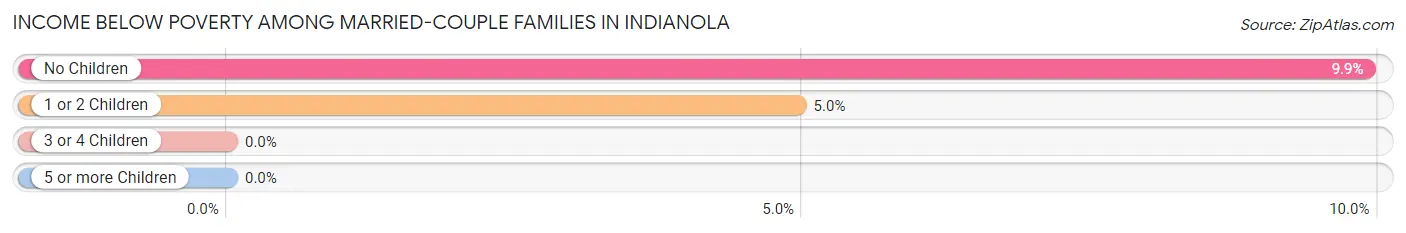
| Children | Above Poverty | Below Poverty |
| No Children | 646 (90.1%) | 71 (9.9%) |
| 1 or 2 Children | 346 (95.1%) | 18 (5.0%) |
| 3 or 4 Children | 95 (100.0%) | 0 (0.0%) |
| 5 or more Children | 0 (0.0%) | 0 (0.0%) |
| Total | 1,087 (92.4%) | 89 (7.6%) |
Income Below Poverty Among Single-Parent Households in Indianola
According to the poverty data in Indianola, 31.7% or 50 single-father households and 34.1% or 300 single-mother households are living below the poverty line. Among single-father households, those with 1 or 2 children have the highest poverty rate, with 41 households (33.6%) experiencing poverty. Likewise, among single-mother households, those with 5 or more children have the highest poverty rate, with 47 households (100.0%) falling below the poverty line.
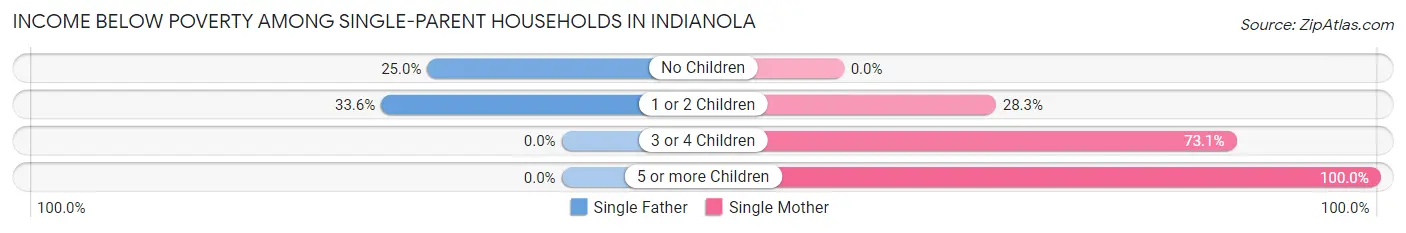
| Children | Single Father | Single Mother |
| No Children | 9 (25.0%) | 0 (0.0%) |
| 1 or 2 Children | 41 (33.6%) | 155 (28.3%) |
| 3 or 4 Children | 0 (0.0%) | 98 (73.1%) |
| 5 or more Children | 0 (0.0%) | 47 (100.0%) |
| Total | 50 (31.7%) | 300 (34.1%) |
Income Below Poverty Among Married-Couple vs Single-Parent Households in Indianola
The poverty data for Indianola shows that 89 of the married-couple family households (7.6%) and 350 of the single-parent households (33.7%) are living below the poverty level. Within the married-couple family households, those with no children have the highest poverty rate, with 71 households (9.9%) falling below the poverty line. Among the single-parent households, those with 5 or more children have the highest poverty rate, with 47 household (100.0%) living below poverty.
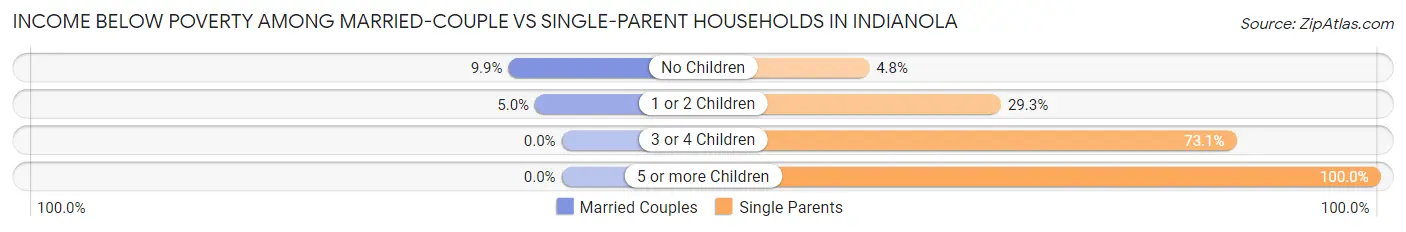
| Children | Married-Couple Families | Single-Parent Households |
| No Children | 71 (9.9%) | 9 (4.8%) |
| 1 or 2 Children | 18 (5.0%) | 196 (29.3%) |
| 3 or 4 Children | 0 (0.0%) | 98 (73.1%) |
| 5 or more Children | 0 (0.0%) | 47 (100.0%) |
| Total | 89 (7.6%) | 350 (33.7%) |
Race in Indianola
The most populous races in Indianola are Black / African American (8,028 | 83.9%), White / Caucasian (1,504 | 15.7%), and Two or more Races (24 | 0.3%).
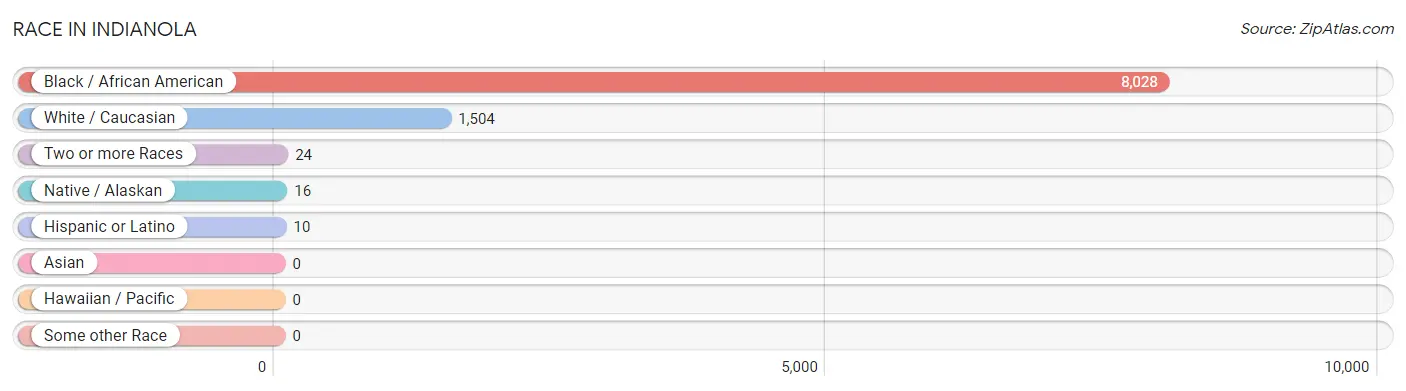
| Race | # Population | % Population |
| Asian | 0 | 0.0% |
| Black / African American | 8,028 | 83.9% |
| Hawaiian / Pacific | 0 | 0.0% |
| Hispanic or Latino | 10 | 0.1% |
| Native / Alaskan | 16 | 0.2% |
| White / Caucasian | 1,504 | 15.7% |
| Two or more Races | 24 | 0.3% |
| Some other Race | 0 | 0.0% |
| Total | 9,572 | 100.0% |
Ancestry in Indianola
The most populous ancestries reported in Indianola are American (708 | 7.4%), English (206 | 2.1%), German (146 | 1.5%), British (98 | 1.0%), and Irish (96 | 1.0%), together accounting for 13.1% of all Indianola residents.
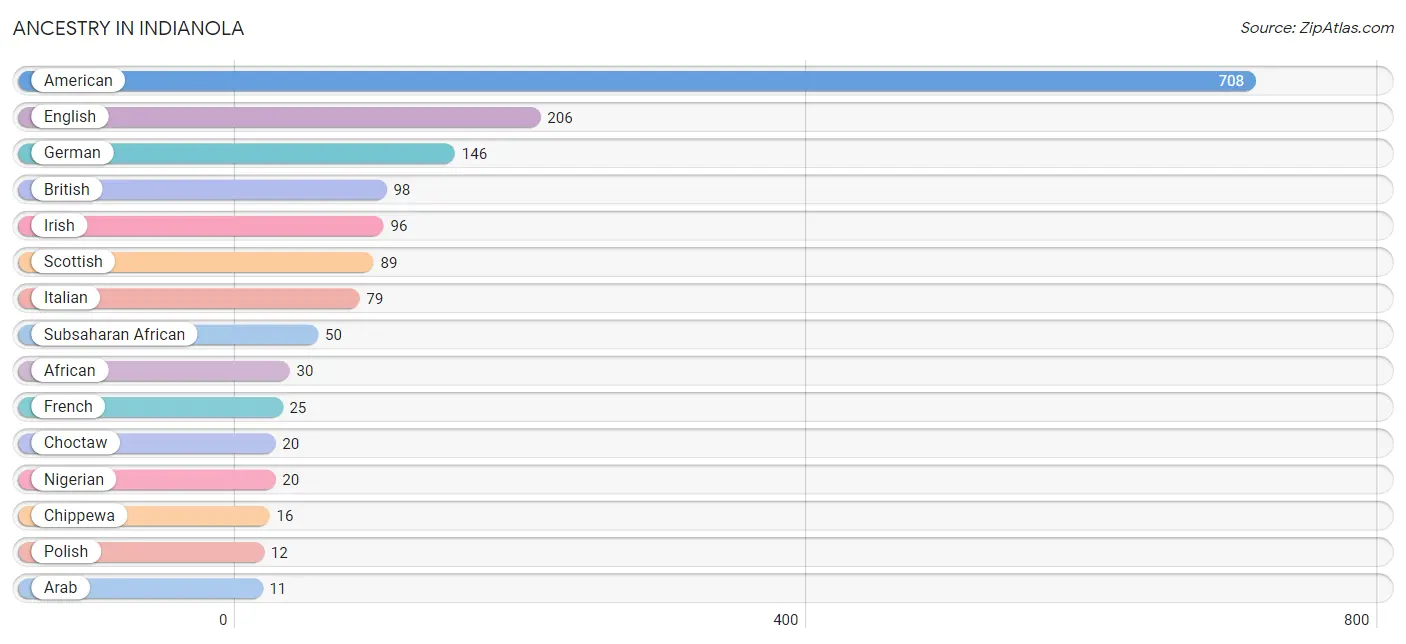
| Ancestry | # Population | % Population |
| African | 30 | 0.3% |
| American | 708 | 7.4% |
| Arab | 11 | 0.1% |
| British | 98 | 1.0% |
| Chippewa | 16 | 0.2% |
| Choctaw | 20 | 0.2% |
| Dutch | 8 | 0.1% |
| English | 206 | 2.1% |
| French | 25 | 0.3% |
| German | 146 | 1.5% |
| Hungarian | 1 | 0.0% |
| Irish | 96 | 1.0% |
| Italian | 79 | 0.8% |
| Lebanese | 11 | 0.1% |
| Nigerian | 20 | 0.2% |
| Polish | 12 | 0.1% |
| Puerto Rican | 10 | 0.1% |
| Scotch-Irish | 4 | 0.0% |
| Scottish | 89 | 0.9% |
| Subsaharan African | 50 | 0.5% | View All 20 Rows |
Immigrants in Indianola

| Immigration Origin | # Population | % Population | View All 0 Rows |
Sex and Age in Indianola
Sex and Age in Indianola
The most populous age groups in Indianola are 15 to 19 Years (484 | 11.0%) for men and 10 to 14 Years (530 | 10.3%) for women.
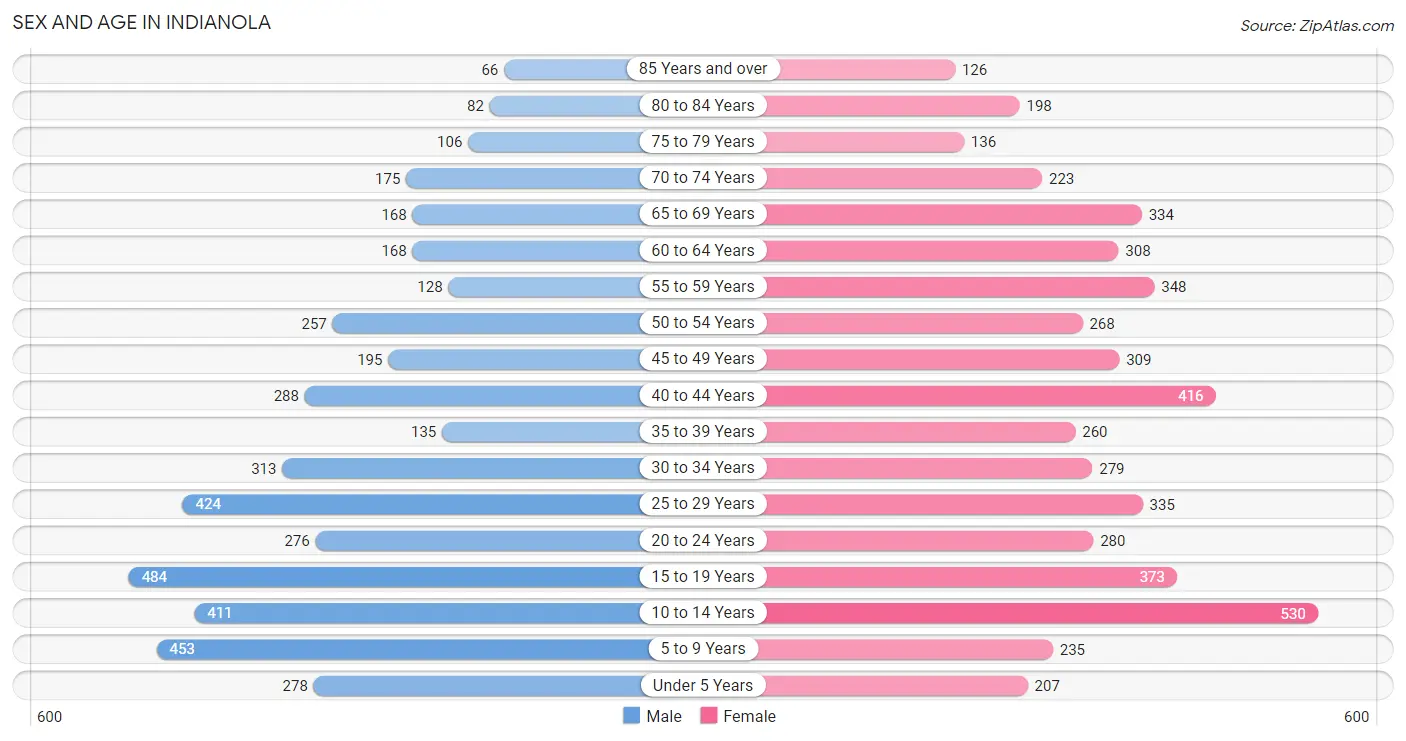
| Age Bracket | Male | Female |
| Under 5 Years | 278 (6.3%) | 207 (4.0%) |
| 5 to 9 Years | 453 (10.3%) | 235 (4.5%) |
| 10 to 14 Years | 411 (9.3%) | 530 (10.3%) |
| 15 to 19 Years | 484 (11.0%) | 373 (7.2%) |
| 20 to 24 Years | 276 (6.3%) | 280 (5.4%) |
| 25 to 29 Years | 424 (9.6%) | 335 (6.5%) |
| 30 to 34 Years | 313 (7.1%) | 279 (5.4%) |
| 35 to 39 Years | 135 (3.1%) | 260 (5.0%) |
| 40 to 44 Years | 288 (6.5%) | 416 (8.1%) |
| 45 to 49 Years | 195 (4.4%) | 309 (6.0%) |
| 50 to 54 Years | 257 (5.8%) | 268 (5.2%) |
| 55 to 59 Years | 128 (2.9%) | 348 (6.7%) |
| 60 to 64 Years | 168 (3.8%) | 308 (6.0%) |
| 65 to 69 Years | 168 (3.8%) | 334 (6.5%) |
| 70 to 74 Years | 175 (4.0%) | 223 (4.3%) |
| 75 to 79 Years | 106 (2.4%) | 136 (2.6%) |
| 80 to 84 Years | 82 (1.9%) | 198 (3.8%) |
| 85 Years and over | 66 (1.5%) | 126 (2.4%) |
| Total | 4,407 (100.0%) | 5,165 (100.0%) |
Families and Households in Indianola
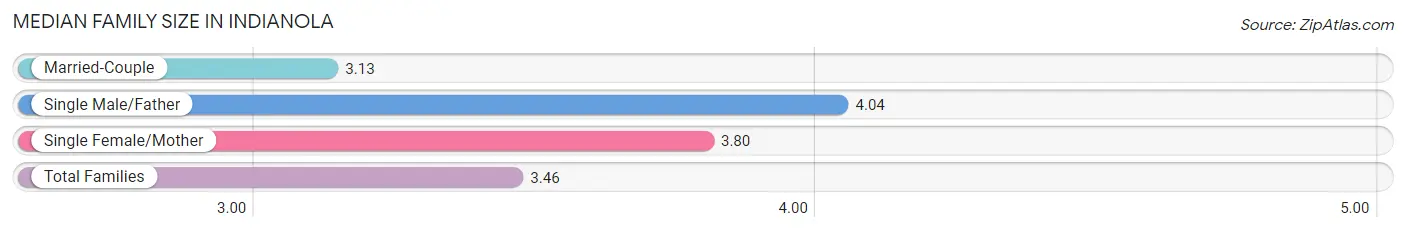
Median Family Size in Indianola
The median family size in Indianola is 3.46 persons per family, with single male/father families (158 | 7.1%) accounting for the largest median family size of 4.04 persons per family. On the other hand, married-couple families (1,176 | 53.1%) represent the smallest median family size with 3.13 persons per family.
| Family Type | # Families | Family Size |
| Married-Couple | 1,176 (53.1%) | 3.13 |
| Single Male/Father | 158 (7.1%) | 4.04 |
| Single Female/Mother | 881 (39.8%) | 3.80 |
| Total Families | 2,215 (100.0%) | 3.46 |
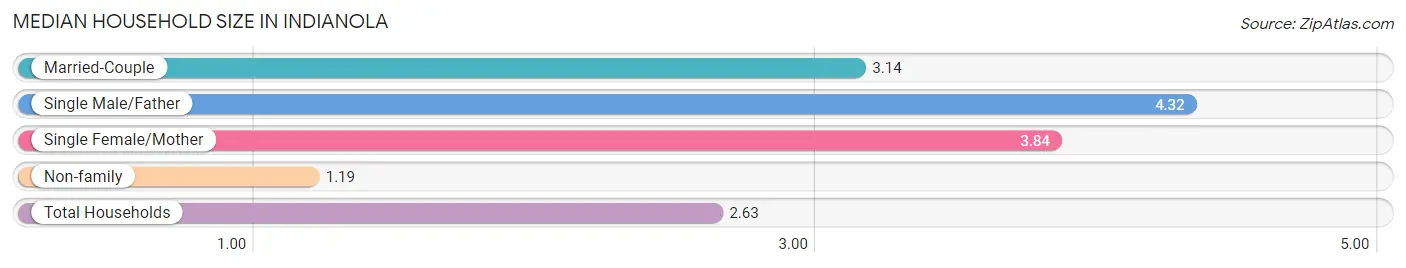
Median Household Size in Indianola
The median household size in Indianola is 2.63 persons per household, with single male/father households (158 | 4.4%) accounting for the largest median household size of 4.32 persons per household. non-family households (1,332 | 37.6%) represent the smallest median household size with 1.19 persons per household.
| Household Type | # Households | Household Size |
| Married-Couple | 1,176 (33.2%) | 3.14 |
| Single Male/Father | 158 (4.4%) | 4.32 |
| Single Female/Mother | 881 (24.8%) | 3.84 |
| Non-family | 1,332 (37.6%) | 1.19 |
| Total Households | 3,547 (100.0%) | 2.63 |
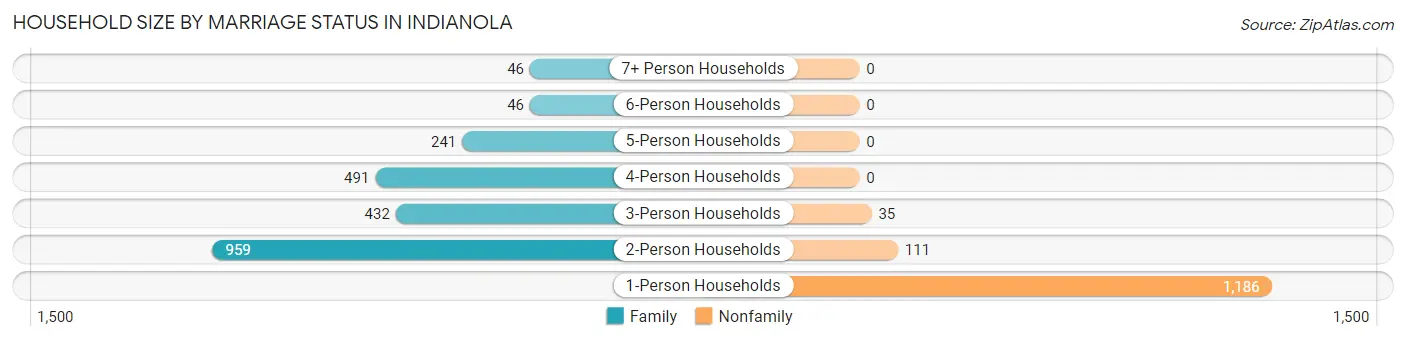
Household Size by Marriage Status in Indianola
Out of a total of 3,547 households in Indianola, 2,215 (62.5%) are family households, while 1,332 (37.6%) are nonfamily households. The most numerous type of family households are 2-person households, comprising 959, and the most common type of nonfamily households are 1-person households, comprising 1,186.
| Household Size | Family Households | Nonfamily Households |
| 1-Person Households | - | 1,186 (33.4%) |
| 2-Person Households | 959 (27.0%) | 111 (3.1%) |
| 3-Person Households | 432 (12.2%) | 35 (1.0%) |
| 4-Person Households | 491 (13.8%) | 0 (0.0%) |
| 5-Person Households | 241 (6.8%) | 0 (0.0%) |
| 6-Person Households | 46 (1.3%) | 0 (0.0%) |
| 7+ Person Households | 46 (1.3%) | 0 (0.0%) |
| Total | 2,215 (62.5%) | 1,332 (37.6%) |
Female Fertility in Indianola
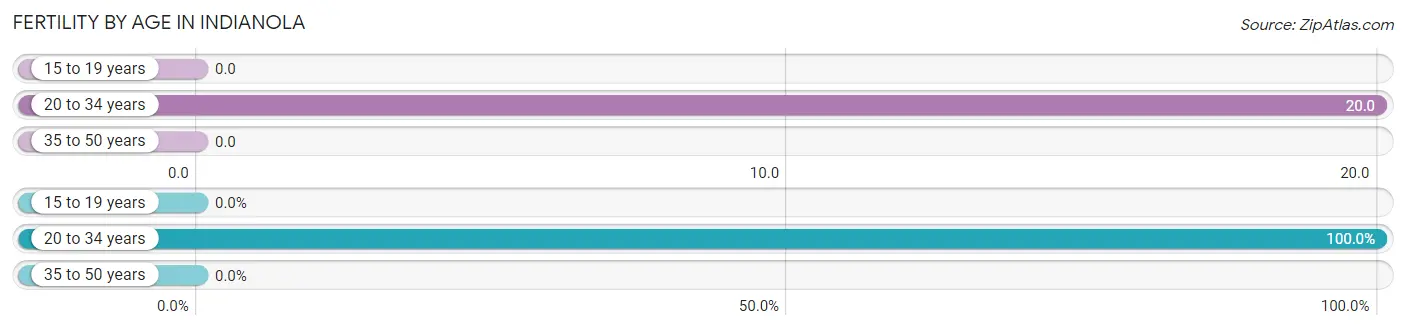
Fertility by Age in Indianola
Average fertility rate in Indianola is 8.0 births per 1,000 women. Women in the age bracket of 20 to 34 years have the highest fertility rate with 20.0 births per 1,000 women. Women in the age bracket of 20 to 34 years acount for 100.0% of all women with births.
| Age Bracket | Women with Births | Births / 1,000 Women |
| 15 to 19 years | 0 (0.0%) | 0.0 |
| 20 to 34 years | 18 (100.0%) | 20.0 |
| 35 to 50 years | 0 (0.0%) | 0.0 |
| Total | 18 (100.0%) | 8.0 |
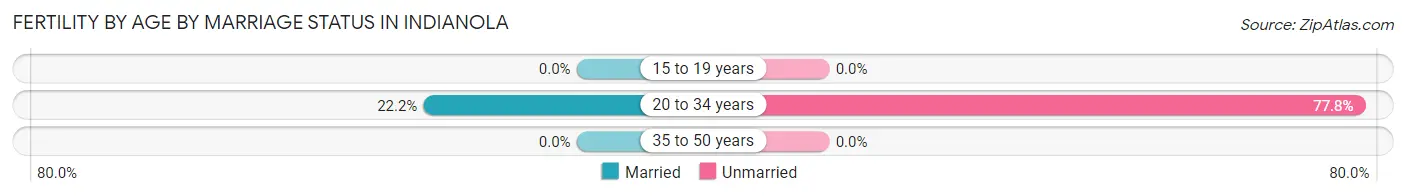
Fertility by Age by Marriage Status in Indianola
22.2% of women with births (18) in Indianola are married. The highest percentage of unmarried women with births falls into 20 to 34 years age bracket with 77.8% of them unmarried at the time of birth, while the lowest percentage of unmarried women with births belong to 20 to 34 years age bracket with 77.8% of them unmarried.
| Age Bracket | Married | Unmarried |
| 15 to 19 years | 0 (0.0%) | 0 (0.0%) |
| 20 to 34 years | 4 (22.2%) | 14 (77.8%) |
| 35 to 50 years | 0 (0.0%) | 0 (0.0%) |
| Total | 4 (22.2%) | 14 (77.8%) |
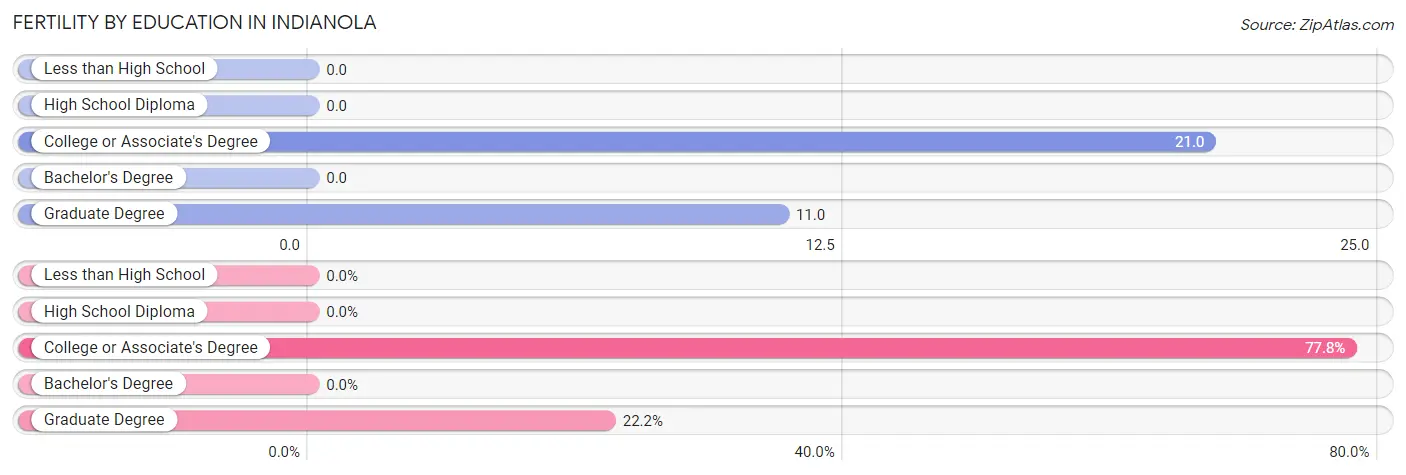
Fertility by Education in Indianola
| Educational Attainment | Women with Births | Births / 1,000 Women |
| Less than High School | 0 (0.0%) | 0.0 |
| High School Diploma | 0 (0.0%) | 0.0 |
| College or Associate's Degree | 14 (77.8%) | 21.0 |
| Bachelor's Degree | 0 (0.0%) | 0.0 |
| Graduate Degree | 4 (22.2%) | 11.0 |
| Total | 18 (100.0%) | 8.0 |
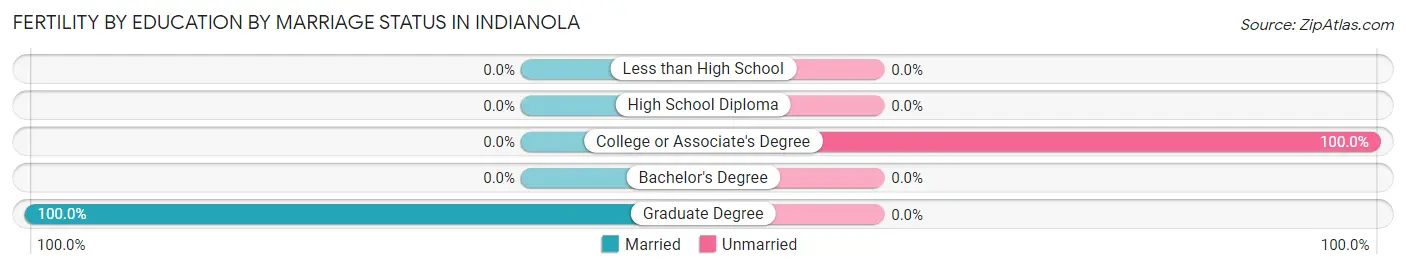
Fertility by Education by Marriage Status in Indianola
77.8% of women with births in Indianola are unmarried. Women with the educational attainment of graduate degree are most likely to be married with 100.0% of them married at childbirth, while women with the educational attainment of college or associate's degree are least likely to be married with 100.0% of them unmarried at childbirth.
| Educational Attainment | Married | Unmarried |
| Less than High School | 0 (0.0%) | 0 (0.0%) |
| High School Diploma | 0 (0.0%) | 0 (0.0%) |
| College or Associate's Degree | 0 (0.0%) | 14 (100.0%) |
| Bachelor's Degree | 0 (0.0%) | 0 (0.0%) |
| Graduate Degree | 4 (100.0%) | 0 (0.0%) |
| Total | 4 (22.2%) | 14 (77.8%) |
Employment Characteristics in Indianola
Employment by Class of Employer in Indianola
Among the 3,537 employed individuals in Indianola, private company employees (2,137 | 60.4%), local government employees (544 | 15.4%), and state government employees (266 | 7.5%) make up the most common classes of employment.
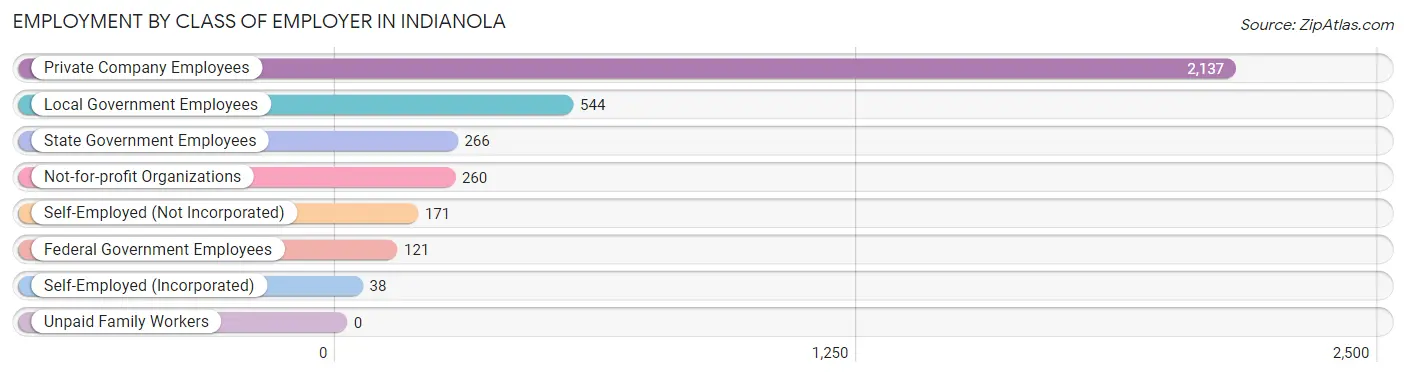
| Employer Class | # Employees | % Employees |
| Private Company Employees | 2,137 | 60.4% |
| Self-Employed (Incorporated) | 38 | 1.1% |
| Self-Employed (Not Incorporated) | 171 | 4.8% |
| Not-for-profit Organizations | 260 | 7.3% |
| Local Government Employees | 544 | 15.4% |
| State Government Employees | 266 | 7.5% |
| Federal Government Employees | 121 | 3.4% |
| Unpaid Family Workers | 0 | 0.0% |
| Total | 3,537 | 100.0% |
Employment Status by Age in Indianola
According to the labor force statistics for Indianola, out of the total population over 16 years of age (7,191), 56.8% or 4,084 individuals are in the labor force, with 12.8% or 523 of them unemployed. The age group with the highest labor force participation rate is 20 to 24 years, with 90.3% or 502 individuals in the labor force. Within the labor force, the 16 to 19 years age range has the highest percentage of unemployed individuals, with 30.2% or 38 of them being unemployed.
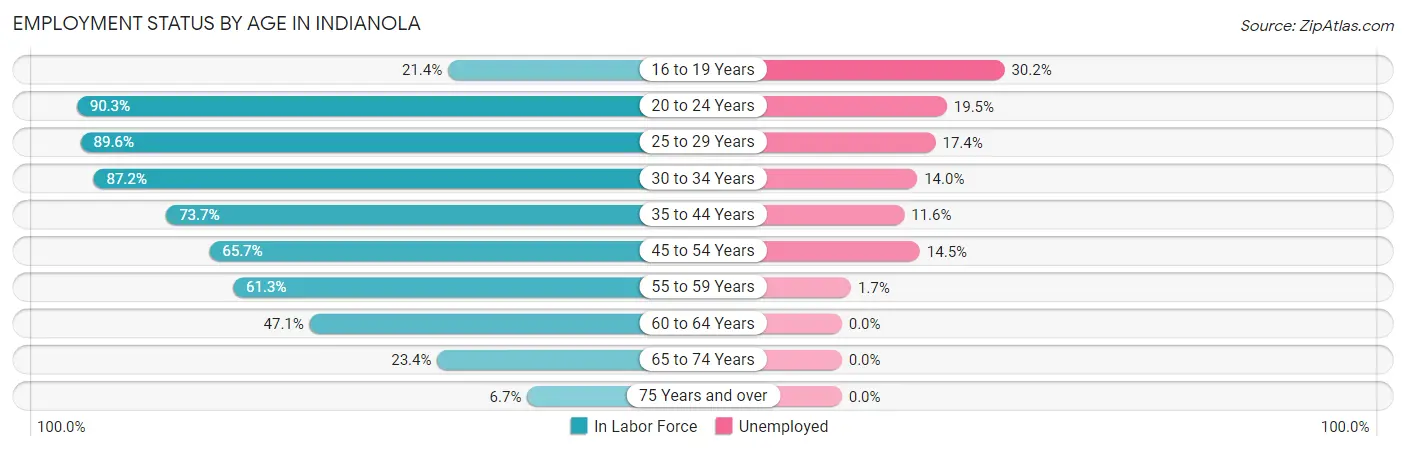
| Age Bracket | In Labor Force | Unemployed |
| 16 to 19 Years | 126 (21.4%) | 38 (30.2%) |
| 20 to 24 Years | 502 (90.3%) | 98 (19.5%) |
| 25 to 29 Years | 680 (89.6%) | 118 (17.4%) |
| 30 to 34 Years | 516 (87.2%) | 72 (14.0%) |
| 35 to 44 Years | 810 (73.7%) | 94 (11.6%) |
| 45 to 54 Years | 676 (65.7%) | 98 (14.5%) |
| 55 to 59 Years | 292 (61.3%) | 5 (1.7%) |
| 60 to 64 Years | 224 (47.1%) | 0 (0.0%) |
| 65 to 74 Years | 211 (23.4%) | 0 (0.0%) |
| 75 Years and over | 48 (6.7%) | 0 (0.0%) |
| Total | 4,084 (56.8%) | 523 (12.8%) |
Employment Status by Educational Attainment in Indianola
According to labor force statistics for Indianola, 72.2% of individuals (3,199) out of the total population between 25 and 64 years of age (4,431) are in the labor force, with 12.1% or 387 of them being unemployed. The group with the highest labor force participation rate are those with the educational attainment of bachelor's degree or higher, with 88.7% or 892 individuals in the labor force. Within the labor force, individuals with less than high school education have the highest percentage of unemployment, with 41.1% or 62 of them being unemployed.
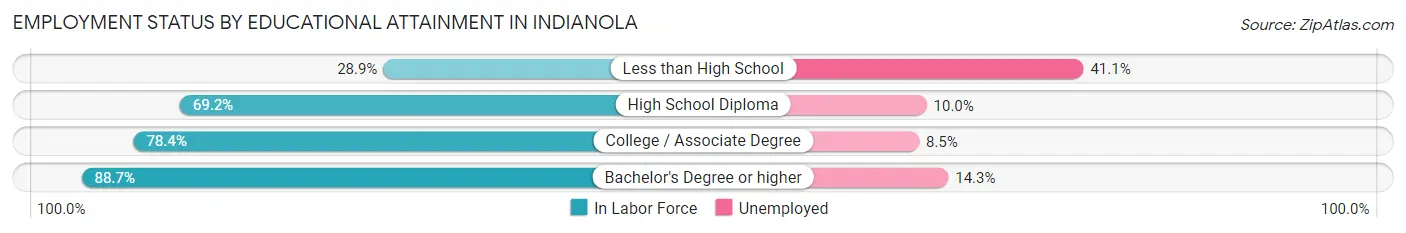
| Educational Attainment | In Labor Force | Unemployed |
| Less than High School | 151 (28.9%) | 215 (41.1%) |
| High School Diploma | 906 (69.2%) | 131 (10.0%) |
| College / Associate Degree | 1,249 (78.4%) | 135 (8.5%) |
| Bachelor's Degree or higher | 892 (88.7%) | 144 (14.3%) |
| Total | 3,199 (72.2%) | 536 (12.1%) |
Employment Occupations by Sex in Indianola
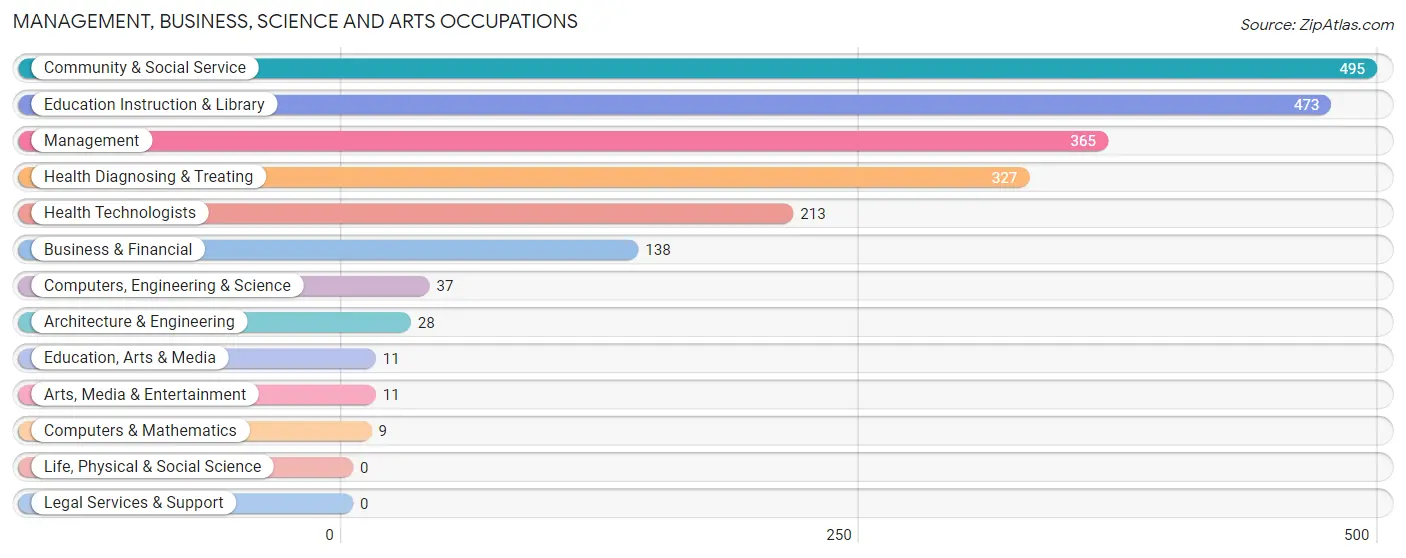
Management, Business, Science and Arts Occupations
The most common Management, Business, Science and Arts occupations in Indianola are Community & Social Service (495 | 13.9%), Education Instruction & Library (473 | 13.3%), Management (365 | 10.2%), Health Diagnosing & Treating (327 | 9.2%), and Health Technologists (213 | 6.0%).
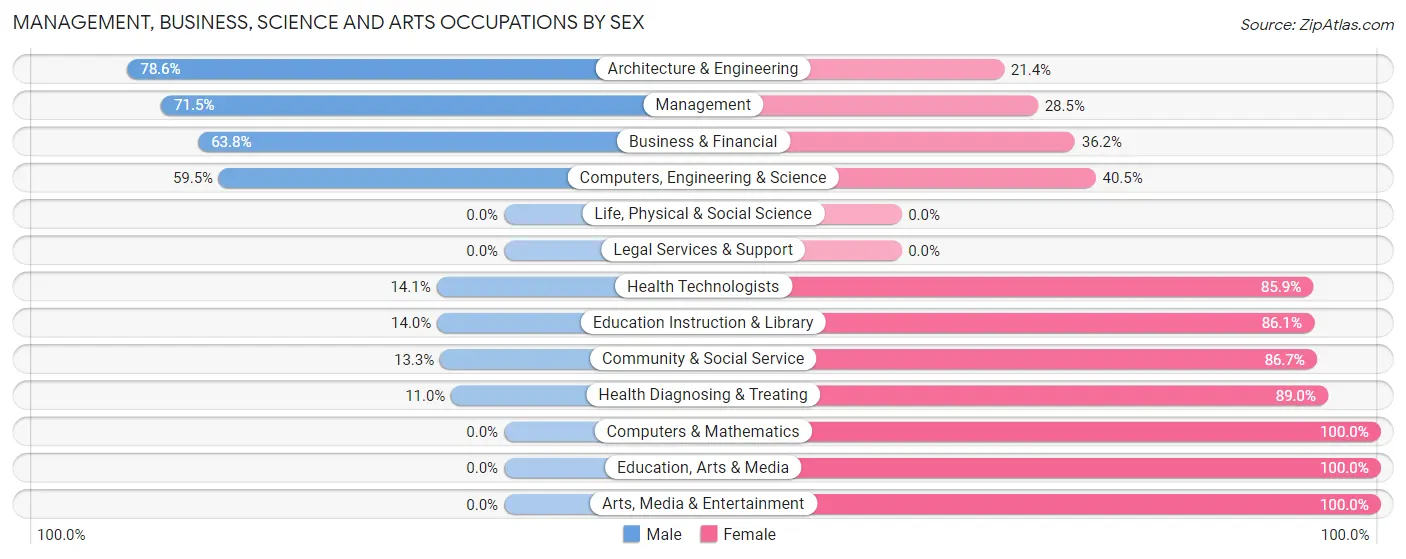
Management, Business, Science and Arts Occupations by Sex
Within the Management, Business, Science and Arts occupations in Indianola, the most male-oriented occupations are Architecture & Engineering (78.6%), Management (71.5%), and Business & Financial (63.8%), while the most female-oriented occupations are Computers & Mathematics (100.0%), Education, Arts & Media (100.0%), and Arts, Media & Entertainment (100.0%).
| Occupation | Male | Female |
| Management | 261 (71.5%) | 104 (28.5%) |
| Business & Financial | 88 (63.8%) | 50 (36.2%) |
| Computers, Engineering & Science | 22 (59.5%) | 15 (40.5%) |
| Computers & Mathematics | 0 (0.0%) | 9 (100.0%) |
| Architecture & Engineering | 22 (78.6%) | 6 (21.4%) |
| Life, Physical & Social Science | 0 (0.0%) | 0 (0.0%) |
| Community & Social Service | 66 (13.3%) | 429 (86.7%) |
| Education, Arts & Media | 0 (0.0%) | 11 (100.0%) |
| Legal Services & Support | 0 (0.0%) | 0 (0.0%) |
| Education Instruction & Library | 66 (14.0%) | 407 (86.1%) |
| Arts, Media & Entertainment | 0 (0.0%) | 11 (100.0%) |
| Health Diagnosing & Treating | 36 (11.0%) | 291 (89.0%) |
| Health Technologists | 30 (14.1%) | 183 (85.9%) |
| Total (Category) | 473 (34.7%) | 889 (65.3%) |
| Total (Overall) | 1,646 (46.2%) | 1,916 (53.8%) |
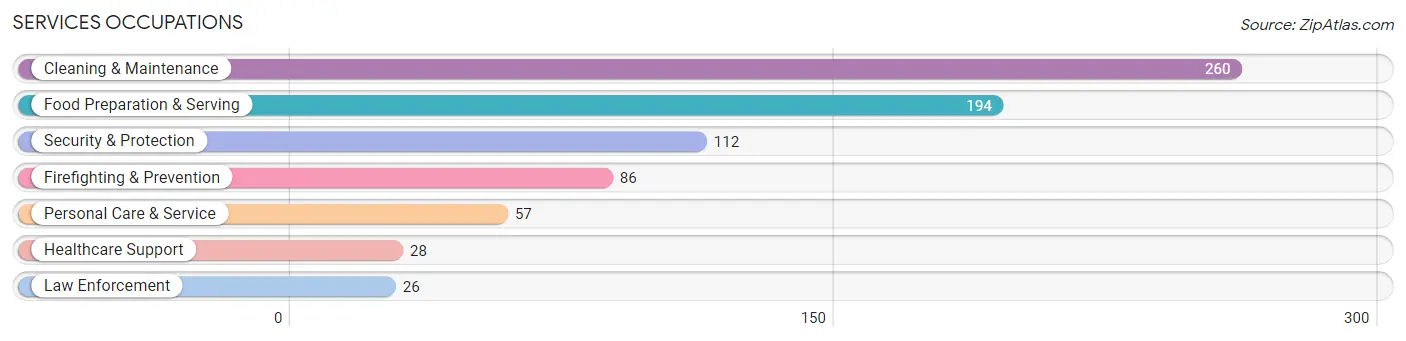
Services Occupations
The most common Services occupations in Indianola are Cleaning & Maintenance (260 | 7.3%), Food Preparation & Serving (194 | 5.4%), Security & Protection (112 | 3.1%), Firefighting & Prevention (86 | 2.4%), and Personal Care & Service (57 | 1.6%).
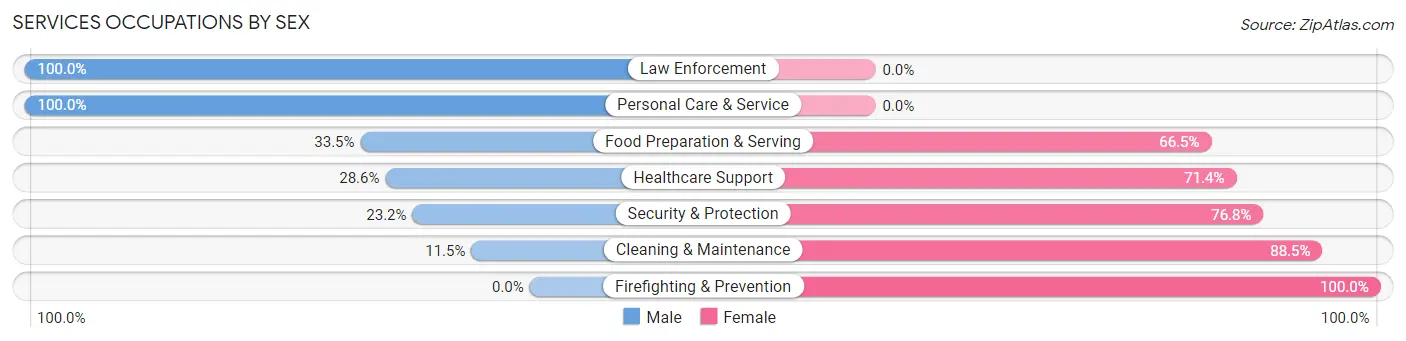
Services Occupations by Sex
Within the Services occupations in Indianola, the most male-oriented occupations are Law Enforcement (100.0%), Personal Care & Service (100.0%), and Food Preparation & Serving (33.5%), while the most female-oriented occupations are Firefighting & Prevention (100.0%), Cleaning & Maintenance (88.5%), and Security & Protection (76.8%).
| Occupation | Male | Female |
| Healthcare Support | 8 (28.6%) | 20 (71.4%) |
| Security & Protection | 26 (23.2%) | 86 (76.8%) |
| Firefighting & Prevention | 0 (0.0%) | 86 (100.0%) |
| Law Enforcement | 26 (100.0%) | 0 (0.0%) |
| Food Preparation & Serving | 65 (33.5%) | 129 (66.5%) |
| Cleaning & Maintenance | 30 (11.5%) | 230 (88.5%) |
| Personal Care & Service | 57 (100.0%) | 0 (0.0%) |
| Total (Category) | 186 (28.6%) | 465 (71.4%) |
| Total (Overall) | 1,646 (46.2%) | 1,916 (53.8%) |
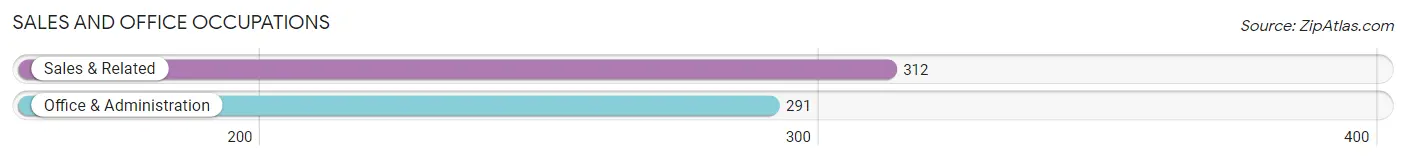
Sales and Office Occupations
The most common Sales and Office occupations in Indianola are Sales & Related (312 | 8.8%), and Office & Administration (291 | 8.2%).
Sales and Office Occupations by Sex
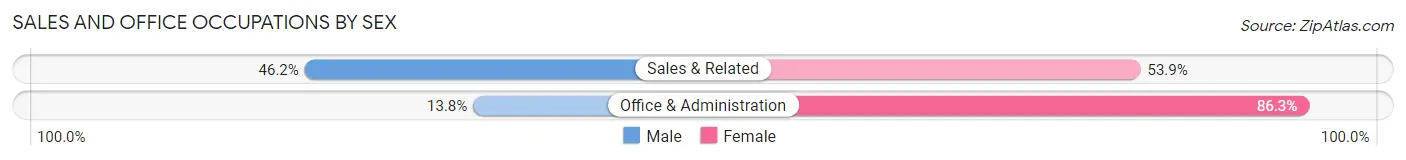
| Occupation | Male | Female |
| Sales & Related | 144 (46.2%) | 168 (53.8%) |
| Office & Administration | 40 (13.8%) | 251 (86.3%) |
| Total (Category) | 184 (30.5%) | 419 (69.5%) |
| Total (Overall) | 1,646 (46.2%) | 1,916 (53.8%) |
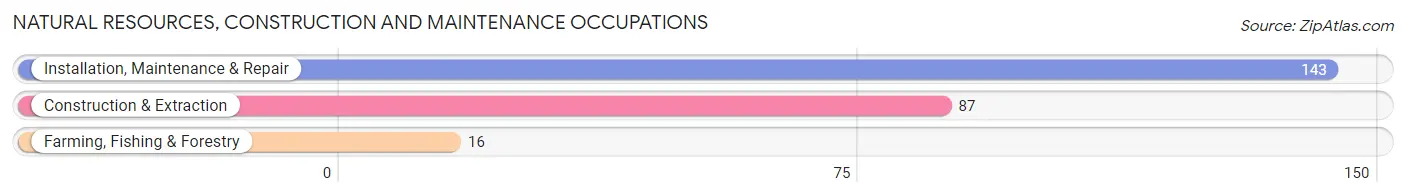
Natural Resources, Construction and Maintenance Occupations
The most common Natural Resources, Construction and Maintenance occupations in Indianola are Installation, Maintenance & Repair (143 | 4.0%), Construction & Extraction (87 | 2.4%), and Farming, Fishing & Forestry (16 | 0.4%).
Natural Resources, Construction and Maintenance Occupations by Sex
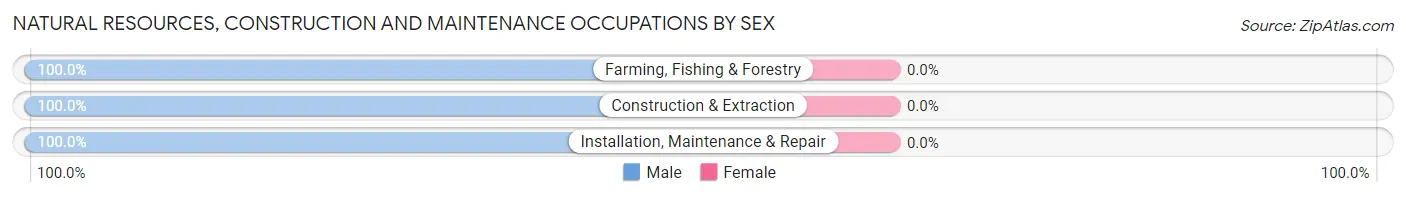
| Occupation | Male | Female |
| Farming, Fishing & Forestry | 16 (100.0%) | 0 (0.0%) |
| Construction & Extraction | 87 (100.0%) | 0 (0.0%) |
| Installation, Maintenance & Repair | 143 (100.0%) | 0 (0.0%) |
| Total (Category) | 246 (100.0%) | 0 (0.0%) |
| Total (Overall) | 1,646 (46.2%) | 1,916 (53.8%) |
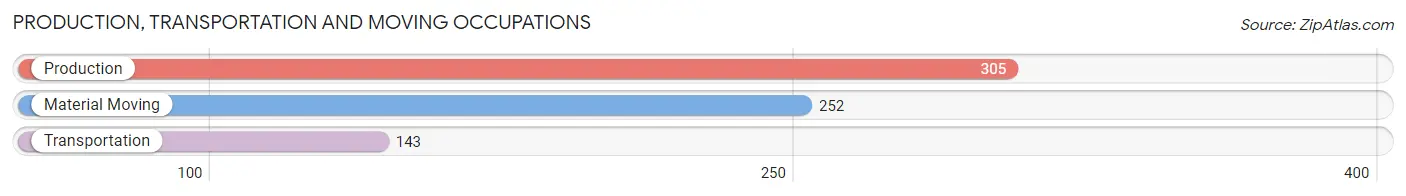
Production, Transportation and Moving Occupations
The most common Production, Transportation and Moving occupations in Indianola are Production (305 | 8.6%), Material Moving (252 | 7.1%), and Transportation (143 | 4.0%).
Production, Transportation and Moving Occupations by Sex
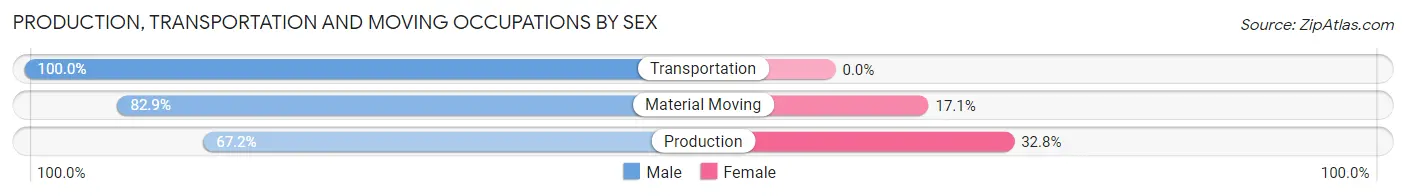
| Occupation | Male | Female |
| Production | 205 (67.2%) | 100 (32.8%) |
| Transportation | 143 (100.0%) | 0 (0.0%) |
| Material Moving | 209 (82.9%) | 43 (17.1%) |
| Total (Category) | 557 (79.6%) | 143 (20.4%) |
| Total (Overall) | 1,646 (46.2%) | 1,916 (53.8%) |
Employment Industries by Sex in Indianola
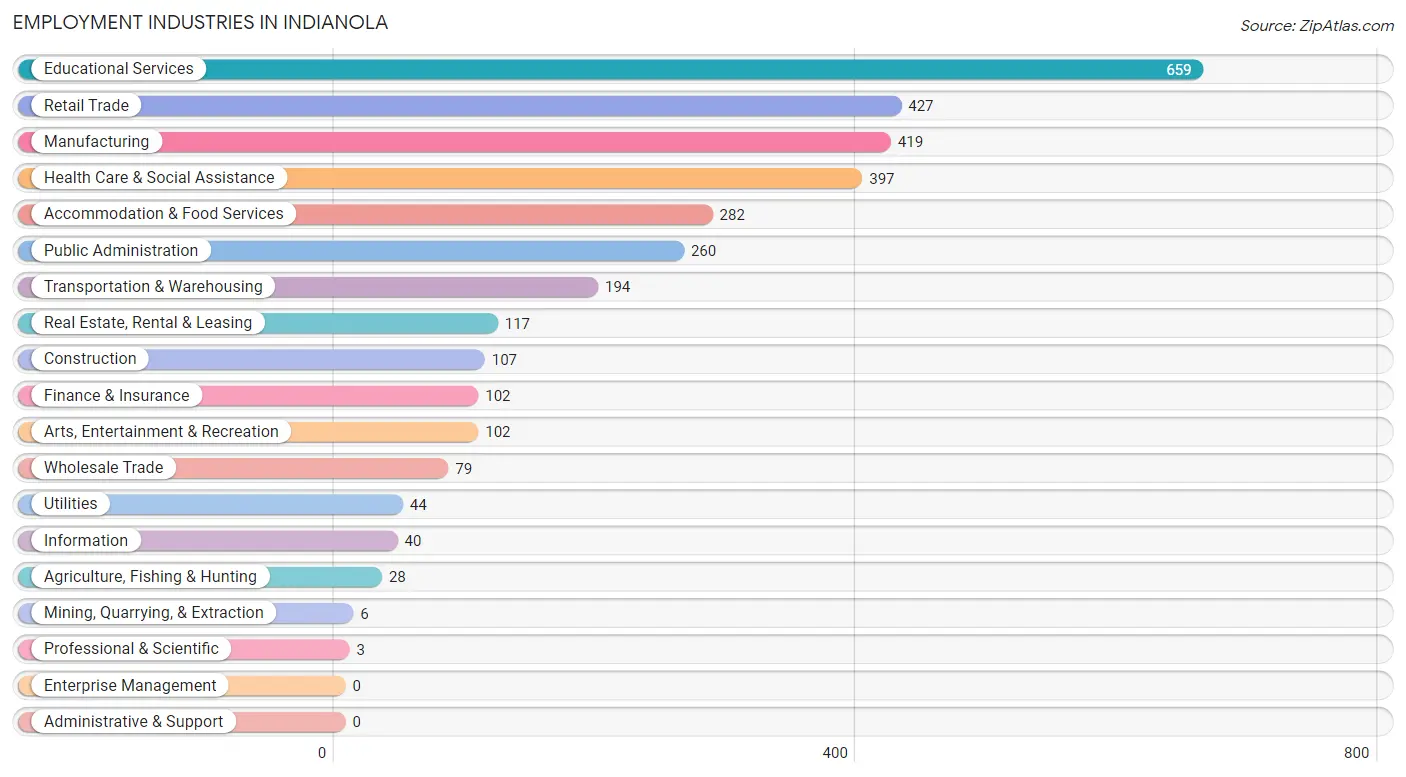
Employment Industries in Indianola
The major employment industries in Indianola include Educational Services (659 | 18.5%), Retail Trade (427 | 12.0%), Manufacturing (419 | 11.8%), Health Care & Social Assistance (397 | 11.2%), and Accommodation & Food Services (282 | 7.9%).
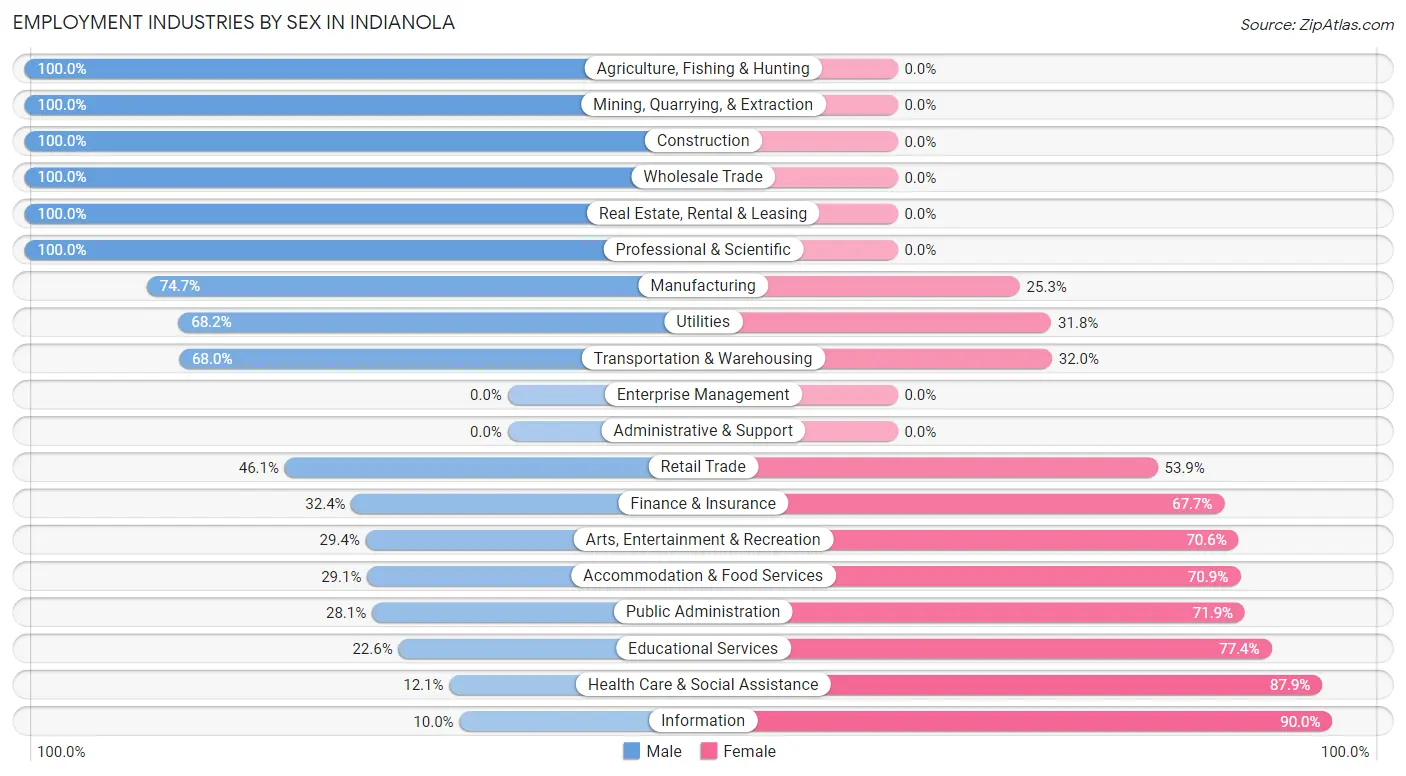
Employment Industries by Sex in Indianola
The Indianola industries that see more men than women are Agriculture, Fishing & Hunting (100.0%), Mining, Quarrying, & Extraction (100.0%), and Construction (100.0%), whereas the industries that tend to have a higher number of women are Information (90.0%), Health Care & Social Assistance (87.9%), and Educational Services (77.4%).
| Industry | Male | Female |
| Agriculture, Fishing & Hunting | 28 (100.0%) | 0 (0.0%) |
| Mining, Quarrying, & Extraction | 6 (100.0%) | 0 (0.0%) |
| Construction | 107 (100.0%) | 0 (0.0%) |
| Manufacturing | 313 (74.7%) | 106 (25.3%) |
| Wholesale Trade | 79 (100.0%) | 0 (0.0%) |
| Retail Trade | 197 (46.1%) | 230 (53.9%) |
| Transportation & Warehousing | 132 (68.0%) | 62 (32.0%) |
| Utilities | 30 (68.2%) | 14 (31.8%) |
| Information | 4 (10.0%) | 36 (90.0%) |
| Finance & Insurance | 33 (32.4%) | 69 (67.6%) |
| Real Estate, Rental & Leasing | 117 (100.0%) | 0 (0.0%) |
| Professional & Scientific | 3 (100.0%) | 0 (0.0%) |
| Enterprise Management | 0 (0.0%) | 0 (0.0%) |
| Administrative & Support | 0 (0.0%) | 0 (0.0%) |
| Educational Services | 149 (22.6%) | 510 (77.4%) |
| Health Care & Social Assistance | 48 (12.1%) | 349 (87.9%) |
| Arts, Entertainment & Recreation | 30 (29.4%) | 72 (70.6%) |
| Accommodation & Food Services | 82 (29.1%) | 200 (70.9%) |
| Public Administration | 73 (28.1%) | 187 (71.9%) |
| Total | 1,646 (46.2%) | 1,916 (53.8%) |
Education in Indianola
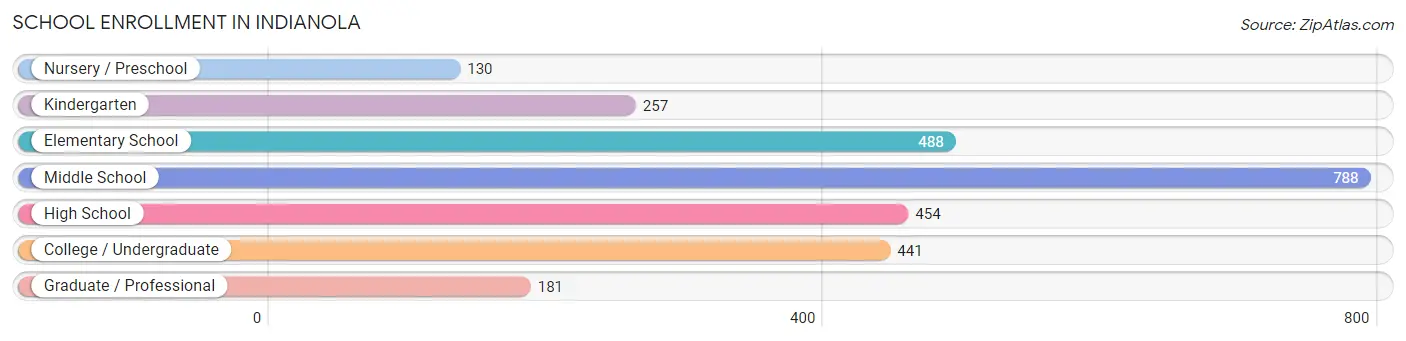
School Enrollment in Indianola
The most common levels of schooling among the 2,739 students in Indianola are middle school (788 | 28.8%), elementary school (488 | 17.8%), and high school (454 | 16.6%).
| School Level | # Students | % Students |
| Nursery / Preschool | 130 | 4.8% |
| Kindergarten | 257 | 9.4% |
| Elementary School | 488 | 17.8% |
| Middle School | 788 | 28.8% |
| High School | 454 | 16.6% |
| College / Undergraduate | 441 | 16.1% |
| Graduate / Professional | 181 | 6.6% |
| Total | 2,739 | 100.0% |
School Enrollment by Age by Funding Source in Indianola
Out of a total of 2,739 students who are enrolled in schools in Indianola, 386 (14.1%) attend a private institution, while the remaining 2,353 (85.9%) are enrolled in public schools. The age group of 35 years and over has the highest likelihood of being enrolled in private schools, with 44 (39.3% in the age bracket) enrolled. Conversely, the age group of 3 to 4 year olds has the lowest likelihood of being enrolled in a private school, with 152 (100.0% in the age bracket) attending a public institution.
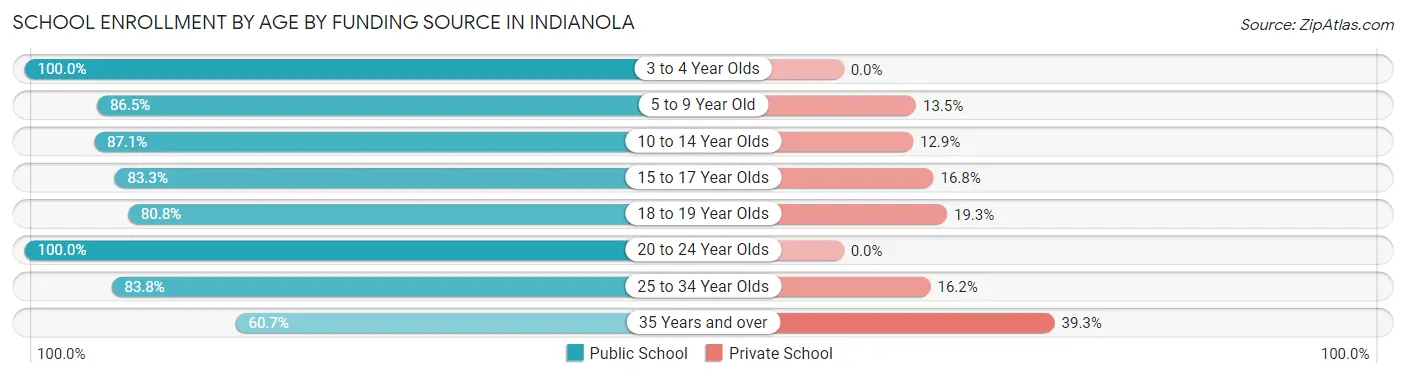
| Age Bracket | Public School | Private School |
| 3 to 4 Year Olds | 152 (100.0%) | 0 (0.0%) |
| 5 to 9 Year Old | 571 (86.5%) | 89 (13.5%) |
| 10 to 14 Year Olds | 721 (87.1%) | 107 (12.9%) |
| 15 to 17 Year Olds | 353 (83.3%) | 71 (16.8%) |
| 18 to 19 Year Olds | 193 (80.7%) | 46 (19.3%) |
| 20 to 24 Year Olds | 151 (100.0%) | 0 (0.0%) |
| 25 to 34 Year Olds | 145 (83.8%) | 28 (16.2%) |
| 35 Years and over | 68 (60.7%) | 44 (39.3%) |
| Total | 2,353 (85.9%) | 386 (14.1%) |
Educational Attainment by Field of Study in Indianola
Education (511 | 33.6%), business (391 | 25.7%), arts & humanities (122 | 8.0%), liberal arts & history (110 | 7.2%), and science & technology (108 | 7.1%) are the most common fields of study among 1,519 individuals in Indianola who have obtained a bachelor's degree or higher.
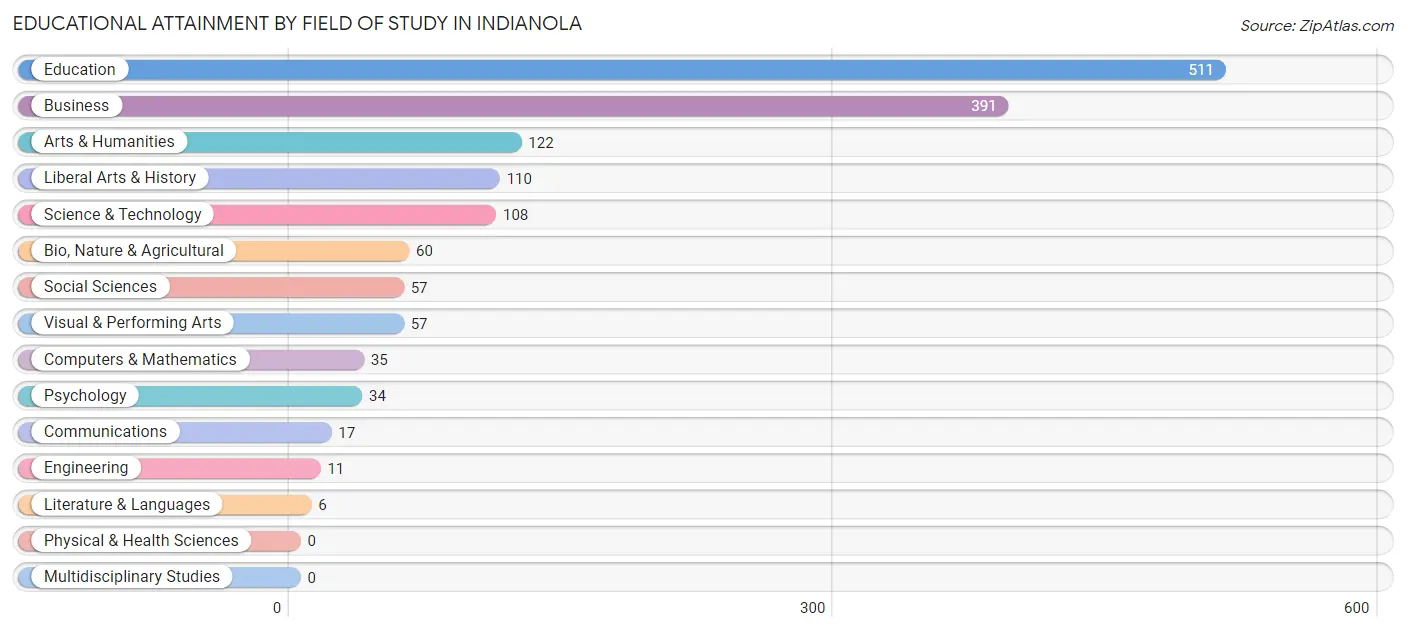
| Field of Study | # Graduates | % Graduates |
| Computers & Mathematics | 35 | 2.3% |
| Bio, Nature & Agricultural | 60 | 4.0% |
| Physical & Health Sciences | 0 | 0.0% |
| Psychology | 34 | 2.2% |
| Social Sciences | 57 | 3.7% |
| Engineering | 11 | 0.7% |
| Multidisciplinary Studies | 0 | 0.0% |
| Science & Technology | 108 | 7.1% |
| Business | 391 | 25.7% |
| Education | 511 | 33.6% |
| Literature & Languages | 6 | 0.4% |
| Liberal Arts & History | 110 | 7.2% |
| Visual & Performing Arts | 57 | 3.7% |
| Communications | 17 | 1.1% |
| Arts & Humanities | 122 | 8.0% |
| Total | 1,519 | 100.0% |
Transportation & Commute in Indianola
Vehicle Availability by Sex in Indianola
The most prevalent vehicle ownership categories in Indianola are males with 2 vehicles (562, accounting for 34.1%) and females with 2 vehicles (803, making up 29.7%).
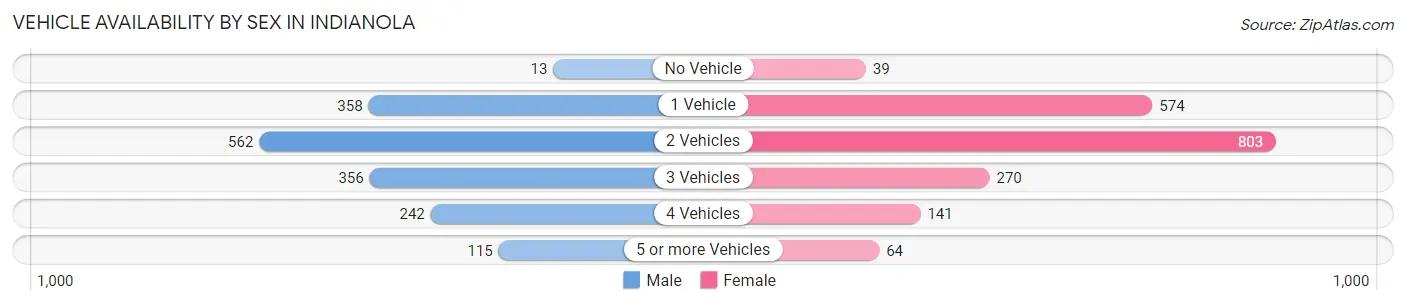
| Vehicles Available | Male | Female |
| No Vehicle | 13 (0.8%) | 39 (2.1%) |
| 1 Vehicle | 358 (21.7%) | 574 (30.3%) |
| 2 Vehicles | 562 (34.1%) | 803 (42.5%) |
| 3 Vehicles | 356 (21.6%) | 270 (14.3%) |
| 4 Vehicles | 242 (14.7%) | 141 (7.5%) |
| 5 or more Vehicles | 115 (7.0%) | 64 (3.4%) |
| Total | 1,646 (100.0%) | 1,891 (100.0%) |
Commute Time in Indianola
The most frequently occuring commute durations in Indianola are 5 to 9 minutes (918 commuters, 27.1%), less than 5 minutes (548 commuters, 16.2%), and 10 to 14 minutes (505 commuters, 14.9%).
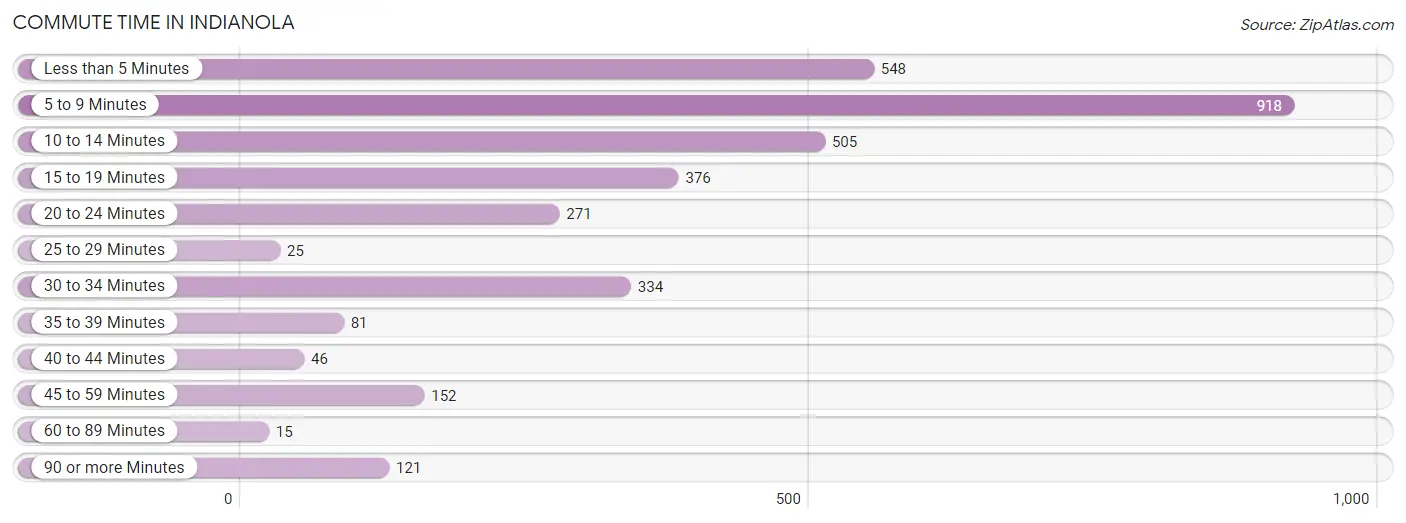
| Commute Time | # Commuters | % Commuters |
| Less than 5 Minutes | 548 | 16.2% |
| 5 to 9 Minutes | 918 | 27.1% |
| 10 to 14 Minutes | 505 | 14.9% |
| 15 to 19 Minutes | 376 | 11.1% |
| 20 to 24 Minutes | 271 | 8.0% |
| 25 to 29 Minutes | 25 | 0.7% |
| 30 to 34 Minutes | 334 | 9.9% |
| 35 to 39 Minutes | 81 | 2.4% |
| 40 to 44 Minutes | 46 | 1.4% |
| 45 to 59 Minutes | 152 | 4.5% |
| 60 to 89 Minutes | 15 | 0.4% |
| 90 or more Minutes | 121 | 3.6% |
Commute Time by Sex in Indianola
The most common commute times in Indianola are 10 to 14 minutes (312 commuters, 20.7%) for males and 5 to 9 minutes (650 commuters, 34.5%) for females.
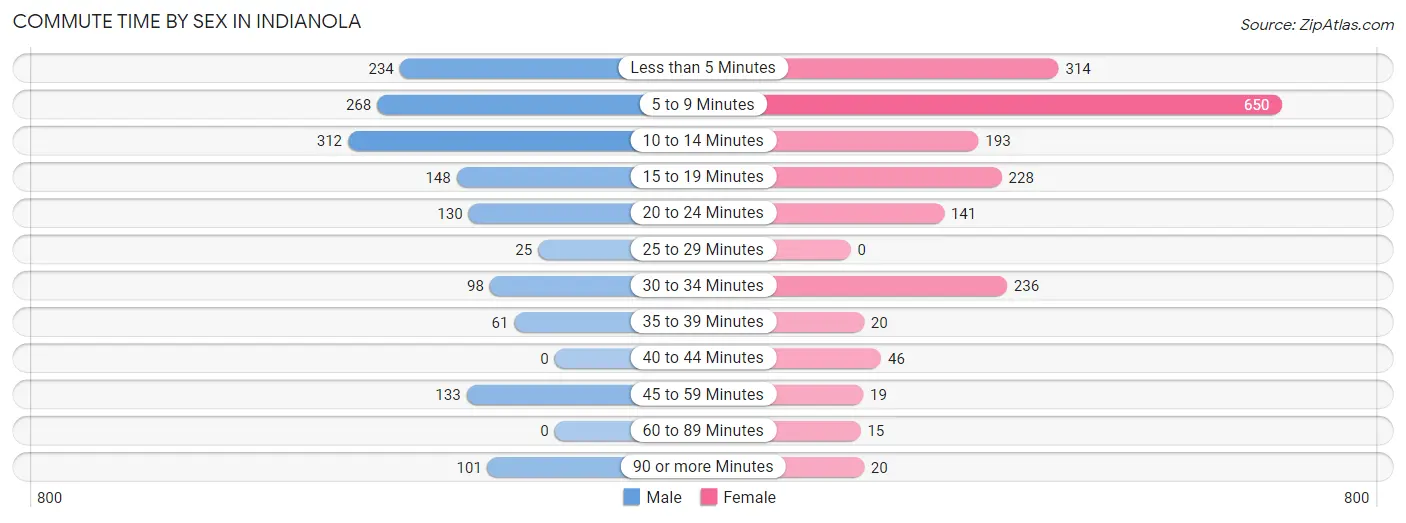
| Commute Time | Male | Female |
| Less than 5 Minutes | 234 (15.5%) | 314 (16.7%) |
| 5 to 9 Minutes | 268 (17.7%) | 650 (34.5%) |
| 10 to 14 Minutes | 312 (20.7%) | 193 (10.3%) |
| 15 to 19 Minutes | 148 (9.8%) | 228 (12.1%) |
| 20 to 24 Minutes | 130 (8.6%) | 141 (7.5%) |
| 25 to 29 Minutes | 25 (1.7%) | 0 (0.0%) |
| 30 to 34 Minutes | 98 (6.5%) | 236 (12.5%) |
| 35 to 39 Minutes | 61 (4.0%) | 20 (1.1%) |
| 40 to 44 Minutes | 0 (0.0%) | 46 (2.4%) |
| 45 to 59 Minutes | 133 (8.8%) | 19 (1.0%) |
| 60 to 89 Minutes | 0 (0.0%) | 15 (0.8%) |
| 90 or more Minutes | 101 (6.7%) | 20 (1.1%) |
Time of Departure to Work by Sex in Indianola
The most frequent times of departure to work in Indianola are 7:30 AM to 7:59 AM (362, 24.0%) for males and 7:30 AM to 7:59 AM (462, 24.5%) for females.
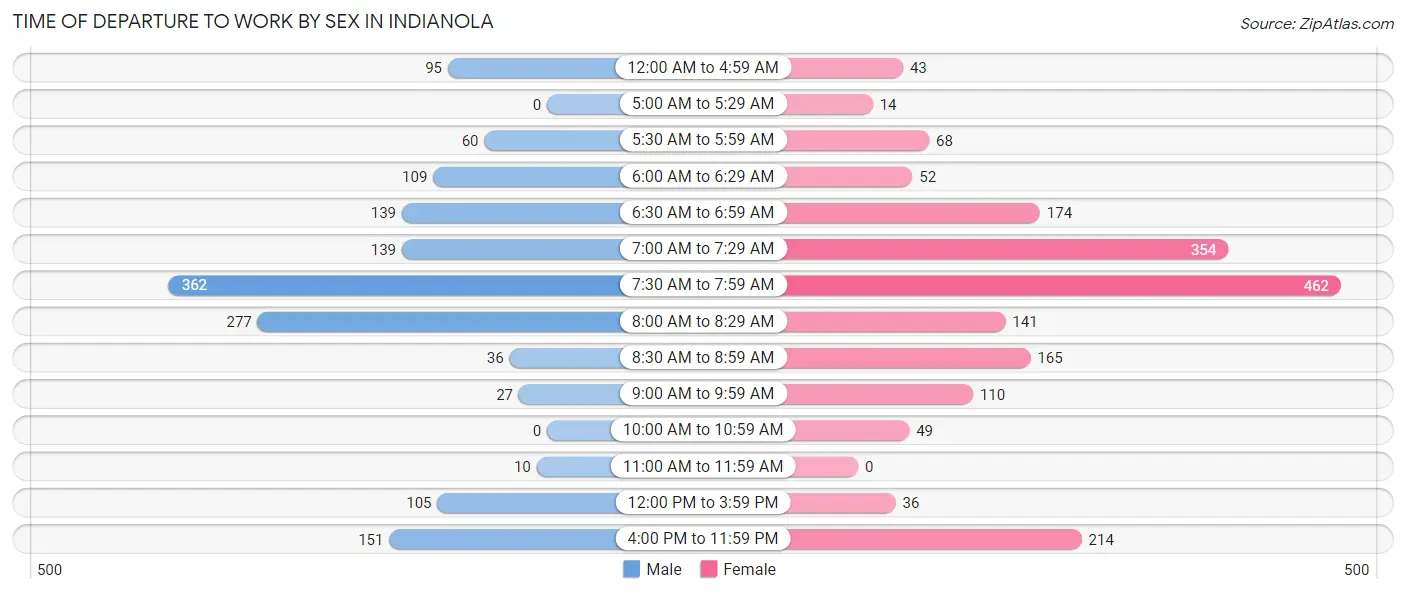
| Time of Departure | Male | Female |
| 12:00 AM to 4:59 AM | 95 (6.3%) | 43 (2.3%) |
| 5:00 AM to 5:29 AM | 0 (0.0%) | 14 (0.7%) |
| 5:30 AM to 5:59 AM | 60 (4.0%) | 68 (3.6%) |
| 6:00 AM to 6:29 AM | 109 (7.2%) | 52 (2.8%) |
| 6:30 AM to 6:59 AM | 139 (9.2%) | 174 (9.2%) |
| 7:00 AM to 7:29 AM | 139 (9.2%) | 354 (18.8%) |
| 7:30 AM to 7:59 AM | 362 (24.0%) | 462 (24.5%) |
| 8:00 AM to 8:29 AM | 277 (18.3%) | 141 (7.5%) |
| 8:30 AM to 8:59 AM | 36 (2.4%) | 165 (8.8%) |
| 9:00 AM to 9:59 AM | 27 (1.8%) | 110 (5.8%) |
| 10:00 AM to 10:59 AM | 0 (0.0%) | 49 (2.6%) |
| 11:00 AM to 11:59 AM | 10 (0.7%) | 0 (0.0%) |
| 12:00 PM to 3:59 PM | 105 (7.0%) | 36 (1.9%) |
| 4:00 PM to 11:59 PM | 151 (10.0%) | 214 (11.4%) |
| Total | 1,510 (100.0%) | 1,882 (100.0%) |
Housing Occupancy in Indianola
Occupancy by Ownership in Indianola
Of the total 3,547 dwellings in Indianola, owner-occupied units account for 1,919 (54.1%), while renter-occupied units make up 1,628 (45.9%).
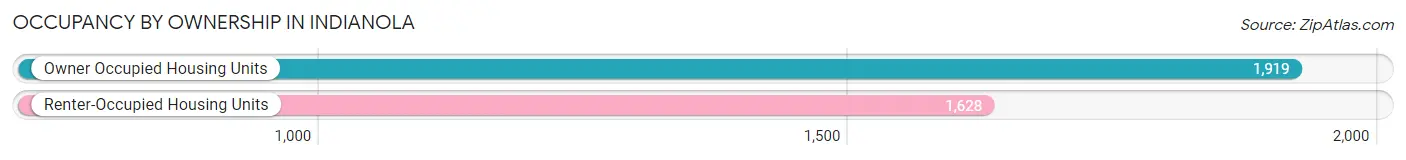
| Occupancy | # Housing Units | % Housing Units |
| Owner Occupied Housing Units | 1,919 | 54.1% |
| Renter-Occupied Housing Units | 1,628 | 45.9% |
| Total Occupied Housing Units | 3,547 | 100.0% |
Occupancy by Household Size in Indianola
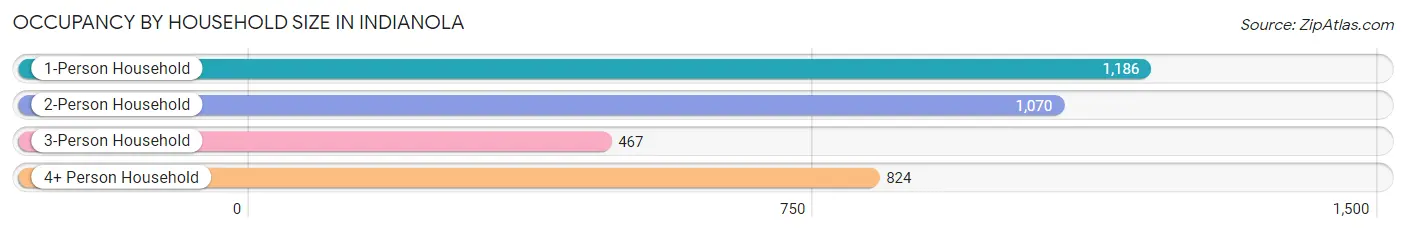
| Household Size | # Housing Units | % Housing Units |
| 1-Person Household | 1,186 | 33.4% |
| 2-Person Household | 1,070 | 30.2% |
| 3-Person Household | 467 | 13.2% |
| 4+ Person Household | 824 | 23.2% |
| Total Housing Units | 3,547 | 100.0% |
Occupancy by Ownership by Household Size in Indianola
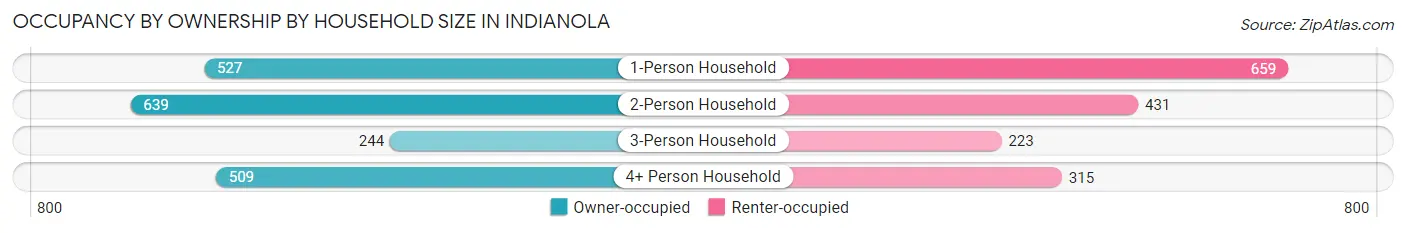
| Household Size | Owner-occupied | Renter-occupied |
| 1-Person Household | 527 (44.4%) | 659 (55.6%) |
| 2-Person Household | 639 (59.7%) | 431 (40.3%) |
| 3-Person Household | 244 (52.2%) | 223 (47.7%) |
| 4+ Person Household | 509 (61.8%) | 315 (38.2%) |
| Total Housing Units | 1,919 (54.1%) | 1,628 (45.9%) |
Occupancy by Educational Attainment in Indianola
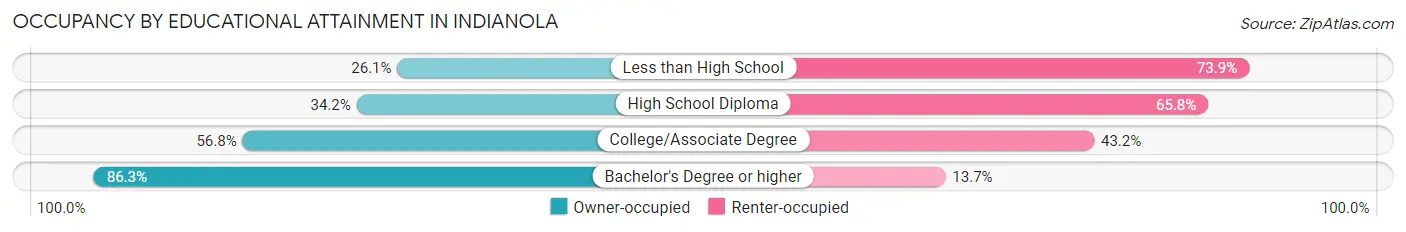
| Household Size | Owner-occupied | Renter-occupied |
| Less than High School | 156 (26.1%) | 442 (73.9%) |
| High School Diploma | 305 (34.2%) | 587 (65.8%) |
| College/Associate Degree | 610 (56.8%) | 464 (43.2%) |
| Bachelor's Degree or higher | 848 (86.3%) | 135 (13.7%) |
Occupancy by Age of Householder in Indianola
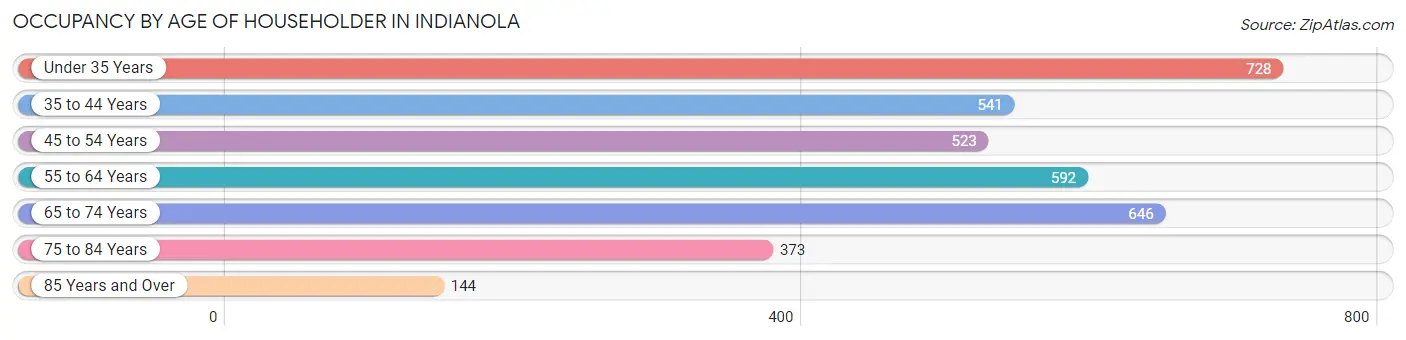
| Age Bracket | # Households | % Households |
| Under 35 Years | 728 | 20.5% |
| 35 to 44 Years | 541 | 15.2% |
| 45 to 54 Years | 523 | 14.7% |
| 55 to 64 Years | 592 | 16.7% |
| 65 to 74 Years | 646 | 18.2% |
| 75 to 84 Years | 373 | 10.5% |
| 85 Years and Over | 144 | 4.1% |
| Total | 3,547 | 100.0% |
Housing Finances in Indianola
Median Income by Occupancy in Indianola
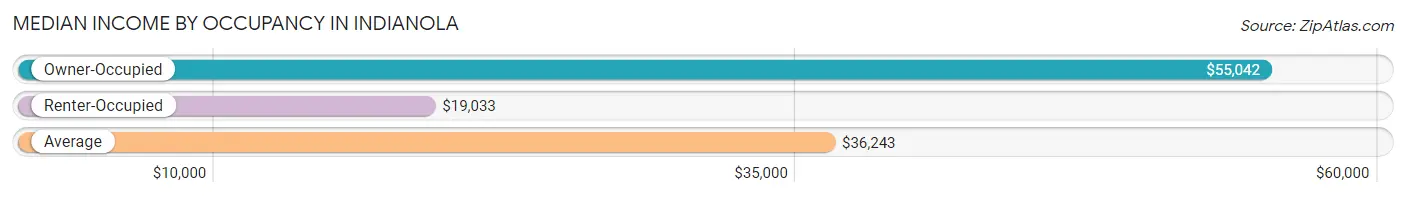
| Occupancy Type | # Households | Median Income |
| Owner-Occupied | 1,919 (54.1%) | $55,042 |
| Renter-Occupied | 1,628 (45.9%) | $19,033 |
| Average | 3,547 (100.0%) | $36,243 |
Occupancy by Householder Income Bracket in Indianola
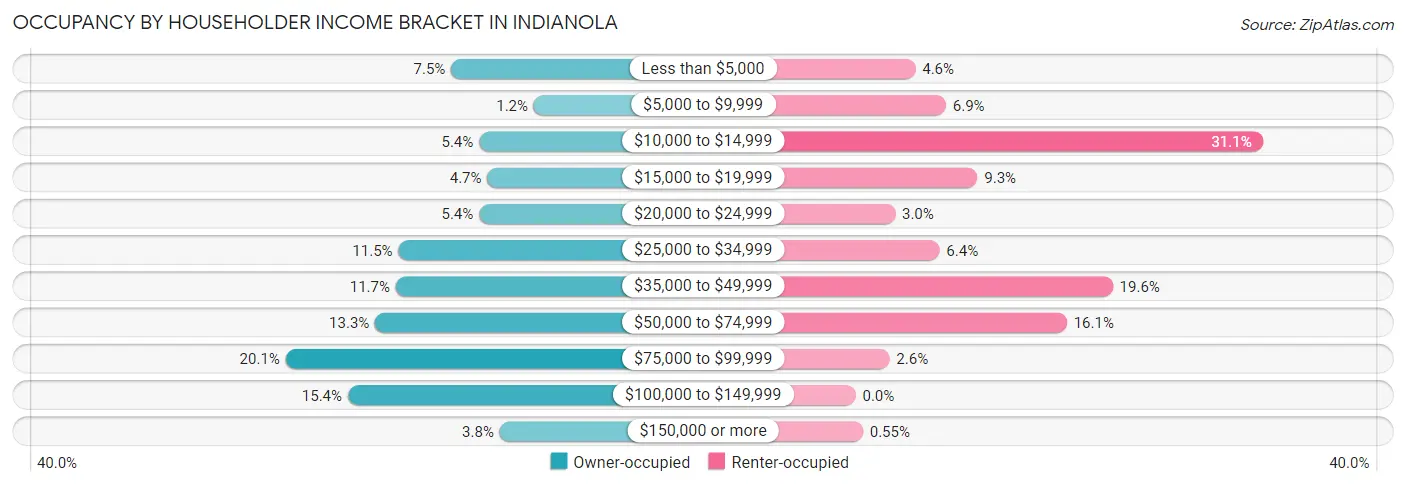
| Income Bracket | Owner-occupied | Renter-occupied |
| Less than $5,000 | 144 (7.5%) | 74 (4.5%) |
| $5,000 to $9,999 | 23 (1.2%) | 112 (6.9%) |
| $10,000 to $14,999 | 103 (5.4%) | 506 (31.1%) |
| $15,000 to $19,999 | 91 (4.7%) | 151 (9.3%) |
| $20,000 to $24,999 | 103 (5.4%) | 49 (3.0%) |
| $25,000 to $34,999 | 221 (11.5%) | 104 (6.4%) |
| $35,000 to $49,999 | 225 (11.7%) | 319 (19.6%) |
| $50,000 to $74,999 | 255 (13.3%) | 262 (16.1%) |
| $75,000 to $99,999 | 386 (20.1%) | 42 (2.6%) |
| $100,000 to $149,999 | 295 (15.4%) | 0 (0.0%) |
| $150,000 or more | 73 (3.8%) | 9 (0.5%) |
| Total | 1,919 (100.0%) | 1,628 (100.0%) |
Monthly Housing Cost Tiers in Indianola
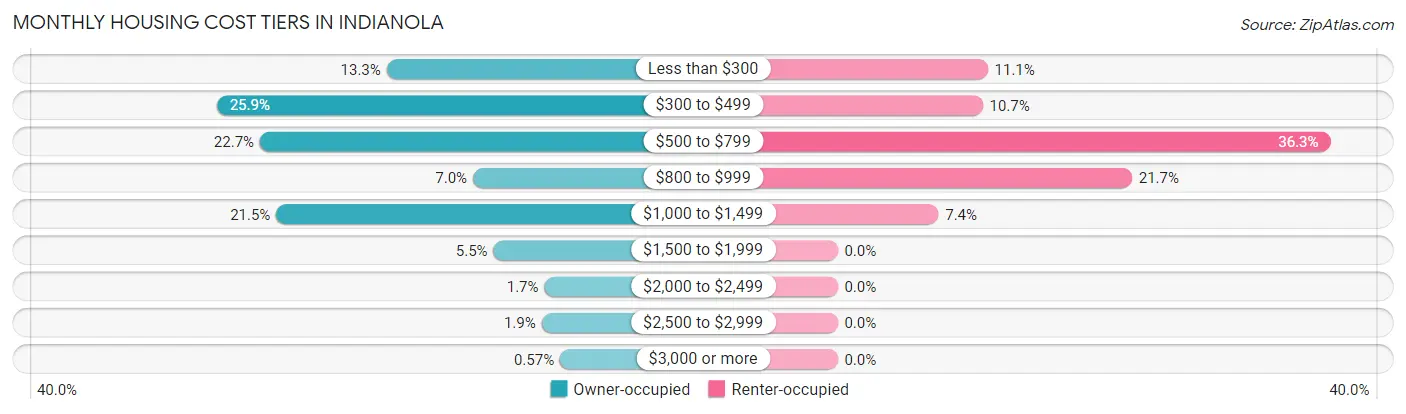
| Monthly Cost | Owner-occupied | Renter-occupied |
| Less than $300 | 256 (13.3%) | 180 (11.1%) |
| $300 to $499 | 496 (25.9%) | 174 (10.7%) |
| $500 to $799 | 435 (22.7%) | 591 (36.3%) |
| $800 to $999 | 134 (7.0%) | 353 (21.7%) |
| $1,000 to $1,499 | 412 (21.5%) | 121 (7.4%) |
| $1,500 to $1,999 | 105 (5.5%) | 0 (0.0%) |
| $2,000 to $2,499 | 33 (1.7%) | 0 (0.0%) |
| $2,500 to $2,999 | 37 (1.9%) | 0 (0.0%) |
| $3,000 or more | 11 (0.6%) | 0 (0.0%) |
| Total | 1,919 (100.0%) | 1,628 (100.0%) |
Physical Housing Characteristics in Indianola
Housing Structures in Indianola
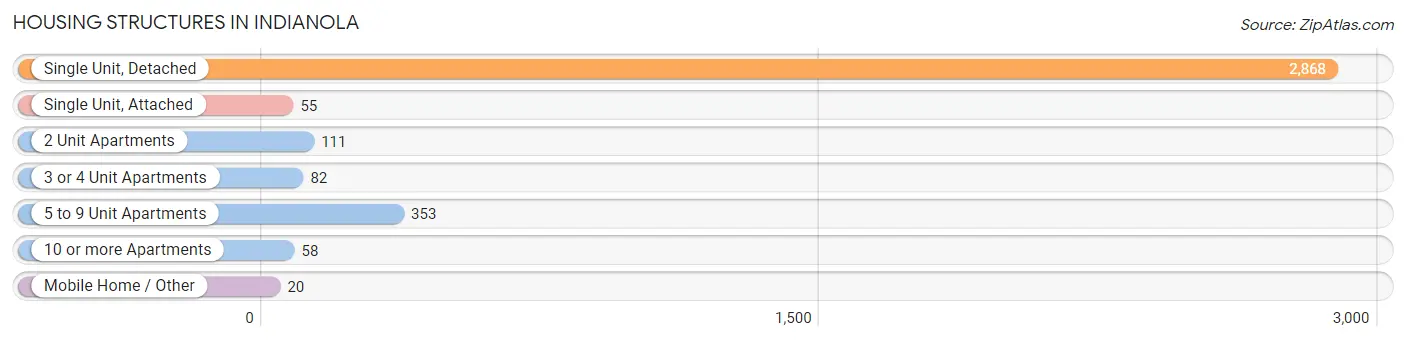
| Structure Type | # Housing Units | % Housing Units |
| Single Unit, Detached | 2,868 | 80.9% |
| Single Unit, Attached | 55 | 1.5% |
| 2 Unit Apartments | 111 | 3.1% |
| 3 or 4 Unit Apartments | 82 | 2.3% |
| 5 to 9 Unit Apartments | 353 | 10.0% |
| 10 or more Apartments | 58 | 1.6% |
| Mobile Home / Other | 20 | 0.6% |
| Total | 3,547 | 100.0% |
Housing Structures by Occupancy in Indianola
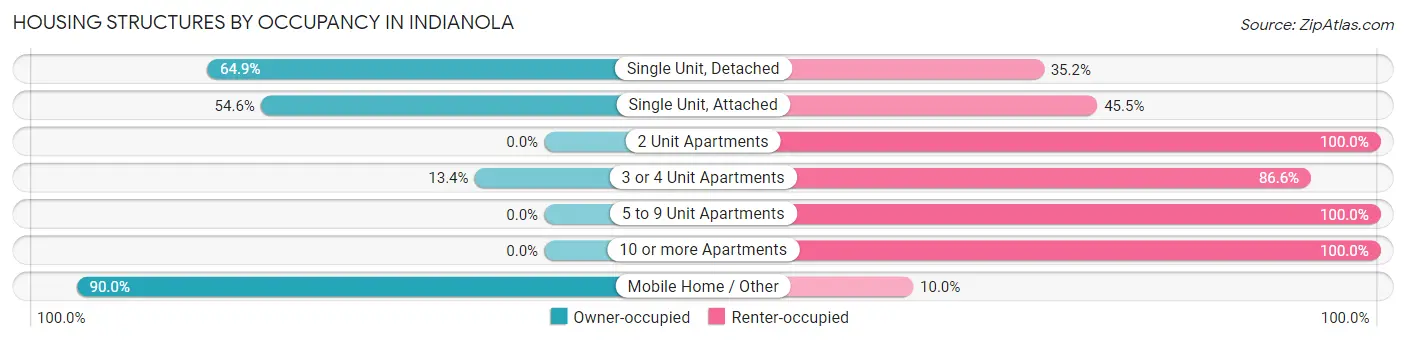
| Structure Type | Owner-occupied | Renter-occupied |
| Single Unit, Detached | 1,860 (64.8%) | 1,008 (35.1%) |
| Single Unit, Attached | 30 (54.5%) | 25 (45.5%) |
| 2 Unit Apartments | 0 (0.0%) | 111 (100.0%) |
| 3 or 4 Unit Apartments | 11 (13.4%) | 71 (86.6%) |
| 5 to 9 Unit Apartments | 0 (0.0%) | 353 (100.0%) |
| 10 or more Apartments | 0 (0.0%) | 58 (100.0%) |
| Mobile Home / Other | 18 (90.0%) | 2 (10.0%) |
| Total | 1,919 (54.1%) | 1,628 (45.9%) |
Housing Structures by Number of Rooms in Indianola
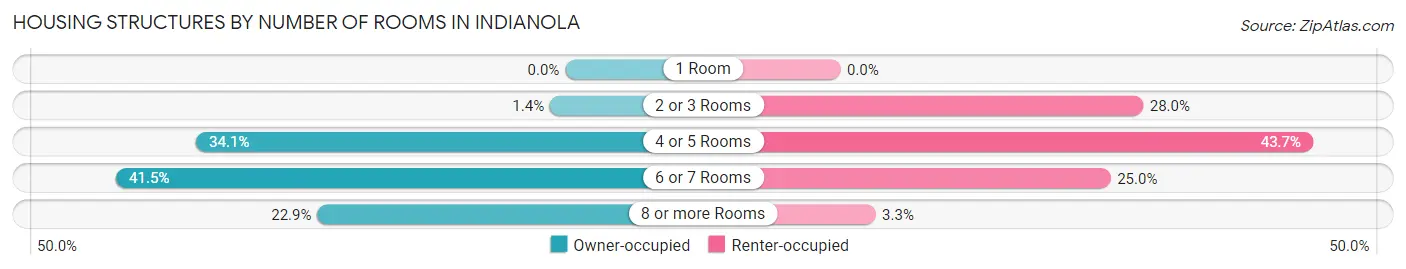
| Number of Rooms | Owner-occupied | Renter-occupied |
| 1 Room | 0 (0.0%) | 0 (0.0%) |
| 2 or 3 Rooms | 27 (1.4%) | 456 (28.0%) |
| 4 or 5 Rooms | 655 (34.1%) | 712 (43.7%) |
| 6 or 7 Rooms | 797 (41.5%) | 407 (25.0%) |
| 8 or more Rooms | 440 (22.9%) | 53 (3.3%) |
| Total | 1,919 (100.0%) | 1,628 (100.0%) |
Housing Structure by Heating Type in Indianola
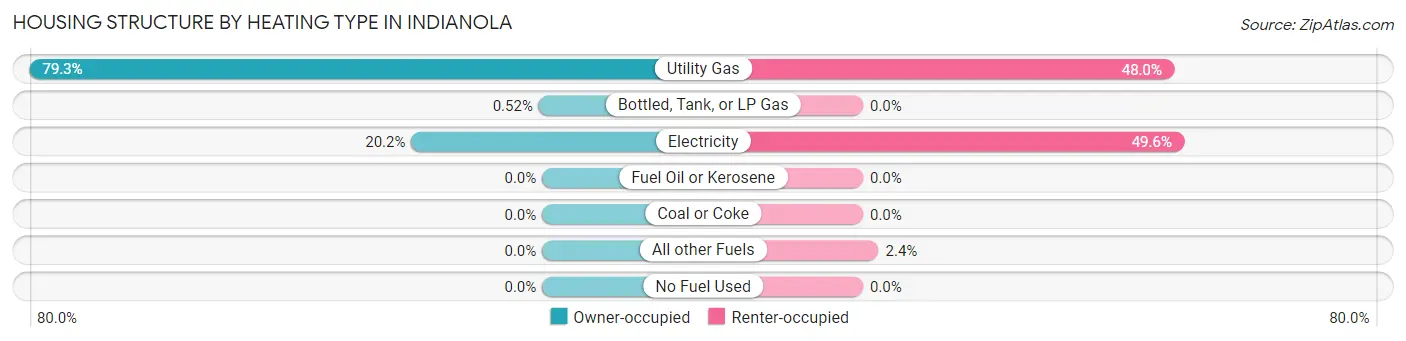
| Heating Type | Owner-occupied | Renter-occupied |
| Utility Gas | 1,521 (79.3%) | 782 (48.0%) |
| Bottled, Tank, or LP Gas | 10 (0.5%) | 0 (0.0%) |
| Electricity | 388 (20.2%) | 807 (49.6%) |
| Fuel Oil or Kerosene | 0 (0.0%) | 0 (0.0%) |
| Coal or Coke | 0 (0.0%) | 0 (0.0%) |
| All other Fuels | 0 (0.0%) | 39 (2.4%) |
| No Fuel Used | 0 (0.0%) | 0 (0.0%) |
| Total | 1,919 (100.0%) | 1,628 (100.0%) |
Household Vehicle Usage in Indianola
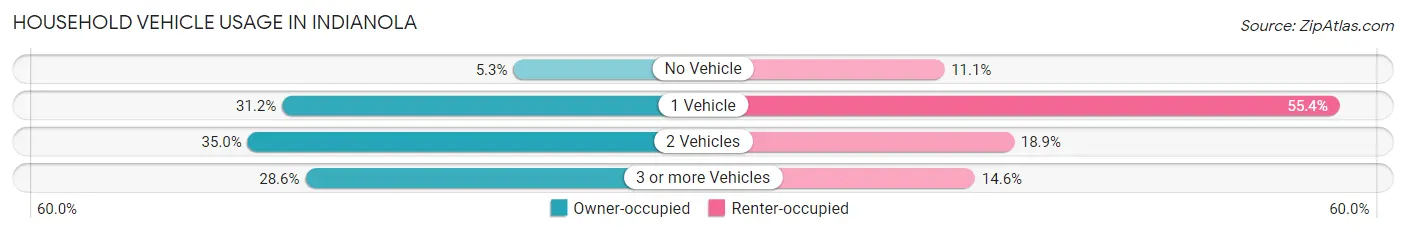
| Vehicles per Household | Owner-occupied | Renter-occupied |
| No Vehicle | 101 (5.3%) | 181 (11.1%) |
| 1 Vehicle | 598 (31.2%) | 902 (55.4%) |
| 2 Vehicles | 672 (35.0%) | 308 (18.9%) |
| 3 or more Vehicles | 548 (28.6%) | 237 (14.6%) |
| Total | 1,919 (100.0%) | 1,628 (100.0%) |
Real Estate & Mortgages in Indianola
Real Estate and Mortgage Overview in Indianola
| Characteristic | Without Mortgage | With Mortgage |
| Housing Units | 1,018 | 901 |
| Median Property Value | $106,400 | $112,200 |
| Median Household Income | $47,874 | $56 |
| Monthly Housing Costs | $401 | $11 |
| Real Estate Taxes | $705 | $168 |
Property Value by Mortgage Status in Indianola
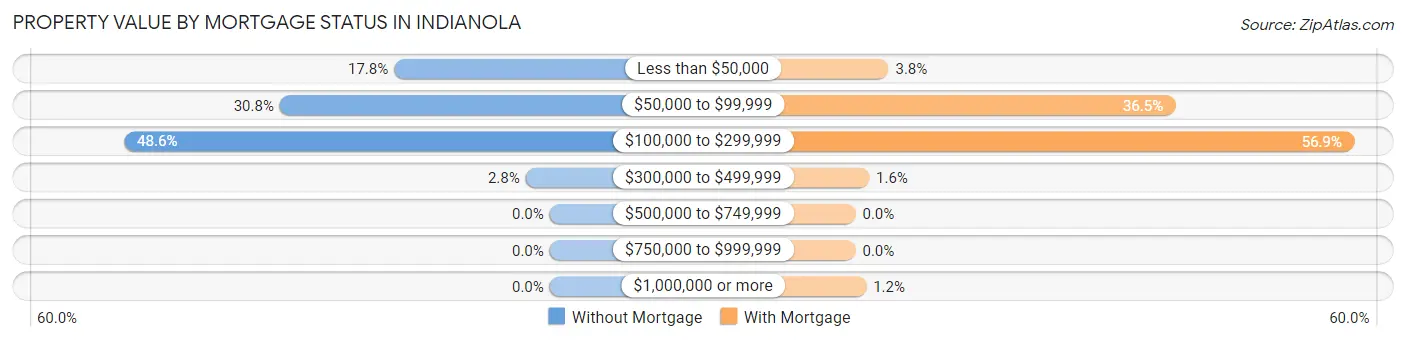
| Property Value | Without Mortgage | With Mortgage |
| Less than $50,000 | 181 (17.8%) | 34 (3.8%) |
| $50,000 to $99,999 | 314 (30.8%) | 329 (36.5%) |
| $100,000 to $299,999 | 495 (48.6%) | 513 (56.9%) |
| $300,000 to $499,999 | 28 (2.8%) | 14 (1.5%) |
| $500,000 to $749,999 | 0 (0.0%) | 0 (0.0%) |
| $750,000 to $999,999 | 0 (0.0%) | 0 (0.0%) |
| $1,000,000 or more | 0 (0.0%) | 11 (1.2%) |
| Total | 1,018 (100.0%) | 901 (100.0%) |
Household Income by Mortgage Status in Indianola
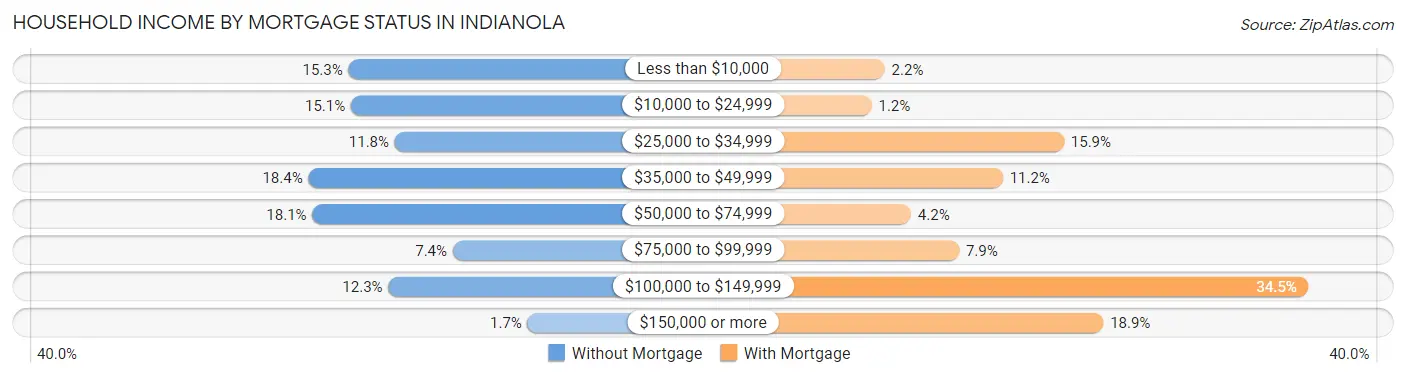
| Household Income | Without Mortgage | With Mortgage |
| Less than $10,000 | 156 (15.3%) | 20 (2.2%) |
| $10,000 to $24,999 | 154 (15.1%) | 11 (1.2%) |
| $25,000 to $34,999 | 120 (11.8%) | 143 (15.9%) |
| $35,000 to $49,999 | 187 (18.4%) | 101 (11.2%) |
| $50,000 to $74,999 | 184 (18.1%) | 38 (4.2%) |
| $75,000 to $99,999 | 75 (7.4%) | 71 (7.9%) |
| $100,000 to $149,999 | 125 (12.3%) | 311 (34.5%) |
| $150,000 or more | 17 (1.7%) | 170 (18.9%) |
| Total | 1,018 (100.0%) | 901 (100.0%) |
Property Value to Household Income Ratio in Indianola
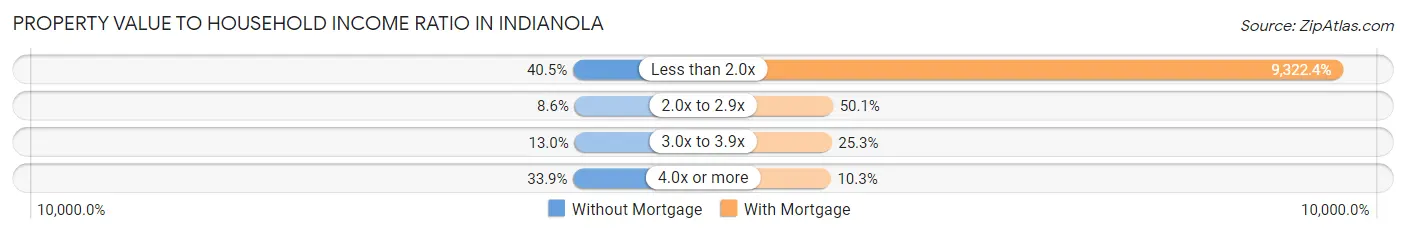
| Value-to-Income Ratio | Without Mortgage | With Mortgage |
| Less than 2.0x | 412 (40.5%) | 83,995 (9,322.4%) |
| 2.0x to 2.9x | 87 (8.6%) | 451 (50.1%) |
| 3.0x to 3.9x | 132 (13.0%) | 228 (25.3%) |
| 4.0x or more | 345 (33.9%) | 93 (10.3%) |
| Total | 1,018 (100.0%) | 901 (100.0%) |
Real Estate Taxes by Mortgage Status in Indianola
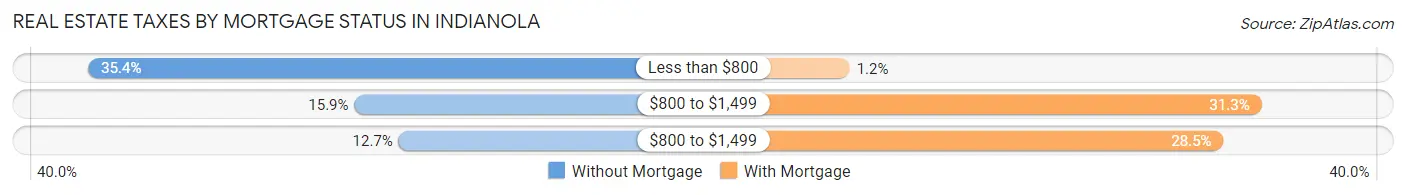
| Property Taxes | Without Mortgage | With Mortgage |
| Less than $800 | 360 (35.4%) | 11 (1.2%) |
| $800 to $1,499 | 162 (15.9%) | 282 (31.3%) |
| $800 to $1,499 | 129 (12.7%) | 257 (28.5%) |
| Total | 1,018 (100.0%) | 901 (100.0%) |
Health & Disability in Indianola
Health Insurance Coverage by Age in Indianola
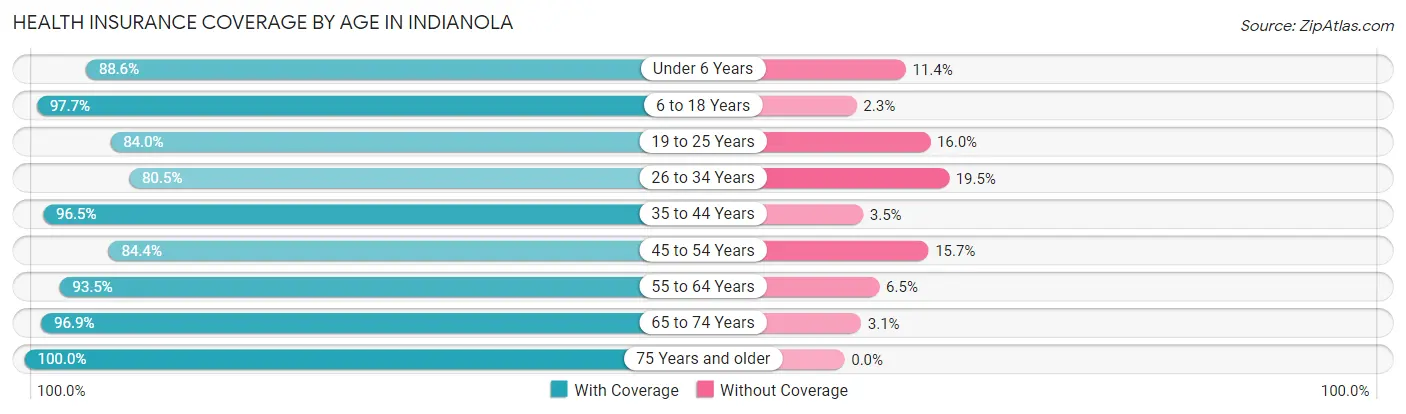
| Age Bracket | With Coverage | Without Coverage |
| Under 6 Years | 481 (88.6%) | 62 (11.4%) |
| 6 to 18 Years | 2,160 (97.7%) | 50 (2.3%) |
| 19 to 25 Years | 721 (84.0%) | 137 (16.0%) |
| 26 to 34 Years | 980 (80.5%) | 237 (19.5%) |
| 35 to 44 Years | 1,004 (96.5%) | 36 (3.5%) |
| 45 to 54 Years | 841 (84.4%) | 156 (15.7%) |
| 55 to 64 Years | 877 (93.5%) | 61 (6.5%) |
| 65 to 74 Years | 847 (96.9%) | 27 (3.1%) |
| 75 Years and older | 665 (100.0%) | 0 (0.0%) |
| Total | 8,576 (91.8%) | 766 (8.2%) |
Health Insurance Coverage by Citizenship Status in Indianola
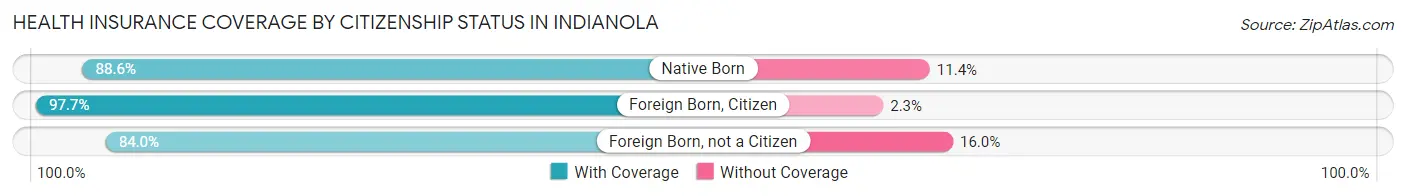
| Citizenship Status | With Coverage | Without Coverage |
| Native Born | 481 (88.6%) | 62 (11.4%) |
| Foreign Born, Citizen | 2,160 (97.7%) | 50 (2.3%) |
| Foreign Born, not a Citizen | 721 (84.0%) | 137 (16.0%) |
Health Insurance Coverage by Household Income in Indianola
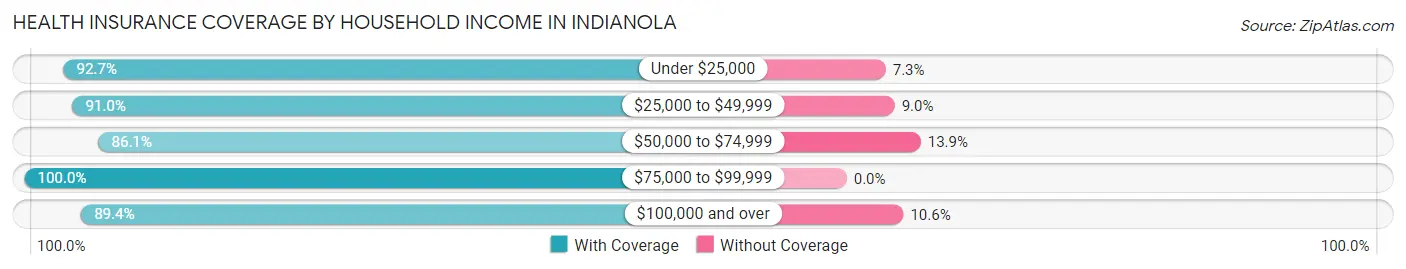
| Household Income | With Coverage | Without Coverage |
| Under $25,000 | 2,409 (92.7%) | 190 (7.3%) |
| $25,000 to $49,999 | 2,148 (91.0%) | 212 (9.0%) |
| $50,000 to $74,999 | 1,317 (86.1%) | 212 (13.9%) |
| $75,000 to $99,999 | 1,423 (100.0%) | 0 (0.0%) |
| $100,000 and over | 1,279 (89.4%) | 152 (10.6%) |
Public vs Private Health Insurance Coverage by Age in Indianola
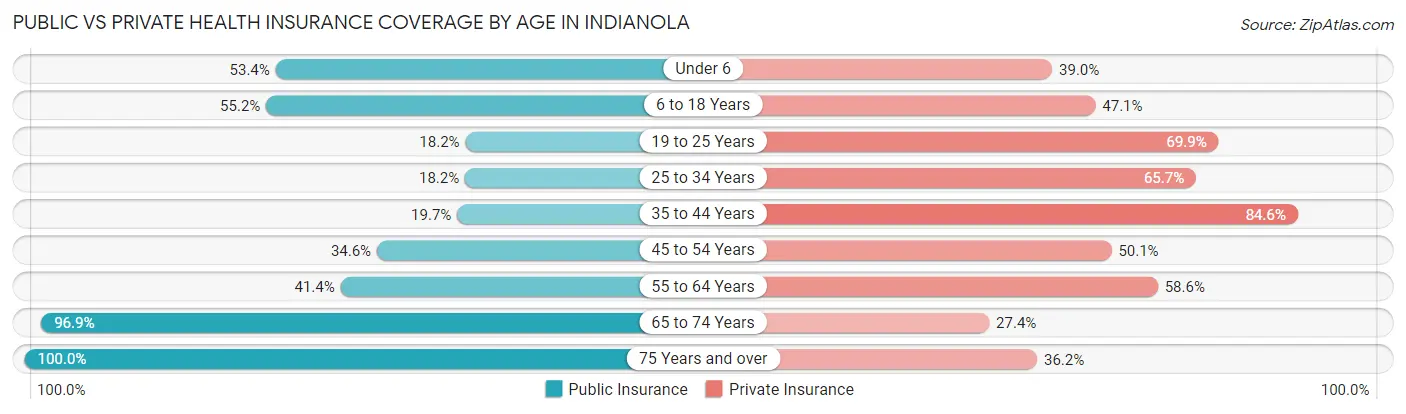
| Age Bracket | Public Insurance | Private Insurance |
| Under 6 | 290 (53.4%) | 212 (39.0%) |
| 6 to 18 Years | 1,219 (55.2%) | 1,040 (47.1%) |
| 19 to 25 Years | 156 (18.2%) | 600 (69.9%) |
| 25 to 34 Years | 222 (18.2%) | 800 (65.7%) |
| 35 to 44 Years | 205 (19.7%) | 880 (84.6%) |
| 45 to 54 Years | 345 (34.6%) | 499 (50.0%) |
| 55 to 64 Years | 388 (41.4%) | 550 (58.6%) |
| 65 to 74 Years | 847 (96.9%) | 239 (27.4%) |
| 75 Years and over | 665 (100.0%) | 241 (36.2%) |
| Total | 4,337 (46.4%) | 5,061 (54.2%) |
Disability Status by Sex by Age in Indianola
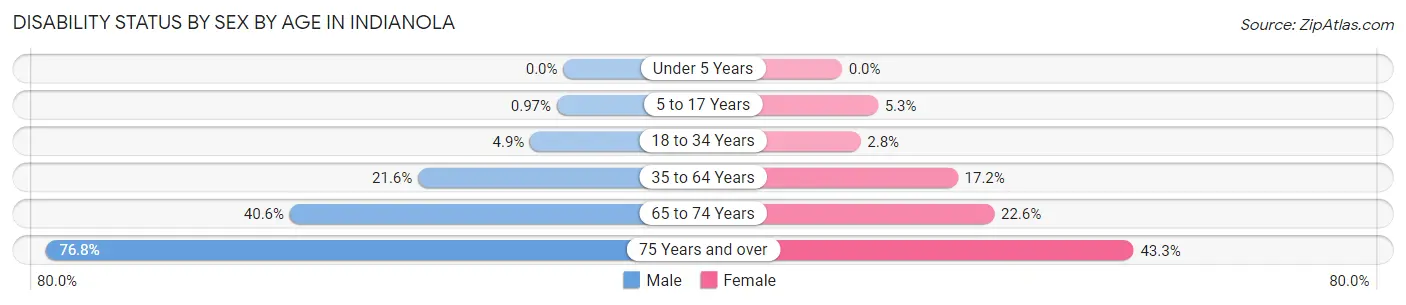
| Age Bracket | Male | Female |
| Under 5 Years | 0 (0.0%) | 0 (0.0%) |
| 5 to 17 Years | 11 (1.0%) | 54 (5.3%) |
| 18 to 34 Years | 58 (4.9%) | 28 (2.8%) |
| 35 to 64 Years | 233 (21.6%) | 326 (17.2%) |
| 65 to 74 Years | 134 (40.6%) | 123 (22.6%) |
| 75 Years and over | 195 (76.8%) | 178 (43.3%) |
Disability Class by Sex by Age in Indianola
Disability Class: Hearing Difficulty
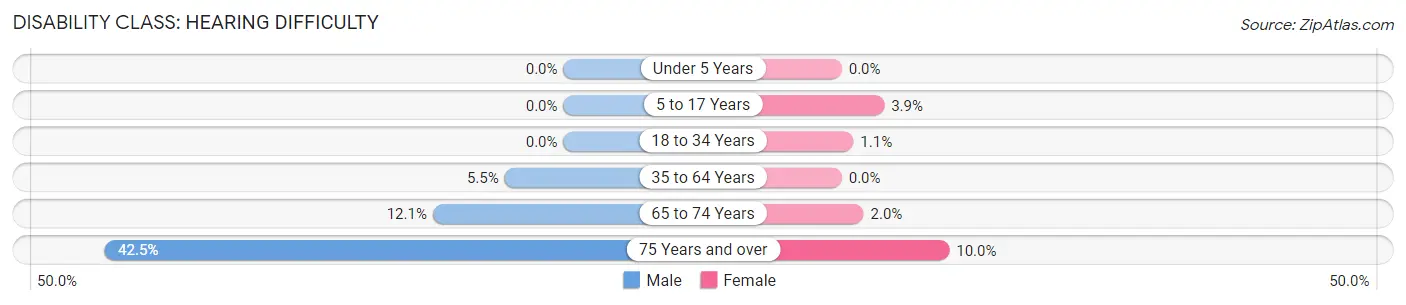
| Age Bracket | Male | Female |
| Under 5 Years | 0 (0.0%) | 0 (0.0%) |
| 5 to 17 Years | 0 (0.0%) | 40 (3.9%) |
| 18 to 34 Years | 0 (0.0%) | 11 (1.1%) |
| 35 to 64 Years | 59 (5.5%) | 0 (0.0%) |
| 65 to 74 Years | 40 (12.1%) | 11 (2.0%) |
| 75 Years and over | 108 (42.5%) | 41 (10.0%) |
Disability Class: Vision Difficulty
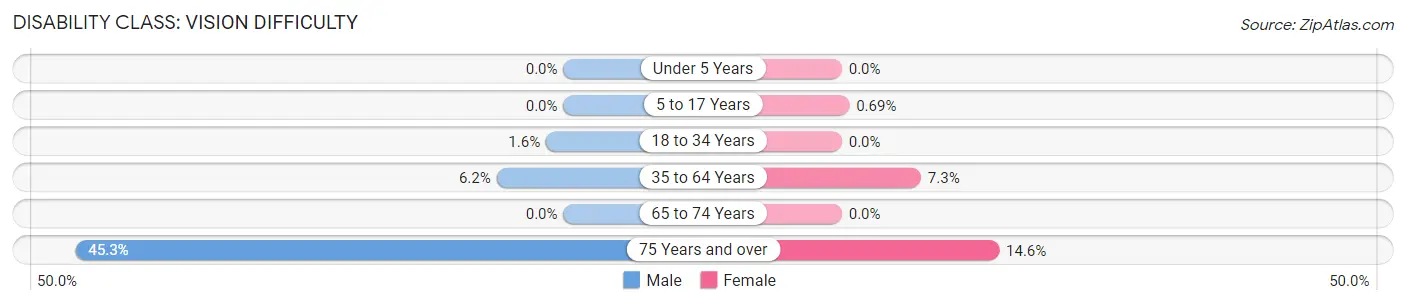
| Age Bracket | Male | Female |
| Under 5 Years | 0 (0.0%) | 0 (0.0%) |
| 5 to 17 Years | 0 (0.0%) | 7 (0.7%) |
| 18 to 34 Years | 19 (1.6%) | 0 (0.0%) |
| 35 to 64 Years | 67 (6.2%) | 139 (7.3%) |
| 65 to 74 Years | 0 (0.0%) | 0 (0.0%) |
| 75 Years and over | 115 (45.3%) | 60 (14.6%) |
Disability Class: Cognitive Difficulty
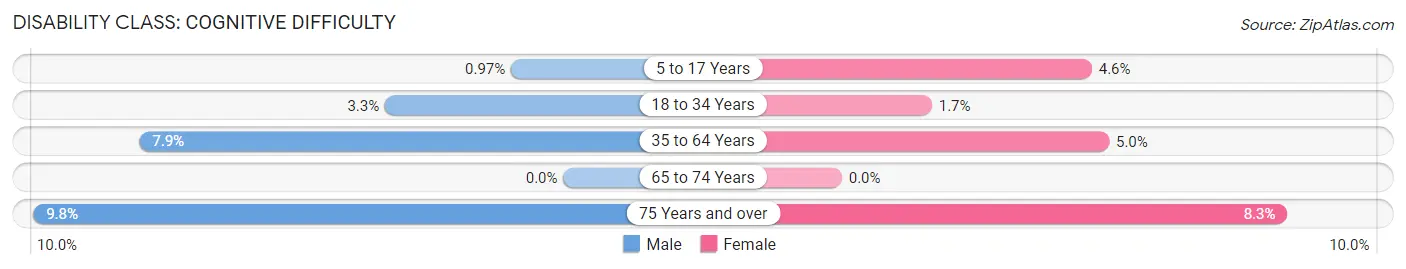
| Age Bracket | Male | Female |
| 5 to 17 Years | 11 (1.0%) | 47 (4.6%) |
| 18 to 34 Years | 39 (3.3%) | 17 (1.7%) |
| 35 to 64 Years | 85 (7.9%) | 94 (5.0%) |
| 65 to 74 Years | 0 (0.0%) | 0 (0.0%) |
| 75 Years and over | 25 (9.8%) | 34 (8.3%) |
Disability Class: Ambulatory Difficulty
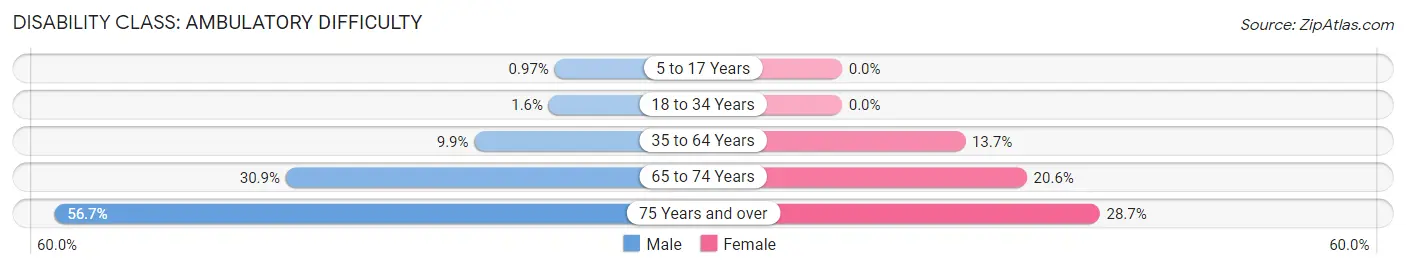
| Age Bracket | Male | Female |
| 5 to 17 Years | 11 (1.0%) | 0 (0.0%) |
| 18 to 34 Years | 19 (1.6%) | 0 (0.0%) |
| 35 to 64 Years | 107 (9.9%) | 260 (13.7%) |
| 65 to 74 Years | 102 (30.9%) | 112 (20.6%) |
| 75 Years and over | 144 (56.7%) | 118 (28.7%) |
Disability Class: Self-Care Difficulty
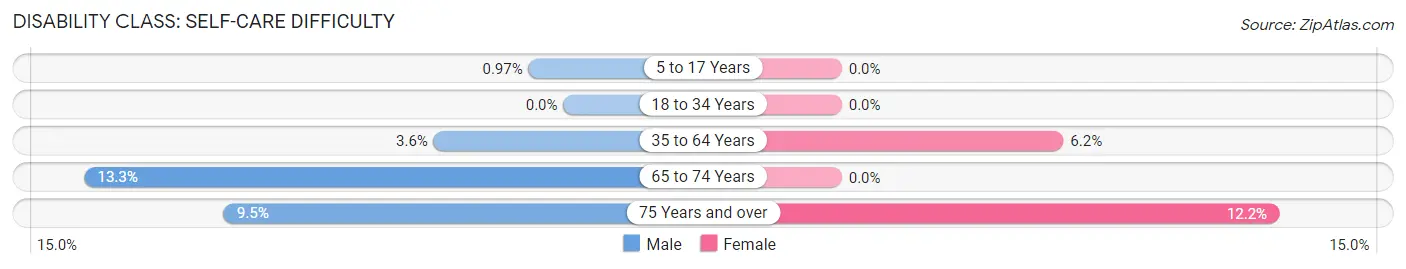
| Age Bracket | Male | Female |
| 5 to 17 Years | 11 (1.0%) | 0 (0.0%) |
| 18 to 34 Years | 0 (0.0%) | 0 (0.0%) |
| 35 to 64 Years | 39 (3.6%) | 117 (6.2%) |
| 65 to 74 Years | 44 (13.3%) | 0 (0.0%) |
| 75 Years and over | 24 (9.5%) | 50 (12.2%) |
Technology Access in Indianola
Computing Device Access in Indianola
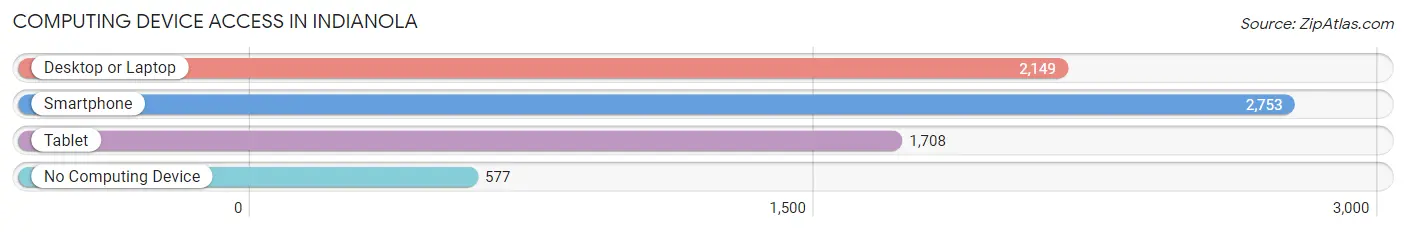
| Device Type | # Households | % Households |
| Desktop or Laptop | 2,149 | 60.6% |
| Smartphone | 2,753 | 77.6% |
| Tablet | 1,708 | 48.1% |
| No Computing Device | 577 | 16.3% |
| Total | 3,547 | 100.0% |
Internet Access in Indianola
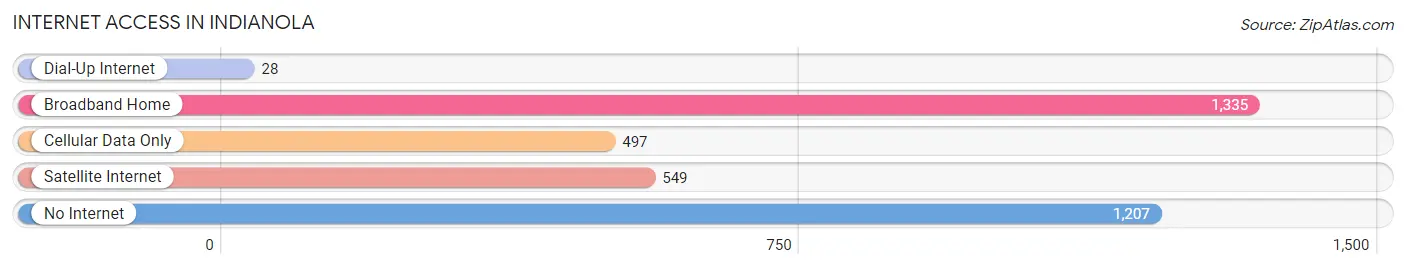
| Internet Type | # Households | % Households |
| Dial-Up Internet | 28 | 0.8% |
| Broadband Home | 1,335 | 37.6% |
| Cellular Data Only | 497 | 14.0% |
| Satellite Internet | 549 | 15.5% |
| No Internet | 1,207 | 34.0% |
| Total | 3,547 | 100.0% |
Indianola Summary
Introduction
Indianola is a city located in Sunflower County, Mississippi. It is the county seat of Sunflower County and is located in the Mississippi Delta region. The city has a population of 10,683 as of the 2010 census. Indianola is known for its rich history, diverse geography, vibrant economy, and diverse demographics.
History
Indianola was founded in 1882 by the Mississippi and Tennessee Railroad. The city was named after the Indianola Plantation, which was owned by the railroad's president, William Henry Harrison. The city was incorporated in 1886 and was the first city in Sunflower County.
Indianola has a rich history of civil rights activism. In the 1950s and 1960s, the city was a major center of the civil rights movement. The city was the site of the first Freedom Summer project in 1964, which was organized by the Student Nonviolent Coordinating Committee (SNCC). The project was designed to register African American voters in the South.
Indianola was also the site of the first Freedom School in the South. The school was established in 1964 and was designed to provide educational opportunities to African American students. The school was closed in 1969 due to lack of funding.
Geography
Indianola is located in the Mississippi Delta region of the United States. The city is situated on the banks of the Sunflower River and is surrounded by flat, fertile farmland. The city is located approximately 50 miles south of Memphis, Tennessee and approximately 100 miles north of Jackson, Mississippi.
The climate in Indianola is humid subtropical, with hot, humid summers and mild winters. The average annual temperature is 64°F (18°C). The average annual precipitation is 48 inches (122 cm).
Economy
Indianola's economy is largely based on agriculture. The city is home to several large agricultural companies, including Delta Pride Catfish, which is the largest catfish processor in the United States. Other major employers in the city include the Indianola Cotton Mill, the Indianola Pecan Company, and the Indianola Poultry Processing Plant.
Indianola is also home to several small businesses, including restaurants, retail stores, and service providers. The city is also home to several educational institutions, including Indianola Academy, Mississippi Valley State University, and the Indianola School District.
Demographics
As of the 2010 census, the population of Indianola was 10,683. The racial makeup of the city was 57.3% African American, 37.7% White, 0.3% Native American, 0.2% Asian, 0.1% Pacific Islander, and 4.4% from other races. The median household income was $25,921, and the median family income was $31,919.
Conclusion
Indianola is a city located in Sunflower County, Mississippi. It is the county seat of Sunflower County and is located in the Mississippi Delta region. The city has a population of 10,683 as of the 2010 census. Indianola is known for its rich history, diverse geography, vibrant economy, and diverse demographics. The city is home to several large agricultural companies, as well as small businesses, educational institutions, and other service providers. The racial makeup of the city is 57.3% African American, 37.7% White, 0.3% Native American, 0.2% Asian, 0.1% Pacific Islander, and 4.4% from other races. The median household income was $25,921, and the median family income was $31,919. Indianola is a vibrant city with a rich history and a diverse population.
Common Questions
What is Per Capita Income in Indianola?
Per Capita income in Indianola is $19,563.
What is the Median Family Income in Indianola?
Median Family Income in Indianola is $49,342.
What is the Median Household income in Indianola?
Median Household Income in Indianola is $36,243.
What is Income or Wage Gap in Indianola?
Income or Wage Gap in Indianola is 24.1%.
Women in Indianola earn 75.9 cents for every dollar earned by a man.
What is Family Income Deficit in Indianola?
Family Income Deficit in Indianola is $13,726.
Families that are below poverty line in Indianola earn $13,726 less on average than the poverty threshold level.
What is Inequality or Gini Index in Indianola?
Inequality or Gini Index in Indianola is 0.46.
What is the Total Population of Indianola?
Total Population of Indianola is 9,572.
What is the Total Male Population of Indianola?
Total Male Population of Indianola is 4,407.
What is the Total Female Population of Indianola?
Total Female Population of Indianola is 5,165.
What is the Ratio of Males per 100 Females in Indianola?
There are 85.32 Males per 100 Females in Indianola.
What is the Ratio of Females per 100 Males in Indianola?
There are 117.20 Females per 100 Males in Indianola.
What is the Median Population Age in Indianola?
Median Population Age in Indianola is 34.0 Years.
What is the Average Family Size in Indianola
Average Family Size in Indianola is 3.5 People.
What is the Average Household Size in Indianola
Average Household Size in Indianola is 2.6 People.
How Large is the Labor Force in Indianola?
There are 4,084 People in the Labor Forcein in Indianola.
What is the Percentage of People in the Labor Force in Indianola?
56.8% of People are in the Labor Force in Indianola.
What is the Unemployment Rate in Indianola?
Unemployment Rate in Indianola is 12.8%.