Gulf Hills, MS Map & Demographics
Gulf Hills Map
Gulf Hills Overview
$28,202
PER CAPITA INCOME
$60,352
AVG FAMILY INCOME
$61,094
AVG HOUSEHOLD INCOME
15.0%
WAGE / INCOME GAP [ % ]
85.0¢/ $1
WAGE / INCOME GAP [ $ ]
$15,649
FAMILY INCOME DEFICIT
0.41
INEQUALITY / GINI INDEX
8,647
TOTAL POPULATION
4,168
MALE POPULATION
4,479
FEMALE POPULATION
93.06
MALES / 100 FEMALES
107.46
FEMALES / 100 MALES
33.6
MEDIAN AGE
3.0
AVG FAMILY SIZE
2.6
AVG HOUSEHOLD SIZE
4,774
LABOR FORCE [ PEOPLE ]
69.8%
PERCENT IN LABOR FORCE
4.5%
UNEMPLOYMENT RATE
Income in Gulf Hills
Income Overview in Gulf Hills
Per Capita Income in Gulf Hills is $28,202, while median incomes of families and households are $60,352 and $61,094 respectively.
| Characteristic | Number | Measure |
| Per Capita Income | 8,647 | $28,202 |
| Median Family Income | 2,482 | $60,352 |
| Mean Family Income | 2,482 | $76,162 |
| Median Household Income | 3,349 | $61,094 |
| Mean Household Income | 3,349 | $71,203 |
| Income Deficit | 2,482 | $15,649 |
| Wage / Income Gap (%) | 8,647 | 15.04% |
| Wage / Income Gap ($) | 8,647 | 84.96¢ per $1 |
| Gini / Inequality Index | 8,647 | 0.41 |
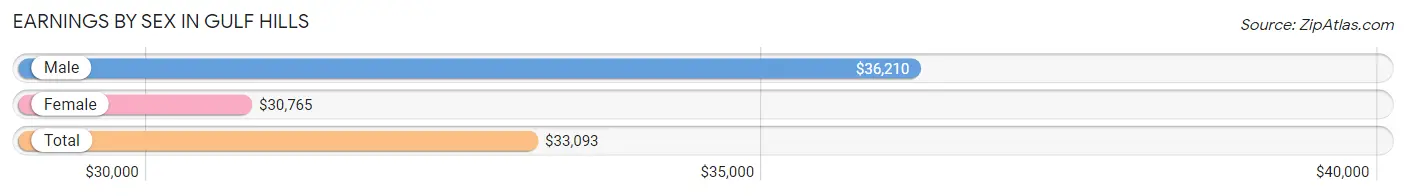
Earnings by Sex in Gulf Hills
Average Earnings in Gulf Hills are $33,093, $36,210 for men and $30,765 for women, a difference of 15.0%.
| Sex | Number | Average Earnings |
| Male | 2,567 (52.6%) | $36,210 |
| Female | 2,315 (47.4%) | $30,765 |
| Total | 4,882 (100.0%) | $33,093 |
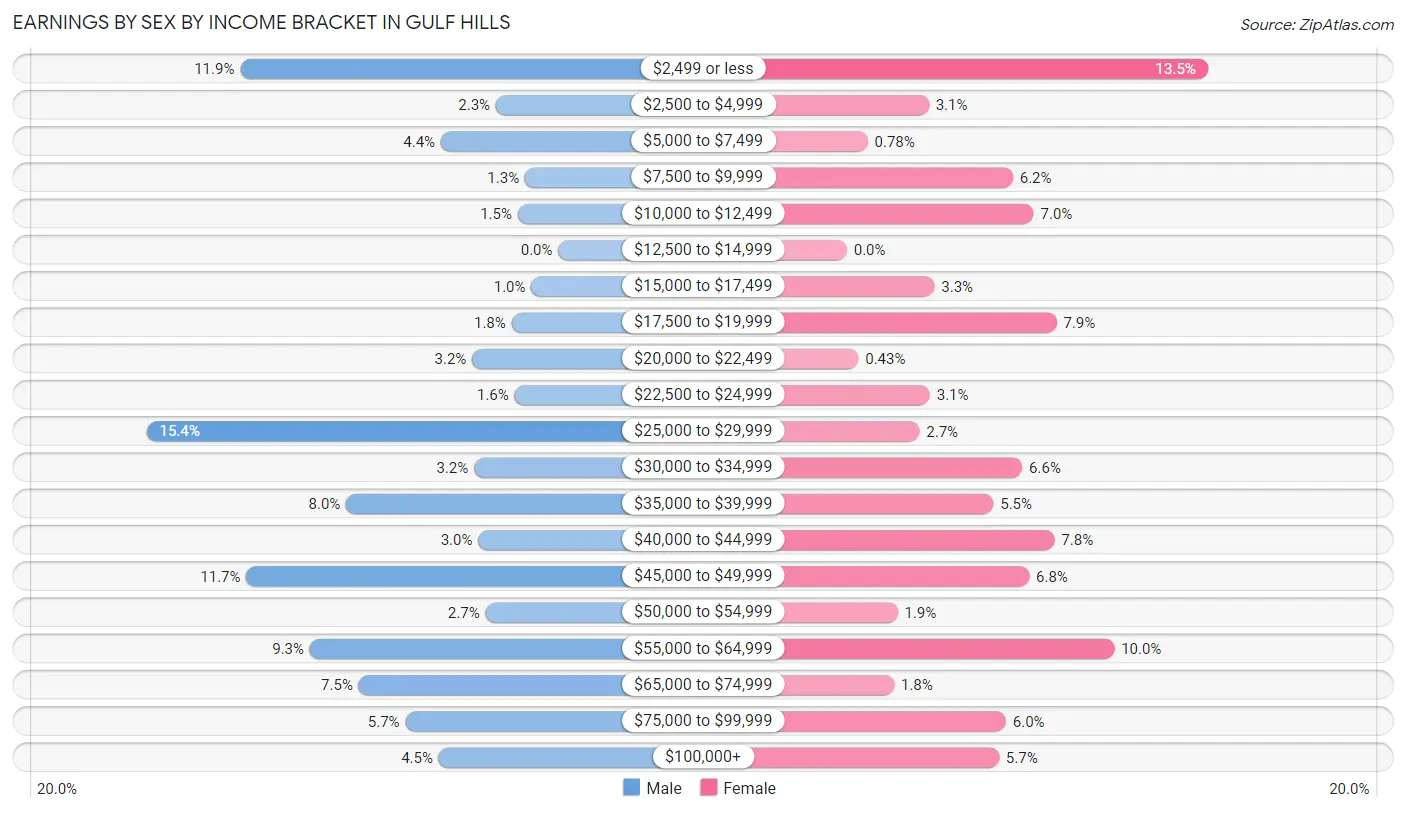
Earnings by Sex by Income Bracket in Gulf Hills
The most common earnings brackets in Gulf Hills are $25,000 to $29,999 for men (396 | 15.4%) and $2,499 or less for women (313 | 13.5%).
| Income | Male | Female |
| $2,499 or less | 306 (11.9%) | 313 (13.5%) |
| $2,500 to $4,999 | 60 (2.3%) | 71 (3.1%) |
| $5,000 to $7,499 | 113 (4.4%) | 18 (0.8%) |
| $7,500 to $9,999 | 32 (1.3%) | 144 (6.2%) |
| $10,000 to $12,499 | 39 (1.5%) | 162 (7.0%) |
| $12,500 to $14,999 | 0 (0.0%) | 0 (0.0%) |
| $15,000 to $17,499 | 26 (1.0%) | 76 (3.3%) |
| $17,500 to $19,999 | 45 (1.8%) | 182 (7.9%) |
| $20,000 to $22,499 | 83 (3.2%) | 10 (0.4%) |
| $22,500 to $24,999 | 42 (1.6%) | 72 (3.1%) |
| $25,000 to $29,999 | 396 (15.4%) | 63 (2.7%) |
| $30,000 to $34,999 | 81 (3.2%) | 152 (6.6%) |
| $35,000 to $39,999 | 204 (8.0%) | 127 (5.5%) |
| $40,000 to $44,999 | 77 (3.0%) | 180 (7.8%) |
| $45,000 to $49,999 | 300 (11.7%) | 158 (6.8%) |
| $50,000 to $54,999 | 70 (2.7%) | 44 (1.9%) |
| $55,000 to $64,999 | 239 (9.3%) | 232 (10.0%) |
| $65,000 to $74,999 | 192 (7.5%) | 41 (1.8%) |
| $75,000 to $99,999 | 147 (5.7%) | 138 (6.0%) |
| $100,000+ | 115 (4.5%) | 132 (5.7%) |
| Total | 2,567 (100.0%) | 2,315 (100.0%) |
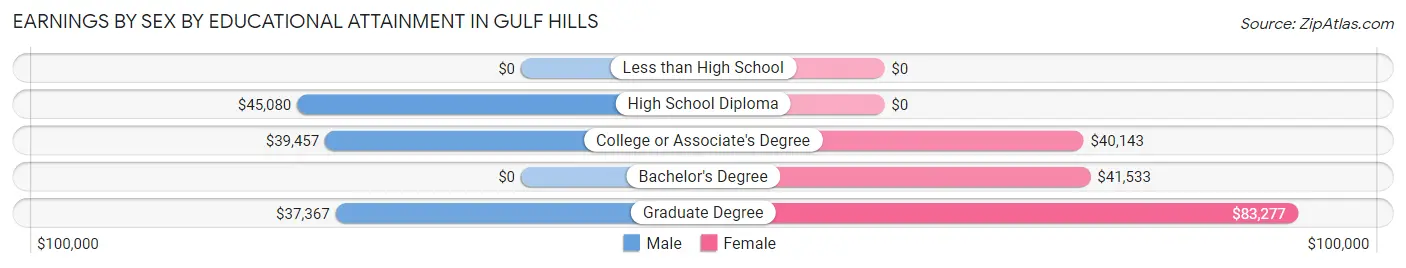
Earnings by Sex by Educational Attainment in Gulf Hills
Average earnings in Gulf Hills are $36,639 for men and $41,014 for women, a difference of 10.7%. Men with an educational attainment of high school diploma enjoy the highest average annual earnings of $45,080, while those with graduate degree education earn the least with $37,367. Women with an educational attainment of graduate degree earn the most with the average annual earnings of $83,277, while those with college or associate's degree education have the smallest earnings of $40,143.
| Educational Attainment | Male Income | Female Income |
| Less than High School | - | - |
| High School Diploma | $45,080 | $0 |
| College or Associate's Degree | $39,457 | $40,143 |
| Bachelor's Degree | - | - |
| Graduate Degree | $37,367 | $83,277 |
| Total | $36,639 | $41,014 |
Family Income in Gulf Hills
Family Income Brackets in Gulf Hills
According to the Gulf Hills family income data, there are 486 families falling into the $50,000 to $74,999 income range, which is the most common income bracket and makes up 19.6% of all families. Conversely, the $15,000 to $24,999 income bracket is the least frequent group with only 60 families (2.4%) belonging to this category.
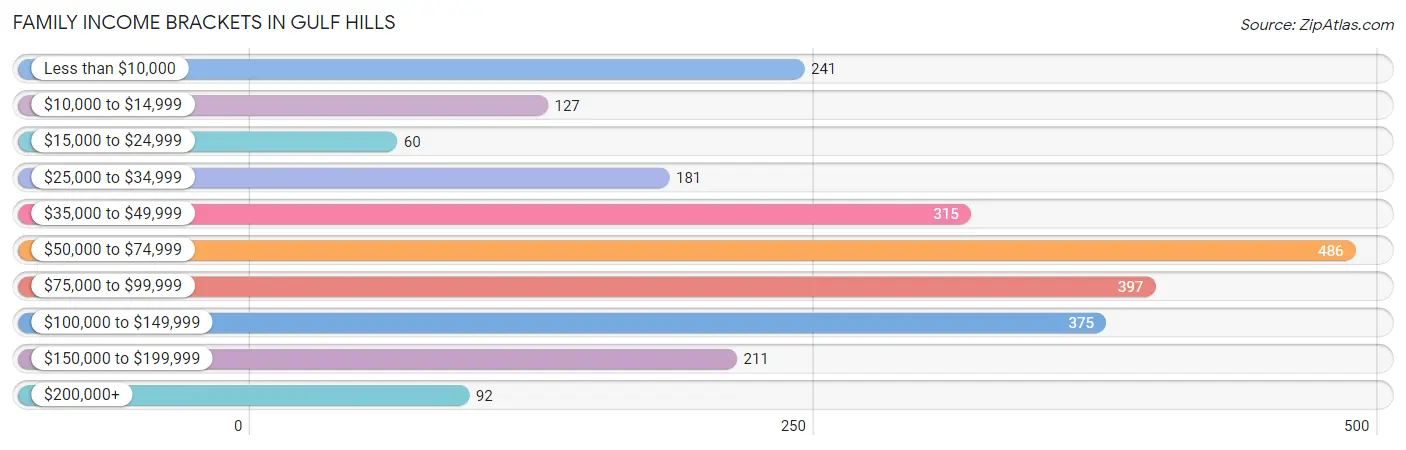
| Income Bracket | # Families | % Families |
| Less than $10,000 | 241 | 9.7% |
| $10,000 to $14,999 | 127 | 5.1% |
| $15,000 to $24,999 | 60 | 2.4% |
| $25,000 to $34,999 | 181 | 7.3% |
| $35,000 to $49,999 | 315 | 12.7% |
| $50,000 to $74,999 | 486 | 19.6% |
| $75,000 to $99,999 | 397 | 16.0% |
| $100,000 to $149,999 | 375 | 15.1% |
| $150,000 to $199,999 | 211 | 8.5% |
| $200,000+ | 92 | 3.7% |
Family Income by Famaliy Size in Gulf Hills
4-person families (401 | 16.2%) account for the highest median family income in Gulf Hills with $89,503 per family, while 2-person families (1,064 | 42.9%) have the highest median income of $31,625 per family member.
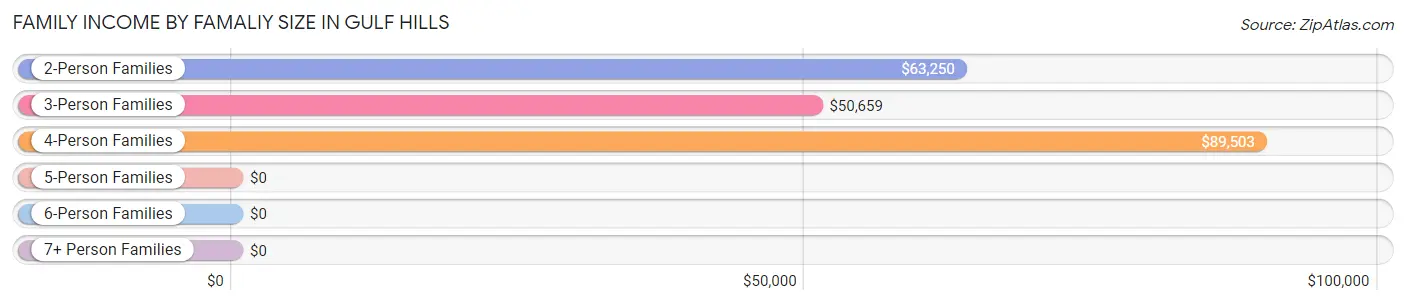
| Income Bracket | # Families | Median Income |
| 2-Person Families | 1,064 (42.9%) | $63,250 |
| 3-Person Families | 686 (27.6%) | $50,659 |
| 4-Person Families | 401 (16.2%) | $89,503 |
| 5-Person Families | 285 (11.5%) | $0 |
| 6-Person Families | 46 (1.8%) | $0 |
| 7+ Person Families | 0 (0.0%) | $0 |
| Total | 2,482 (100.0%) | $60,352 |
Family Income by Number of Earners in Gulf Hills
The median family income in Gulf Hills is $60,352, with families comprising 3+ earners (243) having the highest median family income of $95,972, while families with no earners (289) have the lowest median family income of $48,262, accounting for 9.8% and 11.6% of families, respectively.
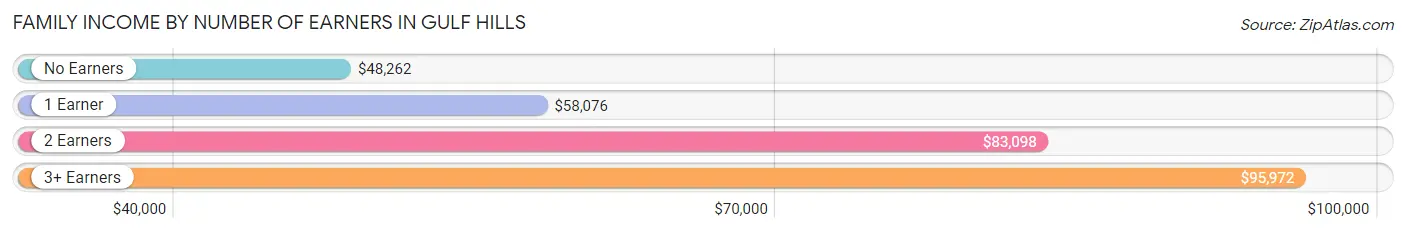
| Number of Earners | # Families | Median Income |
| No Earners | 289 (11.6%) | $48,262 |
| 1 Earner | 935 (37.7%) | $58,076 |
| 2 Earners | 1,015 (40.9%) | $83,098 |
| 3+ Earners | 243 (9.8%) | $95,972 |
| Total | 2,482 (100.0%) | $60,352 |
Household Income in Gulf Hills
Household Income Brackets in Gulf Hills
With 620 households falling in the category, the $75,000 to $99,999 income range is the most frequent in Gulf Hills, accounting for 18.5% of all households. In contrast, only 90 households (2.7%) fall into the $200,000+ income bracket, making it the least populous group.
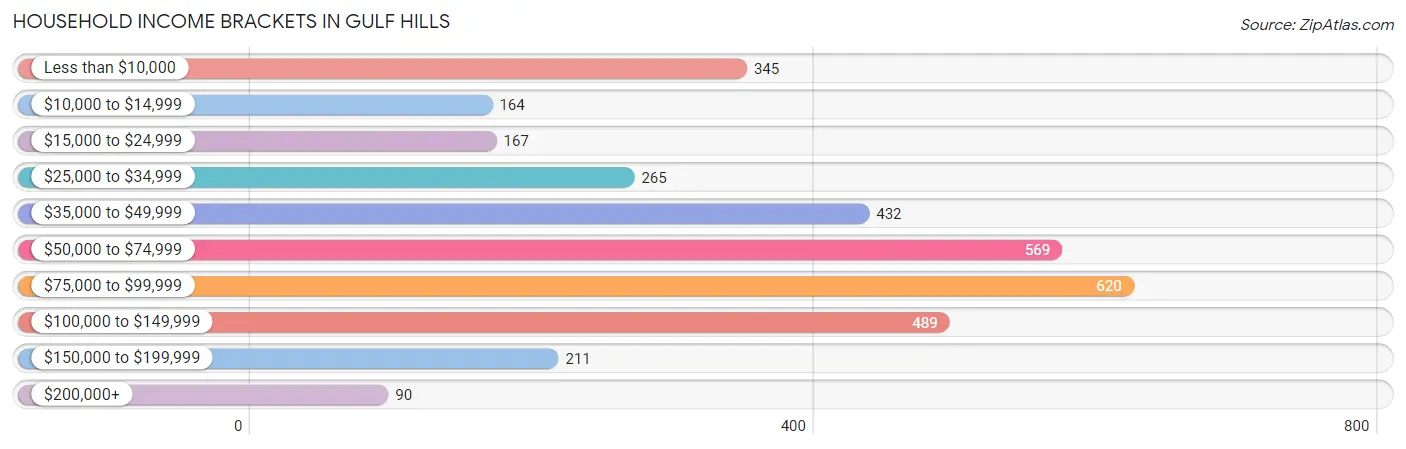
| Income Bracket | # Households | % Households |
| Less than $10,000 | 345 | 10.3% |
| $10,000 to $14,999 | 164 | 4.9% |
| $15,000 to $24,999 | 167 | 5.0% |
| $25,000 to $34,999 | 265 | 7.9% |
| $35,000 to $49,999 | 432 | 12.9% |
| $50,000 to $74,999 | 569 | 17.0% |
| $75,000 to $99,999 | 620 | 18.5% |
| $100,000 to $149,999 | 489 | 14.6% |
| $150,000 to $199,999 | 211 | 6.3% |
| $200,000+ | 90 | 2.7% |
Household Income by Householder Age in Gulf Hills
The median household income in Gulf Hills is $61,094, with the highest median household income of $88,326 found in the 45 to 64 years age bracket for the primary householder. A total of 1,017 households (30.4%) fall into this category. Meanwhile, the 15 to 24 years age bracket for the primary householder has the lowest median household income of $0, with 246 households (7.3%) in this group.
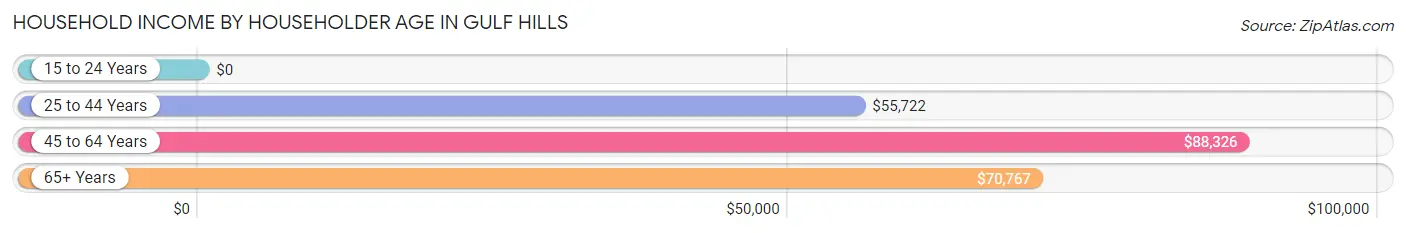
| Income Bracket | # Households | Median Income |
| 15 to 24 Years | 246 (7.3%) | $0 |
| 25 to 44 Years | 1,368 (40.8%) | $55,722 |
| 45 to 64 Years | 1,017 (30.4%) | $88,326 |
| 65+ Years | 718 (21.4%) | $70,767 |
| Total | 3,349 (100.0%) | $61,094 |
Poverty in Gulf Hills
Income Below Poverty by Sex and Age in Gulf Hills
With 17.7% poverty level for males and 15.5% for females among the residents of Gulf Hills, under 5 year old males and 5 year old females are the most vulnerable to poverty, with 102 males (53.1%) and 81 females (100.0%) in their respective age groups living below the poverty level.
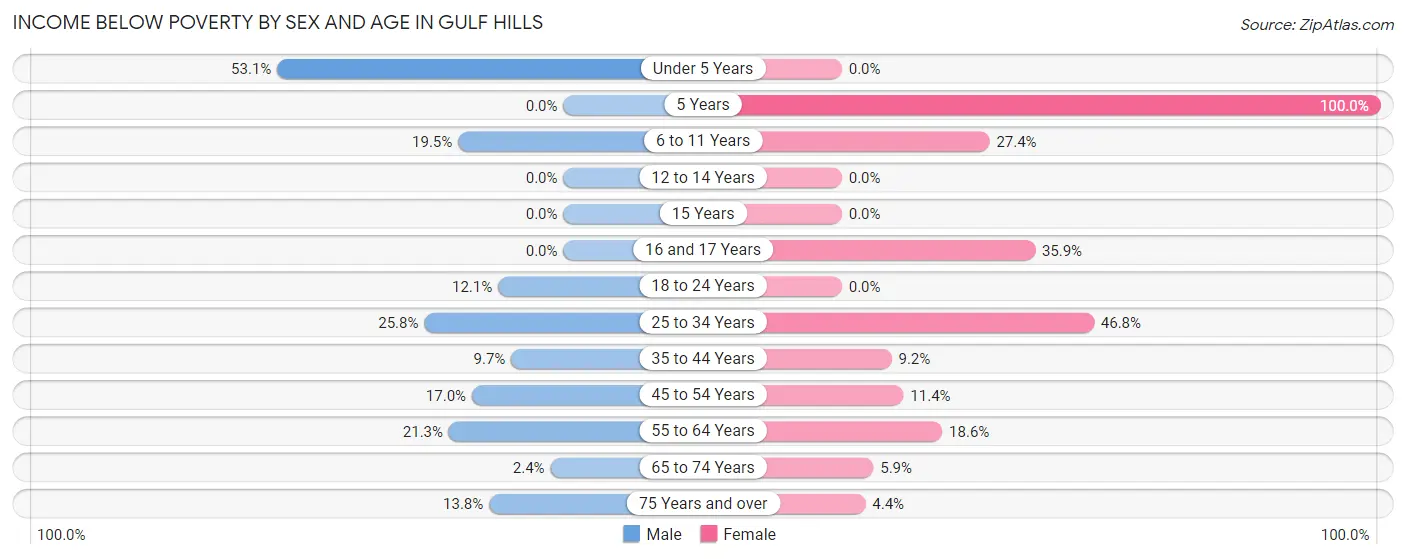
| Age Bracket | Male | Female |
| Under 5 Years | 102 (53.1%) | 0 (0.0%) |
| 5 Years | 0 (0.0%) | 81 (100.0%) |
| 6 to 11 Years | 92 (19.5%) | 74 (27.4%) |
| 12 to 14 Years | 0 (0.0%) | 0 (0.0%) |
| 15 Years | 0 (0.0%) | 0 (0.0%) |
| 16 and 17 Years | 0 (0.0%) | 38 (35.8%) |
| 18 to 24 Years | 60 (12.1%) | 0 (0.0%) |
| 25 to 34 Years | 232 (25.8%) | 255 (46.8%) |
| 35 to 44 Years | 33 (9.7%) | 71 (9.2%) |
| 45 to 54 Years | 84 (17.0%) | 47 (11.4%) |
| 55 to 64 Years | 92 (21.2%) | 98 (18.6%) |
| 65 to 74 Years | 8 (2.4%) | 21 (5.9%) |
| 75 Years and over | 35 (13.8%) | 11 (4.4%) |
| Total | 738 (17.7%) | 696 (15.5%) |
Income Above Poverty by Sex and Age in Gulf Hills
According to the poverty statistics in Gulf Hills, males aged 5 years and females aged under 5 years are the age groups that are most secure financially, with 100.0% of males and 100.0% of females in these age groups living above the poverty line.
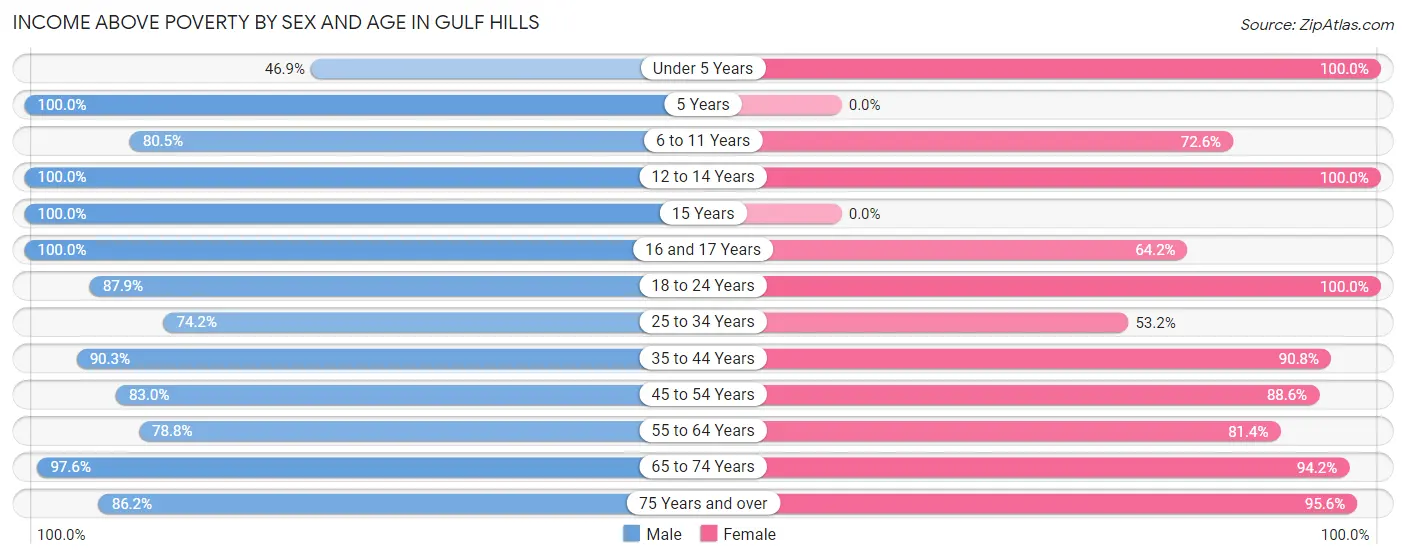
| Age Bracket | Male | Female |
| Under 5 Years | 90 (46.9%) | 341 (100.0%) |
| 5 Years | 44 (100.0%) | 0 (0.0%) |
| 6 to 11 Years | 379 (80.5%) | 196 (72.6%) |
| 12 to 14 Years | 178 (100.0%) | 218 (100.0%) |
| 15 Years | 12 (100.0%) | 0 (0.0%) |
| 16 and 17 Years | 21 (100.0%) | 68 (64.1%) |
| 18 to 24 Years | 435 (87.9%) | 601 (100.0%) |
| 25 to 34 Years | 667 (74.2%) | 290 (53.2%) |
| 35 to 44 Years | 308 (90.3%) | 698 (90.8%) |
| 45 to 54 Years | 411 (83.0%) | 364 (88.6%) |
| 55 to 64 Years | 341 (78.7%) | 428 (81.4%) |
| 65 to 74 Years | 325 (97.6%) | 338 (94.2%) |
| 75 Years and over | 219 (86.2%) | 241 (95.6%) |
| Total | 3,430 (82.3%) | 3,783 (84.5%) |
Income Below Poverty Among Married-Couple Families in Gulf Hills
The poverty statistics for married-couple families in Gulf Hills show that 12.6% or 222 of the total 1,763 families live below the poverty line. Families with 1 or 2 children have the highest poverty rate of 17.5%, comprising of 149 families. On the other hand, families with 3 or 4 children have the lowest poverty rate of 0.0%, which includes 0 families.
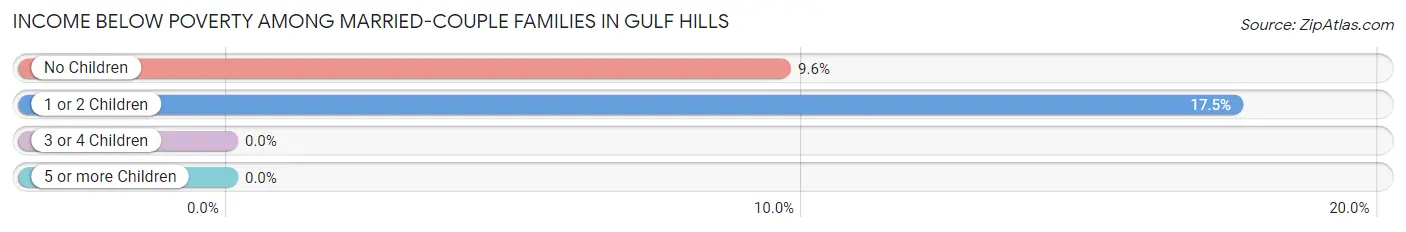
| Children | Above Poverty | Below Poverty |
| No Children | 685 (90.4%) | 73 (9.6%) |
| 1 or 2 Children | 703 (82.5%) | 149 (17.5%) |
| 3 or 4 Children | 153 (100.0%) | 0 (0.0%) |
| 5 or more Children | 0 (0.0%) | 0 (0.0%) |
| Total | 1,541 (87.4%) | 222 (12.6%) |
Income Below Poverty Among Single-Parent Households in Gulf Hills
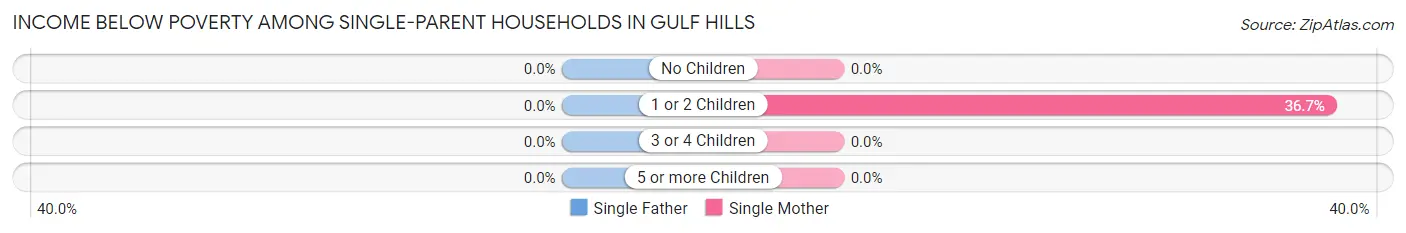
| Children | Single Father | Single Mother |
| No Children | 0 (0.0%) | 0 (0.0%) |
| 1 or 2 Children | 0 (0.0%) | 173 (36.7%) |
| 3 or 4 Children | 0 (0.0%) | 0 (0.0%) |
| 5 or more Children | 0 (0.0%) | 0 (0.0%) |
| Total | 0 (0.0%) | 173 (29.1%) |
Income Below Poverty Among Married-Couple vs Single-Parent Households in Gulf Hills
The poverty data for Gulf Hills shows that 222 of the married-couple family households (12.6%) and 173 of the single-parent households (24.1%) are living below the poverty level. Within the married-couple family households, those with 1 or 2 children have the highest poverty rate, with 149 households (17.5%) falling below the poverty line. Among the single-parent households, those with 1 or 2 children have the highest poverty rate, with 173 household (32.8%) living below poverty.
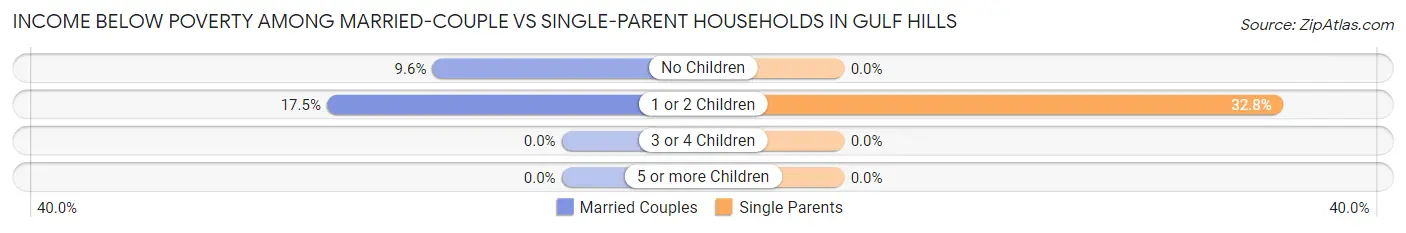
| Children | Married-Couple Families | Single-Parent Households |
| No Children | 73 (9.6%) | 0 (0.0%) |
| 1 or 2 Children | 149 (17.5%) | 173 (32.8%) |
| 3 or 4 Children | 0 (0.0%) | 0 (0.0%) |
| 5 or more Children | 0 (0.0%) | 0 (0.0%) |
| Total | 222 (12.6%) | 173 (24.1%) |
Race in Gulf Hills
The most populous races in Gulf Hills are White / Caucasian (5,641 | 65.2%), Black / African American (1,076 | 12.4%), and Hispanic or Latino (934 | 10.8%).
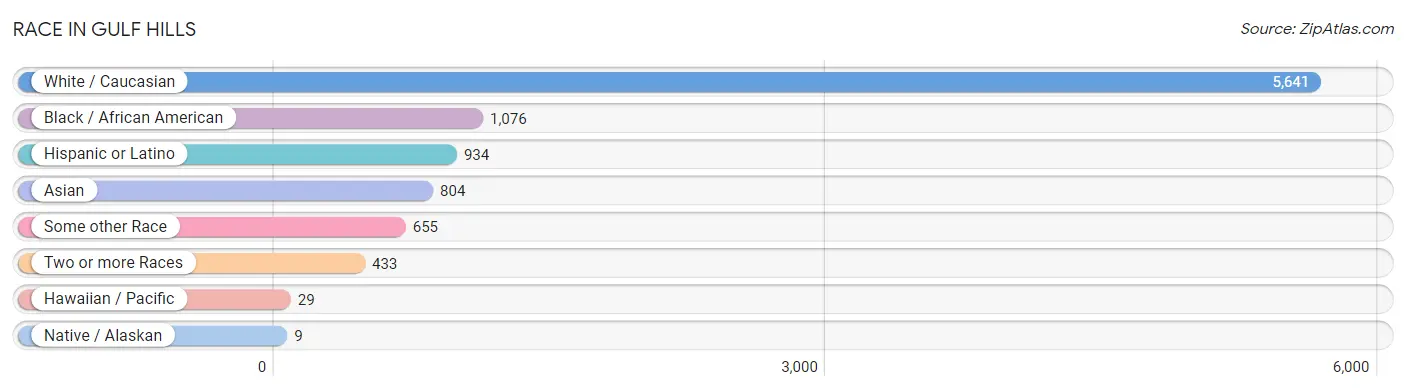
| Race | # Population | % Population |
| Asian | 804 | 9.3% |
| Black / African American | 1,076 | 12.4% |
| Hawaiian / Pacific | 29 | 0.3% |
| Hispanic or Latino | 934 | 10.8% |
| Native / Alaskan | 9 | 0.1% |
| White / Caucasian | 5,641 | 65.2% |
| Two or more Races | 433 | 5.0% |
| Some other Race | 655 | 7.6% |
| Total | 8,647 | 100.0% |
Ancestry in Gulf Hills
The most populous ancestries reported in Gulf Hills are Irish (886 | 10.2%), German (814 | 9.4%), English (719 | 8.3%), Sri Lankan (630 | 7.3%), and American (511 | 5.9%), together accounting for 41.2% of all Gulf Hills residents.
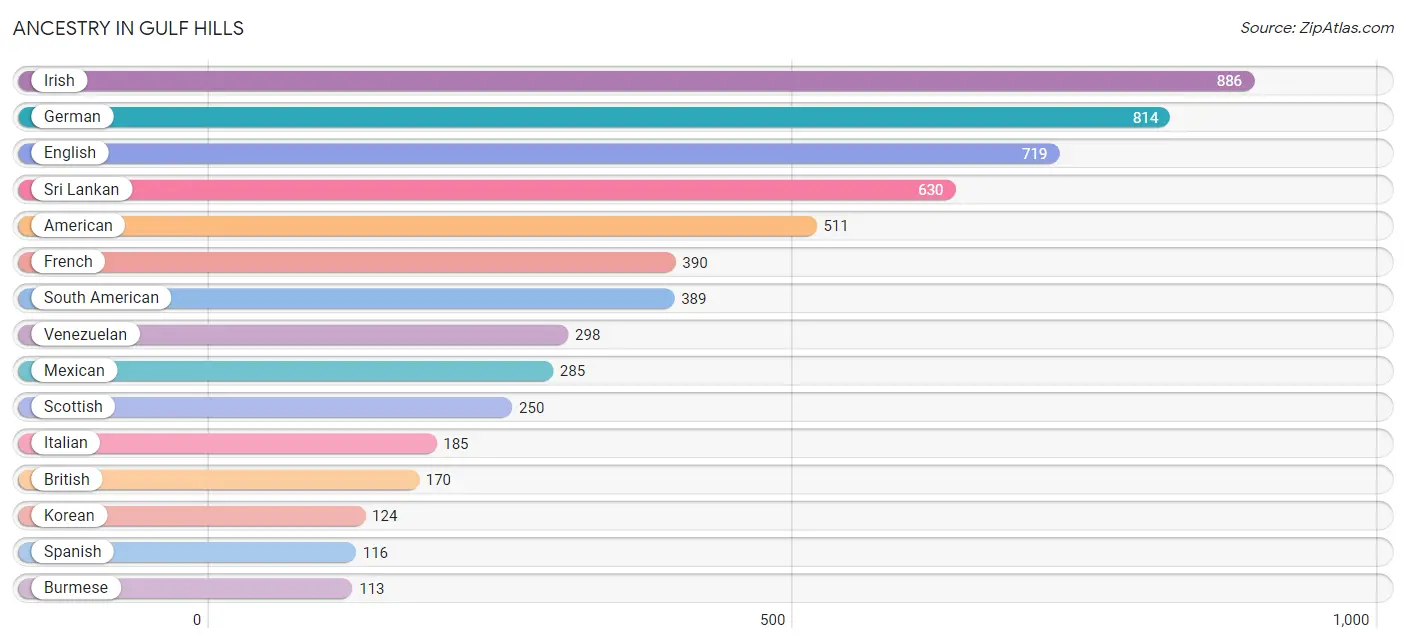
| Ancestry | # Population | % Population |
| American | 511 | 5.9% |
| Bhutanese | 27 | 0.3% |
| Blackfeet | 8 | 0.1% |
| British | 170 | 2.0% |
| Burmese | 113 | 1.3% |
| Central American | 55 | 0.6% |
| Cherokee | 14 | 0.2% |
| Choctaw | 9 | 0.1% |
| Colombian | 8 | 0.1% |
| Croatian | 45 | 0.5% |
| Czech | 11 | 0.1% |
| Danish | 10 | 0.1% |
| Dominican | 89 | 1.0% |
| Dutch | 113 | 1.3% |
| Eastern European | 9 | 0.1% |
| English | 719 | 8.3% |
| European | 23 | 0.3% |
| French | 390 | 4.5% |
| French Canadian | 46 | 0.5% |
| German | 814 | 9.4% |
| Guatemalan | 55 | 0.6% |
| Irish | 886 | 10.2% |
| Italian | 185 | 2.1% |
| Korean | 124 | 1.4% |
| Lithuanian | 24 | 0.3% |
| Mexican | 285 | 3.3% |
| Norwegian | 82 | 0.9% |
| Peruvian | 83 | 1.0% |
| Polish | 87 | 1.0% |
| Portuguese | 6 | 0.1% |
| Russian | 47 | 0.5% |
| Scotch-Irish | 105 | 1.2% |
| Scottish | 250 | 2.9% |
| South American | 389 | 4.5% |
| Spanish | 116 | 1.3% |
| Sri Lankan | 630 | 7.3% |
| Swedish | 61 | 0.7% |
| Thai | 1 | 0.0% |
| Tongan | 59 | 0.7% |
| Venezuelan | 298 | 3.5% |
| Welsh | 19 | 0.2% |
| Yugoslavian | 9 | 0.1% | View All 42 Rows |
Immigrants in Gulf Hills
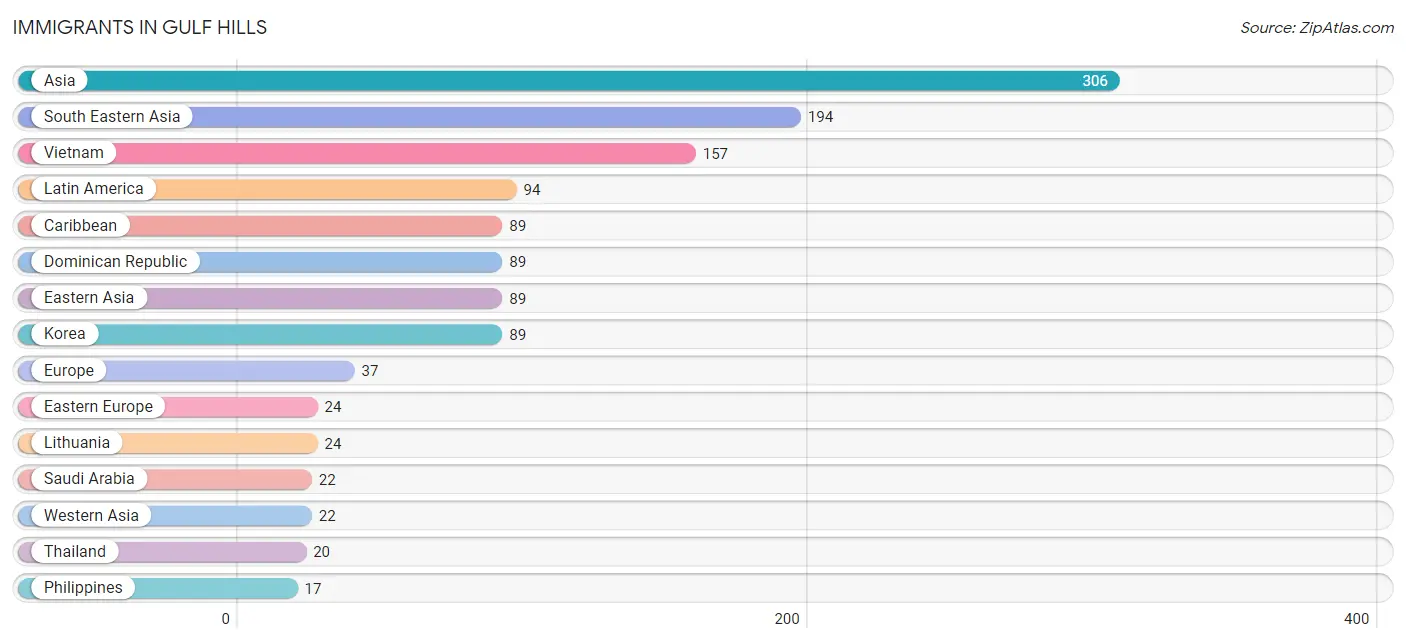
The most numerous immigrant groups reported in Gulf Hills came from Asia (306 | 3.5%), South Eastern Asia (194 | 2.2%), Vietnam (157 | 1.8%), Latin America (94 | 1.1%), and Caribbean (89 | 1.0%), together accounting for 9.7% of all Gulf Hills residents.
| Immigration Origin | # Population | % Population |
| Asia | 306 | 3.5% |
| Caribbean | 89 | 1.0% |
| Central America | 3 | 0.0% |
| Colombia | 2 | 0.0% |
| Dominican Republic | 89 | 1.0% |
| Eastern Asia | 89 | 1.0% |
| Eastern Europe | 24 | 0.3% |
| Europe | 37 | 0.4% |
| France | 6 | 0.1% |
| Germany | 7 | 0.1% |
| India | 1 | 0.0% |
| Korea | 89 | 1.0% |
| Latin America | 94 | 1.1% |
| Lithuania | 24 | 0.3% |
| Mexico | 3 | 0.0% |
| Philippines | 17 | 0.2% |
| Saudi Arabia | 22 | 0.3% |
| South America | 2 | 0.0% |
| South Central Asia | 1 | 0.0% |
| South Eastern Asia | 194 | 2.2% |
| Thailand | 20 | 0.2% |
| Vietnam | 157 | 1.8% |
| Western Asia | 22 | 0.3% |
| Western Europe | 13 | 0.2% | View All 24 Rows |
Sex and Age in Gulf Hills
Sex and Age in Gulf Hills
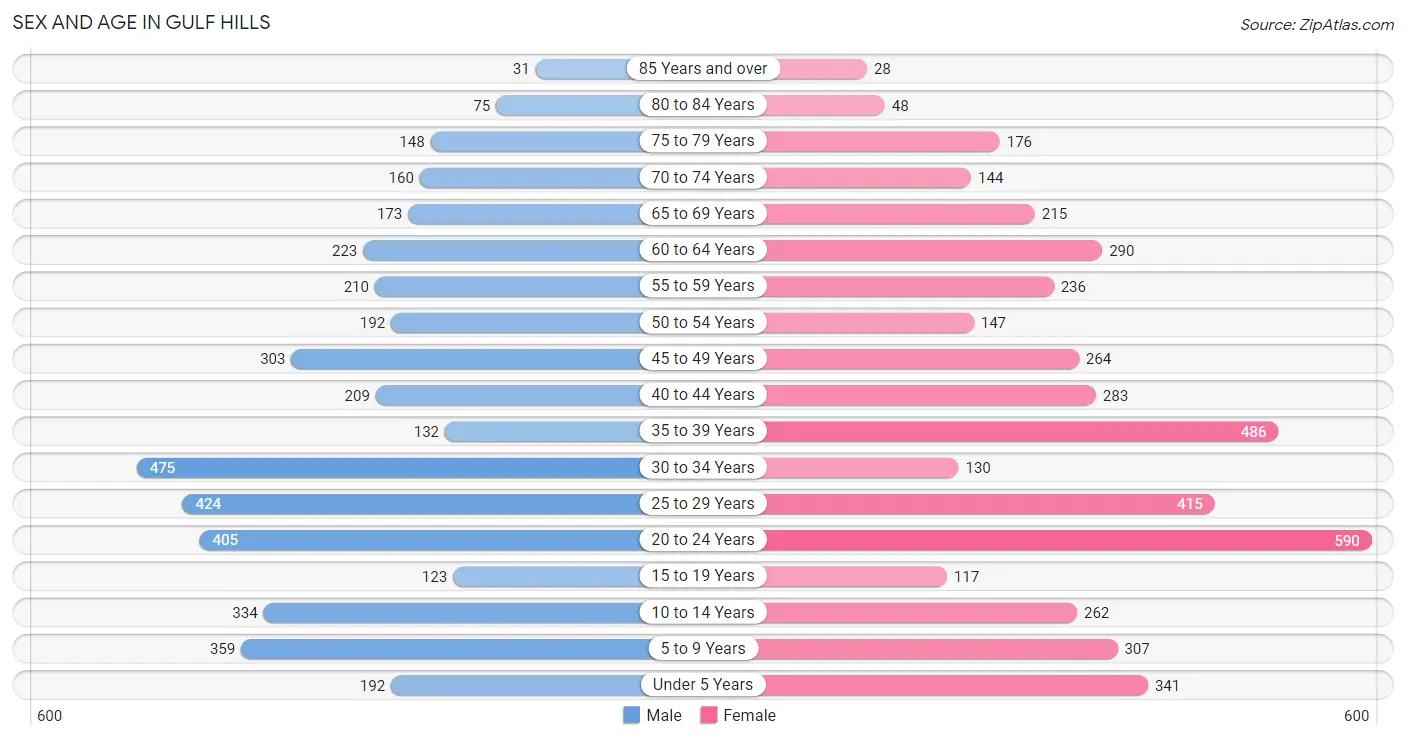
The most populous age groups in Gulf Hills are 30 to 34 Years (475 | 11.4%) for men and 20 to 24 Years (590 | 13.2%) for women.
| Age Bracket | Male | Female |
| Under 5 Years | 192 (4.6%) | 341 (7.6%) |
| 5 to 9 Years | 359 (8.6%) | 307 (6.9%) |
| 10 to 14 Years | 334 (8.0%) | 262 (5.9%) |
| 15 to 19 Years | 123 (2.9%) | 117 (2.6%) |
| 20 to 24 Years | 405 (9.7%) | 590 (13.2%) |
| 25 to 29 Years | 424 (10.2%) | 415 (9.3%) |
| 30 to 34 Years | 475 (11.4%) | 130 (2.9%) |
| 35 to 39 Years | 132 (3.2%) | 486 (10.8%) |
| 40 to 44 Years | 209 (5.0%) | 283 (6.3%) |
| 45 to 49 Years | 303 (7.3%) | 264 (5.9%) |
| 50 to 54 Years | 192 (4.6%) | 147 (3.3%) |
| 55 to 59 Years | 210 (5.0%) | 236 (5.3%) |
| 60 to 64 Years | 223 (5.3%) | 290 (6.5%) |
| 65 to 69 Years | 173 (4.2%) | 215 (4.8%) |
| 70 to 74 Years | 160 (3.8%) | 144 (3.2%) |
| 75 to 79 Years | 148 (3.5%) | 176 (3.9%) |
| 80 to 84 Years | 75 (1.8%) | 48 (1.1%) |
| 85 Years and over | 31 (0.7%) | 28 (0.6%) |
| Total | 4,168 (100.0%) | 4,479 (100.0%) |
Families and Households in Gulf Hills
Median Family Size in Gulf Hills
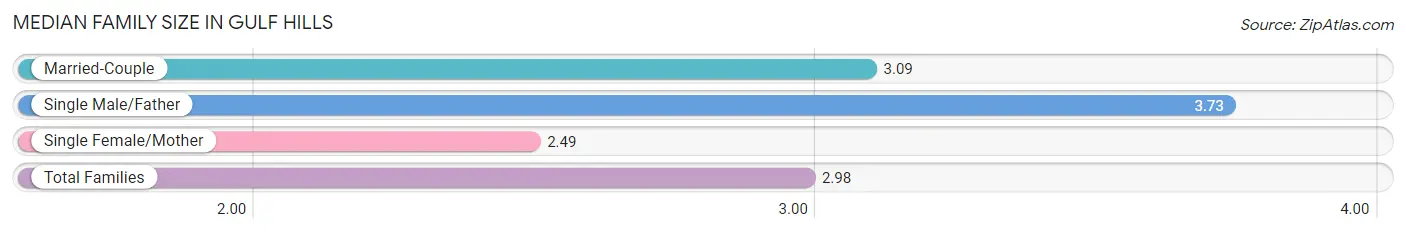
The median family size in Gulf Hills is 2.98 persons per family, with single male/father families (124 | 5.0%) accounting for the largest median family size of 3.73 persons per family. On the other hand, single female/mother families (595 | 24.0%) represent the smallest median family size with 2.49 persons per family.
| Family Type | # Families | Family Size |
| Married-Couple | 1,763 (71.0%) | 3.09 |
| Single Male/Father | 124 (5.0%) | 3.73 |
| Single Female/Mother | 595 (24.0%) | 2.49 |
| Total Families | 2,482 (100.0%) | 2.98 |
Median Household Size in Gulf Hills
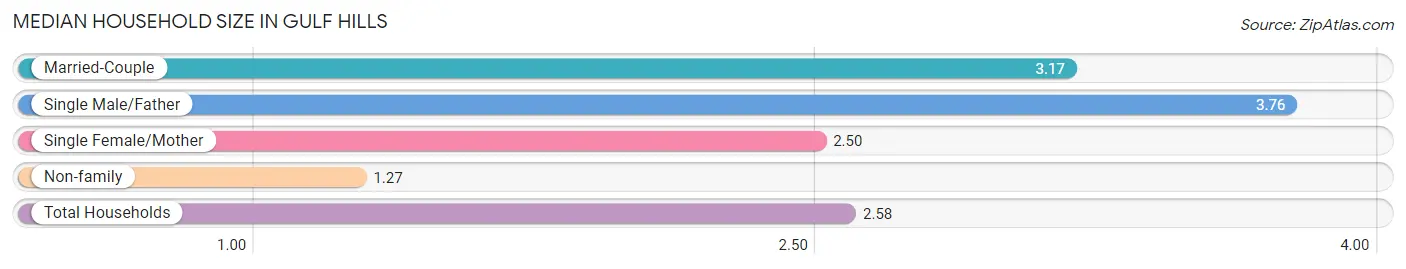
The median household size in Gulf Hills is 2.58 persons per household, with single male/father households (124 | 3.7%) accounting for the largest median household size of 3.76 persons per household. non-family households (867 | 25.9%) represent the smallest median household size with 1.27 persons per household.
| Household Type | # Households | Household Size |
| Married-Couple | 1,763 (52.6%) | 3.17 |
| Single Male/Father | 124 (3.7%) | 3.76 |
| Single Female/Mother | 595 (17.8%) | 2.50 |
| Non-family | 867 (25.9%) | 1.27 |
| Total Households | 3,349 (100.0%) | 2.58 |
Household Size by Marriage Status in Gulf Hills
Out of a total of 3,349 households in Gulf Hills, 2,482 (74.1%) are family households, while 867 (25.9%) are nonfamily households. The most numerous type of family households are 2-person households, comprising 1,055, and the most common type of nonfamily households are 1-person households, comprising 662.
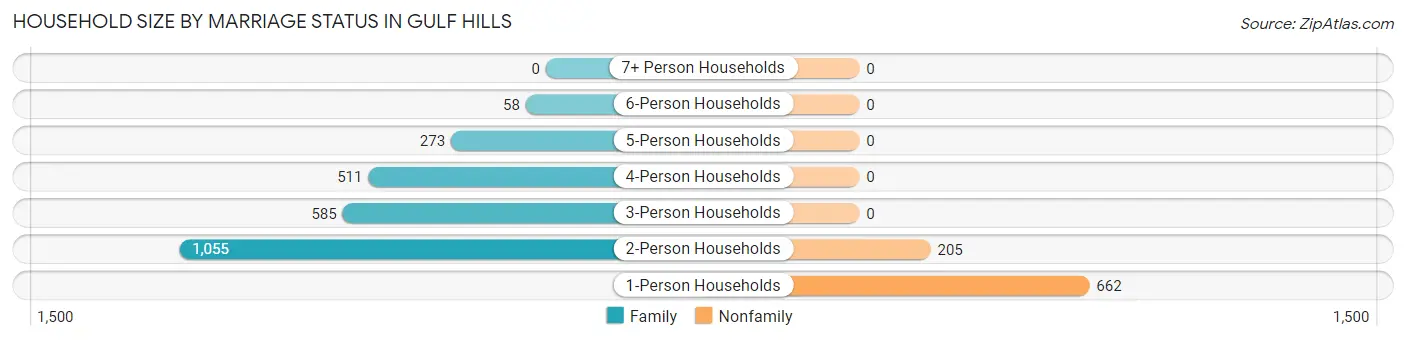
| Household Size | Family Households | Nonfamily Households |
| 1-Person Households | - | 662 (19.8%) |
| 2-Person Households | 1,055 (31.5%) | 205 (6.1%) |
| 3-Person Households | 585 (17.5%) | 0 (0.0%) |
| 4-Person Households | 511 (15.3%) | 0 (0.0%) |
| 5-Person Households | 273 (8.2%) | 0 (0.0%) |
| 6-Person Households | 58 (1.7%) | 0 (0.0%) |
| 7+ Person Households | 0 (0.0%) | 0 (0.0%) |
| Total | 2,482 (74.1%) | 867 (25.9%) |
Female Fertility in Gulf Hills
Fertility by Age in Gulf Hills
Average fertility rate in Gulf Hills is 77.0 births per 1,000 women. Women in the age bracket of 20 to 34 years have the highest fertility rate with 157.0 births per 1,000 women. Women in the age bracket of 20 to 34 years acount for 100.0% of all women with births.
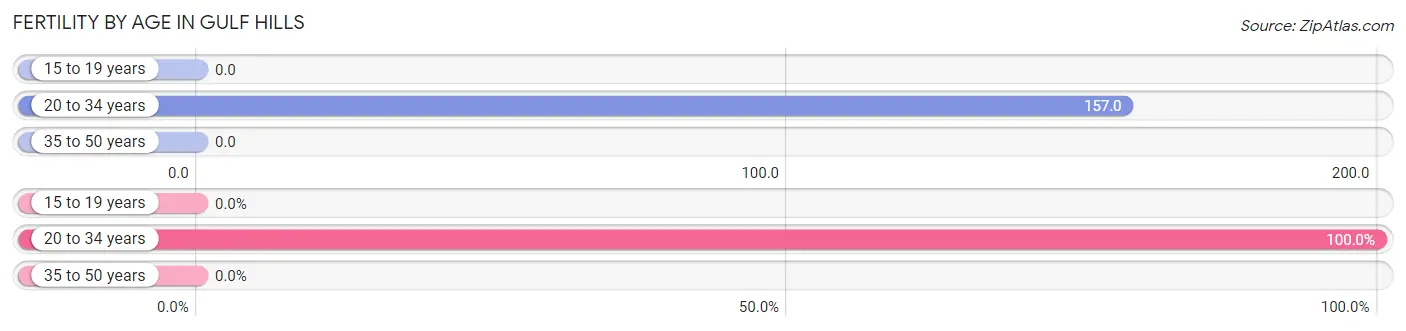
| Age Bracket | Women with Births | Births / 1,000 Women |
| 15 to 19 years | 0 (0.0%) | 0.0 |
| 20 to 34 years | 178 (100.0%) | 157.0 |
| 35 to 50 years | 0 (0.0%) | 0.0 |
| Total | 178 (100.0%) | 77.0 |
Fertility by Age by Marriage Status in Gulf Hills
77.5% of women with births (178) in Gulf Hills are married. The highest percentage of unmarried women with births falls into 20 to 34 years age bracket with 22.5% of them unmarried at the time of birth, while the lowest percentage of unmarried women with births belong to 20 to 34 years age bracket with 22.5% of them unmarried.
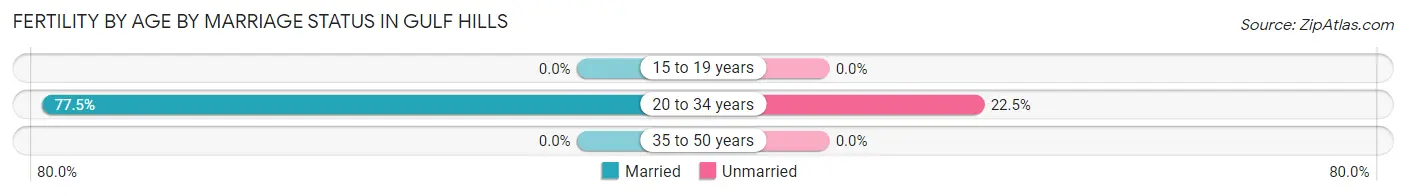
| Age Bracket | Married | Unmarried |
| 15 to 19 years | 0 (0.0%) | 0 (0.0%) |
| 20 to 34 years | 138 (77.5%) | 40 (22.5%) |
| 35 to 50 years | 0 (0.0%) | 0 (0.0%) |
| Total | 138 (77.5%) | 40 (22.5%) |
Fertility by Education in Gulf Hills
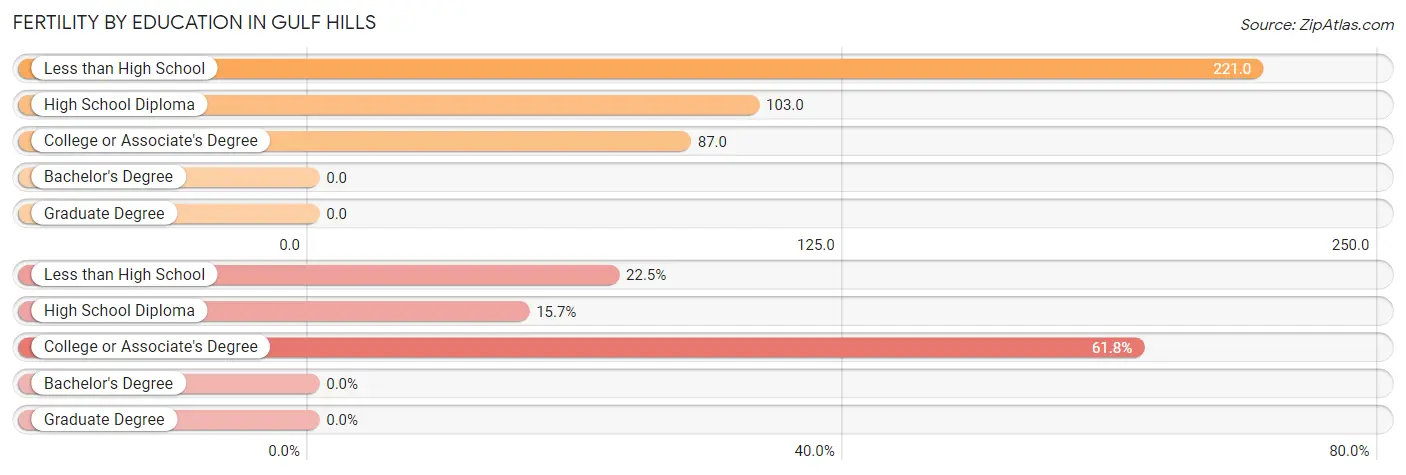
| Educational Attainment | Women with Births | Births / 1,000 Women |
| Less than High School | 40 (22.5%) | 221.0 |
| High School Diploma | 28 (15.7%) | 103.0 |
| College or Associate's Degree | 110 (61.8%) | 87.0 |
| Bachelor's Degree | 0 (0.0%) | 0.0 |
| Graduate Degree | 0 (0.0%) | 0.0 |
| Total | 178 (100.0%) | 77.0 |
Fertility by Education by Marriage Status in Gulf Hills
22.5% of women with births in Gulf Hills are unmarried. Women with the educational attainment of high school diploma are most likely to be married with 100.0% of them married at childbirth, while women with the educational attainment of less than high school are least likely to be married with 100.0% of them unmarried at childbirth.
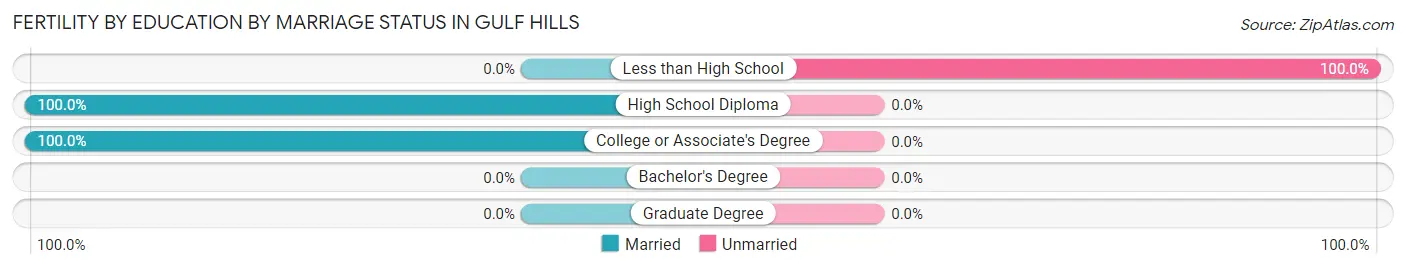
| Educational Attainment | Married | Unmarried |
| Less than High School | 0 (0.0%) | 40 (100.0%) |
| High School Diploma | 28 (100.0%) | 0 (0.0%) |
| College or Associate's Degree | 110 (100.0%) | 0 (0.0%) |
| Bachelor's Degree | 0 (0.0%) | 0 (0.0%) |
| Graduate Degree | 0 (0.0%) | 0 (0.0%) |
| Total | 138 (77.5%) | 40 (22.5%) |
Employment Characteristics in Gulf Hills
Employment by Class of Employer in Gulf Hills
Among the 4,355 employed individuals in Gulf Hills, private company employees (2,966 | 68.1%), federal government employees (482 | 11.1%), and state government employees (262 | 6.0%) make up the most common classes of employment.
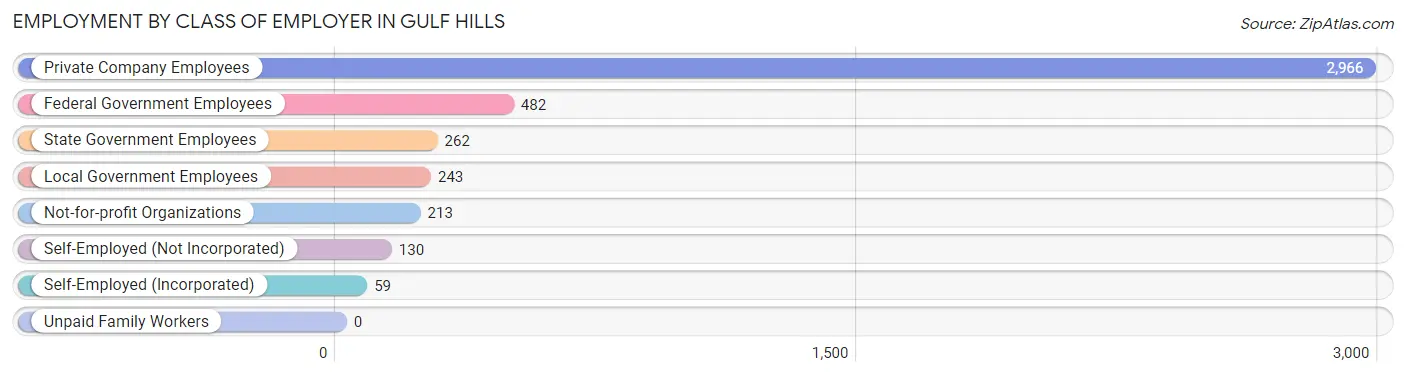
| Employer Class | # Employees | % Employees |
| Private Company Employees | 2,966 | 68.1% |
| Self-Employed (Incorporated) | 59 | 1.3% |
| Self-Employed (Not Incorporated) | 130 | 3.0% |
| Not-for-profit Organizations | 213 | 4.9% |
| Local Government Employees | 243 | 5.6% |
| State Government Employees | 262 | 6.0% |
| Federal Government Employees | 482 | 11.1% |
| Unpaid Family Workers | 0 | 0.0% |
| Total | 4,355 | 100.0% |
Employment Status by Age in Gulf Hills
According to the labor force statistics for Gulf Hills, out of the total population over 16 years of age (6,840), 69.8% or 4,774 individuals are in the labor force, with 4.5% or 215 of them unemployed. The age group with the highest labor force participation rate is 30 to 34 years, with 94.7% or 573 individuals in the labor force. Within the labor force, the 20 to 24 years age range has the highest percentage of unemployed individuals, with 15.8% or 140 of them being unemployed.
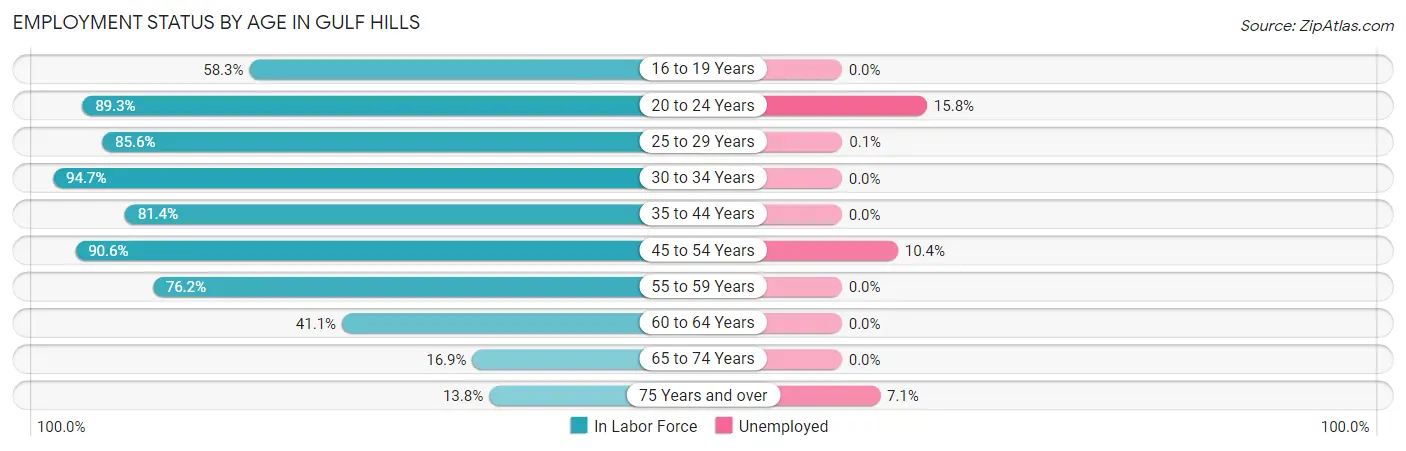
| Age Bracket | In Labor Force | Unemployed |
| 16 to 19 Years | 133 (58.3%) | 0 (0.0%) |
| 20 to 24 Years | 889 (89.3%) | 140 (15.8%) |
| 25 to 29 Years | 718 (85.6%) | 1 (0.1%) |
| 30 to 34 Years | 573 (94.7%) | 0 (0.0%) |
| 35 to 44 Years | 904 (81.4%) | 0 (0.0%) |
| 45 to 54 Years | 821 (90.6%) | 85 (10.4%) |
| 55 to 59 Years | 340 (76.2%) | 0 (0.0%) |
| 60 to 64 Years | 211 (41.1%) | 0 (0.0%) |
| 65 to 74 Years | 117 (16.9%) | 0 (0.0%) |
| 75 Years and over | 70 (13.8%) | 5 (7.1%) |
| Total | 4,774 (69.8%) | 215 (4.5%) |
Employment Status by Educational Attainment in Gulf Hills
According to labor force statistics for Gulf Hills, 80.7% of individuals (3,566) out of the total population between 25 and 64 years of age (4,419) are in the labor force, with 2.4% or 86 of them being unemployed. The group with the highest labor force participation rate are those with the educational attainment of bachelor's degree or higher, with 86.3% or 1,247 individuals in the labor force. Within the labor force, individuals with less than high school education have the highest percentage of unemployment, with 22.9% or 48 of them being unemployed.
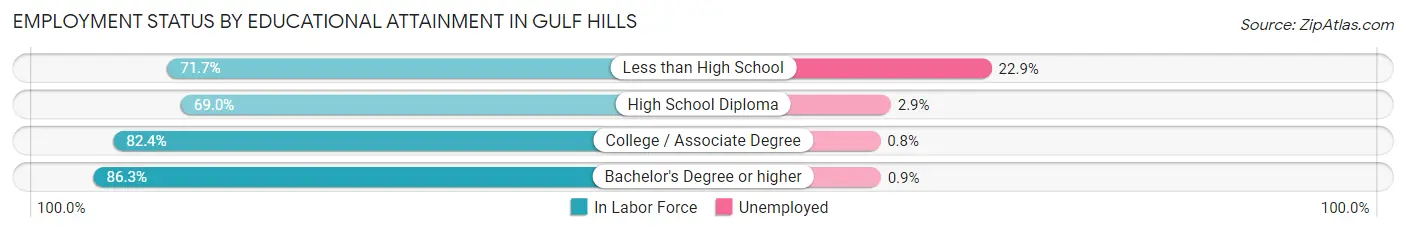
| Educational Attainment | In Labor Force | Unemployed |
| Less than High School | 210 (71.7%) | 67 (22.9%) |
| High School Diploma | 513 (69.0%) | 22 (2.9%) |
| College / Associate Degree | 1,597 (82.4%) | 16 (0.8%) |
| Bachelor's Degree or higher | 1,247 (86.3%) | 13 (0.9%) |
| Total | 3,566 (80.7%) | 106 (2.4%) |
Employment Occupations by Sex in Gulf Hills
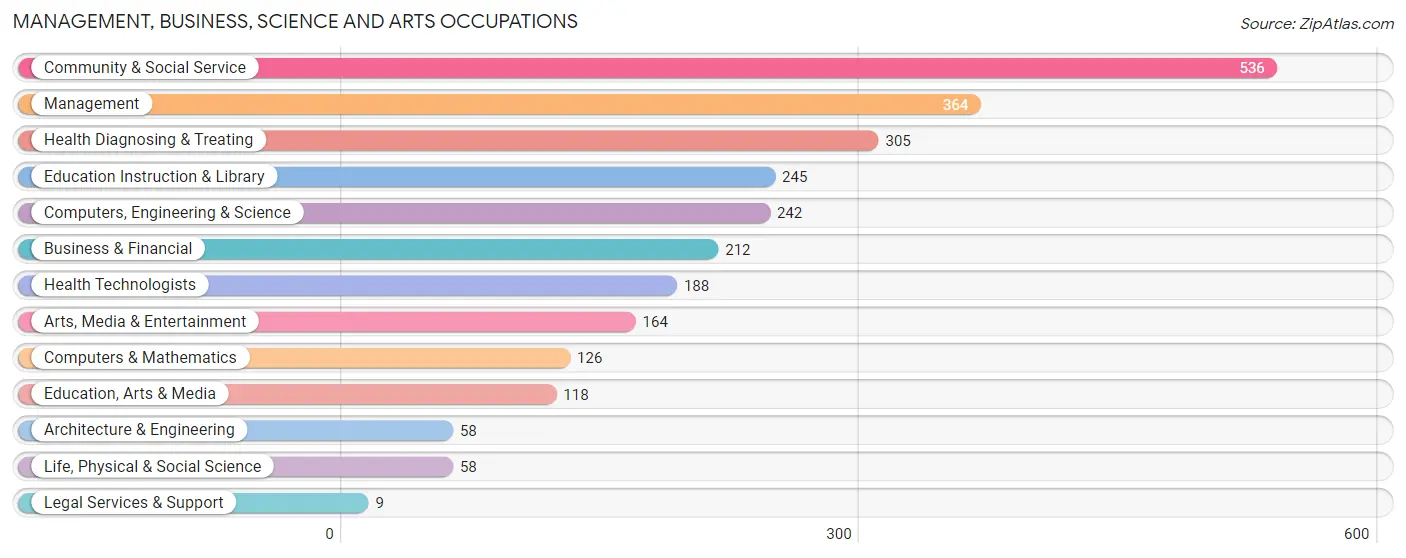
Management, Business, Science and Arts Occupations
The most common Management, Business, Science and Arts occupations in Gulf Hills are Community & Social Service (536 | 12.2%), Management (364 | 8.3%), Health Diagnosing & Treating (305 | 6.9%), Education Instruction & Library (245 | 5.6%), and Computers, Engineering & Science (242 | 5.5%).
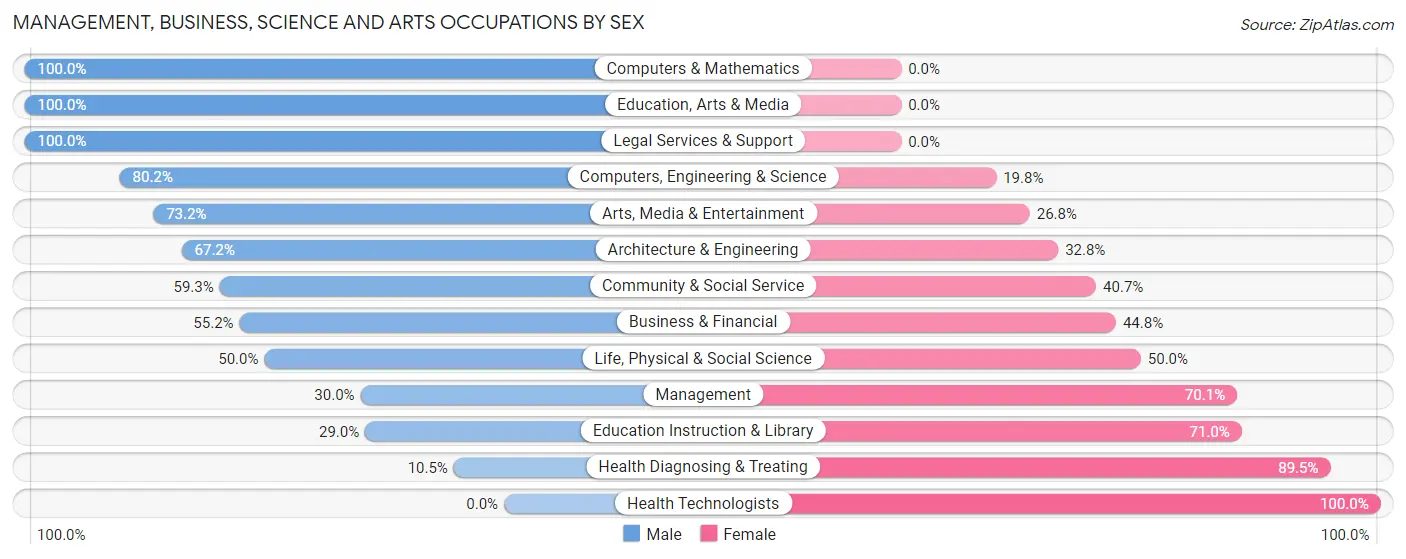
Management, Business, Science and Arts Occupations by Sex
Within the Management, Business, Science and Arts occupations in Gulf Hills, the most male-oriented occupations are Computers & Mathematics (100.0%), Education, Arts & Media (100.0%), and Legal Services & Support (100.0%), while the most female-oriented occupations are Health Technologists (100.0%), Health Diagnosing & Treating (89.5%), and Education Instruction & Library (71.0%).
| Occupation | Male | Female |
| Management | 109 (29.9%) | 255 (70.1%) |
| Business & Financial | 117 (55.2%) | 95 (44.8%) |
| Computers, Engineering & Science | 194 (80.2%) | 48 (19.8%) |
| Computers & Mathematics | 126 (100.0%) | 0 (0.0%) |
| Architecture & Engineering | 39 (67.2%) | 19 (32.8%) |
| Life, Physical & Social Science | 29 (50.0%) | 29 (50.0%) |
| Community & Social Service | 318 (59.3%) | 218 (40.7%) |
| Education, Arts & Media | 118 (100.0%) | 0 (0.0%) |
| Legal Services & Support | 9 (100.0%) | 0 (0.0%) |
| Education Instruction & Library | 71 (29.0%) | 174 (71.0%) |
| Arts, Media & Entertainment | 120 (73.2%) | 44 (26.8%) |
| Health Diagnosing & Treating | 32 (10.5%) | 273 (89.5%) |
| Health Technologists | 0 (0.0%) | 188 (100.0%) |
| Total (Category) | 770 (46.4%) | 889 (53.6%) |
| Total (Overall) | 2,265 (51.4%) | 2,137 (48.5%) |
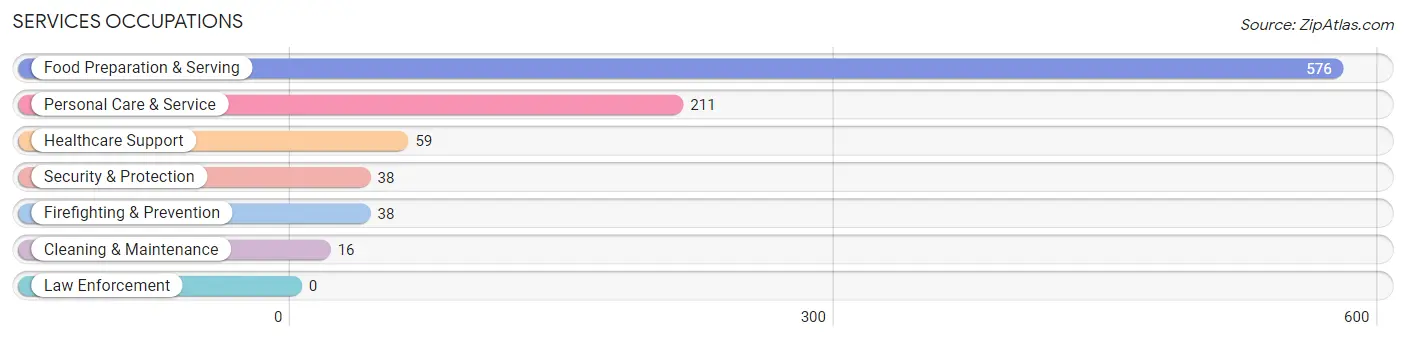
Services Occupations
The most common Services occupations in Gulf Hills are Food Preparation & Serving (576 | 13.1%), Personal Care & Service (211 | 4.8%), Healthcare Support (59 | 1.3%), Security & Protection (38 | 0.9%), and Firefighting & Prevention (38 | 0.9%).
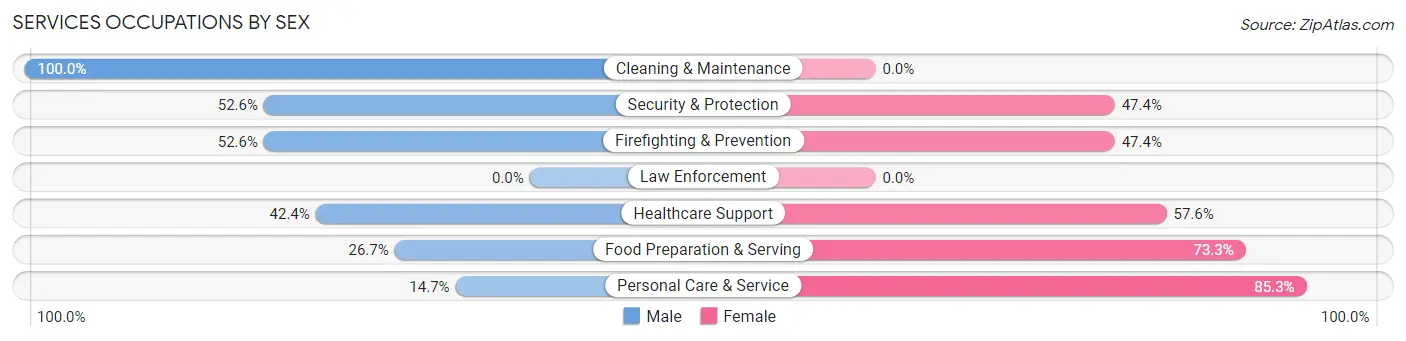
Services Occupations by Sex
Within the Services occupations in Gulf Hills, the most male-oriented occupations are Cleaning & Maintenance (100.0%), Security & Protection (52.6%), and Firefighting & Prevention (52.6%), while the most female-oriented occupations are Personal Care & Service (85.3%), Food Preparation & Serving (73.3%), and Healthcare Support (57.6%).
| Occupation | Male | Female |
| Healthcare Support | 25 (42.4%) | 34 (57.6%) |
| Security & Protection | 20 (52.6%) | 18 (47.4%) |
| Firefighting & Prevention | 20 (52.6%) | 18 (47.4%) |
| Law Enforcement | 0 (0.0%) | 0 (0.0%) |
| Food Preparation & Serving | 154 (26.7%) | 422 (73.3%) |
| Cleaning & Maintenance | 16 (100.0%) | 0 (0.0%) |
| Personal Care & Service | 31 (14.7%) | 180 (85.3%) |
| Total (Category) | 246 (27.3%) | 654 (72.7%) |
| Total (Overall) | 2,265 (51.4%) | 2,137 (48.5%) |
Sales and Office Occupations
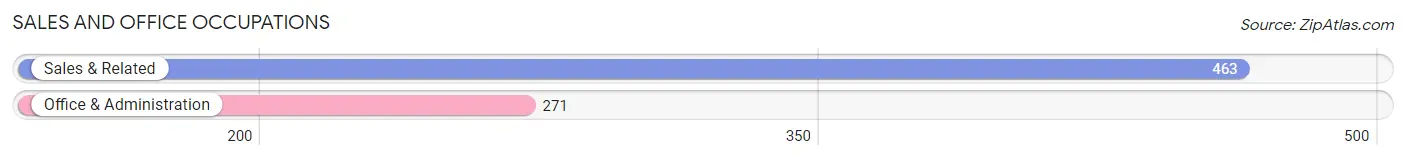
The most common Sales and Office occupations in Gulf Hills are Sales & Related (463 | 10.5%), and Office & Administration (271 | 6.2%).
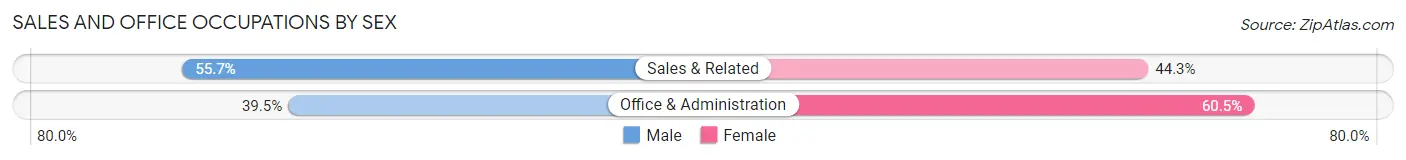
Sales and Office Occupations by Sex
| Occupation | Male | Female |
| Sales & Related | 258 (55.7%) | 205 (44.3%) |
| Office & Administration | 107 (39.5%) | 164 (60.5%) |
| Total (Category) | 365 (49.7%) | 369 (50.3%) |
| Total (Overall) | 2,265 (51.4%) | 2,137 (48.5%) |
Natural Resources, Construction and Maintenance Occupations
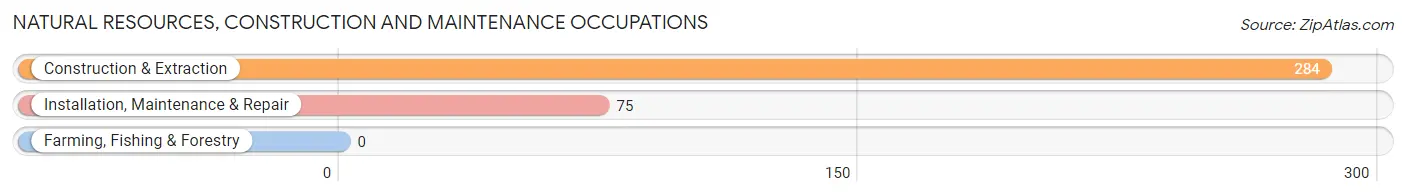
The most common Natural Resources, Construction and Maintenance occupations in Gulf Hills are Construction & Extraction (284 | 6.5%), and Installation, Maintenance & Repair (75 | 1.7%).
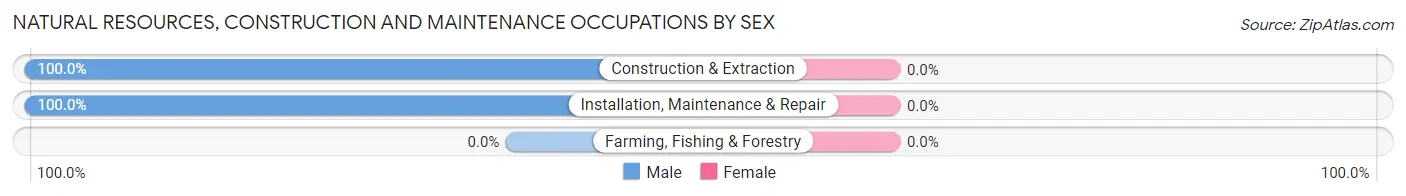
Natural Resources, Construction and Maintenance Occupations by Sex
| Occupation | Male | Female |
| Farming, Fishing & Forestry | 0 (0.0%) | 0 (0.0%) |
| Construction & Extraction | 284 (100.0%) | 0 (0.0%) |
| Installation, Maintenance & Repair | 75 (100.0%) | 0 (0.0%) |
| Total (Category) | 359 (100.0%) | 0 (0.0%) |
| Total (Overall) | 2,265 (51.4%) | 2,137 (48.5%) |
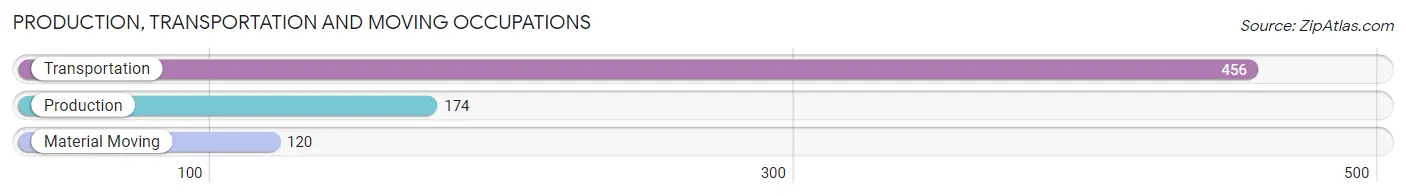
Production, Transportation and Moving Occupations
The most common Production, Transportation and Moving occupations in Gulf Hills are Transportation (456 | 10.4%), Production (174 | 4.0%), and Material Moving (120 | 2.7%).
Production, Transportation and Moving Occupations by Sex
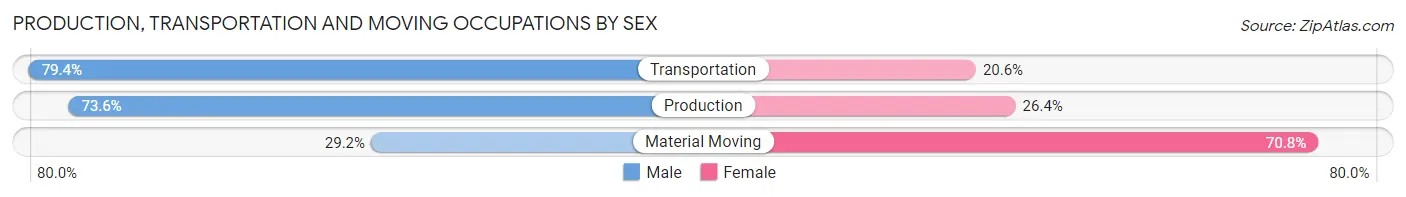
| Occupation | Male | Female |
| Production | 128 (73.6%) | 46 (26.4%) |
| Transportation | 362 (79.4%) | 94 (20.6%) |
| Material Moving | 35 (29.2%) | 85 (70.8%) |
| Total (Category) | 525 (70.0%) | 225 (30.0%) |
| Total (Overall) | 2,265 (51.4%) | 2,137 (48.5%) |
Employment Industries by Sex in Gulf Hills
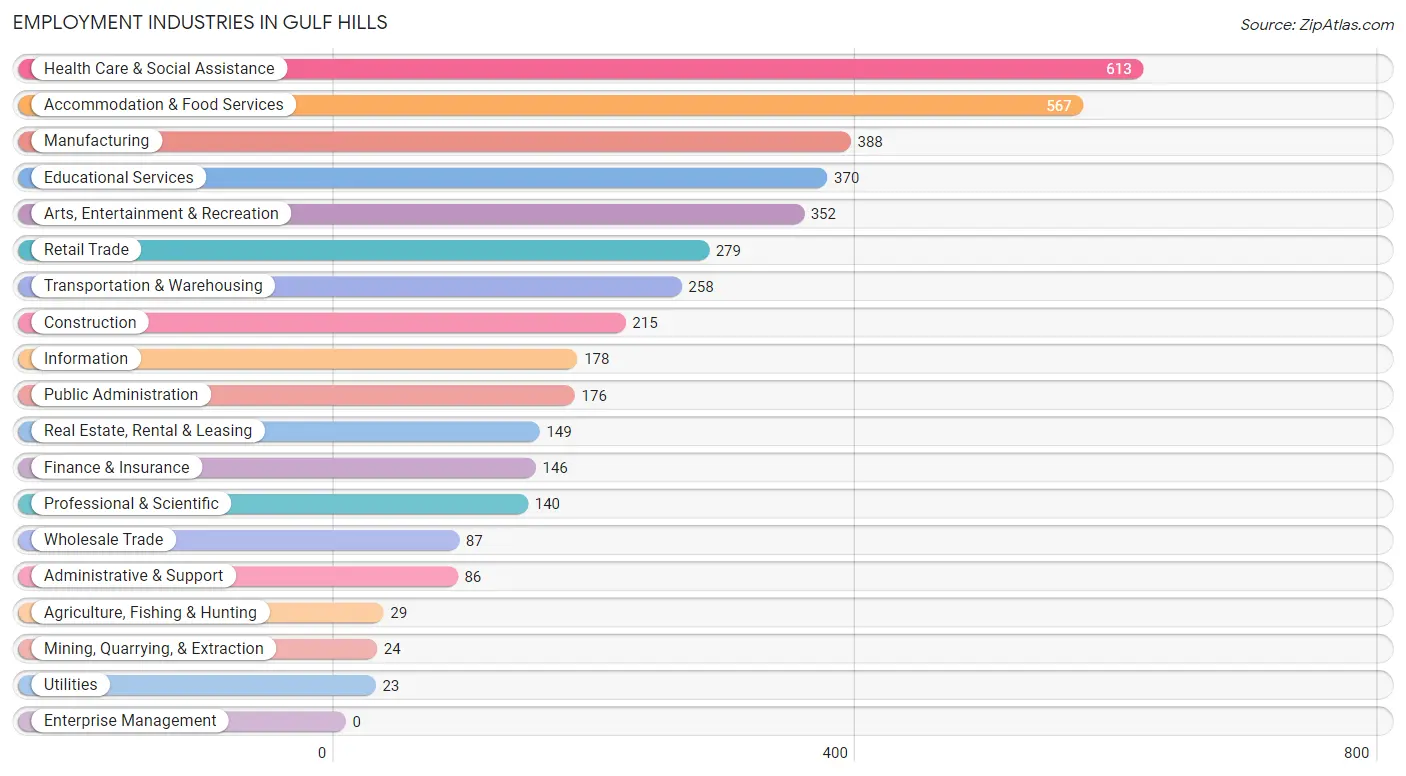
Employment Industries in Gulf Hills
The major employment industries in Gulf Hills include Health Care & Social Assistance (613 | 13.9%), Accommodation & Food Services (567 | 12.9%), Manufacturing (388 | 8.8%), Educational Services (370 | 8.4%), and Arts, Entertainment & Recreation (352 | 8.0%).
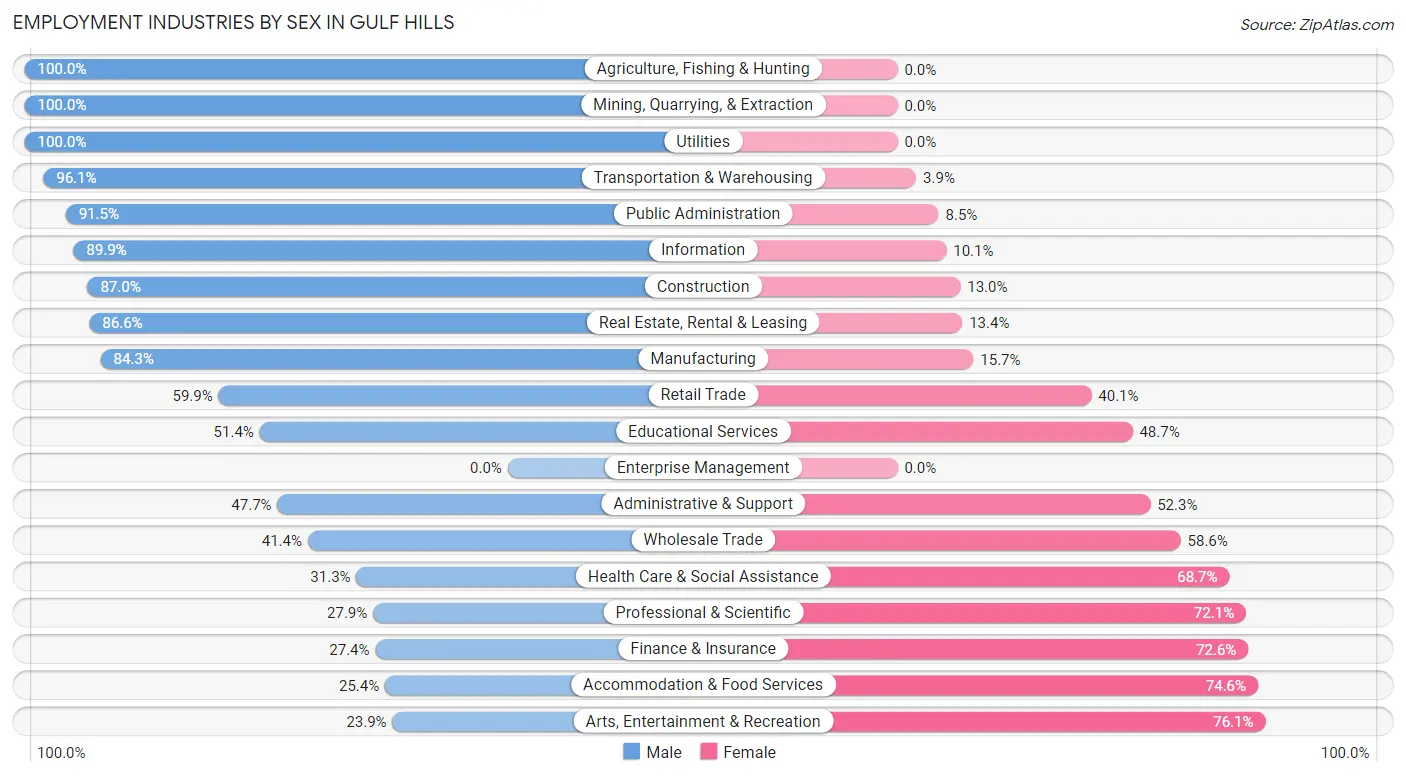
Employment Industries by Sex in Gulf Hills
The Gulf Hills industries that see more men than women are Agriculture, Fishing & Hunting (100.0%), Mining, Quarrying, & Extraction (100.0%), and Utilities (100.0%), whereas the industries that tend to have a higher number of women are Arts, Entertainment & Recreation (76.1%), Accommodation & Food Services (74.6%), and Finance & Insurance (72.6%).
| Industry | Male | Female |
| Agriculture, Fishing & Hunting | 29 (100.0%) | 0 (0.0%) |
| Mining, Quarrying, & Extraction | 24 (100.0%) | 0 (0.0%) |
| Construction | 187 (87.0%) | 28 (13.0%) |
| Manufacturing | 327 (84.3%) | 61 (15.7%) |
| Wholesale Trade | 36 (41.4%) | 51 (58.6%) |
| Retail Trade | 167 (59.9%) | 112 (40.1%) |
| Transportation & Warehousing | 248 (96.1%) | 10 (3.9%) |
| Utilities | 23 (100.0%) | 0 (0.0%) |
| Information | 160 (89.9%) | 18 (10.1%) |
| Finance & Insurance | 40 (27.4%) | 106 (72.6%) |
| Real Estate, Rental & Leasing | 129 (86.6%) | 20 (13.4%) |
| Professional & Scientific | 39 (27.9%) | 101 (72.1%) |
| Enterprise Management | 0 (0.0%) | 0 (0.0%) |
| Administrative & Support | 41 (47.7%) | 45 (52.3%) |
| Educational Services | 190 (51.3%) | 180 (48.6%) |
| Health Care & Social Assistance | 192 (31.3%) | 421 (68.7%) |
| Arts, Entertainment & Recreation | 84 (23.9%) | 268 (76.1%) |
| Accommodation & Food Services | 144 (25.4%) | 423 (74.6%) |
| Public Administration | 161 (91.5%) | 15 (8.5%) |
| Total | 2,265 (51.4%) | 2,137 (48.5%) |
Education in Gulf Hills
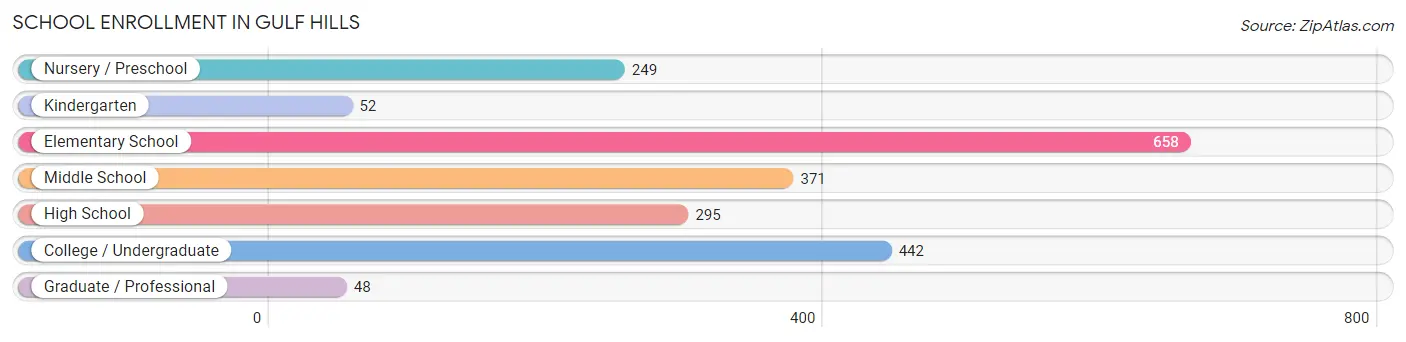
School Enrollment in Gulf Hills
The most common levels of schooling among the 2,115 students in Gulf Hills are elementary school (658 | 31.1%), college / undergraduate (442 | 20.9%), and middle school (371 | 17.5%).
| School Level | # Students | % Students |
| Nursery / Preschool | 249 | 11.8% |
| Kindergarten | 52 | 2.5% |
| Elementary School | 658 | 31.1% |
| Middle School | 371 | 17.5% |
| High School | 295 | 14.0% |
| College / Undergraduate | 442 | 20.9% |
| Graduate / Professional | 48 | 2.3% |
| Total | 2,115 | 100.0% |
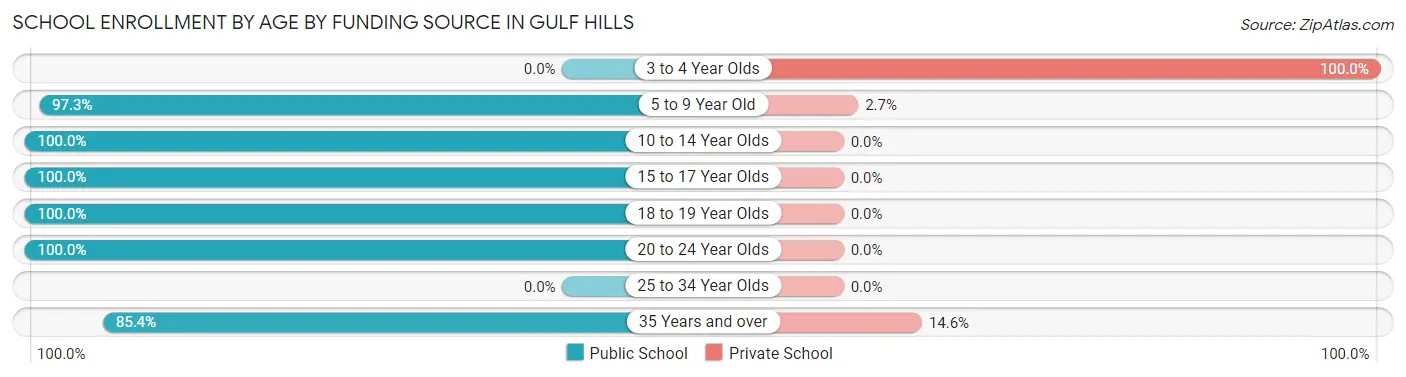
School Enrollment by Age by Funding Source in Gulf Hills
Out of a total of 2,115 students who are enrolled in schools in Gulf Hills, 252 (11.9%) attend a private institution, while the remaining 1,863 (88.1%) are enrolled in public schools. The age group of 3 to 4 year olds has the highest likelihood of being enrolled in private schools, with 214 (100.0% in the age bracket) enrolled. Conversely, the age group of 10 to 14 year olds has the lowest likelihood of being enrolled in a private school, with 596 (100.0% in the age bracket) attending a public institution.
| Age Bracket | Public School | Private School |
| 3 to 4 Year Olds | 0 (0.0%) | 214 (100.0%) |
| 5 to 9 Year Old | 611 (97.3%) | 17 (2.7%) |
| 10 to 14 Year Olds | 596 (100.0%) | 0 (0.0%) |
| 15 to 17 Year Olds | 139 (100.0%) | 0 (0.0%) |
| 18 to 19 Year Olds | 47 (100.0%) | 0 (0.0%) |
| 20 to 24 Year Olds | 347 (100.0%) | 0 (0.0%) |
| 25 to 34 Year Olds | 0 (0.0%) | 0 (0.0%) |
| 35 Years and over | 123 (85.4%) | 21 (14.6%) |
| Total | 1,863 (88.1%) | 252 (11.9%) |
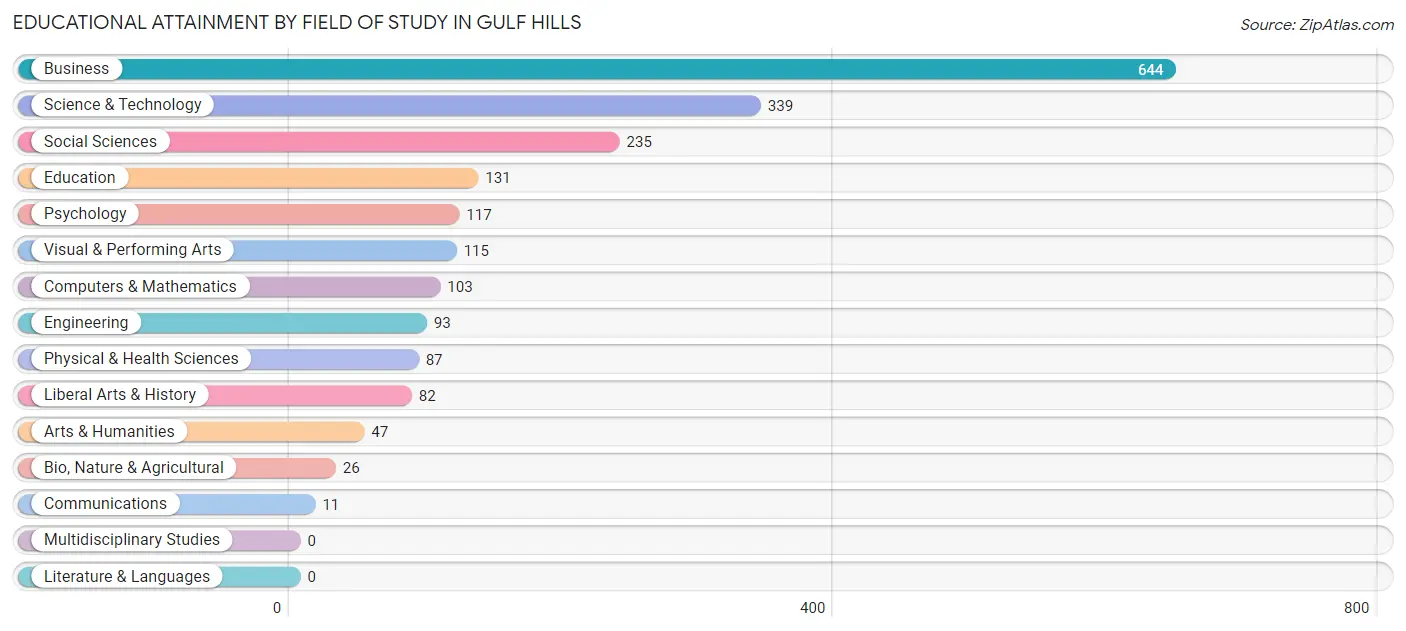
Educational Attainment by Field of Study in Gulf Hills
Business (644 | 31.7%), science & technology (339 | 16.7%), social sciences (235 | 11.6%), education (131 | 6.5%), and psychology (117 | 5.8%) are the most common fields of study among 2,030 individuals in Gulf Hills who have obtained a bachelor's degree or higher.
| Field of Study | # Graduates | % Graduates |
| Computers & Mathematics | 103 | 5.1% |
| Bio, Nature & Agricultural | 26 | 1.3% |
| Physical & Health Sciences | 87 | 4.3% |
| Psychology | 117 | 5.8% |
| Social Sciences | 235 | 11.6% |
| Engineering | 93 | 4.6% |
| Multidisciplinary Studies | 0 | 0.0% |
| Science & Technology | 339 | 16.7% |
| Business | 644 | 31.7% |
| Education | 131 | 6.5% |
| Literature & Languages | 0 | 0.0% |
| Liberal Arts & History | 82 | 4.0% |
| Visual & Performing Arts | 115 | 5.7% |
| Communications | 11 | 0.5% |
| Arts & Humanities | 47 | 2.3% |
| Total | 2,030 | 100.0% |
Transportation & Commute in Gulf Hills
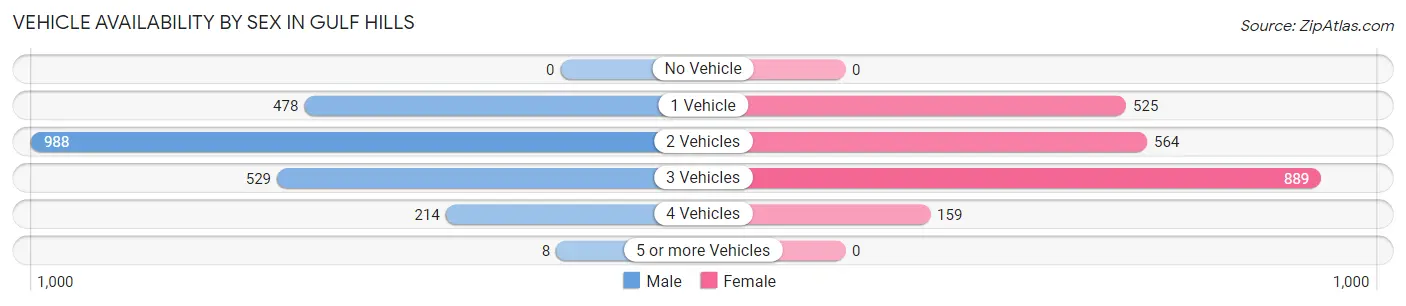
Vehicle Availability by Sex in Gulf Hills
The most prevalent vehicle ownership categories in Gulf Hills are males with 2 vehicles (988, accounting for 44.6%) and females with 2 vehicles (564, making up 46.2%).
| Vehicles Available | Male | Female |
| No Vehicle | 0 (0.0%) | 0 (0.0%) |
| 1 Vehicle | 478 (21.6%) | 525 (24.6%) |
| 2 Vehicles | 988 (44.6%) | 564 (26.4%) |
| 3 Vehicles | 529 (23.9%) | 889 (41.6%) |
| 4 Vehicles | 214 (9.7%) | 159 (7.4%) |
| 5 or more Vehicles | 8 (0.4%) | 0 (0.0%) |
| Total | 2,217 (100.0%) | 2,137 (100.0%) |
Commute Time in Gulf Hills
The most frequently occuring commute durations in Gulf Hills are 15 to 19 minutes (890 commuters, 22.8%), 30 to 34 minutes (659 commuters, 16.9%), and 20 to 24 minutes (589 commuters, 15.1%).
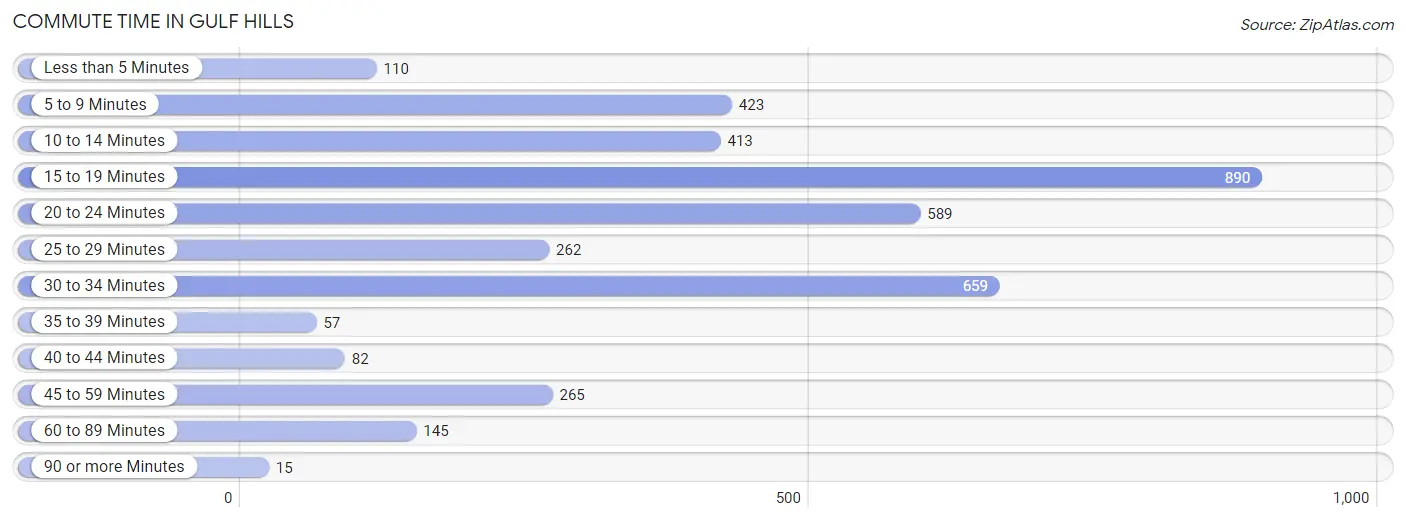
| Commute Time | # Commuters | % Commuters |
| Less than 5 Minutes | 110 | 2.8% |
| 5 to 9 Minutes | 423 | 10.8% |
| 10 to 14 Minutes | 413 | 10.6% |
| 15 to 19 Minutes | 890 | 22.8% |
| 20 to 24 Minutes | 589 | 15.1% |
| 25 to 29 Minutes | 262 | 6.7% |
| 30 to 34 Minutes | 659 | 16.9% |
| 35 to 39 Minutes | 57 | 1.5% |
| 40 to 44 Minutes | 82 | 2.1% |
| 45 to 59 Minutes | 265 | 6.8% |
| 60 to 89 Minutes | 145 | 3.7% |
| 90 or more Minutes | 15 | 0.4% |
Commute Time by Sex in Gulf Hills
The most common commute times in Gulf Hills are 15 to 19 minutes (469 commuters, 24.7%) for males and 15 to 19 minutes (421 commuters, 20.9%) for females.
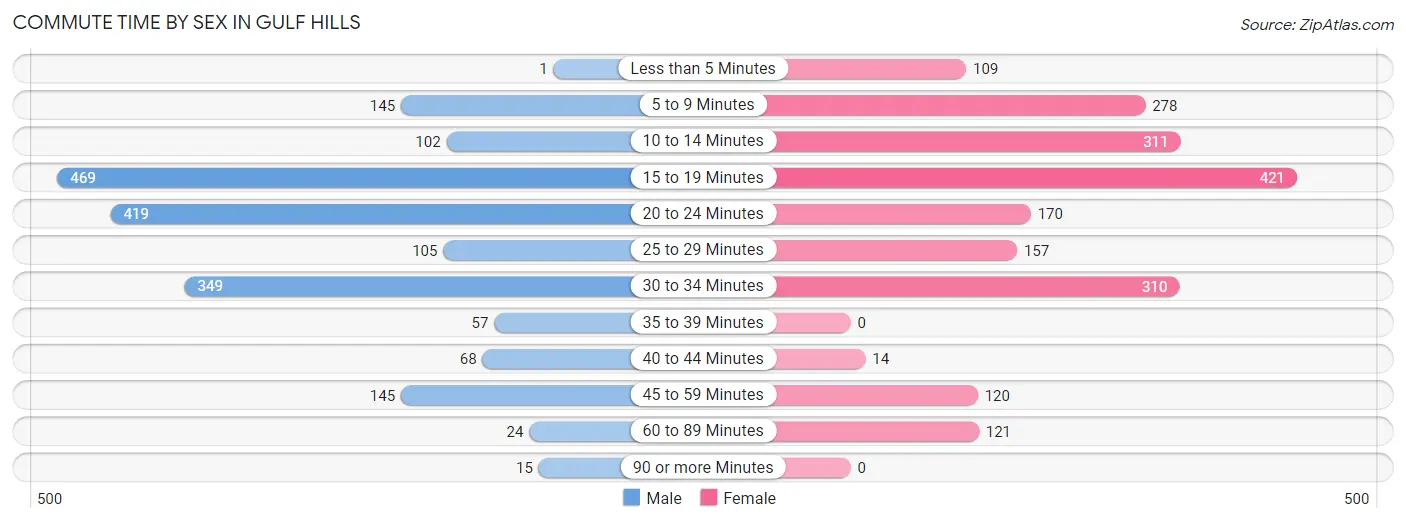
| Commute Time | Male | Female |
| Less than 5 Minutes | 1 (0.1%) | 109 (5.4%) |
| 5 to 9 Minutes | 145 (7.6%) | 278 (13.8%) |
| 10 to 14 Minutes | 102 (5.4%) | 311 (15.5%) |
| 15 to 19 Minutes | 469 (24.7%) | 421 (20.9%) |
| 20 to 24 Minutes | 419 (22.1%) | 170 (8.5%) |
| 25 to 29 Minutes | 105 (5.5%) | 157 (7.8%) |
| 30 to 34 Minutes | 349 (18.4%) | 310 (15.4%) |
| 35 to 39 Minutes | 57 (3.0%) | 0 (0.0%) |
| 40 to 44 Minutes | 68 (3.6%) | 14 (0.7%) |
| 45 to 59 Minutes | 145 (7.6%) | 120 (6.0%) |
| 60 to 89 Minutes | 24 (1.3%) | 121 (6.0%) |
| 90 or more Minutes | 15 (0.8%) | 0 (0.0%) |
Time of Departure to Work by Sex in Gulf Hills
The most frequent times of departure to work in Gulf Hills are 6:00 AM to 6:29 AM (421, 22.2%) for males and 7:00 AM to 7:29 AM (303, 15.1%) for females.
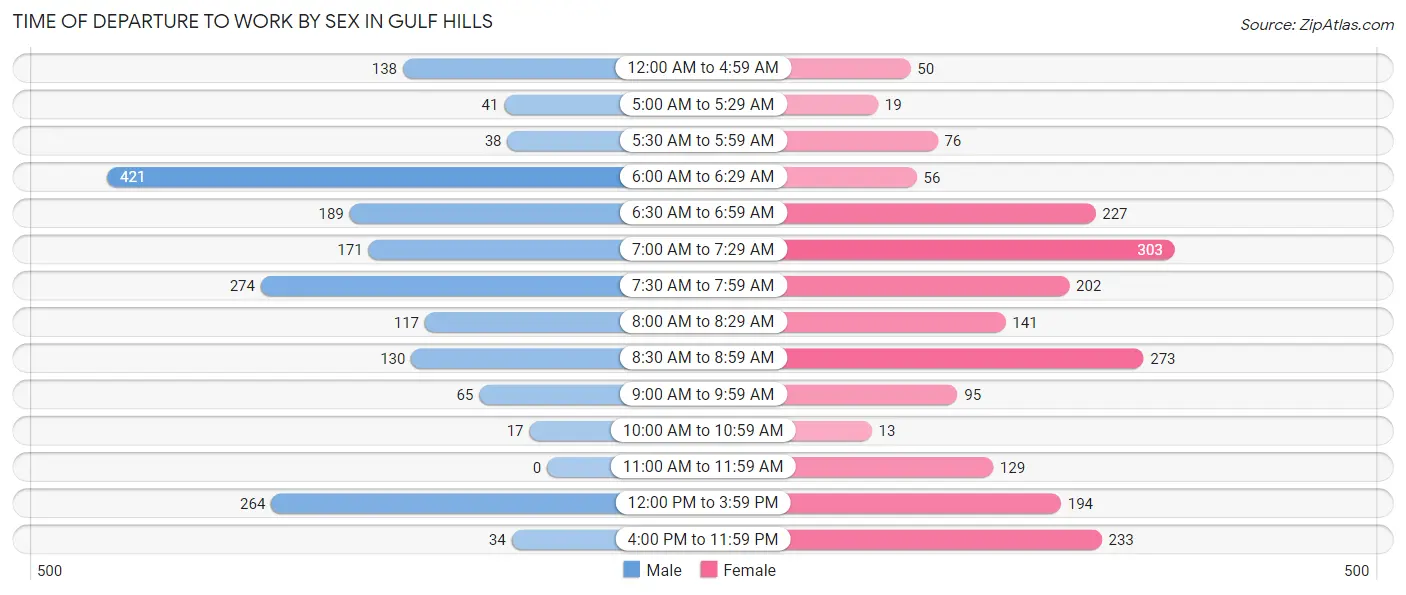
| Time of Departure | Male | Female |
| 12:00 AM to 4:59 AM | 138 (7.3%) | 50 (2.5%) |
| 5:00 AM to 5:29 AM | 41 (2.2%) | 19 (0.9%) |
| 5:30 AM to 5:59 AM | 38 (2.0%) | 76 (3.8%) |
| 6:00 AM to 6:29 AM | 421 (22.2%) | 56 (2.8%) |
| 6:30 AM to 6:59 AM | 189 (10.0%) | 227 (11.3%) |
| 7:00 AM to 7:29 AM | 171 (9.0%) | 303 (15.1%) |
| 7:30 AM to 7:59 AM | 274 (14.4%) | 202 (10.0%) |
| 8:00 AM to 8:29 AM | 117 (6.2%) | 141 (7.0%) |
| 8:30 AM to 8:59 AM | 130 (6.9%) | 273 (13.6%) |
| 9:00 AM to 9:59 AM | 65 (3.4%) | 95 (4.7%) |
| 10:00 AM to 10:59 AM | 17 (0.9%) | 13 (0.6%) |
| 11:00 AM to 11:59 AM | 0 (0.0%) | 129 (6.4%) |
| 12:00 PM to 3:59 PM | 264 (13.9%) | 194 (9.7%) |
| 4:00 PM to 11:59 PM | 34 (1.8%) | 233 (11.6%) |
| Total | 1,899 (100.0%) | 2,011 (100.0%) |
Housing Occupancy in Gulf Hills
Occupancy by Ownership in Gulf Hills
Of the total 3,349 dwellings in Gulf Hills, owner-occupied units account for 2,472 (73.8%), while renter-occupied units make up 877 (26.2%).
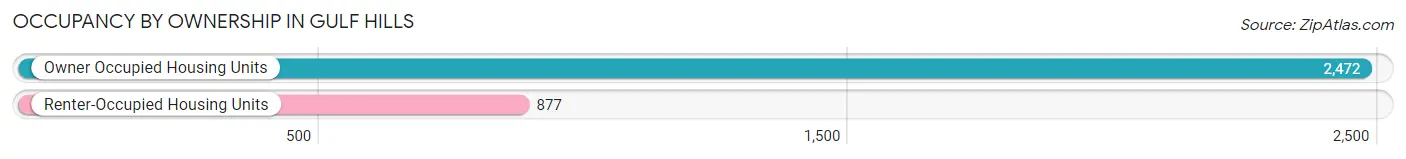
| Occupancy | # Housing Units | % Housing Units |
| Owner Occupied Housing Units | 2,472 | 73.8% |
| Renter-Occupied Housing Units | 877 | 26.2% |
| Total Occupied Housing Units | 3,349 | 100.0% |
Occupancy by Household Size in Gulf Hills
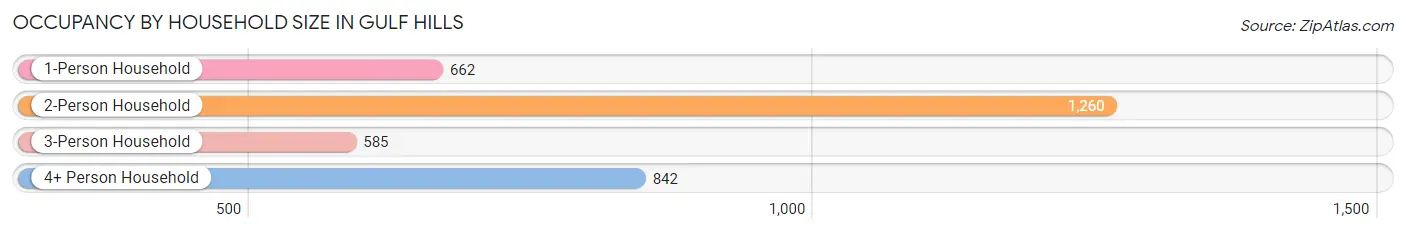
| Household Size | # Housing Units | % Housing Units |
| 1-Person Household | 662 | 19.8% |
| 2-Person Household | 1,260 | 37.6% |
| 3-Person Household | 585 | 17.5% |
| 4+ Person Household | 842 | 25.1% |
| Total Housing Units | 3,349 | 100.0% |
Occupancy by Ownership by Household Size in Gulf Hills
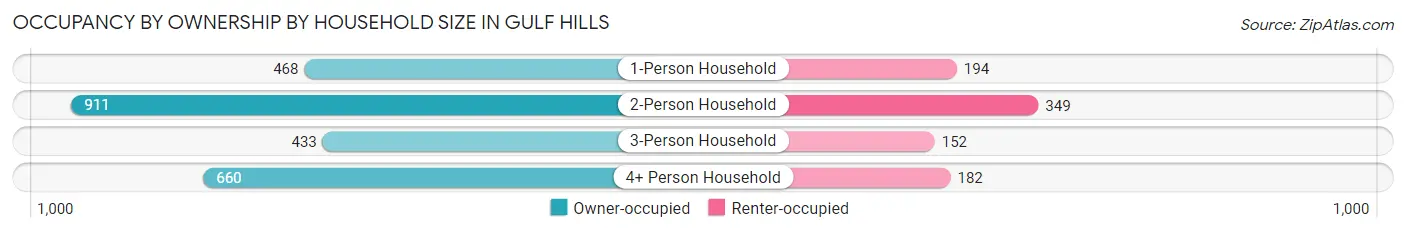
| Household Size | Owner-occupied | Renter-occupied |
| 1-Person Household | 468 (70.7%) | 194 (29.3%) |
| 2-Person Household | 911 (72.3%) | 349 (27.7%) |
| 3-Person Household | 433 (74.0%) | 152 (26.0%) |
| 4+ Person Household | 660 (78.4%) | 182 (21.6%) |
| Total Housing Units | 2,472 (73.8%) | 877 (26.2%) |
Occupancy by Educational Attainment in Gulf Hills
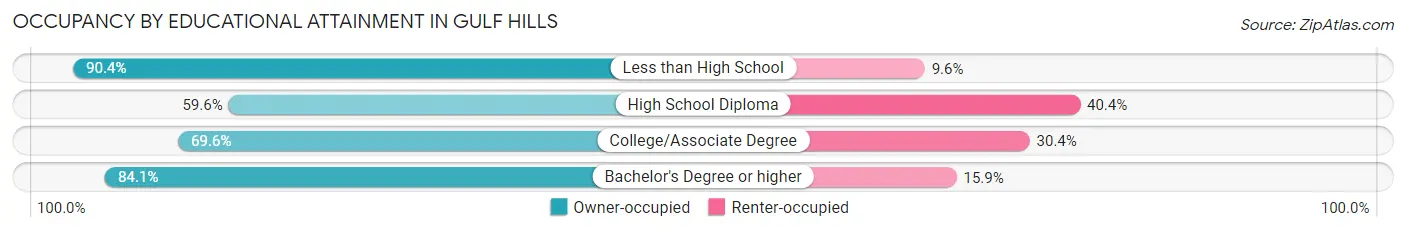
| Household Size | Owner-occupied | Renter-occupied |
| Less than High School | 169 (90.4%) | 18 (9.6%) |
| High School Diploma | 339 (59.6%) | 230 (40.4%) |
| College/Associate Degree | 1,036 (69.6%) | 453 (30.4%) |
| Bachelor's Degree or higher | 928 (84.1%) | 176 (15.9%) |
Occupancy by Age of Householder in Gulf Hills
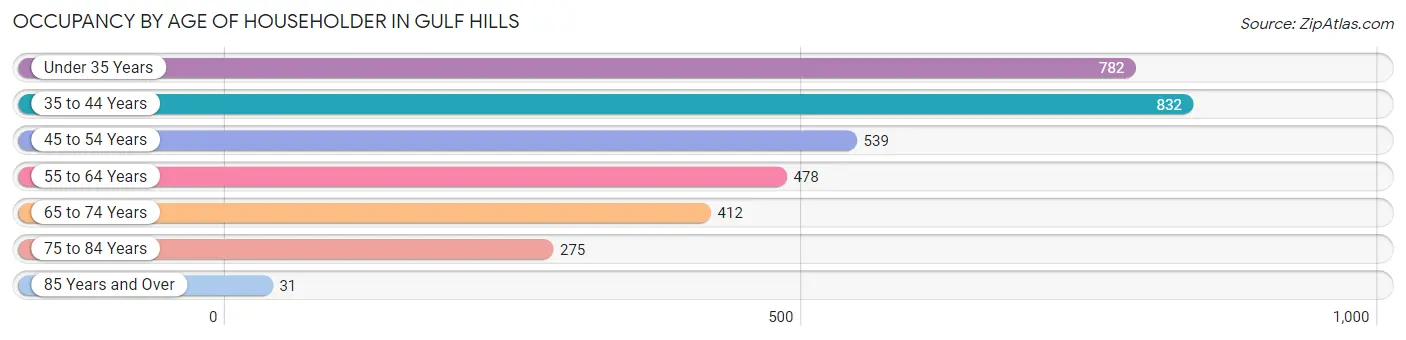
| Age Bracket | # Households | % Households |
| Under 35 Years | 782 | 23.4% |
| 35 to 44 Years | 832 | 24.8% |
| 45 to 54 Years | 539 | 16.1% |
| 55 to 64 Years | 478 | 14.3% |
| 65 to 74 Years | 412 | 12.3% |
| 75 to 84 Years | 275 | 8.2% |
| 85 Years and Over | 31 | 0.9% |
| Total | 3,349 | 100.0% |
Housing Finances in Gulf Hills
Median Income by Occupancy in Gulf Hills
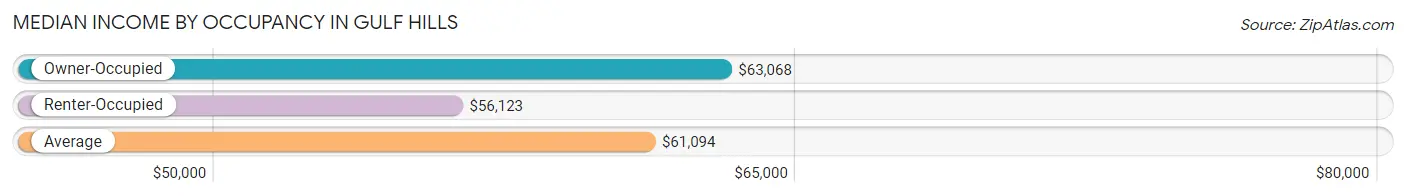
| Occupancy Type | # Households | Median Income |
| Owner-Occupied | 2,472 (73.8%) | $63,068 |
| Renter-Occupied | 877 (26.2%) | $56,123 |
| Average | 3,349 (100.0%) | $61,094 |
Occupancy by Householder Income Bracket in Gulf Hills
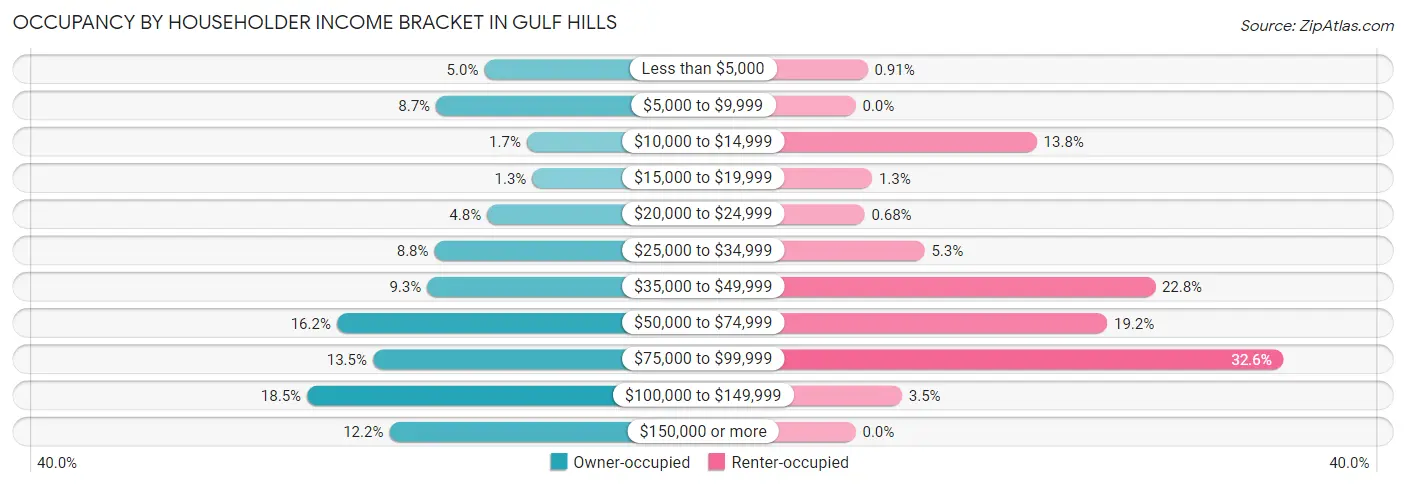
| Income Bracket | Owner-occupied | Renter-occupied |
| Less than $5,000 | 123 (5.0%) | 8 (0.9%) |
| $5,000 to $9,999 | 214 (8.7%) | 0 (0.0%) |
| $10,000 to $14,999 | 43 (1.7%) | 121 (13.8%) |
| $15,000 to $19,999 | 33 (1.3%) | 11 (1.3%) |
| $20,000 to $24,999 | 118 (4.8%) | 6 (0.7%) |
| $25,000 to $34,999 | 217 (8.8%) | 46 (5.2%) |
| $35,000 to $49,999 | 231 (9.3%) | 200 (22.8%) |
| $50,000 to $74,999 | 401 (16.2%) | 168 (19.2%) |
| $75,000 to $99,999 | 333 (13.5%) | 286 (32.6%) |
| $100,000 to $149,999 | 457 (18.5%) | 31 (3.5%) |
| $150,000 or more | 302 (12.2%) | 0 (0.0%) |
| Total | 2,472 (100.0%) | 877 (100.0%) |
Monthly Housing Cost Tiers in Gulf Hills
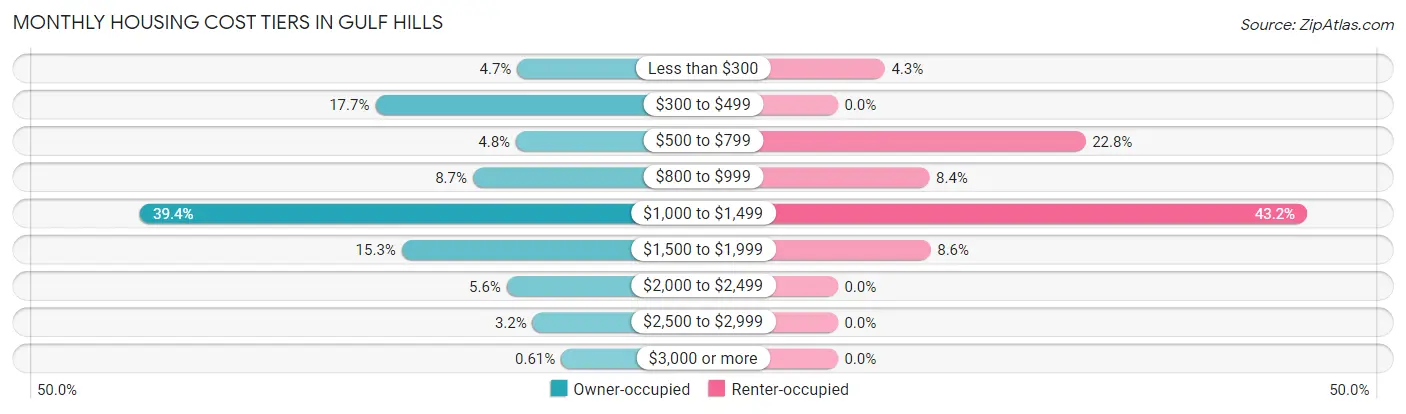
| Monthly Cost | Owner-occupied | Renter-occupied |
| Less than $300 | 115 (4.6%) | 38 (4.3%) |
| $300 to $499 | 438 (17.7%) | 0 (0.0%) |
| $500 to $799 | 118 (4.8%) | 200 (22.8%) |
| $800 to $999 | 216 (8.7%) | 74 (8.4%) |
| $1,000 to $1,499 | 973 (39.4%) | 379 (43.2%) |
| $1,500 to $1,999 | 378 (15.3%) | 75 (8.6%) |
| $2,000 to $2,499 | 139 (5.6%) | 0 (0.0%) |
| $2,500 to $2,999 | 80 (3.2%) | 0 (0.0%) |
| $3,000 or more | 15 (0.6%) | 0 (0.0%) |
| Total | 2,472 (100.0%) | 877 (100.0%) |
Physical Housing Characteristics in Gulf Hills
Housing Structures in Gulf Hills
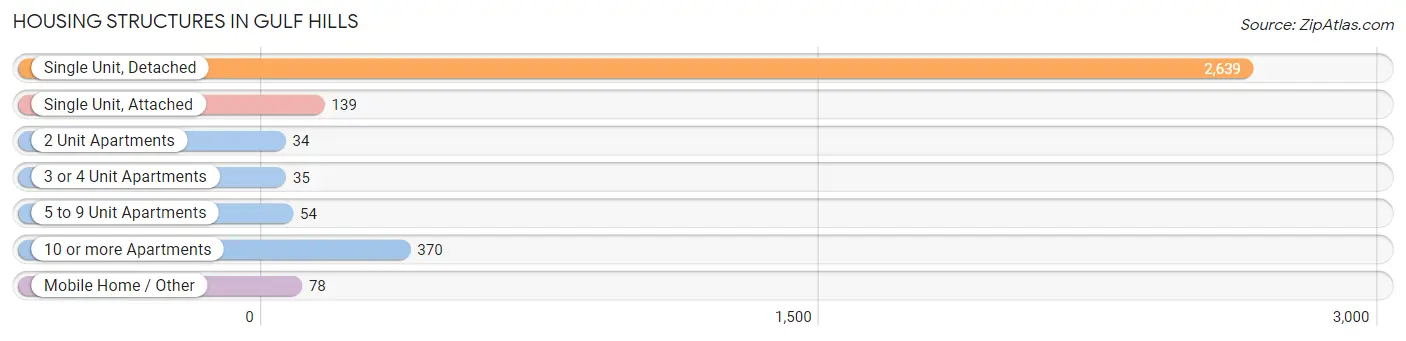
| Structure Type | # Housing Units | % Housing Units |
| Single Unit, Detached | 2,639 | 78.8% |
| Single Unit, Attached | 139 | 4.2% |
| 2 Unit Apartments | 34 | 1.0% |
| 3 or 4 Unit Apartments | 35 | 1.1% |
| 5 to 9 Unit Apartments | 54 | 1.6% |
| 10 or more Apartments | 370 | 11.1% |
| Mobile Home / Other | 78 | 2.3% |
| Total | 3,349 | 100.0% |
Housing Structures by Occupancy in Gulf Hills
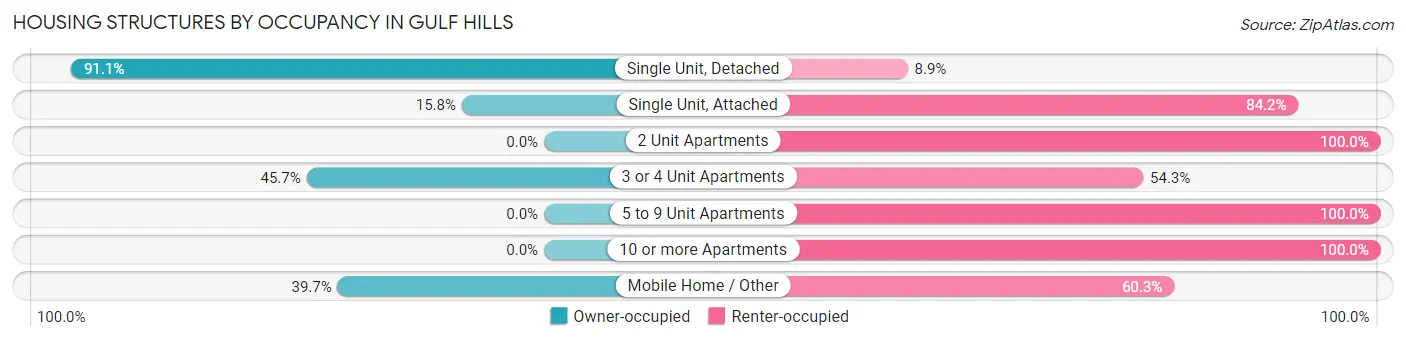
| Structure Type | Owner-occupied | Renter-occupied |
| Single Unit, Detached | 2,403 (91.1%) | 236 (8.9%) |
| Single Unit, Attached | 22 (15.8%) | 117 (84.2%) |
| 2 Unit Apartments | 0 (0.0%) | 34 (100.0%) |
| 3 or 4 Unit Apartments | 16 (45.7%) | 19 (54.3%) |
| 5 to 9 Unit Apartments | 0 (0.0%) | 54 (100.0%) |
| 10 or more Apartments | 0 (0.0%) | 370 (100.0%) |
| Mobile Home / Other | 31 (39.7%) | 47 (60.3%) |
| Total | 2,472 (73.8%) | 877 (26.2%) |
Housing Structures by Number of Rooms in Gulf Hills
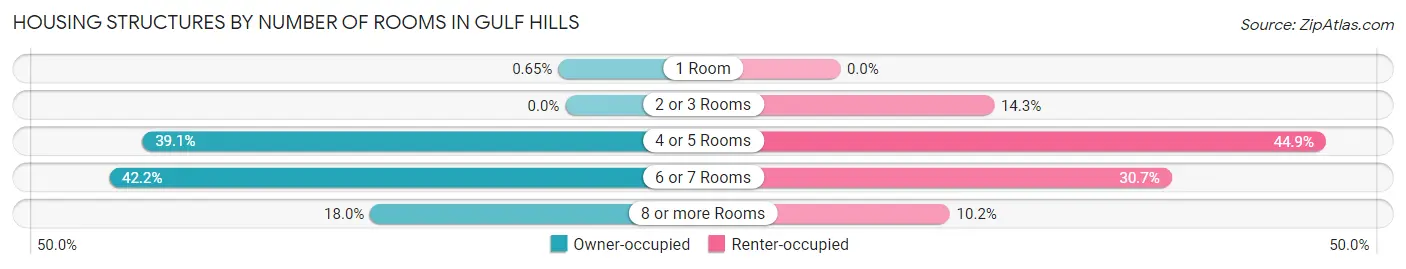
| Number of Rooms | Owner-occupied | Renter-occupied |
| 1 Room | 16 (0.6%) | 0 (0.0%) |
| 2 or 3 Rooms | 0 (0.0%) | 125 (14.2%) |
| 4 or 5 Rooms | 967 (39.1%) | 394 (44.9%) |
| 6 or 7 Rooms | 1,043 (42.2%) | 269 (30.7%) |
| 8 or more Rooms | 446 (18.0%) | 89 (10.2%) |
| Total | 2,472 (100.0%) | 877 (100.0%) |
Housing Structure by Heating Type in Gulf Hills
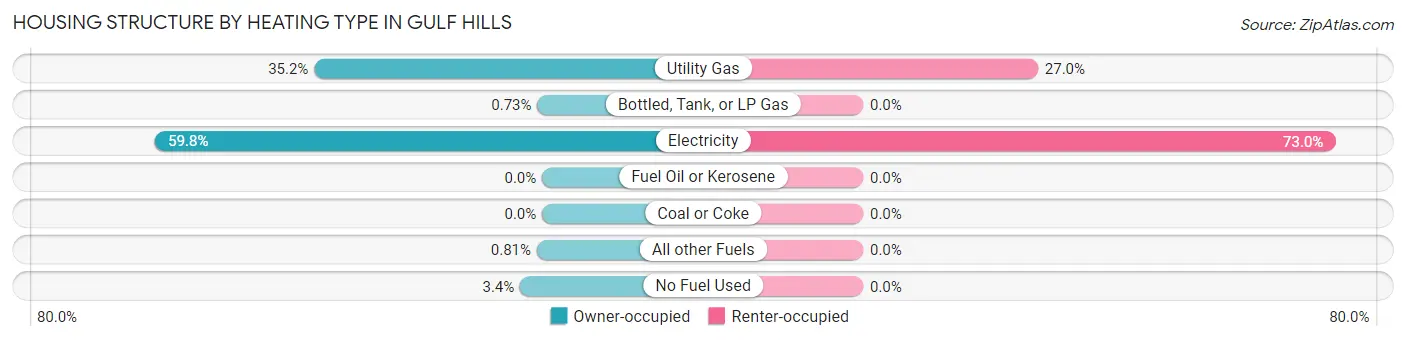
| Heating Type | Owner-occupied | Renter-occupied |
| Utility Gas | 871 (35.2%) | 237 (27.0%) |
| Bottled, Tank, or LP Gas | 18 (0.7%) | 0 (0.0%) |
| Electricity | 1,479 (59.8%) | 640 (73.0%) |
| Fuel Oil or Kerosene | 0 (0.0%) | 0 (0.0%) |
| Coal or Coke | 0 (0.0%) | 0 (0.0%) |
| All other Fuels | 20 (0.8%) | 0 (0.0%) |
| No Fuel Used | 84 (3.4%) | 0 (0.0%) |
| Total | 2,472 (100.0%) | 877 (100.0%) |
Household Vehicle Usage in Gulf Hills
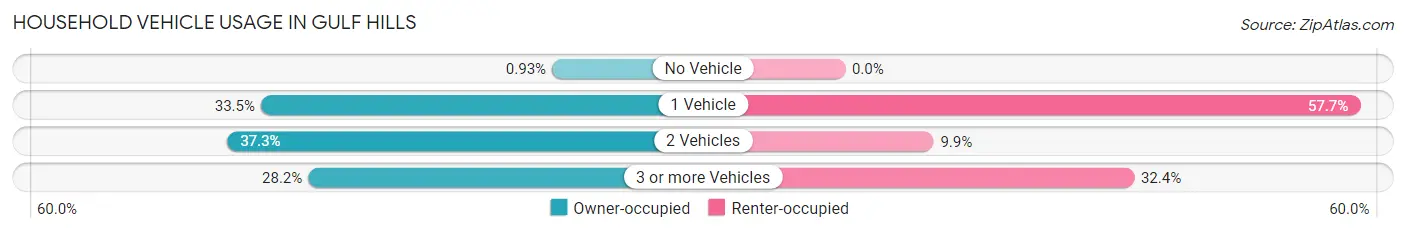
| Vehicles per Household | Owner-occupied | Renter-occupied |
| No Vehicle | 23 (0.9%) | 0 (0.0%) |
| 1 Vehicle | 829 (33.5%) | 506 (57.7%) |
| 2 Vehicles | 922 (37.3%) | 87 (9.9%) |
| 3 or more Vehicles | 698 (28.2%) | 284 (32.4%) |
| Total | 2,472 (100.0%) | 877 (100.0%) |
Real Estate & Mortgages in Gulf Hills
Real Estate and Mortgage Overview in Gulf Hills
| Characteristic | Without Mortgage | With Mortgage |
| Housing Units | 712 | 1,760 |
| Median Property Value | $139,200 | $172,900 |
| Median Household Income | $64,750 | $215 |
| Monthly Housing Costs | $433 | $15 |
| Real Estate Taxes | $918 | $104 |
Property Value by Mortgage Status in Gulf Hills
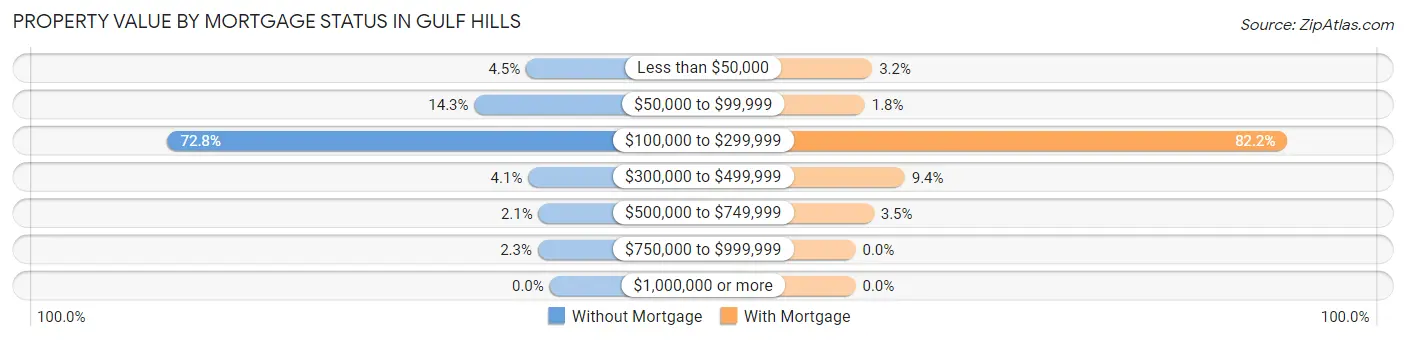
| Property Value | Without Mortgage | With Mortgage |
| Less than $50,000 | 32 (4.5%) | 56 (3.2%) |
| $50,000 to $99,999 | 102 (14.3%) | 31 (1.8%) |
| $100,000 to $299,999 | 518 (72.8%) | 1,447 (82.2%) |
| $300,000 to $499,999 | 29 (4.1%) | 165 (9.4%) |
| $500,000 to $749,999 | 15 (2.1%) | 61 (3.5%) |
| $750,000 to $999,999 | 16 (2.2%) | 0 (0.0%) |
| $1,000,000 or more | 0 (0.0%) | 0 (0.0%) |
| Total | 712 (100.0%) | 1,760 (100.0%) |
Household Income by Mortgage Status in Gulf Hills
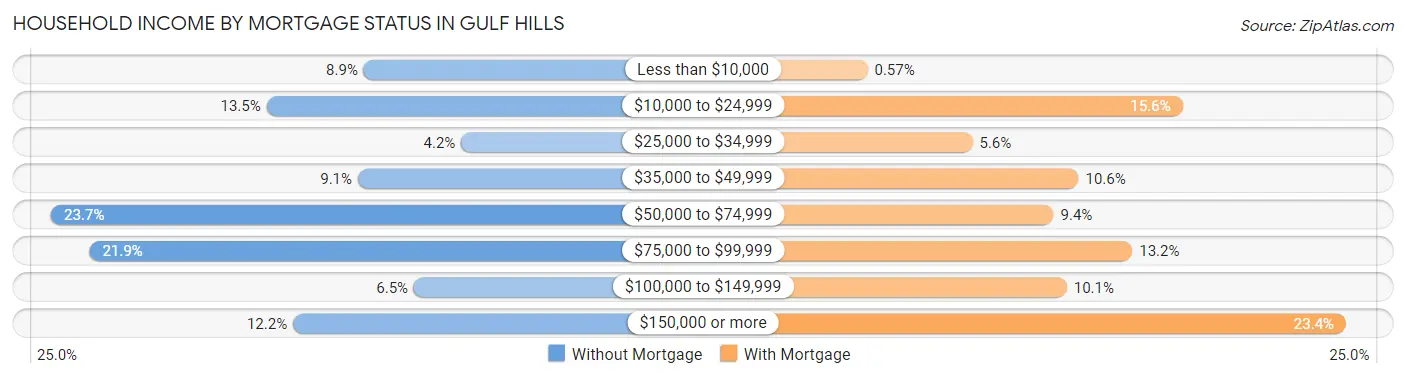
| Household Income | Without Mortgage | With Mortgage |
| Less than $10,000 | 63 (8.8%) | 10 (0.6%) |
| $10,000 to $24,999 | 96 (13.5%) | 274 (15.6%) |
| $25,000 to $34,999 | 30 (4.2%) | 98 (5.6%) |
| $35,000 to $49,999 | 65 (9.1%) | 187 (10.6%) |
| $50,000 to $74,999 | 169 (23.7%) | 166 (9.4%) |
| $75,000 to $99,999 | 156 (21.9%) | 232 (13.2%) |
| $100,000 to $149,999 | 46 (6.5%) | 177 (10.1%) |
| $150,000 or more | 87 (12.2%) | 411 (23.4%) |
| Total | 712 (100.0%) | 1,760 (100.0%) |
Property Value to Household Income Ratio in Gulf Hills
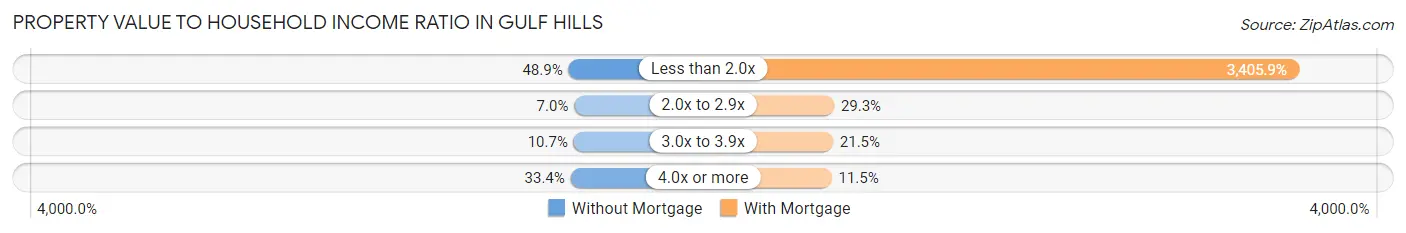
| Value-to-Income Ratio | Without Mortgage | With Mortgage |
| Less than 2.0x | 348 (48.9%) | 59,943 (3,405.9%) |
| 2.0x to 2.9x | 50 (7.0%) | 515 (29.3%) |
| 3.0x to 3.9x | 76 (10.7%) | 379 (21.5%) |
| 4.0x or more | 238 (33.4%) | 203 (11.5%) |
| Total | 712 (100.0%) | 1,760 (100.0%) |
Real Estate Taxes by Mortgage Status in Gulf Hills
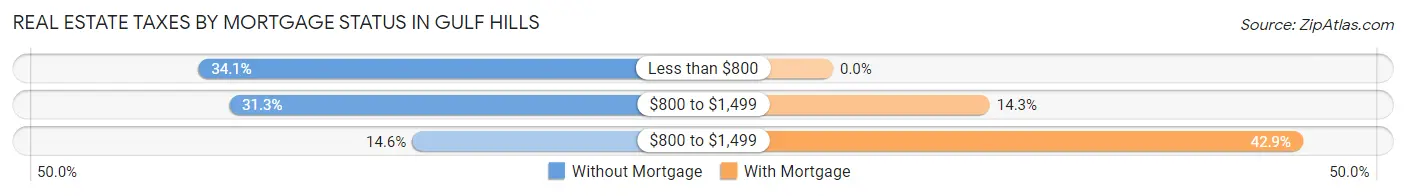
| Property Taxes | Without Mortgage | With Mortgage |
| Less than $800 | 243 (34.1%) | 0 (0.0%) |
| $800 to $1,499 | 223 (31.3%) | 252 (14.3%) |
| $800 to $1,499 | 104 (14.6%) | 755 (42.9%) |
| Total | 712 (100.0%) | 1,760 (100.0%) |
Health & Disability in Gulf Hills
Health Insurance Coverage by Age in Gulf Hills
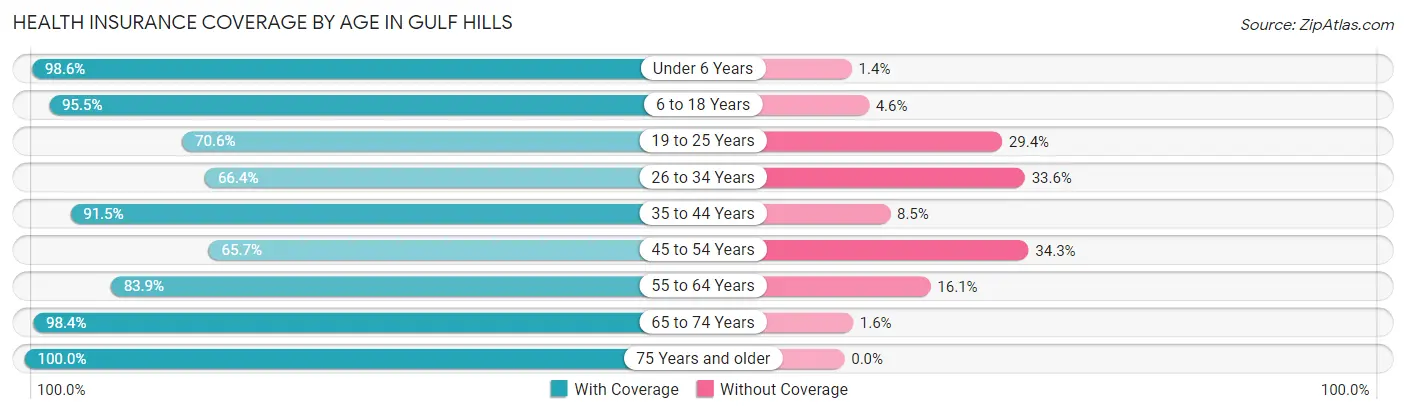
| Age Bracket | With Coverage | Without Coverage |
| Under 6 Years | 649 (98.6%) | 9 (1.4%) |
| 6 to 18 Years | 1,218 (95.5%) | 58 (4.5%) |
| 19 to 25 Years | 675 (70.6%) | 281 (29.4%) |
| 26 to 34 Years | 945 (66.4%) | 479 (33.6%) |
| 35 to 44 Years | 1,008 (91.5%) | 94 (8.5%) |
| 45 to 54 Years | 595 (65.7%) | 311 (34.3%) |
| 55 to 64 Years | 805 (83.9%) | 154 (16.1%) |
| 65 to 74 Years | 681 (98.4%) | 11 (1.6%) |
| 75 Years and older | 506 (100.0%) | 0 (0.0%) |
| Total | 7,082 (83.5%) | 1,397 (16.5%) |
Health Insurance Coverage by Citizenship Status in Gulf Hills
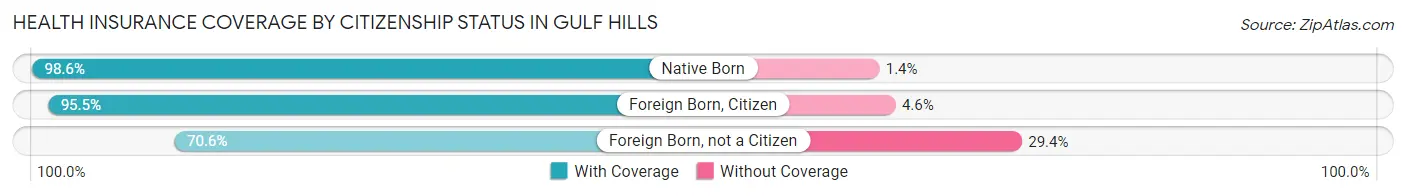
| Citizenship Status | With Coverage | Without Coverage |
| Native Born | 649 (98.6%) | 9 (1.4%) |
| Foreign Born, Citizen | 1,218 (95.5%) | 58 (4.5%) |
| Foreign Born, not a Citizen | 675 (70.6%) | 281 (29.4%) |
Health Insurance Coverage by Household Income in Gulf Hills
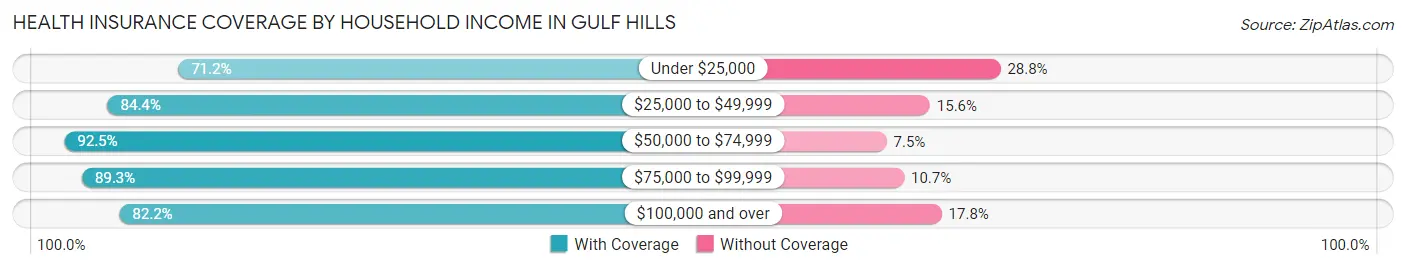
| Household Income | With Coverage | Without Coverage |
| Under $25,000 | 1,081 (71.2%) | 437 (28.8%) |
| $25,000 to $49,999 | 1,281 (84.4%) | 236 (15.6%) |
| $50,000 to $74,999 | 1,091 (92.5%) | 88 (7.5%) |
| $75,000 to $99,999 | 1,564 (89.3%) | 188 (10.7%) |
| $100,000 and over | 2,064 (82.2%) | 446 (17.8%) |
Public vs Private Health Insurance Coverage by Age in Gulf Hills
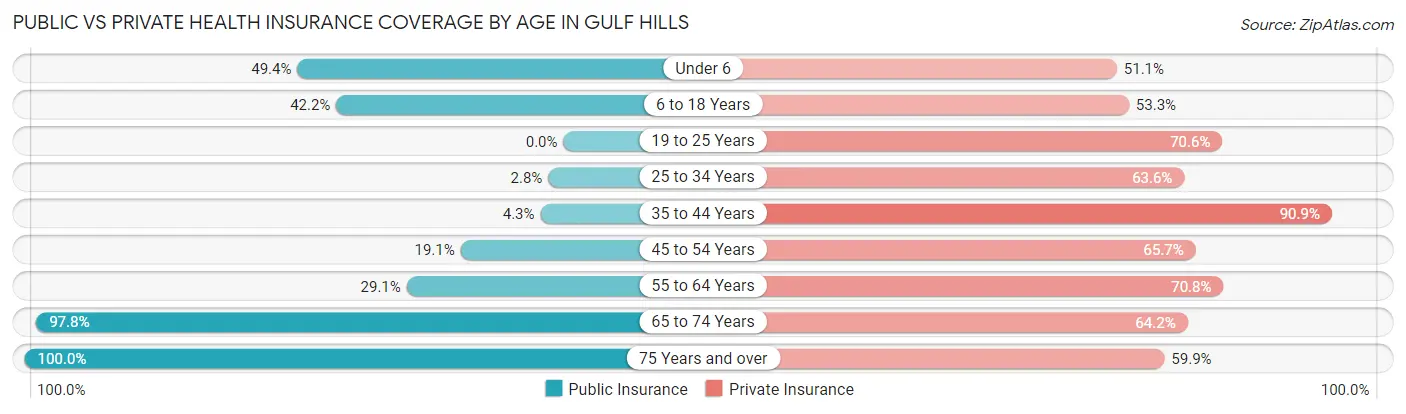
| Age Bracket | Public Insurance | Private Insurance |
| Under 6 | 325 (49.4%) | 336 (51.1%) |
| 6 to 18 Years | 538 (42.2%) | 680 (53.3%) |
| 19 to 25 Years | 0 (0.0%) | 675 (70.6%) |
| 25 to 34 Years | 40 (2.8%) | 905 (63.5%) |
| 35 to 44 Years | 47 (4.3%) | 1,002 (90.9%) |
| 45 to 54 Years | 173 (19.1%) | 595 (65.7%) |
| 55 to 64 Years | 279 (29.1%) | 679 (70.8%) |
| 65 to 74 Years | 677 (97.8%) | 444 (64.2%) |
| 75 Years and over | 506 (100.0%) | 303 (59.9%) |
| Total | 2,585 (30.5%) | 5,619 (66.3%) |
Disability Status by Sex by Age in Gulf Hills
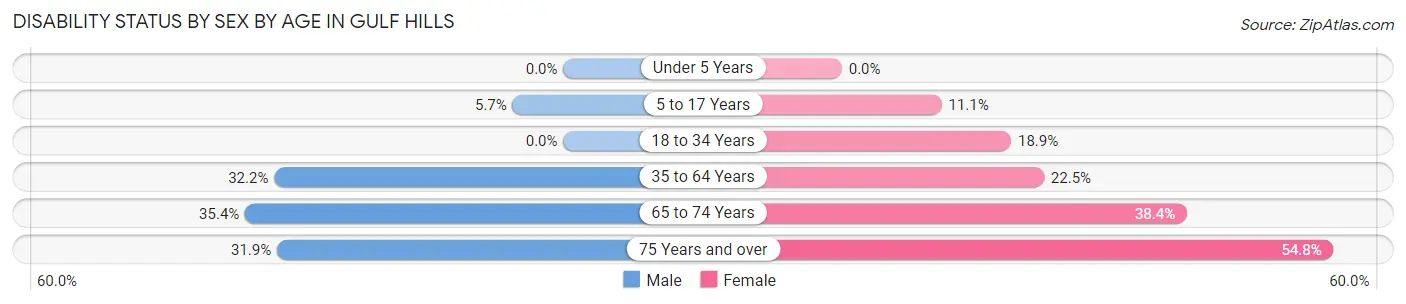
| Age Bracket | Male | Female |
| Under 5 Years | 0 (0.0%) | 0 (0.0%) |
| 5 to 17 Years | 41 (5.7%) | 75 (11.1%) |
| 18 to 34 Years | 0 (0.0%) | 216 (18.9%) |
| 35 to 64 Years | 406 (32.2%) | 384 (22.5%) |
| 65 to 74 Years | 118 (35.4%) | 138 (38.4%) |
| 75 Years and over | 81 (31.9%) | 138 (54.8%) |
Disability Class by Sex by Age in Gulf Hills
Disability Class: Hearing Difficulty
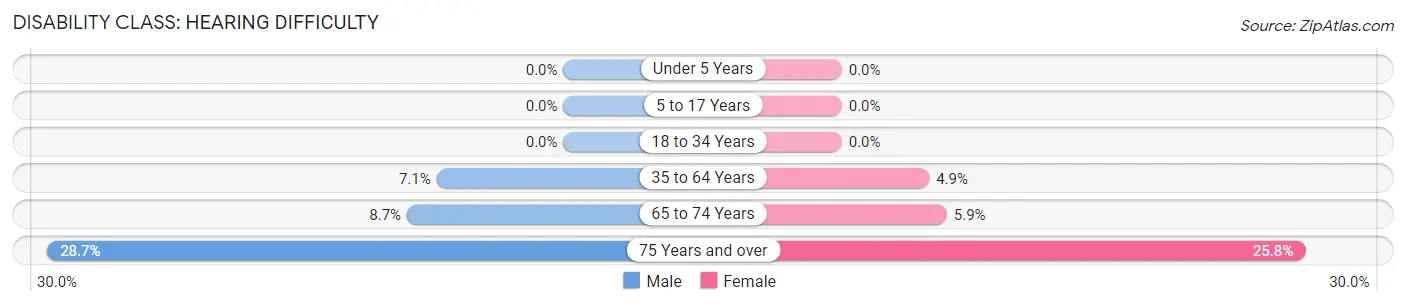
| Age Bracket | Male | Female |
| Under 5 Years | 0 (0.0%) | 0 (0.0%) |
| 5 to 17 Years | 0 (0.0%) | 0 (0.0%) |
| 18 to 34 Years | 0 (0.0%) | 0 (0.0%) |
| 35 to 64 Years | 89 (7.1%) | 83 (4.9%) |
| 65 to 74 Years | 29 (8.7%) | 21 (5.9%) |
| 75 Years and over | 73 (28.7%) | 65 (25.8%) |
Disability Class: Vision Difficulty
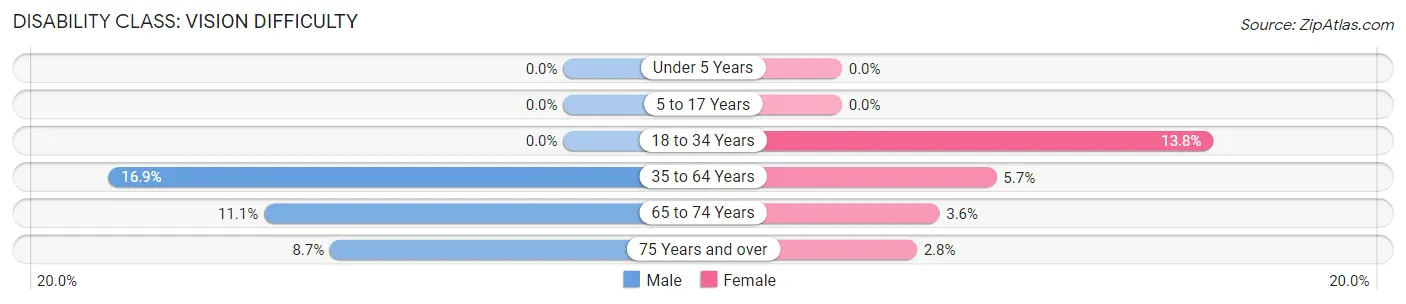
| Age Bracket | Male | Female |
| Under 5 Years | 0 (0.0%) | 0 (0.0%) |
| 5 to 17 Years | 0 (0.0%) | 0 (0.0%) |
| 18 to 34 Years | 0 (0.0%) | 158 (13.8%) |
| 35 to 64 Years | 213 (16.9%) | 98 (5.7%) |
| 65 to 74 Years | 37 (11.1%) | 13 (3.6%) |
| 75 Years and over | 22 (8.7%) | 7 (2.8%) |
Disability Class: Cognitive Difficulty
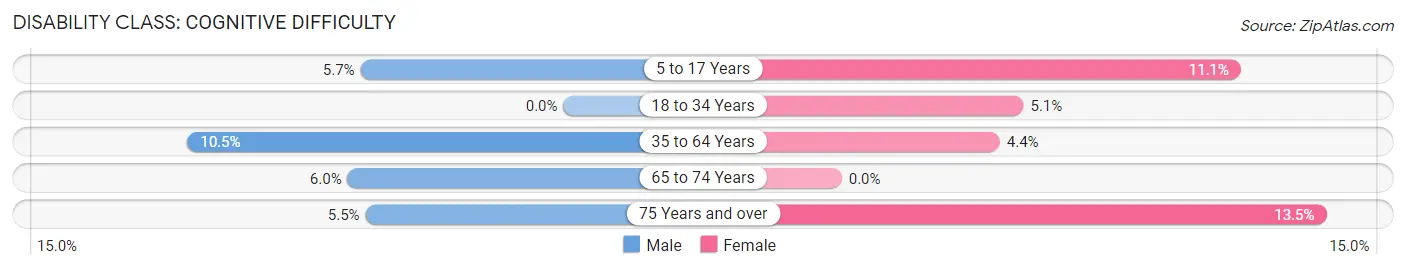
| Age Bracket | Male | Female |
| 5 to 17 Years | 41 (5.7%) | 75 (11.1%) |
| 18 to 34 Years | 0 (0.0%) | 58 (5.1%) |
| 35 to 64 Years | 132 (10.5%) | 75 (4.4%) |
| 65 to 74 Years | 20 (6.0%) | 0 (0.0%) |
| 75 Years and over | 14 (5.5%) | 34 (13.5%) |
Disability Class: Ambulatory Difficulty
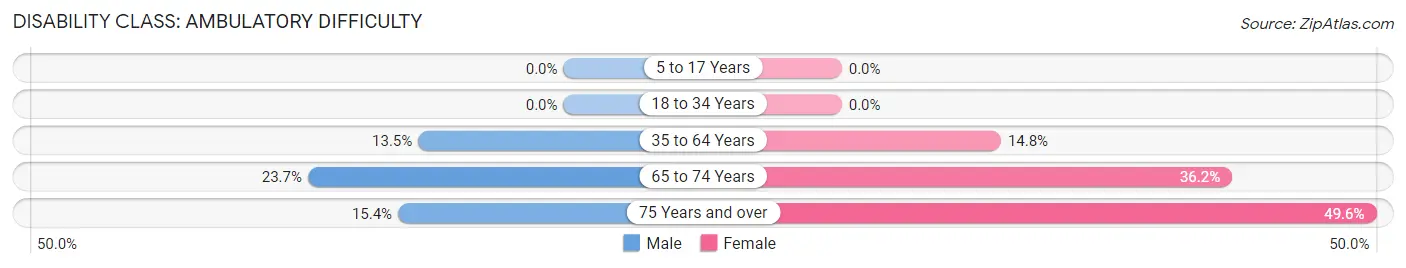
| Age Bracket | Male | Female |
| 5 to 17 Years | 0 (0.0%) | 0 (0.0%) |
| 18 to 34 Years | 0 (0.0%) | 0 (0.0%) |
| 35 to 64 Years | 170 (13.5%) | 252 (14.8%) |
| 65 to 74 Years | 79 (23.7%) | 130 (36.2%) |
| 75 Years and over | 39 (15.3%) | 125 (49.6%) |
Disability Class: Self-Care Difficulty
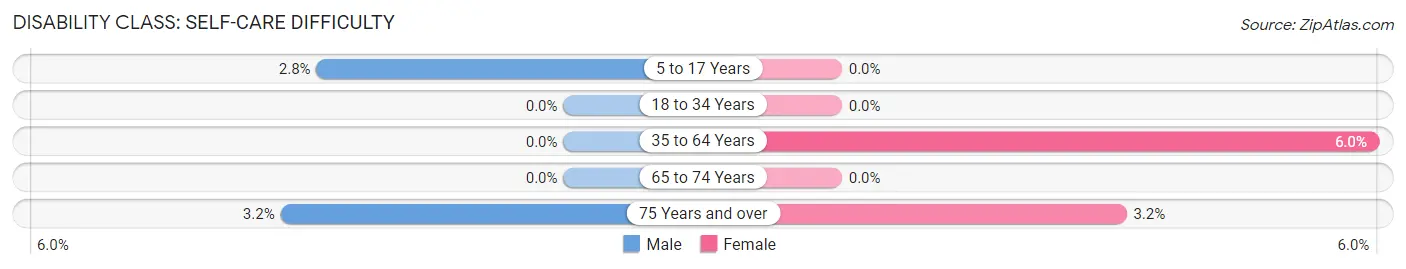
| Age Bracket | Male | Female |
| 5 to 17 Years | 20 (2.8%) | 0 (0.0%) |
| 18 to 34 Years | 0 (0.0%) | 0 (0.0%) |
| 35 to 64 Years | 0 (0.0%) | 102 (6.0%) |
| 65 to 74 Years | 0 (0.0%) | 0 (0.0%) |
| 75 Years and over | 8 (3.2%) | 8 (3.2%) |
Technology Access in Gulf Hills
Computing Device Access in Gulf Hills
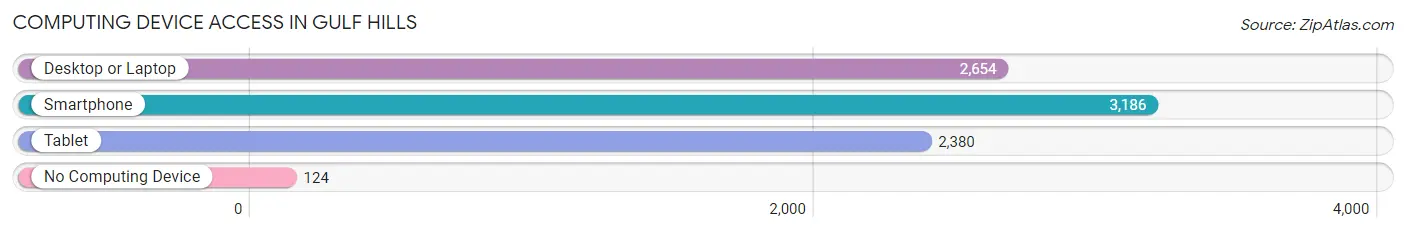
| Device Type | # Households | % Households |
| Desktop or Laptop | 2,654 | 79.2% |
| Smartphone | 3,186 | 95.1% |
| Tablet | 2,380 | 71.1% |
| No Computing Device | 124 | 3.7% |
| Total | 3,349 | 100.0% |
Internet Access in Gulf Hills
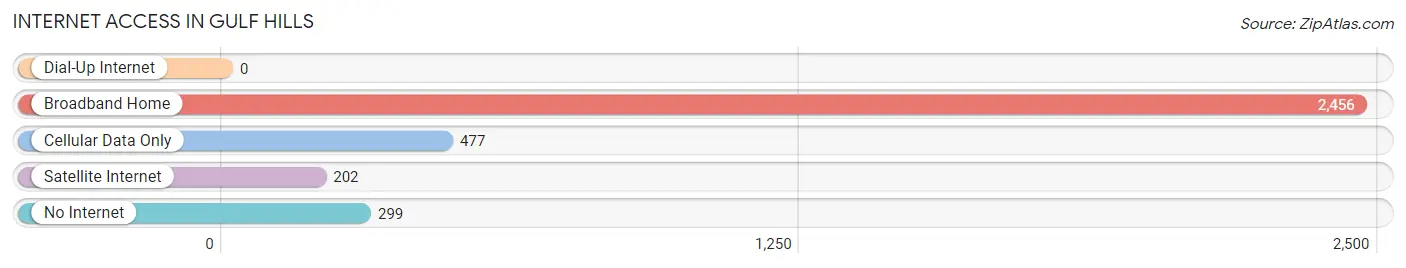
| Internet Type | # Households | % Households |
| Dial-Up Internet | 0 | 0.0% |
| Broadband Home | 2,456 | 73.3% |
| Cellular Data Only | 477 | 14.2% |
| Satellite Internet | 202 | 6.0% |
| No Internet | 299 | 8.9% |
| Total | 3,349 | 100.0% |
Gulf Hills Summary
Gulf Hills is a small unincorporated community located in Jackson County, Mississippi, United States. It is situated along the Gulf of Mexico, approximately 10 miles east of Ocean Springs. The community is part of the Pascagoula-Moss Point Metropolitan Statistical Area.
History
Gulf Hills was founded in the early 1900s by a group of settlers from the nearby town of Ocean Springs. The settlers were attracted to the area due to its proximity to the Gulf of Mexico and its abundance of natural resources. The community was originally known as “Gulf Hill” and was later changed to “Gulf Hills”.
The first settlers of Gulf Hills were primarily fishermen and farmers. They built small homes and cabins along the shoreline and began to cultivate the land. The community grew slowly but steadily over the years and by the mid-1900s, it had become a popular vacation destination for tourists from all over the country.
Geography
Gulf Hills is located in Jackson County, Mississippi, approximately 10 miles east of Ocean Springs. The community is situated along the Gulf of Mexico and is bordered by the cities of Pascagoula and Moss Point. The area is characterized by its flat terrain and sandy beaches.
The climate in Gulf Hills is subtropical, with hot, humid summers and mild winters. The average temperature in the summer months is around 80 degrees Fahrenheit, while the average temperature in the winter months is around 60 degrees Fahrenheit.
Economy
Gulf Hills is primarily a residential community, with most of its residents employed in the nearby cities of Pascagoula and Moss Point. The community does not have any major industries or businesses, but there are several small businesses located in the area, including restaurants, convenience stores, and a few retail stores.
The local economy is largely dependent on tourism, as the area is a popular destination for beachgoers and fishermen. The community also benefits from its proximity to the Gulf of Mexico, as it is home to several marinas and boat docks.
Demographics
As of the 2010 census, the population of Gulf Hills was 1,845. The racial makeup of the community was 94.3% White, 2.2% African American, 0.7% Native American, 0.3% Asian, 0.1% Pacific Islander, and 2.4% from other races. The median household income was $45,938, and the median family income was $50,938.
Conclusion
Gulf Hills is a small unincorporated community located in Jackson County, Mississippi, United States. It is situated along the Gulf of Mexico, approximately 10 miles east of Ocean Springs. The community is primarily a residential area, with most of its residents employed in the nearby cities of Pascagoula and Moss Point. The local economy is largely dependent on tourism, as the area is a popular destination for beachgoers and fishermen. As of the 2010 census, the population of Gulf Hills was 1,845. The racial makeup of the community was 94.3% White, 2.2% African American, 0.7% Native American, 0.3% Asian, 0.1% Pacific Islander, and 2.4% from other races.
Common Questions
What is Per Capita Income in Gulf Hills?
Per Capita income in Gulf Hills is $28,202.
What is the Median Family Income in Gulf Hills?
Median Family Income in Gulf Hills is $60,352.
What is the Median Household income in Gulf Hills?
Median Household Income in Gulf Hills is $61,094.
What is Income or Wage Gap in Gulf Hills?
Income or Wage Gap in Gulf Hills is 15.0%.
Women in Gulf Hills earn 85.0 cents for every dollar earned by a man.
What is Family Income Deficit in Gulf Hills?
Family Income Deficit in Gulf Hills is $15,649.
Families that are below poverty line in Gulf Hills earn $15,649 less on average than the poverty threshold level.
What is Inequality or Gini Index in Gulf Hills?
Inequality or Gini Index in Gulf Hills is 0.41.
What is the Total Population of Gulf Hills?
Total Population of Gulf Hills is 8,647.
What is the Total Male Population of Gulf Hills?
Total Male Population of Gulf Hills is 4,168.
What is the Total Female Population of Gulf Hills?
Total Female Population of Gulf Hills is 4,479.
What is the Ratio of Males per 100 Females in Gulf Hills?
There are 93.06 Males per 100 Females in Gulf Hills.
What is the Ratio of Females per 100 Males in Gulf Hills?
There are 107.46 Females per 100 Males in Gulf Hills.
What is the Median Population Age in Gulf Hills?
Median Population Age in Gulf Hills is 33.6 Years.
What is the Average Family Size in Gulf Hills
Average Family Size in Gulf Hills is 3.0 People.
What is the Average Household Size in Gulf Hills
Average Household Size in Gulf Hills is 2.6 People.
How Large is the Labor Force in Gulf Hills?
There are 4,774 People in the Labor Forcein in Gulf Hills.
What is the Percentage of People in the Labor Force in Gulf Hills?
69.8% of People are in the Labor Force in Gulf Hills.
What is the Unemployment Rate in Gulf Hills?
Unemployment Rate in Gulf Hills is 4.5%.