Starkville, MS Map & Demographics
Starkville Map
Starkville Overview
$31,354
PER CAPITA INCOME
$76,807
AVG FAMILY INCOME
$36,076
AVG HOUSEHOLD INCOME
20.8%
WAGE / INCOME GAP [ % ]
79.2¢/ $1
WAGE / INCOME GAP [ $ ]
$11,564
FAMILY INCOME DEFICIT
0.59
INEQUALITY / GINI INDEX
24,274
TOTAL POPULATION
12,648
MALE POPULATION
11,626
FEMALE POPULATION
108.79
MALES / 100 FEMALES
91.92
FEMALES / 100 MALES
27.0
MEDIAN AGE
2.9
AVG FAMILY SIZE
2.1
AVG HOUSEHOLD SIZE
12,510
LABOR FORCE [ PEOPLE ]
61.3%
PERCENT IN LABOR FORCE
7.9%
UNEMPLOYMENT RATE
Starkville Zip Codes
Starkville Area Codes
Income in Starkville
Income Overview in Starkville
Per Capita Income in Starkville is $31,354, while median incomes of families and households are $76,807 and $36,076 respectively.
| Characteristic | Number | Measure |
| Per Capita Income | 24,274 | $31,354 |
| Median Family Income | 4,895 | $76,807 |
| Mean Family Income | 4,895 | $99,010 |
| Median Household Income | 10,875 | $36,076 |
| Mean Household Income | 10,875 | $68,571 |
| Income Deficit | 4,895 | $11,564 |
| Wage / Income Gap (%) | 24,274 | 20.85% |
| Wage / Income Gap ($) | 24,274 | 79.15¢ per $1 |
| Gini / Inequality Index | 24,274 | 0.59 |
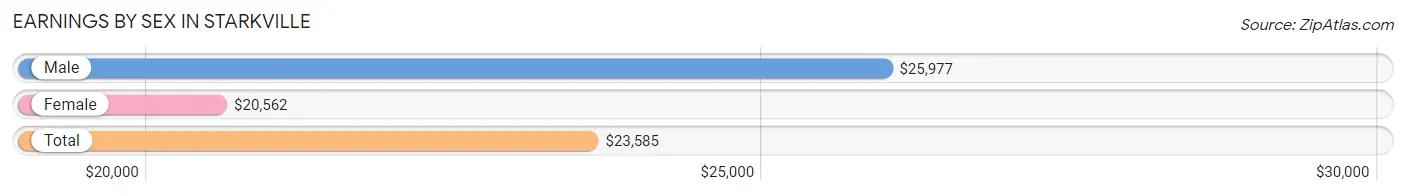
Earnings by Sex in Starkville
Average Earnings in Starkville are $23,585, $25,977 for men and $20,562 for women, a difference of 20.8%.
| Sex | Number | Average Earnings |
| Male | 7,708 (56.9%) | $25,977 |
| Female | 5,834 (43.1%) | $20,562 |
| Total | 13,542 (100.0%) | $23,585 |
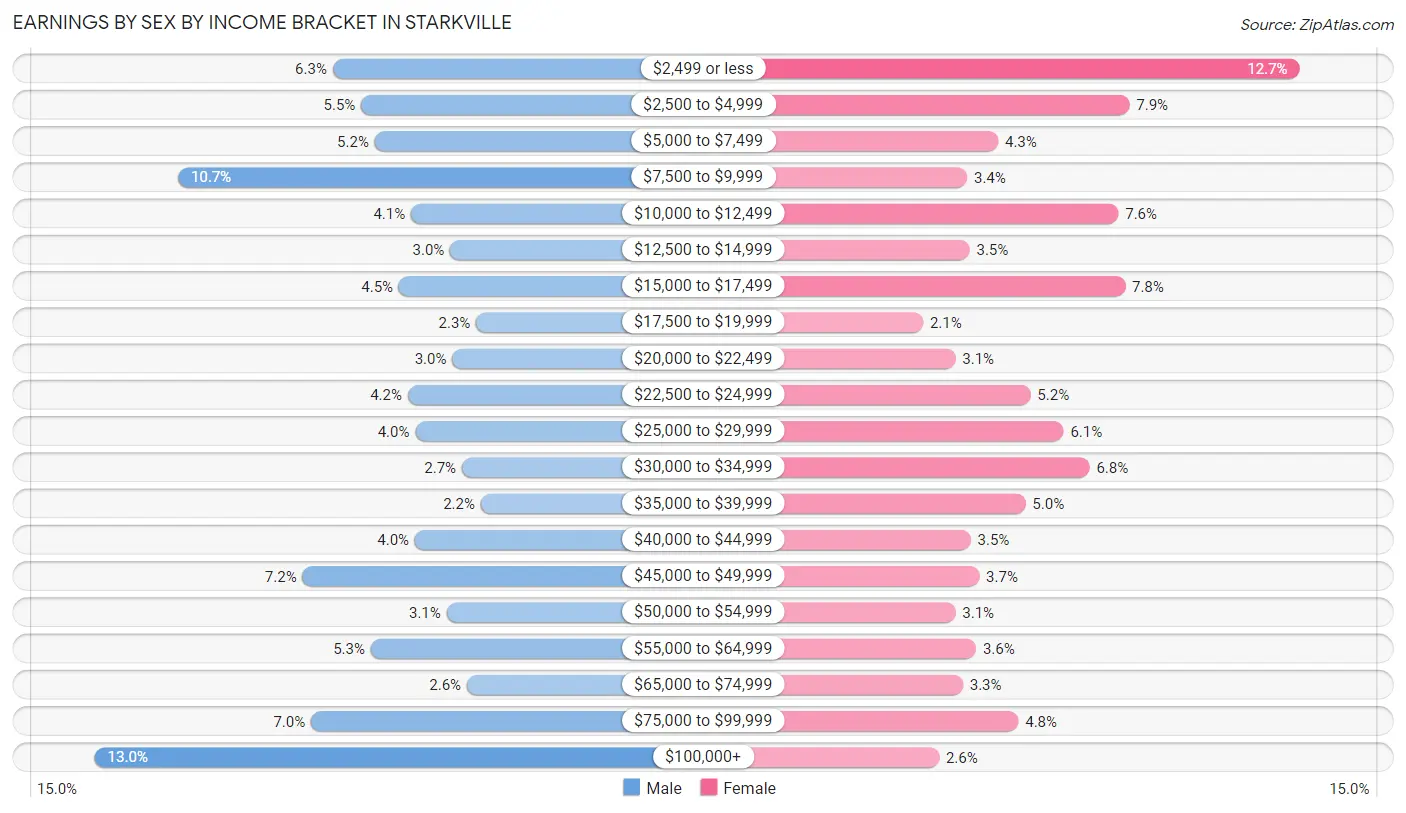
Earnings by Sex by Income Bracket in Starkville
The most common earnings brackets in Starkville are $100,000+ for men (1,004 | 13.0%) and $2,499 or less for women (742 | 12.7%).
| Income | Male | Female |
| $2,499 or less | 489 (6.3%) | 742 (12.7%) |
| $2,500 to $4,999 | 427 (5.5%) | 463 (7.9%) |
| $5,000 to $7,499 | 398 (5.2%) | 248 (4.3%) |
| $7,500 to $9,999 | 824 (10.7%) | 197 (3.4%) |
| $10,000 to $12,499 | 319 (4.1%) | 445 (7.6%) |
| $12,500 to $14,999 | 234 (3.0%) | 201 (3.5%) |
| $15,000 to $17,499 | 345 (4.5%) | 456 (7.8%) |
| $17,500 to $19,999 | 178 (2.3%) | 125 (2.1%) |
| $20,000 to $22,499 | 230 (3.0%) | 178 (3.0%) |
| $22,500 to $24,999 | 326 (4.2%) | 301 (5.2%) |
| $25,000 to $29,999 | 310 (4.0%) | 355 (6.1%) |
| $30,000 to $34,999 | 209 (2.7%) | 398 (6.8%) |
| $35,000 to $39,999 | 168 (2.2%) | 293 (5.0%) |
| $40,000 to $44,999 | 311 (4.0%) | 203 (3.5%) |
| $45,000 to $49,999 | 554 (7.2%) | 217 (3.7%) |
| $50,000 to $54,999 | 242 (3.1%) | 178 (3.0%) |
| $55,000 to $64,999 | 406 (5.3%) | 212 (3.6%) |
| $65,000 to $74,999 | 198 (2.6%) | 190 (3.3%) |
| $75,000 to $99,999 | 536 (7.0%) | 281 (4.8%) |
| $100,000+ | 1,004 (13.0%) | 151 (2.6%) |
| Total | 7,708 (100.0%) | 5,834 (100.0%) |
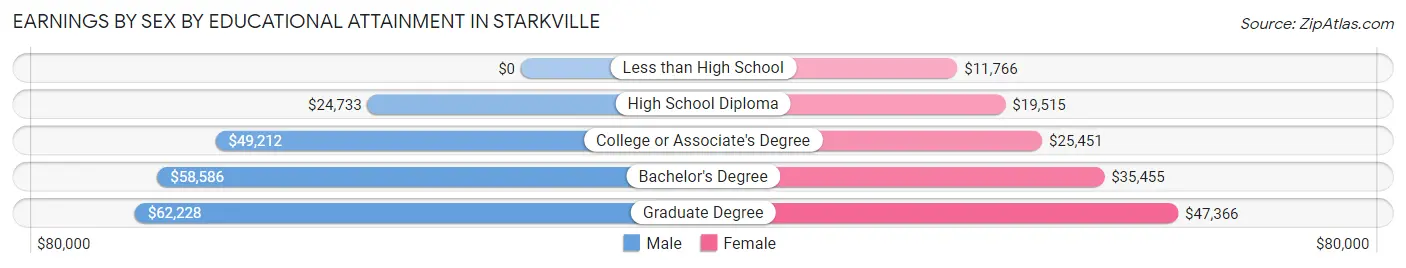
Earnings by Sex by Educational Attainment in Starkville
Average earnings in Starkville are $49,920 for men and $30,685 for women, a difference of 38.5%. Men with an educational attainment of graduate degree enjoy the highest average annual earnings of $62,228, while those with high school diploma education earn the least with $24,733. Women with an educational attainment of graduate degree earn the most with the average annual earnings of $47,366, while those with less than high school education have the smallest earnings of $11,766.
| Educational Attainment | Male Income | Female Income |
| Less than High School | - | - |
| High School Diploma | $24,733 | $19,515 |
| College or Associate's Degree | $49,212 | $25,451 |
| Bachelor's Degree | $58,586 | $35,455 |
| Graduate Degree | $62,228 | $47,366 |
| Total | $49,920 | $30,685 |
Family Income in Starkville
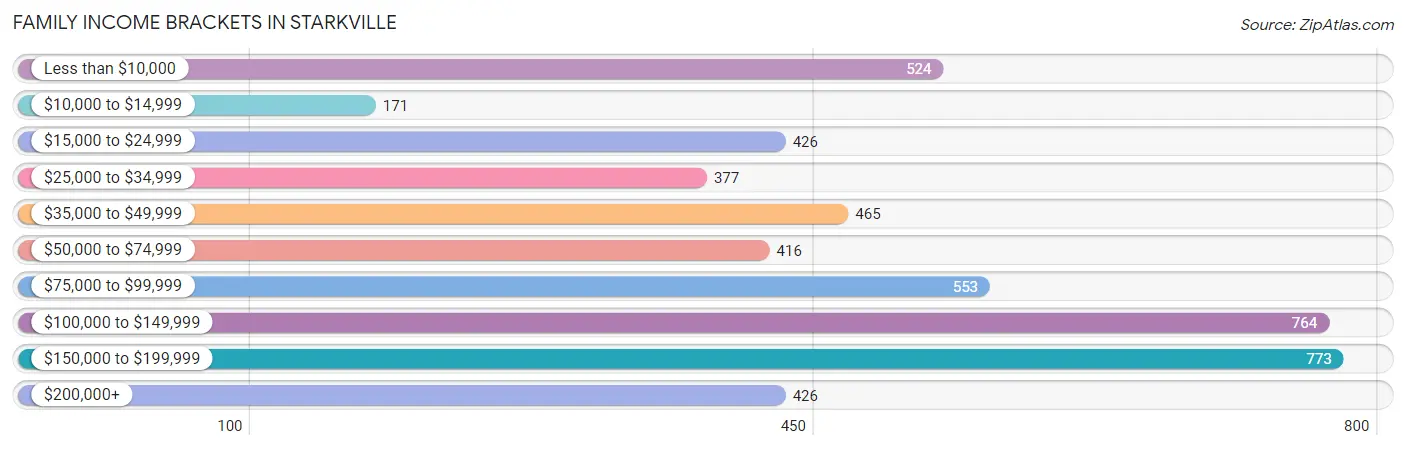
Family Income Brackets in Starkville
According to the Starkville family income data, there are 773 families falling into the $150,000 to $199,999 income range, which is the most common income bracket and makes up 15.8% of all families. Conversely, the $10,000 to $14,999 income bracket is the least frequent group with only 171 families (3.5%) belonging to this category.
| Income Bracket | # Families | % Families |
| Less than $10,000 | 524 | 10.7% |
| $10,000 to $14,999 | 171 | 3.5% |
| $15,000 to $24,999 | 426 | 8.7% |
| $25,000 to $34,999 | 377 | 7.7% |
| $35,000 to $49,999 | 465 | 9.5% |
| $50,000 to $74,999 | 416 | 8.5% |
| $75,000 to $99,999 | 553 | 11.3% |
| $100,000 to $149,999 | 764 | 15.6% |
| $150,000 to $199,999 | 773 | 15.8% |
| $200,000+ | 426 | 8.7% |
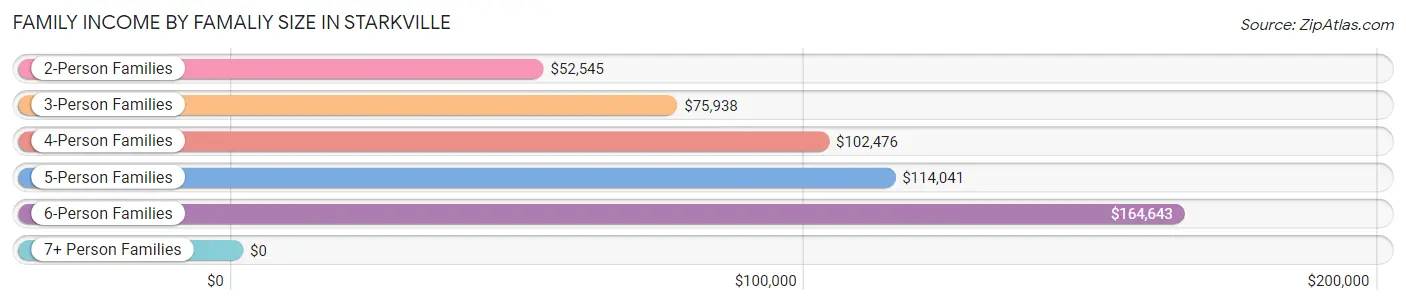
Family Income by Famaliy Size in Starkville
6-person families (74 | 1.5%) account for the highest median family income in Starkville with $164,643 per family, while 6-person families (74 | 1.5%) have the highest median income of $27,440 per family member.
| Income Bracket | # Families | Median Income |
| 2-Person Families | 2,703 (55.2%) | $52,545 |
| 3-Person Families | 1,008 (20.6%) | $75,938 |
| 4-Person Families | 803 (16.4%) | $102,476 |
| 5-Person Families | 263 (5.4%) | $114,041 |
| 6-Person Families | 74 (1.5%) | $164,643 |
| 7+ Person Families | 44 (0.9%) | $0 |
| Total | 4,895 (100.0%) | $76,807 |
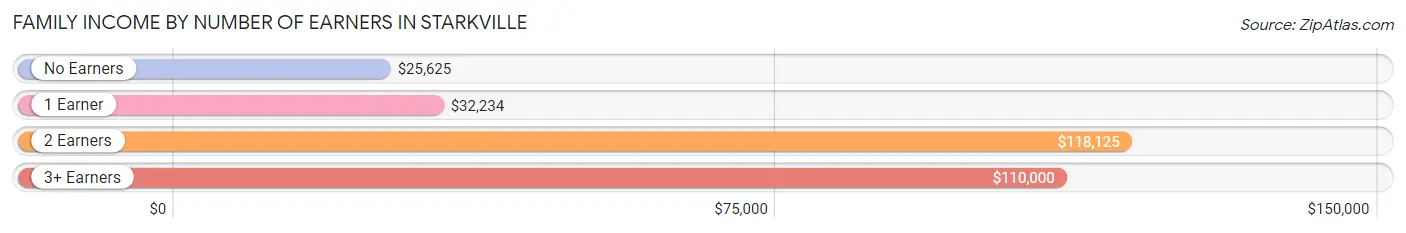
Family Income by Number of Earners in Starkville
The median family income in Starkville is $76,807, with families comprising 2 earners (2,059) having the highest median family income of $118,125, while families with no earners (1,119) have the lowest median family income of $25,625, accounting for 42.1% and 22.9% of families, respectively.
| Number of Earners | # Families | Median Income |
| No Earners | 1,119 (22.9%) | $25,625 |
| 1 Earner | 1,381 (28.2%) | $32,234 |
| 2 Earners | 2,059 (42.1%) | $118,125 |
| 3+ Earners | 336 (6.9%) | $110,000 |
| Total | 4,895 (100.0%) | $76,807 |
Household Income in Starkville
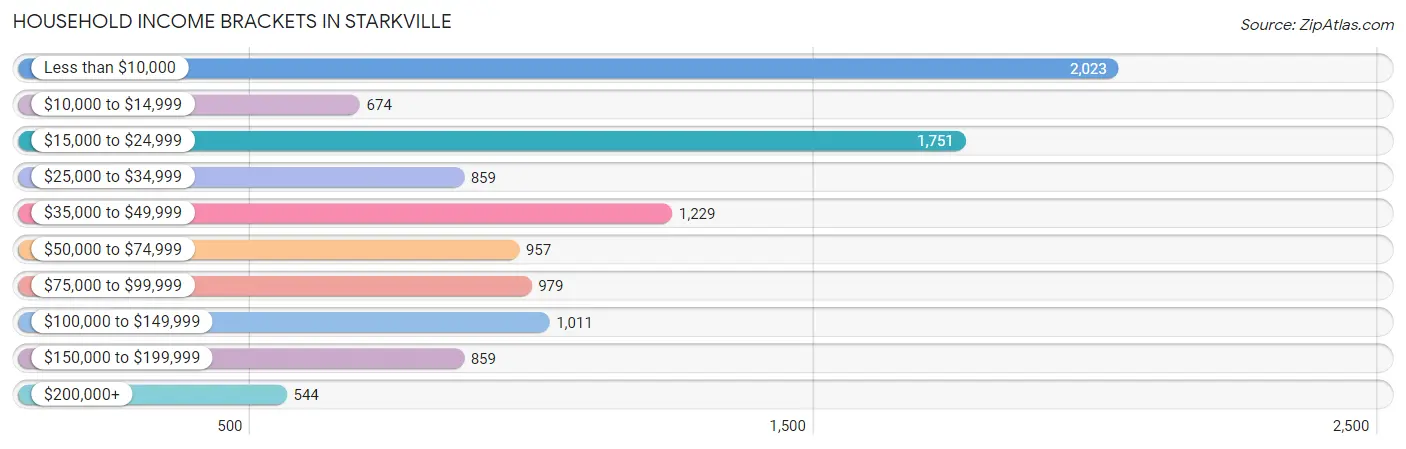
Household Income Brackets in Starkville
With 2,023 households falling in the category, the less than $10,000 income range is the most frequent in Starkville, accounting for 18.6% of all households. In contrast, only 544 households (5.0%) fall into the $200,000+ income bracket, making it the least populous group.
| Income Bracket | # Households | % Households |
| Less than $10,000 | 2,023 | 18.6% |
| $10,000 to $14,999 | 674 | 6.2% |
| $15,000 to $24,999 | 1,751 | 16.1% |
| $25,000 to $34,999 | 859 | 7.9% |
| $35,000 to $49,999 | 1,229 | 11.3% |
| $50,000 to $74,999 | 957 | 8.8% |
| $75,000 to $99,999 | 979 | 9.0% |
| $100,000 to $149,999 | 1,011 | 9.3% |
| $150,000 to $199,999 | 859 | 7.9% |
| $200,000+ | 544 | 5.0% |
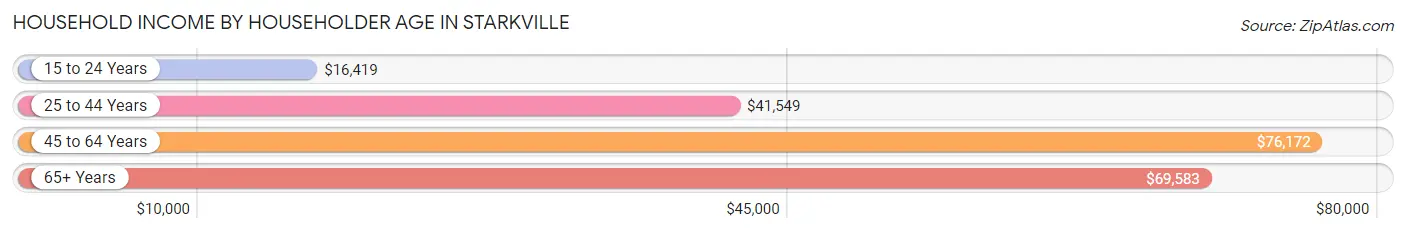
Household Income by Householder Age in Starkville
The median household income in Starkville is $36,076, with the highest median household income of $76,172 found in the 45 to 64 years age bracket for the primary householder. A total of 2,351 households (21.6%) fall into this category. Meanwhile, the 15 to 24 years age bracket for the primary householder has the lowest median household income of $16,419, with 2,964 households (27.3%) in this group.
| Income Bracket | # Households | Median Income |
| 15 to 24 Years | 2,964 (27.3%) | $16,419 |
| 25 to 44 Years | 3,899 (35.8%) | $41,549 |
| 45 to 64 Years | 2,351 (21.6%) | $76,172 |
| 65+ Years | 1,661 (15.3%) | $69,583 |
| Total | 10,875 (100.0%) | $36,076 |
Poverty in Starkville
Income Below Poverty by Sex and Age in Starkville
With 30.8% poverty level for males and 30.4% for females among the residents of Starkville, 18 to 24 year old males and 5 year old females are the most vulnerable to poverty, with 2,329 males (62.6%) and 136 females (95.8%) in their respective age groups living below the poverty level.
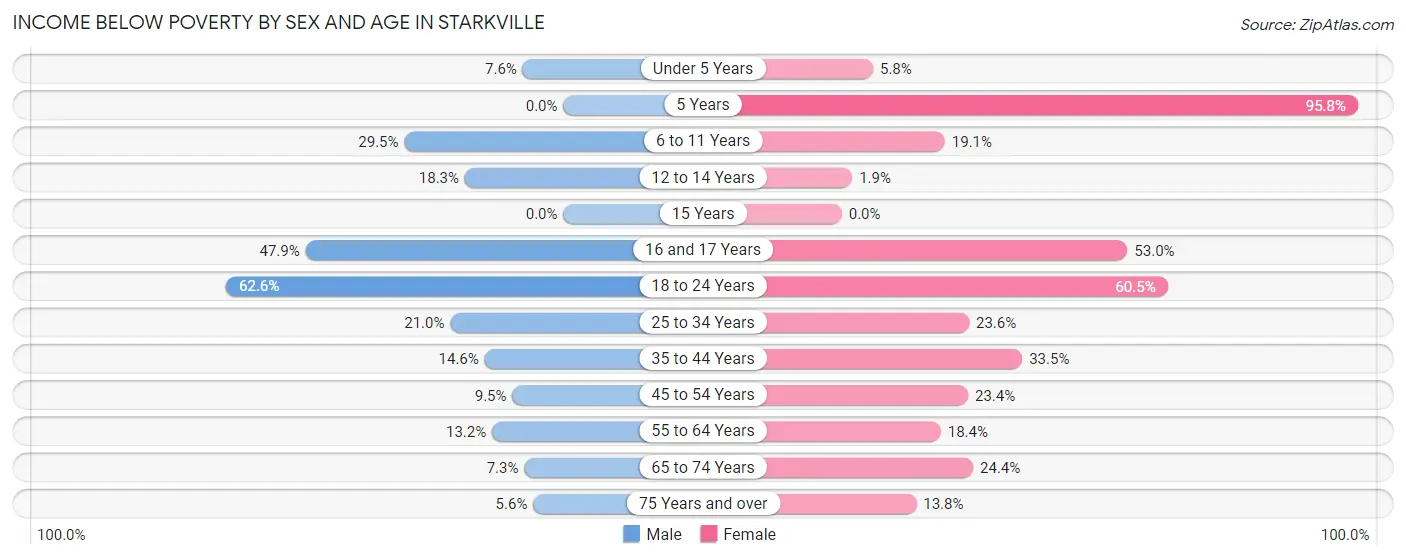
| Age Bracket | Male | Female |
| Under 5 Years | 41 (7.5%) | 22 (5.8%) |
| 5 Years | 0 (0.0%) | 136 (95.8%) |
| 6 to 11 Years | 255 (29.5%) | 140 (19.1%) |
| 12 to 14 Years | 113 (18.3%) | 6 (1.9%) |
| 15 Years | 0 (0.0%) | 0 (0.0%) |
| 16 and 17 Years | 123 (47.9%) | 141 (53.0%) |
| 18 to 24 Years | 2,329 (62.6%) | 1,212 (60.5%) |
| 25 to 34 Years | 401 (21.0%) | 431 (23.6%) |
| 35 to 44 Years | 209 (14.6%) | 513 (33.5%) |
| 45 to 54 Years | 76 (9.5%) | 235 (23.4%) |
| 55 to 64 Years | 104 (13.2%) | 187 (18.4%) |
| 65 to 74 Years | 35 (7.2%) | 195 (24.4%) |
| 75 Years and over | 25 (5.6%) | 126 (13.8%) |
| Total | 3,711 (30.8%) | 3,344 (30.4%) |
Income Above Poverty by Sex and Age in Starkville
According to the poverty statistics in Starkville, males aged 5 years and females aged 15 years are the age groups that are most secure financially, with 100.0% of males and 100.0% of females in these age groups living above the poverty line.
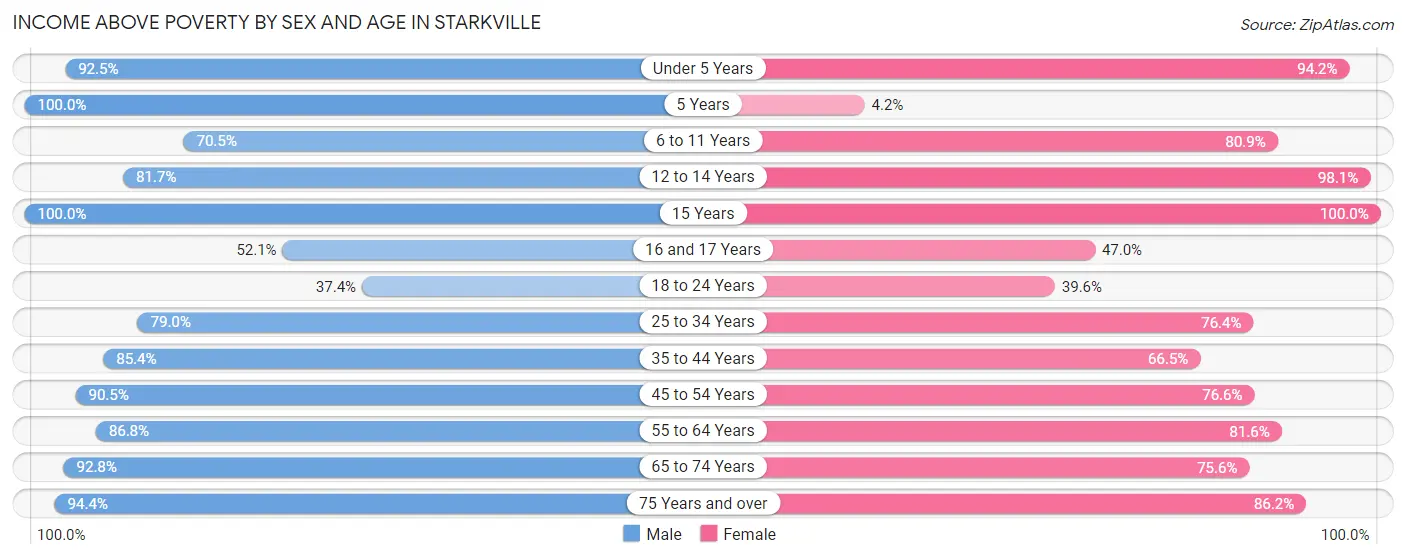
| Age Bracket | Male | Female |
| Under 5 Years | 502 (92.4%) | 357 (94.2%) |
| 5 Years | 142 (100.0%) | 6 (4.2%) |
| 6 to 11 Years | 609 (70.5%) | 592 (80.9%) |
| 12 to 14 Years | 505 (81.7%) | 304 (98.1%) |
| 15 Years | 33 (100.0%) | 58 (100.0%) |
| 16 and 17 Years | 134 (52.1%) | 125 (47.0%) |
| 18 to 24 Years | 1,391 (37.4%) | 793 (39.6%) |
| 25 to 34 Years | 1,510 (79.0%) | 1,394 (76.4%) |
| 35 to 44 Years | 1,222 (85.4%) | 1,019 (66.5%) |
| 45 to 54 Years | 727 (90.5%) | 768 (76.6%) |
| 55 to 64 Years | 682 (86.8%) | 831 (81.6%) |
| 65 to 74 Years | 448 (92.7%) | 605 (75.6%) |
| 75 Years and over | 422 (94.4%) | 786 (86.2%) |
| Total | 8,327 (69.2%) | 7,638 (69.6%) |
Income Below Poverty Among Married-Couple Families in Starkville
The poverty statistics for married-couple families in Starkville show that 8.2% or 278 of the total 3,380 families live below the poverty line. Families with 3 or 4 children have the highest poverty rate of 13.3%, comprising of 36 families. On the other hand, families with 5 or more children have the lowest poverty rate of 0.0%, which includes 0 families.
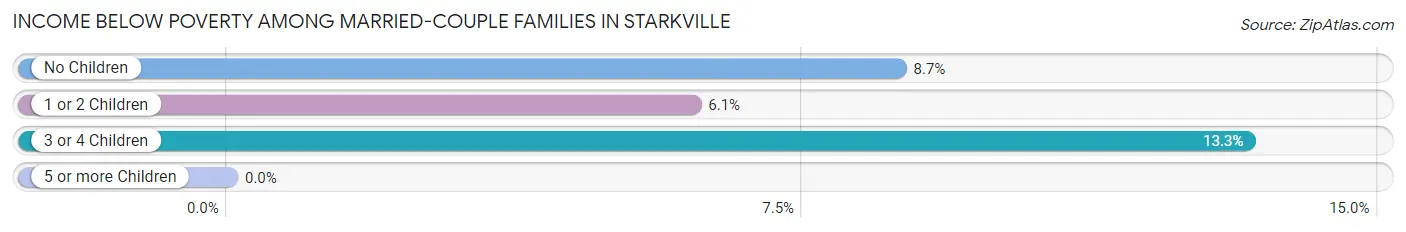
| Children | Above Poverty | Below Poverty |
| No Children | 1,860 (91.3%) | 178 (8.7%) |
| 1 or 2 Children | 994 (94.0%) | 64 (6.0%) |
| 3 or 4 Children | 235 (86.7%) | 36 (13.3%) |
| 5 or more Children | 13 (100.0%) | 0 (0.0%) |
| Total | 3,102 (91.8%) | 278 (8.2%) |
Income Below Poverty Among Single-Parent Households in Starkville
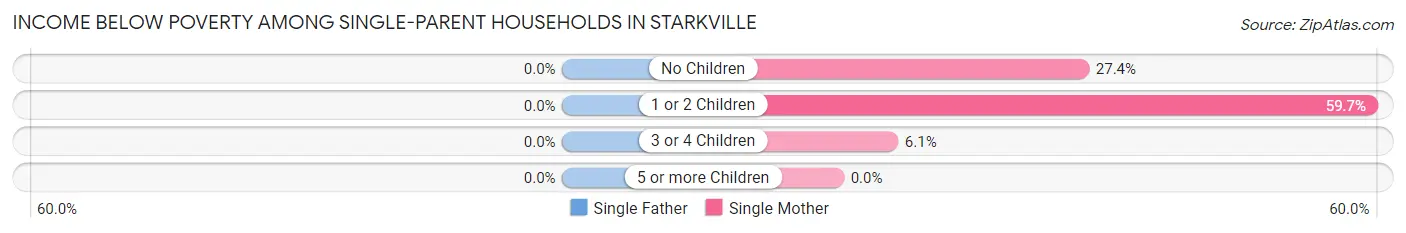
| Children | Single Father | Single Mother |
| No Children | 0 (0.0%) | 114 (27.4%) |
| 1 or 2 Children | 0 (0.0%) | 533 (59.7%) |
| 3 or 4 Children | 0 (0.0%) | 2 (6.1%) |
| 5 or more Children | 0 (0.0%) | 0 (0.0%) |
| Total | 0 (0.0%) | 649 (48.4%) |
Income Below Poverty Among Married-Couple vs Single-Parent Households in Starkville
The poverty data for Starkville shows that 278 of the married-couple family households (8.2%) and 649 of the single-parent households (42.8%) are living below the poverty level. Within the married-couple family households, those with 3 or 4 children have the highest poverty rate, with 36 households (13.3%) falling below the poverty line. Among the single-parent households, those with 1 or 2 children have the highest poverty rate, with 533 household (56.9%) living below poverty.
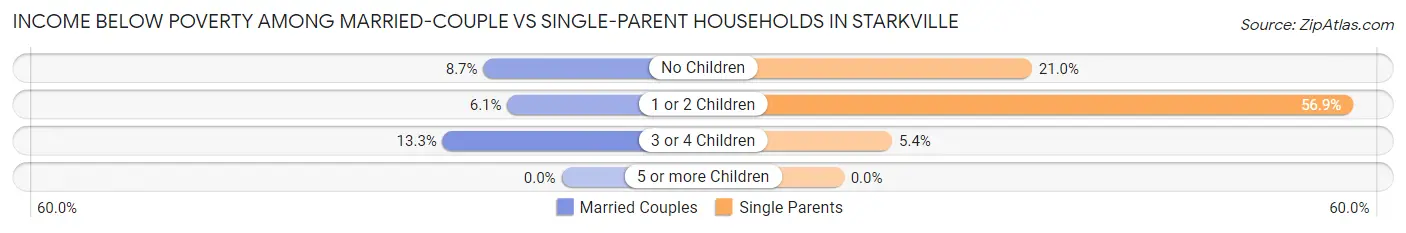
| Children | Married-Couple Families | Single-Parent Households |
| No Children | 178 (8.7%) | 114 (21.0%) |
| 1 or 2 Children | 64 (6.0%) | 533 (56.9%) |
| 3 or 4 Children | 36 (13.3%) | 2 (5.4%) |
| 5 or more Children | 0 (0.0%) | 0 (0.0%) |
| Total | 278 (8.2%) | 649 (42.8%) |
Race in Starkville
The most populous races in Starkville are White / Caucasian (14,406 | 59.4%), Black / African American (8,252 | 34.0%), and Asian (923 | 3.8%).
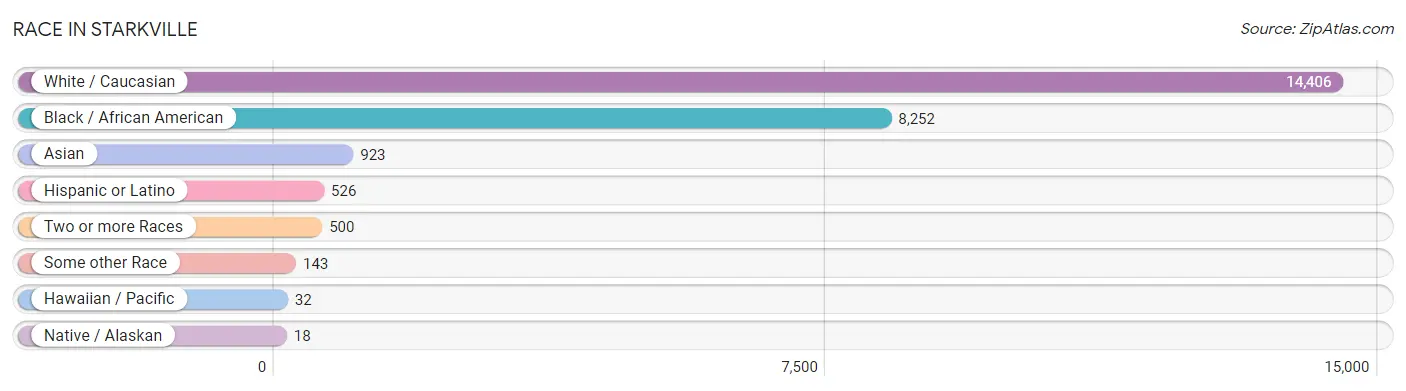
| Race | # Population | % Population |
| Asian | 923 | 3.8% |
| Black / African American | 8,252 | 34.0% |
| Hawaiian / Pacific | 32 | 0.1% |
| Hispanic or Latino | 526 | 2.2% |
| Native / Alaskan | 18 | 0.1% |
| White / Caucasian | 14,406 | 59.4% |
| Two or more Races | 500 | 2.1% |
| Some other Race | 143 | 0.6% |
| Total | 24,274 | 100.0% |
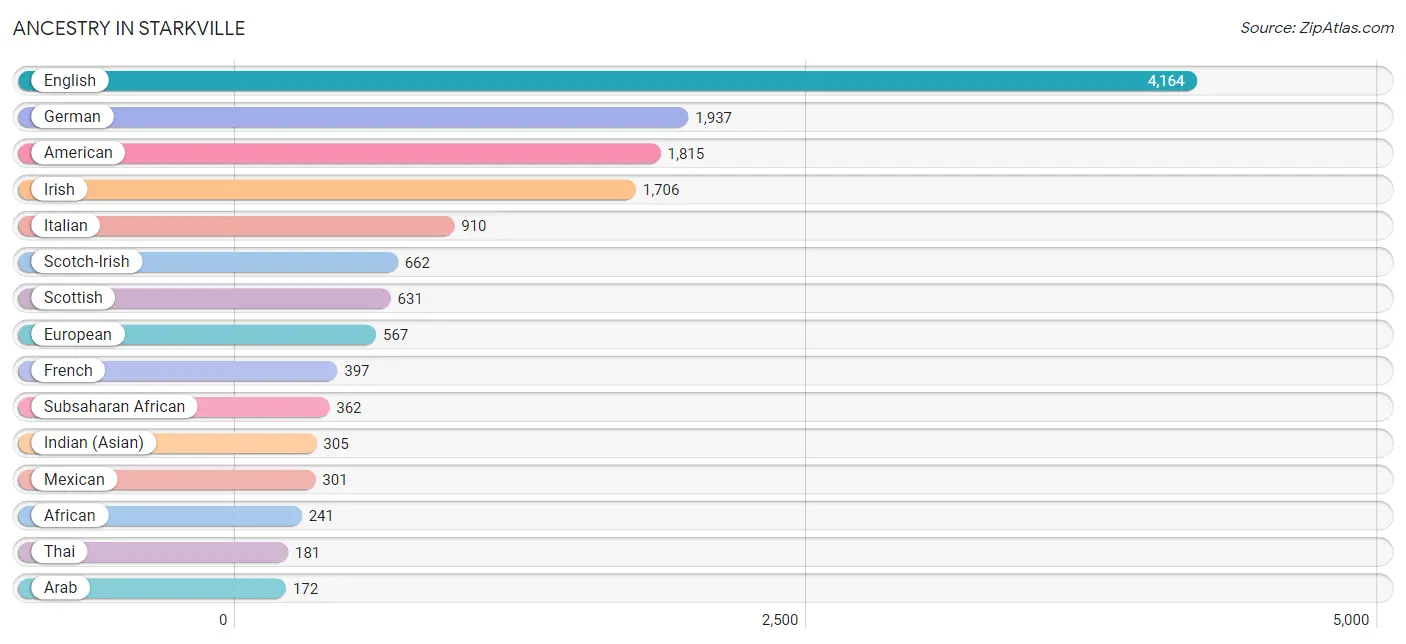
Ancestry in Starkville
The most populous ancestries reported in Starkville are English (4,164 | 17.2%), German (1,937 | 8.0%), American (1,815 | 7.5%), Irish (1,706 | 7.0%), and Italian (910 | 3.7%), together accounting for 43.4% of all Starkville residents.
| Ancestry | # Population | % Population |
| African | 241 | 1.0% |
| Alsatian | 19 | 0.1% |
| American | 1,815 | 7.5% |
| Arab | 172 | 0.7% |
| Austrian | 14 | 0.1% |
| Bhutanese | 11 | 0.1% |
| Brazilian | 8 | 0.0% |
| British | 166 | 0.7% |
| Burmese | 81 | 0.3% |
| Canadian | 29 | 0.1% |
| Celtic | 8 | 0.0% |
| Central American | 39 | 0.2% |
| Cherokee | 23 | 0.1% |
| Choctaw | 51 | 0.2% |
| Colombian | 58 | 0.2% |
| Croatian | 25 | 0.1% |
| Cuban | 57 | 0.2% |
| Czech | 16 | 0.1% |
| Danish | 13 | 0.1% |
| Dutch | 92 | 0.4% |
| Ecuadorian | 10 | 0.0% |
| English | 4,164 | 17.2% |
| Ethiopian | 32 | 0.1% |
| European | 567 | 2.3% |
| Fijian | 16 | 0.1% |
| Filipino | 80 | 0.3% |
| French | 397 | 1.6% |
| French Canadian | 47 | 0.2% |
| German | 1,937 | 8.0% |
| Greek | 111 | 0.5% |
| Guatemalan | 3 | 0.0% |
| Honduran | 36 | 0.2% |
| Hungarian | 90 | 0.4% |
| Indian (Asian) | 305 | 1.3% |
| Iranian | 10 | 0.0% |
| Irish | 1,706 | 7.0% |
| Italian | 910 | 3.7% |
| Jamaican | 9 | 0.0% |
| Korean | 81 | 0.3% |
| Latvian | 10 | 0.0% |
| Lebanese | 172 | 0.7% |
| Mexican | 301 | 1.2% |
| Mexican American Indian | 5 | 0.0% |
| Mongolian | 43 | 0.2% |
| Nigerian | 89 | 0.4% |
| Northern European | 17 | 0.1% |
| Norwegian | 72 | 0.3% |
| Pakistani | 18 | 0.1% |
| Peruvian | 10 | 0.0% |
| Polish | 105 | 0.4% |
| Portuguese | 12 | 0.1% |
| Puerto Rican | 19 | 0.1% |
| Russian | 74 | 0.3% |
| Samoan | 31 | 0.1% |
| Scandinavian | 129 | 0.5% |
| Scotch-Irish | 662 | 2.7% |
| Scottish | 631 | 2.6% |
| Slovak | 23 | 0.1% |
| South American | 99 | 0.4% |
| Spanish | 11 | 0.1% |
| Sri Lankan | 134 | 0.5% |
| Subsaharan African | 362 | 1.5% |
| Swedish | 166 | 0.7% |
| Swiss | 7 | 0.0% |
| Thai | 181 | 0.7% |
| Turkish | 17 | 0.1% |
| Ukrainian | 23 | 0.1% |
| Venezuelan | 21 | 0.1% |
| Vietnamese | 67 | 0.3% |
| Welsh | 60 | 0.3% | View All 70 Rows |
Immigrants in Starkville
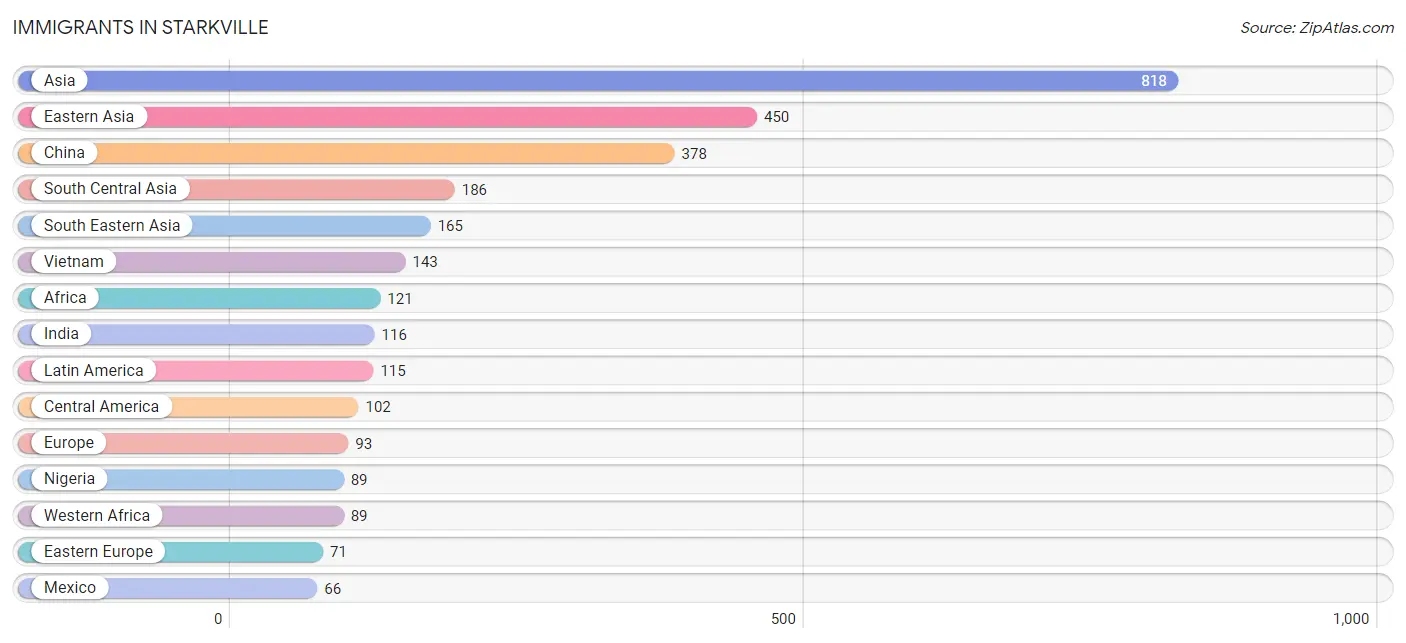
The most numerous immigrant groups reported in Starkville came from Asia (818 | 3.4%), Eastern Asia (450 | 1.8%), China (378 | 1.6%), South Central Asia (186 | 0.8%), and South Eastern Asia (165 | 0.7%), together accounting for 8.2% of all Starkville residents.
| Immigration Origin | # Population | % Population |
| Africa | 121 | 0.5% |
| Asia | 818 | 3.4% |
| Bangladesh | 29 | 0.1% |
| Brazil | 4 | 0.0% |
| Canada | 28 | 0.1% |
| Caribbean | 9 | 0.0% |
| Central America | 102 | 0.4% |
| China | 378 | 1.6% |
| Czechoslovakia | 30 | 0.1% |
| Eastern Africa | 32 | 0.1% |
| Eastern Asia | 450 | 1.8% |
| Eastern Europe | 71 | 0.3% |
| Ethiopia | 32 | 0.1% |
| Europe | 93 | 0.4% |
| Germany | 22 | 0.1% |
| Honduras | 29 | 0.1% |
| India | 116 | 0.5% |
| Iran | 10 | 0.0% |
| Jamaica | 9 | 0.0% |
| Japan | 11 | 0.1% |
| Korea | 61 | 0.3% |
| Latin America | 115 | 0.5% |
| Mexico | 66 | 0.3% |
| Nepal | 31 | 0.1% |
| Nicaragua | 7 | 0.0% |
| Nigeria | 89 | 0.4% |
| Oceania | 3 | 0.0% |
| Philippines | 22 | 0.1% |
| Poland | 15 | 0.1% |
| Russia | 7 | 0.0% |
| South America | 4 | 0.0% |
| South Central Asia | 186 | 0.8% |
| South Eastern Asia | 165 | 0.7% |
| Taiwan | 47 | 0.2% |
| Turkey | 17 | 0.1% |
| Ukraine | 19 | 0.1% |
| Vietnam | 143 | 0.6% |
| Western Africa | 89 | 0.4% |
| Western Asia | 17 | 0.1% |
| Western Europe | 22 | 0.1% | View All 40 Rows |
Sex and Age in Starkville
Sex and Age in Starkville
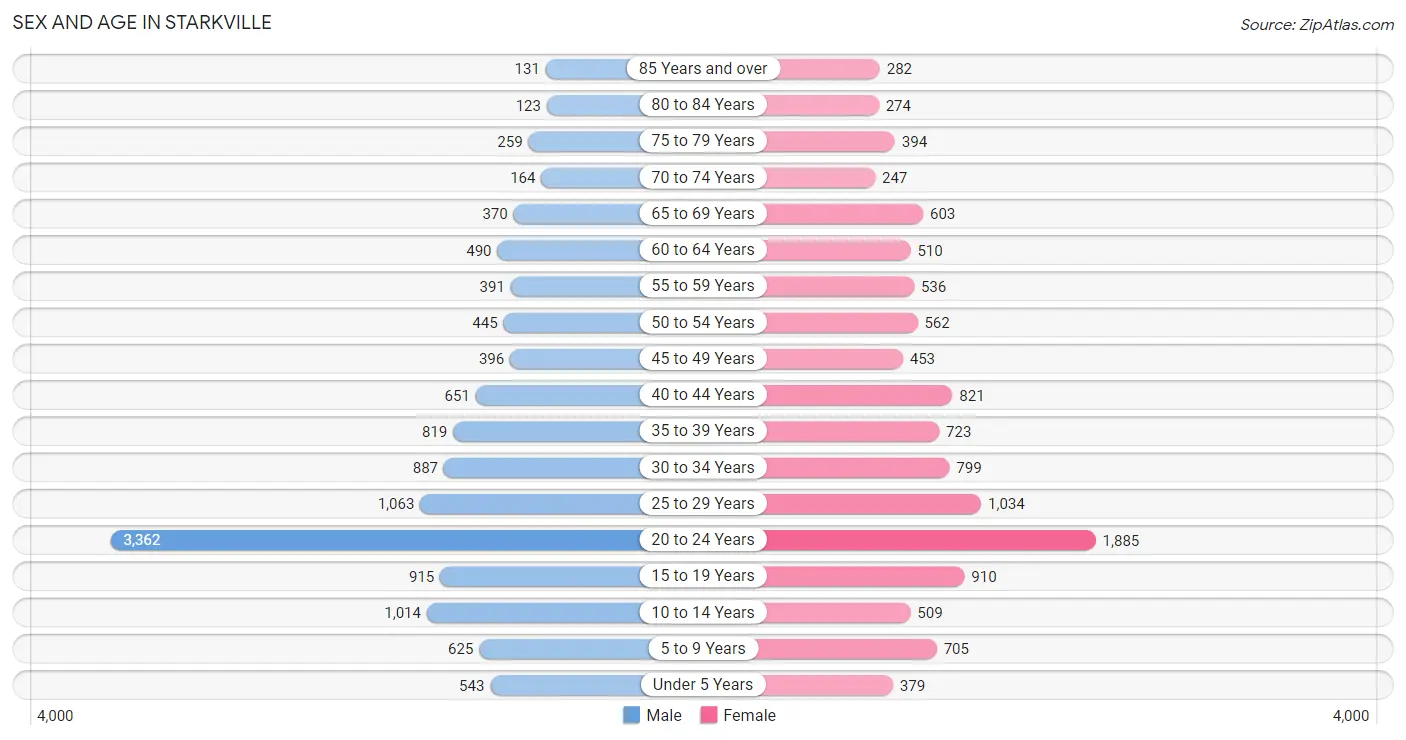
The most populous age groups in Starkville are 20 to 24 Years (3,362 | 26.6%) for men and 20 to 24 Years (1,885 | 16.2%) for women.
| Age Bracket | Male | Female |
| Under 5 Years | 543 (4.3%) | 379 (3.3%) |
| 5 to 9 Years | 625 (4.9%) | 705 (6.1%) |
| 10 to 14 Years | 1,014 (8.0%) | 509 (4.4%) |
| 15 to 19 Years | 915 (7.2%) | 910 (7.8%) |
| 20 to 24 Years | 3,362 (26.6%) | 1,885 (16.2%) |
| 25 to 29 Years | 1,063 (8.4%) | 1,034 (8.9%) |
| 30 to 34 Years | 887 (7.0%) | 799 (6.9%) |
| 35 to 39 Years | 819 (6.5%) | 723 (6.2%) |
| 40 to 44 Years | 651 (5.1%) | 821 (7.1%) |
| 45 to 49 Years | 396 (3.1%) | 453 (3.9%) |
| 50 to 54 Years | 445 (3.5%) | 562 (4.8%) |
| 55 to 59 Years | 391 (3.1%) | 536 (4.6%) |
| 60 to 64 Years | 490 (3.9%) | 510 (4.4%) |
| 65 to 69 Years | 370 (2.9%) | 603 (5.2%) |
| 70 to 74 Years | 164 (1.3%) | 247 (2.1%) |
| 75 to 79 Years | 259 (2.1%) | 394 (3.4%) |
| 80 to 84 Years | 123 (1.0%) | 274 (2.4%) |
| 85 Years and over | 131 (1.0%) | 282 (2.4%) |
| Total | 12,648 (100.0%) | 11,626 (100.0%) |
Families and Households in Starkville
Median Family Size in Starkville
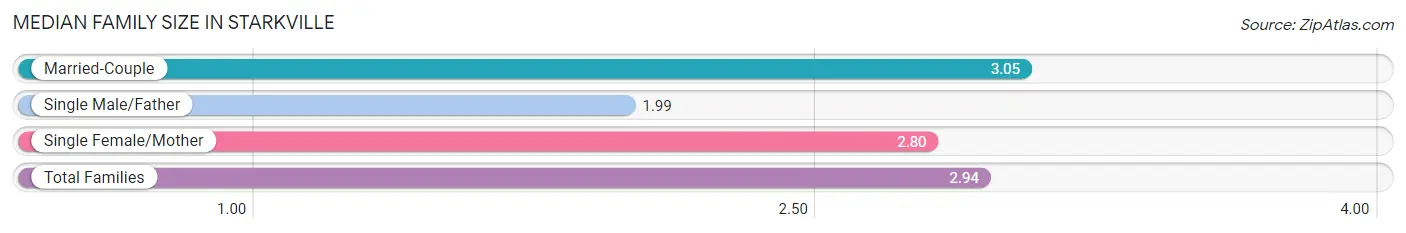
The median family size in Starkville is 2.94 persons per family, with married-couple families (3,380 | 69.1%) accounting for the largest median family size of 3.05 persons per family. On the other hand, single male/father families (173 | 3.5%) represent the smallest median family size with 1.99 persons per family.
| Family Type | # Families | Family Size |
| Married-Couple | 3,380 (69.1%) | 3.05 |
| Single Male/Father | 173 (3.5%) | 1.99 |
| Single Female/Mother | 1,342 (27.4%) | 2.80 |
| Total Families | 4,895 (100.0%) | 2.94 |
Median Household Size in Starkville
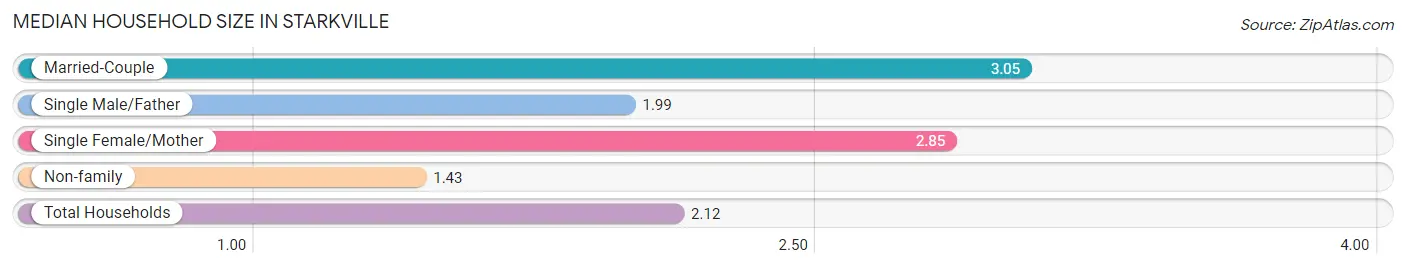
The median household size in Starkville is 2.12 persons per household, with married-couple households (3,380 | 31.1%) accounting for the largest median household size of 3.05 persons per household. non-family households (5,980 | 55.0%) represent the smallest median household size with 1.43 persons per household.
| Household Type | # Households | Household Size |
| Married-Couple | 3,380 (31.1%) | 3.05 |
| Single Male/Father | 173 (1.6%) | 1.99 |
| Single Female/Mother | 1,342 (12.3%) | 2.85 |
| Non-family | 5,980 (55.0%) | 1.43 |
| Total Households | 10,875 (100.0%) | 2.12 |
Household Size by Marriage Status in Starkville
Out of a total of 10,875 households in Starkville, 4,895 (45.0%) are family households, while 5,980 (55.0%) are nonfamily households. The most numerous type of family households are 2-person households, comprising 2,674, and the most common type of nonfamily households are 1-person households, comprising 3,557.
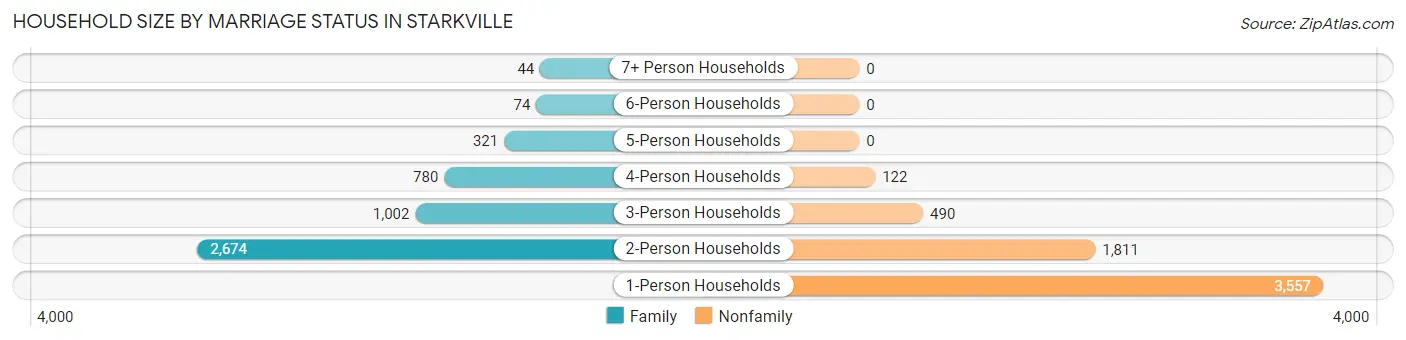
| Household Size | Family Households | Nonfamily Households |
| 1-Person Households | - | 3,557 (32.7%) |
| 2-Person Households | 2,674 (24.6%) | 1,811 (16.7%) |
| 3-Person Households | 1,002 (9.2%) | 490 (4.5%) |
| 4-Person Households | 780 (7.2%) | 122 (1.1%) |
| 5-Person Households | 321 (2.9%) | 0 (0.0%) |
| 6-Person Households | 74 (0.7%) | 0 (0.0%) |
| 7+ Person Households | 44 (0.4%) | 0 (0.0%) |
| Total | 4,895 (45.0%) | 5,980 (55.0%) |
Female Fertility in Starkville
Fertility by Age in Starkville
Average fertility rate in Starkville is 21.0 births per 1,000 women. Women in the age bracket of 15 to 19 years have the highest fertility rate with 48.0 births per 1,000 women. Women in the age bracket of 35 to 50 years acount for 40.7% of all women with births.
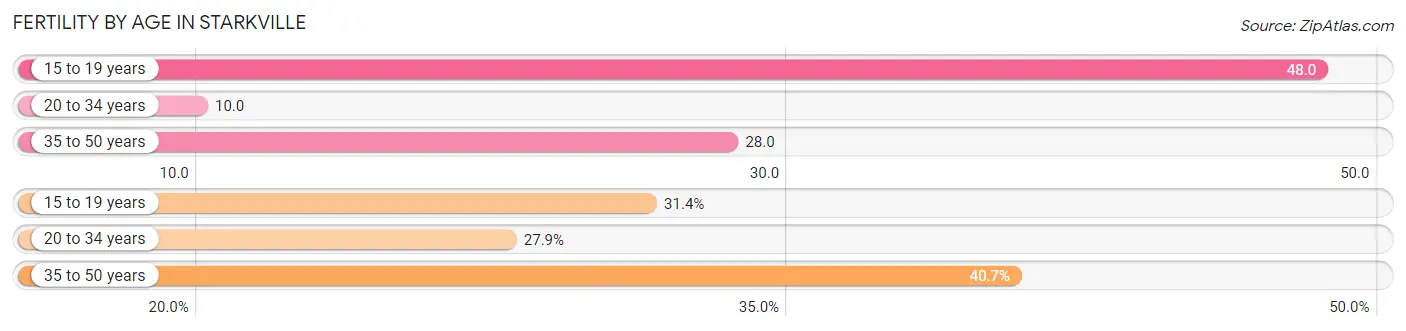
| Age Bracket | Women with Births | Births / 1,000 Women |
| 15 to 19 years | 44 (31.4%) | 48.0 |
| 20 to 34 years | 39 (27.9%) | 10.0 |
| 35 to 50 years | 57 (40.7%) | 28.0 |
| Total | 140 (100.0%) | 21.0 |
Fertility by Age by Marriage Status in Starkville
56.4% of women with births (140) in Starkville are married. The highest percentage of unmarried women with births falls into 15 to 19 years age bracket with 100.0% of them unmarried at the time of birth, while the lowest percentage of unmarried women with births belong to 35 to 50 years age bracket with 12.3% of them unmarried.
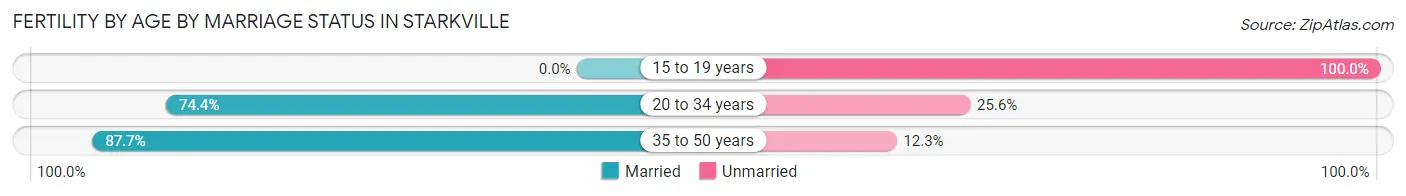
| Age Bracket | Married | Unmarried |
| 15 to 19 years | 0 (0.0%) | 44 (100.0%) |
| 20 to 34 years | 29 (74.4%) | 10 (25.6%) |
| 35 to 50 years | 50 (87.7%) | 7 (12.3%) |
| Total | 79 (56.4%) | 61 (43.6%) |
Fertility by Education in Starkville
Average fertility rate in Starkville is 21.0 births per 1,000 women. Women with the education attainment of graduate degree have the highest fertility rate of 39.0 births per 1,000 women, while women with the education attainment of college or associate's degree have the lowest fertility at 4.0 births per 1,000 women. Women with the education attainment of high school diploma represent 31.4% of all women with births.
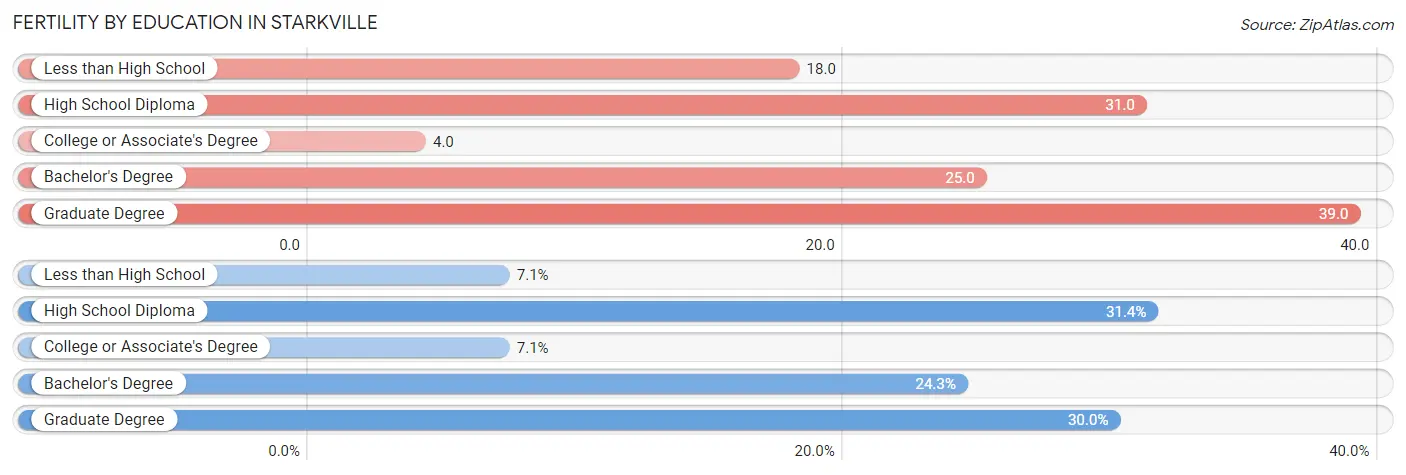
| Educational Attainment | Women with Births | Births / 1,000 Women |
| Less than High School | 10 (7.1%) | 18.0 |
| High School Diploma | 44 (31.4%) | 31.0 |
| College or Associate's Degree | 10 (7.1%) | 4.0 |
| Bachelor's Degree | 34 (24.3%) | 25.0 |
| Graduate Degree | 42 (30.0%) | 39.0 |
| Total | 140 (100.0%) | 21.0 |
Fertility by Education by Marriage Status in Starkville
43.6% of women with births in Starkville are unmarried. Women with the educational attainment of bachelor's degree are most likely to be married with 100.0% of them married at childbirth, while women with the educational attainment of less than high school are least likely to be married with 100.0% of them unmarried at childbirth.
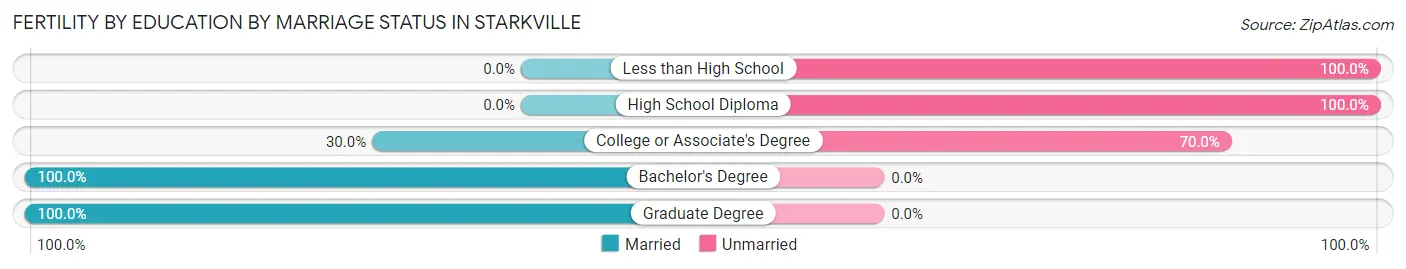
| Educational Attainment | Married | Unmarried |
| Less than High School | 0 (0.0%) | 10 (100.0%) |
| High School Diploma | 0 (0.0%) | 44 (100.0%) |
| College or Associate's Degree | 3 (30.0%) | 7 (70.0%) |
| Bachelor's Degree | 34 (100.0%) | 0 (0.0%) |
| Graduate Degree | 42 (100.0%) | 0 (0.0%) |
| Total | 79 (56.4%) | 61 (43.6%) |
Employment Characteristics in Starkville
Employment by Class of Employer in Starkville
Among the 10,965 employed individuals in Starkville, private company employees (6,269 | 57.2%), state government employees (2,789 | 25.4%), and not-for-profit organizations (547 | 5.0%) make up the most common classes of employment.
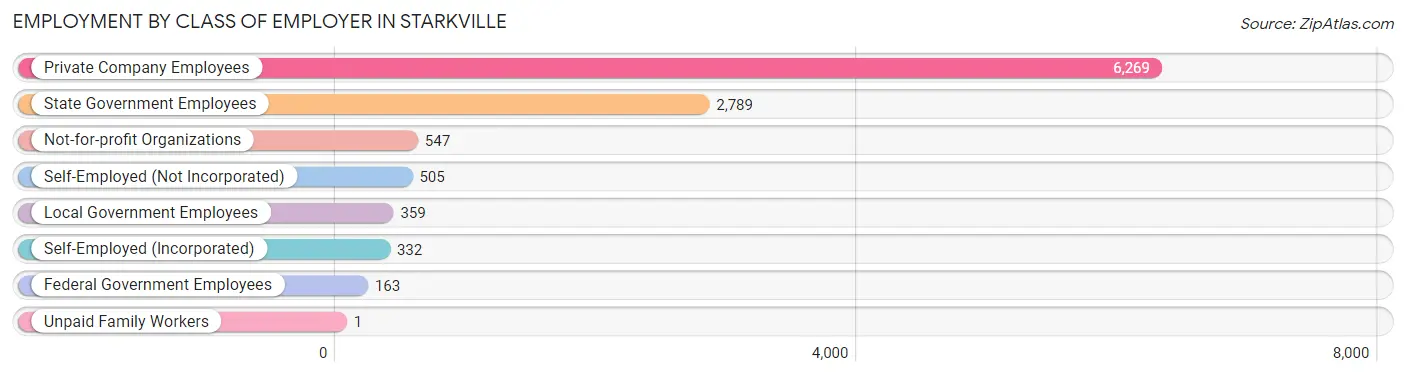
| Employer Class | # Employees | % Employees |
| Private Company Employees | 6,269 | 57.2% |
| Self-Employed (Incorporated) | 332 | 3.0% |
| Self-Employed (Not Incorporated) | 505 | 4.6% |
| Not-for-profit Organizations | 547 | 5.0% |
| Local Government Employees | 359 | 3.3% |
| State Government Employees | 2,789 | 25.4% |
| Federal Government Employees | 163 | 1.5% |
| Unpaid Family Workers | 1 | 0.0% |
| Total | 10,965 | 100.0% |
Employment Status by Age in Starkville
According to the labor force statistics for Starkville, out of the total population over 16 years of age (20,408), 61.3% or 12,510 individuals are in the labor force, with 7.9% or 988 of them unemployed. The age group with the highest labor force participation rate is 30 to 34 years, with 91.9% or 1,549 individuals in the labor force. Within the labor force, the 16 to 19 years age range has the highest percentage of unemployed individuals, with 23.7% or 161 of them being unemployed.
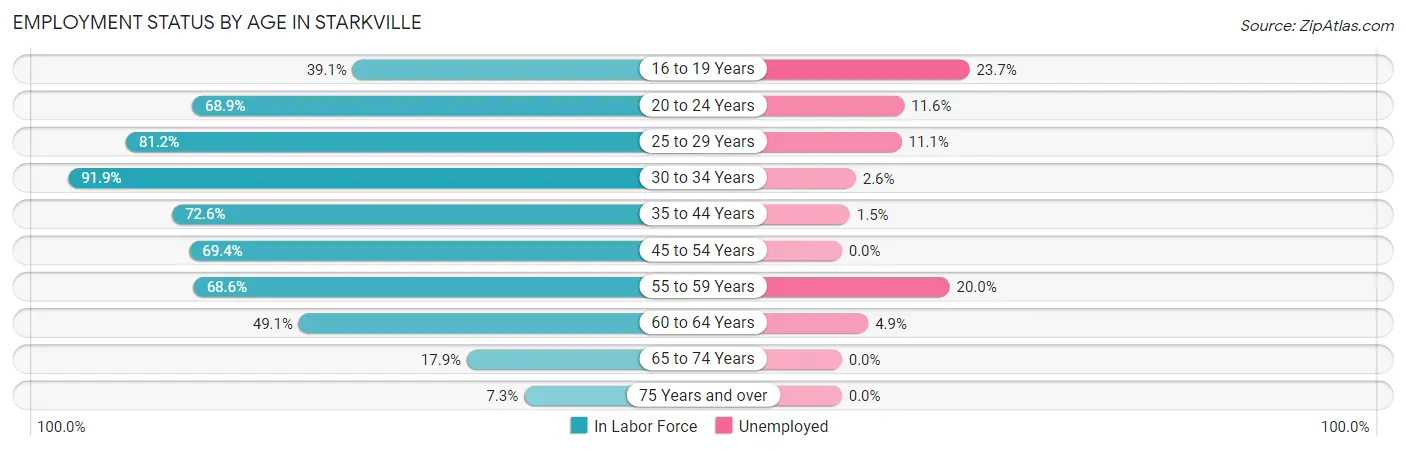
| Age Bracket | In Labor Force | Unemployed |
| 16 to 19 Years | 678 (39.1%) | 161 (23.7%) |
| 20 to 24 Years | 3,615 (68.9%) | 419 (11.6%) |
| 25 to 29 Years | 1,703 (81.2%) | 189 (11.1%) |
| 30 to 34 Years | 1,549 (91.9%) | 40 (2.6%) |
| 35 to 44 Years | 2,188 (72.6%) | 33 (1.5%) |
| 45 to 54 Years | 1,288 (69.4%) | 0 (0.0%) |
| 55 to 59 Years | 636 (68.6%) | 127 (20.0%) |
| 60 to 64 Years | 491 (49.1%) | 24 (4.9%) |
| 65 to 74 Years | 248 (17.9%) | 0 (0.0%) |
| 75 Years and over | 107 (7.3%) | 0 (0.0%) |
| Total | 12,510 (61.3%) | 988 (7.9%) |
Employment Status by Educational Attainment in Starkville
According to labor force statistics for Starkville, 74.3% of individuals (7,861) out of the total population between 25 and 64 years of age (10,580) are in the labor force, with 5.3% or 417 of them being unemployed. The group with the highest labor force participation rate are those with the educational attainment of bachelor's degree or higher, with 86.9% or 4,494 individuals in the labor force. Within the labor force, individuals with high school diploma education have the highest percentage of unemployment, with 12.5% or 154 of them being unemployed.
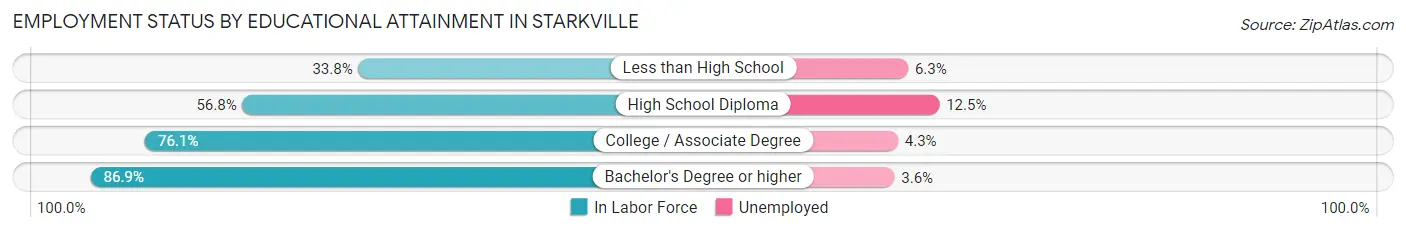
| Educational Attainment | In Labor Force | Unemployed |
| Less than High School | 268 (33.8%) | 50 (6.3%) |
| High School Diploma | 1,230 (56.8%) | 271 (12.5%) |
| College / Associate Degree | 1,866 (76.1%) | 105 (4.3%) |
| Bachelor's Degree or higher | 4,494 (86.9%) | 186 (3.6%) |
| Total | 7,861 (74.3%) | 561 (5.3%) |
Employment Occupations by Sex in Starkville
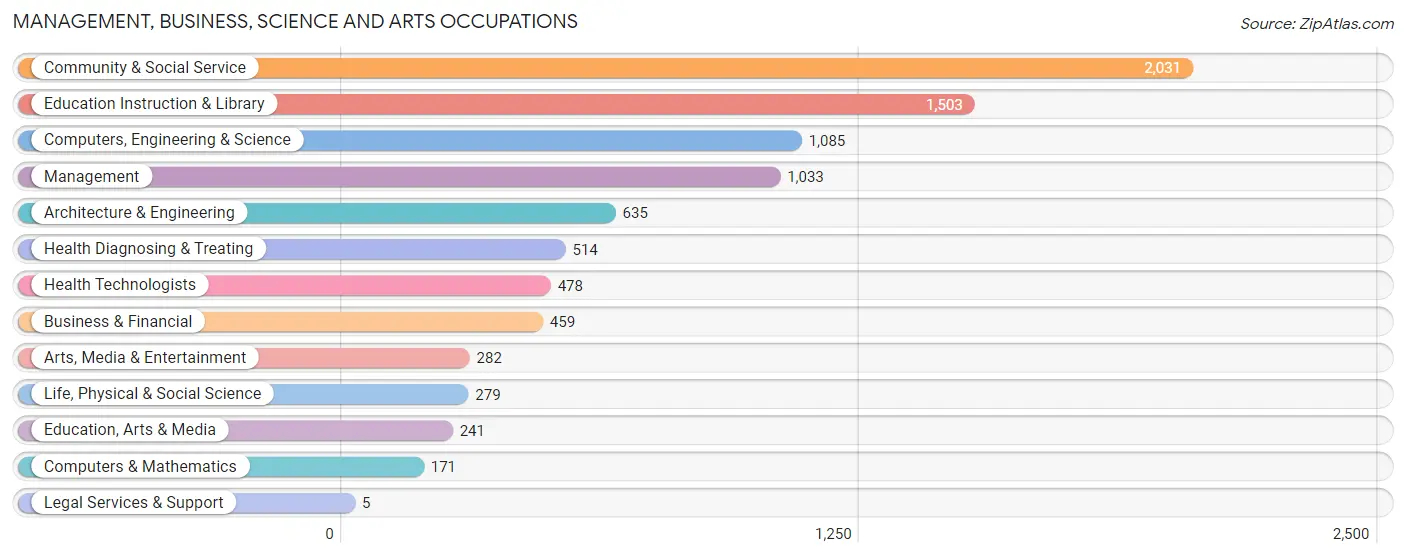
Management, Business, Science and Arts Occupations
The most common Management, Business, Science and Arts occupations in Starkville are Community & Social Service (2,031 | 17.6%), Education Instruction & Library (1,503 | 13.1%), Computers, Engineering & Science (1,085 | 9.4%), Management (1,033 | 9.0%), and Architecture & Engineering (635 | 5.5%).
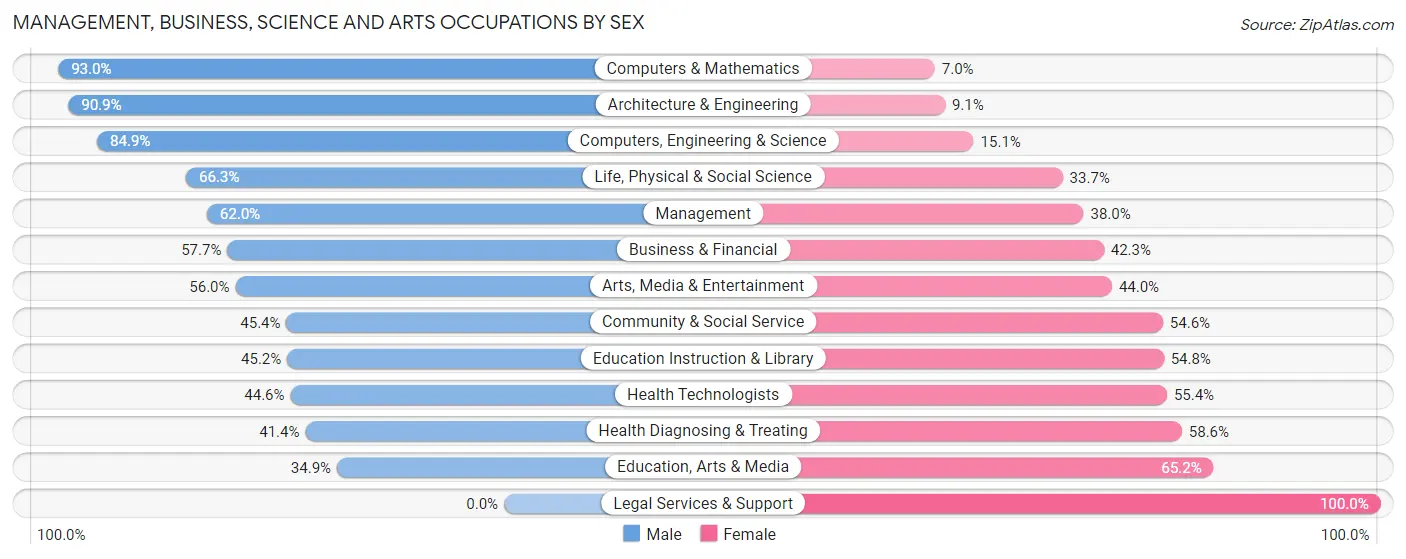
Management, Business, Science and Arts Occupations by Sex
Within the Management, Business, Science and Arts occupations in Starkville, the most male-oriented occupations are Computers & Mathematics (93.0%), Architecture & Engineering (90.9%), and Computers, Engineering & Science (84.9%), while the most female-oriented occupations are Legal Services & Support (100.0%), Education, Arts & Media (65.1%), and Health Diagnosing & Treating (58.6%).
| Occupation | Male | Female |
| Management | 640 (62.0%) | 393 (38.0%) |
| Business & Financial | 265 (57.7%) | 194 (42.3%) |
| Computers, Engineering & Science | 921 (84.9%) | 164 (15.1%) |
| Computers & Mathematics | 159 (93.0%) | 12 (7.0%) |
| Architecture & Engineering | 577 (90.9%) | 58 (9.1%) |
| Life, Physical & Social Science | 185 (66.3%) | 94 (33.7%) |
| Community & Social Service | 922 (45.4%) | 1,109 (54.6%) |
| Education, Arts & Media | 84 (34.8%) | 157 (65.1%) |
| Legal Services & Support | 0 (0.0%) | 5 (100.0%) |
| Education Instruction & Library | 680 (45.2%) | 823 (54.8%) |
| Arts, Media & Entertainment | 158 (56.0%) | 124 (44.0%) |
| Health Diagnosing & Treating | 213 (41.4%) | 301 (58.6%) |
| Health Technologists | 213 (44.6%) | 265 (55.4%) |
| Total (Category) | 2,961 (57.8%) | 2,161 (42.2%) |
| Total (Overall) | 6,820 (59.2%) | 4,692 (40.8%) |
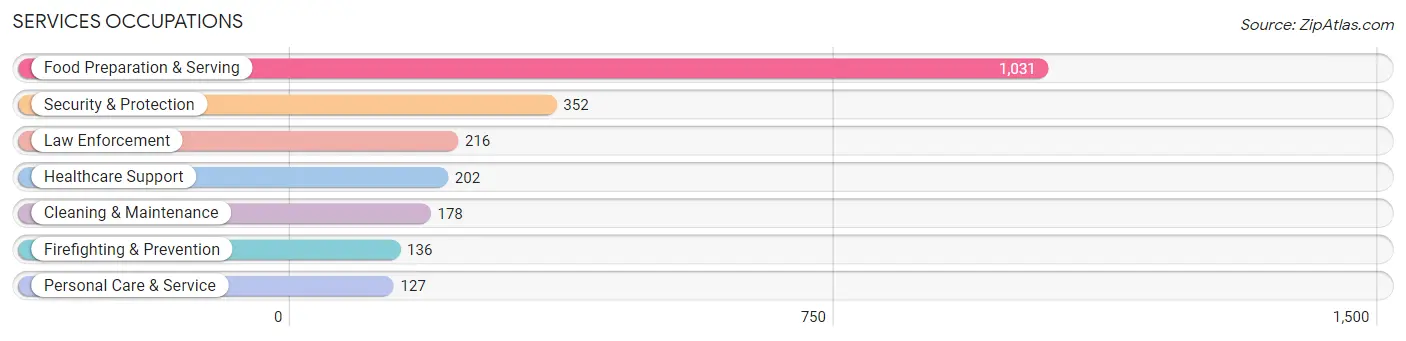
Services Occupations
The most common Services occupations in Starkville are Food Preparation & Serving (1,031 | 9.0%), Security & Protection (352 | 3.1%), Law Enforcement (216 | 1.9%), Healthcare Support (202 | 1.8%), and Cleaning & Maintenance (178 | 1.5%).
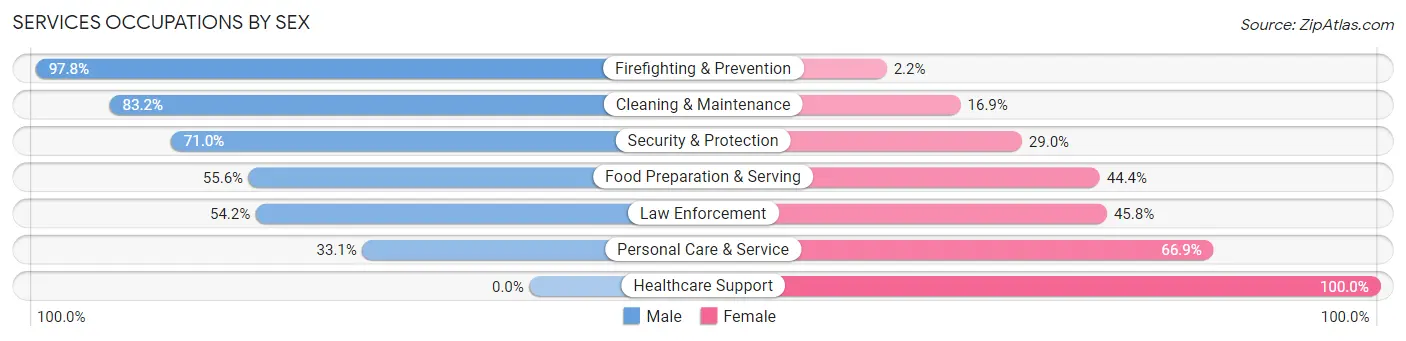
Services Occupations by Sex
Within the Services occupations in Starkville, the most male-oriented occupations are Firefighting & Prevention (97.8%), Cleaning & Maintenance (83.2%), and Security & Protection (71.0%), while the most female-oriented occupations are Healthcare Support (100.0%), Personal Care & Service (66.9%), and Law Enforcement (45.8%).
| Occupation | Male | Female |
| Healthcare Support | 0 (0.0%) | 202 (100.0%) |
| Security & Protection | 250 (71.0%) | 102 (29.0%) |
| Firefighting & Prevention | 133 (97.8%) | 3 (2.2%) |
| Law Enforcement | 117 (54.2%) | 99 (45.8%) |
| Food Preparation & Serving | 573 (55.6%) | 458 (44.4%) |
| Cleaning & Maintenance | 148 (83.2%) | 30 (16.9%) |
| Personal Care & Service | 42 (33.1%) | 85 (66.9%) |
| Total (Category) | 1,013 (53.6%) | 877 (46.4%) |
| Total (Overall) | 6,820 (59.2%) | 4,692 (40.8%) |
Sales and Office Occupations
The most common Sales and Office occupations in Starkville are Sales & Related (1,641 | 14.2%), and Office & Administration (900 | 7.8%).
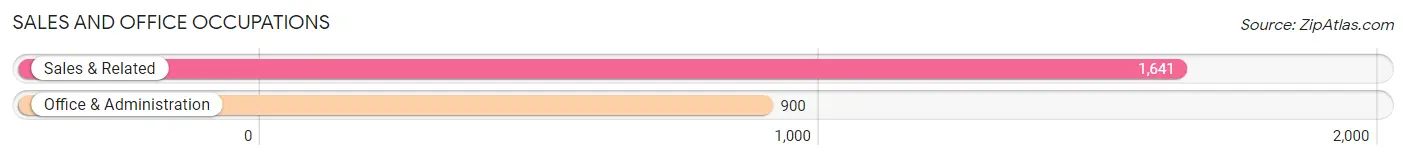
Sales and Office Occupations by Sex

| Occupation | Male | Female |
| Sales & Related | 1,023 (62.3%) | 618 (37.7%) |
| Office & Administration | 265 (29.4%) | 635 (70.6%) |
| Total (Category) | 1,288 (50.7%) | 1,253 (49.3%) |
| Total (Overall) | 6,820 (59.2%) | 4,692 (40.8%) |
Natural Resources, Construction and Maintenance Occupations
The most common Natural Resources, Construction and Maintenance occupations in Starkville are Installation, Maintenance & Repair (366 | 3.2%), Construction & Extraction (173 | 1.5%), and Farming, Fishing & Forestry (31 | 0.3%).
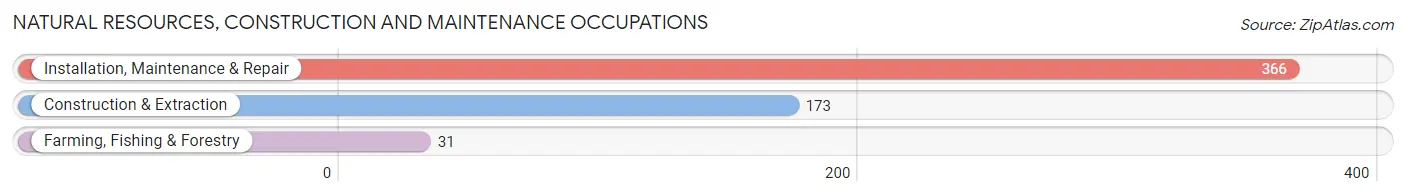
Natural Resources, Construction and Maintenance Occupations by Sex

| Occupation | Male | Female |
| Farming, Fishing & Forestry | 0 (0.0%) | 31 (100.0%) |
| Construction & Extraction | 173 (100.0%) | 0 (0.0%) |
| Installation, Maintenance & Repair | 366 (100.0%) | 0 (0.0%) |
| Total (Category) | 539 (94.6%) | 31 (5.4%) |
| Total (Overall) | 6,820 (59.2%) | 4,692 (40.8%) |
Production, Transportation and Moving Occupations
The most common Production, Transportation and Moving occupations in Starkville are Production (611 | 5.3%), Transportation (503 | 4.4%), and Material Moving (275 | 2.4%).
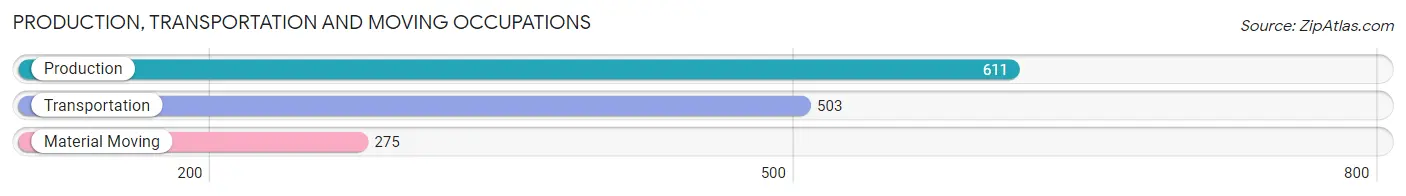
Production, Transportation and Moving Occupations by Sex
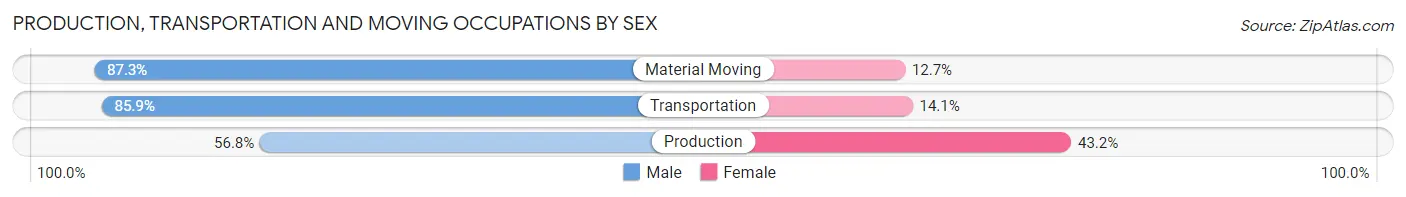
| Occupation | Male | Female |
| Production | 347 (56.8%) | 264 (43.2%) |
| Transportation | 432 (85.9%) | 71 (14.1%) |
| Material Moving | 240 (87.3%) | 35 (12.7%) |
| Total (Category) | 1,019 (73.4%) | 370 (26.6%) |
| Total (Overall) | 6,820 (59.2%) | 4,692 (40.8%) |
Employment Industries by Sex in Starkville
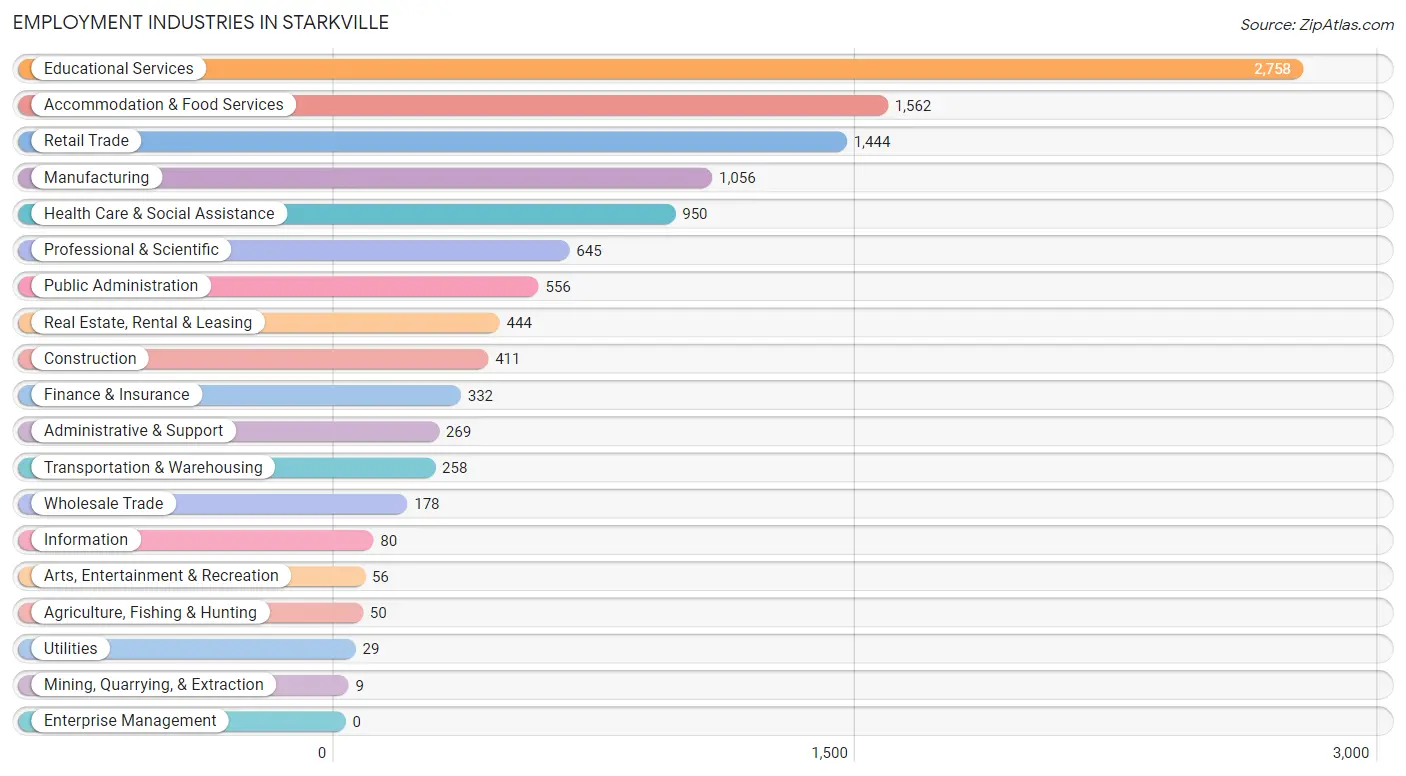
Employment Industries in Starkville
The major employment industries in Starkville include Educational Services (2,758 | 24.0%), Accommodation & Food Services (1,562 | 13.6%), Retail Trade (1,444 | 12.5%), Manufacturing (1,056 | 9.2%), and Health Care & Social Assistance (950 | 8.3%).
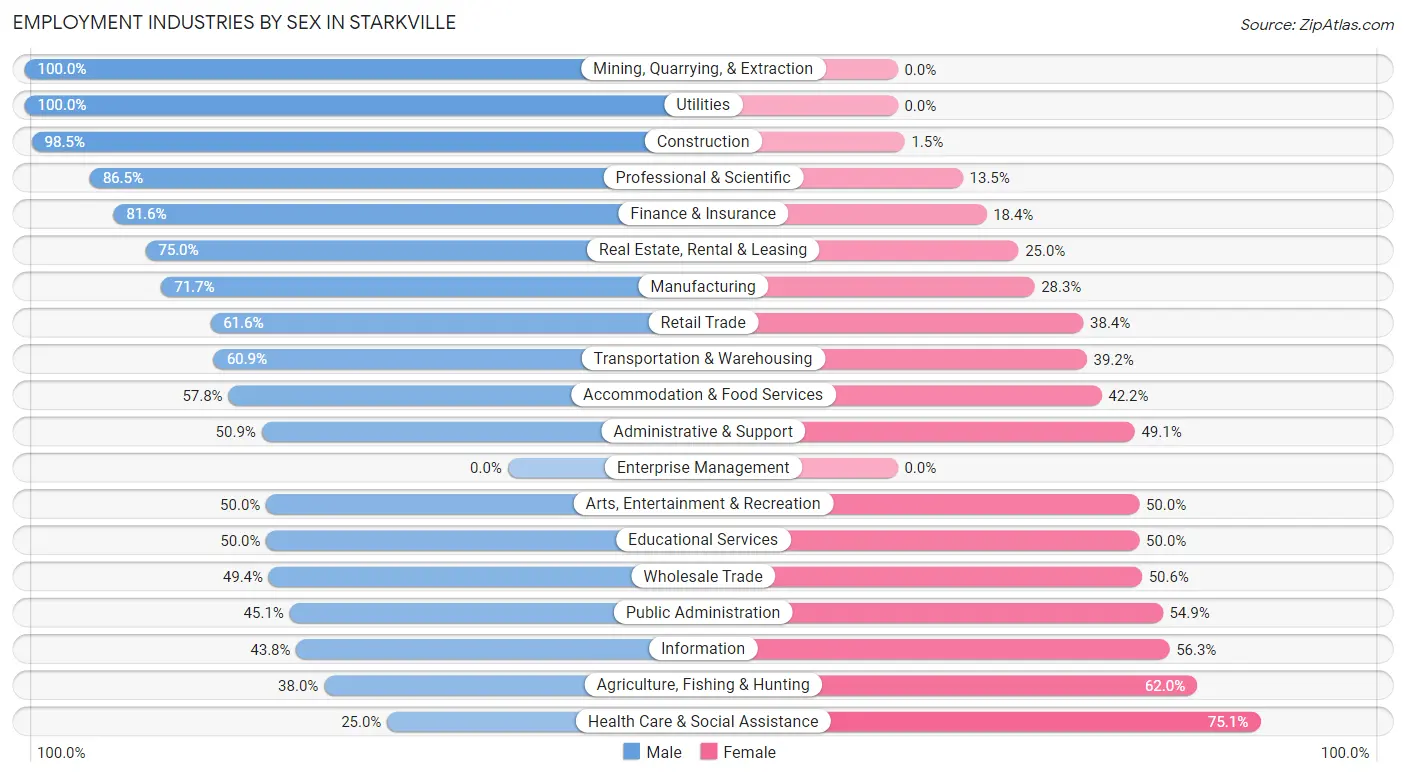
Employment Industries by Sex in Starkville
The Starkville industries that see more men than women are Mining, Quarrying, & Extraction (100.0%), Utilities (100.0%), and Construction (98.5%), whereas the industries that tend to have a higher number of women are Health Care & Social Assistance (75.0%), Agriculture, Fishing & Hunting (62.0%), and Information (56.2%).
| Industry | Male | Female |
| Agriculture, Fishing & Hunting | 19 (38.0%) | 31 (62.0%) |
| Mining, Quarrying, & Extraction | 9 (100.0%) | 0 (0.0%) |
| Construction | 405 (98.5%) | 6 (1.5%) |
| Manufacturing | 757 (71.7%) | 299 (28.3%) |
| Wholesale Trade | 88 (49.4%) | 90 (50.6%) |
| Retail Trade | 889 (61.6%) | 555 (38.4%) |
| Transportation & Warehousing | 157 (60.9%) | 101 (39.2%) |
| Utilities | 29 (100.0%) | 0 (0.0%) |
| Information | 35 (43.8%) | 45 (56.2%) |
| Finance & Insurance | 271 (81.6%) | 61 (18.4%) |
| Real Estate, Rental & Leasing | 333 (75.0%) | 111 (25.0%) |
| Professional & Scientific | 558 (86.5%) | 87 (13.5%) |
| Enterprise Management | 0 (0.0%) | 0 (0.0%) |
| Administrative & Support | 137 (50.9%) | 132 (49.1%) |
| Educational Services | 1,378 (50.0%) | 1,380 (50.0%) |
| Health Care & Social Assistance | 237 (24.9%) | 713 (75.0%) |
| Arts, Entertainment & Recreation | 28 (50.0%) | 28 (50.0%) |
| Accommodation & Food Services | 903 (57.8%) | 659 (42.2%) |
| Public Administration | 251 (45.1%) | 305 (54.9%) |
| Total | 6,820 (59.2%) | 4,692 (40.8%) |
Education in Starkville
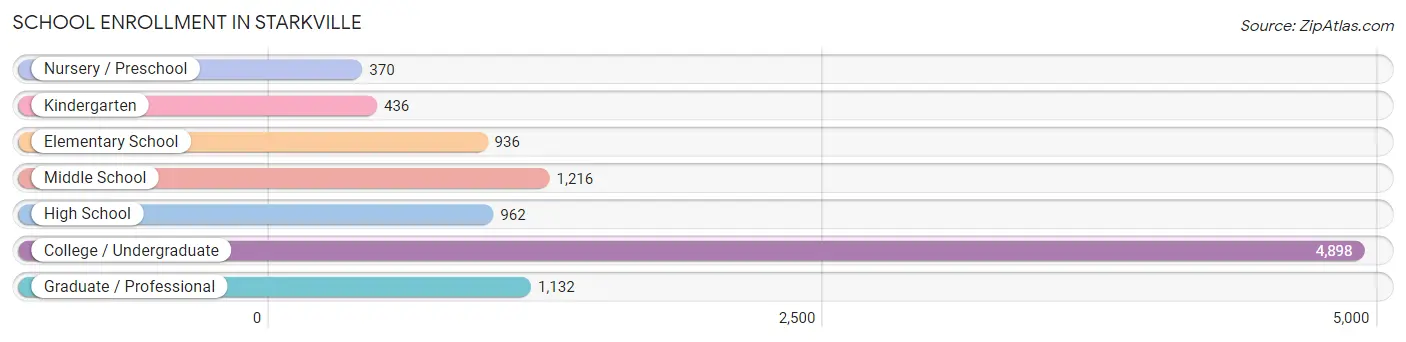
School Enrollment in Starkville
The most common levels of schooling among the 9,950 students in Starkville are college / undergraduate (4,898 | 49.2%), middle school (1,216 | 12.2%), and graduate / professional (1,132 | 11.4%).
| School Level | # Students | % Students |
| Nursery / Preschool | 370 | 3.7% |
| Kindergarten | 436 | 4.4% |
| Elementary School | 936 | 9.4% |
| Middle School | 1,216 | 12.2% |
| High School | 962 | 9.7% |
| College / Undergraduate | 4,898 | 49.2% |
| Graduate / Professional | 1,132 | 11.4% |
| Total | 9,950 | 100.0% |
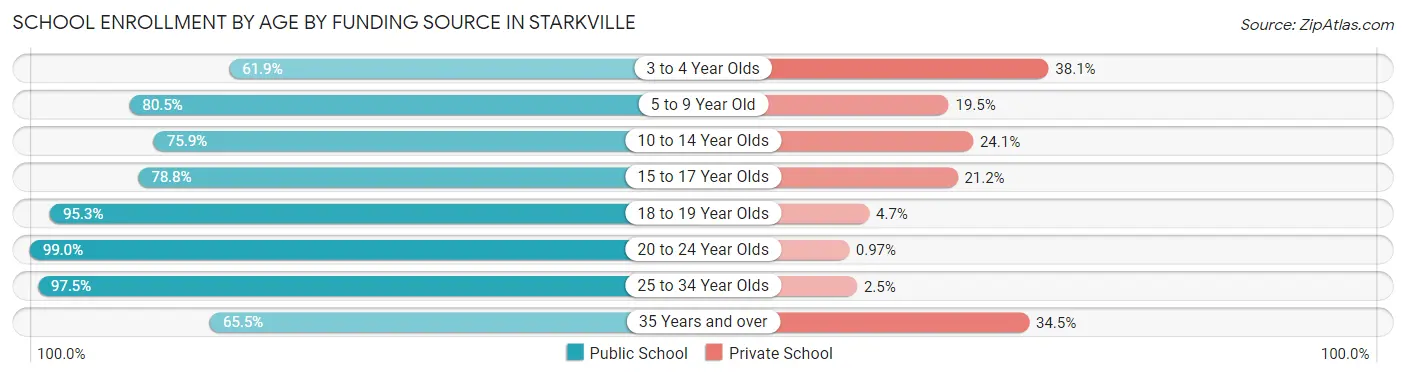
School Enrollment by Age by Funding Source in Starkville
Out of a total of 9,950 students who are enrolled in schools in Starkville, 1,065 (10.7%) attend a private institution, while the remaining 8,885 (89.3%) are enrolled in public schools. The age group of 3 to 4 year olds has the highest likelihood of being enrolled in private schools, with 127 (38.1% in the age bracket) enrolled. Conversely, the age group of 20 to 24 year olds has the lowest likelihood of being enrolled in a private school, with 3,872 (99.0% in the age bracket) attending a public institution.
| Age Bracket | Public School | Private School |
| 3 to 4 Year Olds | 206 (61.9%) | 127 (38.1%) |
| 5 to 9 Year Old | 1,059 (80.5%) | 257 (19.5%) |
| 10 to 14 Year Olds | 1,122 (75.9%) | 356 (24.1%) |
| 15 to 17 Year Olds | 476 (78.8%) | 128 (21.2%) |
| 18 to 19 Year Olds | 1,065 (95.3%) | 53 (4.7%) |
| 20 to 24 Year Olds | 3,872 (99.0%) | 38 (1.0%) |
| 25 to 34 Year Olds | 944 (97.5%) | 24 (2.5%) |
| 35 Years and over | 146 (65.5%) | 77 (34.5%) |
| Total | 8,885 (89.3%) | 1,065 (10.7%) |
Educational Attainment by Field of Study in Starkville
Business (1,473 | 21.8%), bio, nature & agricultural (805 | 11.9%), education (725 | 10.7%), arts & humanities (585 | 8.7%), and engineering (545 | 8.1%) are the most common fields of study among 6,753 individuals in Starkville who have obtained a bachelor's degree or higher.
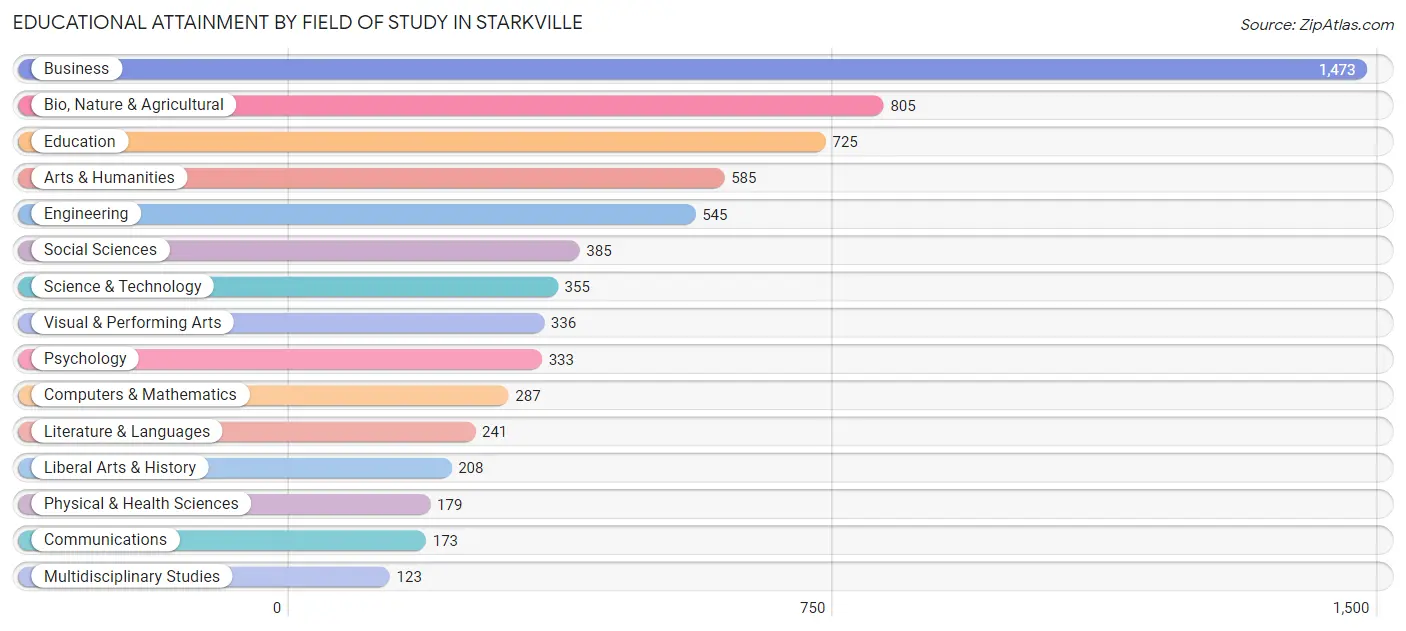
| Field of Study | # Graduates | % Graduates |
| Computers & Mathematics | 287 | 4.3% |
| Bio, Nature & Agricultural | 805 | 11.9% |
| Physical & Health Sciences | 179 | 2.6% |
| Psychology | 333 | 4.9% |
| Social Sciences | 385 | 5.7% |
| Engineering | 545 | 8.1% |
| Multidisciplinary Studies | 123 | 1.8% |
| Science & Technology | 355 | 5.3% |
| Business | 1,473 | 21.8% |
| Education | 725 | 10.7% |
| Literature & Languages | 241 | 3.6% |
| Liberal Arts & History | 208 | 3.1% |
| Visual & Performing Arts | 336 | 5.0% |
| Communications | 173 | 2.6% |
| Arts & Humanities | 585 | 8.7% |
| Total | 6,753 | 100.0% |
Transportation & Commute in Starkville
Vehicle Availability by Sex in Starkville
The most prevalent vehicle ownership categories in Starkville are males with 2 vehicles (3,227, accounting for 50.9%) and females with 2 vehicles (1,836, making up 71.7%).
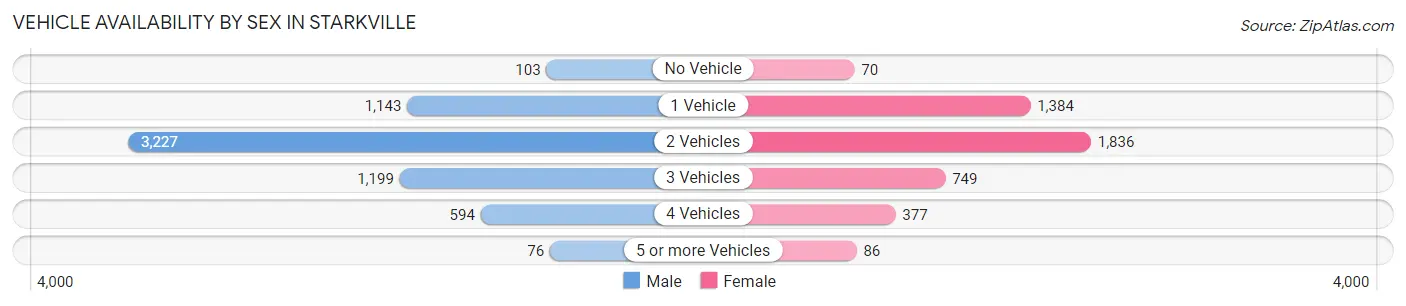
| Vehicles Available | Male | Female |
| No Vehicle | 103 (1.6%) | 70 (1.5%) |
| 1 Vehicle | 1,143 (18.0%) | 1,384 (30.7%) |
| 2 Vehicles | 3,227 (50.9%) | 1,836 (40.8%) |
| 3 Vehicles | 1,199 (18.9%) | 749 (16.6%) |
| 4 Vehicles | 594 (9.4%) | 377 (8.4%) |
| 5 or more Vehicles | 76 (1.2%) | 86 (1.9%) |
| Total | 6,342 (100.0%) | 4,502 (100.0%) |
Commute Time in Starkville
The most frequently occuring commute durations in Starkville are 10 to 14 minutes (2,921 commuters, 28.5%), 5 to 9 minutes (2,333 commuters, 22.7%), and 15 to 19 minutes (1,863 commuters, 18.1%).
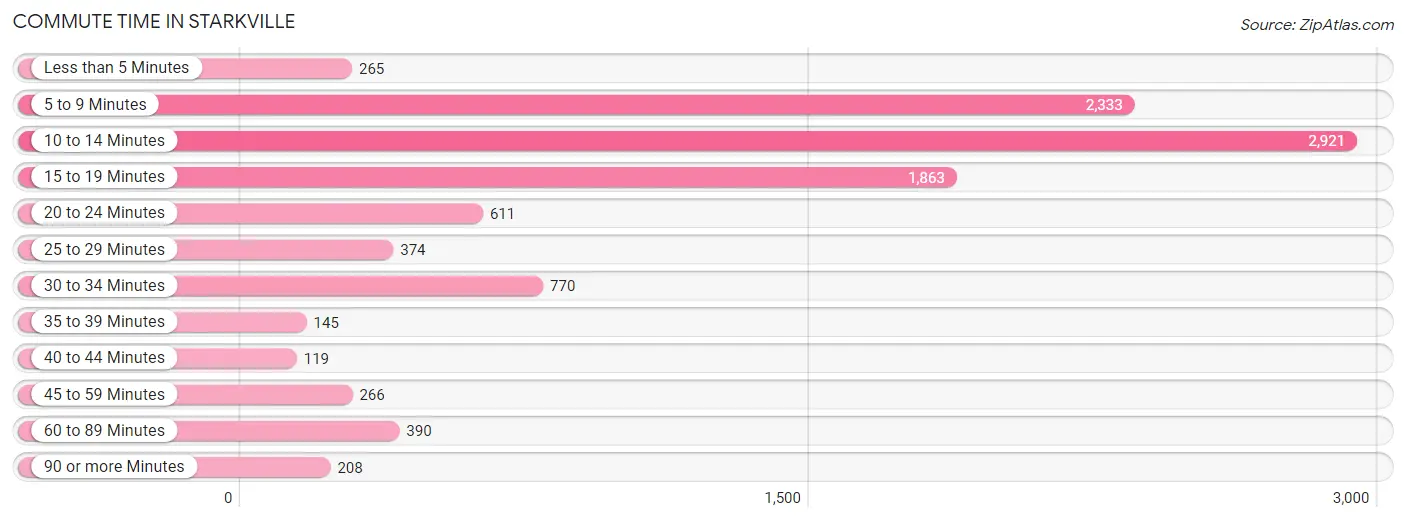
| Commute Time | # Commuters | % Commuters |
| Less than 5 Minutes | 265 | 2.6% |
| 5 to 9 Minutes | 2,333 | 22.7% |
| 10 to 14 Minutes | 2,921 | 28.5% |
| 15 to 19 Minutes | 1,863 | 18.1% |
| 20 to 24 Minutes | 611 | 5.9% |
| 25 to 29 Minutes | 374 | 3.6% |
| 30 to 34 Minutes | 770 | 7.5% |
| 35 to 39 Minutes | 145 | 1.4% |
| 40 to 44 Minutes | 119 | 1.2% |
| 45 to 59 Minutes | 266 | 2.6% |
| 60 to 89 Minutes | 390 | 3.8% |
| 90 or more Minutes | 208 | 2.0% |
Commute Time by Sex in Starkville
The most common commute times in Starkville are 10 to 14 minutes (1,538 commuters, 25.6%) for males and 10 to 14 minutes (1,383 commuters, 32.4%) for females.
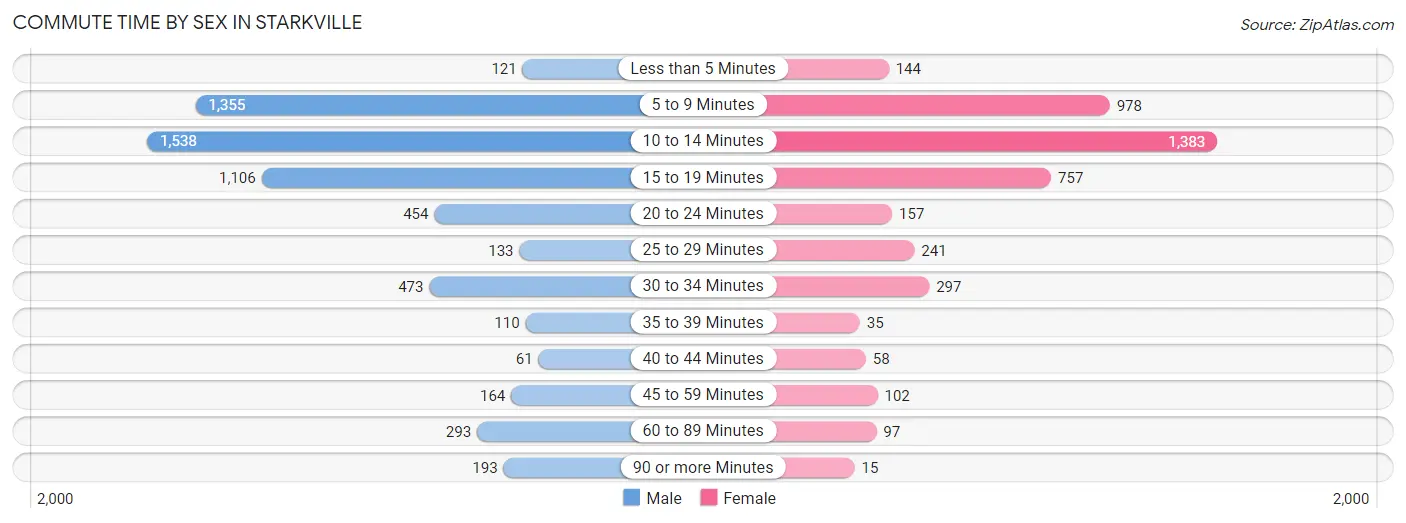
| Commute Time | Male | Female |
| Less than 5 Minutes | 121 (2.0%) | 144 (3.4%) |
| 5 to 9 Minutes | 1,355 (22.6%) | 978 (22.9%) |
| 10 to 14 Minutes | 1,538 (25.6%) | 1,383 (32.4%) |
| 15 to 19 Minutes | 1,106 (18.4%) | 757 (17.7%) |
| 20 to 24 Minutes | 454 (7.6%) | 157 (3.7%) |
| 25 to 29 Minutes | 133 (2.2%) | 241 (5.7%) |
| 30 to 34 Minutes | 473 (7.9%) | 297 (7.0%) |
| 35 to 39 Minutes | 110 (1.8%) | 35 (0.8%) |
| 40 to 44 Minutes | 61 (1.0%) | 58 (1.4%) |
| 45 to 59 Minutes | 164 (2.7%) | 102 (2.4%) |
| 60 to 89 Minutes | 293 (4.9%) | 97 (2.3%) |
| 90 or more Minutes | 193 (3.2%) | 15 (0.4%) |
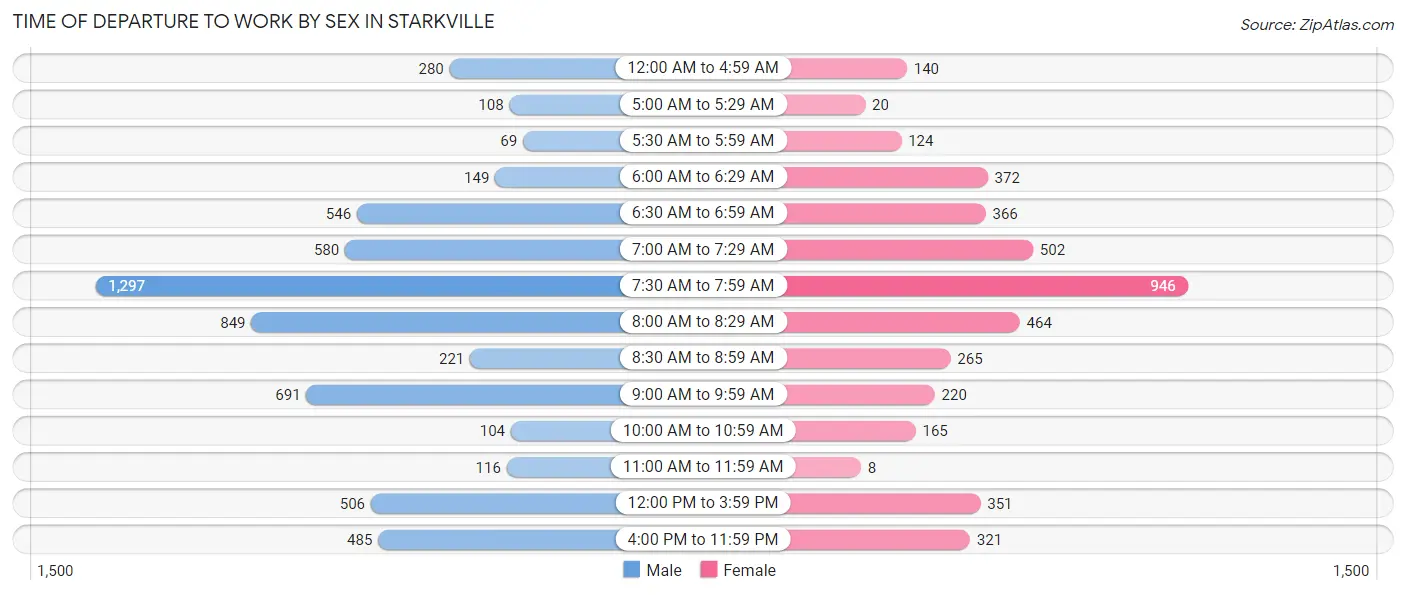
Time of Departure to Work by Sex in Starkville
The most frequent times of departure to work in Starkville are 7:30 AM to 7:59 AM (1,297, 21.6%) for males and 7:30 AM to 7:59 AM (946, 22.2%) for females.
| Time of Departure | Male | Female |
| 12:00 AM to 4:59 AM | 280 (4.7%) | 140 (3.3%) |
| 5:00 AM to 5:29 AM | 108 (1.8%) | 20 (0.5%) |
| 5:30 AM to 5:59 AM | 69 (1.1%) | 124 (2.9%) |
| 6:00 AM to 6:29 AM | 149 (2.5%) | 372 (8.7%) |
| 6:30 AM to 6:59 AM | 546 (9.1%) | 366 (8.6%) |
| 7:00 AM to 7:29 AM | 580 (9.7%) | 502 (11.8%) |
| 7:30 AM to 7:59 AM | 1,297 (21.6%) | 946 (22.2%) |
| 8:00 AM to 8:29 AM | 849 (14.1%) | 464 (10.9%) |
| 8:30 AM to 8:59 AM | 221 (3.7%) | 265 (6.2%) |
| 9:00 AM to 9:59 AM | 691 (11.5%) | 220 (5.2%) |
| 10:00 AM to 10:59 AM | 104 (1.7%) | 165 (3.9%) |
| 11:00 AM to 11:59 AM | 116 (1.9%) | 8 (0.2%) |
| 12:00 PM to 3:59 PM | 506 (8.4%) | 351 (8.2%) |
| 4:00 PM to 11:59 PM | 485 (8.1%) | 321 (7.5%) |
| Total | 6,001 (100.0%) | 4,264 (100.0%) |
Housing Occupancy in Starkville
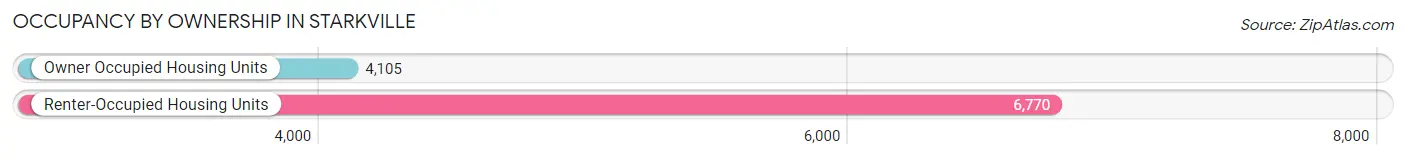
Occupancy by Ownership in Starkville
Of the total 10,875 dwellings in Starkville, owner-occupied units account for 4,105 (37.8%), while renter-occupied units make up 6,770 (62.3%).
| Occupancy | # Housing Units | % Housing Units |
| Owner Occupied Housing Units | 4,105 | 37.8% |
| Renter-Occupied Housing Units | 6,770 | 62.3% |
| Total Occupied Housing Units | 10,875 | 100.0% |
Occupancy by Household Size in Starkville
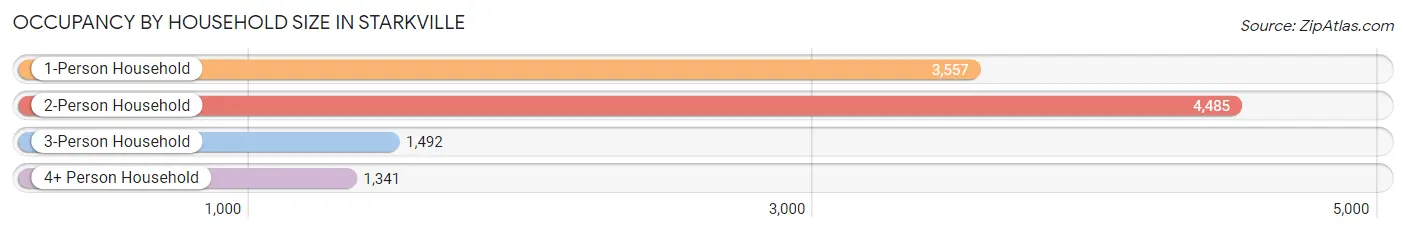
| Household Size | # Housing Units | % Housing Units |
| 1-Person Household | 3,557 | 32.7% |
| 2-Person Household | 4,485 | 41.2% |
| 3-Person Household | 1,492 | 13.7% |
| 4+ Person Household | 1,341 | 12.3% |
| Total Housing Units | 10,875 | 100.0% |
Occupancy by Ownership by Household Size in Starkville
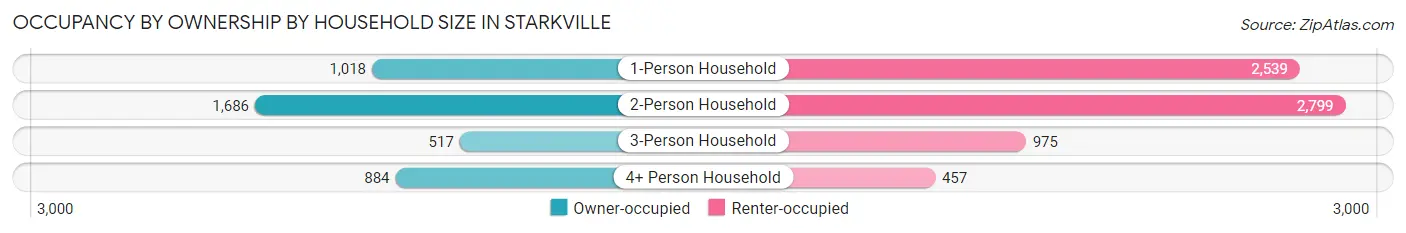
| Household Size | Owner-occupied | Renter-occupied |
| 1-Person Household | 1,018 (28.6%) | 2,539 (71.4%) |
| 2-Person Household | 1,686 (37.6%) | 2,799 (62.4%) |
| 3-Person Household | 517 (34.6%) | 975 (65.3%) |
| 4+ Person Household | 884 (65.9%) | 457 (34.1%) |
| Total Housing Units | 4,105 (37.8%) | 6,770 (62.3%) |
Occupancy by Educational Attainment in Starkville
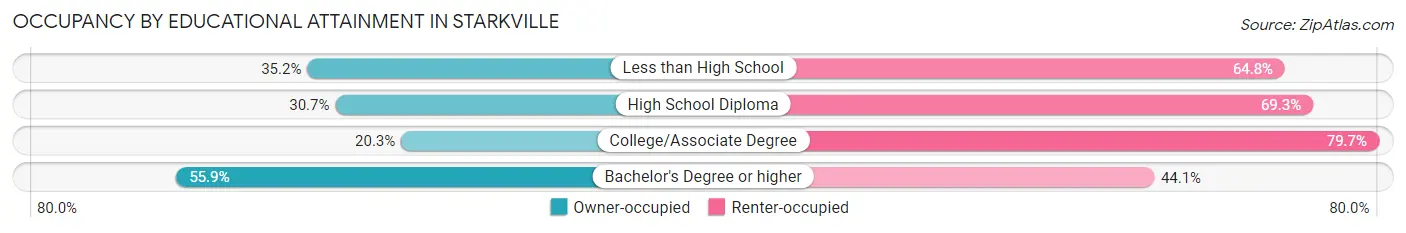
| Household Size | Owner-occupied | Renter-occupied |
| Less than High School | 191 (35.2%) | 352 (64.8%) |
| High School Diploma | 704 (30.7%) | 1,588 (69.3%) |
| College/Associate Degree | 732 (20.3%) | 2,878 (79.7%) |
| Bachelor's Degree or higher | 2,478 (55.9%) | 1,952 (44.1%) |
Occupancy by Age of Householder in Starkville
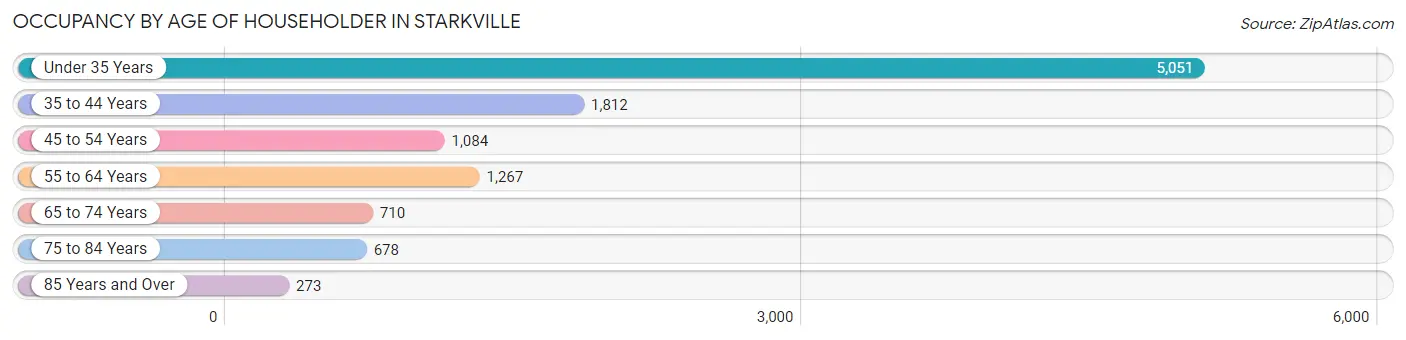
| Age Bracket | # Households | % Households |
| Under 35 Years | 5,051 | 46.5% |
| 35 to 44 Years | 1,812 | 16.7% |
| 45 to 54 Years | 1,084 | 10.0% |
| 55 to 64 Years | 1,267 | 11.7% |
| 65 to 74 Years | 710 | 6.5% |
| 75 to 84 Years | 678 | 6.2% |
| 85 Years and Over | 273 | 2.5% |
| Total | 10,875 | 100.0% |
Housing Finances in Starkville
Median Income by Occupancy in Starkville
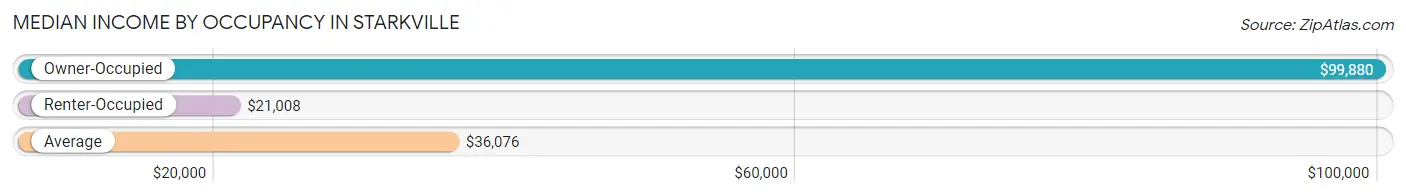
| Occupancy Type | # Households | Median Income |
| Owner-Occupied | 4,105 (37.8%) | $99,880 |
| Renter-Occupied | 6,770 (62.3%) | $21,008 |
| Average | 10,875 (100.0%) | $36,076 |
Occupancy by Householder Income Bracket in Starkville
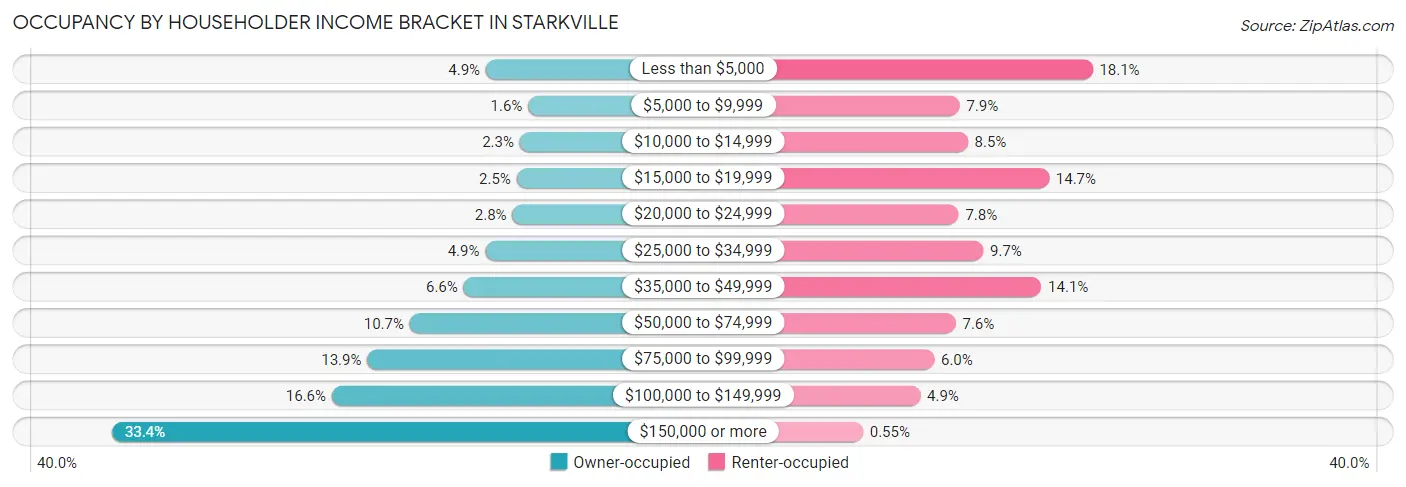
| Income Bracket | Owner-occupied | Renter-occupied |
| Less than $5,000 | 199 (4.9%) | 1,222 (18.0%) |
| $5,000 to $9,999 | 67 (1.6%) | 536 (7.9%) |
| $10,000 to $14,999 | 93 (2.3%) | 578 (8.5%) |
| $15,000 to $19,999 | 103 (2.5%) | 997 (14.7%) |
| $20,000 to $24,999 | 116 (2.8%) | 531 (7.8%) |
| $25,000 to $34,999 | 201 (4.9%) | 658 (9.7%) |
| $35,000 to $49,999 | 269 (6.6%) | 957 (14.1%) |
| $50,000 to $74,999 | 437 (10.6%) | 516 (7.6%) |
| $75,000 to $99,999 | 570 (13.9%) | 405 (6.0%) |
| $100,000 to $149,999 | 681 (16.6%) | 333 (4.9%) |
| $150,000 or more | 1,369 (33.4%) | 37 (0.5%) |
| Total | 4,105 (100.0%) | 6,770 (100.0%) |
Monthly Housing Cost Tiers in Starkville
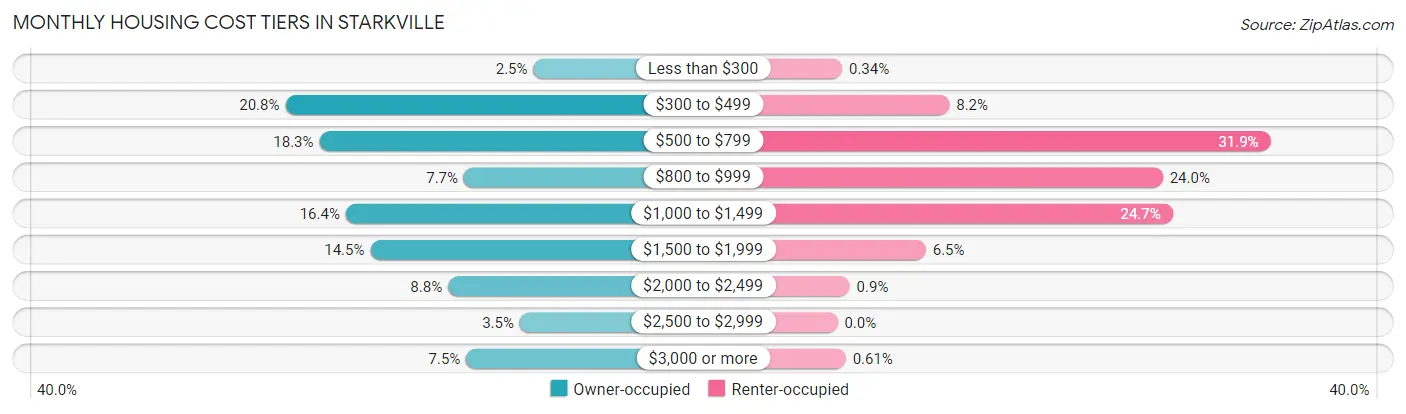
| Monthly Cost | Owner-occupied | Renter-occupied |
| Less than $300 | 104 (2.5%) | 23 (0.3%) |
| $300 to $499 | 854 (20.8%) | 558 (8.2%) |
| $500 to $799 | 751 (18.3%) | 2,159 (31.9%) |
| $800 to $999 | 314 (7.6%) | 1,622 (24.0%) |
| $1,000 to $1,499 | 671 (16.4%) | 1,671 (24.7%) |
| $1,500 to $1,999 | 597 (14.5%) | 441 (6.5%) |
| $2,000 to $2,499 | 362 (8.8%) | 61 (0.9%) |
| $2,500 to $2,999 | 145 (3.5%) | 0 (0.0%) |
| $3,000 or more | 307 (7.5%) | 41 (0.6%) |
| Total | 4,105 (100.0%) | 6,770 (100.0%) |
Physical Housing Characteristics in Starkville
Housing Structures in Starkville
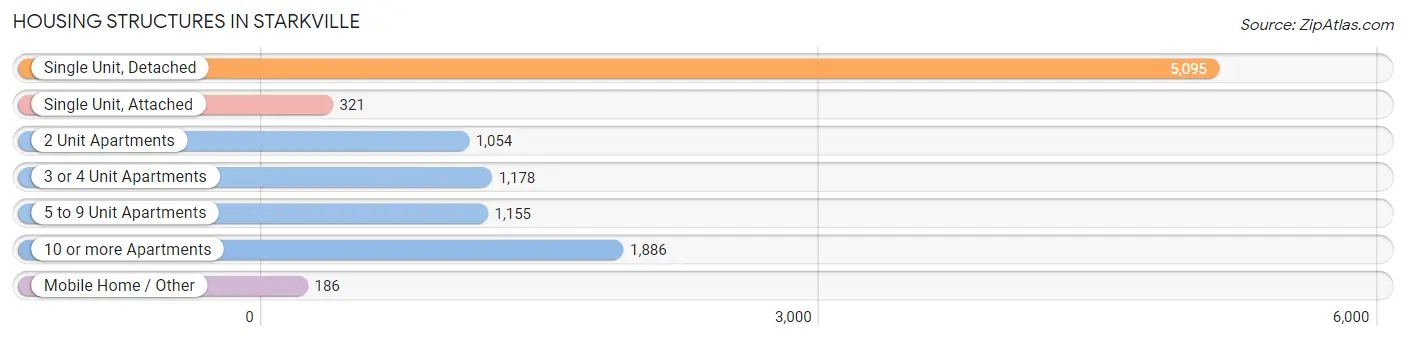
| Structure Type | # Housing Units | % Housing Units |
| Single Unit, Detached | 5,095 | 46.9% |
| Single Unit, Attached | 321 | 2.9% |
| 2 Unit Apartments | 1,054 | 9.7% |
| 3 or 4 Unit Apartments | 1,178 | 10.8% |
| 5 to 9 Unit Apartments | 1,155 | 10.6% |
| 10 or more Apartments | 1,886 | 17.3% |
| Mobile Home / Other | 186 | 1.7% |
| Total | 10,875 | 100.0% |
Housing Structures by Occupancy in Starkville
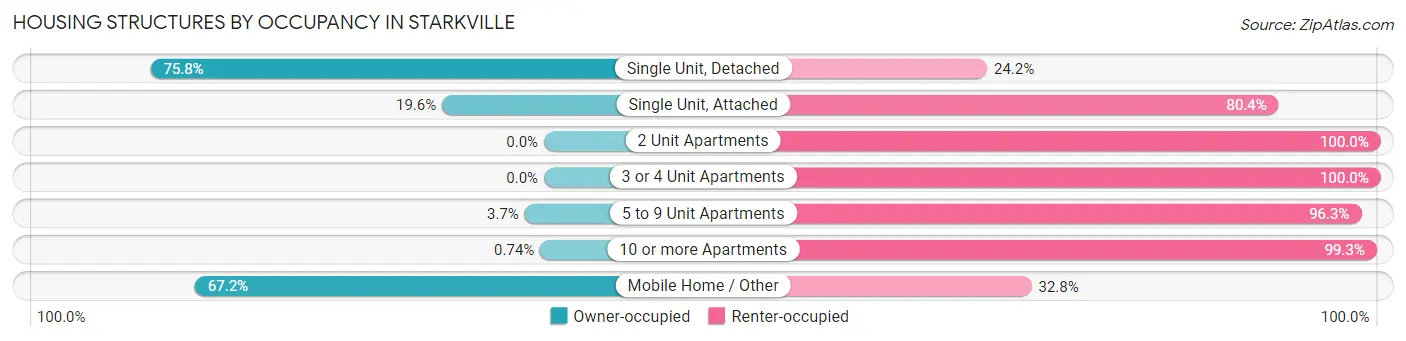
| Structure Type | Owner-occupied | Renter-occupied |
| Single Unit, Detached | 3,860 (75.8%) | 1,235 (24.2%) |
| Single Unit, Attached | 63 (19.6%) | 258 (80.4%) |
| 2 Unit Apartments | 0 (0.0%) | 1,054 (100.0%) |
| 3 or 4 Unit Apartments | 0 (0.0%) | 1,178 (100.0%) |
| 5 to 9 Unit Apartments | 43 (3.7%) | 1,112 (96.3%) |
| 10 or more Apartments | 14 (0.7%) | 1,872 (99.3%) |
| Mobile Home / Other | 125 (67.2%) | 61 (32.8%) |
| Total | 4,105 (37.8%) | 6,770 (62.3%) |
Housing Structures by Number of Rooms in Starkville
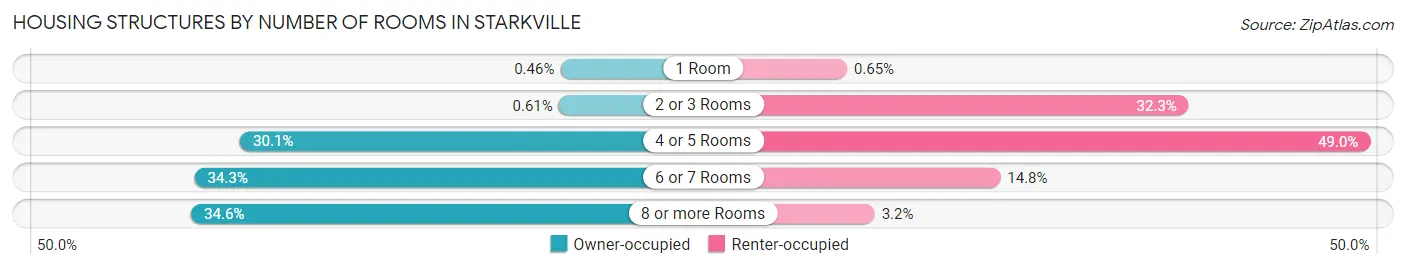
| Number of Rooms | Owner-occupied | Renter-occupied |
| 1 Room | 19 (0.5%) | 44 (0.6%) |
| 2 or 3 Rooms | 25 (0.6%) | 2,183 (32.3%) |
| 4 or 5 Rooms | 1,234 (30.1%) | 3,320 (49.0%) |
| 6 or 7 Rooms | 1,407 (34.3%) | 1,005 (14.8%) |
| 8 or more Rooms | 1,420 (34.6%) | 218 (3.2%) |
| Total | 4,105 (100.0%) | 6,770 (100.0%) |
Housing Structure by Heating Type in Starkville
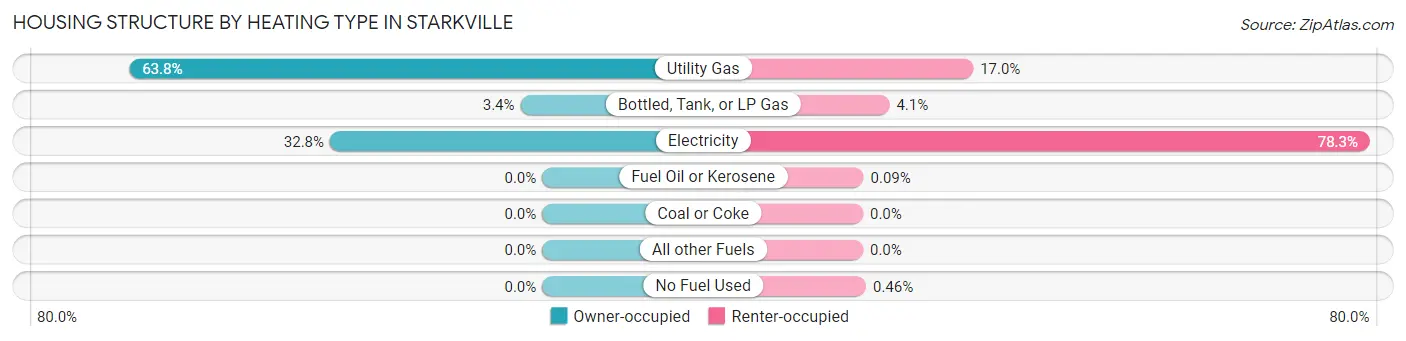
| Heating Type | Owner-occupied | Renter-occupied |
| Utility Gas | 2,620 (63.8%) | 1,153 (17.0%) |
| Bottled, Tank, or LP Gas | 138 (3.4%) | 277 (4.1%) |
| Electricity | 1,347 (32.8%) | 5,303 (78.3%) |
| Fuel Oil or Kerosene | 0 (0.0%) | 6 (0.1%) |
| Coal or Coke | 0 (0.0%) | 0 (0.0%) |
| All other Fuels | 0 (0.0%) | 0 (0.0%) |
| No Fuel Used | 0 (0.0%) | 31 (0.5%) |
| Total | 4,105 (100.0%) | 6,770 (100.0%) |
Household Vehicle Usage in Starkville
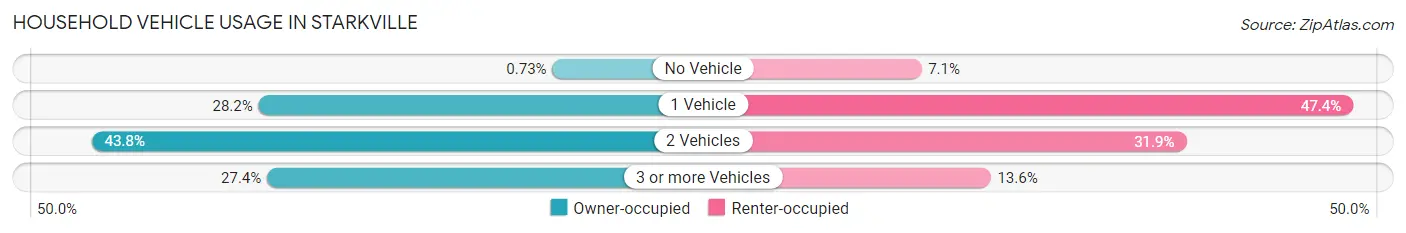
| Vehicles per Household | Owner-occupied | Renter-occupied |
| No Vehicle | 30 (0.7%) | 482 (7.1%) |
| 1 Vehicle | 1,156 (28.2%) | 3,211 (47.4%) |
| 2 Vehicles | 1,796 (43.8%) | 2,157 (31.9%) |
| 3 or more Vehicles | 1,123 (27.4%) | 920 (13.6%) |
| Total | 4,105 (100.0%) | 6,770 (100.0%) |
Real Estate & Mortgages in Starkville
Real Estate and Mortgage Overview in Starkville
| Characteristic | Without Mortgage | With Mortgage |
| Housing Units | 1,771 | 2,334 |
| Median Property Value | $224,200 | $253,500 |
| Median Household Income | $81,051 | $882 |
| Monthly Housing Costs | $486 | $307 |
| Real Estate Taxes | $2,122 | $185 |
Property Value by Mortgage Status in Starkville
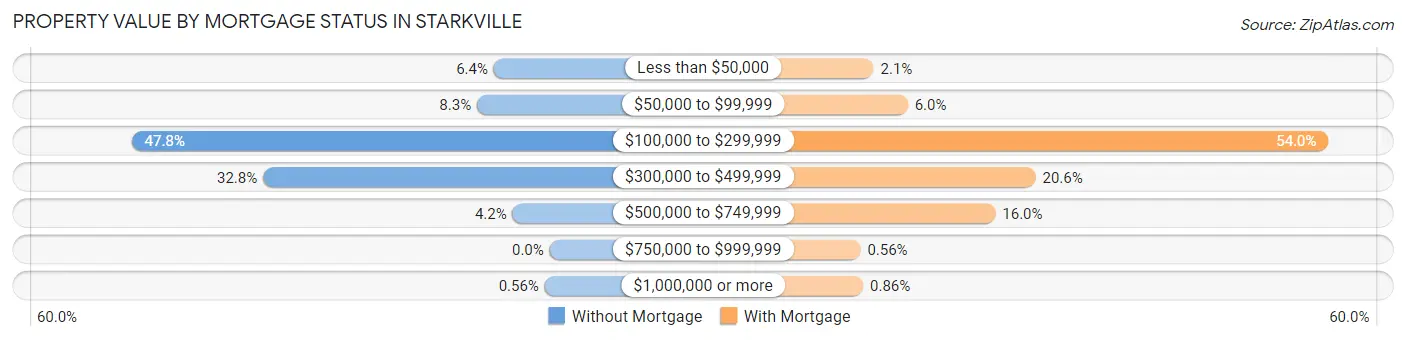
| Property Value | Without Mortgage | With Mortgage |
| Less than $50,000 | 113 (6.4%) | 48 (2.1%) |
| $50,000 to $99,999 | 147 (8.3%) | 139 (6.0%) |
| $100,000 to $299,999 | 846 (47.8%) | 1,261 (54.0%) |
| $300,000 to $499,999 | 580 (32.8%) | 480 (20.6%) |
| $500,000 to $749,999 | 75 (4.2%) | 373 (16.0%) |
| $750,000 to $999,999 | 0 (0.0%) | 13 (0.6%) |
| $1,000,000 or more | 10 (0.6%) | 20 (0.9%) |
| Total | 1,771 (100.0%) | 2,334 (100.0%) |
Household Income by Mortgage Status in Starkville
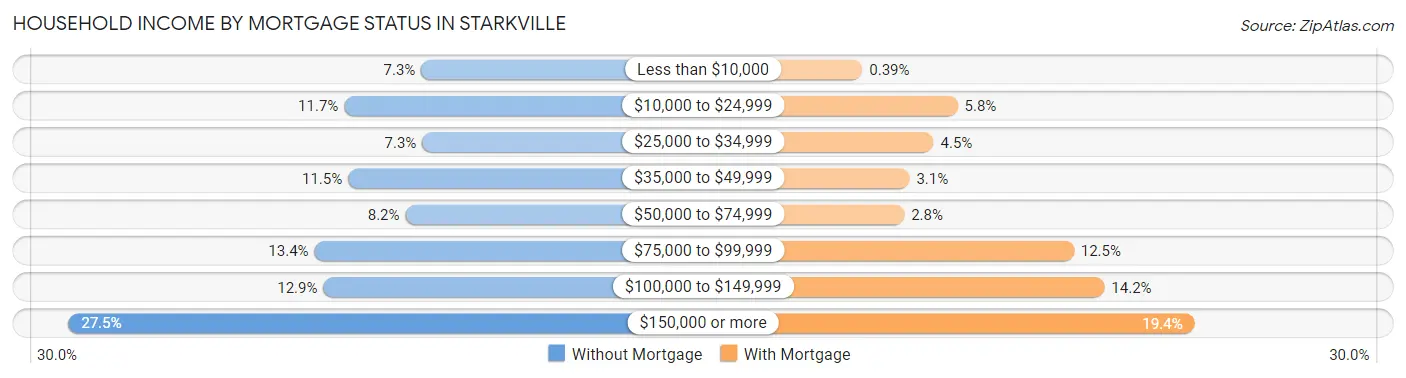
| Household Income | Without Mortgage | With Mortgage |
| Less than $10,000 | 130 (7.3%) | 9 (0.4%) |
| $10,000 to $24,999 | 208 (11.7%) | 136 (5.8%) |
| $25,000 to $34,999 | 129 (7.3%) | 104 (4.5%) |
| $35,000 to $49,999 | 204 (11.5%) | 72 (3.1%) |
| $50,000 to $74,999 | 146 (8.2%) | 65 (2.8%) |
| $75,000 to $99,999 | 238 (13.4%) | 291 (12.5%) |
| $100,000 to $149,999 | 229 (12.9%) | 332 (14.2%) |
| $150,000 or more | 487 (27.5%) | 452 (19.4%) |
| Total | 1,771 (100.0%) | 2,334 (100.0%) |
Property Value to Household Income Ratio in Starkville
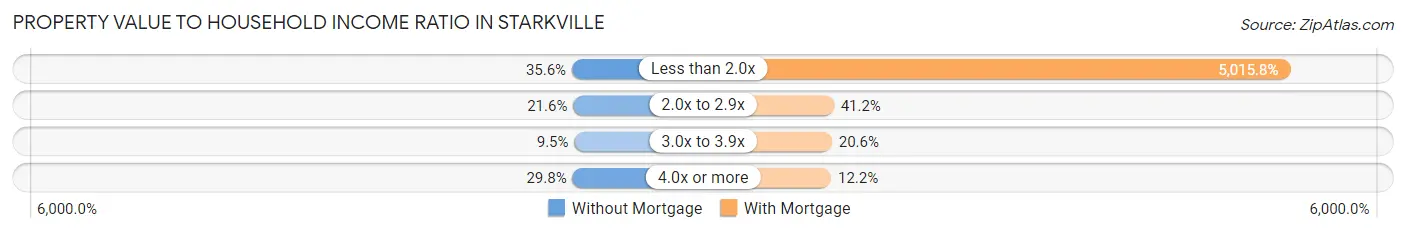
| Value-to-Income Ratio | Without Mortgage | With Mortgage |
| Less than 2.0x | 630 (35.6%) | 117,069 (5,015.8%) |
| 2.0x to 2.9x | 383 (21.6%) | 962 (41.2%) |
| 3.0x to 3.9x | 169 (9.5%) | 480 (20.6%) |
| 4.0x or more | 528 (29.8%) | 284 (12.2%) |
| Total | 1,771 (100.0%) | 2,334 (100.0%) |
Real Estate Taxes by Mortgage Status in Starkville
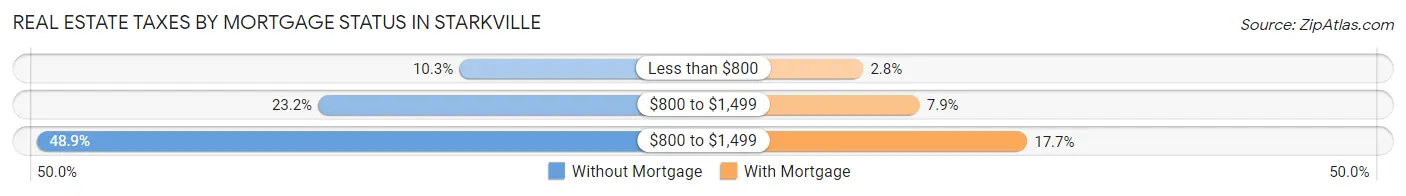
| Property Taxes | Without Mortgage | With Mortgage |
| Less than $800 | 183 (10.3%) | 65 (2.8%) |
| $800 to $1,499 | 411 (23.2%) | 185 (7.9%) |
| $800 to $1,499 | 866 (48.9%) | 414 (17.7%) |
| Total | 1,771 (100.0%) | 2,334 (100.0%) |
Health & Disability in Starkville
Health Insurance Coverage by Age in Starkville
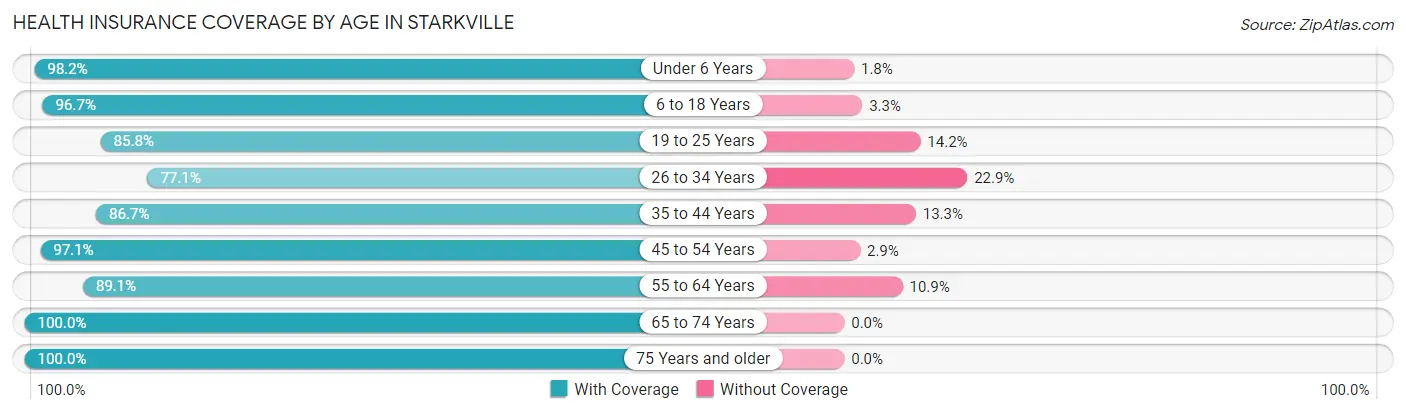
| Age Bracket | With Coverage | Without Coverage |
| Under 6 Years | 1,184 (98.2%) | 22 (1.8%) |
| 6 to 18 Years | 3,561 (96.7%) | 123 (3.3%) |
| 19 to 25 Years | 5,792 (85.8%) | 958 (14.2%) |
| 26 to 34 Years | 2,250 (77.1%) | 669 (22.9%) |
| 35 to 44 Years | 2,568 (86.7%) | 395 (13.3%) |
| 45 to 54 Years | 1,753 (97.1%) | 53 (2.9%) |
| 55 to 64 Years | 1,608 (89.1%) | 196 (10.9%) |
| 65 to 74 Years | 1,283 (100.0%) | 0 (0.0%) |
| 75 Years and older | 1,359 (100.0%) | 0 (0.0%) |
| Total | 21,358 (89.8%) | 2,416 (10.2%) |
Health Insurance Coverage by Citizenship Status in Starkville
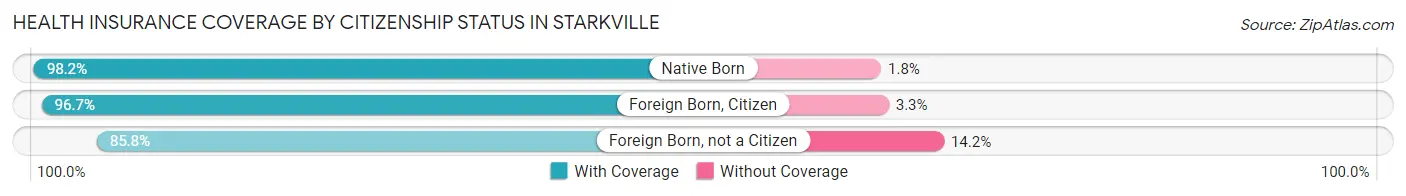
| Citizenship Status | With Coverage | Without Coverage |
| Native Born | 1,184 (98.2%) | 22 (1.8%) |
| Foreign Born, Citizen | 3,561 (96.7%) | 123 (3.3%) |
| Foreign Born, not a Citizen | 5,792 (85.8%) | 958 (14.2%) |
Health Insurance Coverage by Household Income in Starkville
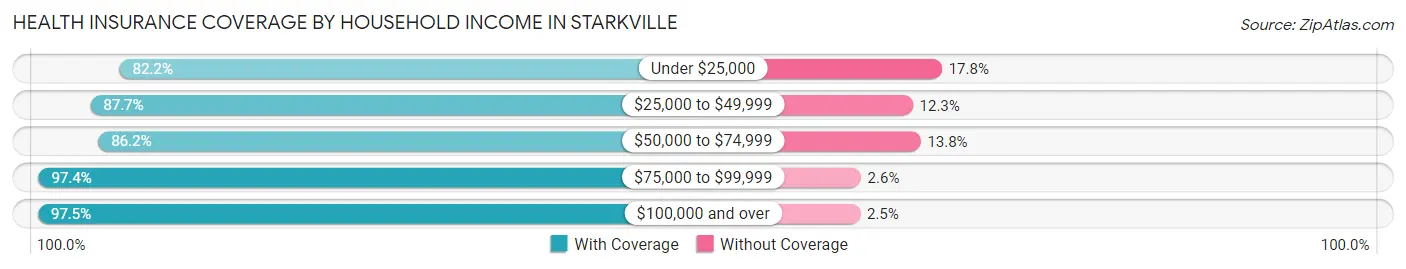
| Household Income | With Coverage | Without Coverage |
| Under $25,000 | 6,030 (82.2%) | 1,305 (17.8%) |
| $25,000 to $49,999 | 3,718 (87.7%) | 523 (12.3%) |
| $50,000 to $74,999 | 2,137 (86.2%) | 342 (13.8%) |
| $75,000 to $99,999 | 1,986 (97.4%) | 53 (2.6%) |
| $100,000 and over | 6,771 (97.5%) | 172 (2.5%) |
Public vs Private Health Insurance Coverage by Age in Starkville
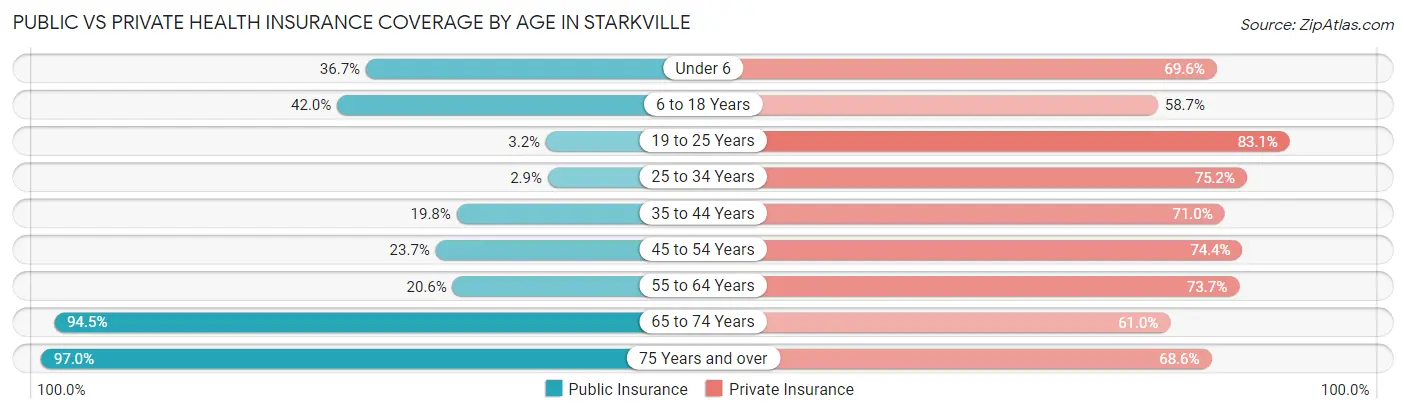
| Age Bracket | Public Insurance | Private Insurance |
| Under 6 | 442 (36.6%) | 839 (69.6%) |
| 6 to 18 Years | 1,547 (42.0%) | 2,161 (58.7%) |
| 19 to 25 Years | 219 (3.2%) | 5,611 (83.1%) |
| 25 to 34 Years | 84 (2.9%) | 2,194 (75.2%) |
| 35 to 44 Years | 587 (19.8%) | 2,105 (71.0%) |
| 45 to 54 Years | 428 (23.7%) | 1,343 (74.4%) |
| 55 to 64 Years | 371 (20.6%) | 1,330 (73.7%) |
| 65 to 74 Years | 1,213 (94.5%) | 782 (61.0%) |
| 75 Years and over | 1,318 (97.0%) | 932 (68.6%) |
| Total | 6,209 (26.1%) | 17,297 (72.8%) |
Disability Status by Sex by Age in Starkville
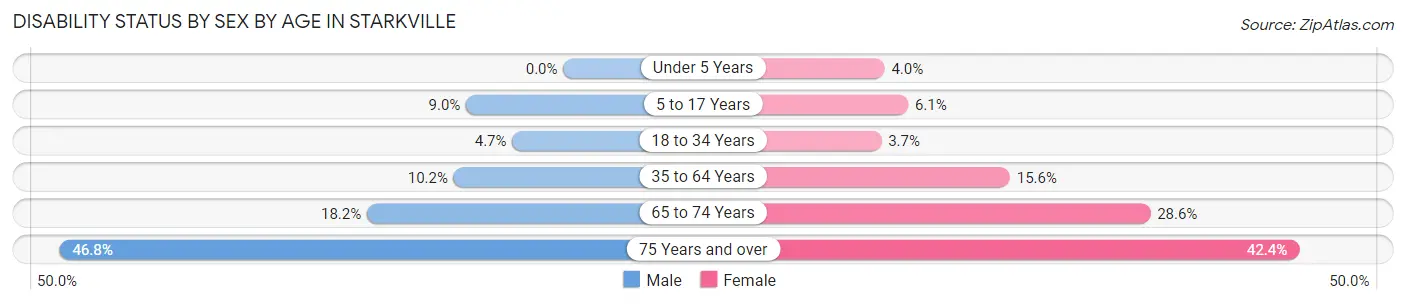
| Age Bracket | Male | Female |
| Under 5 Years | 0 (0.0%) | 15 (4.0%) |
| 5 to 17 Years | 174 (9.0%) | 95 (6.1%) |
| 18 to 34 Years | 278 (4.7%) | 157 (3.7%) |
| 35 to 64 Years | 307 (10.2%) | 554 (15.6%) |
| 65 to 74 Years | 88 (18.2%) | 229 (28.6%) |
| 75 Years and over | 209 (46.8%) | 387 (42.4%) |
Disability Class by Sex by Age in Starkville
Disability Class: Hearing Difficulty
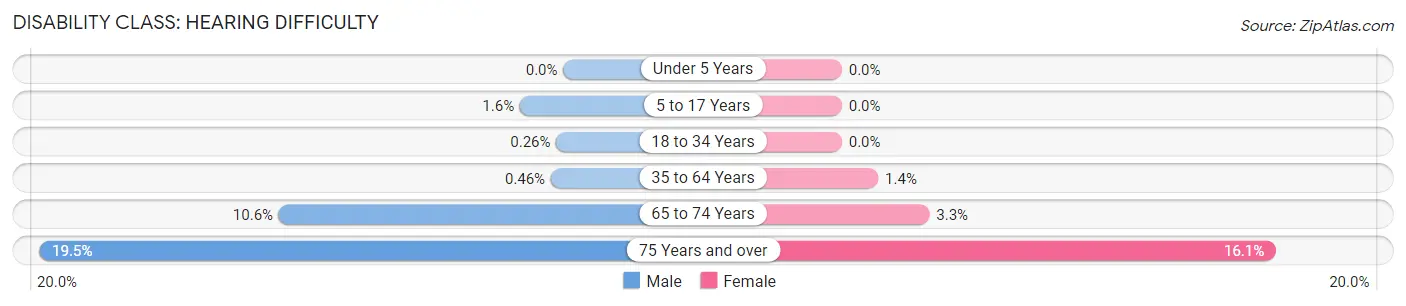
| Age Bracket | Male | Female |
| Under 5 Years | 0 (0.0%) | 0 (0.0%) |
| 5 to 17 Years | 31 (1.6%) | 0 (0.0%) |
| 18 to 34 Years | 15 (0.3%) | 0 (0.0%) |
| 35 to 64 Years | 14 (0.5%) | 48 (1.3%) |
| 65 to 74 Years | 51 (10.6%) | 26 (3.3%) |
| 75 Years and over | 87 (19.5%) | 147 (16.1%) |
Disability Class: Vision Difficulty
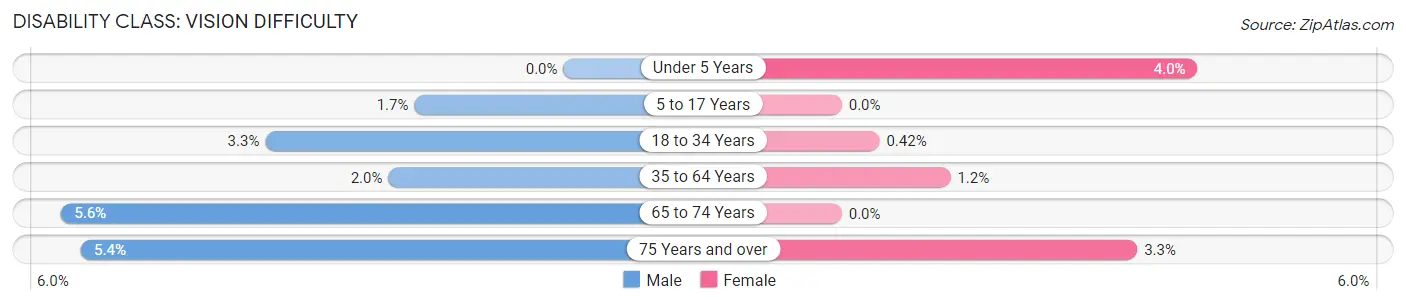
| Age Bracket | Male | Female |
| Under 5 Years | 0 (0.0%) | 15 (4.0%) |
| 5 to 17 Years | 32 (1.7%) | 0 (0.0%) |
| 18 to 34 Years | 195 (3.3%) | 18 (0.4%) |
| 35 to 64 Years | 59 (1.9%) | 43 (1.2%) |
| 65 to 74 Years | 27 (5.6%) | 0 (0.0%) |
| 75 Years and over | 24 (5.4%) | 30 (3.3%) |
Disability Class: Cognitive Difficulty
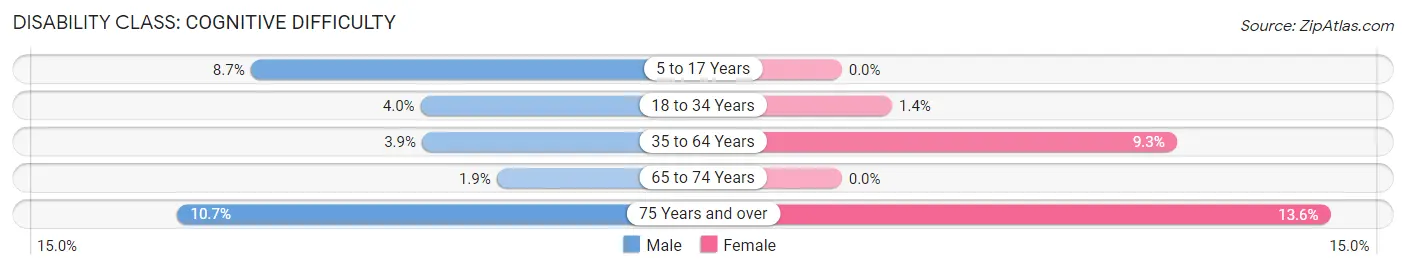
| Age Bracket | Male | Female |
| 5 to 17 Years | 168 (8.7%) | 0 (0.0%) |
| 18 to 34 Years | 234 (4.0%) | 60 (1.4%) |
| 35 to 64 Years | 119 (3.9%) | 331 (9.3%) |
| 65 to 74 Years | 9 (1.9%) | 0 (0.0%) |
| 75 Years and over | 48 (10.7%) | 124 (13.6%) |
Disability Class: Ambulatory Difficulty
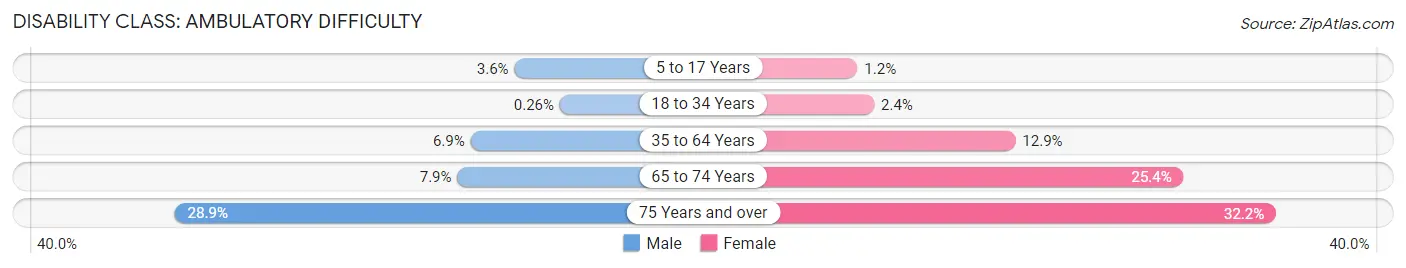
| Age Bracket | Male | Female |
| 5 to 17 Years | 70 (3.6%) | 18 (1.2%) |
| 18 to 34 Years | 15 (0.3%) | 103 (2.4%) |
| 35 to 64 Years | 208 (6.9%) | 458 (12.9%) |
| 65 to 74 Years | 38 (7.9%) | 203 (25.4%) |
| 75 Years and over | 129 (28.9%) | 294 (32.2%) |
Disability Class: Self-Care Difficulty
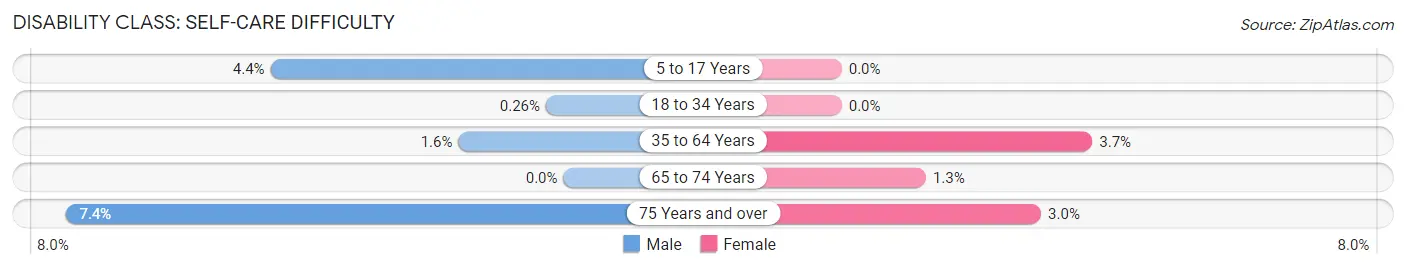
| Age Bracket | Male | Female |
| 5 to 17 Years | 84 (4.3%) | 0 (0.0%) |
| 18 to 34 Years | 15 (0.3%) | 0 (0.0%) |
| 35 to 64 Years | 47 (1.6%) | 132 (3.7%) |
| 65 to 74 Years | 0 (0.0%) | 10 (1.3%) |
| 75 Years and over | 33 (7.4%) | 27 (3.0%) |
Technology Access in Starkville
Computing Device Access in Starkville
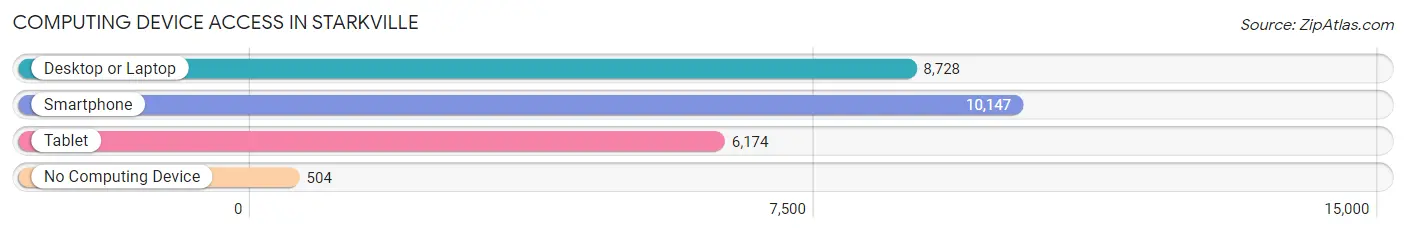
| Device Type | # Households | % Households |
| Desktop or Laptop | 8,728 | 80.3% |
| Smartphone | 10,147 | 93.3% |
| Tablet | 6,174 | 56.8% |
| No Computing Device | 504 | 4.6% |
| Total | 10,875 | 100.0% |
Internet Access in Starkville
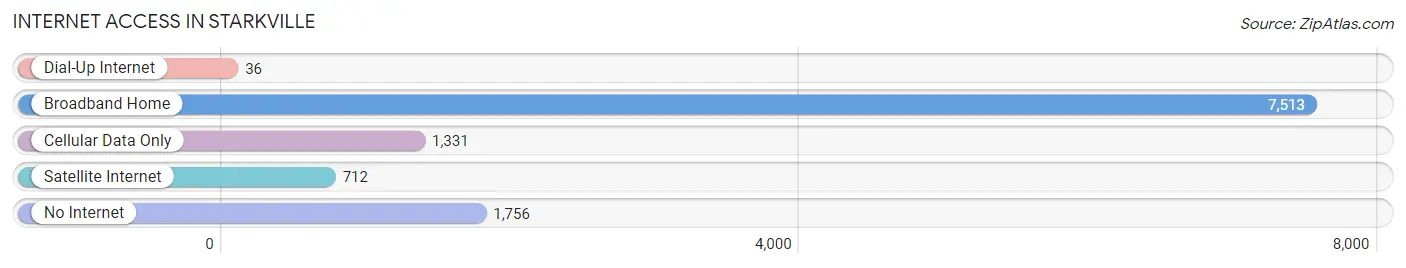
| Internet Type | # Households | % Households |
| Dial-Up Internet | 36 | 0.3% |
| Broadband Home | 7,513 | 69.1% |
| Cellular Data Only | 1,331 | 12.2% |
| Satellite Internet | 712 | 6.6% |
| No Internet | 1,756 | 16.2% |
| Total | 10,875 | 100.0% |
Starkville Summary
Starkville, Mississippi is a city located in Oktibbeha County in the northeastern part of the state. It is the county seat and the largest city in the county. The city is home to Mississippi State University, the state’s flagship university. Starkville is located approximately 100 miles northeast of Jackson, the state capital.
History
Starkville was founded in 1835 and named after Revolutionary War hero General John Stark. The city was originally a trading post and was known as Boardtown. In 1839, the city was renamed Starkville in honor of General Stark. The city was incorporated in 1853 and was the first city in the state to have a mayor and aldermen.
During the Civil War, Starkville was the site of a major battle between Union and Confederate forces. The Battle of Oktibbeha County was fought in 1862 and resulted in a Confederate victory.
In the late 19th century, Starkville became an important railroad hub. The city was home to several cotton mills and other industries. The city’s economy was largely based on agriculture and the railroad.
In the early 20th century, Starkville was home to several colleges and universities, including Mississippi State University. The university was founded in 1878 and is the state’s flagship university.
Geography
Starkville is located in the northeastern part of the state, in Oktibbeha County. The city is situated on the banks of the Tombigbee River. The city is located approximately 100 miles northeast of Jackson, the state capital.
The city has a total area of 16.2 square miles, of which 16.1 square miles is land and 0.1 square miles is water. The city is located in the Black Belt region of the state, which is known for its rich, fertile soil.
Economy
Starkville’s economy is largely based on agriculture and education. The city is home to Mississippi State University, the state’s flagship university. The university is a major employer in the city and provides jobs for thousands of people.
The city is also home to several manufacturing companies, including a furniture factory, a paper mill, and a printing company. The city is also home to several retail stores, restaurants, and other businesses.
Demographics
As of the 2010 census, Starkville had a population of 23,888. The racial makeup of the city was 68.2% White, 28.3% African American, 0.3% Native American, 1.2% Asian, 0.1% Pacific Islander, 0.7% from other races, and 1.4% from two or more races. Hispanic or Latino of any race were 2.2% of the population.
The median income for a household in the city was $30,912, and the median income for a family was $41,945. The per capita income for the city was $17,845. About 17.2% of families and 24.3% of the population were below the poverty line, including 33.2% of those under age 18 and 11.2% of those age 65 or over.
Common Questions
What is Per Capita Income in Starkville?
Per Capita income in Starkville is $31,354.
What is the Median Family Income in Starkville?
Median Family Income in Starkville is $76,807.
What is the Median Household income in Starkville?
Median Household Income in Starkville is $36,076.
What is Income or Wage Gap in Starkville?
Income or Wage Gap in Starkville is 20.8%.
Women in Starkville earn 79.2 cents for every dollar earned by a man.
What is Family Income Deficit in Starkville?
Family Income Deficit in Starkville is $11,564.
Families that are below poverty line in Starkville earn $11,564 less on average than the poverty threshold level.
What is Inequality or Gini Index in Starkville?
Inequality or Gini Index in Starkville is 0.59.
What is the Total Population of Starkville?
Total Population of Starkville is 24,274.
What is the Total Male Population of Starkville?
Total Male Population of Starkville is 12,648.
What is the Total Female Population of Starkville?
Total Female Population of Starkville is 11,626.
What is the Ratio of Males per 100 Females in Starkville?
There are 108.79 Males per 100 Females in Starkville.
What is the Ratio of Females per 100 Males in Starkville?
There are 91.92 Females per 100 Males in Starkville.
What is the Median Population Age in Starkville?
Median Population Age in Starkville is 27.0 Years.
What is the Average Family Size in Starkville
Average Family Size in Starkville is 2.9 People.
What is the Average Household Size in Starkville
Average Household Size in Starkville is 2.1 People.
How Large is the Labor Force in Starkville?
There are 12,510 People in the Labor Forcein in Starkville.
What is the Percentage of People in the Labor Force in Starkville?
61.3% of People are in the Labor Force in Starkville.
What is the Unemployment Rate in Starkville?
Unemployment Rate in Starkville is 7.9%.