Kosciusko, MS Map & Demographics
Kosciusko Map
Kosciusko Overview
$33,573
PER CAPITA INCOME
$51,382
AVG FAMILY INCOME
$33,719
AVG HOUSEHOLD INCOME
24.5%
WAGE / INCOME GAP [ % ]
75.5¢/ $1
WAGE / INCOME GAP [ $ ]
0.62
INEQUALITY / GINI INDEX
7,056
TOTAL POPULATION
3,077
MALE POPULATION
3,979
FEMALE POPULATION
77.33
MALES / 100 FEMALES
129.31
FEMALES / 100 MALES
36.2
MEDIAN AGE
3.6
AVG FAMILY SIZE
2.6
AVG HOUSEHOLD SIZE
3,236
LABOR FORCE [ PEOPLE ]
60.5%
PERCENT IN LABOR FORCE
5.5%
UNEMPLOYMENT RATE
Kosciusko Zip Codes
Kosciusko Area Codes
Income in Kosciusko
Income Overview in Kosciusko
Per Capita Income in Kosciusko is $33,573, while median incomes of families and households are $51,382 and $33,719 respectively.
| Characteristic | Number | Measure |
| Per Capita Income | 7,056 | $33,573 |
| Median Family Income | 1,489 | $51,382 |
| Mean Family Income | 1,489 | $107,008 |
| Median Household Income | 2,545 | $33,719 |
| Mean Household Income | 2,545 | $81,911 |
| Income Deficit | 1,489 | $0 |
| Wage / Income Gap (%) | 7,056 | 24.50% |
| Wage / Income Gap ($) | 7,056 | 75.50¢ per $1 |
| Gini / Inequality Index | 7,056 | 0.62 |
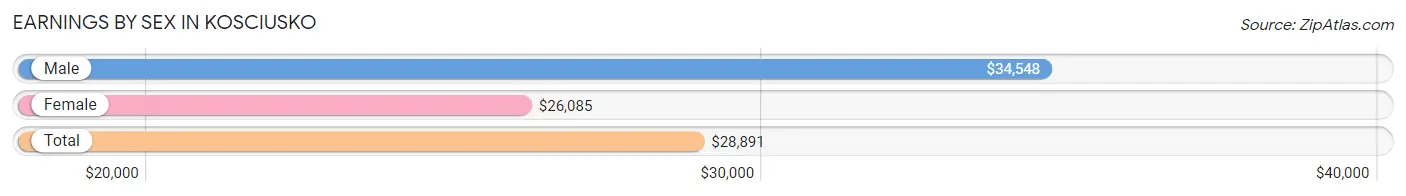
Earnings by Sex in Kosciusko
Average Earnings in Kosciusko are $28,891, $34,548 for men and $26,085 for women, a difference of 24.5%.
| Sex | Number | Average Earnings |
| Male | 1,548 (45.7%) | $34,548 |
| Female | 1,841 (54.3%) | $26,085 |
| Total | 3,389 (100.0%) | $28,891 |
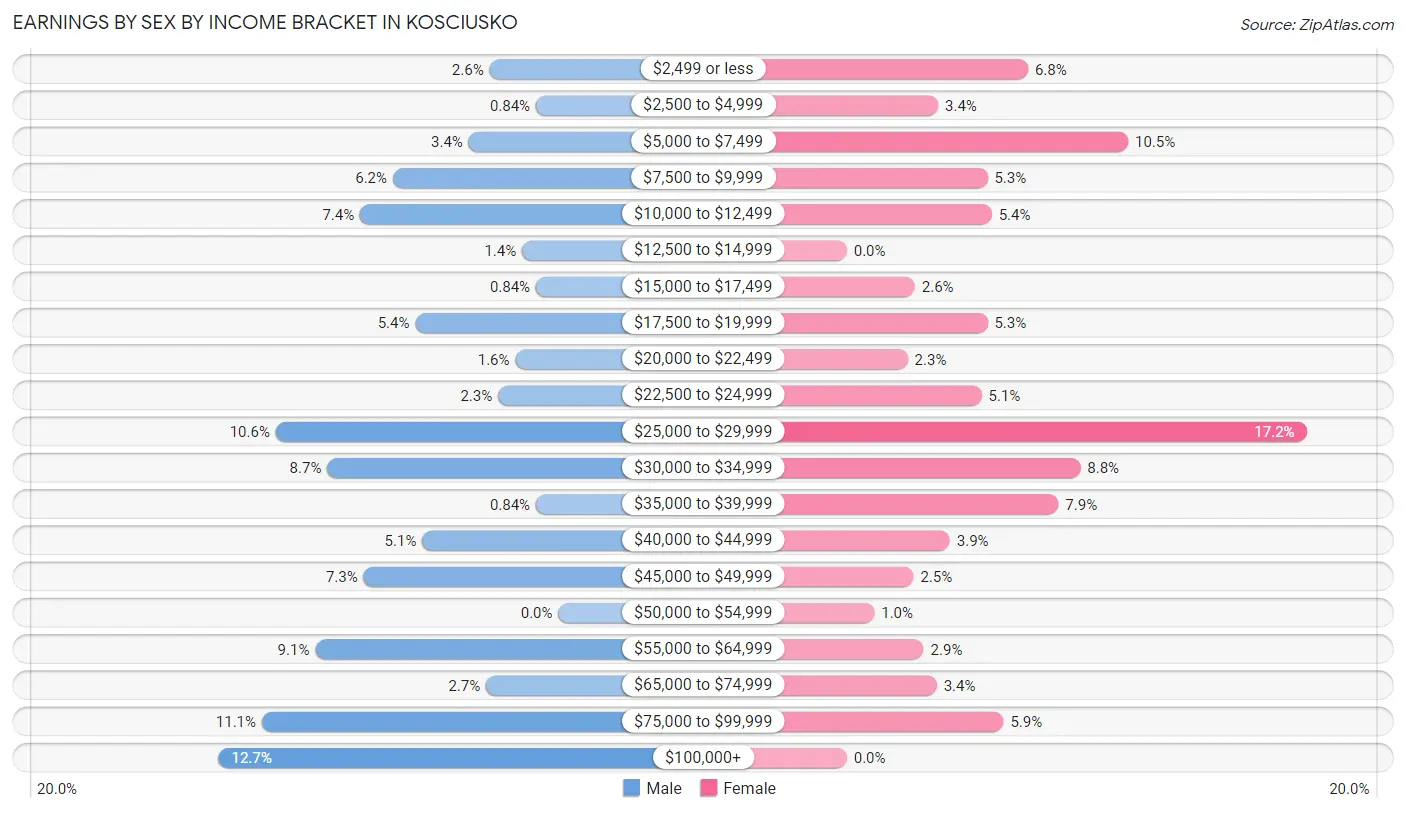
Earnings by Sex by Income Bracket in Kosciusko
The most common earnings brackets in Kosciusko are $100,000+ for men (197 | 12.7%) and $25,000 to $29,999 for women (317 | 17.2%).
| Income | Male | Female |
| $2,499 or less | 40 (2.6%) | 125 (6.8%) |
| $2,500 to $4,999 | 13 (0.8%) | 63 (3.4%) |
| $5,000 to $7,499 | 52 (3.4%) | 194 (10.5%) |
| $7,500 to $9,999 | 96 (6.2%) | 97 (5.3%) |
| $10,000 to $12,499 | 115 (7.4%) | 100 (5.4%) |
| $12,500 to $14,999 | 21 (1.4%) | 0 (0.0%) |
| $15,000 to $17,499 | 13 (0.8%) | 47 (2.5%) |
| $17,500 to $19,999 | 83 (5.4%) | 97 (5.3%) |
| $20,000 to $22,499 | 25 (1.6%) | 42 (2.3%) |
| $22,500 to $24,999 | 35 (2.3%) | 93 (5.1%) |
| $25,000 to $29,999 | 164 (10.6%) | 317 (17.2%) |
| $30,000 to $34,999 | 134 (8.7%) | 161 (8.7%) |
| $35,000 to $39,999 | 13 (0.8%) | 146 (7.9%) |
| $40,000 to $44,999 | 79 (5.1%) | 71 (3.9%) |
| $45,000 to $49,999 | 113 (7.3%) | 46 (2.5%) |
| $50,000 to $54,999 | 0 (0.0%) | 19 (1.0%) |
| $55,000 to $64,999 | 141 (9.1%) | 53 (2.9%) |
| $65,000 to $74,999 | 42 (2.7%) | 62 (3.4%) |
| $75,000 to $99,999 | 172 (11.1%) | 108 (5.9%) |
| $100,000+ | 197 (12.7%) | 0 (0.0%) |
| Total | 1,548 (100.0%) | 1,841 (100.0%) |
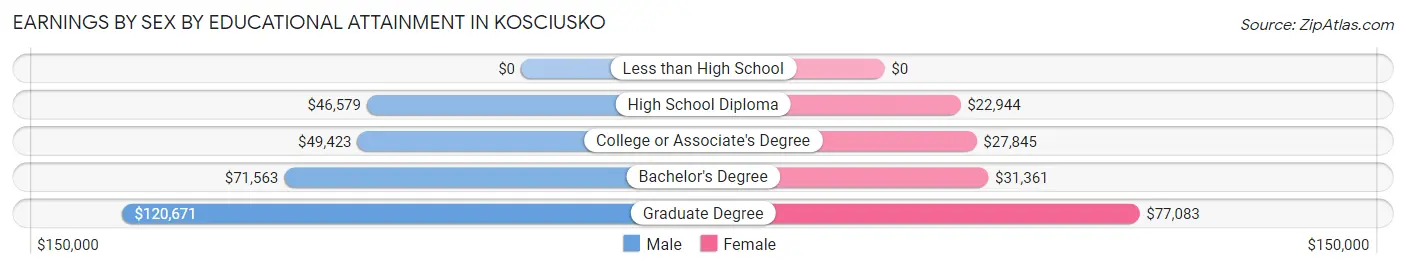
Earnings by Sex by Educational Attainment in Kosciusko
Average earnings in Kosciusko are $49,145 for men and $26,988 for women, a difference of 45.1%. Men with an educational attainment of graduate degree enjoy the highest average annual earnings of $120,671, while those with high school diploma education earn the least with $46,579. Women with an educational attainment of graduate degree earn the most with the average annual earnings of $77,083, while those with high school diploma education have the smallest earnings of $22,944.
| Educational Attainment | Male Income | Female Income |
| Less than High School | - | - |
| High School Diploma | $46,579 | $22,944 |
| College or Associate's Degree | $49,423 | $27,845 |
| Bachelor's Degree | $71,563 | $31,361 |
| Graduate Degree | $120,671 | $77,083 |
| Total | $49,145 | $26,988 |
Family Income in Kosciusko
Family Income Brackets in Kosciusko
According to the Kosciusko family income data, there are 259 families falling into the $25,000 to $34,999 income range, which is the most common income bracket and makes up 17.4% of all families. Conversely, the $10,000 to $14,999 income bracket is the least frequent group with only 28 families (1.9%) belonging to this category.
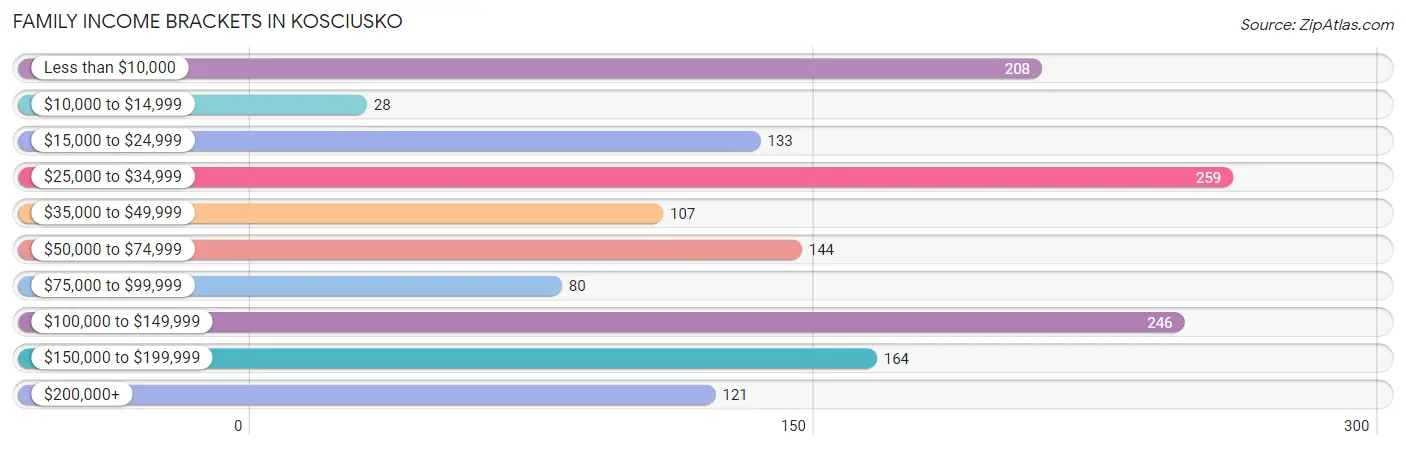
| Income Bracket | # Families | % Families |
| Less than $10,000 | 208 | 14.0% |
| $10,000 to $14,999 | 28 | 1.9% |
| $15,000 to $24,999 | 133 | 8.9% |
| $25,000 to $34,999 | 259 | 17.4% |
| $35,000 to $49,999 | 107 | 7.2% |
| $50,000 to $74,999 | 144 | 9.7% |
| $75,000 to $99,999 | 80 | 5.4% |
| $100,000 to $149,999 | 246 | 16.5% |
| $150,000 to $199,999 | 164 | 11.0% |
| $200,000+ | 121 | 8.1% |
Family Income by Famaliy Size in Kosciusko
5-person families (138 | 9.3%) account for the highest median family income in Kosciusko with $114,868 per family, while 4-person families (234 | 15.7%) have the highest median income of $26,023 per family member.
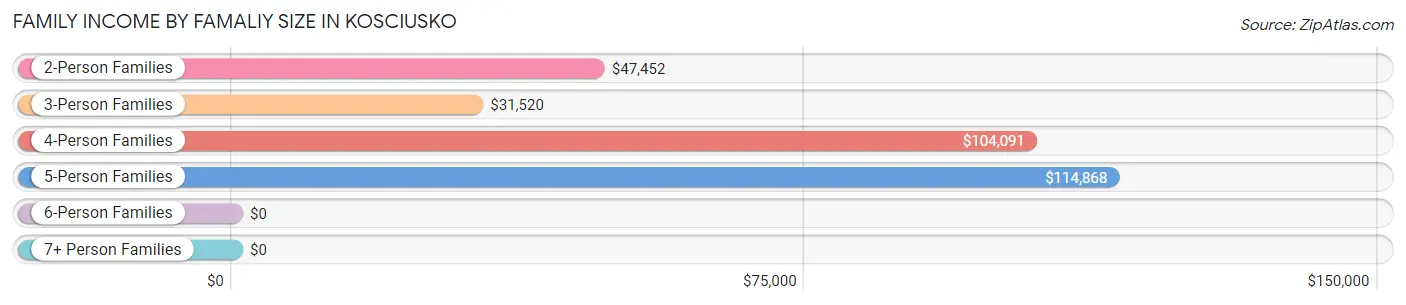
| Income Bracket | # Families | Median Income |
| 2-Person Families | 629 (42.2%) | $47,452 |
| 3-Person Families | 475 (31.9%) | $31,520 |
| 4-Person Families | 234 (15.7%) | $104,091 |
| 5-Person Families | 138 (9.3%) | $114,868 |
| 6-Person Families | 13 (0.9%) | $0 |
| 7+ Person Families | 0 (0.0%) | $0 |
| Total | 1,489 (100.0%) | $51,382 |
Family Income by Number of Earners in Kosciusko
The median family income in Kosciusko is $51,382, with families comprising 3+ earners (102) having the highest median family income of $242,976, while families with no earners (87) have the lowest median family income of $23,125, accounting for 6.9% and 5.8% of families, respectively.
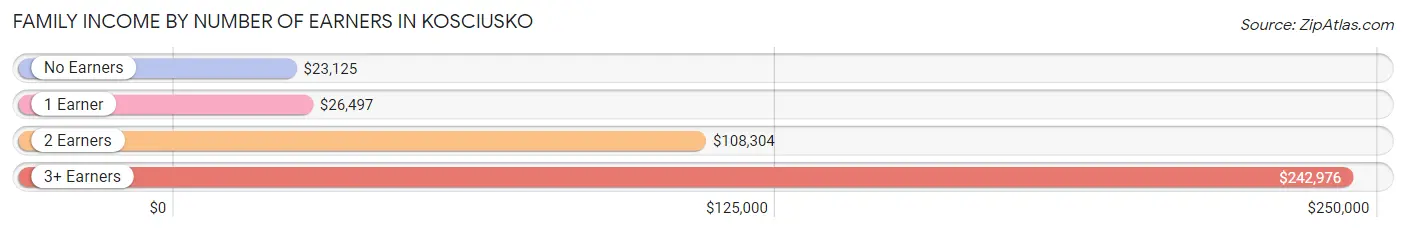
| Number of Earners | # Families | Median Income |
| No Earners | 87 (5.8%) | $23,125 |
| 1 Earner | 679 (45.6%) | $26,497 |
| 2 Earners | 621 (41.7%) | $108,304 |
| 3+ Earners | 102 (6.9%) | $242,976 |
| Total | 1,489 (100.0%) | $51,382 |
Household Income in Kosciusko
Household Income Brackets in Kosciusko
With 453 households falling in the category, the $25,000 to $34,999 income range is the most frequent in Kosciusko, accounting for 17.8% of all households. In contrast, only 137 households (5.4%) fall into the $200,000+ income bracket, making it the least populous group.
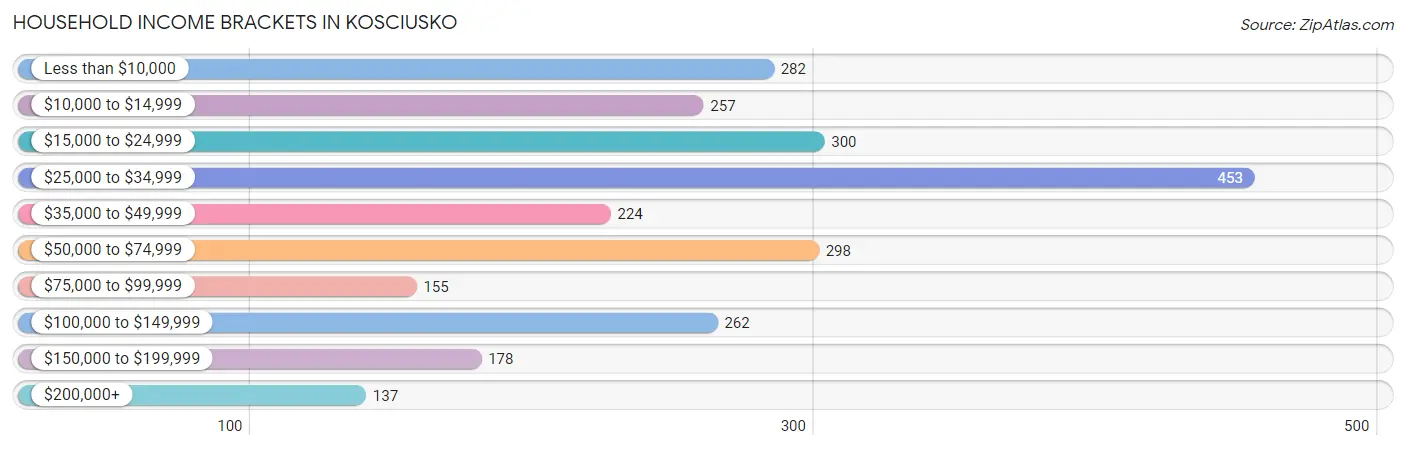
| Income Bracket | # Households | % Households |
| Less than $10,000 | 282 | 11.1% |
| $10,000 to $14,999 | 257 | 10.1% |
| $15,000 to $24,999 | 300 | 11.8% |
| $25,000 to $34,999 | 453 | 17.8% |
| $35,000 to $49,999 | 224 | 8.8% |
| $50,000 to $74,999 | 298 | 11.7% |
| $75,000 to $99,999 | 155 | 6.1% |
| $100,000 to $149,999 | 262 | 10.3% |
| $150,000 to $199,999 | 178 | 7.0% |
| $200,000+ | 137 | 5.4% |
Household Income by Householder Age in Kosciusko
The median household income in Kosciusko is $33,719, with the highest median household income of $59,423 found in the 45 to 64 years age bracket for the primary householder. A total of 914 households (35.9%) fall into this category. Meanwhile, the 65+ years age bracket for the primary householder has the lowest median household income of $23,994, with 727 households (28.6%) in this group.
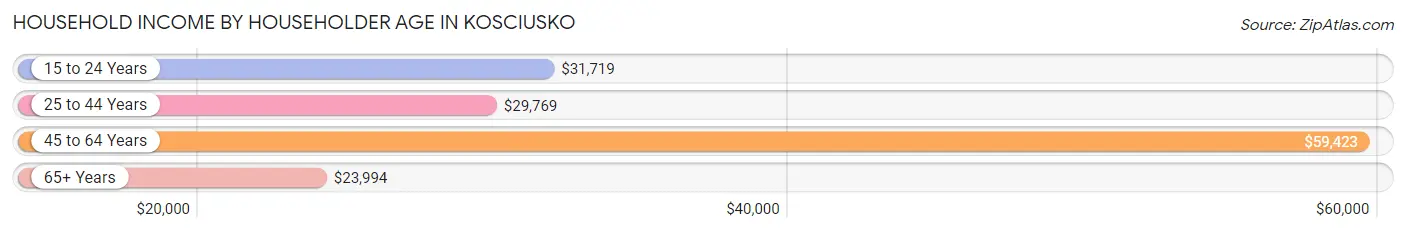
| Income Bracket | # Households | Median Income |
| 15 to 24 Years | 82 (3.2%) | $31,719 |
| 25 to 44 Years | 822 (32.3%) | $29,769 |
| 45 to 64 Years | 914 (35.9%) | $59,423 |
| 65+ Years | 727 (28.6%) | $23,994 |
| Total | 2,545 (100.0%) | $33,719 |
Poverty in Kosciusko
Income Below Poverty by Sex and Age in Kosciusko
With 16.2% poverty level for males and 37.1% for females among the residents of Kosciusko, 5 year old males and under 5 year old females are the most vulnerable to poverty, with 42 males (100.0%) and 157 females (77.3%) in their respective age groups living below the poverty level.
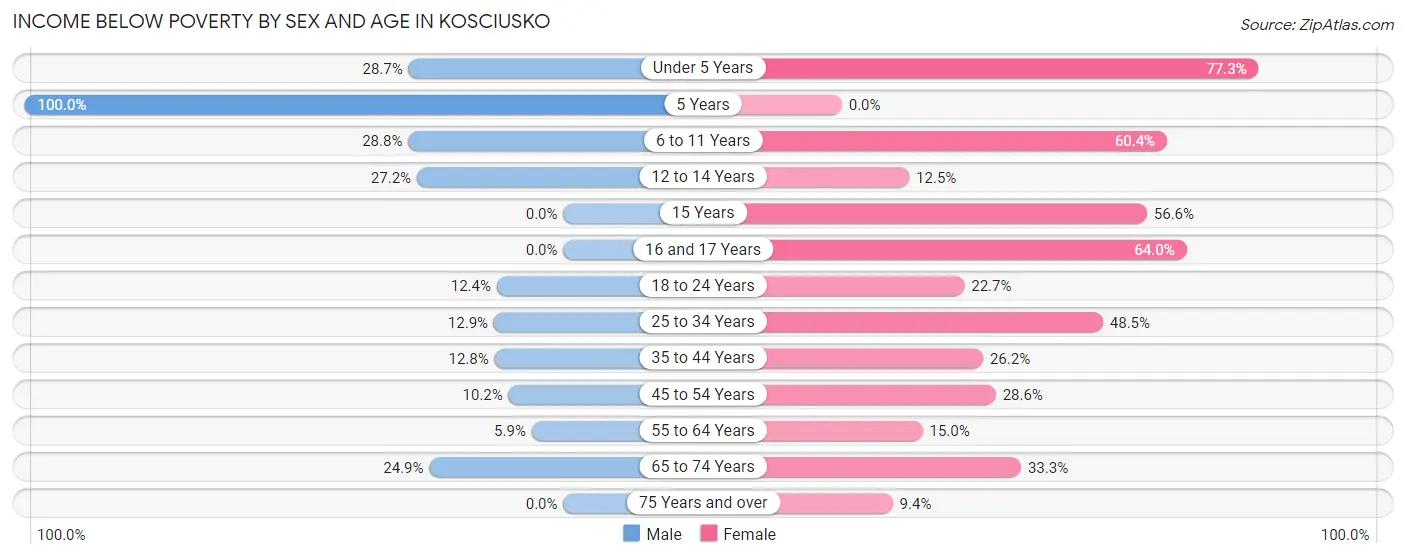
| Age Bracket | Male | Female |
| Under 5 Years | 50 (28.7%) | 157 (77.3%) |
| 5 Years | 42 (100.0%) | 0 (0.0%) |
| 6 to 11 Years | 74 (28.8%) | 277 (60.4%) |
| 12 to 14 Years | 56 (27.2%) | 6 (12.5%) |
| 15 Years | 0 (0.0%) | 77 (56.6%) |
| 16 and 17 Years | 0 (0.0%) | 87 (64.0%) |
| 18 to 24 Years | 44 (12.4%) | 73 (22.7%) |
| 25 to 34 Years | 41 (12.9%) | 268 (48.5%) |
| 35 to 44 Years | 35 (12.8%) | 135 (26.2%) |
| 45 to 54 Years | 30 (10.2%) | 124 (28.6%) |
| 55 to 64 Years | 20 (5.9%) | 46 (15.0%) |
| 65 to 74 Years | 58 (24.9%) | 150 (33.3%) |
| 75 Years and over | 0 (0.0%) | 27 (9.4%) |
| Total | 450 (16.2%) | 1,427 (37.1%) |
Income Above Poverty by Sex and Age in Kosciusko
According to the poverty statistics in Kosciusko, males aged 15 years and females aged 75 years and over are the age groups that are most secure financially, with 100.0% of males and 90.6% of females in these age groups living above the poverty line.
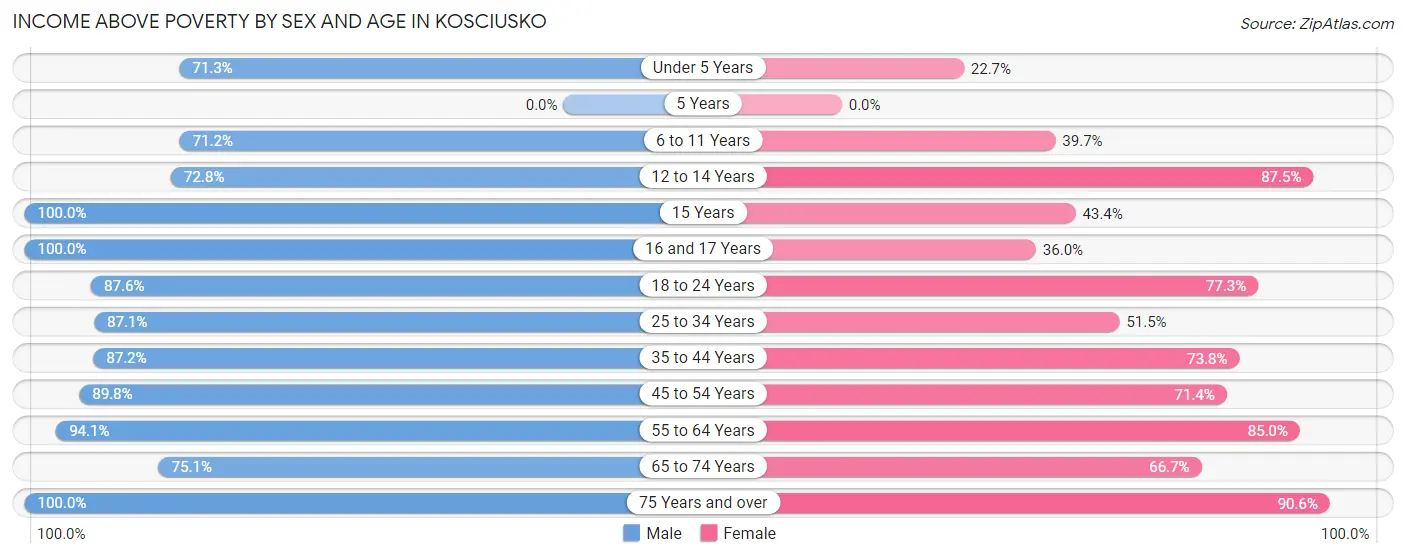
| Age Bracket | Male | Female |
| Under 5 Years | 124 (71.3%) | 46 (22.7%) |
| 5 Years | 0 (0.0%) | 0 (0.0%) |
| 6 to 11 Years | 183 (71.2%) | 182 (39.7%) |
| 12 to 14 Years | 150 (72.8%) | 42 (87.5%) |
| 15 Years | 102 (100.0%) | 59 (43.4%) |
| 16 and 17 Years | 71 (100.0%) | 49 (36.0%) |
| 18 to 24 Years | 312 (87.6%) | 248 (77.3%) |
| 25 to 34 Years | 277 (87.1%) | 285 (51.5%) |
| 35 to 44 Years | 239 (87.2%) | 380 (73.8%) |
| 45 to 54 Years | 265 (89.8%) | 310 (71.4%) |
| 55 to 64 Years | 321 (94.1%) | 261 (85.0%) |
| 65 to 74 Years | 175 (75.1%) | 301 (66.7%) |
| 75 Years and over | 110 (100.0%) | 259 (90.6%) |
| Total | 2,329 (83.8%) | 2,422 (62.9%) |
Income Below Poverty Among Married-Couple Families in Kosciusko
The poverty statistics for married-couple families in Kosciusko show that 4.3% or 33 of the total 759 families live below the poverty line. Families with 3 or 4 children have the highest poverty rate of 23.6%, comprising of 13 families. On the other hand, families with no children have the lowest poverty rate of 2.6%, which includes 10 families.
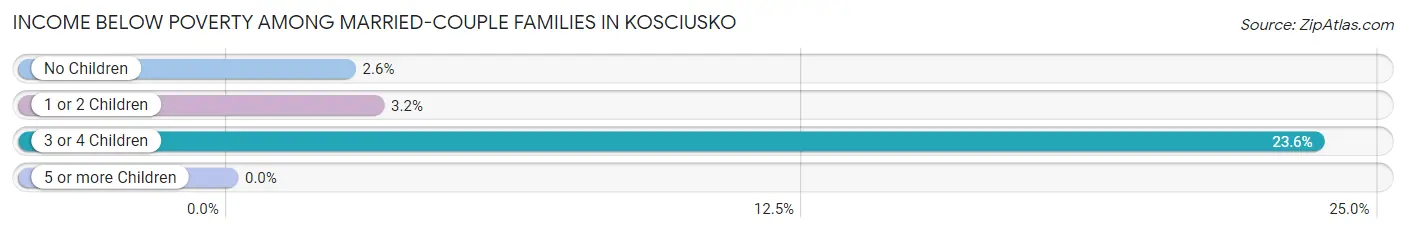
| Children | Above Poverty | Below Poverty |
| No Children | 380 (97.4%) | 10 (2.6%) |
| 1 or 2 Children | 304 (96.8%) | 10 (3.2%) |
| 3 or 4 Children | 42 (76.4%) | 13 (23.6%) |
| 5 or more Children | 0 (0.0%) | 0 (0.0%) |
| Total | 726 (95.7%) | 33 (4.3%) |
Income Below Poverty Among Single-Parent Households in Kosciusko
According to the poverty data in Kosciusko, 7.6% or 8 single-father households and 54.4% or 340 single-mother households are living below the poverty line. Among single-father households, those with 1 or 2 children have the highest poverty rate, with 8 households (9.8%) experiencing poverty. Likewise, among single-mother households, those with 3 or 4 children have the highest poverty rate, with 75 households (88.2%) falling below the poverty line.
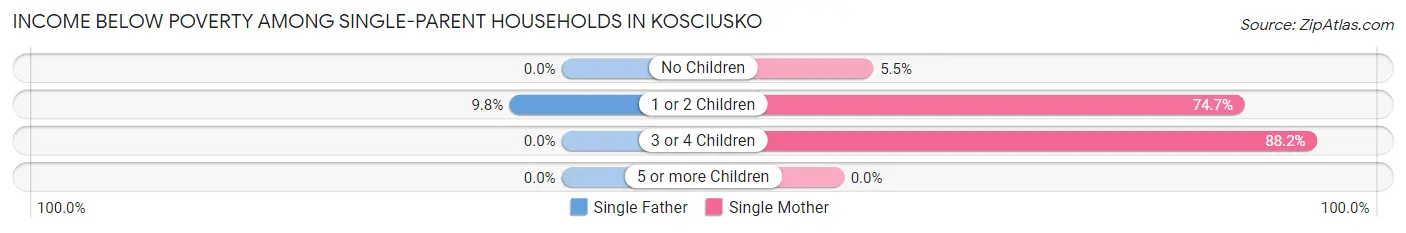
| Children | Single Father | Single Mother |
| No Children | 0 (0.0%) | 11 (5.5%) |
| 1 or 2 Children | 8 (9.8%) | 254 (74.7%) |
| 3 or 4 Children | 0 (0.0%) | 75 (88.2%) |
| 5 or more Children | 0 (0.0%) | 0 (0.0%) |
| Total | 8 (7.6%) | 340 (54.4%) |
Income Below Poverty Among Married-Couple vs Single-Parent Households in Kosciusko
The poverty data for Kosciusko shows that 33 of the married-couple family households (4.3%) and 348 of the single-parent households (47.7%) are living below the poverty level. Within the married-couple family households, those with 3 or 4 children have the highest poverty rate, with 13 households (23.6%) falling below the poverty line. Among the single-parent households, those with 3 or 4 children have the highest poverty rate, with 75 household (88.2%) living below poverty.
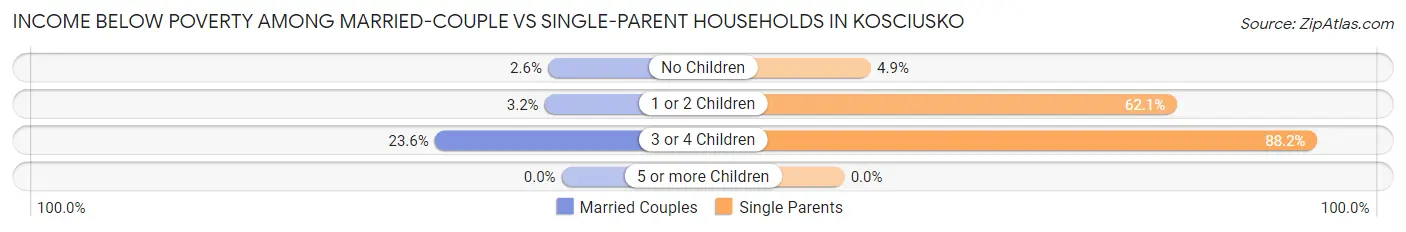
| Children | Married-Couple Families | Single-Parent Households |
| No Children | 10 (2.6%) | 11 (4.9%) |
| 1 or 2 Children | 10 (3.2%) | 262 (62.1%) |
| 3 or 4 Children | 13 (23.6%) | 75 (88.2%) |
| 5 or more Children | 0 (0.0%) | 0 (0.0%) |
| Total | 33 (4.3%) | 348 (47.7%) |
Race in Kosciusko
The most populous races in Kosciusko are Black / African American (3,696 | 52.4%), White / Caucasian (3,105 | 44.0%), and Two or more Races (234 | 3.3%).
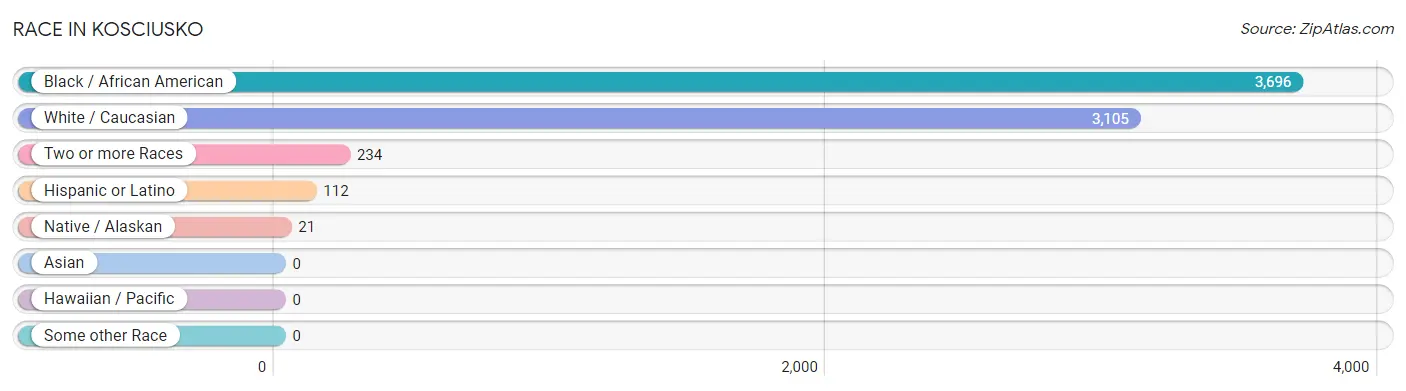
| Race | # Population | % Population |
| Asian | 0 | 0.0% |
| Black / African American | 3,696 | 52.4% |
| Hawaiian / Pacific | 0 | 0.0% |
| Hispanic or Latino | 112 | 1.6% |
| Native / Alaskan | 21 | 0.3% |
| White / Caucasian | 3,105 | 44.0% |
| Two or more Races | 234 | 3.3% |
| Some other Race | 0 | 0.0% |
| Total | 7,056 | 100.0% |
Ancestry in Kosciusko
The most populous ancestries reported in Kosciusko are English (664 | 9.4%), American (476 | 6.8%), German (306 | 4.3%), Irish (274 | 3.9%), and European (157 | 2.2%), together accounting for 26.6% of all Kosciusko residents.
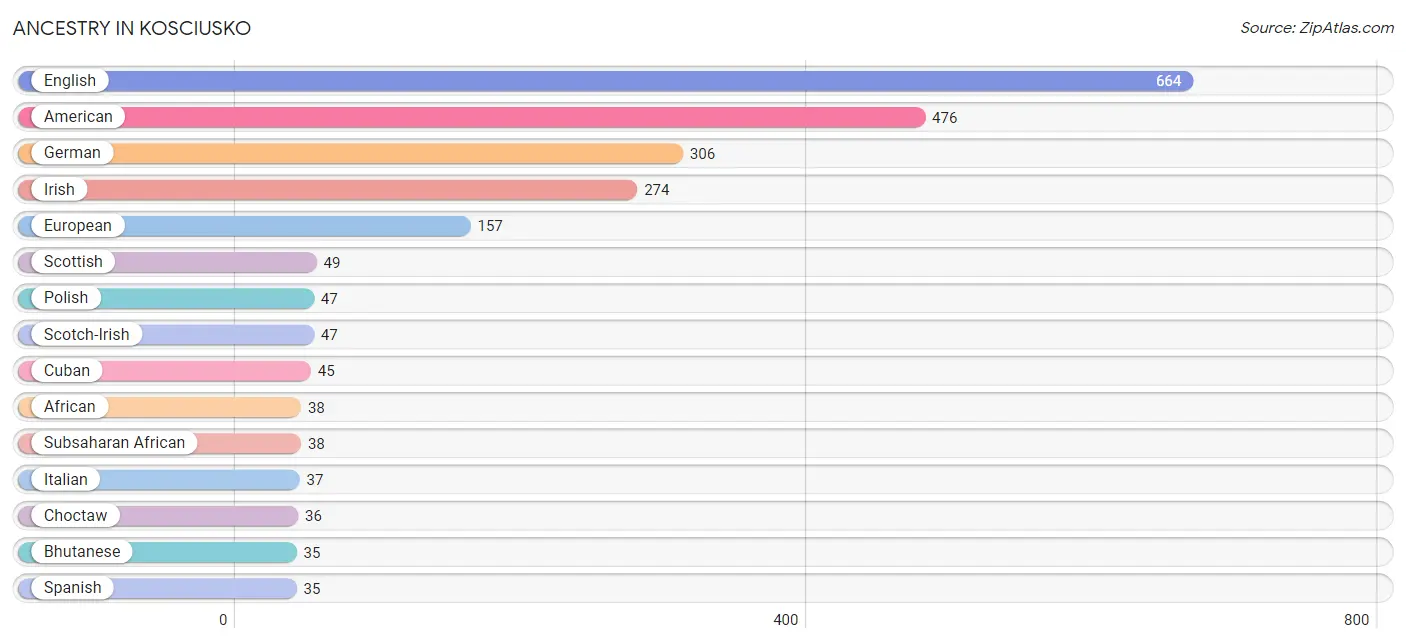
| Ancestry | # Population | % Population |
| African | 38 | 0.5% |
| American | 476 | 6.8% |
| Bhutanese | 35 | 0.5% |
| Choctaw | 36 | 0.5% |
| Cuban | 45 | 0.6% |
| English | 664 | 9.4% |
| European | 157 | 2.2% |
| French | 28 | 0.4% |
| German | 306 | 4.3% |
| Greek | 4 | 0.1% |
| Irish | 274 | 3.9% |
| Italian | 37 | 0.5% |
| Polish | 47 | 0.7% |
| Puerto Rican | 32 | 0.4% |
| Scotch-Irish | 47 | 0.7% |
| Scottish | 49 | 0.7% |
| Spanish | 35 | 0.5% |
| Subsaharan African | 38 | 0.5% | View All 18 Rows |
Immigrants in Kosciusko

| Immigration Origin | # Population | % Population | View All 0 Rows |
Sex and Age in Kosciusko
Sex and Age in Kosciusko
The most populous age groups in Kosciusko are 10 to 14 Years (369 | 12.0%) for men and 15 to 19 Years (497 | 12.5%) for women.
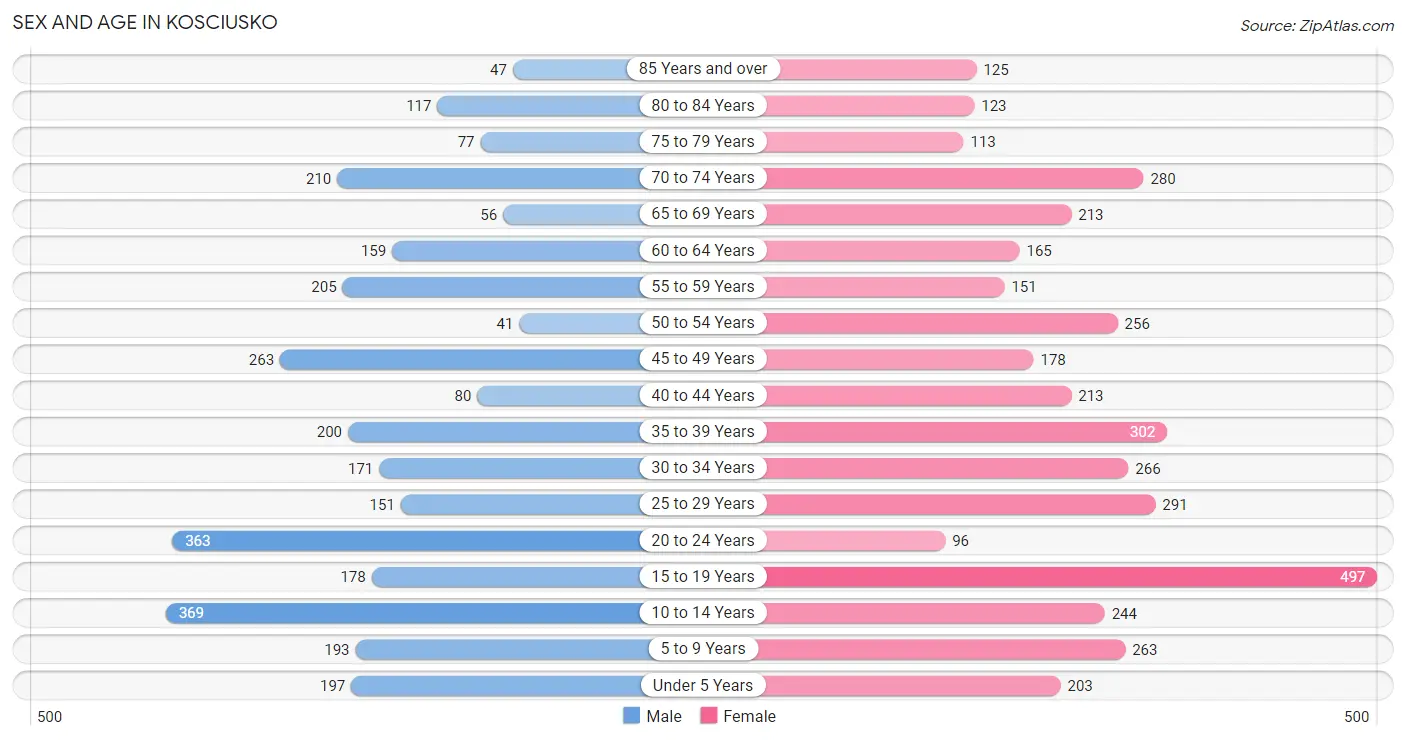
| Age Bracket | Male | Female |
| Under 5 Years | 197 (6.4%) | 203 (5.1%) |
| 5 to 9 Years | 193 (6.3%) | 263 (6.6%) |
| 10 to 14 Years | 369 (12.0%) | 244 (6.1%) |
| 15 to 19 Years | 178 (5.8%) | 497 (12.5%) |
| 20 to 24 Years | 363 (11.8%) | 96 (2.4%) |
| 25 to 29 Years | 151 (4.9%) | 291 (7.3%) |
| 30 to 34 Years | 171 (5.6%) | 266 (6.7%) |
| 35 to 39 Years | 200 (6.5%) | 302 (7.6%) |
| 40 to 44 Years | 80 (2.6%) | 213 (5.3%) |
| 45 to 49 Years | 263 (8.6%) | 178 (4.5%) |
| 50 to 54 Years | 41 (1.3%) | 256 (6.4%) |
| 55 to 59 Years | 205 (6.7%) | 151 (3.8%) |
| 60 to 64 Years | 159 (5.2%) | 165 (4.2%) |
| 65 to 69 Years | 56 (1.8%) | 213 (5.3%) |
| 70 to 74 Years | 210 (6.8%) | 280 (7.0%) |
| 75 to 79 Years | 77 (2.5%) | 113 (2.8%) |
| 80 to 84 Years | 117 (3.8%) | 123 (3.1%) |
| 85 Years and over | 47 (1.5%) | 125 (3.1%) |
| Total | 3,077 (100.0%) | 3,979 (100.0%) |
Families and Households in Kosciusko
Median Family Size in Kosciusko
The median family size in Kosciusko is 3.58 persons per family, with single female/mother families (625 | 42.0%) accounting for the largest median family size of 4.18 persons per family. On the other hand, single male/father families (105 | 7.0%) represent the smallest median family size with 2.83 persons per family.
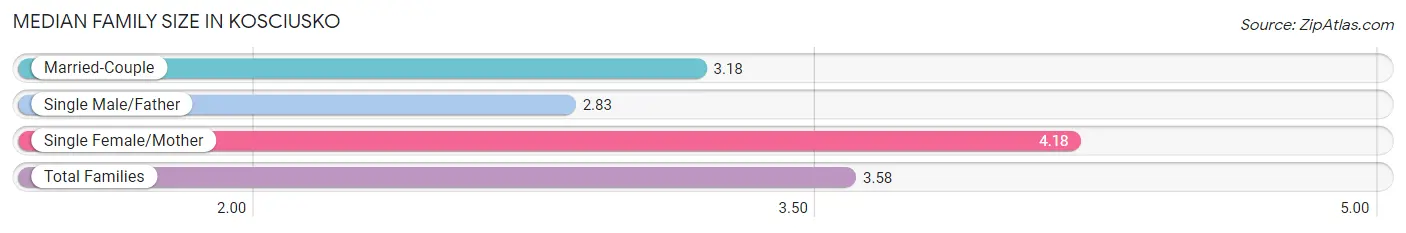
| Family Type | # Families | Family Size |
| Married-Couple | 759 (51.0%) | 3.18 |
| Single Male/Father | 105 (7.0%) | 2.83 |
| Single Female/Mother | 625 (42.0%) | 4.18 |
| Total Families | 1,489 (100.0%) | 3.58 |
Median Household Size in Kosciusko
The median household size in Kosciusko is 2.63 persons per household, with single female/mother households (625 | 24.6%) accounting for the largest median household size of 4.39 persons per household. non-family households (1,056 | 41.5%) represent the smallest median household size with 1.13 persons per household.
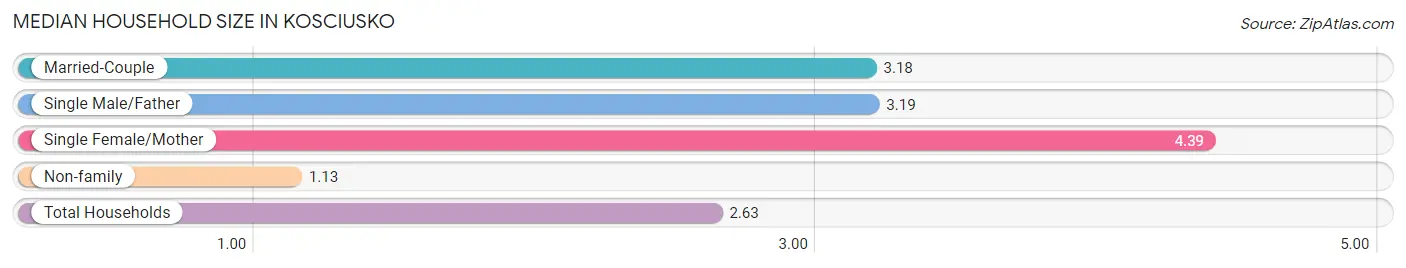
| Household Type | # Households | Household Size |
| Married-Couple | 759 (29.8%) | 3.18 |
| Single Male/Father | 105 (4.1%) | 3.19 |
| Single Female/Mother | 625 (24.6%) | 4.39 |
| Non-family | 1,056 (41.5%) | 1.13 |
| Total Households | 2,545 (100.0%) | 2.63 |
Household Size by Marriage Status in Kosciusko
Out of a total of 2,545 households in Kosciusko, 1,489 (58.5%) are family households, while 1,056 (41.5%) are nonfamily households. The most numerous type of family households are 2-person households, comprising 594, and the most common type of nonfamily households are 1-person households, comprising 939.
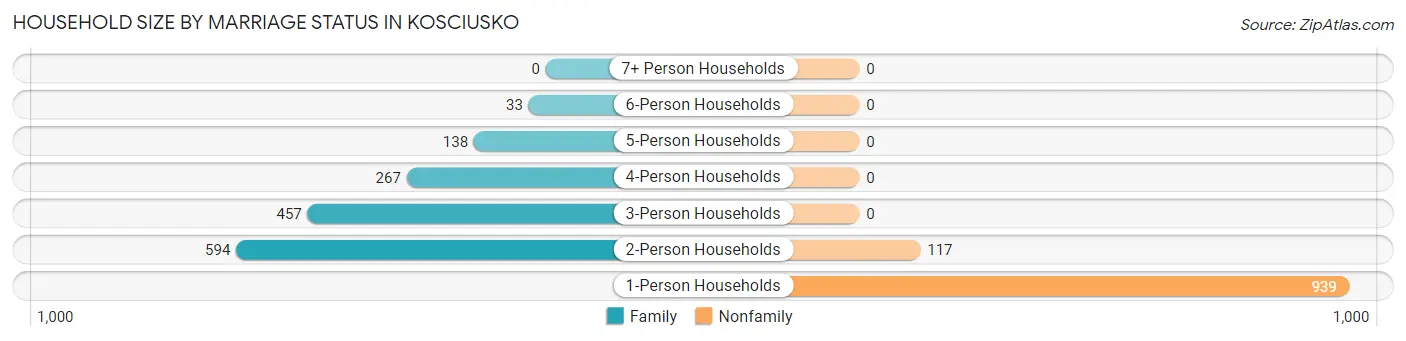
| Household Size | Family Households | Nonfamily Households |
| 1-Person Households | - | 939 (36.9%) |
| 2-Person Households | 594 (23.3%) | 117 (4.6%) |
| 3-Person Households | 457 (18.0%) | 0 (0.0%) |
| 4-Person Households | 267 (10.5%) | 0 (0.0%) |
| 5-Person Households | 138 (5.4%) | 0 (0.0%) |
| 6-Person Households | 33 (1.3%) | 0 (0.0%) |
| 7+ Person Households | 0 (0.0%) | 0 (0.0%) |
| Total | 1,489 (58.5%) | 1,056 (41.5%) |
Female Fertility in Kosciusko
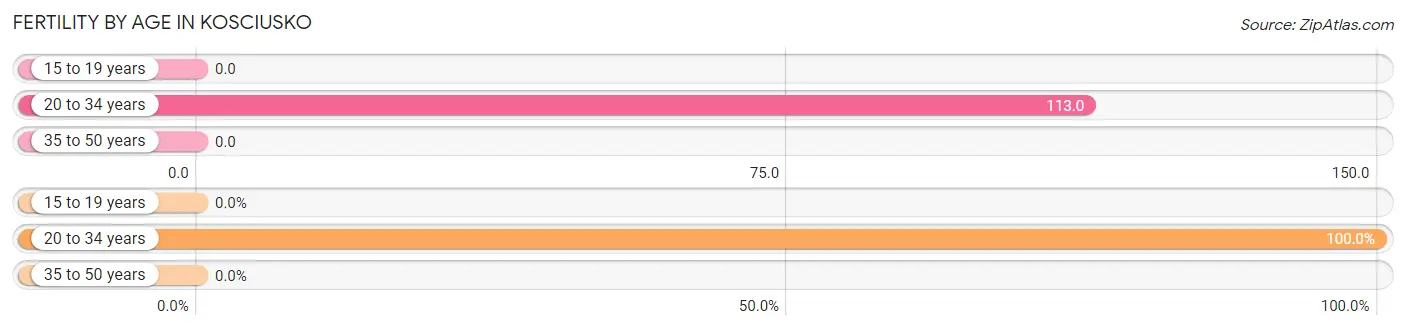
Fertility by Age in Kosciusko
Average fertility rate in Kosciusko is 39.0 births per 1,000 women. Women in the age bracket of 20 to 34 years have the highest fertility rate with 113.0 births per 1,000 women. Women in the age bracket of 20 to 34 years acount for 100.0% of all women with births.
| Age Bracket | Women with Births | Births / 1,000 Women |
| 15 to 19 years | 0 (0.0%) | 0.0 |
| 20 to 34 years | 74 (100.0%) | 113.0 |
| 35 to 50 years | 0 (0.0%) | 0.0 |
| Total | 74 (100.0%) | 39.0 |
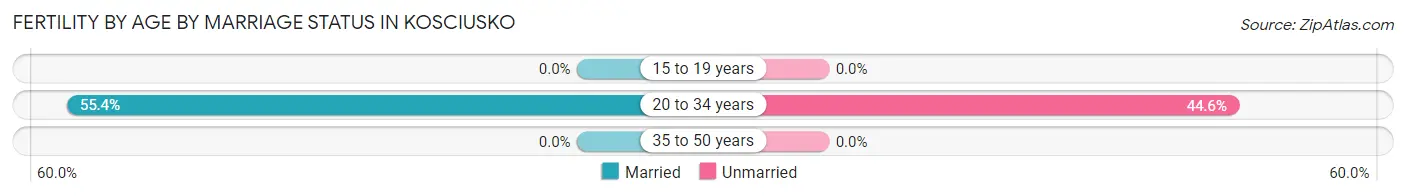
Fertility by Age by Marriage Status in Kosciusko
55.4% of women with births (74) in Kosciusko are married. The highest percentage of unmarried women with births falls into 20 to 34 years age bracket with 44.6% of them unmarried at the time of birth, while the lowest percentage of unmarried women with births belong to 20 to 34 years age bracket with 44.6% of them unmarried.
| Age Bracket | Married | Unmarried |
| 15 to 19 years | 0 (0.0%) | 0 (0.0%) |
| 20 to 34 years | 41 (55.4%) | 33 (44.6%) |
| 35 to 50 years | 0 (0.0%) | 0 (0.0%) |
| Total | 41 (55.4%) | 33 (44.6%) |
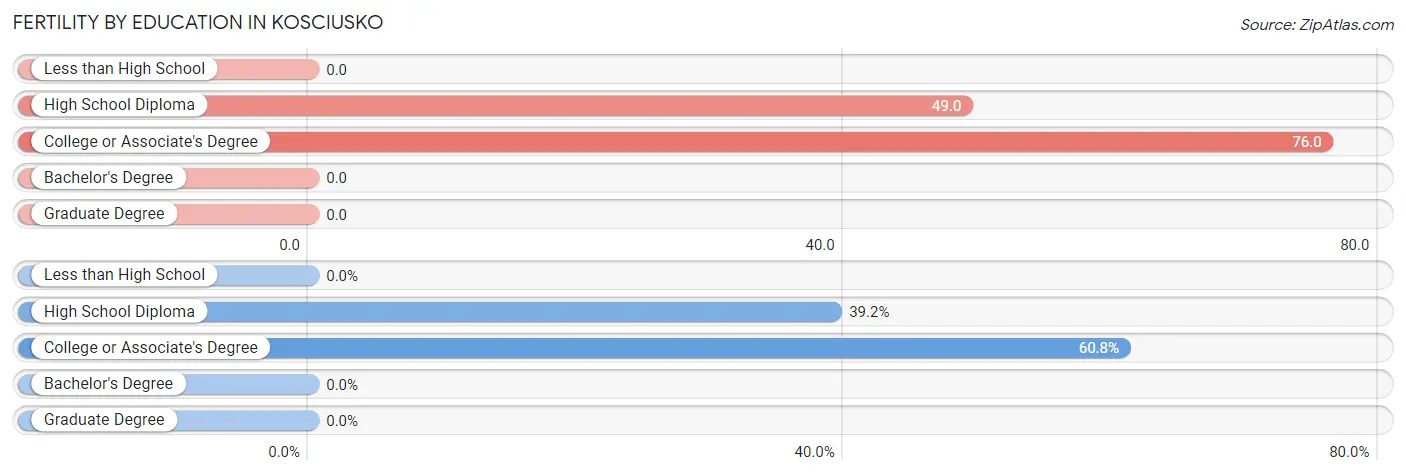
Fertility by Education in Kosciusko
| Educational Attainment | Women with Births | Births / 1,000 Women |
| Less than High School | 0 (0.0%) | 0.0 |
| High School Diploma | 29 (39.2%) | 49.0 |
| College or Associate's Degree | 45 (60.8%) | 76.0 |
| Bachelor's Degree | 0 (0.0%) | 0.0 |
| Graduate Degree | 0 (0.0%) | 0.0 |
| Total | 74 (100.0%) | 39.0 |
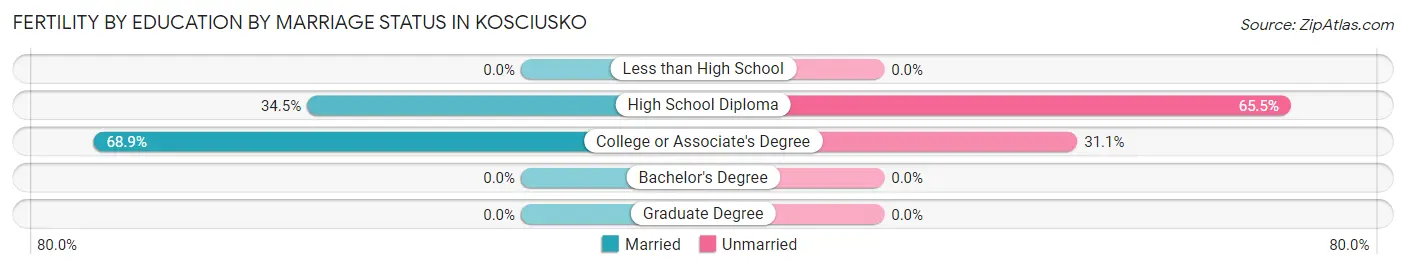
Fertility by Education by Marriage Status in Kosciusko
44.6% of women with births in Kosciusko are unmarried. Women with the educational attainment of college or associate's degree are most likely to be married with 68.9% of them married at childbirth, while women with the educational attainment of high school diploma are least likely to be married with 65.5% of them unmarried at childbirth.
| Educational Attainment | Married | Unmarried |
| Less than High School | 0 (0.0%) | 0 (0.0%) |
| High School Diploma | 10 (34.5%) | 19 (65.5%) |
| College or Associate's Degree | 31 (68.9%) | 14 (31.1%) |
| Bachelor's Degree | 0 (0.0%) | 0 (0.0%) |
| Graduate Degree | 0 (0.0%) | 0 (0.0%) |
| Total | 41 (55.4%) | 33 (44.6%) |
Employment Characteristics in Kosciusko
Employment by Class of Employer in Kosciusko
Among the 3,036 employed individuals in Kosciusko, private company employees (2,148 | 70.8%), state government employees (270 | 8.9%), and local government employees (179 | 5.9%) make up the most common classes of employment.
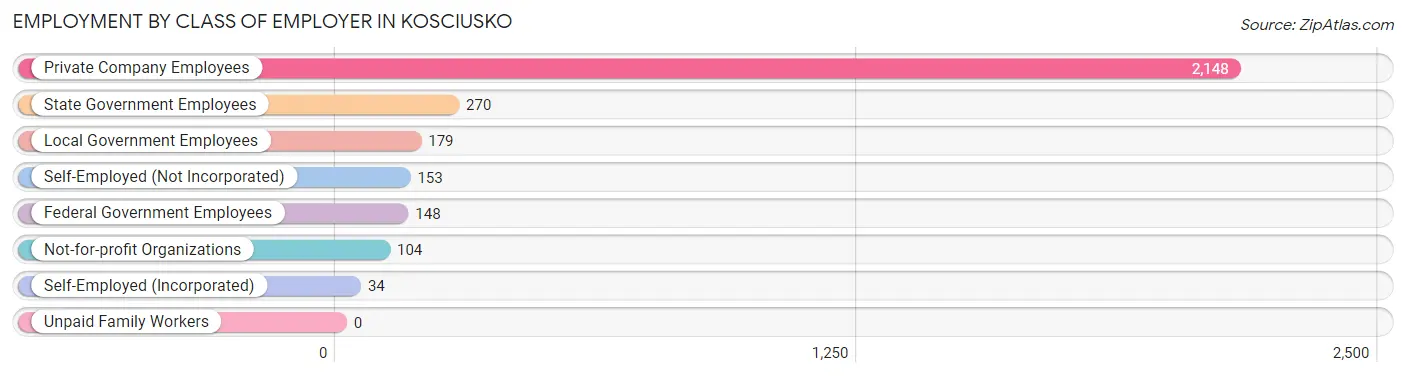
| Employer Class | # Employees | % Employees |
| Private Company Employees | 2,148 | 70.8% |
| Self-Employed (Incorporated) | 34 | 1.1% |
| Self-Employed (Not Incorporated) | 153 | 5.0% |
| Not-for-profit Organizations | 104 | 3.4% |
| Local Government Employees | 179 | 5.9% |
| State Government Employees | 270 | 8.9% |
| Federal Government Employees | 148 | 4.9% |
| Unpaid Family Workers | 0 | 0.0% |
| Total | 3,036 | 100.0% |
Employment Status by Age in Kosciusko
According to the labor force statistics for Kosciusko, out of the total population over 16 years of age (5,349), 60.5% or 3,236 individuals are in the labor force, with 5.5% or 178 of them unemployed. The age group with the highest labor force participation rate is 20 to 24 years, with 92.6% or 425 individuals in the labor force. Within the labor force, the 16 to 19 years age range has the highest percentage of unemployed individuals, with 37.0% or 34 of them being unemployed.
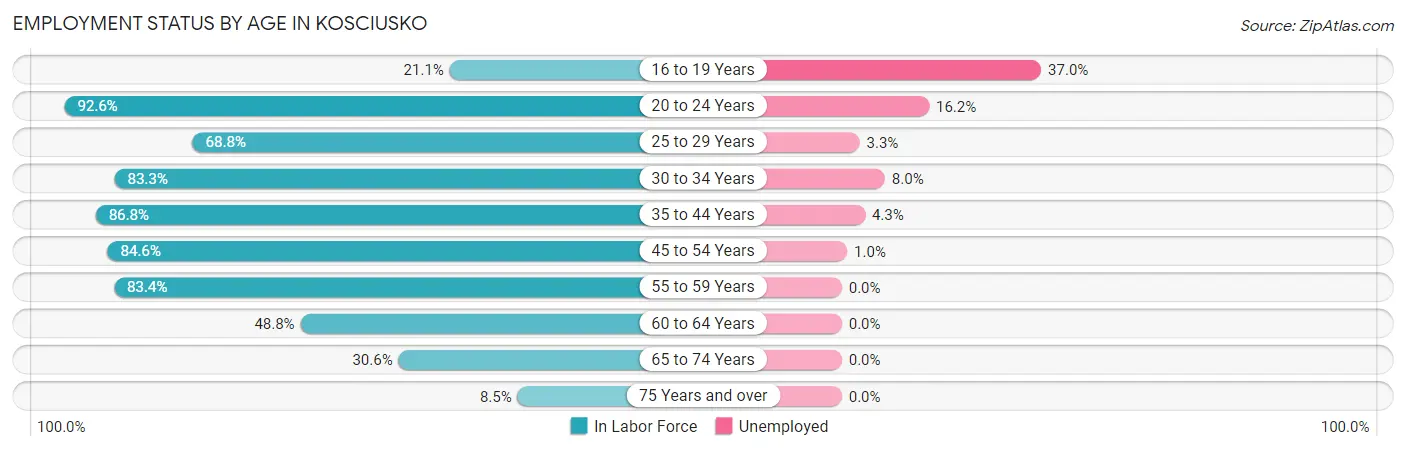
| Age Bracket | In Labor Force | Unemployed |
| 16 to 19 Years | 92 (21.1%) | 34 (37.0%) |
| 20 to 24 Years | 425 (92.6%) | 69 (16.2%) |
| 25 to 29 Years | 304 (68.8%) | 10 (3.3%) |
| 30 to 34 Years | 364 (83.3%) | 29 (8.0%) |
| 35 to 44 Years | 690 (86.8%) | 30 (4.3%) |
| 45 to 54 Years | 624 (84.6%) | 6 (1.0%) |
| 55 to 59 Years | 297 (83.4%) | 0 (0.0%) |
| 60 to 64 Years | 158 (48.8%) | 0 (0.0%) |
| 65 to 74 Years | 232 (30.6%) | 0 (0.0%) |
| 75 Years and over | 51 (8.5%) | 0 (0.0%) |
| Total | 3,236 (60.5%) | 178 (5.5%) |
Employment Status by Educational Attainment in Kosciusko
According to labor force statistics for Kosciusko, 78.8% of individuals (2,436) out of the total population between 25 and 64 years of age (3,092) are in the labor force, with 3.1% or 76 of them being unemployed. The group with the highest labor force participation rate are those with the educational attainment of bachelor's degree or higher, with 91.5% or 563 individuals in the labor force. Within the labor force, individuals with high school diploma education have the highest percentage of unemployment, with 4.6% or 40 of them being unemployed.
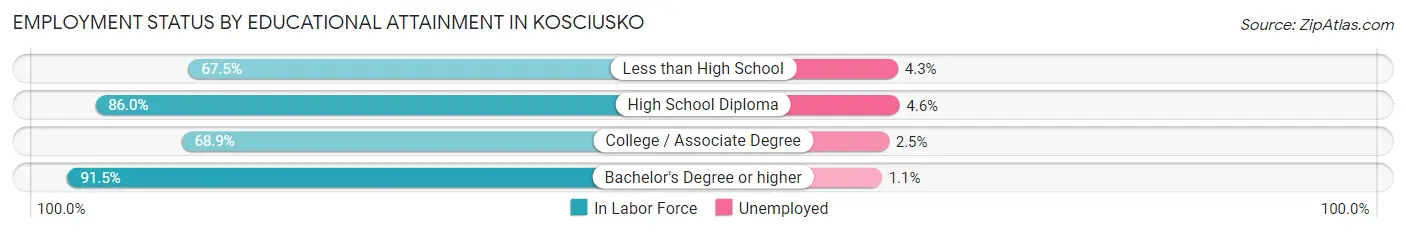
| Educational Attainment | In Labor Force | Unemployed |
| Less than High School | 235 (67.5%) | 15 (4.3%) |
| High School Diploma | 869 (86.0%) | 47 (4.6%) |
| College / Associate Degree | 770 (68.9%) | 28 (2.5%) |
| Bachelor's Degree or higher | 563 (91.5%) | 7 (1.1%) |
| Total | 2,436 (78.8%) | 96 (3.1%) |
Employment Occupations by Sex in Kosciusko
Management, Business, Science and Arts Occupations
The most common Management, Business, Science and Arts occupations in Kosciusko are Community & Social Service (305 | 10.0%), Education Instruction & Library (198 | 6.5%), Management (175 | 5.7%), Health Diagnosing & Treating (145 | 4.7%), and Business & Financial (103 | 3.4%).
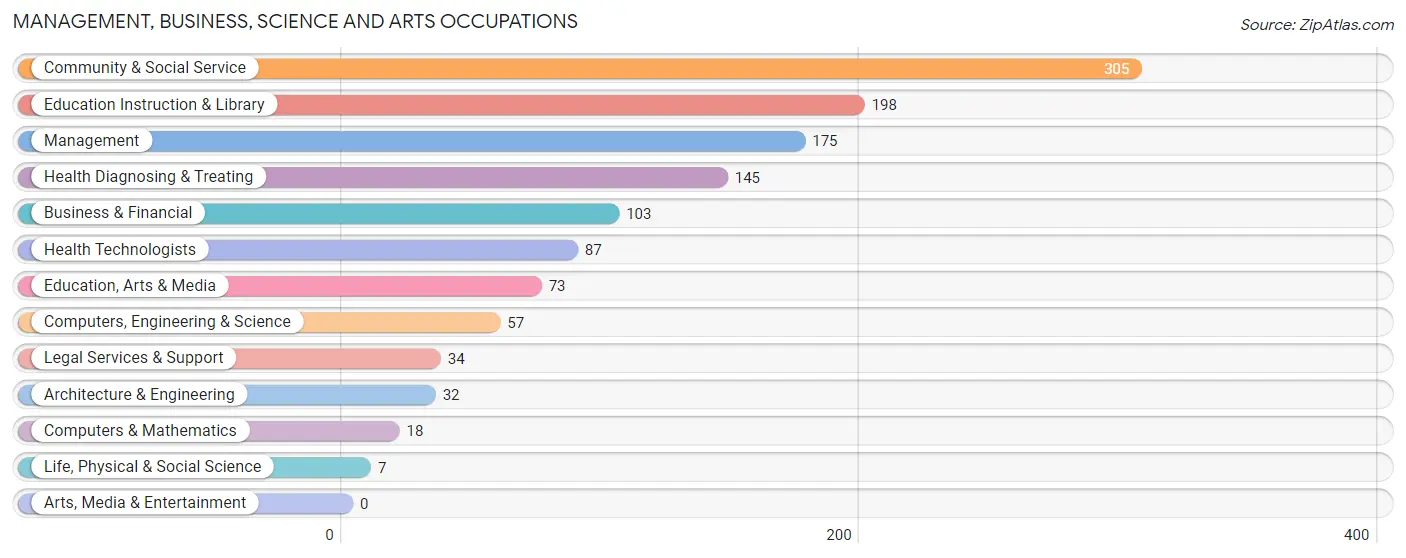
Management, Business, Science and Arts Occupations by Sex
Within the Management, Business, Science and Arts occupations in Kosciusko, the most male-oriented occupations are Computers & Mathematics (100.0%), Architecture & Engineering (100.0%), and Legal Services & Support (100.0%), while the most female-oriented occupations are Business & Financial (100.0%), Life, Physical & Social Science (100.0%), and Education Instruction & Library (100.0%).
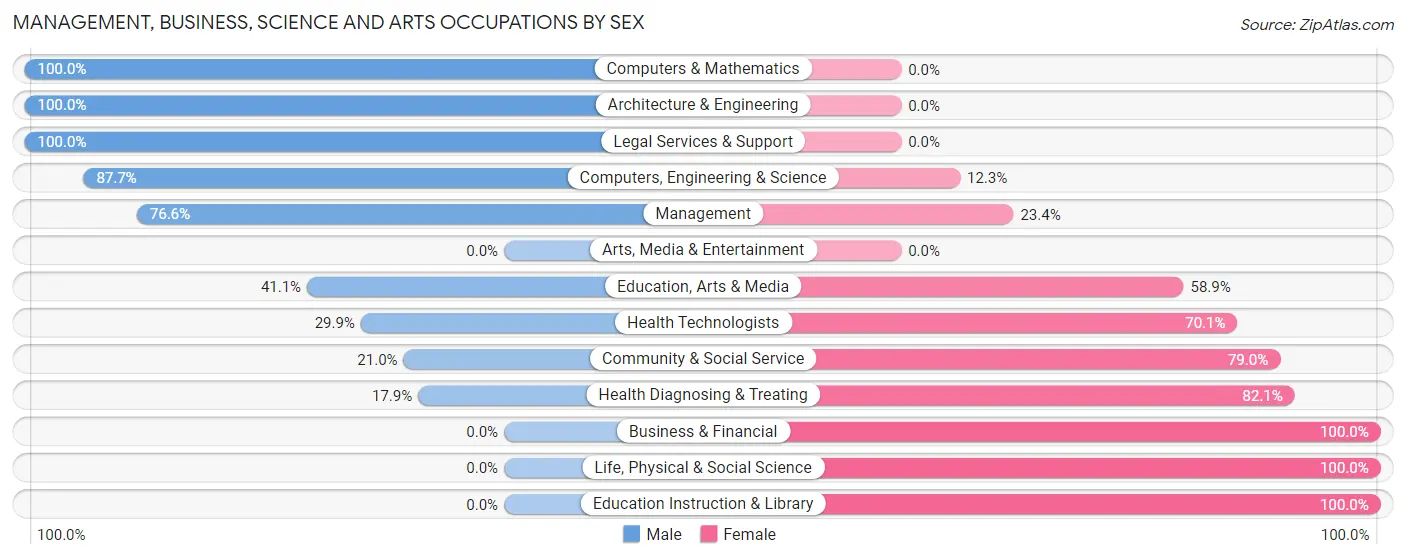
| Occupation | Male | Female |
| Management | 134 (76.6%) | 41 (23.4%) |
| Business & Financial | 0 (0.0%) | 103 (100.0%) |
| Computers, Engineering & Science | 50 (87.7%) | 7 (12.3%) |
| Computers & Mathematics | 18 (100.0%) | 0 (0.0%) |
| Architecture & Engineering | 32 (100.0%) | 0 (0.0%) |
| Life, Physical & Social Science | 0 (0.0%) | 7 (100.0%) |
| Community & Social Service | 64 (21.0%) | 241 (79.0%) |
| Education, Arts & Media | 30 (41.1%) | 43 (58.9%) |
| Legal Services & Support | 34 (100.0%) | 0 (0.0%) |
| Education Instruction & Library | 0 (0.0%) | 198 (100.0%) |
| Arts, Media & Entertainment | 0 (0.0%) | 0 (0.0%) |
| Health Diagnosing & Treating | 26 (17.9%) | 119 (82.1%) |
| Health Technologists | 26 (29.9%) | 61 (70.1%) |
| Total (Category) | 274 (34.9%) | 511 (65.1%) |
| Total (Overall) | 1,359 (44.4%) | 1,700 (55.6%) |
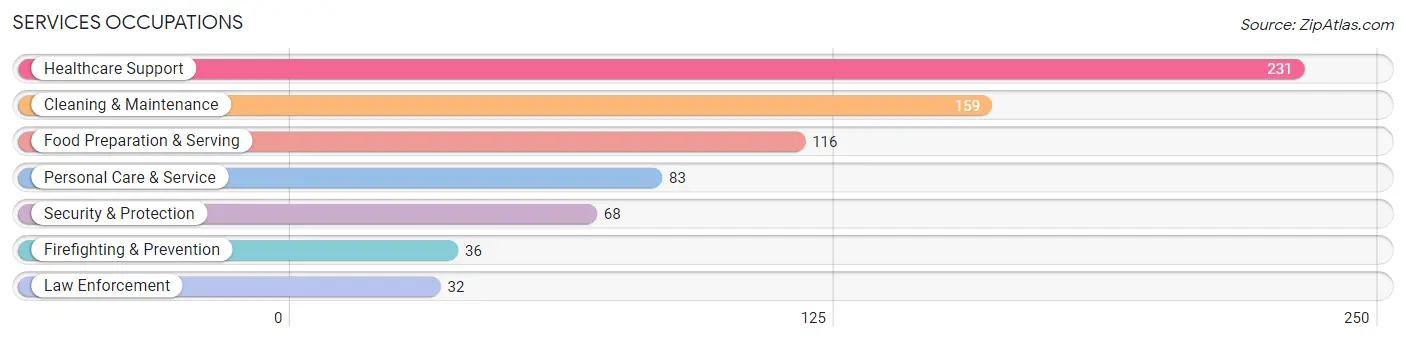
Services Occupations
The most common Services occupations in Kosciusko are Healthcare Support (231 | 7.5%), Cleaning & Maintenance (159 | 5.2%), Food Preparation & Serving (116 | 3.8%), Personal Care & Service (83 | 2.7%), and Security & Protection (68 | 2.2%).
Services Occupations by Sex
Within the Services occupations in Kosciusko, the most male-oriented occupations are Security & Protection (100.0%), Firefighting & Prevention (100.0%), and Law Enforcement (100.0%), while the most female-oriented occupations are Food Preparation & Serving (95.7%), Healthcare Support (87.0%), and Personal Care & Service (75.9%).
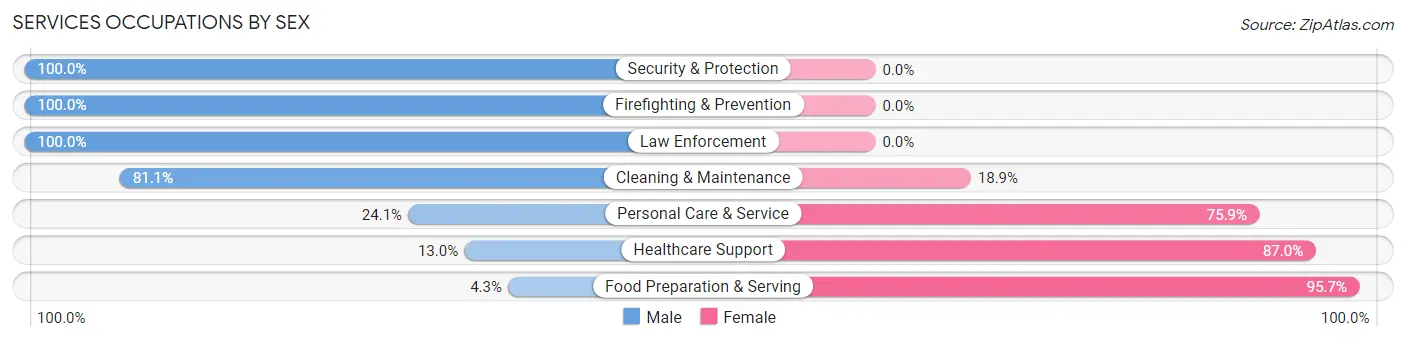
| Occupation | Male | Female |
| Healthcare Support | 30 (13.0%) | 201 (87.0%) |
| Security & Protection | 68 (100.0%) | 0 (0.0%) |
| Firefighting & Prevention | 36 (100.0%) | 0 (0.0%) |
| Law Enforcement | 32 (100.0%) | 0 (0.0%) |
| Food Preparation & Serving | 5 (4.3%) | 111 (95.7%) |
| Cleaning & Maintenance | 129 (81.1%) | 30 (18.9%) |
| Personal Care & Service | 20 (24.1%) | 63 (75.9%) |
| Total (Category) | 252 (38.4%) | 405 (61.6%) |
| Total (Overall) | 1,359 (44.4%) | 1,700 (55.6%) |
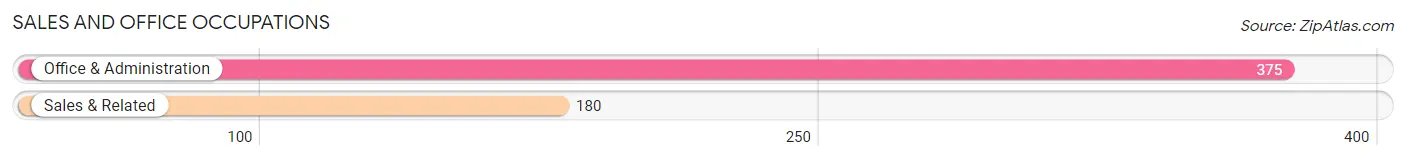
Sales and Office Occupations
The most common Sales and Office occupations in Kosciusko are Office & Administration (375 | 12.3%), and Sales & Related (180 | 5.9%).
Sales and Office Occupations by Sex
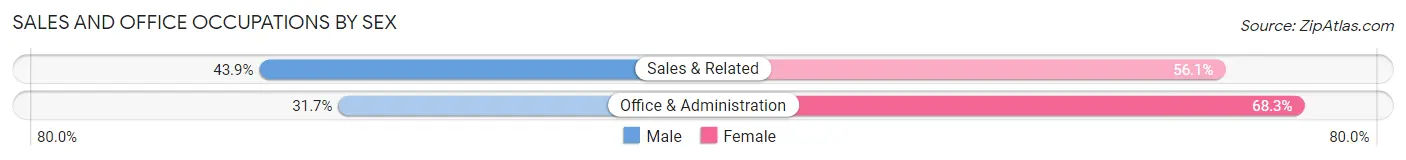
| Occupation | Male | Female |
| Sales & Related | 79 (43.9%) | 101 (56.1%) |
| Office & Administration | 119 (31.7%) | 256 (68.3%) |
| Total (Category) | 198 (35.7%) | 357 (64.3%) |
| Total (Overall) | 1,359 (44.4%) | 1,700 (55.6%) |
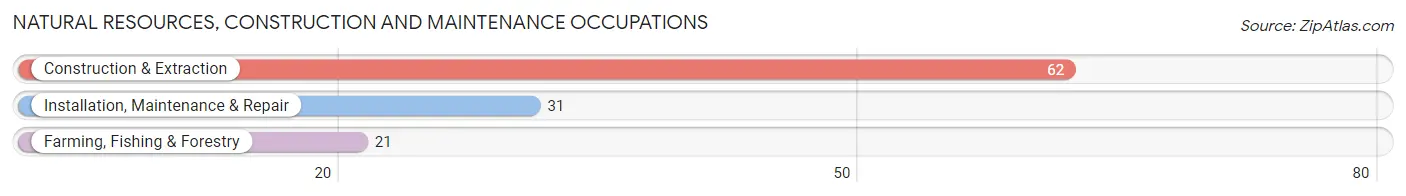
Natural Resources, Construction and Maintenance Occupations
The most common Natural Resources, Construction and Maintenance occupations in Kosciusko are Construction & Extraction (62 | 2.0%), Installation, Maintenance & Repair (31 | 1.0%), and Farming, Fishing & Forestry (21 | 0.7%).
Natural Resources, Construction and Maintenance Occupations by Sex
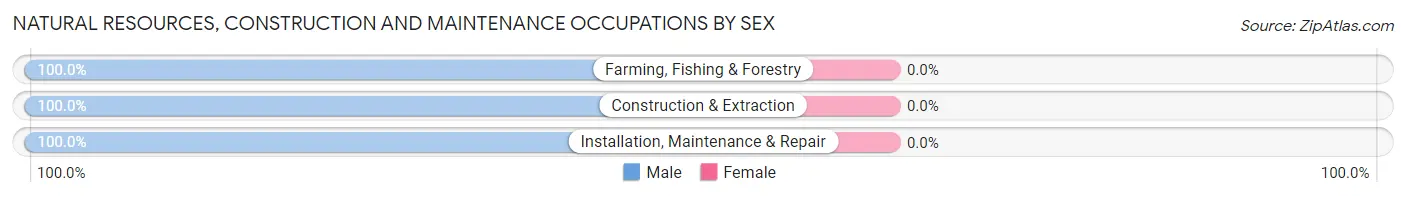
| Occupation | Male | Female |
| Farming, Fishing & Forestry | 21 (100.0%) | 0 (0.0%) |
| Construction & Extraction | 62 (100.0%) | 0 (0.0%) |
| Installation, Maintenance & Repair | 31 (100.0%) | 0 (0.0%) |
| Total (Category) | 114 (100.0%) | 0 (0.0%) |
| Total (Overall) | 1,359 (44.4%) | 1,700 (55.6%) |
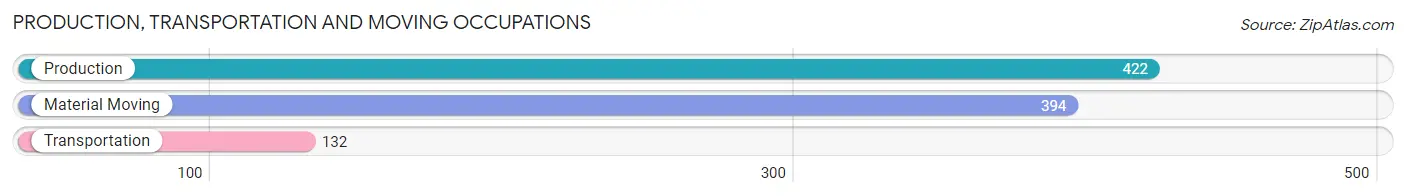
Production, Transportation and Moving Occupations
The most common Production, Transportation and Moving occupations in Kosciusko are Production (422 | 13.8%), Material Moving (394 | 12.9%), and Transportation (132 | 4.3%).
Production, Transportation and Moving Occupations by Sex
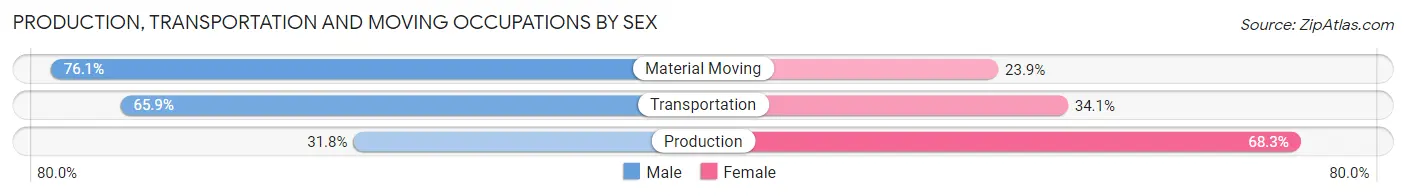
| Occupation | Male | Female |
| Production | 134 (31.8%) | 288 (68.2%) |
| Transportation | 87 (65.9%) | 45 (34.1%) |
| Material Moving | 300 (76.1%) | 94 (23.9%) |
| Total (Category) | 521 (55.0%) | 427 (45.0%) |
| Total (Overall) | 1,359 (44.4%) | 1,700 (55.6%) |
Employment Industries by Sex in Kosciusko
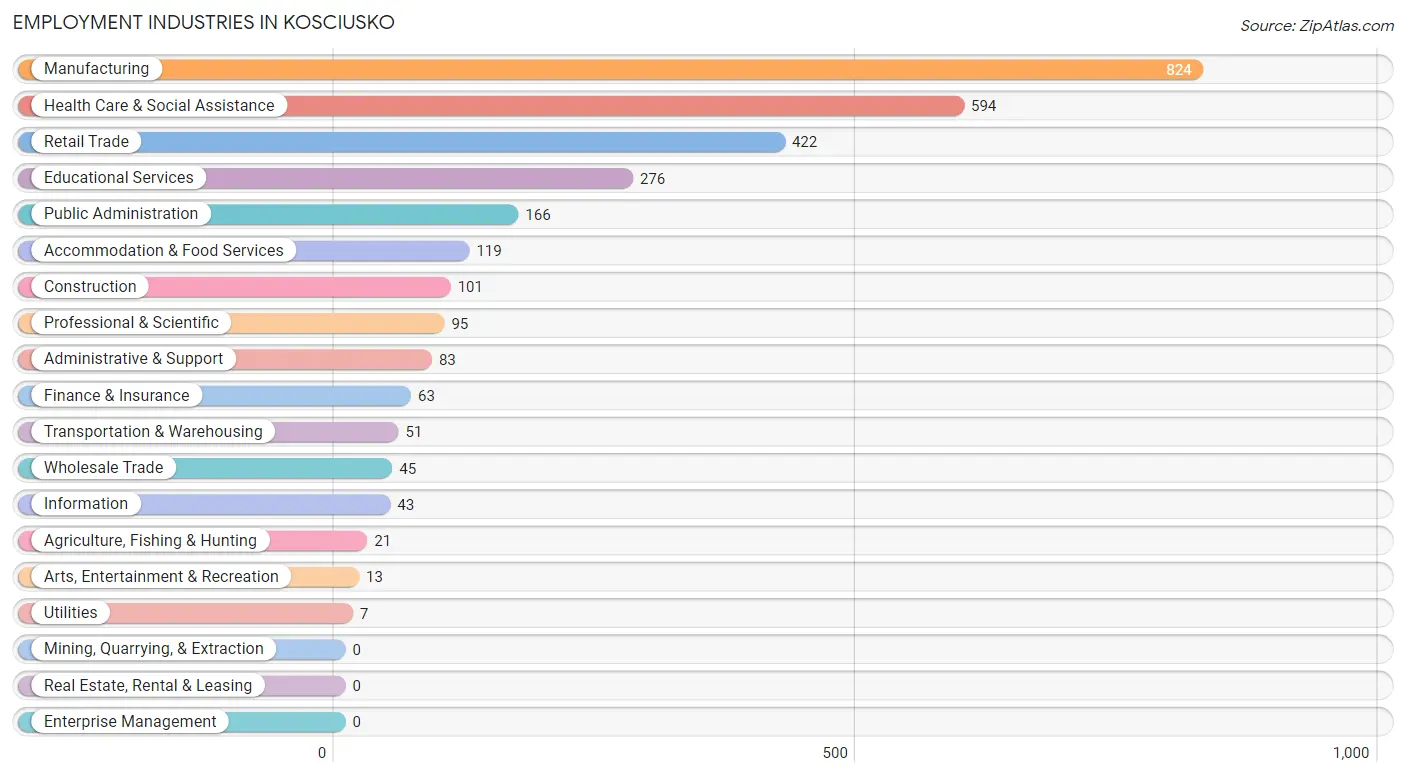
Employment Industries in Kosciusko
The major employment industries in Kosciusko include Manufacturing (824 | 26.9%), Health Care & Social Assistance (594 | 19.4%), Retail Trade (422 | 13.8%), Educational Services (276 | 9.0%), and Public Administration (166 | 5.4%).
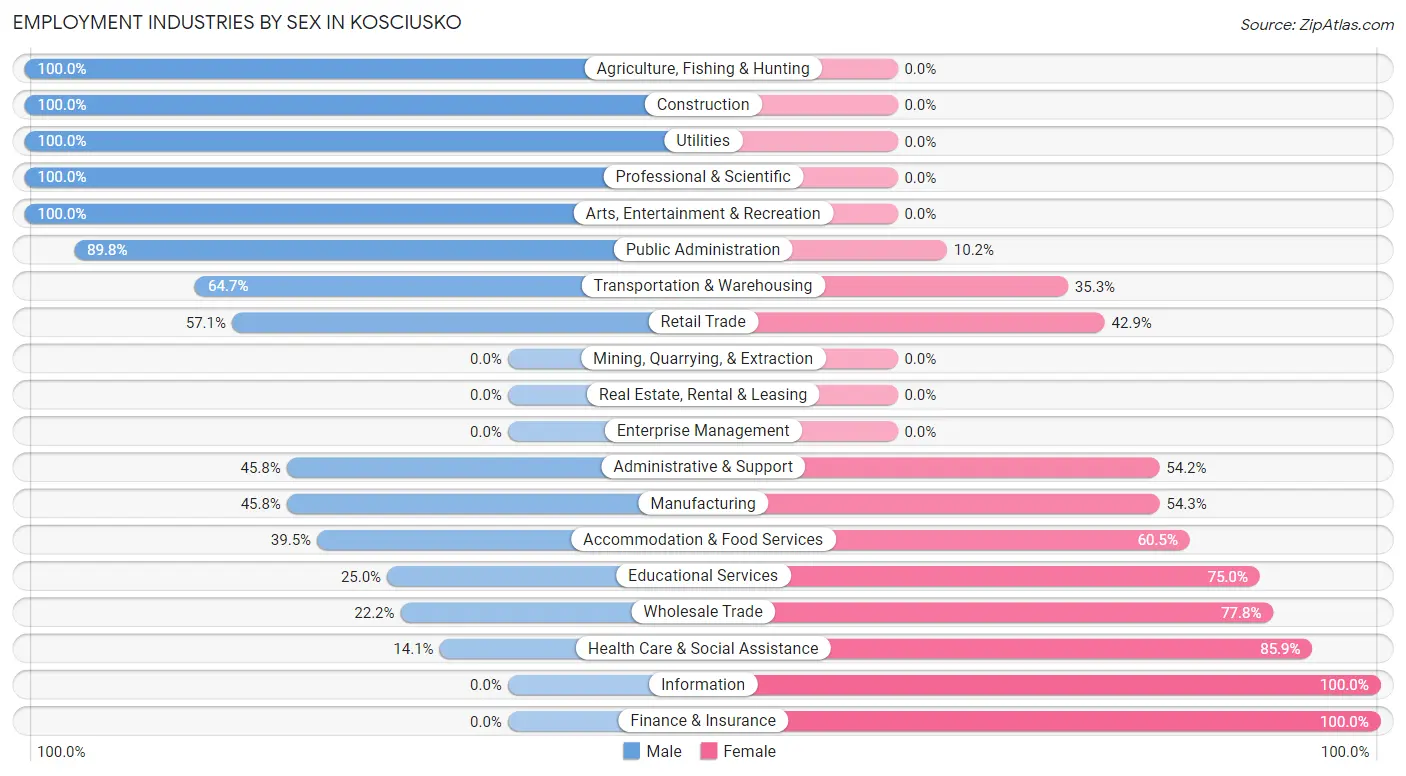
Employment Industries by Sex in Kosciusko
The Kosciusko industries that see more men than women are Agriculture, Fishing & Hunting (100.0%), Construction (100.0%), and Utilities (100.0%), whereas the industries that tend to have a higher number of women are Information (100.0%), Finance & Insurance (100.0%), and Health Care & Social Assistance (85.9%).
| Industry | Male | Female |
| Agriculture, Fishing & Hunting | 21 (100.0%) | 0 (0.0%) |
| Mining, Quarrying, & Extraction | 0 (0.0%) | 0 (0.0%) |
| Construction | 101 (100.0%) | 0 (0.0%) |
| Manufacturing | 377 (45.8%) | 447 (54.2%) |
| Wholesale Trade | 10 (22.2%) | 35 (77.8%) |
| Retail Trade | 241 (57.1%) | 181 (42.9%) |
| Transportation & Warehousing | 33 (64.7%) | 18 (35.3%) |
| Utilities | 7 (100.0%) | 0 (0.0%) |
| Information | 0 (0.0%) | 43 (100.0%) |
| Finance & Insurance | 0 (0.0%) | 63 (100.0%) |
| Real Estate, Rental & Leasing | 0 (0.0%) | 0 (0.0%) |
| Professional & Scientific | 95 (100.0%) | 0 (0.0%) |
| Enterprise Management | 0 (0.0%) | 0 (0.0%) |
| Administrative & Support | 38 (45.8%) | 45 (54.2%) |
| Educational Services | 69 (25.0%) | 207 (75.0%) |
| Health Care & Social Assistance | 84 (14.1%) | 510 (85.9%) |
| Arts, Entertainment & Recreation | 13 (100.0%) | 0 (0.0%) |
| Accommodation & Food Services | 47 (39.5%) | 72 (60.5%) |
| Public Administration | 149 (89.8%) | 17 (10.2%) |
| Total | 1,359 (44.4%) | 1,700 (55.6%) |
Education in Kosciusko
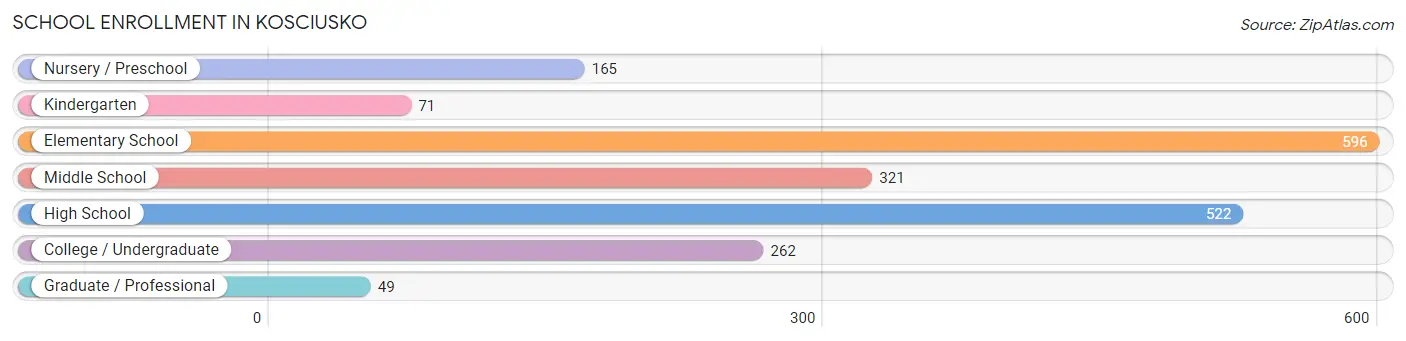
School Enrollment in Kosciusko
The most common levels of schooling among the 1,986 students in Kosciusko are elementary school (596 | 30.0%), high school (522 | 26.3%), and middle school (321 | 16.2%).
| School Level | # Students | % Students |
| Nursery / Preschool | 165 | 8.3% |
| Kindergarten | 71 | 3.6% |
| Elementary School | 596 | 30.0% |
| Middle School | 321 | 16.2% |
| High School | 522 | 26.3% |
| College / Undergraduate | 262 | 13.2% |
| Graduate / Professional | 49 | 2.5% |
| Total | 1,986 | 100.0% |
School Enrollment by Age by Funding Source in Kosciusko
Out of a total of 1,986 students who are enrolled in schools in Kosciusko, 56 (2.8%) attend a private institution, while the remaining 1,930 (97.2%) are enrolled in public schools. The age group of 18 to 19 year olds has the highest likelihood of being enrolled in private schools, with 21 (27.3% in the age bracket) enrolled. Conversely, the age group of 5 to 9 year old has the lowest likelihood of being enrolled in a private school, with 456 (100.0% in the age bracket) attending a public institution.
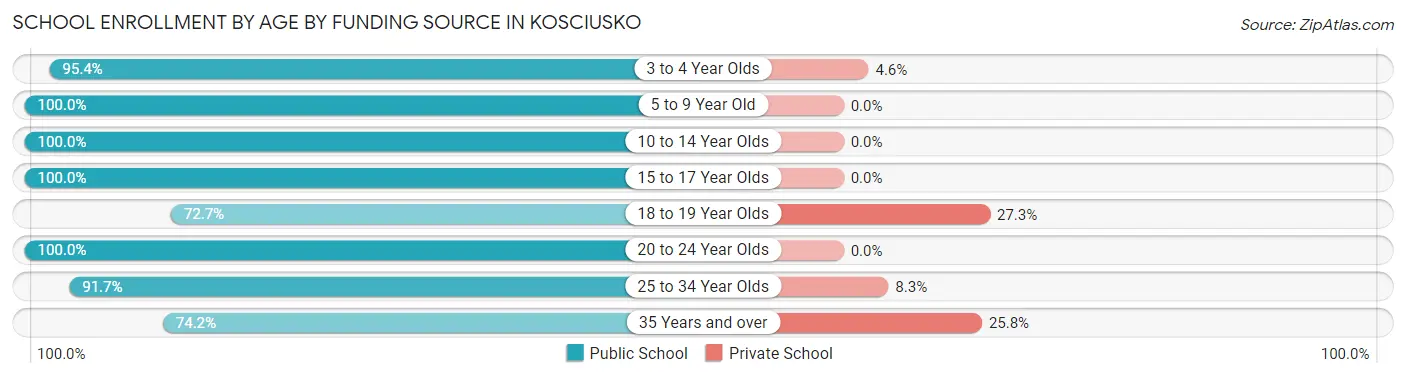
| Age Bracket | Public School | Private School |
| 3 to 4 Year Olds | 103 (95.4%) | 5 (4.6%) |
| 5 to 9 Year Old | 456 (100.0%) | 0 (0.0%) |
| 10 to 14 Year Olds | 589 (100.0%) | 0 (0.0%) |
| 15 to 17 Year Olds | 445 (100.0%) | 0 (0.0%) |
| 18 to 19 Year Olds | 56 (72.7%) | 21 (27.3%) |
| 20 to 24 Year Olds | 89 (100.0%) | 0 (0.0%) |
| 25 to 34 Year Olds | 143 (91.7%) | 13 (8.3%) |
| 35 Years and over | 49 (74.2%) | 17 (25.8%) |
| Total | 1,930 (97.2%) | 56 (2.8%) |
Educational Attainment by Field of Study in Kosciusko
Education (457 | 51.6%), business (163 | 18.4%), science & technology (125 | 14.1%), social sciences (36 | 4.1%), and communications (30 | 3.4%) are the most common fields of study among 886 individuals in Kosciusko who have obtained a bachelor's degree or higher.
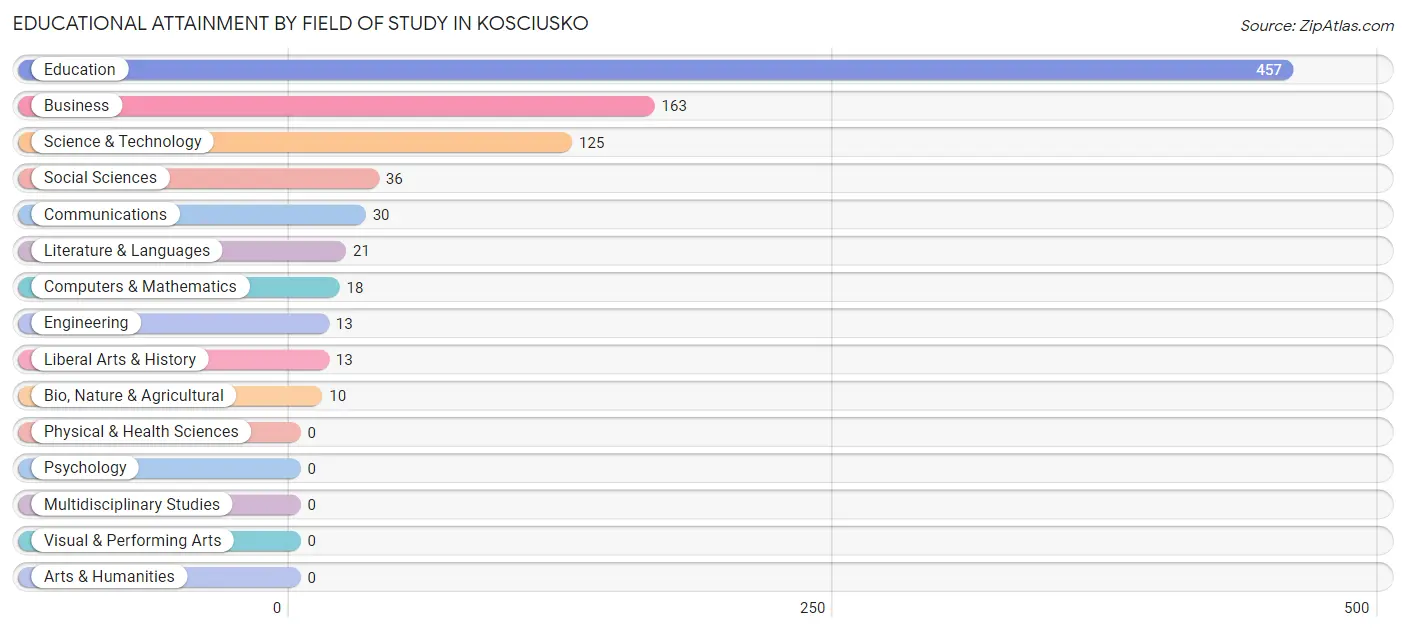
| Field of Study | # Graduates | % Graduates |
| Computers & Mathematics | 18 | 2.0% |
| Bio, Nature & Agricultural | 10 | 1.1% |
| Physical & Health Sciences | 0 | 0.0% |
| Psychology | 0 | 0.0% |
| Social Sciences | 36 | 4.1% |
| Engineering | 13 | 1.5% |
| Multidisciplinary Studies | 0 | 0.0% |
| Science & Technology | 125 | 14.1% |
| Business | 163 | 18.4% |
| Education | 457 | 51.6% |
| Literature & Languages | 21 | 2.4% |
| Liberal Arts & History | 13 | 1.5% |
| Visual & Performing Arts | 0 | 0.0% |
| Communications | 30 | 3.4% |
| Arts & Humanities | 0 | 0.0% |
| Total | 886 | 100.0% |
Transportation & Commute in Kosciusko
Vehicle Availability by Sex in Kosciusko
The most prevalent vehicle ownership categories in Kosciusko are males with 2 vehicles (527, accounting for 39.2%) and females with 2 vehicles (510, making up 31.3%).
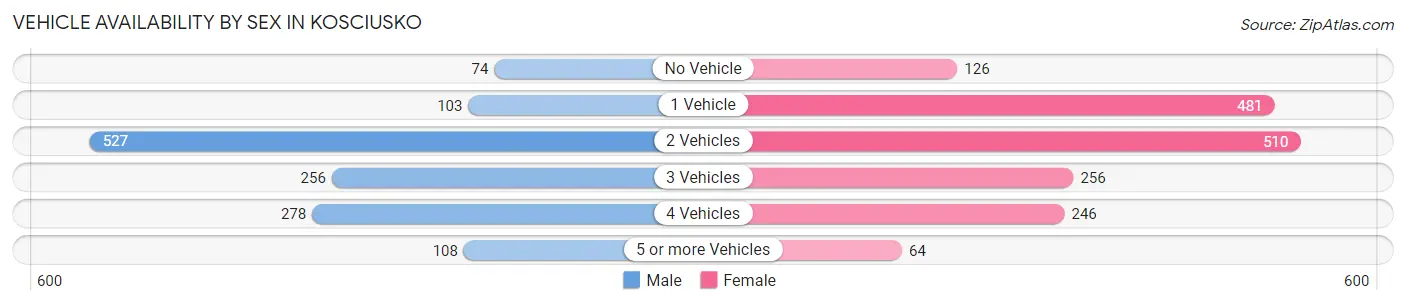
| Vehicles Available | Male | Female |
| No Vehicle | 74 (5.5%) | 126 (7.5%) |
| 1 Vehicle | 103 (7.6%) | 481 (28.6%) |
| 2 Vehicles | 527 (39.2%) | 510 (30.3%) |
| 3 Vehicles | 256 (19.0%) | 256 (15.2%) |
| 4 Vehicles | 278 (20.6%) | 246 (14.6%) |
| 5 or more Vehicles | 108 (8.0%) | 64 (3.8%) |
| Total | 1,346 (100.0%) | 1,683 (100.0%) |
Commute Time in Kosciusko
The most frequently occuring commute durations in Kosciusko are 5 to 9 minutes (687 commuters, 23.1%), 10 to 14 minutes (501 commuters, 16.9%), and 20 to 24 minutes (426 commuters, 14.3%).
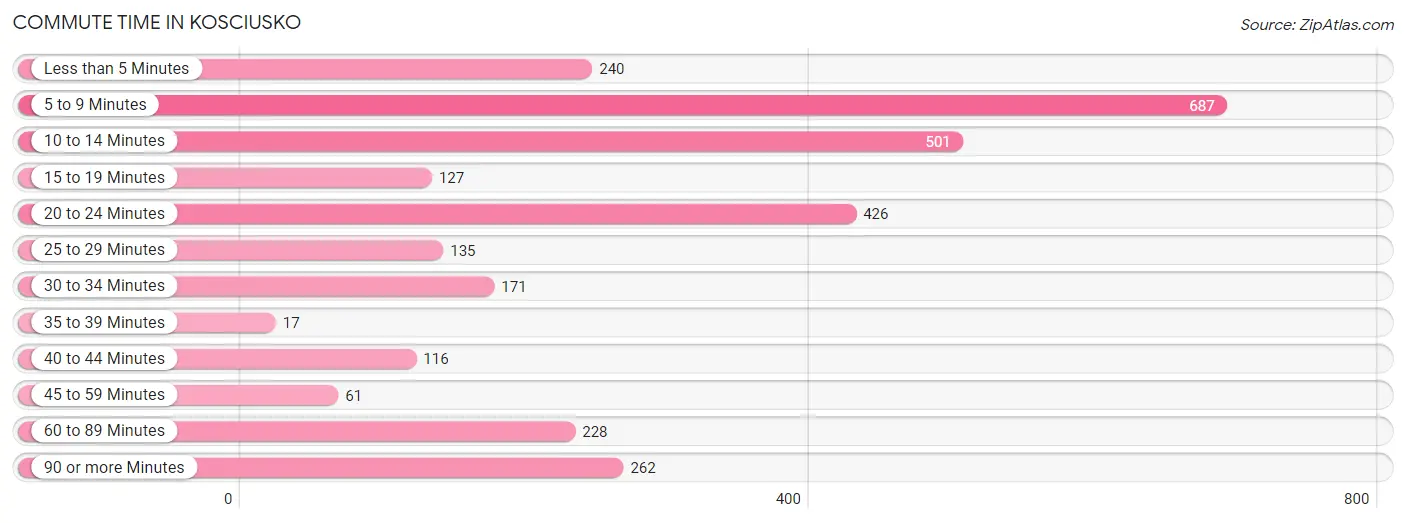
| Commute Time | # Commuters | % Commuters |
| Less than 5 Minutes | 240 | 8.1% |
| 5 to 9 Minutes | 687 | 23.1% |
| 10 to 14 Minutes | 501 | 16.9% |
| 15 to 19 Minutes | 127 | 4.3% |
| 20 to 24 Minutes | 426 | 14.3% |
| 25 to 29 Minutes | 135 | 4.5% |
| 30 to 34 Minutes | 171 | 5.8% |
| 35 to 39 Minutes | 17 | 0.6% |
| 40 to 44 Minutes | 116 | 3.9% |
| 45 to 59 Minutes | 61 | 2.1% |
| 60 to 89 Minutes | 228 | 7.7% |
| 90 or more Minutes | 262 | 8.8% |
Commute Time by Sex in Kosciusko
The most common commute times in Kosciusko are 10 to 14 minutes (313 commuters, 23.7%) for males and 5 to 9 minutes (405 commuters, 24.6%) for females.
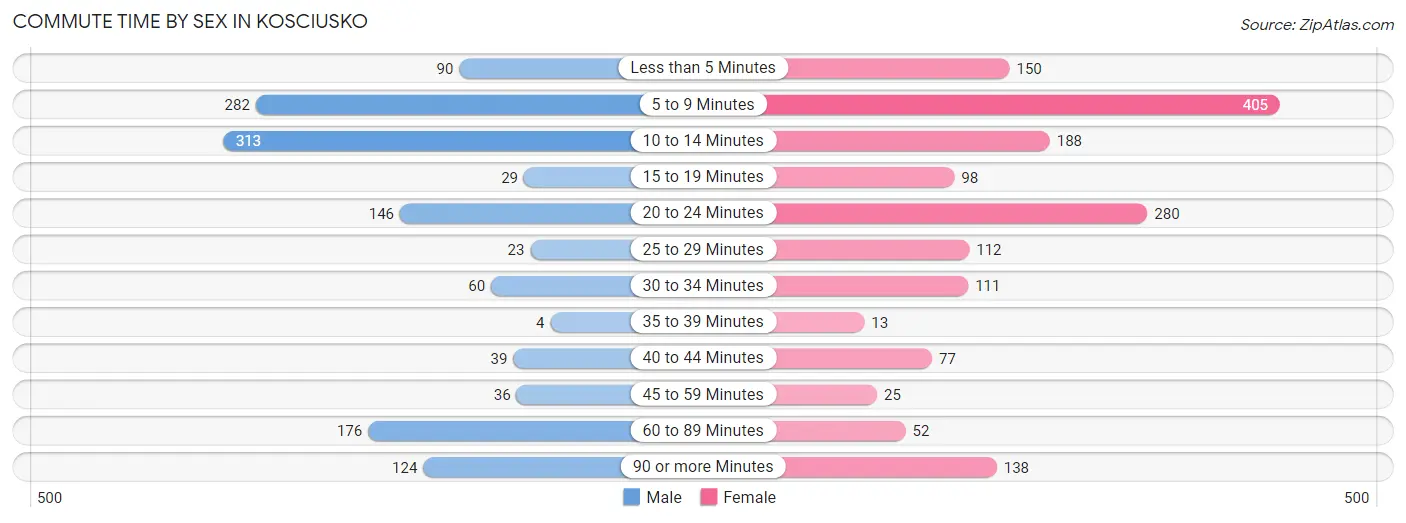
| Commute Time | Male | Female |
| Less than 5 Minutes | 90 (6.8%) | 150 (9.1%) |
| 5 to 9 Minutes | 282 (21.3%) | 405 (24.6%) |
| 10 to 14 Minutes | 313 (23.7%) | 188 (11.4%) |
| 15 to 19 Minutes | 29 (2.2%) | 98 (5.9%) |
| 20 to 24 Minutes | 146 (11.0%) | 280 (17.0%) |
| 25 to 29 Minutes | 23 (1.7%) | 112 (6.8%) |
| 30 to 34 Minutes | 60 (4.5%) | 111 (6.7%) |
| 35 to 39 Minutes | 4 (0.3%) | 13 (0.8%) |
| 40 to 44 Minutes | 39 (2.9%) | 77 (4.7%) |
| 45 to 59 Minutes | 36 (2.7%) | 25 (1.5%) |
| 60 to 89 Minutes | 176 (13.3%) | 52 (3.2%) |
| 90 or more Minutes | 124 (9.4%) | 138 (8.4%) |
Time of Departure to Work by Sex in Kosciusko
The most frequent times of departure to work in Kosciusko are 7:00 AM to 7:29 AM (372, 28.1%) for males and 12:00 PM to 3:59 PM (288, 17.5%) for females.
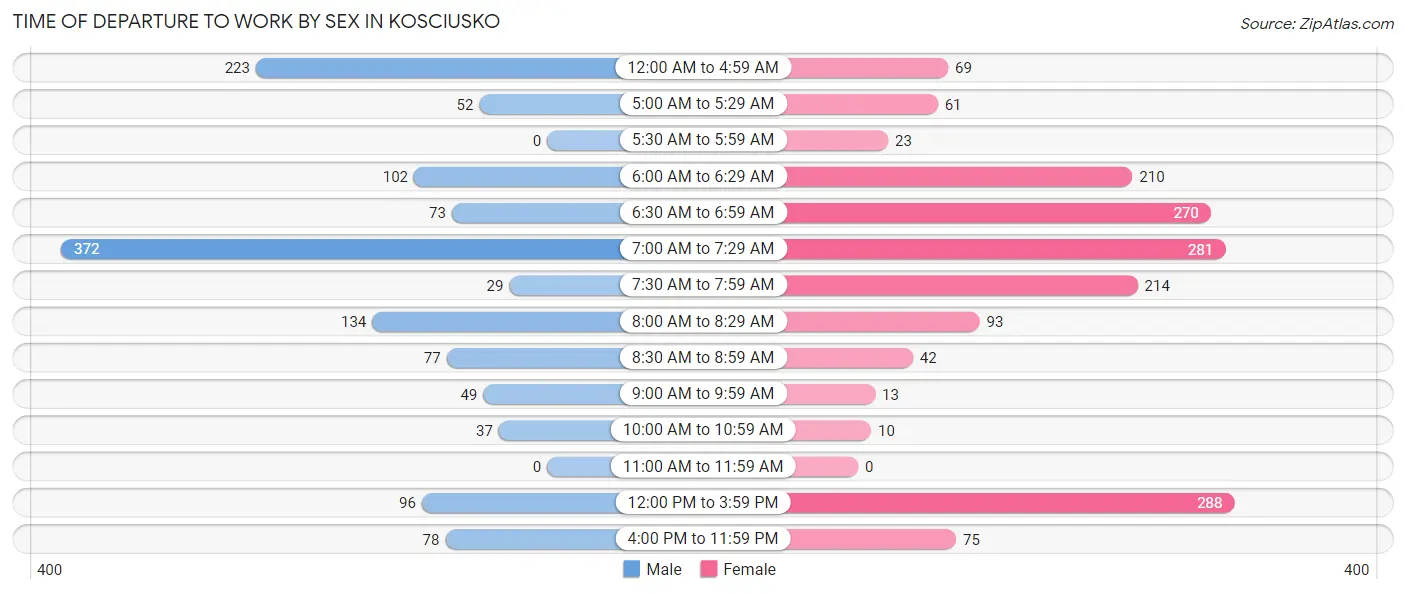
| Time of Departure | Male | Female |
| 12:00 AM to 4:59 AM | 223 (16.9%) | 69 (4.2%) |
| 5:00 AM to 5:29 AM | 52 (3.9%) | 61 (3.7%) |
| 5:30 AM to 5:59 AM | 0 (0.0%) | 23 (1.4%) |
| 6:00 AM to 6:29 AM | 102 (7.7%) | 210 (12.7%) |
| 6:30 AM to 6:59 AM | 73 (5.5%) | 270 (16.4%) |
| 7:00 AM to 7:29 AM | 372 (28.1%) | 281 (17.0%) |
| 7:30 AM to 7:59 AM | 29 (2.2%) | 214 (13.0%) |
| 8:00 AM to 8:29 AM | 134 (10.1%) | 93 (5.6%) |
| 8:30 AM to 8:59 AM | 77 (5.8%) | 42 (2.5%) |
| 9:00 AM to 9:59 AM | 49 (3.7%) | 13 (0.8%) |
| 10:00 AM to 10:59 AM | 37 (2.8%) | 10 (0.6%) |
| 11:00 AM to 11:59 AM | 0 (0.0%) | 0 (0.0%) |
| 12:00 PM to 3:59 PM | 96 (7.3%) | 288 (17.5%) |
| 4:00 PM to 11:59 PM | 78 (5.9%) | 75 (4.5%) |
| Total | 1,322 (100.0%) | 1,649 (100.0%) |
Housing Occupancy in Kosciusko
Occupancy by Ownership in Kosciusko
Of the total 2,545 dwellings in Kosciusko, owner-occupied units account for 1,436 (56.4%), while renter-occupied units make up 1,109 (43.6%).
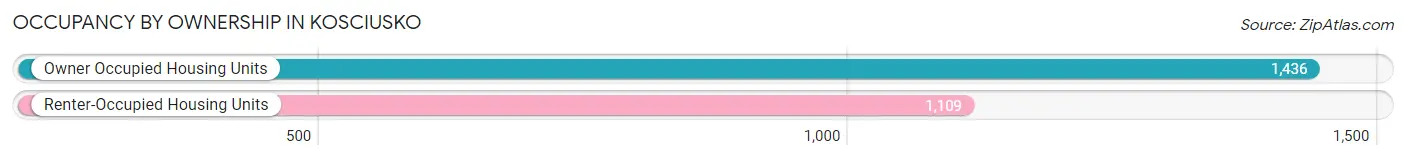
| Occupancy | # Housing Units | % Housing Units |
| Owner Occupied Housing Units | 1,436 | 56.4% |
| Renter-Occupied Housing Units | 1,109 | 43.6% |
| Total Occupied Housing Units | 2,545 | 100.0% |
Occupancy by Household Size in Kosciusko
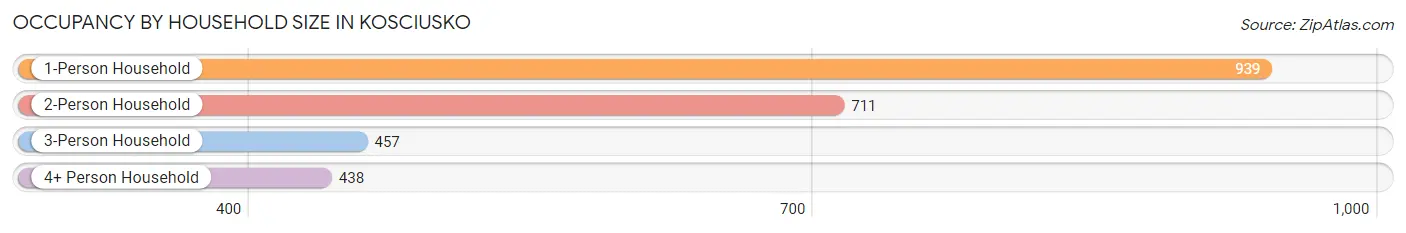
| Household Size | # Housing Units | % Housing Units |
| 1-Person Household | 939 | 36.9% |
| 2-Person Household | 711 | 27.9% |
| 3-Person Household | 457 | 18.0% |
| 4+ Person Household | 438 | 17.2% |
| Total Housing Units | 2,545 | 100.0% |
Occupancy by Ownership by Household Size in Kosciusko
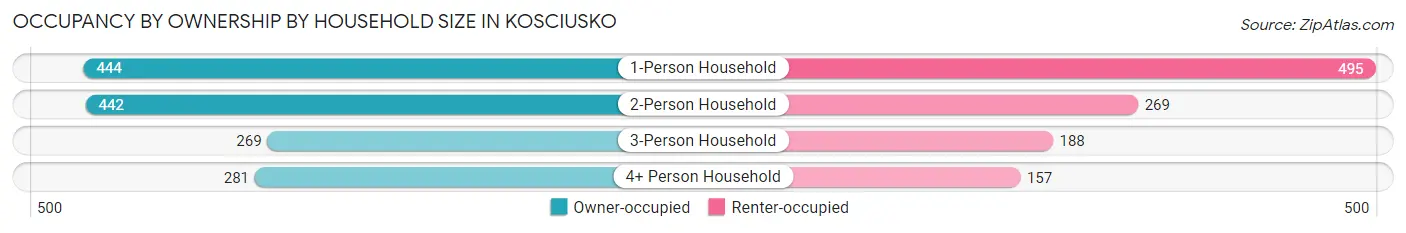
| Household Size | Owner-occupied | Renter-occupied |
| 1-Person Household | 444 (47.3%) | 495 (52.7%) |
| 2-Person Household | 442 (62.2%) | 269 (37.8%) |
| 3-Person Household | 269 (58.9%) | 188 (41.1%) |
| 4+ Person Household | 281 (64.2%) | 157 (35.8%) |
| Total Housing Units | 1,436 (56.4%) | 1,109 (43.6%) |
Occupancy by Educational Attainment in Kosciusko
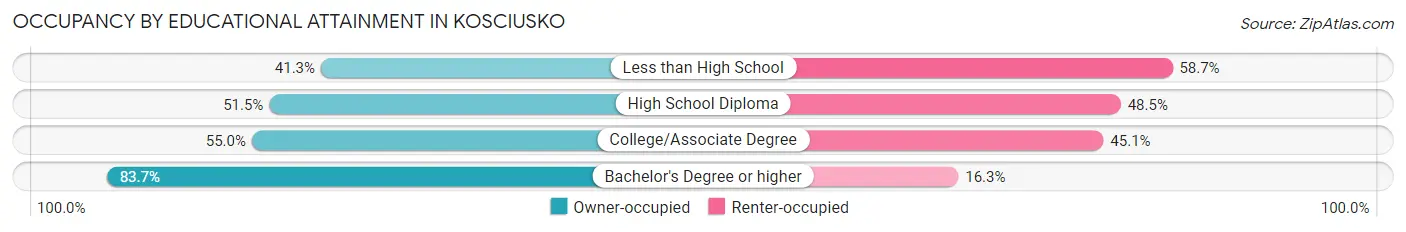
| Household Size | Owner-occupied | Renter-occupied |
| Less than High School | 118 (41.3%) | 168 (58.7%) |
| High School Diploma | 545 (51.5%) | 513 (48.5%) |
| College/Associate Degree | 444 (54.9%) | 364 (45.1%) |
| Bachelor's Degree or higher | 329 (83.7%) | 64 (16.3%) |
Occupancy by Age of Householder in Kosciusko
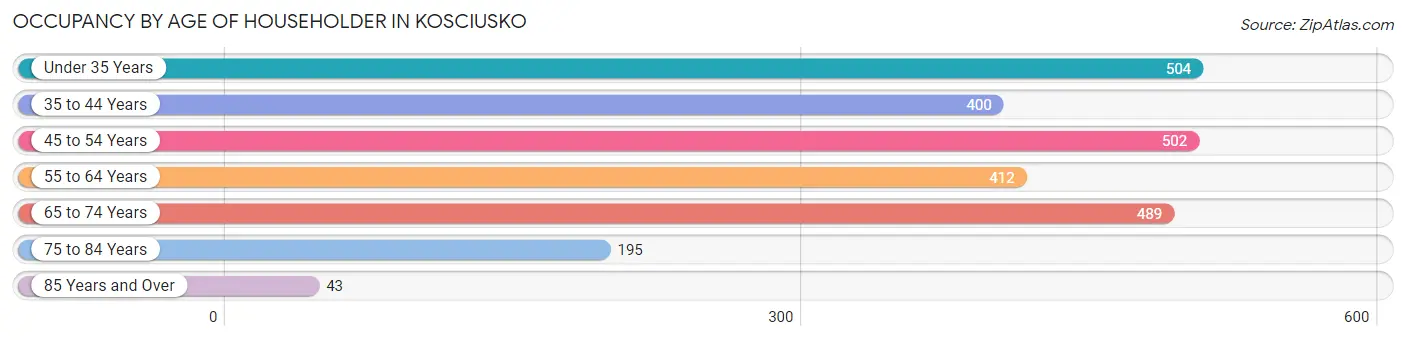
| Age Bracket | # Households | % Households |
| Under 35 Years | 504 | 19.8% |
| 35 to 44 Years | 400 | 15.7% |
| 45 to 54 Years | 502 | 19.7% |
| 55 to 64 Years | 412 | 16.2% |
| 65 to 74 Years | 489 | 19.2% |
| 75 to 84 Years | 195 | 7.7% |
| 85 Years and Over | 43 | 1.7% |
| Total | 2,545 | 100.0% |
Housing Finances in Kosciusko
Median Income by Occupancy in Kosciusko
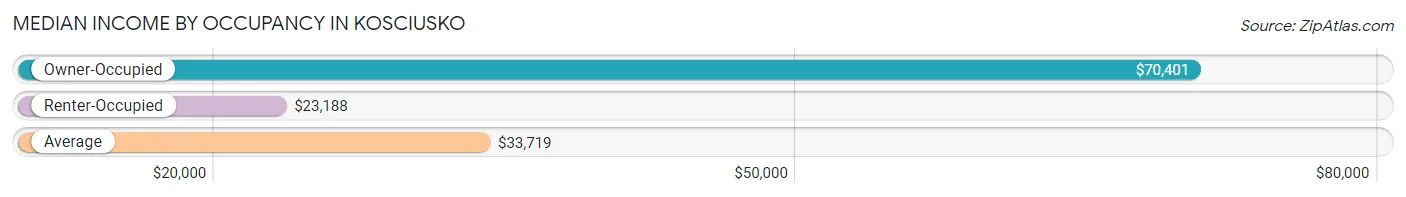
| Occupancy Type | # Households | Median Income |
| Owner-Occupied | 1,436 (56.4%) | $70,401 |
| Renter-Occupied | 1,109 (43.6%) | $23,188 |
| Average | 2,545 (100.0%) | $33,719 |
Occupancy by Householder Income Bracket in Kosciusko
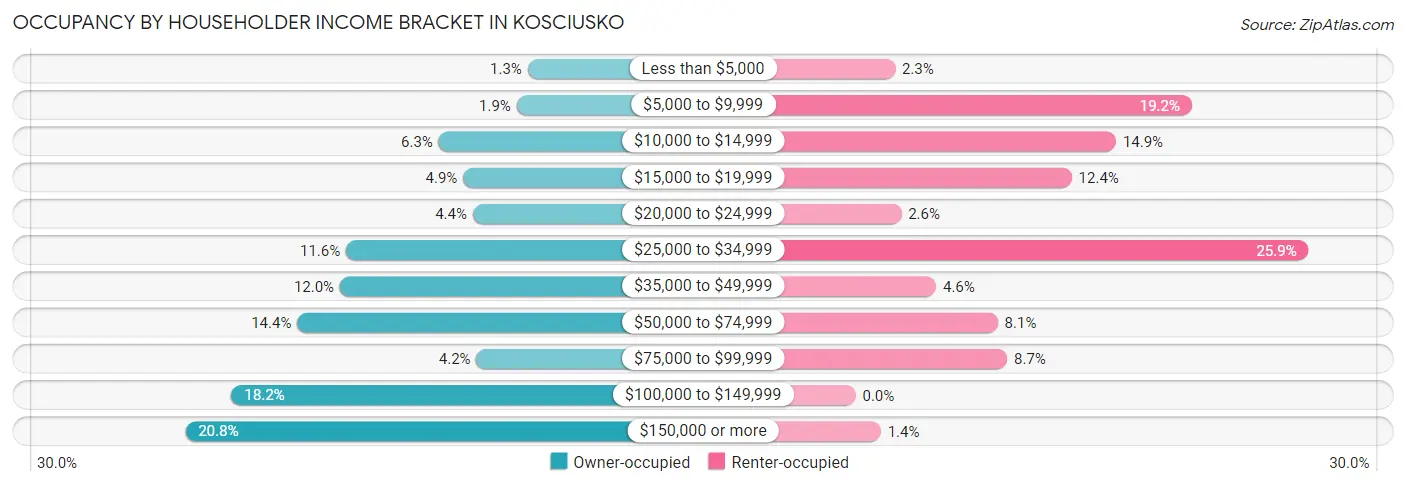
| Income Bracket | Owner-occupied | Renter-occupied |
| Less than $5,000 | 18 (1.3%) | 25 (2.2%) |
| $5,000 to $9,999 | 27 (1.9%) | 213 (19.2%) |
| $10,000 to $14,999 | 91 (6.3%) | 165 (14.9%) |
| $15,000 to $19,999 | 71 (4.9%) | 137 (12.3%) |
| $20,000 to $24,999 | 63 (4.4%) | 29 (2.6%) |
| $25,000 to $34,999 | 167 (11.6%) | 287 (25.9%) |
| $35,000 to $49,999 | 172 (12.0%) | 51 (4.6%) |
| $50,000 to $74,999 | 207 (14.4%) | 90 (8.1%) |
| $75,000 to $99,999 | 60 (4.2%) | 96 (8.7%) |
| $100,000 to $149,999 | 261 (18.2%) | 0 (0.0%) |
| $150,000 or more | 299 (20.8%) | 16 (1.4%) |
| Total | 1,436 (100.0%) | 1,109 (100.0%) |
Monthly Housing Cost Tiers in Kosciusko
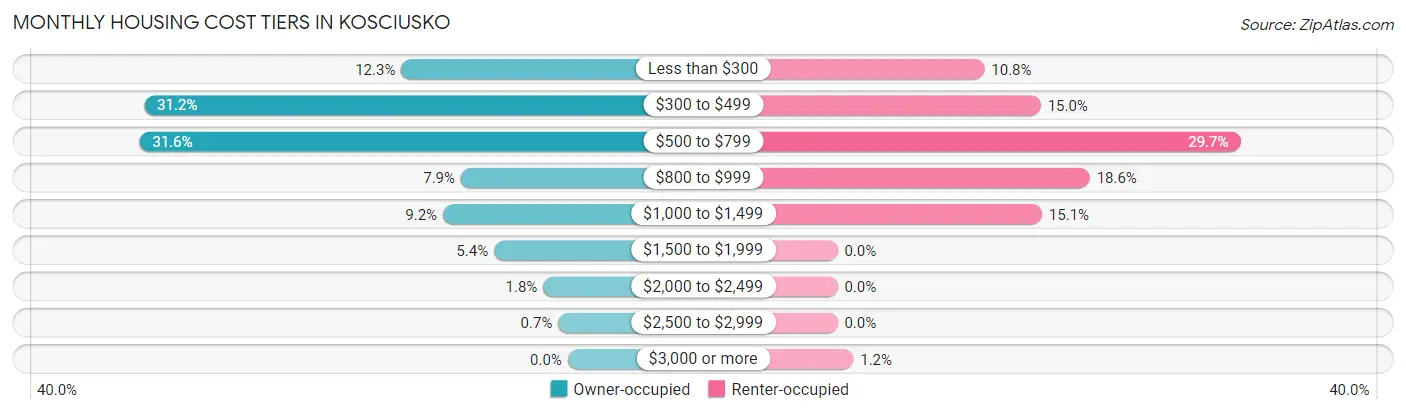
| Monthly Cost | Owner-occupied | Renter-occupied |
| Less than $300 | 176 (12.3%) | 120 (10.8%) |
| $300 to $499 | 448 (31.2%) | 166 (15.0%) |
| $500 to $799 | 453 (31.6%) | 329 (29.7%) |
| $800 to $999 | 113 (7.9%) | 206 (18.6%) |
| $1,000 to $1,499 | 132 (9.2%) | 167 (15.1%) |
| $1,500 to $1,999 | 78 (5.4%) | 0 (0.0%) |
| $2,000 to $2,499 | 26 (1.8%) | 0 (0.0%) |
| $2,500 to $2,999 | 10 (0.7%) | 0 (0.0%) |
| $3,000 or more | 0 (0.0%) | 13 (1.2%) |
| Total | 1,436 (100.0%) | 1,109 (100.0%) |
Physical Housing Characteristics in Kosciusko
Housing Structures in Kosciusko
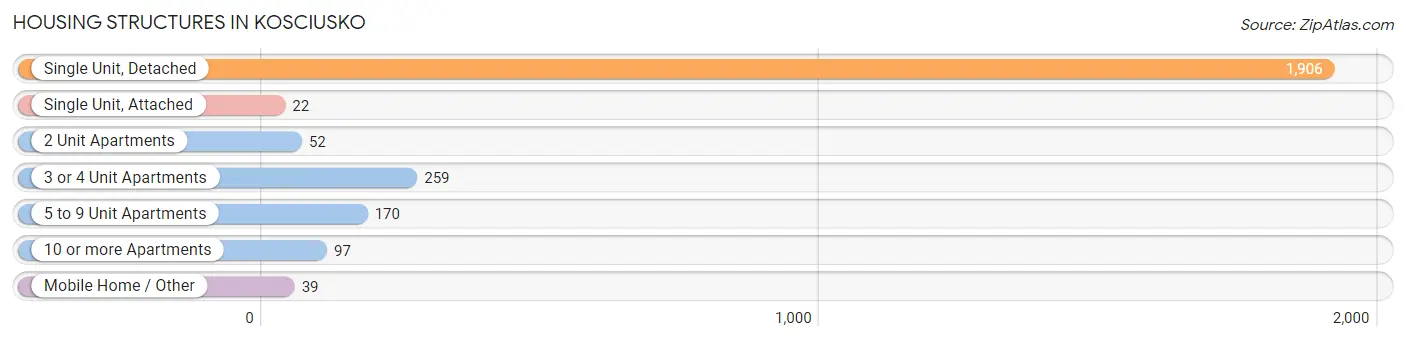
| Structure Type | # Housing Units | % Housing Units |
| Single Unit, Detached | 1,906 | 74.9% |
| Single Unit, Attached | 22 | 0.9% |
| 2 Unit Apartments | 52 | 2.0% |
| 3 or 4 Unit Apartments | 259 | 10.2% |
| 5 to 9 Unit Apartments | 170 | 6.7% |
| 10 or more Apartments | 97 | 3.8% |
| Mobile Home / Other | 39 | 1.5% |
| Total | 2,545 | 100.0% |
Housing Structures by Occupancy in Kosciusko
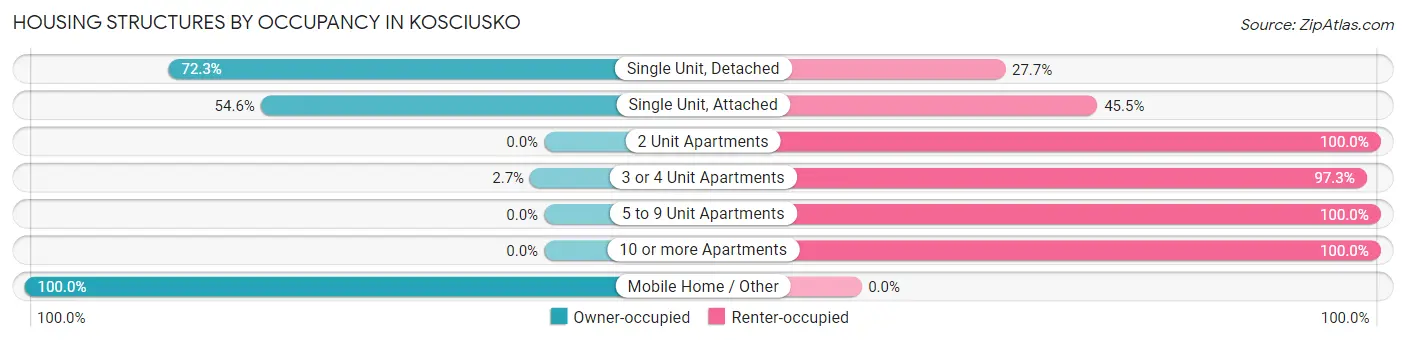
| Structure Type | Owner-occupied | Renter-occupied |
| Single Unit, Detached | 1,378 (72.3%) | 528 (27.7%) |
| Single Unit, Attached | 12 (54.5%) | 10 (45.5%) |
| 2 Unit Apartments | 0 (0.0%) | 52 (100.0%) |
| 3 or 4 Unit Apartments | 7 (2.7%) | 252 (97.3%) |
| 5 to 9 Unit Apartments | 0 (0.0%) | 170 (100.0%) |
| 10 or more Apartments | 0 (0.0%) | 97 (100.0%) |
| Mobile Home / Other | 39 (100.0%) | 0 (0.0%) |
| Total | 1,436 (56.4%) | 1,109 (43.6%) |
Housing Structures by Number of Rooms in Kosciusko
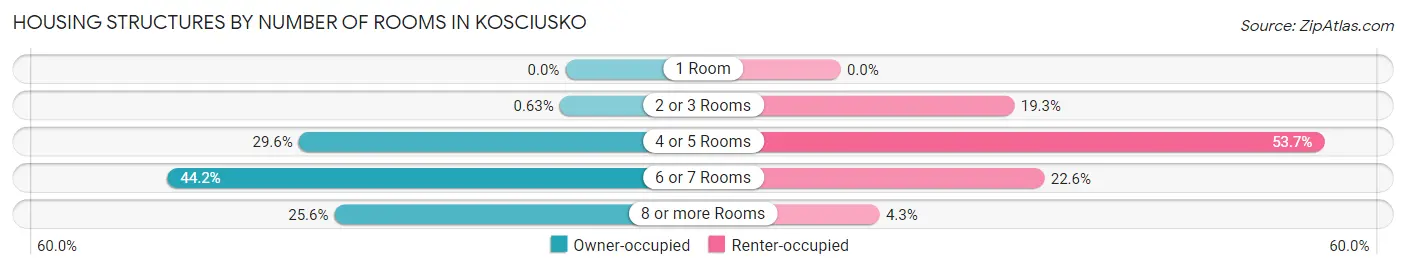
| Number of Rooms | Owner-occupied | Renter-occupied |
| 1 Room | 0 (0.0%) | 0 (0.0%) |
| 2 or 3 Rooms | 9 (0.6%) | 214 (19.3%) |
| 4 or 5 Rooms | 425 (29.6%) | 596 (53.7%) |
| 6 or 7 Rooms | 634 (44.2%) | 251 (22.6%) |
| 8 or more Rooms | 368 (25.6%) | 48 (4.3%) |
| Total | 1,436 (100.0%) | 1,109 (100.0%) |
Housing Structure by Heating Type in Kosciusko
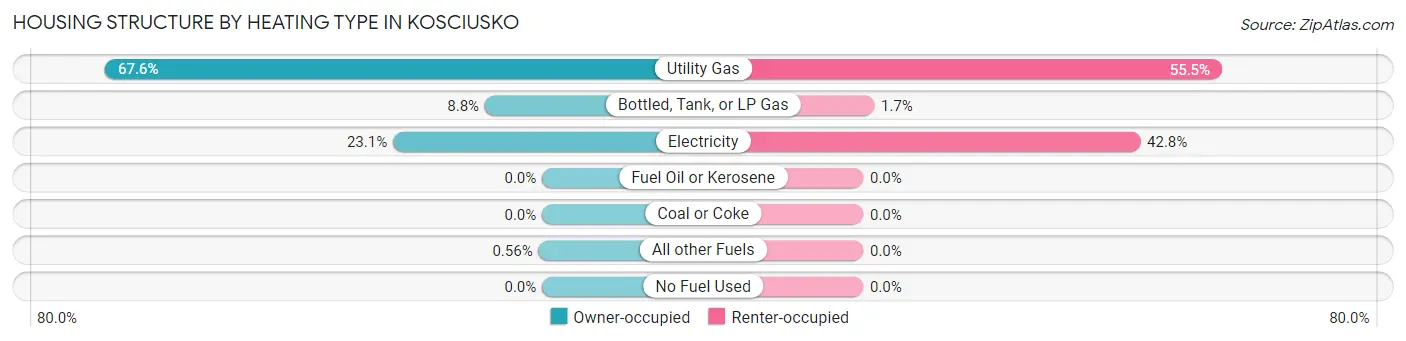
| Heating Type | Owner-occupied | Renter-occupied |
| Utility Gas | 970 (67.5%) | 615 (55.5%) |
| Bottled, Tank, or LP Gas | 127 (8.8%) | 19 (1.7%) |
| Electricity | 331 (23.1%) | 475 (42.8%) |
| Fuel Oil or Kerosene | 0 (0.0%) | 0 (0.0%) |
| Coal or Coke | 0 (0.0%) | 0 (0.0%) |
| All other Fuels | 8 (0.6%) | 0 (0.0%) |
| No Fuel Used | 0 (0.0%) | 0 (0.0%) |
| Total | 1,436 (100.0%) | 1,109 (100.0%) |
Household Vehicle Usage in Kosciusko
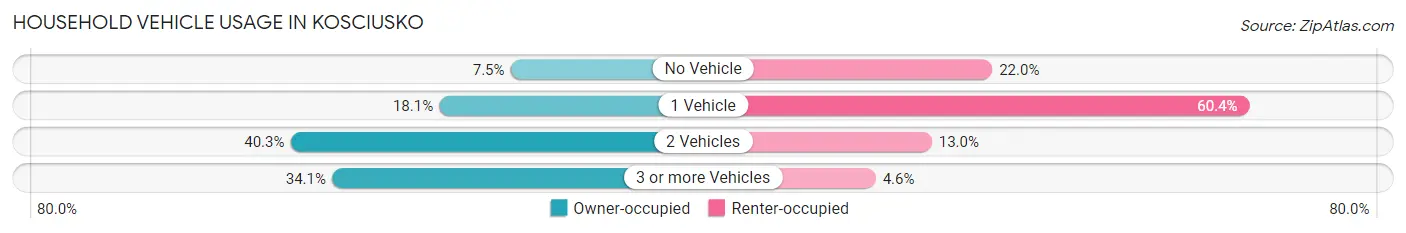
| Vehicles per Household | Owner-occupied | Renter-occupied |
| No Vehicle | 107 (7.4%) | 244 (22.0%) |
| 1 Vehicle | 260 (18.1%) | 670 (60.4%) |
| 2 Vehicles | 579 (40.3%) | 144 (13.0%) |
| 3 or more Vehicles | 490 (34.1%) | 51 (4.6%) |
| Total | 1,436 (100.0%) | 1,109 (100.0%) |
Real Estate & Mortgages in Kosciusko
Real Estate and Mortgage Overview in Kosciusko
| Characteristic | Without Mortgage | With Mortgage |
| Housing Units | 837 | 599 |
| Median Property Value | $106,800 | $126,300 |
| Median Household Income | $53,194 | $141 |
| Monthly Housing Costs | $422 | $0 |
| Real Estate Taxes | $897 | $133 |
Property Value by Mortgage Status in Kosciusko
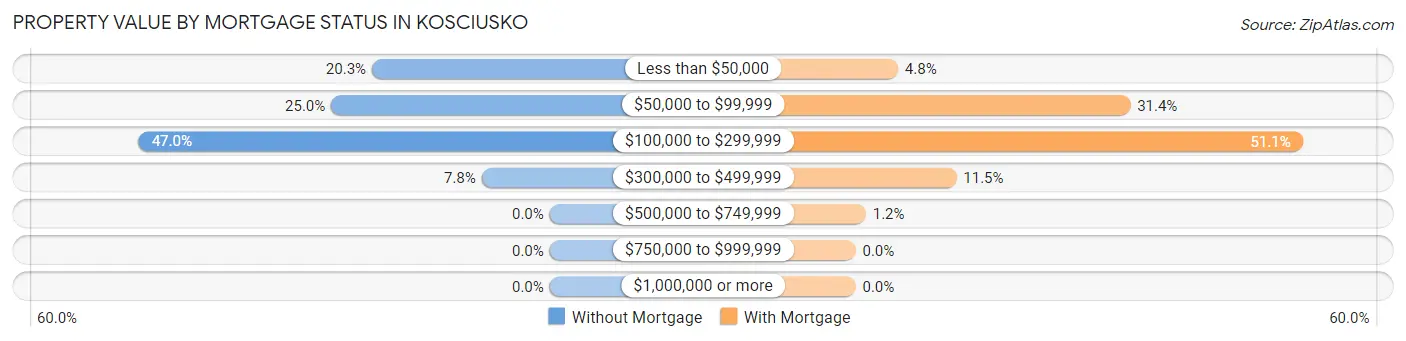
| Property Value | Without Mortgage | With Mortgage |
| Less than $50,000 | 170 (20.3%) | 29 (4.8%) |
| $50,000 to $99,999 | 209 (25.0%) | 188 (31.4%) |
| $100,000 to $299,999 | 393 (46.9%) | 306 (51.1%) |
| $300,000 to $499,999 | 65 (7.8%) | 69 (11.5%) |
| $500,000 to $749,999 | 0 (0.0%) | 7 (1.2%) |
| $750,000 to $999,999 | 0 (0.0%) | 0 (0.0%) |
| $1,000,000 or more | 0 (0.0%) | 0 (0.0%) |
| Total | 837 (100.0%) | 599 (100.0%) |
Household Income by Mortgage Status in Kosciusko
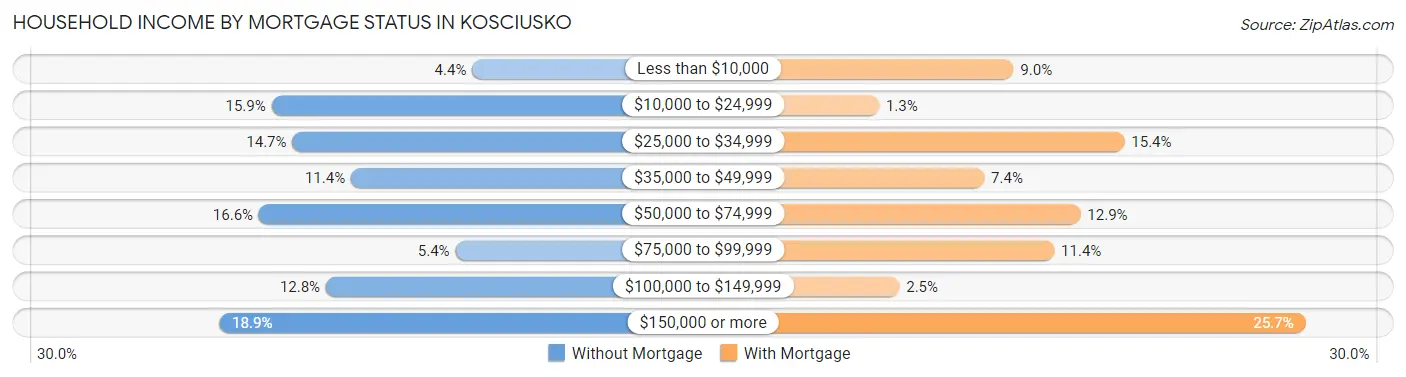
| Household Income | Without Mortgage | With Mortgage |
| Less than $10,000 | 37 (4.4%) | 54 (9.0%) |
| $10,000 to $24,999 | 133 (15.9%) | 8 (1.3%) |
| $25,000 to $34,999 | 123 (14.7%) | 92 (15.4%) |
| $35,000 to $49,999 | 95 (11.4%) | 44 (7.3%) |
| $50,000 to $74,999 | 139 (16.6%) | 77 (12.9%) |
| $75,000 to $99,999 | 45 (5.4%) | 68 (11.4%) |
| $100,000 to $149,999 | 107 (12.8%) | 15 (2.5%) |
| $150,000 or more | 158 (18.9%) | 154 (25.7%) |
| Total | 837 (100.0%) | 599 (100.0%) |
Property Value to Household Income Ratio in Kosciusko
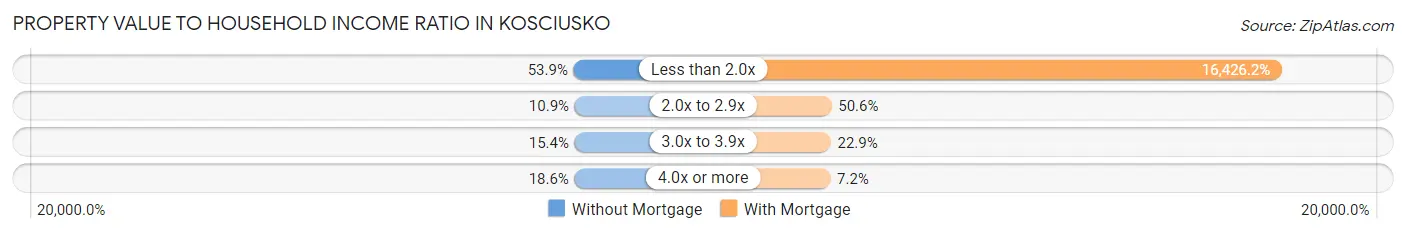
| Value-to-Income Ratio | Without Mortgage | With Mortgage |
| Less than 2.0x | 451 (53.9%) | 98,393 (16,426.2%) |
| 2.0x to 2.9x | 91 (10.9%) | 303 (50.6%) |
| 3.0x to 3.9x | 129 (15.4%) | 137 (22.9%) |
| 4.0x or more | 156 (18.6%) | 43 (7.2%) |
| Total | 837 (100.0%) | 599 (100.0%) |
Real Estate Taxes by Mortgage Status in Kosciusko
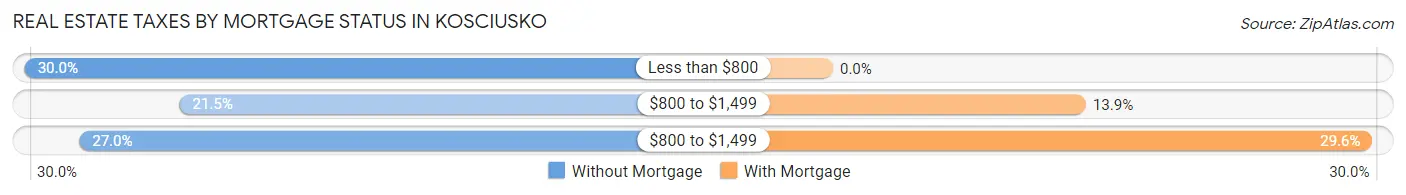
| Property Taxes | Without Mortgage | With Mortgage |
| Less than $800 | 251 (30.0%) | 0 (0.0%) |
| $800 to $1,499 | 180 (21.5%) | 83 (13.9%) |
| $800 to $1,499 | 226 (27.0%) | 177 (29.5%) |
| Total | 837 (100.0%) | 599 (100.0%) |
Health & Disability in Kosciusko
Health Insurance Coverage by Age in Kosciusko
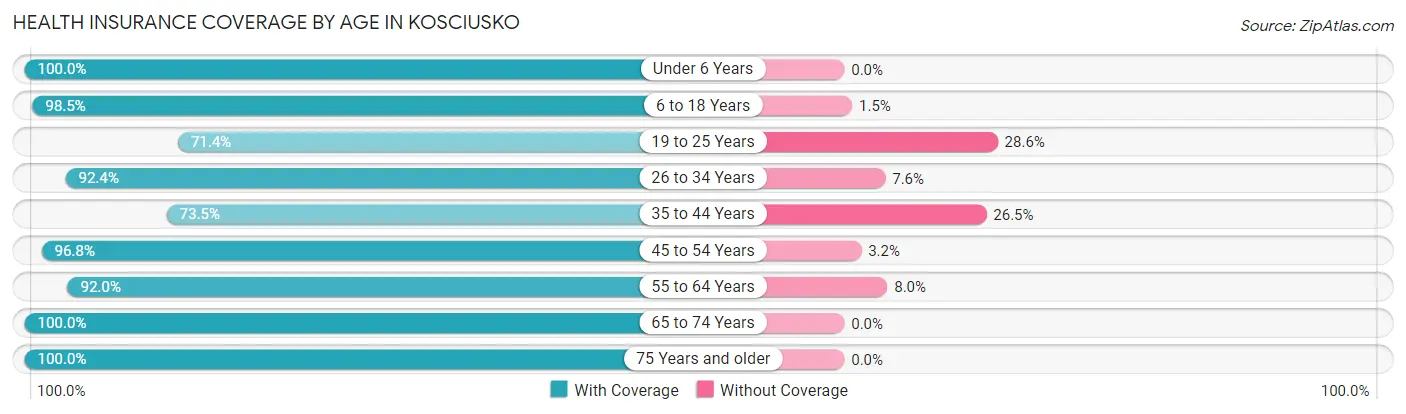
| Age Bracket | With Coverage | Without Coverage |
| Under 6 Years | 499 (100.0%) | 0 (0.0%) |
| 6 to 18 Years | 1,616 (98.5%) | 24 (1.5%) |
| 19 to 25 Years | 412 (71.4%) | 165 (28.6%) |
| 26 to 34 Years | 689 (92.4%) | 57 (7.6%) |
| 35 to 44 Years | 580 (73.5%) | 209 (26.5%) |
| 45 to 54 Years | 706 (96.8%) | 23 (3.2%) |
| 55 to 64 Years | 596 (92.0%) | 52 (8.0%) |
| 65 to 74 Years | 684 (100.0%) | 0 (0.0%) |
| 75 Years and older | 396 (100.0%) | 0 (0.0%) |
| Total | 6,178 (92.1%) | 530 (7.9%) |
Health Insurance Coverage by Citizenship Status in Kosciusko
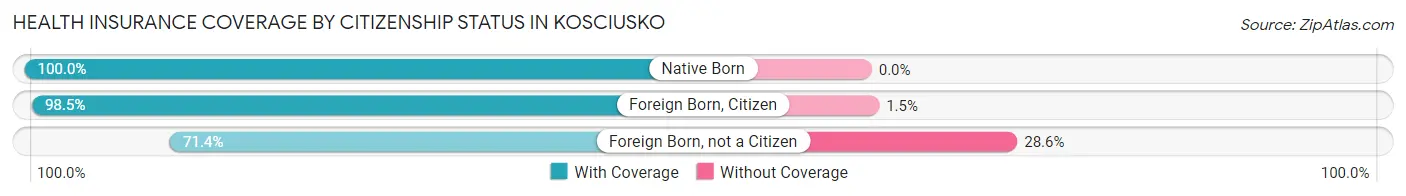
| Citizenship Status | With Coverage | Without Coverage |
| Native Born | 499 (100.0%) | 0 (0.0%) |
| Foreign Born, Citizen | 1,616 (98.5%) | 24 (1.5%) |
| Foreign Born, not a Citizen | 412 (71.4%) | 165 (28.6%) |
Health Insurance Coverage by Household Income in Kosciusko
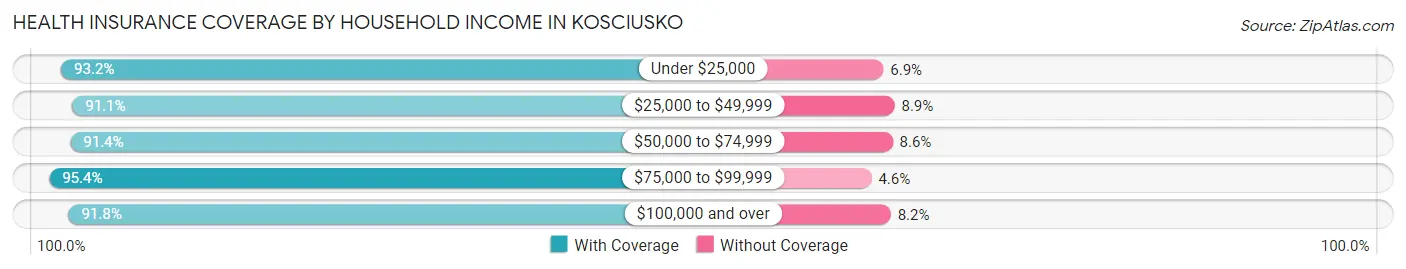
| Household Income | With Coverage | Without Coverage |
| Under $25,000 | 1,551 (93.1%) | 114 (6.9%) |
| $25,000 to $49,999 | 1,487 (91.1%) | 146 (8.9%) |
| $50,000 to $74,999 | 778 (91.4%) | 73 (8.6%) |
| $75,000 to $99,999 | 413 (95.4%) | 20 (4.6%) |
| $100,000 and over | 1,929 (91.8%) | 173 (8.2%) |
Public vs Private Health Insurance Coverage by Age in Kosciusko
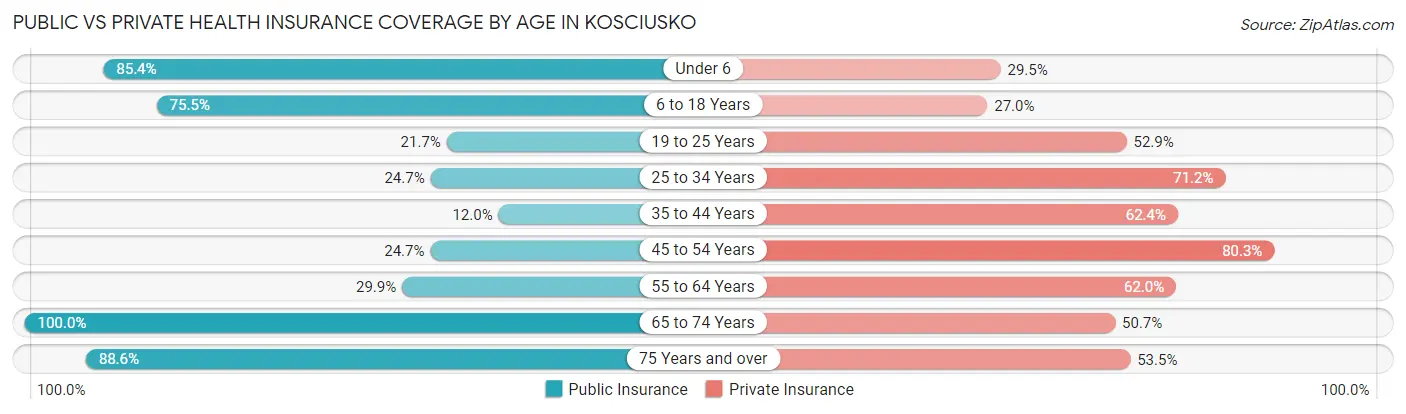
| Age Bracket | Public Insurance | Private Insurance |
| Under 6 | 426 (85.4%) | 147 (29.5%) |
| 6 to 18 Years | 1,238 (75.5%) | 443 (27.0%) |
| 19 to 25 Years | 125 (21.7%) | 305 (52.9%) |
| 25 to 34 Years | 184 (24.7%) | 531 (71.2%) |
| 35 to 44 Years | 95 (12.0%) | 492 (62.4%) |
| 45 to 54 Years | 180 (24.7%) | 585 (80.2%) |
| 55 to 64 Years | 194 (29.9%) | 402 (62.0%) |
| 65 to 74 Years | 684 (100.0%) | 347 (50.7%) |
| 75 Years and over | 351 (88.6%) | 212 (53.5%) |
| Total | 3,477 (51.8%) | 3,464 (51.6%) |
Disability Status by Sex by Age in Kosciusko
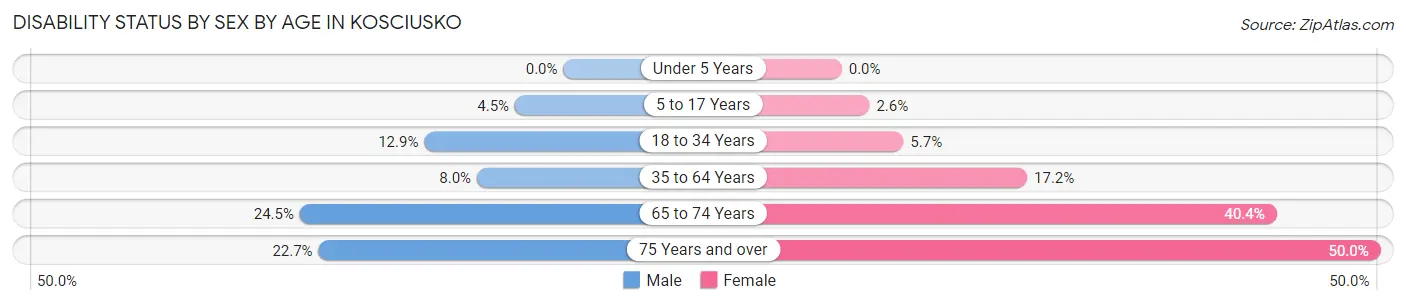
| Age Bracket | Male | Female |
| Under 5 Years | 0 (0.0%) | 0 (0.0%) |
| 5 to 17 Years | 33 (4.5%) | 20 (2.6%) |
| 18 to 34 Years | 87 (12.9%) | 50 (5.7%) |
| 35 to 64 Years | 73 (8.0%) | 216 (17.2%) |
| 65 to 74 Years | 57 (24.5%) | 182 (40.4%) |
| 75 Years and over | 25 (22.7%) | 143 (50.0%) |
Disability Class by Sex by Age in Kosciusko
Disability Class: Hearing Difficulty
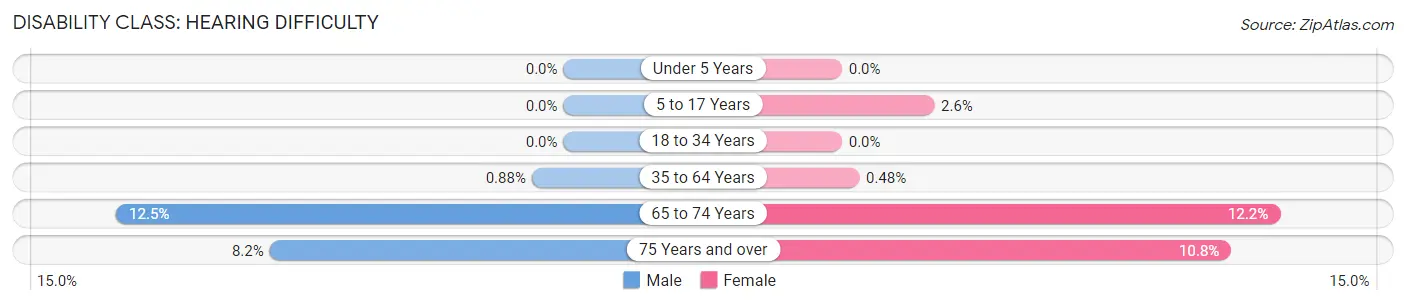
| Age Bracket | Male | Female |
| Under 5 Years | 0 (0.0%) | 0 (0.0%) |
| 5 to 17 Years | 0 (0.0%) | 20 (2.6%) |
| 18 to 34 Years | 0 (0.0%) | 0 (0.0%) |
| 35 to 64 Years | 8 (0.9%) | 6 (0.5%) |
| 65 to 74 Years | 29 (12.4%) | 55 (12.2%) |
| 75 Years and over | 9 (8.2%) | 31 (10.8%) |
Disability Class: Vision Difficulty
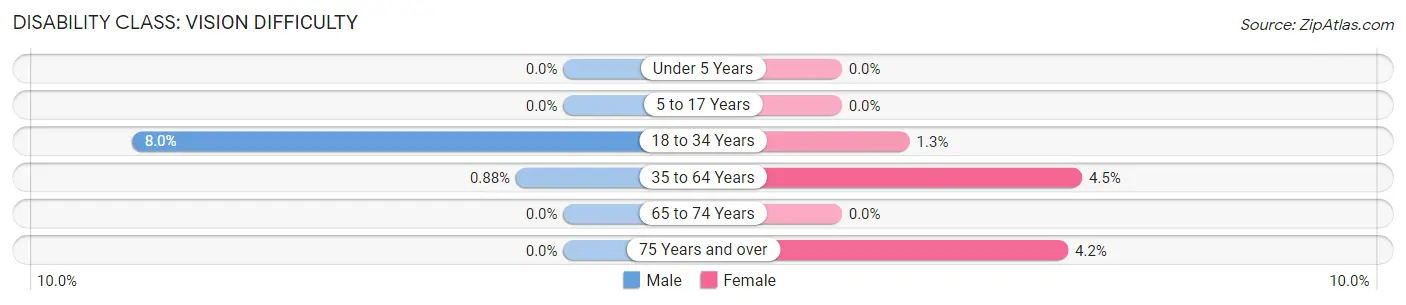
| Age Bracket | Male | Female |
| Under 5 Years | 0 (0.0%) | 0 (0.0%) |
| 5 to 17 Years | 0 (0.0%) | 0 (0.0%) |
| 18 to 34 Years | 54 (8.0%) | 11 (1.3%) |
| 35 to 64 Years | 8 (0.9%) | 56 (4.5%) |
| 65 to 74 Years | 0 (0.0%) | 0 (0.0%) |
| 75 Years and over | 0 (0.0%) | 12 (4.2%) |
Disability Class: Cognitive Difficulty
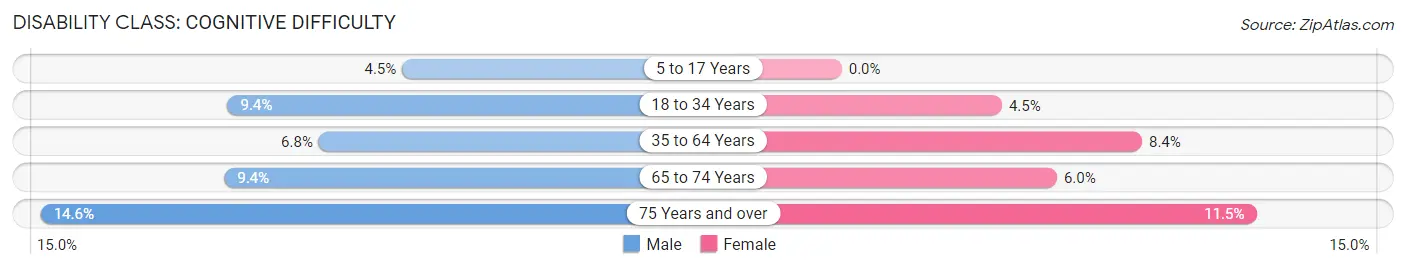
| Age Bracket | Male | Female |
| 5 to 17 Years | 33 (4.5%) | 0 (0.0%) |
| 18 to 34 Years | 63 (9.3%) | 39 (4.5%) |
| 35 to 64 Years | 62 (6.8%) | 105 (8.4%) |
| 65 to 74 Years | 22 (9.4%) | 27 (6.0%) |
| 75 Years and over | 16 (14.5%) | 33 (11.5%) |
Disability Class: Ambulatory Difficulty
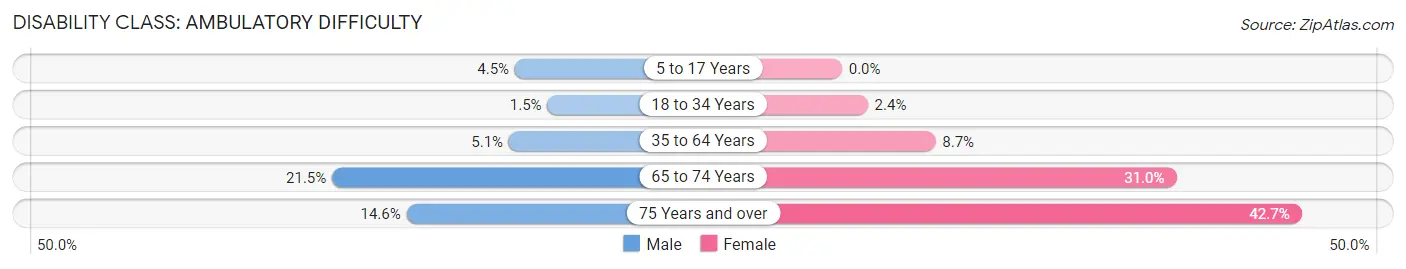
| Age Bracket | Male | Female |
| 5 to 17 Years | 33 (4.5%) | 0 (0.0%) |
| 18 to 34 Years | 10 (1.5%) | 21 (2.4%) |
| 35 to 64 Years | 46 (5.1%) | 109 (8.7%) |
| 65 to 74 Years | 50 (21.5%) | 140 (31.0%) |
| 75 Years and over | 16 (14.5%) | 122 (42.7%) |
Disability Class: Self-Care Difficulty
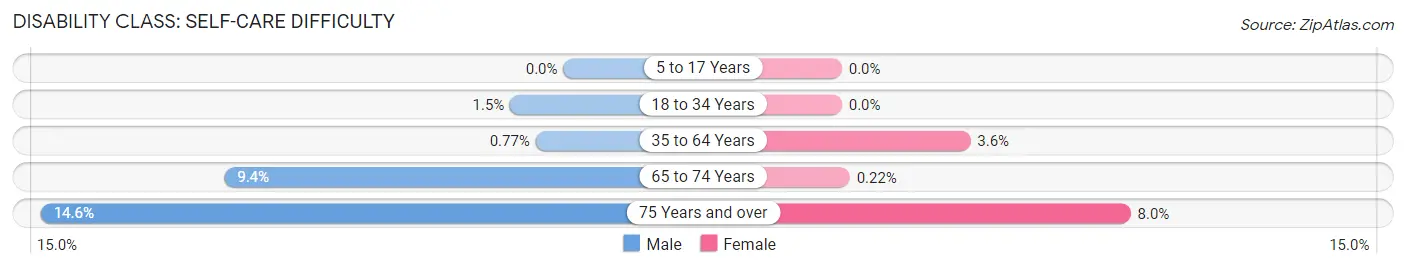
| Age Bracket | Male | Female |
| 5 to 17 Years | 0 (0.0%) | 0 (0.0%) |
| 18 to 34 Years | 10 (1.5%) | 0 (0.0%) |
| 35 to 64 Years | 7 (0.8%) | 45 (3.6%) |
| 65 to 74 Years | 22 (9.4%) | 1 (0.2%) |
| 75 Years and over | 16 (14.5%) | 23 (8.0%) |
Technology Access in Kosciusko
Computing Device Access in Kosciusko
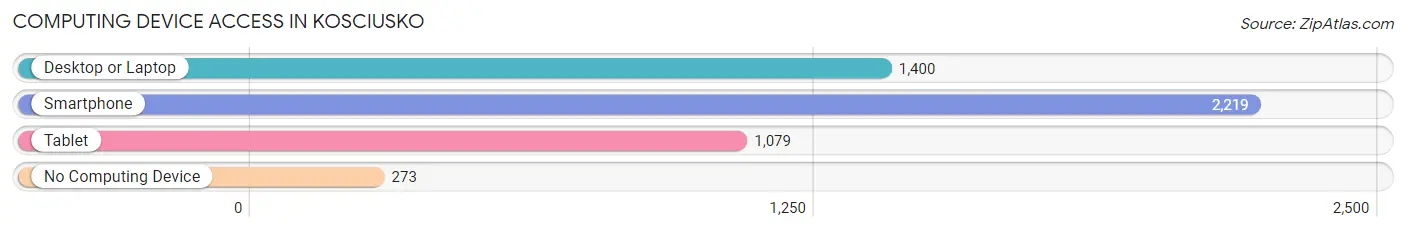
| Device Type | # Households | % Households |
| Desktop or Laptop | 1,400 | 55.0% |
| Smartphone | 2,219 | 87.2% |
| Tablet | 1,079 | 42.4% |
| No Computing Device | 273 | 10.7% |
| Total | 2,545 | 100.0% |
Internet Access in Kosciusko
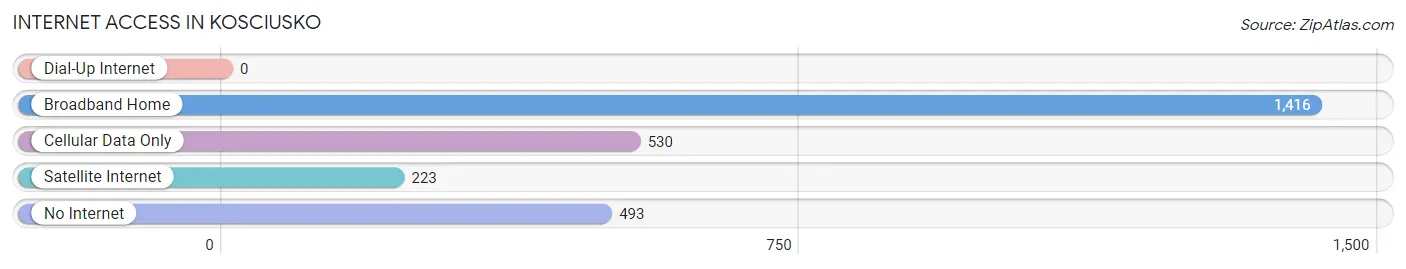
| Internet Type | # Households | % Households |
| Dial-Up Internet | 0 | 0.0% |
| Broadband Home | 1,416 | 55.6% |
| Cellular Data Only | 530 | 20.8% |
| Satellite Internet | 223 | 8.8% |
| No Internet | 493 | 19.4% |
| Total | 2,545 | 100.0% |
Kosciusko Summary
Kosciusko is a city located in Attala County, Mississippi. It is the county seat of Attala County and is located in the north-central part of the state. The city is situated along the Yockanookany River and is home to a population of approximately 7,000 people.
Kosciusko was founded in 1833 and was named after the Polish military leader and statesman, Tadeusz Kosciuszko. The city was originally a trading post and was the site of a major battle during the Civil War. The city was also the birthplace of the blues musician, Robert Johnson.
Geography
Kosciusko is located in the north-central part of Mississippi, approximately 70 miles south of Jackson, the state capital. The city is situated along the Yockanookany River and is surrounded by rolling hills and forests. The city has a total area of 8.2 square miles, all of which is land.
Climate
Kosciusko has a humid subtropical climate, with hot, humid summers and mild winters. The average annual temperature is around 64°F, with an average high of around 90°F in the summer and an average low of around 40°F in the winter. The city receives an average of 48 inches of precipitation per year, with most of it falling in the spring and summer months.
Demographics
As of the 2010 census, the population of Kosciusko was 7,372. The racial makeup of the city was 57.3% African American, 37.2% White, 0.7% Native American, 0.3% Asian, 0.1% Pacific Islander, and 4.4% from other races. The median household income was $25,945, and the median family income was $32,917.
Economy
Kosciusko’s economy is largely based on agriculture and manufacturing. The city is home to several large poultry processing plants, as well as a number of smaller businesses. The city is also home to a number of retail stores, restaurants, and other service-based businesses.
Education
Kosciusko is served by the Attala County School District, which operates five elementary schools, two middle schools, and one high school. The city is also home to a number of private schools, including a Christian school and a Montessori school.
Transportation
Kosciusko is served by the Kosciusko-Attala County Airport, which offers daily flights to Jackson and other nearby cities. The city is also served by a number of bus lines, including Greyhound and Jefferson Lines.
Culture
Kosciusko is home to a number of cultural attractions, including the Attala County Historical Museum, the Robert Johnson Blues Museum, and the Kosciusko Arts Center. The city also hosts a number of annual festivals and events, including the Attala County Fair and the Robert Johnson Blues Festival.
Kosciusko is a small city with a rich history and a vibrant culture. The city is home to a diverse population and a thriving economy, and is a great place to live, work, and play.
Common Questions
What is Per Capita Income in Kosciusko?
Per Capita income in Kosciusko is $33,573.
What is the Median Family Income in Kosciusko?
Median Family Income in Kosciusko is $51,382.
What is the Median Household income in Kosciusko?
Median Household Income in Kosciusko is $33,719.
What is Income or Wage Gap in Kosciusko?
Income or Wage Gap in Kosciusko is 24.5%.
Women in Kosciusko earn 75.5 cents for every dollar earned by a man.
What is Inequality or Gini Index in Kosciusko?
Inequality or Gini Index in Kosciusko is 0.62.
What is the Total Population of Kosciusko?
Total Population of Kosciusko is 7,056.
What is the Total Male Population of Kosciusko?
Total Male Population of Kosciusko is 3,077.
What is the Total Female Population of Kosciusko?
Total Female Population of Kosciusko is 3,979.
What is the Ratio of Males per 100 Females in Kosciusko?
There are 77.33 Males per 100 Females in Kosciusko.
What is the Ratio of Females per 100 Males in Kosciusko?
There are 129.31 Females per 100 Males in Kosciusko.
What is the Median Population Age in Kosciusko?
Median Population Age in Kosciusko is 36.2 Years.
What is the Average Family Size in Kosciusko
Average Family Size in Kosciusko is 3.6 People.
What is the Average Household Size in Kosciusko
Average Household Size in Kosciusko is 2.6 People.
How Large is the Labor Force in Kosciusko?
There are 3,236 People in the Labor Forcein in Kosciusko.
What is the Percentage of People in the Labor Force in Kosciusko?
60.5% of People are in the Labor Force in Kosciusko.
What is the Unemployment Rate in Kosciusko?
Unemployment Rate in Kosciusko is 5.5%.