Greenwood, MS Map & Demographics
Greenwood Map
Greenwood Overview
$28,641
PER CAPITA INCOME
$48,239
AVG FAMILY INCOME
$37,718
AVG HOUSEHOLD INCOME
11.2%
WAGE / INCOME GAP [ % ]
88.8¢/ $1
WAGE / INCOME GAP [ $ ]
$11,796
FAMILY INCOME DEFICIT
0.61
INEQUALITY / GINI INDEX
14,242
TOTAL POPULATION
6,240
MALE POPULATION
8,002
FEMALE POPULATION
77.98
MALES / 100 FEMALES
128.24
FEMALES / 100 MALES
35.2
MEDIAN AGE
4.0
AVG FAMILY SIZE
2.7
AVG HOUSEHOLD SIZE
6,143
LABOR FORCE [ PEOPLE ]
57.5%
PERCENT IN LABOR FORCE
7.9%
UNEMPLOYMENT RATE
Greenwood Zip Codes
Greenwood Area Codes
Income in Greenwood
Income Overview in Greenwood
Per Capita Income in Greenwood is $28,641, while median incomes of families and households are $48,239 and $37,718 respectively.
| Characteristic | Number | Measure |
| Per Capita Income | 14,242 | $28,641 |
| Median Family Income | 2,708 | $48,239 |
| Mean Family Income | 2,708 | $101,701 |
| Median Household Income | 5,098 | $37,718 |
| Mean Household Income | 5,098 | $73,091 |
| Income Deficit | 2,708 | $11,796 |
| Wage / Income Gap (%) | 14,242 | 11.23% |
| Wage / Income Gap ($) | 14,242 | 88.77¢ per $1 |
| Gini / Inequality Index | 14,242 | 0.61 |
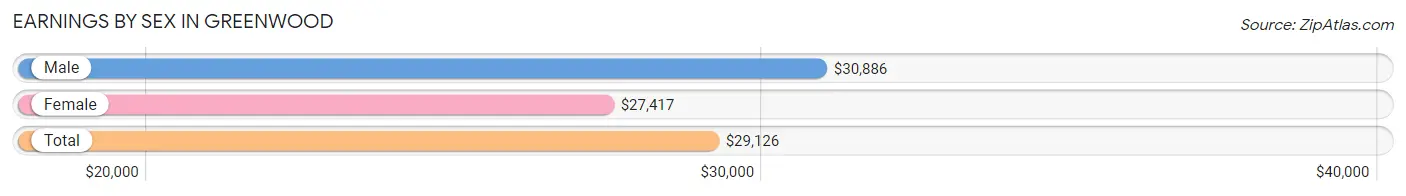
Earnings by Sex in Greenwood
Average Earnings in Greenwood are $29,126, $30,886 for men and $27,417 for women, a difference of 11.2%.
| Sex | Number | Average Earnings |
| Male | 2,822 (45.8%) | $30,886 |
| Female | 3,346 (54.2%) | $27,417 |
| Total | 6,168 (100.0%) | $29,126 |
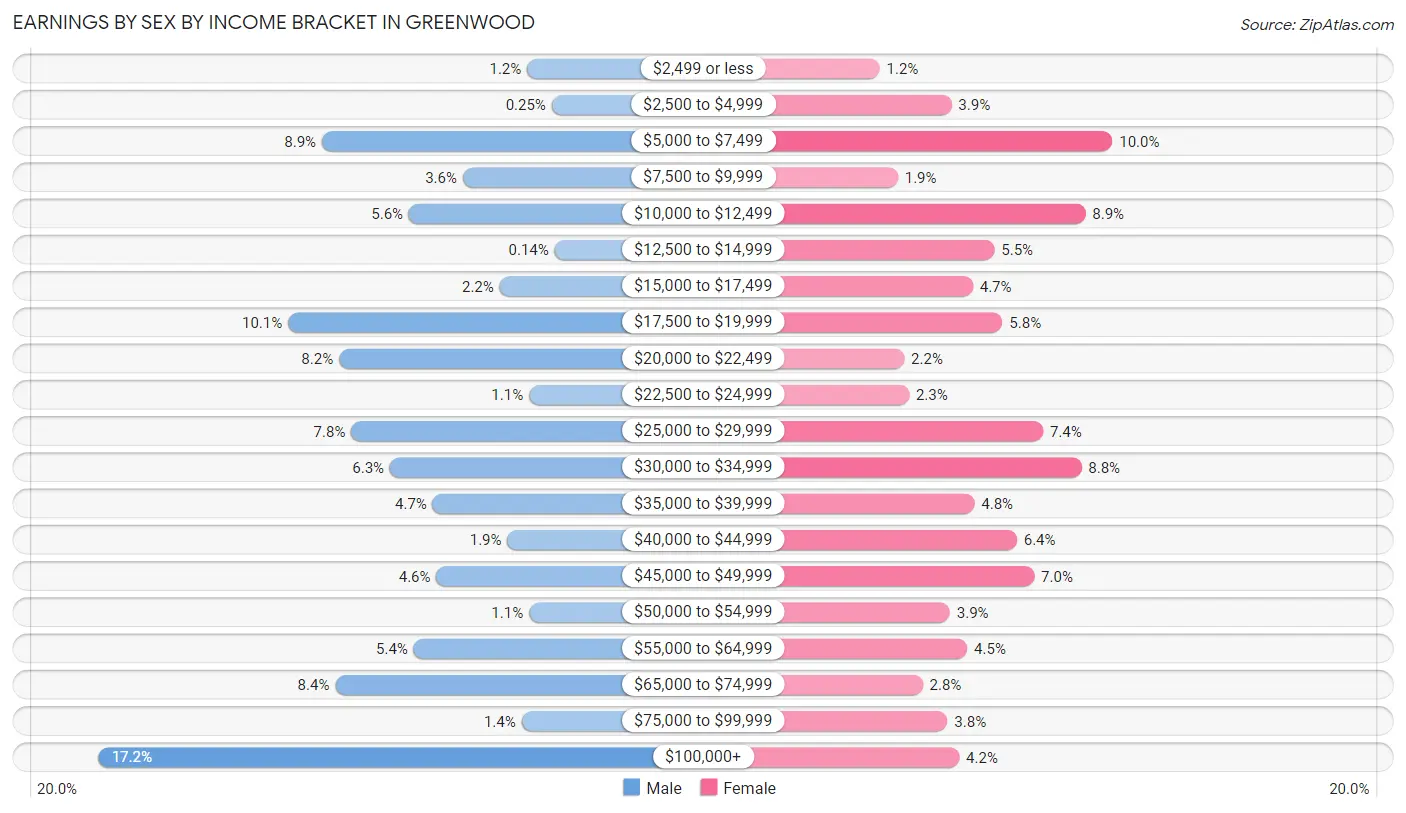
Earnings by Sex by Income Bracket in Greenwood
The most common earnings brackets in Greenwood are $100,000+ for men (486 | 17.2%) and $5,000 to $7,499 for women (333 | 10.0%).
| Income | Male | Female |
| $2,499 or less | 33 (1.2%) | 41 (1.2%) |
| $2,500 to $4,999 | 7 (0.3%) | 131 (3.9%) |
| $5,000 to $7,499 | 250 (8.9%) | 333 (10.0%) |
| $7,500 to $9,999 | 101 (3.6%) | 64 (1.9%) |
| $10,000 to $12,499 | 158 (5.6%) | 299 (8.9%) |
| $12,500 to $14,999 | 4 (0.1%) | 185 (5.5%) |
| $15,000 to $17,499 | 62 (2.2%) | 158 (4.7%) |
| $17,500 to $19,999 | 286 (10.1%) | 195 (5.8%) |
| $20,000 to $22,499 | 232 (8.2%) | 72 (2.1%) |
| $22,500 to $24,999 | 31 (1.1%) | 78 (2.3%) |
| $25,000 to $29,999 | 219 (7.8%) | 246 (7.3%) |
| $30,000 to $34,999 | 178 (6.3%) | 294 (8.8%) |
| $35,000 to $39,999 | 133 (4.7%) | 160 (4.8%) |
| $40,000 to $44,999 | 54 (1.9%) | 213 (6.4%) |
| $45,000 to $49,999 | 129 (4.6%) | 235 (7.0%) |
| $50,000 to $54,999 | 31 (1.1%) | 129 (3.9%) |
| $55,000 to $64,999 | 153 (5.4%) | 151 (4.5%) |
| $65,000 to $74,999 | 236 (8.4%) | 95 (2.8%) |
| $75,000 to $99,999 | 39 (1.4%) | 126 (3.8%) |
| $100,000+ | 486 (17.2%) | 141 (4.2%) |
| Total | 2,822 (100.0%) | 3,346 (100.0%) |
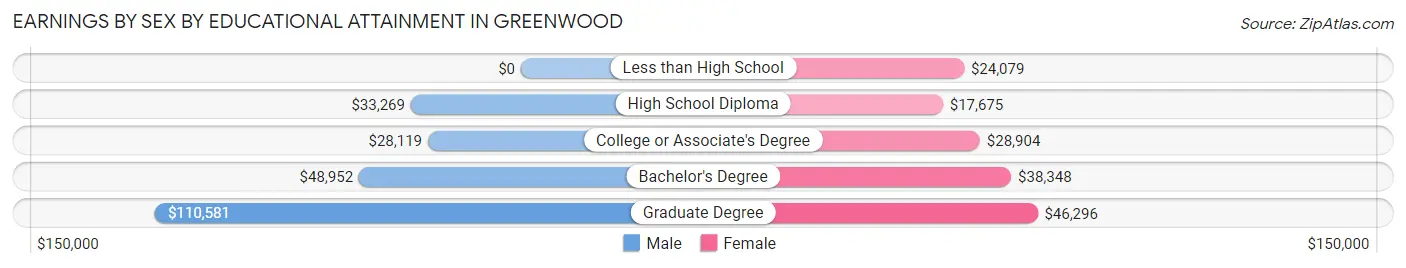
Earnings by Sex by Educational Attainment in Greenwood
Average earnings in Greenwood are $35,225 for men and $31,144 for women, a difference of 11.6%. Men with an educational attainment of graduate degree enjoy the highest average annual earnings of $110,581, while those with college or associate's degree education earn the least with $28,119. Women with an educational attainment of graduate degree earn the most with the average annual earnings of $46,296, while those with high school diploma education have the smallest earnings of $17,675.
| Educational Attainment | Male Income | Female Income |
| Less than High School | - | - |
| High School Diploma | $33,269 | $17,675 |
| College or Associate's Degree | $28,119 | $28,904 |
| Bachelor's Degree | $48,952 | $38,348 |
| Graduate Degree | $110,581 | $46,296 |
| Total | $35,225 | $31,144 |
Family Income in Greenwood
Family Income Brackets in Greenwood
According to the Greenwood family income data, there are 498 families falling into the $25,000 to $34,999 income range, which is the most common income bracket and makes up 18.4% of all families. Conversely, the $10,000 to $14,999 income bracket is the least frequent group with only 95 families (3.5%) belonging to this category.
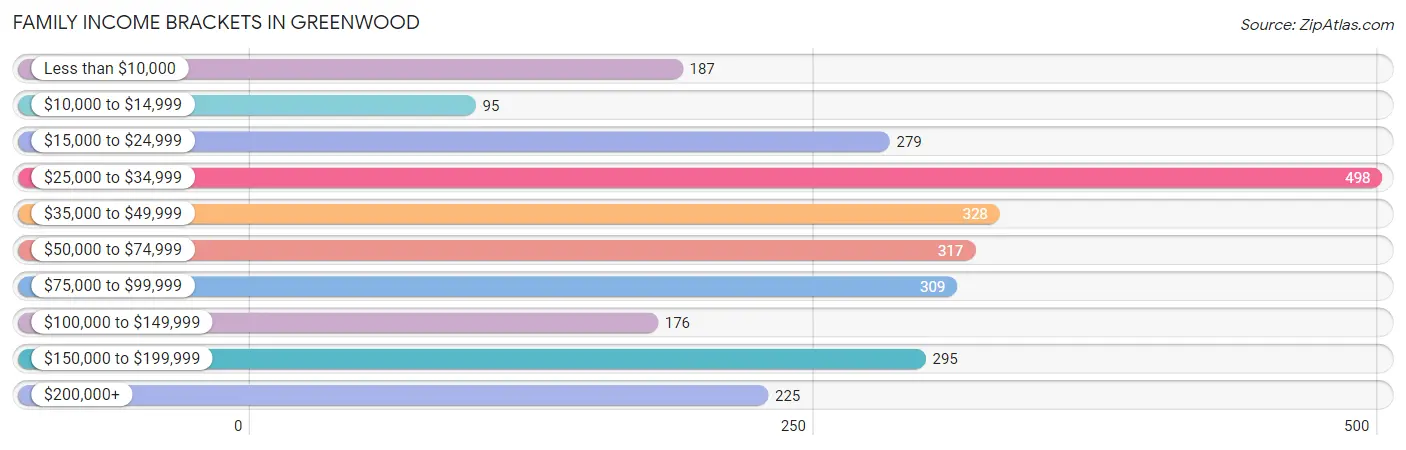
| Income Bracket | # Families | % Families |
| Less than $10,000 | 187 | 6.9% |
| $10,000 to $14,999 | 95 | 3.5% |
| $15,000 to $24,999 | 279 | 10.3% |
| $25,000 to $34,999 | 498 | 18.4% |
| $35,000 to $49,999 | 328 | 12.1% |
| $50,000 to $74,999 | 317 | 11.7% |
| $75,000 to $99,999 | 309 | 11.4% |
| $100,000 to $149,999 | 176 | 6.5% |
| $150,000 to $199,999 | 295 | 10.9% |
| $200,000+ | 225 | 8.3% |
Family Income by Famaliy Size in Greenwood
6-person families (34 | 1.3%) account for the highest median family income in Greenwood with $81,905 per family, while 2-person families (1,229 | 45.4%) have the highest median income of $25,701 per family member.
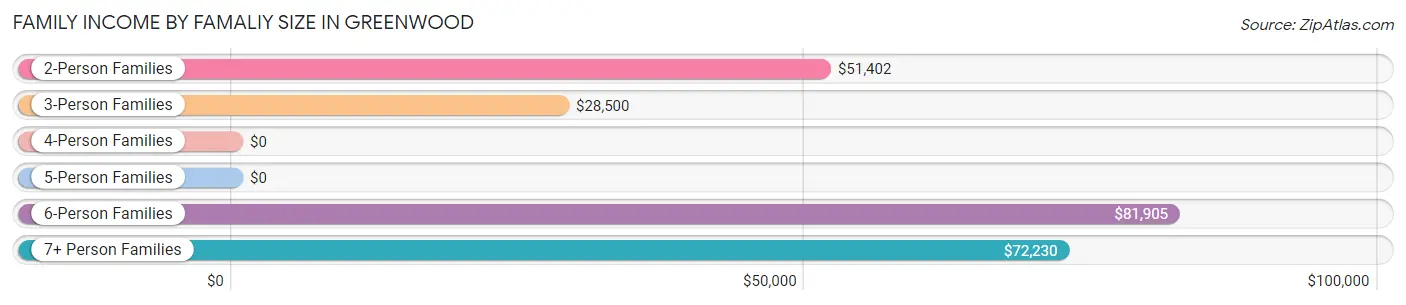
| Income Bracket | # Families | Median Income |
| 2-Person Families | 1,229 (45.4%) | $51,402 |
| 3-Person Families | 570 (21.0%) | $28,500 |
| 4-Person Families | 572 (21.1%) | $0 |
| 5-Person Families | 237 (8.7%) | $0 |
| 6-Person Families | 34 (1.3%) | $81,905 |
| 7+ Person Families | 66 (2.4%) | $72,230 |
| Total | 2,708 (100.0%) | $48,239 |
Family Income by Number of Earners in Greenwood
The median family income in Greenwood is $48,239, with families comprising 2 earners (1,014) having the highest median family income of $93,500, while families with no earners (397) have the lowest median family income of $21,054, accounting for 37.4% and 14.7% of families, respectively.
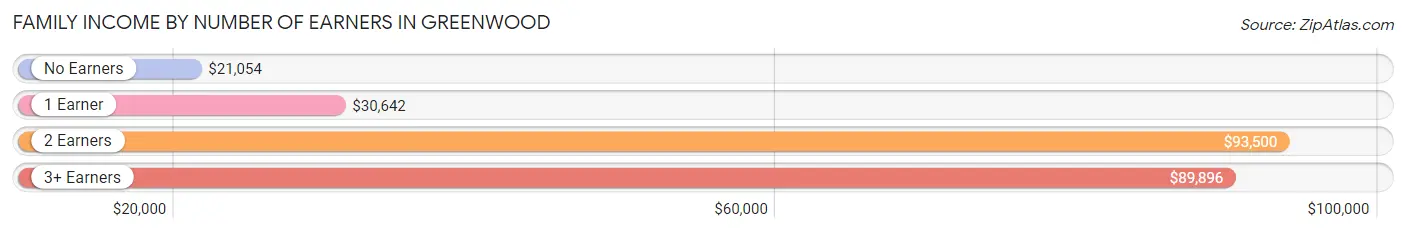
| Number of Earners | # Families | Median Income |
| No Earners | 397 (14.7%) | $21,054 |
| 1 Earner | 1,148 (42.4%) | $30,642 |
| 2 Earners | 1,014 (37.4%) | $93,500 |
| 3+ Earners | 149 (5.5%) | $89,896 |
| Total | 2,708 (100.0%) | $48,239 |
Household Income in Greenwood
Household Income Brackets in Greenwood
With 724 households falling in the category, the $10,000 to $14,999 income range is the most frequent in Greenwood, accounting for 14.2% of all households. In contrast, only 245 households (4.8%) fall into the $100,000 to $149,999 income bracket, making it the least populous group.
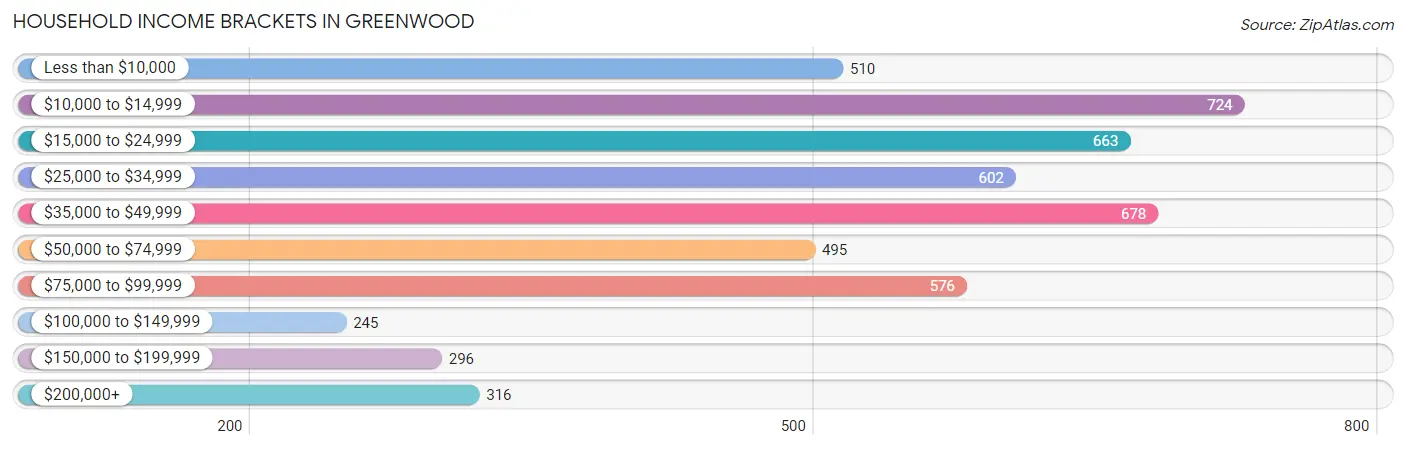
| Income Bracket | # Households | % Households |
| Less than $10,000 | 510 | 10.0% |
| $10,000 to $14,999 | 724 | 14.2% |
| $15,000 to $24,999 | 663 | 13.0% |
| $25,000 to $34,999 | 602 | 11.8% |
| $35,000 to $49,999 | 678 | 13.3% |
| $50,000 to $74,999 | 495 | 9.7% |
| $75,000 to $99,999 | 576 | 11.3% |
| $100,000 to $149,999 | 245 | 4.8% |
| $150,000 to $199,999 | 296 | 5.8% |
| $200,000+ | 316 | 6.2% |
Household Income by Householder Age in Greenwood
The median household income in Greenwood is $37,718, with the highest median household income of $41,645 found in the 45 to 64 years age bracket for the primary householder. A total of 1,830 households (35.9%) fall into this category. Meanwhile, the 15 to 24 years age bracket for the primary householder has the lowest median household income of $0, with 142 households (2.8%) in this group.
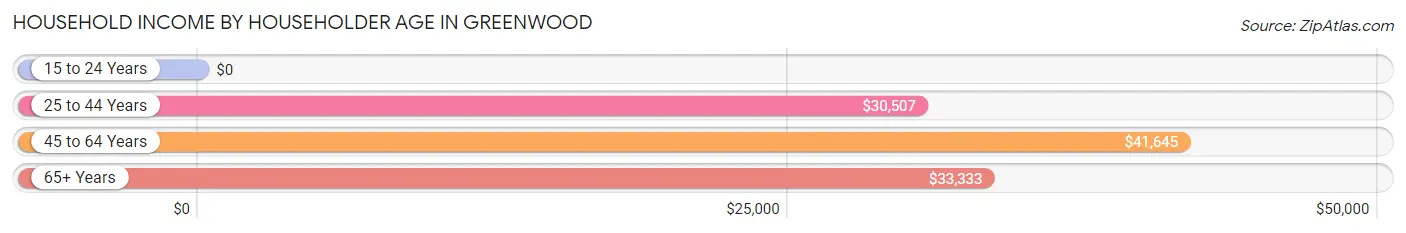
| Income Bracket | # Households | Median Income |
| 15 to 24 Years | 142 (2.8%) | $0 |
| 25 to 44 Years | 1,424 (27.9%) | $30,507 |
| 45 to 64 Years | 1,830 (35.9%) | $41,645 |
| 65+ Years | 1,702 (33.4%) | $33,333 |
| Total | 5,098 (100.0%) | $37,718 |
Poverty in Greenwood
Income Below Poverty by Sex and Age in Greenwood
With 24.3% poverty level for males and 29.1% for females among the residents of Greenwood, 5 year old males and 16 and 17 year old females are the most vulnerable to poverty, with 84 males (57.9%) and 33 females (51.6%) in their respective age groups living below the poverty level.
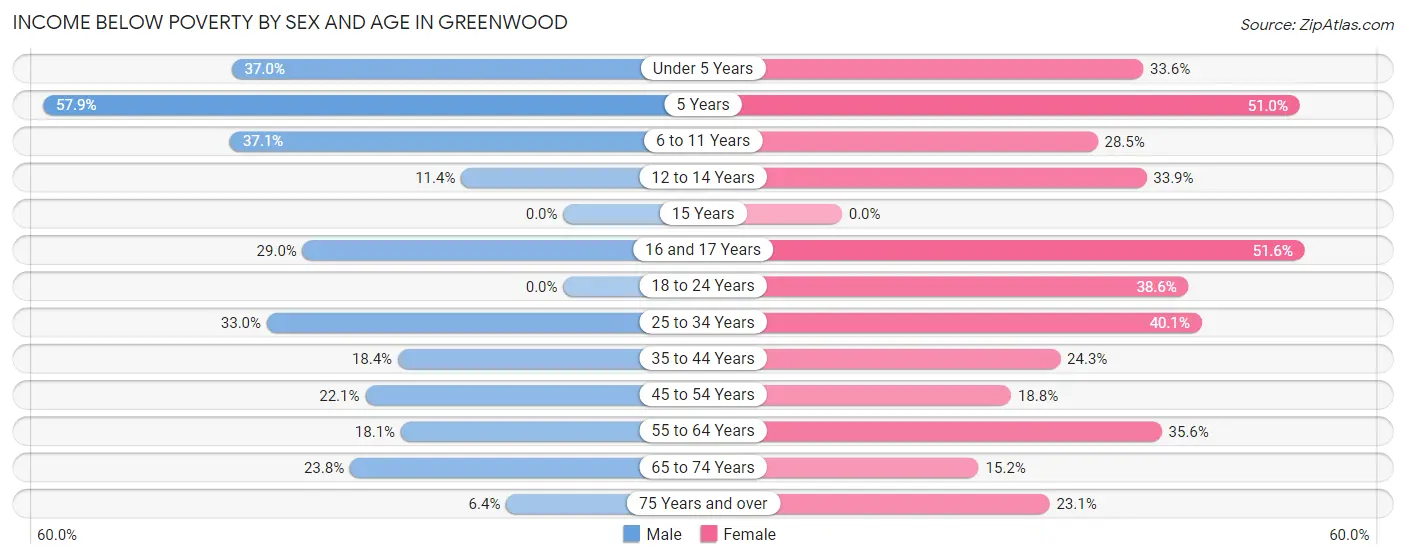
| Age Bracket | Male | Female |
| Under 5 Years | 150 (36.9%) | 202 (33.6%) |
| 5 Years | 84 (57.9%) | 51 (51.0%) |
| 6 to 11 Years | 202 (37.1%) | 219 (28.5%) |
| 12 to 14 Years | 24 (11.4%) | 96 (33.9%) |
| 15 Years | 0 (0.0%) | 0 (0.0%) |
| 16 and 17 Years | 108 (29.0%) | 33 (51.6%) |
| 18 to 24 Years | 0 (0.0%) | 287 (38.6%) |
| 25 to 34 Years | 282 (33.0%) | 410 (40.1%) |
| 35 to 44 Years | 112 (18.4%) | 233 (24.3%) |
| 45 to 54 Years | 150 (22.1%) | 143 (18.8%) |
| 55 to 64 Years | 140 (18.1%) | 337 (35.6%) |
| 65 to 74 Years | 129 (23.8%) | 121 (15.2%) |
| 75 Years and over | 11 (6.4%) | 155 (23.1%) |
| Total | 1,392 (24.3%) | 2,287 (29.1%) |
Income Above Poverty by Sex and Age in Greenwood
According to the poverty statistics in Greenwood, males aged 15 years and females aged 15 years are the age groups that are most secure financially, with 100.0% of males and 100.0% of females in these age groups living above the poverty line.
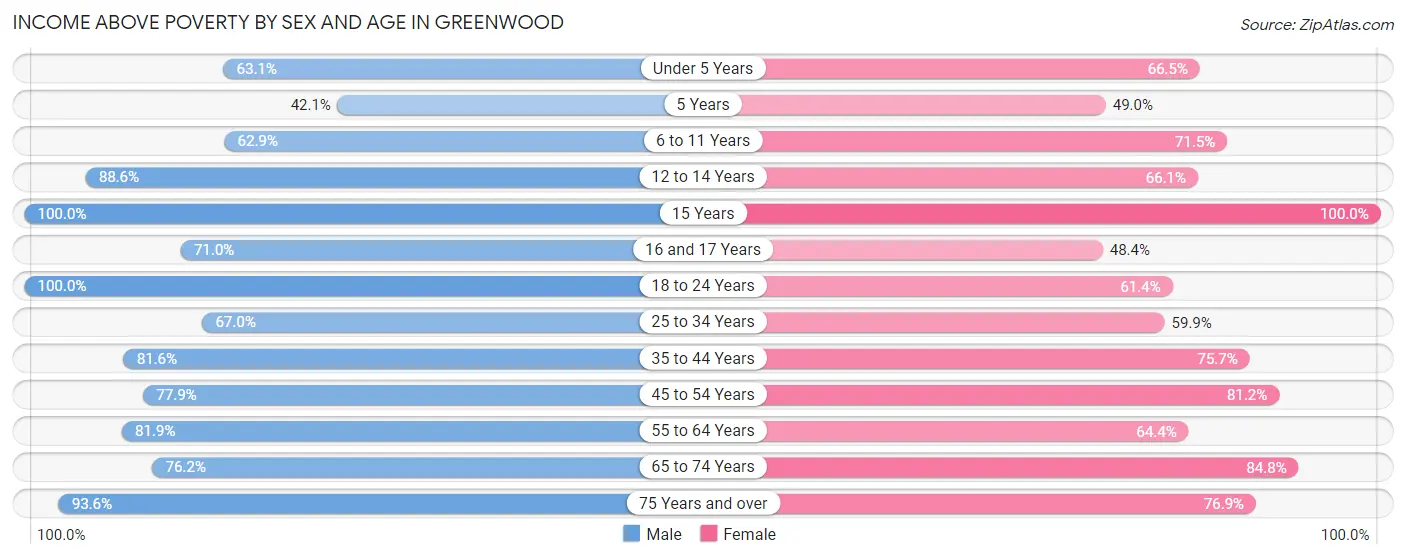
| Age Bracket | Male | Female |
| Under 5 Years | 256 (63.0%) | 400 (66.4%) |
| 5 Years | 61 (42.1%) | 49 (49.0%) |
| 6 to 11 Years | 342 (62.9%) | 550 (71.5%) |
| 12 to 14 Years | 187 (88.6%) | 187 (66.1%) |
| 15 Years | 14 (100.0%) | 151 (100.0%) |
| 16 and 17 Years | 264 (71.0%) | 31 (48.4%) |
| 18 to 24 Years | 408 (100.0%) | 456 (61.4%) |
| 25 to 34 Years | 572 (67.0%) | 613 (59.9%) |
| 35 to 44 Years | 496 (81.6%) | 725 (75.7%) |
| 45 to 54 Years | 530 (77.9%) | 616 (81.2%) |
| 55 to 64 Years | 634 (81.9%) | 609 (64.4%) |
| 65 to 74 Years | 414 (76.2%) | 673 (84.8%) |
| 75 Years and over | 162 (93.6%) | 515 (76.9%) |
| Total | 4,340 (75.7%) | 5,575 (70.9%) |
Income Below Poverty Among Married-Couple Families in Greenwood
The poverty statistics for married-couple families in Greenwood show that 8.7% or 115 of the total 1,318 families live below the poverty line. Families with 1 or 2 children have the highest poverty rate of 18.6%, comprising of 65 families. On the other hand, families with 5 or more children have the lowest poverty rate of 0.0%, which includes 0 families.
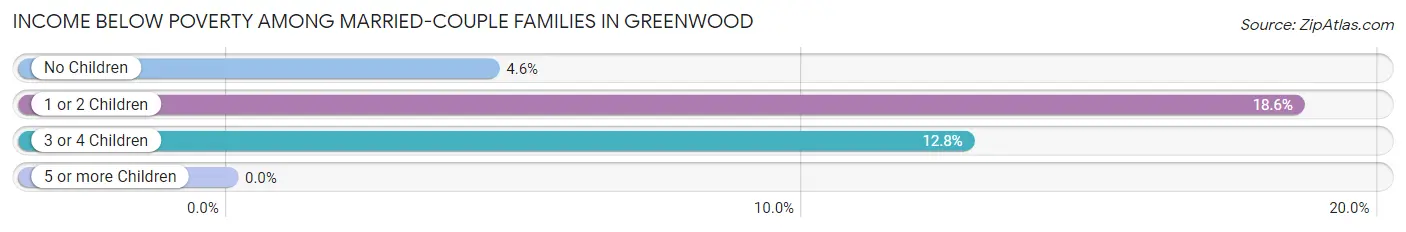
| Children | Above Poverty | Below Poverty |
| No Children | 840 (95.5%) | 40 (4.5%) |
| 1 or 2 Children | 285 (81.4%) | 65 (18.6%) |
| 3 or 4 Children | 68 (87.2%) | 10 (12.8%) |
| 5 or more Children | 10 (100.0%) | 0 (0.0%) |
| Total | 1,203 (91.3%) | 115 (8.7%) |
Income Below Poverty Among Single-Parent Households in Greenwood
According to the poverty data in Greenwood, 27.7% or 46 single-father households and 31.5% or 386 single-mother households are living below the poverty line. Among single-father households, those with no children have the highest poverty rate, with 30 households (31.6%) experiencing poverty. Likewise, among single-mother households, those with 3 or 4 children have the highest poverty rate, with 175 households (68.6%) falling below the poverty line.
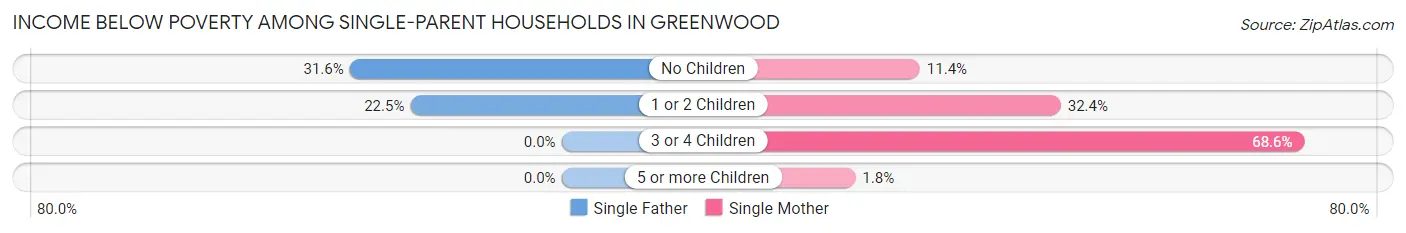
| Children | Single Father | Single Mother |
| No Children | 30 (31.6%) | 46 (11.4%) |
| 1 or 2 Children | 16 (22.5%) | 164 (32.4%) |
| 3 or 4 Children | 0 (0.0%) | 175 (68.6%) |
| 5 or more Children | 0 (0.0%) | 1 (1.8%) |
| Total | 46 (27.7%) | 386 (31.5%) |
Income Below Poverty Among Married-Couple vs Single-Parent Households in Greenwood
The poverty data for Greenwood shows that 115 of the married-couple family households (8.7%) and 432 of the single-parent households (31.1%) are living below the poverty level. Within the married-couple family households, those with 1 or 2 children have the highest poverty rate, with 65 households (18.6%) falling below the poverty line. Among the single-parent households, those with 3 or 4 children have the highest poverty rate, with 175 household (68.6%) living below poverty.
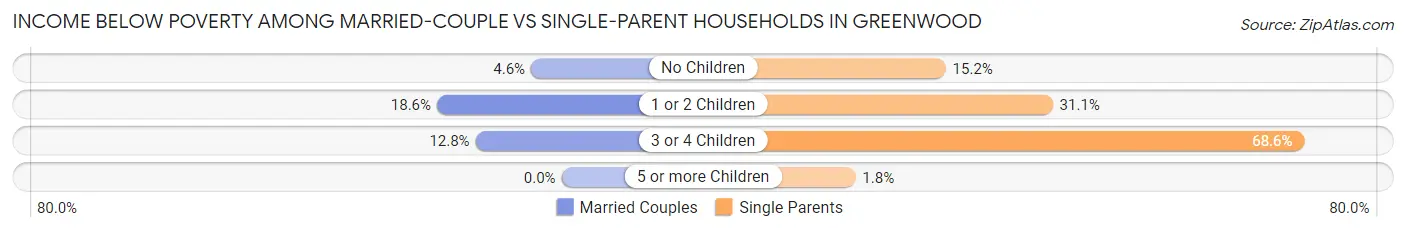
| Children | Married-Couple Families | Single-Parent Households |
| No Children | 40 (4.5%) | 76 (15.2%) |
| 1 or 2 Children | 65 (18.6%) | 180 (31.1%) |
| 3 or 4 Children | 10 (12.8%) | 175 (68.6%) |
| 5 or more Children | 0 (0.0%) | 1 (1.8%) |
| Total | 115 (8.7%) | 432 (31.1%) |
Race in Greenwood
The most populous races in Greenwood are Black / African American (9,999 | 70.2%), White / Caucasian (3,762 | 26.4%), and Hispanic or Latino (346 | 2.4%).
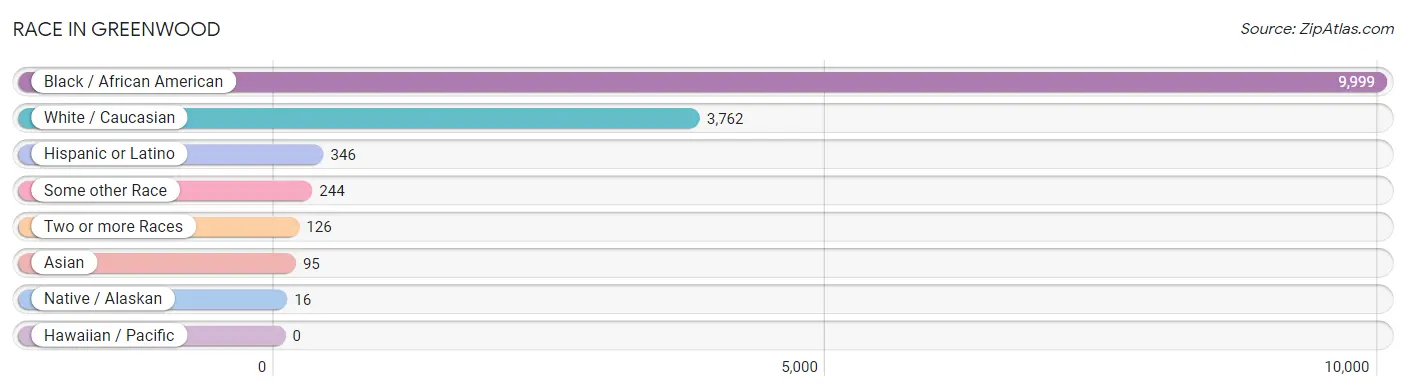
| Race | # Population | % Population |
| Asian | 95 | 0.7% |
| Black / African American | 9,999 | 70.2% |
| Hawaiian / Pacific | 0 | 0.0% |
| Hispanic or Latino | 346 | 2.4% |
| Native / Alaskan | 16 | 0.1% |
| White / Caucasian | 3,762 | 26.4% |
| Two or more Races | 126 | 0.9% |
| Some other Race | 244 | 1.7% |
| Total | 14,242 | 100.0% |
Ancestry in Greenwood
The most populous ancestries reported in Greenwood are American (1,174 | 8.2%), English (689 | 4.8%), Irish (286 | 2.0%), Mexican (178 | 1.3%), and German (172 | 1.2%), together accounting for 17.6% of all Greenwood residents.
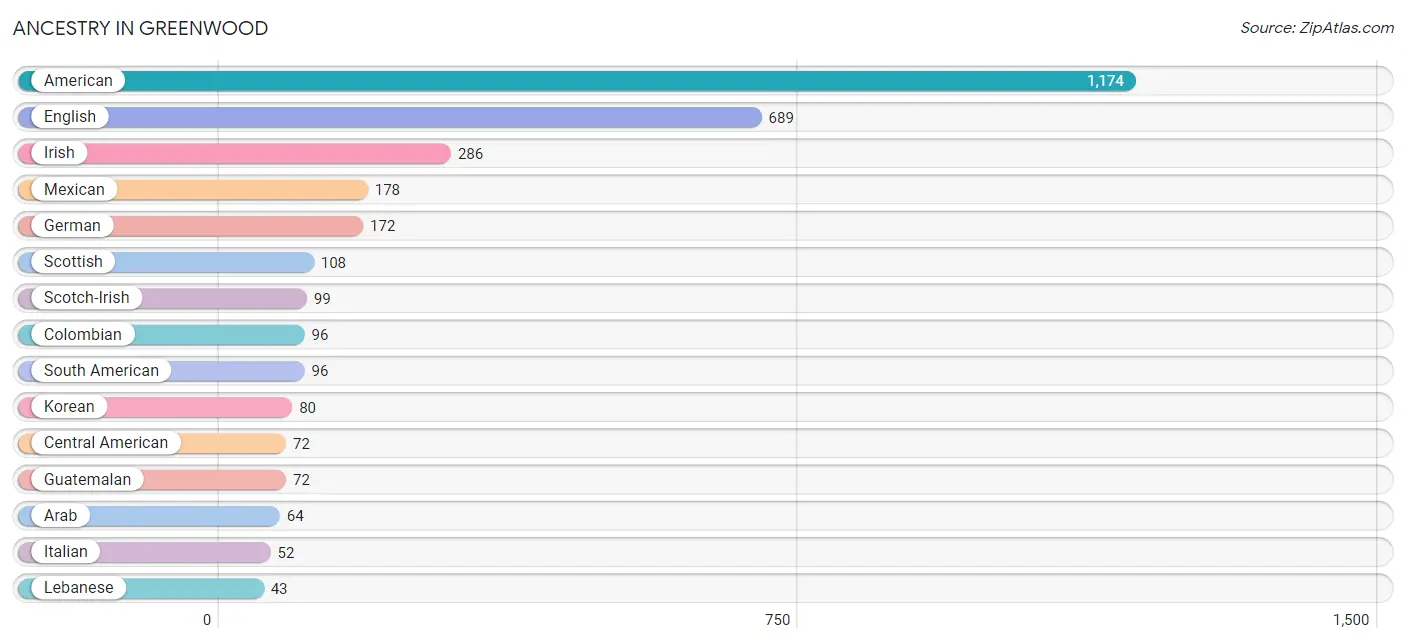
| Ancestry | # Population | % Population |
| African | 33 | 0.2% |
| American | 1,174 | 8.2% |
| Arab | 64 | 0.4% |
| Belgian | 12 | 0.1% |
| British | 16 | 0.1% |
| Central American | 72 | 0.5% |
| Cherokee | 1 | 0.0% |
| Choctaw | 16 | 0.1% |
| Colombian | 96 | 0.7% |
| English | 689 | 4.8% |
| European | 35 | 0.3% |
| French | 24 | 0.2% |
| German | 172 | 1.2% |
| Guatemalan | 72 | 0.5% |
| Hungarian | 18 | 0.1% |
| Irish | 286 | 2.0% |
| Italian | 52 | 0.4% |
| Korean | 80 | 0.6% |
| Lebanese | 43 | 0.3% |
| Mexican | 178 | 1.3% |
| Norwegian | 33 | 0.2% |
| Polish | 24 | 0.2% |
| Portuguese | 10 | 0.1% |
| Scotch-Irish | 99 | 0.7% |
| Scottish | 108 | 0.8% |
| South American | 96 | 0.7% |
| Subsaharan African | 33 | 0.2% |
| Swedish | 27 | 0.2% |
| Syrian | 21 | 0.2% |
| Thai | 15 | 0.1% |
| Welsh | 23 | 0.2% | View All 31 Rows |
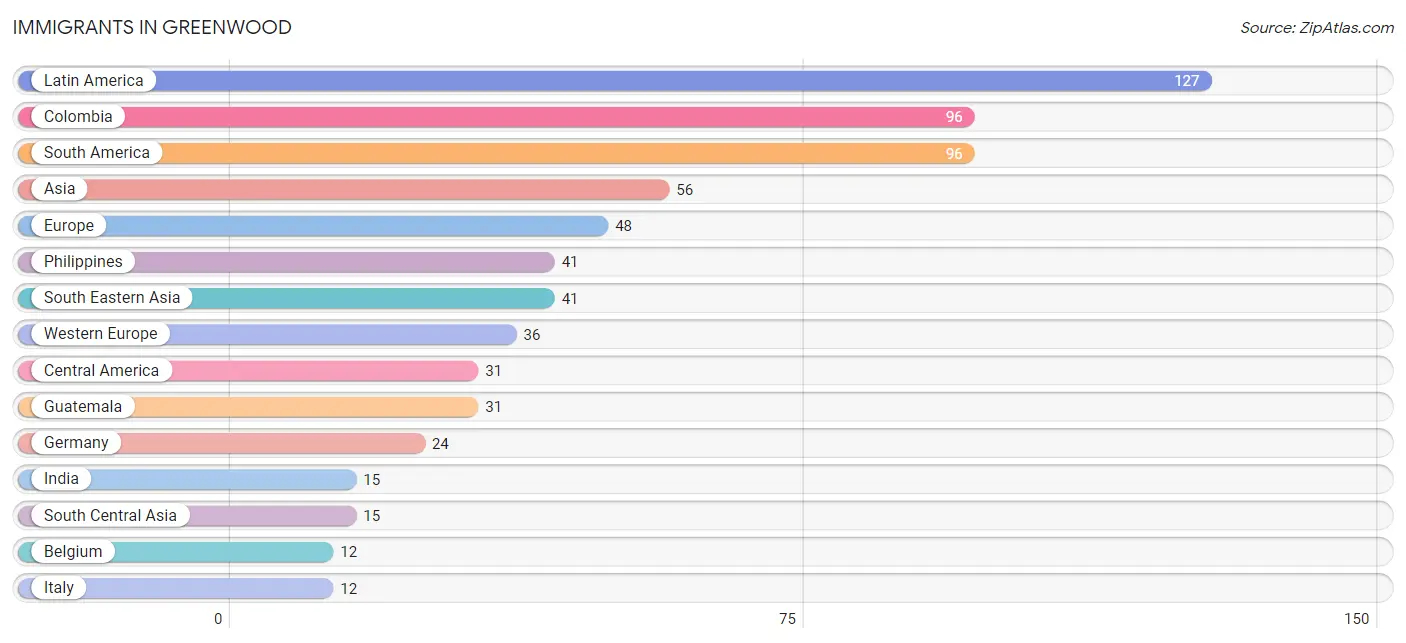
Immigrants in Greenwood
The most numerous immigrant groups reported in Greenwood came from Latin America (127 | 0.9%), Colombia (96 | 0.7%), South America (96 | 0.7%), Asia (56 | 0.4%), and Europe (48 | 0.3%), together accounting for 3.0% of all Greenwood residents.
| Immigration Origin | # Population | % Population |
| Africa | 1 | 0.0% |
| Asia | 56 | 0.4% |
| Belgium | 12 | 0.1% |
| Central America | 31 | 0.2% |
| Colombia | 96 | 0.7% |
| Eastern Africa | 1 | 0.0% |
| Europe | 48 | 0.3% |
| Germany | 24 | 0.2% |
| Guatemala | 31 | 0.2% |
| India | 15 | 0.1% |
| Italy | 12 | 0.1% |
| Latin America | 127 | 0.9% |
| Philippines | 41 | 0.3% |
| South America | 96 | 0.7% |
| South Central Asia | 15 | 0.1% |
| South Eastern Asia | 41 | 0.3% |
| Southern Europe | 12 | 0.1% |
| Western Europe | 36 | 0.3% | View All 18 Rows |
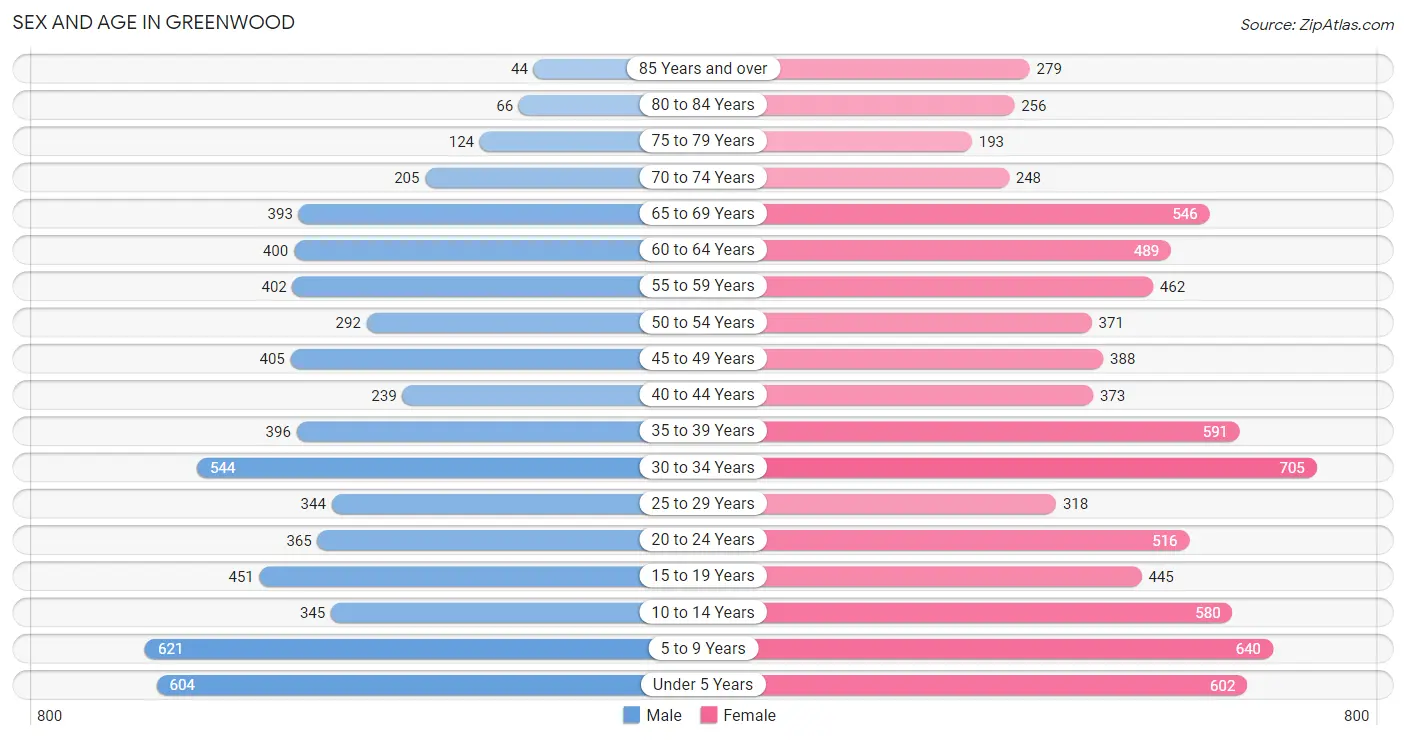
Sex and Age in Greenwood
Sex and Age in Greenwood
The most populous age groups in Greenwood are 5 to 9 Years (621 | 10.0%) for men and 30 to 34 Years (705 | 8.8%) for women.
| Age Bracket | Male | Female |
| Under 5 Years | 604 (9.7%) | 602 (7.5%) |
| 5 to 9 Years | 621 (10.0%) | 640 (8.0%) |
| 10 to 14 Years | 345 (5.5%) | 580 (7.2%) |
| 15 to 19 Years | 451 (7.2%) | 445 (5.6%) |
| 20 to 24 Years | 365 (5.9%) | 516 (6.5%) |
| 25 to 29 Years | 344 (5.5%) | 318 (4.0%) |
| 30 to 34 Years | 544 (8.7%) | 705 (8.8%) |
| 35 to 39 Years | 396 (6.4%) | 591 (7.4%) |
| 40 to 44 Years | 239 (3.8%) | 373 (4.7%) |
| 45 to 49 Years | 405 (6.5%) | 388 (4.9%) |
| 50 to 54 Years | 292 (4.7%) | 371 (4.6%) |
| 55 to 59 Years | 402 (6.4%) | 462 (5.8%) |
| 60 to 64 Years | 400 (6.4%) | 489 (6.1%) |
| 65 to 69 Years | 393 (6.3%) | 546 (6.8%) |
| 70 to 74 Years | 205 (3.3%) | 248 (3.1%) |
| 75 to 79 Years | 124 (2.0%) | 193 (2.4%) |
| 80 to 84 Years | 66 (1.1%) | 256 (3.2%) |
| 85 Years and over | 44 (0.7%) | 279 (3.5%) |
| Total | 6,240 (100.0%) | 8,002 (100.0%) |
Families and Households in Greenwood
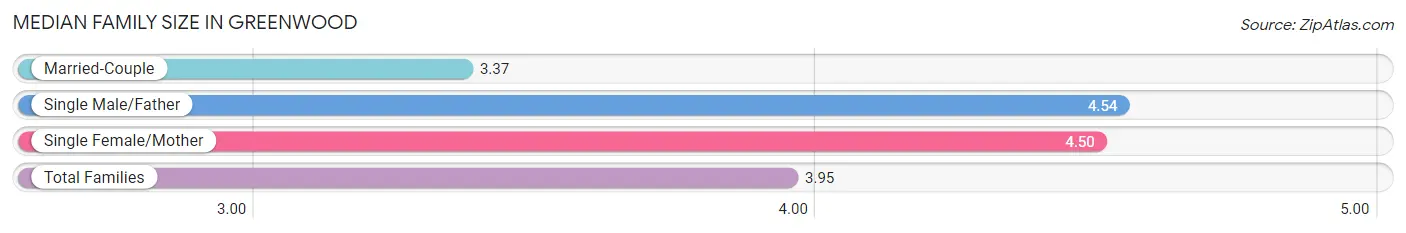
Median Family Size in Greenwood
The median family size in Greenwood is 3.95 persons per family, with single male/father families (166 | 6.1%) accounting for the largest median family size of 4.54 persons per family. On the other hand, married-couple families (1,318 | 48.7%) represent the smallest median family size with 3.37 persons per family.
| Family Type | # Families | Family Size |
| Married-Couple | 1,318 (48.7%) | 3.37 |
| Single Male/Father | 166 (6.1%) | 4.54 |
| Single Female/Mother | 1,224 (45.2%) | 4.50 |
| Total Families | 2,708 (100.0%) | 3.95 |
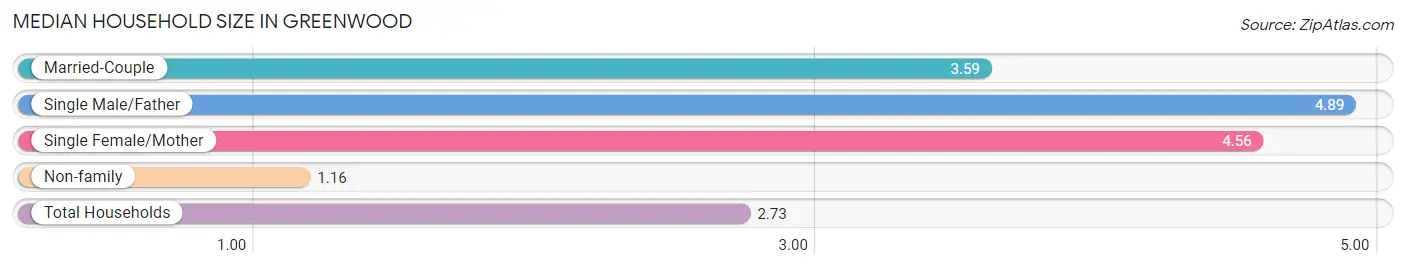
Median Household Size in Greenwood
The median household size in Greenwood is 2.73 persons per household, with single male/father households (166 | 3.3%) accounting for the largest median household size of 4.89 persons per household. non-family households (2,390 | 46.9%) represent the smallest median household size with 1.16 persons per household.
| Household Type | # Households | Household Size |
| Married-Couple | 1,318 (25.9%) | 3.59 |
| Single Male/Father | 166 (3.3%) | 4.89 |
| Single Female/Mother | 1,224 (24.0%) | 4.56 |
| Non-family | 2,390 (46.9%) | 1.16 |
| Total Households | 5,098 (100.0%) | 2.73 |
Household Size by Marriage Status in Greenwood
Out of a total of 5,098 households in Greenwood, 2,708 (53.1%) are family households, while 2,390 (46.9%) are nonfamily households. The most numerous type of family households are 2-person households, comprising 1,147, and the most common type of nonfamily households are 1-person households, comprising 2,174.
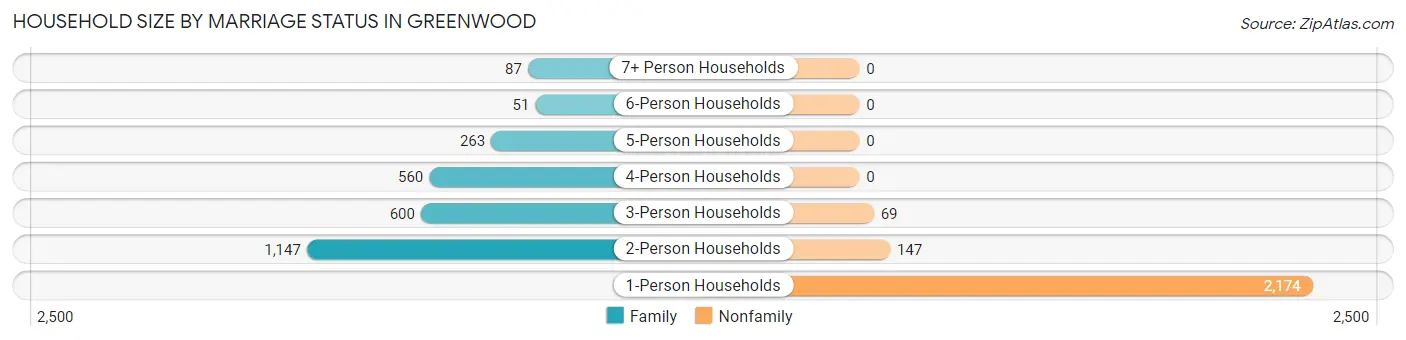
| Household Size | Family Households | Nonfamily Households |
| 1-Person Households | - | 2,174 (42.6%) |
| 2-Person Households | 1,147 (22.5%) | 147 (2.9%) |
| 3-Person Households | 600 (11.8%) | 69 (1.3%) |
| 4-Person Households | 560 (11.0%) | 0 (0.0%) |
| 5-Person Households | 263 (5.2%) | 0 (0.0%) |
| 6-Person Households | 51 (1.0%) | 0 (0.0%) |
| 7+ Person Households | 87 (1.7%) | 0 (0.0%) |
| Total | 2,708 (53.1%) | 2,390 (46.9%) |
Female Fertility in Greenwood
Fertility by Age in Greenwood
Average fertility rate in Greenwood is 41.0 births per 1,000 women. Women in the age bracket of 15 to 19 years have the highest fertility rate with 94.0 births per 1,000 women. Women in the age bracket of 35 to 50 years acount for 37.4% of all women with births.
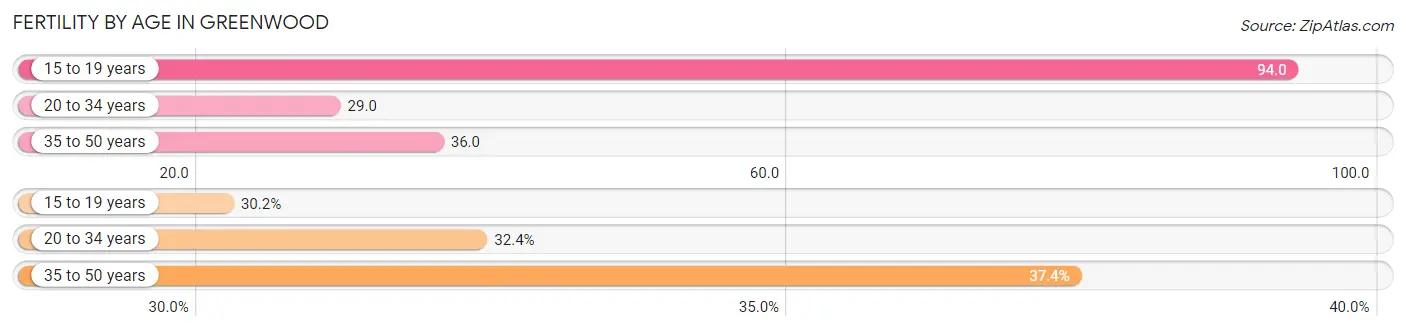
| Age Bracket | Women with Births | Births / 1,000 Women |
| 15 to 19 years | 42 (30.2%) | 94.0 |
| 20 to 34 years | 45 (32.4%) | 29.0 |
| 35 to 50 years | 52 (37.4%) | 36.0 |
| Total | 139 (100.0%) | 41.0 |
Fertility by Age by Marriage Status in Greenwood
25.9% of women with births (139) in Greenwood are married. The highest percentage of unmarried women with births falls into 15 to 19 years age bracket with 100.0% of them unmarried at the time of birth, while the lowest percentage of unmarried women with births belong to 35 to 50 years age bracket with 30.8% of them unmarried.
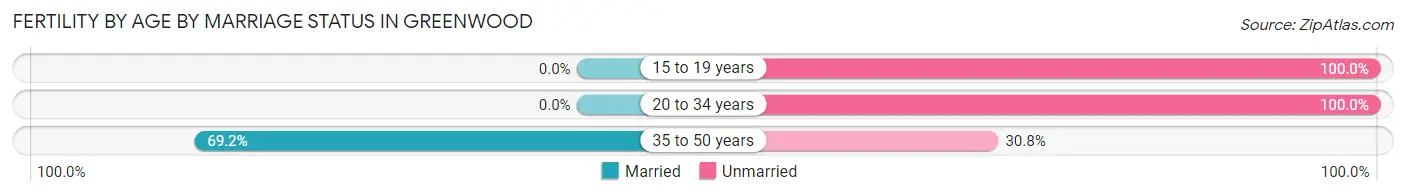
| Age Bracket | Married | Unmarried |
| 15 to 19 years | 0 (0.0%) | 42 (100.0%) |
| 20 to 34 years | 0 (0.0%) | 45 (100.0%) |
| 35 to 50 years | 36 (69.2%) | 16 (30.8%) |
| Total | 36 (25.9%) | 103 (74.1%) |
Fertility by Education in Greenwood
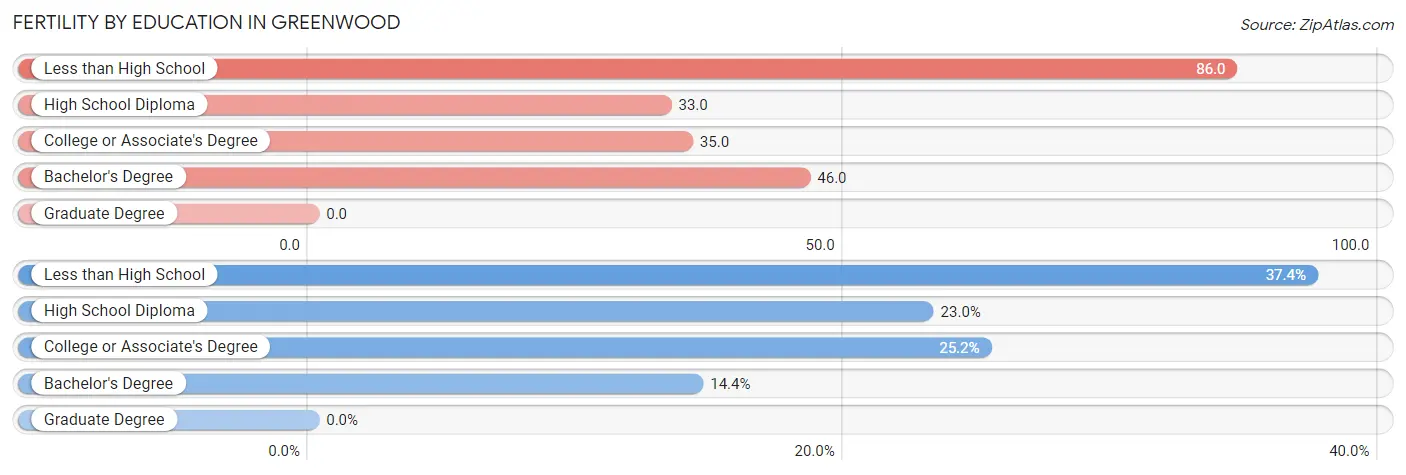
| Educational Attainment | Women with Births | Births / 1,000 Women |
| Less than High School | 52 (37.4%) | 86.0 |
| High School Diploma | 32 (23.0%) | 33.0 |
| College or Associate's Degree | 35 (25.2%) | 35.0 |
| Bachelor's Degree | 20 (14.4%) | 46.0 |
| Graduate Degree | 0 (0.0%) | 0.0 |
| Total | 139 (100.0%) | 41.0 |
Fertility by Education by Marriage Status in Greenwood
74.1% of women with births in Greenwood are unmarried. Women with the educational attainment of bachelor's degree are most likely to be married with 100.0% of them married at childbirth, while women with the educational attainment of less than high school are least likely to be married with 100.0% of them unmarried at childbirth.
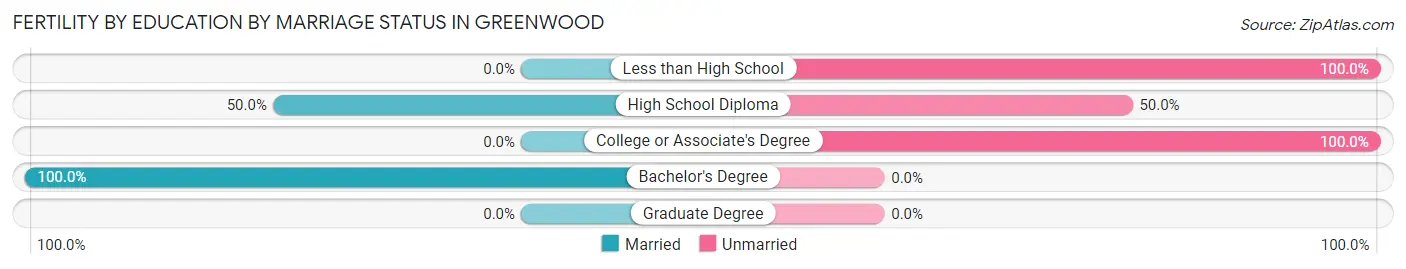
| Educational Attainment | Married | Unmarried |
| Less than High School | 0 (0.0%) | 52 (100.0%) |
| High School Diploma | 16 (50.0%) | 16 (50.0%) |
| College or Associate's Degree | 0 (0.0%) | 35 (100.0%) |
| Bachelor's Degree | 20 (100.0%) | 0 (0.0%) |
| Graduate Degree | 0 (0.0%) | 0 (0.0%) |
| Total | 36 (25.9%) | 103 (74.1%) |
Employment Characteristics in Greenwood
Employment by Class of Employer in Greenwood
Among the 5,618 employed individuals in Greenwood, private company employees (3,476 | 61.9%), local government employees (668 | 11.9%), and not-for-profit organizations (653 | 11.6%) make up the most common classes of employment.
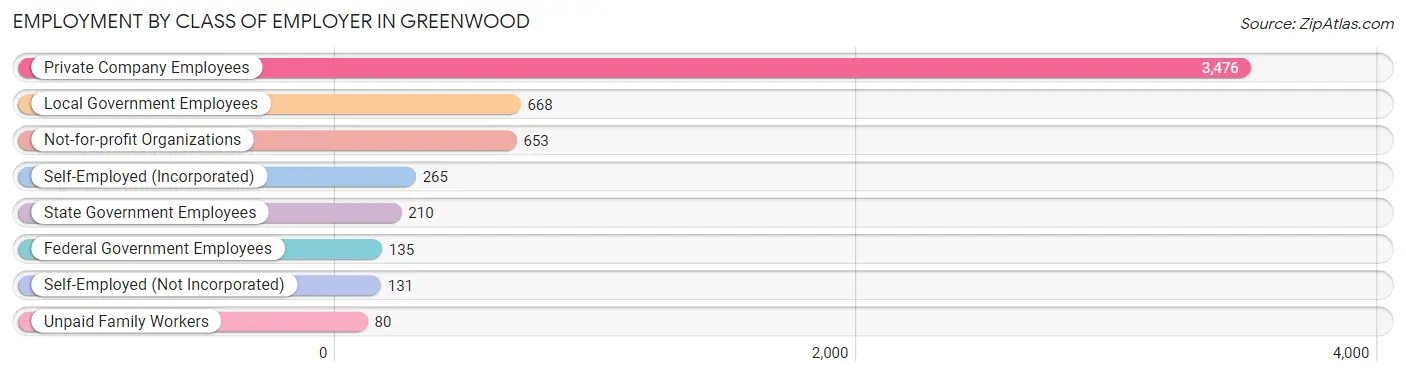
| Employer Class | # Employees | % Employees |
| Private Company Employees | 3,476 | 61.9% |
| Self-Employed (Incorporated) | 265 | 4.7% |
| Self-Employed (Not Incorporated) | 131 | 2.3% |
| Not-for-profit Organizations | 653 | 11.6% |
| Local Government Employees | 668 | 11.9% |
| State Government Employees | 210 | 3.7% |
| Federal Government Employees | 135 | 2.4% |
| Unpaid Family Workers | 80 | 1.4% |
| Total | 5,618 | 100.0% |
Employment Status by Age in Greenwood
According to the labor force statistics for Greenwood, out of the total population over 16 years of age (10,684), 57.5% or 6,143 individuals are in the labor force, with 7.9% or 485 of them unemployed. The age group with the highest labor force participation rate is 20 to 24 years, with 86.5% or 762 individuals in the labor force. Within the labor force, the 16 to 19 years age range has the highest percentage of unemployed individuals, with 73.1% or 144 of them being unemployed.
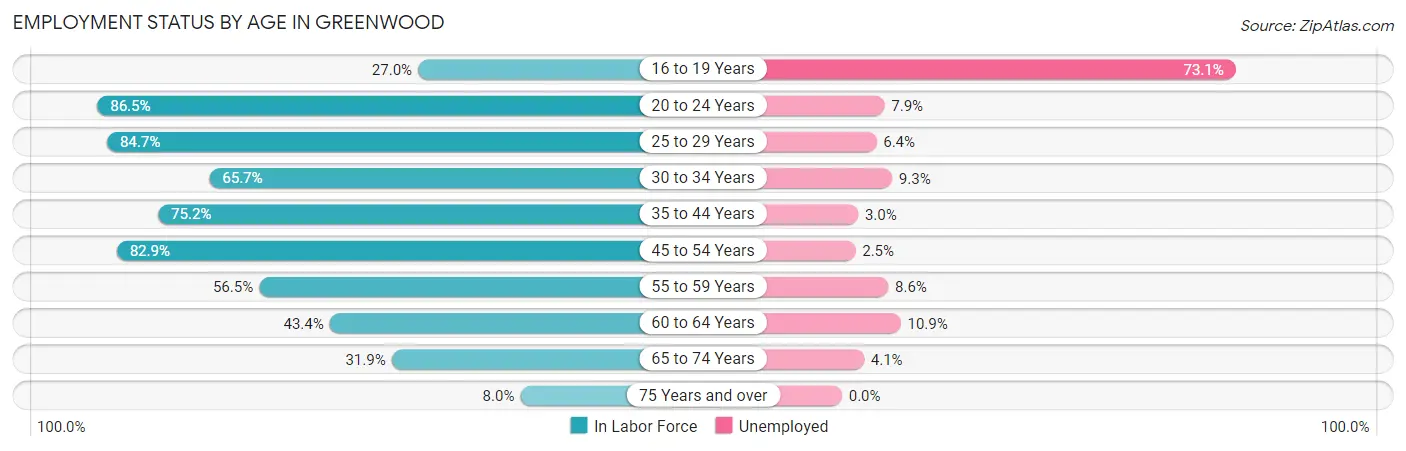
| Age Bracket | In Labor Force | Unemployed |
| 16 to 19 Years | 197 (27.0%) | 144 (73.1%) |
| 20 to 24 Years | 762 (86.5%) | 60 (7.9%) |
| 25 to 29 Years | 561 (84.7%) | 36 (6.4%) |
| 30 to 34 Years | 821 (65.7%) | 76 (9.3%) |
| 35 to 44 Years | 1,202 (75.2%) | 36 (3.0%) |
| 45 to 54 Years | 1,207 (82.9%) | 30 (2.5%) |
| 55 to 59 Years | 488 (56.5%) | 42 (8.6%) |
| 60 to 64 Years | 386 (43.4%) | 42 (10.9%) |
| 65 to 74 Years | 444 (31.9%) | 18 (4.1%) |
| 75 Years and over | 77 (8.0%) | 0 (0.0%) |
| Total | 6,143 (57.5%) | 485 (7.9%) |
Employment Status by Educational Attainment in Greenwood
According to labor force statistics for Greenwood, 69.4% of individuals (4,663) out of the total population between 25 and 64 years of age (6,719) are in the labor force, with 5.6% or 261 of them being unemployed. The group with the highest labor force participation rate are those with the educational attainment of bachelor's degree or higher, with 94.8% or 1,636 individuals in the labor force. Within the labor force, individuals with less than high school education have the highest percentage of unemployment, with 34.0% or 73 of them being unemployed.
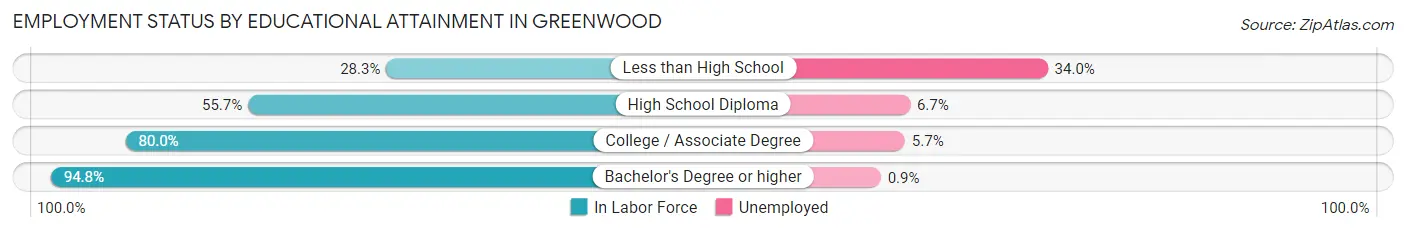
| Educational Attainment | In Labor Force | Unemployed |
| Less than High School | 215 (28.3%) | 258 (34.0%) |
| High School Diploma | 1,312 (55.7%) | 158 (6.7%) |
| College / Associate Degree | 1,502 (80.0%) | 107 (5.7%) |
| Bachelor's Degree or higher | 1,636 (94.8%) | 16 (0.9%) |
| Total | 4,663 (69.4%) | 376 (5.6%) |
Employment Occupations by Sex in Greenwood
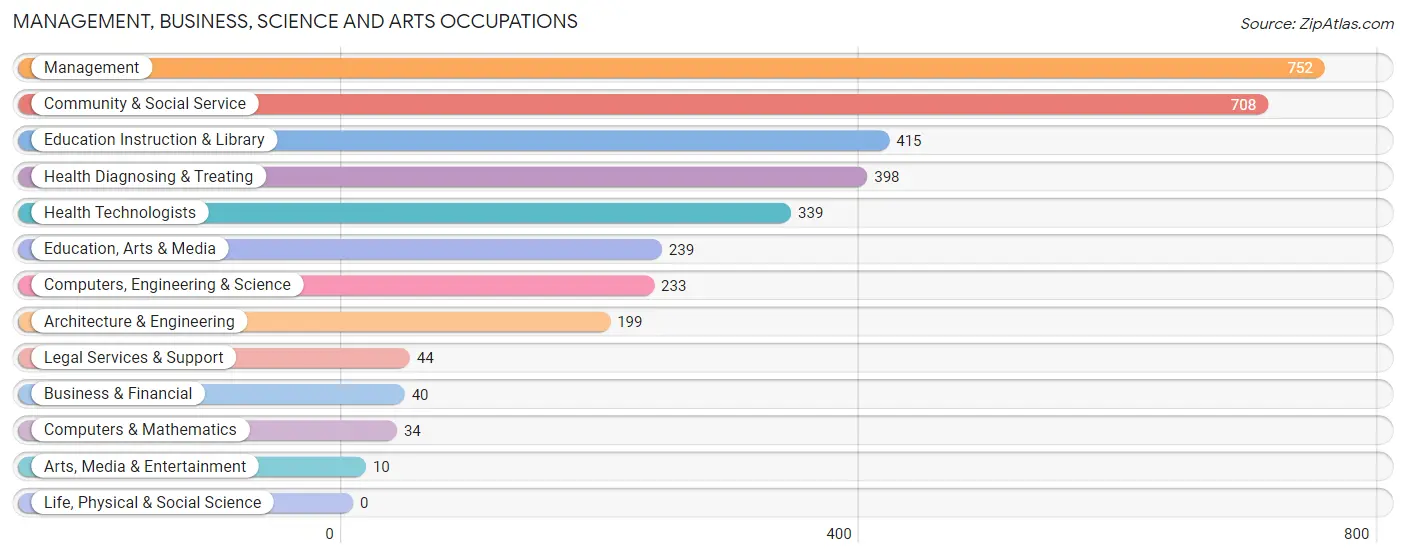
Management, Business, Science and Arts Occupations
The most common Management, Business, Science and Arts occupations in Greenwood are Management (752 | 13.4%), Community & Social Service (708 | 12.6%), Education Instruction & Library (415 | 7.4%), Health Diagnosing & Treating (398 | 7.1%), and Health Technologists (339 | 6.0%).
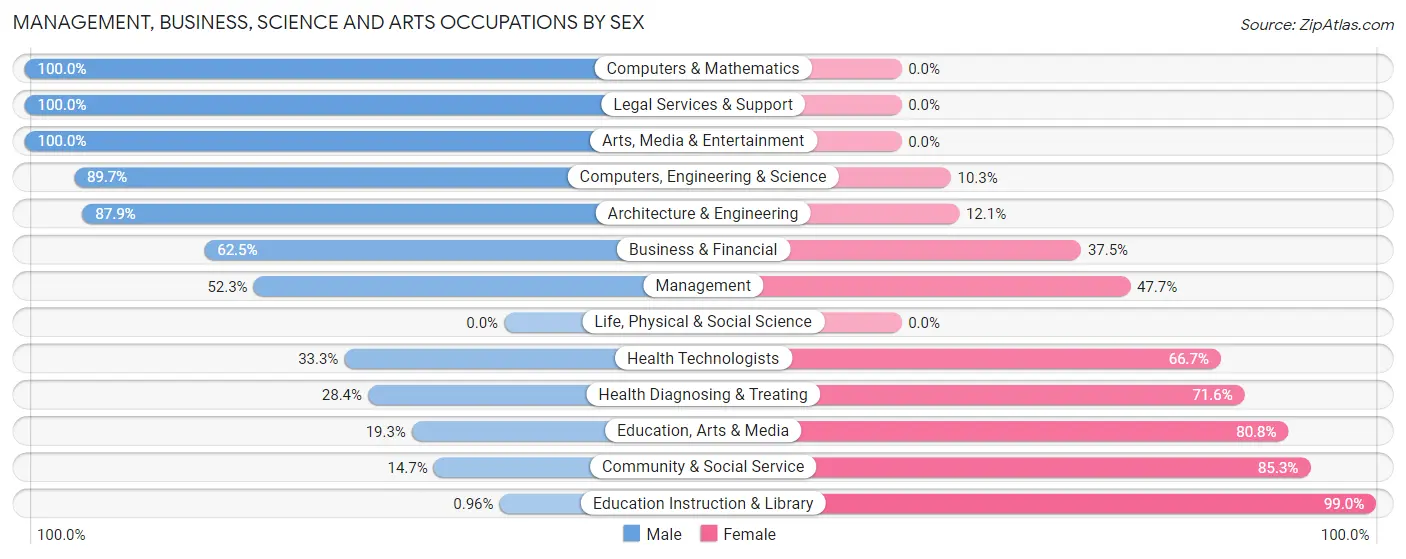
Management, Business, Science and Arts Occupations by Sex
Within the Management, Business, Science and Arts occupations in Greenwood, the most male-oriented occupations are Computers & Mathematics (100.0%), Legal Services & Support (100.0%), and Arts, Media & Entertainment (100.0%), while the most female-oriented occupations are Education Instruction & Library (99.0%), Community & Social Service (85.3%), and Education, Arts & Media (80.7%).
| Occupation | Male | Female |
| Management | 393 (52.3%) | 359 (47.7%) |
| Business & Financial | 25 (62.5%) | 15 (37.5%) |
| Computers, Engineering & Science | 209 (89.7%) | 24 (10.3%) |
| Computers & Mathematics | 34 (100.0%) | 0 (0.0%) |
| Architecture & Engineering | 175 (87.9%) | 24 (12.1%) |
| Life, Physical & Social Science | 0 (0.0%) | 0 (0.0%) |
| Community & Social Service | 104 (14.7%) | 604 (85.3%) |
| Education, Arts & Media | 46 (19.3%) | 193 (80.7%) |
| Legal Services & Support | 44 (100.0%) | 0 (0.0%) |
| Education Instruction & Library | 4 (1.0%) | 411 (99.0%) |
| Arts, Media & Entertainment | 10 (100.0%) | 0 (0.0%) |
| Health Diagnosing & Treating | 113 (28.4%) | 285 (71.6%) |
| Health Technologists | 113 (33.3%) | 226 (66.7%) |
| Total (Category) | 844 (39.6%) | 1,287 (60.4%) |
| Total (Overall) | 2,539 (45.1%) | 3,093 (54.9%) |
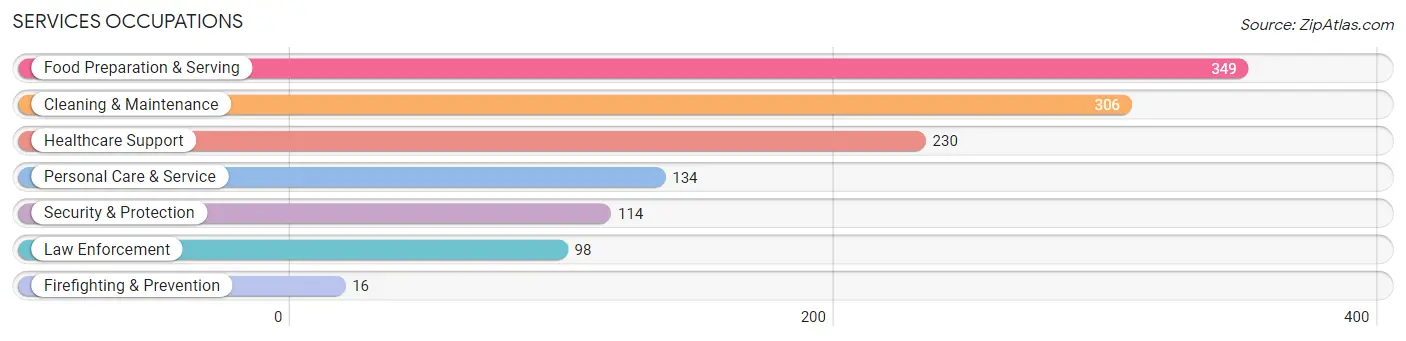
Services Occupations
The most common Services occupations in Greenwood are Food Preparation & Serving (349 | 6.2%), Cleaning & Maintenance (306 | 5.4%), Healthcare Support (230 | 4.1%), Personal Care & Service (134 | 2.4%), and Security & Protection (114 | 2.0%).
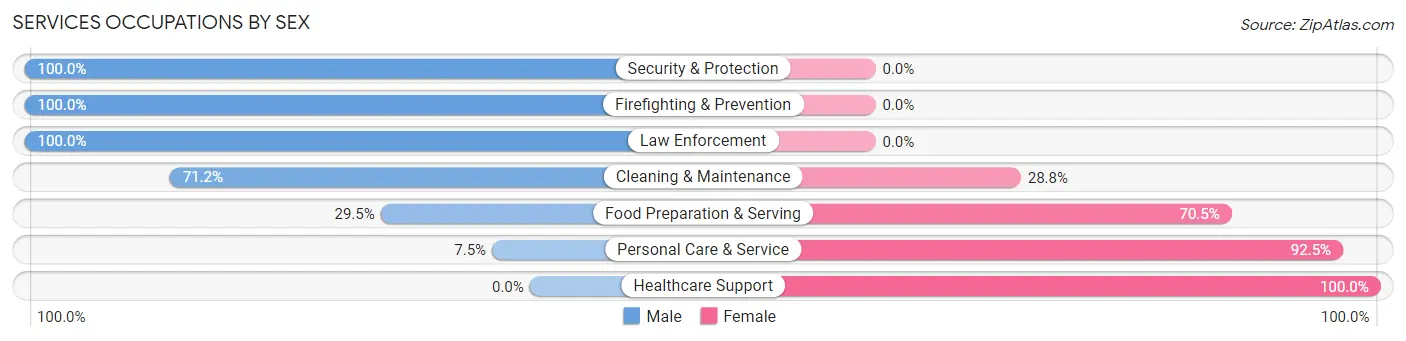
Services Occupations by Sex
Within the Services occupations in Greenwood, the most male-oriented occupations are Security & Protection (100.0%), Firefighting & Prevention (100.0%), and Law Enforcement (100.0%), while the most female-oriented occupations are Healthcare Support (100.0%), Personal Care & Service (92.5%), and Food Preparation & Serving (70.5%).
| Occupation | Male | Female |
| Healthcare Support | 0 (0.0%) | 230 (100.0%) |
| Security & Protection | 114 (100.0%) | 0 (0.0%) |
| Firefighting & Prevention | 16 (100.0%) | 0 (0.0%) |
| Law Enforcement | 98 (100.0%) | 0 (0.0%) |
| Food Preparation & Serving | 103 (29.5%) | 246 (70.5%) |
| Cleaning & Maintenance | 218 (71.2%) | 88 (28.8%) |
| Personal Care & Service | 10 (7.5%) | 124 (92.5%) |
| Total (Category) | 445 (39.3%) | 688 (60.7%) |
| Total (Overall) | 2,539 (45.1%) | 3,093 (54.9%) |
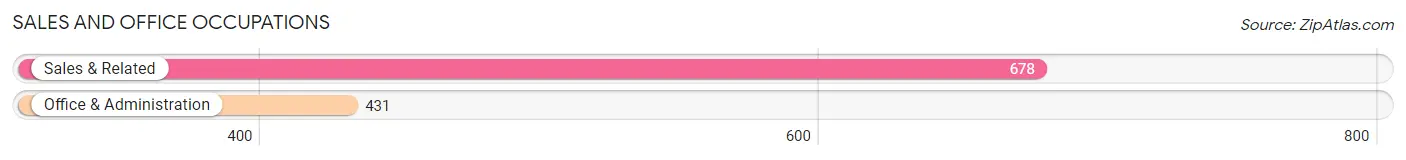
Sales and Office Occupations
The most common Sales and Office occupations in Greenwood are Sales & Related (678 | 12.0%), and Office & Administration (431 | 7.6%).
Sales and Office Occupations by Sex
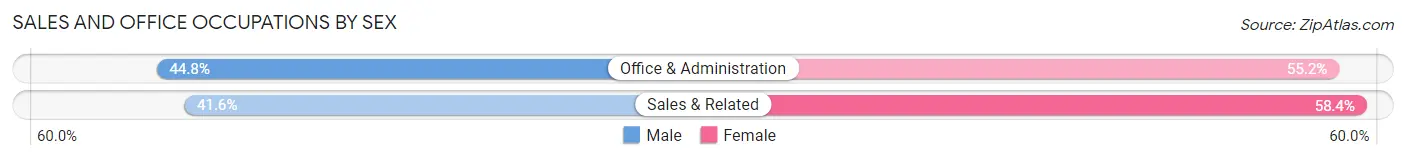
| Occupation | Male | Female |
| Sales & Related | 282 (41.6%) | 396 (58.4%) |
| Office & Administration | 193 (44.8%) | 238 (55.2%) |
| Total (Category) | 475 (42.8%) | 634 (57.2%) |
| Total (Overall) | 2,539 (45.1%) | 3,093 (54.9%) |
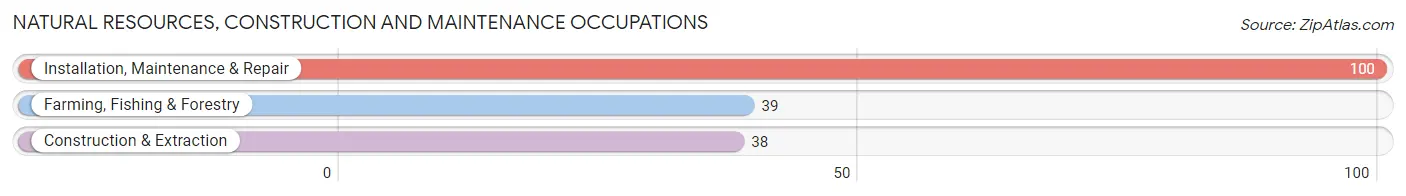
Natural Resources, Construction and Maintenance Occupations
The most common Natural Resources, Construction and Maintenance occupations in Greenwood are Installation, Maintenance & Repair (100 | 1.8%), Farming, Fishing & Forestry (39 | 0.7%), and Construction & Extraction (38 | 0.7%).
Natural Resources, Construction and Maintenance Occupations by Sex
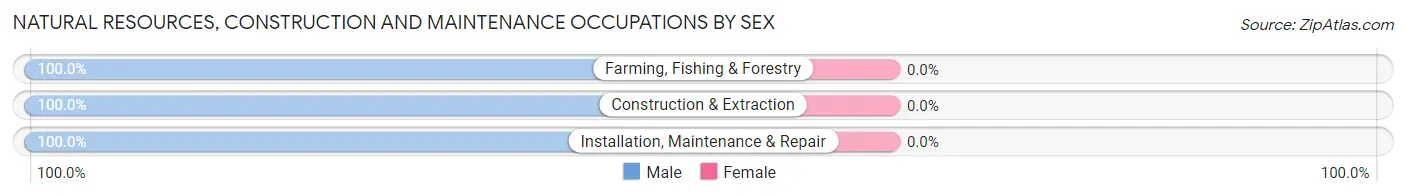
| Occupation | Male | Female |
| Farming, Fishing & Forestry | 39 (100.0%) | 0 (0.0%) |
| Construction & Extraction | 38 (100.0%) | 0 (0.0%) |
| Installation, Maintenance & Repair | 100 (100.0%) | 0 (0.0%) |
| Total (Category) | 177 (100.0%) | 0 (0.0%) |
| Total (Overall) | 2,539 (45.1%) | 3,093 (54.9%) |
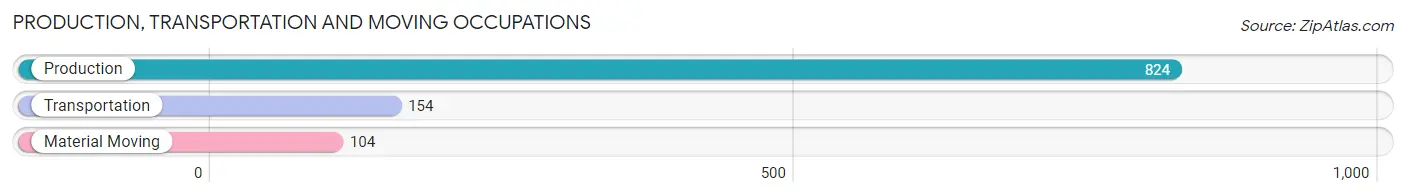
Production, Transportation and Moving Occupations
The most common Production, Transportation and Moving occupations in Greenwood are Production (824 | 14.6%), Transportation (154 | 2.7%), and Material Moving (104 | 1.8%).
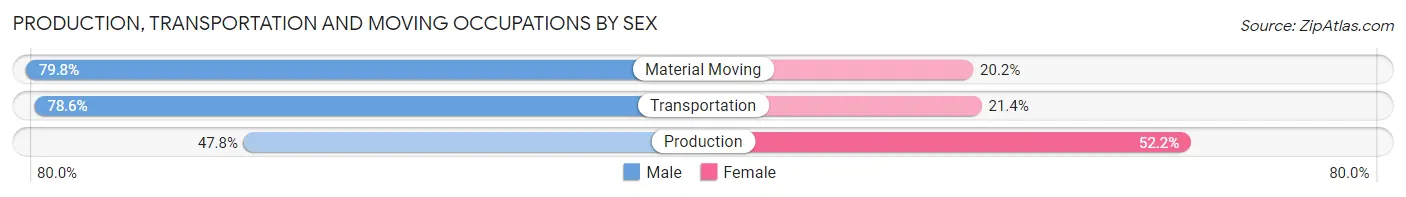
Production, Transportation and Moving Occupations by Sex
| Occupation | Male | Female |
| Production | 394 (47.8%) | 430 (52.2%) |
| Transportation | 121 (78.6%) | 33 (21.4%) |
| Material Moving | 83 (79.8%) | 21 (20.2%) |
| Total (Category) | 598 (55.3%) | 484 (44.7%) |
| Total (Overall) | 2,539 (45.1%) | 3,093 (54.9%) |
Employment Industries by Sex in Greenwood
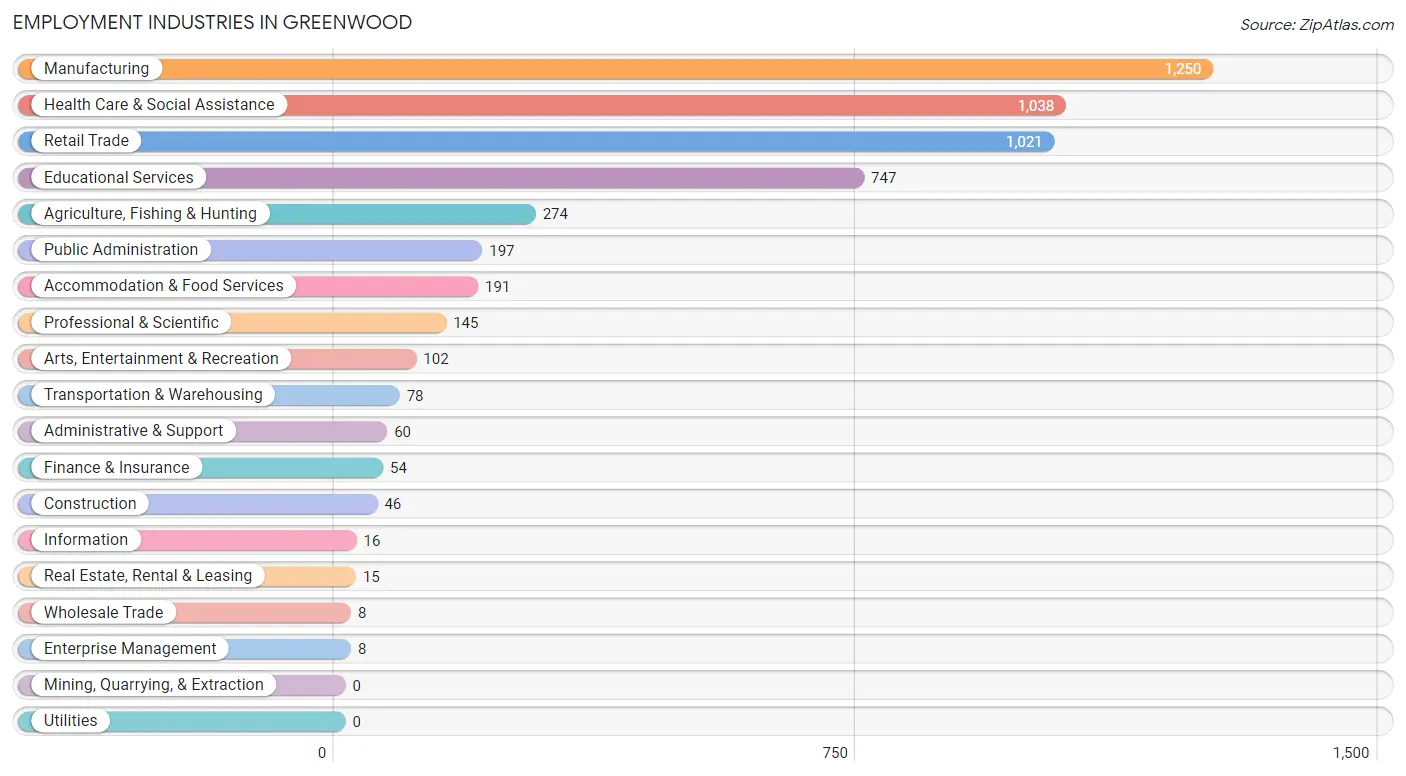
Employment Industries in Greenwood
The major employment industries in Greenwood include Manufacturing (1,250 | 22.2%), Health Care & Social Assistance (1,038 | 18.4%), Retail Trade (1,021 | 18.1%), Educational Services (747 | 13.3%), and Agriculture, Fishing & Hunting (274 | 4.9%).
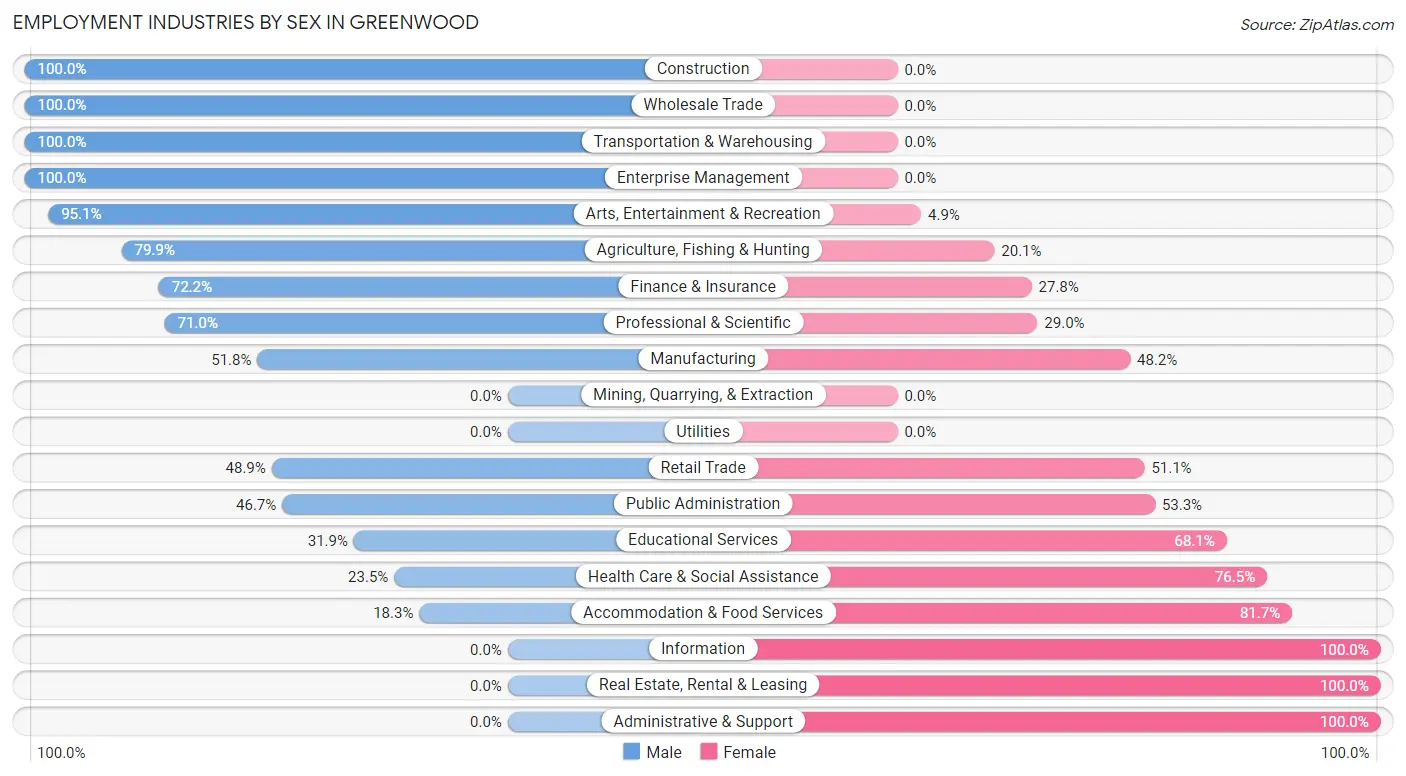
Employment Industries by Sex in Greenwood
The Greenwood industries that see more men than women are Construction (100.0%), Wholesale Trade (100.0%), and Transportation & Warehousing (100.0%), whereas the industries that tend to have a higher number of women are Information (100.0%), Real Estate, Rental & Leasing (100.0%), and Administrative & Support (100.0%).
| Industry | Male | Female |
| Agriculture, Fishing & Hunting | 219 (79.9%) | 55 (20.1%) |
| Mining, Quarrying, & Extraction | 0 (0.0%) | 0 (0.0%) |
| Construction | 46 (100.0%) | 0 (0.0%) |
| Manufacturing | 648 (51.8%) | 602 (48.2%) |
| Wholesale Trade | 8 (100.0%) | 0 (0.0%) |
| Retail Trade | 499 (48.9%) | 522 (51.1%) |
| Transportation & Warehousing | 78 (100.0%) | 0 (0.0%) |
| Utilities | 0 (0.0%) | 0 (0.0%) |
| Information | 0 (0.0%) | 16 (100.0%) |
| Finance & Insurance | 39 (72.2%) | 15 (27.8%) |
| Real Estate, Rental & Leasing | 0 (0.0%) | 15 (100.0%) |
| Professional & Scientific | 103 (71.0%) | 42 (29.0%) |
| Enterprise Management | 8 (100.0%) | 0 (0.0%) |
| Administrative & Support | 0 (0.0%) | 60 (100.0%) |
| Educational Services | 238 (31.9%) | 509 (68.1%) |
| Health Care & Social Assistance | 244 (23.5%) | 794 (76.5%) |
| Arts, Entertainment & Recreation | 97 (95.1%) | 5 (4.9%) |
| Accommodation & Food Services | 35 (18.3%) | 156 (81.7%) |
| Public Administration | 92 (46.7%) | 105 (53.3%) |
| Total | 2,539 (45.1%) | 3,093 (54.9%) |
Education in Greenwood
School Enrollment in Greenwood
The most common levels of schooling among the 3,752 students in Greenwood are high school (924 | 24.6%), elementary school (850 | 22.7%), and middle school (681 | 18.1%).
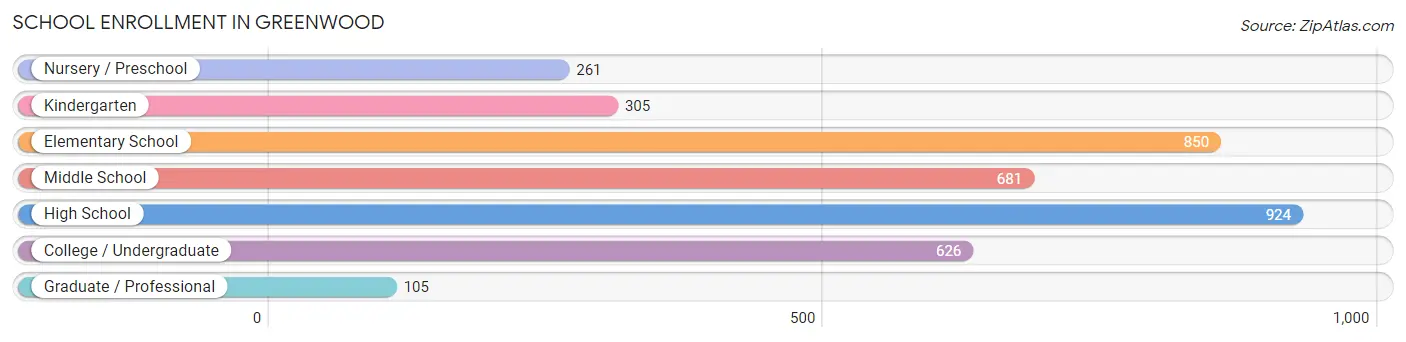
| School Level | # Students | % Students |
| Nursery / Preschool | 261 | 7.0% |
| Kindergarten | 305 | 8.1% |
| Elementary School | 850 | 22.7% |
| Middle School | 681 | 18.1% |
| High School | 924 | 24.6% |
| College / Undergraduate | 626 | 16.7% |
| Graduate / Professional | 105 | 2.8% |
| Total | 3,752 | 100.0% |
School Enrollment by Age by Funding Source in Greenwood
Out of a total of 3,752 students who are enrolled in schools in Greenwood, 435 (11.6%) attend a private institution, while the remaining 3,317 (88.4%) are enrolled in public schools. The age group of 3 to 4 year olds has the highest likelihood of being enrolled in private schools, with 34 (25.4% in the age bracket) enrolled. Conversely, the age group of 18 to 19 year olds has the lowest likelihood of being enrolled in a private school, with 204 (100.0% in the age bracket) attending a public institution.
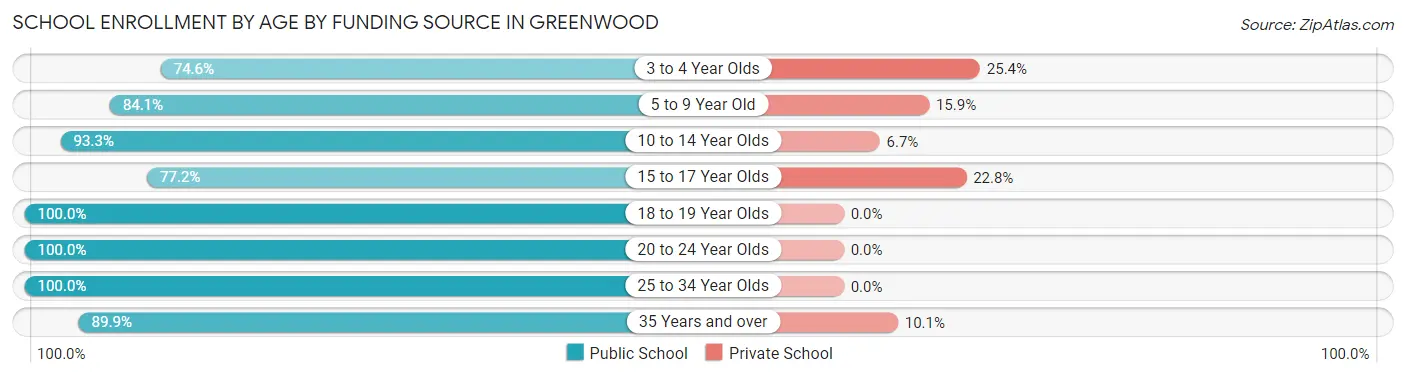
| Age Bracket | Public School | Private School |
| 3 to 4 Year Olds | 100 (74.6%) | 34 (25.4%) |
| 5 to 9 Year Old | 1,016 (84.1%) | 192 (15.9%) |
| 10 to 14 Year Olds | 809 (93.3%) | 58 (6.7%) |
| 15 to 17 Year Olds | 470 (77.2%) | 139 (22.8%) |
| 18 to 19 Year Olds | 204 (100.0%) | 0 (0.0%) |
| 20 to 24 Year Olds | 465 (100.0%) | 0 (0.0%) |
| 25 to 34 Year Olds | 146 (100.0%) | 0 (0.0%) |
| 35 Years and over | 107 (89.9%) | 12 (10.1%) |
| Total | 3,317 (88.4%) | 435 (11.6%) |
Educational Attainment by Field of Study in Greenwood
Science & technology (473 | 21.9%), business (434 | 20.1%), education (433 | 20.1%), engineering (232 | 10.7%), and bio, nature & agricultural (177 | 8.2%) are the most common fields of study among 2,159 individuals in Greenwood who have obtained a bachelor's degree or higher.
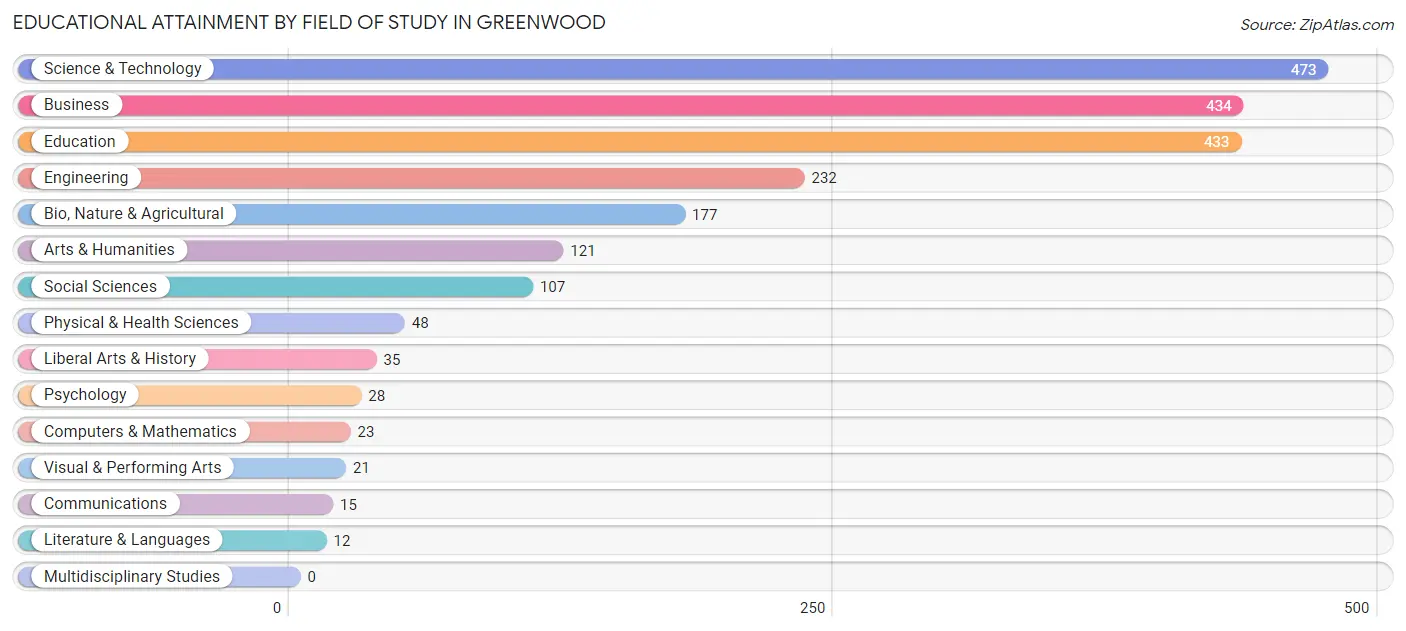
| Field of Study | # Graduates | % Graduates |
| Computers & Mathematics | 23 | 1.1% |
| Bio, Nature & Agricultural | 177 | 8.2% |
| Physical & Health Sciences | 48 | 2.2% |
| Psychology | 28 | 1.3% |
| Social Sciences | 107 | 5.0% |
| Engineering | 232 | 10.7% |
| Multidisciplinary Studies | 0 | 0.0% |
| Science & Technology | 473 | 21.9% |
| Business | 434 | 20.1% |
| Education | 433 | 20.1% |
| Literature & Languages | 12 | 0.6% |
| Liberal Arts & History | 35 | 1.6% |
| Visual & Performing Arts | 21 | 1.0% |
| Communications | 15 | 0.7% |
| Arts & Humanities | 121 | 5.6% |
| Total | 2,159 | 100.0% |
Transportation & Commute in Greenwood
Vehicle Availability by Sex in Greenwood
The most prevalent vehicle ownership categories in Greenwood are males with 2 vehicles (1,100, accounting for 43.3%) and females with 2 vehicles (1,585, making up 35.7%).
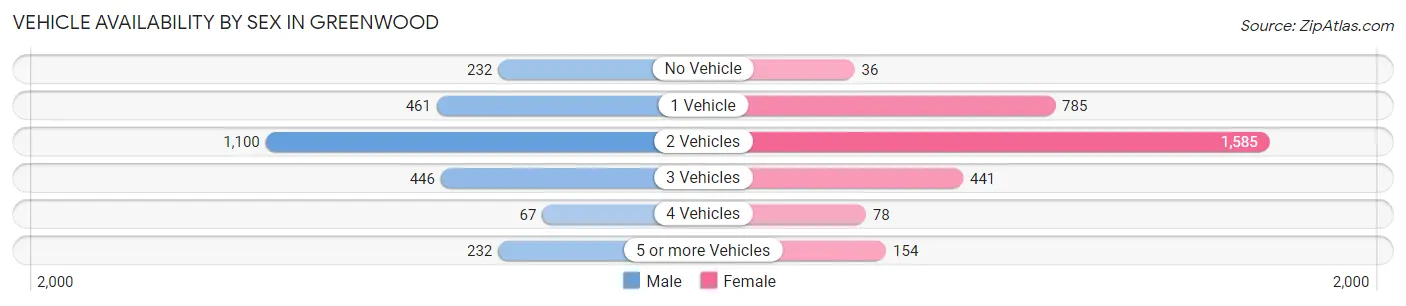
| Vehicles Available | Male | Female |
| No Vehicle | 232 (9.1%) | 36 (1.2%) |
| 1 Vehicle | 461 (18.2%) | 785 (25.5%) |
| 2 Vehicles | 1,100 (43.3%) | 1,585 (51.5%) |
| 3 Vehicles | 446 (17.6%) | 441 (14.3%) |
| 4 Vehicles | 67 (2.6%) | 78 (2.5%) |
| 5 or more Vehicles | 232 (9.1%) | 154 (5.0%) |
| Total | 2,538 (100.0%) | 3,079 (100.0%) |
Commute Time in Greenwood
The most frequently occuring commute durations in Greenwood are 10 to 14 minutes (2,210 commuters, 40.5%), 5 to 9 minutes (1,376 commuters, 25.2%), and 15 to 19 minutes (717 commuters, 13.1%).
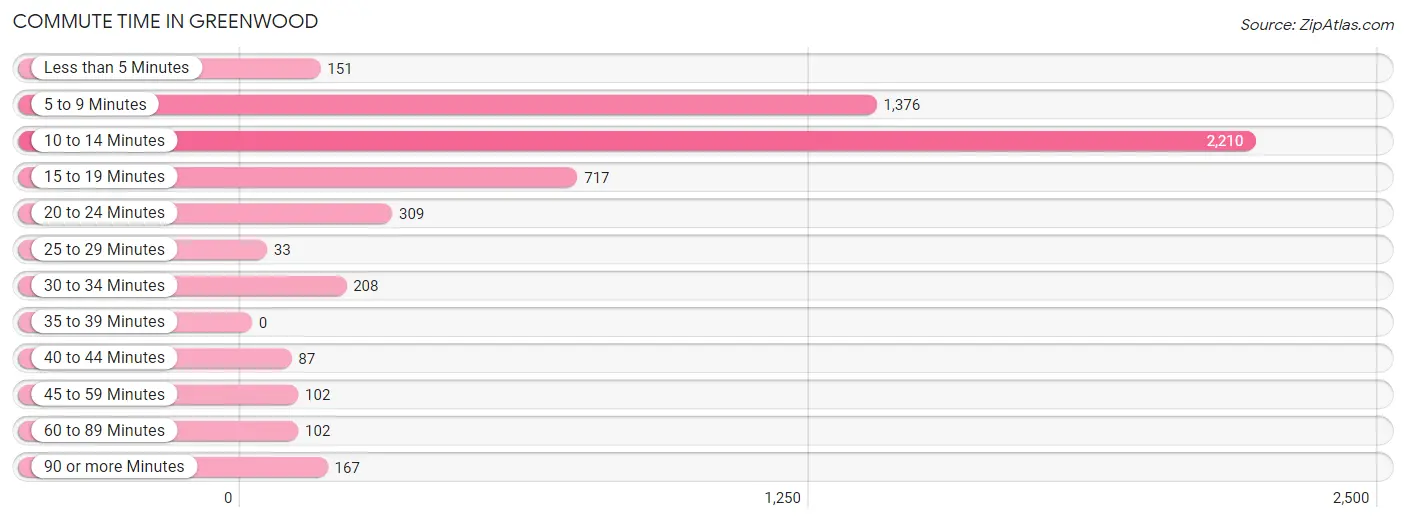
| Commute Time | # Commuters | % Commuters |
| Less than 5 Minutes | 151 | 2.8% |
| 5 to 9 Minutes | 1,376 | 25.2% |
| 10 to 14 Minutes | 2,210 | 40.5% |
| 15 to 19 Minutes | 717 | 13.1% |
| 20 to 24 Minutes | 309 | 5.7% |
| 25 to 29 Minutes | 33 | 0.6% |
| 30 to 34 Minutes | 208 | 3.8% |
| 35 to 39 Minutes | 0 | 0.0% |
| 40 to 44 Minutes | 87 | 1.6% |
| 45 to 59 Minutes | 102 | 1.9% |
| 60 to 89 Minutes | 102 | 1.9% |
| 90 or more Minutes | 167 | 3.1% |
Commute Time by Sex in Greenwood
The most common commute times in Greenwood are 10 to 14 minutes (924 commuters, 36.8%) for males and 10 to 14 minutes (1,286 commuters, 43.6%) for females.
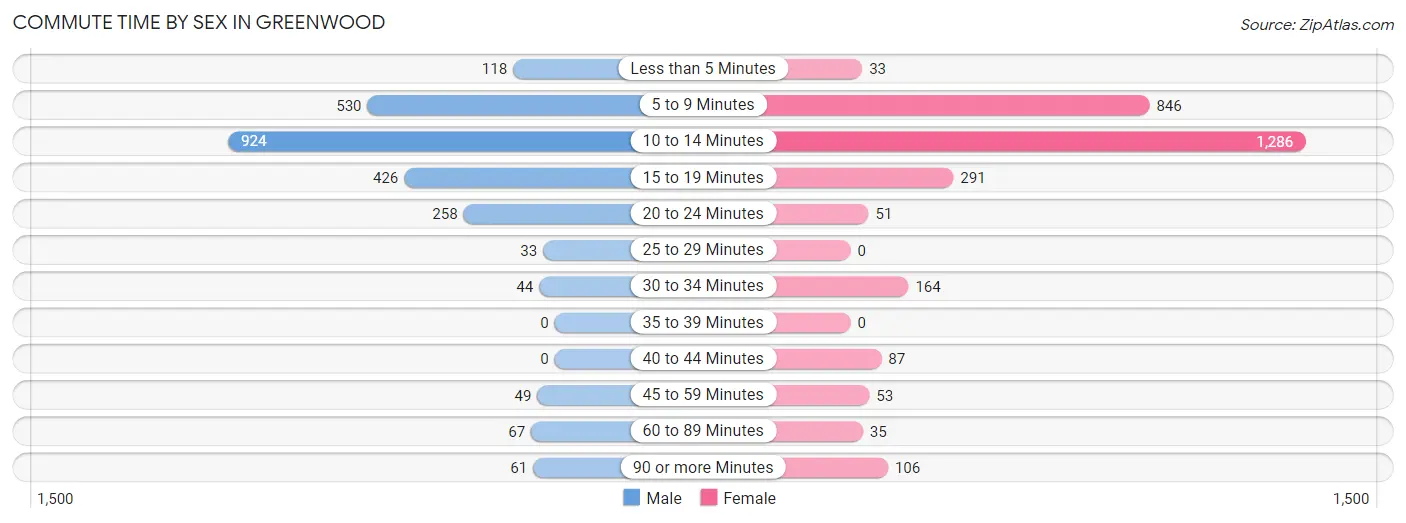
| Commute Time | Male | Female |
| Less than 5 Minutes | 118 (4.7%) | 33 (1.1%) |
| 5 to 9 Minutes | 530 (21.1%) | 846 (28.7%) |
| 10 to 14 Minutes | 924 (36.8%) | 1,286 (43.6%) |
| 15 to 19 Minutes | 426 (17.0%) | 291 (9.9%) |
| 20 to 24 Minutes | 258 (10.3%) | 51 (1.7%) |
| 25 to 29 Minutes | 33 (1.3%) | 0 (0.0%) |
| 30 to 34 Minutes | 44 (1.8%) | 164 (5.6%) |
| 35 to 39 Minutes | 0 (0.0%) | 0 (0.0%) |
| 40 to 44 Minutes | 0 (0.0%) | 87 (2.9%) |
| 45 to 59 Minutes | 49 (1.9%) | 53 (1.8%) |
| 60 to 89 Minutes | 67 (2.7%) | 35 (1.2%) |
| 90 or more Minutes | 61 (2.4%) | 106 (3.6%) |
Time of Departure to Work by Sex in Greenwood
The most frequent times of departure to work in Greenwood are 7:00 AM to 7:29 AM (788, 31.4%) for males and 7:00 AM to 7:29 AM (685, 23.2%) for females.
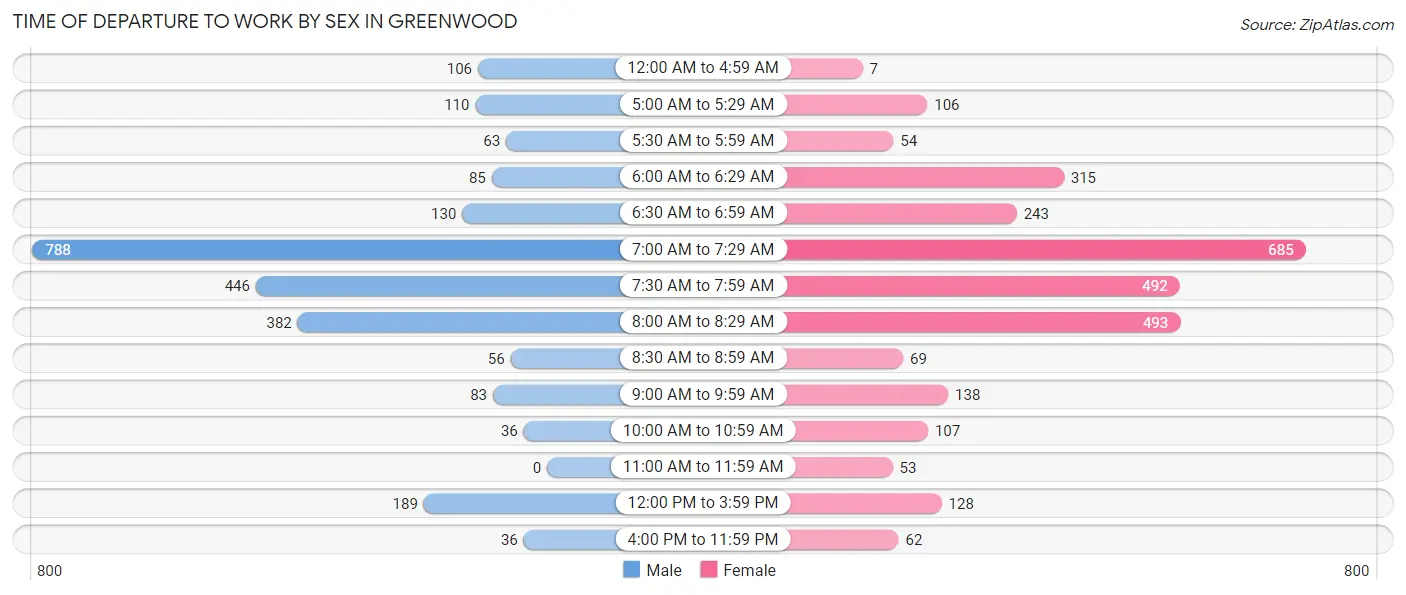
| Time of Departure | Male | Female |
| 12:00 AM to 4:59 AM | 106 (4.2%) | 7 (0.2%) |
| 5:00 AM to 5:29 AM | 110 (4.4%) | 106 (3.6%) |
| 5:30 AM to 5:59 AM | 63 (2.5%) | 54 (1.8%) |
| 6:00 AM to 6:29 AM | 85 (3.4%) | 315 (10.7%) |
| 6:30 AM to 6:59 AM | 130 (5.2%) | 243 (8.2%) |
| 7:00 AM to 7:29 AM | 788 (31.4%) | 685 (23.2%) |
| 7:30 AM to 7:59 AM | 446 (17.8%) | 492 (16.7%) |
| 8:00 AM to 8:29 AM | 382 (15.2%) | 493 (16.7%) |
| 8:30 AM to 8:59 AM | 56 (2.2%) | 69 (2.3%) |
| 9:00 AM to 9:59 AM | 83 (3.3%) | 138 (4.7%) |
| 10:00 AM to 10:59 AM | 36 (1.4%) | 107 (3.6%) |
| 11:00 AM to 11:59 AM | 0 (0.0%) | 53 (1.8%) |
| 12:00 PM to 3:59 PM | 189 (7.5%) | 128 (4.3%) |
| 4:00 PM to 11:59 PM | 36 (1.4%) | 62 (2.1%) |
| Total | 2,510 (100.0%) | 2,952 (100.0%) |
Housing Occupancy in Greenwood
Occupancy by Ownership in Greenwood
Of the total 5,098 dwellings in Greenwood, owner-occupied units account for 2,911 (57.1%), while renter-occupied units make up 2,187 (42.9%).
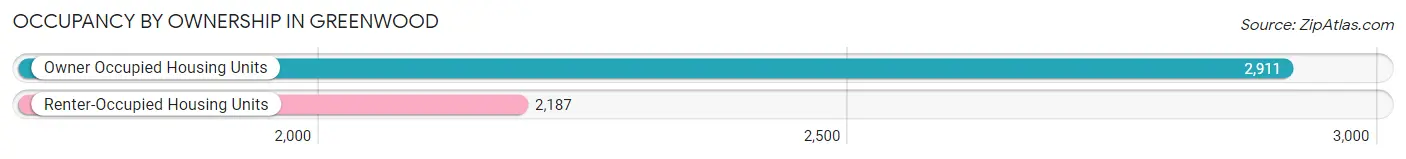
| Occupancy | # Housing Units | % Housing Units |
| Owner Occupied Housing Units | 2,911 | 57.1% |
| Renter-Occupied Housing Units | 2,187 | 42.9% |
| Total Occupied Housing Units | 5,098 | 100.0% |
Occupancy by Household Size in Greenwood
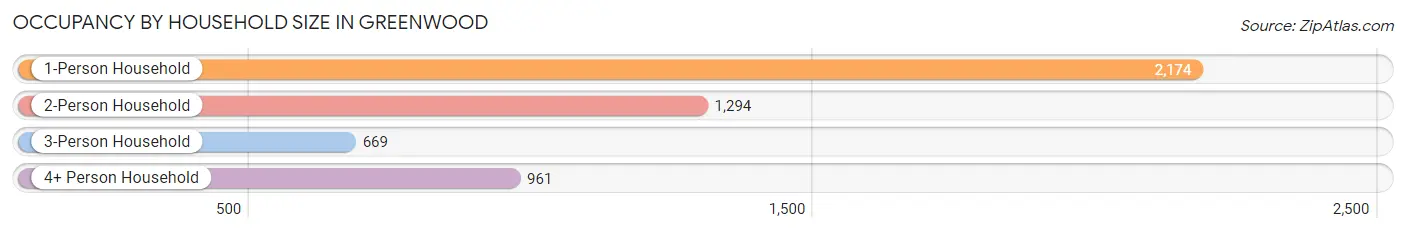
| Household Size | # Housing Units | % Housing Units |
| 1-Person Household | 2,174 | 42.6% |
| 2-Person Household | 1,294 | 25.4% |
| 3-Person Household | 669 | 13.1% |
| 4+ Person Household | 961 | 18.9% |
| Total Housing Units | 5,098 | 100.0% |
Occupancy by Ownership by Household Size in Greenwood
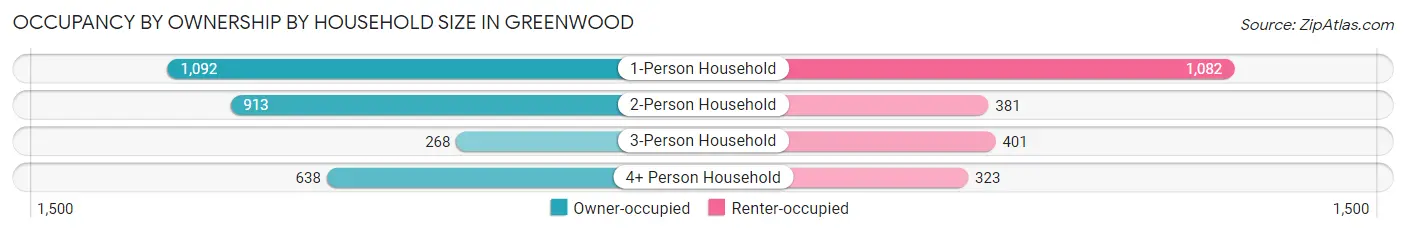
| Household Size | Owner-occupied | Renter-occupied |
| 1-Person Household | 1,092 (50.2%) | 1,082 (49.8%) |
| 2-Person Household | 913 (70.6%) | 381 (29.4%) |
| 3-Person Household | 268 (40.1%) | 401 (59.9%) |
| 4+ Person Household | 638 (66.4%) | 323 (33.6%) |
| Total Housing Units | 2,911 (57.1%) | 2,187 (42.9%) |
Occupancy by Educational Attainment in Greenwood
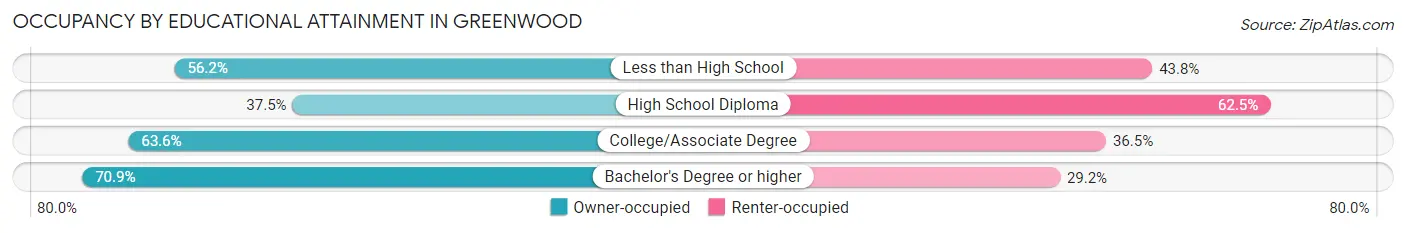
| Household Size | Owner-occupied | Renter-occupied |
| Less than High School | 357 (56.2%) | 278 (43.8%) |
| High School Diploma | 556 (37.5%) | 926 (62.5%) |
| College/Associate Degree | 994 (63.5%) | 570 (36.4%) |
| Bachelor's Degree or higher | 1,004 (70.9%) | 413 (29.1%) |
Occupancy by Age of Householder in Greenwood
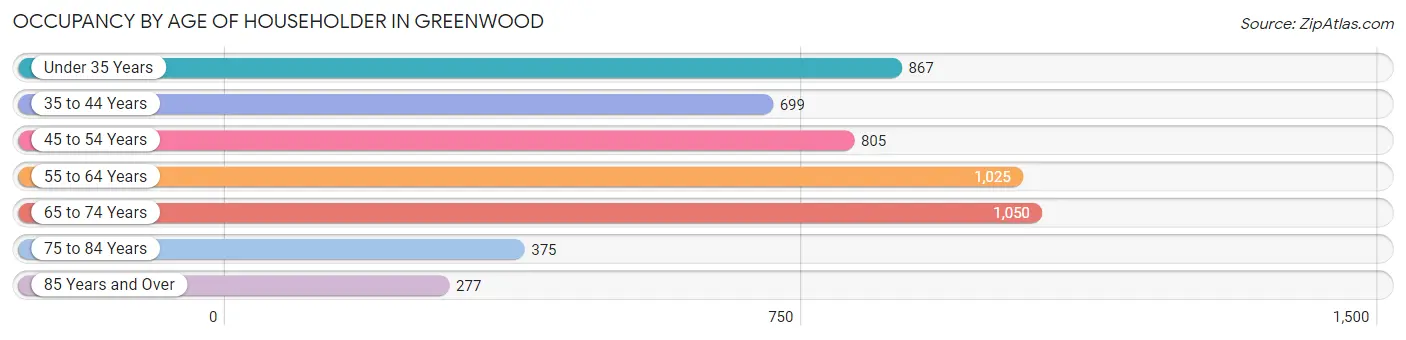
| Age Bracket | # Households | % Households |
| Under 35 Years | 867 | 17.0% |
| 35 to 44 Years | 699 | 13.7% |
| 45 to 54 Years | 805 | 15.8% |
| 55 to 64 Years | 1,025 | 20.1% |
| 65 to 74 Years | 1,050 | 20.6% |
| 75 to 84 Years | 375 | 7.4% |
| 85 Years and Over | 277 | 5.4% |
| Total | 5,098 | 100.0% |
Housing Finances in Greenwood
Median Income by Occupancy in Greenwood
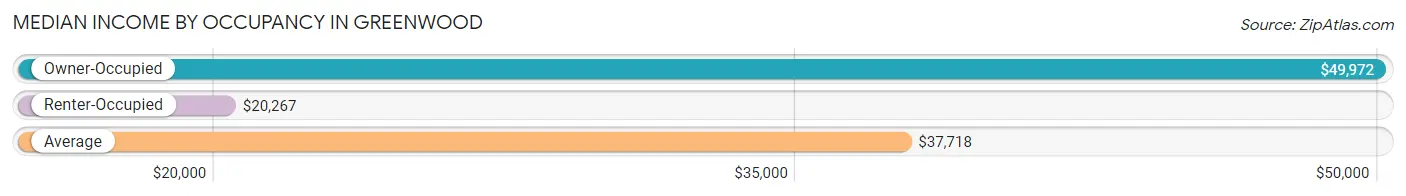
| Occupancy Type | # Households | Median Income |
| Owner-Occupied | 2,911 (57.1%) | $49,972 |
| Renter-Occupied | 2,187 (42.9%) | $20,267 |
| Average | 5,098 (100.0%) | $37,718 |
Occupancy by Householder Income Bracket in Greenwood
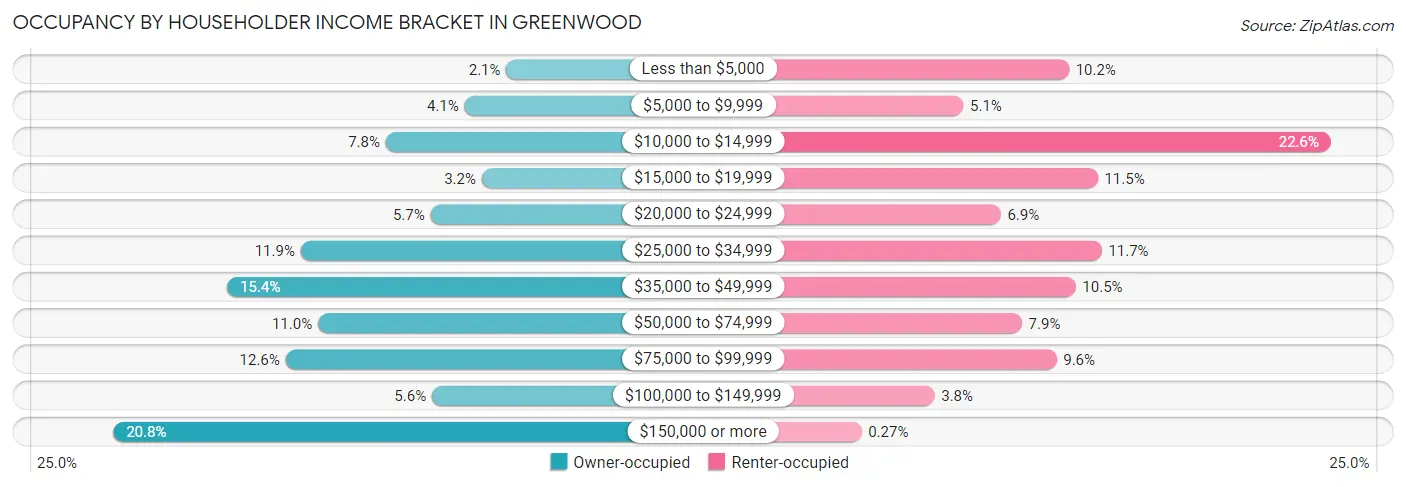
| Income Bracket | Owner-occupied | Renter-occupied |
| Less than $5,000 | 60 (2.1%) | 222 (10.2%) |
| $5,000 to $9,999 | 118 (4.1%) | 112 (5.1%) |
| $10,000 to $14,999 | 227 (7.8%) | 495 (22.6%) |
| $15,000 to $19,999 | 94 (3.2%) | 252 (11.5%) |
| $20,000 to $24,999 | 165 (5.7%) | 151 (6.9%) |
| $25,000 to $34,999 | 345 (11.8%) | 256 (11.7%) |
| $35,000 to $49,999 | 447 (15.4%) | 229 (10.5%) |
| $50,000 to $74,999 | 321 (11.0%) | 173 (7.9%) |
| $75,000 to $99,999 | 366 (12.6%) | 209 (9.6%) |
| $100,000 to $149,999 | 163 (5.6%) | 82 (3.7%) |
| $150,000 or more | 605 (20.8%) | 6 (0.3%) |
| Total | 2,911 (100.0%) | 2,187 (100.0%) |
Monthly Housing Cost Tiers in Greenwood
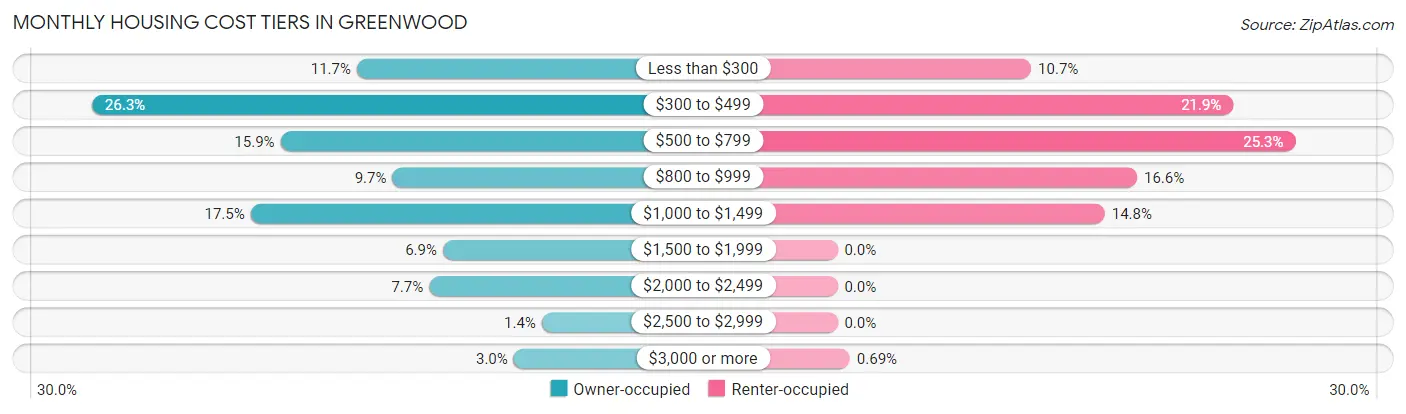
| Monthly Cost | Owner-occupied | Renter-occupied |
| Less than $300 | 339 (11.7%) | 234 (10.7%) |
| $300 to $499 | 765 (26.3%) | 478 (21.9%) |
| $500 to $799 | 462 (15.9%) | 553 (25.3%) |
| $800 to $999 | 282 (9.7%) | 362 (16.6%) |
| $1,000 to $1,499 | 510 (17.5%) | 323 (14.8%) |
| $1,500 to $1,999 | 201 (6.9%) | 0 (0.0%) |
| $2,000 to $2,499 | 223 (7.7%) | 0 (0.0%) |
| $2,500 to $2,999 | 42 (1.4%) | 0 (0.0%) |
| $3,000 or more | 87 (3.0%) | 15 (0.7%) |
| Total | 2,911 (100.0%) | 2,187 (100.0%) |
Physical Housing Characteristics in Greenwood
Housing Structures in Greenwood
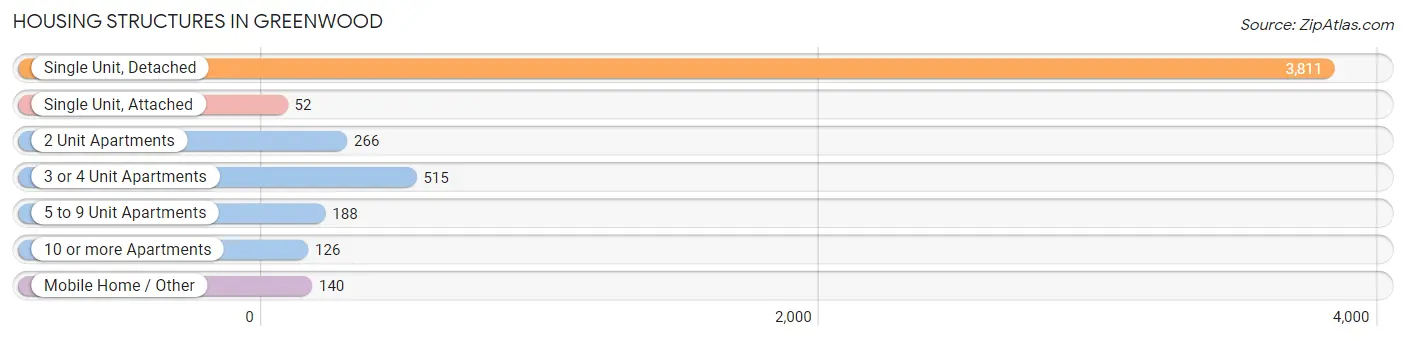
| Structure Type | # Housing Units | % Housing Units |
| Single Unit, Detached | 3,811 | 74.8% |
| Single Unit, Attached | 52 | 1.0% |
| 2 Unit Apartments | 266 | 5.2% |
| 3 or 4 Unit Apartments | 515 | 10.1% |
| 5 to 9 Unit Apartments | 188 | 3.7% |
| 10 or more Apartments | 126 | 2.5% |
| Mobile Home / Other | 140 | 2.8% |
| Total | 5,098 | 100.0% |
Housing Structures by Occupancy in Greenwood
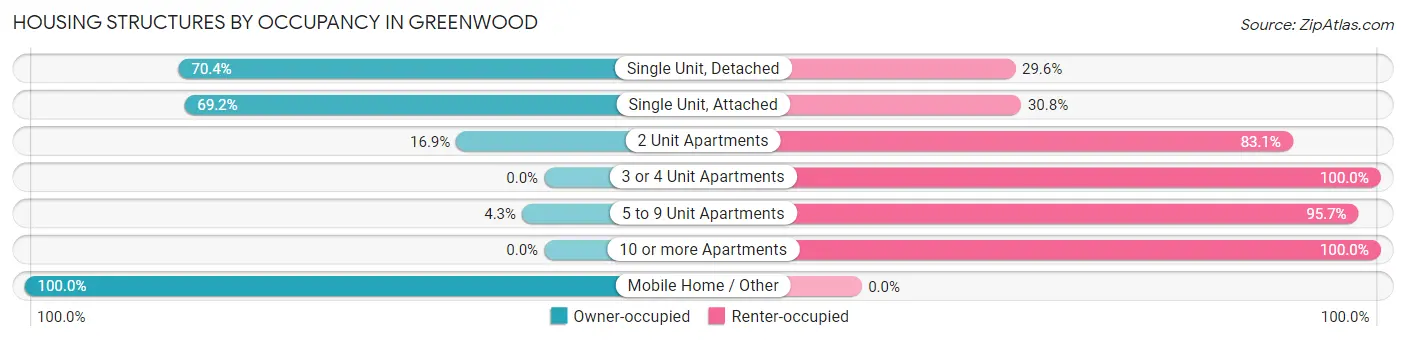
| Structure Type | Owner-occupied | Renter-occupied |
| Single Unit, Detached | 2,682 (70.4%) | 1,129 (29.6%) |
| Single Unit, Attached | 36 (69.2%) | 16 (30.8%) |
| 2 Unit Apartments | 45 (16.9%) | 221 (83.1%) |
| 3 or 4 Unit Apartments | 0 (0.0%) | 515 (100.0%) |
| 5 to 9 Unit Apartments | 8 (4.3%) | 180 (95.7%) |
| 10 or more Apartments | 0 (0.0%) | 126 (100.0%) |
| Mobile Home / Other | 140 (100.0%) | 0 (0.0%) |
| Total | 2,911 (57.1%) | 2,187 (42.9%) |
Housing Structures by Number of Rooms in Greenwood
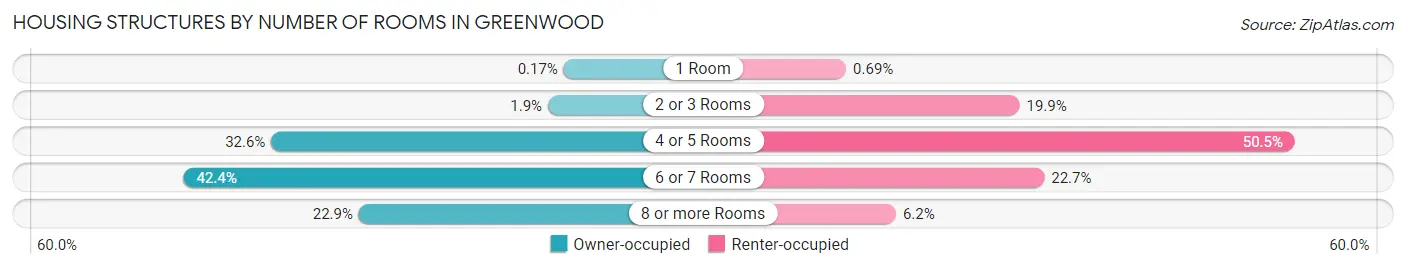
| Number of Rooms | Owner-occupied | Renter-occupied |
| 1 Room | 5 (0.2%) | 15 (0.7%) |
| 2 or 3 Rooms | 56 (1.9%) | 436 (19.9%) |
| 4 or 5 Rooms | 950 (32.6%) | 1,104 (50.5%) |
| 6 or 7 Rooms | 1,233 (42.4%) | 496 (22.7%) |
| 8 or more Rooms | 667 (22.9%) | 136 (6.2%) |
| Total | 2,911 (100.0%) | 2,187 (100.0%) |
Housing Structure by Heating Type in Greenwood
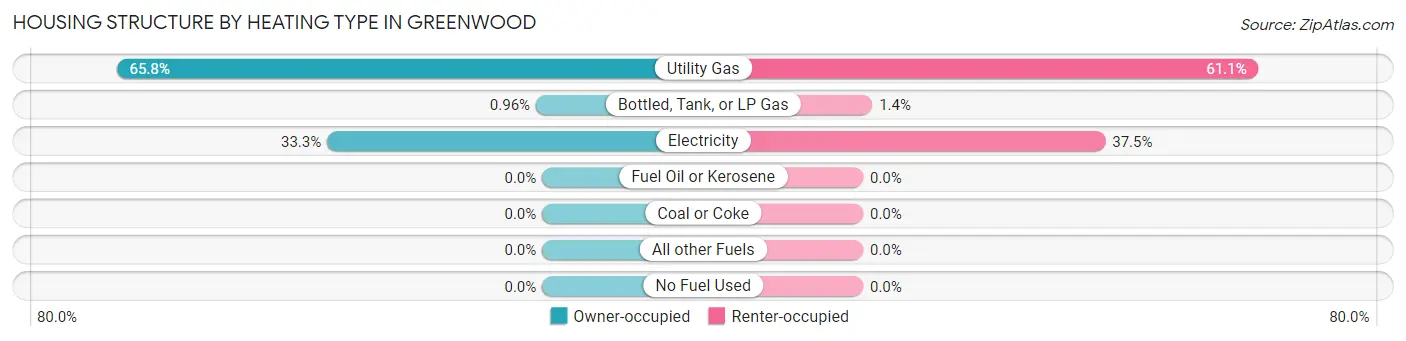
| Heating Type | Owner-occupied | Renter-occupied |
| Utility Gas | 1,915 (65.8%) | 1,337 (61.1%) |
| Bottled, Tank, or LP Gas | 28 (1.0%) | 31 (1.4%) |
| Electricity | 968 (33.3%) | 819 (37.4%) |
| Fuel Oil or Kerosene | 0 (0.0%) | 0 (0.0%) |
| Coal or Coke | 0 (0.0%) | 0 (0.0%) |
| All other Fuels | 0 (0.0%) | 0 (0.0%) |
| No Fuel Used | 0 (0.0%) | 0 (0.0%) |
| Total | 2,911 (100.0%) | 2,187 (100.0%) |
Household Vehicle Usage in Greenwood
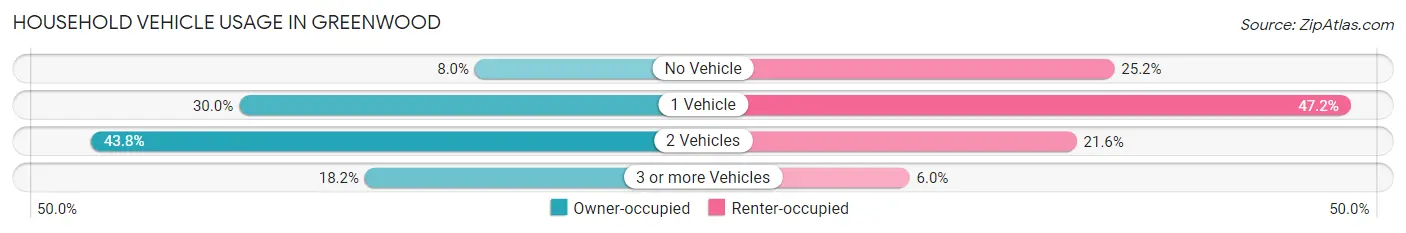
| Vehicles per Household | Owner-occupied | Renter-occupied |
| No Vehicle | 232 (8.0%) | 550 (25.2%) |
| 1 Vehicle | 873 (30.0%) | 1,032 (47.2%) |
| 2 Vehicles | 1,275 (43.8%) | 473 (21.6%) |
| 3 or more Vehicles | 531 (18.2%) | 132 (6.0%) |
| Total | 2,911 (100.0%) | 2,187 (100.0%) |
Real Estate & Mortgages in Greenwood
Real Estate and Mortgage Overview in Greenwood
| Characteristic | Without Mortgage | With Mortgage |
| Housing Units | 1,574 | 1,337 |
| Median Property Value | $86,900 | $128,800 |
| Median Household Income | $40,284 | $429 |
| Monthly Housing Costs | $431 | $87 |
| Real Estate Taxes | $925 | $292 |
Property Value by Mortgage Status in Greenwood
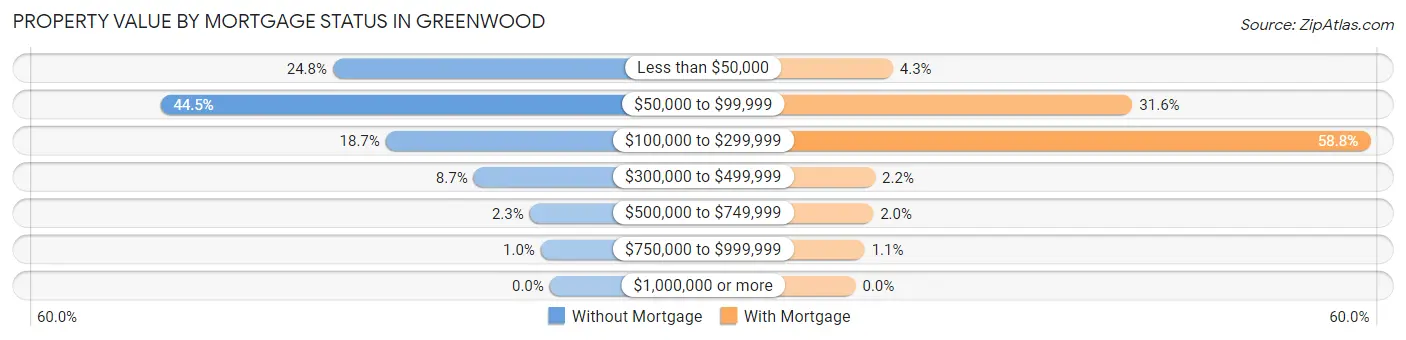
| Property Value | Without Mortgage | With Mortgage |
| Less than $50,000 | 390 (24.8%) | 57 (4.3%) |
| $50,000 to $99,999 | 700 (44.5%) | 423 (31.6%) |
| $100,000 to $299,999 | 295 (18.7%) | 786 (58.8%) |
| $300,000 to $499,999 | 137 (8.7%) | 30 (2.2%) |
| $500,000 to $749,999 | 36 (2.3%) | 27 (2.0%) |
| $750,000 to $999,999 | 16 (1.0%) | 14 (1.1%) |
| $1,000,000 or more | 0 (0.0%) | 0 (0.0%) |
| Total | 1,574 (100.0%) | 1,337 (100.0%) |
Household Income by Mortgage Status in Greenwood
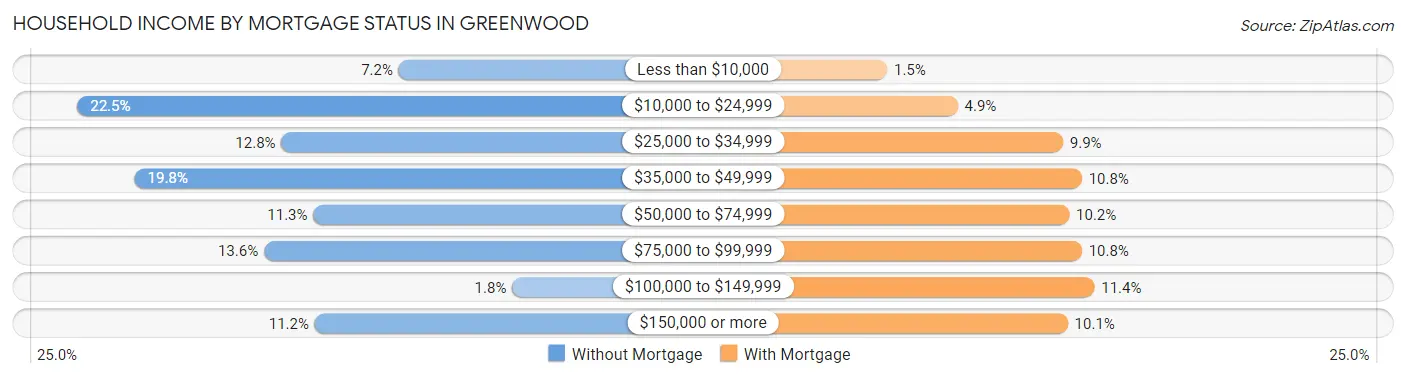
| Household Income | Without Mortgage | With Mortgage |
| Less than $10,000 | 113 (7.2%) | 20 (1.5%) |
| $10,000 to $24,999 | 354 (22.5%) | 65 (4.9%) |
| $25,000 to $34,999 | 201 (12.8%) | 132 (9.9%) |
| $35,000 to $49,999 | 311 (19.8%) | 144 (10.8%) |
| $50,000 to $74,999 | 177 (11.3%) | 136 (10.2%) |
| $75,000 to $99,999 | 214 (13.6%) | 144 (10.8%) |
| $100,000 to $149,999 | 28 (1.8%) | 152 (11.4%) |
| $150,000 or more | 176 (11.2%) | 135 (10.1%) |
| Total | 1,574 (100.0%) | 1,337 (100.0%) |
Property Value to Household Income Ratio in Greenwood
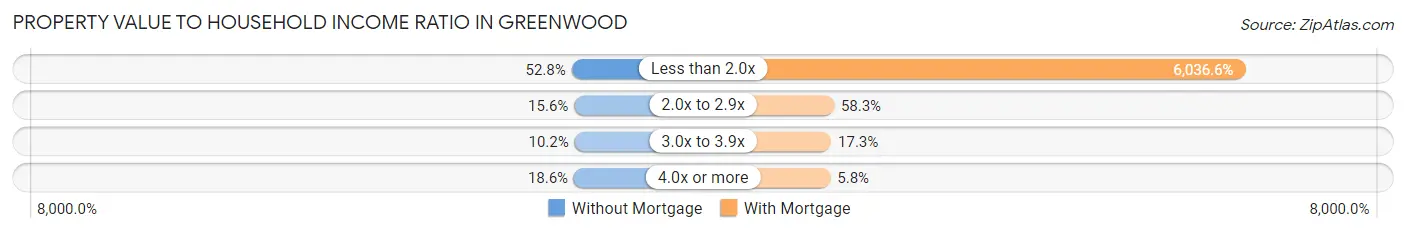
| Value-to-Income Ratio | Without Mortgage | With Mortgage |
| Less than 2.0x | 831 (52.8%) | 80,709 (6,036.6%) |
| 2.0x to 2.9x | 245 (15.6%) | 780 (58.3%) |
| 3.0x to 3.9x | 161 (10.2%) | 231 (17.3%) |
| 4.0x or more | 292 (18.5%) | 78 (5.8%) |
| Total | 1,574 (100.0%) | 1,337 (100.0%) |
Real Estate Taxes by Mortgage Status in Greenwood
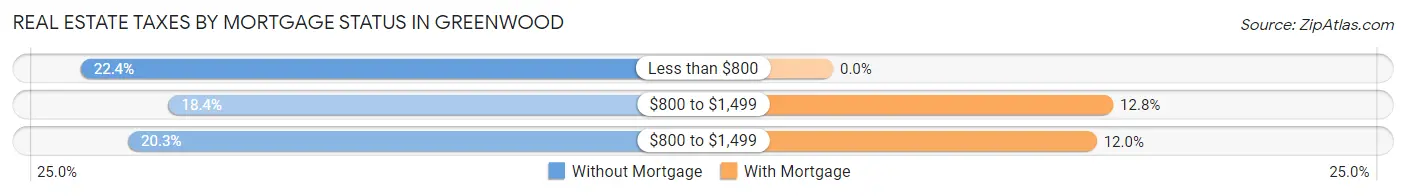
| Property Taxes | Without Mortgage | With Mortgage |
| Less than $800 | 353 (22.4%) | 0 (0.0%) |
| $800 to $1,499 | 290 (18.4%) | 171 (12.8%) |
| $800 to $1,499 | 319 (20.3%) | 161 (12.0%) |
| Total | 1,574 (100.0%) | 1,337 (100.0%) |
Health & Disability in Greenwood
Health Insurance Coverage by Age in Greenwood
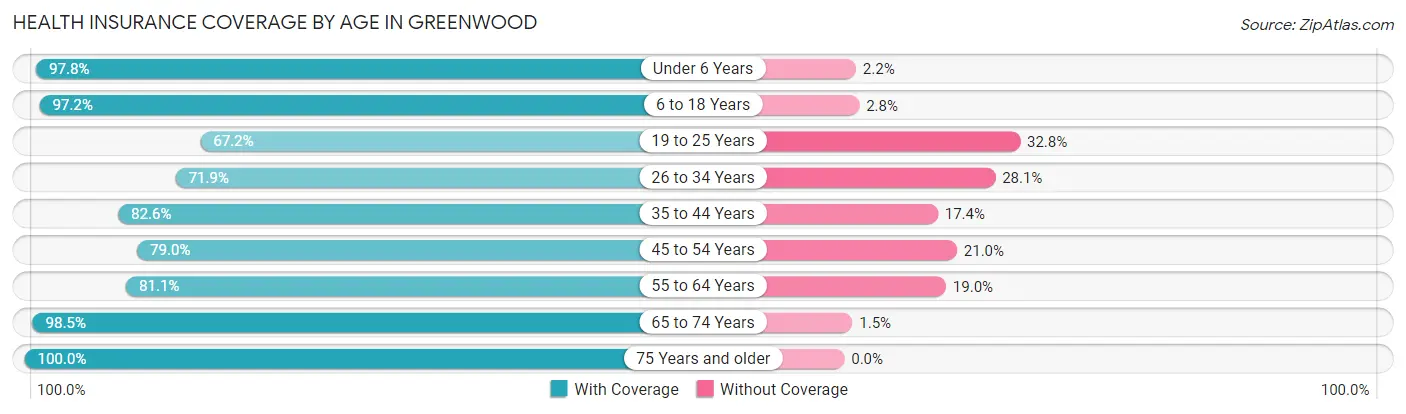
| Age Bracket | With Coverage | Without Coverage |
| Under 6 Years | 1,494 (97.8%) | 33 (2.2%) |
| 6 to 18 Years | 2,553 (97.2%) | 73 (2.8%) |
| 19 to 25 Years | 722 (67.2%) | 352 (32.8%) |
| 26 to 34 Years | 1,269 (71.9%) | 497 (28.1%) |
| 35 to 44 Years | 1,293 (82.6%) | 273 (17.4%) |
| 45 to 54 Years | 1,137 (79.0%) | 302 (21.0%) |
| 55 to 64 Years | 1,394 (81.0%) | 326 (19.0%) |
| 65 to 74 Years | 1,317 (98.5%) | 20 (1.5%) |
| 75 Years and older | 843 (100.0%) | 0 (0.0%) |
| Total | 12,022 (86.5%) | 1,876 (13.5%) |
Health Insurance Coverage by Citizenship Status in Greenwood
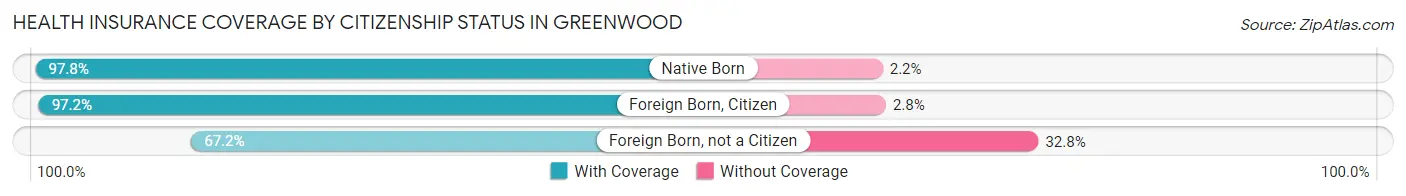
| Citizenship Status | With Coverage | Without Coverage |
| Native Born | 1,494 (97.8%) | 33 (2.2%) |
| Foreign Born, Citizen | 2,553 (97.2%) | 73 (2.8%) |
| Foreign Born, not a Citizen | 722 (67.2%) | 352 (32.8%) |
Health Insurance Coverage by Household Income in Greenwood
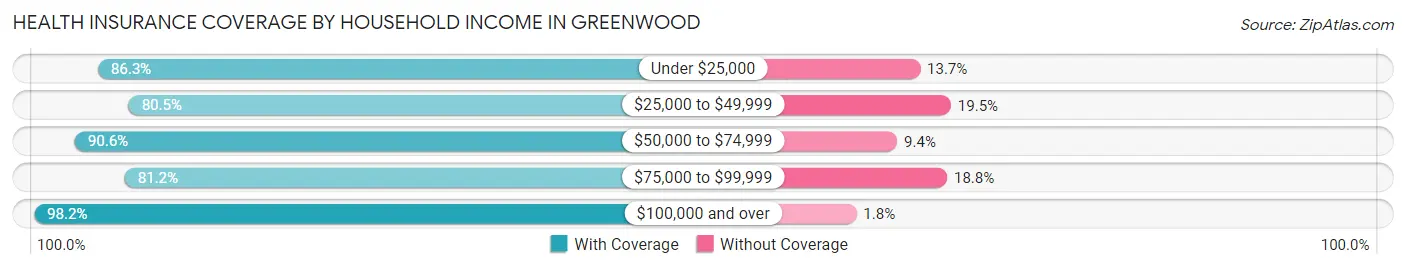
| Household Income | With Coverage | Without Coverage |
| Under $25,000 | 3,152 (86.3%) | 502 (13.7%) |
| $25,000 to $49,999 | 2,801 (80.5%) | 679 (19.5%) |
| $50,000 to $74,999 | 1,470 (90.6%) | 153 (9.4%) |
| $75,000 to $99,999 | 2,128 (81.2%) | 492 (18.8%) |
| $100,000 and over | 2,460 (98.2%) | 45 (1.8%) |
Public vs Private Health Insurance Coverage by Age in Greenwood
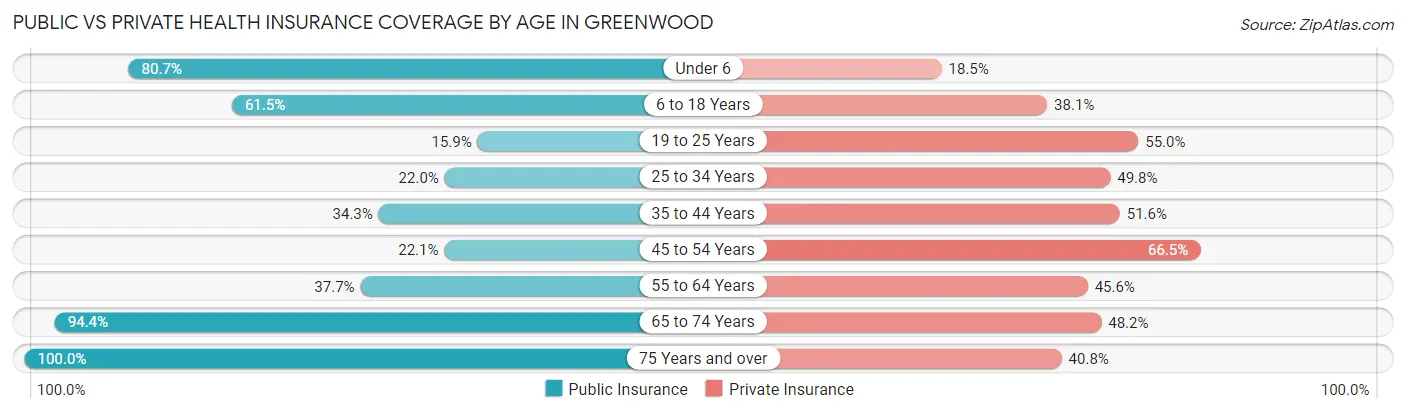
| Age Bracket | Public Insurance | Private Insurance |
| Under 6 | 1,232 (80.7%) | 283 (18.5%) |
| 6 to 18 Years | 1,615 (61.5%) | 1,001 (38.1%) |
| 19 to 25 Years | 171 (15.9%) | 591 (55.0%) |
| 25 to 34 Years | 389 (22.0%) | 880 (49.8%) |
| 35 to 44 Years | 537 (34.3%) | 808 (51.6%) |
| 45 to 54 Years | 318 (22.1%) | 957 (66.5%) |
| 55 to 64 Years | 648 (37.7%) | 785 (45.6%) |
| 65 to 74 Years | 1,262 (94.4%) | 644 (48.2%) |
| 75 Years and over | 843 (100.0%) | 344 (40.8%) |
| Total | 7,015 (50.5%) | 6,293 (45.3%) |
Disability Status by Sex by Age in Greenwood
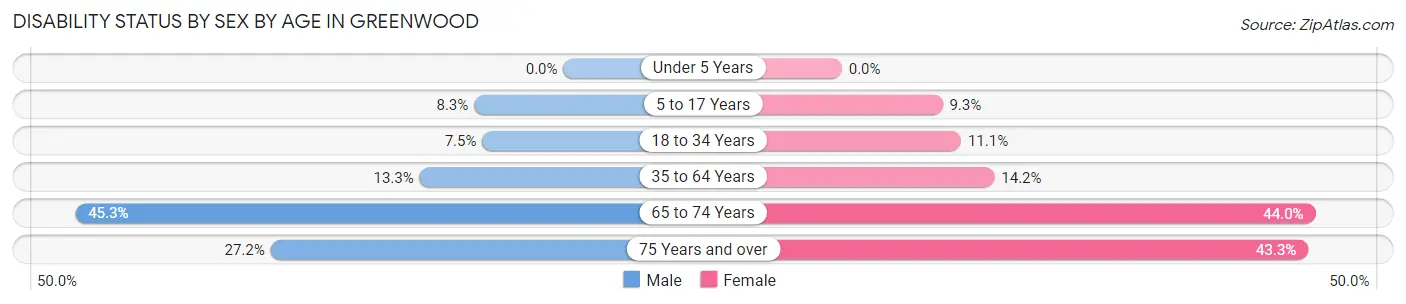
| Age Bracket | Male | Female |
| Under 5 Years | 0 (0.0%) | 0 (0.0%) |
| 5 to 17 Years | 112 (8.3%) | 134 (9.3%) |
| 18 to 34 Years | 95 (7.5%) | 192 (11.1%) |
| 35 to 64 Years | 275 (13.3%) | 377 (14.2%) |
| 65 to 74 Years | 246 (45.3%) | 349 (44.0%) |
| 75 Years and over | 47 (27.2%) | 290 (43.3%) |
Disability Class by Sex by Age in Greenwood
Disability Class: Hearing Difficulty
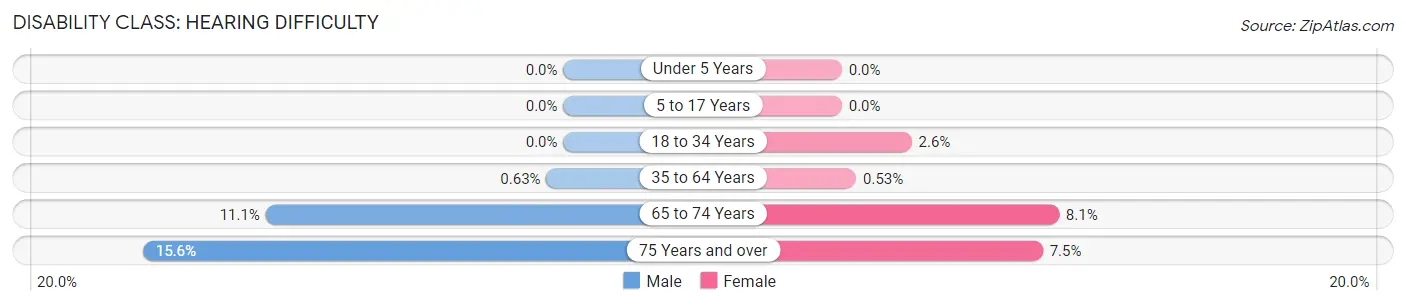
| Age Bracket | Male | Female |
| Under 5 Years | 0 (0.0%) | 0 (0.0%) |
| 5 to 17 Years | 0 (0.0%) | 0 (0.0%) |
| 18 to 34 Years | 0 (0.0%) | 45 (2.6%) |
| 35 to 64 Years | 13 (0.6%) | 14 (0.5%) |
| 65 to 74 Years | 60 (11.1%) | 64 (8.1%) |
| 75 Years and over | 27 (15.6%) | 50 (7.5%) |
Disability Class: Vision Difficulty
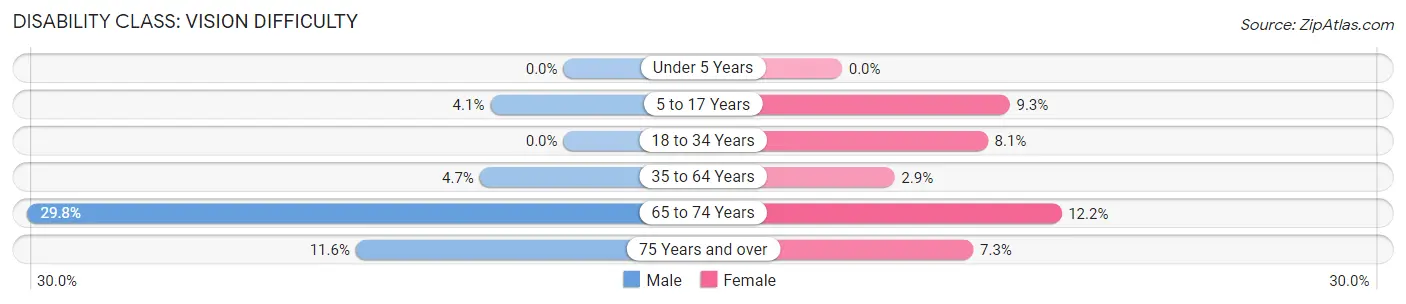
| Age Bracket | Male | Female |
| Under 5 Years | 0 (0.0%) | 0 (0.0%) |
| 5 to 17 Years | 55 (4.1%) | 134 (9.3%) |
| 18 to 34 Years | 0 (0.0%) | 141 (8.1%) |
| 35 to 64 Years | 96 (4.7%) | 78 (2.9%) |
| 65 to 74 Years | 162 (29.8%) | 97 (12.2%) |
| 75 Years and over | 20 (11.6%) | 49 (7.3%) |
Disability Class: Cognitive Difficulty
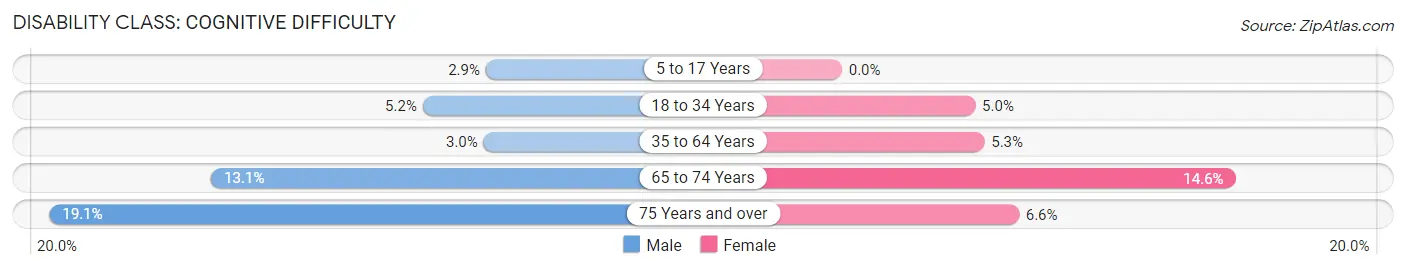
| Age Bracket | Male | Female |
| 5 to 17 Years | 39 (2.9%) | 0 (0.0%) |
| 18 to 34 Years | 66 (5.2%) | 86 (5.0%) |
| 35 to 64 Years | 61 (3.0%) | 141 (5.3%) |
| 65 to 74 Years | 71 (13.1%) | 116 (14.6%) |
| 75 Years and over | 33 (19.1%) | 44 (6.6%) |
Disability Class: Ambulatory Difficulty
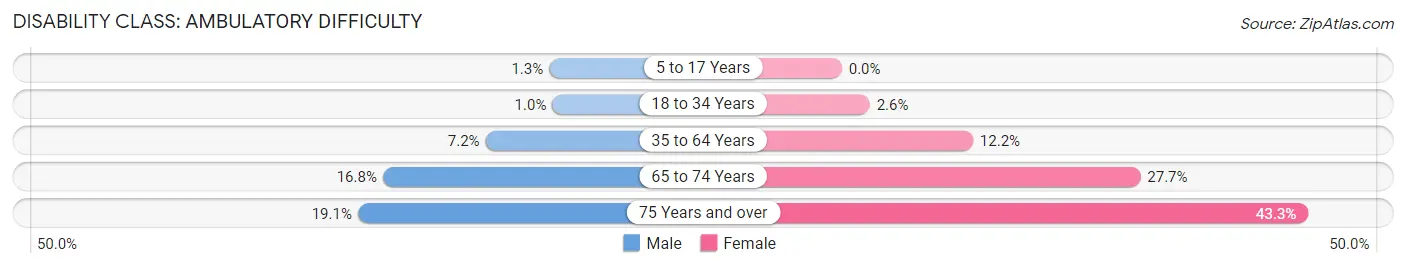
| Age Bracket | Male | Female |
| 5 to 17 Years | 18 (1.3%) | 0 (0.0%) |
| 18 to 34 Years | 13 (1.0%) | 45 (2.6%) |
| 35 to 64 Years | 149 (7.2%) | 324 (12.2%) |
| 65 to 74 Years | 91 (16.8%) | 220 (27.7%) |
| 75 Years and over | 33 (19.1%) | 290 (43.3%) |
Disability Class: Self-Care Difficulty
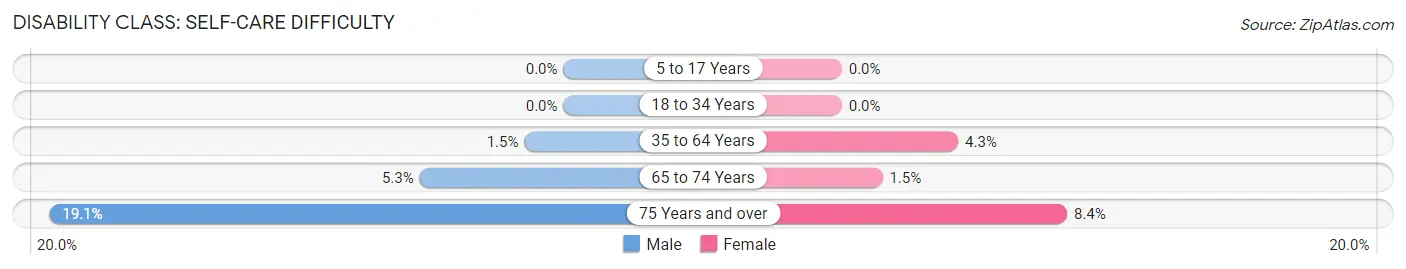
| Age Bracket | Male | Female |
| 5 to 17 Years | 0 (0.0%) | 0 (0.0%) |
| 18 to 34 Years | 0 (0.0%) | 0 (0.0%) |
| 35 to 64 Years | 30 (1.5%) | 115 (4.3%) |
| 65 to 74 Years | 29 (5.3%) | 12 (1.5%) |
| 75 Years and over | 33 (19.1%) | 56 (8.4%) |
Technology Access in Greenwood
Computing Device Access in Greenwood
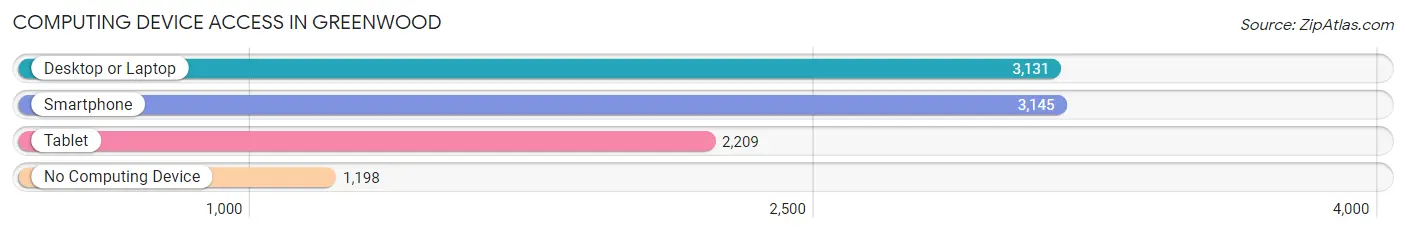
| Device Type | # Households | % Households |
| Desktop or Laptop | 3,131 | 61.4% |
| Smartphone | 3,145 | 61.7% |
| Tablet | 2,209 | 43.3% |
| No Computing Device | 1,198 | 23.5% |
| Total | 5,098 | 100.0% |
Internet Access in Greenwood
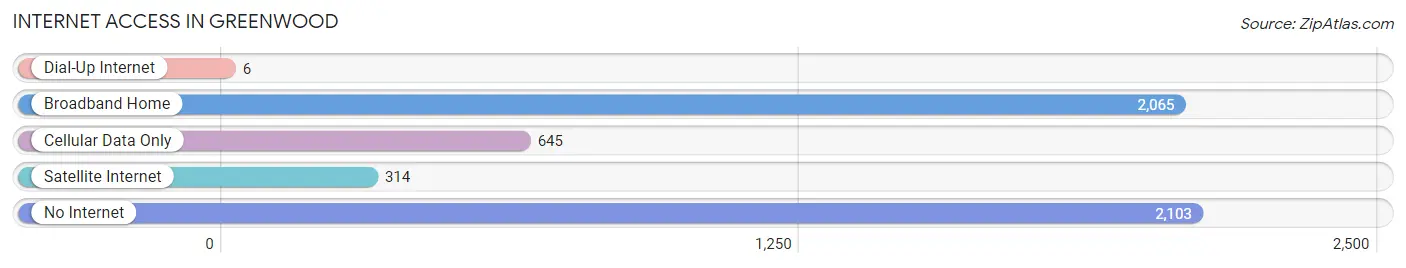
| Internet Type | # Households | % Households |
| Dial-Up Internet | 6 | 0.1% |
| Broadband Home | 2,065 | 40.5% |
| Cellular Data Only | 645 | 12.7% |
| Satellite Internet | 314 | 6.2% |
| No Internet | 2,103 | 41.2% |
| Total | 5,098 | 100.0% |
Greenwood Summary
Greenwood, Mississippi is a city located in the heart of the Mississippi Delta, in the northwestern part of the state. It is the county seat of Leflore County and is the principal city of the Greenwood, Mississippi Micropolitan Statistical Area. The city has a population of 15,205 as of the 2010 census, and is the second largest city in the Delta region.
Geography
Greenwood is located at 33°32'N 90°9'W (33.5333, -90.15). According to the United States Census Bureau, the city has a total area of 16.2 square miles (41.8 km2), of which 16.1 square miles (41.6 km2) is land and 0.1 square miles (0.2 km2) (0.62%) is water.
History
Greenwood was founded in 1844 by John Henry Moore, a planter from Virginia. The city was named after Greenwood County, South Carolina, where Moore had lived before moving to Mississippi. Greenwood was incorporated in 1856 and became the county seat of Leflore County in 1871.
The city was a major cotton producer in the late 19th and early 20th centuries, and was home to several cotton mills. The city was also a major railroad hub, with the Yazoo and Mississippi Valley Railroad running through the city.
In the early 20th century, Greenwood was a center of the blues music scene, with many famous blues musicians, such as Robert Johnson, Muddy Waters, and B.B. King, performing in the city.
Economy
Greenwood’s economy is largely based on agriculture and manufacturing. The city is home to several large agricultural operations, including Delta Pride Catfish, which is the largest catfish processor in the United States. The city is also home to several manufacturing companies, including Viking Range Corporation, which produces kitchen appliances, and Viking Range Corporation, which produces industrial equipment.
The city is also home to several retail stores including Walmart Lowe s and Target
Demographics
As of the 2010 census, there were 15,205 people, 5,845 households, and 3,845 families residing in the city. The population density was 941.2 people per square mile (362.7/km2). There were 6,521 housing units at an average density of 404.2 per square mile (156.1/km2). The racial makeup of the city was 57.2% African American, 40.2% White, 0.2% Native American, 0.7% Asian, 0.1% Pacific Islander, 0.7% from other races, and 0.9% from two or more races. Hispanic or Latino of any race were 1.7% of the population.
There were 5,845 households, out of which 32.2% had children under the age of 18 living with them, 33.2% were married couples living together, 28.2% had a female householder with no husband present, and 33.2% were non-families. 28.7% of all households were made up of individuals, and 11.2% had someone living alone who was 65 years of age or older. The average household size was 2.55 and the average family size was 3.14.
In the city, the population was spread out, with 28.2% under the age of 18, 9.7% from 18 to 24, 25.2% from 25 to 44, 22.2% from 45 to 64, and 14.7% who were 65 years of age or older. The median age was 35 years. For every 100 females, there were 84.2 males. For every 100 females age 18 and over, there were 78.2 males.
The median income for a household in the city was $25,921, and the median income for a family was $31,919. Males had a median income of $27,917 versus $20,945 for females. The per capita income for the city was $14,945. About 22.2% of families and 25.7% of the population were below the poverty line, including 36.2% of those under age 18 and 20.2% of those age 65 or over.
Common Questions
What is Per Capita Income in Greenwood?
Per Capita income in Greenwood is $28,641.
What is the Median Family Income in Greenwood?
Median Family Income in Greenwood is $48,239.
What is the Median Household income in Greenwood?
Median Household Income in Greenwood is $37,718.
What is Income or Wage Gap in Greenwood?
Income or Wage Gap in Greenwood is 11.2%.
Women in Greenwood earn 88.8 cents for every dollar earned by a man.
What is Family Income Deficit in Greenwood?
Family Income Deficit in Greenwood is $11,796.
Families that are below poverty line in Greenwood earn $11,796 less on average than the poverty threshold level.
What is Inequality or Gini Index in Greenwood?
Inequality or Gini Index in Greenwood is 0.61.
What is the Total Population of Greenwood?
Total Population of Greenwood is 14,242.
What is the Total Male Population of Greenwood?
Total Male Population of Greenwood is 6,240.
What is the Total Female Population of Greenwood?
Total Female Population of Greenwood is 8,002.
What is the Ratio of Males per 100 Females in Greenwood?
There are 77.98 Males per 100 Females in Greenwood.
What is the Ratio of Females per 100 Males in Greenwood?
There are 128.24 Females per 100 Males in Greenwood.
What is the Median Population Age in Greenwood?
Median Population Age in Greenwood is 35.2 Years.
What is the Average Family Size in Greenwood
Average Family Size in Greenwood is 4.0 People.
What is the Average Household Size in Greenwood
Average Household Size in Greenwood is 2.7 People.
How Large is the Labor Force in Greenwood?
There are 6,143 People in the Labor Forcein in Greenwood.
What is the Percentage of People in the Labor Force in Greenwood?
57.5% of People are in the Labor Force in Greenwood.
What is the Unemployment Rate in Greenwood?
Unemployment Rate in Greenwood is 7.9%.