Coldwater, MS Map & Demographics
Coldwater Map
Coldwater Overview
$27,257
PER CAPITA INCOME
$39,567
AVG FAMILY INCOME
$38,883
AVG HOUSEHOLD INCOME
39.7%
WAGE / INCOME GAP [ % ]
60.3¢/ $1
WAGE / INCOME GAP [ $ ]
0.51
INEQUALITY / GINI INDEX
1,237
TOTAL POPULATION
500
MALE POPULATION
737
FEMALE POPULATION
67.84
MALES / 100 FEMALES
147.40
FEMALES / 100 MALES
40.7
MEDIAN AGE
2.5
AVG FAMILY SIZE
2.2
AVG HOUSEHOLD SIZE
576
LABOR FORCE [ PEOPLE ]
57.9%
PERCENT IN LABOR FORCE
3.1%
UNEMPLOYMENT RATE
Coldwater Zip Codes
Coldwater Area Codes
Income in Coldwater
Income Overview in Coldwater
Per Capita Income in Coldwater is $27,257, while median incomes of families and households are $39,567 and $38,883 respectively.
| Characteristic | Number | Measure |
| Per Capita Income | 1,237 | $27,257 |
| Median Family Income | 404 | $39,567 |
| Mean Family Income | 404 | $70,033 |
| Median Household Income | 551 | $38,883 |
| Mean Household Income | 551 | $62,496 |
| Income Deficit | 404 | $0 |
| Wage / Income Gap (%) | 1,237 | 39.70% |
| Wage / Income Gap ($) | 1,237 | 60.30¢ per $1 |
| Gini / Inequality Index | 1,237 | 0.51 |
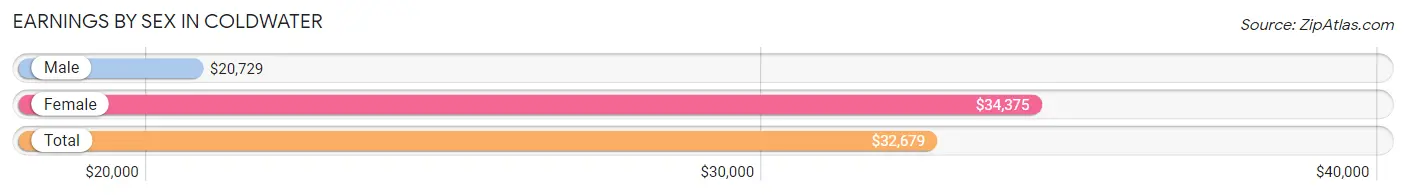
Earnings by Sex in Coldwater
Average Earnings in Coldwater are $32,679, $20,729 for men and $34,375 for women, a difference of 39.7%.
| Sex | Number | Average Earnings |
| Male | 285 (47.8%) | $20,729 |
| Female | 311 (52.2%) | $34,375 |
| Total | 596 (100.0%) | $32,679 |
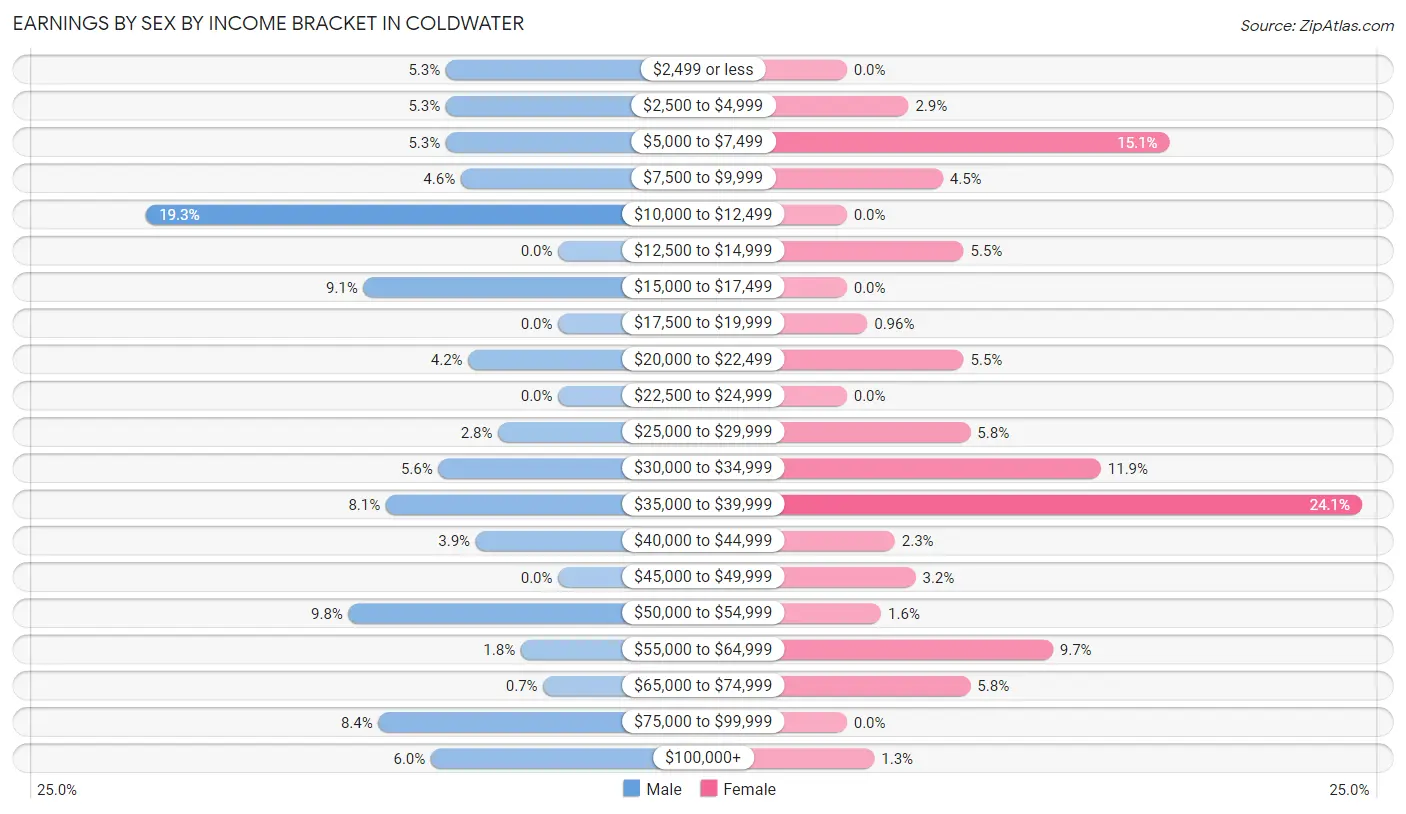
Earnings by Sex by Income Bracket in Coldwater
The most common earnings brackets in Coldwater are $10,000 to $12,499 for men (55 | 19.3%) and $35,000 to $39,999 for women (75 | 24.1%).
| Income | Male | Female |
| $2,499 or less | 15 (5.3%) | 0 (0.0%) |
| $2,500 to $4,999 | 15 (5.3%) | 9 (2.9%) |
| $5,000 to $7,499 | 15 (5.3%) | 47 (15.1%) |
| $7,500 to $9,999 | 13 (4.6%) | 14 (4.5%) |
| $10,000 to $12,499 | 55 (19.3%) | 0 (0.0%) |
| $12,500 to $14,999 | 0 (0.0%) | 17 (5.5%) |
| $15,000 to $17,499 | 26 (9.1%) | 0 (0.0%) |
| $17,500 to $19,999 | 0 (0.0%) | 3 (1.0%) |
| $20,000 to $22,499 | 12 (4.2%) | 17 (5.5%) |
| $22,500 to $24,999 | 0 (0.0%) | 0 (0.0%) |
| $25,000 to $29,999 | 8 (2.8%) | 18 (5.8%) |
| $30,000 to $34,999 | 16 (5.6%) | 37 (11.9%) |
| $35,000 to $39,999 | 23 (8.1%) | 75 (24.1%) |
| $40,000 to $44,999 | 11 (3.9%) | 7 (2.2%) |
| $45,000 to $49,999 | 0 (0.0%) | 10 (3.2%) |
| $50,000 to $54,999 | 28 (9.8%) | 5 (1.6%) |
| $55,000 to $64,999 | 5 (1.8%) | 30 (9.7%) |
| $65,000 to $74,999 | 2 (0.7%) | 18 (5.8%) |
| $75,000 to $99,999 | 24 (8.4%) | 0 (0.0%) |
| $100,000+ | 17 (6.0%) | 4 (1.3%) |
| Total | 285 (100.0%) | 311 (100.0%) |
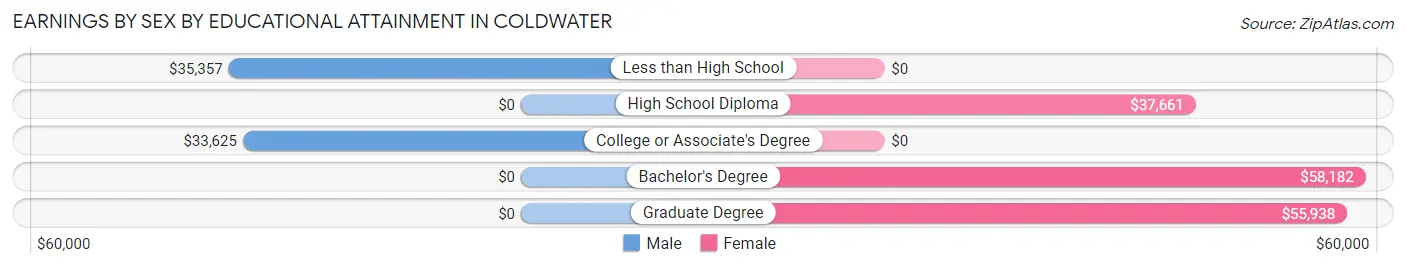
Earnings by Sex by Educational Attainment in Coldwater
Average earnings in Coldwater are $26,667 for men and $34,375 for women, a difference of 22.4%. Men with an educational attainment of less than high school enjoy the highest average annual earnings of $35,357, while those with college or associate's degree education earn the least with $33,625. Women with an educational attainment of bachelor's degree earn the most with the average annual earnings of $58,182, while those with high school diploma education have the smallest earnings of $37,661.
| Educational Attainment | Male Income | Female Income |
| Less than High School | $35,357 | $0 |
| High School Diploma | - | - |
| College or Associate's Degree | $33,625 | $0 |
| Bachelor's Degree | - | - |
| Graduate Degree | - | - |
| Total | $26,667 | $34,375 |
Family Income in Coldwater
Family Income Brackets in Coldwater
According to the Coldwater family income data, there are 121 families falling into the $35,000 to $49,999 income range, which is the most common income bracket and makes up 29.9% of all families. Conversely, the $150,000 to $199,999 income bracket is the least frequent group with only 10 families (2.5%) belonging to this category.
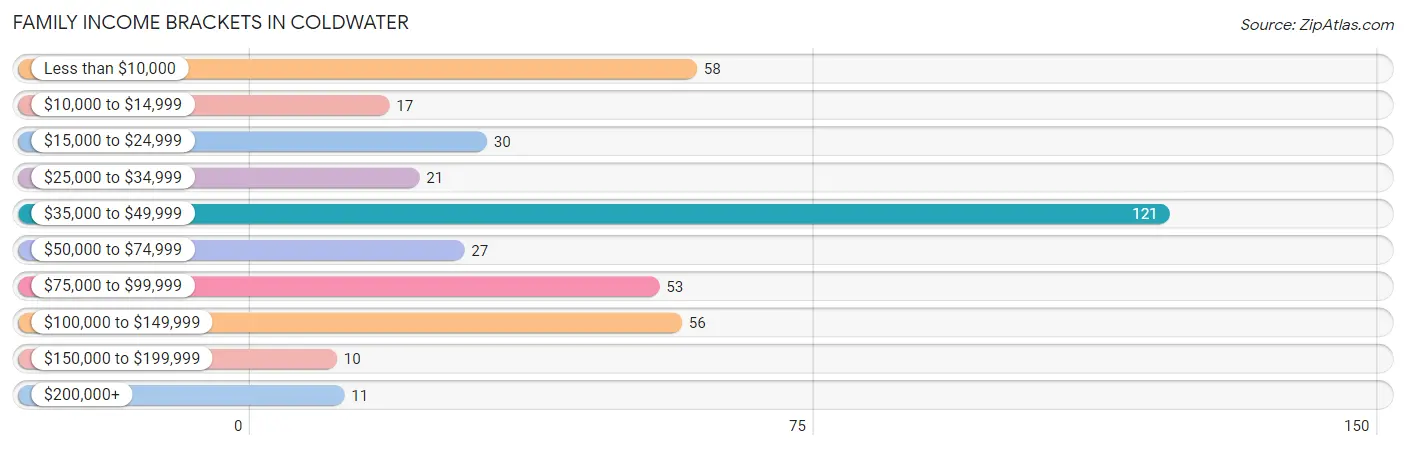
| Income Bracket | # Families | % Families |
| Less than $10,000 | 58 | 14.4% |
| $10,000 to $14,999 | 17 | 4.2% |
| $15,000 to $24,999 | 30 | 7.4% |
| $25,000 to $34,999 | 21 | 5.2% |
| $35,000 to $49,999 | 121 | 30.0% |
| $50,000 to $74,999 | 27 | 6.7% |
| $75,000 to $99,999 | 53 | 13.1% |
| $100,000 to $149,999 | 56 | 13.9% |
| $150,000 to $199,999 | 10 | 2.5% |
| $200,000+ | 11 | 2.7% |
Family Income by Famaliy Size in Coldwater
2-person families (183 | 45.3%) account for the highest median family income in Coldwater with $70,417 per family, while 2-person families (183 | 45.3%) have the highest median income of $35,208 per family member.
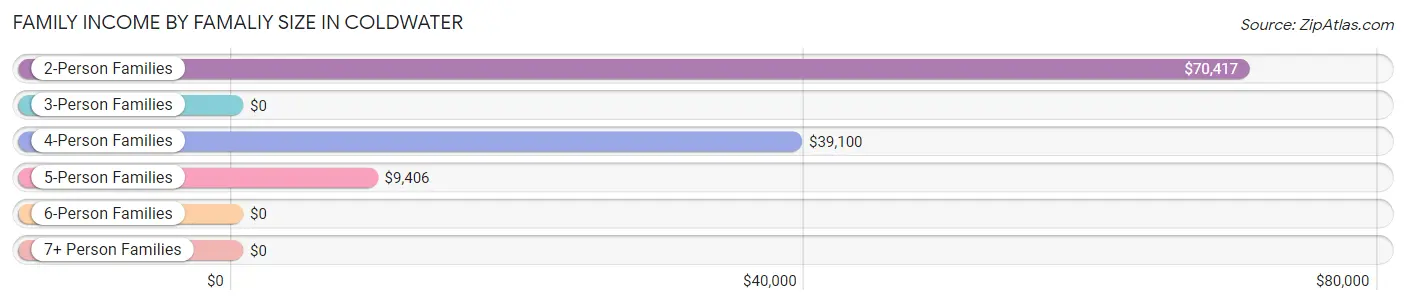
| Income Bracket | # Families | Median Income |
| 2-Person Families | 183 (45.3%) | $70,417 |
| 3-Person Families | 57 (14.1%) | $0 |
| 4-Person Families | 96 (23.8%) | $39,100 |
| 5-Person Families | 61 (15.1%) | $9,406 |
| 6-Person Families | 5 (1.2%) | $0 |
| 7+ Person Families | 2 (0.5%) | $0 |
| Total | 404 (100.0%) | $39,567 |
Family Income by Number of Earners in Coldwater
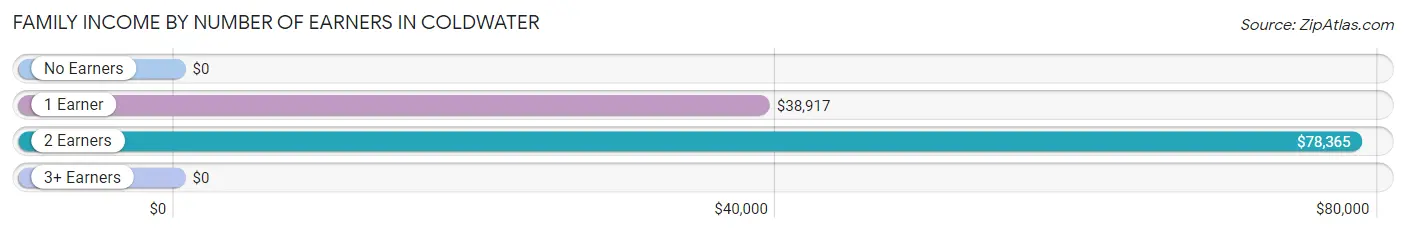
| Number of Earners | # Families | Median Income |
| No Earners | 52 (12.9%) | $0 |
| 1 Earner | 231 (57.2%) | $38,917 |
| 2 Earners | 109 (27.0%) | $78,365 |
| 3+ Earners | 12 (3.0%) | $0 |
| Total | 404 (100.0%) | $39,567 |
Household Income in Coldwater
Household Income Brackets in Coldwater
With 121 households falling in the category, the $35,000 to $49,999 income range is the most frequent in Coldwater, accounting for 22.0% of all households. In contrast, only 10 households (1.8%) fall into the $150,000 to $199,999 income bracket, making it the least populous group.
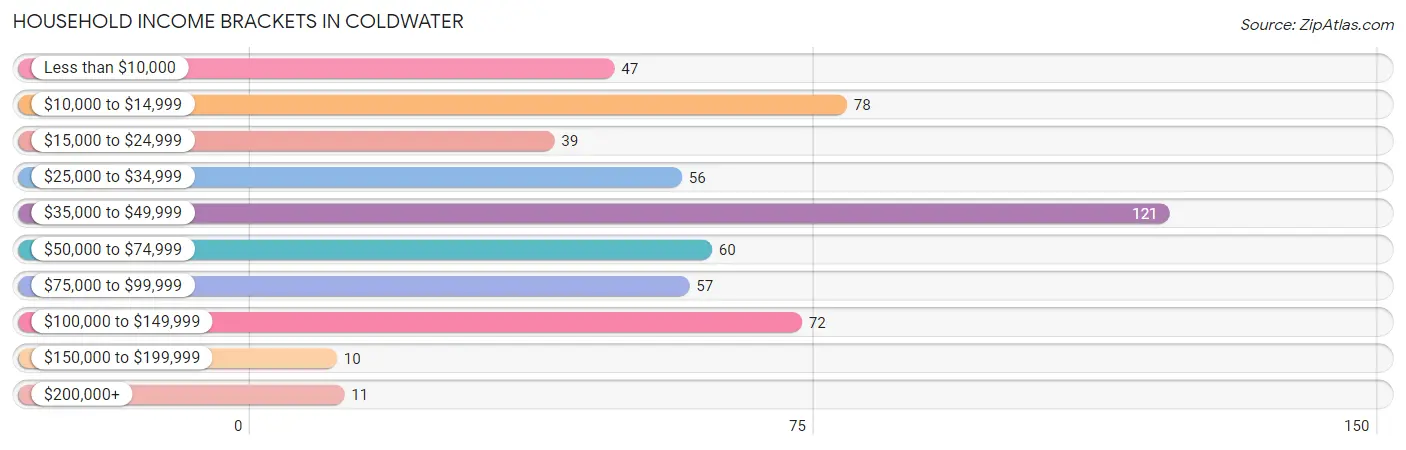
| Income Bracket | # Households | % Households |
| Less than $10,000 | 47 | 8.5% |
| $10,000 to $14,999 | 78 | 14.2% |
| $15,000 to $24,999 | 39 | 7.1% |
| $25,000 to $34,999 | 56 | 10.2% |
| $35,000 to $49,999 | 121 | 22.0% |
| $50,000 to $74,999 | 60 | 10.9% |
| $75,000 to $99,999 | 57 | 10.3% |
| $100,000 to $149,999 | 72 | 13.1% |
| $150,000 to $199,999 | 10 | 1.8% |
| $200,000+ | 11 | 2.0% |
Household Income by Householder Age in Coldwater
The median household income in Coldwater is $38,883, with the highest median household income of $78,750 found in the 45 to 64 years age bracket for the primary householder. A total of 192 households (34.8%) fall into this category. Meanwhile, the 15 to 24 years age bracket for the primary householder has the lowest median household income of $0, with 6 households (1.1%) in this group.
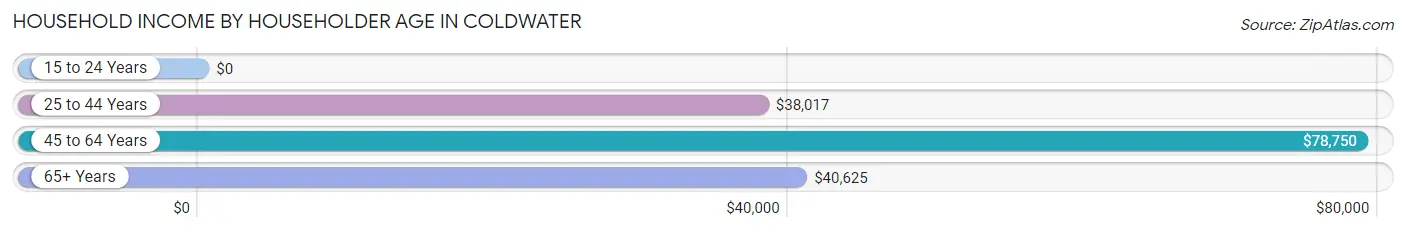
| Income Bracket | # Households | Median Income |
| 15 to 24 Years | 6 (1.1%) | $0 |
| 25 to 44 Years | 189 (34.3%) | $38,017 |
| 45 to 64 Years | 192 (34.8%) | $78,750 |
| 65+ Years | 164 (29.8%) | $40,625 |
| Total | 551 (100.0%) | $38,883 |
Poverty in Coldwater
Income Below Poverty by Sex and Age in Coldwater
With 28.2% poverty level for males and 36.2% for females among the residents of Coldwater, under 5 year old males and 5 year old females are the most vulnerable to poverty, with 40 males (70.2%) and 9 females (100.0%) in their respective age groups living below the poverty level.
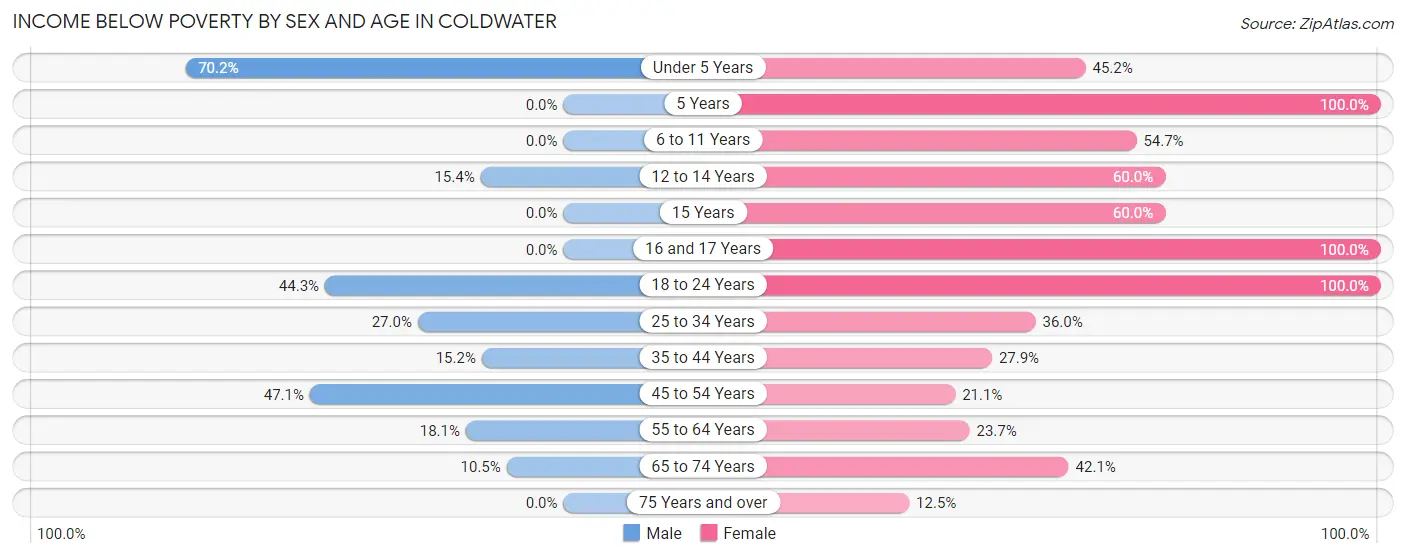
| Age Bracket | Male | Female |
| Under 5 Years | 40 (70.2%) | 19 (45.2%) |
| 5 Years | 0 (0.0%) | 9 (100.0%) |
| 6 to 11 Years | 0 (0.0%) | 35 (54.7%) |
| 12 to 14 Years | 6 (15.4%) | 9 (60.0%) |
| 15 Years | 0 (0.0%) | 3 (60.0%) |
| 16 and 17 Years | 0 (0.0%) | 3 (100.0%) |
| 18 to 24 Years | 27 (44.3%) | 20 (100.0%) |
| 25 to 34 Years | 10 (27.0%) | 64 (36.0%) |
| 35 to 44 Years | 5 (15.1%) | 17 (27.9%) |
| 45 to 54 Years | 24 (47.1%) | 16 (21.0%) |
| 55 to 64 Years | 23 (18.1%) | 23 (23.7%) |
| 65 to 74 Years | 6 (10.5%) | 40 (42.1%) |
| 75 Years and over | 0 (0.0%) | 9 (12.5%) |
| Total | 141 (28.2%) | 267 (36.2%) |
Income Above Poverty by Sex and Age in Coldwater
According to the poverty statistics in Coldwater, males aged 6 to 11 years and females aged 75 years and over are the age groups that are most secure financially, with 100.0% of males and 87.5% of females in these age groups living above the poverty line.
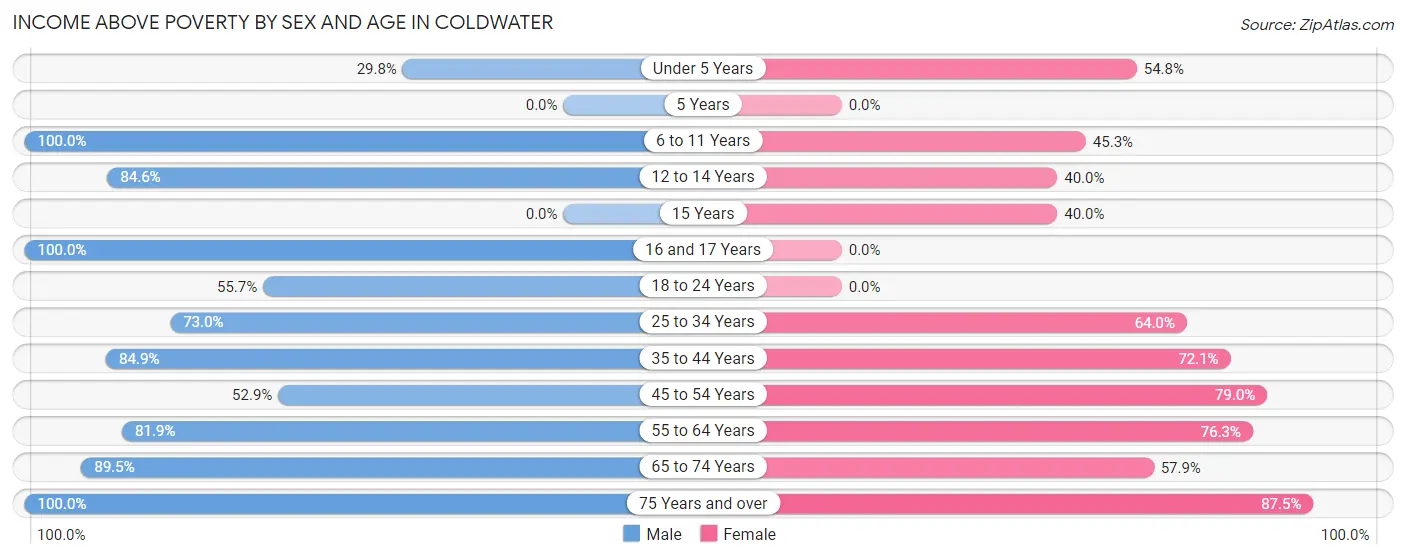
| Age Bracket | Male | Female |
| Under 5 Years | 17 (29.8%) | 23 (54.8%) |
| 5 Years | 0 (0.0%) | 0 (0.0%) |
| 6 to 11 Years | 12 (100.0%) | 29 (45.3%) |
| 12 to 14 Years | 33 (84.6%) | 6 (40.0%) |
| 15 Years | 0 (0.0%) | 2 (40.0%) |
| 16 and 17 Years | 13 (100.0%) | 0 (0.0%) |
| 18 to 24 Years | 34 (55.7%) | 0 (0.0%) |
| 25 to 34 Years | 27 (73.0%) | 114 (64.0%) |
| 35 to 44 Years | 28 (84.9%) | 44 (72.1%) |
| 45 to 54 Years | 27 (52.9%) | 60 (78.9%) |
| 55 to 64 Years | 104 (81.9%) | 74 (76.3%) |
| 65 to 74 Years | 51 (89.5%) | 55 (57.9%) |
| 75 Years and over | 13 (100.0%) | 63 (87.5%) |
| Total | 359 (71.8%) | 470 (63.8%) |
Income Below Poverty Among Married-Couple Families in Coldwater
The poverty statistics for married-couple families in Coldwater show that 11.8% or 20 of the total 170 families live below the poverty line. Families with 3 or 4 children have the highest poverty rate of 100.0%, comprising of 13 families. On the other hand, families with no children have the lowest poverty rate of 0.0%, which includes 0 families.
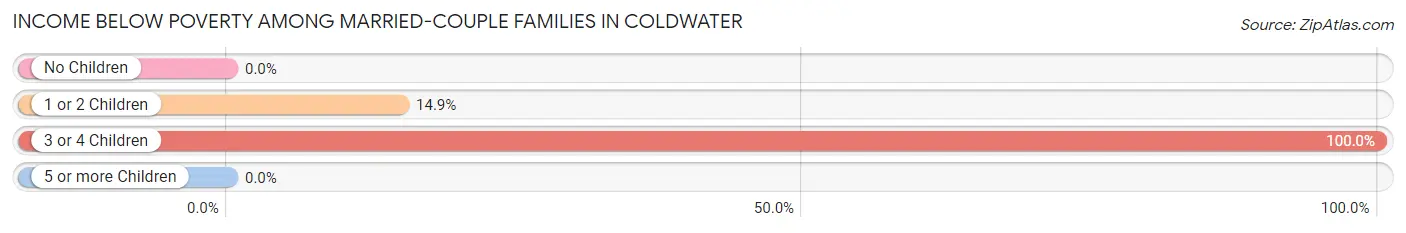
| Children | Above Poverty | Below Poverty |
| No Children | 108 (100.0%) | 0 (0.0%) |
| 1 or 2 Children | 40 (85.1%) | 7 (14.9%) |
| 3 or 4 Children | 0 (0.0%) | 13 (100.0%) |
| 5 or more Children | 2 (100.0%) | 0 (0.0%) |
| Total | 150 (88.2%) | 20 (11.8%) |
Income Below Poverty Among Single-Parent Households in Coldwater
According to the poverty data in Coldwater, 100.0% or 6 single-father households and 32.0% or 73 single-mother households are living below the poverty line. Among single-father households, those with 1 or 2 children have the highest poverty rate, with 6 households (100.0%) experiencing poverty. Likewise, among single-mother households, those with 5 or more children have the highest poverty rate, with 5 households (100.0%) falling below the poverty line.
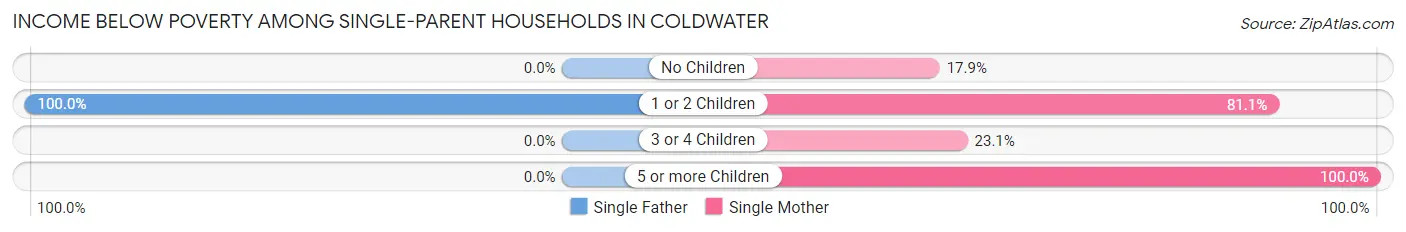
| Children | Single Father | Single Mother |
| No Children | 0 (0.0%) | 17 (17.9%) |
| 1 or 2 Children | 6 (100.0%) | 30 (81.1%) |
| 3 or 4 Children | 0 (0.0%) | 21 (23.1%) |
| 5 or more Children | 0 (0.0%) | 5 (100.0%) |
| Total | 6 (100.0%) | 73 (32.0%) |
Income Below Poverty Among Married-Couple vs Single-Parent Households in Coldwater
The poverty data for Coldwater shows that 20 of the married-couple family households (11.8%) and 79 of the single-parent households (33.8%) are living below the poverty level. Within the married-couple family households, those with 3 or 4 children have the highest poverty rate, with 13 households (100.0%) falling below the poverty line. Among the single-parent households, those with 5 or more children have the highest poverty rate, with 5 household (100.0%) living below poverty.
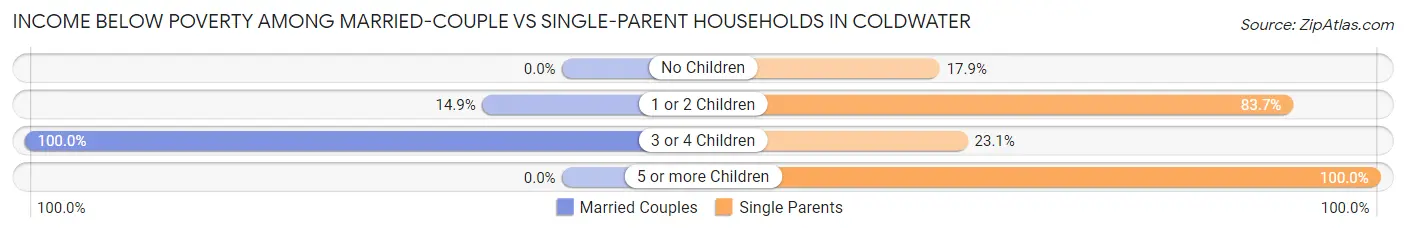
| Children | Married-Couple Families | Single-Parent Households |
| No Children | 0 (0.0%) | 17 (17.9%) |
| 1 or 2 Children | 7 (14.9%) | 36 (83.7%) |
| 3 or 4 Children | 13 (100.0%) | 21 (23.1%) |
| 5 or more Children | 0 (0.0%) | 5 (100.0%) |
| Total | 20 (11.8%) | 79 (33.8%) |
Race in Coldwater
The most populous races in Coldwater are Black / African American (949 | 76.7%), White / Caucasian (220 | 17.8%), and Some other Race (49 | 4.0%).
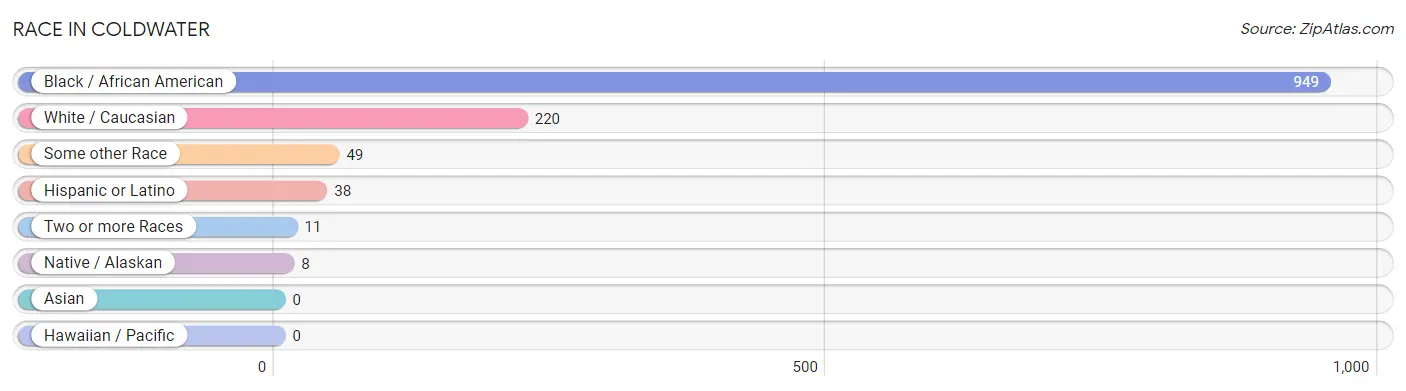
| Race | # Population | % Population |
| Asian | 0 | 0.0% |
| Black / African American | 949 | 76.7% |
| Hawaiian / Pacific | 0 | 0.0% |
| Hispanic or Latino | 38 | 3.1% |
| Native / Alaskan | 8 | 0.6% |
| White / Caucasian | 220 | 17.8% |
| Two or more Races | 11 | 0.9% |
| Some other Race | 49 | 4.0% |
| Total | 1,237 | 100.0% |
Ancestry in Coldwater
The most populous ancestries reported in Coldwater are French (50 | 4.0%), Dutch (39 | 3.2%), Mexican (38 | 3.1%), American (29 | 2.3%), and Irish (22 | 1.8%), together accounting for 14.4% of all Coldwater residents.
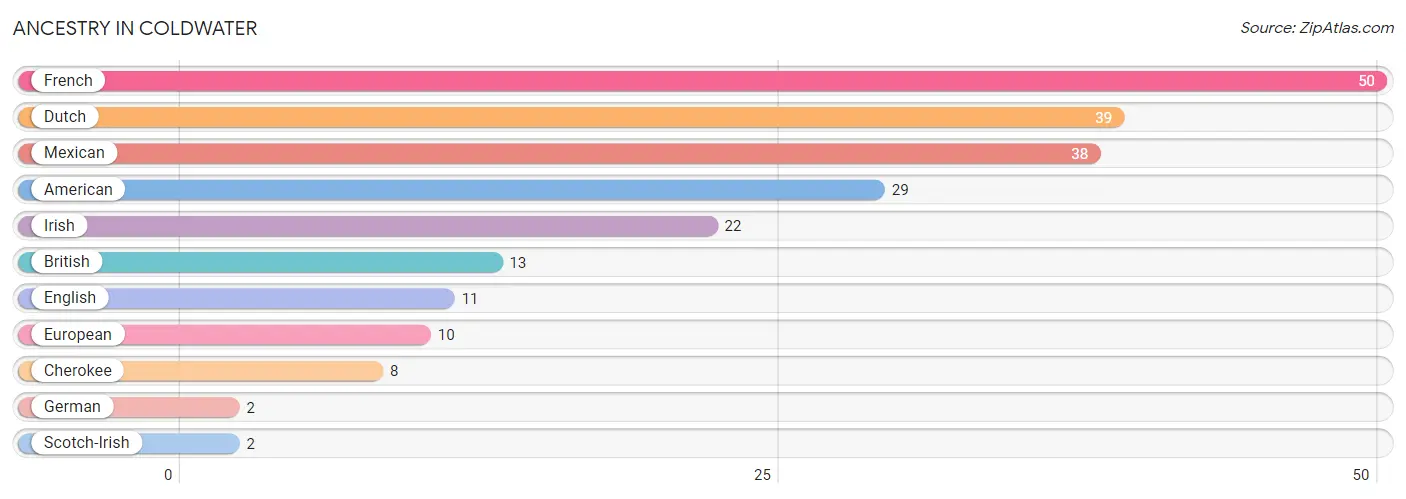
| Ancestry | # Population | % Population |
| American | 29 | 2.3% |
| British | 13 | 1.1% |
| Cherokee | 8 | 0.6% |
| Dutch | 39 | 3.2% |
| English | 11 | 0.9% |
| European | 10 | 0.8% |
| French | 50 | 4.0% |
| German | 2 | 0.2% |
| Irish | 22 | 1.8% |
| Mexican | 38 | 3.1% |
| Scotch-Irish | 2 | 0.2% | View All 11 Rows |
Immigrants in Coldwater
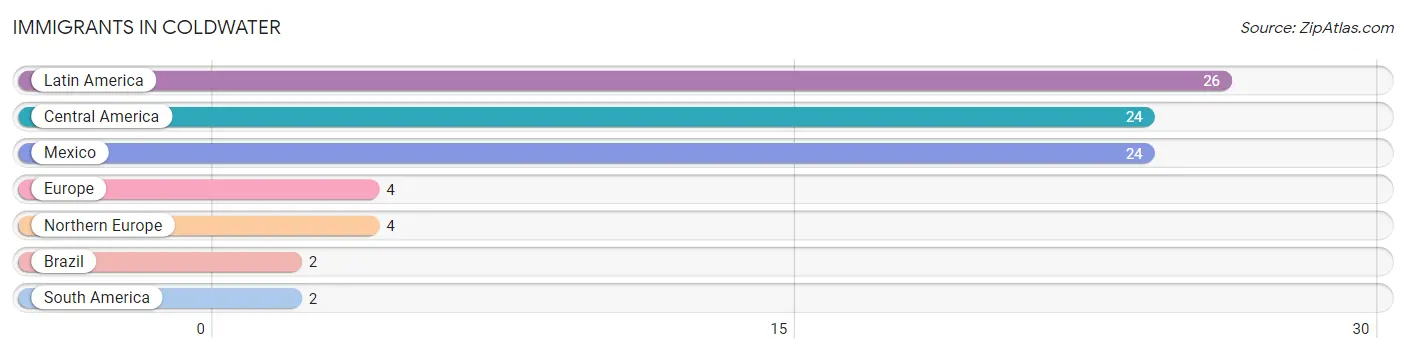
The most numerous immigrant groups reported in Coldwater came from Latin America (26 | 2.1%), Central America (24 | 1.9%), Mexico (24 | 1.9%), Europe (4 | 0.3%), and Northern Europe (4 | 0.3%), together accounting for 6.6% of all Coldwater residents.
| Immigration Origin | # Population | % Population |
| Brazil | 2 | 0.2% |
| Central America | 24 | 1.9% |
| Europe | 4 | 0.3% |
| Latin America | 26 | 2.1% |
| Mexico | 24 | 1.9% |
| Northern Europe | 4 | 0.3% |
| South America | 2 | 0.2% | View All 7 Rows |
Sex and Age in Coldwater
Sex and Age in Coldwater
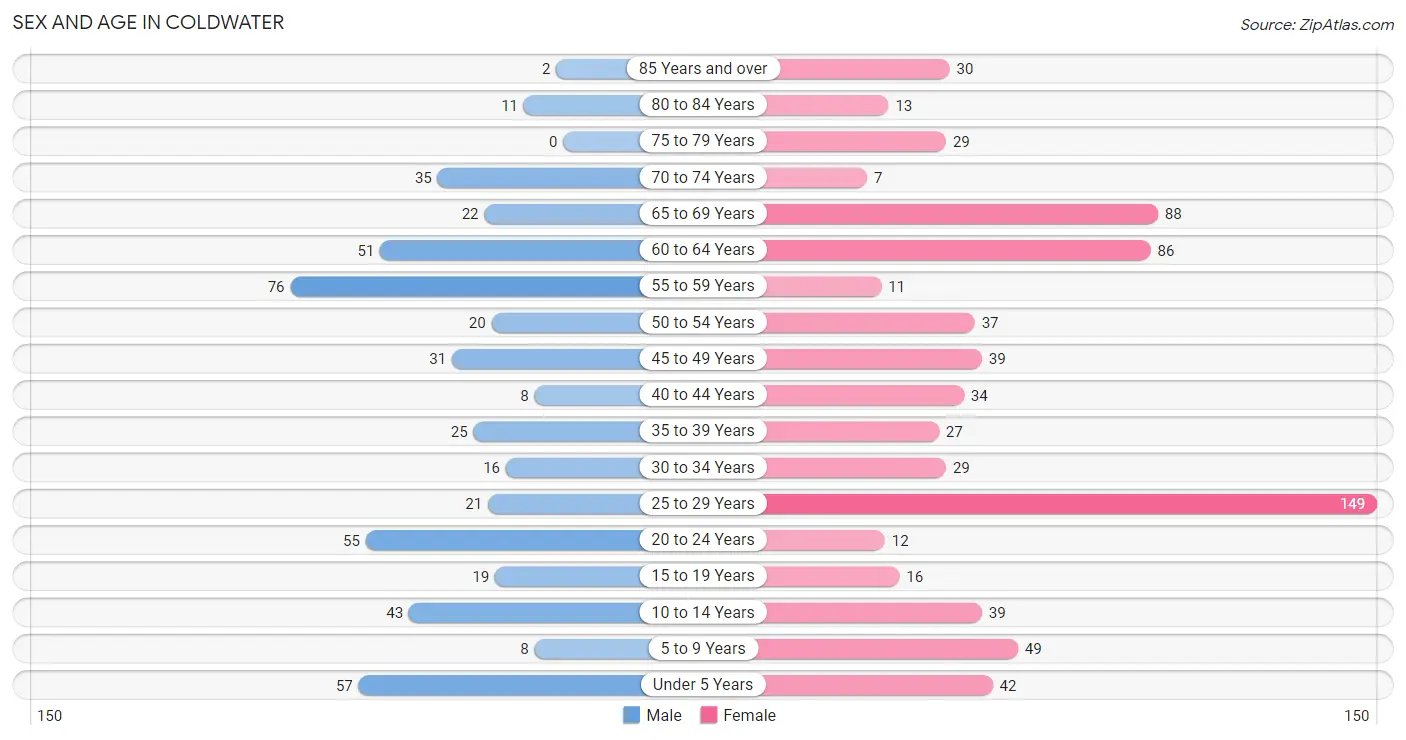
The most populous age groups in Coldwater are 55 to 59 Years (76 | 15.2%) for men and 25 to 29 Years (149 | 20.2%) for women.
| Age Bracket | Male | Female |
| Under 5 Years | 57 (11.4%) | 42 (5.7%) |
| 5 to 9 Years | 8 (1.6%) | 49 (6.7%) |
| 10 to 14 Years | 43 (8.6%) | 39 (5.3%) |
| 15 to 19 Years | 19 (3.8%) | 16 (2.2%) |
| 20 to 24 Years | 55 (11.0%) | 12 (1.6%) |
| 25 to 29 Years | 21 (4.2%) | 149 (20.2%) |
| 30 to 34 Years | 16 (3.2%) | 29 (3.9%) |
| 35 to 39 Years | 25 (5.0%) | 27 (3.7%) |
| 40 to 44 Years | 8 (1.6%) | 34 (4.6%) |
| 45 to 49 Years | 31 (6.2%) | 39 (5.3%) |
| 50 to 54 Years | 20 (4.0%) | 37 (5.0%) |
| 55 to 59 Years | 76 (15.2%) | 11 (1.5%) |
| 60 to 64 Years | 51 (10.2%) | 86 (11.7%) |
| 65 to 69 Years | 22 (4.4%) | 88 (11.9%) |
| 70 to 74 Years | 35 (7.0%) | 7 (0.9%) |
| 75 to 79 Years | 0 (0.0%) | 29 (3.9%) |
| 80 to 84 Years | 11 (2.2%) | 13 (1.8%) |
| 85 Years and over | 2 (0.4%) | 30 (4.1%) |
| Total | 500 (100.0%) | 737 (100.0%) |
Families and Households in Coldwater
Median Family Size in Coldwater
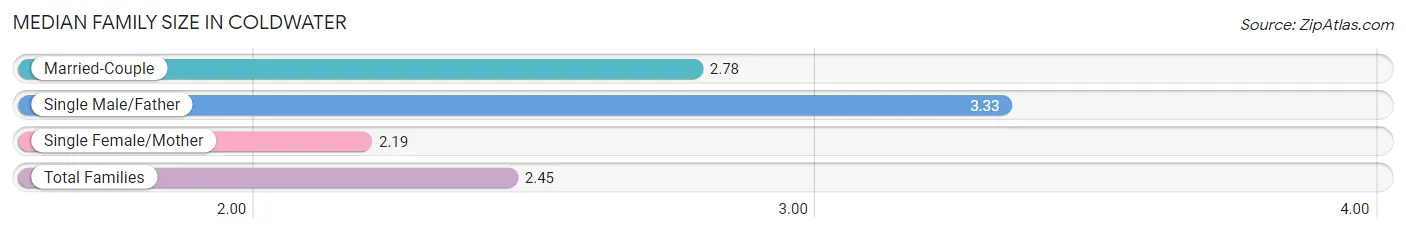
The median family size in Coldwater is 2.45 persons per family, with single male/father families (6 | 1.5%) accounting for the largest median family size of 3.33 persons per family. On the other hand, single female/mother families (228 | 56.4%) represent the smallest median family size with 2.19 persons per family.
| Family Type | # Families | Family Size |
| Married-Couple | 170 (42.1%) | 2.78 |
| Single Male/Father | 6 (1.5%) | 3.33 |
| Single Female/Mother | 228 (56.4%) | 2.19 |
| Total Families | 404 (100.0%) | 2.45 |
Median Household Size in Coldwater
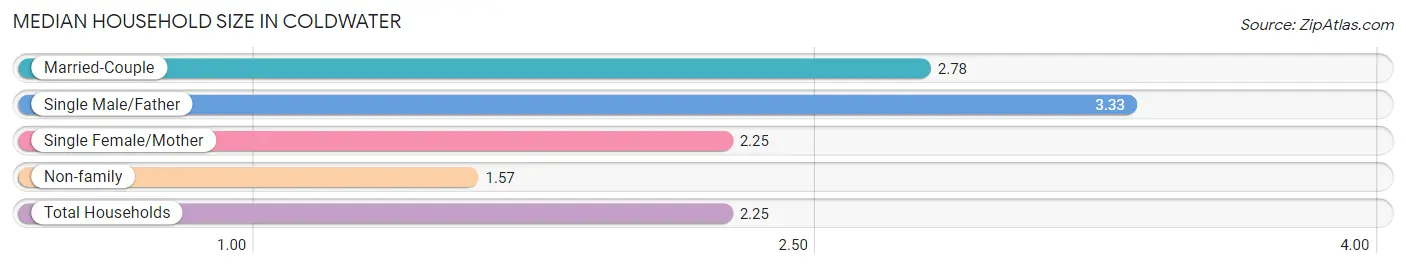
The median household size in Coldwater is 2.25 persons per household, with single male/father households (6 | 1.1%) accounting for the largest median household size of 3.33 persons per household. non-family households (147 | 26.7%) represent the smallest median household size with 1.57 persons per household.
| Household Type | # Households | Household Size |
| Married-Couple | 170 (30.8%) | 2.78 |
| Single Male/Father | 6 (1.1%) | 3.33 |
| Single Female/Mother | 228 (41.4%) | 2.25 |
| Non-family | 147 (26.7%) | 1.57 |
| Total Households | 551 (100.0%) | 2.25 |
Household Size by Marriage Status in Coldwater
Out of a total of 551 households in Coldwater, 404 (73.3%) are family households, while 147 (26.7%) are nonfamily households. The most numerous type of family households are 2-person households, comprising 183, and the most common type of nonfamily households are 1-person households, comprising 103.
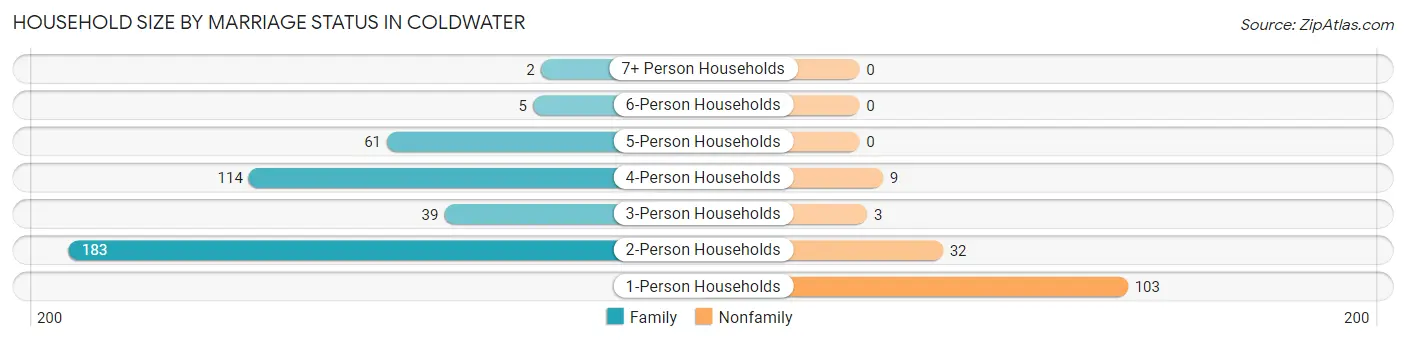
| Household Size | Family Households | Nonfamily Households |
| 1-Person Households | - | 103 (18.7%) |
| 2-Person Households | 183 (33.2%) | 32 (5.8%) |
| 3-Person Households | 39 (7.1%) | 3 (0.5%) |
| 4-Person Households | 114 (20.7%) | 9 (1.6%) |
| 5-Person Households | 61 (11.1%) | 0 (0.0%) |
| 6-Person Households | 5 (0.9%) | 0 (0.0%) |
| 7+ Person Households | 2 (0.4%) | 0 (0.0%) |
| Total | 404 (73.3%) | 147 (26.7%) |
Female Fertility in Coldwater
Fertility by Age in Coldwater
Average fertility rate in Coldwater is 13.0 births per 1,000 women. Women in the age bracket of 20 to 34 years have the highest fertility rate with 21.0 births per 1,000 women. Women in the age bracket of 20 to 34 years acount for 100.0% of all women with births.
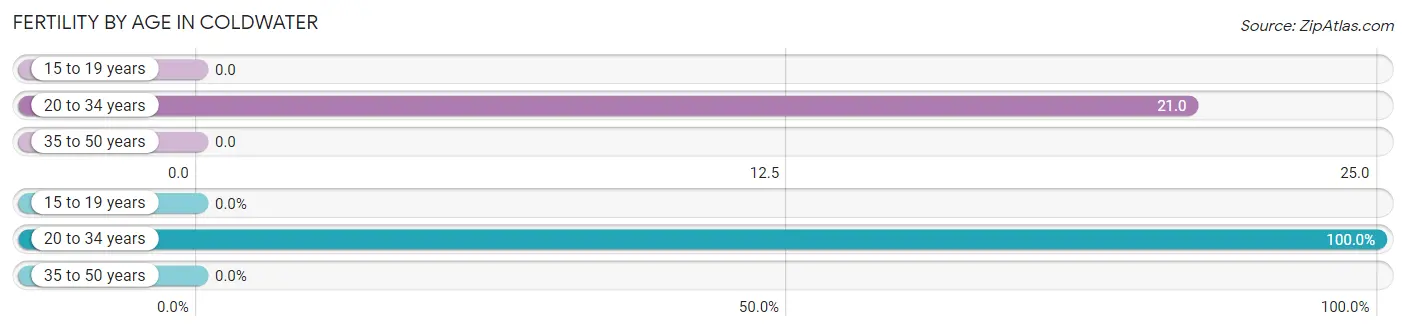
| Age Bracket | Women with Births | Births / 1,000 Women |
| 15 to 19 years | 0 (0.0%) | 0.0 |
| 20 to 34 years | 4 (100.0%) | 21.0 |
| 35 to 50 years | 0 (0.0%) | 0.0 |
| Total | 4 (100.0%) | 13.0 |
Fertility by Age by Marriage Status in Coldwater
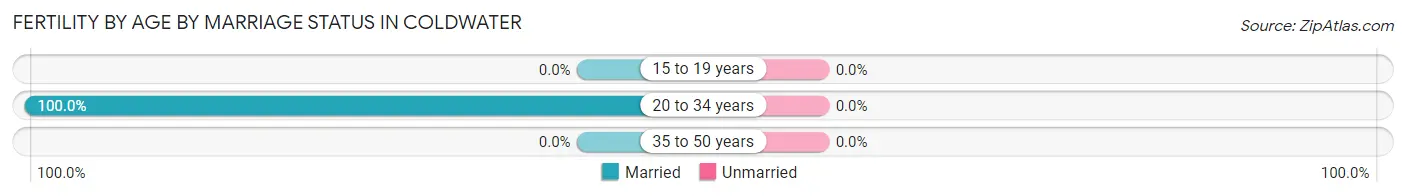
| Age Bracket | Married | Unmarried |
| 15 to 19 years | 0 (0.0%) | 0 (0.0%) |
| 20 to 34 years | 4 (100.0%) | 0 (0.0%) |
| 35 to 50 years | 0 (0.0%) | 0 (0.0%) |
| Total | 4 (100.0%) | 0 (0.0%) |
Fertility by Education in Coldwater
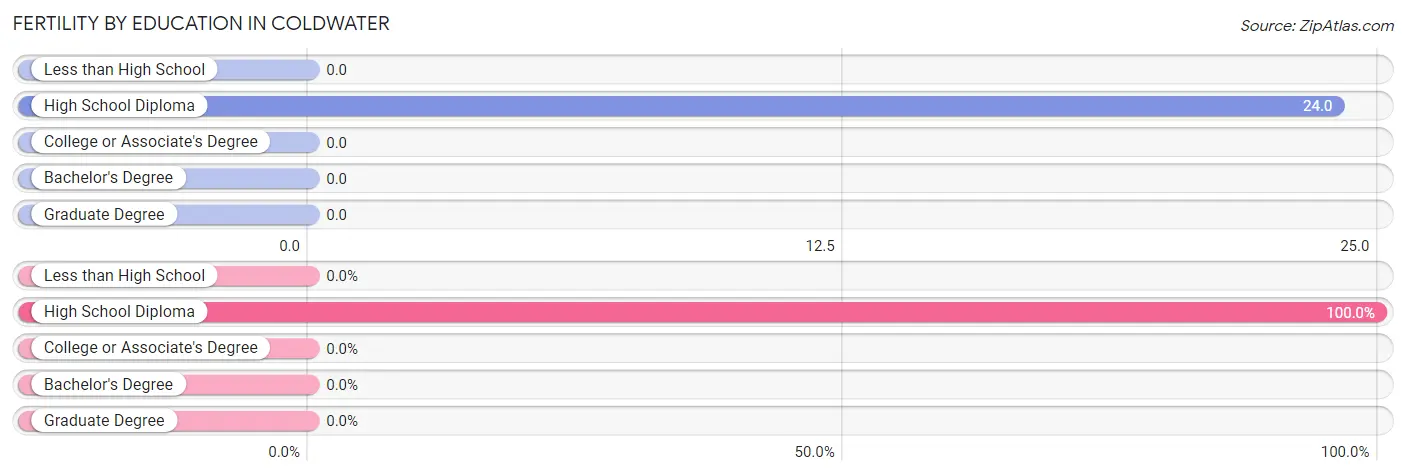
| Educational Attainment | Women with Births | Births / 1,000 Women |
| Less than High School | 0 (0.0%) | 0.0 |
| High School Diploma | 4 (100.0%) | 24.0 |
| College or Associate's Degree | 0 (0.0%) | 0.0 |
| Bachelor's Degree | 0 (0.0%) | 0.0 |
| Graduate Degree | 0 (0.0%) | 0.0 |
| Total | 4 (100.0%) | 13.0 |
Fertility by Education by Marriage Status in Coldwater
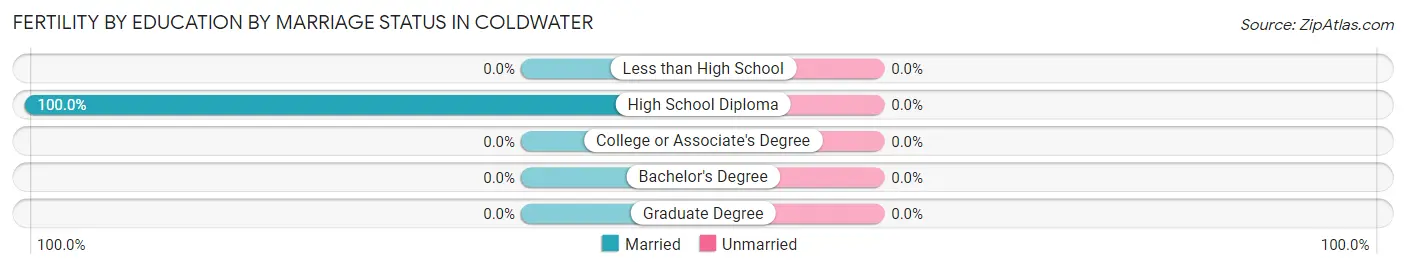
| Educational Attainment | Married | Unmarried |
| Less than High School | 0 (0.0%) | 0 (0.0%) |
| High School Diploma | 4 (100.0%) | 0 (0.0%) |
| College or Associate's Degree | 0 (0.0%) | 0 (0.0%) |
| Bachelor's Degree | 0 (0.0%) | 0 (0.0%) |
| Graduate Degree | 0 (0.0%) | 0 (0.0%) |
| Total | 4 (100.0%) | 0 (0.0%) |
Employment Characteristics in Coldwater
Employment by Class of Employer in Coldwater
Among the 546 employed individuals in Coldwater, private company employees (436 | 79.8%), state government employees (29 | 5.3%), and self-employed (not incorporated) (27 | 5.0%) make up the most common classes of employment.
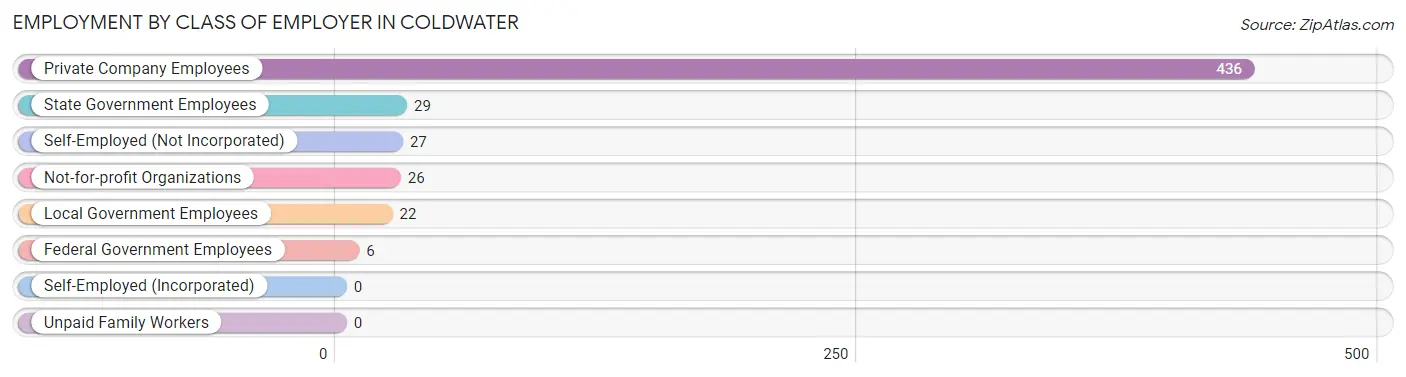
| Employer Class | # Employees | % Employees |
| Private Company Employees | 436 | 79.8% |
| Self-Employed (Incorporated) | 0 | 0.0% |
| Self-Employed (Not Incorporated) | 27 | 5.0% |
| Not-for-profit Organizations | 26 | 4.8% |
| Local Government Employees | 22 | 4.0% |
| State Government Employees | 29 | 5.3% |
| Federal Government Employees | 6 | 1.1% |
| Unpaid Family Workers | 0 | 0.0% |
| Total | 546 | 100.0% |
Employment Status by Age in Coldwater
According to the labor force statistics for Coldwater, out of the total population over 16 years of age (994), 57.9% or 576 individuals are in the labor force, with 3.1% or 18 of them unemployed. The age group with the highest labor force participation rate is 25 to 29 years, with 87.6% or 149 individuals in the labor force. Within the labor force, the 45 to 54 years age range has the highest percentage of unemployed individuals, with 7.2% or 8 of them being unemployed.
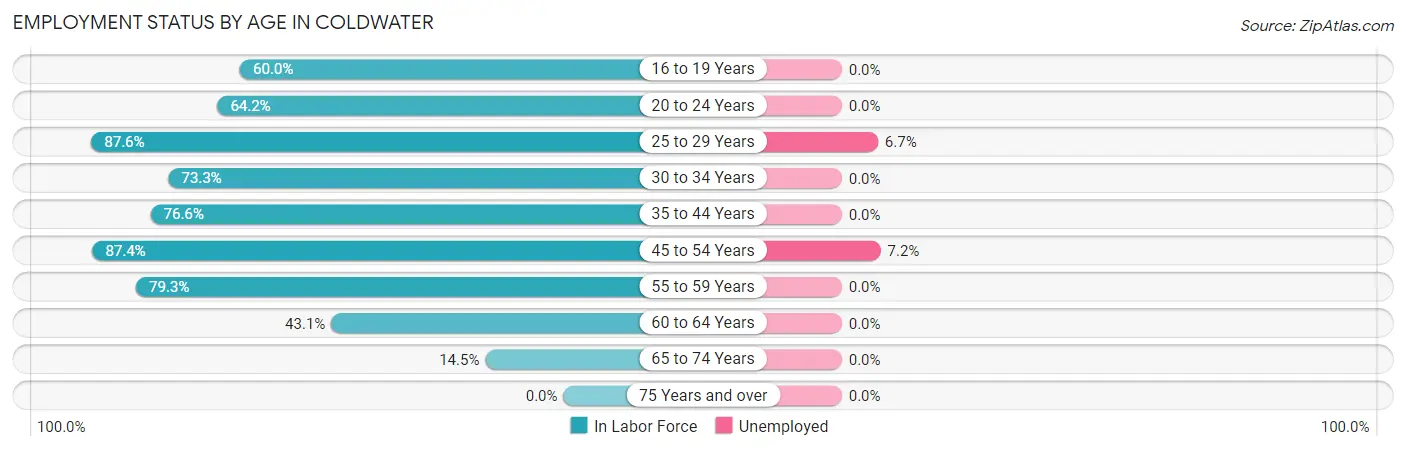
| Age Bracket | In Labor Force | Unemployed |
| 16 to 19 Years | 18 (60.0%) | 0 (0.0%) |
| 20 to 24 Years | 43 (64.2%) | 0 (0.0%) |
| 25 to 29 Years | 149 (87.6%) | 10 (6.7%) |
| 30 to 34 Years | 33 (73.3%) | 0 (0.0%) |
| 35 to 44 Years | 72 (76.6%) | 0 (0.0%) |
| 45 to 54 Years | 111 (87.4%) | 8 (7.2%) |
| 55 to 59 Years | 69 (79.3%) | 0 (0.0%) |
| 60 to 64 Years | 59 (43.1%) | 0 (0.0%) |
| 65 to 74 Years | 22 (14.5%) | 0 (0.0%) |
| 75 Years and over | 0 (0.0%) | 0 (0.0%) |
| Total | 576 (57.9%) | 18 (3.1%) |
Employment Status by Educational Attainment in Coldwater
According to labor force statistics for Coldwater, 74.7% of individuals (493) out of the total population between 25 and 64 years of age (660) are in the labor force, with 3.7% or 18 of them being unemployed. The group with the highest labor force participation rate are those with the educational attainment of high school diploma, with 79.7% or 310 individuals in the labor force. Within the labor force, individuals with high school diploma education have the highest percentage of unemployment, with 5.8% or 18 of them being unemployed.
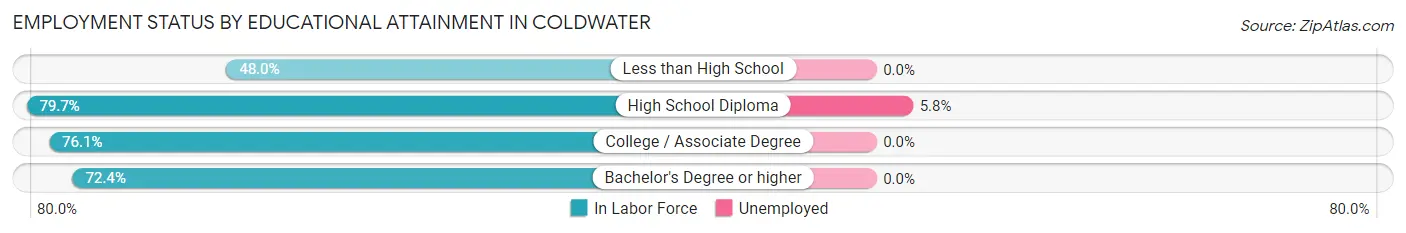
| Educational Attainment | In Labor Force | Unemployed |
| Less than High School | 36 (48.0%) | 0 (0.0%) |
| High School Diploma | 310 (79.7%) | 23 (5.8%) |
| College / Associate Degree | 105 (76.1%) | 0 (0.0%) |
| Bachelor's Degree or higher | 42 (72.4%) | 0 (0.0%) |
| Total | 493 (74.7%) | 24 (3.7%) |
Employment Occupations by Sex in Coldwater
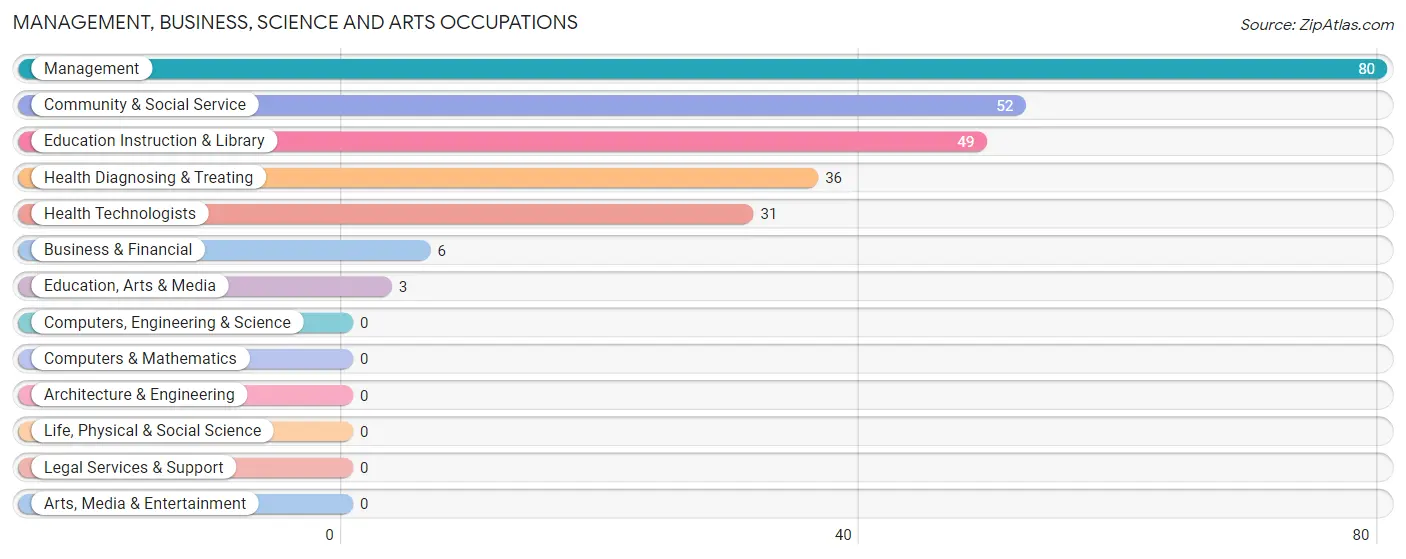
Management, Business, Science and Arts Occupations
The most common Management, Business, Science and Arts occupations in Coldwater are Management (80 | 14.3%), Community & Social Service (52 | 9.3%), Education Instruction & Library (49 | 8.8%), Health Diagnosing & Treating (36 | 6.5%), and Health Technologists (31 | 5.6%).
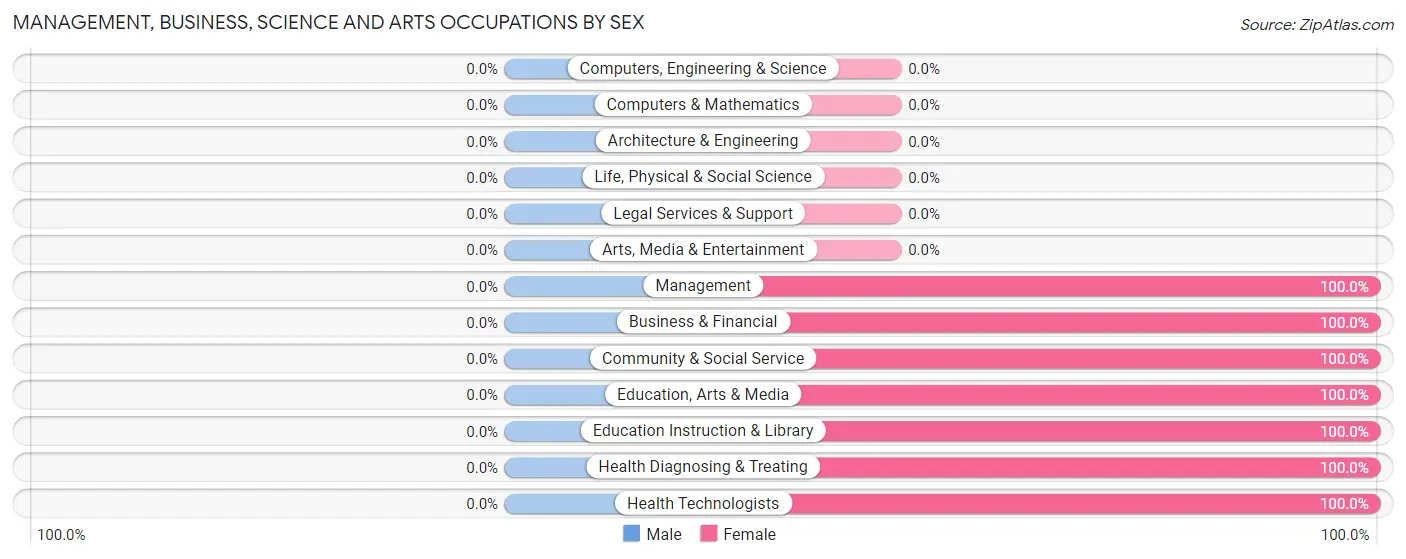
Management, Business, Science and Arts Occupations by Sex
| Occupation | Male | Female |
| Management | 0 (0.0%) | 80 (100.0%) |
| Business & Financial | 0 (0.0%) | 6 (100.0%) |
| Computers, Engineering & Science | 0 (0.0%) | 0 (0.0%) |
| Computers & Mathematics | 0 (0.0%) | 0 (0.0%) |
| Architecture & Engineering | 0 (0.0%) | 0 (0.0%) |
| Life, Physical & Social Science | 0 (0.0%) | 0 (0.0%) |
| Community & Social Service | 0 (0.0%) | 52 (100.0%) |
| Education, Arts & Media | 0 (0.0%) | 3 (100.0%) |
| Legal Services & Support | 0 (0.0%) | 0 (0.0%) |
| Education Instruction & Library | 0 (0.0%) | 49 (100.0%) |
| Arts, Media & Entertainment | 0 (0.0%) | 0 (0.0%) |
| Health Diagnosing & Treating | 0 (0.0%) | 36 (100.0%) |
| Health Technologists | 0 (0.0%) | 31 (100.0%) |
| Total (Category) | 0 (0.0%) | 174 (100.0%) |
| Total (Overall) | 251 (45.0%) | 307 (55.0%) |
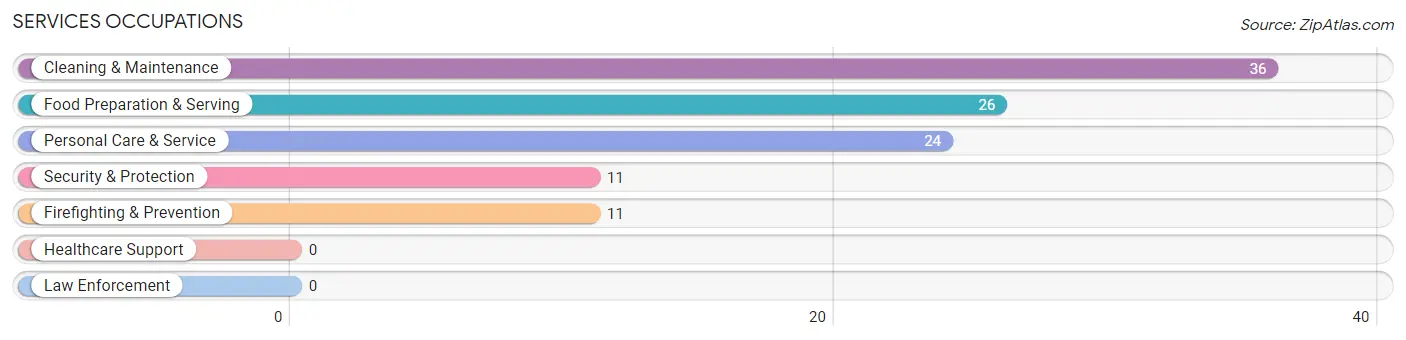
Services Occupations
The most common Services occupations in Coldwater are Cleaning & Maintenance (36 | 6.5%), Food Preparation & Serving (26 | 4.7%), Personal Care & Service (24 | 4.3%), Security & Protection (11 | 2.0%), and Firefighting & Prevention (11 | 2.0%).
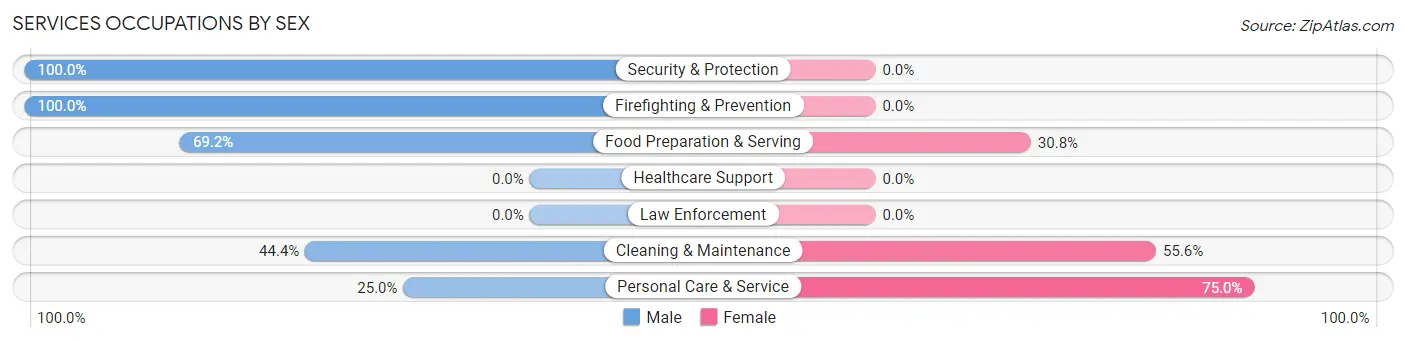
Services Occupations by Sex
Within the Services occupations in Coldwater, the most male-oriented occupations are Security & Protection (100.0%), Firefighting & Prevention (100.0%), and Food Preparation & Serving (69.2%), while the most female-oriented occupations are Personal Care & Service (75.0%), Cleaning & Maintenance (55.6%), and Food Preparation & Serving (30.8%).
| Occupation | Male | Female |
| Healthcare Support | 0 (0.0%) | 0 (0.0%) |
| Security & Protection | 11 (100.0%) | 0 (0.0%) |
| Firefighting & Prevention | 11 (100.0%) | 0 (0.0%) |
| Law Enforcement | 0 (0.0%) | 0 (0.0%) |
| Food Preparation & Serving | 18 (69.2%) | 8 (30.8%) |
| Cleaning & Maintenance | 16 (44.4%) | 20 (55.6%) |
| Personal Care & Service | 6 (25.0%) | 18 (75.0%) |
| Total (Category) | 51 (52.6%) | 46 (47.4%) |
| Total (Overall) | 251 (45.0%) | 307 (55.0%) |
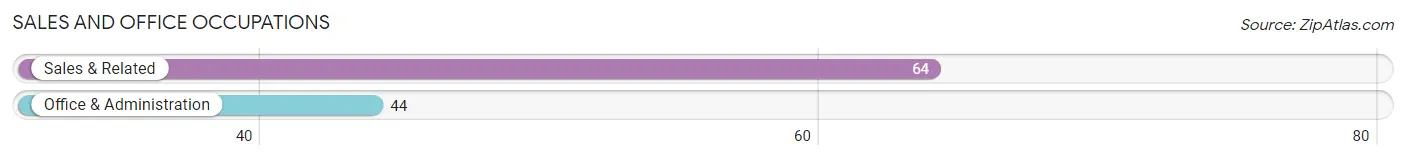
Sales and Office Occupations
The most common Sales and Office occupations in Coldwater are Sales & Related (64 | 11.5%), and Office & Administration (44 | 7.9%).
Sales and Office Occupations by Sex
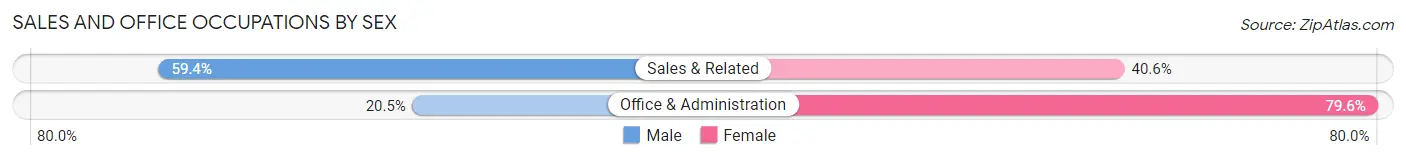
| Occupation | Male | Female |
| Sales & Related | 38 (59.4%) | 26 (40.6%) |
| Office & Administration | 9 (20.4%) | 35 (79.5%) |
| Total (Category) | 47 (43.5%) | 61 (56.5%) |
| Total (Overall) | 251 (45.0%) | 307 (55.0%) |
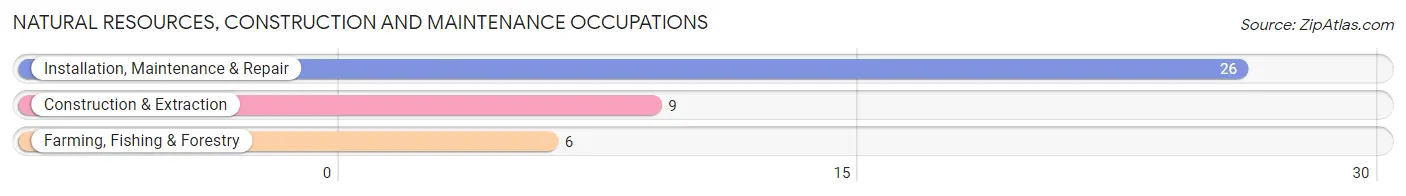
Natural Resources, Construction and Maintenance Occupations
The most common Natural Resources, Construction and Maintenance occupations in Coldwater are Installation, Maintenance & Repair (26 | 4.7%), Construction & Extraction (9 | 1.6%), and Farming, Fishing & Forestry (6 | 1.1%).
Natural Resources, Construction and Maintenance Occupations by Sex
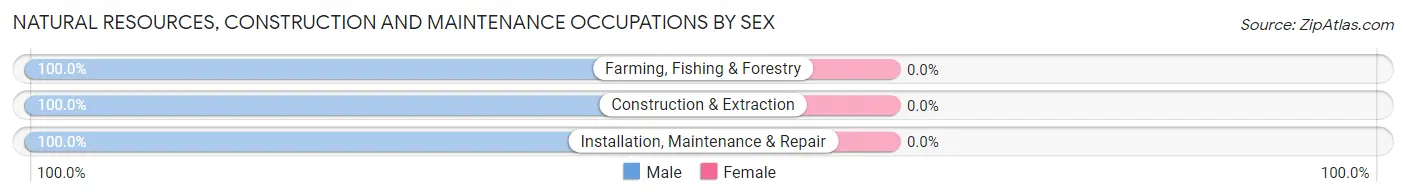
| Occupation | Male | Female |
| Farming, Fishing & Forestry | 6 (100.0%) | 0 (0.0%) |
| Construction & Extraction | 9 (100.0%) | 0 (0.0%) |
| Installation, Maintenance & Repair | 26 (100.0%) | 0 (0.0%) |
| Total (Category) | 41 (100.0%) | 0 (0.0%) |
| Total (Overall) | 251 (45.0%) | 307 (55.0%) |
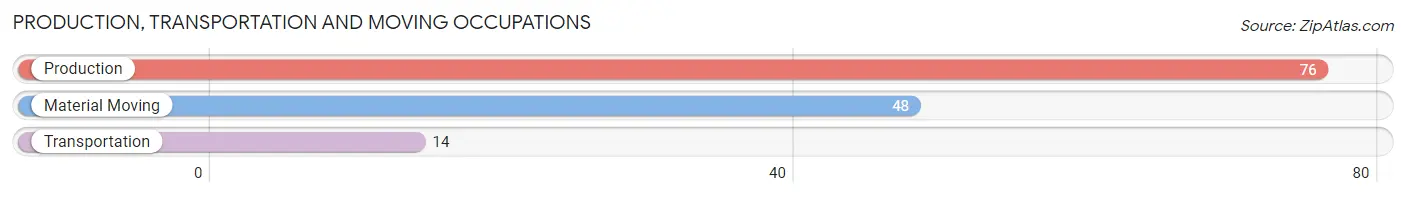
Production, Transportation and Moving Occupations
The most common Production, Transportation and Moving occupations in Coldwater are Production (76 | 13.6%), Material Moving (48 | 8.6%), and Transportation (14 | 2.5%).
Production, Transportation and Moving Occupations by Sex
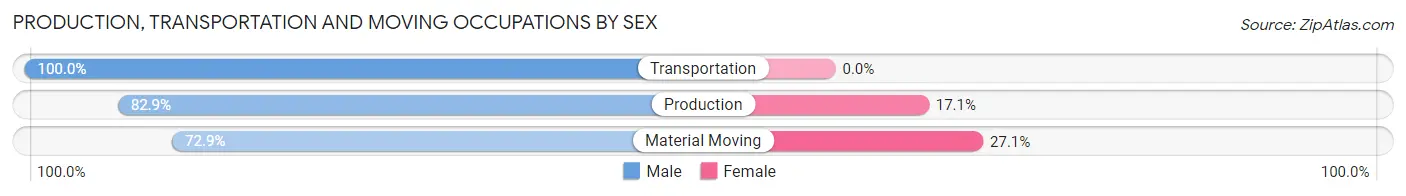
| Occupation | Male | Female |
| Production | 63 (82.9%) | 13 (17.1%) |
| Transportation | 14 (100.0%) | 0 (0.0%) |
| Material Moving | 35 (72.9%) | 13 (27.1%) |
| Total (Category) | 112 (81.2%) | 26 (18.8%) |
| Total (Overall) | 251 (45.0%) | 307 (55.0%) |
Employment Industries by Sex in Coldwater
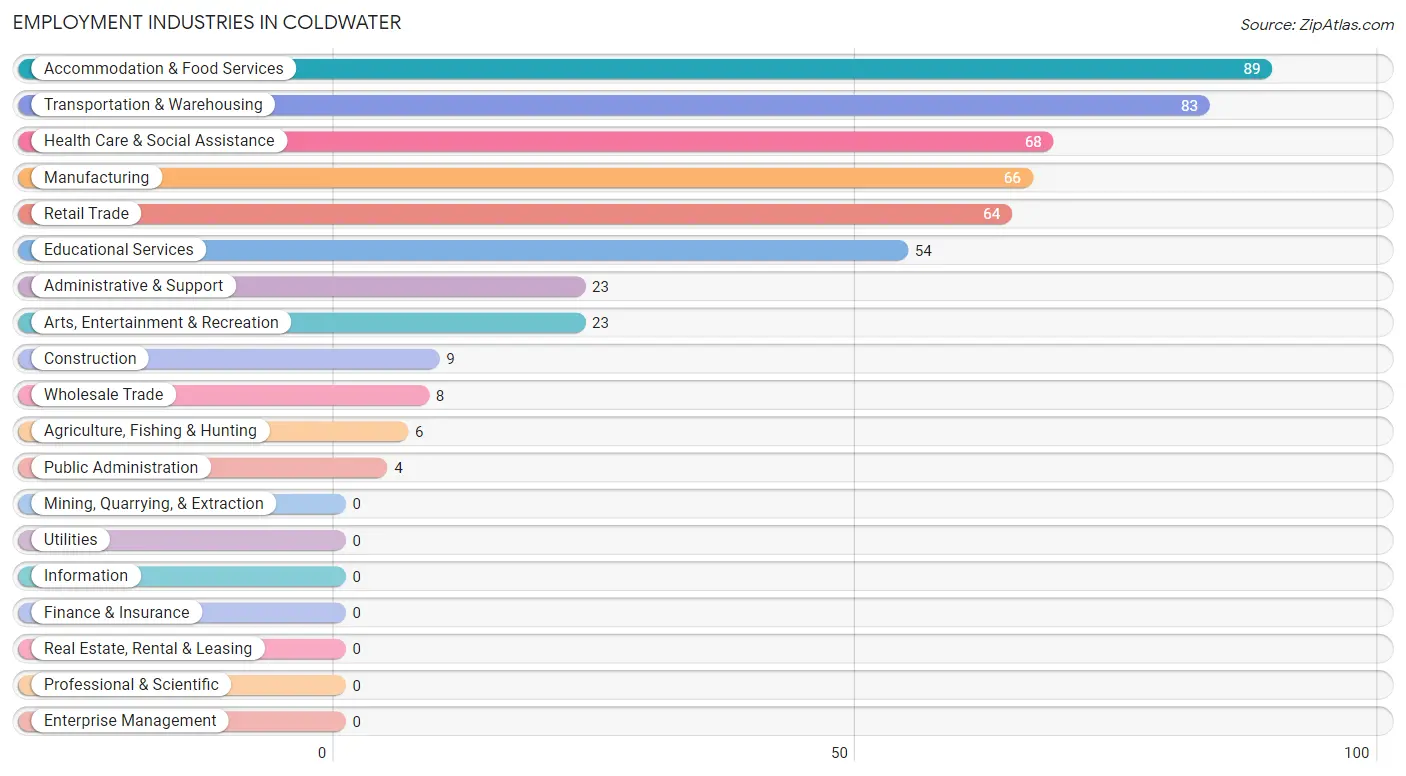
Employment Industries in Coldwater
The major employment industries in Coldwater include Accommodation & Food Services (89 | 16.0%), Transportation & Warehousing (83 | 14.9%), Health Care & Social Assistance (68 | 12.2%), Manufacturing (66 | 11.8%), and Retail Trade (64 | 11.5%).
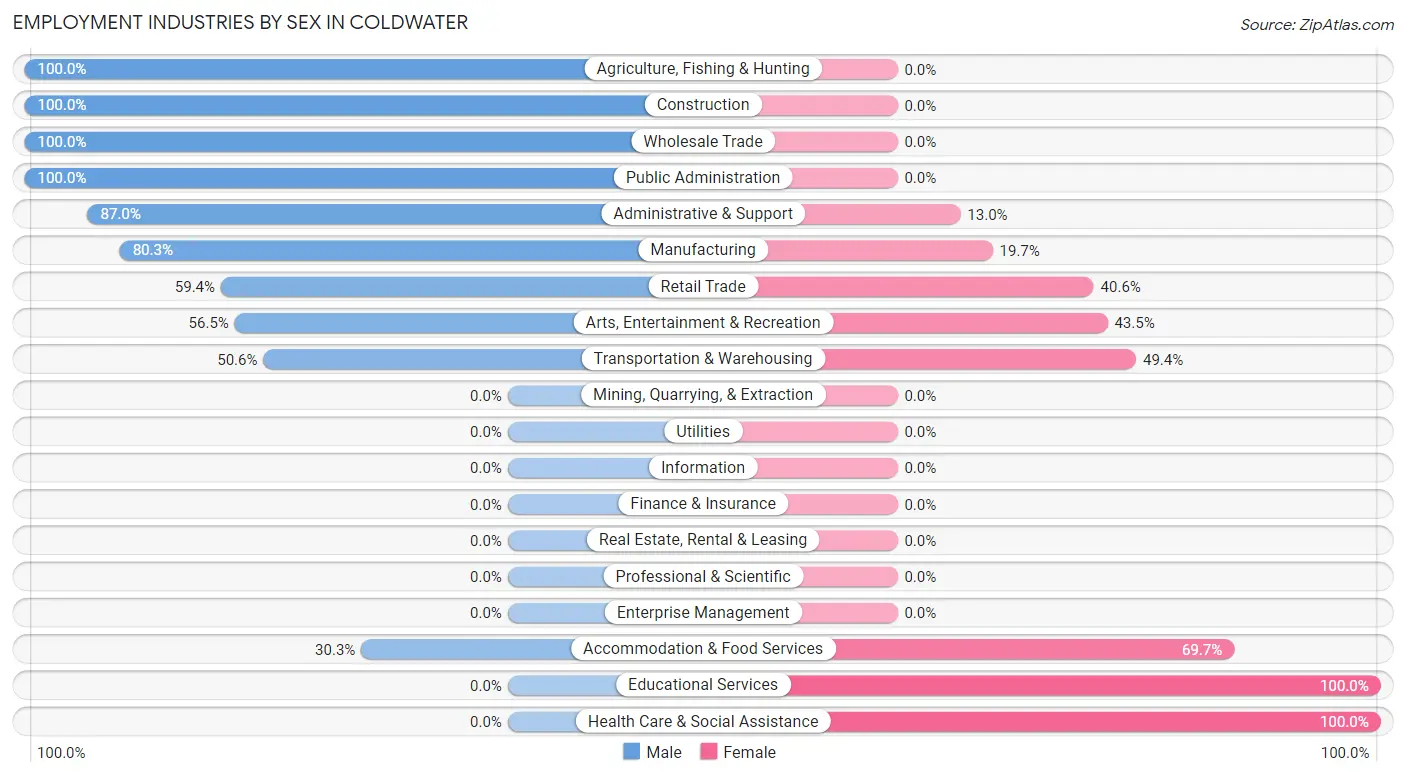
Employment Industries by Sex in Coldwater
The Coldwater industries that see more men than women are Agriculture, Fishing & Hunting (100.0%), Construction (100.0%), and Wholesale Trade (100.0%), whereas the industries that tend to have a higher number of women are Educational Services (100.0%), Health Care & Social Assistance (100.0%), and Accommodation & Food Services (69.7%).
| Industry | Male | Female |
| Agriculture, Fishing & Hunting | 6 (100.0%) | 0 (0.0%) |
| Mining, Quarrying, & Extraction | 0 (0.0%) | 0 (0.0%) |
| Construction | 9 (100.0%) | 0 (0.0%) |
| Manufacturing | 53 (80.3%) | 13 (19.7%) |
| Wholesale Trade | 8 (100.0%) | 0 (0.0%) |
| Retail Trade | 38 (59.4%) | 26 (40.6%) |
| Transportation & Warehousing | 42 (50.6%) | 41 (49.4%) |
| Utilities | 0 (0.0%) | 0 (0.0%) |
| Information | 0 (0.0%) | 0 (0.0%) |
| Finance & Insurance | 0 (0.0%) | 0 (0.0%) |
| Real Estate, Rental & Leasing | 0 (0.0%) | 0 (0.0%) |
| Professional & Scientific | 0 (0.0%) | 0 (0.0%) |
| Enterprise Management | 0 (0.0%) | 0 (0.0%) |
| Administrative & Support | 20 (87.0%) | 3 (13.0%) |
| Educational Services | 0 (0.0%) | 54 (100.0%) |
| Health Care & Social Assistance | 0 (0.0%) | 68 (100.0%) |
| Arts, Entertainment & Recreation | 13 (56.5%) | 10 (43.5%) |
| Accommodation & Food Services | 27 (30.3%) | 62 (69.7%) |
| Public Administration | 4 (100.0%) | 0 (0.0%) |
| Total | 251 (45.0%) | 307 (55.0%) |
Education in Coldwater
School Enrollment in Coldwater
The most common levels of schooling among the 191 students in Coldwater are elementary school (64 | 33.5%), middle school (60 | 31.4%), and college / undergraduate (25 | 13.1%).
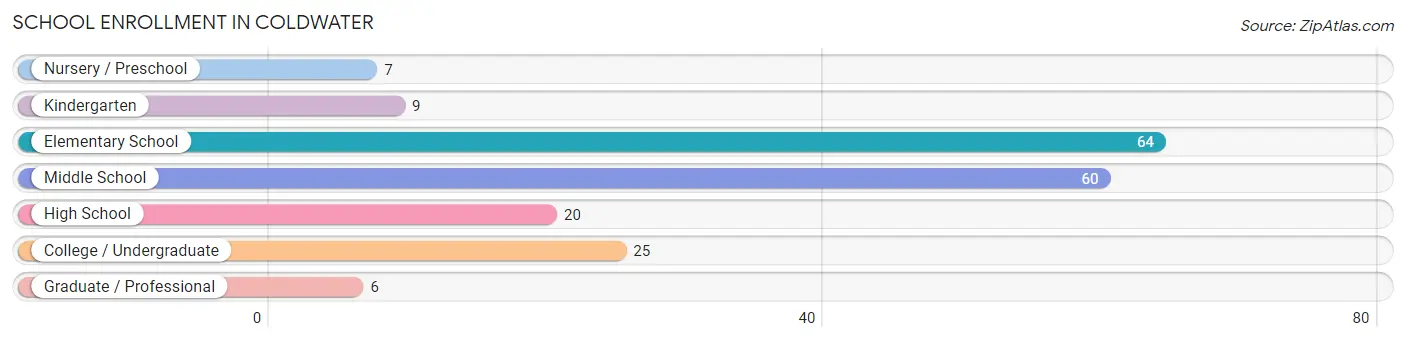
| School Level | # Students | % Students |
| Nursery / Preschool | 7 | 3.7% |
| Kindergarten | 9 | 4.7% |
| Elementary School | 64 | 33.5% |
| Middle School | 60 | 31.4% |
| High School | 20 | 10.5% |
| College / Undergraduate | 25 | 13.1% |
| Graduate / Professional | 6 | 3.1% |
| Total | 191 | 100.0% |
School Enrollment by Age by Funding Source in Coldwater
Out of a total of 191 students who are enrolled in schools in Coldwater, 39 (20.4%) attend a private institution, while the remaining 152 (79.6%) are enrolled in public schools. The age group of 10 to 14 year olds has the highest likelihood of being enrolled in private schools, with 33 (40.2% in the age bracket) enrolled. Conversely, the age group of 3 to 4 year olds has the lowest likelihood of being enrolled in a private school, with 7 (100.0% in the age bracket) attending a public institution.
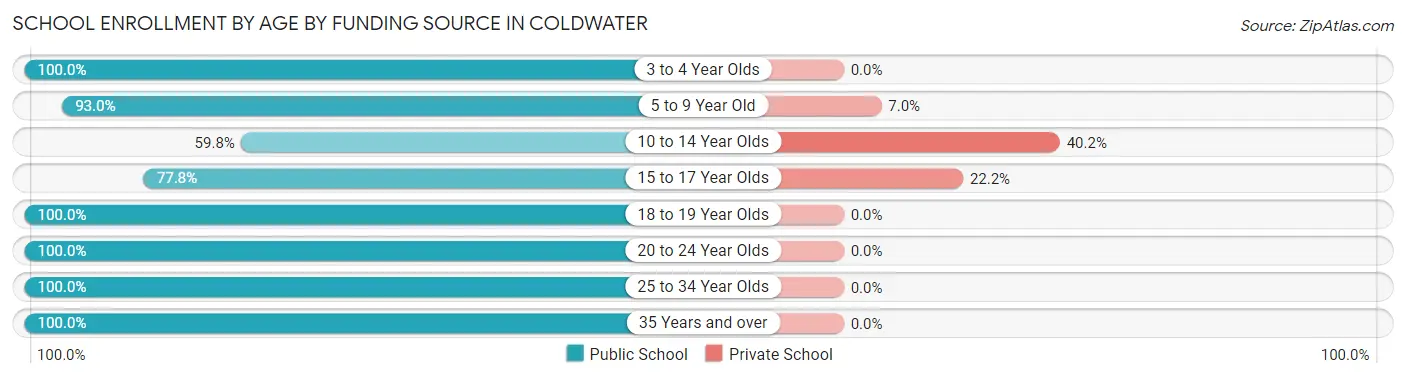
| Age Bracket | Public School | Private School |
| 3 to 4 Year Olds | 7 (100.0%) | 0 (0.0%) |
| 5 to 9 Year Old | 53 (93.0%) | 4 (7.0%) |
| 10 to 14 Year Olds | 49 (59.8%) | 33 (40.2%) |
| 15 to 17 Year Olds | 7 (77.8%) | 2 (22.2%) |
| 18 to 19 Year Olds | 5 (100.0%) | 0 (0.0%) |
| 20 to 24 Year Olds | 12 (100.0%) | 0 (0.0%) |
| 25 to 34 Year Olds | 14 (100.0%) | 0 (0.0%) |
| 35 Years and over | 5 (100.0%) | 0 (0.0%) |
| Total | 152 (79.6%) | 39 (20.4%) |
Educational Attainment by Field of Study in Coldwater
Education (39 | 39.8%), science & technology (23 | 23.5%), arts & humanities (14 | 14.3%), physical & health sciences (8 | 8.2%), and business (6 | 6.1%) are the most common fields of study among 98 individuals in Coldwater who have obtained a bachelor's degree or higher.
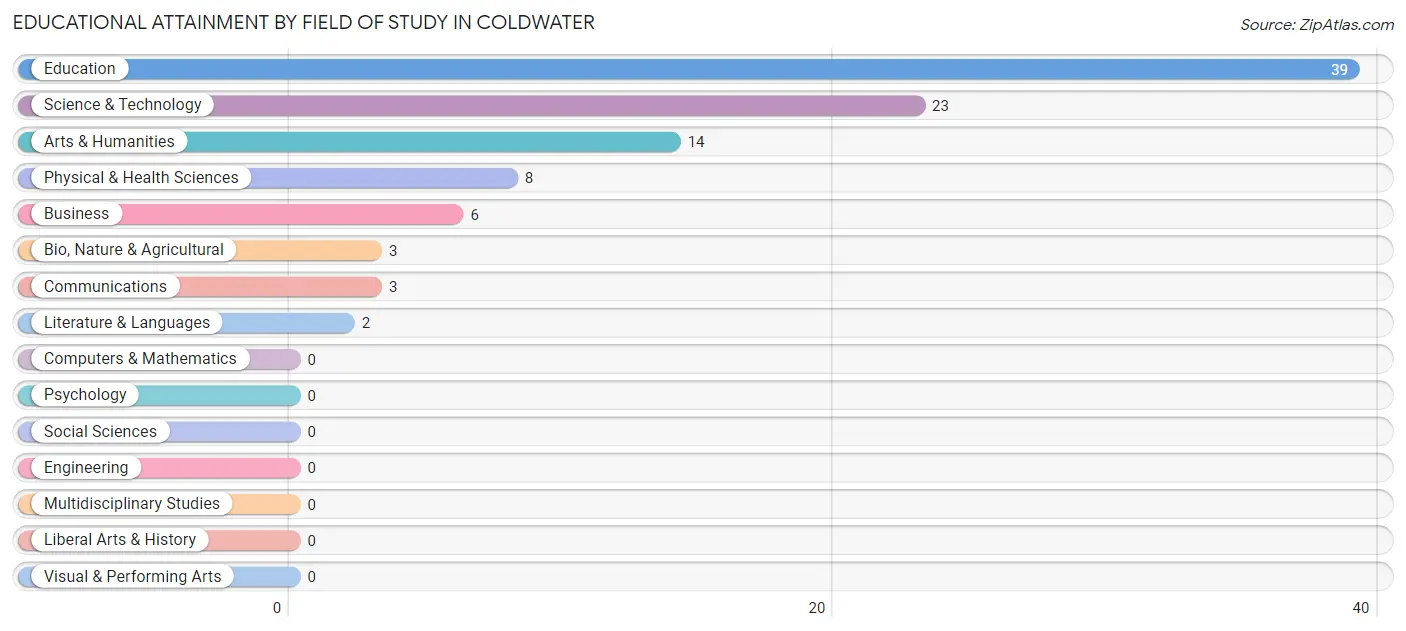
| Field of Study | # Graduates | % Graduates |
| Computers & Mathematics | 0 | 0.0% |
| Bio, Nature & Agricultural | 3 | 3.1% |
| Physical & Health Sciences | 8 | 8.2% |
| Psychology | 0 | 0.0% |
| Social Sciences | 0 | 0.0% |
| Engineering | 0 | 0.0% |
| Multidisciplinary Studies | 0 | 0.0% |
| Science & Technology | 23 | 23.5% |
| Business | 6 | 6.1% |
| Education | 39 | 39.8% |
| Literature & Languages | 2 | 2.0% |
| Liberal Arts & History | 0 | 0.0% |
| Visual & Performing Arts | 0 | 0.0% |
| Communications | 3 | 3.1% |
| Arts & Humanities | 14 | 14.3% |
| Total | 98 | 100.0% |
Transportation & Commute in Coldwater
Vehicle Availability by Sex in Coldwater
The most prevalent vehicle ownership categories in Coldwater are males with 2 vehicles (103, accounting for 41.9%) and females with 2 vehicles (93, making up 34.3%).
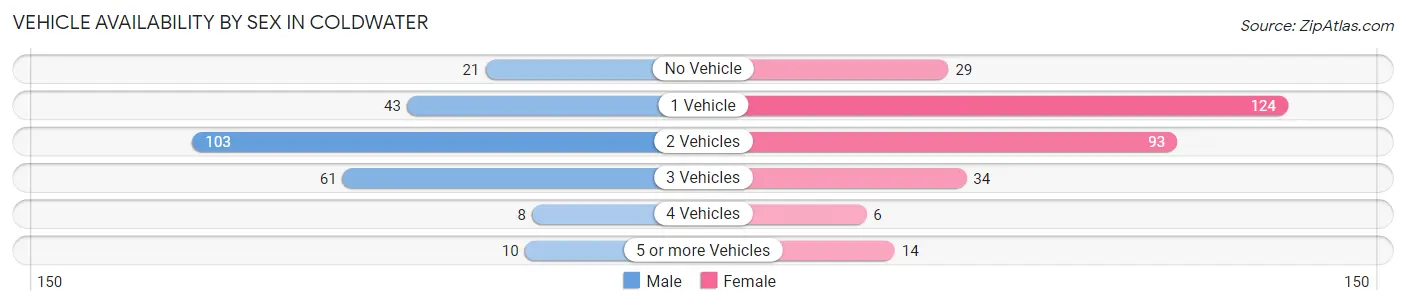
| Vehicles Available | Male | Female |
| No Vehicle | 21 (8.5%) | 29 (9.7%) |
| 1 Vehicle | 43 (17.5%) | 124 (41.3%) |
| 2 Vehicles | 103 (41.9%) | 93 (31.0%) |
| 3 Vehicles | 61 (24.8%) | 34 (11.3%) |
| 4 Vehicles | 8 (3.3%) | 6 (2.0%) |
| 5 or more Vehicles | 10 (4.1%) | 14 (4.7%) |
| Total | 246 (100.0%) | 300 (100.0%) |
Commute Time in Coldwater
The most frequently occuring commute durations in Coldwater are 10 to 14 minutes (124 commuters, 24.2%), 45 to 59 minutes (104 commuters, 20.3%), and 30 to 34 minutes (101 commuters, 19.7%).
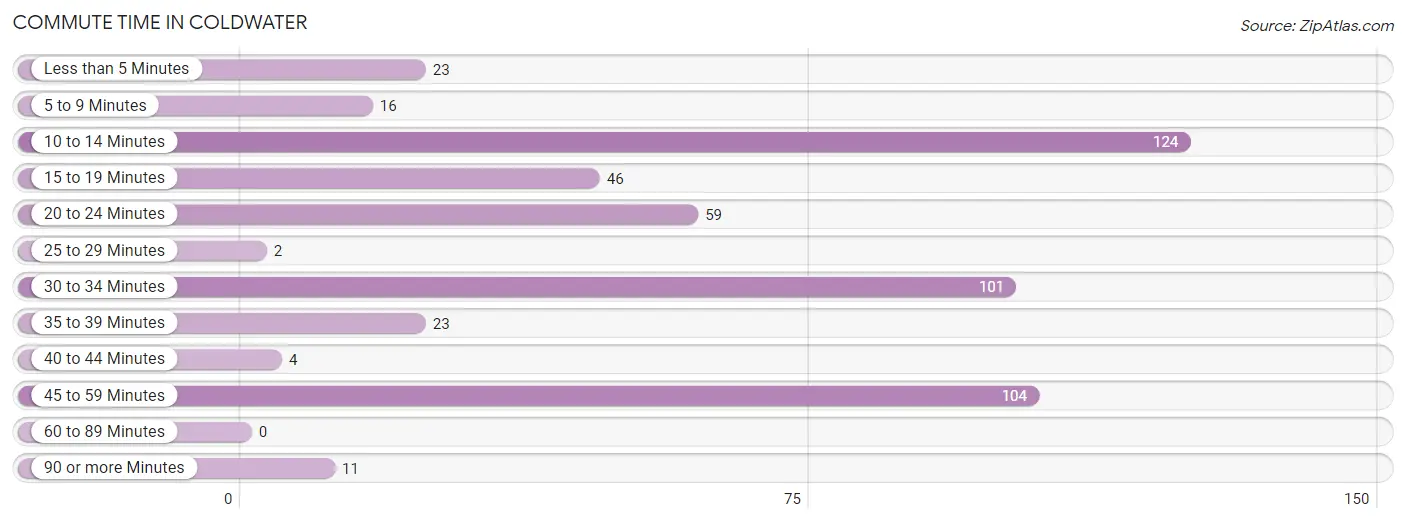
| Commute Time | # Commuters | % Commuters |
| Less than 5 Minutes | 23 | 4.5% |
| 5 to 9 Minutes | 16 | 3.1% |
| 10 to 14 Minutes | 124 | 24.2% |
| 15 to 19 Minutes | 46 | 9.0% |
| 20 to 24 Minutes | 59 | 11.5% |
| 25 to 29 Minutes | 2 | 0.4% |
| 30 to 34 Minutes | 101 | 19.7% |
| 35 to 39 Minutes | 23 | 4.5% |
| 40 to 44 Minutes | 4 | 0.8% |
| 45 to 59 Minutes | 104 | 20.3% |
| 60 to 89 Minutes | 0 | 0.0% |
| 90 or more Minutes | 11 | 2.1% |
Commute Time by Sex in Coldwater
The most common commute times in Coldwater are 45 to 59 minutes (62 commuters, 26.8%) for males and 30 to 34 minutes (73 commuters, 25.9%) for females.
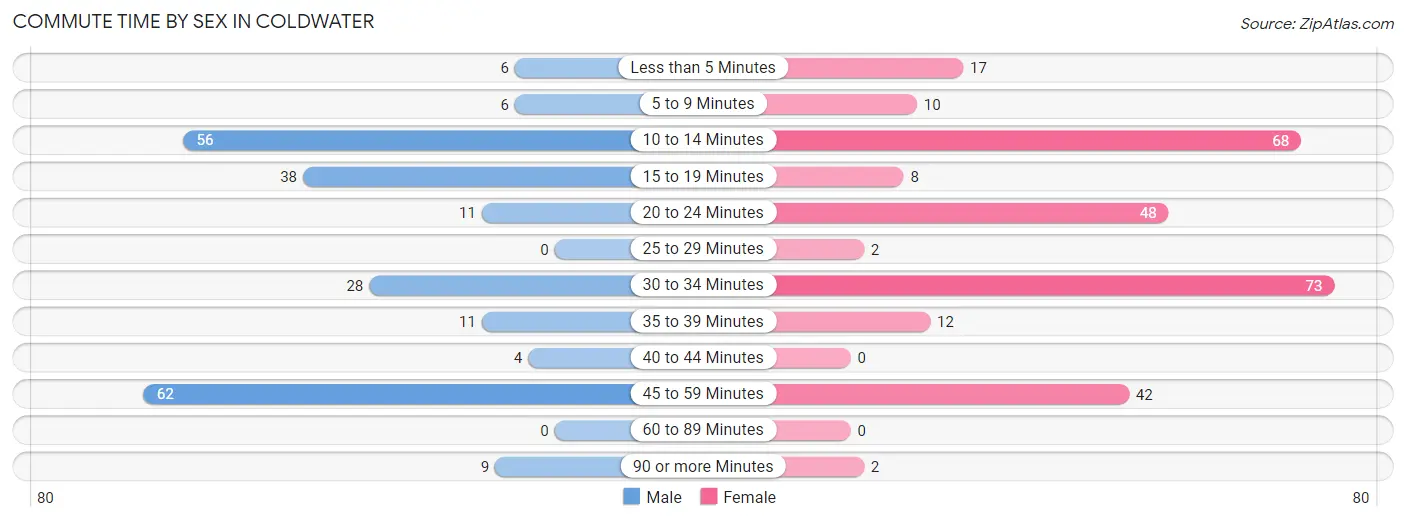
| Commute Time | Male | Female |
| Less than 5 Minutes | 6 (2.6%) | 17 (6.0%) |
| 5 to 9 Minutes | 6 (2.6%) | 10 (3.5%) |
| 10 to 14 Minutes | 56 (24.2%) | 68 (24.1%) |
| 15 to 19 Minutes | 38 (16.5%) | 8 (2.8%) |
| 20 to 24 Minutes | 11 (4.8%) | 48 (17.0%) |
| 25 to 29 Minutes | 0 (0.0%) | 2 (0.7%) |
| 30 to 34 Minutes | 28 (12.1%) | 73 (25.9%) |
| 35 to 39 Minutes | 11 (4.8%) | 12 (4.3%) |
| 40 to 44 Minutes | 4 (1.7%) | 0 (0.0%) |
| 45 to 59 Minutes | 62 (26.8%) | 42 (14.9%) |
| 60 to 89 Minutes | 0 (0.0%) | 0 (0.0%) |
| 90 or more Minutes | 9 (3.9%) | 2 (0.7%) |
Time of Departure to Work by Sex in Coldwater
The most frequent times of departure to work in Coldwater are 12:00 PM to 3:59 PM (54, 23.4%) for males and 6:00 AM to 6:29 AM (76, 27.0%) for females.
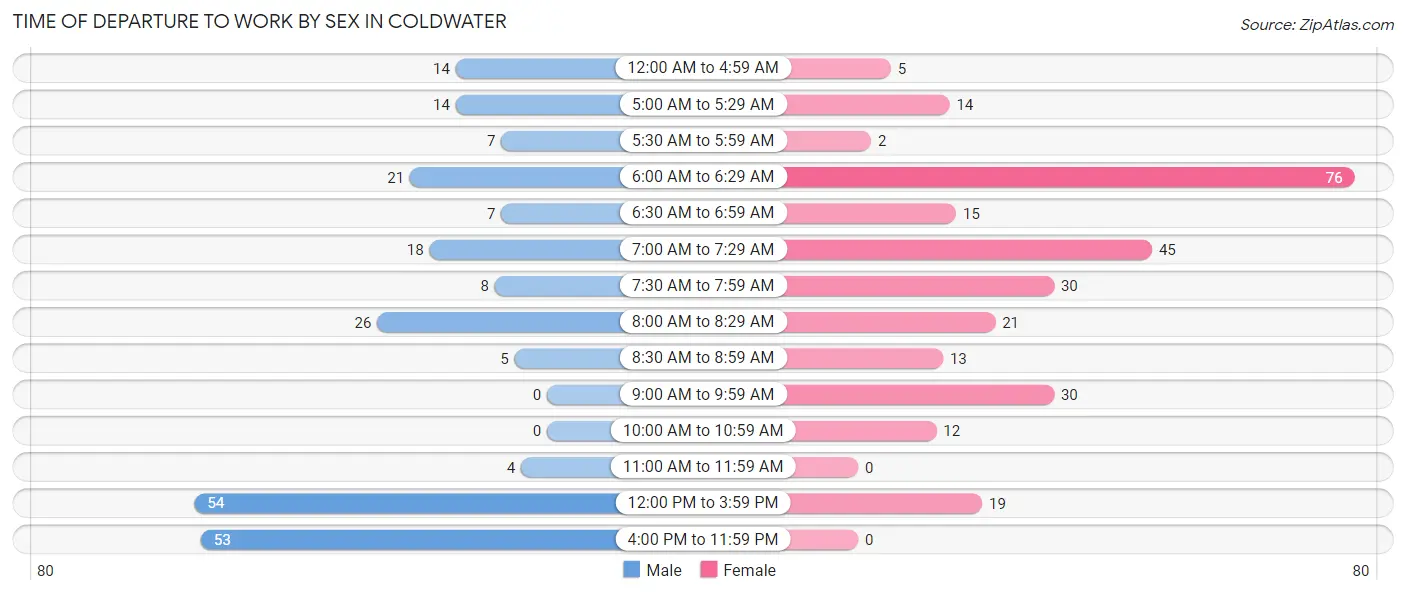
| Time of Departure | Male | Female |
| 12:00 AM to 4:59 AM | 14 (6.1%) | 5 (1.8%) |
| 5:00 AM to 5:29 AM | 14 (6.1%) | 14 (5.0%) |
| 5:30 AM to 5:59 AM | 7 (3.0%) | 2 (0.7%) |
| 6:00 AM to 6:29 AM | 21 (9.1%) | 76 (27.0%) |
| 6:30 AM to 6:59 AM | 7 (3.0%) | 15 (5.3%) |
| 7:00 AM to 7:29 AM | 18 (7.8%) | 45 (16.0%) |
| 7:30 AM to 7:59 AM | 8 (3.5%) | 30 (10.6%) |
| 8:00 AM to 8:29 AM | 26 (11.3%) | 21 (7.4%) |
| 8:30 AM to 8:59 AM | 5 (2.2%) | 13 (4.6%) |
| 9:00 AM to 9:59 AM | 0 (0.0%) | 30 (10.6%) |
| 10:00 AM to 10:59 AM | 0 (0.0%) | 12 (4.3%) |
| 11:00 AM to 11:59 AM | 4 (1.7%) | 0 (0.0%) |
| 12:00 PM to 3:59 PM | 54 (23.4%) | 19 (6.7%) |
| 4:00 PM to 11:59 PM | 53 (22.9%) | 0 (0.0%) |
| Total | 231 (100.0%) | 282 (100.0%) |
Housing Occupancy in Coldwater
Occupancy by Ownership in Coldwater
Of the total 551 dwellings in Coldwater, owner-occupied units account for 364 (66.1%), while renter-occupied units make up 187 (33.9%).
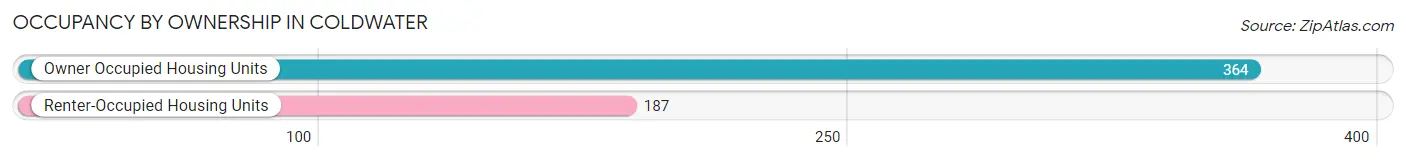
| Occupancy | # Housing Units | % Housing Units |
| Owner Occupied Housing Units | 364 | 66.1% |
| Renter-Occupied Housing Units | 187 | 33.9% |
| Total Occupied Housing Units | 551 | 100.0% |
Occupancy by Household Size in Coldwater
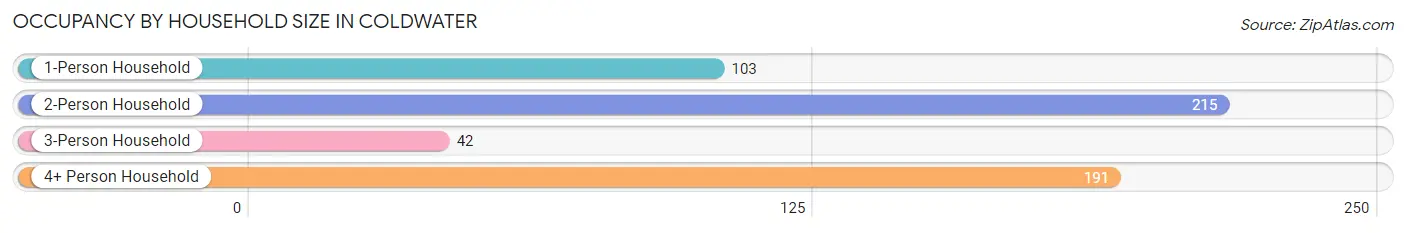
| Household Size | # Housing Units | % Housing Units |
| 1-Person Household | 103 | 18.7% |
| 2-Person Household | 215 | 39.0% |
| 3-Person Household | 42 | 7.6% |
| 4+ Person Household | 191 | 34.7% |
| Total Housing Units | 551 | 100.0% |
Occupancy by Ownership by Household Size in Coldwater
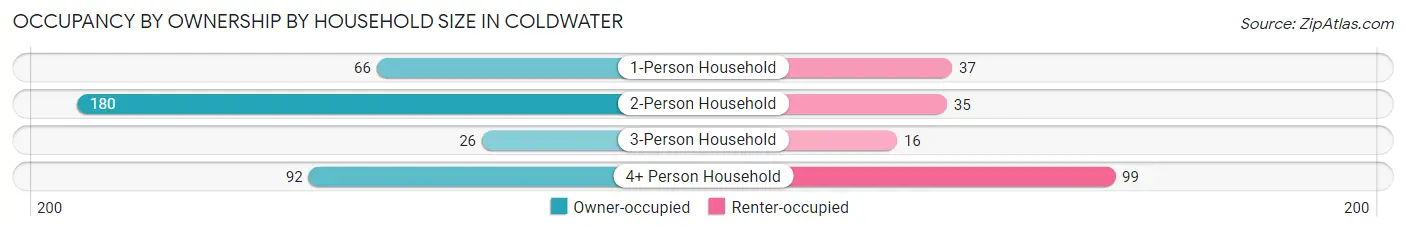
| Household Size | Owner-occupied | Renter-occupied |
| 1-Person Household | 66 (64.1%) | 37 (35.9%) |
| 2-Person Household | 180 (83.7%) | 35 (16.3%) |
| 3-Person Household | 26 (61.9%) | 16 (38.1%) |
| 4+ Person Household | 92 (48.2%) | 99 (51.8%) |
| Total Housing Units | 364 (66.1%) | 187 (33.9%) |
Occupancy by Educational Attainment in Coldwater
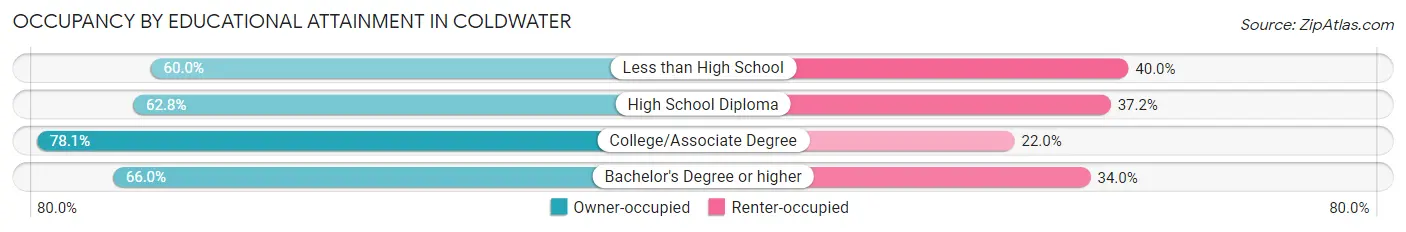
| Household Size | Owner-occupied | Renter-occupied |
| Less than High School | 51 (60.0%) | 34 (40.0%) |
| High School Diploma | 184 (62.8%) | 109 (37.2%) |
| College/Associate Degree | 96 (78.0%) | 27 (22.0%) |
| Bachelor's Degree or higher | 33 (66.0%) | 17 (34.0%) |
Occupancy by Age of Householder in Coldwater
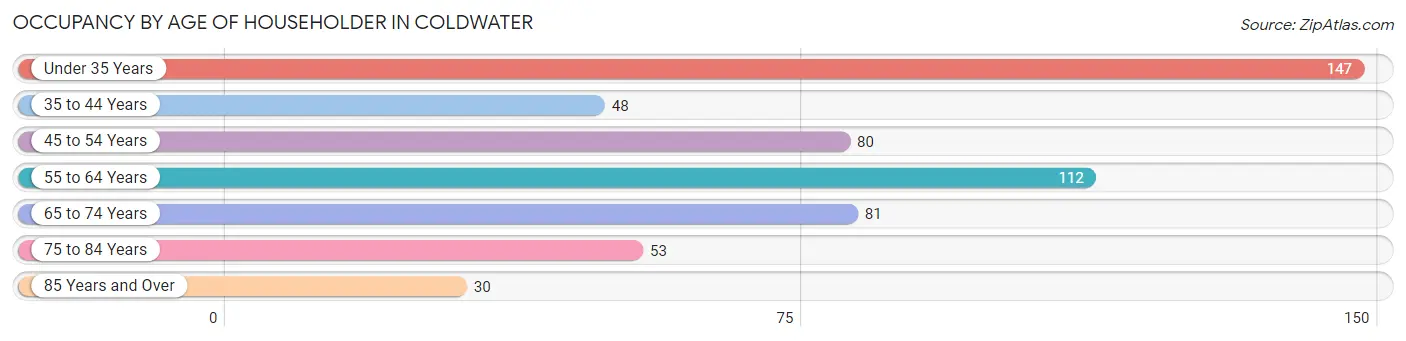
| Age Bracket | # Households | % Households |
| Under 35 Years | 147 | 26.7% |
| 35 to 44 Years | 48 | 8.7% |
| 45 to 54 Years | 80 | 14.5% |
| 55 to 64 Years | 112 | 20.3% |
| 65 to 74 Years | 81 | 14.7% |
| 75 to 84 Years | 53 | 9.6% |
| 85 Years and Over | 30 | 5.4% |
| Total | 551 | 100.0% |
Housing Finances in Coldwater
Median Income by Occupancy in Coldwater
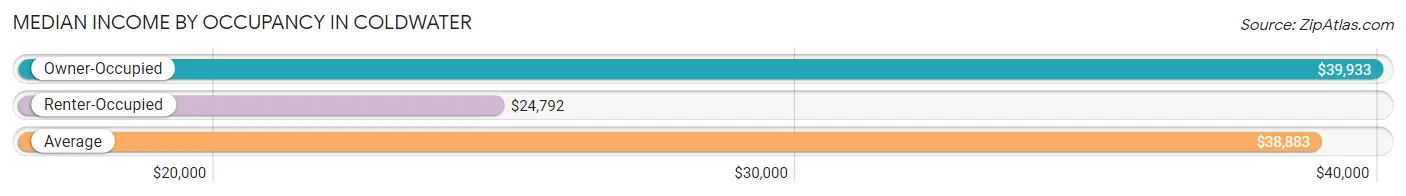
| Occupancy Type | # Households | Median Income |
| Owner-Occupied | 364 (66.1%) | $39,933 |
| Renter-Occupied | 187 (33.9%) | $24,792 |
| Average | 551 (100.0%) | $38,883 |
Occupancy by Householder Income Bracket in Coldwater
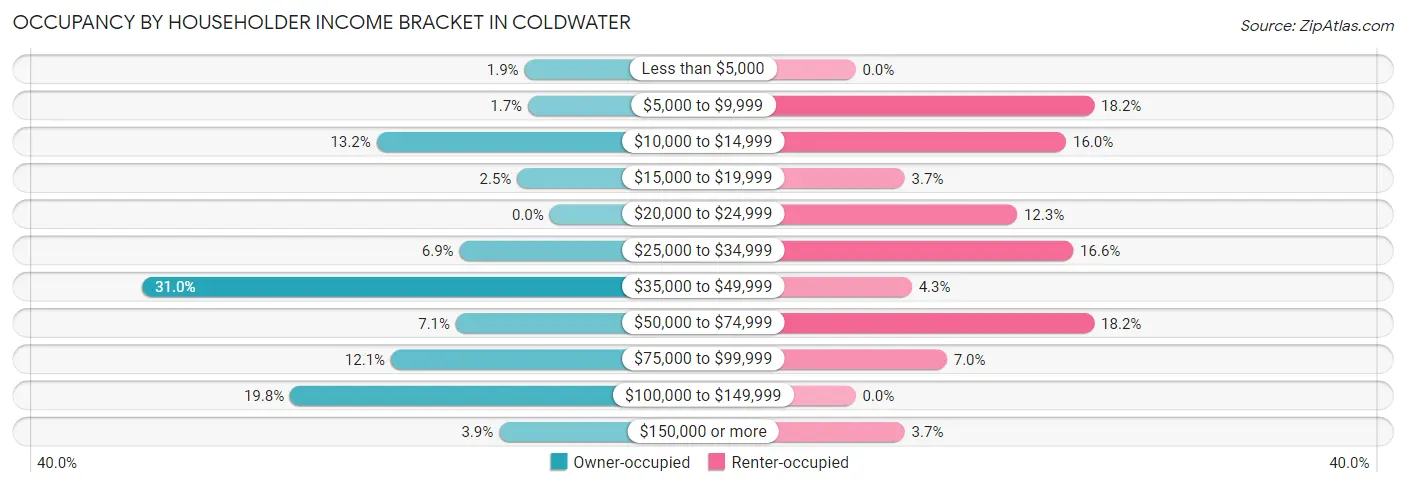
| Income Bracket | Owner-occupied | Renter-occupied |
| Less than $5,000 | 7 (1.9%) | 0 (0.0%) |
| $5,000 to $9,999 | 6 (1.7%) | 34 (18.2%) |
| $10,000 to $14,999 | 48 (13.2%) | 30 (16.0%) |
| $15,000 to $19,999 | 9 (2.5%) | 7 (3.7%) |
| $20,000 to $24,999 | 0 (0.0%) | 23 (12.3%) |
| $25,000 to $34,999 | 25 (6.9%) | 31 (16.6%) |
| $35,000 to $49,999 | 113 (31.0%) | 8 (4.3%) |
| $50,000 to $74,999 | 26 (7.1%) | 34 (18.2%) |
| $75,000 to $99,999 | 44 (12.1%) | 13 (7.0%) |
| $100,000 to $149,999 | 72 (19.8%) | 0 (0.0%) |
| $150,000 or more | 14 (3.8%) | 7 (3.7%) |
| Total | 364 (100.0%) | 187 (100.0%) |
Monthly Housing Cost Tiers in Coldwater
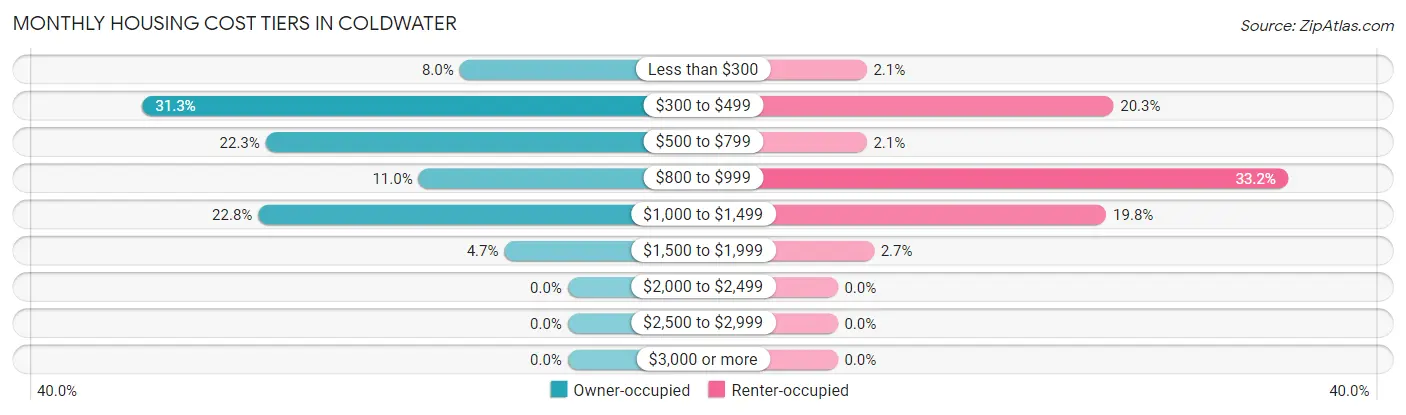
| Monthly Cost | Owner-occupied | Renter-occupied |
| Less than $300 | 29 (8.0%) | 4 (2.1%) |
| $300 to $499 | 114 (31.3%) | 38 (20.3%) |
| $500 to $799 | 81 (22.3%) | 4 (2.1%) |
| $800 to $999 | 40 (11.0%) | 62 (33.2%) |
| $1,000 to $1,499 | 83 (22.8%) | 37 (19.8%) |
| $1,500 to $1,999 | 17 (4.7%) | 5 (2.7%) |
| $2,000 to $2,499 | 0 (0.0%) | 0 (0.0%) |
| $2,500 to $2,999 | 0 (0.0%) | 0 (0.0%) |
| $3,000 or more | 0 (0.0%) | 0 (0.0%) |
| Total | 364 (100.0%) | 187 (100.0%) |
Physical Housing Characteristics in Coldwater
Housing Structures in Coldwater
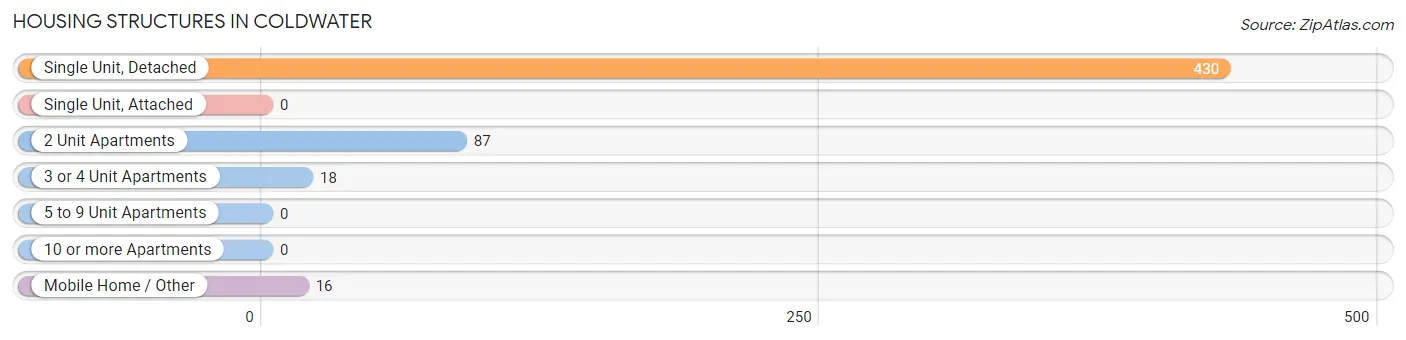
| Structure Type | # Housing Units | % Housing Units |
| Single Unit, Detached | 430 | 78.0% |
| Single Unit, Attached | 0 | 0.0% |
| 2 Unit Apartments | 87 | 15.8% |
| 3 or 4 Unit Apartments | 18 | 3.3% |
| 5 to 9 Unit Apartments | 0 | 0.0% |
| 10 or more Apartments | 0 | 0.0% |
| Mobile Home / Other | 16 | 2.9% |
| Total | 551 | 100.0% |
Housing Structures by Occupancy in Coldwater
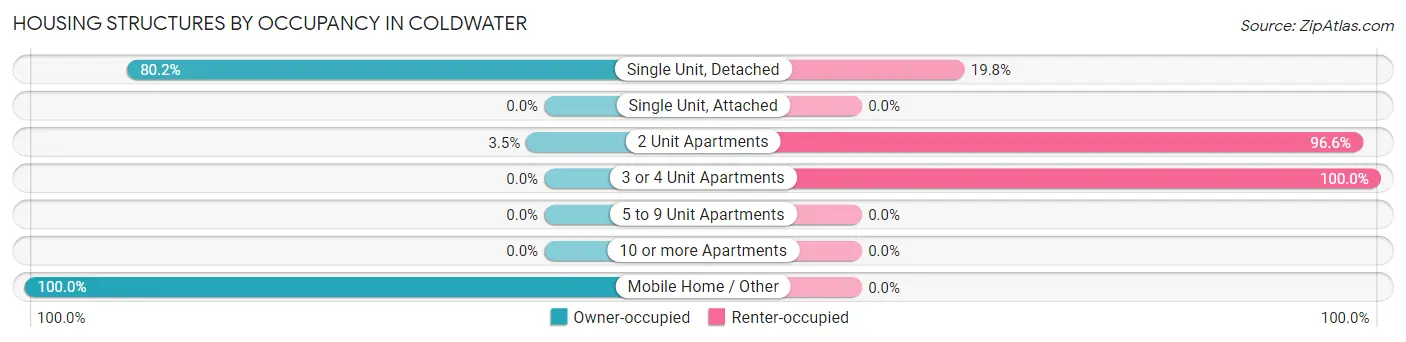
| Structure Type | Owner-occupied | Renter-occupied |
| Single Unit, Detached | 345 (80.2%) | 85 (19.8%) |
| Single Unit, Attached | 0 (0.0%) | 0 (0.0%) |
| 2 Unit Apartments | 3 (3.5%) | 84 (96.6%) |
| 3 or 4 Unit Apartments | 0 (0.0%) | 18 (100.0%) |
| 5 to 9 Unit Apartments | 0 (0.0%) | 0 (0.0%) |
| 10 or more Apartments | 0 (0.0%) | 0 (0.0%) |
| Mobile Home / Other | 16 (100.0%) | 0 (0.0%) |
| Total | 364 (66.1%) | 187 (33.9%) |
Housing Structures by Number of Rooms in Coldwater
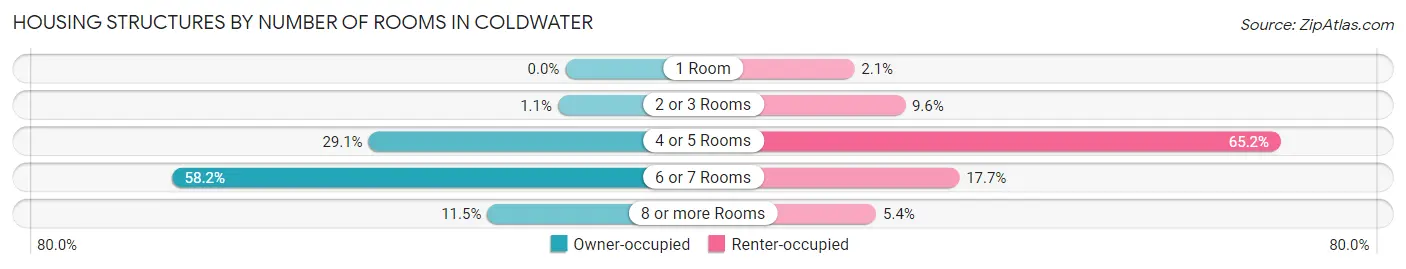
| Number of Rooms | Owner-occupied | Renter-occupied |
| 1 Room | 0 (0.0%) | 4 (2.1%) |
| 2 or 3 Rooms | 4 (1.1%) | 18 (9.6%) |
| 4 or 5 Rooms | 106 (29.1%) | 122 (65.2%) |
| 6 or 7 Rooms | 212 (58.2%) | 33 (17.6%) |
| 8 or more Rooms | 42 (11.5%) | 10 (5.3%) |
| Total | 364 (100.0%) | 187 (100.0%) |
Housing Structure by Heating Type in Coldwater
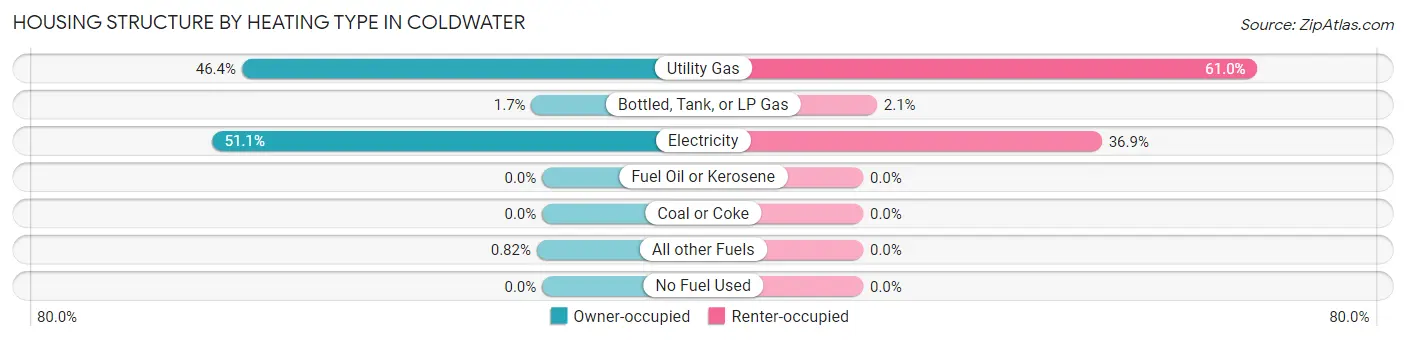
| Heating Type | Owner-occupied | Renter-occupied |
| Utility Gas | 169 (46.4%) | 114 (61.0%) |
| Bottled, Tank, or LP Gas | 6 (1.7%) | 4 (2.1%) |
| Electricity | 186 (51.1%) | 69 (36.9%) |
| Fuel Oil or Kerosene | 0 (0.0%) | 0 (0.0%) |
| Coal or Coke | 0 (0.0%) | 0 (0.0%) |
| All other Fuels | 3 (0.8%) | 0 (0.0%) |
| No Fuel Used | 0 (0.0%) | 0 (0.0%) |
| Total | 364 (100.0%) | 187 (100.0%) |
Household Vehicle Usage in Coldwater
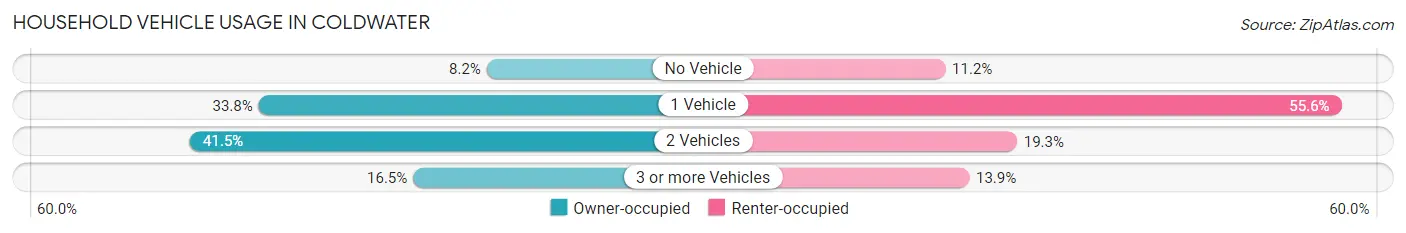
| Vehicles per Household | Owner-occupied | Renter-occupied |
| No Vehicle | 30 (8.2%) | 21 (11.2%) |
| 1 Vehicle | 123 (33.8%) | 104 (55.6%) |
| 2 Vehicles | 151 (41.5%) | 36 (19.3%) |
| 3 or more Vehicles | 60 (16.5%) | 26 (13.9%) |
| Total | 364 (100.0%) | 187 (100.0%) |
Real Estate & Mortgages in Coldwater
Real Estate and Mortgage Overview in Coldwater
| Characteristic | Without Mortgage | With Mortgage |
| Housing Units | 182 | 182 |
| Median Property Value | $94,000 | $86,300 |
| Median Household Income | - | - |
| Monthly Housing Costs | $420 | $0 |
| Real Estate Taxes | $892 | $99 |
Property Value by Mortgage Status in Coldwater
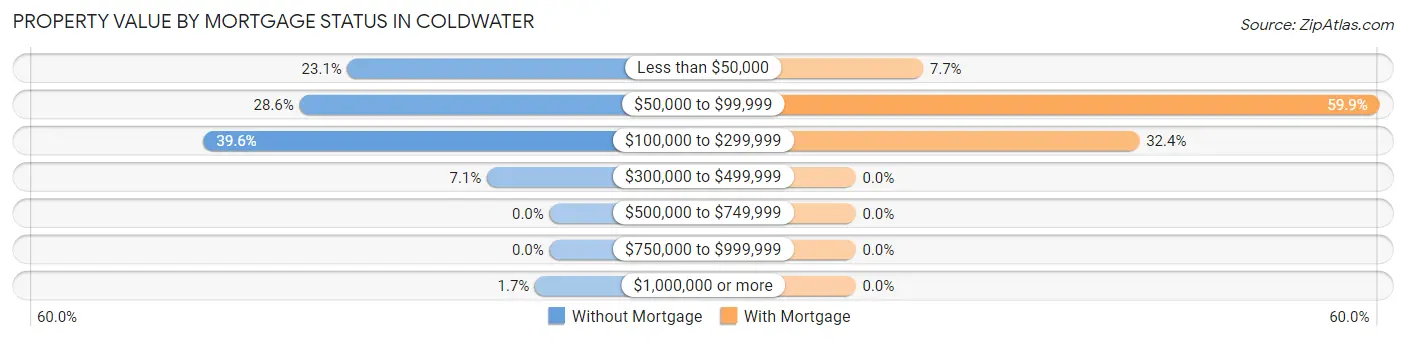
| Property Value | Without Mortgage | With Mortgage |
| Less than $50,000 | 42 (23.1%) | 14 (7.7%) |
| $50,000 to $99,999 | 52 (28.6%) | 109 (59.9%) |
| $100,000 to $299,999 | 72 (39.6%) | 59 (32.4%) |
| $300,000 to $499,999 | 13 (7.1%) | 0 (0.0%) |
| $500,000 to $749,999 | 0 (0.0%) | 0 (0.0%) |
| $750,000 to $999,999 | 0 (0.0%) | 0 (0.0%) |
| $1,000,000 or more | 3 (1.7%) | 0 (0.0%) |
| Total | 182 (100.0%) | 182 (100.0%) |
Household Income by Mortgage Status in Coldwater
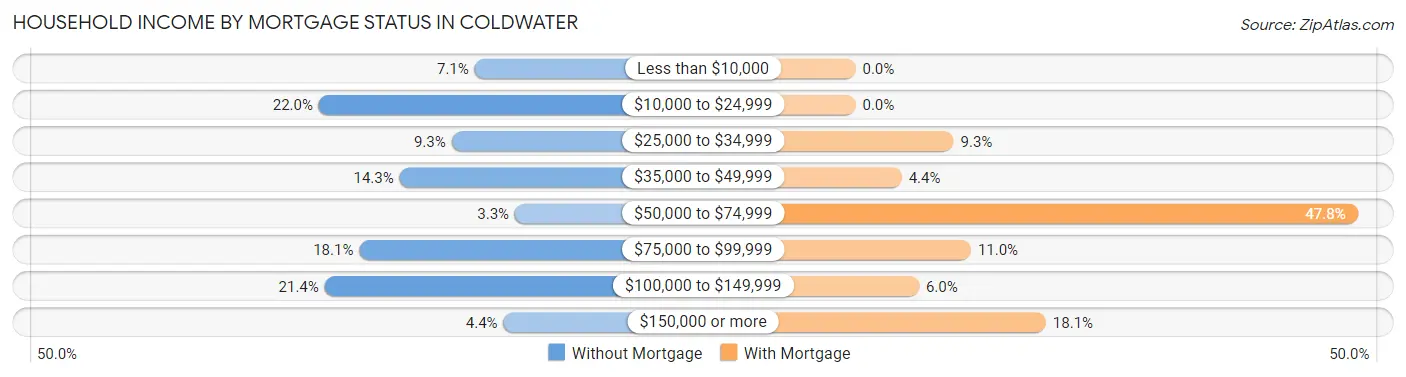
| Household Income | Without Mortgage | With Mortgage |
| Less than $10,000 | 13 (7.1%) | 0 (0.0%) |
| $10,000 to $24,999 | 40 (22.0%) | 0 (0.0%) |
| $25,000 to $34,999 | 17 (9.3%) | 17 (9.3%) |
| $35,000 to $49,999 | 26 (14.3%) | 8 (4.4%) |
| $50,000 to $74,999 | 6 (3.3%) | 87 (47.8%) |
| $75,000 to $99,999 | 33 (18.1%) | 20 (11.0%) |
| $100,000 to $149,999 | 39 (21.4%) | 11 (6.0%) |
| $150,000 or more | 8 (4.4%) | 33 (18.1%) |
| Total | 182 (100.0%) | 182 (100.0%) |
Property Value to Household Income Ratio in Coldwater
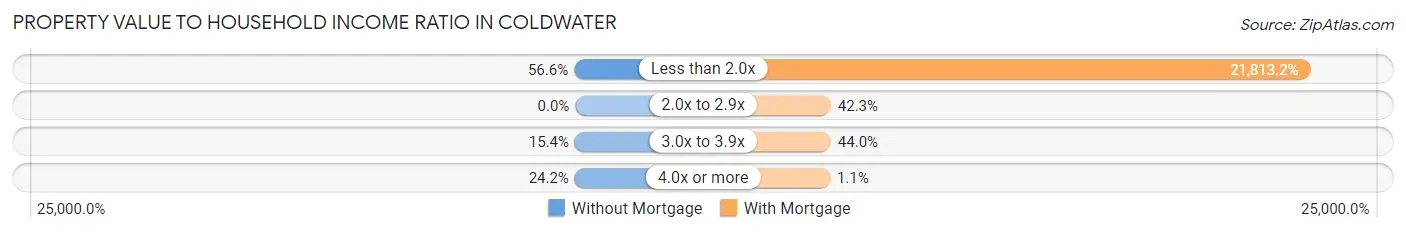
| Value-to-Income Ratio | Without Mortgage | With Mortgage |
| Less than 2.0x | 103 (56.6%) | 39,700 (21,813.2%) |
| 2.0x to 2.9x | 0 (0.0%) | 77 (42.3%) |
| 3.0x to 3.9x | 28 (15.4%) | 80 (44.0%) |
| 4.0x or more | 44 (24.2%) | 2 (1.1%) |
| Total | 182 (100.0%) | 182 (100.0%) |
Real Estate Taxes by Mortgage Status in Coldwater
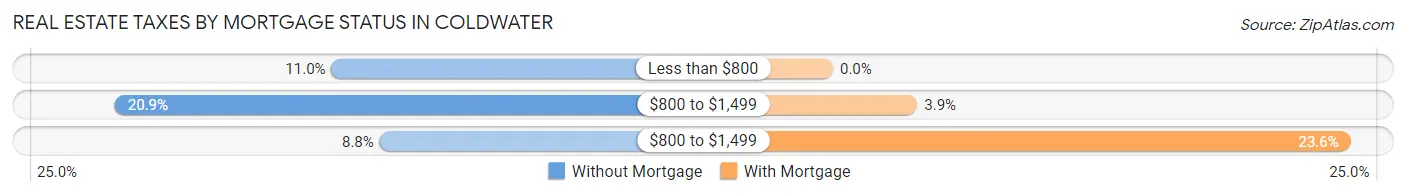
| Property Taxes | Without Mortgage | With Mortgage |
| Less than $800 | 20 (11.0%) | 0 (0.0%) |
| $800 to $1,499 | 38 (20.9%) | 7 (3.8%) |
| $800 to $1,499 | 16 (8.8%) | 43 (23.6%) |
| Total | 182 (100.0%) | 182 (100.0%) |
Health & Disability in Coldwater
Health Insurance Coverage by Age in Coldwater
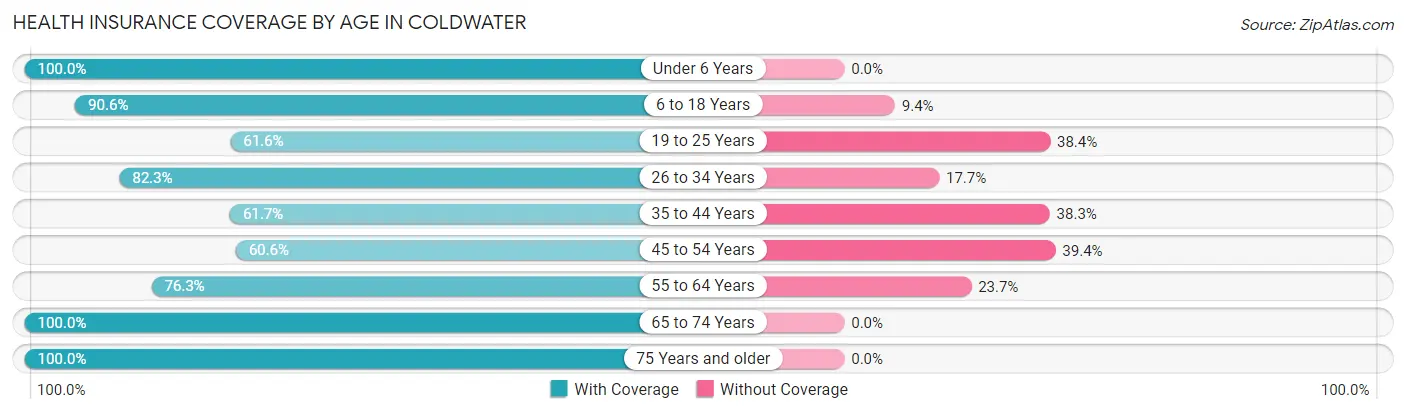
| Age Bracket | With Coverage | Without Coverage |
| Under 6 Years | 108 (100.0%) | 0 (0.0%) |
| 6 to 18 Years | 144 (90.6%) | 15 (9.4%) |
| 19 to 25 Years | 45 (61.6%) | 28 (38.4%) |
| 26 to 34 Years | 177 (82.3%) | 38 (17.7%) |
| 35 to 44 Years | 58 (61.7%) | 36 (38.3%) |
| 45 to 54 Years | 77 (60.6%) | 50 (39.4%) |
| 55 to 64 Years | 171 (76.3%) | 53 (23.7%) |
| 65 to 74 Years | 152 (100.0%) | 0 (0.0%) |
| 75 Years and older | 85 (100.0%) | 0 (0.0%) |
| Total | 1,017 (82.2%) | 220 (17.8%) |
Health Insurance Coverage by Citizenship Status in Coldwater
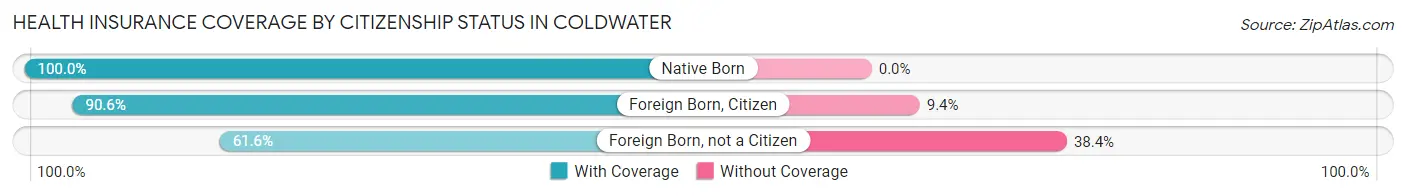
| Citizenship Status | With Coverage | Without Coverage |
| Native Born | 108 (100.0%) | 0 (0.0%) |
| Foreign Born, Citizen | 144 (90.6%) | 15 (9.4%) |
| Foreign Born, not a Citizen | 45 (61.6%) | 28 (38.4%) |
Health Insurance Coverage by Household Income in Coldwater
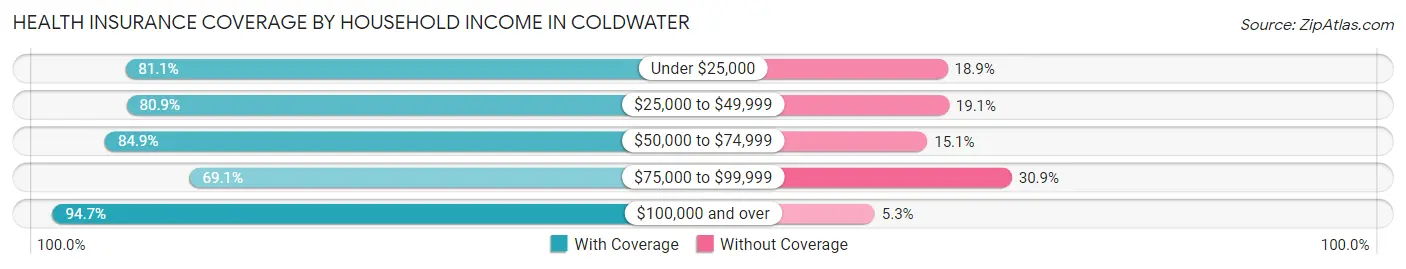
| Household Income | With Coverage | Without Coverage |
| Under $25,000 | 305 (81.1%) | 71 (18.9%) |
| $25,000 to $49,999 | 275 (80.9%) | 65 (19.1%) |
| $50,000 to $74,999 | 152 (84.9%) | 27 (15.1%) |
| $75,000 to $99,999 | 105 (69.1%) | 47 (30.9%) |
| $100,000 and over | 180 (94.7%) | 10 (5.3%) |
Public vs Private Health Insurance Coverage by Age in Coldwater
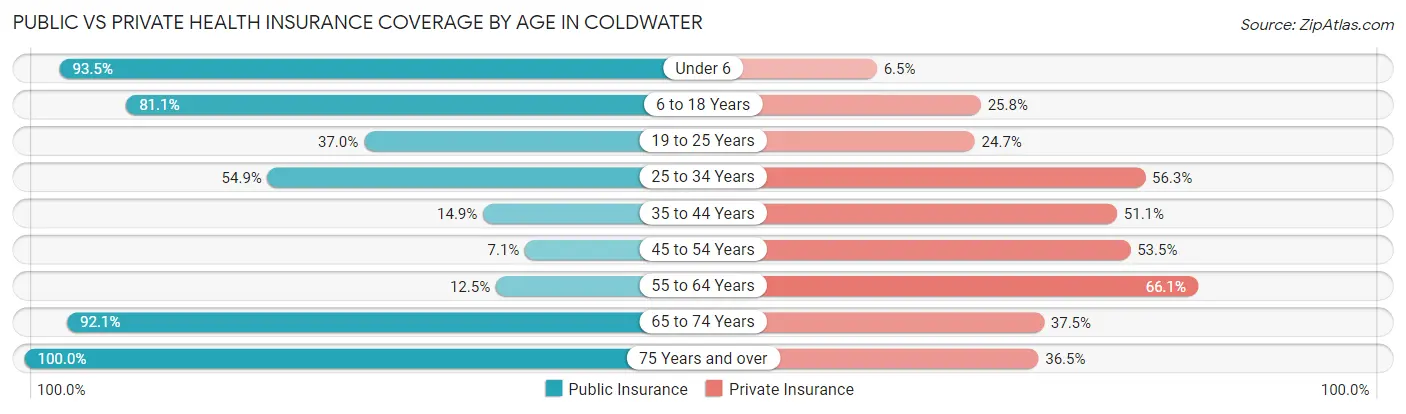
| Age Bracket | Public Insurance | Private Insurance |
| Under 6 | 101 (93.5%) | 7 (6.5%) |
| 6 to 18 Years | 129 (81.1%) | 41 (25.8%) |
| 19 to 25 Years | 27 (37.0%) | 18 (24.7%) |
| 25 to 34 Years | 118 (54.9%) | 121 (56.3%) |
| 35 to 44 Years | 14 (14.9%) | 48 (51.1%) |
| 45 to 54 Years | 9 (7.1%) | 68 (53.5%) |
| 55 to 64 Years | 28 (12.5%) | 148 (66.1%) |
| 65 to 74 Years | 140 (92.1%) | 57 (37.5%) |
| 75 Years and over | 85 (100.0%) | 31 (36.5%) |
| Total | 651 (52.6%) | 539 (43.6%) |
Disability Status by Sex by Age in Coldwater
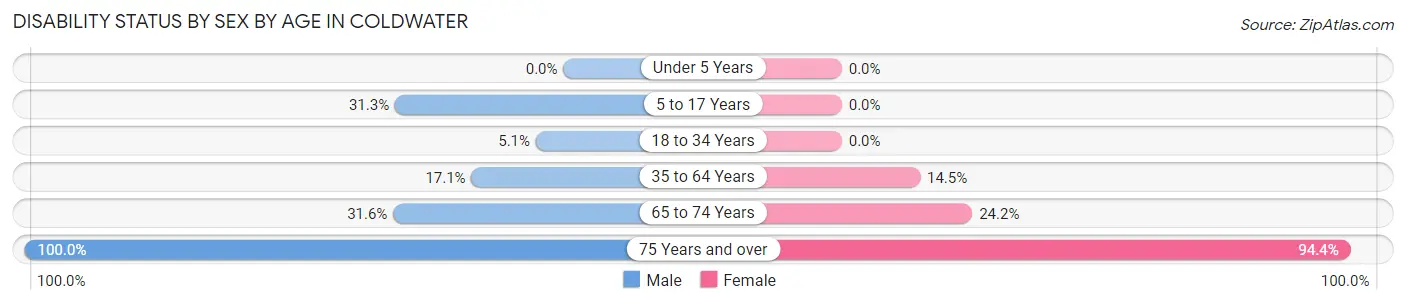
| Age Bracket | Male | Female |
| Under 5 Years | 0 (0.0%) | 0 (0.0%) |
| 5 to 17 Years | 20 (31.2%) | 0 (0.0%) |
| 18 to 34 Years | 5 (5.1%) | 0 (0.0%) |
| 35 to 64 Years | 36 (17.1%) | 34 (14.5%) |
| 65 to 74 Years | 18 (31.6%) | 23 (24.2%) |
| 75 Years and over | 13 (100.0%) | 68 (94.4%) |
Disability Class by Sex by Age in Coldwater
Disability Class: Hearing Difficulty
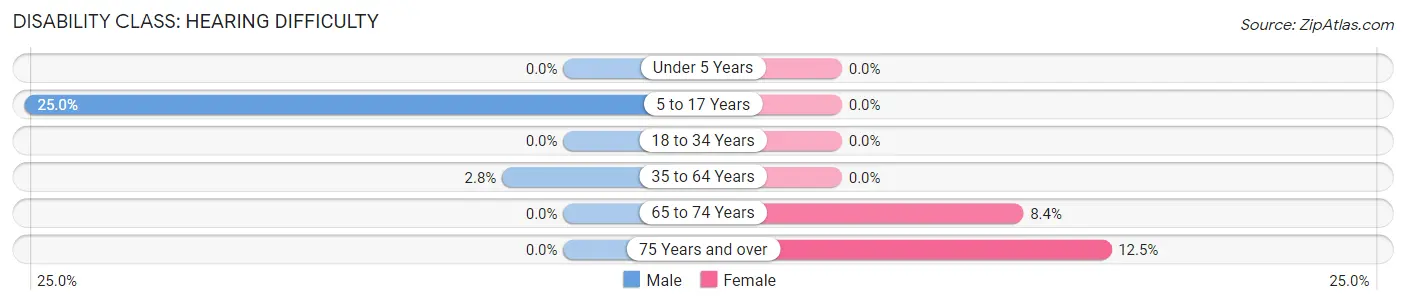
| Age Bracket | Male | Female |
| Under 5 Years | 0 (0.0%) | 0 (0.0%) |
| 5 to 17 Years | 16 (25.0%) | 0 (0.0%) |
| 18 to 34 Years | 0 (0.0%) | 0 (0.0%) |
| 35 to 64 Years | 6 (2.8%) | 0 (0.0%) |
| 65 to 74 Years | 0 (0.0%) | 8 (8.4%) |
| 75 Years and over | 0 (0.0%) | 9 (12.5%) |
Disability Class: Vision Difficulty
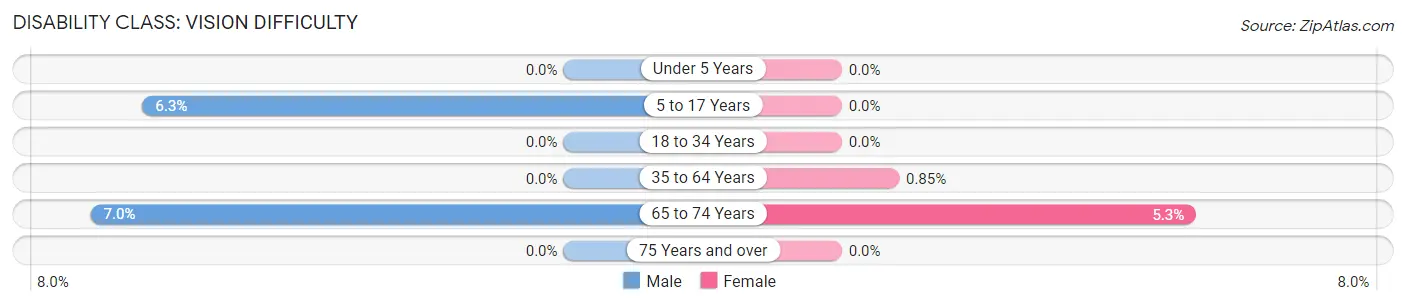
| Age Bracket | Male | Female |
| Under 5 Years | 0 (0.0%) | 0 (0.0%) |
| 5 to 17 Years | 4 (6.2%) | 0 (0.0%) |
| 18 to 34 Years | 0 (0.0%) | 0 (0.0%) |
| 35 to 64 Years | 0 (0.0%) | 2 (0.9%) |
| 65 to 74 Years | 4 (7.0%) | 5 (5.3%) |
| 75 Years and over | 0 (0.0%) | 0 (0.0%) |
Disability Class: Cognitive Difficulty
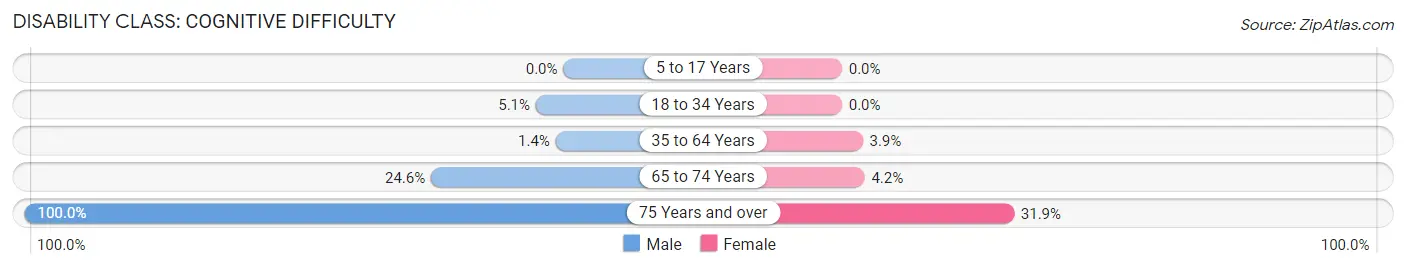
| Age Bracket | Male | Female |
| 5 to 17 Years | 0 (0.0%) | 0 (0.0%) |
| 18 to 34 Years | 5 (5.1%) | 0 (0.0%) |
| 35 to 64 Years | 3 (1.4%) | 9 (3.8%) |
| 65 to 74 Years | 14 (24.6%) | 4 (4.2%) |
| 75 Years and over | 13 (100.0%) | 23 (31.9%) |
Disability Class: Ambulatory Difficulty
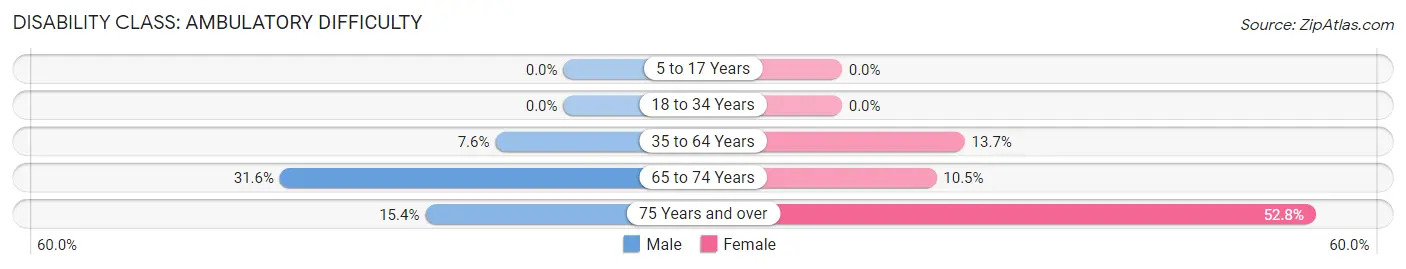
| Age Bracket | Male | Female |
| 5 to 17 Years | 0 (0.0%) | 0 (0.0%) |
| 18 to 34 Years | 0 (0.0%) | 0 (0.0%) |
| 35 to 64 Years | 16 (7.6%) | 32 (13.7%) |
| 65 to 74 Years | 18 (31.6%) | 10 (10.5%) |
| 75 Years and over | 2 (15.4%) | 38 (52.8%) |
Disability Class: Self-Care Difficulty
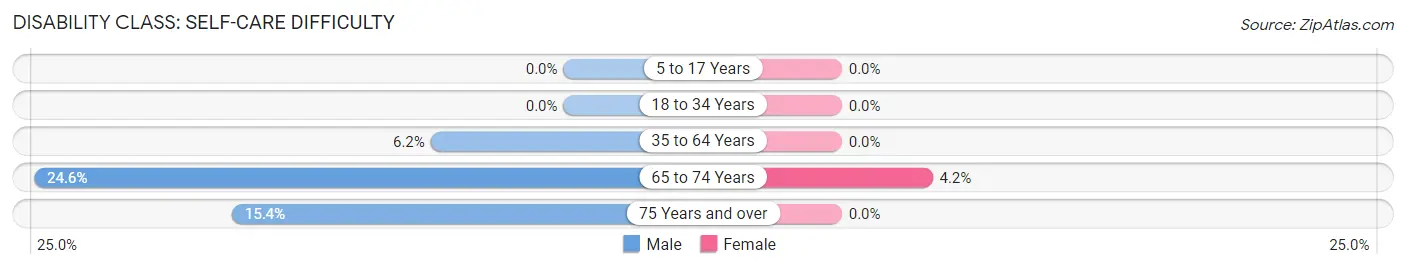
| Age Bracket | Male | Female |
| 5 to 17 Years | 0 (0.0%) | 0 (0.0%) |
| 18 to 34 Years | 0 (0.0%) | 0 (0.0%) |
| 35 to 64 Years | 13 (6.2%) | 0 (0.0%) |
| 65 to 74 Years | 14 (24.6%) | 4 (4.2%) |
| 75 Years and over | 2 (15.4%) | 0 (0.0%) |
Technology Access in Coldwater
Computing Device Access in Coldwater
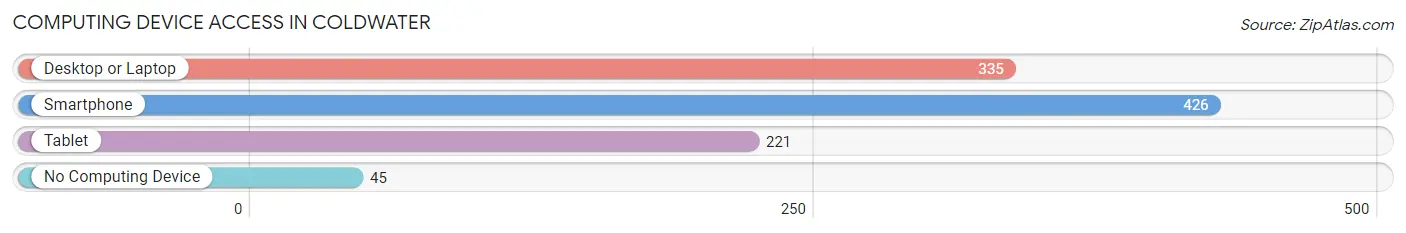
| Device Type | # Households | % Households |
| Desktop or Laptop | 335 | 60.8% |
| Smartphone | 426 | 77.3% |
| Tablet | 221 | 40.1% |
| No Computing Device | 45 | 8.2% |
| Total | 551 | 100.0% |
Internet Access in Coldwater
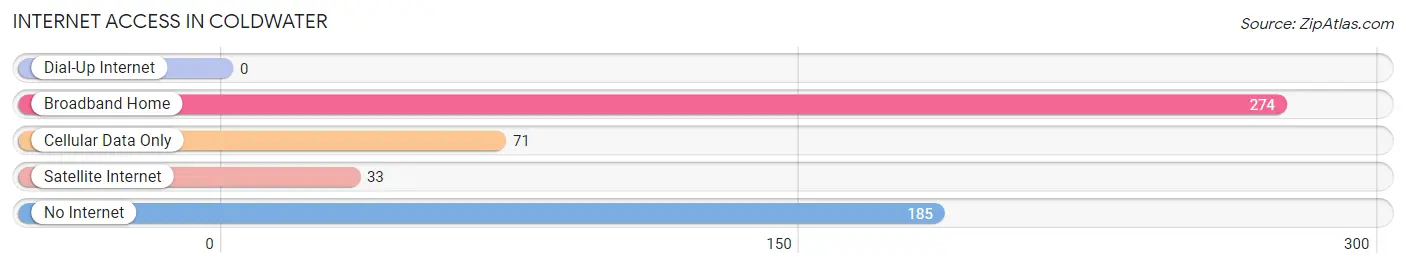
| Internet Type | # Households | % Households |
| Dial-Up Internet | 0 | 0.0% |
| Broadband Home | 274 | 49.7% |
| Cellular Data Only | 71 | 12.9% |
| Satellite Internet | 33 | 6.0% |
| No Internet | 185 | 33.6% |
| Total | 551 | 100.0% |
Coldwater Summary
Coldwater is a small town located in the northern part of Mississippi, in Tate County. It is situated on the banks of the Coldwater River, and is part of the Memphis metropolitan area. The town has a population of approximately 1,500 people, and is known for its rural charm and friendly atmosphere.
History
The area that is now Coldwater was first settled in the early 1800s by settlers from the nearby town of Hernando. The town was originally known as Coldwater Station, and was a stop on the Memphis and Charleston Railroad. In 1858, the town was officially incorporated as Coldwater.
During the Civil War, Coldwater was a major supply depot for the Confederate Army. After the war, the town experienced a period of growth and prosperity, and by the early 1900s, it had become a thriving agricultural center.
In the mid-1900s, Coldwater began to experience a decline in population as many of its residents moved away in search of better economic opportunities. However, in recent years, the town has seen a resurgence in population and economic activity.
Geography
Coldwater is located in the northern part of Mississippi, in Tate County. It is situated on the banks of the Coldwater River, and is part of the Memphis metropolitan area. The town has a total area of 1.3 square miles, all of which is land.
The town is located in a humid subtropical climate zone, and experiences hot, humid summers and mild winters. The average annual temperature is around 70 degrees Fahrenheit, and the average annual precipitation is around 50 inches.
Economy
The economy of Coldwater is largely based on agriculture. The town is home to several farms, which produce a variety of crops, including cotton, soybeans, corn, and wheat. The town also has a small manufacturing sector, which produces a variety of products, including furniture, clothing, and food products.
In addition to agriculture and manufacturing, Coldwater also has a thriving tourism industry. The town is home to several historic sites, including the Coldwater Depot Museum, which is dedicated to the town’s history. The town also has several parks and recreational areas, which attract visitors from all over the region.
Demographics
As of the 2010 census, Coldwater had a population of 1,500 people. The racial makeup of the town was 95.3% White, 2.7% African American, 0.3% Native American, 0.3% Asian, and 1.3% from other races. The median household income was $35,000, and the median family income was $41,000.
The town has a relatively low crime rate, and is considered to be a safe place to live. The town has a strong sense of community, and is known for its friendly atmosphere and rural charm.
Conclusion
Coldwater is a small town located in the northern part of Mississippi, in Tate County. It is situated on the banks of the Coldwater River, and is part of the Memphis metropolitan area. The town has a population of approximately 1,500 people, and is known for its rural charm and friendly atmosphere. The economy of Coldwater is largely based on agriculture, manufacturing, and tourism. The town has a relatively low crime rate, and is considered to be a safe place to live.
Common Questions
What is Per Capita Income in Coldwater?
Per Capita income in Coldwater is $27,257.
What is the Median Family Income in Coldwater?
Median Family Income in Coldwater is $39,567.
What is the Median Household income in Coldwater?
Median Household Income in Coldwater is $38,883.
What is Income or Wage Gap in Coldwater?
Income or Wage Gap in Coldwater is 39.7%.
Women in Coldwater earn 60.3 cents for every dollar earned by a man.
What is Inequality or Gini Index in Coldwater?
Inequality or Gini Index in Coldwater is 0.51.
What is the Total Population of Coldwater?
Total Population of Coldwater is 1,237.
What is the Total Male Population of Coldwater?
Total Male Population of Coldwater is 500.
What is the Total Female Population of Coldwater?
Total Female Population of Coldwater is 737.
What is the Ratio of Males per 100 Females in Coldwater?
There are 67.84 Males per 100 Females in Coldwater.
What is the Ratio of Females per 100 Males in Coldwater?
There are 147.40 Females per 100 Males in Coldwater.
What is the Median Population Age in Coldwater?
Median Population Age in Coldwater is 40.7 Years.
What is the Average Family Size in Coldwater
Average Family Size in Coldwater is 2.5 People.
What is the Average Household Size in Coldwater
Average Household Size in Coldwater is 2.2 People.
How Large is the Labor Force in Coldwater?
There are 576 People in the Labor Forcein in Coldwater.
What is the Percentage of People in the Labor Force in Coldwater?
57.9% of People are in the Labor Force in Coldwater.
What is the Unemployment Rate in Coldwater?
Unemployment Rate in Coldwater is 3.1%.