Union, MS Map & Demographics
Union Map
Union Overview
$16,216
PER CAPITA INCOME
$44,519
AVG FAMILY INCOME
$40,201
AVG HOUSEHOLD INCOME
15.9%
WAGE / INCOME GAP [ % ]
84.1¢/ $1
WAGE / INCOME GAP [ $ ]
0.50
INEQUALITY / GINI INDEX
2,780
TOTAL POPULATION
1,230
MALE POPULATION
1,550
FEMALE POPULATION
79.35
MALES / 100 FEMALES
126.02
FEMALES / 100 MALES
30.7
MEDIAN AGE
3.8
AVG FAMILY SIZE
3.0
AVG HOUSEHOLD SIZE
893
LABOR FORCE [ PEOPLE ]
46.5%
PERCENT IN LABOR FORCE
14.2%
UNEMPLOYMENT RATE
Union Zip Codes
Income in Union
Income Overview in Union
Per Capita Income in Union is $16,216, while median incomes of families and households are $44,519 and $40,201 respectively.
| Characteristic | Number | Measure |
| Per Capita Income | 2,780 | $16,216 |
| Median Family Income | 608 | $44,519 |
| Mean Family Income | 608 | $57,750 |
| Median Household Income | 887 | $40,201 |
| Mean Household Income | 887 | $48,997 |
| Income Deficit | 608 | $0 |
| Wage / Income Gap (%) | 2,780 | 15.87% |
| Wage / Income Gap ($) | 2,780 | 84.13¢ per $1 |
| Gini / Inequality Index | 2,780 | 0.50 |
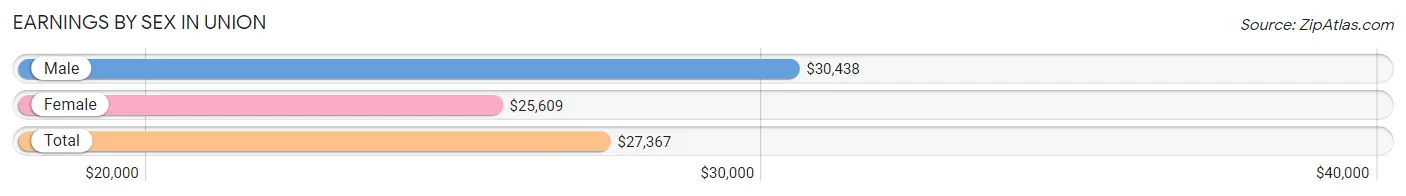
Earnings by Sex in Union
Average Earnings in Union are $27,367, $30,438 for men and $25,609 for women, a difference of 15.9%.
| Sex | Number | Average Earnings |
| Male | 457 (52.4%) | $30,438 |
| Female | 415 (47.6%) | $25,609 |
| Total | 872 (100.0%) | $27,367 |
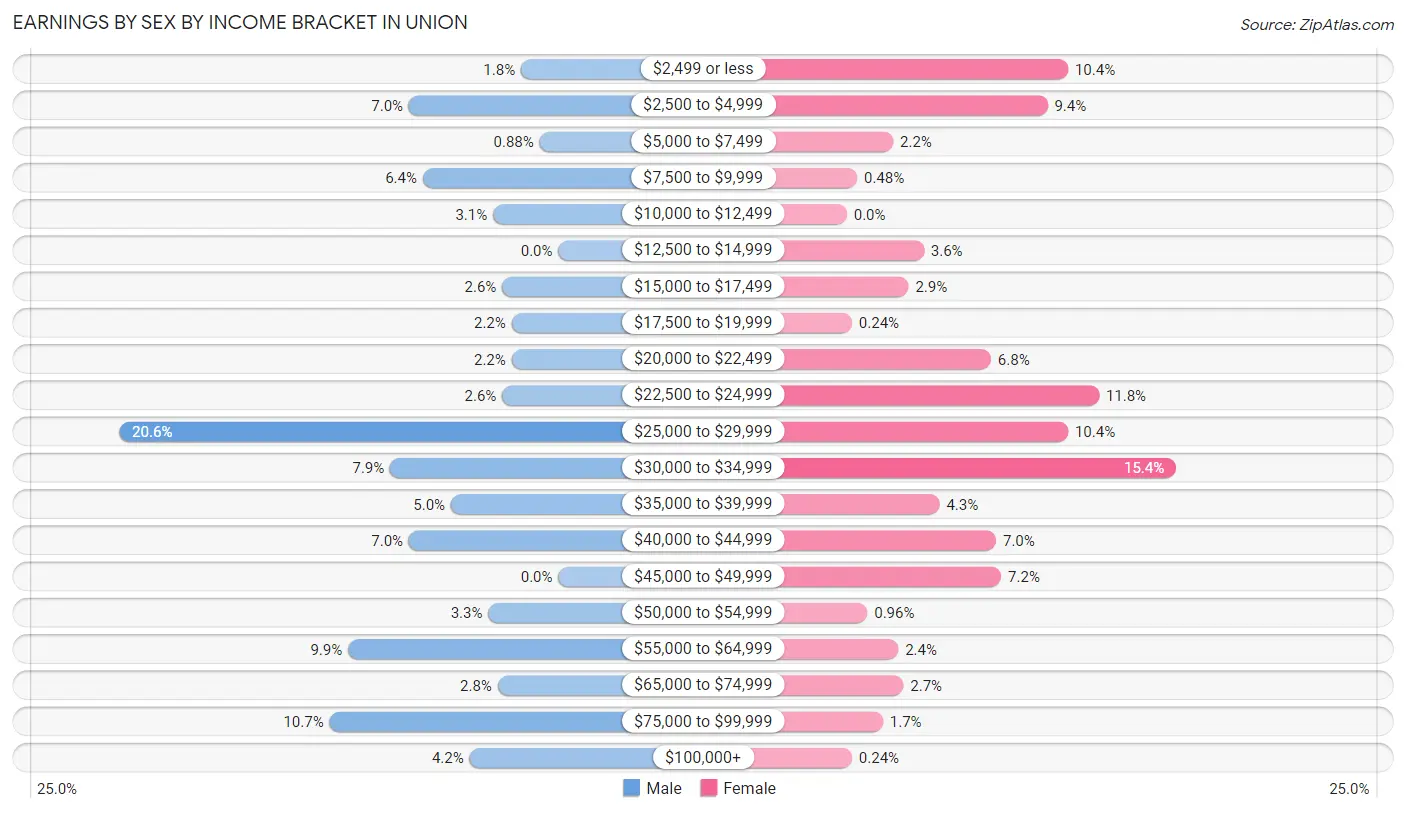
Earnings by Sex by Income Bracket in Union
The most common earnings brackets in Union are $25,000 to $29,999 for men (94 | 20.6%) and $30,000 to $34,999 for women (64 | 15.4%).
| Income | Male | Female |
| $2,499 or less | 8 (1.8%) | 43 (10.4%) |
| $2,500 to $4,999 | 32 (7.0%) | 39 (9.4%) |
| $5,000 to $7,499 | 4 (0.9%) | 9 (2.2%) |
| $7,500 to $9,999 | 29 (6.4%) | 2 (0.5%) |
| $10,000 to $12,499 | 14 (3.1%) | 0 (0.0%) |
| $12,500 to $14,999 | 0 (0.0%) | 15 (3.6%) |
| $15,000 to $17,499 | 12 (2.6%) | 12 (2.9%) |
| $17,500 to $19,999 | 10 (2.2%) | 1 (0.2%) |
| $20,000 to $22,499 | 10 (2.2%) | 28 (6.8%) |
| $22,500 to $24,999 | 12 (2.6%) | 49 (11.8%) |
| $25,000 to $29,999 | 94 (20.6%) | 43 (10.4%) |
| $30,000 to $34,999 | 36 (7.9%) | 64 (15.4%) |
| $35,000 to $39,999 | 23 (5.0%) | 18 (4.3%) |
| $40,000 to $44,999 | 32 (7.0%) | 29 (7.0%) |
| $45,000 to $49,999 | 0 (0.0%) | 30 (7.2%) |
| $50,000 to $54,999 | 15 (3.3%) | 4 (1.0%) |
| $55,000 to $64,999 | 45 (9.9%) | 10 (2.4%) |
| $65,000 to $74,999 | 13 (2.8%) | 11 (2.6%) |
| $75,000 to $99,999 | 49 (10.7%) | 7 (1.7%) |
| $100,000+ | 19 (4.2%) | 1 (0.2%) |
| Total | 457 (100.0%) | 415 (100.0%) |
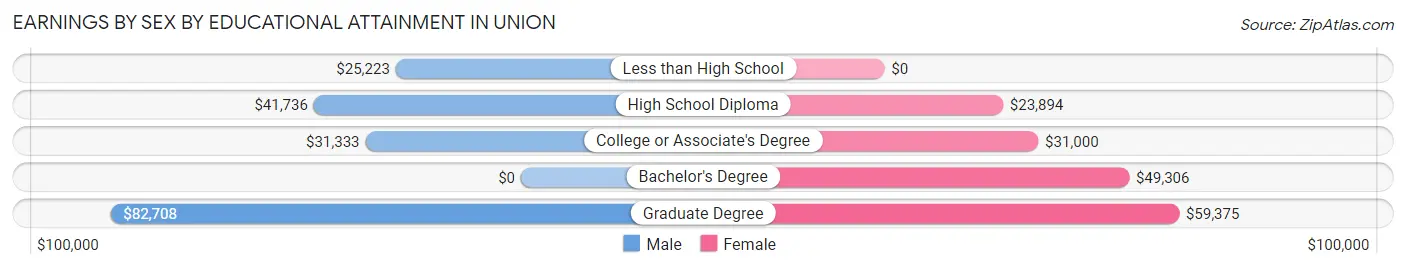
Earnings by Sex by Educational Attainment in Union
Average earnings in Union are $34,844 for men and $26,500 for women, a difference of 23.9%. Men with an educational attainment of graduate degree enjoy the highest average annual earnings of $82,708, while those with less than high school education earn the least with $25,223. Women with an educational attainment of graduate degree earn the most with the average annual earnings of $59,375, while those with high school diploma education have the smallest earnings of $23,894.
| Educational Attainment | Male Income | Female Income |
| Less than High School | $25,223 | $0 |
| High School Diploma | $41,736 | $23,894 |
| College or Associate's Degree | $31,333 | $31,000 |
| Bachelor's Degree | - | - |
| Graduate Degree | $82,708 | $59,375 |
| Total | $34,844 | $26,500 |
Family Income in Union
Family Income Brackets in Union
According to the Union family income data, there are 121 families falling into the $35,000 to $49,999 income range, which is the most common income bracket and makes up 19.9% of all families. Conversely, the $150,000 to $199,999 income bracket is the least frequent group with only 8 families (1.3%) belonging to this category.
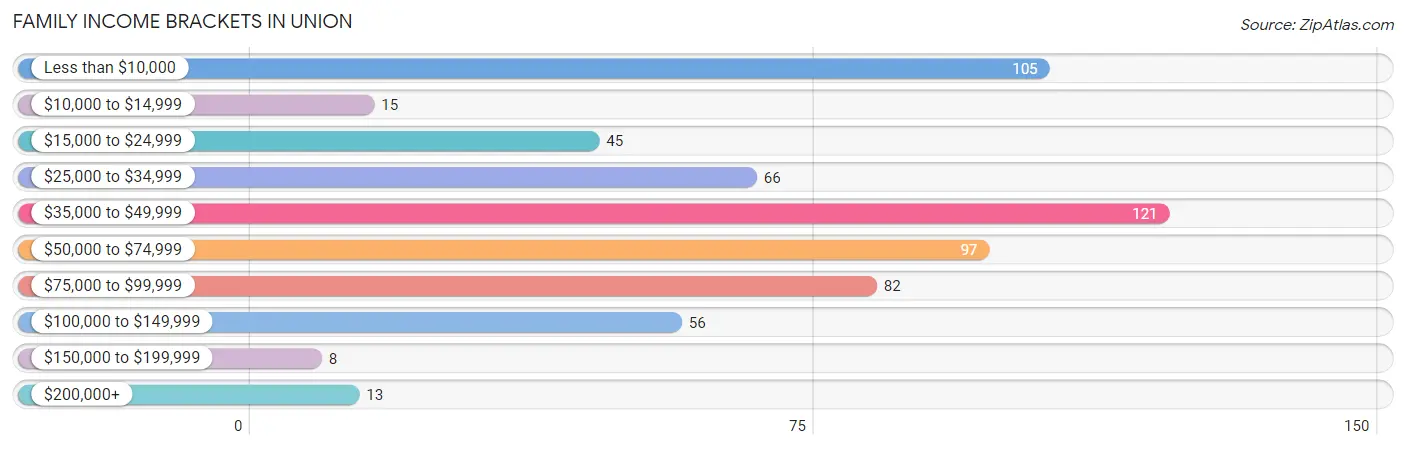
| Income Bracket | # Families | % Families |
| Less than $10,000 | 105 | 17.3% |
| $10,000 to $14,999 | 15 | 2.5% |
| $15,000 to $24,999 | 45 | 7.4% |
| $25,000 to $34,999 | 66 | 10.9% |
| $35,000 to $49,999 | 121 | 19.9% |
| $50,000 to $74,999 | 97 | 16.0% |
| $75,000 to $99,999 | 82 | 13.5% |
| $100,000 to $149,999 | 56 | 9.2% |
| $150,000 to $199,999 | 8 | 1.3% |
| $200,000+ | 13 | 2.1% |
Family Income by Famaliy Size in Union
4-person families (158 | 26.0%) account for the highest median family income in Union with $63,958 per family, while 2-person families (287 | 47.2%) have the highest median income of $20,024 per family member.
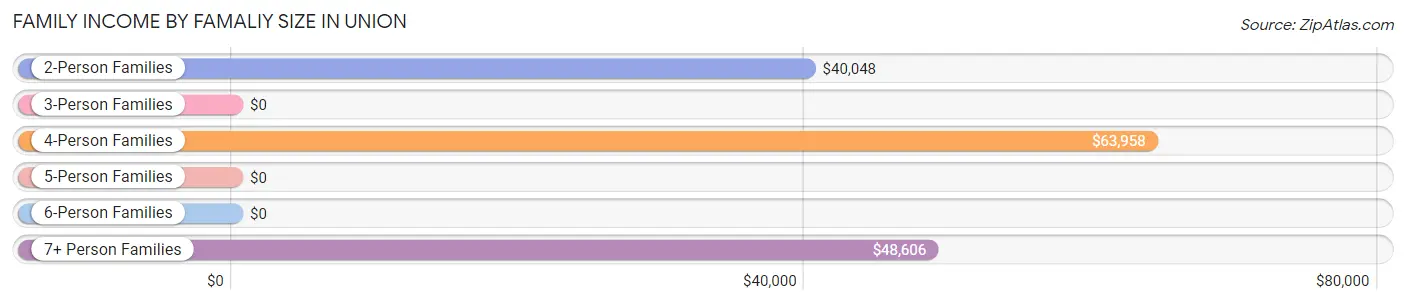
| Income Bracket | # Families | Median Income |
| 2-Person Families | 287 (47.2%) | $40,048 |
| 3-Person Families | 61 (10.0%) | $0 |
| 4-Person Families | 158 (26.0%) | $63,958 |
| 5-Person Families | 59 (9.7%) | $0 |
| 6-Person Families | 4 (0.7%) | $0 |
| 7+ Person Families | 39 (6.4%) | $48,606 |
| Total | 608 (100.0%) | $44,519 |
Family Income by Number of Earners in Union
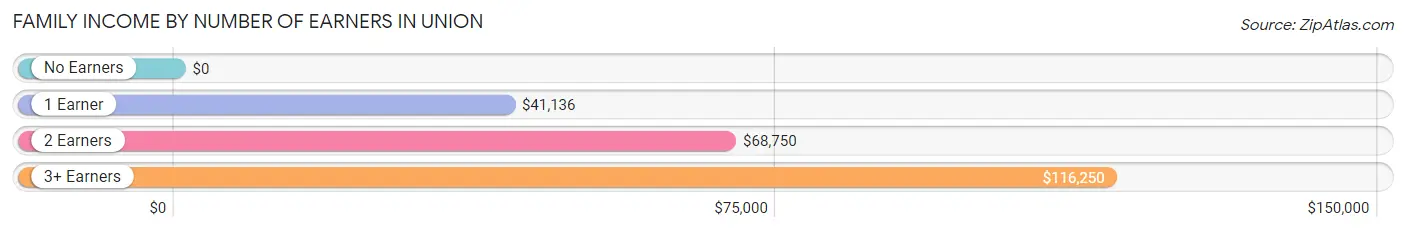
| Number of Earners | # Families | Median Income |
| No Earners | 186 (30.6%) | $0 |
| 1 Earner | 180 (29.6%) | $41,136 |
| 2 Earners | 214 (35.2%) | $68,750 |
| 3+ Earners | 28 (4.6%) | $116,250 |
| Total | 608 (100.0%) | $44,519 |
Household Income in Union
Household Income Brackets in Union
With 185 households falling in the category, the less than $10,000 income range is the most frequent in Union, accounting for 20.9% of all households. In contrast, only 8 households (0.9%) fall into the $150,000 to $199,999 income bracket, making it the least populous group.
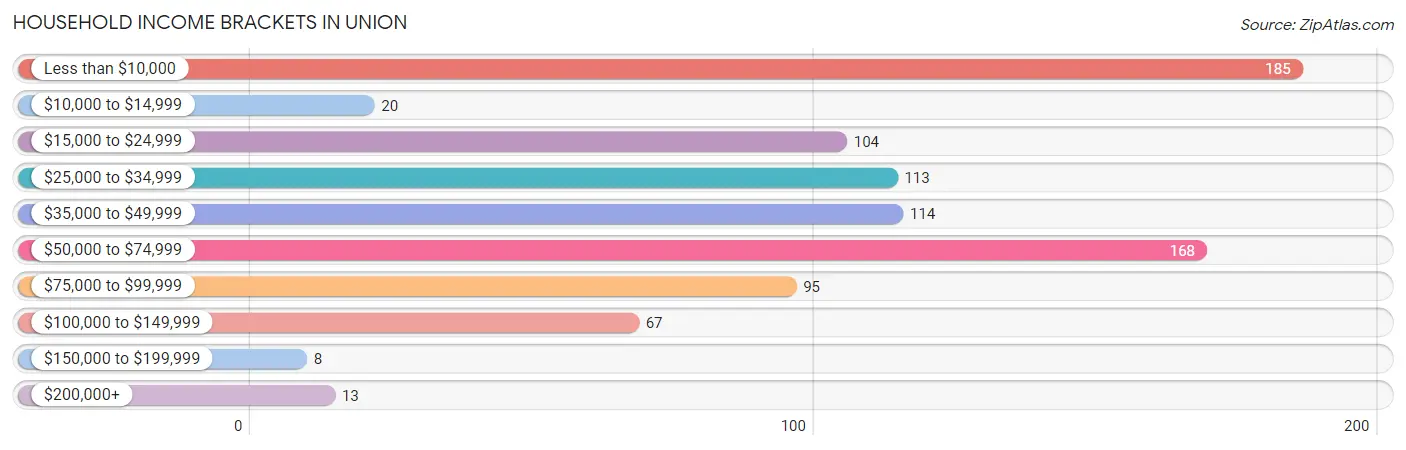
| Income Bracket | # Households | % Households |
| Less than $10,000 | 185 | 20.9% |
| $10,000 to $14,999 | 20 | 2.3% |
| $15,000 to $24,999 | 104 | 11.7% |
| $25,000 to $34,999 | 113 | 12.7% |
| $35,000 to $49,999 | 114 | 12.9% |
| $50,000 to $74,999 | 168 | 18.9% |
| $75,000 to $99,999 | 95 | 10.7% |
| $100,000 to $149,999 | 67 | 7.6% |
| $150,000 to $199,999 | 8 | 0.9% |
| $200,000+ | 13 | 1.5% |
Household Income by Householder Age in Union
The median household income in Union is $40,201, with the highest median household income of $51,500 found in the 45 to 64 years age bracket for the primary householder. A total of 296 households (33.4%) fall into this category. Meanwhile, the 15 to 24 years age bracket for the primary householder has the lowest median household income of $2,499, with 87 households (9.8%) in this group.
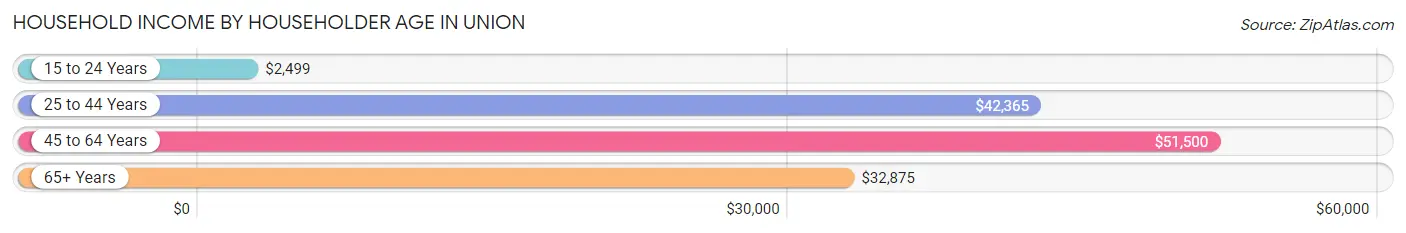
| Income Bracket | # Households | Median Income |
| 15 to 24 Years | 87 (9.8%) | $2,499 |
| 25 to 44 Years | 286 (32.2%) | $42,365 |
| 45 to 64 Years | 296 (33.4%) | $51,500 |
| 65+ Years | 218 (24.6%) | $32,875 |
| Total | 887 (100.0%) | $40,201 |
Poverty in Union
Income Below Poverty by Sex and Age in Union
With 30.2% poverty level for males and 39.2% for females among the residents of Union, under 5 year old males and 5 year old females are the most vulnerable to poverty, with 63 males (69.2%) and 46 females (100.0%) in their respective age groups living below the poverty level.
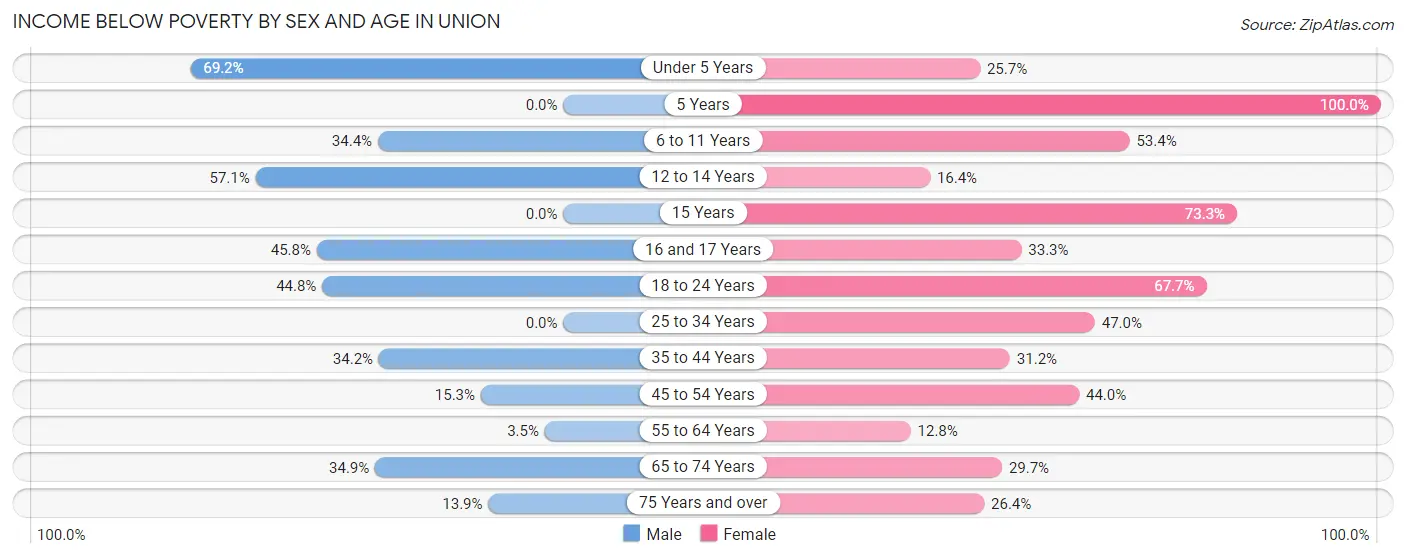
| Age Bracket | Male | Female |
| Under 5 Years | 63 (69.2%) | 49 (25.7%) |
| 5 Years | 0 (0.0%) | 46 (100.0%) |
| 6 to 11 Years | 53 (34.4%) | 102 (53.4%) |
| 12 to 14 Years | 60 (57.1%) | 9 (16.4%) |
| 15 Years | 0 (0.0%) | 11 (73.3%) |
| 16 and 17 Years | 27 (45.8%) | 18 (33.3%) |
| 18 to 24 Years | 47 (44.8%) | 115 (67.6%) |
| 25 to 34 Years | 0 (0.0%) | 54 (47.0%) |
| 35 to 44 Years | 51 (34.2%) | 39 (31.2%) |
| 45 to 54 Years | 15 (15.3%) | 48 (44.0%) |
| 55 to 64 Years | 5 (3.5%) | 18 (12.8%) |
| 65 to 74 Years | 29 (34.9%) | 22 (29.7%) |
| 75 Years and over | 11 (13.9%) | 56 (26.4%) |
| Total | 361 (30.2%) | 587 (39.2%) |
Income Above Poverty by Sex and Age in Union
According to the poverty statistics in Union, males aged 5 years and females aged 55 to 64 years are the age groups that are most secure financially, with 100.0% of males and 87.2% of females in these age groups living above the poverty line.
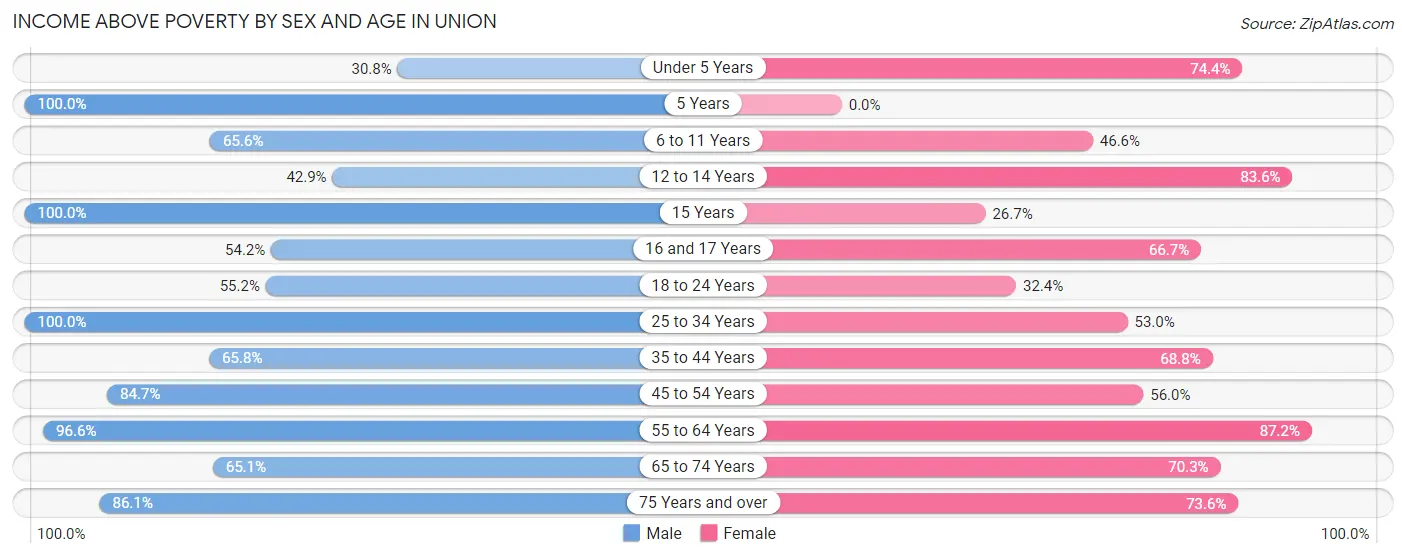
| Age Bracket | Male | Female |
| Under 5 Years | 28 (30.8%) | 142 (74.4%) |
| 5 Years | 4 (100.0%) | 0 (0.0%) |
| 6 to 11 Years | 101 (65.6%) | 89 (46.6%) |
| 12 to 14 Years | 45 (42.9%) | 46 (83.6%) |
| 15 Years | 5 (100.0%) | 4 (26.7%) |
| 16 and 17 Years | 32 (54.2%) | 36 (66.7%) |
| 18 to 24 Years | 58 (55.2%) | 55 (32.4%) |
| 25 to 34 Years | 120 (100.0%) | 61 (53.0%) |
| 35 to 44 Years | 98 (65.8%) | 86 (68.8%) |
| 45 to 54 Years | 83 (84.7%) | 61 (56.0%) |
| 55 to 64 Years | 140 (96.6%) | 123 (87.2%) |
| 65 to 74 Years | 54 (65.1%) | 52 (70.3%) |
| 75 Years and over | 68 (86.1%) | 156 (73.6%) |
| Total | 836 (69.8%) | 911 (60.8%) |
Income Below Poverty Among Married-Couple Families in Union
The poverty statistics for married-couple families in Union show that 1.5% or 5 of the total 340 families live below the poverty line. Families with 3 or 4 children have the highest poverty rate of 10.7%, comprising of 3 families. On the other hand, families with 1 or 2 children have the lowest poverty rate of 0.0%, which includes 0 families.
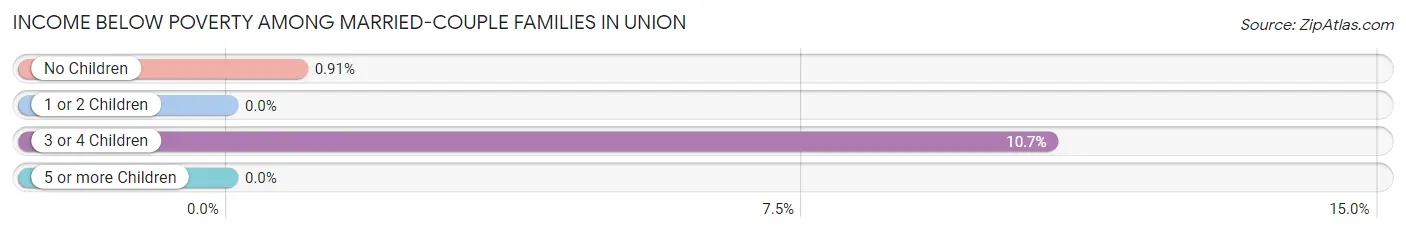
| Children | Above Poverty | Below Poverty |
| No Children | 218 (99.1%) | 2 (0.9%) |
| 1 or 2 Children | 61 (100.0%) | 0 (0.0%) |
| 3 or 4 Children | 25 (89.3%) | 3 (10.7%) |
| 5 or more Children | 31 (100.0%) | 0 (0.0%) |
| Total | 335 (98.5%) | 5 (1.5%) |
Income Below Poverty Among Single-Parent Households in Union
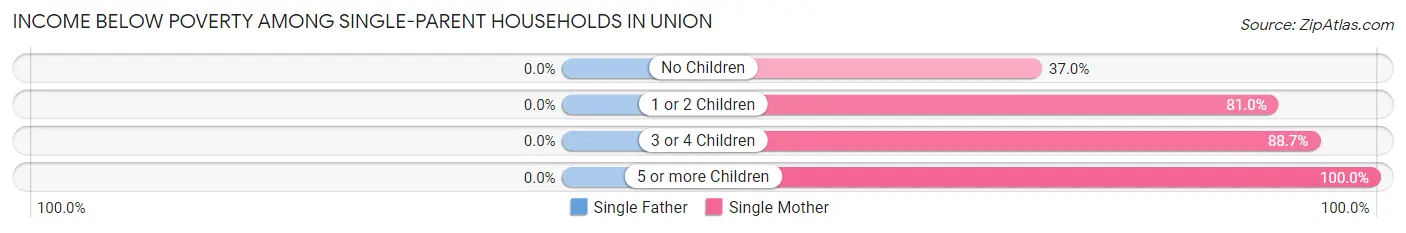
| Children | Single Father | Single Mother |
| No Children | 0 (0.0%) | 17 (37.0%) |
| 1 or 2 Children | 0 (0.0%) | 98 (81.0%) |
| 3 or 4 Children | 0 (0.0%) | 63 (88.7%) |
| 5 or more Children | 0 (0.0%) | 8 (100.0%) |
| Total | 0 (0.0%) | 186 (75.6%) |
Income Below Poverty Among Married-Couple vs Single-Parent Households in Union
The poverty data for Union shows that 5 of the married-couple family households (1.5%) and 186 of the single-parent households (69.4%) are living below the poverty level. Within the married-couple family households, those with 3 or 4 children have the highest poverty rate, with 3 households (10.7%) falling below the poverty line. Among the single-parent households, those with 5 or more children have the highest poverty rate, with 8 household (100.0%) living below poverty.
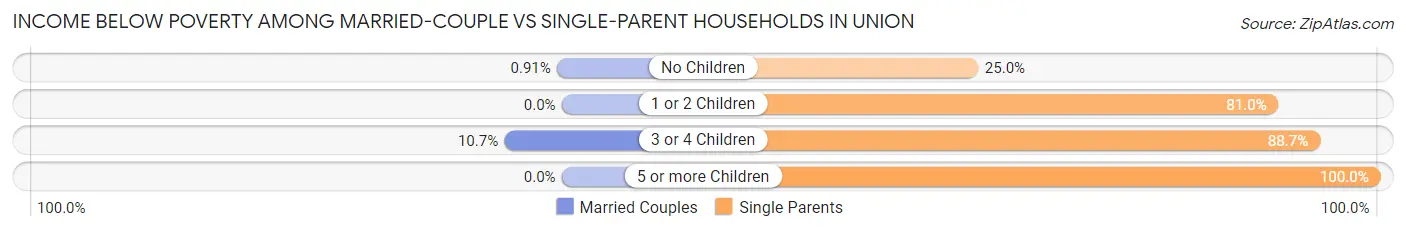
| Children | Married-Couple Families | Single-Parent Households |
| No Children | 2 (0.9%) | 17 (25.0%) |
| 1 or 2 Children | 0 (0.0%) | 98 (81.0%) |
| 3 or 4 Children | 3 (10.7%) | 63 (88.7%) |
| 5 or more Children | 0 (0.0%) | 8 (100.0%) |
| Total | 5 (1.5%) | 186 (69.4%) |
Race in Union
The most populous races in Union are Black / African American (1,501 | 54.0%), White / Caucasian (1,097 | 39.5%), and Two or more Races (141 | 5.1%).
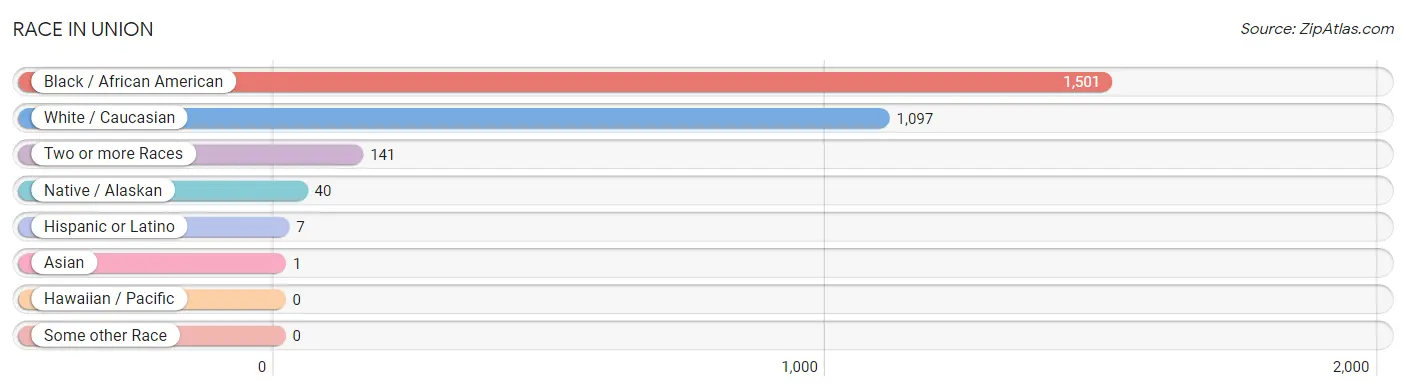
| Race | # Population | % Population |
| Asian | 1 | 0.0% |
| Black / African American | 1,501 | 54.0% |
| Hawaiian / Pacific | 0 | 0.0% |
| Hispanic or Latino | 7 | 0.3% |
| Native / Alaskan | 40 | 1.4% |
| White / Caucasian | 1,097 | 39.5% |
| Two or more Races | 141 | 5.1% |
| Some other Race | 0 | 0.0% |
| Total | 2,780 | 100.0% |
Ancestry in Union
The most populous ancestries reported in Union are American (378 | 13.6%), Irish (169 | 6.1%), English (93 | 3.4%), Choctaw (40 | 1.4%), and African (24 | 0.9%), together accounting for 25.3% of all Union residents.
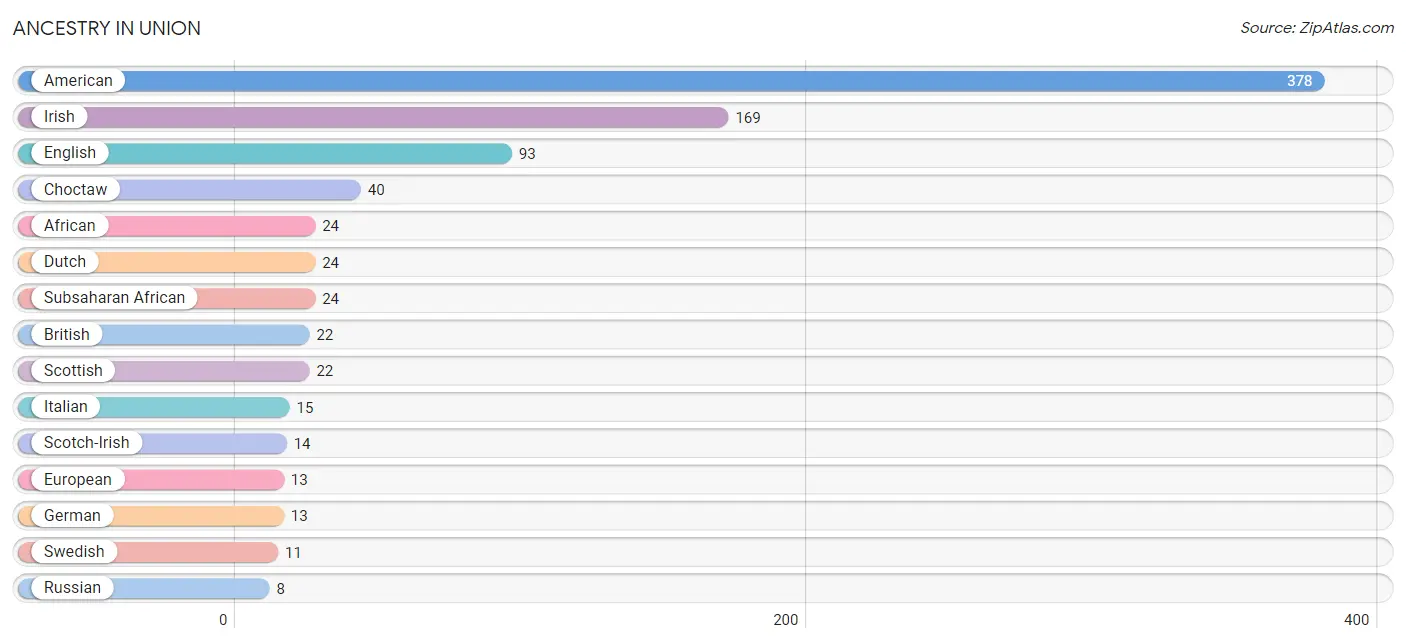
| Ancestry | # Population | % Population |
| African | 24 | 0.9% |
| American | 378 | 13.6% |
| Austrian | 5 | 0.2% |
| British | 22 | 0.8% |
| Choctaw | 40 | 1.4% |
| Cuban | 3 | 0.1% |
| Czech | 3 | 0.1% |
| Dutch | 24 | 0.9% |
| English | 93 | 3.4% |
| European | 13 | 0.5% |
| French Canadian | 4 | 0.1% |
| German | 13 | 0.5% |
| Indian (Asian) | 4 | 0.1% |
| Irish | 169 | 6.1% |
| Italian | 15 | 0.5% |
| Russian | 8 | 0.3% |
| Scotch-Irish | 14 | 0.5% |
| Scottish | 22 | 0.8% |
| Spaniard | 4 | 0.1% |
| Subsaharan African | 24 | 0.9% |
| Swedish | 11 | 0.4% | View All 21 Rows |
Immigrants in Union
The most numerous immigrant groups reported in Union came from Guyana (2 | 0.1%), Latin America (2 | 0.1%), South America (2 | 0.1%), Asia (1 | 0.0%), and China (1 | 0.0%), together accounting for 0.3% of all Union residents.
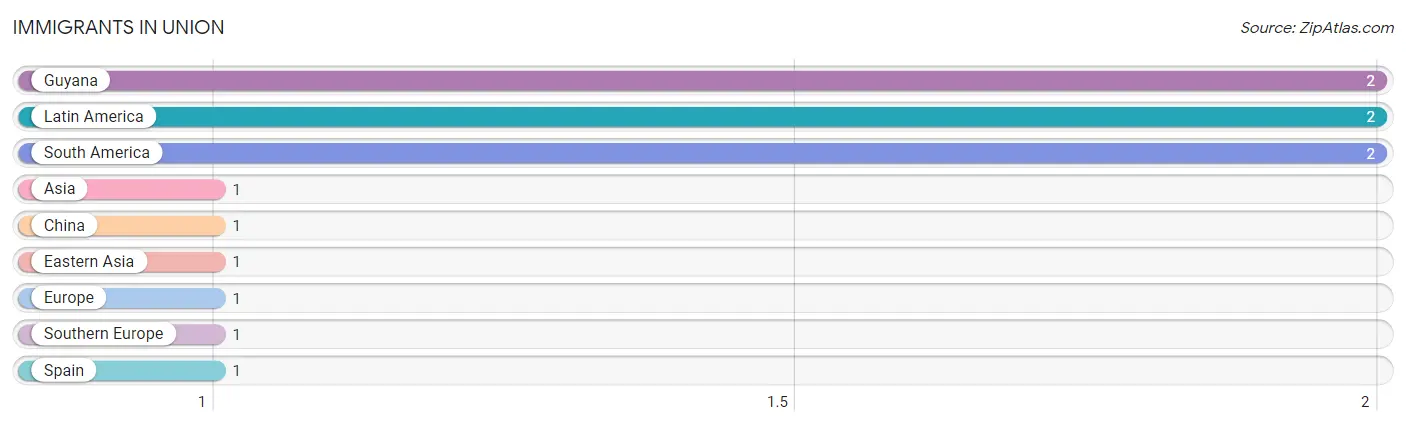
| Immigration Origin | # Population | % Population |
| Asia | 1 | 0.0% |
| China | 1 | 0.0% |
| Eastern Asia | 1 | 0.0% |
| Europe | 1 | 0.0% |
| Guyana | 2 | 0.1% |
| Latin America | 2 | 0.1% |
| South America | 2 | 0.1% |
| Southern Europe | 1 | 0.0% |
| Spain | 1 | 0.0% | View All 9 Rows |
Sex and Age in Union
Sex and Age in Union
The most populous age groups in Union are 10 to 14 Years (183 | 14.9%) for men and Under 5 Years (191 | 12.3%) for women.
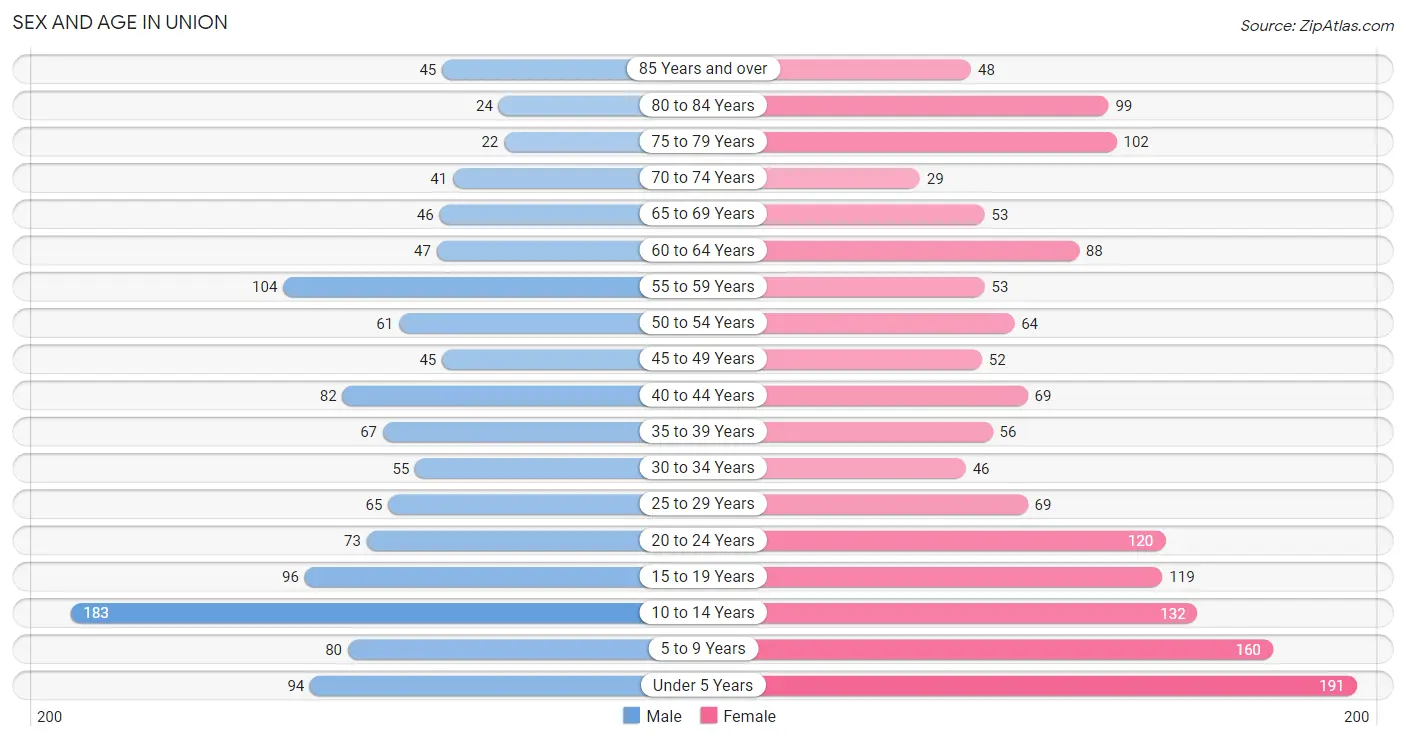
| Age Bracket | Male | Female |
| Under 5 Years | 94 (7.6%) | 191 (12.3%) |
| 5 to 9 Years | 80 (6.5%) | 160 (10.3%) |
| 10 to 14 Years | 183 (14.9%) | 132 (8.5%) |
| 15 to 19 Years | 96 (7.8%) | 119 (7.7%) |
| 20 to 24 Years | 73 (5.9%) | 120 (7.7%) |
| 25 to 29 Years | 65 (5.3%) | 69 (4.4%) |
| 30 to 34 Years | 55 (4.5%) | 46 (3.0%) |
| 35 to 39 Years | 67 (5.4%) | 56 (3.6%) |
| 40 to 44 Years | 82 (6.7%) | 69 (4.4%) |
| 45 to 49 Years | 45 (3.7%) | 52 (3.4%) |
| 50 to 54 Years | 61 (5.0%) | 64 (4.1%) |
| 55 to 59 Years | 104 (8.5%) | 53 (3.4%) |
| 60 to 64 Years | 47 (3.8%) | 88 (5.7%) |
| 65 to 69 Years | 46 (3.7%) | 53 (3.4%) |
| 70 to 74 Years | 41 (3.3%) | 29 (1.9%) |
| 75 to 79 Years | 22 (1.8%) | 102 (6.6%) |
| 80 to 84 Years | 24 (1.9%) | 99 (6.4%) |
| 85 Years and over | 45 (3.7%) | 48 (3.1%) |
| Total | 1,230 (100.0%) | 1,550 (100.0%) |
Families and Households in Union
Median Family Size in Union
The median family size in Union is 3.78 persons per family, with single female/mother families (246 | 40.5%) accounting for the largest median family size of 4.14 persons per family. On the other hand, single male/father families (22 | 3.6%) represent the smallest median family size with 2.14 persons per family.
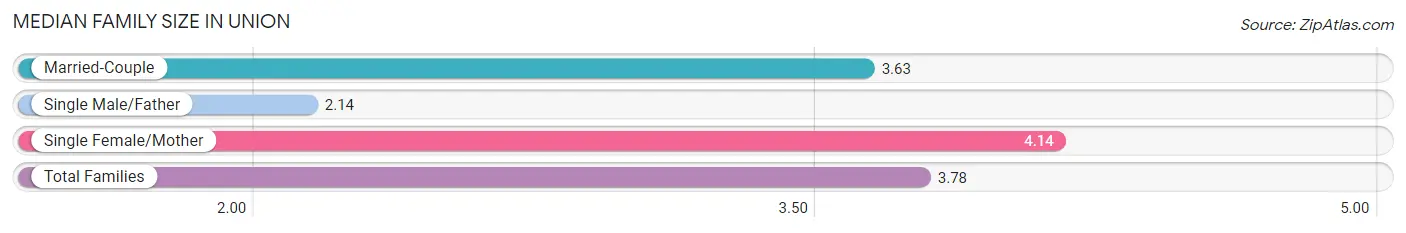
| Family Type | # Families | Family Size |
| Married-Couple | 340 (55.9%) | 3.63 |
| Single Male/Father | 22 (3.6%) | 2.14 |
| Single Female/Mother | 246 (40.5%) | 4.14 |
| Total Families | 608 (100.0%) | 3.78 |
Median Household Size in Union
The median household size in Union is 3.04 persons per household, with single female/mother households (246 | 27.7%) accounting for the largest median household size of 4.38 persons per household. non-family households (279 | 31.5%) represent the smallest median household size with 1.13 persons per household.
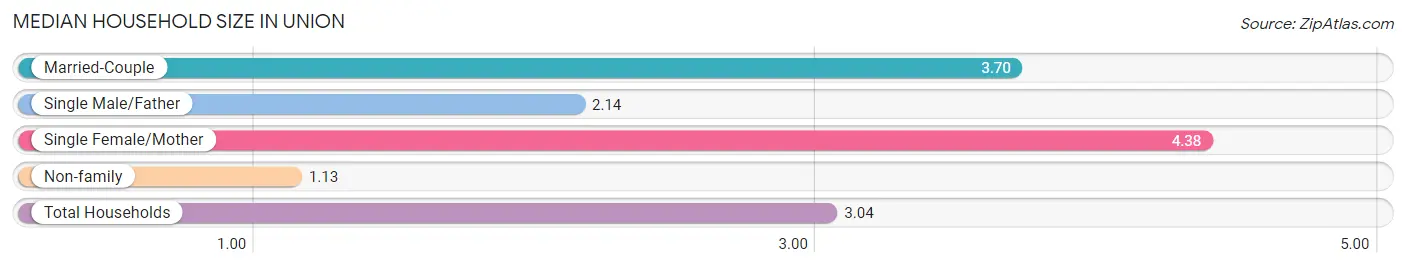
| Household Type | # Households | Household Size |
| Married-Couple | 340 (38.3%) | 3.70 |
| Single Male/Father | 22 (2.5%) | 2.14 |
| Single Female/Mother | 246 (27.7%) | 4.38 |
| Non-family | 279 (31.5%) | 1.13 |
| Total Households | 887 (100.0%) | 3.04 |
Household Size by Marriage Status in Union
Out of a total of 887 households in Union, 608 (68.5%) are family households, while 279 (31.5%) are nonfamily households. The most numerous type of family households are 2-person households, comprising 262, and the most common type of nonfamily households are 1-person households, comprising 244.
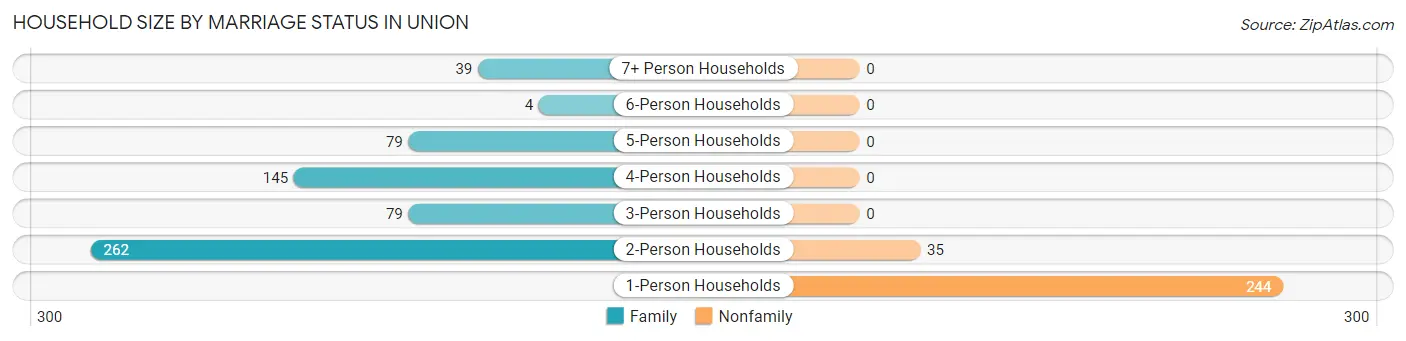
| Household Size | Family Households | Nonfamily Households |
| 1-Person Households | - | 244 (27.5%) |
| 2-Person Households | 262 (29.5%) | 35 (4.0%) |
| 3-Person Households | 79 (8.9%) | 0 (0.0%) |
| 4-Person Households | 145 (16.4%) | 0 (0.0%) |
| 5-Person Households | 79 (8.9%) | 0 (0.0%) |
| 6-Person Households | 4 (0.4%) | 0 (0.0%) |
| 7+ Person Households | 39 (4.4%) | 0 (0.0%) |
| Total | 608 (68.5%) | 279 (31.5%) |
Female Fertility in Union
Fertility by Age in Union
Average fertility rate in Union is 144.0 births per 1,000 women. Women in the age bracket of 20 to 34 years have the highest fertility rate with 260.0 births per 1,000 women. Women in the age bracket of 20 to 34 years acount for 77.2% of all women with births.
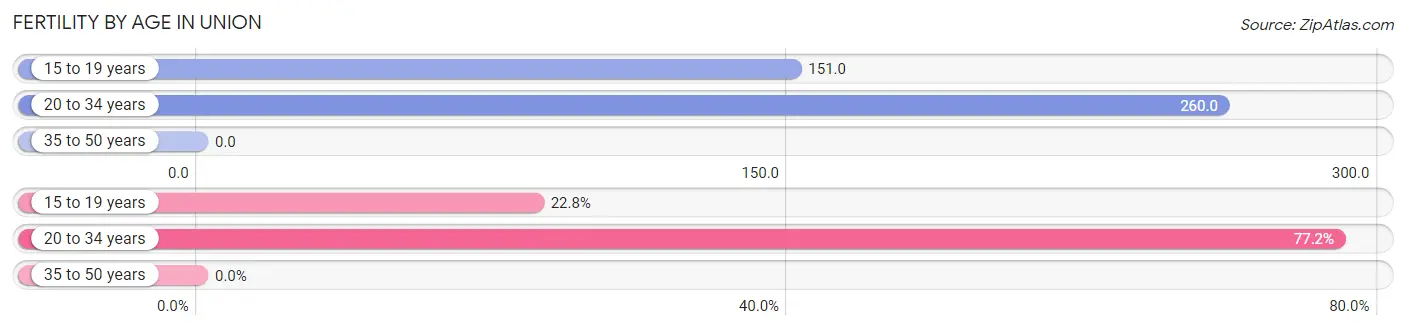
| Age Bracket | Women with Births | Births / 1,000 Women |
| 15 to 19 years | 18 (22.8%) | 151.0 |
| 20 to 34 years | 61 (77.2%) | 260.0 |
| 35 to 50 years | 0 (0.0%) | 0.0 |
| Total | 79 (100.0%) | 144.0 |
Fertility by Age by Marriage Status in Union
6.3% of women with births (79) in Union are married. The highest percentage of unmarried women with births falls into 15 to 19 years age bracket with 100.0% of them unmarried at the time of birth, while the lowest percentage of unmarried women with births belong to 20 to 34 years age bracket with 91.8% of them unmarried.
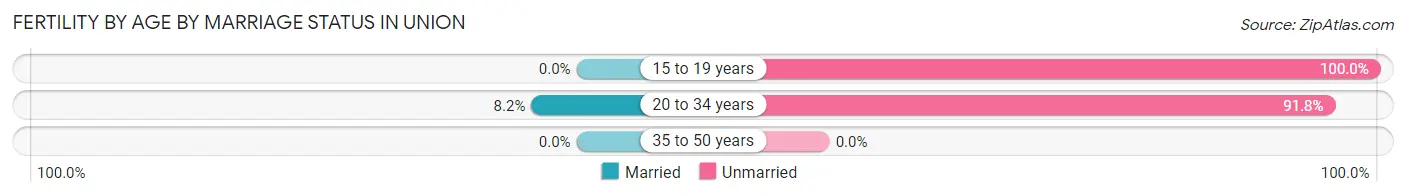
| Age Bracket | Married | Unmarried |
| 15 to 19 years | 0 (0.0%) | 18 (100.0%) |
| 20 to 34 years | 5 (8.2%) | 56 (91.8%) |
| 35 to 50 years | 0 (0.0%) | 0 (0.0%) |
| Total | 5 (6.3%) | 74 (93.7%) |
Fertility by Education in Union
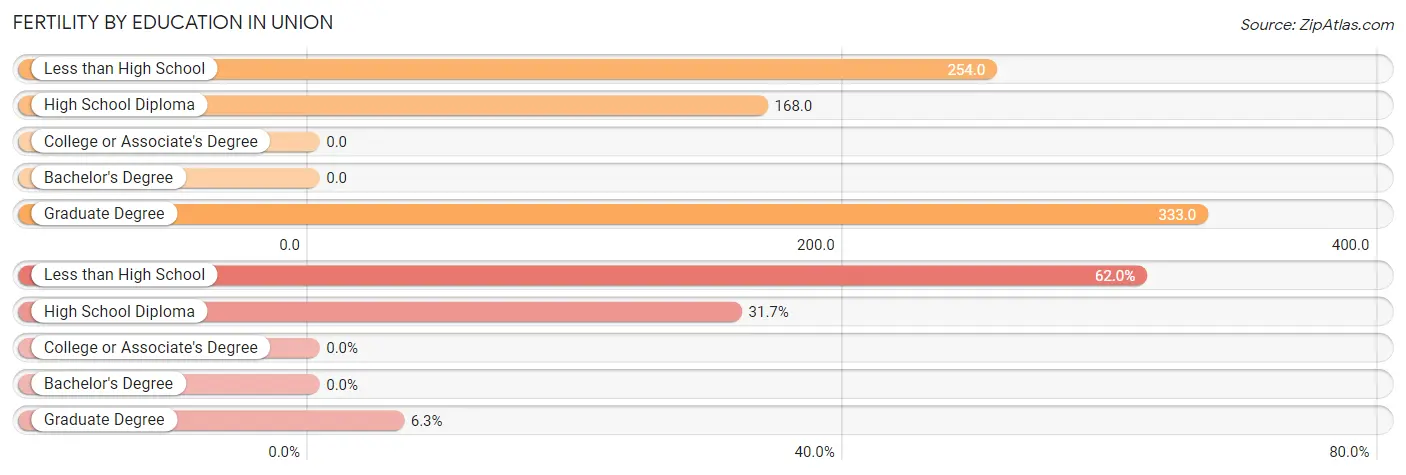
| Educational Attainment | Women with Births | Births / 1,000 Women |
| Less than High School | 49 (62.0%) | 254.0 |
| High School Diploma | 25 (31.7%) | 168.0 |
| College or Associate's Degree | 0 (0.0%) | 0.0 |
| Bachelor's Degree | 0 (0.0%) | 0.0 |
| Graduate Degree | 5 (6.3%) | 333.0 |
| Total | 79 (100.0%) | 144.0 |
Fertility by Education by Marriage Status in Union
93.7% of women with births in Union are unmarried. Women with the educational attainment of graduate degree are most likely to be married with 100.0% of them married at childbirth, while women with the educational attainment of less than high school are least likely to be married with 100.0% of them unmarried at childbirth.
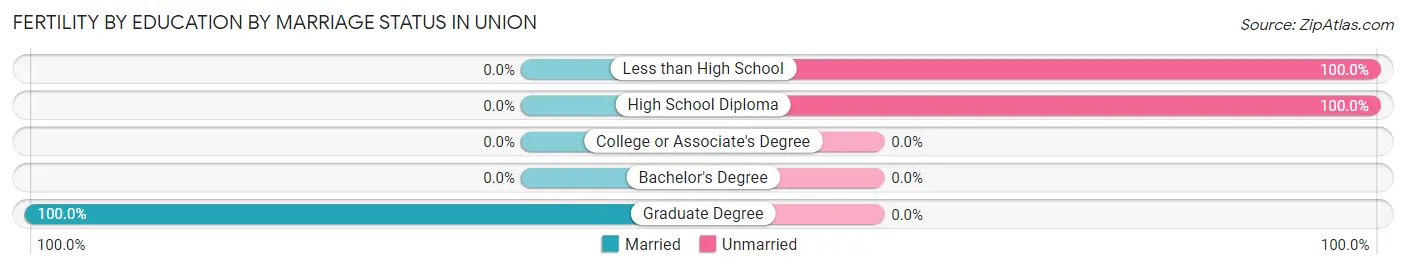
| Educational Attainment | Married | Unmarried |
| Less than High School | 0 (0.0%) | 49 (100.0%) |
| High School Diploma | 0 (0.0%) | 25 (100.0%) |
| College or Associate's Degree | 0 (0.0%) | 0 (0.0%) |
| Bachelor's Degree | 0 (0.0%) | 0 (0.0%) |
| Graduate Degree | 5 (100.0%) | 0 (0.0%) |
| Total | 5 (6.3%) | 74 (93.7%) |
Employment Characteristics in Union
Employment by Class of Employer in Union
Among the 758 employed individuals in Union, private company employees (451 | 59.5%), state government employees (99 | 13.1%), and local government employees (84 | 11.1%) make up the most common classes of employment.
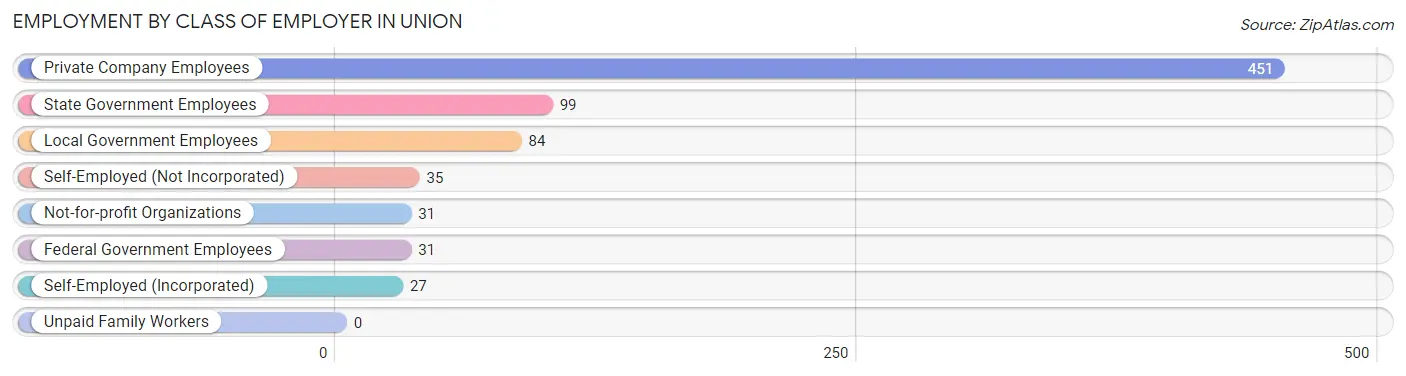
| Employer Class | # Employees | % Employees |
| Private Company Employees | 451 | 59.5% |
| Self-Employed (Incorporated) | 27 | 3.6% |
| Self-Employed (Not Incorporated) | 35 | 4.6% |
| Not-for-profit Organizations | 31 | 4.1% |
| Local Government Employees | 84 | 11.1% |
| State Government Employees | 99 | 13.1% |
| Federal Government Employees | 31 | 4.1% |
| Unpaid Family Workers | 0 | 0.0% |
| Total | 758 | 100.0% |
Employment Status by Age in Union
According to the labor force statistics for Union, out of the total population over 16 years of age (1,920), 46.5% or 893 individuals are in the labor force, with 14.2% or 127 of them unemployed. The age group with the highest labor force participation rate is 25 to 29 years, with 91.0% or 122 individuals in the labor force. Within the labor force, the 20 to 24 years age range has the highest percentage of unemployed individuals, with 38.9% or 35 of them being unemployed.
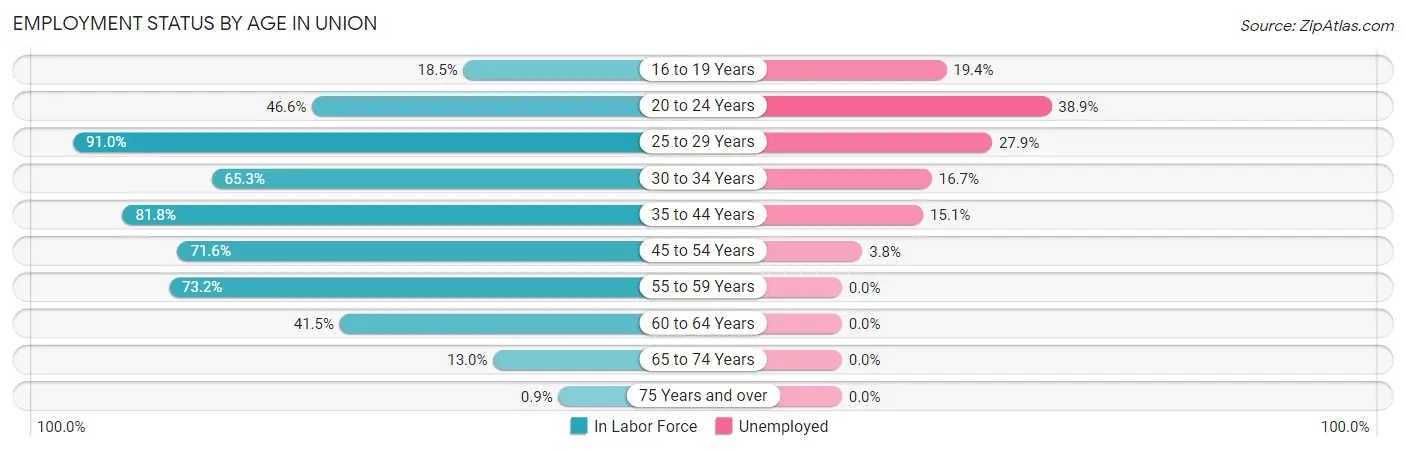
| Age Bracket | In Labor Force | Unemployed |
| 16 to 19 Years | 36 (18.5%) | 7 (19.4%) |
| 20 to 24 Years | 90 (46.6%) | 35 (38.9%) |
| 25 to 29 Years | 122 (91.0%) | 34 (27.9%) |
| 30 to 34 Years | 66 (65.3%) | 11 (16.7%) |
| 35 to 44 Years | 224 (81.8%) | 34 (15.1%) |
| 45 to 54 Years | 159 (71.6%) | 6 (3.8%) |
| 55 to 59 Years | 115 (73.2%) | 0 (0.0%) |
| 60 to 64 Years | 56 (41.5%) | 0 (0.0%) |
| 65 to 74 Years | 22 (13.0%) | 0 (0.0%) |
| 75 Years and over | 3 (0.9%) | 0 (0.0%) |
| Total | 893 (46.5%) | 127 (14.2%) |
Employment Status by Educational Attainment in Union
According to labor force statistics for Union, 72.5% of individuals (742) out of the total population between 25 and 64 years of age (1,023) are in the labor force, with 11.4% or 85 of them being unemployed. The group with the highest labor force participation rate are those with the educational attainment of bachelor's degree or higher, with 91.2% or 93 individuals in the labor force. Within the labor force, individuals with less than high school education have the highest percentage of unemployment, with 21.9% or 33 of them being unemployed.
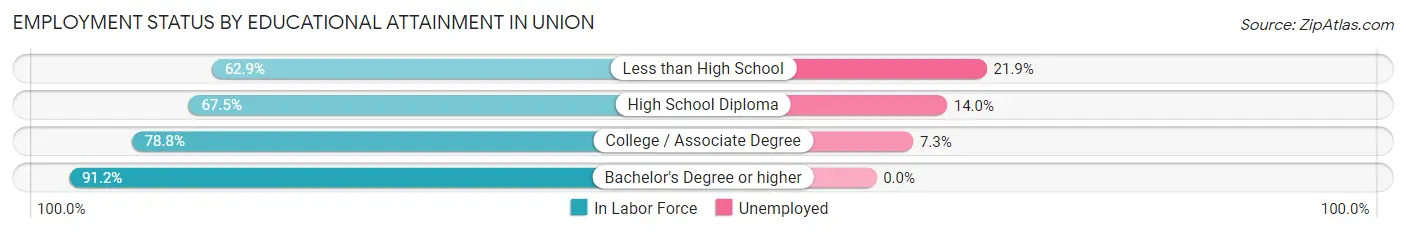
| Educational Attainment | In Labor Force | Unemployed |
| Less than High School | 151 (62.9%) | 53 (21.9%) |
| High School Diploma | 231 (67.5%) | 48 (14.0%) |
| College / Associate Degree | 267 (78.8%) | 25 (7.3%) |
| Bachelor's Degree or higher | 93 (91.2%) | 0 (0.0%) |
| Total | 742 (72.5%) | 117 (11.4%) |
Employment Occupations by Sex in Union
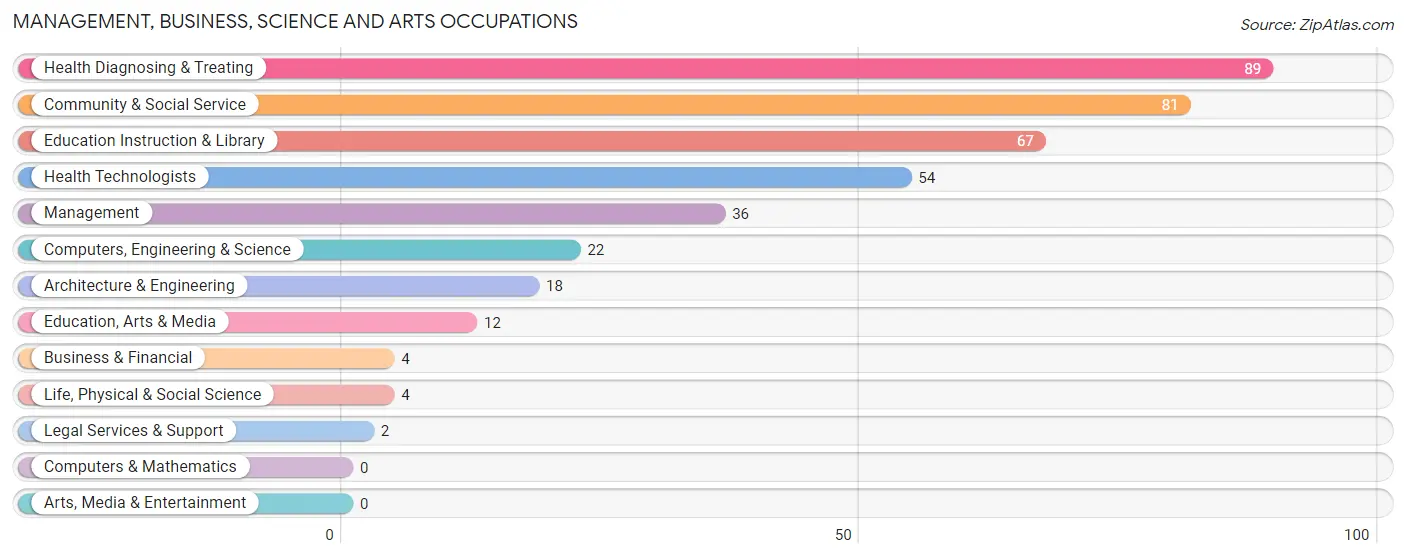
Management, Business, Science and Arts Occupations
The most common Management, Business, Science and Arts occupations in Union are Health Diagnosing & Treating (89 | 11.7%), Community & Social Service (81 | 10.7%), Education Instruction & Library (67 | 8.8%), Health Technologists (54 | 7.1%), and Management (36 | 4.7%).
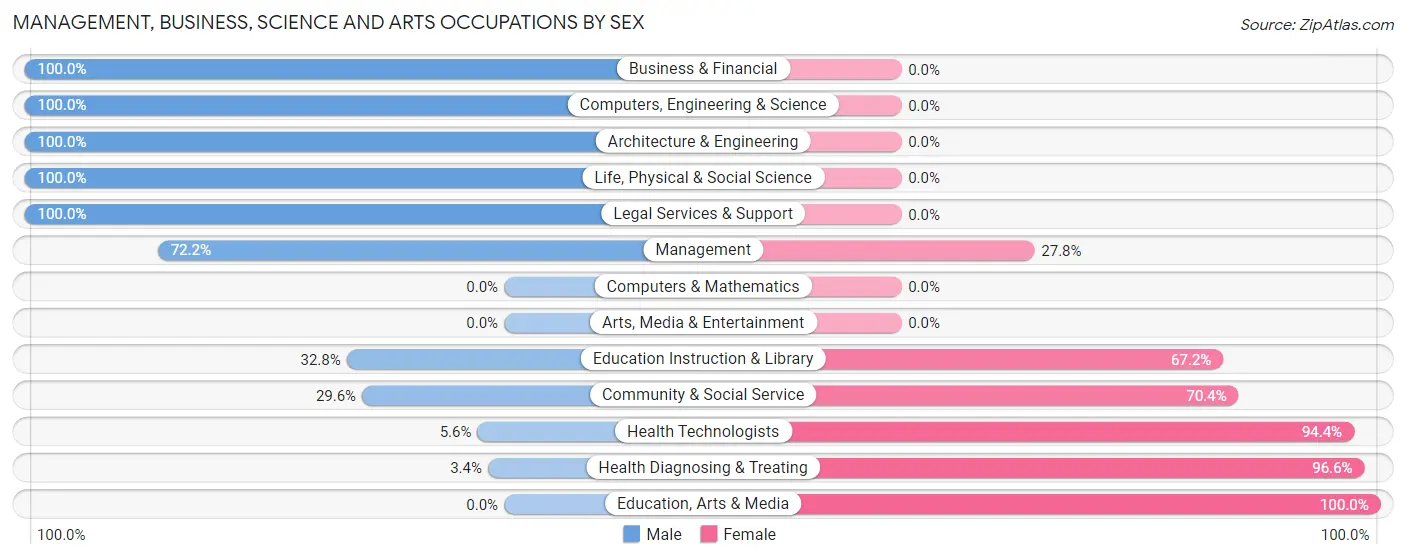
Management, Business, Science and Arts Occupations by Sex
Within the Management, Business, Science and Arts occupations in Union, the most male-oriented occupations are Business & Financial (100.0%), Computers, Engineering & Science (100.0%), and Architecture & Engineering (100.0%), while the most female-oriented occupations are Education, Arts & Media (100.0%), Health Diagnosing & Treating (96.6%), and Health Technologists (94.4%).
| Occupation | Male | Female |
| Management | 26 (72.2%) | 10 (27.8%) |
| Business & Financial | 4 (100.0%) | 0 (0.0%) |
| Computers, Engineering & Science | 22 (100.0%) | 0 (0.0%) |
| Computers & Mathematics | 0 (0.0%) | 0 (0.0%) |
| Architecture & Engineering | 18 (100.0%) | 0 (0.0%) |
| Life, Physical & Social Science | 4 (100.0%) | 0 (0.0%) |
| Community & Social Service | 24 (29.6%) | 57 (70.4%) |
| Education, Arts & Media | 0 (0.0%) | 12 (100.0%) |
| Legal Services & Support | 2 (100.0%) | 0 (0.0%) |
| Education Instruction & Library | 22 (32.8%) | 45 (67.2%) |
| Arts, Media & Entertainment | 0 (0.0%) | 0 (0.0%) |
| Health Diagnosing & Treating | 3 (3.4%) | 86 (96.6%) |
| Health Technologists | 3 (5.6%) | 51 (94.4%) |
| Total (Category) | 79 (34.1%) | 153 (65.9%) |
| Total (Overall) | 398 (52.4%) | 362 (47.6%) |
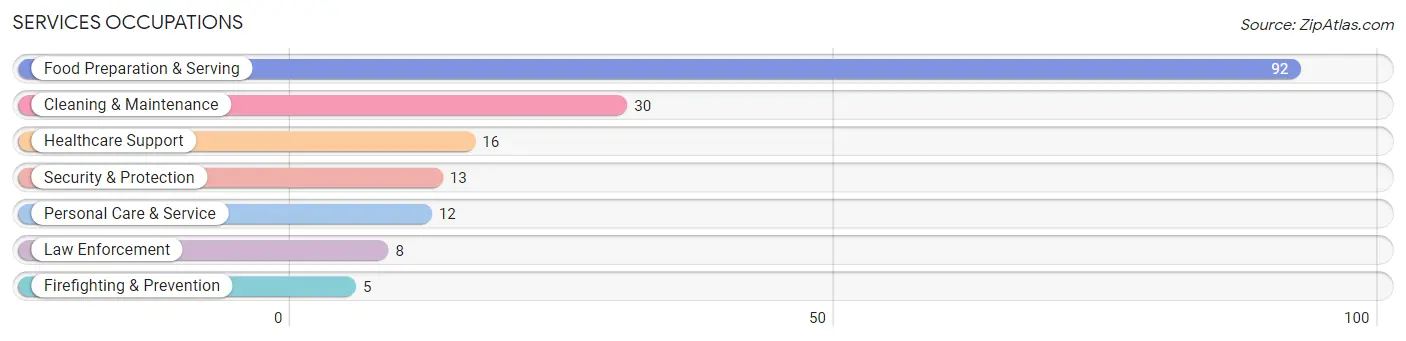
Services Occupations
The most common Services occupations in Union are Food Preparation & Serving (92 | 12.1%), Cleaning & Maintenance (30 | 4.0%), Healthcare Support (16 | 2.1%), Security & Protection (13 | 1.7%), and Personal Care & Service (12 | 1.6%).
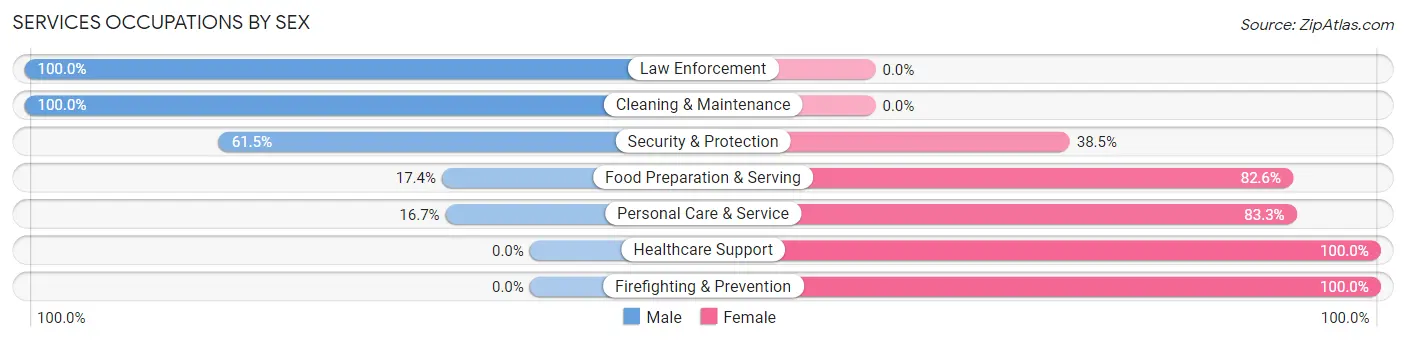
Services Occupations by Sex
Within the Services occupations in Union, the most male-oriented occupations are Law Enforcement (100.0%), Cleaning & Maintenance (100.0%), and Security & Protection (61.5%), while the most female-oriented occupations are Healthcare Support (100.0%), Firefighting & Prevention (100.0%), and Personal Care & Service (83.3%).
| Occupation | Male | Female |
| Healthcare Support | 0 (0.0%) | 16 (100.0%) |
| Security & Protection | 8 (61.5%) | 5 (38.5%) |
| Firefighting & Prevention | 0 (0.0%) | 5 (100.0%) |
| Law Enforcement | 8 (100.0%) | 0 (0.0%) |
| Food Preparation & Serving | 16 (17.4%) | 76 (82.6%) |
| Cleaning & Maintenance | 30 (100.0%) | 0 (0.0%) |
| Personal Care & Service | 2 (16.7%) | 10 (83.3%) |
| Total (Category) | 56 (34.4%) | 107 (65.6%) |
| Total (Overall) | 398 (52.4%) | 362 (47.6%) |
Sales and Office Occupations
The most common Sales and Office occupations in Union are Office & Administration (101 | 13.3%), and Sales & Related (20 | 2.6%).
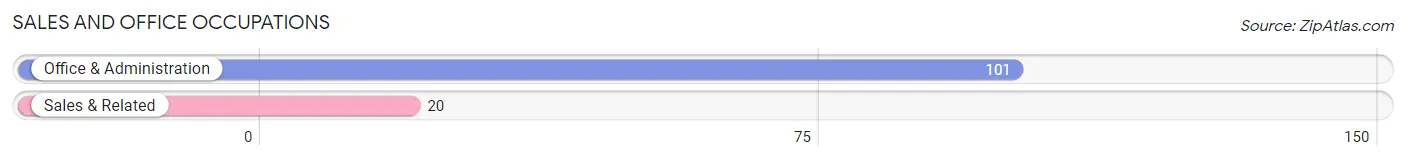
Sales and Office Occupations by Sex

| Occupation | Male | Female |
| Sales & Related | 20 (100.0%) | 0 (0.0%) |
| Office & Administration | 44 (43.6%) | 57 (56.4%) |
| Total (Category) | 64 (52.9%) | 57 (47.1%) |
| Total (Overall) | 398 (52.4%) | 362 (47.6%) |
Natural Resources, Construction and Maintenance Occupations
The most common Natural Resources, Construction and Maintenance occupations in Union are Construction & Extraction (35 | 4.6%), and Installation, Maintenance & Repair (34 | 4.5%).
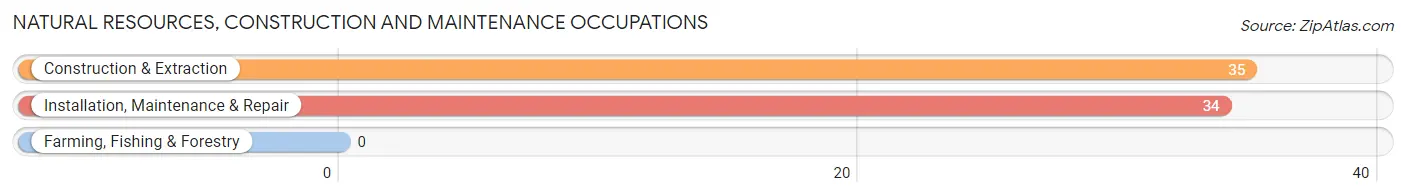
Natural Resources, Construction and Maintenance Occupations by Sex
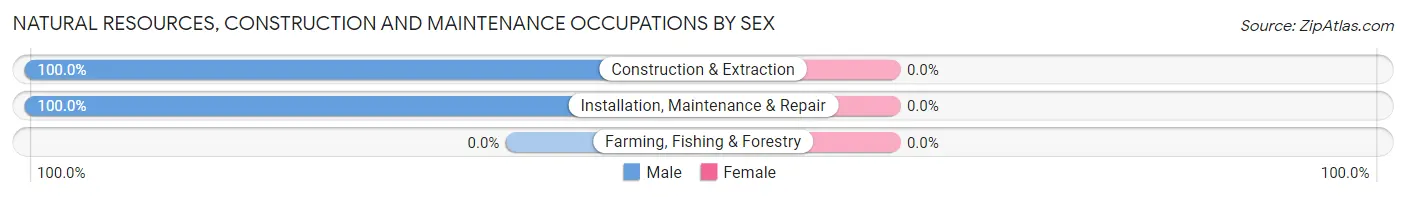
| Occupation | Male | Female |
| Farming, Fishing & Forestry | 0 (0.0%) | 0 (0.0%) |
| Construction & Extraction | 35 (100.0%) | 0 (0.0%) |
| Installation, Maintenance & Repair | 34 (100.0%) | 0 (0.0%) |
| Total (Category) | 69 (100.0%) | 0 (0.0%) |
| Total (Overall) | 398 (52.4%) | 362 (47.6%) |
Production, Transportation and Moving Occupations
The most common Production, Transportation and Moving occupations in Union are Material Moving (85 | 11.2%), Production (72 | 9.5%), and Transportation (18 | 2.4%).
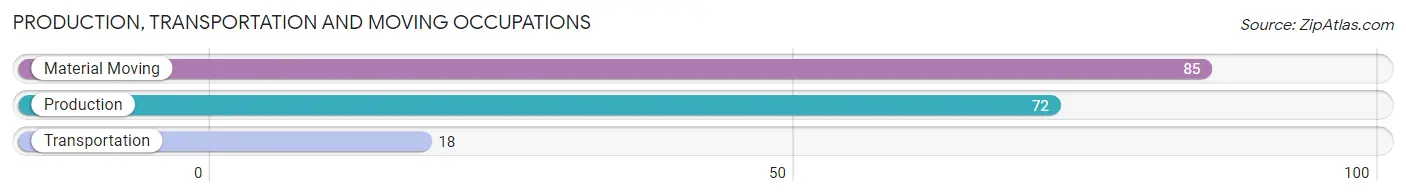
Production, Transportation and Moving Occupations by Sex
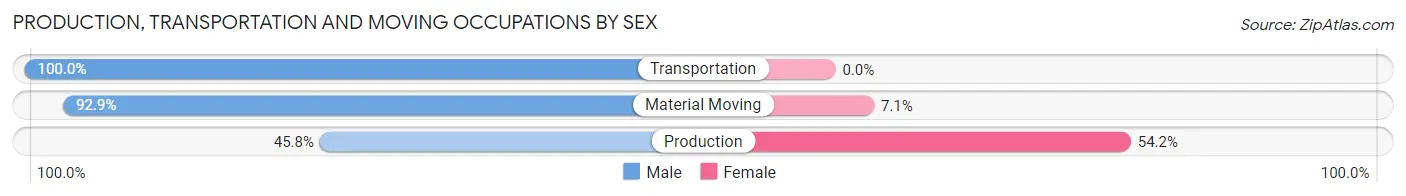
| Occupation | Male | Female |
| Production | 33 (45.8%) | 39 (54.2%) |
| Transportation | 18 (100.0%) | 0 (0.0%) |
| Material Moving | 79 (92.9%) | 6 (7.1%) |
| Total (Category) | 130 (74.3%) | 45 (25.7%) |
| Total (Overall) | 398 (52.4%) | 362 (47.6%) |
Employment Industries by Sex in Union
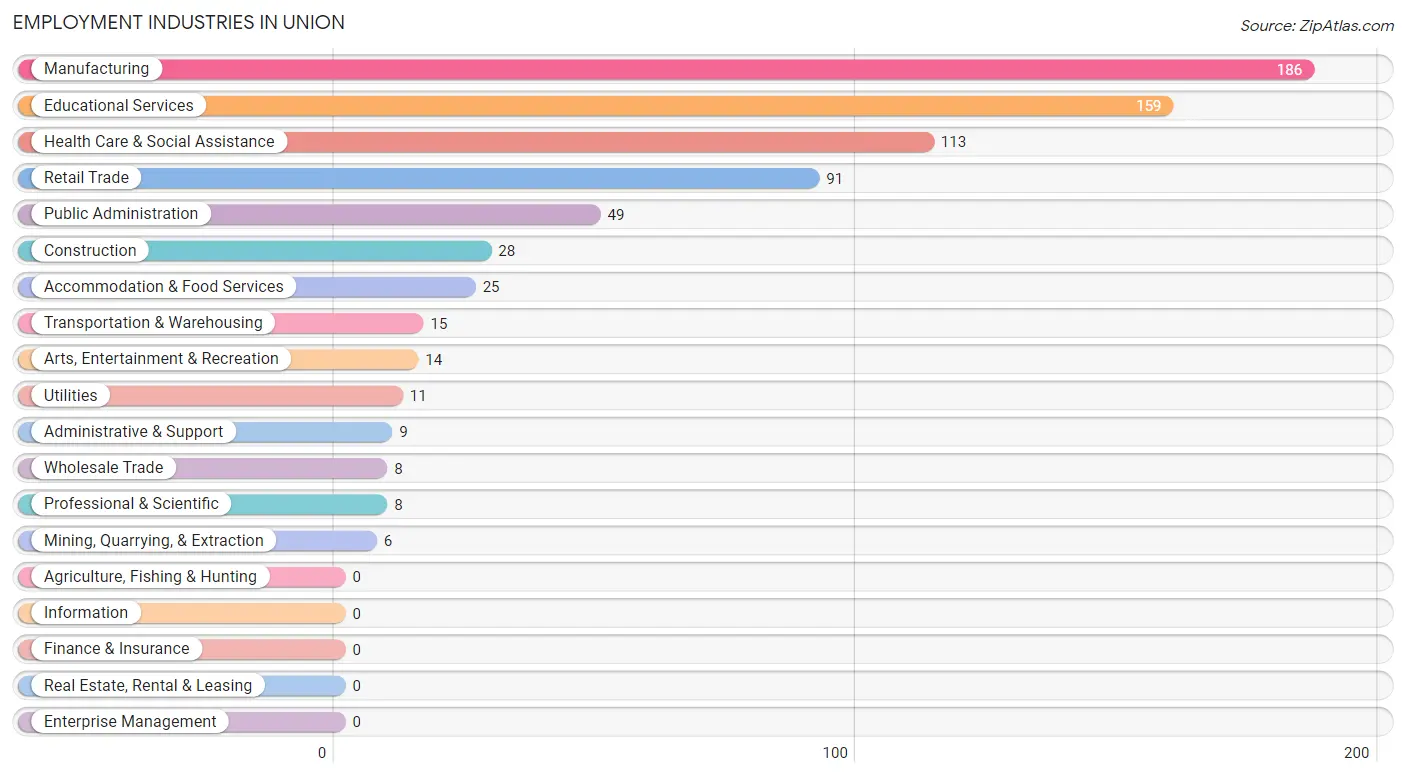
Employment Industries in Union
The major employment industries in Union include Manufacturing (186 | 24.5%), Educational Services (159 | 20.9%), Health Care & Social Assistance (113 | 14.9%), Retail Trade (91 | 12.0%), and Public Administration (49 | 6.5%).
Employment Industries by Sex in Union
The Union industries that see more men than women are Mining, Quarrying, & Extraction (100.0%), Wholesale Trade (100.0%), and Utilities (100.0%), whereas the industries that tend to have a higher number of women are Health Care & Social Assistance (93.8%), Arts, Entertainment & Recreation (85.7%), and Educational Services (62.3%).
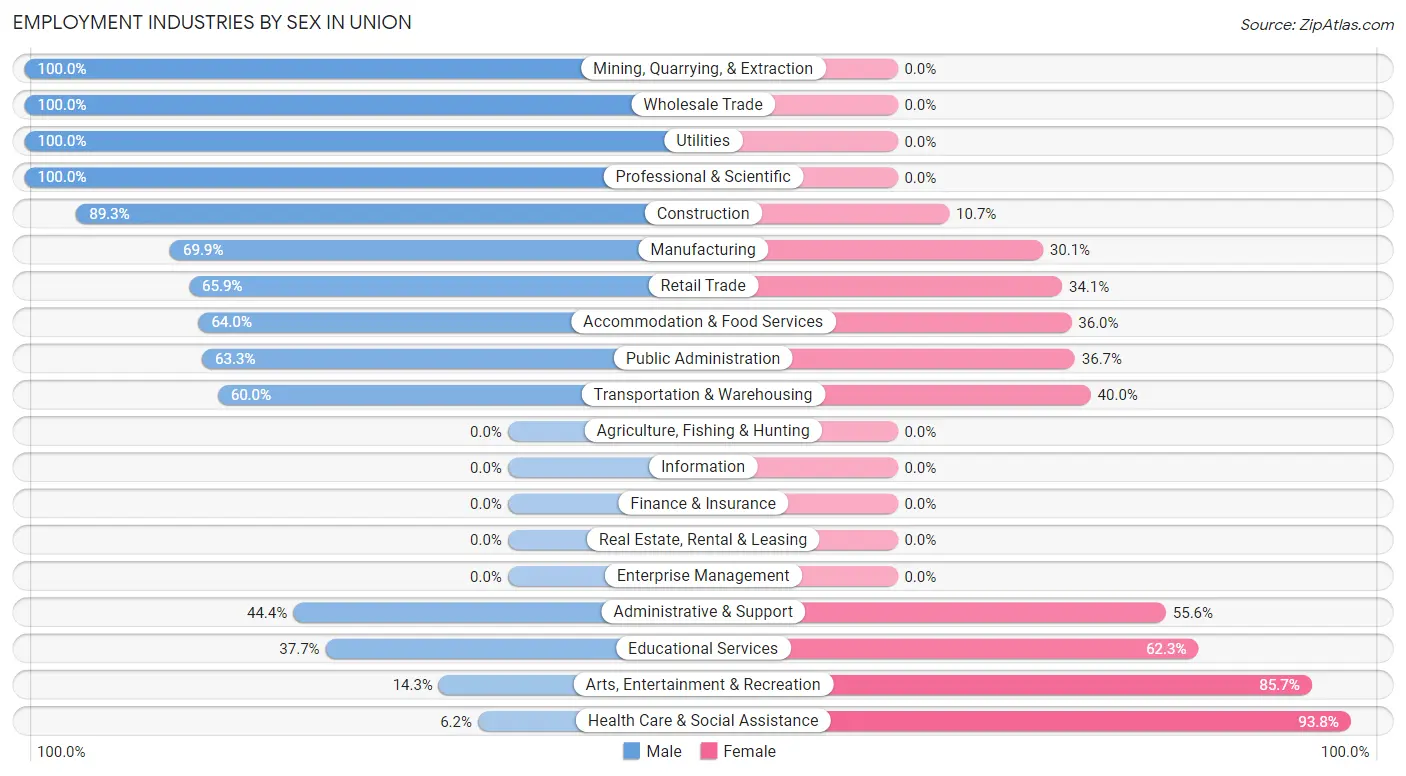
| Industry | Male | Female |
| Agriculture, Fishing & Hunting | 0 (0.0%) | 0 (0.0%) |
| Mining, Quarrying, & Extraction | 6 (100.0%) | 0 (0.0%) |
| Construction | 25 (89.3%) | 3 (10.7%) |
| Manufacturing | 130 (69.9%) | 56 (30.1%) |
| Wholesale Trade | 8 (100.0%) | 0 (0.0%) |
| Retail Trade | 60 (65.9%) | 31 (34.1%) |
| Transportation & Warehousing | 9 (60.0%) | 6 (40.0%) |
| Utilities | 11 (100.0%) | 0 (0.0%) |
| Information | 0 (0.0%) | 0 (0.0%) |
| Finance & Insurance | 0 (0.0%) | 0 (0.0%) |
| Real Estate, Rental & Leasing | 0 (0.0%) | 0 (0.0%) |
| Professional & Scientific | 8 (100.0%) | 0 (0.0%) |
| Enterprise Management | 0 (0.0%) | 0 (0.0%) |
| Administrative & Support | 4 (44.4%) | 5 (55.6%) |
| Educational Services | 60 (37.7%) | 99 (62.3%) |
| Health Care & Social Assistance | 7 (6.2%) | 106 (93.8%) |
| Arts, Entertainment & Recreation | 2 (14.3%) | 12 (85.7%) |
| Accommodation & Food Services | 16 (64.0%) | 9 (36.0%) |
| Public Administration | 31 (63.3%) | 18 (36.7%) |
| Total | 398 (52.4%) | 362 (47.6%) |
Education in Union
School Enrollment in Union
The most common levels of schooling among the 860 students in Union are elementary school (247 | 28.7%), high school (211 | 24.5%), and middle school (156 | 18.1%).
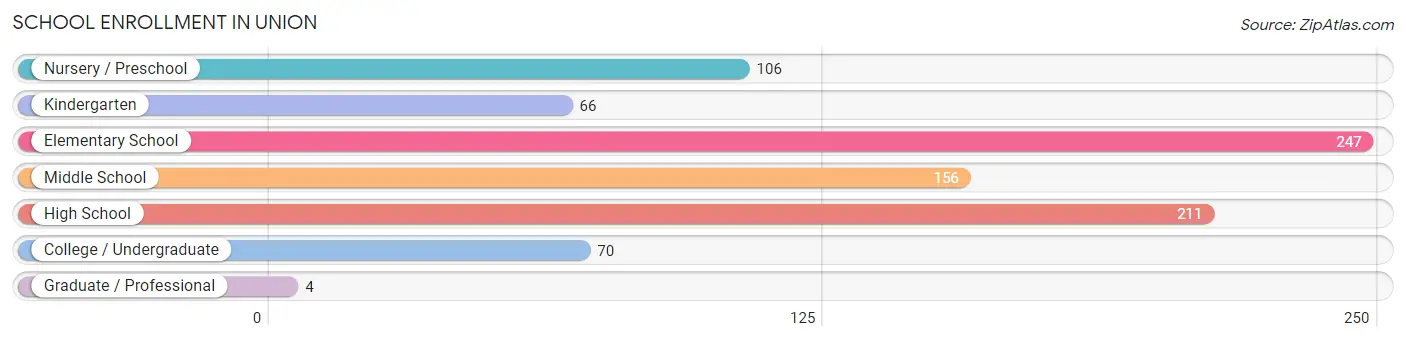
| School Level | # Students | % Students |
| Nursery / Preschool | 106 | 12.3% |
| Kindergarten | 66 | 7.7% |
| Elementary School | 247 | 28.7% |
| Middle School | 156 | 18.1% |
| High School | 211 | 24.5% |
| College / Undergraduate | 70 | 8.1% |
| Graduate / Professional | 4 | 0.5% |
| Total | 860 | 100.0% |
School Enrollment by Age by Funding Source in Union
Out of a total of 860 students who are enrolled in schools in Union, 42 (4.9%) attend a private institution, while the remaining 818 (95.1%) are enrolled in public schools. The age group of 10 to 14 year olds has the highest likelihood of being enrolled in private schools, with 21 (6.9% in the age bracket) enrolled. Conversely, the age group of 3 to 4 year olds has the lowest likelihood of being enrolled in a private school, with 77 (100.0% in the age bracket) attending a public institution.
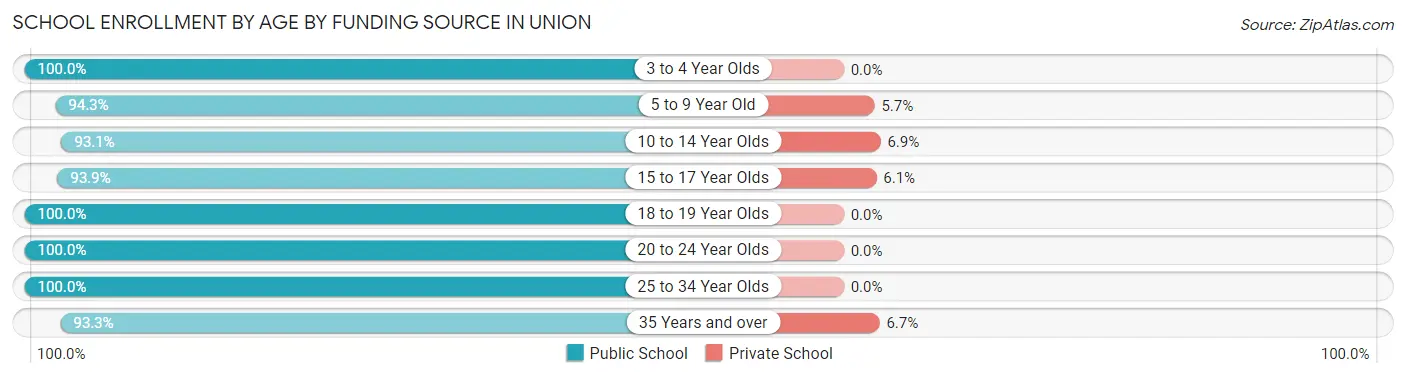
| Age Bracket | Public School | Private School |
| 3 to 4 Year Olds | 77 (100.0%) | 0 (0.0%) |
| 5 to 9 Year Old | 214 (94.3%) | 13 (5.7%) |
| 10 to 14 Year Olds | 285 (93.1%) | 21 (6.9%) |
| 15 to 17 Year Olds | 108 (93.9%) | 7 (6.1%) |
| 18 to 19 Year Olds | 73 (100.0%) | 0 (0.0%) |
| 20 to 24 Year Olds | 38 (100.0%) | 0 (0.0%) |
| 25 to 34 Year Olds | 9 (100.0%) | 0 (0.0%) |
| 35 Years and over | 14 (93.3%) | 1 (6.7%) |
| Total | 818 (95.1%) | 42 (4.9%) |
Educational Attainment by Field of Study in Union
Education (90 | 46.4%), business (37 | 19.1%), science & technology (22 | 11.3%), literature & languages (13 | 6.7%), and visual & performing arts (11 | 5.7%) are the most common fields of study among 194 individuals in Union who have obtained a bachelor's degree or higher.
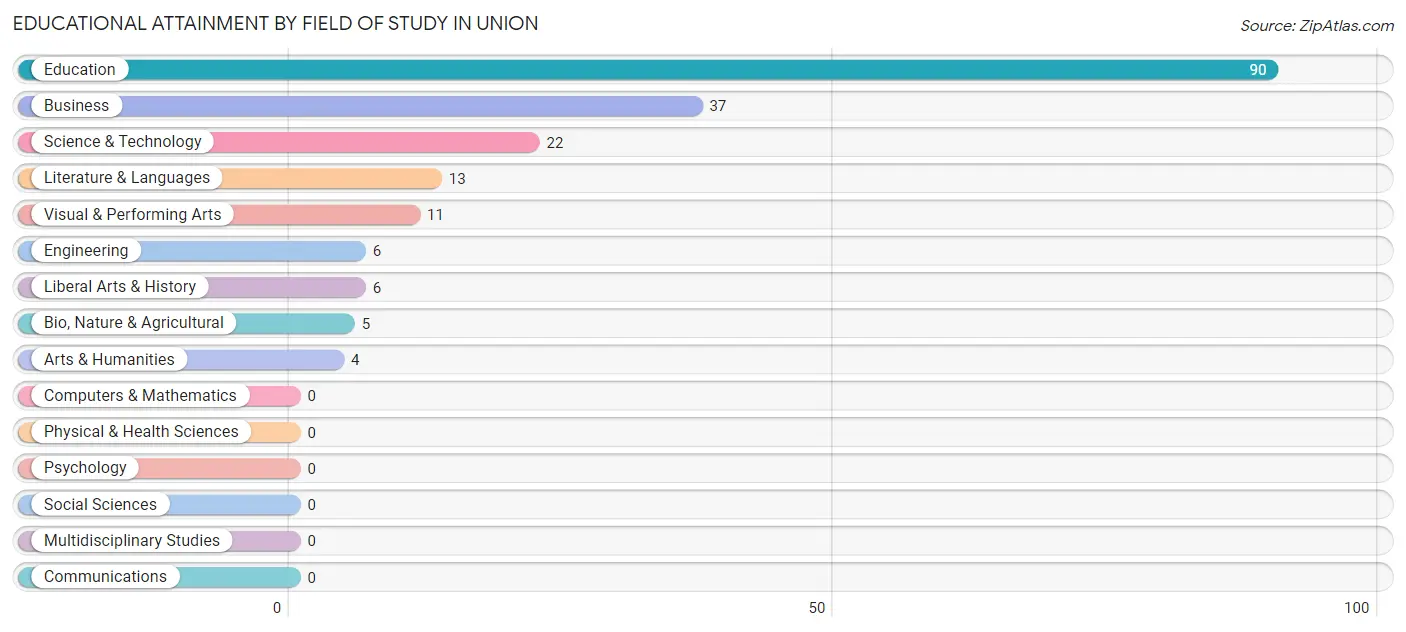
| Field of Study | # Graduates | % Graduates |
| Computers & Mathematics | 0 | 0.0% |
| Bio, Nature & Agricultural | 5 | 2.6% |
| Physical & Health Sciences | 0 | 0.0% |
| Psychology | 0 | 0.0% |
| Social Sciences | 0 | 0.0% |
| Engineering | 6 | 3.1% |
| Multidisciplinary Studies | 0 | 0.0% |
| Science & Technology | 22 | 11.3% |
| Business | 37 | 19.1% |
| Education | 90 | 46.4% |
| Literature & Languages | 13 | 6.7% |
| Liberal Arts & History | 6 | 3.1% |
| Visual & Performing Arts | 11 | 5.7% |
| Communications | 0 | 0.0% |
| Arts & Humanities | 4 | 2.1% |
| Total | 194 | 100.0% |
Transportation & Commute in Union
Vehicle Availability by Sex in Union
The most prevalent vehicle ownership categories in Union are males with 2 vehicles (206, accounting for 51.4%) and females with 2 vehicles (166, making up 57.7%).
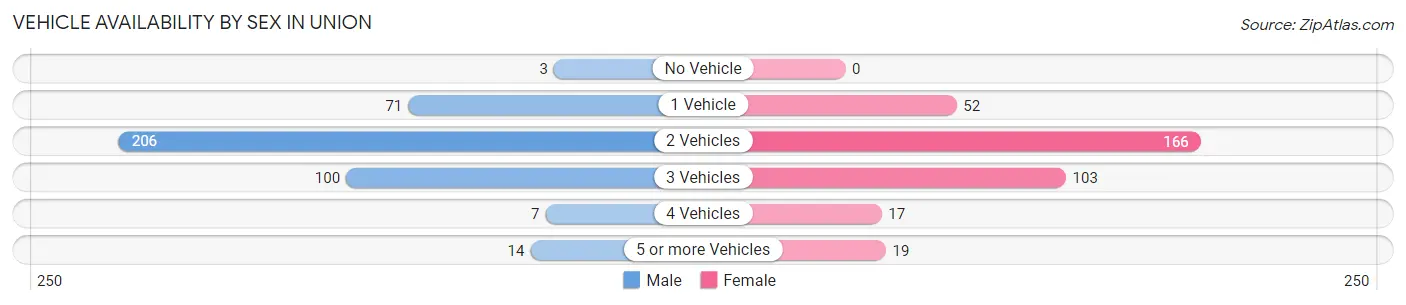
| Vehicles Available | Male | Female |
| No Vehicle | 3 (0.7%) | 0 (0.0%) |
| 1 Vehicle | 71 (17.7%) | 52 (14.6%) |
| 2 Vehicles | 206 (51.4%) | 166 (46.5%) |
| 3 Vehicles | 100 (24.9%) | 103 (28.8%) |
| 4 Vehicles | 7 (1.8%) | 17 (4.8%) |
| 5 or more Vehicles | 14 (3.5%) | 19 (5.3%) |
| Total | 401 (100.0%) | 357 (100.0%) |
Commute Time in Union
The most frequently occuring commute durations in Union are 5 to 9 minutes (183 commuters, 24.3%), 20 to 24 minutes (104 commuters, 13.8%), and less than 5 minutes (86 commuters, 11.4%).
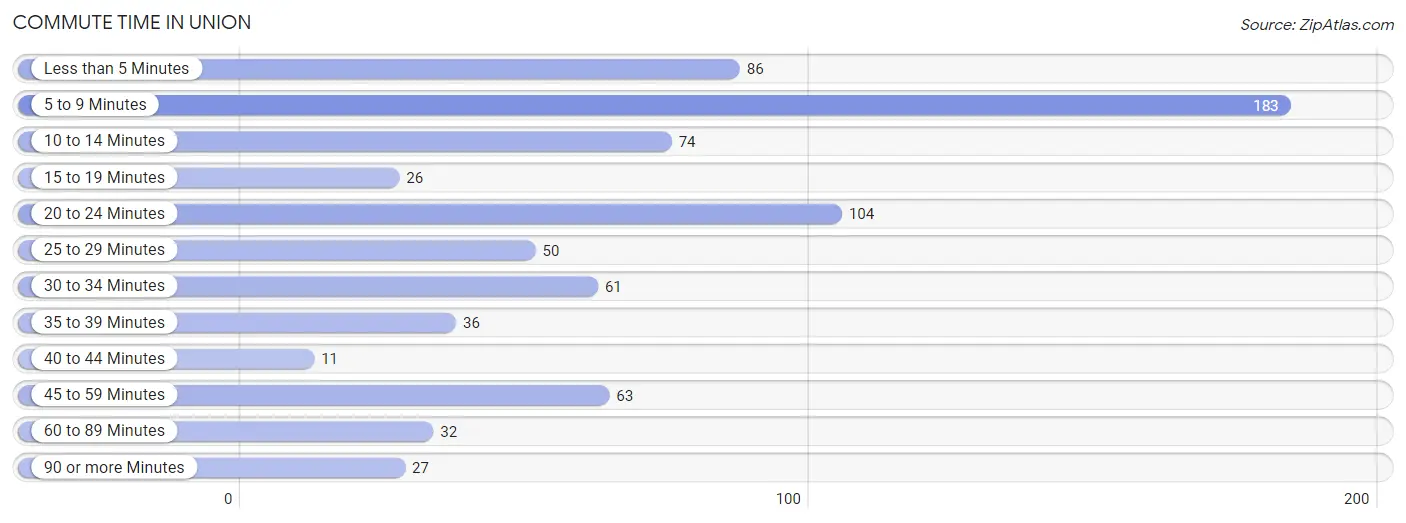
| Commute Time | # Commuters | % Commuters |
| Less than 5 Minutes | 86 | 11.4% |
| 5 to 9 Minutes | 183 | 24.3% |
| 10 to 14 Minutes | 74 | 9.8% |
| 15 to 19 Minutes | 26 | 3.5% |
| 20 to 24 Minutes | 104 | 13.8% |
| 25 to 29 Minutes | 50 | 6.6% |
| 30 to 34 Minutes | 61 | 8.1% |
| 35 to 39 Minutes | 36 | 4.8% |
| 40 to 44 Minutes | 11 | 1.5% |
| 45 to 59 Minutes | 63 | 8.4% |
| 60 to 89 Minutes | 32 | 4.3% |
| 90 or more Minutes | 27 | 3.6% |
Commute Time by Sex in Union
The most common commute times in Union are 5 to 9 minutes (85 commuters, 21.2%) for males and 5 to 9 minutes (98 commuters, 27.8%) for females.
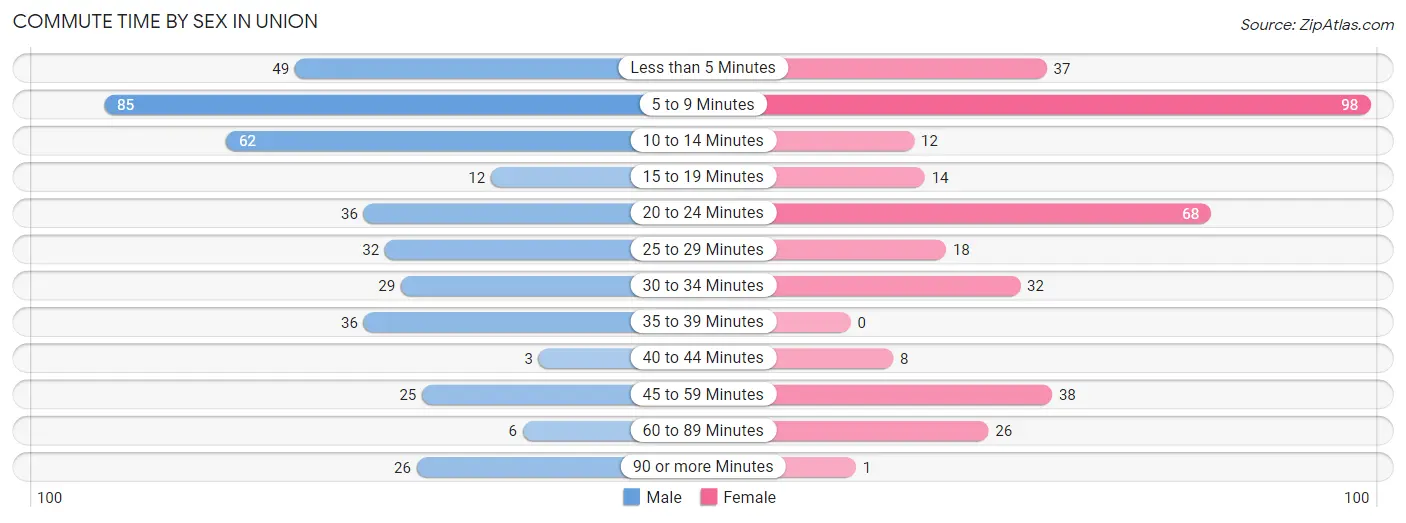
| Commute Time | Male | Female |
| Less than 5 Minutes | 49 (12.2%) | 37 (10.5%) |
| 5 to 9 Minutes | 85 (21.2%) | 98 (27.8%) |
| 10 to 14 Minutes | 62 (15.5%) | 12 (3.4%) |
| 15 to 19 Minutes | 12 (3.0%) | 14 (4.0%) |
| 20 to 24 Minutes | 36 (9.0%) | 68 (19.3%) |
| 25 to 29 Minutes | 32 (8.0%) | 18 (5.1%) |
| 30 to 34 Minutes | 29 (7.2%) | 32 (9.1%) |
| 35 to 39 Minutes | 36 (9.0%) | 0 (0.0%) |
| 40 to 44 Minutes | 3 (0.7%) | 8 (2.3%) |
| 45 to 59 Minutes | 25 (6.2%) | 38 (10.8%) |
| 60 to 89 Minutes | 6 (1.5%) | 26 (7.4%) |
| 90 or more Minutes | 26 (6.5%) | 1 (0.3%) |
Time of Departure to Work by Sex in Union
The most frequent times of departure to work in Union are 7:00 AM to 7:29 AM (59, 14.7%) for males and 7:30 AM to 7:59 AM (70, 19.9%) for females.
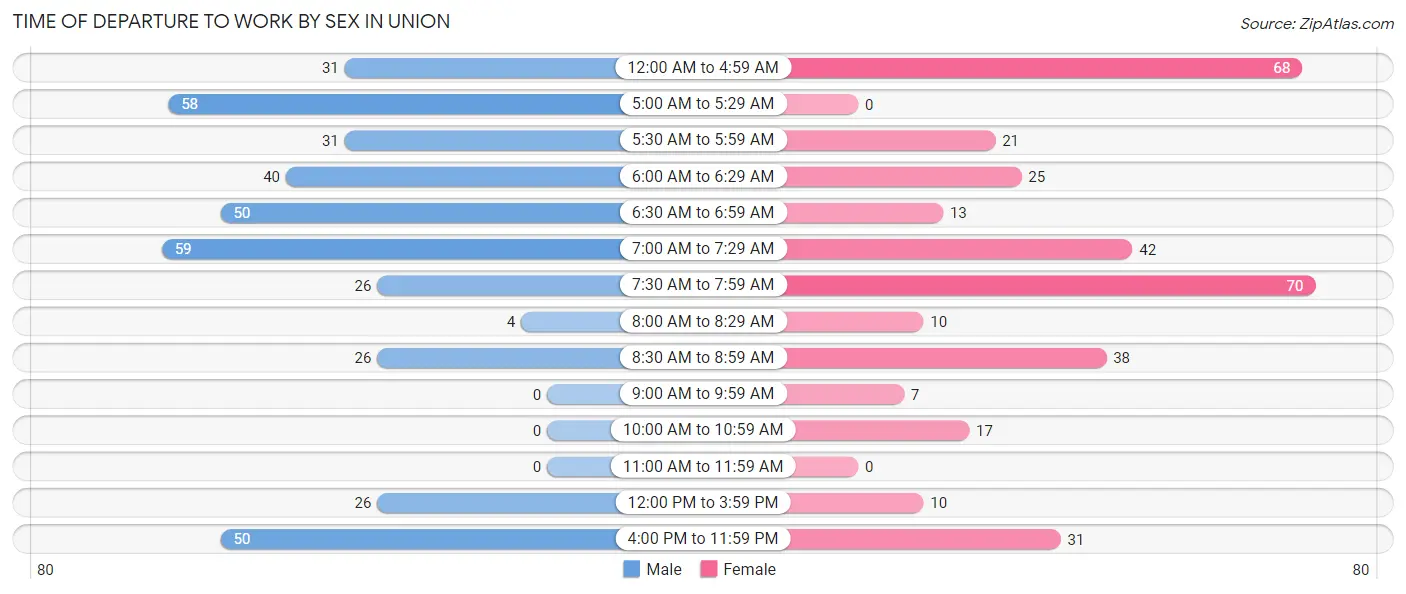
| Time of Departure | Male | Female |
| 12:00 AM to 4:59 AM | 31 (7.7%) | 68 (19.3%) |
| 5:00 AM to 5:29 AM | 58 (14.5%) | 0 (0.0%) |
| 5:30 AM to 5:59 AM | 31 (7.7%) | 21 (6.0%) |
| 6:00 AM to 6:29 AM | 40 (10.0%) | 25 (7.1%) |
| 6:30 AM to 6:59 AM | 50 (12.5%) | 13 (3.7%) |
| 7:00 AM to 7:29 AM | 59 (14.7%) | 42 (11.9%) |
| 7:30 AM to 7:59 AM | 26 (6.5%) | 70 (19.9%) |
| 8:00 AM to 8:29 AM | 4 (1.0%) | 10 (2.8%) |
| 8:30 AM to 8:59 AM | 26 (6.5%) | 38 (10.8%) |
| 9:00 AM to 9:59 AM | 0 (0.0%) | 7 (2.0%) |
| 10:00 AM to 10:59 AM | 0 (0.0%) | 17 (4.8%) |
| 11:00 AM to 11:59 AM | 0 (0.0%) | 0 (0.0%) |
| 12:00 PM to 3:59 PM | 26 (6.5%) | 10 (2.8%) |
| 4:00 PM to 11:59 PM | 50 (12.5%) | 31 (8.8%) |
| Total | 401 (100.0%) | 352 (100.0%) |
Housing Occupancy in Union
Occupancy by Ownership in Union
Of the total 887 dwellings in Union, owner-occupied units account for 548 (61.8%), while renter-occupied units make up 339 (38.2%).
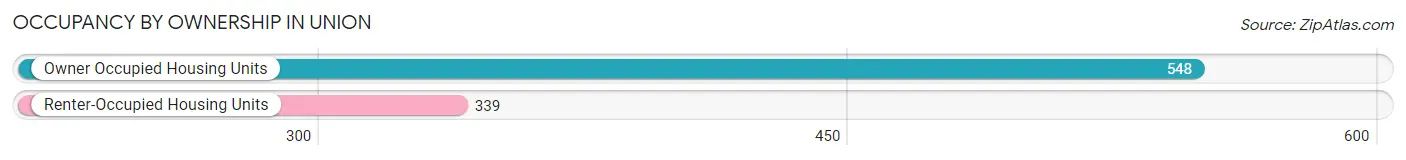
| Occupancy | # Housing Units | % Housing Units |
| Owner Occupied Housing Units | 548 | 61.8% |
| Renter-Occupied Housing Units | 339 | 38.2% |
| Total Occupied Housing Units | 887 | 100.0% |
Occupancy by Household Size in Union
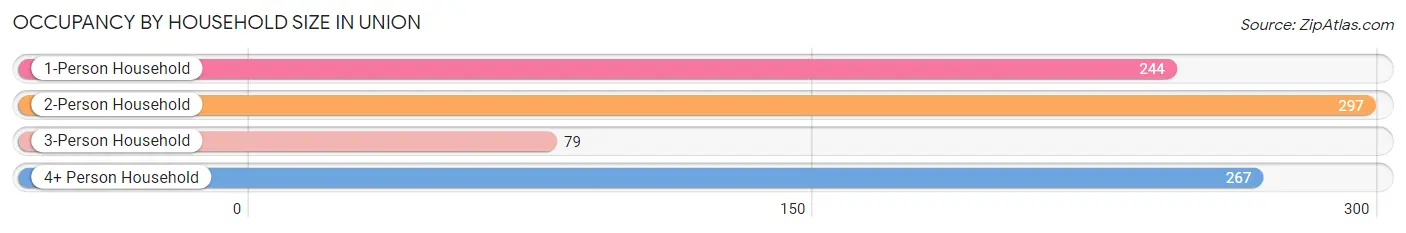
| Household Size | # Housing Units | % Housing Units |
| 1-Person Household | 244 | 27.5% |
| 2-Person Household | 297 | 33.5% |
| 3-Person Household | 79 | 8.9% |
| 4+ Person Household | 267 | 30.1% |
| Total Housing Units | 887 | 100.0% |
Occupancy by Ownership by Household Size in Union
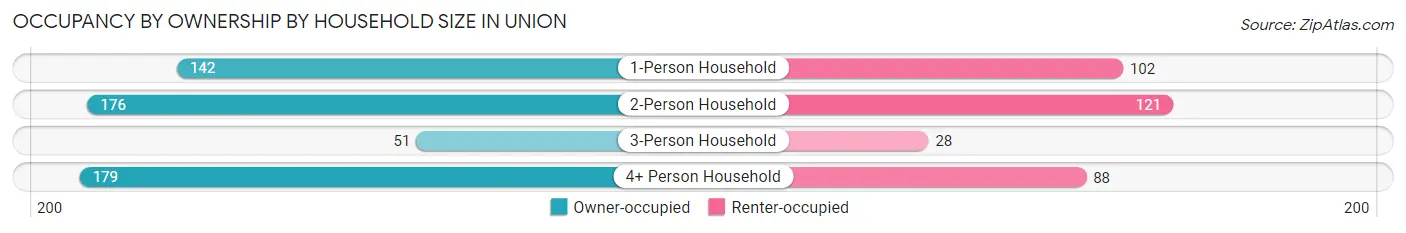
| Household Size | Owner-occupied | Renter-occupied |
| 1-Person Household | 142 (58.2%) | 102 (41.8%) |
| 2-Person Household | 176 (59.3%) | 121 (40.7%) |
| 3-Person Household | 51 (64.6%) | 28 (35.4%) |
| 4+ Person Household | 179 (67.0%) | 88 (33.0%) |
| Total Housing Units | 548 (61.8%) | 339 (38.2%) |
Occupancy by Educational Attainment in Union
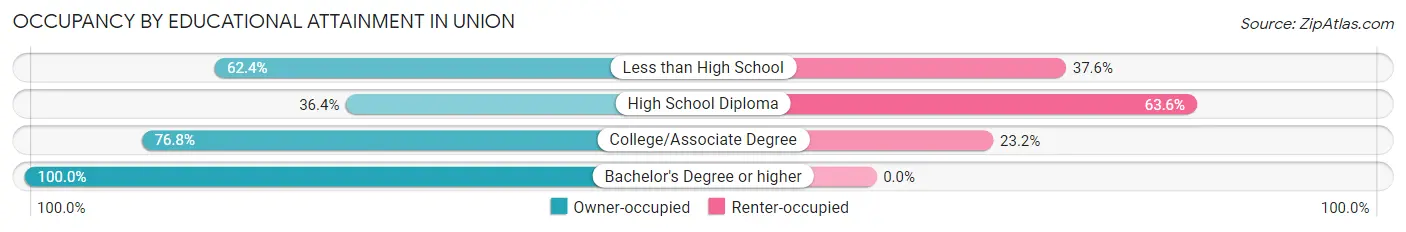
| Household Size | Owner-occupied | Renter-occupied |
| Less than High School | 166 (62.4%) | 100 (37.6%) |
| High School Diploma | 106 (36.4%) | 185 (63.6%) |
| College/Associate Degree | 179 (76.8%) | 54 (23.2%) |
| Bachelor's Degree or higher | 97 (100.0%) | 0 (0.0%) |
Occupancy by Age of Householder in Union
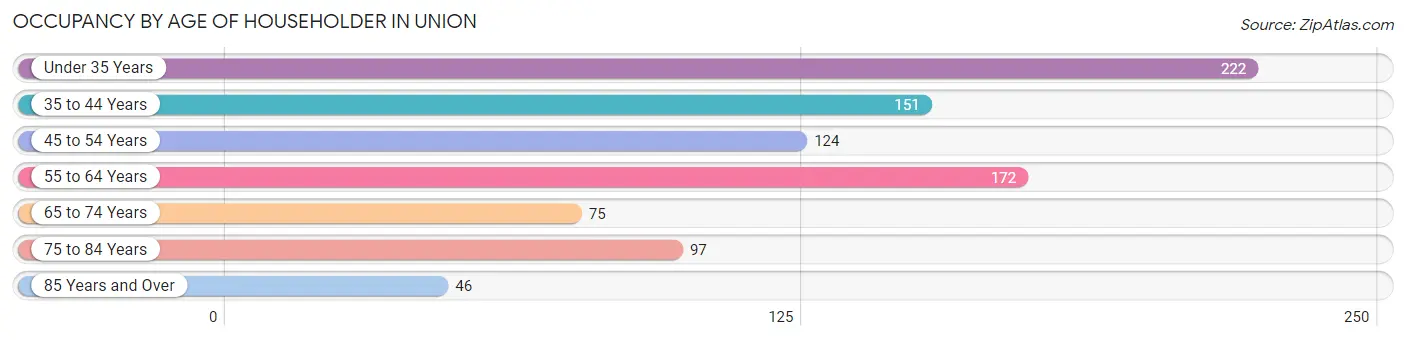
| Age Bracket | # Households | % Households |
| Under 35 Years | 222 | 25.0% |
| 35 to 44 Years | 151 | 17.0% |
| 45 to 54 Years | 124 | 14.0% |
| 55 to 64 Years | 172 | 19.4% |
| 65 to 74 Years | 75 | 8.5% |
| 75 to 84 Years | 97 | 10.9% |
| 85 Years and Over | 46 | 5.2% |
| Total | 887 | 100.0% |
Housing Finances in Union
Median Income by Occupancy in Union
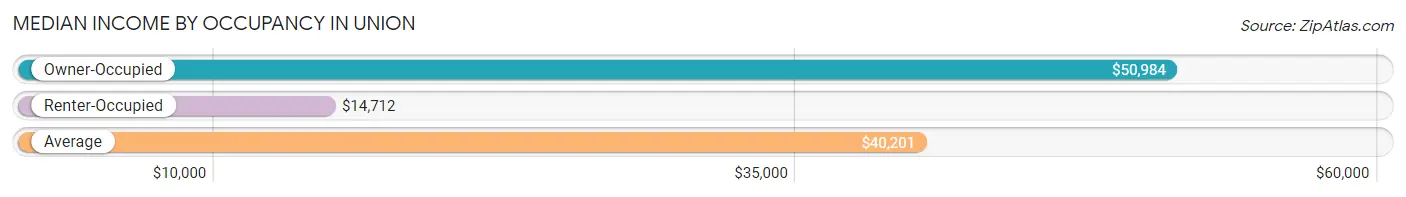
| Occupancy Type | # Households | Median Income |
| Owner-Occupied | 548 (61.8%) | $50,984 |
| Renter-Occupied | 339 (38.2%) | $14,712 |
| Average | 887 (100.0%) | $40,201 |
Occupancy by Householder Income Bracket in Union
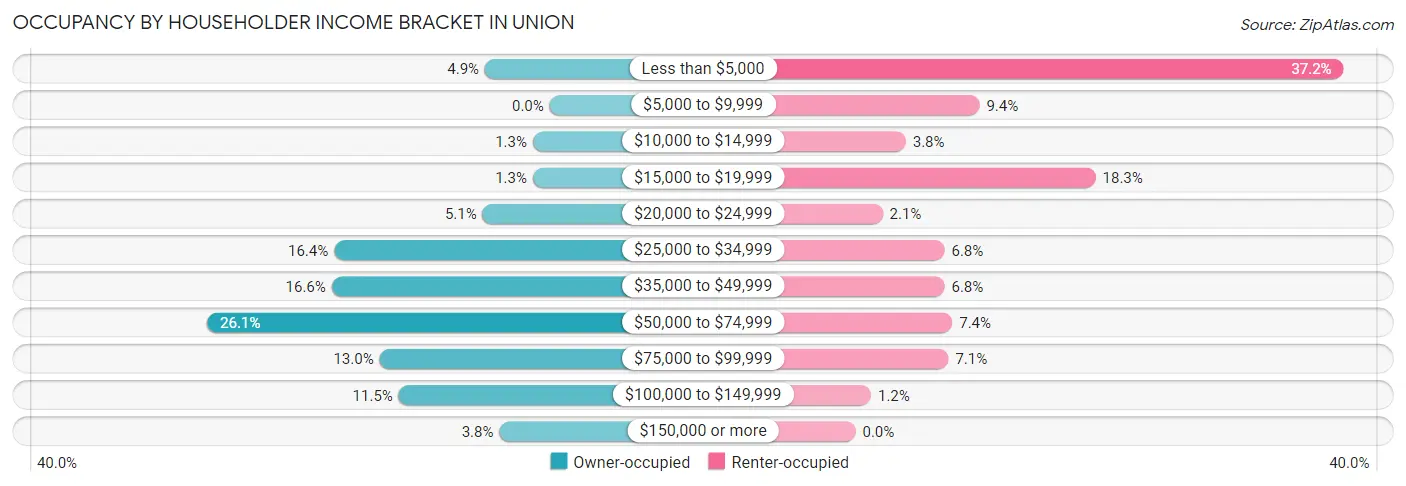
| Income Bracket | Owner-occupied | Renter-occupied |
| Less than $5,000 | 27 (4.9%) | 126 (37.2%) |
| $5,000 to $9,999 | 0 (0.0%) | 32 (9.4%) |
| $10,000 to $14,999 | 7 (1.3%) | 13 (3.8%) |
| $15,000 to $19,999 | 7 (1.3%) | 62 (18.3%) |
| $20,000 to $24,999 | 28 (5.1%) | 7 (2.1%) |
| $25,000 to $34,999 | 90 (16.4%) | 23 (6.8%) |
| $35,000 to $49,999 | 91 (16.6%) | 23 (6.8%) |
| $50,000 to $74,999 | 143 (26.1%) | 25 (7.4%) |
| $75,000 to $99,999 | 71 (13.0%) | 24 (7.1%) |
| $100,000 to $149,999 | 63 (11.5%) | 4 (1.2%) |
| $150,000 or more | 21 (3.8%) | 0 (0.0%) |
| Total | 548 (100.0%) | 339 (100.0%) |
Monthly Housing Cost Tiers in Union
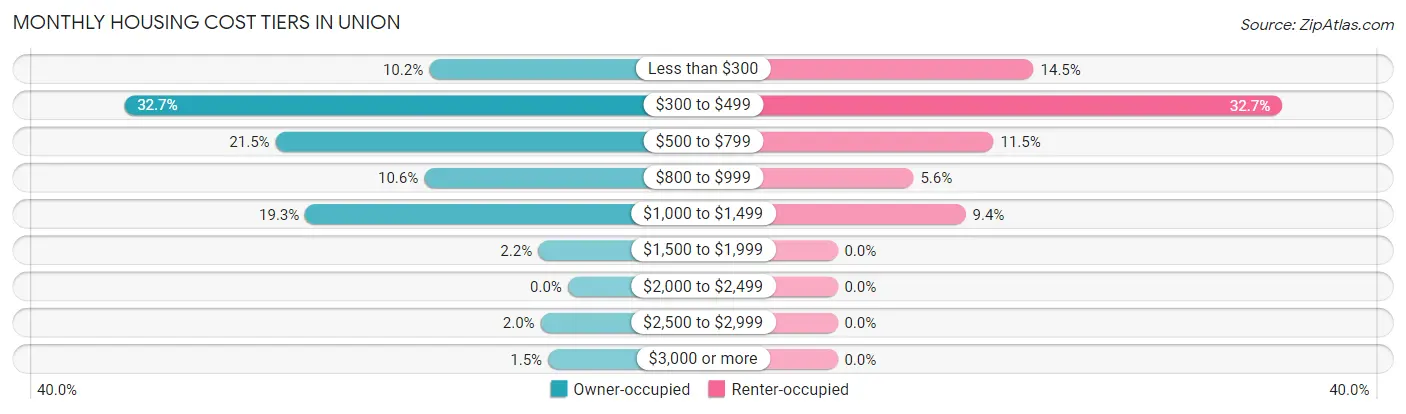
| Monthly Cost | Owner-occupied | Renter-occupied |
| Less than $300 | 56 (10.2%) | 49 (14.4%) |
| $300 to $499 | 179 (32.7%) | 111 (32.7%) |
| $500 to $799 | 118 (21.5%) | 39 (11.5%) |
| $800 to $999 | 58 (10.6%) | 19 (5.6%) |
| $1,000 to $1,499 | 106 (19.3%) | 32 (9.4%) |
| $1,500 to $1,999 | 12 (2.2%) | 0 (0.0%) |
| $2,000 to $2,499 | 0 (0.0%) | 0 (0.0%) |
| $2,500 to $2,999 | 11 (2.0%) | 0 (0.0%) |
| $3,000 or more | 8 (1.5%) | 0 (0.0%) |
| Total | 548 (100.0%) | 339 (100.0%) |
Physical Housing Characteristics in Union
Housing Structures in Union
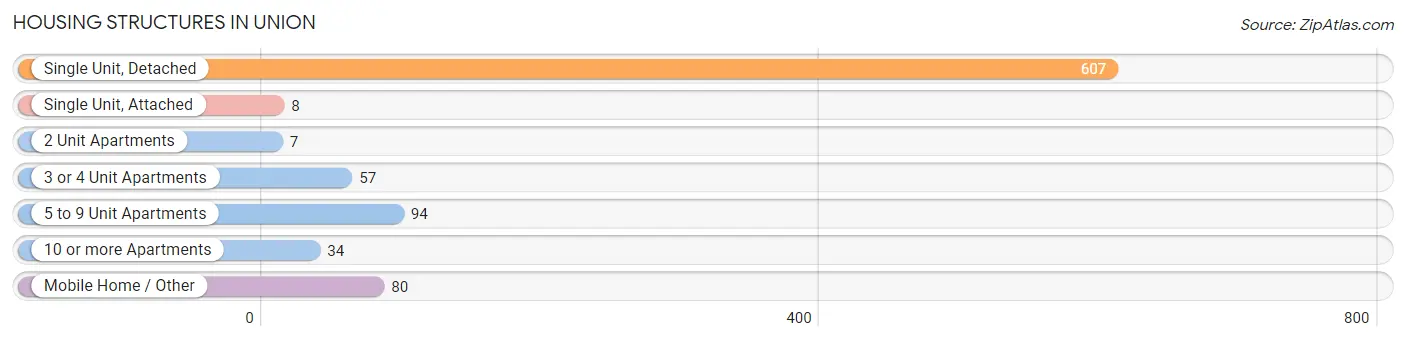
| Structure Type | # Housing Units | % Housing Units |
| Single Unit, Detached | 607 | 68.4% |
| Single Unit, Attached | 8 | 0.9% |
| 2 Unit Apartments | 7 | 0.8% |
| 3 or 4 Unit Apartments | 57 | 6.4% |
| 5 to 9 Unit Apartments | 94 | 10.6% |
| 10 or more Apartments | 34 | 3.8% |
| Mobile Home / Other | 80 | 9.0% |
| Total | 887 | 100.0% |
Housing Structures by Occupancy in Union
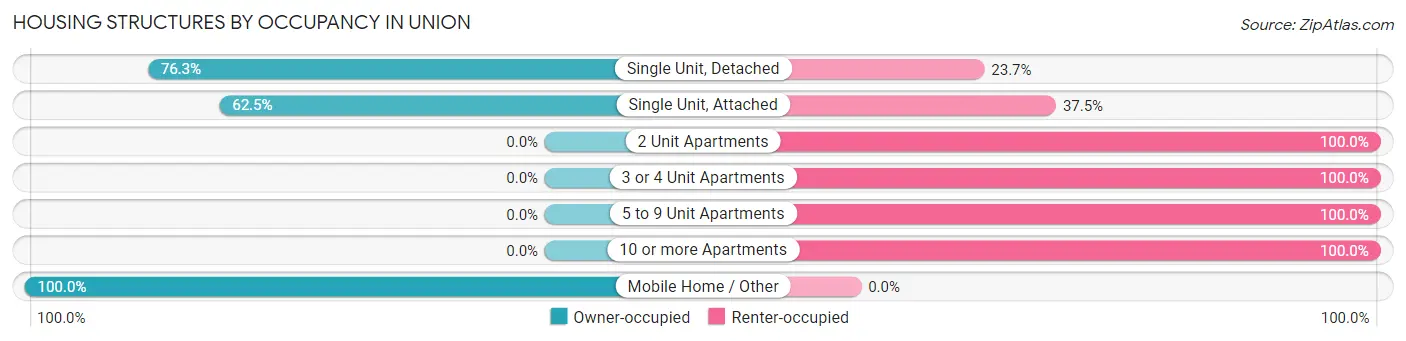
| Structure Type | Owner-occupied | Renter-occupied |
| Single Unit, Detached | 463 (76.3%) | 144 (23.7%) |
| Single Unit, Attached | 5 (62.5%) | 3 (37.5%) |
| 2 Unit Apartments | 0 (0.0%) | 7 (100.0%) |
| 3 or 4 Unit Apartments | 0 (0.0%) | 57 (100.0%) |
| 5 to 9 Unit Apartments | 0 (0.0%) | 94 (100.0%) |
| 10 or more Apartments | 0 (0.0%) | 34 (100.0%) |
| Mobile Home / Other | 80 (100.0%) | 0 (0.0%) |
| Total | 548 (61.8%) | 339 (38.2%) |
Housing Structures by Number of Rooms in Union
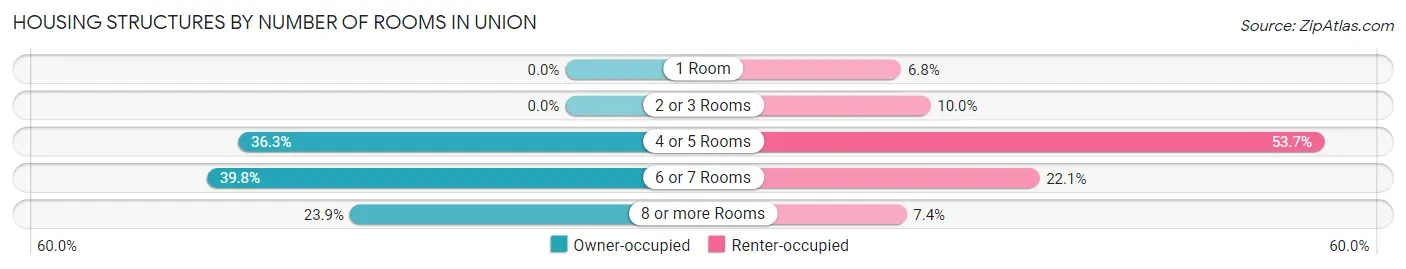
| Number of Rooms | Owner-occupied | Renter-occupied |
| 1 Room | 0 (0.0%) | 23 (6.8%) |
| 2 or 3 Rooms | 0 (0.0%) | 34 (10.0%) |
| 4 or 5 Rooms | 199 (36.3%) | 182 (53.7%) |
| 6 or 7 Rooms | 218 (39.8%) | 75 (22.1%) |
| 8 or more Rooms | 131 (23.9%) | 25 (7.4%) |
| Total | 548 (100.0%) | 339 (100.0%) |
Housing Structure by Heating Type in Union
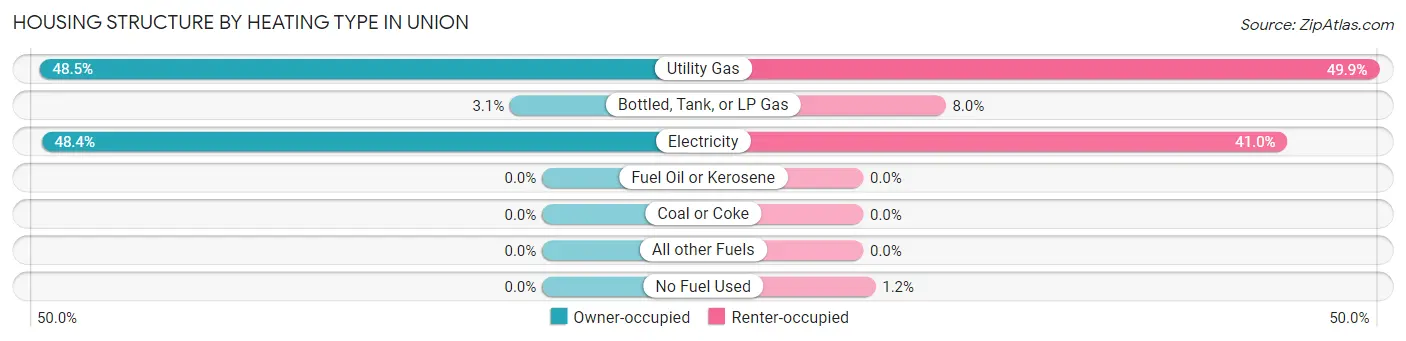
| Heating Type | Owner-occupied | Renter-occupied |
| Utility Gas | 266 (48.5%) | 169 (49.8%) |
| Bottled, Tank, or LP Gas | 17 (3.1%) | 27 (8.0%) |
| Electricity | 265 (48.4%) | 139 (41.0%) |
| Fuel Oil or Kerosene | 0 (0.0%) | 0 (0.0%) |
| Coal or Coke | 0 (0.0%) | 0 (0.0%) |
| All other Fuels | 0 (0.0%) | 0 (0.0%) |
| No Fuel Used | 0 (0.0%) | 4 (1.2%) |
| Total | 548 (100.0%) | 339 (100.0%) |
Household Vehicle Usage in Union
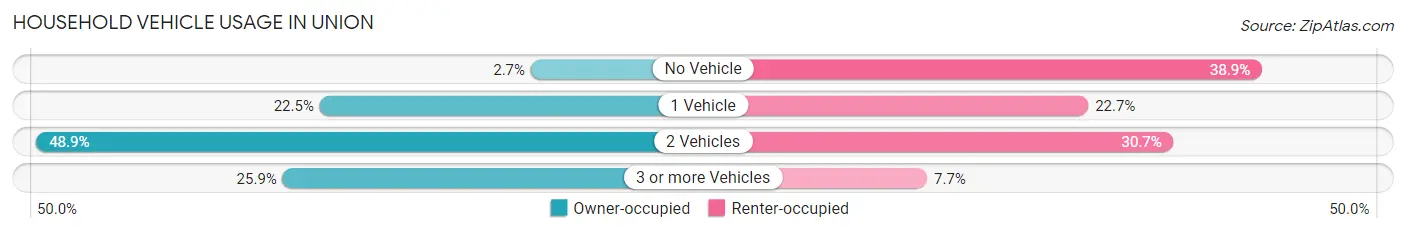
| Vehicles per Household | Owner-occupied | Renter-occupied |
| No Vehicle | 15 (2.7%) | 132 (38.9%) |
| 1 Vehicle | 123 (22.5%) | 77 (22.7%) |
| 2 Vehicles | 268 (48.9%) | 104 (30.7%) |
| 3 or more Vehicles | 142 (25.9%) | 26 (7.7%) |
| Total | 548 (100.0%) | 339 (100.0%) |
Real Estate & Mortgages in Union
Real Estate and Mortgage Overview in Union
| Characteristic | Without Mortgage | With Mortgage |
| Housing Units | 338 | 210 |
| Median Property Value | $97,400 | $119,400 |
| Median Household Income | $48,167 | $16 |
| Monthly Housing Costs | $435 | $8 |
| Real Estate Taxes | $546 | $43 |
Property Value by Mortgage Status in Union
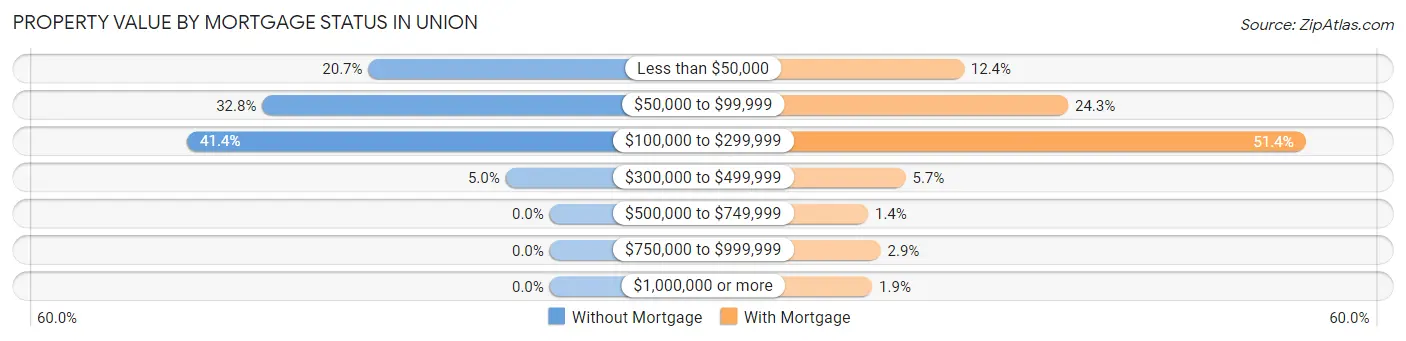
| Property Value | Without Mortgage | With Mortgage |
| Less than $50,000 | 70 (20.7%) | 26 (12.4%) |
| $50,000 to $99,999 | 111 (32.8%) | 51 (24.3%) |
| $100,000 to $299,999 | 140 (41.4%) | 108 (51.4%) |
| $300,000 to $499,999 | 17 (5.0%) | 12 (5.7%) |
| $500,000 to $749,999 | 0 (0.0%) | 3 (1.4%) |
| $750,000 to $999,999 | 0 (0.0%) | 6 (2.9%) |
| $1,000,000 or more | 0 (0.0%) | 4 (1.9%) |
| Total | 338 (100.0%) | 210 (100.0%) |
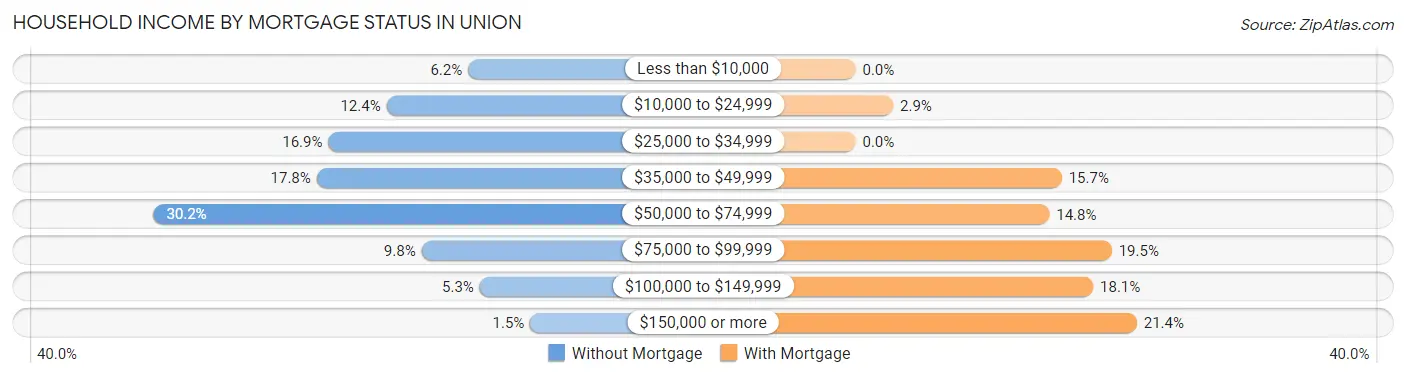
Household Income by Mortgage Status in Union
| Household Income | Without Mortgage | With Mortgage |
| Less than $10,000 | 21 (6.2%) | 0 (0.0%) |
| $10,000 to $24,999 | 42 (12.4%) | 6 (2.9%) |
| $25,000 to $34,999 | 57 (16.9%) | 0 (0.0%) |
| $35,000 to $49,999 | 60 (17.7%) | 33 (15.7%) |
| $50,000 to $74,999 | 102 (30.2%) | 31 (14.8%) |
| $75,000 to $99,999 | 33 (9.8%) | 41 (19.5%) |
| $100,000 to $149,999 | 18 (5.3%) | 38 (18.1%) |
| $150,000 or more | 5 (1.5%) | 45 (21.4%) |
| Total | 338 (100.0%) | 210 (100.0%) |
Property Value to Household Income Ratio in Union
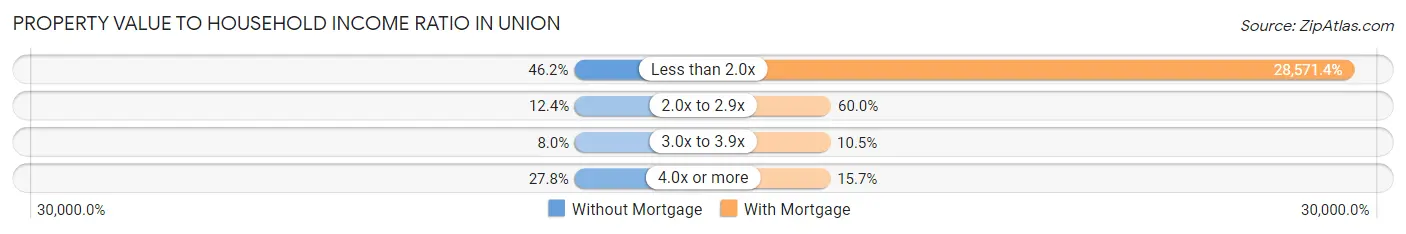
| Value-to-Income Ratio | Without Mortgage | With Mortgage |
| Less than 2.0x | 156 (46.2%) | 60,000 (28,571.4%) |
| 2.0x to 2.9x | 42 (12.4%) | 126 (60.0%) |
| 3.0x to 3.9x | 27 (8.0%) | 22 (10.5%) |
| 4.0x or more | 94 (27.8%) | 33 (15.7%) |
| Total | 338 (100.0%) | 210 (100.0%) |
Real Estate Taxes by Mortgage Status in Union
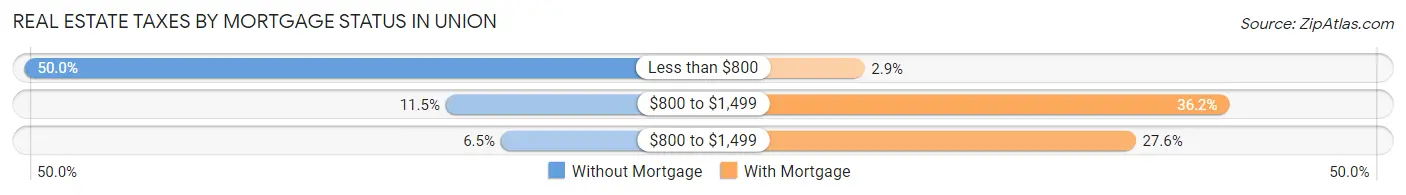
| Property Taxes | Without Mortgage | With Mortgage |
| Less than $800 | 169 (50.0%) | 6 (2.9%) |
| $800 to $1,499 | 39 (11.5%) | 76 (36.2%) |
| $800 to $1,499 | 22 (6.5%) | 58 (27.6%) |
| Total | 338 (100.0%) | 210 (100.0%) |
Health & Disability in Union
Health Insurance Coverage by Age in Union
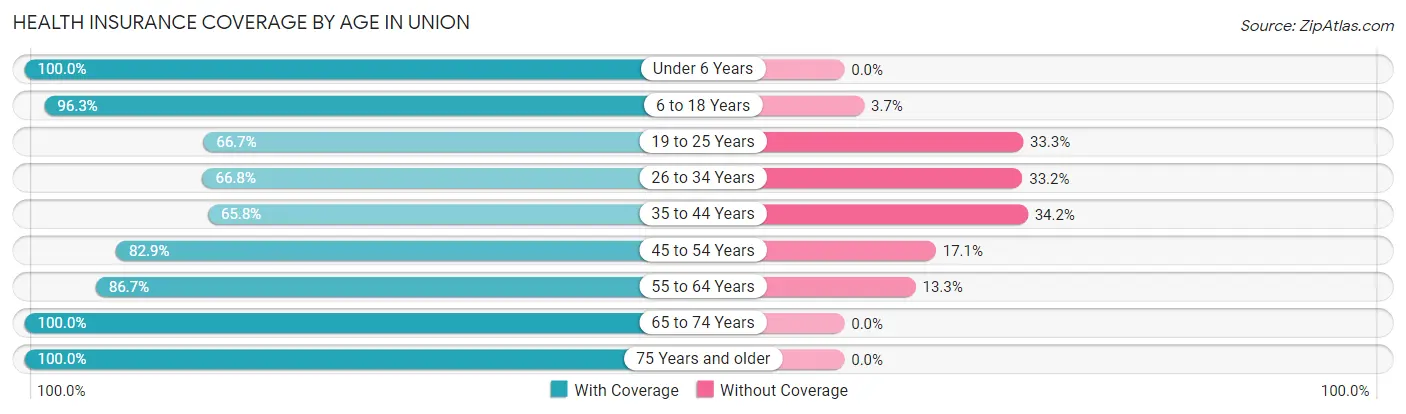
| Age Bracket | With Coverage | Without Coverage |
| Under 6 Years | 335 (100.0%) | 0 (0.0%) |
| 6 to 18 Years | 677 (96.3%) | 26 (3.7%) |
| 19 to 25 Years | 142 (66.7%) | 71 (33.3%) |
| 26 to 34 Years | 155 (66.8%) | 77 (33.2%) |
| 35 to 44 Years | 177 (65.8%) | 92 (34.2%) |
| 45 to 54 Years | 170 (82.9%) | 35 (17.1%) |
| 55 to 64 Years | 248 (86.7%) | 38 (13.3%) |
| 65 to 74 Years | 157 (100.0%) | 0 (0.0%) |
| 75 Years and older | 291 (100.0%) | 0 (0.0%) |
| Total | 2,352 (87.4%) | 339 (12.6%) |
Health Insurance Coverage by Citizenship Status in Union
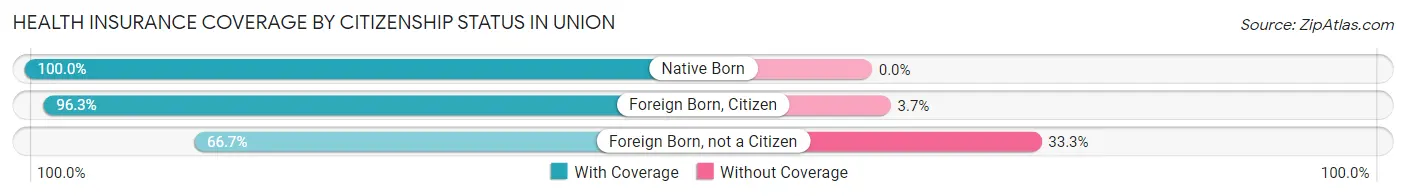
| Citizenship Status | With Coverage | Without Coverage |
| Native Born | 335 (100.0%) | 0 (0.0%) |
| Foreign Born, Citizen | 677 (96.3%) | 26 (3.7%) |
| Foreign Born, not a Citizen | 142 (66.7%) | 71 (33.3%) |
Health Insurance Coverage by Household Income in Union
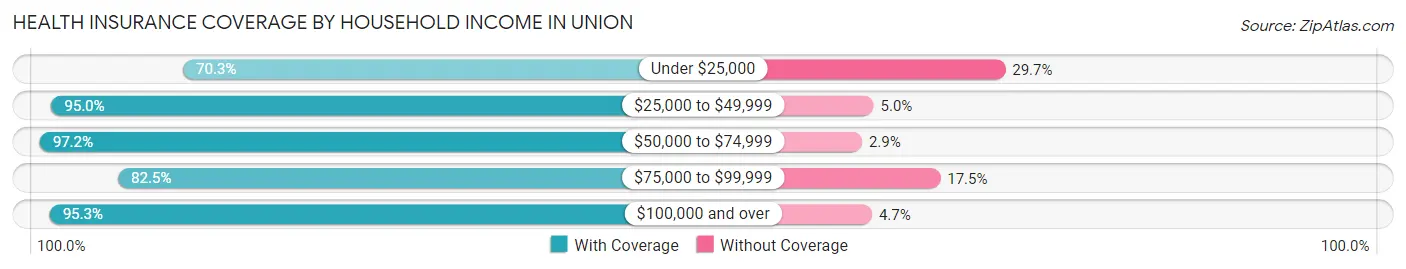
| Household Income | With Coverage | Without Coverage |
| Under $25,000 | 516 (70.3%) | 218 (29.7%) |
| $25,000 to $49,999 | 606 (95.0%) | 32 (5.0%) |
| $50,000 to $74,999 | 580 (97.2%) | 17 (2.9%) |
| $75,000 to $99,999 | 245 (82.5%) | 52 (17.5%) |
| $100,000 and over | 405 (95.3%) | 20 (4.7%) |
Public vs Private Health Insurance Coverage by Age in Union
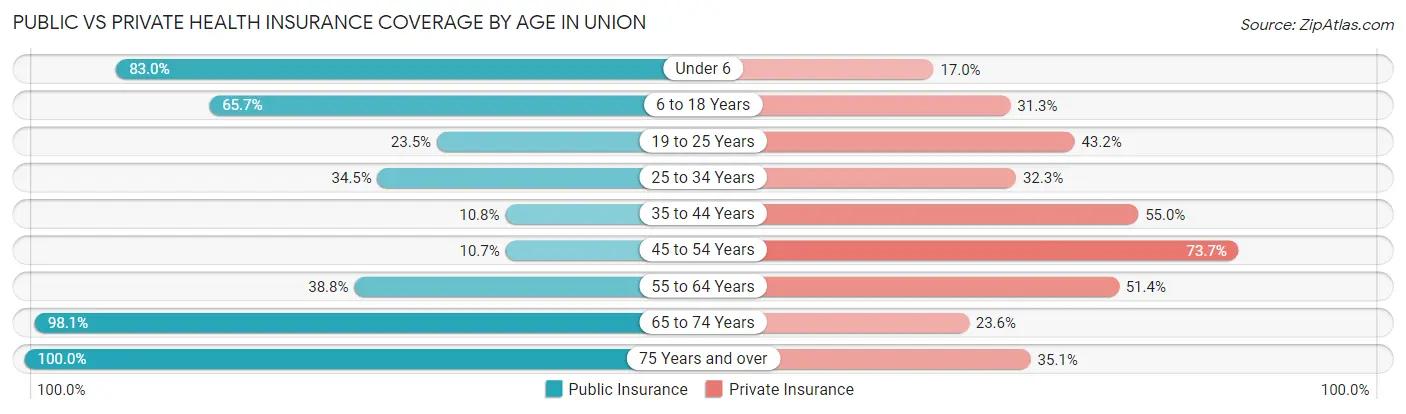
| Age Bracket | Public Insurance | Private Insurance |
| Under 6 | 278 (83.0%) | 57 (17.0%) |
| 6 to 18 Years | 462 (65.7%) | 220 (31.3%) |
| 19 to 25 Years | 50 (23.5%) | 92 (43.2%) |
| 25 to 34 Years | 80 (34.5%) | 75 (32.3%) |
| 35 to 44 Years | 29 (10.8%) | 148 (55.0%) |
| 45 to 54 Years | 22 (10.7%) | 151 (73.7%) |
| 55 to 64 Years | 111 (38.8%) | 147 (51.4%) |
| 65 to 74 Years | 154 (98.1%) | 37 (23.6%) |
| 75 Years and over | 291 (100.0%) | 102 (35.0%) |
| Total | 1,477 (54.9%) | 1,029 (38.2%) |
Disability Status by Sex by Age in Union
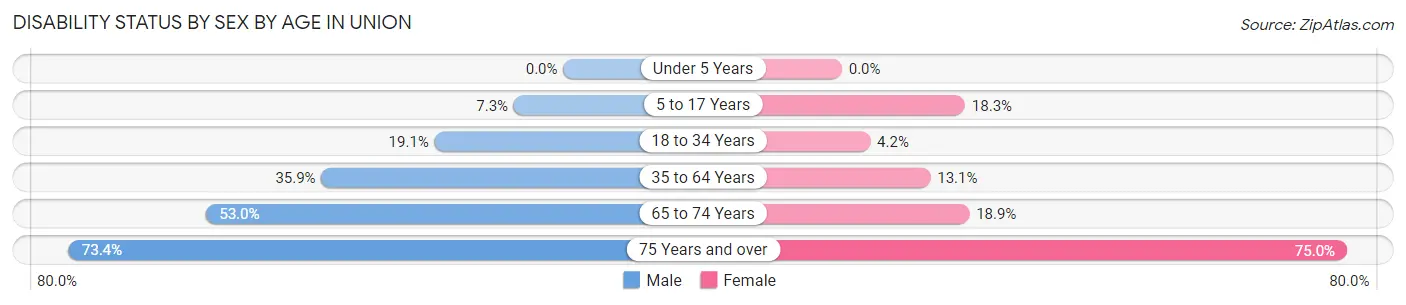
| Age Bracket | Male | Female |
| Under 5 Years | 0 (0.0%) | 0 (0.0%) |
| 5 to 17 Years | 24 (7.3%) | 66 (18.3%) |
| 18 to 34 Years | 43 (19.1%) | 12 (4.2%) |
| 35 to 64 Years | 139 (35.9%) | 49 (13.1%) |
| 65 to 74 Years | 44 (53.0%) | 14 (18.9%) |
| 75 Years and over | 58 (73.4%) | 159 (75.0%) |
Disability Class by Sex by Age in Union
Disability Class: Hearing Difficulty
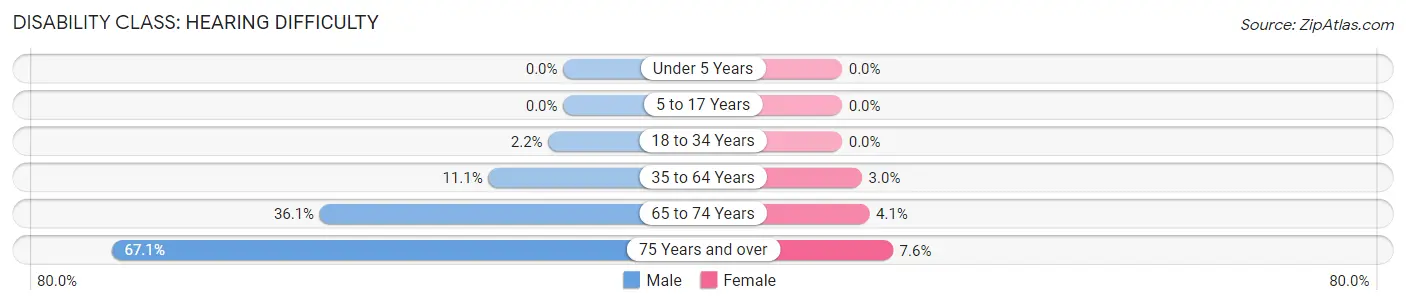
| Age Bracket | Male | Female |
| Under 5 Years | 0 (0.0%) | 0 (0.0%) |
| 5 to 17 Years | 0 (0.0%) | 0 (0.0%) |
| 18 to 34 Years | 5 (2.2%) | 0 (0.0%) |
| 35 to 64 Years | 43 (11.1%) | 11 (2.9%) |
| 65 to 74 Years | 30 (36.1%) | 3 (4.1%) |
| 75 Years and over | 53 (67.1%) | 16 (7.5%) |
Disability Class: Vision Difficulty
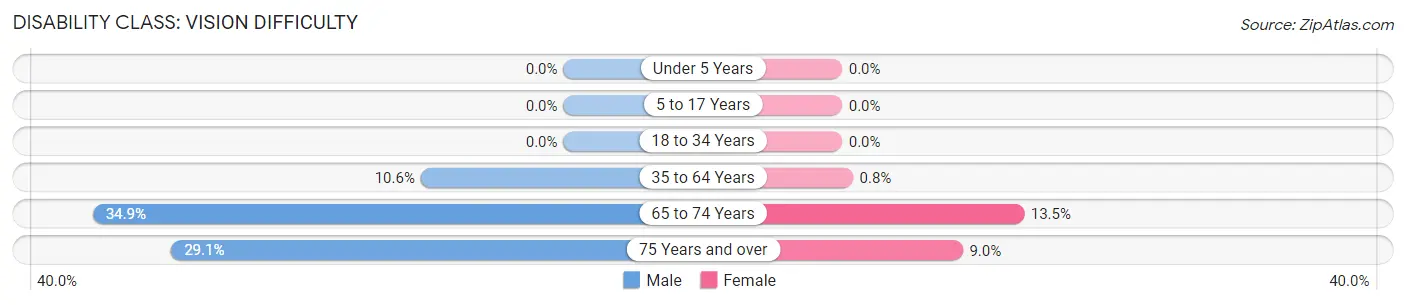
| Age Bracket | Male | Female |
| Under 5 Years | 0 (0.0%) | 0 (0.0%) |
| 5 to 17 Years | 0 (0.0%) | 0 (0.0%) |
| 18 to 34 Years | 0 (0.0%) | 0 (0.0%) |
| 35 to 64 Years | 41 (10.6%) | 3 (0.8%) |
| 65 to 74 Years | 29 (34.9%) | 10 (13.5%) |
| 75 Years and over | 23 (29.1%) | 19 (9.0%) |
Disability Class: Cognitive Difficulty
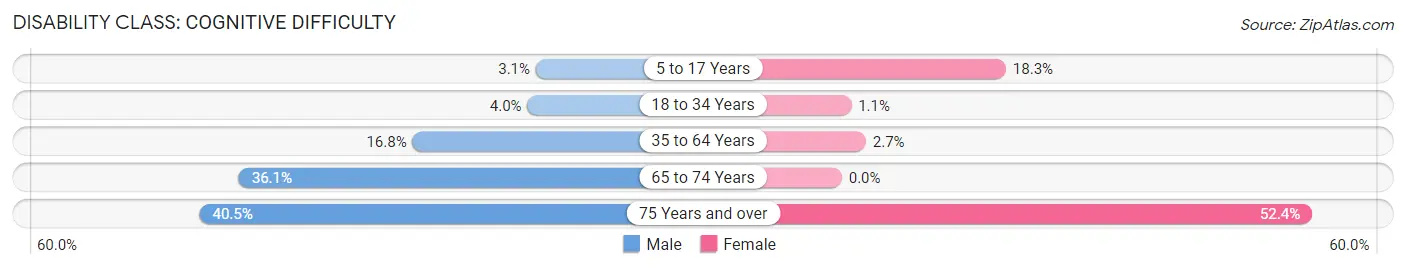
| Age Bracket | Male | Female |
| 5 to 17 Years | 10 (3.1%) | 66 (18.3%) |
| 18 to 34 Years | 9 (4.0%) | 3 (1.1%) |
| 35 to 64 Years | 65 (16.8%) | 10 (2.7%) |
| 65 to 74 Years | 30 (36.1%) | 0 (0.0%) |
| 75 Years and over | 32 (40.5%) | 111 (52.4%) |
Disability Class: Ambulatory Difficulty
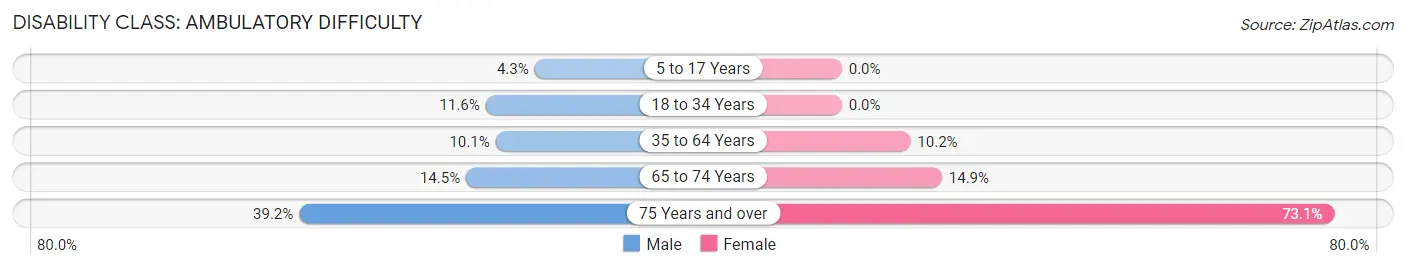
| Age Bracket | Male | Female |
| 5 to 17 Years | 14 (4.3%) | 0 (0.0%) |
| 18 to 34 Years | 26 (11.6%) | 0 (0.0%) |
| 35 to 64 Years | 39 (10.1%) | 38 (10.2%) |
| 65 to 74 Years | 12 (14.5%) | 11 (14.9%) |
| 75 Years and over | 31 (39.2%) | 155 (73.1%) |
Disability Class: Self-Care Difficulty
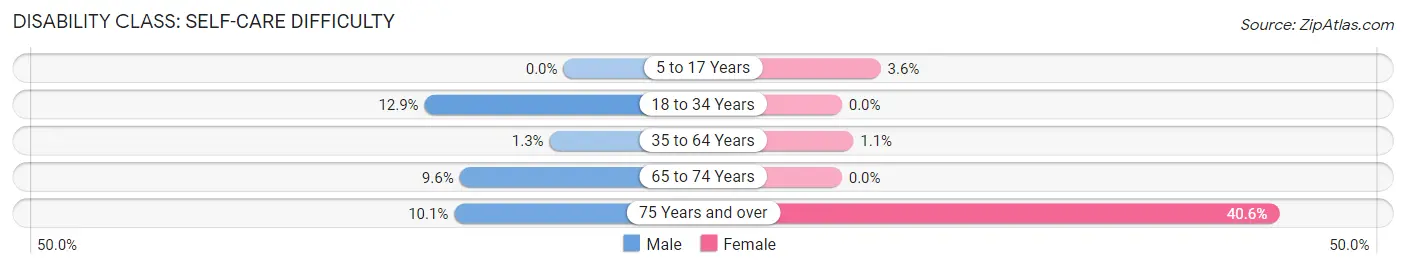
| Age Bracket | Male | Female |
| 5 to 17 Years | 0 (0.0%) | 13 (3.6%) |
| 18 to 34 Years | 29 (12.9%) | 0 (0.0%) |
| 35 to 64 Years | 5 (1.3%) | 4 (1.1%) |
| 65 to 74 Years | 8 (9.6%) | 0 (0.0%) |
| 75 Years and over | 8 (10.1%) | 86 (40.6%) |
Technology Access in Union
Computing Device Access in Union
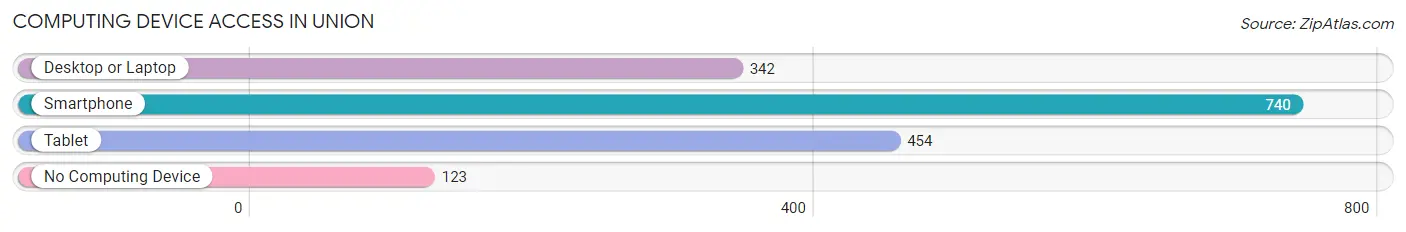
| Device Type | # Households | % Households |
| Desktop or Laptop | 342 | 38.6% |
| Smartphone | 740 | 83.4% |
| Tablet | 454 | 51.2% |
| No Computing Device | 123 | 13.9% |
| Total | 887 | 100.0% |
Internet Access in Union
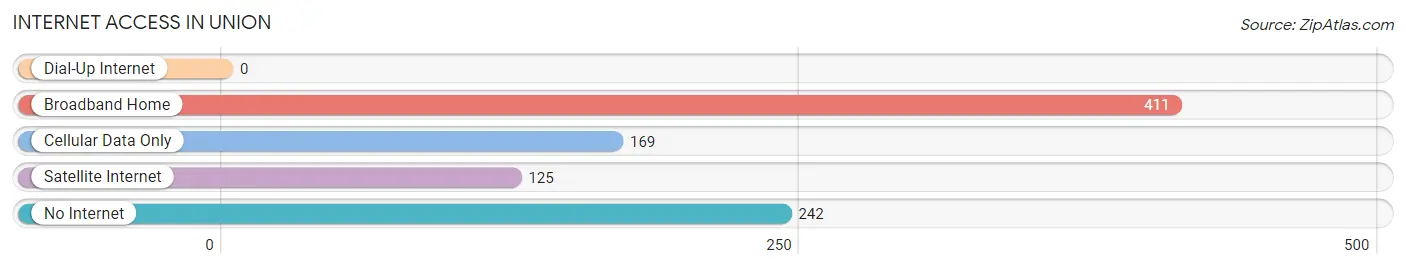
| Internet Type | # Households | % Households |
| Dial-Up Internet | 0 | 0.0% |
| Broadband Home | 411 | 46.3% |
| Cellular Data Only | 169 | 19.1% |
| Satellite Internet | 125 | 14.1% |
| No Internet | 242 | 27.3% |
| Total | 887 | 100.0% |
Union Summary
MS History
Mississippi is a state located in the southeastern region of the United States. It is bordered by Tennessee to the north, Alabama to the east, the Gulf of Mexico to the south, and Louisiana and Arkansas to the west. Mississippi was admitted to the Union as the 20th state on December 10, 1817.
The history of Mississippi dates back to the Paleo-Indian period, which began around 12,000 years ago. The first inhabitants of the area were Native American tribes, including the Choctaw, Chickasaw, and Natchez. The first Europeans to explore the area were the Spanish, who arrived in the 16th century. The French also explored the area, and in 1798, the United States acquired the region as part of the Louisiana Purchase.
In the early 19th century, Mississippi was a part of the Mississippi Territory, which was created in 1798. The territory was divided into the states of Mississippi and Alabama in 1817. During this time, Mississippi was a slave state, and the economy was largely based on cotton production.
In 1861, Mississippi seceded from the Union and joined the Confederate States of America. During the Civil War, Mississippi was the site of several battles, including the Battle of Vicksburg. After the war, Mississippi was readmitted to the Union in 1870.
In the late 19th and early 20th centuries, Mississippi was a largely rural state, and the economy was based on agriculture. In the 1920s, the state began to industrialize, and the economy shifted to manufacturing. During this time, the state also experienced a period of racial violence, as African Americans were denied basic civil rights.
In the 1950s and 1960s, Mississippi was a major site of the civil rights movement. The state was the site of several major civil rights protests, including the Freedom Rides and the March on Washington. In 1964, the Civil Rights Act was passed, which outlawed discrimination based on race, color, religion, sex, or national origin.
Geography
Mississippi is located in the southeastern region of the United States. It is bordered by Tennessee to the north, Alabama to the east, the Gulf of Mexico to the south, and Louisiana and Arkansas to the west. The state has a total area of 48,430 square miles, making it the 32nd largest state in the country.
The landscape of Mississippi is mostly flat, with rolling hills in the north and east. The highest point in the state is Woodall Mountain, which has an elevation of 806 feet. The state is divided into three distinct geographic regions: the Gulf Coastal Plain, the Mississippi Alluvial Plain, and the Mississippi Delta.
The Gulf Coastal Plain is located along the Gulf of Mexico and is characterized by sandy beaches and wetlands. The Mississippi Alluvial Plain is located in the northern part of the state and is characterized by flat, fertile land. The Mississippi Delta is located in the western part of the state and is characterized by flat, low-lying land.
Economy
The economy of Mississippi is largely based on agriculture, manufacturing, and services. The state is a major producer of cotton, soybeans, corn, and rice. Other important agricultural products include poultry, livestock, and timber.
Manufacturing is also an important part of the state’s economy. Mississippi is home to several major automotive and aerospace companies, including Nissan and Airbus. The state is also a major producer of chemicals, furniture, and textiles.
The service sector is also an important part of the state’s economy. Tourism is a major industry in Mississippi, with visitors drawn to the state’s beaches, casinos, and historic sites. The state is also home to several major universities, including the University of Mississippi and Mississippi State University.
Demographics
As of 2020, the population of Mississippi was estimated to be 2,976,149. The state has a population density of 60.3 people per square mile, making it the 37th most densely populated state in the country.
The racial makeup of Mississippi is 63.7% White, 37.2% African American, 0.3% Native American, 0.5% Asian, 0.1% Pacific Islander, 0.3% from other races, and 1.9% from two or more races. The Hispanic or Latino population of the state is 2.2%.
The largest cities in Mississippi are Jackson, Gulfport, Southaven, Hattiesburg, and Biloxi. The capital of Mississippi is Jackson, which is also the state’s largest city. The state’s official language is English.
Common Questions
What is Per Capita Income in Union?
Per Capita income in Union is $16,216.
What is the Median Family Income in Union?
Median Family Income in Union is $44,519.
What is the Median Household income in Union?
Median Household Income in Union is $40,201.
What is Income or Wage Gap in Union?
Income or Wage Gap in Union is 15.9%.
Women in Union earn 84.1 cents for every dollar earned by a man.
What is Inequality or Gini Index in Union?
Inequality or Gini Index in Union is 0.50.
What is the Total Population of Union?
Total Population of Union is 2,780.
What is the Total Male Population of Union?
Total Male Population of Union is 1,230.
What is the Total Female Population of Union?
Total Female Population of Union is 1,550.
What is the Ratio of Males per 100 Females in Union?
There are 79.35 Males per 100 Females in Union.
What is the Ratio of Females per 100 Males in Union?
There are 126.02 Females per 100 Males in Union.
What is the Median Population Age in Union?
Median Population Age in Union is 30.7 Years.
What is the Average Family Size in Union
Average Family Size in Union is 3.8 People.
What is the Average Household Size in Union
Average Household Size in Union is 3.0 People.
How Large is the Labor Force in Union?
There are 893 People in the Labor Forcein in Union.
What is the Percentage of People in the Labor Force in Union?
46.5% of People are in the Labor Force in Union.
What is the Unemployment Rate in Union?
Unemployment Rate in Union is 14.2%.