Clarksdale, MS Map & Demographics
Clarksdale Map
Clarksdale Overview
$21,166
PER CAPITA INCOME
$41,307
AVG FAMILY INCOME
$35,377
AVG HOUSEHOLD INCOME
30.7%
WAGE / INCOME GAP [ % ]
69.3¢/ $1
WAGE / INCOME GAP [ $ ]
$11,362
FAMILY INCOME DEFICIT
0.51
INEQUALITY / GINI INDEX
14,769
TOTAL POPULATION
7,169
MALE POPULATION
7,600
FEMALE POPULATION
94.33
MALES / 100 FEMALES
106.01
FEMALES / 100 MALES
35.4
MEDIAN AGE
3.2
AVG FAMILY SIZE
2.5
AVG HOUSEHOLD SIZE
5,945
LABOR FORCE [ PEOPLE ]
52.5%
PERCENT IN LABOR FORCE
12.6%
UNEMPLOYMENT RATE
Clarksdale Zip Codes
Clarksdale Area Codes
Income in Clarksdale
Income Overview in Clarksdale
Per Capita Income in Clarksdale is $21,166, while median incomes of families and households are $41,307 and $35,377 respectively.
| Characteristic | Number | Measure |
| Per Capita Income | 14,769 | $21,166 |
| Median Family Income | 3,545 | $41,307 |
| Mean Family Income | 3,545 | $59,009 |
| Median Household Income | 5,849 | $35,377 |
| Mean Household Income | 5,849 | $50,019 |
| Income Deficit | 3,545 | $11,362 |
| Wage / Income Gap (%) | 14,769 | 30.71% |
| Wage / Income Gap ($) | 14,769 | 69.29¢ per $1 |
| Gini / Inequality Index | 14,769 | 0.51 |
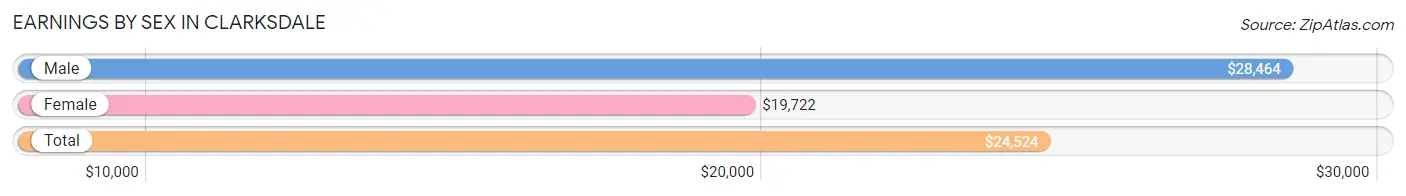
Earnings by Sex in Clarksdale
Average Earnings in Clarksdale are $24,524, $28,464 for men and $19,722 for women, a difference of 30.7%.
| Sex | Number | Average Earnings |
| Male | 2,717 (47.8%) | $28,464 |
| Female | 2,971 (52.2%) | $19,722 |
| Total | 5,688 (100.0%) | $24,524 |
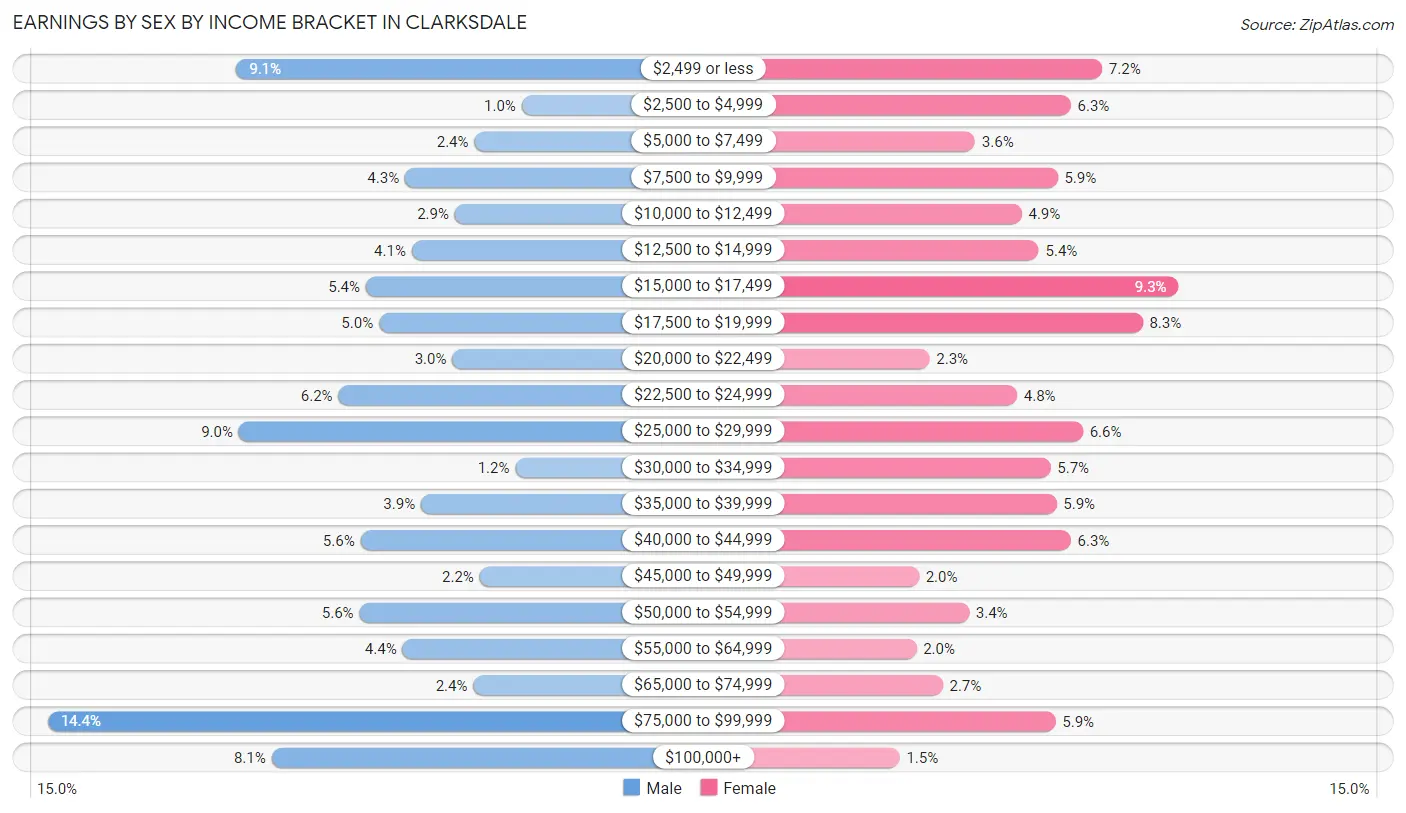
Earnings by Sex by Income Bracket in Clarksdale
The most common earnings brackets in Clarksdale are $75,000 to $99,999 for men (390 | 14.3%) and $15,000 to $17,499 for women (277 | 9.3%).
| Income | Male | Female |
| $2,499 or less | 246 (9.0%) | 213 (7.2%) |
| $2,500 to $4,999 | 28 (1.0%) | 187 (6.3%) |
| $5,000 to $7,499 | 64 (2.4%) | 107 (3.6%) |
| $7,500 to $9,999 | 117 (4.3%) | 176 (5.9%) |
| $10,000 to $12,499 | 79 (2.9%) | 146 (4.9%) |
| $12,500 to $14,999 | 112 (4.1%) | 160 (5.4%) |
| $15,000 to $17,499 | 147 (5.4%) | 277 (9.3%) |
| $17,500 to $19,999 | 137 (5.0%) | 247 (8.3%) |
| $20,000 to $22,499 | 81 (3.0%) | 69 (2.3%) |
| $22,500 to $24,999 | 168 (6.2%) | 142 (4.8%) |
| $25,000 to $29,999 | 244 (9.0%) | 197 (6.6%) |
| $30,000 to $34,999 | 33 (1.2%) | 170 (5.7%) |
| $35,000 to $39,999 | 105 (3.9%) | 175 (5.9%) |
| $40,000 to $44,999 | 151 (5.6%) | 187 (6.3%) |
| $45,000 to $49,999 | 60 (2.2%) | 60 (2.0%) |
| $50,000 to $54,999 | 152 (5.6%) | 102 (3.4%) |
| $55,000 to $64,999 | 119 (4.4%) | 58 (1.9%) |
| $65,000 to $74,999 | 65 (2.4%) | 80 (2.7%) |
| $75,000 to $99,999 | 390 (14.3%) | 174 (5.9%) |
| $100,000+ | 219 (8.1%) | 44 (1.5%) |
| Total | 2,717 (100.0%) | 2,971 (100.0%) |
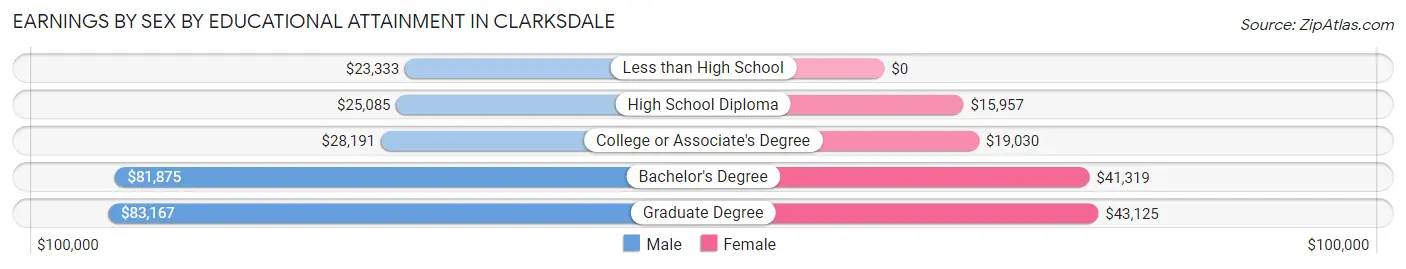
Earnings by Sex by Educational Attainment in Clarksdale
Average earnings in Clarksdale are $33,646 for men and $23,264 for women, a difference of 30.9%. Men with an educational attainment of graduate degree enjoy the highest average annual earnings of $83,167, while those with less than high school education earn the least with $23,333. Women with an educational attainment of graduate degree earn the most with the average annual earnings of $43,125, while those with high school diploma education have the smallest earnings of $15,957.
| Educational Attainment | Male Income | Female Income |
| Less than High School | $23,333 | $0 |
| High School Diploma | $25,085 | $15,957 |
| College or Associate's Degree | $28,191 | $19,030 |
| Bachelor's Degree | $81,875 | $41,319 |
| Graduate Degree | $83,167 | $43,125 |
| Total | $33,646 | $23,264 |
Family Income in Clarksdale
Family Income Brackets in Clarksdale
According to the Clarksdale family income data, there are 674 families falling into the $35,000 to $49,999 income range, which is the most common income bracket and makes up 19.0% of all families. Conversely, the $150,000 to $199,999 income bracket is the least frequent group with only 43 families (1.2%) belonging to this category.
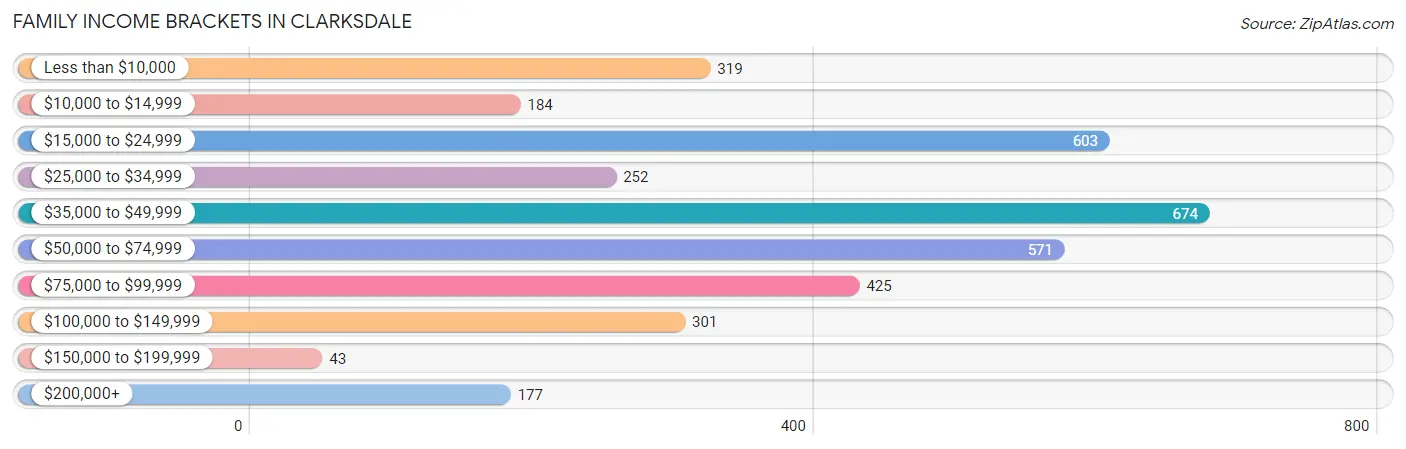
| Income Bracket | # Families | % Families |
| Less than $10,000 | 319 | 9.0% |
| $10,000 to $14,999 | 184 | 5.2% |
| $15,000 to $24,999 | 603 | 17.0% |
| $25,000 to $34,999 | 252 | 7.1% |
| $35,000 to $49,999 | 674 | 19.0% |
| $50,000 to $74,999 | 571 | 16.1% |
| $75,000 to $99,999 | 425 | 12.0% |
| $100,000 to $149,999 | 301 | 8.5% |
| $150,000 to $199,999 | 43 | 1.2% |
| $200,000+ | 177 | 5.0% |
Family Income by Famaliy Size in Clarksdale
7+ person families (144 | 4.1%) account for the highest median family income in Clarksdale with $50,455 per family, while 2-person families (1,589 | 44.8%) have the highest median income of $22,973 per family member.
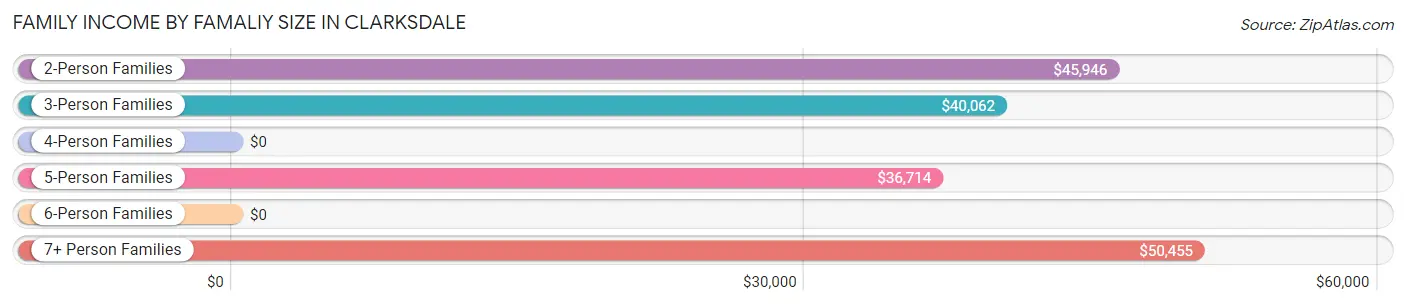
| Income Bracket | # Families | Median Income |
| 2-Person Families | 1,589 (44.8%) | $45,946 |
| 3-Person Families | 950 (26.8%) | $40,062 |
| 4-Person Families | 606 (17.1%) | $0 |
| 5-Person Families | 213 (6.0%) | $36,714 |
| 6-Person Families | 43 (1.2%) | $0 |
| 7+ Person Families | 144 (4.1%) | $50,455 |
| Total | 3,545 (100.0%) | $41,307 |
Family Income by Number of Earners in Clarksdale
The median family income in Clarksdale is $41,307, with families comprising 2 earners (784) having the highest median family income of $91,905, while families with no earners (861) have the lowest median family income of $25,568, accounting for 22.1% and 24.3% of families, respectively.
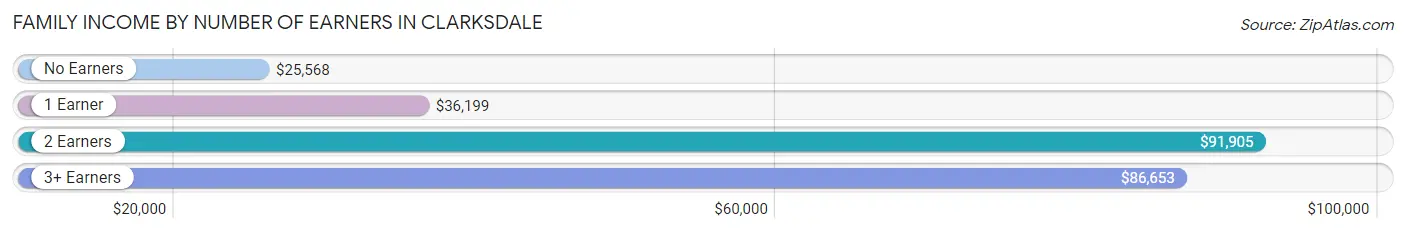
| Number of Earners | # Families | Median Income |
| No Earners | 861 (24.3%) | $25,568 |
| 1 Earner | 1,751 (49.4%) | $36,199 |
| 2 Earners | 784 (22.1%) | $91,905 |
| 3+ Earners | 149 (4.2%) | $86,653 |
| Total | 3,545 (100.0%) | $41,307 |
Household Income in Clarksdale
Household Income Brackets in Clarksdale
With 994 households falling in the category, the $15,000 to $24,999 income range is the most frequent in Clarksdale, accounting for 17.0% of all households. In contrast, only 47 households (0.8%) fall into the $150,000 to $199,999 income bracket, making it the least populous group.
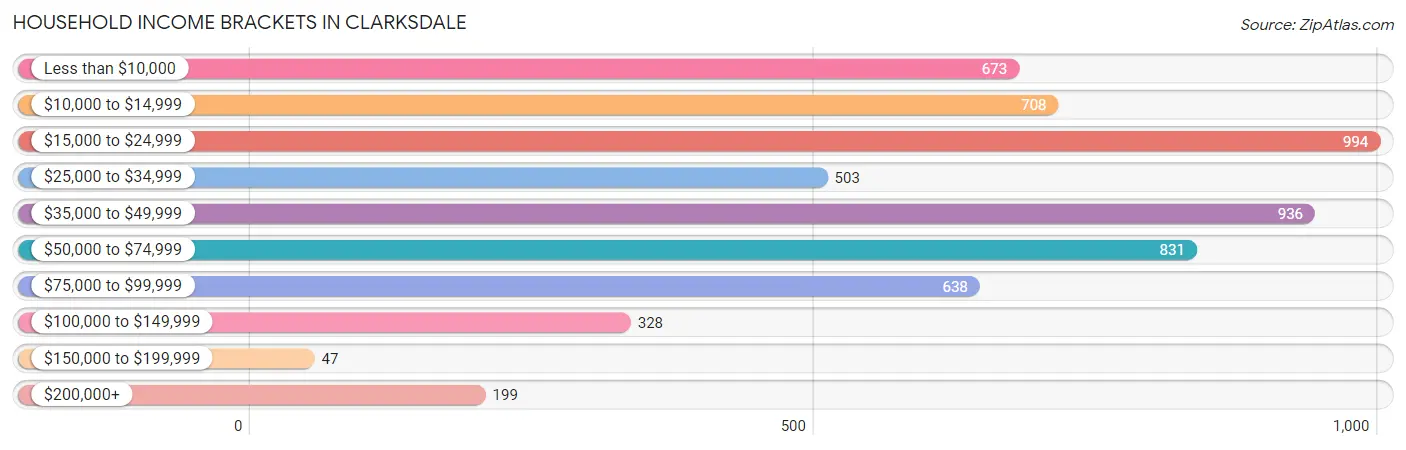
| Income Bracket | # Households | % Households |
| Less than $10,000 | 673 | 11.5% |
| $10,000 to $14,999 | 708 | 12.1% |
| $15,000 to $24,999 | 994 | 17.0% |
| $25,000 to $34,999 | 503 | 8.6% |
| $35,000 to $49,999 | 936 | 16.0% |
| $50,000 to $74,999 | 831 | 14.2% |
| $75,000 to $99,999 | 638 | 10.9% |
| $100,000 to $149,999 | 328 | 5.6% |
| $150,000 to $199,999 | 47 | 0.8% |
| $200,000+ | 199 | 3.4% |
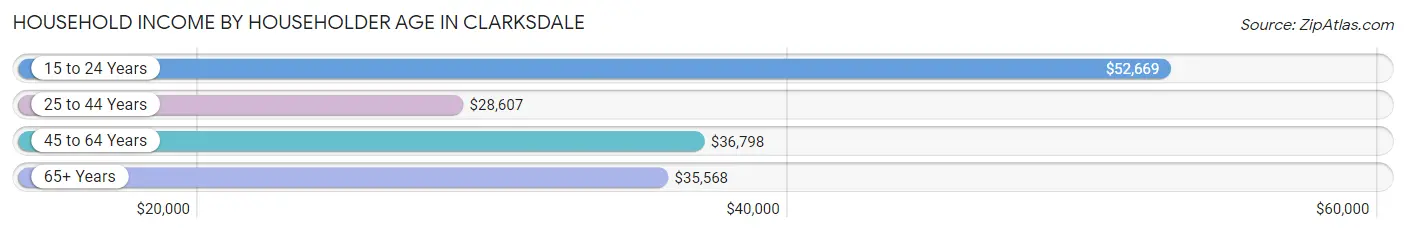
Household Income by Householder Age in Clarksdale
The median household income in Clarksdale is $35,377, with the highest median household income of $52,669 found in the 15 to 24 years age bracket for the primary householder. A total of 198 households (3.4%) fall into this category. Meanwhile, the 25 to 44 years age bracket for the primary householder has the lowest median household income of $28,607, with 1,731 households (29.6%) in this group.
| Income Bracket | # Households | Median Income |
| 15 to 24 Years | 198 (3.4%) | $52,669 |
| 25 to 44 Years | 1,731 (29.6%) | $28,607 |
| 45 to 64 Years | 2,167 (37.0%) | $36,798 |
| 65+ Years | 1,753 (30.0%) | $35,568 |
| Total | 5,849 (100.0%) | $35,377 |
Poverty in Clarksdale
Income Below Poverty by Sex and Age in Clarksdale
With 40.5% poverty level for males and 40.9% for females among the residents of Clarksdale, 15 year old males and 12 to 14 year old females are the most vulnerable to poverty, with 118 males (81.4%) and 198 females (79.2%) in their respective age groups living below the poverty level.
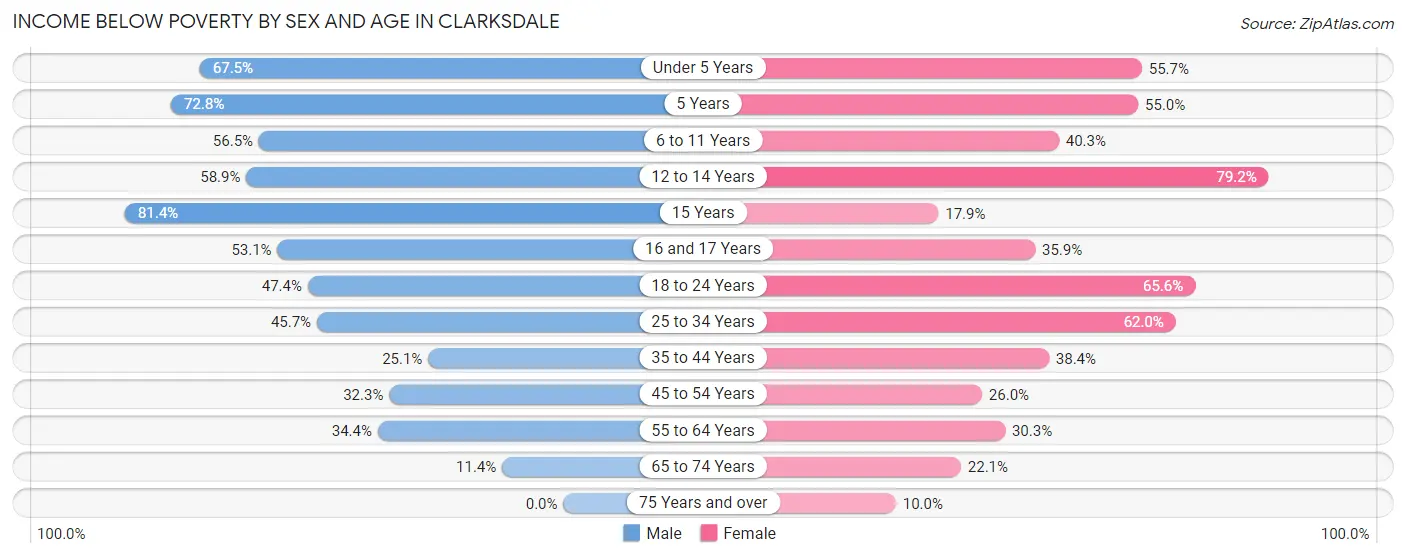
| Age Bracket | Male | Female |
| Under 5 Years | 398 (67.5%) | 323 (55.7%) |
| 5 Years | 75 (72.8%) | 33 (55.0%) |
| 6 to 11 Years | 317 (56.5%) | 269 (40.3%) |
| 12 to 14 Years | 226 (58.9%) | 198 (79.2%) |
| 15 Years | 118 (81.4%) | 12 (17.9%) |
| 16 and 17 Years | 121 (53.1%) | 66 (35.9%) |
| 18 to 24 Years | 351 (47.4%) | 514 (65.6%) |
| 25 to 34 Years | 430 (45.7%) | 603 (62.0%) |
| 35 to 44 Years | 203 (25.1%) | 327 (38.4%) |
| 45 to 54 Years | 201 (32.3%) | 187 (26.0%) |
| 55 to 64 Years | 291 (34.4%) | 305 (30.3%) |
| 65 to 74 Years | 82 (11.4%) | 179 (22.1%) |
| 75 Years and over | 0 (0.0%) | 56 (10.0%) |
| Total | 2,813 (40.5%) | 3,072 (40.9%) |
Income Above Poverty by Sex and Age in Clarksdale
According to the poverty statistics in Clarksdale, males aged 75 years and over and females aged 75 years and over are the age groups that are most secure financially, with 100.0% of males and 90.0% of females in these age groups living above the poverty line.
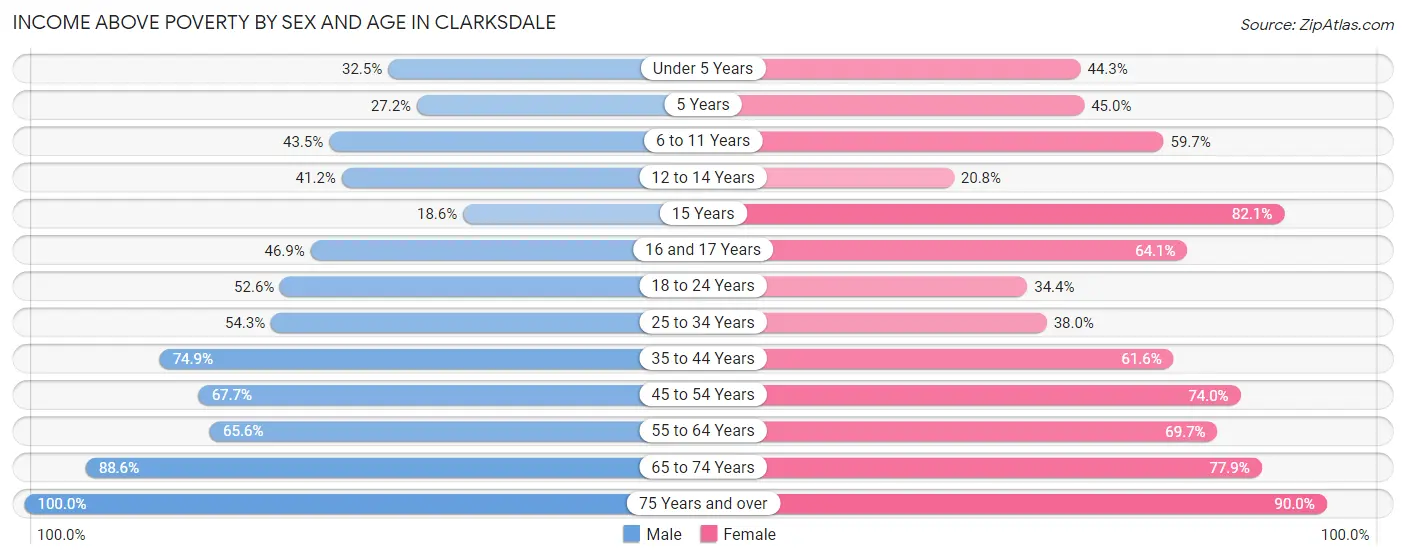
| Age Bracket | Male | Female |
| Under 5 Years | 192 (32.5%) | 257 (44.3%) |
| 5 Years | 28 (27.2%) | 27 (45.0%) |
| 6 to 11 Years | 244 (43.5%) | 399 (59.7%) |
| 12 to 14 Years | 158 (41.1%) | 52 (20.8%) |
| 15 Years | 27 (18.6%) | 55 (82.1%) |
| 16 and 17 Years | 107 (46.9%) | 118 (64.1%) |
| 18 to 24 Years | 389 (52.6%) | 270 (34.4%) |
| 25 to 34 Years | 510 (54.3%) | 370 (38.0%) |
| 35 to 44 Years | 606 (74.9%) | 524 (61.6%) |
| 45 to 54 Years | 421 (67.7%) | 532 (74.0%) |
| 55 to 64 Years | 554 (65.6%) | 702 (69.7%) |
| 65 to 74 Years | 639 (88.6%) | 631 (77.9%) |
| 75 Years and over | 258 (100.0%) | 503 (90.0%) |
| Total | 4,133 (59.5%) | 4,440 (59.1%) |
Income Below Poverty Among Married-Couple Families in Clarksdale
The poverty statistics for married-couple families in Clarksdale show that 2.0% or 26 of the total 1,284 families live below the poverty line. Families with 1 or 2 children have the highest poverty rate of 5.6%, comprising of 20 families. On the other hand, families with 3 or 4 children have the lowest poverty rate of 0.0%, which includes 0 families.
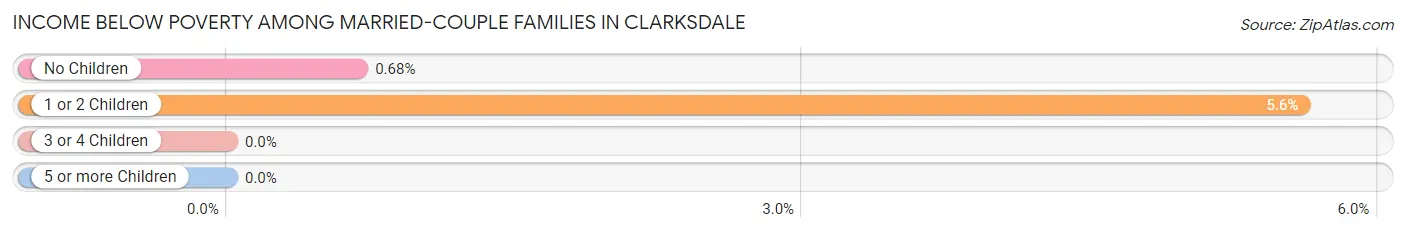
| Children | Above Poverty | Below Poverty |
| No Children | 882 (99.3%) | 6 (0.7%) |
| 1 or 2 Children | 337 (94.4%) | 20 (5.6%) |
| 3 or 4 Children | 39 (100.0%) | 0 (0.0%) |
| 5 or more Children | 0 (0.0%) | 0 (0.0%) |
| Total | 1,258 (98.0%) | 26 (2.0%) |
Income Below Poverty Among Single-Parent Households in Clarksdale
According to the poverty data in Clarksdale, 43.2% or 206 single-father households and 49.7% or 886 single-mother households are living below the poverty line. Among single-father households, those with 1 or 2 children have the highest poverty rate, with 88 households (54.0%) experiencing poverty. Likewise, among single-mother households, those with 5 or more children have the highest poverty rate, with 123 households (100.0%) falling below the poverty line.
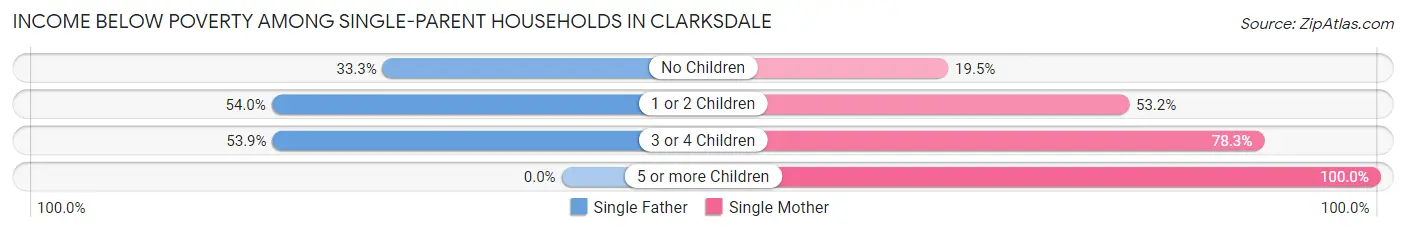
| Children | Single Father | Single Mother |
| No Children | 83 (33.3%) | 100 (19.5%) |
| 1 or 2 Children | 88 (54.0%) | 497 (53.2%) |
| 3 or 4 Children | 35 (53.8%) | 166 (78.3%) |
| 5 or more Children | 0 (0.0%) | 123 (100.0%) |
| Total | 206 (43.2%) | 886 (49.7%) |
Income Below Poverty Among Married-Couple vs Single-Parent Households in Clarksdale
The poverty data for Clarksdale shows that 26 of the married-couple family households (2.0%) and 1,092 of the single-parent households (48.3%) are living below the poverty level. Within the married-couple family households, those with 1 or 2 children have the highest poverty rate, with 20 households (5.6%) falling below the poverty line. Among the single-parent households, those with 5 or more children have the highest poverty rate, with 123 household (100.0%) living below poverty.
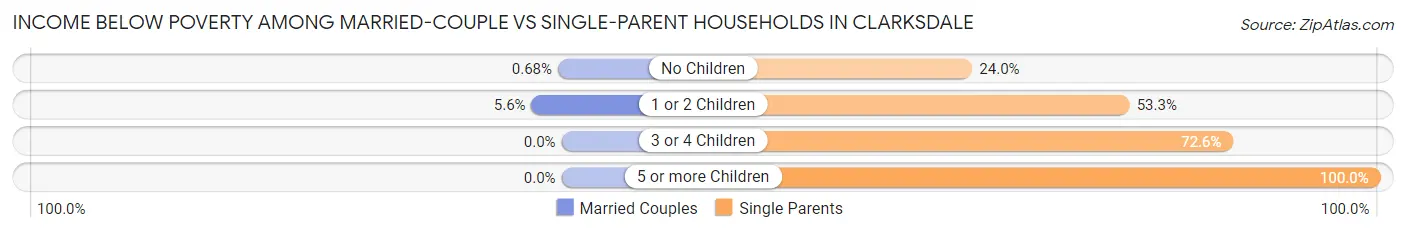
| Children | Married-Couple Families | Single-Parent Households |
| No Children | 6 (0.7%) | 183 (24.0%) |
| 1 or 2 Children | 20 (5.6%) | 585 (53.3%) |
| 3 or 4 Children | 0 (0.0%) | 201 (72.6%) |
| 5 or more Children | 0 (0.0%) | 123 (100.0%) |
| Total | 26 (2.0%) | 1,092 (48.3%) |
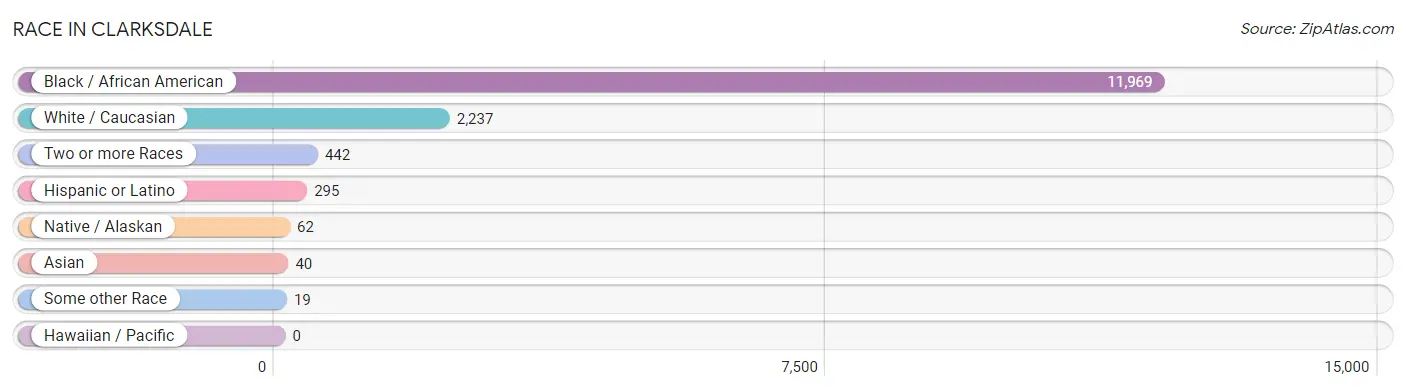
Race in Clarksdale
The most populous races in Clarksdale are Black / African American (11,969 | 81.0%), White / Caucasian (2,237 | 15.1%), and Two or more Races (442 | 3.0%).
| Race | # Population | % Population |
| Asian | 40 | 0.3% |
| Black / African American | 11,969 | 81.0% |
| Hawaiian / Pacific | 0 | 0.0% |
| Hispanic or Latino | 295 | 2.0% |
| Native / Alaskan | 62 | 0.4% |
| White / Caucasian | 2,237 | 15.1% |
| Two or more Races | 442 | 3.0% |
| Some other Race | 19 | 0.1% |
| Total | 14,769 | 100.0% |
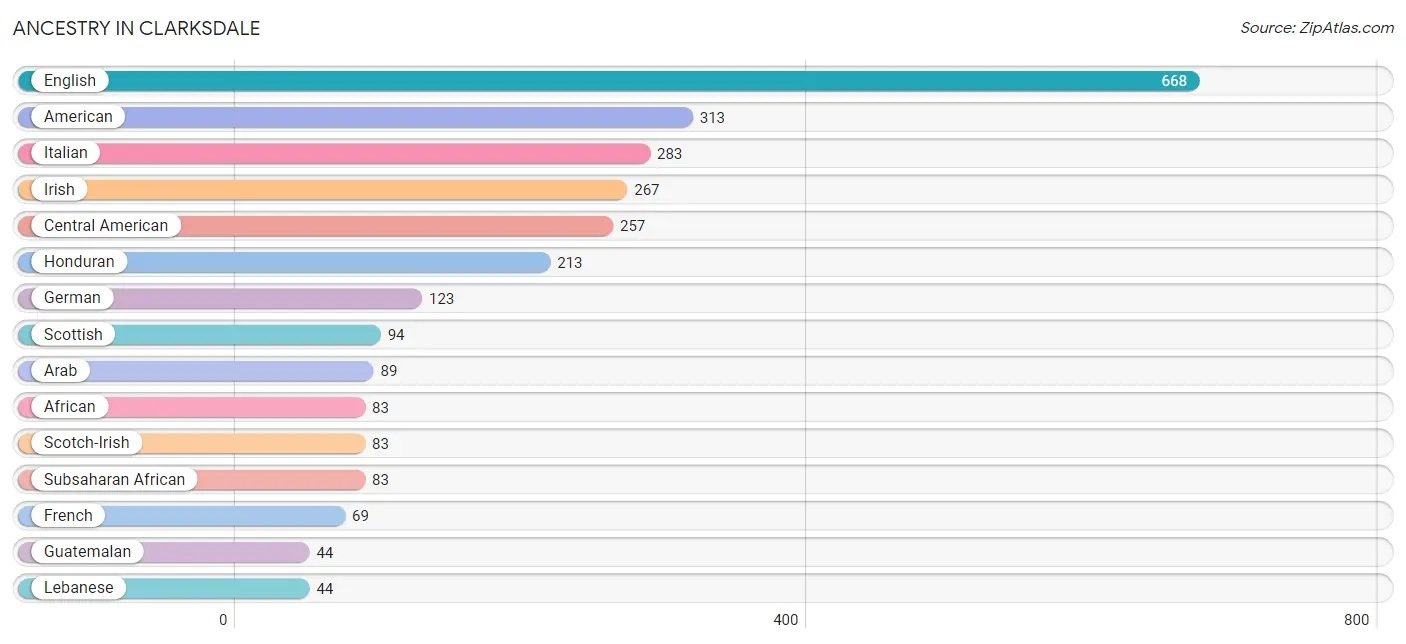
Ancestry in Clarksdale
The most populous ancestries reported in Clarksdale are English (668 | 4.5%), American (313 | 2.1%), Italian (283 | 1.9%), Irish (267 | 1.8%), and Central American (257 | 1.7%), together accounting for 12.1% of all Clarksdale residents.
| Ancestry | # Population | % Population |
| African | 83 | 0.6% |
| American | 313 | 2.1% |
| Arab | 89 | 0.6% |
| British | 16 | 0.1% |
| Central American | 257 | 1.7% |
| Dutch | 7 | 0.1% |
| English | 668 | 4.5% |
| European | 18 | 0.1% |
| French | 69 | 0.5% |
| German | 123 | 0.8% |
| Greek | 4 | 0.0% |
| Guatemalan | 44 | 0.3% |
| Honduran | 213 | 1.4% |
| Iranian | 12 | 0.1% |
| Irish | 267 | 1.8% |
| Italian | 283 | 1.9% |
| Jamaican | 5 | 0.0% |
| Lebanese | 44 | 0.3% |
| Mexican | 38 | 0.3% |
| Norwegian | 12 | 0.1% |
| Samoan | 9 | 0.1% |
| Scotch-Irish | 83 | 0.6% |
| Scottish | 94 | 0.6% |
| Subsaharan African | 83 | 0.6% |
| Thai | 40 | 0.3% | View All 25 Rows |
Immigrants in Clarksdale
The most numerous immigrant groups reported in Clarksdale came from Latin America (263 | 1.8%), Central America (257 | 1.7%), Honduras (213 | 1.4%), Guatemala (44 | 0.3%), and Asia (29 | 0.2%), together accounting for 5.5% of all Clarksdale residents.
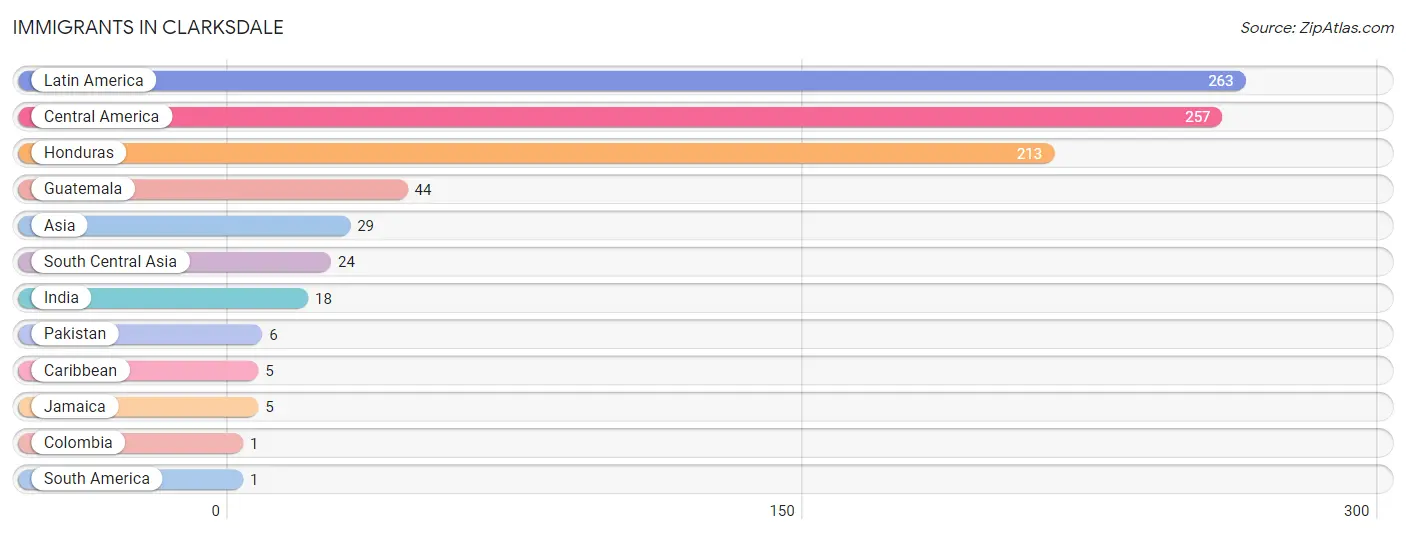
| Immigration Origin | # Population | % Population |
| Asia | 29 | 0.2% |
| Caribbean | 5 | 0.0% |
| Central America | 257 | 1.7% |
| Colombia | 1 | 0.0% |
| Guatemala | 44 | 0.3% |
| Honduras | 213 | 1.4% |
| India | 18 | 0.1% |
| Jamaica | 5 | 0.0% |
| Latin America | 263 | 1.8% |
| Pakistan | 6 | 0.0% |
| South America | 1 | 0.0% |
| South Central Asia | 24 | 0.2% | View All 12 Rows |
Sex and Age in Clarksdale
Sex and Age in Clarksdale
The most populous age groups in Clarksdale are 10 to 14 Years (682 | 9.5%) for men and Under 5 Years (580 | 7.6%) for women.
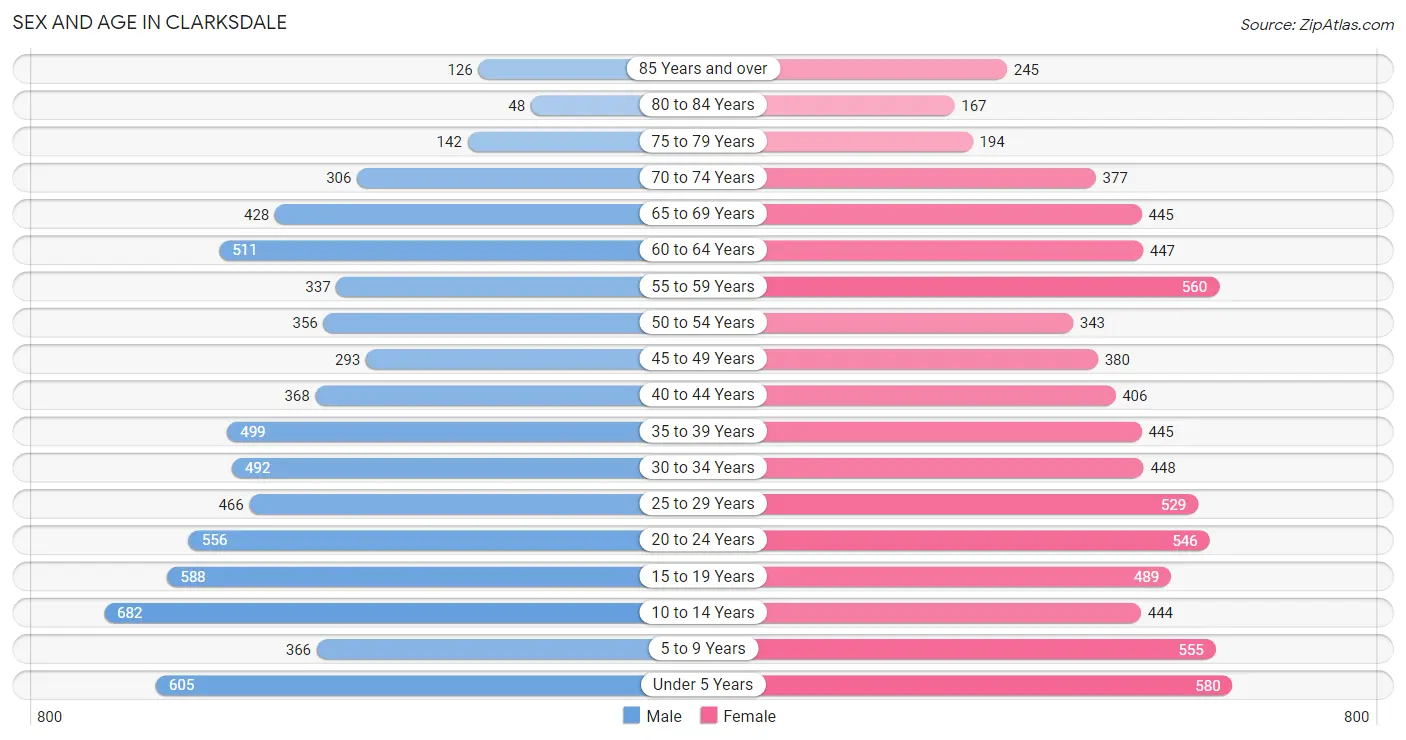
| Age Bracket | Male | Female |
| Under 5 Years | 605 (8.4%) | 580 (7.6%) |
| 5 to 9 Years | 366 (5.1%) | 555 (7.3%) |
| 10 to 14 Years | 682 (9.5%) | 444 (5.8%) |
| 15 to 19 Years | 588 (8.2%) | 489 (6.4%) |
| 20 to 24 Years | 556 (7.8%) | 546 (7.2%) |
| 25 to 29 Years | 466 (6.5%) | 529 (7.0%) |
| 30 to 34 Years | 492 (6.9%) | 448 (5.9%) |
| 35 to 39 Years | 499 (7.0%) | 445 (5.9%) |
| 40 to 44 Years | 368 (5.1%) | 406 (5.3%) |
| 45 to 49 Years | 293 (4.1%) | 380 (5.0%) |
| 50 to 54 Years | 356 (5.0%) | 343 (4.5%) |
| 55 to 59 Years | 337 (4.7%) | 560 (7.4%) |
| 60 to 64 Years | 511 (7.1%) | 447 (5.9%) |
| 65 to 69 Years | 428 (6.0%) | 445 (5.9%) |
| 70 to 74 Years | 306 (4.3%) | 377 (5.0%) |
| 75 to 79 Years | 142 (2.0%) | 194 (2.5%) |
| 80 to 84 Years | 48 (0.7%) | 167 (2.2%) |
| 85 Years and over | 126 (1.8%) | 245 (3.2%) |
| Total | 7,169 (100.0%) | 7,600 (100.0%) |
Families and Households in Clarksdale
Median Family Size in Clarksdale
The median family size in Clarksdale is 3.16 persons per family, with single female/mother families (1,784 | 50.3%) accounting for the largest median family size of 3.53 persons per family. On the other hand, married-couple families (1,284 | 36.2%) represent the smallest median family size with 2.76 persons per family.
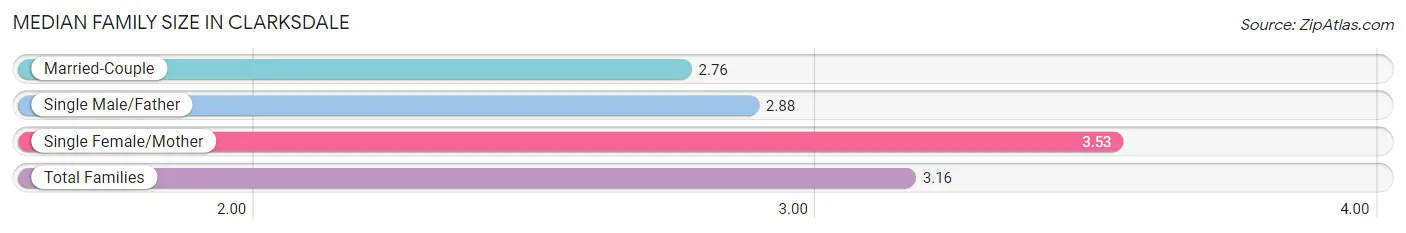
| Family Type | # Families | Family Size |
| Married-Couple | 1,284 (36.2%) | 2.76 |
| Single Male/Father | 477 (13.5%) | 2.88 |
| Single Female/Mother | 1,784 (50.3%) | 3.53 |
| Total Families | 3,545 (100.0%) | 3.16 |
Median Household Size in Clarksdale
The median household size in Clarksdale is 2.47 persons per household, with single female/mother households (1,784 | 30.5%) accounting for the largest median household size of 3.74 persons per household. non-family households (2,304 | 39.4%) represent the smallest median household size with 1.19 persons per household.
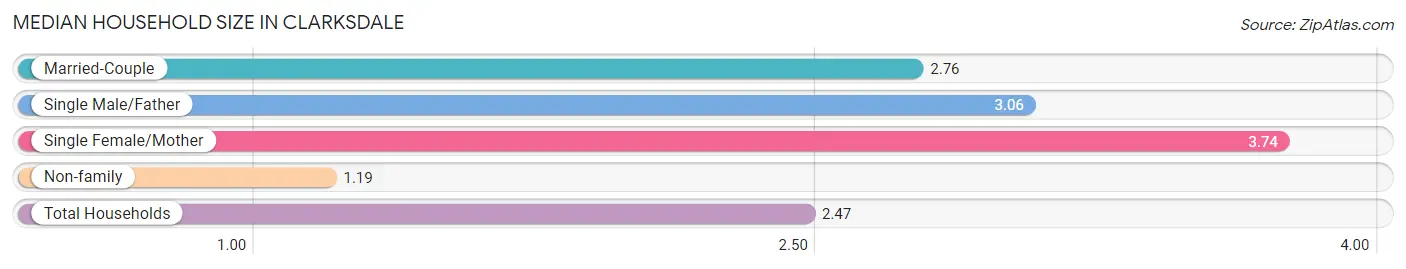
| Household Type | # Households | Household Size |
| Married-Couple | 1,284 (22.0%) | 2.76 |
| Single Male/Father | 477 (8.2%) | 3.06 |
| Single Female/Mother | 1,784 (30.5%) | 3.74 |
| Non-family | 2,304 (39.4%) | 1.19 |
| Total Households | 5,849 (100.0%) | 2.47 |
Household Size by Marriage Status in Clarksdale
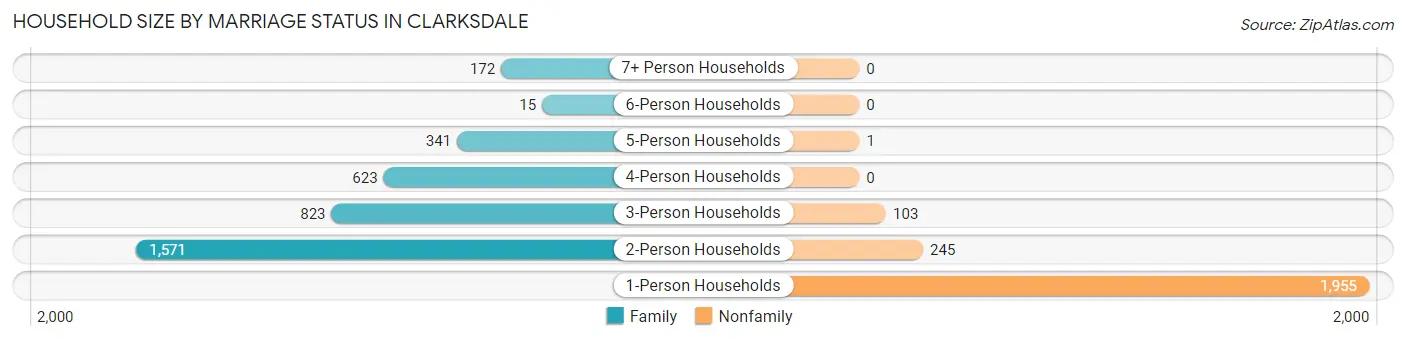
Out of a total of 5,849 households in Clarksdale, 3,545 (60.6%) are family households, while 2,304 (39.4%) are nonfamily households. The most numerous type of family households are 2-person households, comprising 1,571, and the most common type of nonfamily households are 1-person households, comprising 1,955.
| Household Size | Family Households | Nonfamily Households |
| 1-Person Households | - | 1,955 (33.4%) |
| 2-Person Households | 1,571 (26.9%) | 245 (4.2%) |
| 3-Person Households | 823 (14.1%) | 103 (1.8%) |
| 4-Person Households | 623 (10.6%) | 0 (0.0%) |
| 5-Person Households | 341 (5.8%) | 1 (0.0%) |
| 6-Person Households | 15 (0.3%) | 0 (0.0%) |
| 7+ Person Households | 172 (2.9%) | 0 (0.0%) |
| Total | 3,545 (60.6%) | 2,304 (39.4%) |
Female Fertility in Clarksdale
Fertility by Age in Clarksdale
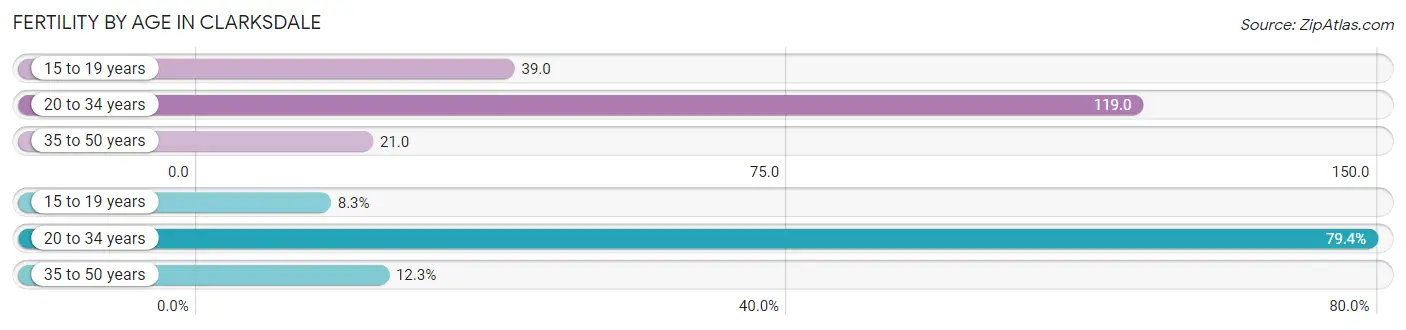
Average fertility rate in Clarksdale is 69.0 births per 1,000 women. Women in the age bracket of 20 to 34 years have the highest fertility rate with 119.0 births per 1,000 women. Women in the age bracket of 20 to 34 years acount for 79.4% of all women with births.
| Age Bracket | Women with Births | Births / 1,000 Women |
| 15 to 19 years | 19 (8.3%) | 39.0 |
| 20 to 34 years | 181 (79.4%) | 119.0 |
| 35 to 50 years | 28 (12.3%) | 21.0 |
| Total | 228 (100.0%) | 69.0 |
Fertility by Age by Marriage Status in Clarksdale
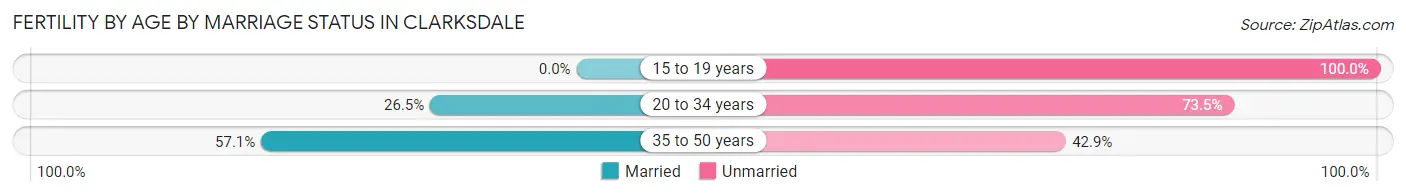
28.1% of women with births (228) in Clarksdale are married. The highest percentage of unmarried women with births falls into 15 to 19 years age bracket with 100.0% of them unmarried at the time of birth, while the lowest percentage of unmarried women with births belong to 35 to 50 years age bracket with 42.9% of them unmarried.
| Age Bracket | Married | Unmarried |
| 15 to 19 years | 0 (0.0%) | 19 (100.0%) |
| 20 to 34 years | 48 (26.5%) | 133 (73.5%) |
| 35 to 50 years | 16 (57.1%) | 12 (42.9%) |
| Total | 64 (28.1%) | 164 (71.9%) |
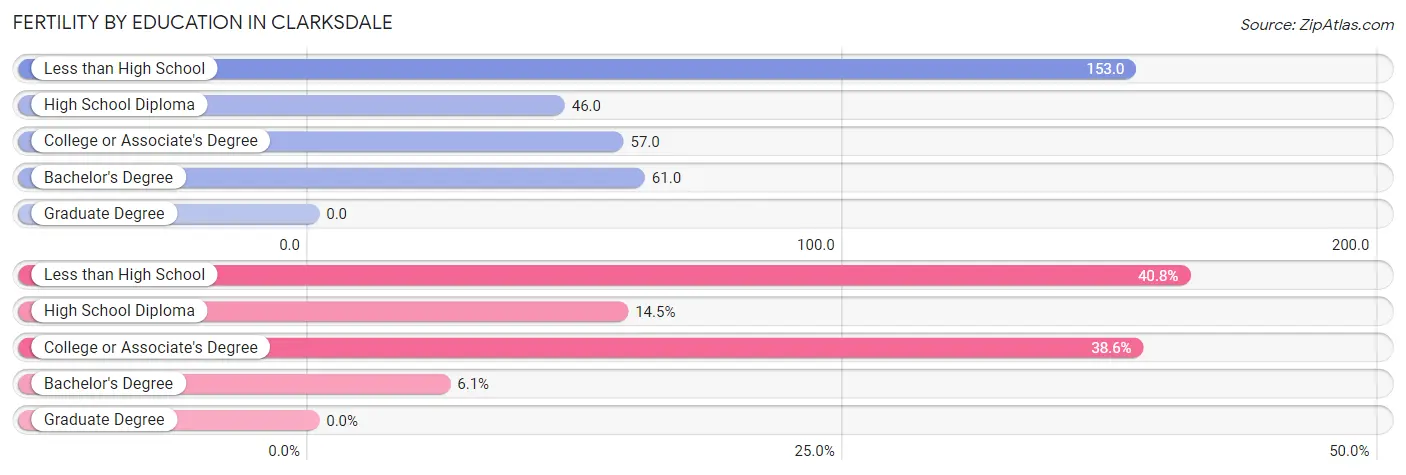
Fertility by Education in Clarksdale
| Educational Attainment | Women with Births | Births / 1,000 Women |
| Less than High School | 93 (40.8%) | 153.0 |
| High School Diploma | 33 (14.5%) | 46.0 |
| College or Associate's Degree | 88 (38.6%) | 57.0 |
| Bachelor's Degree | 14 (6.1%) | 61.0 |
| Graduate Degree | 0 (0.0%) | 0.0 |
| Total | 228 (100.0%) | 69.0 |
Fertility by Education by Marriage Status in Clarksdale
71.9% of women with births in Clarksdale are unmarried. Women with the educational attainment of bachelor's degree are most likely to be married with 100.0% of them married at childbirth, while women with the educational attainment of less than high school are least likely to be married with 100.0% of them unmarried at childbirth.
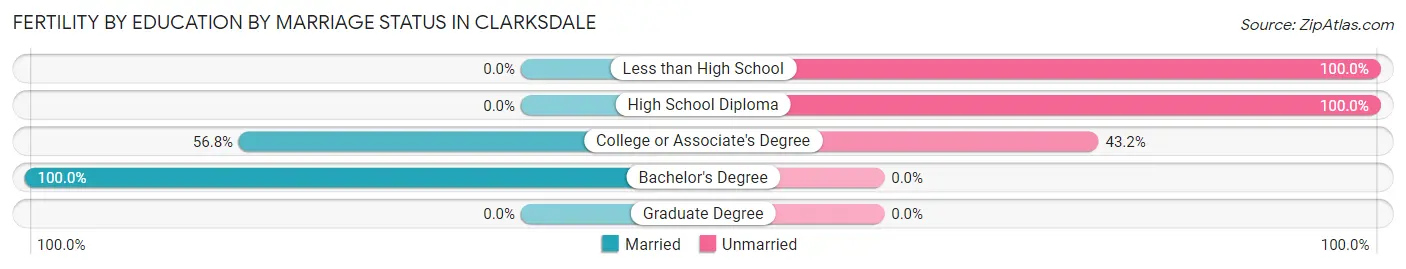
| Educational Attainment | Married | Unmarried |
| Less than High School | 0 (0.0%) | 93 (100.0%) |
| High School Diploma | 0 (0.0%) | 33 (100.0%) |
| College or Associate's Degree | 50 (56.8%) | 38 (43.2%) |
| Bachelor's Degree | 14 (100.0%) | 0 (0.0%) |
| Graduate Degree | 0 (0.0%) | 0 (0.0%) |
| Total | 64 (28.1%) | 164 (71.9%) |
Employment Characteristics in Clarksdale
Employment by Class of Employer in Clarksdale
Among the 5,125 employed individuals in Clarksdale, private company employees (3,427 | 66.9%), state government employees (646 | 12.6%), and local government employees (422 | 8.2%) make up the most common classes of employment.
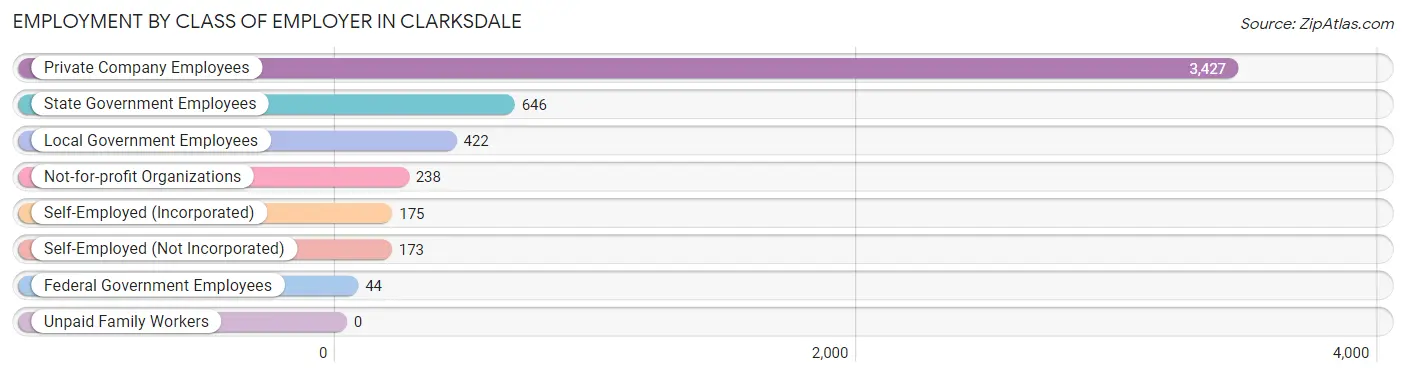
| Employer Class | # Employees | % Employees |
| Private Company Employees | 3,427 | 66.9% |
| Self-Employed (Incorporated) | 175 | 3.4% |
| Self-Employed (Not Incorporated) | 173 | 3.4% |
| Not-for-profit Organizations | 238 | 4.6% |
| Local Government Employees | 422 | 8.2% |
| State Government Employees | 646 | 12.6% |
| Federal Government Employees | 44 | 0.9% |
| Unpaid Family Workers | 0 | 0.0% |
| Total | 5,125 | 100.0% |
Employment Status by Age in Clarksdale
According to the labor force statistics for Clarksdale, out of the total population over 16 years of age (11,323), 52.5% or 5,945 individuals are in the labor force, with 12.6% or 749 of them unemployed. The age group with the highest labor force participation rate is 35 to 44 years, with 85.6% or 1,471 individuals in the labor force. Within the labor force, the 16 to 19 years age range has the highest percentage of unemployed individuals, with 40.9% or 88 of them being unemployed.
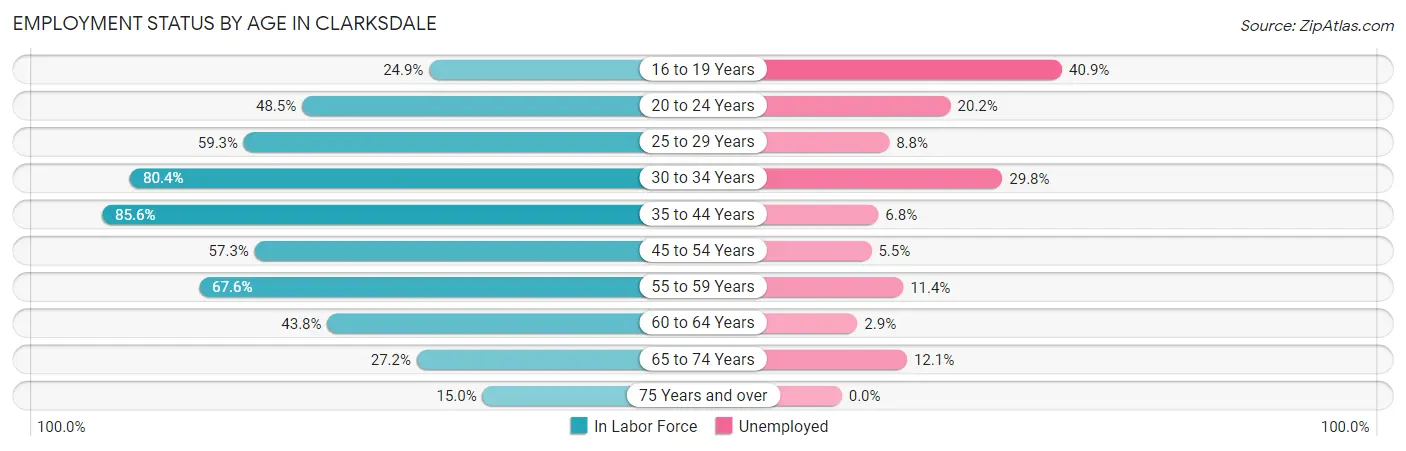
| Age Bracket | In Labor Force | Unemployed |
| 16 to 19 Years | 215 (24.9%) | 88 (40.9%) |
| 20 to 24 Years | 534 (48.5%) | 108 (20.2%) |
| 25 to 29 Years | 590 (59.3%) | 52 (8.8%) |
| 30 to 34 Years | 756 (80.4%) | 225 (29.8%) |
| 35 to 44 Years | 1,471 (85.6%) | 100 (6.8%) |
| 45 to 54 Years | 786 (57.3%) | 43 (5.5%) |
| 55 to 59 Years | 606 (67.6%) | 69 (11.4%) |
| 60 to 64 Years | 420 (43.8%) | 12 (2.9%) |
| 65 to 74 Years | 423 (27.2%) | 51 (12.1%) |
| 75 Years and over | 138 (15.0%) | 0 (0.0%) |
| Total | 5,945 (52.5%) | 749 (12.6%) |
Employment Status by Educational Attainment in Clarksdale
According to labor force statistics for Clarksdale, 67.3% of individuals (4,630) out of the total population between 25 and 64 years of age (6,880) are in the labor force, with 10.8% or 500 of them being unemployed. The group with the highest labor force participation rate are those with the educational attainment of bachelor's degree or higher, with 89.3% or 1,142 individuals in the labor force. Within the labor force, individuals with high school diploma education have the highest percentage of unemployment, with 26.3% or 211 of them being unemployed.
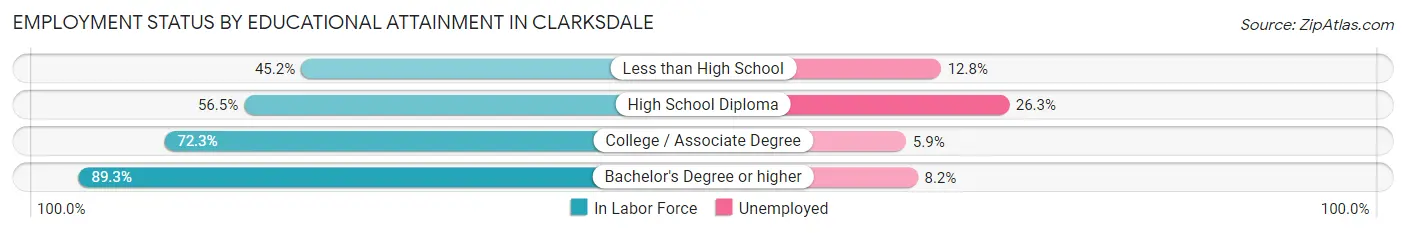
| Educational Attainment | In Labor Force | Unemployed |
| Less than High School | 570 (45.2%) | 161 (12.8%) |
| High School Diploma | 802 (56.5%) | 373 (26.3%) |
| College / Associate Degree | 2,113 (72.3%) | 172 (5.9%) |
| Bachelor's Degree or higher | 1,142 (89.3%) | 105 (8.2%) |
| Total | 4,630 (67.3%) | 743 (10.8%) |
Employment Occupations by Sex in Clarksdale
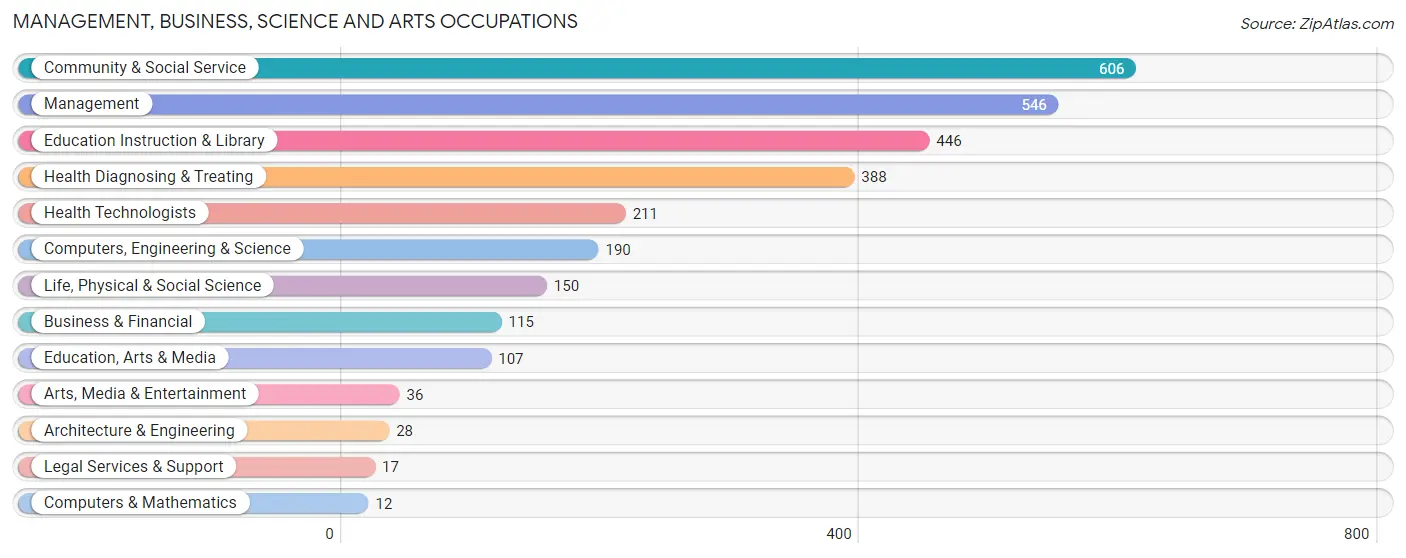
Management, Business, Science and Arts Occupations
The most common Management, Business, Science and Arts occupations in Clarksdale are Community & Social Service (606 | 11.7%), Management (546 | 10.5%), Education Instruction & Library (446 | 8.6%), Health Diagnosing & Treating (388 | 7.5%), and Health Technologists (211 | 4.1%).
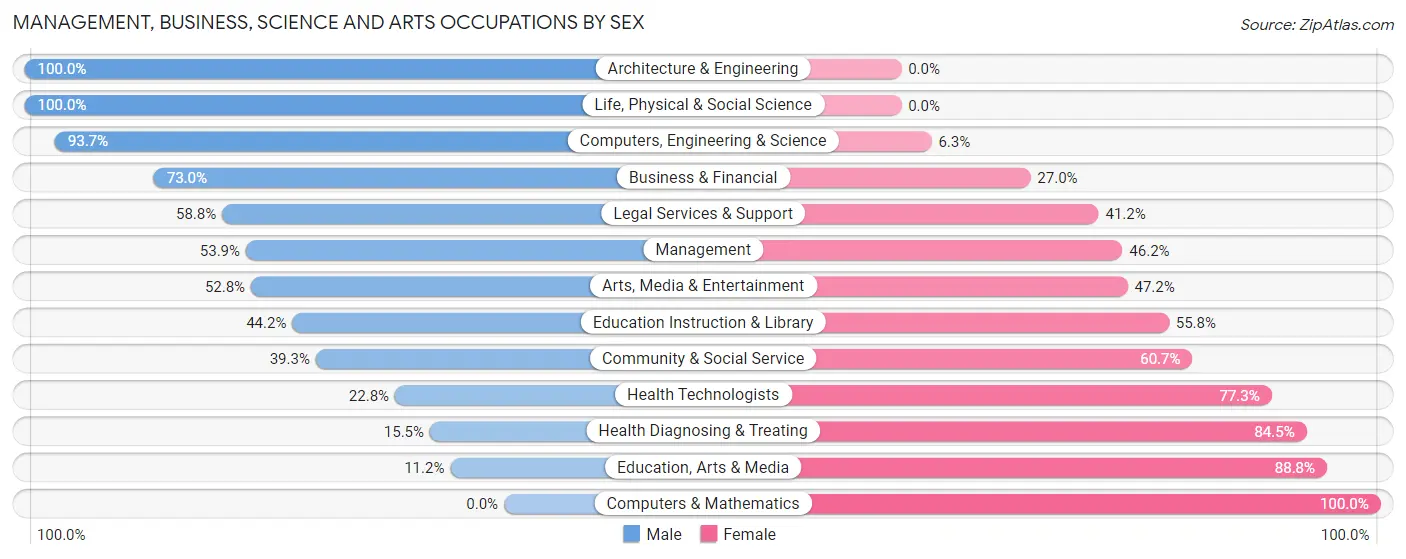
Management, Business, Science and Arts Occupations by Sex
Within the Management, Business, Science and Arts occupations in Clarksdale, the most male-oriented occupations are Architecture & Engineering (100.0%), Life, Physical & Social Science (100.0%), and Computers, Engineering & Science (93.7%), while the most female-oriented occupations are Computers & Mathematics (100.0%), Education, Arts & Media (88.8%), and Health Diagnosing & Treating (84.5%).
| Occupation | Male | Female |
| Management | 294 (53.8%) | 252 (46.2%) |
| Business & Financial | 84 (73.0%) | 31 (27.0%) |
| Computers, Engineering & Science | 178 (93.7%) | 12 (6.3%) |
| Computers & Mathematics | 0 (0.0%) | 12 (100.0%) |
| Architecture & Engineering | 28 (100.0%) | 0 (0.0%) |
| Life, Physical & Social Science | 150 (100.0%) | 0 (0.0%) |
| Community & Social Service | 238 (39.3%) | 368 (60.7%) |
| Education, Arts & Media | 12 (11.2%) | 95 (88.8%) |
| Legal Services & Support | 10 (58.8%) | 7 (41.2%) |
| Education Instruction & Library | 197 (44.2%) | 249 (55.8%) |
| Arts, Media & Entertainment | 19 (52.8%) | 17 (47.2%) |
| Health Diagnosing & Treating | 60 (15.5%) | 328 (84.5%) |
| Health Technologists | 48 (22.8%) | 163 (77.2%) |
| Total (Category) | 854 (46.3%) | 991 (53.7%) |
| Total (Overall) | 2,523 (48.7%) | 2,659 (51.3%) |
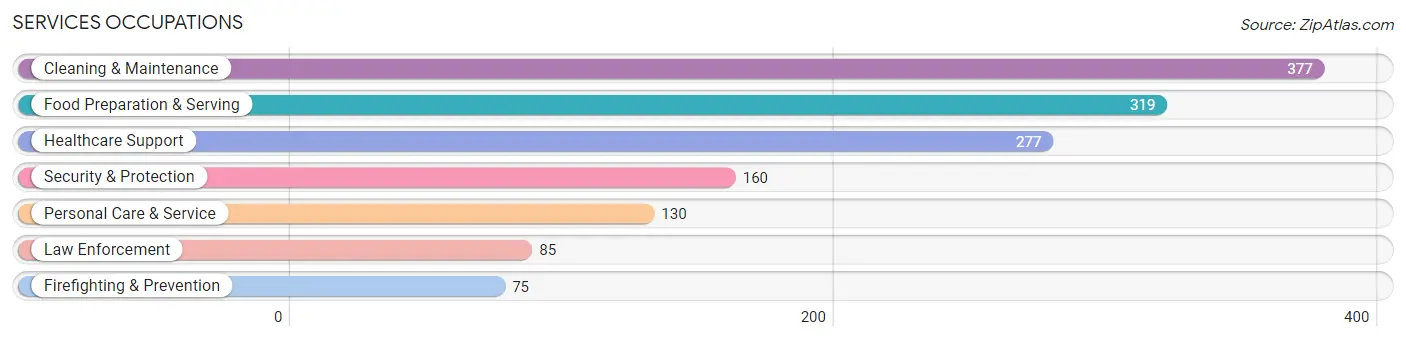
Services Occupations
The most common Services occupations in Clarksdale are Cleaning & Maintenance (377 | 7.3%), Food Preparation & Serving (319 | 6.2%), Healthcare Support (277 | 5.3%), Security & Protection (160 | 3.1%), and Personal Care & Service (130 | 2.5%).
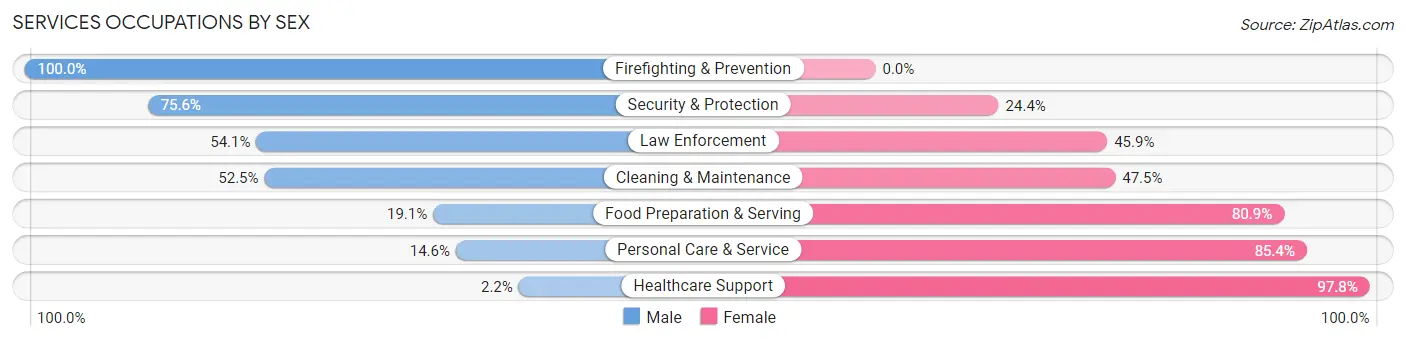
Services Occupations by Sex
Within the Services occupations in Clarksdale, the most male-oriented occupations are Firefighting & Prevention (100.0%), Security & Protection (75.6%), and Law Enforcement (54.1%), while the most female-oriented occupations are Healthcare Support (97.8%), Personal Care & Service (85.4%), and Food Preparation & Serving (80.9%).
| Occupation | Male | Female |
| Healthcare Support | 6 (2.2%) | 271 (97.8%) |
| Security & Protection | 121 (75.6%) | 39 (24.4%) |
| Firefighting & Prevention | 75 (100.0%) | 0 (0.0%) |
| Law Enforcement | 46 (54.1%) | 39 (45.9%) |
| Food Preparation & Serving | 61 (19.1%) | 258 (80.9%) |
| Cleaning & Maintenance | 198 (52.5%) | 179 (47.5%) |
| Personal Care & Service | 19 (14.6%) | 111 (85.4%) |
| Total (Category) | 405 (32.1%) | 858 (67.9%) |
| Total (Overall) | 2,523 (48.7%) | 2,659 (51.3%) |
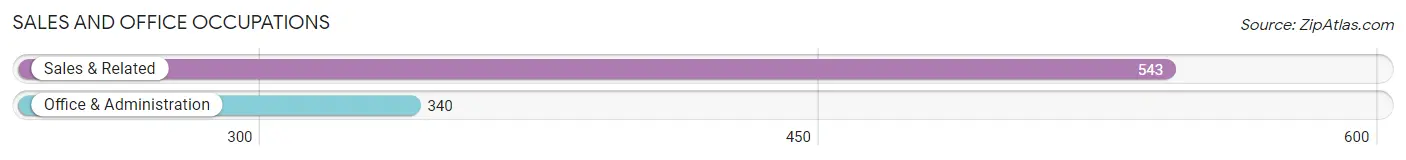
Sales and Office Occupations
The most common Sales and Office occupations in Clarksdale are Sales & Related (543 | 10.5%), and Office & Administration (340 | 6.6%).
Sales and Office Occupations by Sex
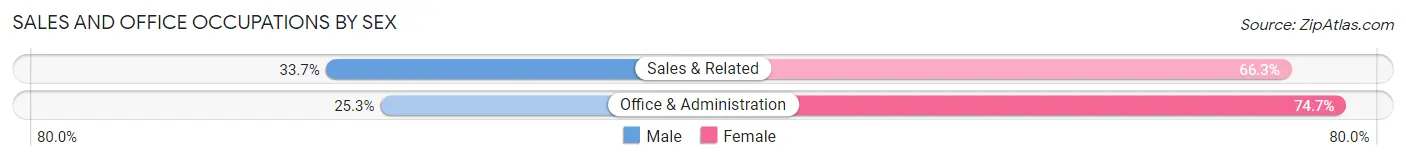
| Occupation | Male | Female |
| Sales & Related | 183 (33.7%) | 360 (66.3%) |
| Office & Administration | 86 (25.3%) | 254 (74.7%) |
| Total (Category) | 269 (30.5%) | 614 (69.5%) |
| Total (Overall) | 2,523 (48.7%) | 2,659 (51.3%) |
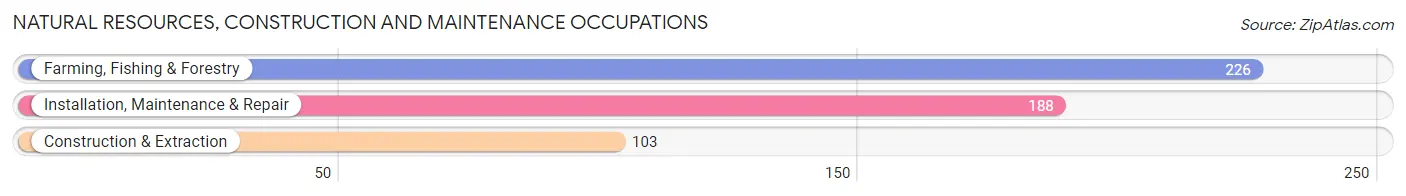
Natural Resources, Construction and Maintenance Occupations
The most common Natural Resources, Construction and Maintenance occupations in Clarksdale are Farming, Fishing & Forestry (226 | 4.4%), Installation, Maintenance & Repair (188 | 3.6%), and Construction & Extraction (103 | 2.0%).
Natural Resources, Construction and Maintenance Occupations by Sex
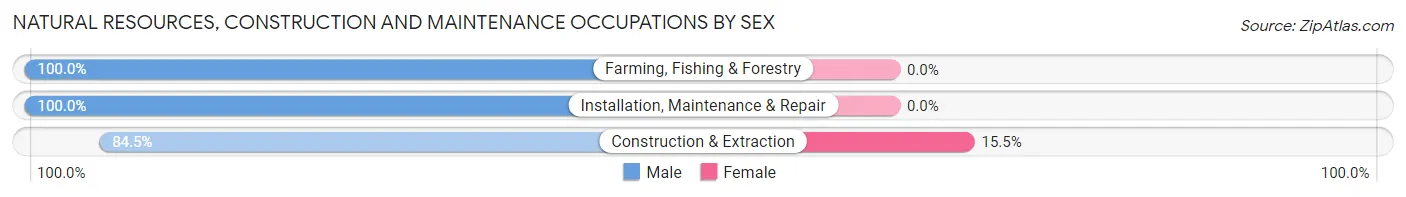
| Occupation | Male | Female |
| Farming, Fishing & Forestry | 226 (100.0%) | 0 (0.0%) |
| Construction & Extraction | 87 (84.5%) | 16 (15.5%) |
| Installation, Maintenance & Repair | 188 (100.0%) | 0 (0.0%) |
| Total (Category) | 501 (96.9%) | 16 (3.1%) |
| Total (Overall) | 2,523 (48.7%) | 2,659 (51.3%) |
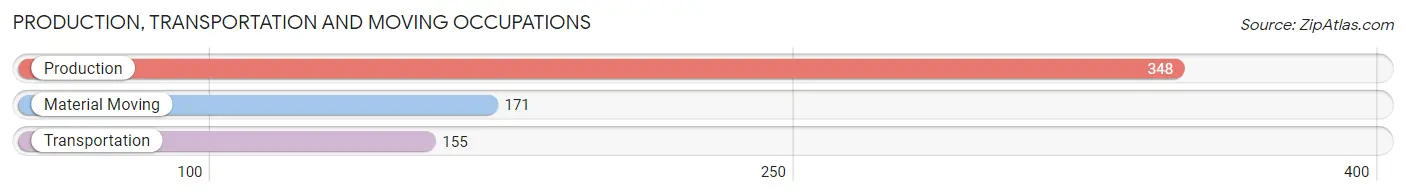
Production, Transportation and Moving Occupations
The most common Production, Transportation and Moving occupations in Clarksdale are Production (348 | 6.7%), Material Moving (171 | 3.3%), and Transportation (155 | 3.0%).
Production, Transportation and Moving Occupations by Sex
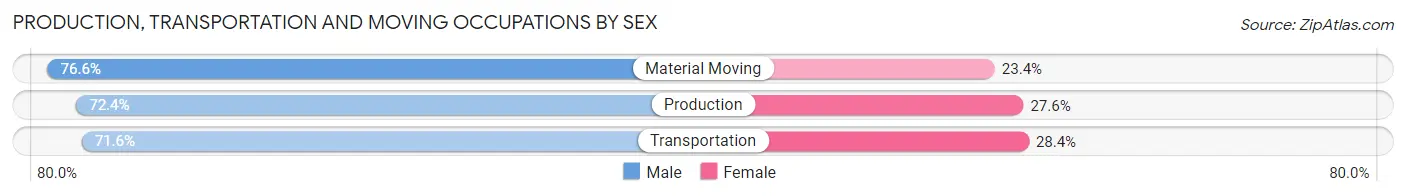
| Occupation | Male | Female |
| Production | 252 (72.4%) | 96 (27.6%) |
| Transportation | 111 (71.6%) | 44 (28.4%) |
| Material Moving | 131 (76.6%) | 40 (23.4%) |
| Total (Category) | 494 (73.3%) | 180 (26.7%) |
| Total (Overall) | 2,523 (48.7%) | 2,659 (51.3%) |
Employment Industries by Sex in Clarksdale
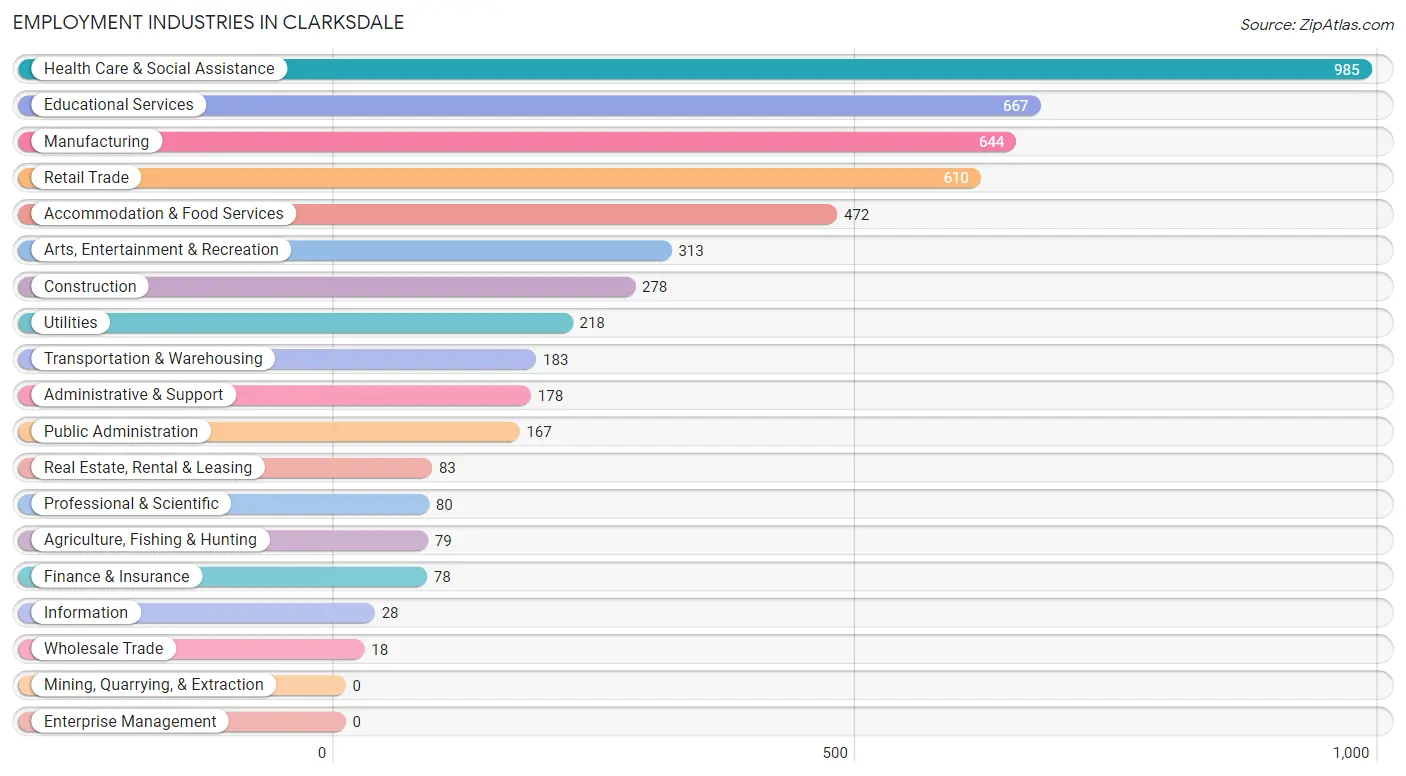
Employment Industries in Clarksdale
The major employment industries in Clarksdale include Health Care & Social Assistance (985 | 19.0%), Educational Services (667 | 12.9%), Manufacturing (644 | 12.4%), Retail Trade (610 | 11.8%), and Accommodation & Food Services (472 | 9.1%).
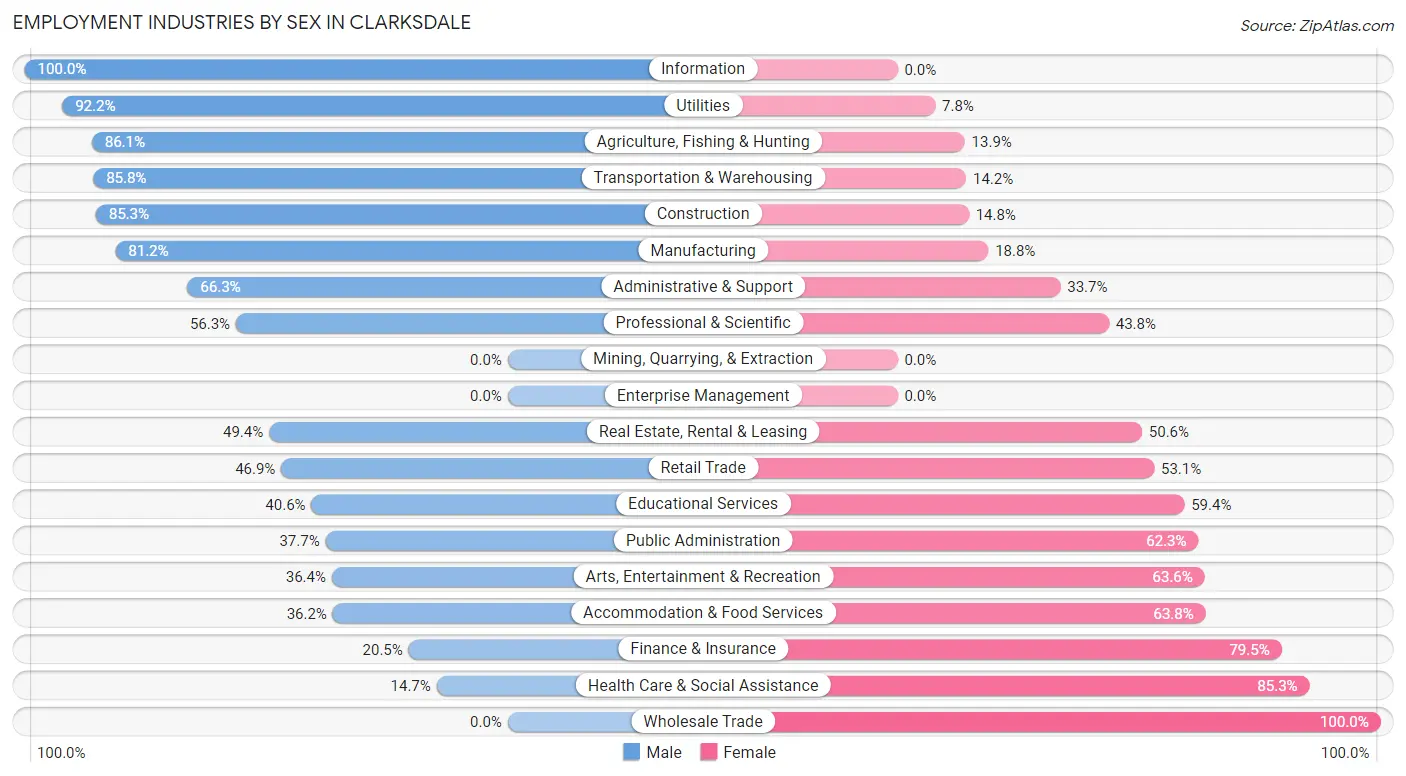
Employment Industries by Sex in Clarksdale
The Clarksdale industries that see more men than women are Information (100.0%), Utilities (92.2%), and Agriculture, Fishing & Hunting (86.1%), whereas the industries that tend to have a higher number of women are Wholesale Trade (100.0%), Health Care & Social Assistance (85.3%), and Finance & Insurance (79.5%).
| Industry | Male | Female |
| Agriculture, Fishing & Hunting | 68 (86.1%) | 11 (13.9%) |
| Mining, Quarrying, & Extraction | 0 (0.0%) | 0 (0.0%) |
| Construction | 237 (85.3%) | 41 (14.7%) |
| Manufacturing | 523 (81.2%) | 121 (18.8%) |
| Wholesale Trade | 0 (0.0%) | 18 (100.0%) |
| Retail Trade | 286 (46.9%) | 324 (53.1%) |
| Transportation & Warehousing | 157 (85.8%) | 26 (14.2%) |
| Utilities | 201 (92.2%) | 17 (7.8%) |
| Information | 28 (100.0%) | 0 (0.0%) |
| Finance & Insurance | 16 (20.5%) | 62 (79.5%) |
| Real Estate, Rental & Leasing | 41 (49.4%) | 42 (50.6%) |
| Professional & Scientific | 45 (56.2%) | 35 (43.8%) |
| Enterprise Management | 0 (0.0%) | 0 (0.0%) |
| Administrative & Support | 118 (66.3%) | 60 (33.7%) |
| Educational Services | 271 (40.6%) | 396 (59.4%) |
| Health Care & Social Assistance | 145 (14.7%) | 840 (85.3%) |
| Arts, Entertainment & Recreation | 114 (36.4%) | 199 (63.6%) |
| Accommodation & Food Services | 171 (36.2%) | 301 (63.8%) |
| Public Administration | 63 (37.7%) | 104 (62.3%) |
| Total | 2,523 (48.7%) | 2,659 (51.3%) |
Education in Clarksdale
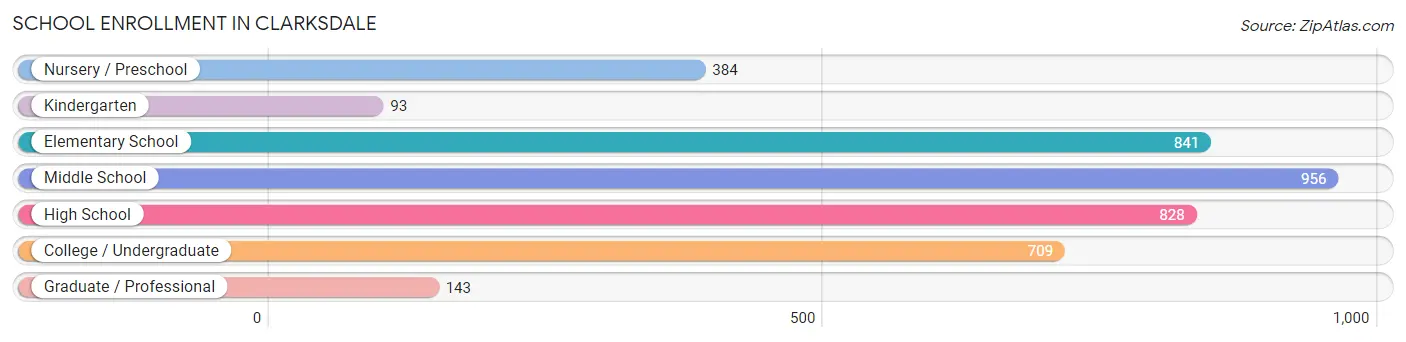
School Enrollment in Clarksdale
The most common levels of schooling among the 3,954 students in Clarksdale are middle school (956 | 24.2%), elementary school (841 | 21.3%), and high school (828 | 20.9%).
| School Level | # Students | % Students |
| Nursery / Preschool | 384 | 9.7% |
| Kindergarten | 93 | 2.4% |
| Elementary School | 841 | 21.3% |
| Middle School | 956 | 24.2% |
| High School | 828 | 20.9% |
| College / Undergraduate | 709 | 17.9% |
| Graduate / Professional | 143 | 3.6% |
| Total | 3,954 | 100.0% |
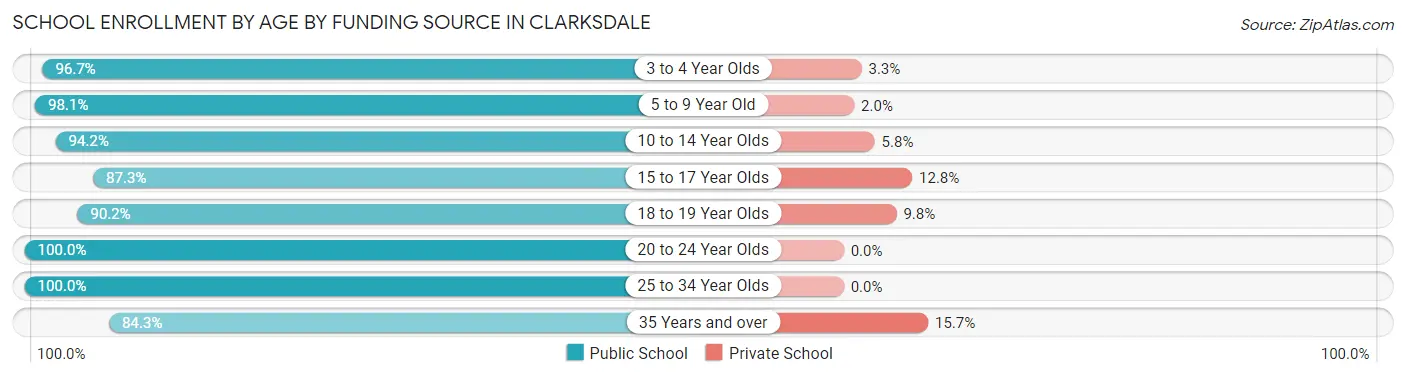
School Enrollment by Age by Funding Source in Clarksdale
Out of a total of 3,954 students who are enrolled in schools in Clarksdale, 241 (6.1%) attend a private institution, while the remaining 3,713 (93.9%) are enrolled in public schools. The age group of 35 years and over has the highest likelihood of being enrolled in private schools, with 50 (15.7% in the age bracket) enrolled. Conversely, the age group of 20 to 24 year olds has the lowest likelihood of being enrolled in a private school, with 305 (100.0% in the age bracket) attending a public institution.
| Age Bracket | Public School | Private School |
| 3 to 4 Year Olds | 290 (96.7%) | 10 (3.3%) |
| 5 to 9 Year Old | 903 (98.1%) | 18 (1.9%) |
| 10 to 14 Year Olds | 1,061 (94.2%) | 65 (5.8%) |
| 15 to 17 Year Olds | 486 (87.3%) | 71 (12.8%) |
| 18 to 19 Year Olds | 266 (90.2%) | 29 (9.8%) |
| 20 to 24 Year Olds | 305 (100.0%) | 0 (0.0%) |
| 25 to 34 Year Olds | 132 (100.0%) | 0 (0.0%) |
| 35 Years and over | 268 (84.3%) | 50 (15.7%) |
| Total | 3,713 (93.9%) | 241 (6.1%) |
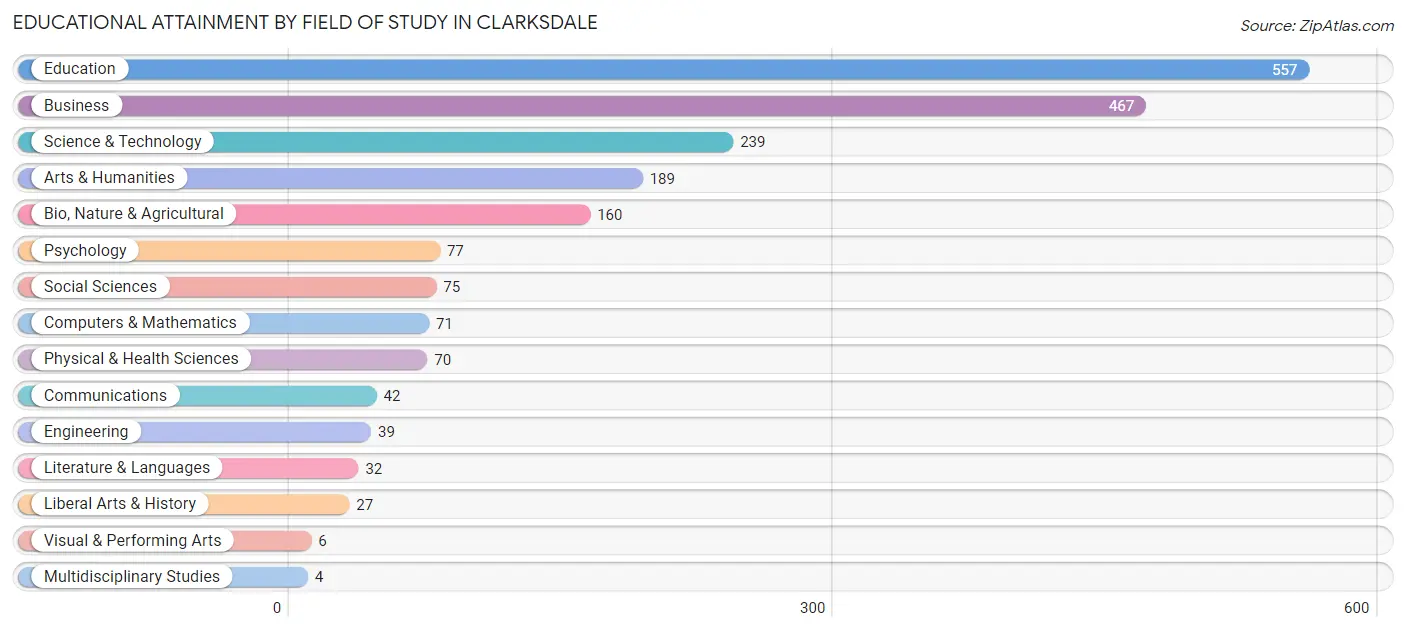
Educational Attainment by Field of Study in Clarksdale
Education (557 | 27.1%), business (467 | 22.7%), science & technology (239 | 11.6%), arts & humanities (189 | 9.2%), and bio, nature & agricultural (160 | 7.8%) are the most common fields of study among 2,055 individuals in Clarksdale who have obtained a bachelor's degree or higher.
| Field of Study | # Graduates | % Graduates |
| Computers & Mathematics | 71 | 3.5% |
| Bio, Nature & Agricultural | 160 | 7.8% |
| Physical & Health Sciences | 70 | 3.4% |
| Psychology | 77 | 3.7% |
| Social Sciences | 75 | 3.6% |
| Engineering | 39 | 1.9% |
| Multidisciplinary Studies | 4 | 0.2% |
| Science & Technology | 239 | 11.6% |
| Business | 467 | 22.7% |
| Education | 557 | 27.1% |
| Literature & Languages | 32 | 1.6% |
| Liberal Arts & History | 27 | 1.3% |
| Visual & Performing Arts | 6 | 0.3% |
| Communications | 42 | 2.0% |
| Arts & Humanities | 189 | 9.2% |
| Total | 2,055 | 100.0% |
Transportation & Commute in Clarksdale
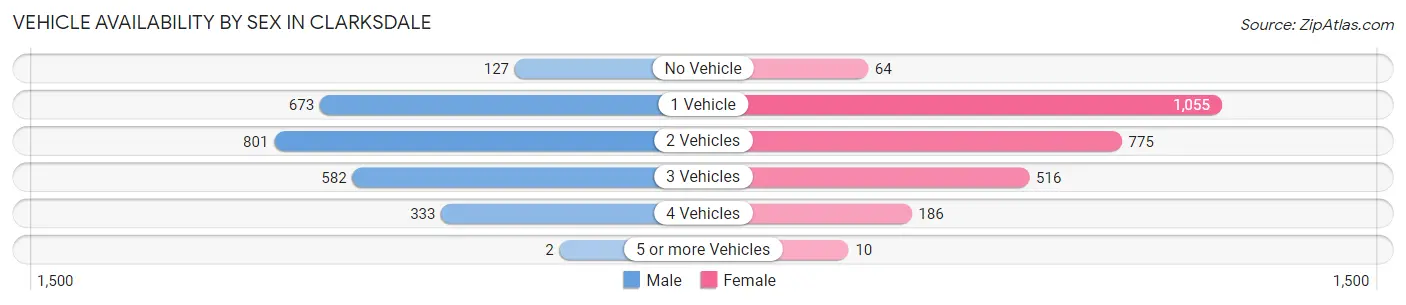
Vehicle Availability by Sex in Clarksdale
The most prevalent vehicle ownership categories in Clarksdale are males with 2 vehicles (801, accounting for 31.8%) and females with 2 vehicles (775, making up 30.7%).
| Vehicles Available | Male | Female |
| No Vehicle | 127 (5.0%) | 64 (2.5%) |
| 1 Vehicle | 673 (26.7%) | 1,055 (40.5%) |
| 2 Vehicles | 801 (31.8%) | 775 (29.7%) |
| 3 Vehicles | 582 (23.1%) | 516 (19.8%) |
| 4 Vehicles | 333 (13.2%) | 186 (7.1%) |
| 5 or more Vehicles | 2 (0.1%) | 10 (0.4%) |
| Total | 2,518 (100.0%) | 2,606 (100.0%) |
Commute Time in Clarksdale
The most frequently occuring commute durations in Clarksdale are 10 to 14 minutes (1,597 commuters, 34.1%), 5 to 9 minutes (1,131 commuters, 24.2%), and 15 to 19 minutes (541 commuters, 11.6%).
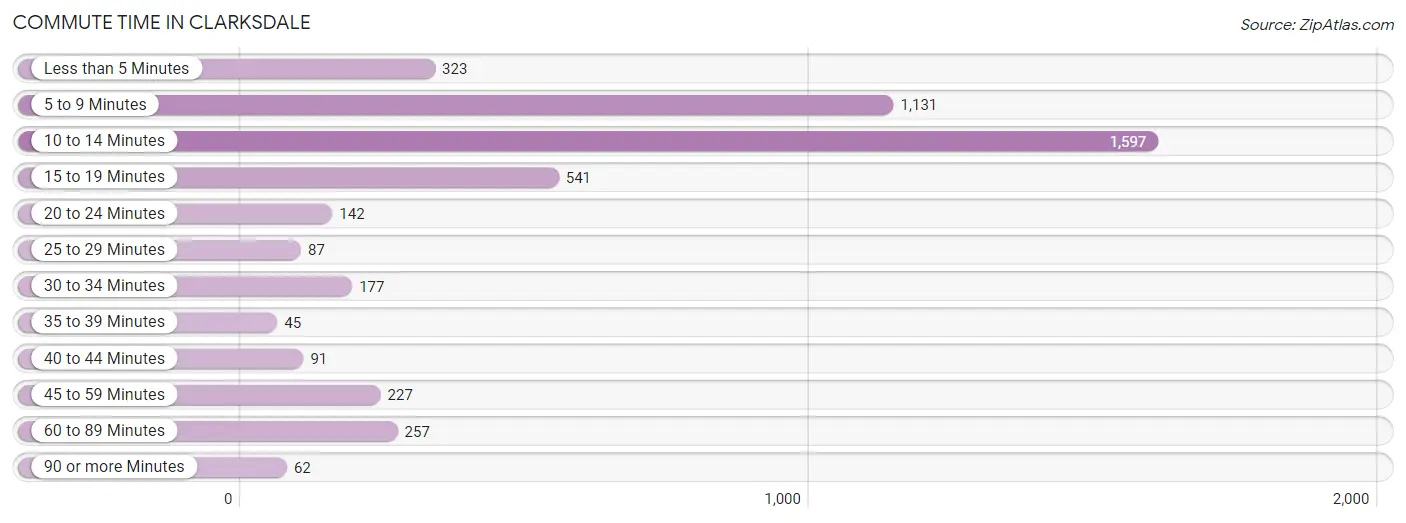
| Commute Time | # Commuters | % Commuters |
| Less than 5 Minutes | 323 | 6.9% |
| 5 to 9 Minutes | 1,131 | 24.2% |
| 10 to 14 Minutes | 1,597 | 34.1% |
| 15 to 19 Minutes | 541 | 11.6% |
| 20 to 24 Minutes | 142 | 3.0% |
| 25 to 29 Minutes | 87 | 1.9% |
| 30 to 34 Minutes | 177 | 3.8% |
| 35 to 39 Minutes | 45 | 1.0% |
| 40 to 44 Minutes | 91 | 1.9% |
| 45 to 59 Minutes | 227 | 4.9% |
| 60 to 89 Minutes | 257 | 5.5% |
| 90 or more Minutes | 62 | 1.3% |
Commute Time by Sex in Clarksdale
The most common commute times in Clarksdale are 10 to 14 minutes (755 commuters, 33.0%) for males and 10 to 14 minutes (842 commuters, 35.2%) for females.
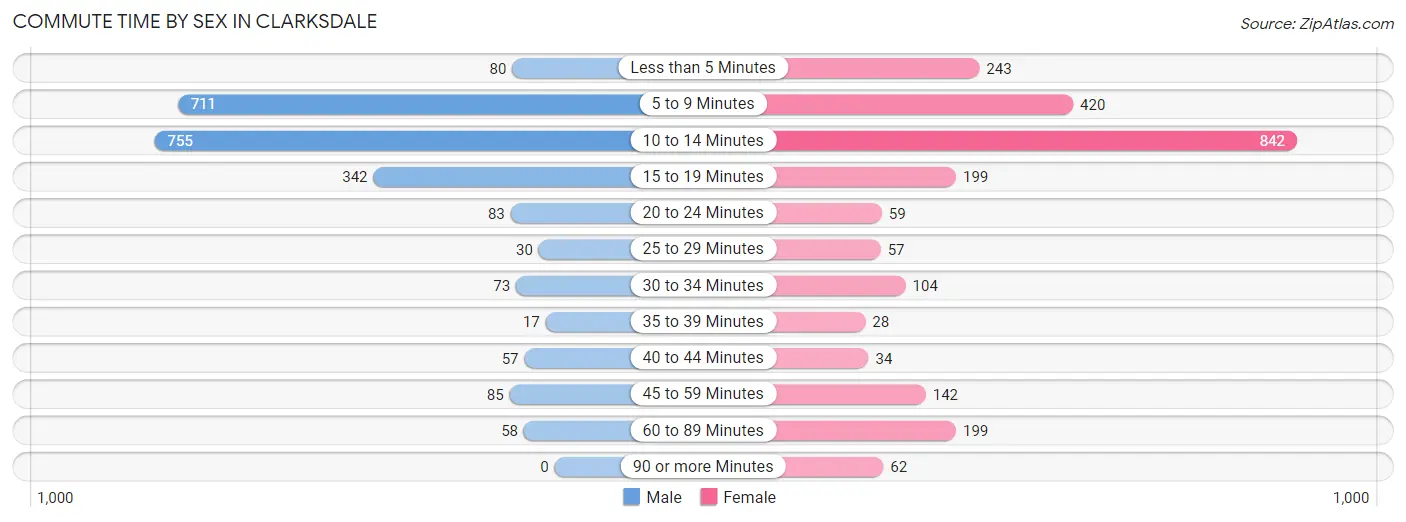
| Commute Time | Male | Female |
| Less than 5 Minutes | 80 (3.5%) | 243 (10.2%) |
| 5 to 9 Minutes | 711 (31.0%) | 420 (17.6%) |
| 10 to 14 Minutes | 755 (33.0%) | 842 (35.2%) |
| 15 to 19 Minutes | 342 (14.9%) | 199 (8.3%) |
| 20 to 24 Minutes | 83 (3.6%) | 59 (2.5%) |
| 25 to 29 Minutes | 30 (1.3%) | 57 (2.4%) |
| 30 to 34 Minutes | 73 (3.2%) | 104 (4.3%) |
| 35 to 39 Minutes | 17 (0.7%) | 28 (1.2%) |
| 40 to 44 Minutes | 57 (2.5%) | 34 (1.4%) |
| 45 to 59 Minutes | 85 (3.7%) | 142 (5.9%) |
| 60 to 89 Minutes | 58 (2.5%) | 199 (8.3%) |
| 90 or more Minutes | 0 (0.0%) | 62 (2.6%) |
Time of Departure to Work by Sex in Clarksdale
The most frequent times of departure to work in Clarksdale are 7:30 AM to 7:59 AM (479, 20.9%) for males and 7:00 AM to 7:29 AM (423, 17.7%) for females.
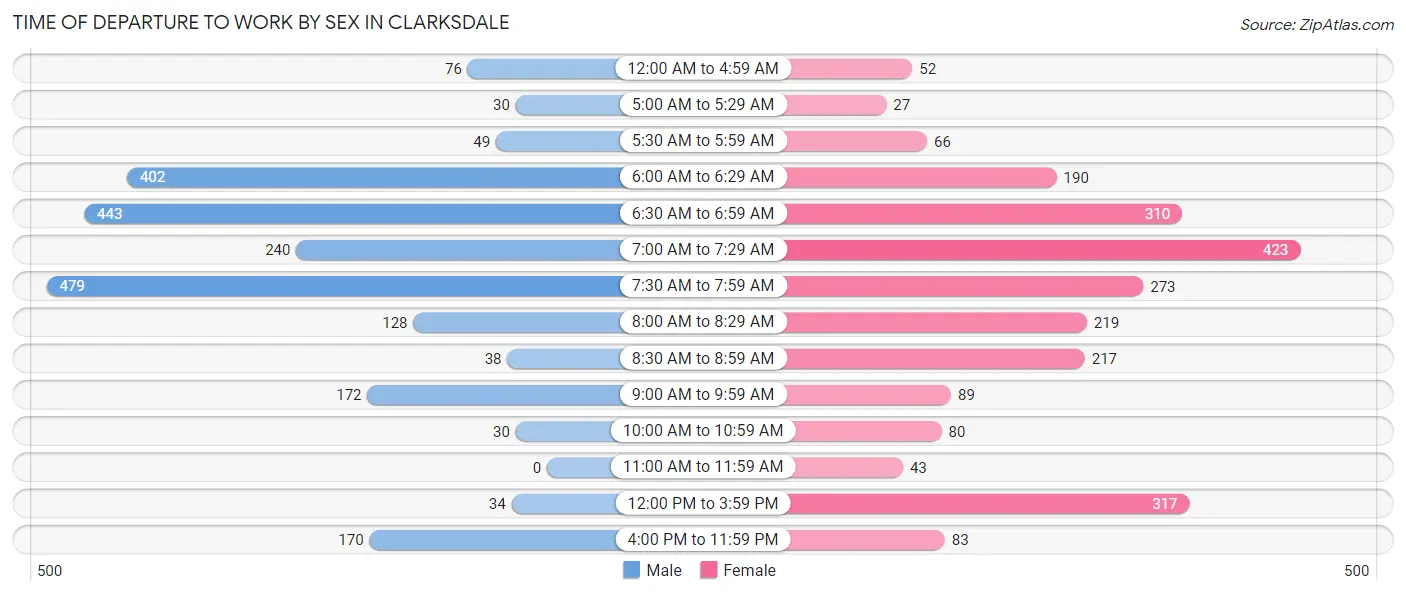
| Time of Departure | Male | Female |
| 12:00 AM to 4:59 AM | 76 (3.3%) | 52 (2.2%) |
| 5:00 AM to 5:29 AM | 30 (1.3%) | 27 (1.1%) |
| 5:30 AM to 5:59 AM | 49 (2.1%) | 66 (2.8%) |
| 6:00 AM to 6:29 AM | 402 (17.5%) | 190 (8.0%) |
| 6:30 AM to 6:59 AM | 443 (19.3%) | 310 (13.0%) |
| 7:00 AM to 7:29 AM | 240 (10.5%) | 423 (17.7%) |
| 7:30 AM to 7:59 AM | 479 (20.9%) | 273 (11.4%) |
| 8:00 AM to 8:29 AM | 128 (5.6%) | 219 (9.2%) |
| 8:30 AM to 8:59 AM | 38 (1.7%) | 217 (9.1%) |
| 9:00 AM to 9:59 AM | 172 (7.5%) | 89 (3.7%) |
| 10:00 AM to 10:59 AM | 30 (1.3%) | 80 (3.4%) |
| 11:00 AM to 11:59 AM | 0 (0.0%) | 43 (1.8%) |
| 12:00 PM to 3:59 PM | 34 (1.5%) | 317 (13.3%) |
| 4:00 PM to 11:59 PM | 170 (7.4%) | 83 (3.5%) |
| Total | 2,291 (100.0%) | 2,389 (100.0%) |
Housing Occupancy in Clarksdale
Occupancy by Ownership in Clarksdale
Of the total 5,849 dwellings in Clarksdale, owner-occupied units account for 2,815 (48.1%), while renter-occupied units make up 3,034 (51.9%).
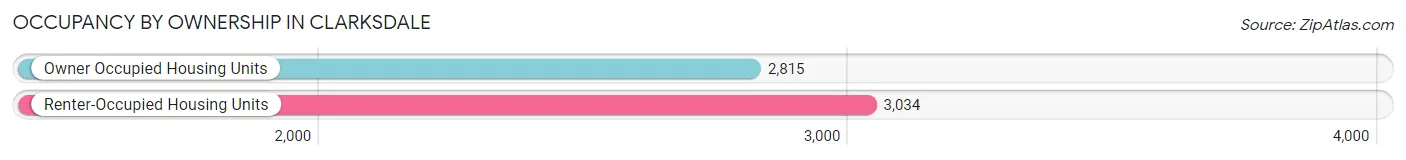
| Occupancy | # Housing Units | % Housing Units |
| Owner Occupied Housing Units | 2,815 | 48.1% |
| Renter-Occupied Housing Units | 3,034 | 51.9% |
| Total Occupied Housing Units | 5,849 | 100.0% |
Occupancy by Household Size in Clarksdale
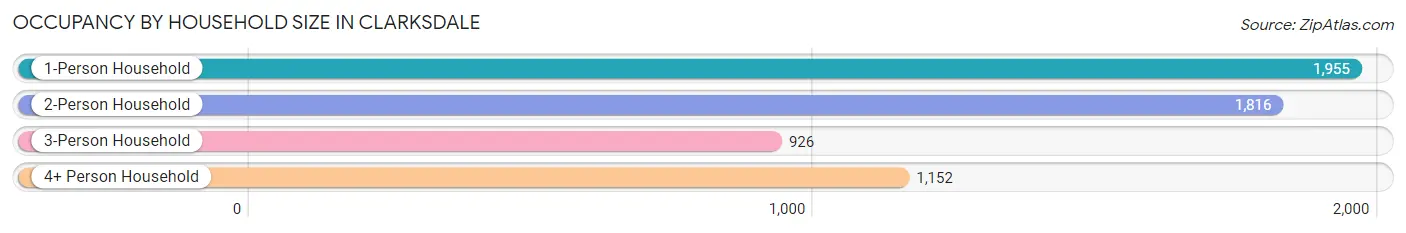
| Household Size | # Housing Units | % Housing Units |
| 1-Person Household | 1,955 | 33.4% |
| 2-Person Household | 1,816 | 31.0% |
| 3-Person Household | 926 | 15.8% |
| 4+ Person Household | 1,152 | 19.7% |
| Total Housing Units | 5,849 | 100.0% |
Occupancy by Ownership by Household Size in Clarksdale
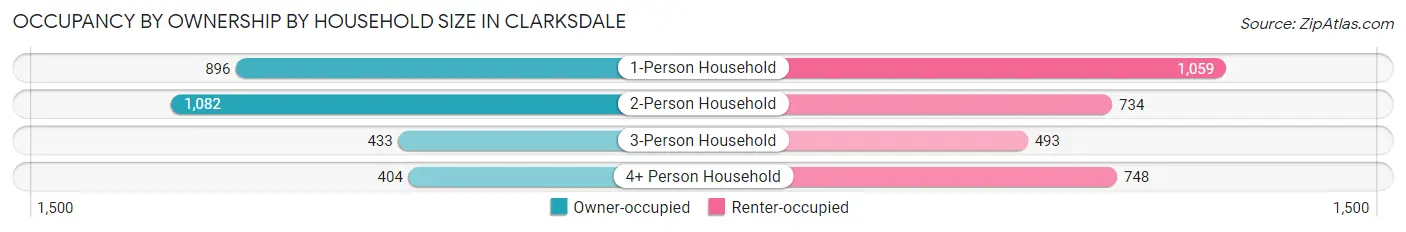
| Household Size | Owner-occupied | Renter-occupied |
| 1-Person Household | 896 (45.8%) | 1,059 (54.2%) |
| 2-Person Household | 1,082 (59.6%) | 734 (40.4%) |
| 3-Person Household | 433 (46.8%) | 493 (53.2%) |
| 4+ Person Household | 404 (35.1%) | 748 (64.9%) |
| Total Housing Units | 2,815 (48.1%) | 3,034 (51.9%) |
Occupancy by Educational Attainment in Clarksdale
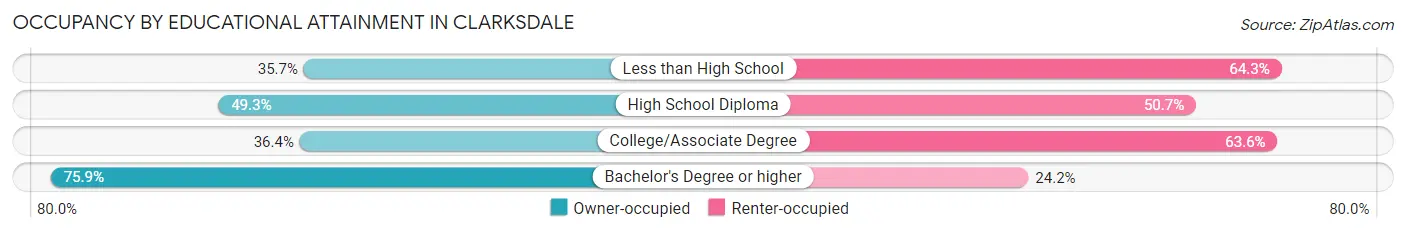
| Household Size | Owner-occupied | Renter-occupied |
| Less than High School | 330 (35.7%) | 594 (64.3%) |
| High School Diploma | 620 (49.3%) | 638 (50.7%) |
| College/Associate Degree | 844 (36.4%) | 1,477 (63.6%) |
| Bachelor's Degree or higher | 1,021 (75.8%) | 325 (24.1%) |
Occupancy by Age of Householder in Clarksdale
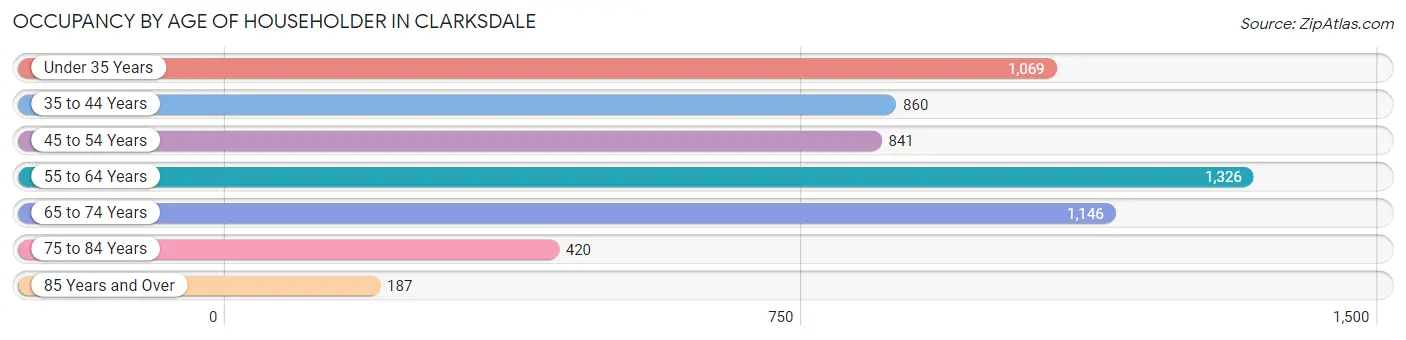
| Age Bracket | # Households | % Households |
| Under 35 Years | 1,069 | 18.3% |
| 35 to 44 Years | 860 | 14.7% |
| 45 to 54 Years | 841 | 14.4% |
| 55 to 64 Years | 1,326 | 22.7% |
| 65 to 74 Years | 1,146 | 19.6% |
| 75 to 84 Years | 420 | 7.2% |
| 85 Years and Over | 187 | 3.2% |
| Total | 5,849 | 100.0% |
Housing Finances in Clarksdale
Median Income by Occupancy in Clarksdale
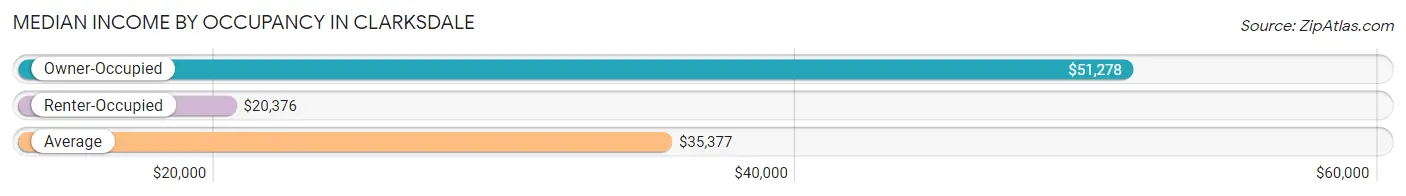
| Occupancy Type | # Households | Median Income |
| Owner-Occupied | 2,815 (48.1%) | $51,278 |
| Renter-Occupied | 3,034 (51.9%) | $20,376 |
| Average | 5,849 (100.0%) | $35,377 |
Occupancy by Householder Income Bracket in Clarksdale
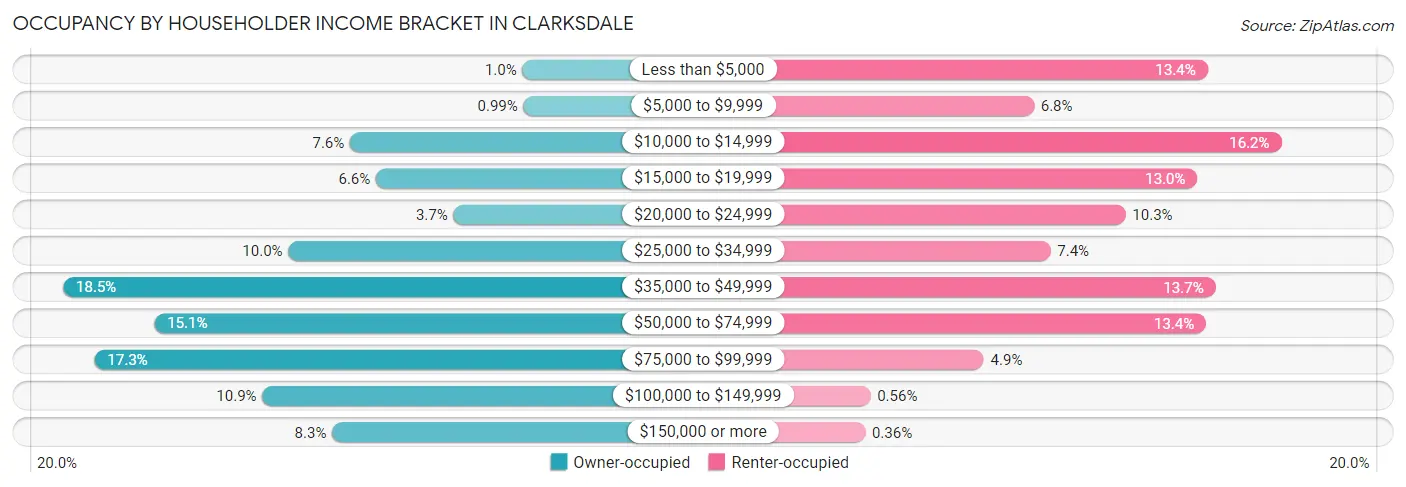
| Income Bracket | Owner-occupied | Renter-occupied |
| Less than $5,000 | 29 (1.0%) | 407 (13.4%) |
| $5,000 to $9,999 | 28 (1.0%) | 206 (6.8%) |
| $10,000 to $14,999 | 214 (7.6%) | 492 (16.2%) |
| $15,000 to $19,999 | 186 (6.6%) | 395 (13.0%) |
| $20,000 to $24,999 | 103 (3.7%) | 312 (10.3%) |
| $25,000 to $34,999 | 280 (10.0%) | 225 (7.4%) |
| $35,000 to $49,999 | 522 (18.5%) | 416 (13.7%) |
| $50,000 to $74,999 | 424 (15.1%) | 405 (13.4%) |
| $75,000 to $99,999 | 488 (17.3%) | 148 (4.9%) |
| $100,000 to $149,999 | 308 (10.9%) | 17 (0.6%) |
| $150,000 or more | 233 (8.3%) | 11 (0.4%) |
| Total | 2,815 (100.0%) | 3,034 (100.0%) |
Monthly Housing Cost Tiers in Clarksdale
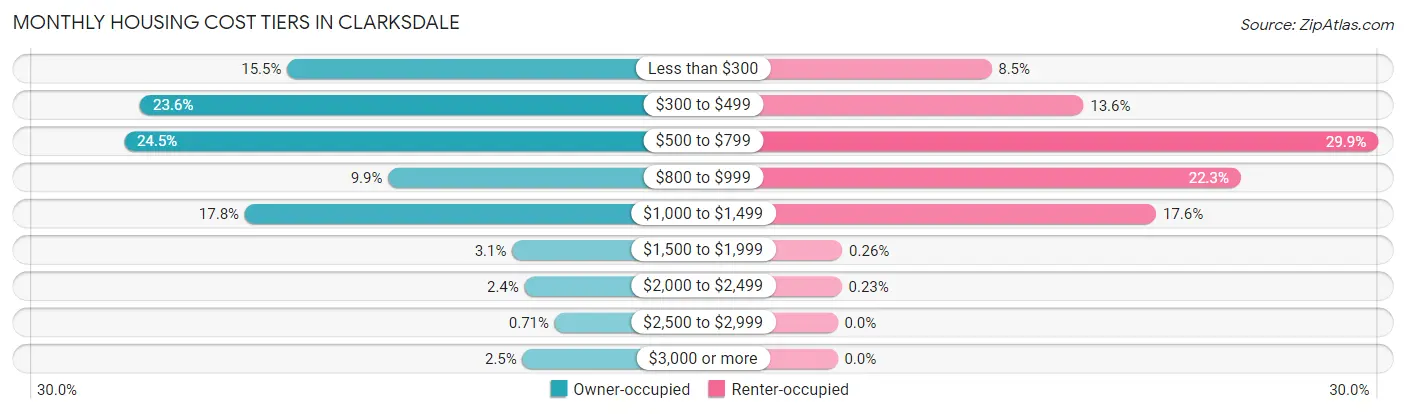
| Monthly Cost | Owner-occupied | Renter-occupied |
| Less than $300 | 436 (15.5%) | 258 (8.5%) |
| $300 to $499 | 665 (23.6%) | 412 (13.6%) |
| $500 to $799 | 690 (24.5%) | 906 (29.9%) |
| $800 to $999 | 279 (9.9%) | 676 (22.3%) |
| $1,000 to $1,499 | 502 (17.8%) | 534 (17.6%) |
| $1,500 to $1,999 | 86 (3.1%) | 8 (0.3%) |
| $2,000 to $2,499 | 67 (2.4%) | 7 (0.2%) |
| $2,500 to $2,999 | 20 (0.7%) | 0 (0.0%) |
| $3,000 or more | 70 (2.5%) | 0 (0.0%) |
| Total | 2,815 (100.0%) | 3,034 (100.0%) |
Physical Housing Characteristics in Clarksdale
Housing Structures in Clarksdale
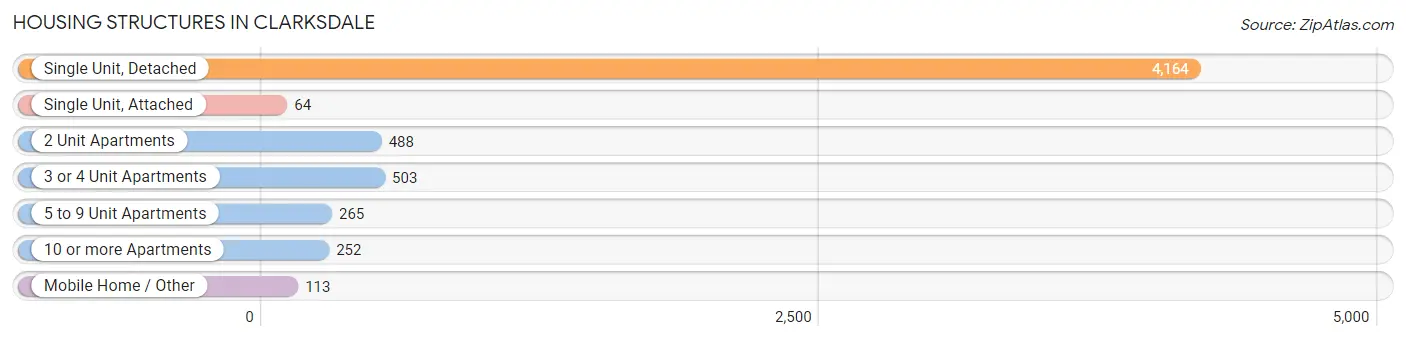
| Structure Type | # Housing Units | % Housing Units |
| Single Unit, Detached | 4,164 | 71.2% |
| Single Unit, Attached | 64 | 1.1% |
| 2 Unit Apartments | 488 | 8.3% |
| 3 or 4 Unit Apartments | 503 | 8.6% |
| 5 to 9 Unit Apartments | 265 | 4.5% |
| 10 or more Apartments | 252 | 4.3% |
| Mobile Home / Other | 113 | 1.9% |
| Total | 5,849 | 100.0% |
Housing Structures by Occupancy in Clarksdale
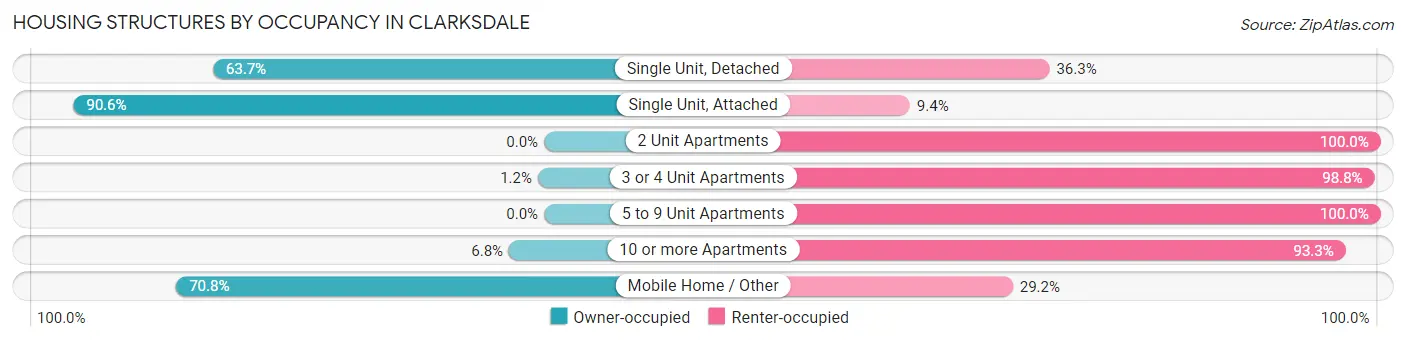
| Structure Type | Owner-occupied | Renter-occupied |
| Single Unit, Detached | 2,654 (63.7%) | 1,510 (36.3%) |
| Single Unit, Attached | 58 (90.6%) | 6 (9.4%) |
| 2 Unit Apartments | 0 (0.0%) | 488 (100.0%) |
| 3 or 4 Unit Apartments | 6 (1.2%) | 497 (98.8%) |
| 5 to 9 Unit Apartments | 0 (0.0%) | 265 (100.0%) |
| 10 or more Apartments | 17 (6.8%) | 235 (93.2%) |
| Mobile Home / Other | 80 (70.8%) | 33 (29.2%) |
| Total | 2,815 (48.1%) | 3,034 (51.9%) |
Housing Structures by Number of Rooms in Clarksdale
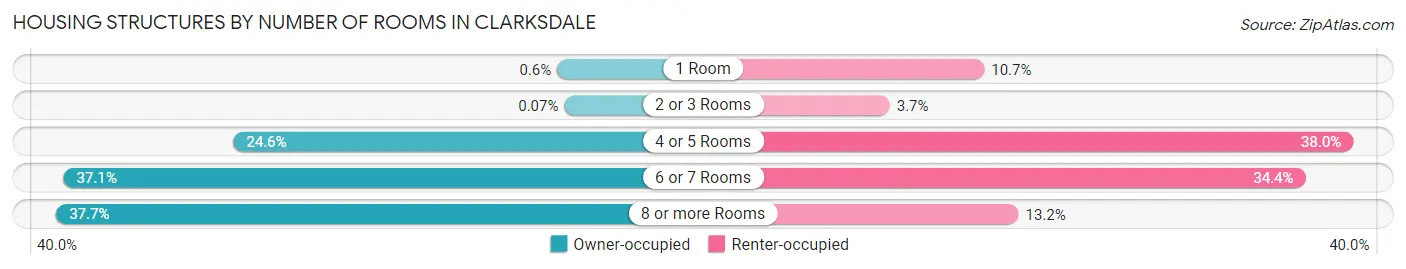
| Number of Rooms | Owner-occupied | Renter-occupied |
| 1 Room | 17 (0.6%) | 324 (10.7%) |
| 2 or 3 Rooms | 2 (0.1%) | 112 (3.7%) |
| 4 or 5 Rooms | 691 (24.5%) | 1,152 (38.0%) |
| 6 or 7 Rooms | 1,045 (37.1%) | 1,045 (34.4%) |
| 8 or more Rooms | 1,060 (37.7%) | 401 (13.2%) |
| Total | 2,815 (100.0%) | 3,034 (100.0%) |
Housing Structure by Heating Type in Clarksdale
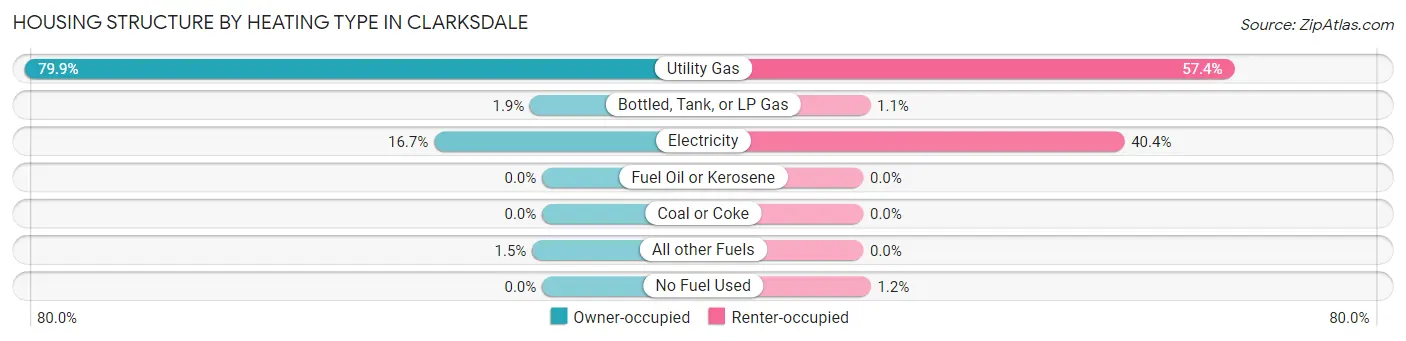
| Heating Type | Owner-occupied | Renter-occupied |
| Utility Gas | 2,250 (79.9%) | 1,741 (57.4%) |
| Bottled, Tank, or LP Gas | 52 (1.8%) | 33 (1.1%) |
| Electricity | 470 (16.7%) | 1,225 (40.4%) |
| Fuel Oil or Kerosene | 0 (0.0%) | 0 (0.0%) |
| Coal or Coke | 0 (0.0%) | 0 (0.0%) |
| All other Fuels | 43 (1.5%) | 0 (0.0%) |
| No Fuel Used | 0 (0.0%) | 35 (1.1%) |
| Total | 2,815 (100.0%) | 3,034 (100.0%) |
Household Vehicle Usage in Clarksdale
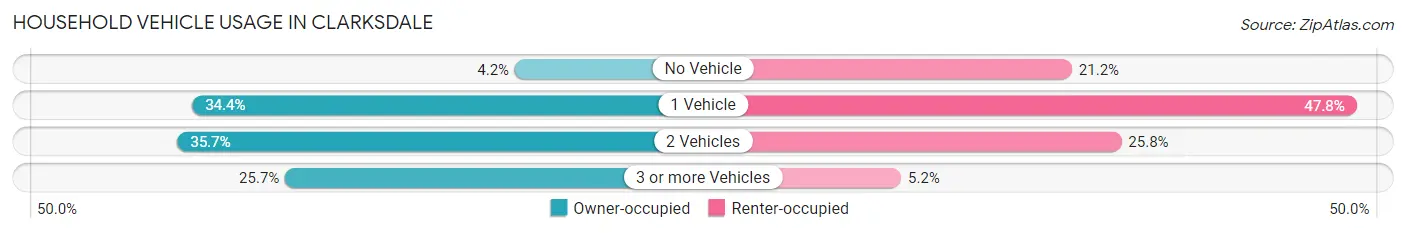
| Vehicles per Household | Owner-occupied | Renter-occupied |
| No Vehicle | 119 (4.2%) | 643 (21.2%) |
| 1 Vehicle | 967 (34.4%) | 1,449 (47.8%) |
| 2 Vehicles | 1,006 (35.7%) | 783 (25.8%) |
| 3 or more Vehicles | 723 (25.7%) | 159 (5.2%) |
| Total | 2,815 (100.0%) | 3,034 (100.0%) |
Real Estate & Mortgages in Clarksdale
Real Estate and Mortgage Overview in Clarksdale
| Characteristic | Without Mortgage | With Mortgage |
| Housing Units | 1,729 | 1,086 |
| Median Property Value | $67,000 | $112,800 |
| Median Household Income | $45,245 | $110 |
| Monthly Housing Costs | $418 | $53 |
| Real Estate Taxes | $1,069 | $258 |
Property Value by Mortgage Status in Clarksdale
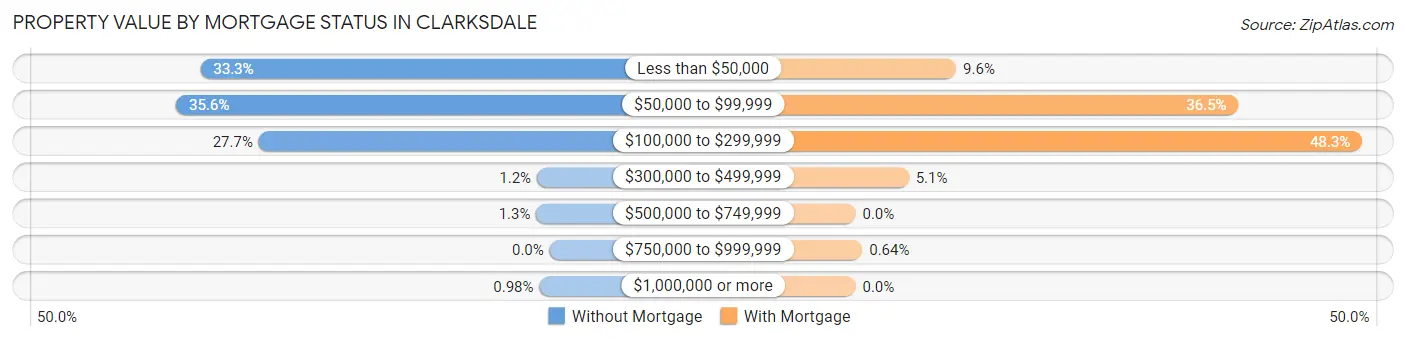
| Property Value | Without Mortgage | With Mortgage |
| Less than $50,000 | 575 (33.3%) | 104 (9.6%) |
| $50,000 to $99,999 | 615 (35.6%) | 396 (36.5%) |
| $100,000 to $299,999 | 479 (27.7%) | 524 (48.2%) |
| $300,000 to $499,999 | 21 (1.2%) | 55 (5.1%) |
| $500,000 to $749,999 | 22 (1.3%) | 0 (0.0%) |
| $750,000 to $999,999 | 0 (0.0%) | 7 (0.6%) |
| $1,000,000 or more | 17 (1.0%) | 0 (0.0%) |
| Total | 1,729 (100.0%) | 1,086 (100.0%) |
Household Income by Mortgage Status in Clarksdale
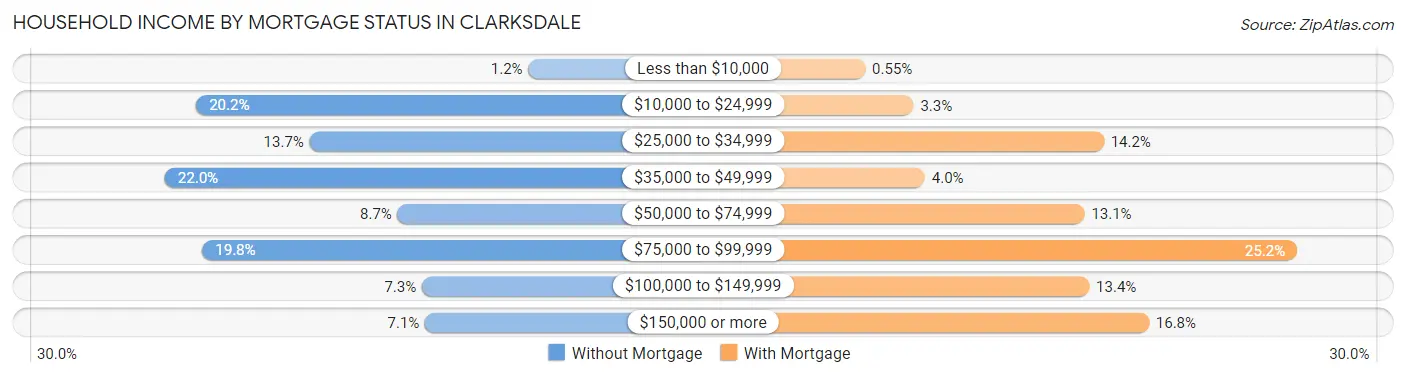
| Household Income | Without Mortgage | With Mortgage |
| Less than $10,000 | 21 (1.2%) | 6 (0.5%) |
| $10,000 to $24,999 | 349 (20.2%) | 36 (3.3%) |
| $25,000 to $34,999 | 237 (13.7%) | 154 (14.2%) |
| $35,000 to $49,999 | 380 (22.0%) | 43 (4.0%) |
| $50,000 to $74,999 | 150 (8.7%) | 142 (13.1%) |
| $75,000 to $99,999 | 343 (19.8%) | 274 (25.2%) |
| $100,000 to $149,999 | 126 (7.3%) | 145 (13.4%) |
| $150,000 or more | 123 (7.1%) | 182 (16.8%) |
| Total | 1,729 (100.0%) | 1,086 (100.0%) |
Property Value to Household Income Ratio in Clarksdale
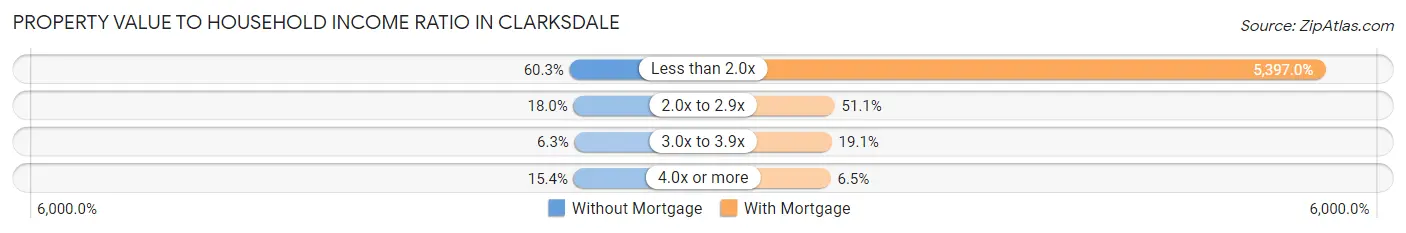
| Value-to-Income Ratio | Without Mortgage | With Mortgage |
| Less than 2.0x | 1,042 (60.3%) | 58,611 (5,397.0%) |
| 2.0x to 2.9x | 311 (18.0%) | 555 (51.1%) |
| 3.0x to 3.9x | 109 (6.3%) | 207 (19.1%) |
| 4.0x or more | 267 (15.4%) | 70 (6.5%) |
| Total | 1,729 (100.0%) | 1,086 (100.0%) |
Real Estate Taxes by Mortgage Status in Clarksdale
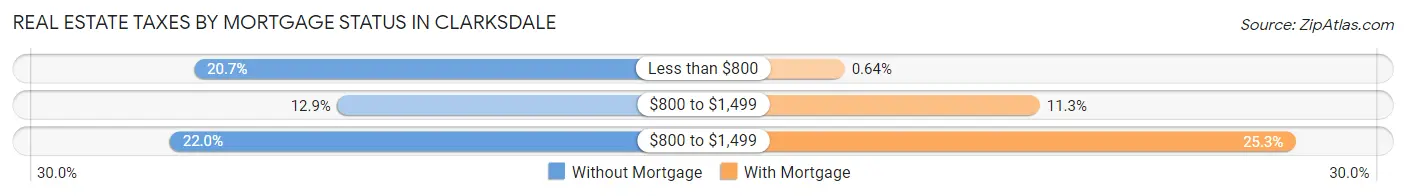
| Property Taxes | Without Mortgage | With Mortgage |
| Less than $800 | 358 (20.7%) | 7 (0.6%) |
| $800 to $1,499 | 223 (12.9%) | 123 (11.3%) |
| $800 to $1,499 | 381 (22.0%) | 275 (25.3%) |
| Total | 1,729 (100.0%) | 1,086 (100.0%) |
Health & Disability in Clarksdale
Health Insurance Coverage by Age in Clarksdale
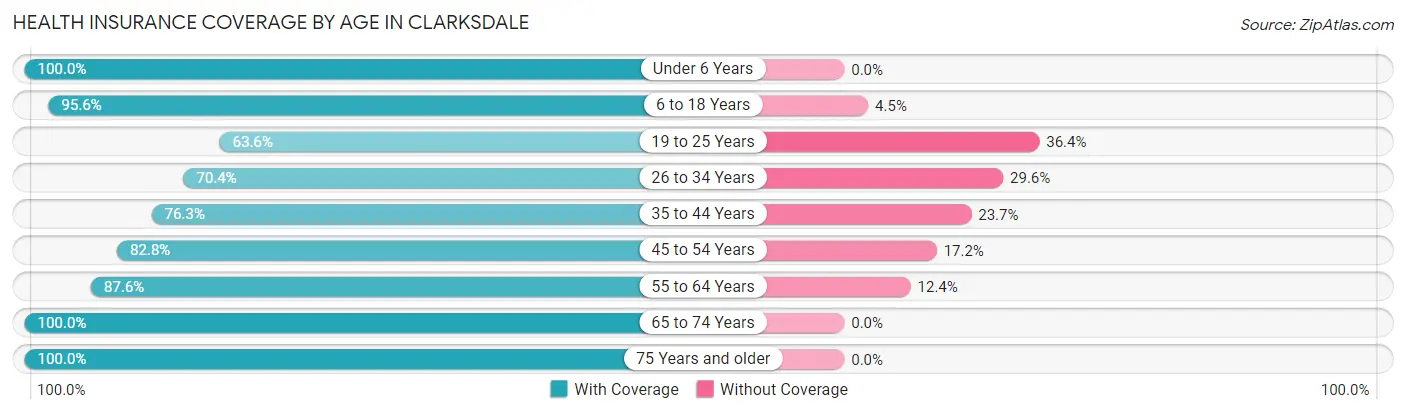
| Age Bracket | With Coverage | Without Coverage |
| Under 6 Years | 1,348 (100.0%) | 0 (0.0%) |
| 6 to 18 Years | 2,662 (95.6%) | 124 (4.4%) |
| 19 to 25 Years | 936 (63.6%) | 535 (36.4%) |
| 26 to 34 Years | 1,188 (70.4%) | 500 (29.6%) |
| 35 to 44 Years | 1,260 (76.3%) | 391 (23.7%) |
| 45 to 54 Years | 1,110 (82.8%) | 231 (17.2%) |
| 55 to 64 Years | 1,623 (87.6%) | 229 (12.4%) |
| 65 to 74 Years | 1,531 (100.0%) | 0 (0.0%) |
| 75 Years and older | 817 (100.0%) | 0 (0.0%) |
| Total | 12,475 (86.1%) | 2,010 (13.9%) |
Health Insurance Coverage by Citizenship Status in Clarksdale
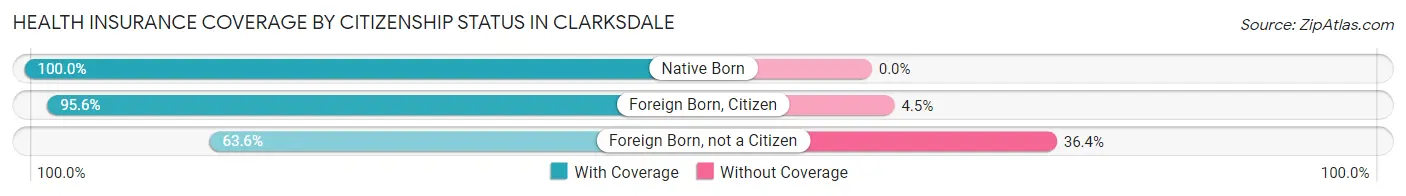
| Citizenship Status | With Coverage | Without Coverage |
| Native Born | 1,348 (100.0%) | 0 (0.0%) |
| Foreign Born, Citizen | 2,662 (95.6%) | 124 (4.4%) |
| Foreign Born, not a Citizen | 936 (63.6%) | 535 (36.4%) |
Health Insurance Coverage by Household Income in Clarksdale
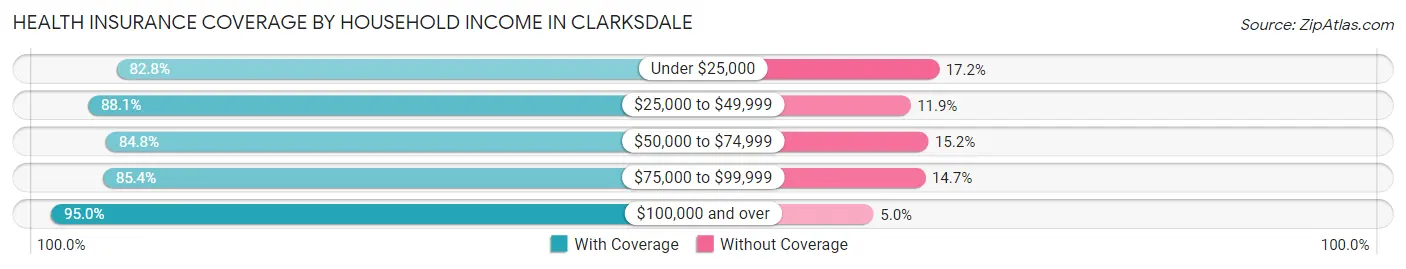
| Household Income | With Coverage | Without Coverage |
| Under $25,000 | 4,092 (82.8%) | 851 (17.2%) |
| $25,000 to $49,999 | 2,938 (88.1%) | 396 (11.9%) |
| $50,000 to $74,999 | 2,233 (84.8%) | 401 (15.2%) |
| $75,000 to $99,999 | 1,655 (85.4%) | 284 (14.6%) |
| $100,000 and over | 1,492 (95.0%) | 78 (5.0%) |
Public vs Private Health Insurance Coverage by Age in Clarksdale
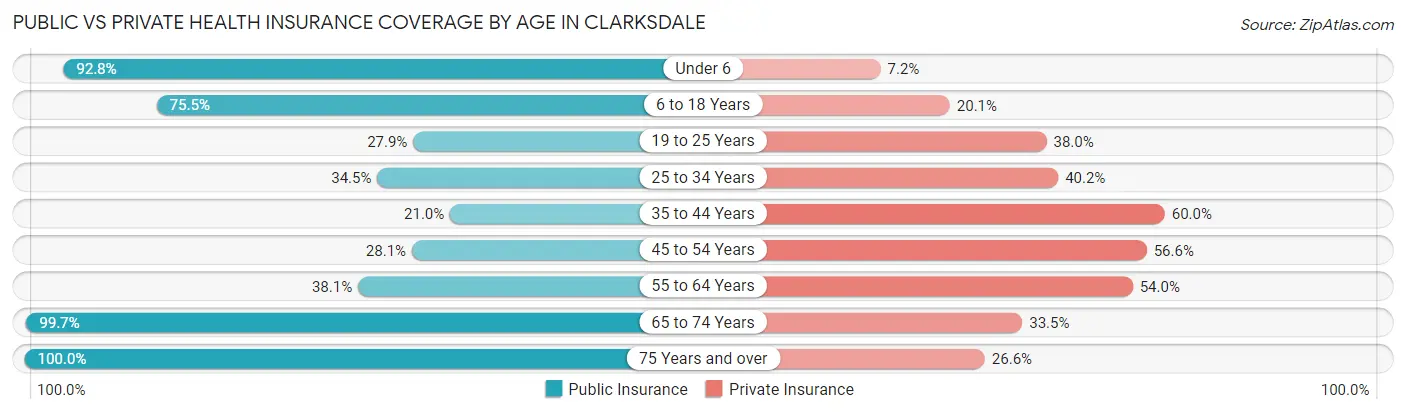
| Age Bracket | Public Insurance | Private Insurance |
| Under 6 | 1,251 (92.8%) | 97 (7.2%) |
| 6 to 18 Years | 2,103 (75.5%) | 559 (20.1%) |
| 19 to 25 Years | 410 (27.9%) | 559 (38.0%) |
| 25 to 34 Years | 583 (34.5%) | 678 (40.2%) |
| 35 to 44 Years | 347 (21.0%) | 990 (60.0%) |
| 45 to 54 Years | 377 (28.1%) | 759 (56.6%) |
| 55 to 64 Years | 706 (38.1%) | 1,000 (54.0%) |
| 65 to 74 Years | 1,526 (99.7%) | 513 (33.5%) |
| 75 Years and over | 817 (100.0%) | 217 (26.6%) |
| Total | 8,120 (56.1%) | 5,372 (37.1%) |
Disability Status by Sex by Age in Clarksdale
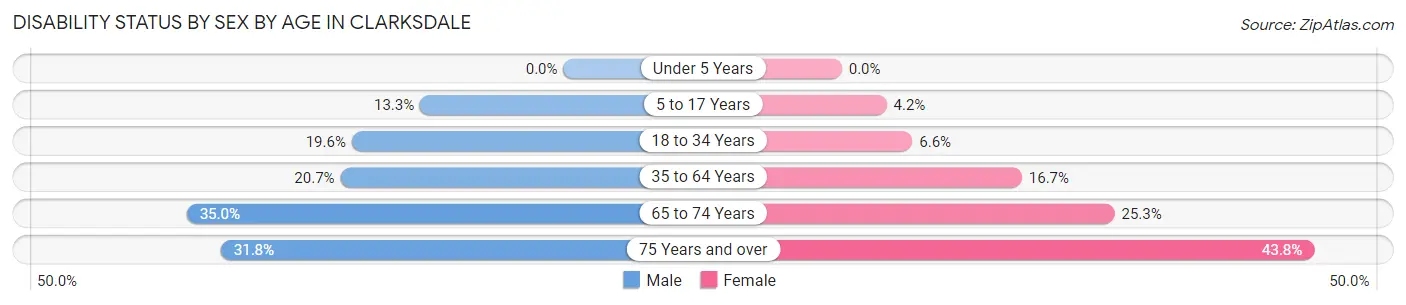
| Age Bracket | Male | Female |
| Under 5 Years | 0 (0.0%) | 0 (0.0%) |
| 5 to 17 Years | 189 (13.3%) | 52 (4.2%) |
| 18 to 34 Years | 330 (19.6%) | 115 (6.6%) |
| 35 to 64 Years | 471 (20.7%) | 429 (16.7%) |
| 65 to 74 Years | 252 (34.9%) | 205 (25.3%) |
| 75 Years and over | 82 (31.8%) | 245 (43.8%) |
Disability Class by Sex by Age in Clarksdale
Disability Class: Hearing Difficulty
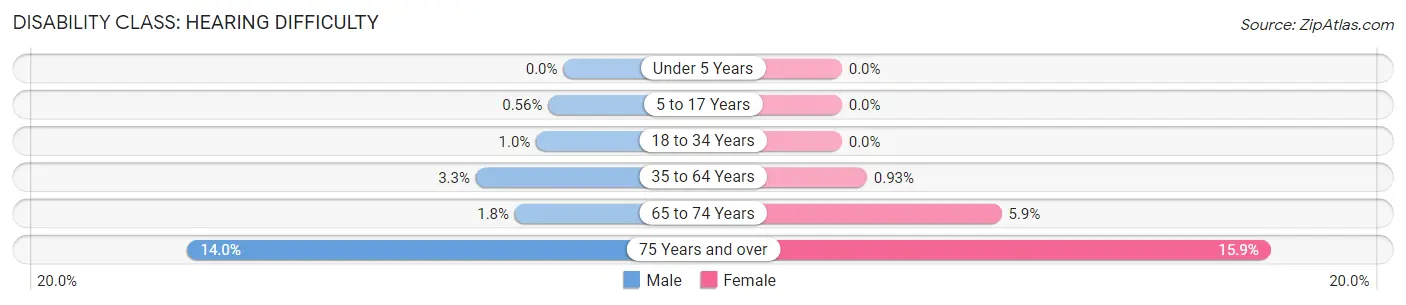
| Age Bracket | Male | Female |
| Under 5 Years | 0 (0.0%) | 0 (0.0%) |
| 5 to 17 Years | 8 (0.6%) | 0 (0.0%) |
| 18 to 34 Years | 17 (1.0%) | 0 (0.0%) |
| 35 to 64 Years | 74 (3.3%) | 24 (0.9%) |
| 65 to 74 Years | 13 (1.8%) | 48 (5.9%) |
| 75 Years and over | 36 (14.0%) | 89 (15.9%) |
Disability Class: Vision Difficulty
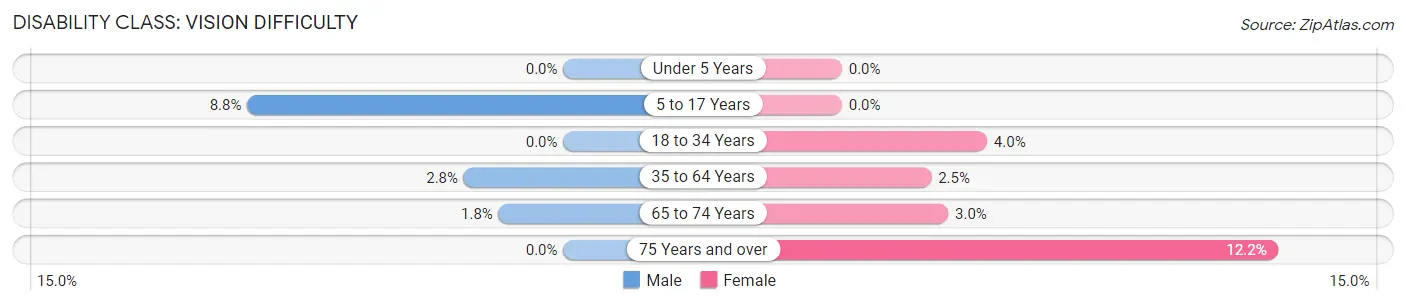
| Age Bracket | Male | Female |
| Under 5 Years | 0 (0.0%) | 0 (0.0%) |
| 5 to 17 Years | 125 (8.8%) | 0 (0.0%) |
| 18 to 34 Years | 0 (0.0%) | 71 (4.0%) |
| 35 to 64 Years | 63 (2.8%) | 64 (2.5%) |
| 65 to 74 Years | 13 (1.8%) | 24 (3.0%) |
| 75 Years and over | 0 (0.0%) | 68 (12.2%) |
Disability Class: Cognitive Difficulty
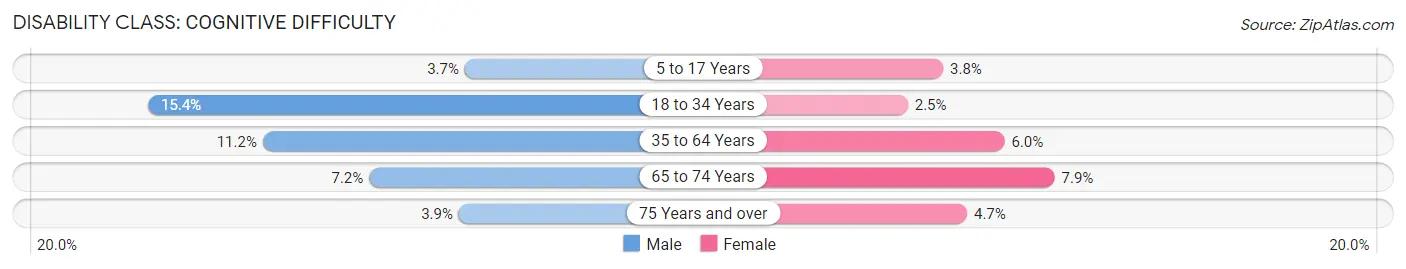
| Age Bracket | Male | Female |
| 5 to 17 Years | 52 (3.7%) | 47 (3.8%) |
| 18 to 34 Years | 259 (15.4%) | 43 (2.5%) |
| 35 to 64 Years | 254 (11.2%) | 155 (6.0%) |
| 65 to 74 Years | 52 (7.2%) | 64 (7.9%) |
| 75 Years and over | 10 (3.9%) | 26 (4.6%) |
Disability Class: Ambulatory Difficulty
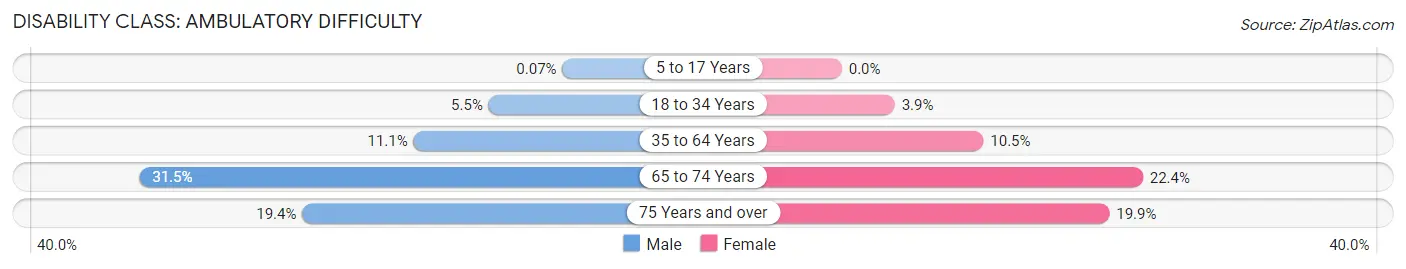
| Age Bracket | Male | Female |
| 5 to 17 Years | 1 (0.1%) | 0 (0.0%) |
| 18 to 34 Years | 93 (5.5%) | 69 (3.9%) |
| 35 to 64 Years | 253 (11.1%) | 270 (10.5%) |
| 65 to 74 Years | 227 (31.5%) | 181 (22.4%) |
| 75 Years and over | 50 (19.4%) | 111 (19.9%) |
Disability Class: Self-Care Difficulty
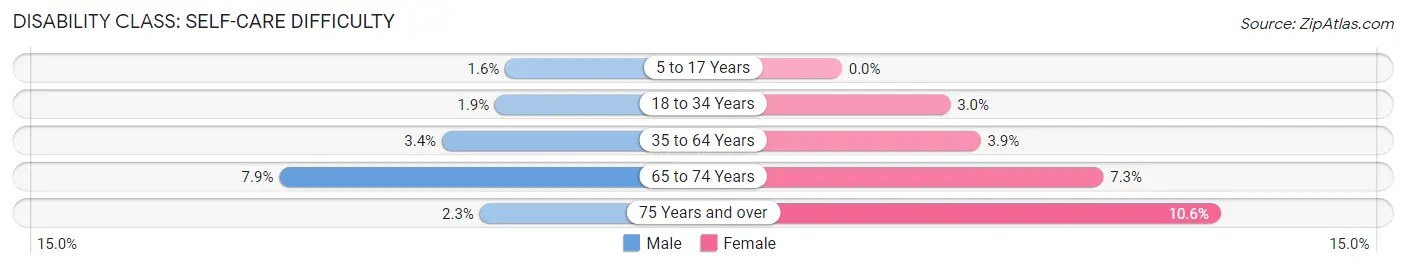
| Age Bracket | Male | Female |
| 5 to 17 Years | 23 (1.6%) | 0 (0.0%) |
| 18 to 34 Years | 32 (1.9%) | 53 (3.0%) |
| 35 to 64 Years | 77 (3.4%) | 99 (3.9%) |
| 65 to 74 Years | 57 (7.9%) | 59 (7.3%) |
| 75 Years and over | 6 (2.3%) | 59 (10.5%) |
Technology Access in Clarksdale
Computing Device Access in Clarksdale
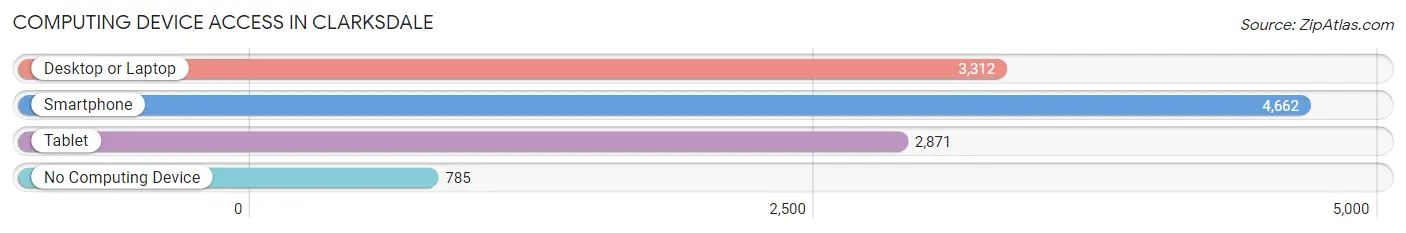
| Device Type | # Households | % Households |
| Desktop or Laptop | 3,312 | 56.6% |
| Smartphone | 4,662 | 79.7% |
| Tablet | 2,871 | 49.1% |
| No Computing Device | 785 | 13.4% |
| Total | 5,849 | 100.0% |
Internet Access in Clarksdale
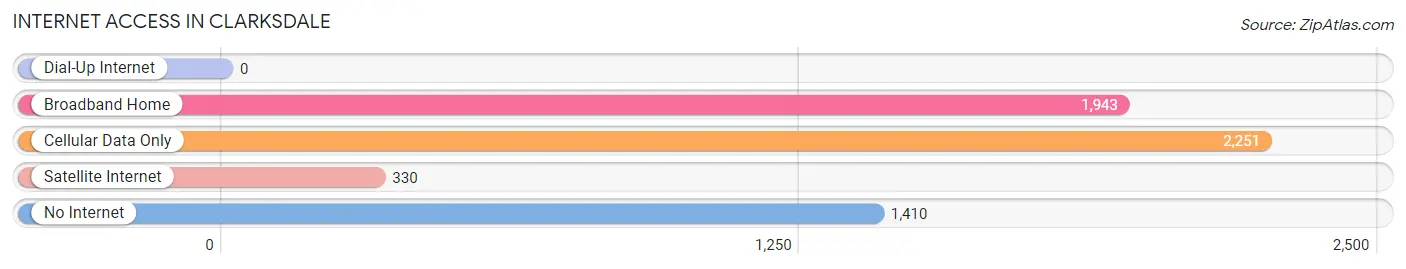
| Internet Type | # Households | % Households |
| Dial-Up Internet | 0 | 0.0% |
| Broadband Home | 1,943 | 33.2% |
| Cellular Data Only | 2,251 | 38.5% |
| Satellite Internet | 330 | 5.6% |
| No Internet | 1,410 | 24.1% |
| Total | 5,849 | 100.0% |
Clarksdale Summary
Clarksdale, Mississippi is a city located in the northwest corner of the state, in Coahoma County. It is situated on the banks of the Sunflower River, and is the county seat of Coahoma County. The city is known for its rich history, vibrant culture, and its role in the development of the blues music genre.
History
Clarksdale was founded in 1836 by John Clark, a settler from North Carolina. The city was named after him, and was incorporated in 1882. The city was a major hub for the cotton industry, and was home to many wealthy plantation owners. During the Civil War, Clarksdale was a major supply center for the Confederate Army. After the war, the city experienced a period of economic growth, and was home to many businesses, including a cotton gin, a sawmill, and a gristmill.
In the early 20th century, Clarksdale became a major center for the blues music genre. The city was home to many famous blues musicians, including Muddy Waters, John Lee Hooker, and B.B. King. The city was also home to the famous Delta Blues Museum, which was founded in 1979.
Geography
Clarksdale is located in the northwest corner of Mississippi, in Coahoma County. The city is situated on the banks of the Sunflower River, and is located about 40 miles south of Memphis, Tennessee. The city has a total area of 8.3 square miles, and has an elevation of about 200 feet. The climate in Clarksdale is humid subtropical, with hot, humid summers and mild winters.
Economy
Clarksdale’s economy is largely based on agriculture and tourism. The city is home to many cotton farms, and is a major producer of cotton in the state. The city is also home to many tourist attractions, including the Delta Blues Museum, the Clarksdale Blues Festival, and the Sunflower River Blues and Gospel Festival. The city is also home to many restaurants, bars, and shops.
Demographics
As of the 2010 census, the population of Clarksdale was 17,962. The racial makeup of the city was 57.3% African American, 37.7% White, 0.3% Native American, 0.2% Asian, 0.1% Pacific Islander, and 4.4% from other races. The median household income in Clarksdale was $25,921, and the median family income was $31,919. The per capita income in the city was $14,945.
Conclusion
Clarksdale, Mississippi is a city with a rich history, vibrant culture, and a strong economy. The city is home to many cotton farms, tourist attractions, and businesses. The city is also home to many famous blues musicians, and is a major center for the blues music genre. The population of Clarksdale is largely African American, and the median household income is lower than the national average.
Common Questions
What is Per Capita Income in Clarksdale?
Per Capita income in Clarksdale is $21,166.
What is the Median Family Income in Clarksdale?
Median Family Income in Clarksdale is $41,307.
What is the Median Household income in Clarksdale?
Median Household Income in Clarksdale is $35,377.
What is Income or Wage Gap in Clarksdale?
Income or Wage Gap in Clarksdale is 30.7%.
Women in Clarksdale earn 69.3 cents for every dollar earned by a man.
What is Family Income Deficit in Clarksdale?
Family Income Deficit in Clarksdale is $11,362.
Families that are below poverty line in Clarksdale earn $11,362 less on average than the poverty threshold level.
What is Inequality or Gini Index in Clarksdale?
Inequality or Gini Index in Clarksdale is 0.51.
What is the Total Population of Clarksdale?
Total Population of Clarksdale is 14,769.
What is the Total Male Population of Clarksdale?
Total Male Population of Clarksdale is 7,169.
What is the Total Female Population of Clarksdale?
Total Female Population of Clarksdale is 7,600.
What is the Ratio of Males per 100 Females in Clarksdale?
There are 94.33 Males per 100 Females in Clarksdale.
What is the Ratio of Females per 100 Males in Clarksdale?
There are 106.01 Females per 100 Males in Clarksdale.
What is the Median Population Age in Clarksdale?
Median Population Age in Clarksdale is 35.4 Years.
What is the Average Family Size in Clarksdale
Average Family Size in Clarksdale is 3.2 People.
What is the Average Household Size in Clarksdale
Average Household Size in Clarksdale is 2.5 People.
How Large is the Labor Force in Clarksdale?
There are 5,945 People in the Labor Forcein in Clarksdale.
What is the Percentage of People in the Labor Force in Clarksdale?
52.5% of People are in the Labor Force in Clarksdale.
What is the Unemployment Rate in Clarksdale?
Unemployment Rate in Clarksdale is 12.6%.