Holly Springs, MS Map & Demographics
Holly Springs Map
Holly Springs Overview
$19,947
PER CAPITA INCOME
$43,613
AVG FAMILY INCOME
$45,552
AVG HOUSEHOLD INCOME
16.1%
WAGE / INCOME GAP [ % ]
83.9¢/ $1
WAGE / INCOME GAP [ $ ]
$11,919
FAMILY INCOME DEFICIT
0.43
INEQUALITY / GINI INDEX
6,942
TOTAL POPULATION
3,556
MALE POPULATION
3,386
FEMALE POPULATION
105.02
MALES / 100 FEMALES
95.22
FEMALES / 100 MALES
40.6
MEDIAN AGE
2.5
AVG FAMILY SIZE
2.2
AVG HOUSEHOLD SIZE
2,776
LABOR FORCE [ PEOPLE ]
45.5%
PERCENT IN LABOR FORCE
7.9%
UNEMPLOYMENT RATE
Holly Springs Zip Codes
Holly Springs Area Codes
Income in Holly Springs
Income Overview in Holly Springs
Per Capita Income in Holly Springs is $19,947, while median incomes of families and households are $43,613 and $45,552 respectively.
| Characteristic | Number | Measure |
| Per Capita Income | 6,942 | $19,947 |
| Median Family Income | 1,539 | $43,613 |
| Mean Family Income | 1,539 | $63,112 |
| Median Household Income | 2,260 | $45,552 |
| Mean Household Income | 2,260 | $59,241 |
| Income Deficit | 1,539 | $11,919 |
| Wage / Income Gap (%) | 6,942 | 16.10% |
| Wage / Income Gap ($) | 6,942 | 83.90¢ per $1 |
| Gini / Inequality Index | 6,942 | 0.43 |
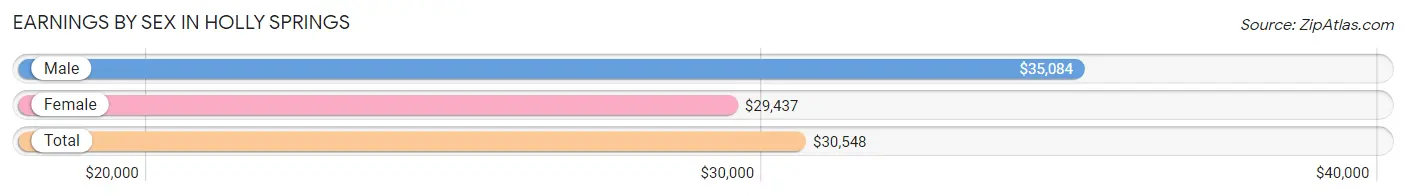
Earnings by Sex in Holly Springs
Average Earnings in Holly Springs are $30,548, $35,084 for men and $29,437 for women, a difference of 16.1%.
| Sex | Number | Average Earnings |
| Male | 1,234 (39.8%) | $35,084 |
| Female | 1,865 (60.2%) | $29,437 |
| Total | 3,099 (100.0%) | $30,548 |
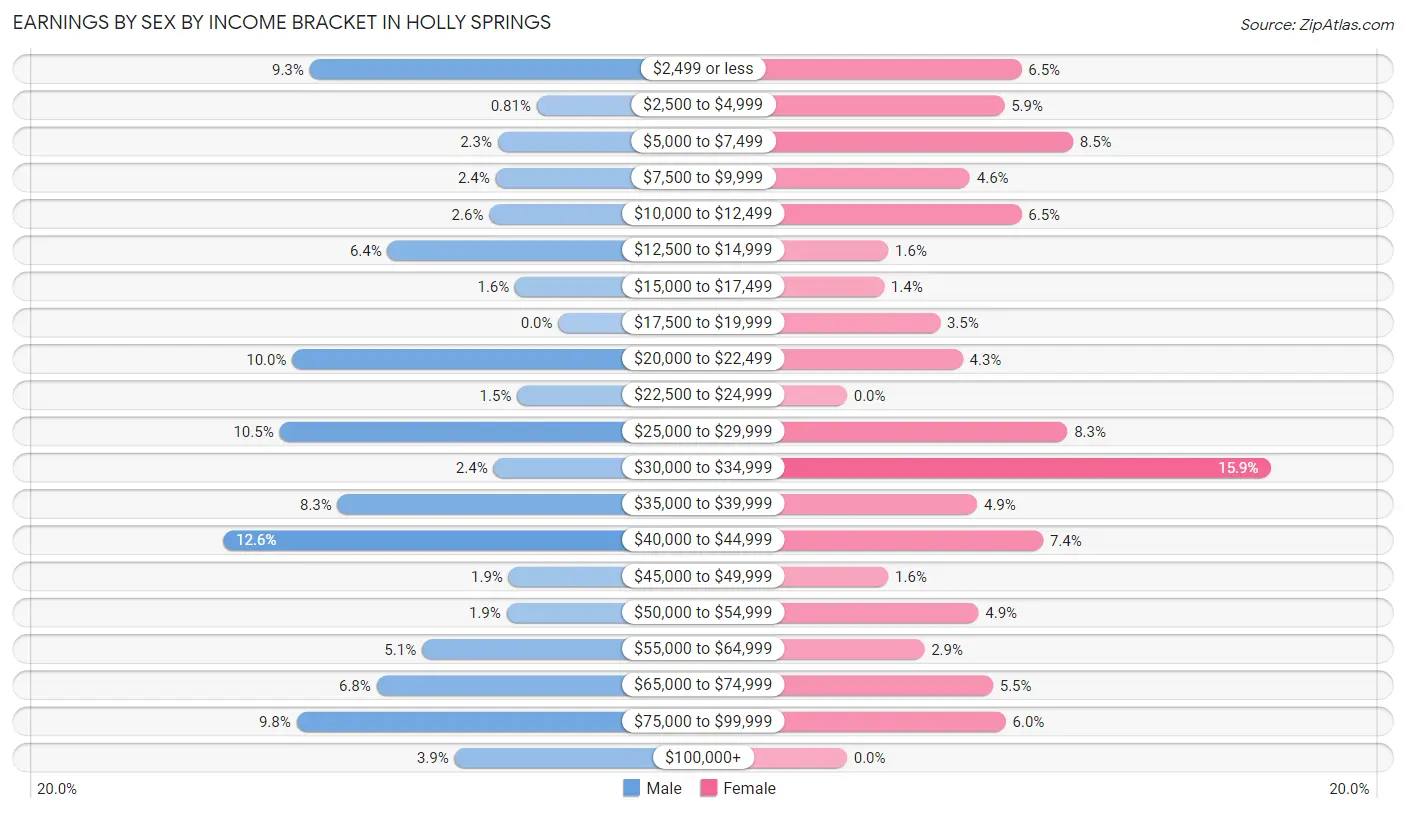
Earnings by Sex by Income Bracket in Holly Springs
The most common earnings brackets in Holly Springs are $40,000 to $44,999 for men (155 | 12.6%) and $30,000 to $34,999 for women (296 | 15.9%).
| Income | Male | Female |
| $2,499 or less | 115 (9.3%) | 122 (6.5%) |
| $2,500 to $4,999 | 10 (0.8%) | 110 (5.9%) |
| $5,000 to $7,499 | 28 (2.3%) | 158 (8.5%) |
| $7,500 to $9,999 | 29 (2.4%) | 86 (4.6%) |
| $10,000 to $12,499 | 32 (2.6%) | 122 (6.5%) |
| $12,500 to $14,999 | 79 (6.4%) | 29 (1.5%) |
| $15,000 to $17,499 | 20 (1.6%) | 26 (1.4%) |
| $17,500 to $19,999 | 0 (0.0%) | 65 (3.5%) |
| $20,000 to $22,499 | 123 (10.0%) | 81 (4.3%) |
| $22,500 to $24,999 | 19 (1.5%) | 0 (0.0%) |
| $25,000 to $29,999 | 129 (10.4%) | 154 (8.3%) |
| $30,000 to $34,999 | 30 (2.4%) | 296 (15.9%) |
| $35,000 to $39,999 | 102 (8.3%) | 91 (4.9%) |
| $40,000 to $44,999 | 155 (12.6%) | 137 (7.3%) |
| $45,000 to $49,999 | 23 (1.9%) | 29 (1.5%) |
| $50,000 to $54,999 | 24 (1.9%) | 92 (4.9%) |
| $55,000 to $64,999 | 63 (5.1%) | 54 (2.9%) |
| $65,000 to $74,999 | 84 (6.8%) | 102 (5.5%) |
| $75,000 to $99,999 | 121 (9.8%) | 111 (5.9%) |
| $100,000+ | 48 (3.9%) | 0 (0.0%) |
| Total | 1,234 (100.0%) | 1,865 (100.0%) |
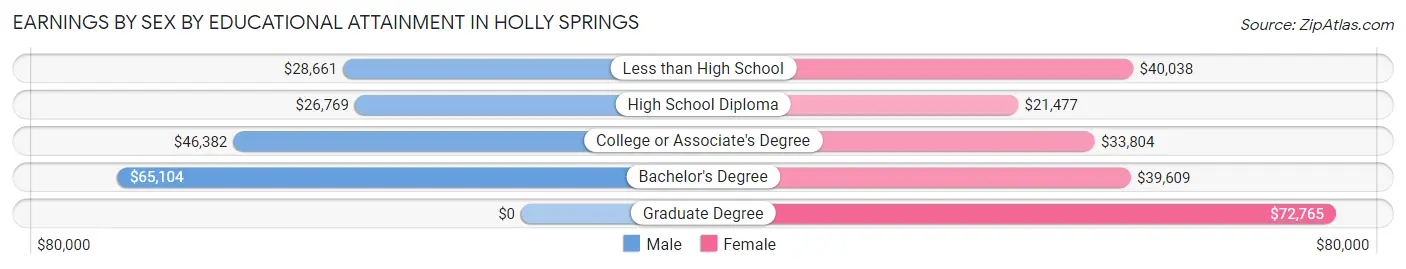
Earnings by Sex by Educational Attainment in Holly Springs
Average earnings in Holly Springs are $40,000 for men and $33,833 for women, a difference of 15.4%. Men with an educational attainment of bachelor's degree enjoy the highest average annual earnings of $65,104, while those with high school diploma education earn the least with $26,769. Women with an educational attainment of graduate degree earn the most with the average annual earnings of $72,765, while those with high school diploma education have the smallest earnings of $21,477.
| Educational Attainment | Male Income | Female Income |
| Less than High School | $28,661 | $40,038 |
| High School Diploma | $26,769 | $21,477 |
| College or Associate's Degree | $46,382 | $33,804 |
| Bachelor's Degree | $65,104 | $39,609 |
| Graduate Degree | - | - |
| Total | $40,000 | $33,833 |
Family Income in Holly Springs
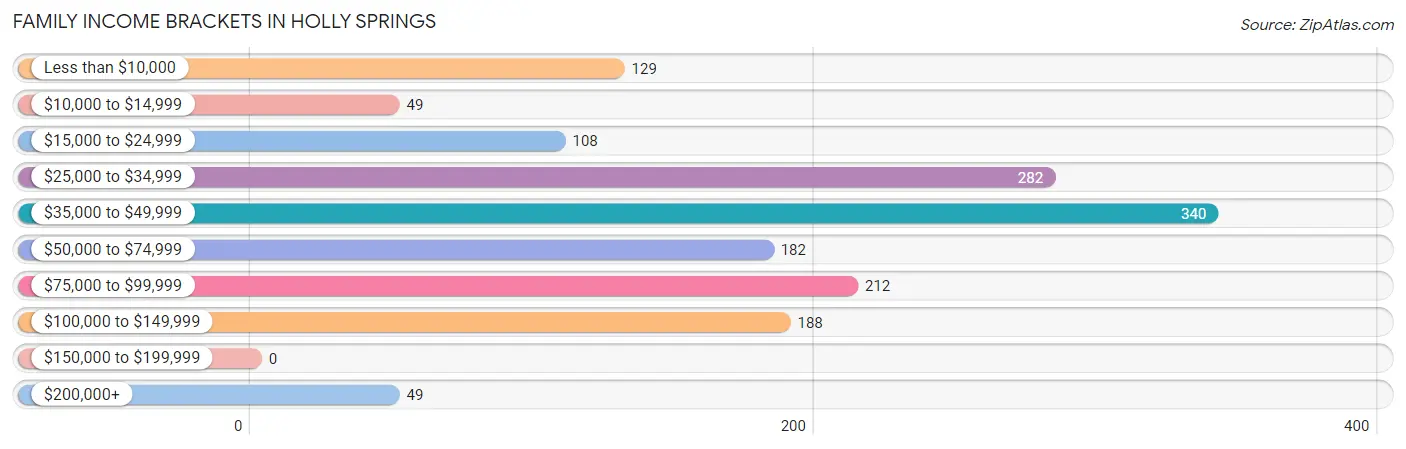
Family Income Brackets in Holly Springs
According to the Holly Springs family income data, there are 340 families falling into the $35,000 to $49,999 income range, which is the most common income bracket and makes up 22.1% of all families.
| Income Bracket | # Families | % Families |
| Less than $10,000 | 129 | 8.4% |
| $10,000 to $14,999 | 49 | 3.2% |
| $15,000 to $24,999 | 108 | 7.0% |
| $25,000 to $34,999 | 282 | 18.3% |
| $35,000 to $49,999 | 340 | 22.1% |
| $50,000 to $74,999 | 182 | 11.8% |
| $75,000 to $99,999 | 212 | 13.8% |
| $100,000 to $149,999 | 188 | 12.2% |
| $150,000 to $199,999 | 0 | 0.0% |
| $200,000+ | 49 | 3.2% |
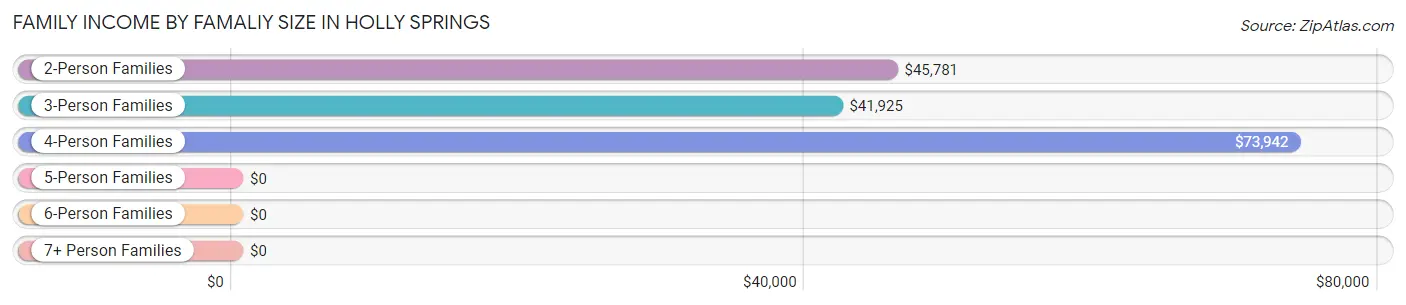
Family Income by Famaliy Size in Holly Springs
4-person families (249 | 16.2%) account for the highest median family income in Holly Springs with $73,942 per family, while 2-person families (975 | 63.3%) have the highest median income of $22,890 per family member.
| Income Bracket | # Families | Median Income |
| 2-Person Families | 975 (63.3%) | $45,781 |
| 3-Person Families | 289 (18.8%) | $41,925 |
| 4-Person Families | 249 (16.2%) | $73,942 |
| 5-Person Families | 7 (0.4%) | $0 |
| 6-Person Families | 0 (0.0%) | $0 |
| 7+ Person Families | 19 (1.2%) | $0 |
| Total | 1,539 (100.0%) | $43,613 |
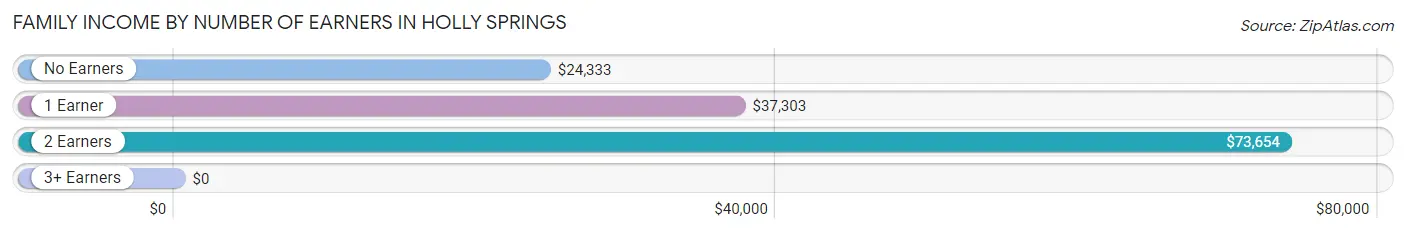
Family Income by Number of Earners in Holly Springs
| Number of Earners | # Families | Median Income |
| No Earners | 284 (18.4%) | $24,333 |
| 1 Earner | 581 (37.8%) | $37,303 |
| 2 Earners | 600 (39.0%) | $73,654 |
| 3+ Earners | 74 (4.8%) | $0 |
| Total | 1,539 (100.0%) | $43,613 |
Household Income in Holly Springs
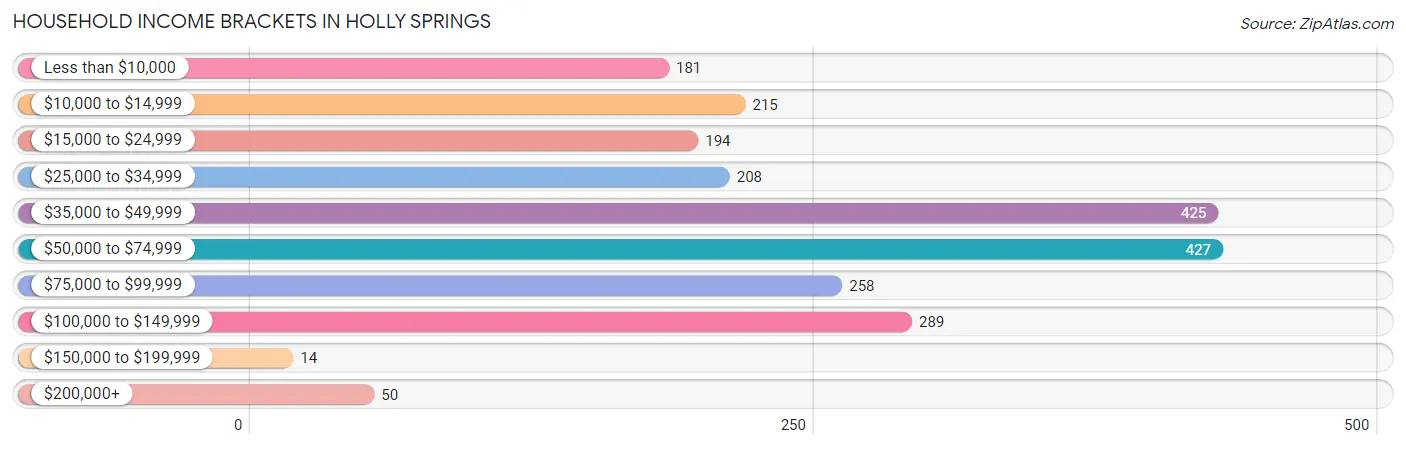
Household Income Brackets in Holly Springs
With 427 households falling in the category, the $50,000 to $74,999 income range is the most frequent in Holly Springs, accounting for 18.9% of all households. In contrast, only 14 households (0.6%) fall into the $150,000 to $199,999 income bracket, making it the least populous group.
| Income Bracket | # Households | % Households |
| Less than $10,000 | 181 | 8.0% |
| $10,000 to $14,999 | 215 | 9.5% |
| $15,000 to $24,999 | 194 | 8.6% |
| $25,000 to $34,999 | 208 | 9.2% |
| $35,000 to $49,999 | 425 | 18.8% |
| $50,000 to $74,999 | 427 | 18.9% |
| $75,000 to $99,999 | 258 | 11.4% |
| $100,000 to $149,999 | 289 | 12.8% |
| $150,000 to $199,999 | 14 | 0.6% |
| $200,000+ | 50 | 2.2% |
Household Income by Householder Age in Holly Springs
The median household income in Holly Springs is $45,552, with the highest median household income of $62,875 found in the 45 to 64 years age bracket for the primary householder. A total of 797 households (35.3%) fall into this category. Meanwhile, the 15 to 24 years age bracket for the primary householder has the lowest median household income of $0, with 47 households (2.1%) in this group.
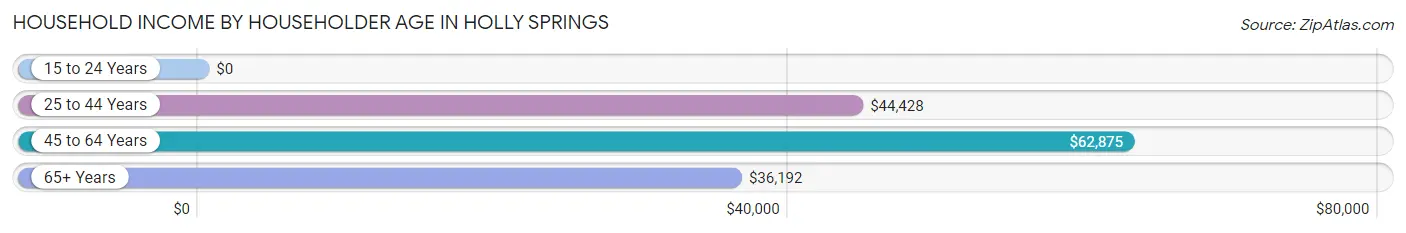
| Income Bracket | # Households | Median Income |
| 15 to 24 Years | 47 (2.1%) | $0 |
| 25 to 44 Years | 883 (39.1%) | $44,428 |
| 45 to 64 Years | 797 (35.3%) | $62,875 |
| 65+ Years | 533 (23.6%) | $36,192 |
| Total | 2,260 (100.0%) | $45,552 |
Poverty in Holly Springs
Income Below Poverty by Sex and Age in Holly Springs
With 23.8% poverty level for males and 26.0% for females among the residents of Holly Springs, 5 year old males and under 5 year old females are the most vulnerable to poverty, with 17 males (100.0%) and 84 females (73.0%) in their respective age groups living below the poverty level.
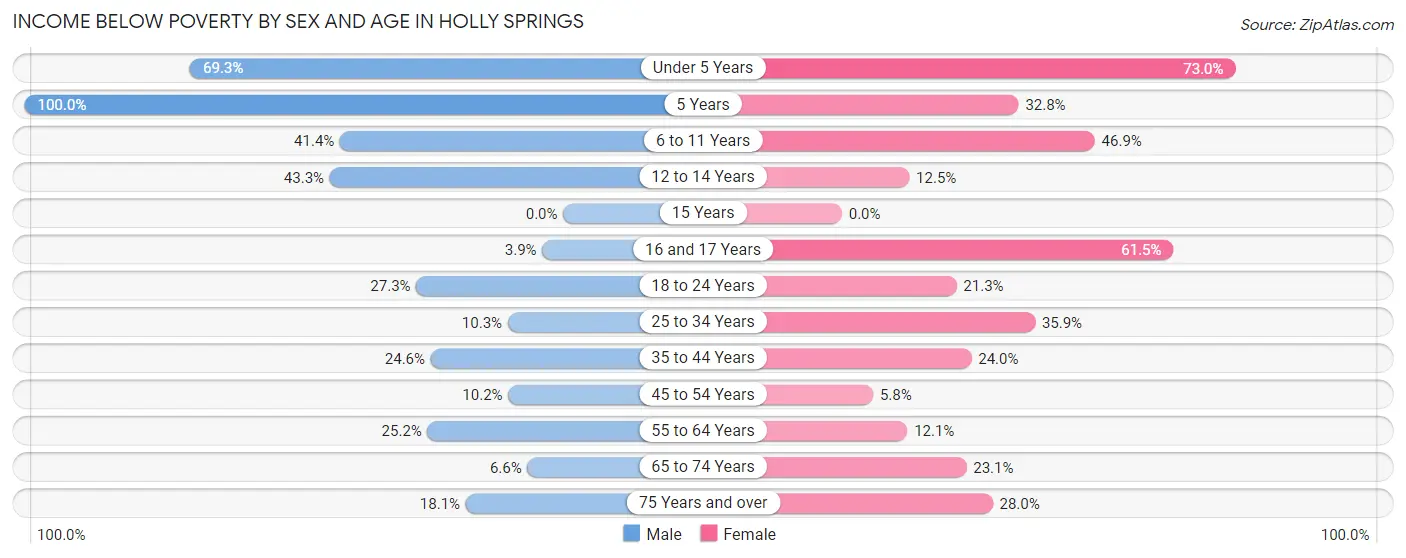
| Age Bracket | Male | Female |
| Under 5 Years | 88 (69.3%) | 84 (73.0%) |
| 5 Years | 17 (100.0%) | 20 (32.8%) |
| 6 to 11 Years | 58 (41.4%) | 92 (46.9%) |
| 12 to 14 Years | 39 (43.3%) | 9 (12.5%) |
| 15 Years | 0 (0.0%) | 0 (0.0%) |
| 16 and 17 Years | 4 (3.9%) | 40 (61.5%) |
| 18 to 24 Years | 51 (27.3%) | 47 (21.3%) |
| 25 to 34 Years | 28 (10.3%) | 114 (35.8%) |
| 35 to 44 Years | 75 (24.6%) | 144 (24.0%) |
| 45 to 54 Years | 20 (10.2%) | 13 (5.8%) |
| 55 to 64 Years | 97 (25.2%) | 59 (12.1%) |
| 65 to 74 Years | 14 (6.6%) | 58 (23.1%) |
| 75 Years and over | 17 (18.1%) | 61 (28.0%) |
| Total | 508 (23.8%) | 741 (26.0%) |
Income Above Poverty by Sex and Age in Holly Springs
According to the poverty statistics in Holly Springs, males aged 15 years and females aged 15 years are the age groups that are most secure financially, with 100.0% of males and 100.0% of females in these age groups living above the poverty line.
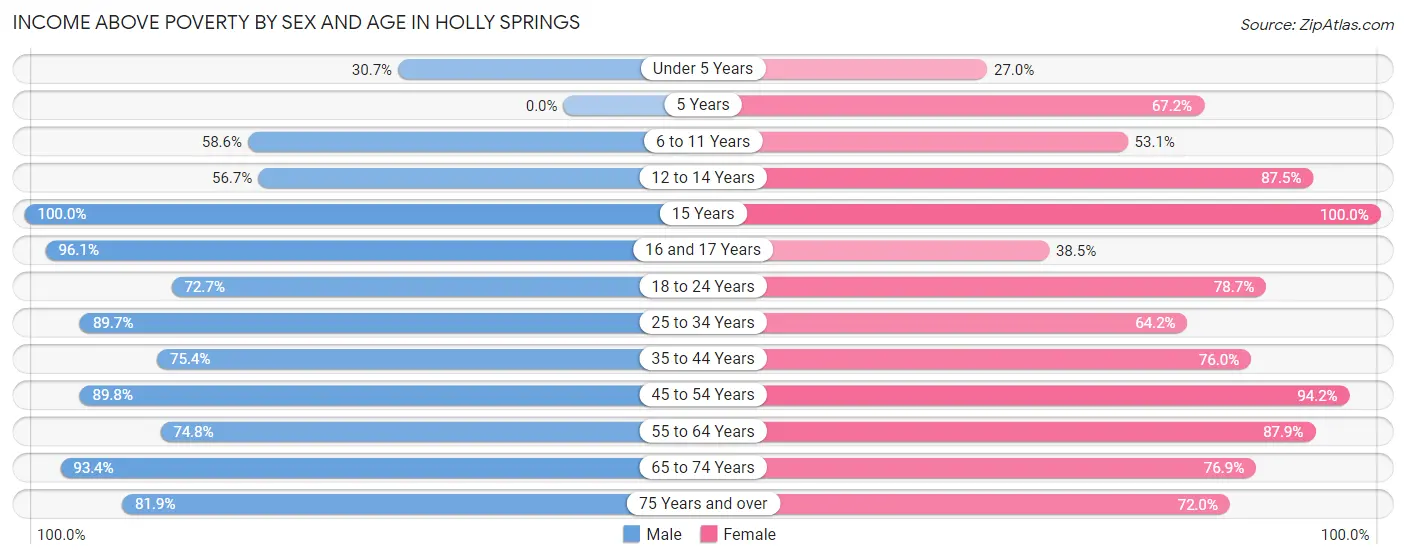
| Age Bracket | Male | Female |
| Under 5 Years | 39 (30.7%) | 31 (27.0%) |
| 5 Years | 0 (0.0%) | 41 (67.2%) |
| 6 to 11 Years | 82 (58.6%) | 104 (53.1%) |
| 12 to 14 Years | 51 (56.7%) | 63 (87.5%) |
| 15 Years | 4 (100.0%) | 19 (100.0%) |
| 16 and 17 Years | 99 (96.1%) | 25 (38.5%) |
| 18 to 24 Years | 136 (72.7%) | 174 (78.7%) |
| 25 to 34 Years | 244 (89.7%) | 204 (64.1%) |
| 35 to 44 Years | 230 (75.4%) | 455 (76.0%) |
| 45 to 54 Years | 176 (89.8%) | 212 (94.2%) |
| 55 to 64 Years | 288 (74.8%) | 427 (87.9%) |
| 65 to 74 Years | 197 (93.4%) | 193 (76.9%) |
| 75 Years and over | 77 (81.9%) | 157 (72.0%) |
| Total | 1,623 (76.2%) | 2,105 (74.0%) |
Income Below Poverty Among Married-Couple Families in Holly Springs
The poverty statistics for married-couple families in Holly Springs show that 6.6% or 39 of the total 587 families live below the poverty line. Families with 3 or 4 children have the highest poverty rate of 100.0%, comprising of 4 families. On the other hand, families with no children have the lowest poverty rate of 1.9%, which includes 10 families.
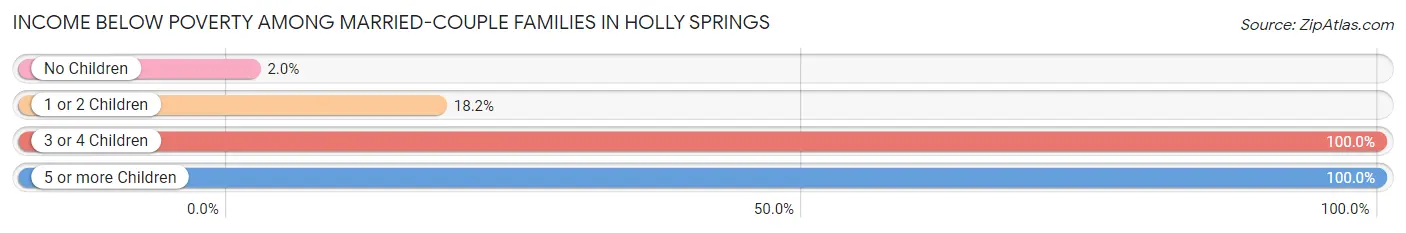
| Children | Above Poverty | Below Poverty |
| No Children | 503 (98.1%) | 10 (1.9%) |
| 1 or 2 Children | 45 (81.8%) | 10 (18.2%) |
| 3 or 4 Children | 0 (0.0%) | 4 (100.0%) |
| 5 or more Children | 0 (0.0%) | 15 (100.0%) |
| Total | 548 (93.4%) | 39 (6.6%) |
Income Below Poverty Among Single-Parent Households in Holly Springs
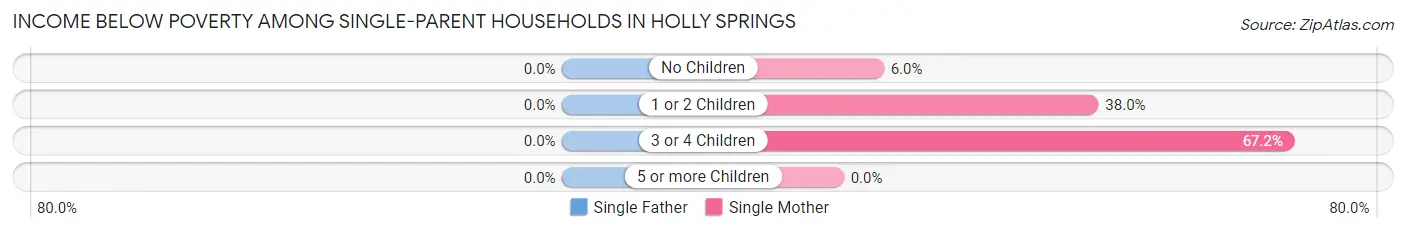
| Children | Single Father | Single Mother |
| No Children | 0 (0.0%) | 24 (6.0%) |
| 1 or 2 Children | 0 (0.0%) | 164 (38.0%) |
| 3 or 4 Children | 0 (0.0%) | 41 (67.2%) |
| 5 or more Children | 0 (0.0%) | 0 (0.0%) |
| Total | 0 (0.0%) | 229 (25.6%) |
Income Below Poverty Among Married-Couple vs Single-Parent Households in Holly Springs
The poverty data for Holly Springs shows that 39 of the married-couple family households (6.6%) and 229 of the single-parent households (24.0%) are living below the poverty level. Within the married-couple family households, those with 3 or 4 children have the highest poverty rate, with 4 households (100.0%) falling below the poverty line. Among the single-parent households, those with 3 or 4 children have the highest poverty rate, with 41 household (67.2%) living below poverty.
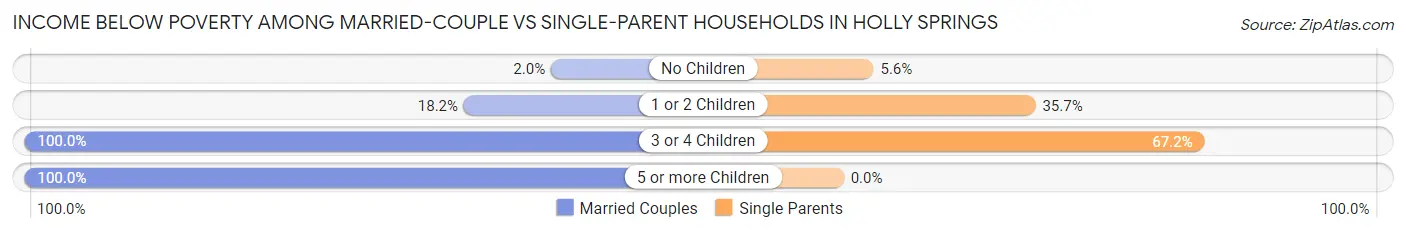
| Children | Married-Couple Families | Single-Parent Households |
| No Children | 10 (1.9%) | 24 (5.6%) |
| 1 or 2 Children | 10 (18.2%) | 164 (35.7%) |
| 3 or 4 Children | 4 (100.0%) | 41 (67.2%) |
| 5 or more Children | 15 (100.0%) | 0 (0.0%) |
| Total | 39 (6.6%) | 229 (24.0%) |
Race in Holly Springs
The most populous races in Holly Springs are Black / African American (5,370 | 77.4%), White / Caucasian (1,277 | 18.4%), and Two or more Races (280 | 4.0%).
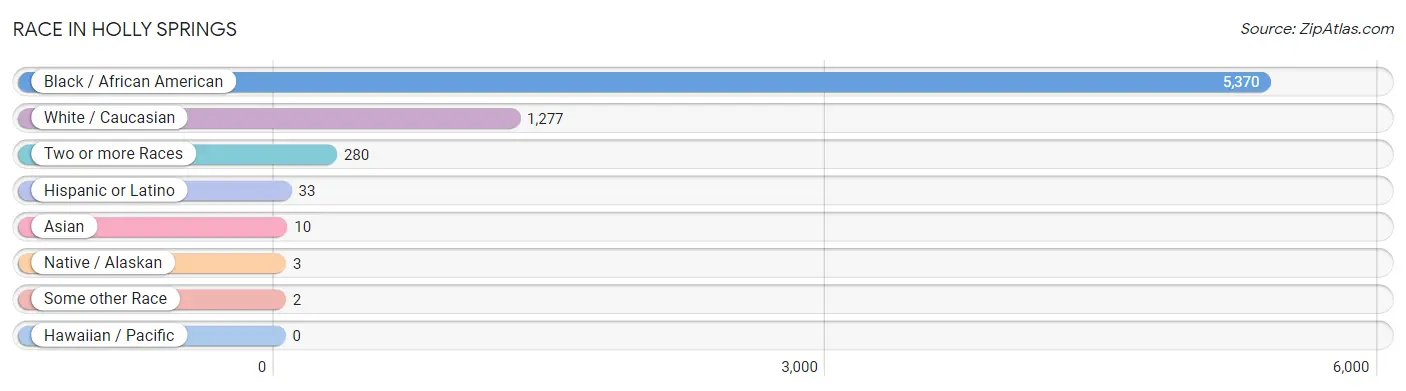
| Race | # Population | % Population |
| Asian | 10 | 0.1% |
| Black / African American | 5,370 | 77.4% |
| Hawaiian / Pacific | 0 | 0.0% |
| Hispanic or Latino | 33 | 0.5% |
| Native / Alaskan | 3 | 0.0% |
| White / Caucasian | 1,277 | 18.4% |
| Two or more Races | 280 | 4.0% |
| Some other Race | 2 | 0.0% |
| Total | 6,942 | 100.0% |
Ancestry in Holly Springs
The most populous ancestries reported in Holly Springs are English (329 | 4.7%), American (309 | 4.4%), Irish (213 | 3.1%), Belgian (98 | 1.4%), and German (93 | 1.3%), together accounting for 15.0% of all Holly Springs residents.
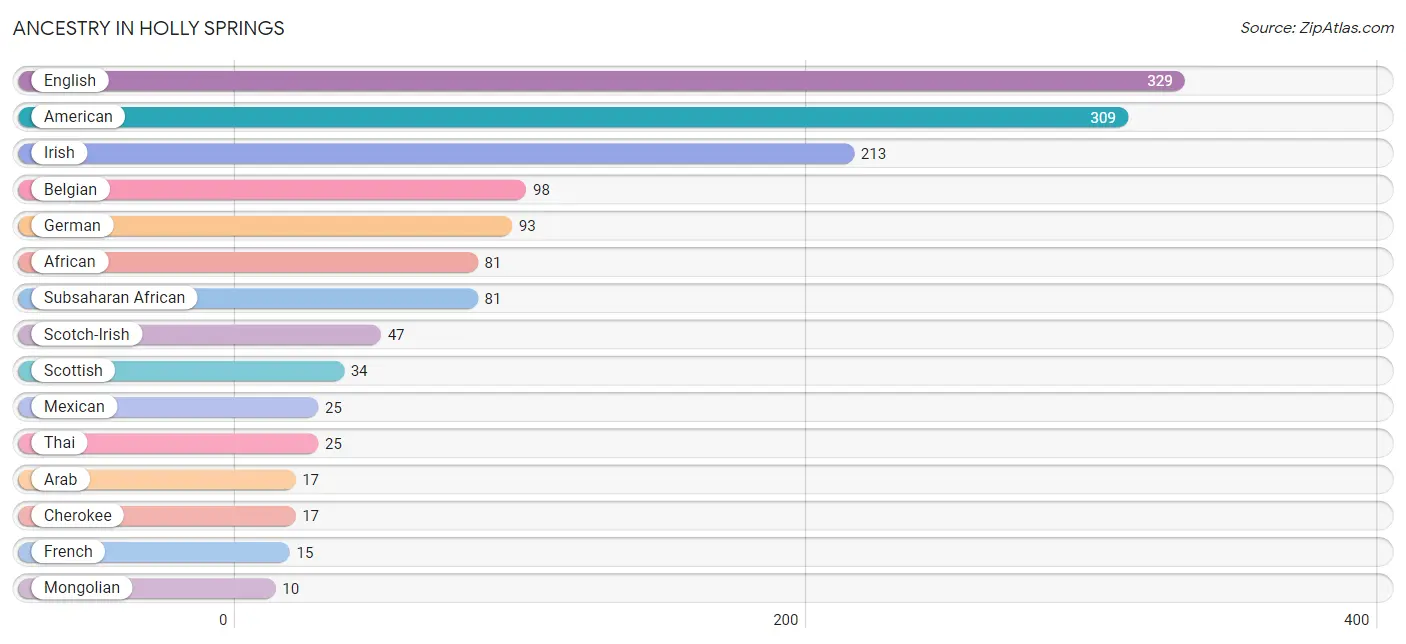
| Ancestry | # Population | % Population |
| African | 81 | 1.2% |
| American | 309 | 4.4% |
| Arab | 17 | 0.2% |
| Austrian | 5 | 0.1% |
| Belgian | 98 | 1.4% |
| Blackfeet | 4 | 0.1% |
| Cajun | 6 | 0.1% |
| Cherokee | 17 | 0.2% |
| Choctaw | 3 | 0.0% |
| Dominican | 8 | 0.1% |
| English | 329 | 4.7% |
| French | 15 | 0.2% |
| French American Indian | 1 | 0.0% |
| French Canadian | 1 | 0.0% |
| German | 93 | 1.3% |
| Irish | 213 | 3.1% |
| Italian | 2 | 0.0% |
| Mexican | 25 | 0.4% |
| Mongolian | 10 | 0.1% |
| Norwegian | 3 | 0.0% |
| Scotch-Irish | 47 | 0.7% |
| Scottish | 34 | 0.5% |
| Slovak | 9 | 0.1% |
| Subsaharan African | 81 | 1.2% |
| Thai | 25 | 0.4% | View All 25 Rows |
Immigrants in Holly Springs
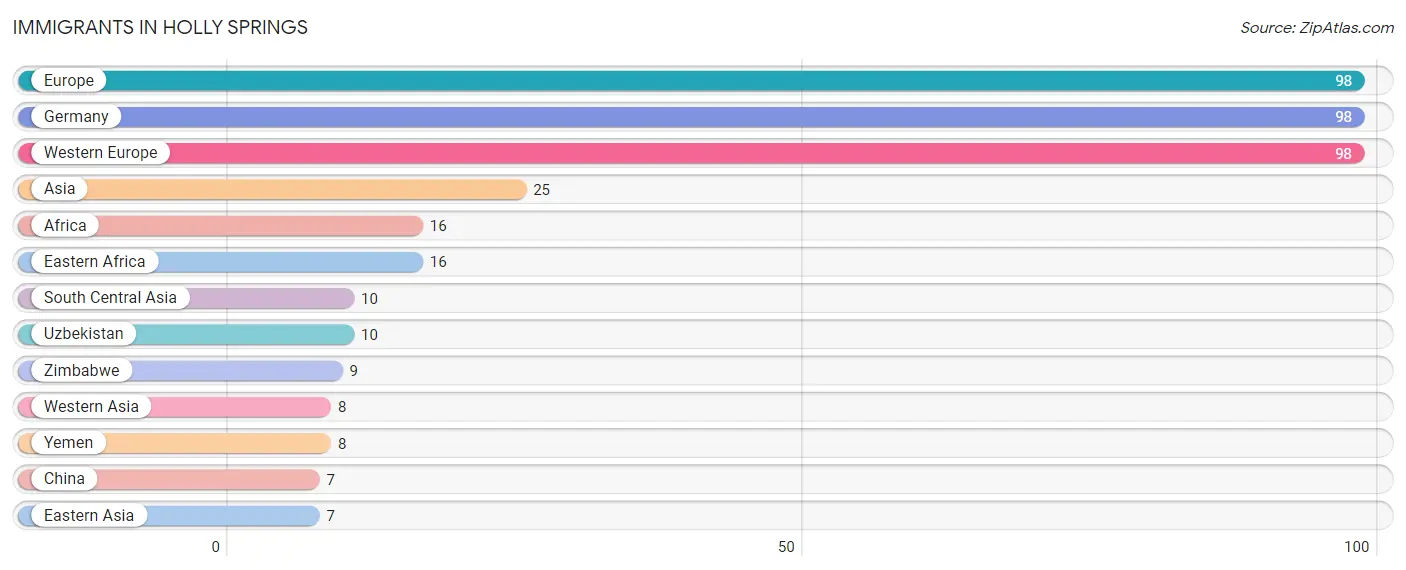
The most numerous immigrant groups reported in Holly Springs came from Europe (98 | 1.4%), Germany (98 | 1.4%), Western Europe (98 | 1.4%), Asia (25 | 0.4%), and Africa (16 | 0.2%), together accounting for 4.8% of all Holly Springs residents.
| Immigration Origin | # Population | % Population |
| Africa | 16 | 0.2% |
| Asia | 25 | 0.4% |
| China | 7 | 0.1% |
| Eastern Africa | 16 | 0.2% |
| Eastern Asia | 7 | 0.1% |
| Europe | 98 | 1.4% |
| Germany | 98 | 1.4% |
| South Central Asia | 10 | 0.1% |
| Uzbekistan | 10 | 0.1% |
| Western Asia | 8 | 0.1% |
| Western Europe | 98 | 1.4% |
| Yemen | 8 | 0.1% |
| Zimbabwe | 9 | 0.1% | View All 13 Rows |
Sex and Age in Holly Springs
Sex and Age in Holly Springs
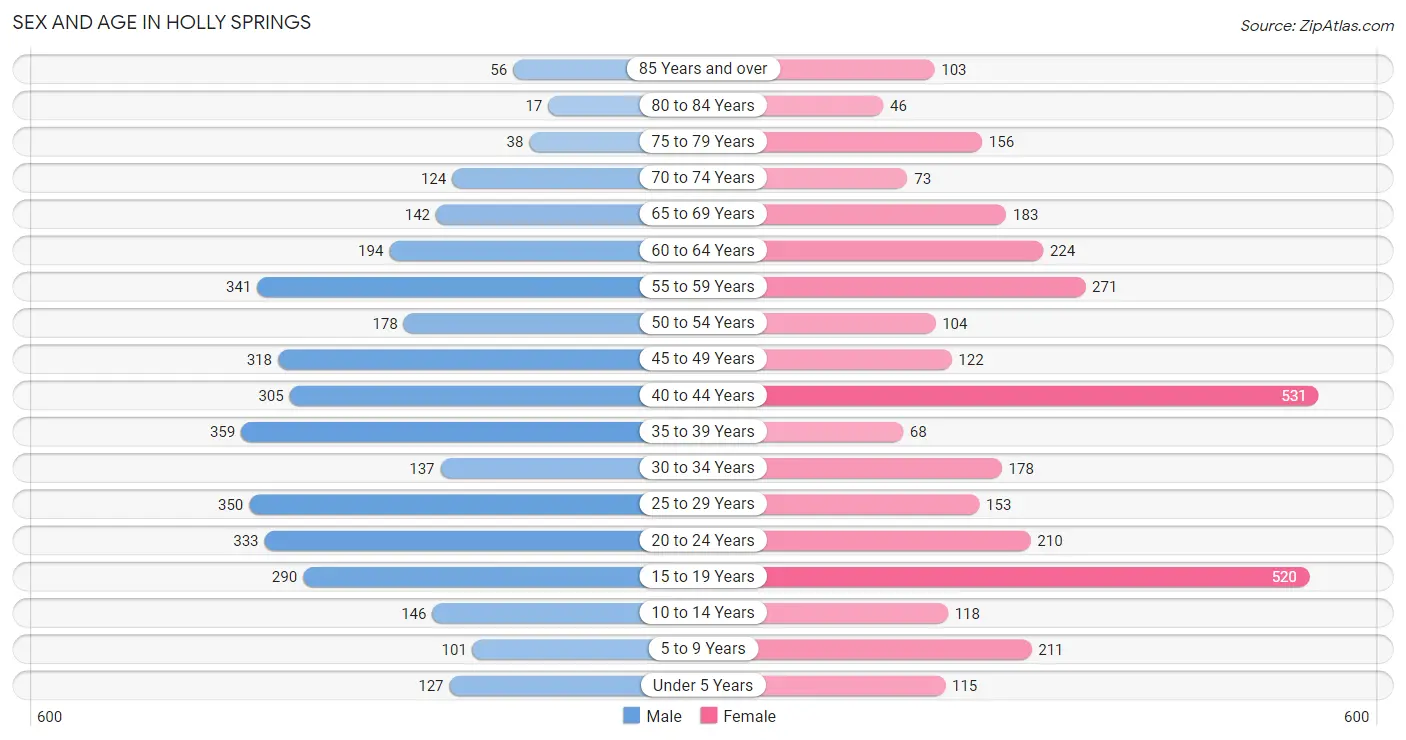
The most populous age groups in Holly Springs are 35 to 39 Years (359 | 10.1%) for men and 40 to 44 Years (531 | 15.7%) for women.
| Age Bracket | Male | Female |
| Under 5 Years | 127 (3.6%) | 115 (3.4%) |
| 5 to 9 Years | 101 (2.8%) | 211 (6.2%) |
| 10 to 14 Years | 146 (4.1%) | 118 (3.5%) |
| 15 to 19 Years | 290 (8.2%) | 520 (15.4%) |
| 20 to 24 Years | 333 (9.4%) | 210 (6.2%) |
| 25 to 29 Years | 350 (9.8%) | 153 (4.5%) |
| 30 to 34 Years | 137 (3.8%) | 178 (5.3%) |
| 35 to 39 Years | 359 (10.1%) | 68 (2.0%) |
| 40 to 44 Years | 305 (8.6%) | 531 (15.7%) |
| 45 to 49 Years | 318 (8.9%) | 122 (3.6%) |
| 50 to 54 Years | 178 (5.0%) | 104 (3.1%) |
| 55 to 59 Years | 341 (9.6%) | 271 (8.0%) |
| 60 to 64 Years | 194 (5.5%) | 224 (6.6%) |
| 65 to 69 Years | 142 (4.0%) | 183 (5.4%) |
| 70 to 74 Years | 124 (3.5%) | 73 (2.2%) |
| 75 to 79 Years | 38 (1.1%) | 156 (4.6%) |
| 80 to 84 Years | 17 (0.5%) | 46 (1.4%) |
| 85 Years and over | 56 (1.6%) | 103 (3.0%) |
| Total | 3,556 (100.0%) | 3,386 (100.0%) |
Families and Households in Holly Springs
Median Family Size in Holly Springs
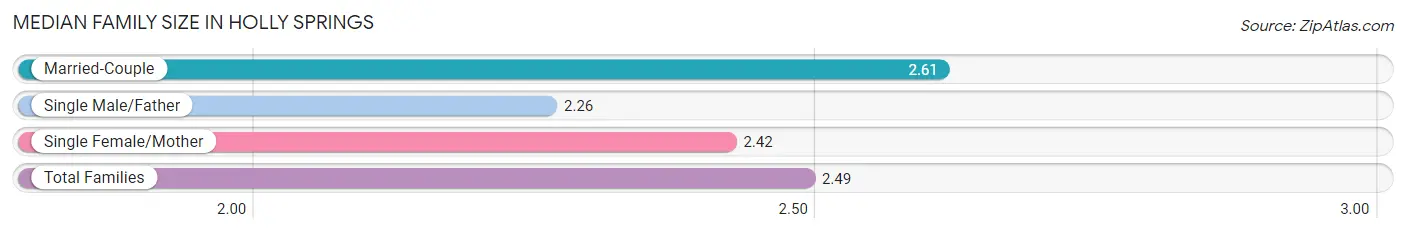
The median family size in Holly Springs is 2.49 persons per family, with married-couple families (587 | 38.1%) accounting for the largest median family size of 2.61 persons per family. On the other hand, single male/father families (57 | 3.7%) represent the smallest median family size with 2.26 persons per family.
| Family Type | # Families | Family Size |
| Married-Couple | 587 (38.1%) | 2.61 |
| Single Male/Father | 57 (3.7%) | 2.26 |
| Single Female/Mother | 895 (58.2%) | 2.42 |
| Total Families | 1,539 (100.0%) | 2.49 |
Median Household Size in Holly Springs
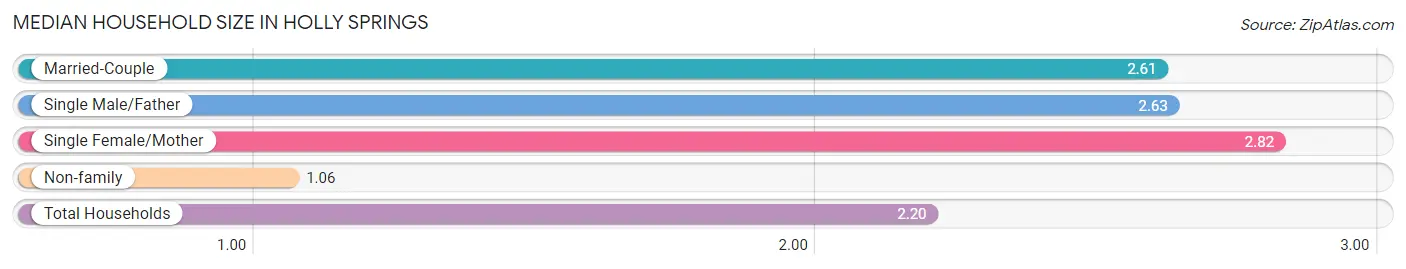
The median household size in Holly Springs is 2.20 persons per household, with single female/mother households (895 | 39.6%) accounting for the largest median household size of 2.82 persons per household. non-family households (721 | 31.9%) represent the smallest median household size with 1.06 persons per household.
| Household Type | # Households | Household Size |
| Married-Couple | 587 (26.0%) | 2.61 |
| Single Male/Father | 57 (2.5%) | 2.63 |
| Single Female/Mother | 895 (39.6%) | 2.82 |
| Non-family | 721 (31.9%) | 1.06 |
| Total Households | 2,260 (100.0%) | 2.20 |
Household Size by Marriage Status in Holly Springs
Out of a total of 2,260 households in Holly Springs, 1,539 (68.1%) are family households, while 721 (31.9%) are nonfamily households. The most numerous type of family households are 2-person households, comprising 654, and the most common type of nonfamily households are 1-person households, comprising 641.
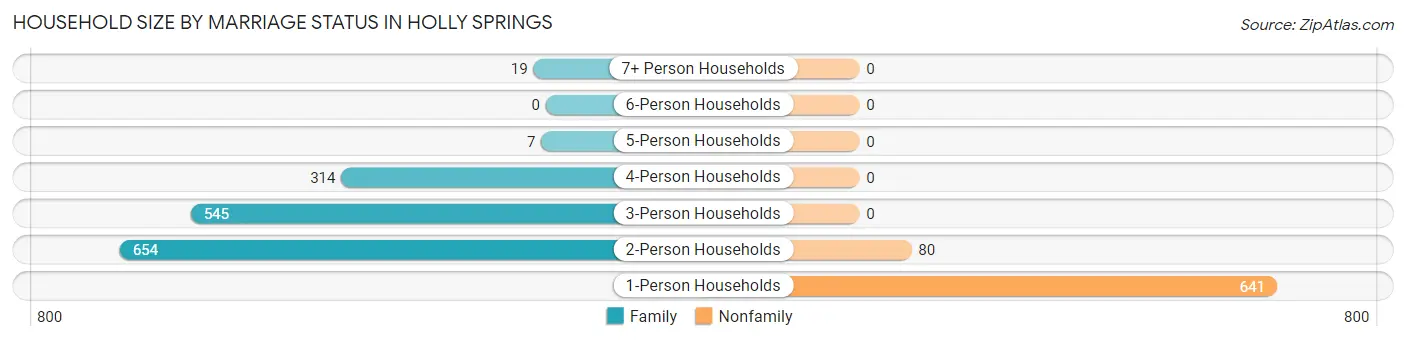
| Household Size | Family Households | Nonfamily Households |
| 1-Person Households | - | 641 (28.4%) |
| 2-Person Households | 654 (28.9%) | 80 (3.5%) |
| 3-Person Households | 545 (24.1%) | 0 (0.0%) |
| 4-Person Households | 314 (13.9%) | 0 (0.0%) |
| 5-Person Households | 7 (0.3%) | 0 (0.0%) |
| 6-Person Households | 0 (0.0%) | 0 (0.0%) |
| 7+ Person Households | 19 (0.8%) | 0 (0.0%) |
| Total | 1,539 (68.1%) | 721 (31.9%) |
Female Fertility in Holly Springs
Fertility by Age in Holly Springs
Average fertility rate in Holly Springs is 57.0 births per 1,000 women. Women in the age bracket of 20 to 34 years have the highest fertility rate with 131.0 births per 1,000 women. Women in the age bracket of 20 to 34 years acount for 70.3% of all women with births.
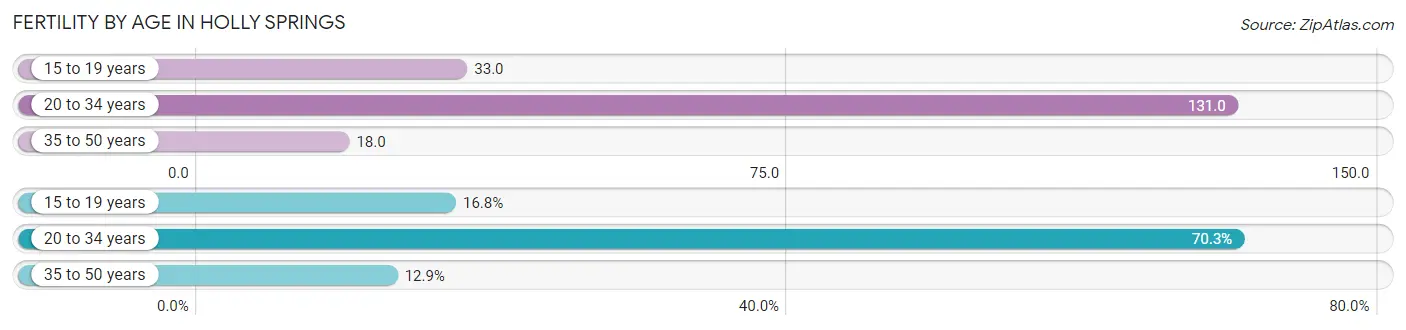
| Age Bracket | Women with Births | Births / 1,000 Women |
| 15 to 19 years | 17 (16.8%) | 33.0 |
| 20 to 34 years | 71 (70.3%) | 131.0 |
| 35 to 50 years | 13 (12.9%) | 18.0 |
| Total | 101 (100.0%) | 57.0 |
Fertility by Age by Marriage Status in Holly Springs
7.9% of women with births (101) in Holly Springs are married. The highest percentage of unmarried women with births falls into 15 to 19 years age bracket with 100.0% of them unmarried at the time of birth, while the lowest percentage of unmarried women with births belong to 20 to 34 years age bracket with 88.7% of them unmarried.
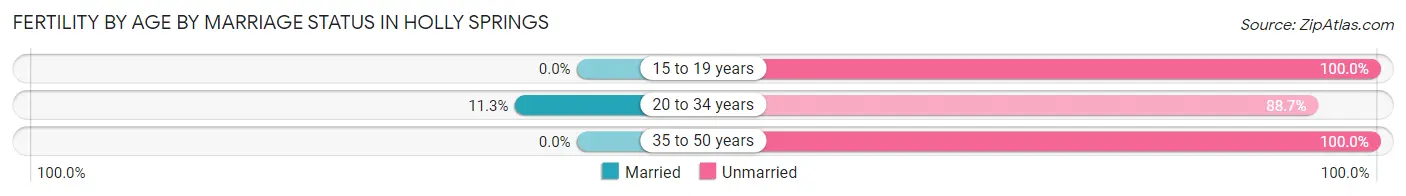
| Age Bracket | Married | Unmarried |
| 15 to 19 years | 0 (0.0%) | 17 (100.0%) |
| 20 to 34 years | 8 (11.3%) | 63 (88.7%) |
| 35 to 50 years | 0 (0.0%) | 13 (100.0%) |
| Total | 8 (7.9%) | 93 (92.1%) |
Fertility by Education in Holly Springs
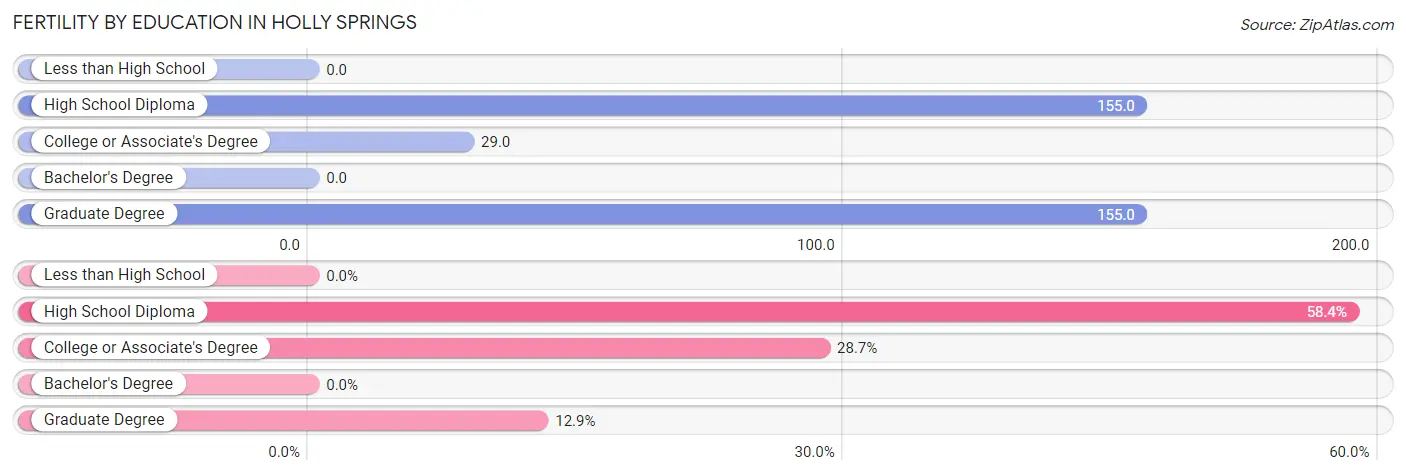
| Educational Attainment | Women with Births | Births / 1,000 Women |
| Less than High School | 0 (0.0%) | 0.0 |
| High School Diploma | 59 (58.4%) | 155.0 |
| College or Associate's Degree | 29 (28.7%) | 29.0 |
| Bachelor's Degree | 0 (0.0%) | 0.0 |
| Graduate Degree | 13 (12.9%) | 155.0 |
| Total | 101 (100.0%) | 57.0 |
Fertility by Education by Marriage Status in Holly Springs
92.1% of women with births in Holly Springs are unmarried. Women with the educational attainment of high school diploma are most likely to be married with 13.6% of them married at childbirth, while women with the educational attainment of college or associate's degree are least likely to be married with 100.0% of them unmarried at childbirth.
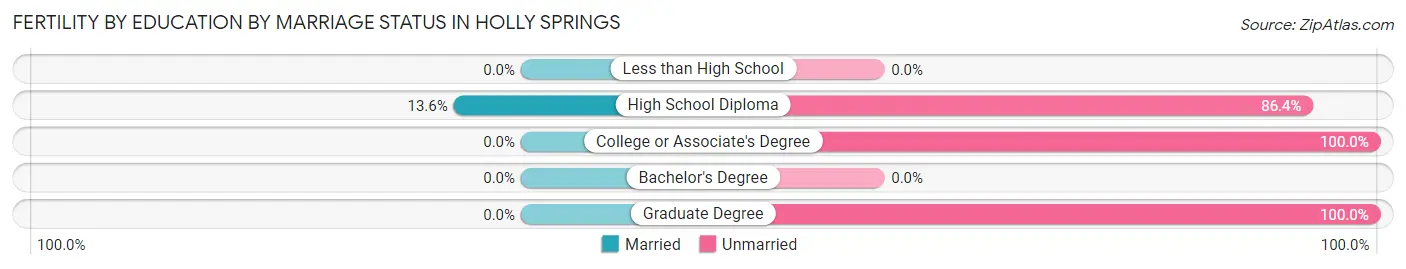
| Educational Attainment | Married | Unmarried |
| Less than High School | 0 (0.0%) | 0 (0.0%) |
| High School Diploma | 8 (13.6%) | 51 (86.4%) |
| College or Associate's Degree | 0 (0.0%) | 29 (100.0%) |
| Bachelor's Degree | 0 (0.0%) | 0 (0.0%) |
| Graduate Degree | 0 (0.0%) | 13 (100.0%) |
| Total | 8 (7.9%) | 93 (92.1%) |
Employment Characteristics in Holly Springs
Employment by Class of Employer in Holly Springs
Among the 2,549 employed individuals in Holly Springs, private company employees (1,662 | 65.2%), local government employees (412 | 16.2%), and not-for-profit organizations (286 | 11.2%) make up the most common classes of employment.
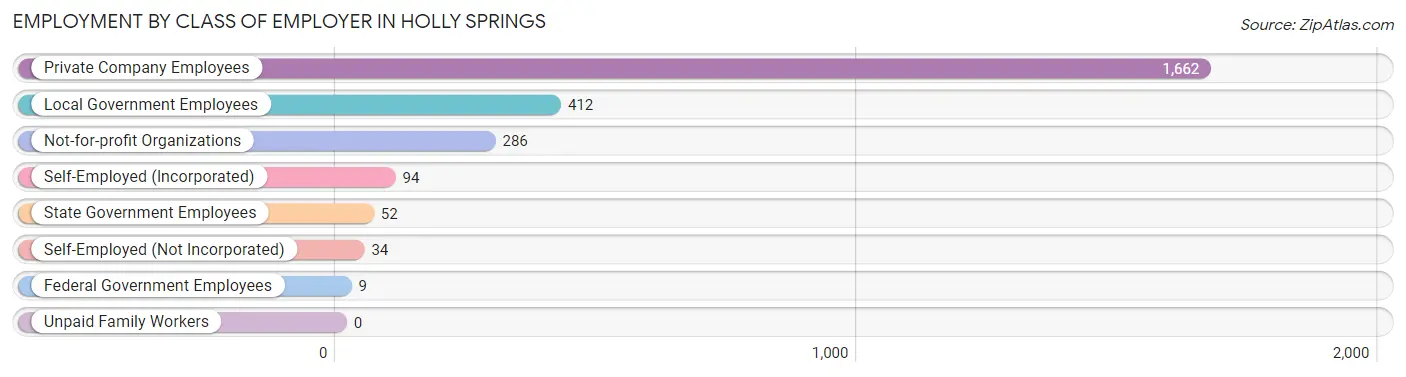
| Employer Class | # Employees | % Employees |
| Private Company Employees | 1,662 | 65.2% |
| Self-Employed (Incorporated) | 94 | 3.7% |
| Self-Employed (Not Incorporated) | 34 | 1.3% |
| Not-for-profit Organizations | 286 | 11.2% |
| Local Government Employees | 412 | 16.2% |
| State Government Employees | 52 | 2.0% |
| Federal Government Employees | 9 | 0.4% |
| Unpaid Family Workers | 0 | 0.0% |
| Total | 2,549 | 100.0% |
Employment Status by Age in Holly Springs
According to the labor force statistics for Holly Springs, out of the total population over 16 years of age (6,101), 45.5% or 2,776 individuals are in the labor force, with 7.9% or 219 of them unemployed. The age group with the highest labor force participation rate is 30 to 34 years, with 68.6% or 216 individuals in the labor force. Within the labor force, the 75 years and over age range has the highest percentage of unemployed individuals, with 46.7% or 14 of them being unemployed.
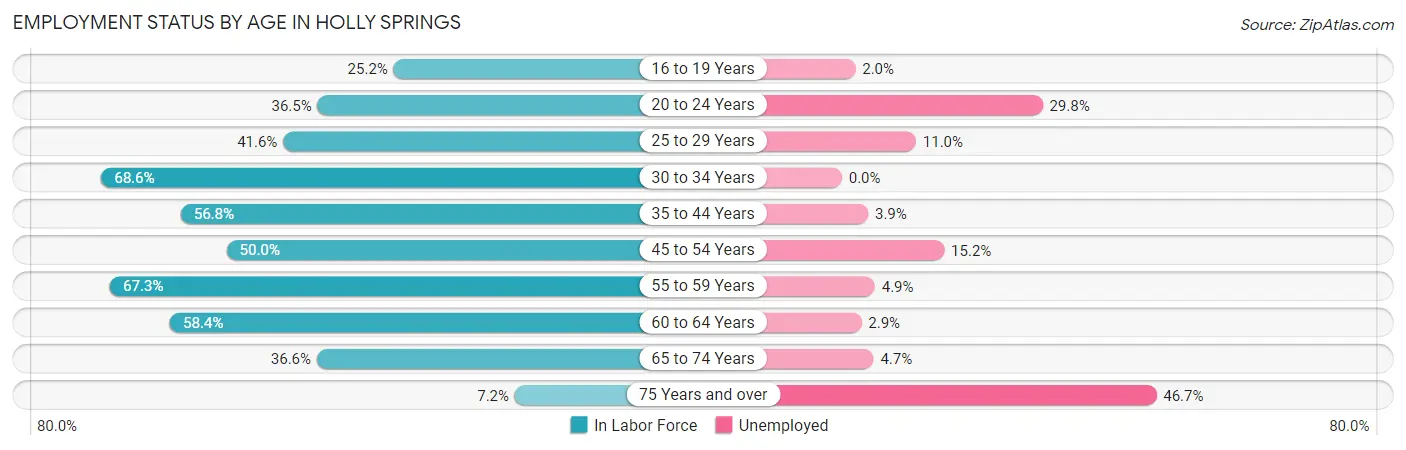
| Age Bracket | In Labor Force | Unemployed |
| 16 to 19 Years | 198 (25.2%) | 4 (2.0%) |
| 20 to 24 Years | 198 (36.5%) | 59 (29.8%) |
| 25 to 29 Years | 209 (41.6%) | 23 (11.0%) |
| 30 to 34 Years | 216 (68.6%) | 0 (0.0%) |
| 35 to 44 Years | 717 (56.8%) | 28 (3.9%) |
| 45 to 54 Years | 361 (50.0%) | 55 (15.2%) |
| 55 to 59 Years | 412 (67.3%) | 20 (4.9%) |
| 60 to 64 Years | 244 (58.4%) | 7 (2.9%) |
| 65 to 74 Years | 191 (36.6%) | 9 (4.7%) |
| 75 Years and over | 30 (7.2%) | 14 (46.7%) |
| Total | 2,776 (45.5%) | 219 (7.9%) |
Employment Status by Educational Attainment in Holly Springs
According to labor force statistics for Holly Springs, 56.4% of individuals (2,162) out of the total population between 25 and 64 years of age (3,833) are in the labor force, with 6.2% or 134 of them being unemployed. The group with the highest labor force participation rate are those with the educational attainment of college / associate degree, with 74.2% or 959 individuals in the labor force. Within the labor force, individuals with high school diploma education have the highest percentage of unemployment, with 8.7% or 65 of them being unemployed.
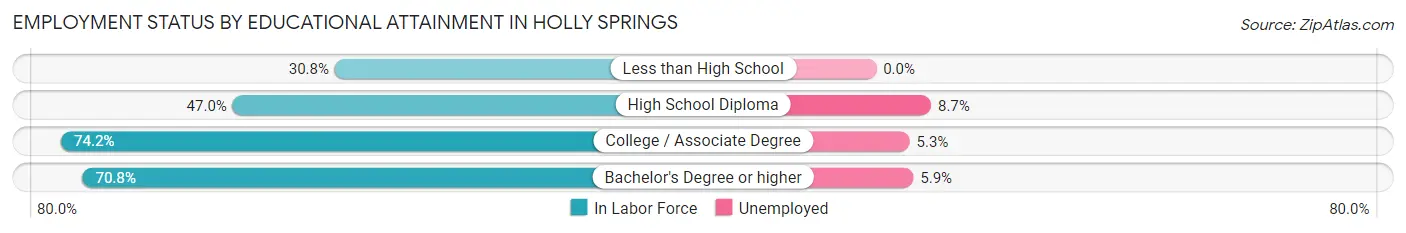
| Educational Attainment | In Labor Force | Unemployed |
| Less than High School | 169 (30.8%) | 0 (0.0%) |
| High School Diploma | 744 (47.0%) | 138 (8.7%) |
| College / Associate Degree | 959 (74.2%) | 69 (5.3%) |
| Bachelor's Degree or higher | 288 (70.8%) | 24 (5.9%) |
| Total | 2,162 (56.4%) | 238 (6.2%) |
Employment Occupations by Sex in Holly Springs
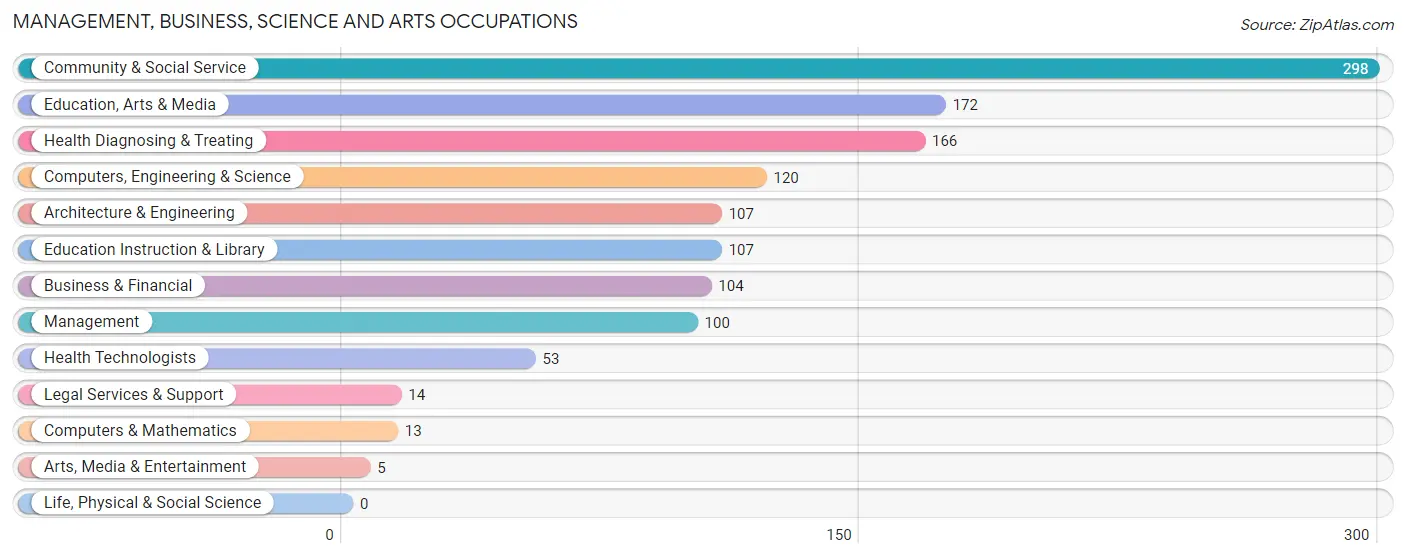
Management, Business, Science and Arts Occupations
The most common Management, Business, Science and Arts occupations in Holly Springs are Community & Social Service (298 | 11.7%), Education, Arts & Media (172 | 6.7%), Health Diagnosing & Treating (166 | 6.5%), Computers, Engineering & Science (120 | 4.7%), and Architecture & Engineering (107 | 4.2%).
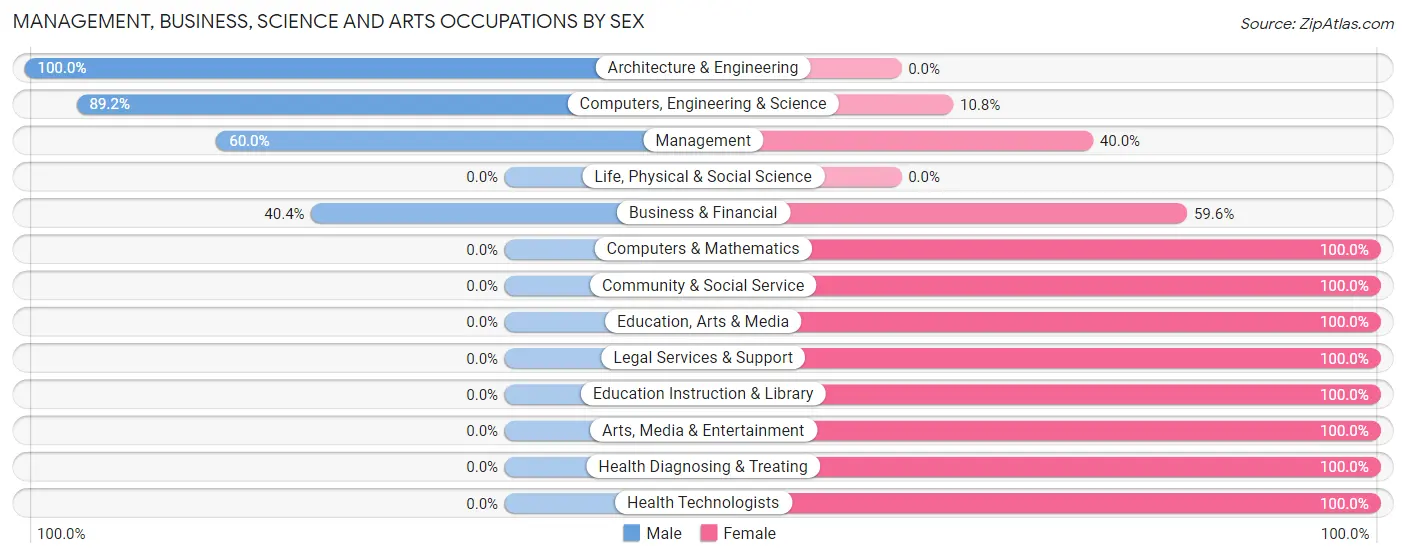
Management, Business, Science and Arts Occupations by Sex
Within the Management, Business, Science and Arts occupations in Holly Springs, the most male-oriented occupations are Architecture & Engineering (100.0%), Computers, Engineering & Science (89.2%), and Management (60.0%), while the most female-oriented occupations are Computers & Mathematics (100.0%), Community & Social Service (100.0%), and Education, Arts & Media (100.0%).
| Occupation | Male | Female |
| Management | 60 (60.0%) | 40 (40.0%) |
| Business & Financial | 42 (40.4%) | 62 (59.6%) |
| Computers, Engineering & Science | 107 (89.2%) | 13 (10.8%) |
| Computers & Mathematics | 0 (0.0%) | 13 (100.0%) |
| Architecture & Engineering | 107 (100.0%) | 0 (0.0%) |
| Life, Physical & Social Science | 0 (0.0%) | 0 (0.0%) |
| Community & Social Service | 0 (0.0%) | 298 (100.0%) |
| Education, Arts & Media | 0 (0.0%) | 172 (100.0%) |
| Legal Services & Support | 0 (0.0%) | 14 (100.0%) |
| Education Instruction & Library | 0 (0.0%) | 107 (100.0%) |
| Arts, Media & Entertainment | 0 (0.0%) | 5 (100.0%) |
| Health Diagnosing & Treating | 0 (0.0%) | 166 (100.0%) |
| Health Technologists | 0 (0.0%) | 53 (100.0%) |
| Total (Category) | 209 (26.5%) | 579 (73.5%) |
| Total (Overall) | 963 (37.7%) | 1,595 (62.4%) |
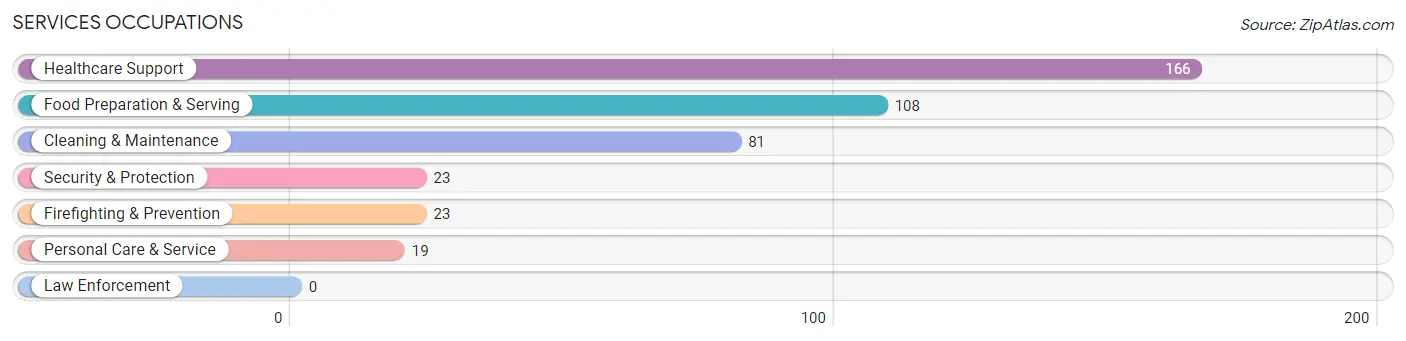
Services Occupations
The most common Services occupations in Holly Springs are Healthcare Support (166 | 6.5%), Food Preparation & Serving (108 | 4.2%), Cleaning & Maintenance (81 | 3.2%), Security & Protection (23 | 0.9%), and Firefighting & Prevention (23 | 0.9%).
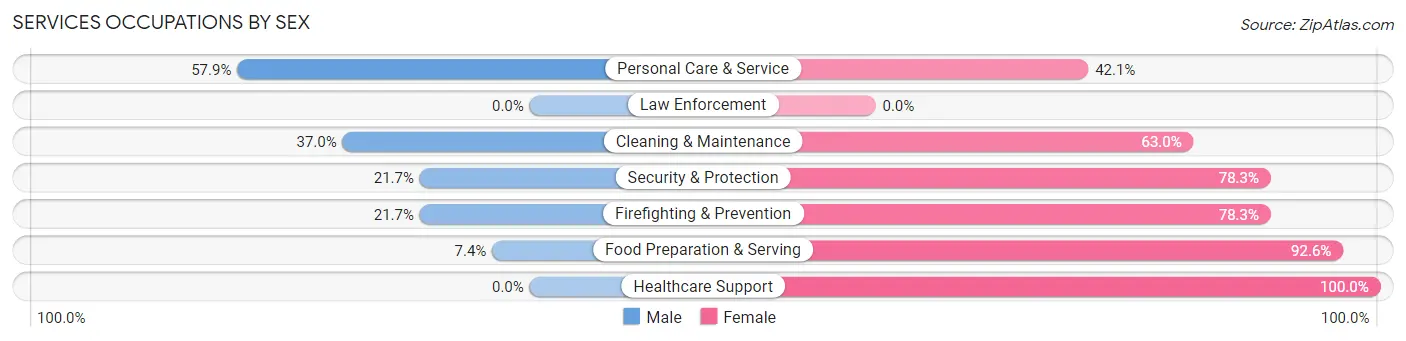
Services Occupations by Sex
Within the Services occupations in Holly Springs, the most male-oriented occupations are Personal Care & Service (57.9%), Cleaning & Maintenance (37.0%), and Security & Protection (21.7%), while the most female-oriented occupations are Healthcare Support (100.0%), Food Preparation & Serving (92.6%), and Security & Protection (78.3%).
| Occupation | Male | Female |
| Healthcare Support | 0 (0.0%) | 166 (100.0%) |
| Security & Protection | 5 (21.7%) | 18 (78.3%) |
| Firefighting & Prevention | 5 (21.7%) | 18 (78.3%) |
| Law Enforcement | 0 (0.0%) | 0 (0.0%) |
| Food Preparation & Serving | 8 (7.4%) | 100 (92.6%) |
| Cleaning & Maintenance | 30 (37.0%) | 51 (63.0%) |
| Personal Care & Service | 11 (57.9%) | 8 (42.1%) |
| Total (Category) | 54 (13.6%) | 343 (86.4%) |
| Total (Overall) | 963 (37.7%) | 1,595 (62.4%) |
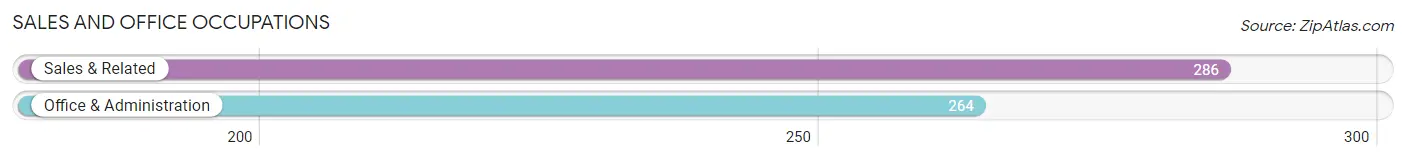
Sales and Office Occupations
The most common Sales and Office occupations in Holly Springs are Sales & Related (286 | 11.2%), and Office & Administration (264 | 10.3%).
Sales and Office Occupations by Sex
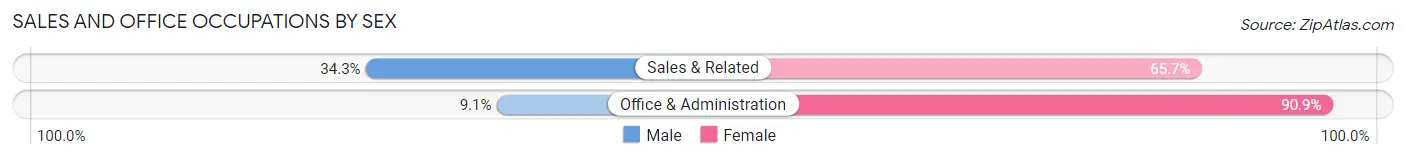
| Occupation | Male | Female |
| Sales & Related | 98 (34.3%) | 188 (65.7%) |
| Office & Administration | 24 (9.1%) | 240 (90.9%) |
| Total (Category) | 122 (22.2%) | 428 (77.8%) |
| Total (Overall) | 963 (37.7%) | 1,595 (62.4%) |
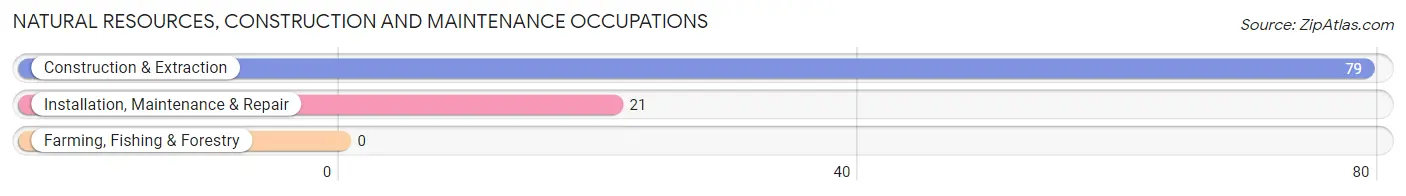
Natural Resources, Construction and Maintenance Occupations
The most common Natural Resources, Construction and Maintenance occupations in Holly Springs are Construction & Extraction (79 | 3.1%), and Installation, Maintenance & Repair (21 | 0.8%).
Natural Resources, Construction and Maintenance Occupations by Sex
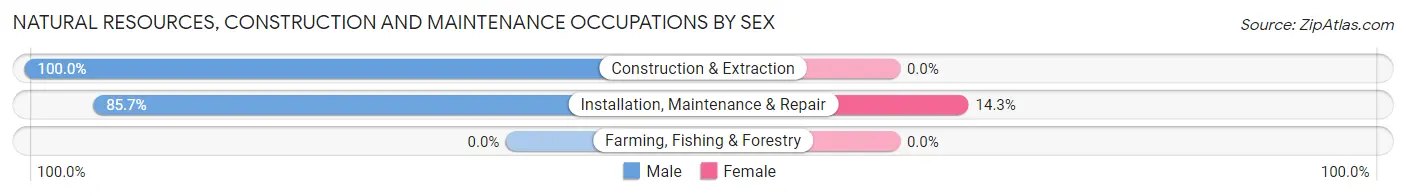
| Occupation | Male | Female |
| Farming, Fishing & Forestry | 0 (0.0%) | 0 (0.0%) |
| Construction & Extraction | 79 (100.0%) | 0 (0.0%) |
| Installation, Maintenance & Repair | 18 (85.7%) | 3 (14.3%) |
| Total (Category) | 97 (97.0%) | 3 (3.0%) |
| Total (Overall) | 963 (37.7%) | 1,595 (62.4%) |
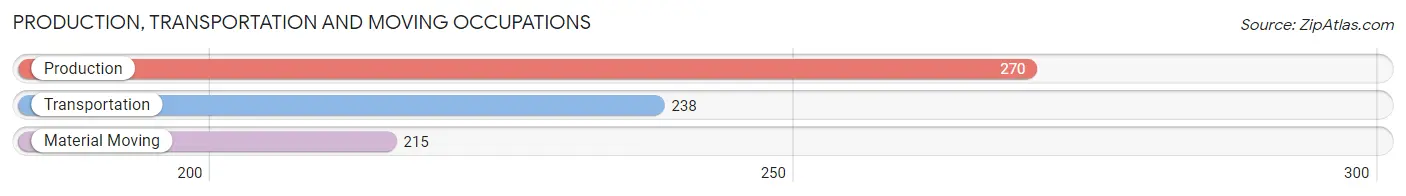
Production, Transportation and Moving Occupations
The most common Production, Transportation and Moving occupations in Holly Springs are Production (270 | 10.6%), Transportation (238 | 9.3%), and Material Moving (215 | 8.4%).
Production, Transportation and Moving Occupations by Sex
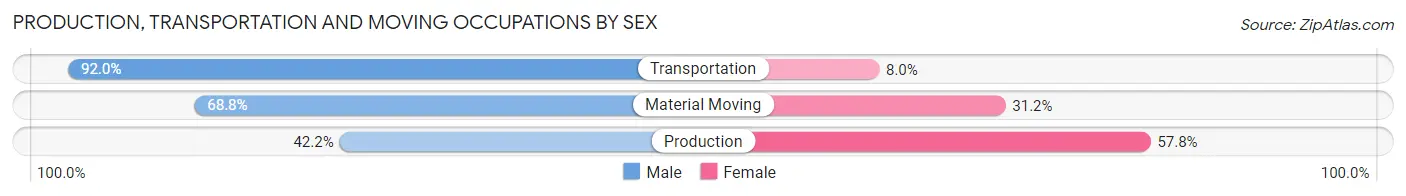
| Occupation | Male | Female |
| Production | 114 (42.2%) | 156 (57.8%) |
| Transportation | 219 (92.0%) | 19 (8.0%) |
| Material Moving | 148 (68.8%) | 67 (31.2%) |
| Total (Category) | 481 (66.5%) | 242 (33.5%) |
| Total (Overall) | 963 (37.7%) | 1,595 (62.4%) |
Employment Industries by Sex in Holly Springs
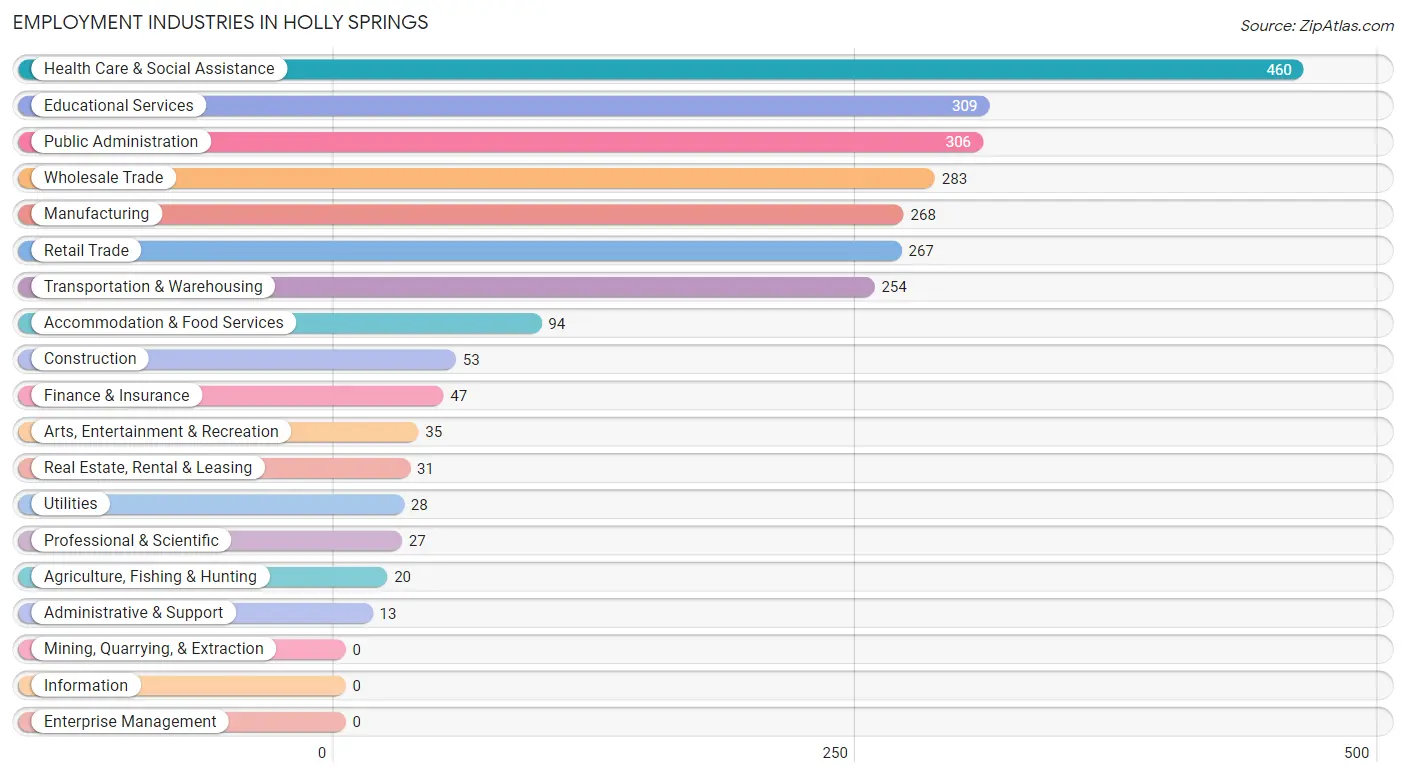
Employment Industries in Holly Springs
The major employment industries in Holly Springs include Health Care & Social Assistance (460 | 18.0%), Educational Services (309 | 12.1%), Public Administration (306 | 12.0%), Wholesale Trade (283 | 11.1%), and Manufacturing (268 | 10.5%).
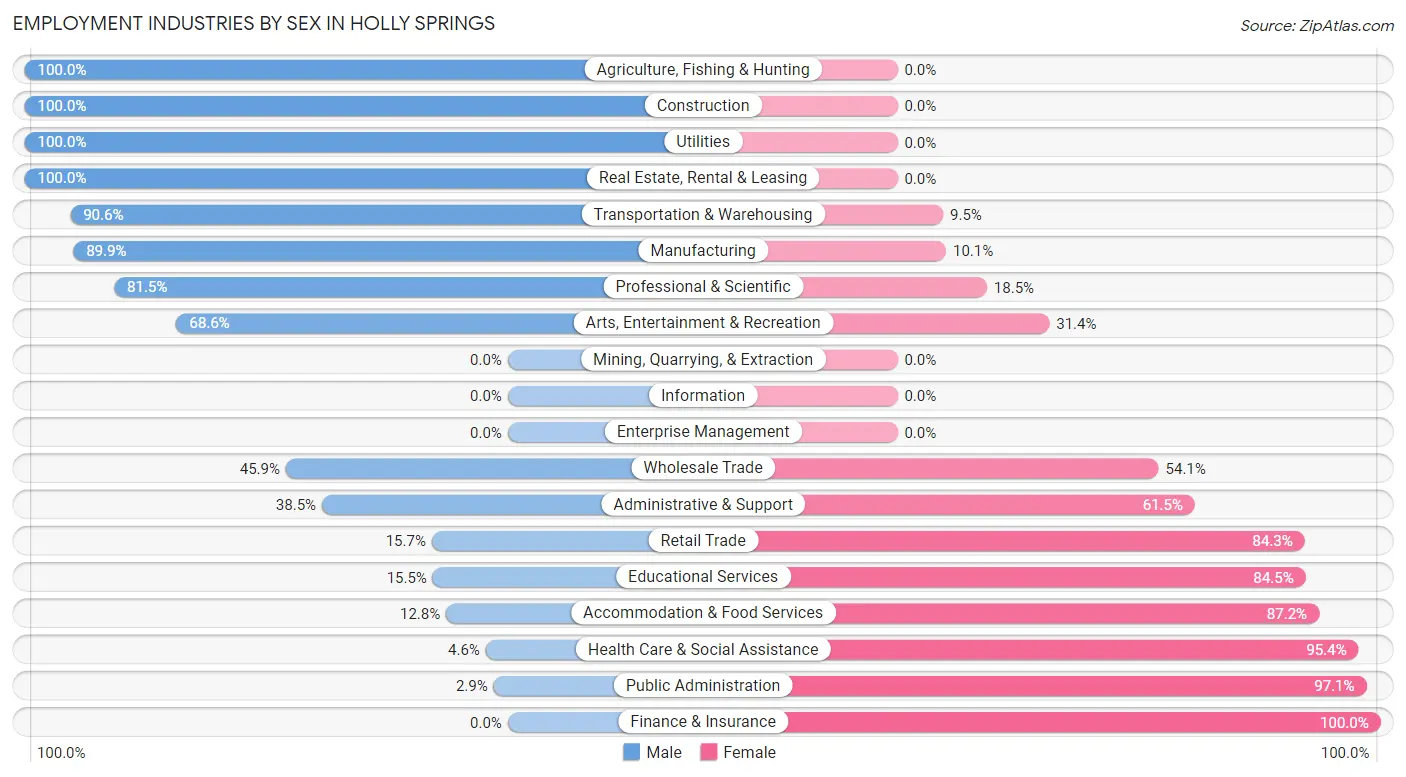
Employment Industries by Sex in Holly Springs
The Holly Springs industries that see more men than women are Agriculture, Fishing & Hunting (100.0%), Construction (100.0%), and Utilities (100.0%), whereas the industries that tend to have a higher number of women are Finance & Insurance (100.0%), Public Administration (97.1%), and Health Care & Social Assistance (95.4%).
| Industry | Male | Female |
| Agriculture, Fishing & Hunting | 20 (100.0%) | 0 (0.0%) |
| Mining, Quarrying, & Extraction | 0 (0.0%) | 0 (0.0%) |
| Construction | 53 (100.0%) | 0 (0.0%) |
| Manufacturing | 241 (89.9%) | 27 (10.1%) |
| Wholesale Trade | 130 (45.9%) | 153 (54.1%) |
| Retail Trade | 42 (15.7%) | 225 (84.3%) |
| Transportation & Warehousing | 230 (90.5%) | 24 (9.5%) |
| Utilities | 28 (100.0%) | 0 (0.0%) |
| Information | 0 (0.0%) | 0 (0.0%) |
| Finance & Insurance | 0 (0.0%) | 47 (100.0%) |
| Real Estate, Rental & Leasing | 31 (100.0%) | 0 (0.0%) |
| Professional & Scientific | 22 (81.5%) | 5 (18.5%) |
| Enterprise Management | 0 (0.0%) | 0 (0.0%) |
| Administrative & Support | 5 (38.5%) | 8 (61.5%) |
| Educational Services | 48 (15.5%) | 261 (84.5%) |
| Health Care & Social Assistance | 21 (4.6%) | 439 (95.4%) |
| Arts, Entertainment & Recreation | 24 (68.6%) | 11 (31.4%) |
| Accommodation & Food Services | 12 (12.8%) | 82 (87.2%) |
| Public Administration | 9 (2.9%) | 297 (97.1%) |
| Total | 963 (37.7%) | 1,595 (62.4%) |
Education in Holly Springs
School Enrollment in Holly Springs
The most common levels of schooling among the 1,909 students in Holly Springs are college / undergraduate (965 | 50.5%), high school (288 | 15.1%), and middle school (258 | 13.5%).
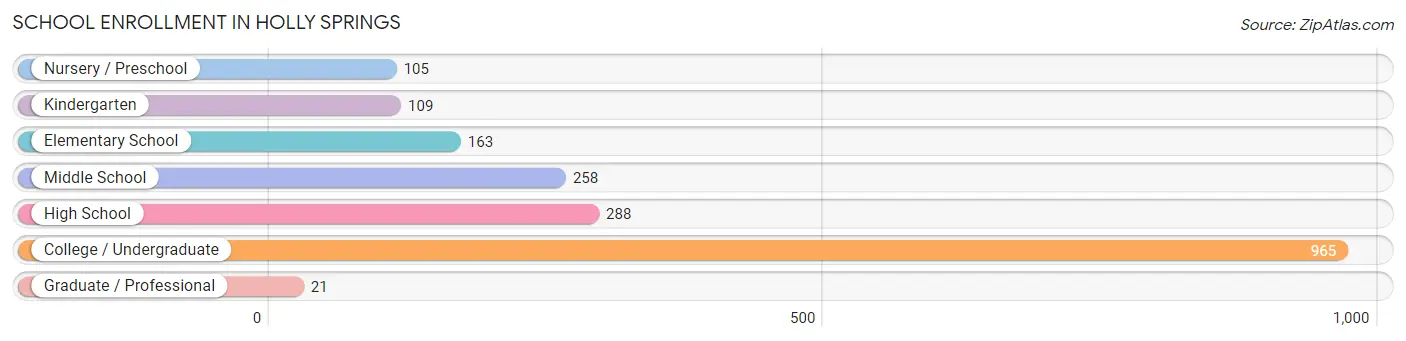
| School Level | # Students | % Students |
| Nursery / Preschool | 105 | 5.5% |
| Kindergarten | 109 | 5.7% |
| Elementary School | 163 | 8.5% |
| Middle School | 258 | 13.5% |
| High School | 288 | 15.1% |
| College / Undergraduate | 965 | 50.5% |
| Graduate / Professional | 21 | 1.1% |
| Total | 1,909 | 100.0% |
School Enrollment by Age by Funding Source in Holly Springs
Out of a total of 1,909 students who are enrolled in schools in Holly Springs, 317 (16.6%) attend a private institution, while the remaining 1,592 (83.4%) are enrolled in public schools. The age group of 25 to 34 year olds has the highest likelihood of being enrolled in private schools, with 62 (35.8% in the age bracket) enrolled. Conversely, the age group of 15 to 17 year olds has the lowest likelihood of being enrolled in a private school, with 181 (100.0% in the age bracket) attending a public institution.
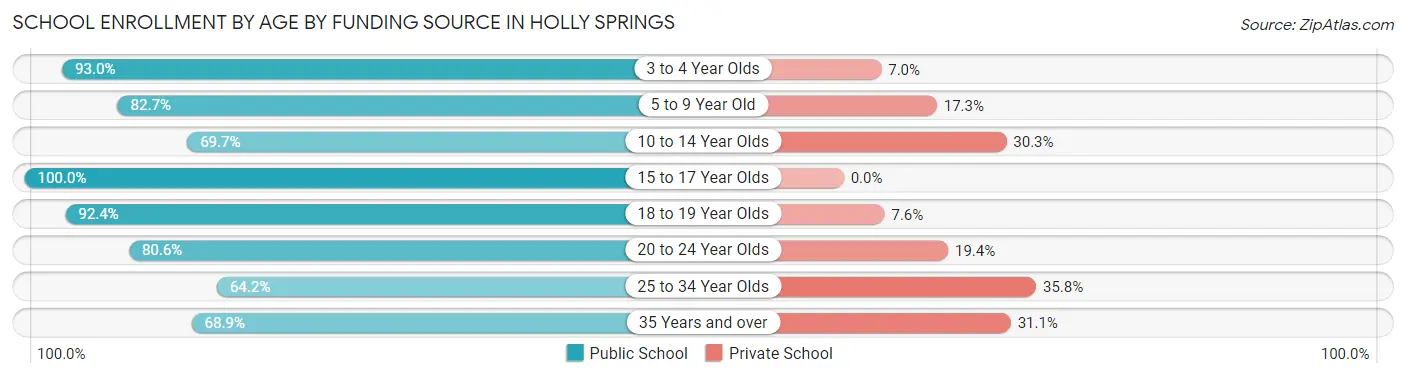
| Age Bracket | Public School | Private School |
| 3 to 4 Year Olds | 93 (93.0%) | 7 (7.0%) |
| 5 to 9 Year Old | 224 (82.7%) | 47 (17.3%) |
| 10 to 14 Year Olds | 184 (69.7%) | 80 (30.3%) |
| 15 to 17 Year Olds | 181 (100.0%) | 0 (0.0%) |
| 18 to 19 Year Olds | 534 (92.4%) | 44 (7.6%) |
| 20 to 24 Year Olds | 203 (80.6%) | 49 (19.4%) |
| 25 to 34 Year Olds | 111 (64.2%) | 62 (35.8%) |
| 35 Years and over | 62 (68.9%) | 28 (31.1%) |
| Total | 1,592 (83.4%) | 317 (16.6%) |
Educational Attainment by Field of Study in Holly Springs
Business (172 | 27.7%), education (116 | 18.7%), arts & humanities (83 | 13.4%), science & technology (61 | 9.8%), and bio, nature & agricultural (51 | 8.2%) are the most common fields of study among 621 individuals in Holly Springs who have obtained a bachelor's degree or higher.
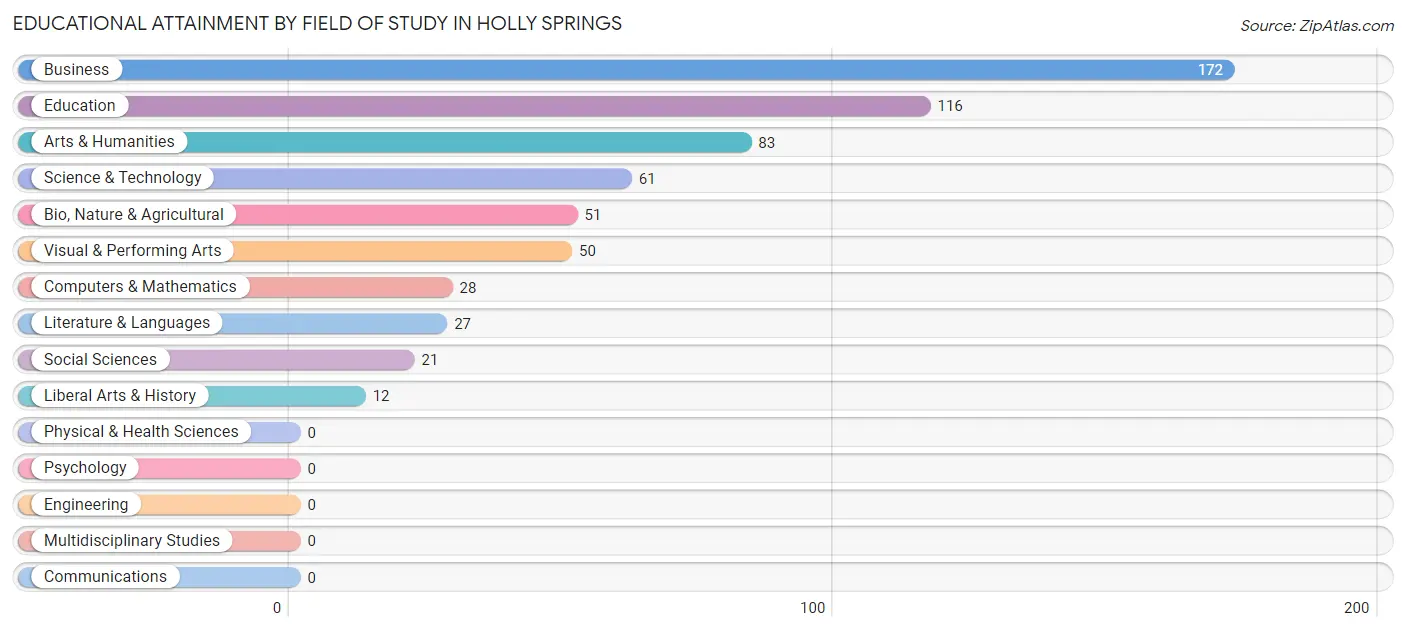
| Field of Study | # Graduates | % Graduates |
| Computers & Mathematics | 28 | 4.5% |
| Bio, Nature & Agricultural | 51 | 8.2% |
| Physical & Health Sciences | 0 | 0.0% |
| Psychology | 0 | 0.0% |
| Social Sciences | 21 | 3.4% |
| Engineering | 0 | 0.0% |
| Multidisciplinary Studies | 0 | 0.0% |
| Science & Technology | 61 | 9.8% |
| Business | 172 | 27.7% |
| Education | 116 | 18.7% |
| Literature & Languages | 27 | 4.3% |
| Liberal Arts & History | 12 | 1.9% |
| Visual & Performing Arts | 50 | 8.1% |
| Communications | 0 | 0.0% |
| Arts & Humanities | 83 | 13.4% |
| Total | 621 | 100.0% |
Transportation & Commute in Holly Springs
Vehicle Availability by Sex in Holly Springs
The most prevalent vehicle ownership categories in Holly Springs are males with 2 vehicles (287, accounting for 31.1%) and females with 2 vehicles (547, making up 18.9%).
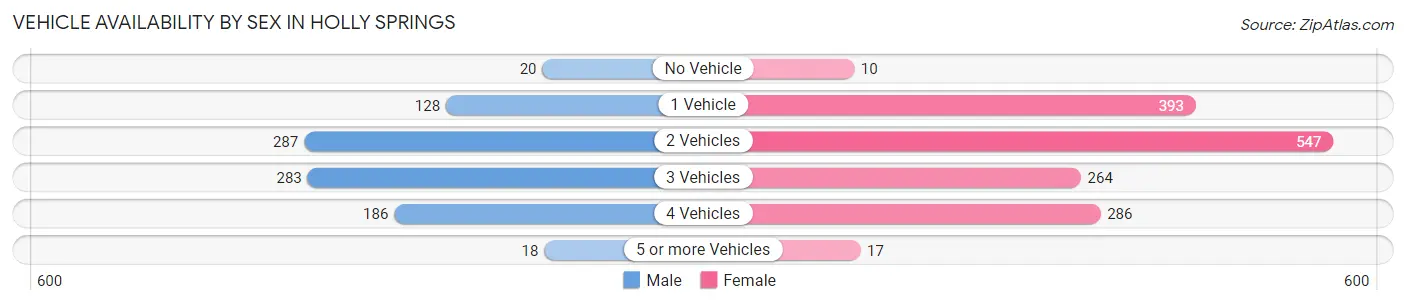
| Vehicles Available | Male | Female |
| No Vehicle | 20 (2.2%) | 10 (0.7%) |
| 1 Vehicle | 128 (13.9%) | 393 (25.9%) |
| 2 Vehicles | 287 (31.1%) | 547 (36.1%) |
| 3 Vehicles | 283 (30.7%) | 264 (17.4%) |
| 4 Vehicles | 186 (20.2%) | 286 (18.9%) |
| 5 or more Vehicles | 18 (1.9%) | 17 (1.1%) |
| Total | 922 (100.0%) | 1,517 (100.0%) |
Commute Time in Holly Springs
The most frequently occuring commute durations in Holly Springs are 30 to 34 minutes (620 commuters, 24.7%), 5 to 9 minutes (493 commuters, 19.6%), and 10 to 14 minutes (390 commuters, 15.5%).
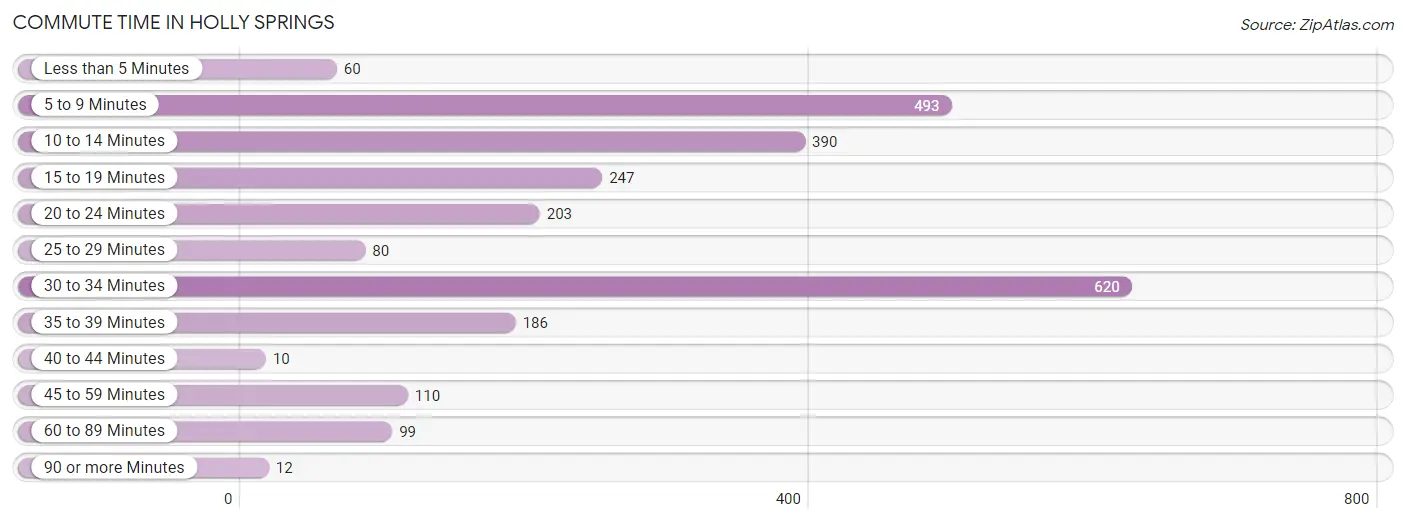
| Commute Time | # Commuters | % Commuters |
| Less than 5 Minutes | 60 | 2.4% |
| 5 to 9 Minutes | 493 | 19.6% |
| 10 to 14 Minutes | 390 | 15.5% |
| 15 to 19 Minutes | 247 | 9.8% |
| 20 to 24 Minutes | 203 | 8.1% |
| 25 to 29 Minutes | 80 | 3.2% |
| 30 to 34 Minutes | 620 | 24.7% |
| 35 to 39 Minutes | 186 | 7.4% |
| 40 to 44 Minutes | 10 | 0.4% |
| 45 to 59 Minutes | 110 | 4.4% |
| 60 to 89 Minutes | 99 | 3.9% |
| 90 or more Minutes | 12 | 0.5% |
Commute Time by Sex in Holly Springs
The most common commute times in Holly Springs are 30 to 34 minutes (225 commuters, 23.7%) for males and 30 to 34 minutes (395 commuters, 25.3%) for females.
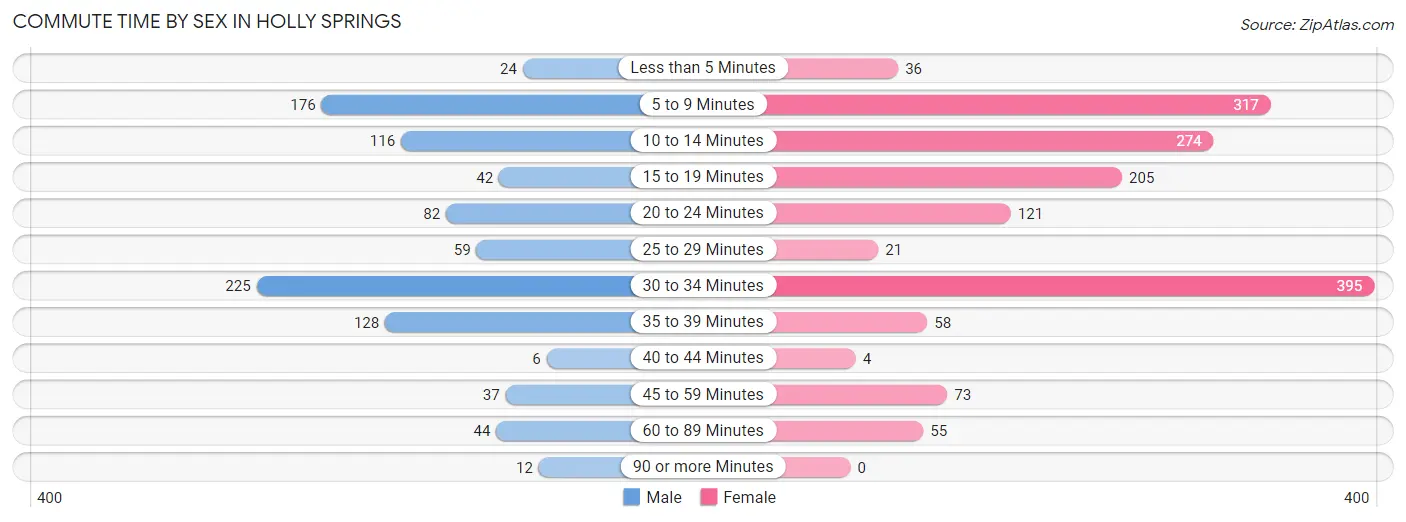
| Commute Time | Male | Female |
| Less than 5 Minutes | 24 (2.5%) | 36 (2.3%) |
| 5 to 9 Minutes | 176 (18.5%) | 317 (20.3%) |
| 10 to 14 Minutes | 116 (12.2%) | 274 (17.6%) |
| 15 to 19 Minutes | 42 (4.4%) | 205 (13.2%) |
| 20 to 24 Minutes | 82 (8.6%) | 121 (7.8%) |
| 25 to 29 Minutes | 59 (6.2%) | 21 (1.3%) |
| 30 to 34 Minutes | 225 (23.7%) | 395 (25.3%) |
| 35 to 39 Minutes | 128 (13.5%) | 58 (3.7%) |
| 40 to 44 Minutes | 6 (0.6%) | 4 (0.3%) |
| 45 to 59 Minutes | 37 (3.9%) | 73 (4.7%) |
| 60 to 89 Minutes | 44 (4.6%) | 55 (3.5%) |
| 90 or more Minutes | 12 (1.3%) | 0 (0.0%) |
Time of Departure to Work by Sex in Holly Springs
The most frequent times of departure to work in Holly Springs are 6:00 AM to 6:29 AM (453, 47.6%) for males and 7:30 AM to 7:59 AM (324, 20.8%) for females.
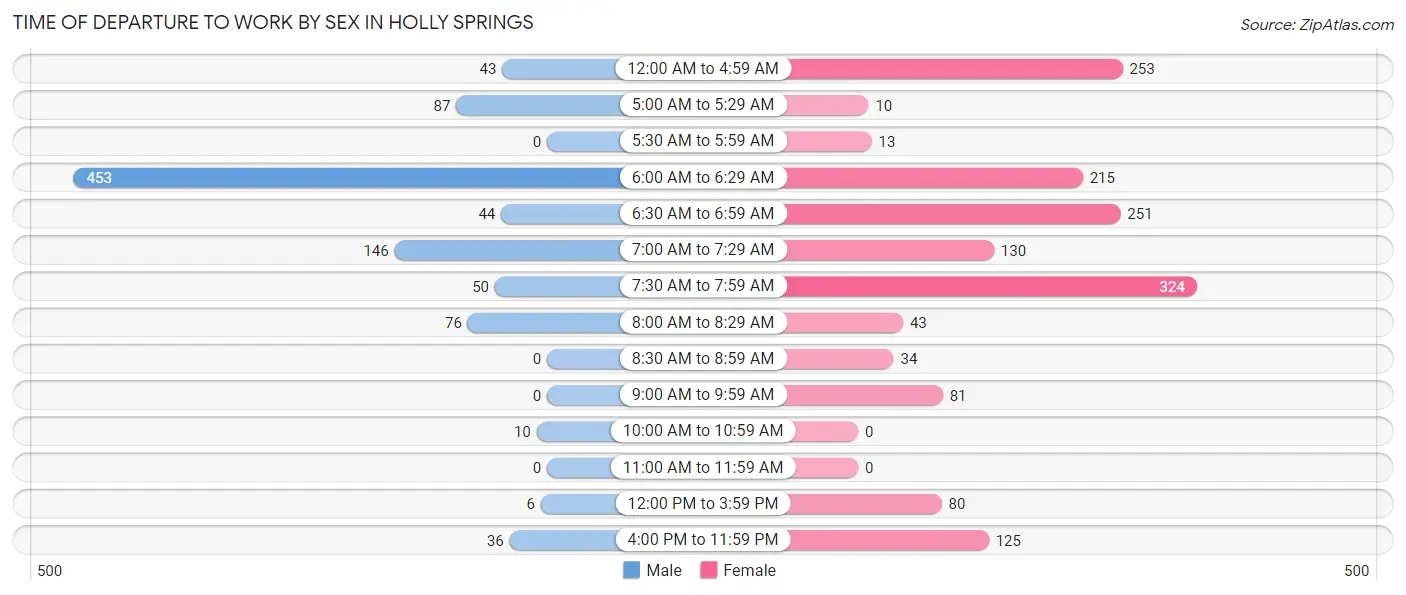
| Time of Departure | Male | Female |
| 12:00 AM to 4:59 AM | 43 (4.5%) | 253 (16.2%) |
| 5:00 AM to 5:29 AM | 87 (9.1%) | 10 (0.6%) |
| 5:30 AM to 5:59 AM | 0 (0.0%) | 13 (0.8%) |
| 6:00 AM to 6:29 AM | 453 (47.6%) | 215 (13.8%) |
| 6:30 AM to 6:59 AM | 44 (4.6%) | 251 (16.1%) |
| 7:00 AM to 7:29 AM | 146 (15.3%) | 130 (8.3%) |
| 7:30 AM to 7:59 AM | 50 (5.3%) | 324 (20.8%) |
| 8:00 AM to 8:29 AM | 76 (8.0%) | 43 (2.8%) |
| 8:30 AM to 8:59 AM | 0 (0.0%) | 34 (2.2%) |
| 9:00 AM to 9:59 AM | 0 (0.0%) | 81 (5.2%) |
| 10:00 AM to 10:59 AM | 10 (1.1%) | 0 (0.0%) |
| 11:00 AM to 11:59 AM | 0 (0.0%) | 0 (0.0%) |
| 12:00 PM to 3:59 PM | 6 (0.6%) | 80 (5.1%) |
| 4:00 PM to 11:59 PM | 36 (3.8%) | 125 (8.0%) |
| Total | 951 (100.0%) | 1,559 (100.0%) |
Housing Occupancy in Holly Springs
Occupancy by Ownership in Holly Springs
Of the total 2,260 dwellings in Holly Springs, owner-occupied units account for 1,450 (64.2%), while renter-occupied units make up 810 (35.8%).
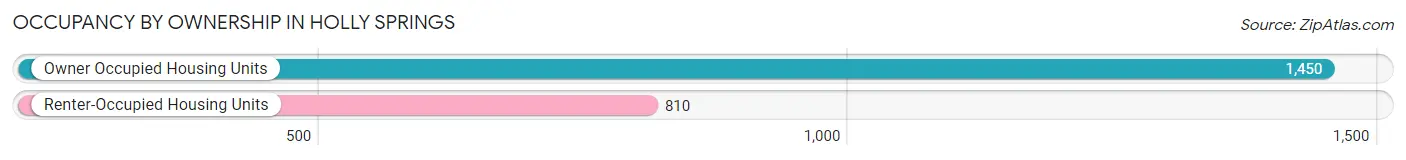
| Occupancy | # Housing Units | % Housing Units |
| Owner Occupied Housing Units | 1,450 | 64.2% |
| Renter-Occupied Housing Units | 810 | 35.8% |
| Total Occupied Housing Units | 2,260 | 100.0% |
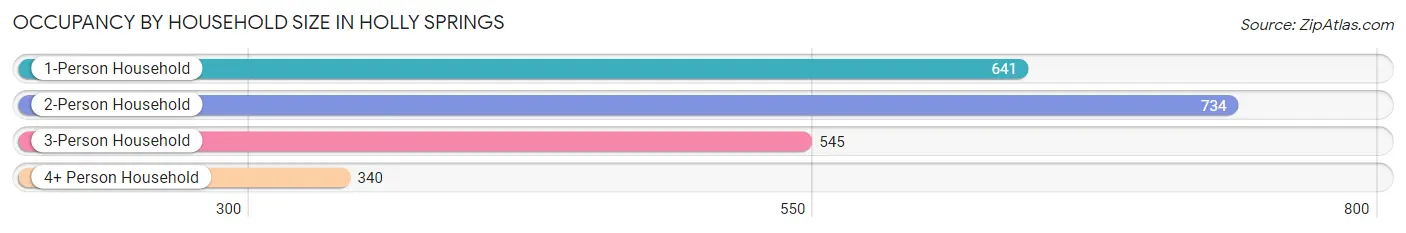
Occupancy by Household Size in Holly Springs
| Household Size | # Housing Units | % Housing Units |
| 1-Person Household | 641 | 28.4% |
| 2-Person Household | 734 | 32.5% |
| 3-Person Household | 545 | 24.1% |
| 4+ Person Household | 340 | 15.0% |
| Total Housing Units | 2,260 | 100.0% |
Occupancy by Ownership by Household Size in Holly Springs
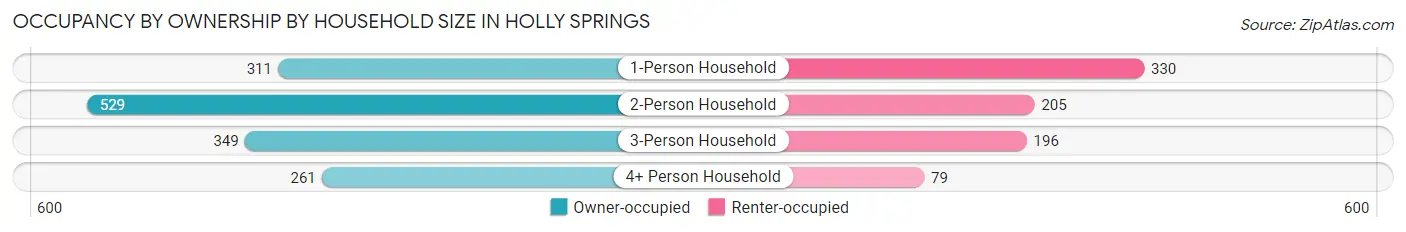
| Household Size | Owner-occupied | Renter-occupied |
| 1-Person Household | 311 (48.5%) | 330 (51.5%) |
| 2-Person Household | 529 (72.1%) | 205 (27.9%) |
| 3-Person Household | 349 (64.0%) | 196 (36.0%) |
| 4+ Person Household | 261 (76.8%) | 79 (23.2%) |
| Total Housing Units | 1,450 (64.2%) | 810 (35.8%) |
Occupancy by Educational Attainment in Holly Springs
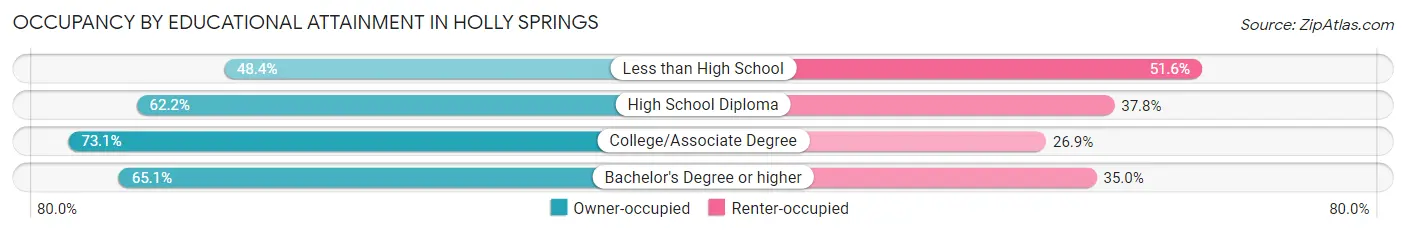
| Household Size | Owner-occupied | Renter-occupied |
| Less than High School | 178 (48.4%) | 190 (51.6%) |
| High School Diploma | 453 (62.2%) | 275 (37.8%) |
| College/Associate Degree | 564 (73.1%) | 208 (26.9%) |
| Bachelor's Degree or higher | 255 (65.0%) | 137 (34.9%) |
Occupancy by Age of Householder in Holly Springs
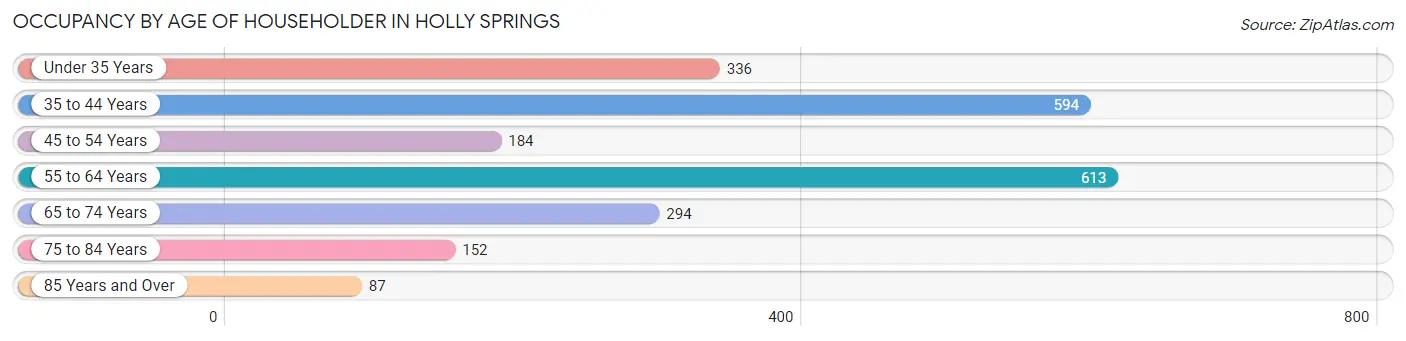
| Age Bracket | # Households | % Households |
| Under 35 Years | 336 | 14.9% |
| 35 to 44 Years | 594 | 26.3% |
| 45 to 54 Years | 184 | 8.1% |
| 55 to 64 Years | 613 | 27.1% |
| 65 to 74 Years | 294 | 13.0% |
| 75 to 84 Years | 152 | 6.7% |
| 85 Years and Over | 87 | 3.8% |
| Total | 2,260 | 100.0% |
Housing Finances in Holly Springs
Median Income by Occupancy in Holly Springs
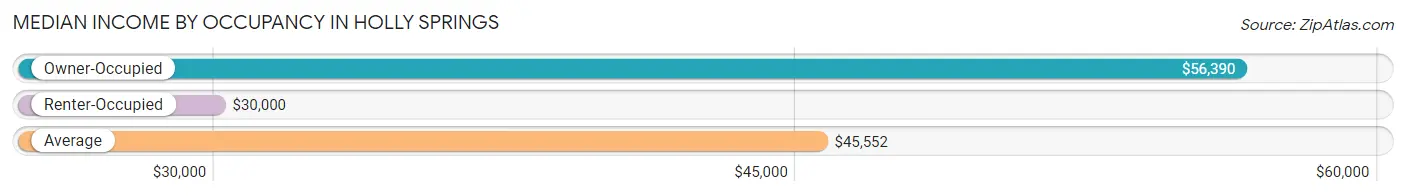
| Occupancy Type | # Households | Median Income |
| Owner-Occupied | 1,450 (64.2%) | $56,390 |
| Renter-Occupied | 810 (35.8%) | $30,000 |
| Average | 2,260 (100.0%) | $45,552 |
Occupancy by Householder Income Bracket in Holly Springs
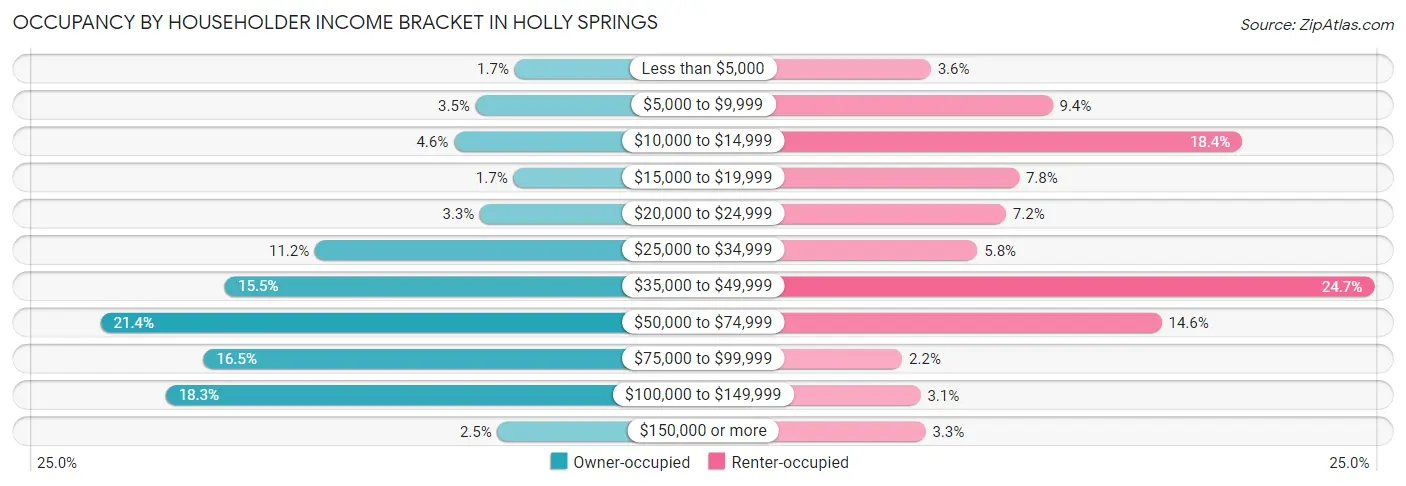
| Income Bracket | Owner-occupied | Renter-occupied |
| Less than $5,000 | 24 (1.7%) | 29 (3.6%) |
| $5,000 to $9,999 | 51 (3.5%) | 76 (9.4%) |
| $10,000 to $14,999 | 66 (4.5%) | 149 (18.4%) |
| $15,000 to $19,999 | 25 (1.7%) | 63 (7.8%) |
| $20,000 to $24,999 | 48 (3.3%) | 58 (7.2%) |
| $25,000 to $34,999 | 162 (11.2%) | 47 (5.8%) |
| $35,000 to $49,999 | 224 (15.4%) | 200 (24.7%) |
| $50,000 to $74,999 | 310 (21.4%) | 118 (14.6%) |
| $75,000 to $99,999 | 239 (16.5%) | 18 (2.2%) |
| $100,000 to $149,999 | 265 (18.3%) | 25 (3.1%) |
| $150,000 or more | 36 (2.5%) | 27 (3.3%) |
| Total | 1,450 (100.0%) | 810 (100.0%) |
Monthly Housing Cost Tiers in Holly Springs
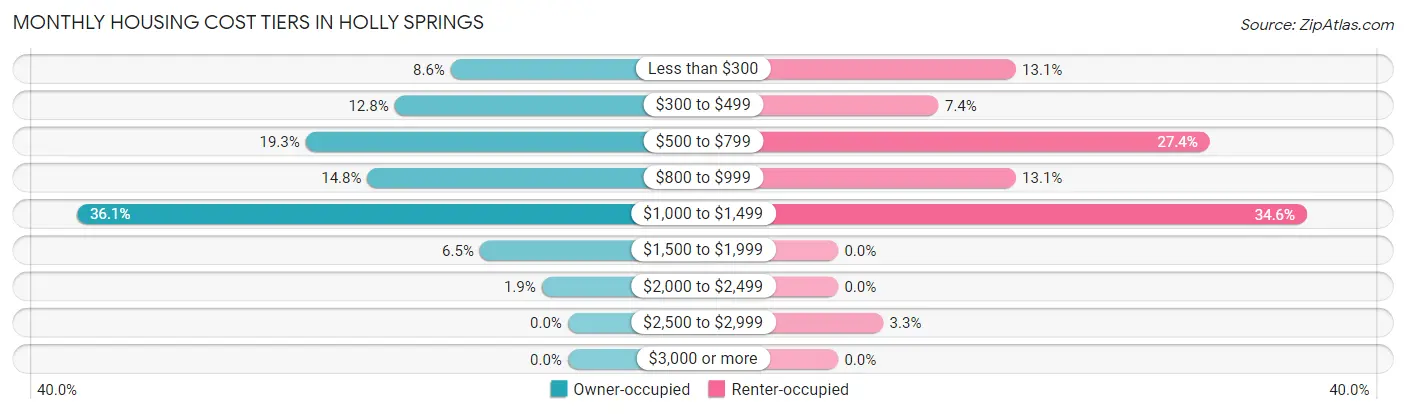
| Monthly Cost | Owner-occupied | Renter-occupied |
| Less than $300 | 125 (8.6%) | 106 (13.1%) |
| $300 to $499 | 185 (12.8%) | 60 (7.4%) |
| $500 to $799 | 280 (19.3%) | 222 (27.4%) |
| $800 to $999 | 214 (14.8%) | 106 (13.1%) |
| $1,000 to $1,499 | 524 (36.1%) | 280 (34.6%) |
| $1,500 to $1,999 | 94 (6.5%) | 0 (0.0%) |
| $2,000 to $2,499 | 28 (1.9%) | 0 (0.0%) |
| $2,500 to $2,999 | 0 (0.0%) | 27 (3.3%) |
| $3,000 or more | 0 (0.0%) | 0 (0.0%) |
| Total | 1,450 (100.0%) | 810 (100.0%) |
Physical Housing Characteristics in Holly Springs
Housing Structures in Holly Springs
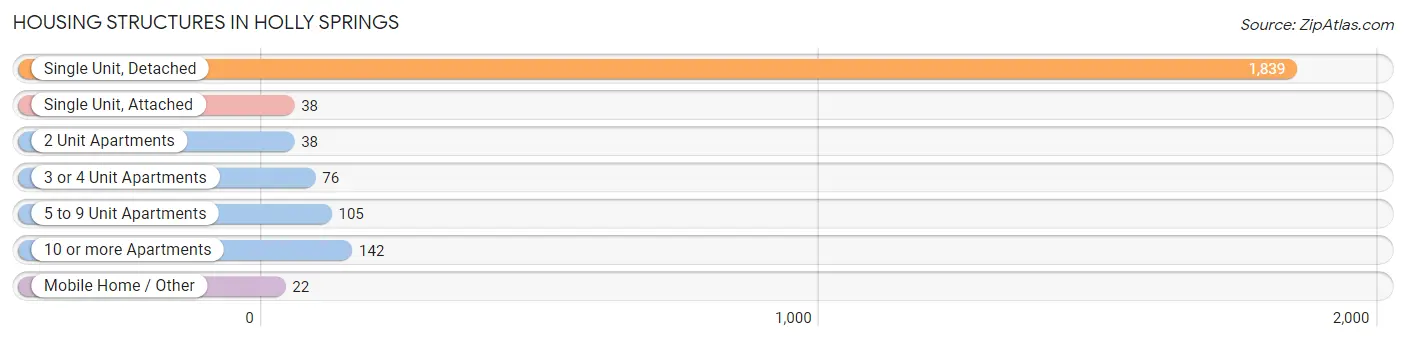
| Structure Type | # Housing Units | % Housing Units |
| Single Unit, Detached | 1,839 | 81.4% |
| Single Unit, Attached | 38 | 1.7% |
| 2 Unit Apartments | 38 | 1.7% |
| 3 or 4 Unit Apartments | 76 | 3.4% |
| 5 to 9 Unit Apartments | 105 | 4.6% |
| 10 or more Apartments | 142 | 6.3% |
| Mobile Home / Other | 22 | 1.0% |
| Total | 2,260 | 100.0% |
Housing Structures by Occupancy in Holly Springs
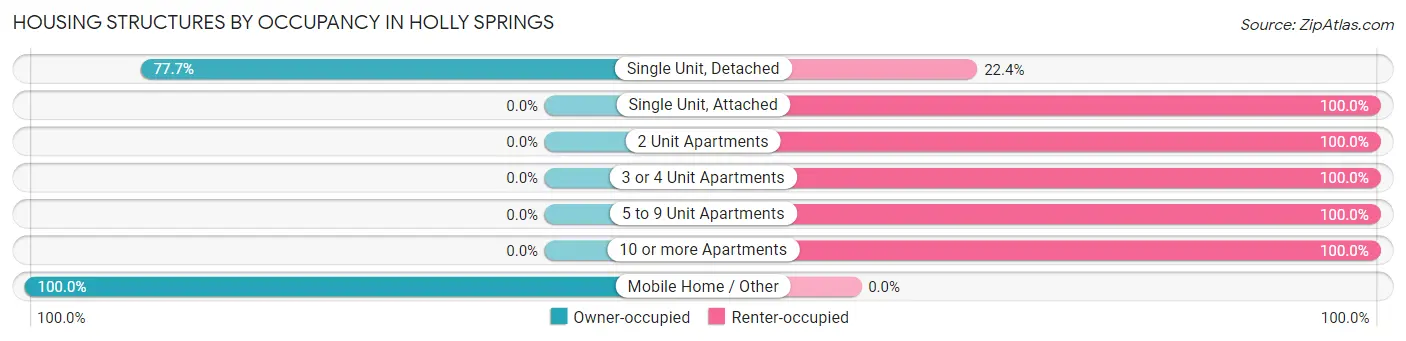
| Structure Type | Owner-occupied | Renter-occupied |
| Single Unit, Detached | 1,428 (77.6%) | 411 (22.4%) |
| Single Unit, Attached | 0 (0.0%) | 38 (100.0%) |
| 2 Unit Apartments | 0 (0.0%) | 38 (100.0%) |
| 3 or 4 Unit Apartments | 0 (0.0%) | 76 (100.0%) |
| 5 to 9 Unit Apartments | 0 (0.0%) | 105 (100.0%) |
| 10 or more Apartments | 0 (0.0%) | 142 (100.0%) |
| Mobile Home / Other | 22 (100.0%) | 0 (0.0%) |
| Total | 1,450 (64.2%) | 810 (35.8%) |
Housing Structures by Number of Rooms in Holly Springs
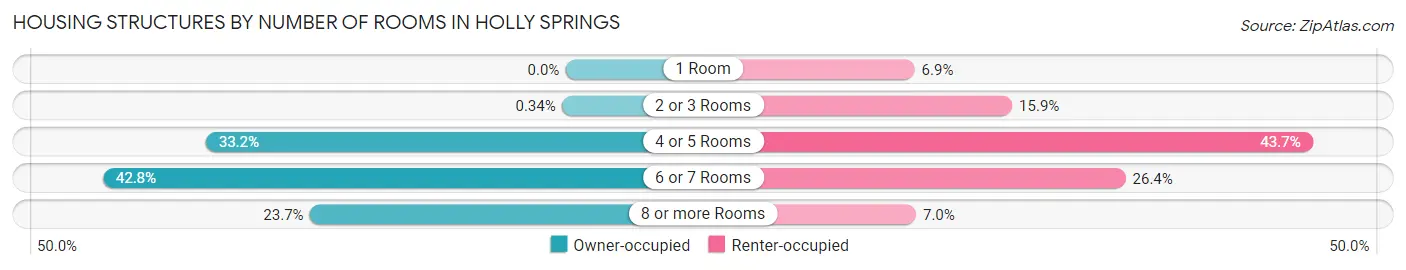
| Number of Rooms | Owner-occupied | Renter-occupied |
| 1 Room | 0 (0.0%) | 56 (6.9%) |
| 2 or 3 Rooms | 5 (0.3%) | 129 (15.9%) |
| 4 or 5 Rooms | 482 (33.2%) | 354 (43.7%) |
| 6 or 7 Rooms | 620 (42.8%) | 214 (26.4%) |
| 8 or more Rooms | 343 (23.7%) | 57 (7.0%) |
| Total | 1,450 (100.0%) | 810 (100.0%) |
Housing Structure by Heating Type in Holly Springs
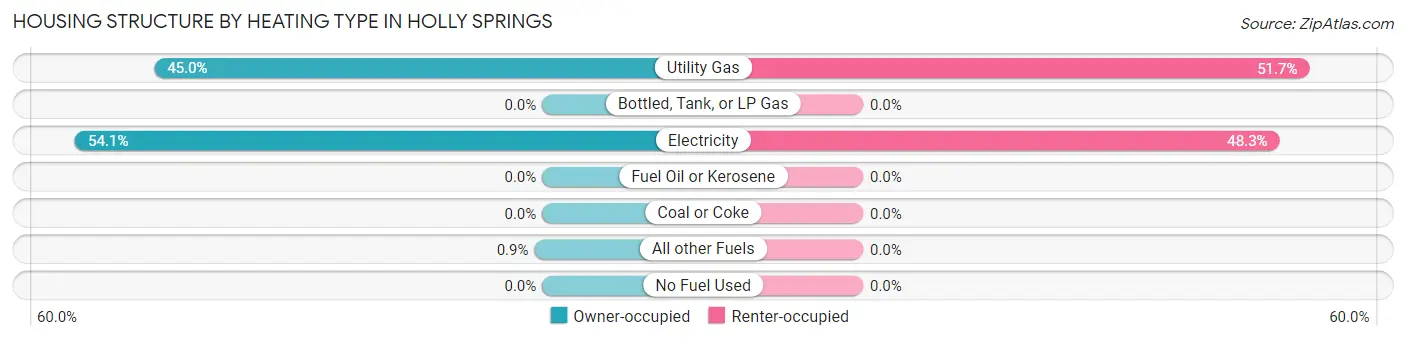
| Heating Type | Owner-occupied | Renter-occupied |
| Utility Gas | 652 (45.0%) | 419 (51.7%) |
| Bottled, Tank, or LP Gas | 0 (0.0%) | 0 (0.0%) |
| Electricity | 785 (54.1%) | 391 (48.3%) |
| Fuel Oil or Kerosene | 0 (0.0%) | 0 (0.0%) |
| Coal or Coke | 0 (0.0%) | 0 (0.0%) |
| All other Fuels | 13 (0.9%) | 0 (0.0%) |
| No Fuel Used | 0 (0.0%) | 0 (0.0%) |
| Total | 1,450 (100.0%) | 810 (100.0%) |
Household Vehicle Usage in Holly Springs
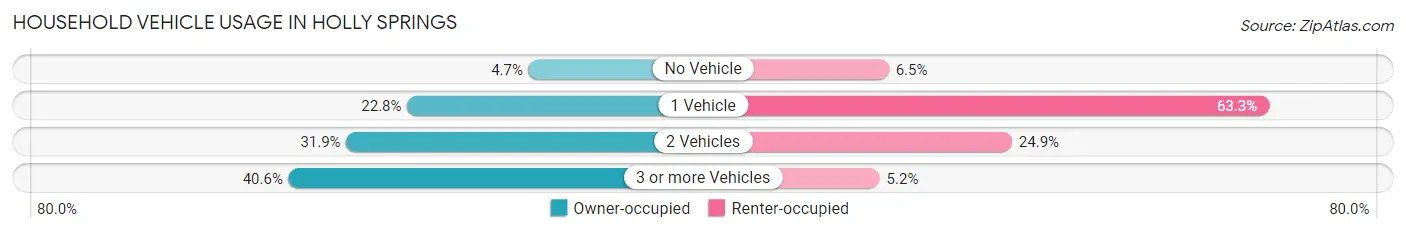
| Vehicles per Household | Owner-occupied | Renter-occupied |
| No Vehicle | 68 (4.7%) | 53 (6.5%) |
| 1 Vehicle | 331 (22.8%) | 513 (63.3%) |
| 2 Vehicles | 463 (31.9%) | 202 (24.9%) |
| 3 or more Vehicles | 588 (40.6%) | 42 (5.2%) |
| Total | 1,450 (100.0%) | 810 (100.0%) |
Real Estate & Mortgages in Holly Springs
Real Estate and Mortgage Overview in Holly Springs
| Characteristic | Without Mortgage | With Mortgage |
| Housing Units | 523 | 927 |
| Median Property Value | $105,600 | $95,800 |
| Median Household Income | $66,438 | $18 |
| Monthly Housing Costs | $457 | $0 |
| Real Estate Taxes | $900 | $134 |
Property Value by Mortgage Status in Holly Springs
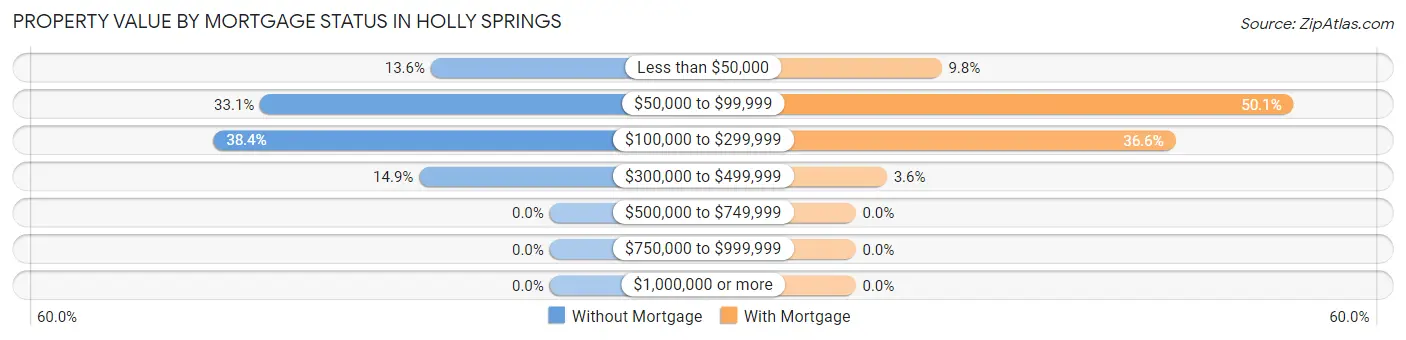
| Property Value | Without Mortgage | With Mortgage |
| Less than $50,000 | 71 (13.6%) | 91 (9.8%) |
| $50,000 to $99,999 | 173 (33.1%) | 464 (50.0%) |
| $100,000 to $299,999 | 201 (38.4%) | 339 (36.6%) |
| $300,000 to $499,999 | 78 (14.9%) | 33 (3.6%) |
| $500,000 to $749,999 | 0 (0.0%) | 0 (0.0%) |
| $750,000 to $999,999 | 0 (0.0%) | 0 (0.0%) |
| $1,000,000 or more | 0 (0.0%) | 0 (0.0%) |
| Total | 523 (100.0%) | 927 (100.0%) |
Household Income by Mortgage Status in Holly Springs
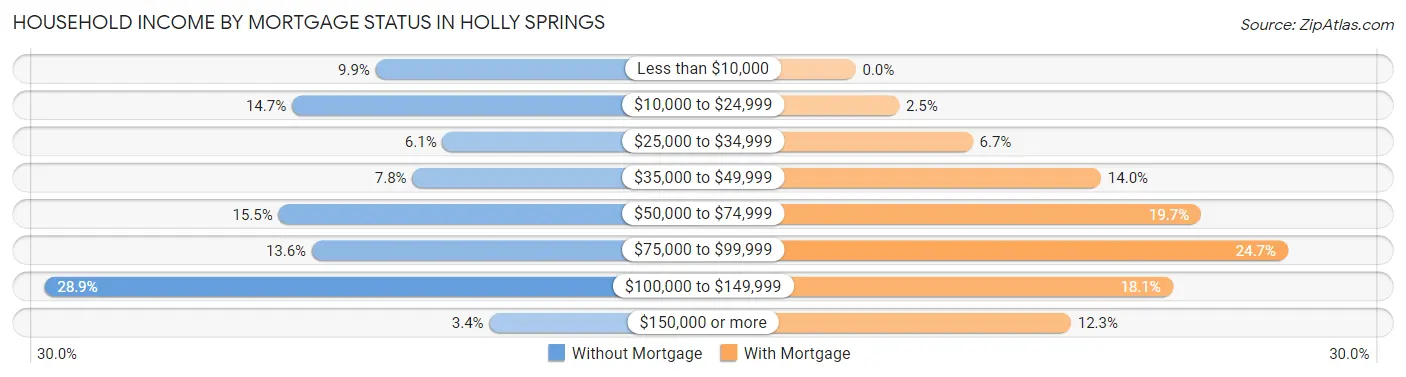
| Household Income | Without Mortgage | With Mortgage |
| Less than $10,000 | 52 (9.9%) | 0 (0.0%) |
| $10,000 to $24,999 | 77 (14.7%) | 23 (2.5%) |
| $25,000 to $34,999 | 32 (6.1%) | 62 (6.7%) |
| $35,000 to $49,999 | 41 (7.8%) | 130 (14.0%) |
| $50,000 to $74,999 | 81 (15.5%) | 183 (19.7%) |
| $75,000 to $99,999 | 71 (13.6%) | 229 (24.7%) |
| $100,000 to $149,999 | 151 (28.9%) | 168 (18.1%) |
| $150,000 or more | 18 (3.4%) | 114 (12.3%) |
| Total | 523 (100.0%) | 927 (100.0%) |
Property Value to Household Income Ratio in Holly Springs
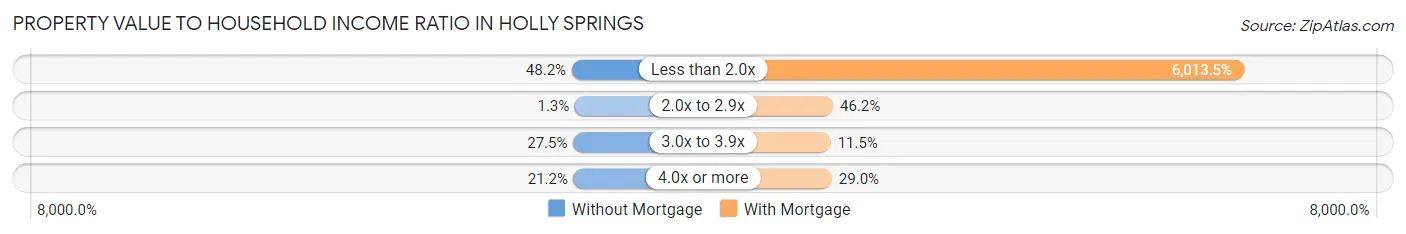
| Value-to-Income Ratio | Without Mortgage | With Mortgage |
| Less than 2.0x | 252 (48.2%) | 55,745 (6,013.5%) |
| 2.0x to 2.9x | 7 (1.3%) | 428 (46.2%) |
| 3.0x to 3.9x | 144 (27.5%) | 107 (11.5%) |
| 4.0x or more | 111 (21.2%) | 269 (29.0%) |
| Total | 523 (100.0%) | 927 (100.0%) |
Real Estate Taxes by Mortgage Status in Holly Springs
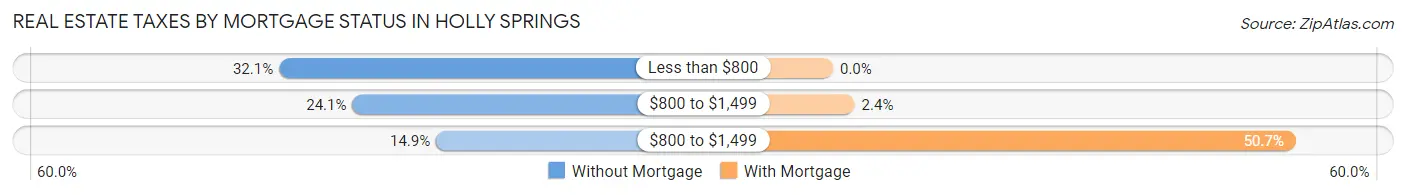
| Property Taxes | Without Mortgage | With Mortgage |
| Less than $800 | 168 (32.1%) | 0 (0.0%) |
| $800 to $1,499 | 126 (24.1%) | 22 (2.4%) |
| $800 to $1,499 | 78 (14.9%) | 470 (50.7%) |
| Total | 523 (100.0%) | 927 (100.0%) |
Health & Disability in Holly Springs
Health Insurance Coverage by Age in Holly Springs
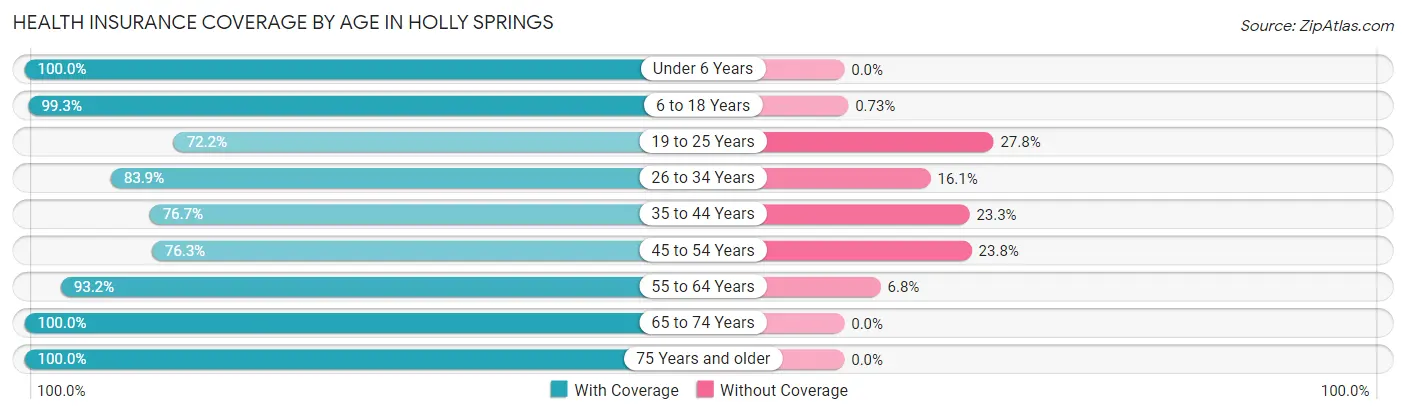
| Age Bracket | With Coverage | Without Coverage |
| Under 6 Years | 320 (100.0%) | 0 (0.0%) |
| 6 to 18 Years | 954 (99.3%) | 7 (0.7%) |
| 19 to 25 Years | 711 (72.2%) | 274 (27.8%) |
| 26 to 34 Years | 386 (83.9%) | 74 (16.1%) |
| 35 to 44 Years | 693 (76.7%) | 211 (23.3%) |
| 45 to 54 Years | 321 (76.2%) | 100 (23.7%) |
| 55 to 64 Years | 812 (93.2%) | 59 (6.8%) |
| 65 to 74 Years | 462 (100.0%) | 0 (0.0%) |
| 75 Years and older | 312 (100.0%) | 0 (0.0%) |
| Total | 4,971 (87.3%) | 725 (12.7%) |
Health Insurance Coverage by Citizenship Status in Holly Springs
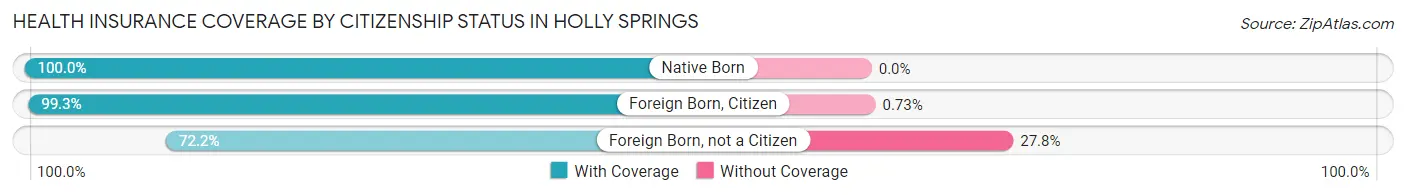
| Citizenship Status | With Coverage | Without Coverage |
| Native Born | 320 (100.0%) | 0 (0.0%) |
| Foreign Born, Citizen | 954 (99.3%) | 7 (0.7%) |
| Foreign Born, not a Citizen | 711 (72.2%) | 274 (27.8%) |
Health Insurance Coverage by Household Income in Holly Springs
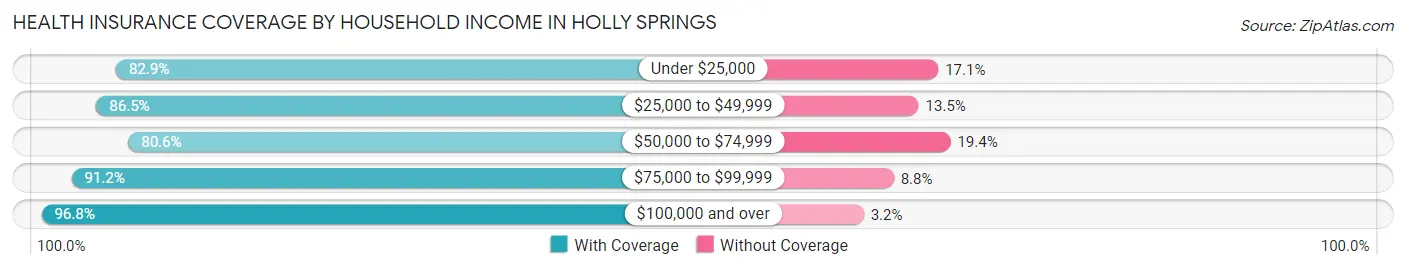
| Household Income | With Coverage | Without Coverage |
| Under $25,000 | 953 (82.9%) | 197 (17.1%) |
| $25,000 to $49,999 | 1,183 (86.5%) | 184 (13.5%) |
| $50,000 to $74,999 | 738 (80.6%) | 178 (19.4%) |
| $75,000 to $99,999 | 571 (91.2%) | 55 (8.8%) |
| $100,000 and over | 885 (96.8%) | 29 (3.2%) |
Public vs Private Health Insurance Coverage by Age in Holly Springs
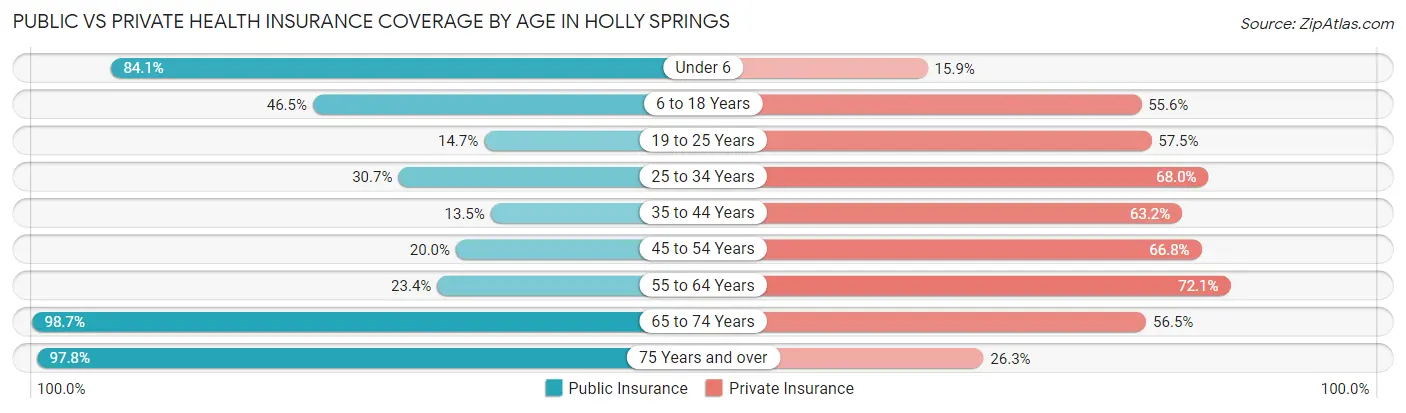
| Age Bracket | Public Insurance | Private Insurance |
| Under 6 | 269 (84.1%) | 51 (15.9%) |
| 6 to 18 Years | 447 (46.5%) | 534 (55.6%) |
| 19 to 25 Years | 145 (14.7%) | 566 (57.5%) |
| 25 to 34 Years | 141 (30.6%) | 313 (68.0%) |
| 35 to 44 Years | 122 (13.5%) | 571 (63.2%) |
| 45 to 54 Years | 84 (20.0%) | 281 (66.7%) |
| 55 to 64 Years | 204 (23.4%) | 628 (72.1%) |
| 65 to 74 Years | 456 (98.7%) | 261 (56.5%) |
| 75 Years and over | 305 (97.8%) | 82 (26.3%) |
| Total | 2,173 (38.2%) | 3,287 (57.7%) |
Disability Status by Sex by Age in Holly Springs
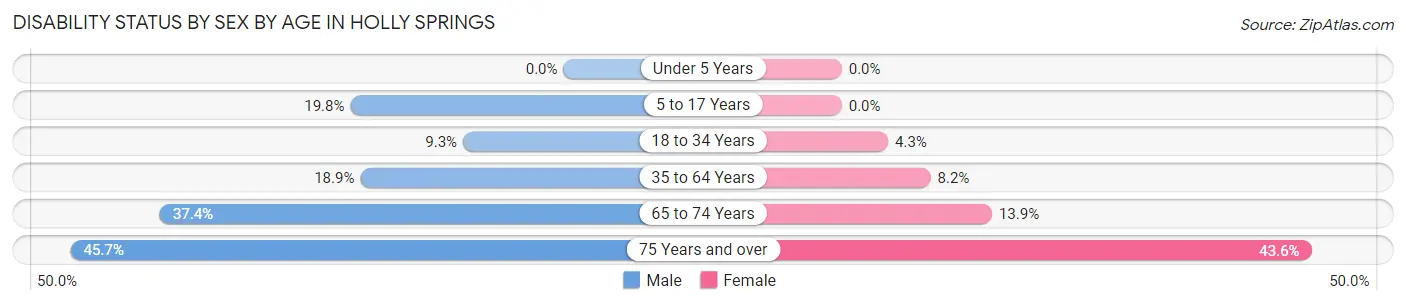
| Age Bracket | Male | Female |
| Under 5 Years | 0 (0.0%) | 0 (0.0%) |
| 5 to 17 Years | 70 (19.8%) | 0 (0.0%) |
| 18 to 34 Years | 69 (9.3%) | 42 (4.3%) |
| 35 to 64 Years | 167 (18.9%) | 108 (8.2%) |
| 65 to 74 Years | 79 (37.4%) | 35 (13.9%) |
| 75 Years and over | 43 (45.7%) | 95 (43.6%) |
Disability Class by Sex by Age in Holly Springs
Disability Class: Hearing Difficulty
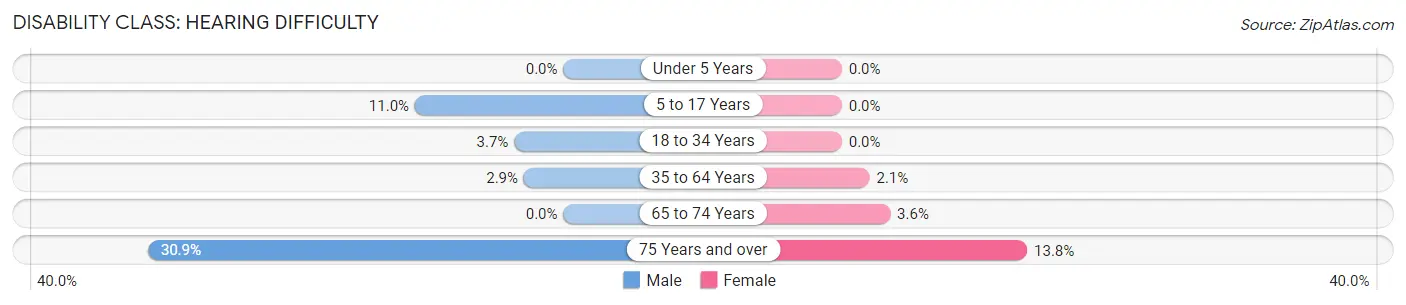
| Age Bracket | Male | Female |
| Under 5 Years | 0 (0.0%) | 0 (0.0%) |
| 5 to 17 Years | 39 (11.0%) | 0 (0.0%) |
| 18 to 34 Years | 27 (3.6%) | 0 (0.0%) |
| 35 to 64 Years | 26 (2.9%) | 27 (2.1%) |
| 65 to 74 Years | 0 (0.0%) | 9 (3.6%) |
| 75 Years and over | 29 (30.8%) | 30 (13.8%) |
Disability Class: Vision Difficulty
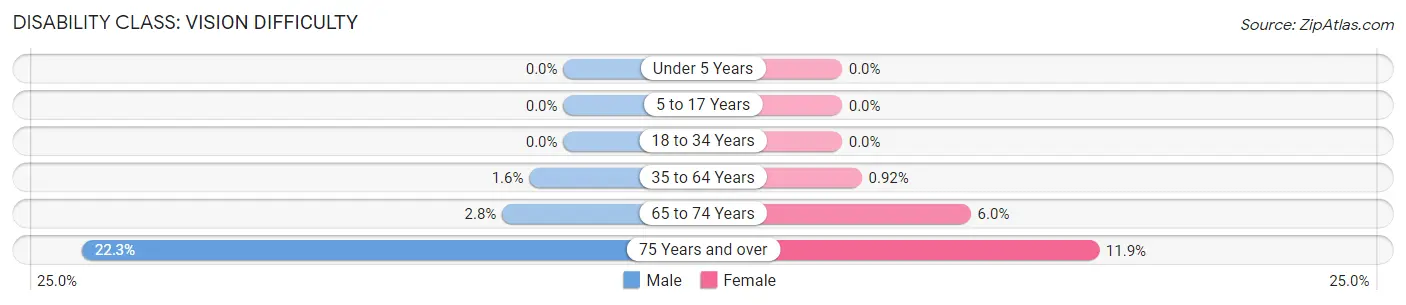
| Age Bracket | Male | Female |
| Under 5 Years | 0 (0.0%) | 0 (0.0%) |
| 5 to 17 Years | 0 (0.0%) | 0 (0.0%) |
| 18 to 34 Years | 0 (0.0%) | 0 (0.0%) |
| 35 to 64 Years | 14 (1.6%) | 12 (0.9%) |
| 65 to 74 Years | 6 (2.8%) | 15 (6.0%) |
| 75 Years and over | 21 (22.3%) | 26 (11.9%) |
Disability Class: Cognitive Difficulty
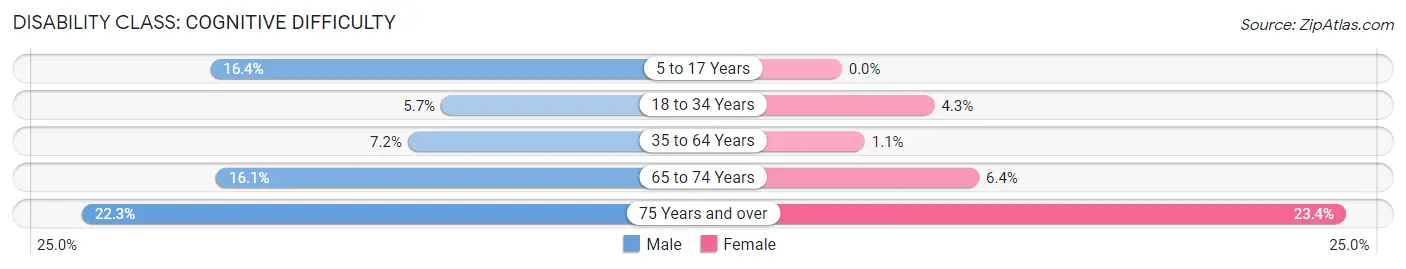
| Age Bracket | Male | Female |
| 5 to 17 Years | 58 (16.4%) | 0 (0.0%) |
| 18 to 34 Years | 42 (5.7%) | 42 (4.3%) |
| 35 to 64 Years | 64 (7.2%) | 14 (1.1%) |
| 65 to 74 Years | 34 (16.1%) | 16 (6.4%) |
| 75 Years and over | 21 (22.3%) | 51 (23.4%) |
Disability Class: Ambulatory Difficulty
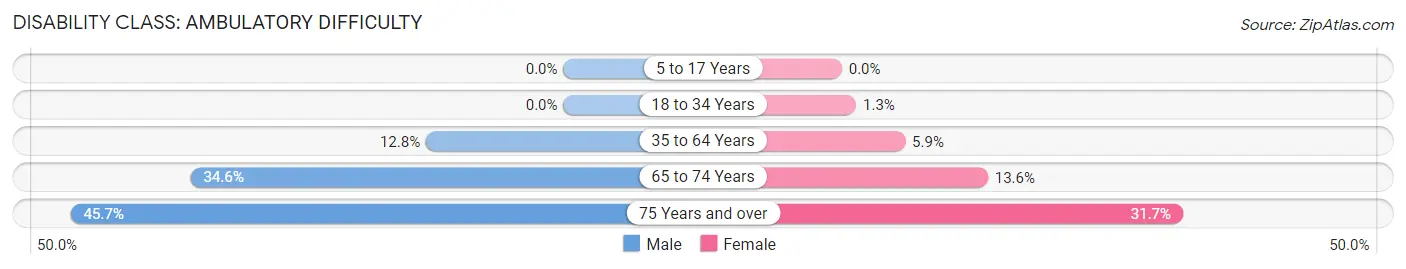
| Age Bracket | Male | Female |
| 5 to 17 Years | 0 (0.0%) | 0 (0.0%) |
| 18 to 34 Years | 0 (0.0%) | 13 (1.3%) |
| 35 to 64 Years | 113 (12.8%) | 77 (5.9%) |
| 65 to 74 Years | 73 (34.6%) | 34 (13.6%) |
| 75 Years and over | 43 (45.7%) | 69 (31.7%) |
Disability Class: Self-Care Difficulty
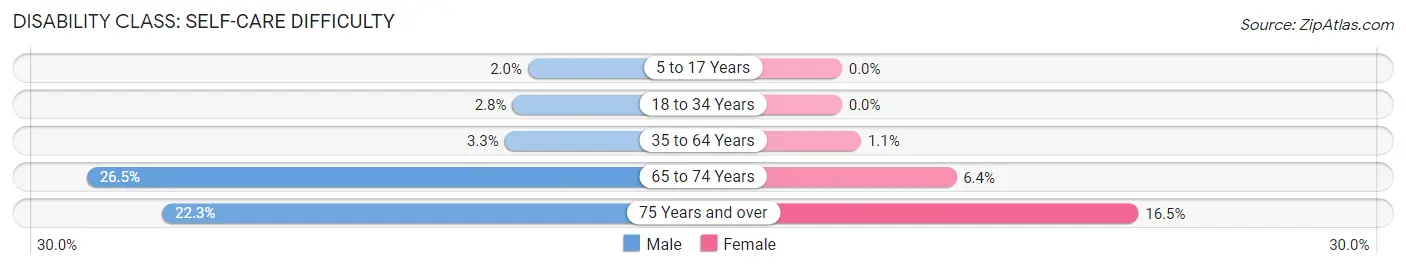
| Age Bracket | Male | Female |
| 5 to 17 Years | 7 (2.0%) | 0 (0.0%) |
| 18 to 34 Years | 21 (2.8%) | 0 (0.0%) |
| 35 to 64 Years | 29 (3.3%) | 14 (1.1%) |
| 65 to 74 Years | 56 (26.5%) | 16 (6.4%) |
| 75 Years and over | 21 (22.3%) | 36 (16.5%) |
Technology Access in Holly Springs
Computing Device Access in Holly Springs
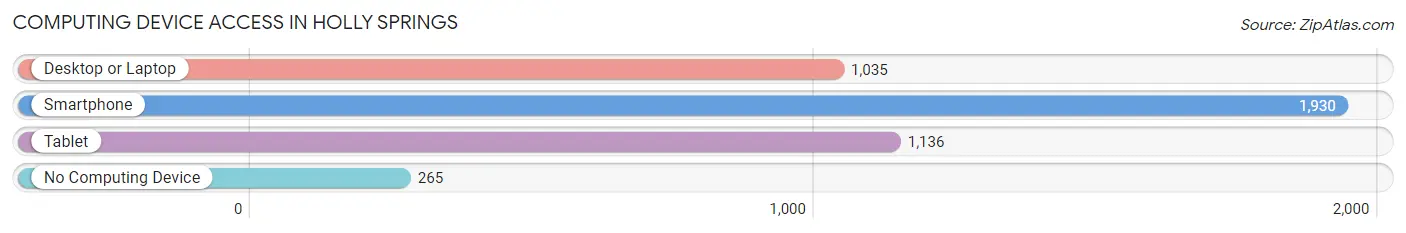
| Device Type | # Households | % Households |
| Desktop or Laptop | 1,035 | 45.8% |
| Smartphone | 1,930 | 85.4% |
| Tablet | 1,136 | 50.3% |
| No Computing Device | 265 | 11.7% |
| Total | 2,260 | 100.0% |
Internet Access in Holly Springs
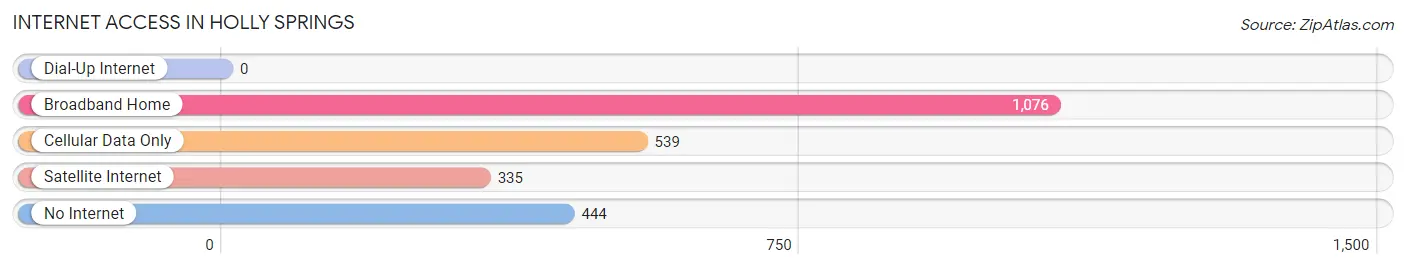
| Internet Type | # Households | % Households |
| Dial-Up Internet | 0 | 0.0% |
| Broadband Home | 1,076 | 47.6% |
| Cellular Data Only | 539 | 23.8% |
| Satellite Internet | 335 | 14.8% |
| No Internet | 444 | 19.7% |
| Total | 2,260 | 100.0% |
Holly Springs Summary
Holly Springs is a city located in Marshall County, Mississippi, United States. The population was 7,957 at the 2010 census. It is the county seat of Marshall County. Holly Springs is a part of the Memphis Metropolitan Statistical Area.
History
Holly Springs was founded in 1836 by European-American settlers. The city was named after the holly trees that grew in the area. The city was a major center of activity during the Civil War. It was the site of the Battle of Holly Springs, which was fought on December 20, 1862. The Union Army was victorious in the battle, and the city was occupied by Union forces for the remainder of the war.
After the war, Holly Springs began to rebuild and grow. The city was incorporated in 1873. In the late 19th century, the city was a major center of education, with several colleges and universities located in the area.
Geography
Holly Springs is located at 34°45'25" North, 89°30'45" West (34.756944, -89.5125). The city is situated in the northwest corner of Marshall County, near the border with Benton County. It is approximately 40 miles southeast of Memphis, Tennessee.
The city has a total area of 8.2 square miles, of which 8.1 square miles is land and 0.1 square miles is water.
Economy
Holly Springs is a small city with a diverse economy. The city is home to several manufacturing companies, including a furniture factory, a paper mill, and a plastics plant. The city also has a thriving agricultural sector, with several farms located in the area.
The city is also home to several educational institutions, including Rust College, a historically black college, and the University of Mississippi Medical Center.
Demographics
As of the 2010 census, there were 7,957 people, 2,845 households, and 1,845 families residing in the city. The population density was 983.3 people per square mile. The racial makeup of the city was 57.3% African American, 37.7% White, 0.3% Native American, 0.2% Asian, 0.1% Pacific Islander, 2.2% from other races, and 2.4% from two or more races. Hispanic or Latino of any race were 4.2% of the population.
The median income for a household in the city was $30,938, and the median income for a family was $37,917. The per capita income for the city was $15,945. About 22.2% of families and 25.7% of the population were below the poverty line, including 36.2% of those under age 18 and 18.2% of those age 65 or over.
Common Questions
What is Per Capita Income in Holly Springs?
Per Capita income in Holly Springs is $19,947.
What is the Median Family Income in Holly Springs?
Median Family Income in Holly Springs is $43,613.
What is the Median Household income in Holly Springs?
Median Household Income in Holly Springs is $45,552.
What is Income or Wage Gap in Holly Springs?
Income or Wage Gap in Holly Springs is 16.1%.
Women in Holly Springs earn 83.9 cents for every dollar earned by a man.
What is Family Income Deficit in Holly Springs?
Family Income Deficit in Holly Springs is $11,919.
Families that are below poverty line in Holly Springs earn $11,919 less on average than the poverty threshold level.
What is Inequality or Gini Index in Holly Springs?
Inequality or Gini Index in Holly Springs is 0.43.
What is the Total Population of Holly Springs?
Total Population of Holly Springs is 6,942.
What is the Total Male Population of Holly Springs?
Total Male Population of Holly Springs is 3,556.
What is the Total Female Population of Holly Springs?
Total Female Population of Holly Springs is 3,386.
What is the Ratio of Males per 100 Females in Holly Springs?
There are 105.02 Males per 100 Females in Holly Springs.
What is the Ratio of Females per 100 Males in Holly Springs?
There are 95.22 Females per 100 Males in Holly Springs.
What is the Median Population Age in Holly Springs?
Median Population Age in Holly Springs is 40.6 Years.
What is the Average Family Size in Holly Springs
Average Family Size in Holly Springs is 2.5 People.
What is the Average Household Size in Holly Springs
Average Household Size in Holly Springs is 2.2 People.
How Large is the Labor Force in Holly Springs?
There are 2,776 People in the Labor Forcein in Holly Springs.
What is the Percentage of People in the Labor Force in Holly Springs?
45.5% of People are in the Labor Force in Holly Springs.
What is the Unemployment Rate in Holly Springs?
Unemployment Rate in Holly Springs is 7.9%.