Gulfport, MS Map & Demographics
Gulfport Map
Gulfport Overview
$26,397
PER CAPITA INCOME
$54,838
AVG FAMILY INCOME
$43,499
AVG HOUSEHOLD INCOME
20.4%
WAGE / INCOME GAP [ % ]
79.6¢/ $1
WAGE / INCOME GAP [ $ ]
$12,682
FAMILY INCOME DEFICIT
0.49
INEQUALITY / GINI INDEX
72,524
TOTAL POPULATION
34,939
MALE POPULATION
37,585
FEMALE POPULATION
92.96
MALES / 100 FEMALES
107.57
FEMALES / 100 MALES
36.1
MEDIAN AGE
3.1
AVG FAMILY SIZE
2.5
AVG HOUSEHOLD SIZE
34,252
LABOR FORCE [ PEOPLE ]
59.5%
PERCENT IN LABOR FORCE
11.4%
UNEMPLOYMENT RATE
Gulfport Area Codes
Income in Gulfport
Income Overview in Gulfport
Per Capita Income in Gulfport is $26,397, while median incomes of families and households are $54,838 and $43,499 respectively.
| Characteristic | Number | Measure |
| Per Capita Income | 72,524 | $26,397 |
| Median Family Income | 17,556 | $54,838 |
| Mean Family Income | 17,556 | $73,118 |
| Median Household Income | 28,137 | $43,499 |
| Mean Household Income | 28,137 | $63,439 |
| Income Deficit | 17,556 | $12,682 |
| Wage / Income Gap (%) | 72,524 | 20.43% |
| Wage / Income Gap ($) | 72,524 | 79.57¢ per $1 |
| Gini / Inequality Index | 72,524 | 0.49 |
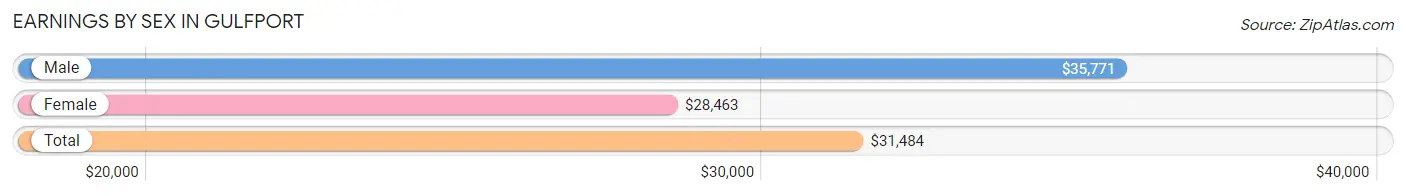
Earnings by Sex in Gulfport
Average Earnings in Gulfport are $31,484, $35,771 for men and $28,463 for women, a difference of 20.4%.
| Sex | Number | Average Earnings |
| Male | 17,144 (49.7%) | $35,771 |
| Female | 17,322 (50.3%) | $28,463 |
| Total | 34,466 (100.0%) | $31,484 |
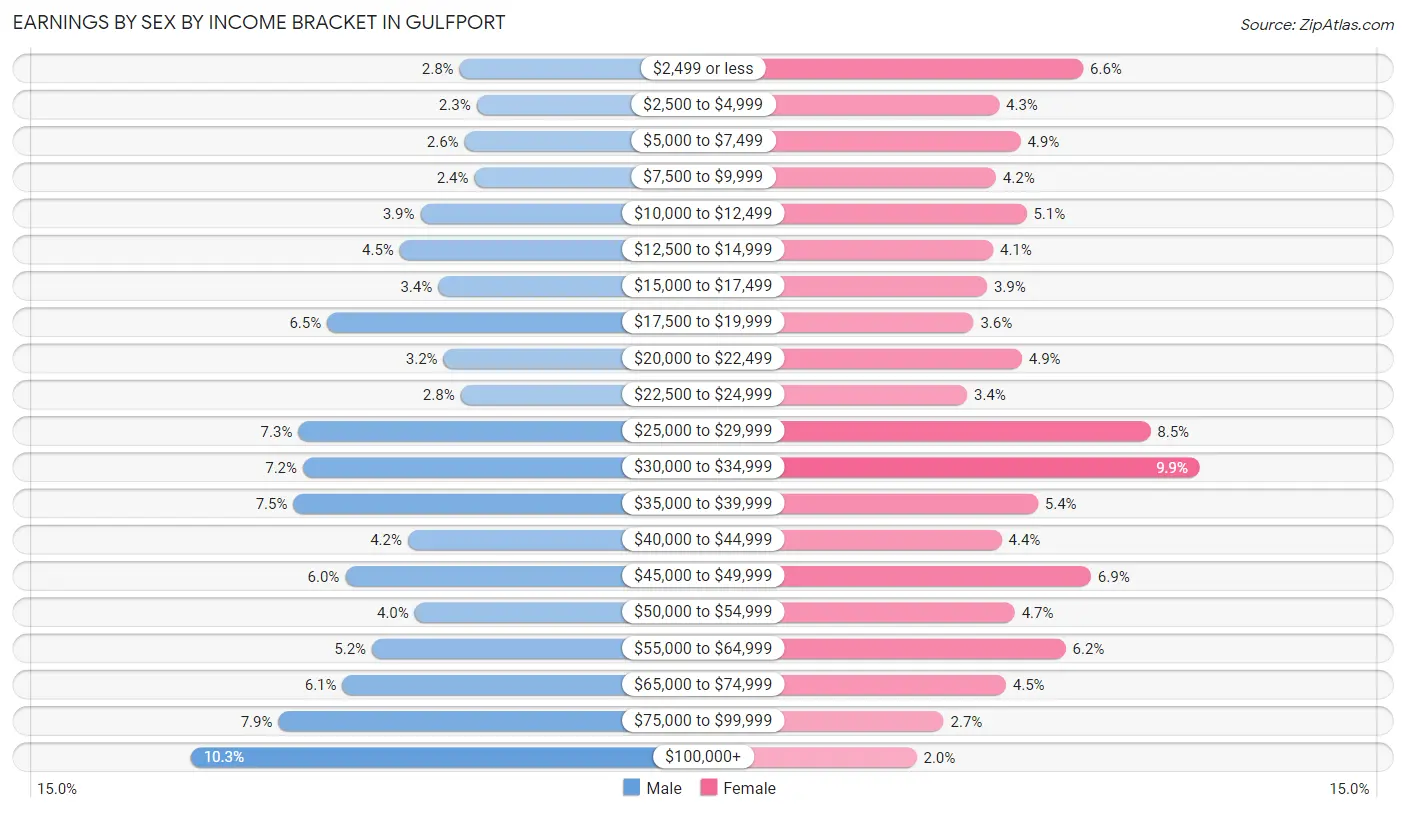
Earnings by Sex by Income Bracket in Gulfport
The most common earnings brackets in Gulfport are $100,000+ for men (1,771 | 10.3%) and $30,000 to $34,999 for women (1,718 | 9.9%).
| Income | Male | Female |
| $2,499 or less | 476 (2.8%) | 1,150 (6.6%) |
| $2,500 to $4,999 | 395 (2.3%) | 742 (4.3%) |
| $5,000 to $7,499 | 452 (2.6%) | 845 (4.9%) |
| $7,500 to $9,999 | 405 (2.4%) | 725 (4.2%) |
| $10,000 to $12,499 | 665 (3.9%) | 875 (5.1%) |
| $12,500 to $14,999 | 765 (4.5%) | 712 (4.1%) |
| $15,000 to $17,499 | 579 (3.4%) | 682 (3.9%) |
| $17,500 to $19,999 | 1,114 (6.5%) | 617 (3.6%) |
| $20,000 to $22,499 | 554 (3.2%) | 853 (4.9%) |
| $22,500 to $24,999 | 472 (2.8%) | 585 (3.4%) |
| $25,000 to $29,999 | 1,254 (7.3%) | 1,477 (8.5%) |
| $30,000 to $34,999 | 1,231 (7.2%) | 1,718 (9.9%) |
| $35,000 to $39,999 | 1,277 (7.4%) | 931 (5.4%) |
| $40,000 to $44,999 | 725 (4.2%) | 753 (4.3%) |
| $45,000 to $49,999 | 1,027 (6.0%) | 1,189 (6.9%) |
| $50,000 to $54,999 | 693 (4.0%) | 818 (4.7%) |
| $55,000 to $64,999 | 899 (5.2%) | 1,065 (6.1%) |
| $65,000 to $74,999 | 1,041 (6.1%) | 774 (4.5%) |
| $75,000 to $99,999 | 1,349 (7.9%) | 471 (2.7%) |
| $100,000+ | 1,771 (10.3%) | 340 (2.0%) |
| Total | 17,144 (100.0%) | 17,322 (100.0%) |
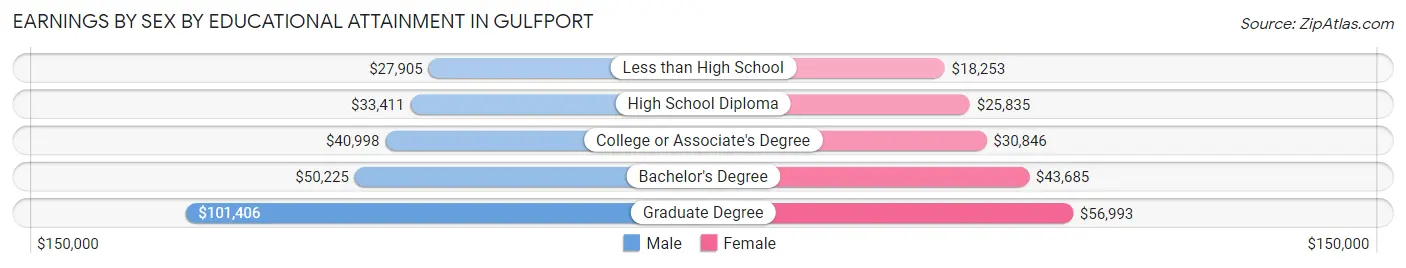
Earnings by Sex by Educational Attainment in Gulfport
Average earnings in Gulfport are $40,921 for men and $30,500 for women, a difference of 25.5%. Men with an educational attainment of graduate degree enjoy the highest average annual earnings of $101,406, while those with less than high school education earn the least with $27,905. Women with an educational attainment of graduate degree earn the most with the average annual earnings of $56,993, while those with less than high school education have the smallest earnings of $18,253.
| Educational Attainment | Male Income | Female Income |
| Less than High School | $27,905 | $18,253 |
| High School Diploma | $33,411 | $25,835 |
| College or Associate's Degree | $40,998 | $30,846 |
| Bachelor's Degree | $50,225 | $43,685 |
| Graduate Degree | $101,406 | $56,993 |
| Total | $40,921 | $30,500 |
Family Income in Gulfport
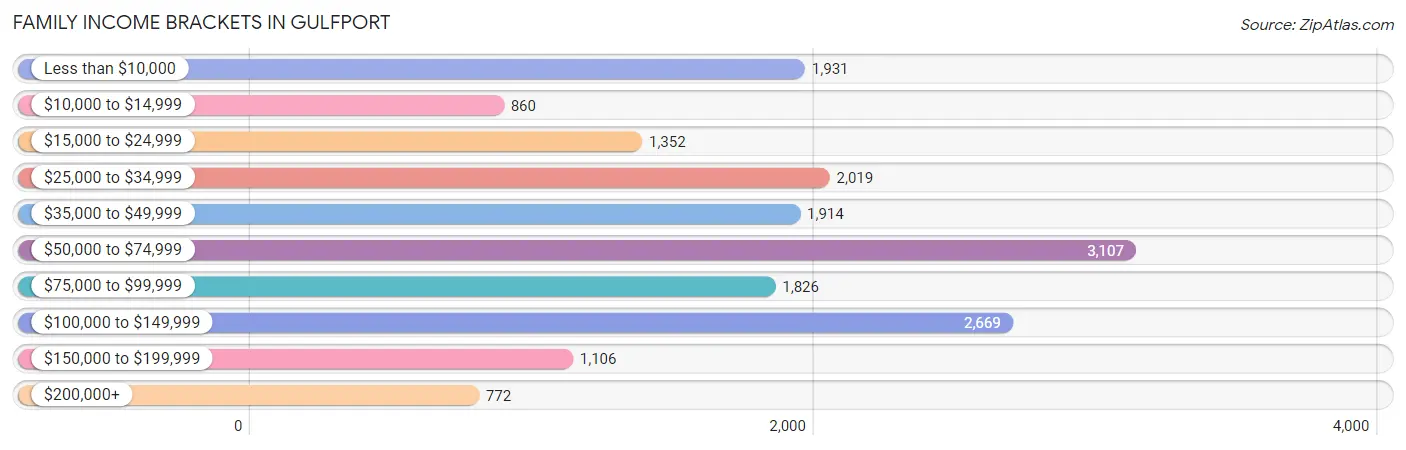
Family Income Brackets in Gulfport
According to the Gulfport family income data, there are 3,107 families falling into the $50,000 to $74,999 income range, which is the most common income bracket and makes up 17.7% of all families. Conversely, the $200,000+ income bracket is the least frequent group with only 772 families (4.4%) belonging to this category.
| Income Bracket | # Families | % Families |
| Less than $10,000 | 1,931 | 11.0% |
| $10,000 to $14,999 | 860 | 4.9% |
| $15,000 to $24,999 | 1,352 | 7.7% |
| $25,000 to $34,999 | 2,019 | 11.5% |
| $35,000 to $49,999 | 1,914 | 10.9% |
| $50,000 to $74,999 | 3,107 | 17.7% |
| $75,000 to $99,999 | 1,826 | 10.4% |
| $100,000 to $149,999 | 2,669 | 15.2% |
| $150,000 to $199,999 | 1,106 | 6.3% |
| $200,000+ | 772 | 4.4% |
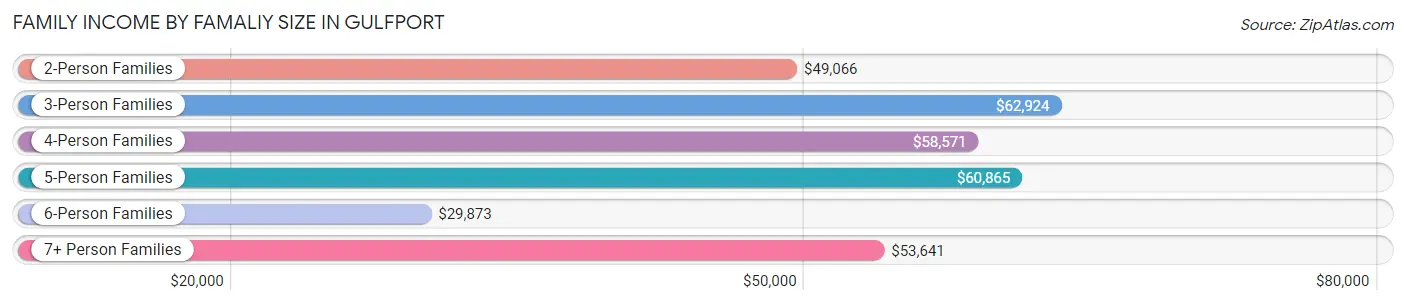
Family Income by Famaliy Size in Gulfport
3-person families (4,681 | 26.7%) account for the highest median family income in Gulfport with $62,924 per family, while 2-person families (8,730 | 49.7%) have the highest median income of $24,533 per family member.
| Income Bracket | # Families | Median Income |
| 2-Person Families | 8,730 (49.7%) | $49,066 |
| 3-Person Families | 4,681 (26.7%) | $62,924 |
| 4-Person Families | 2,508 (14.3%) | $58,571 |
| 5-Person Families | 977 (5.6%) | $60,865 |
| 6-Person Families | 400 (2.3%) | $29,873 |
| 7+ Person Families | 260 (1.5%) | $53,641 |
| Total | 17,556 (100.0%) | $54,838 |
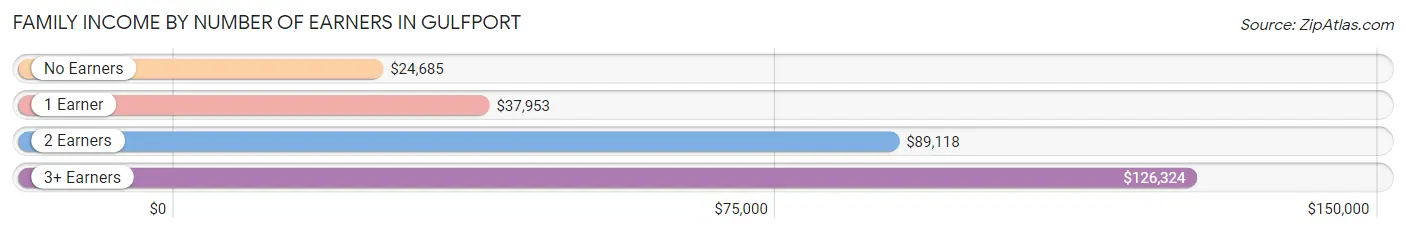
Family Income by Number of Earners in Gulfport
The median family income in Gulfport is $54,838, with families comprising 3+ earners (1,102) having the highest median family income of $126,324, while families with no earners (3,268) have the lowest median family income of $24,685, accounting for 6.3% and 18.6% of families, respectively.
| Number of Earners | # Families | Median Income |
| No Earners | 3,268 (18.6%) | $24,685 |
| 1 Earner | 7,326 (41.7%) | $37,953 |
| 2 Earners | 5,860 (33.4%) | $89,118 |
| 3+ Earners | 1,102 (6.3%) | $126,324 |
| Total | 17,556 (100.0%) | $54,838 |
Household Income in Gulfport
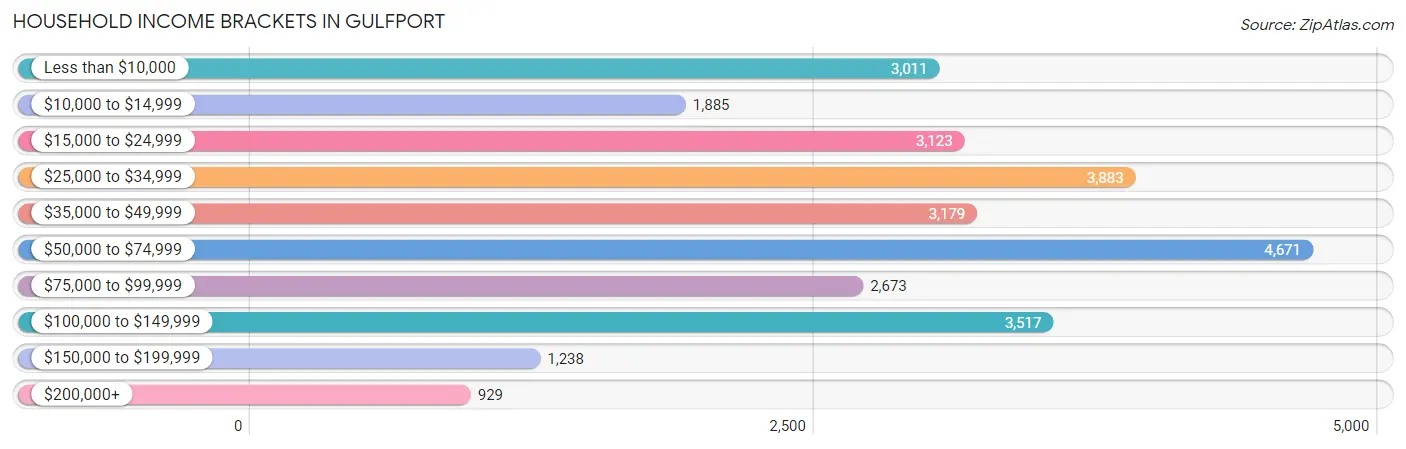
Household Income Brackets in Gulfport
With 4,671 households falling in the category, the $50,000 to $74,999 income range is the most frequent in Gulfport, accounting for 16.6% of all households. In contrast, only 929 households (3.3%) fall into the $200,000+ income bracket, making it the least populous group.
| Income Bracket | # Households | % Households |
| Less than $10,000 | 3,011 | 10.7% |
| $10,000 to $14,999 | 1,885 | 6.7% |
| $15,000 to $24,999 | 3,123 | 11.1% |
| $25,000 to $34,999 | 3,883 | 13.8% |
| $35,000 to $49,999 | 3,179 | 11.3% |
| $50,000 to $74,999 | 4,671 | 16.6% |
| $75,000 to $99,999 | 2,673 | 9.5% |
| $100,000 to $149,999 | 3,517 | 12.5% |
| $150,000 to $199,999 | 1,238 | 4.4% |
| $200,000+ | 929 | 3.3% |
Household Income by Householder Age in Gulfport
The median household income in Gulfport is $43,499, with the highest median household income of $51,516 found in the 45 to 64 years age bracket for the primary householder. A total of 9,601 households (34.1%) fall into this category. Meanwhile, the 15 to 24 years age bracket for the primary householder has the lowest median household income of $19,982, with 1,168 households (4.2%) in this group.
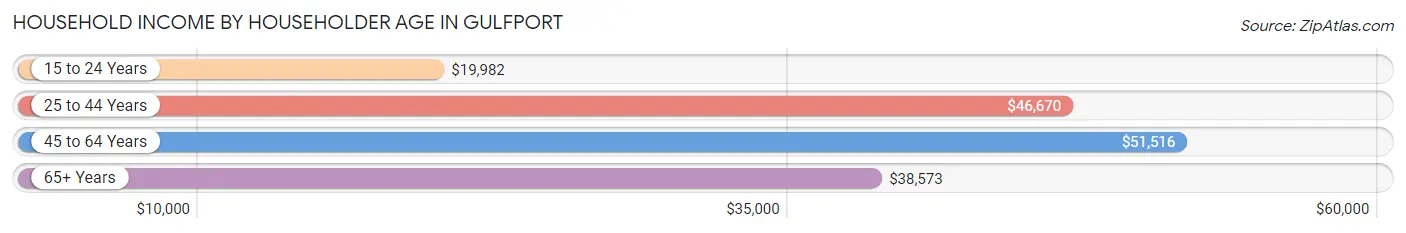
| Income Bracket | # Households | Median Income |
| 15 to 24 Years | 1,168 (4.2%) | $19,982 |
| 25 to 44 Years | 10,426 (37.0%) | $46,670 |
| 45 to 64 Years | 9,601 (34.1%) | $51,516 |
| 65+ Years | 6,942 (24.7%) | $38,573 |
| Total | 28,137 (100.0%) | $43,499 |
Poverty in Gulfport
Income Below Poverty by Sex and Age in Gulfport
With 23.4% poverty level for males and 29.5% for females among the residents of Gulfport, 6 to 11 year old males and 15 year old females are the most vulnerable to poverty, with 1,125 males (42.6%) and 243 females (50.3%) in their respective age groups living below the poverty level.
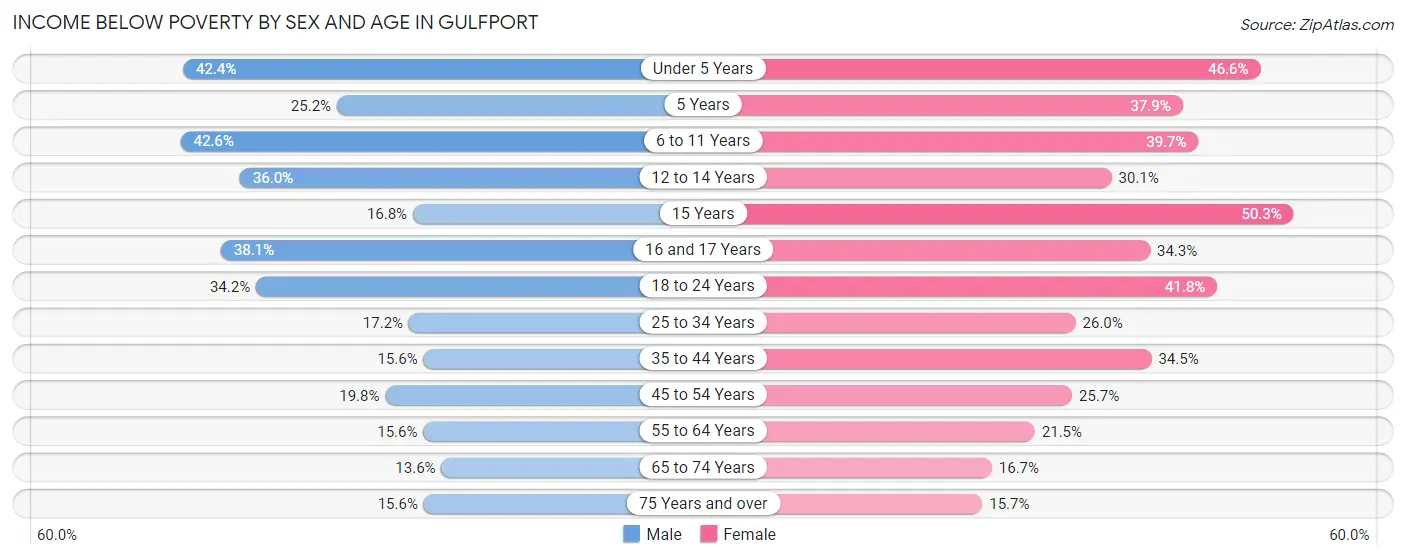
| Age Bracket | Male | Female |
| Under 5 Years | 836 (42.3%) | 1,212 (46.6%) |
| 5 Years | 144 (25.2%) | 203 (37.9%) |
| 6 to 11 Years | 1,125 (42.6%) | 993 (39.7%) |
| 12 to 14 Years | 514 (36.0%) | 375 (30.0%) |
| 15 Years | 99 (16.8%) | 243 (50.3%) |
| 16 and 17 Years | 333 (38.1%) | 265 (34.3%) |
| 18 to 24 Years | 1,187 (34.2%) | 1,308 (41.8%) |
| 25 to 34 Years | 993 (17.2%) | 1,414 (26.0%) |
| 35 to 44 Years | 643 (15.6%) | 1,680 (34.5%) |
| 45 to 54 Years | 718 (19.8%) | 1,232 (25.7%) |
| 55 to 64 Years | 598 (15.6%) | 1,081 (21.5%) |
| 65 to 74 Years | 356 (13.6%) | 531 (16.7%) |
| 75 Years and over | 307 (15.5%) | 396 (15.7%) |
| Total | 7,853 (23.4%) | 10,933 (29.5%) |
Income Above Poverty by Sex and Age in Gulfport
According to the poverty statistics in Gulfport, males aged 65 to 74 years and females aged 75 years and over are the age groups that are most secure financially, with 86.4% of males and 84.4% of females in these age groups living above the poverty line.
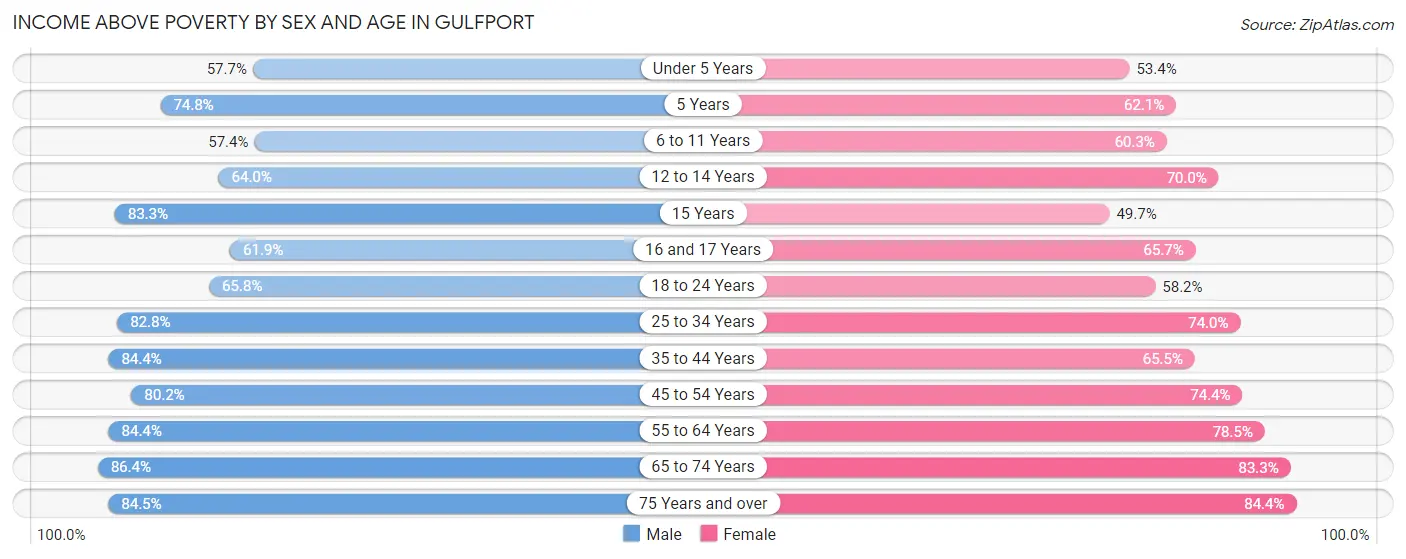
| Age Bracket | Male | Female |
| Under 5 Years | 1,138 (57.7%) | 1,389 (53.4%) |
| 5 Years | 427 (74.8%) | 332 (62.1%) |
| 6 to 11 Years | 1,514 (57.4%) | 1,508 (60.3%) |
| 12 to 14 Years | 913 (64.0%) | 873 (70.0%) |
| 15 Years | 492 (83.3%) | 240 (49.7%) |
| 16 and 17 Years | 540 (61.9%) | 507 (65.7%) |
| 18 to 24 Years | 2,281 (65.8%) | 1,821 (58.2%) |
| 25 to 34 Years | 4,779 (82.8%) | 4,016 (74.0%) |
| 35 to 44 Years | 3,486 (84.4%) | 3,191 (65.5%) |
| 45 to 54 Years | 2,902 (80.2%) | 3,572 (74.4%) |
| 55 to 64 Years | 3,235 (84.4%) | 3,947 (78.5%) |
| 65 to 74 Years | 2,265 (86.4%) | 2,647 (83.3%) |
| 75 Years and over | 1,667 (84.5%) | 2,134 (84.4%) |
| Total | 25,639 (76.5%) | 26,177 (70.5%) |
Income Below Poverty Among Married-Couple Families in Gulfport
The poverty statistics for married-couple families in Gulfport show that 8.5% or 811 of the total 9,536 families live below the poverty line. Families with 3 or 4 children have the highest poverty rate of 26.0%, comprising of 139 families. On the other hand, families with 5 or more children have the lowest poverty rate of 0.0%, which includes 0 families.
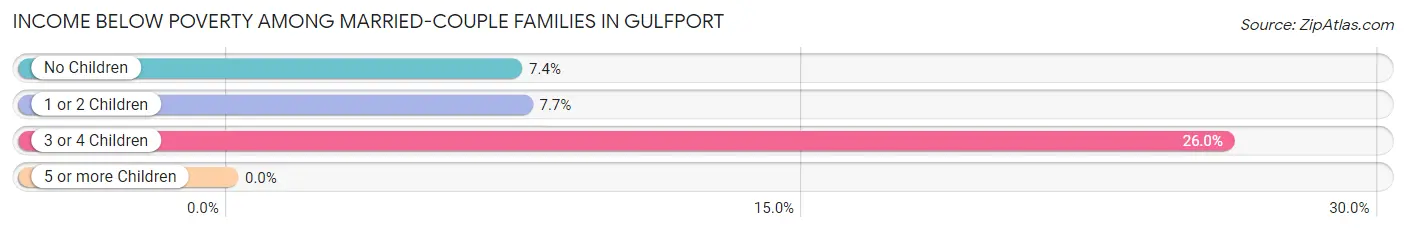
| Children | Above Poverty | Below Poverty |
| No Children | 5,352 (92.6%) | 429 (7.4%) |
| 1 or 2 Children | 2,919 (92.3%) | 243 (7.7%) |
| 3 or 4 Children | 395 (74.0%) | 139 (26.0%) |
| 5 or more Children | 59 (100.0%) | 0 (0.0%) |
| Total | 8,725 (91.5%) | 811 (8.5%) |
Income Below Poverty Among Single-Parent Households in Gulfport
According to the poverty data in Gulfport, 37.0% or 580 single-father households and 41.7% or 2,692 single-mother households are living below the poverty line. Among single-father households, those with 3 or 4 children have the highest poverty rate, with 61 households (61.0%) experiencing poverty. Likewise, among single-mother households, those with 5 or more children have the highest poverty rate, with 158 households (100.0%) falling below the poverty line.
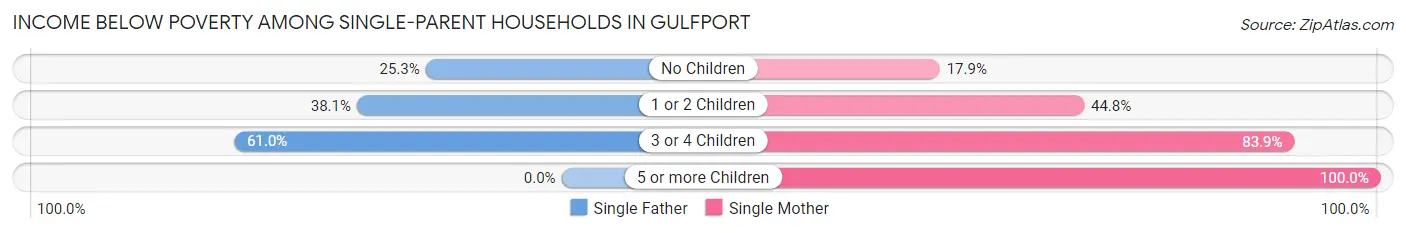
| Children | Single Father | Single Mother |
| No Children | 79 (25.3%) | 384 (17.9%) |
| 1 or 2 Children | 440 (38.1%) | 1,523 (44.8%) |
| 3 or 4 Children | 61 (61.0%) | 627 (83.9%) |
| 5 or more Children | 0 (0.0%) | 158 (100.0%) |
| Total | 580 (37.0%) | 2,692 (41.7%) |
Income Below Poverty Among Married-Couple vs Single-Parent Households in Gulfport
The poverty data for Gulfport shows that 811 of the married-couple family households (8.5%) and 3,272 of the single-parent households (40.8%) are living below the poverty level. Within the married-couple family households, those with 3 or 4 children have the highest poverty rate, with 139 households (26.0%) falling below the poverty line. Among the single-parent households, those with 5 or more children have the highest poverty rate, with 158 household (100.0%) living below poverty.
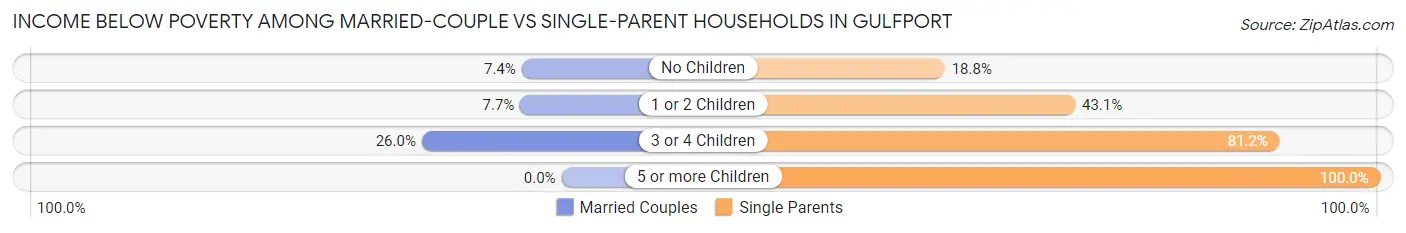
| Children | Married-Couple Families | Single-Parent Households |
| No Children | 429 (7.4%) | 463 (18.8%) |
| 1 or 2 Children | 243 (7.7%) | 1,963 (43.1%) |
| 3 or 4 Children | 139 (26.0%) | 688 (81.2%) |
| 5 or more Children | 0 (0.0%) | 158 (100.0%) |
| Total | 811 (8.5%) | 3,272 (40.8%) |
Race in Gulfport
The most populous races in Gulfport are White / Caucasian (37,608 | 51.9%), Black / African American (27,750 | 38.3%), and Two or more Races (4,499 | 6.2%).
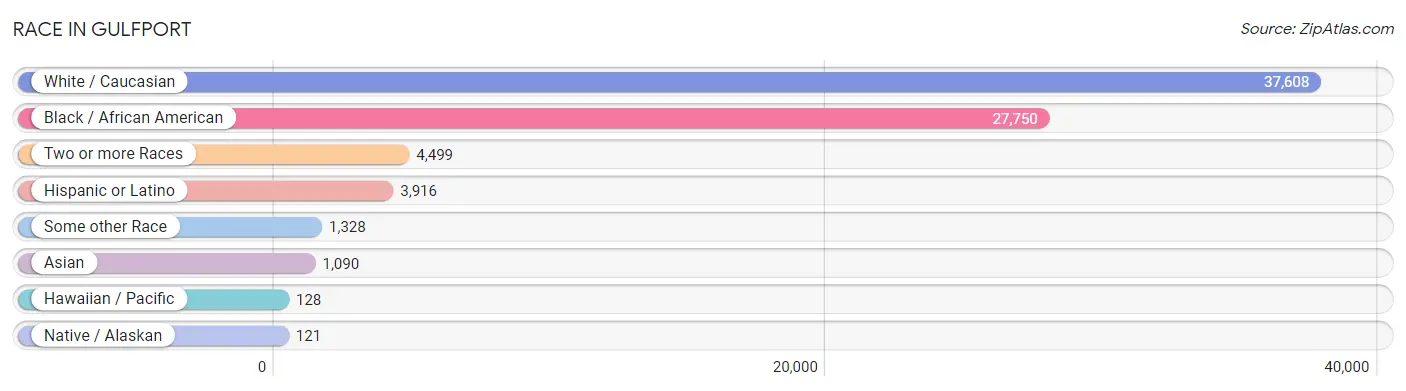
| Race | # Population | % Population |
| Asian | 1,090 | 1.5% |
| Black / African American | 27,750 | 38.3% |
| Hawaiian / Pacific | 128 | 0.2% |
| Hispanic or Latino | 3,916 | 5.4% |
| Native / Alaskan | 121 | 0.2% |
| White / Caucasian | 37,608 | 51.9% |
| Two or more Races | 4,499 | 6.2% |
| Some other Race | 1,328 | 1.8% |
| Total | 72,524 | 100.0% |
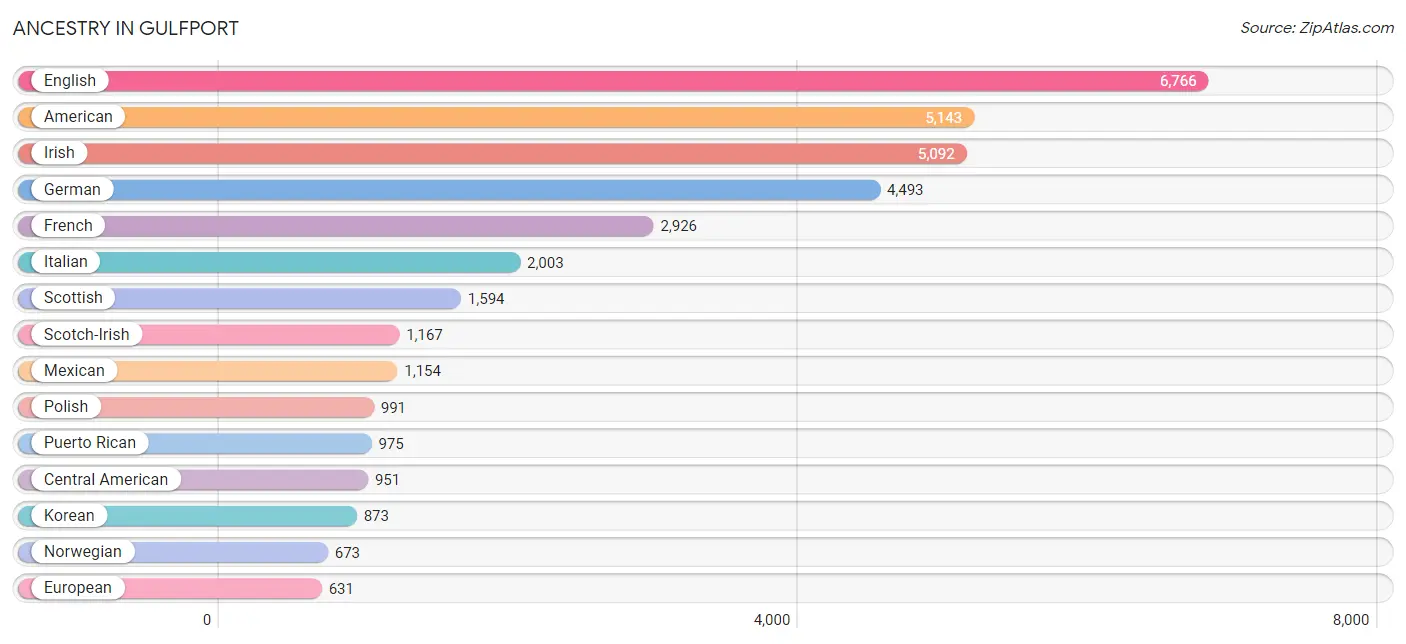
Ancestry in Gulfport
The most populous ancestries reported in Gulfport are English (6,766 | 9.3%), American (5,143 | 7.1%), Irish (5,092 | 7.0%), German (4,493 | 6.2%), and French (2,926 | 4.0%), together accounting for 33.7% of all Gulfport residents.
| Ancestry | # Population | % Population |
| African | 408 | 0.6% |
| Albanian | 14 | 0.0% |
| American | 5,143 | 7.1% |
| Apache | 15 | 0.0% |
| Arab | 166 | 0.2% |
| Argentinean | 22 | 0.0% |
| Austrian | 14 | 0.0% |
| Bangladeshi | 7 | 0.0% |
| Barbadian | 20 | 0.0% |
| Belgian | 17 | 0.0% |
| Bhutanese | 143 | 0.2% |
| Blackfeet | 23 | 0.0% |
| Bolivian | 67 | 0.1% |
| British | 394 | 0.5% |
| Bulgarian | 14 | 0.0% |
| Burmese | 67 | 0.1% |
| Cajun | 28 | 0.0% |
| Canadian | 35 | 0.1% |
| Cape Verdean | 39 | 0.1% |
| Central American | 951 | 1.3% |
| Central American Indian | 5 | 0.0% |
| Cherokee | 276 | 0.4% |
| Chippewa | 4 | 0.0% |
| Choctaw | 196 | 0.3% |
| Colombian | 17 | 0.0% |
| Costa Rican | 55 | 0.1% |
| Croatian | 39 | 0.1% |
| Cuban | 209 | 0.3% |
| Czech | 59 | 0.1% |
| Danish | 137 | 0.2% |
| Dominican | 58 | 0.1% |
| Dutch | 395 | 0.5% |
| Eastern European | 11 | 0.0% |
| English | 6,766 | 9.3% |
| European | 631 | 0.9% |
| Finnish | 24 | 0.0% |
| French | 2,926 | 4.0% |
| French American Indian | 22 | 0.0% |
| French Canadian | 580 | 0.8% |
| German | 4,493 | 6.2% |
| Greek | 112 | 0.2% |
| Guamanian / Chamorro | 161 | 0.2% |
| Guatemalan | 202 | 0.3% |
| Haitian | 104 | 0.1% |
| Honduran | 434 | 0.6% |
| Hungarian | 50 | 0.1% |
| Indian (Asian) | 160 | 0.2% |
| Iranian | 20 | 0.0% |
| Irish | 5,092 | 7.0% |
| Iroquois | 11 | 0.0% |
| Israeli | 27 | 0.0% |
| Italian | 2,003 | 2.8% |
| Jamaican | 257 | 0.4% |
| Japanese | 7 | 0.0% |
| Korean | 873 | 1.2% |
| Lebanese | 131 | 0.2% |
| Lithuanian | 10 | 0.0% |
| Malaysian | 103 | 0.1% |
| Mexican | 1,154 | 1.6% |
| Mexican American Indian | 9 | 0.0% |
| Native Hawaiian | 54 | 0.1% |
| Nigerian | 55 | 0.1% |
| Northern European | 4 | 0.0% |
| Norwegian | 673 | 0.9% |
| Pakistani | 12 | 0.0% |
| Palestinian | 9 | 0.0% |
| Panamanian | 162 | 0.2% |
| Pennsylvania German | 63 | 0.1% |
| Peruvian | 49 | 0.1% |
| Polish | 991 | 1.4% |
| Portuguese | 35 | 0.1% |
| Puerto Rican | 975 | 1.3% |
| Russian | 264 | 0.4% |
| Salvadoran | 98 | 0.1% |
| Scandinavian | 39 | 0.1% |
| Scotch-Irish | 1,167 | 1.6% |
| Scottish | 1,594 | 2.2% |
| Sioux | 17 | 0.0% |
| Slavic | 21 | 0.0% |
| Slovak | 17 | 0.0% |
| Slovene | 7 | 0.0% |
| South African | 14 | 0.0% |
| South American | 155 | 0.2% |
| Spaniard | 249 | 0.3% |
| Spanish | 131 | 0.2% |
| Sri Lankan | 225 | 0.3% |
| Subsaharan African | 525 | 0.7% |
| Swedish | 276 | 0.4% |
| Swiss | 2 | 0.0% |
| Syrian | 21 | 0.0% |
| Thai | 152 | 0.2% |
| Turkish | 69 | 0.1% |
| Ukrainian | 32 | 0.0% |
| Welsh | 315 | 0.4% |
| West Indian | 15 | 0.0% |
| Yugoslavian | 50 | 0.1% | View All 96 Rows |
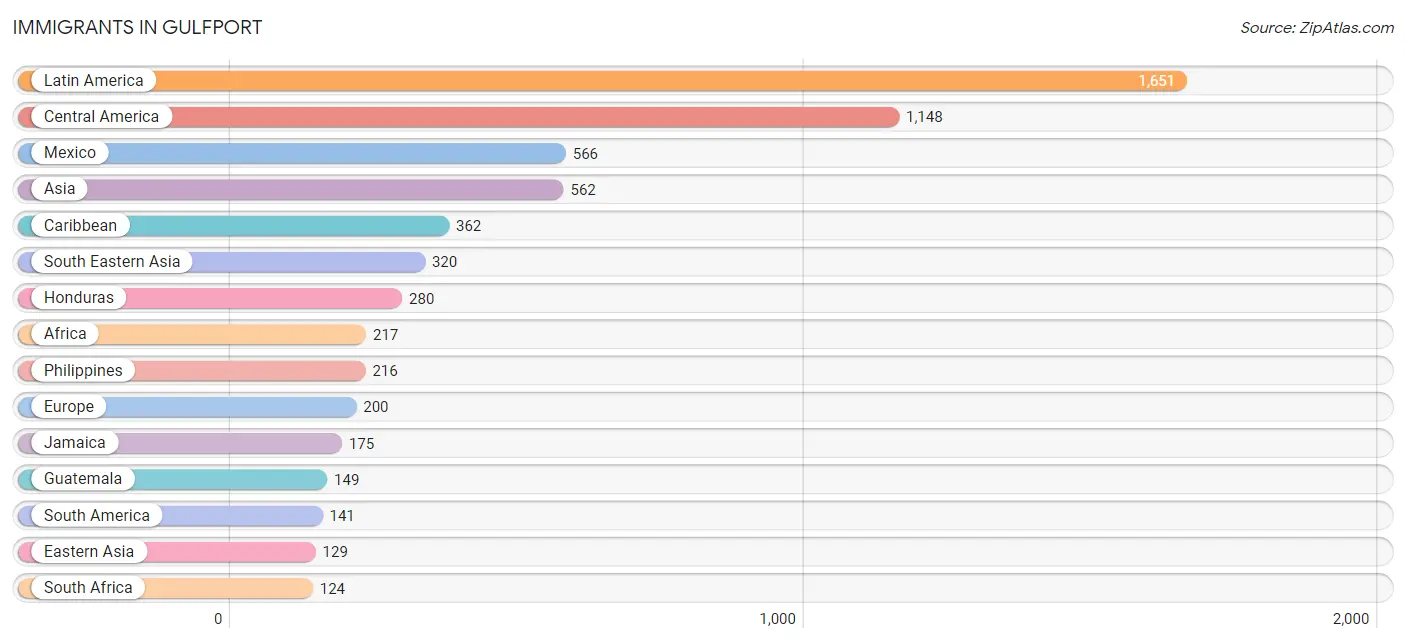
Immigrants in Gulfport
The most numerous immigrant groups reported in Gulfport came from Latin America (1,651 | 2.3%), Central America (1,148 | 1.6%), Mexico (566 | 0.8%), Asia (562 | 0.8%), and Caribbean (362 | 0.5%), together accounting for 5.9% of all Gulfport residents.
| Immigration Origin | # Population | % Population |
| Africa | 217 | 0.3% |
| Argentina | 15 | 0.0% |
| Asia | 562 | 0.8% |
| Bolivia | 70 | 0.1% |
| Bulgaria | 24 | 0.0% |
| Cameroon | 74 | 0.1% |
| Canada | 31 | 0.0% |
| Caribbean | 362 | 0.5% |
| Central America | 1,148 | 1.6% |
| Chile | 12 | 0.0% |
| China | 65 | 0.1% |
| Colombia | 41 | 0.1% |
| Costa Rica | 20 | 0.0% |
| Cuba | 47 | 0.1% |
| Czechoslovakia | 13 | 0.0% |
| Eastern Asia | 129 | 0.2% |
| Eastern Europe | 68 | 0.1% |
| El Salvador | 78 | 0.1% |
| England | 19 | 0.0% |
| Europe | 200 | 0.3% |
| France | 22 | 0.0% |
| Germany | 51 | 0.1% |
| Guatemala | 149 | 0.2% |
| Haiti | 104 | 0.1% |
| Honduras | 280 | 0.4% |
| Hong Kong | 11 | 0.0% |
| India | 40 | 0.1% |
| Iran | 20 | 0.0% |
| Italy | 4 | 0.0% |
| Jamaica | 175 | 0.2% |
| Japan | 31 | 0.0% |
| Korea | 33 | 0.1% |
| Latin America | 1,651 | 2.3% |
| Mexico | 566 | 0.8% |
| Middle Africa | 74 | 0.1% |
| Netherlands | 8 | 0.0% |
| Nicaragua | 27 | 0.0% |
| Northern Europe | 47 | 0.1% |
| Pakistan | 5 | 0.0% |
| Panama | 28 | 0.0% |
| Peru | 3 | 0.0% |
| Philippines | 216 | 0.3% |
| Russia | 31 | 0.0% |
| Sierra Leone | 19 | 0.0% |
| South Africa | 124 | 0.2% |
| South America | 141 | 0.2% |
| South Central Asia | 65 | 0.1% |
| South Eastern Asia | 320 | 0.4% |
| Southern Europe | 4 | 0.0% |
| St. Vincent and the Grenadines | 21 | 0.0% |
| Syria | 28 | 0.0% |
| Thailand | 12 | 0.0% |
| Trinidad and Tobago | 15 | 0.0% |
| Turkey | 6 | 0.0% |
| Vietnam | 92 | 0.1% |
| Western Africa | 19 | 0.0% |
| Western Asia | 48 | 0.1% |
| Western Europe | 81 | 0.1% | View All 58 Rows |
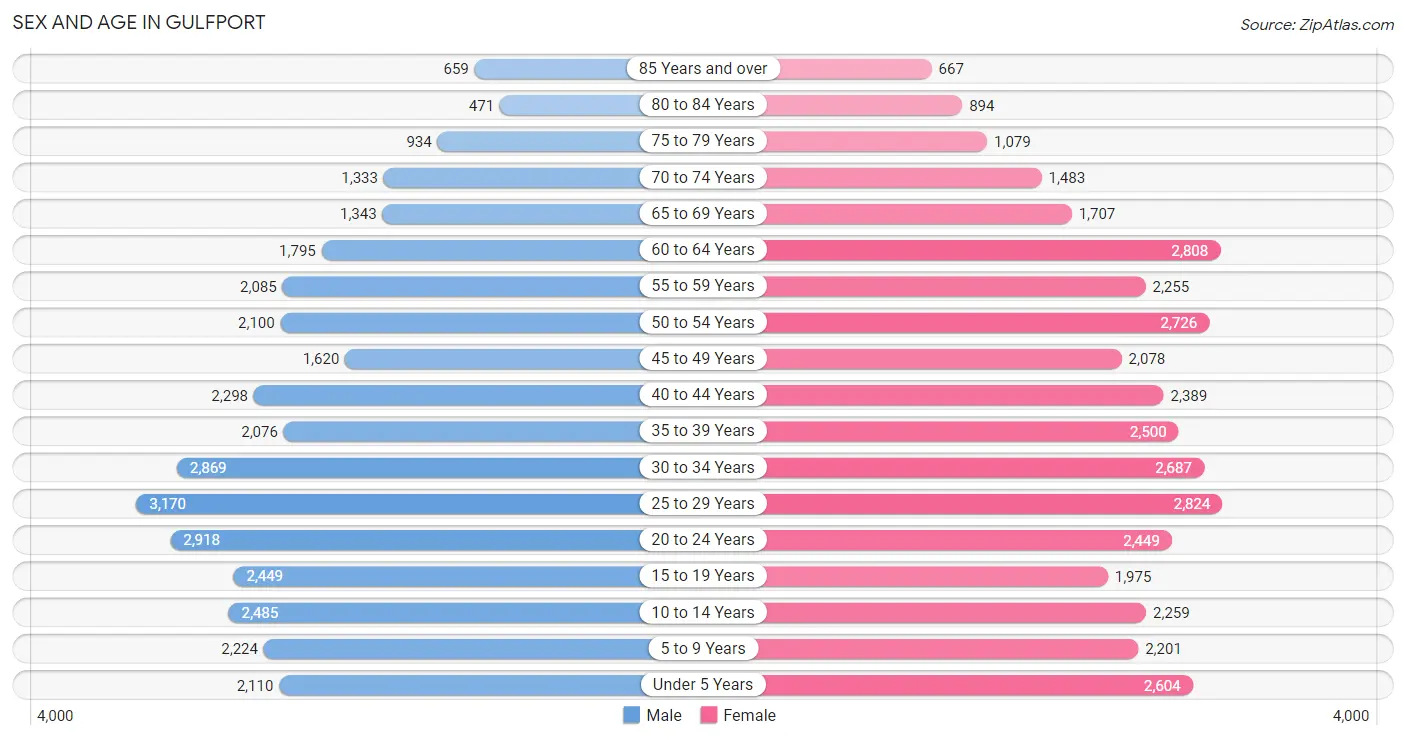
Sex and Age in Gulfport
Sex and Age in Gulfport
The most populous age groups in Gulfport are 25 to 29 Years (3,170 | 9.1%) for men and 25 to 29 Years (2,824 | 7.5%) for women.
| Age Bracket | Male | Female |
| Under 5 Years | 2,110 (6.0%) | 2,604 (6.9%) |
| 5 to 9 Years | 2,224 (6.4%) | 2,201 (5.9%) |
| 10 to 14 Years | 2,485 (7.1%) | 2,259 (6.0%) |
| 15 to 19 Years | 2,449 (7.0%) | 1,975 (5.2%) |
| 20 to 24 Years | 2,918 (8.4%) | 2,449 (6.5%) |
| 25 to 29 Years | 3,170 (9.1%) | 2,824 (7.5%) |
| 30 to 34 Years | 2,869 (8.2%) | 2,687 (7.1%) |
| 35 to 39 Years | 2,076 (5.9%) | 2,500 (6.7%) |
| 40 to 44 Years | 2,298 (6.6%) | 2,389 (6.4%) |
| 45 to 49 Years | 1,620 (4.6%) | 2,078 (5.5%) |
| 50 to 54 Years | 2,100 (6.0%) | 2,726 (7.2%) |
| 55 to 59 Years | 2,085 (6.0%) | 2,255 (6.0%) |
| 60 to 64 Years | 1,795 (5.1%) | 2,808 (7.5%) |
| 65 to 69 Years | 1,343 (3.8%) | 1,707 (4.5%) |
| 70 to 74 Years | 1,333 (3.8%) | 1,483 (4.0%) |
| 75 to 79 Years | 934 (2.7%) | 1,079 (2.9%) |
| 80 to 84 Years | 471 (1.3%) | 894 (2.4%) |
| 85 Years and over | 659 (1.9%) | 667 (1.8%) |
| Total | 34,939 (100.0%) | 37,585 (100.0%) |
Families and Households in Gulfport
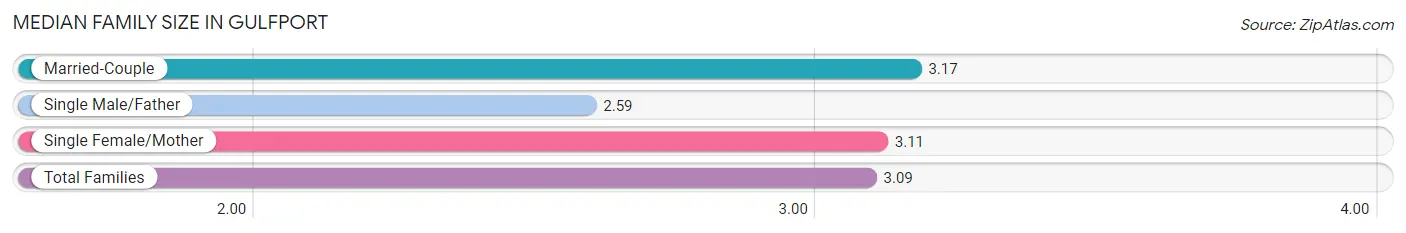
Median Family Size in Gulfport
The median family size in Gulfport is 3.09 persons per family, with married-couple families (9,536 | 54.3%) accounting for the largest median family size of 3.17 persons per family. On the other hand, single male/father families (1,566 | 8.9%) represent the smallest median family size with 2.59 persons per family.
| Family Type | # Families | Family Size |
| Married-Couple | 9,536 (54.3%) | 3.17 |
| Single Male/Father | 1,566 (8.9%) | 2.59 |
| Single Female/Mother | 6,454 (36.8%) | 3.11 |
| Total Families | 17,556 (100.0%) | 3.09 |
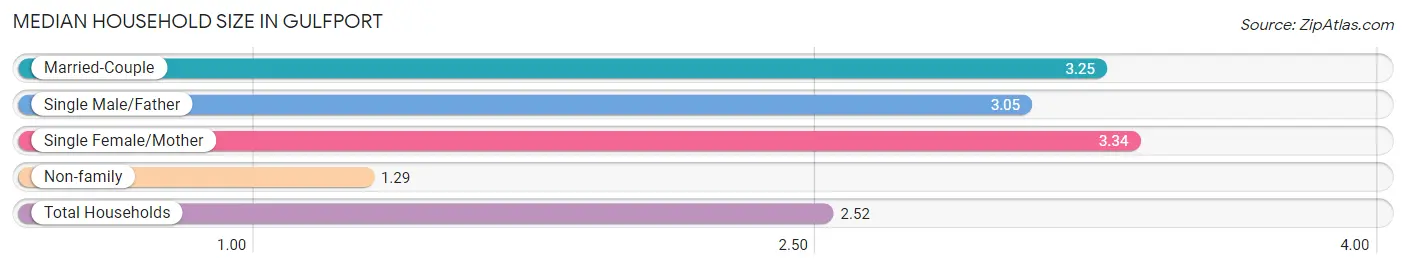
Median Household Size in Gulfport
The median household size in Gulfport is 2.52 persons per household, with single female/mother households (6,454 | 22.9%) accounting for the largest median household size of 3.34 persons per household. non-family households (10,581 | 37.6%) represent the smallest median household size with 1.29 persons per household.
| Household Type | # Households | Household Size |
| Married-Couple | 9,536 (33.9%) | 3.25 |
| Single Male/Father | 1,566 (5.6%) | 3.05 |
| Single Female/Mother | 6,454 (22.9%) | 3.34 |
| Non-family | 10,581 (37.6%) | 1.29 |
| Total Households | 28,137 (100.0%) | 2.52 |
Household Size by Marriage Status in Gulfport
Out of a total of 28,137 households in Gulfport, 17,556 (62.4%) are family households, while 10,581 (37.6%) are nonfamily households. The most numerous type of family households are 2-person households, comprising 7,761, and the most common type of nonfamily households are 1-person households, comprising 8,500.
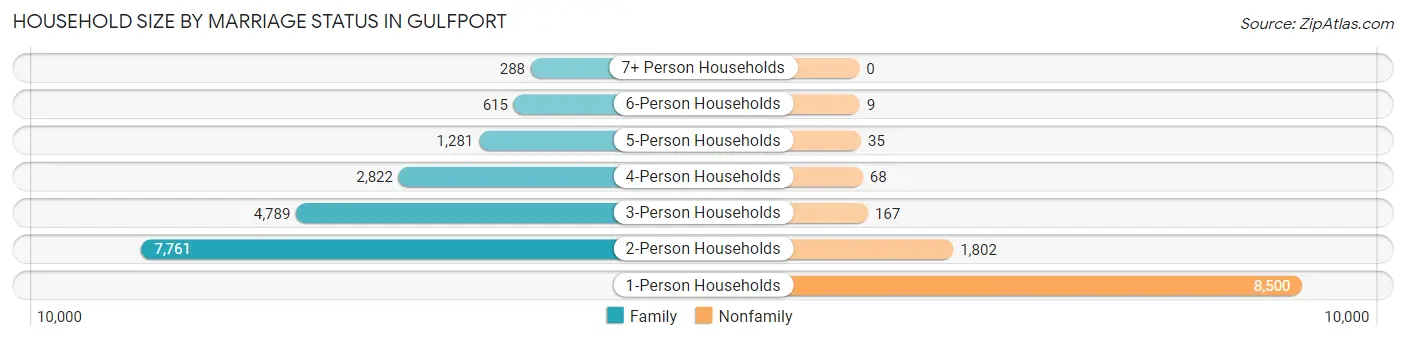
| Household Size | Family Households | Nonfamily Households |
| 1-Person Households | - | 8,500 (30.2%) |
| 2-Person Households | 7,761 (27.6%) | 1,802 (6.4%) |
| 3-Person Households | 4,789 (17.0%) | 167 (0.6%) |
| 4-Person Households | 2,822 (10.0%) | 68 (0.2%) |
| 5-Person Households | 1,281 (4.5%) | 35 (0.1%) |
| 6-Person Households | 615 (2.2%) | 9 (0.0%) |
| 7+ Person Households | 288 (1.0%) | 0 (0.0%) |
| Total | 17,556 (62.4%) | 10,581 (37.6%) |
Female Fertility in Gulfport
Fertility by Age in Gulfport
Average fertility rate in Gulfport is 54.0 births per 1,000 women. Women in the age bracket of 20 to 34 years have the highest fertility rate with 91.0 births per 1,000 women. Women in the age bracket of 20 to 34 years acount for 77.3% of all women with births.
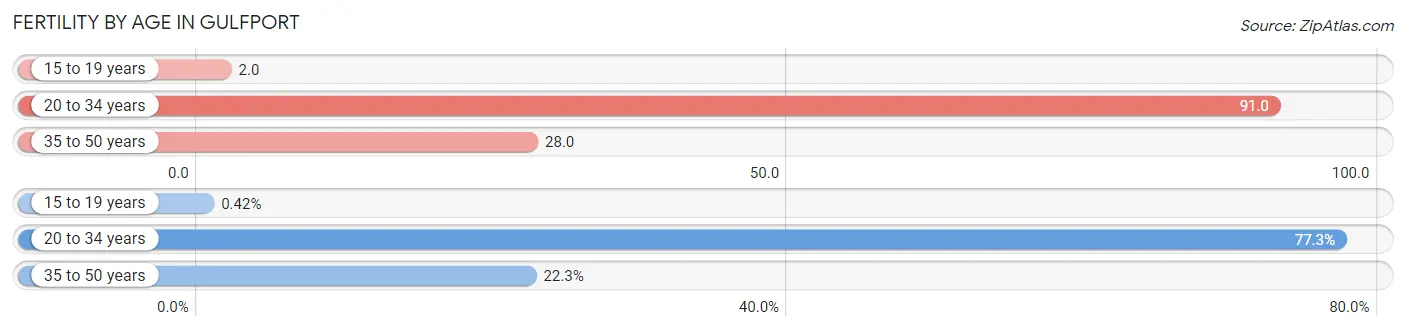
| Age Bracket | Women with Births | Births / 1,000 Women |
| 15 to 19 years | 4 (0.4%) | 2.0 |
| 20 to 34 years | 728 (77.3%) | 91.0 |
| 35 to 50 years | 210 (22.3%) | 28.0 |
| Total | 942 (100.0%) | 54.0 |
Fertility by Age by Marriage Status in Gulfport
31.2% of women with births (942) in Gulfport are married. The highest percentage of unmarried women with births falls into 15 to 19 years age bracket with 100.0% of them unmarried at the time of birth, while the lowest percentage of unmarried women with births belong to 35 to 50 years age bracket with 48.1% of them unmarried.
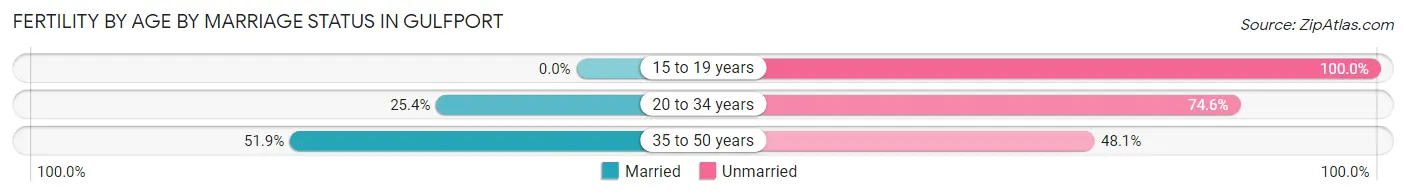
| Age Bracket | Married | Unmarried |
| 15 to 19 years | 0 (0.0%) | 4 (100.0%) |
| 20 to 34 years | 185 (25.4%) | 543 (74.6%) |
| 35 to 50 years | 109 (51.9%) | 101 (48.1%) |
| Total | 294 (31.2%) | 648 (68.8%) |
Fertility by Education in Gulfport
Average fertility rate in Gulfport is 54.0 births per 1,000 women. Women with the education attainment of bachelor's degree have the highest fertility rate of 76.0 births per 1,000 women, while women with the education attainment of less than high school have the lowest fertility at 26.0 births per 1,000 women. Women with the education attainment of college or associate's degree represent 35.0% of all women with births.
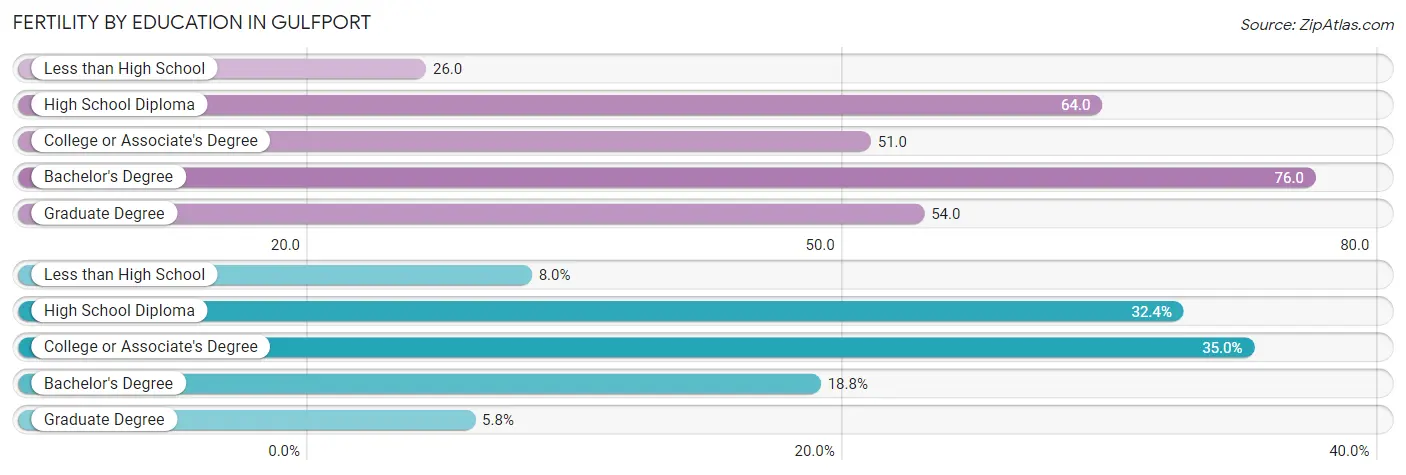
| Educational Attainment | Women with Births | Births / 1,000 Women |
| Less than High School | 75 (8.0%) | 26.0 |
| High School Diploma | 305 (32.4%) | 64.0 |
| College or Associate's Degree | 330 (35.0%) | 51.0 |
| Bachelor's Degree | 177 (18.8%) | 76.0 |
| Graduate Degree | 55 (5.8%) | 54.0 |
| Total | 942 (100.0%) | 54.0 |
Fertility by Education by Marriage Status in Gulfport
68.8% of women with births in Gulfport are unmarried. Women with the educational attainment of graduate degree are most likely to be married with 100.0% of them married at childbirth, while women with the educational attainment of high school diploma are least likely to be married with 93.4% of them unmarried at childbirth.
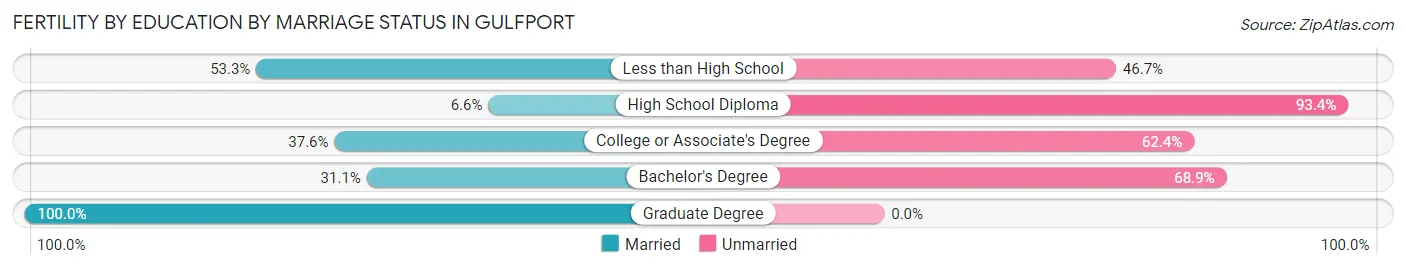
| Educational Attainment | Married | Unmarried |
| Less than High School | 40 (53.3%) | 35 (46.7%) |
| High School Diploma | 20 (6.6%) | 285 (93.4%) |
| College or Associate's Degree | 124 (37.6%) | 206 (62.4%) |
| Bachelor's Degree | 55 (31.1%) | 122 (68.9%) |
| Graduate Degree | 55 (100.0%) | 0 (0.0%) |
| Total | 294 (31.2%) | 648 (68.8%) |
Employment Characteristics in Gulfport
Employment by Class of Employer in Gulfport
Among the 30,018 employed individuals in Gulfport, private company employees (19,373 | 64.5%), federal government employees (3,100 | 10.3%), and not-for-profit organizations (1,735 | 5.8%) make up the most common classes of employment.
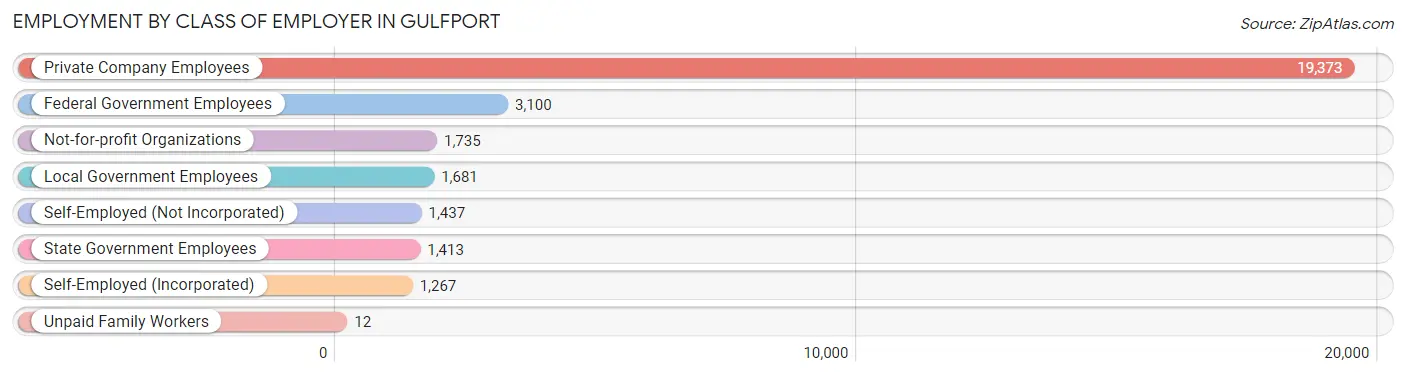
| Employer Class | # Employees | % Employees |
| Private Company Employees | 19,373 | 64.5% |
| Self-Employed (Incorporated) | 1,267 | 4.2% |
| Self-Employed (Not Incorporated) | 1,437 | 4.8% |
| Not-for-profit Organizations | 1,735 | 5.8% |
| Local Government Employees | 1,681 | 5.6% |
| State Government Employees | 1,413 | 4.7% |
| Federal Government Employees | 3,100 | 10.3% |
| Unpaid Family Workers | 12 | 0.0% |
| Total | 30,018 | 100.0% |
Employment Status by Age in Gulfport
According to the labor force statistics for Gulfport, out of the total population over 16 years of age (57,567), 59.5% or 34,252 individuals are in the labor force, with 11.4% or 3,905 of them unemployed. The age group with the highest labor force participation rate is 30 to 34 years, with 81.7% or 4,539 individuals in the labor force. Within the labor force, the 16 to 19 years age range has the highest percentage of unemployed individuals, with 27.0% or 320 of them being unemployed.
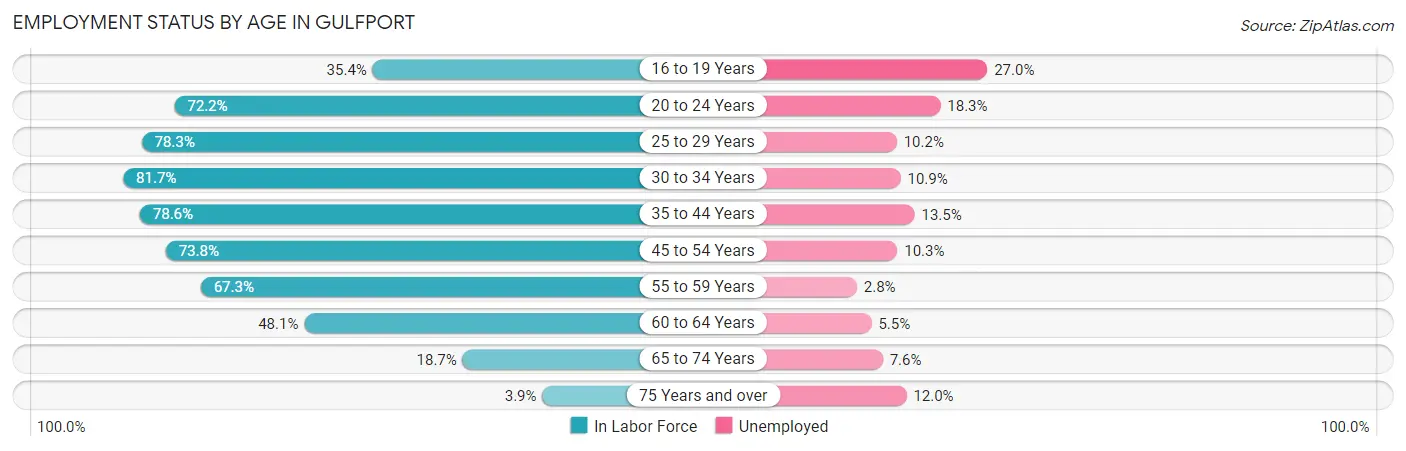
| Age Bracket | In Labor Force | Unemployed |
| 16 to 19 Years | 1,186 (35.4%) | 320 (27.0%) |
| 20 to 24 Years | 3,875 (72.2%) | 709 (18.3%) |
| 25 to 29 Years | 4,693 (78.3%) | 479 (10.2%) |
| 30 to 34 Years | 4,539 (81.7%) | 495 (10.9%) |
| 35 to 44 Years | 7,281 (78.6%) | 983 (13.5%) |
| 45 to 54 Years | 6,291 (73.8%) | 648 (10.3%) |
| 55 to 59 Years | 2,921 (67.3%) | 82 (2.8%) |
| 60 to 64 Years | 2,214 (48.1%) | 122 (5.5%) |
| 65 to 74 Years | 1,097 (18.7%) | 83 (7.6%) |
| 75 Years and over | 183 (3.9%) | 22 (12.0%) |
| Total | 34,252 (59.5%) | 3,905 (11.4%) |
Employment Status by Educational Attainment in Gulfport
According to labor force statistics for Gulfport, 73.0% of individuals (27,944) out of the total population between 25 and 64 years of age (38,280) are in the labor force, with 10.0% or 2,794 of them being unemployed. The group with the highest labor force participation rate are those with the educational attainment of bachelor's degree or higher, with 90.1% or 7,858 individuals in the labor force. Within the labor force, individuals with less than high school education have the highest percentage of unemployment, with 18.9% or 500 of them being unemployed.
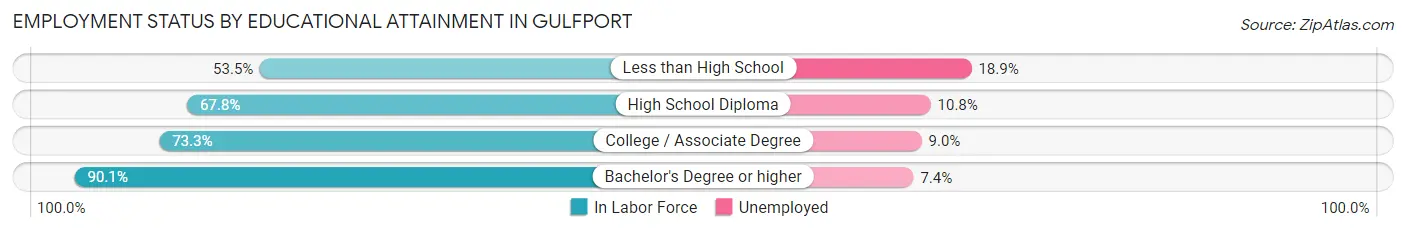
| Educational Attainment | In Labor Force | Unemployed |
| Less than High School | 2,643 (53.5%) | 934 (18.9%) |
| High School Diploma | 7,622 (67.8%) | 1,214 (10.8%) |
| College / Associate Degree | 9,805 (73.3%) | 1,204 (9.0%) |
| Bachelor's Degree or higher | 7,858 (90.1%) | 645 (7.4%) |
| Total | 27,944 (73.0%) | 3,828 (10.0%) |
Employment Occupations by Sex in Gulfport
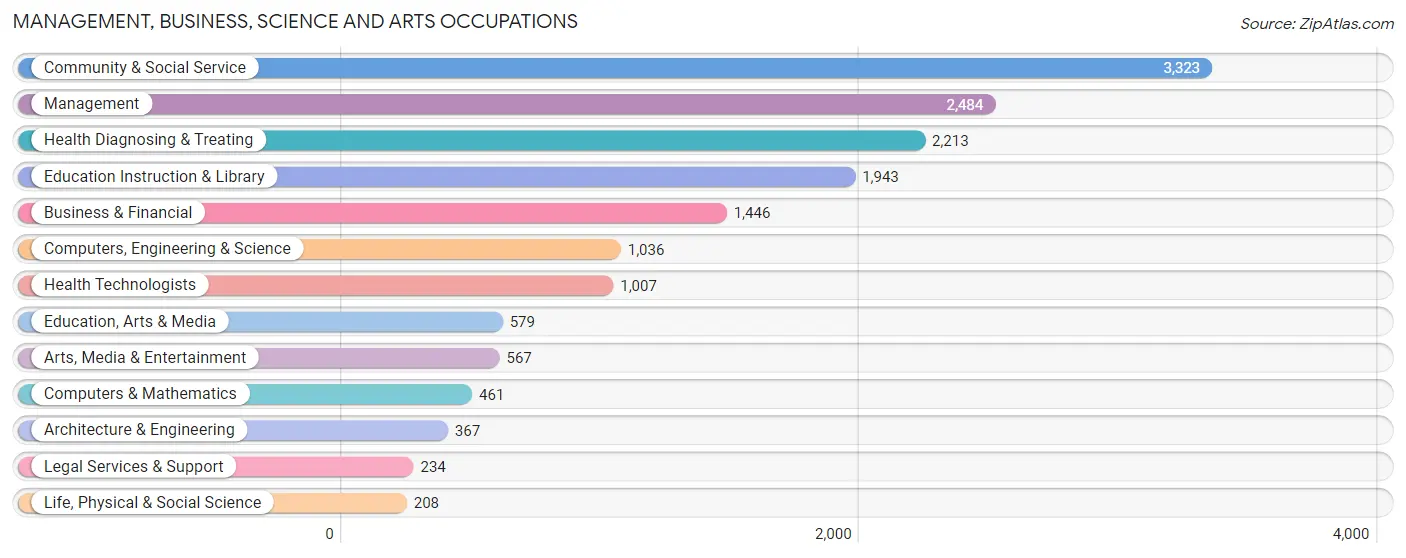
Management, Business, Science and Arts Occupations
The most common Management, Business, Science and Arts occupations in Gulfport are Community & Social Service (3,323 | 11.4%), Management (2,484 | 8.5%), Health Diagnosing & Treating (2,213 | 7.6%), Education Instruction & Library (1,943 | 6.6%), and Business & Financial (1,446 | 4.9%).
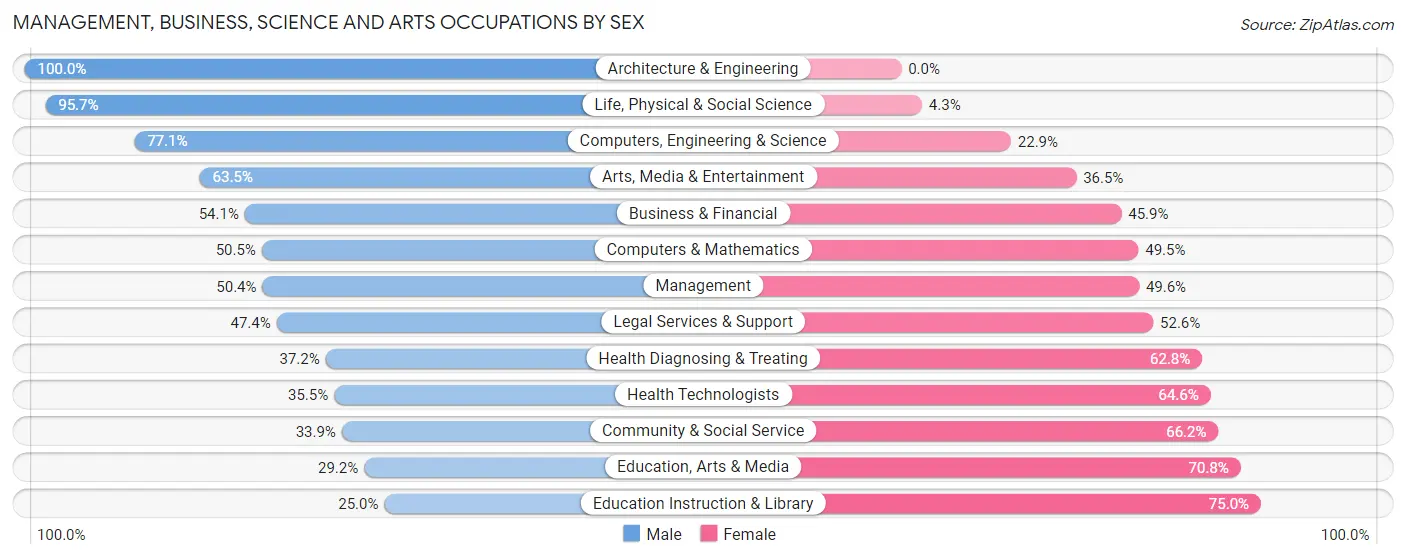
Management, Business, Science and Arts Occupations by Sex
Within the Management, Business, Science and Arts occupations in Gulfport, the most male-oriented occupations are Architecture & Engineering (100.0%), Life, Physical & Social Science (95.7%), and Computers, Engineering & Science (77.1%), while the most female-oriented occupations are Education Instruction & Library (75.0%), Education, Arts & Media (70.8%), and Community & Social Service (66.1%).
| Occupation | Male | Female |
| Management | 1,252 (50.4%) | 1,232 (49.6%) |
| Business & Financial | 782 (54.1%) | 664 (45.9%) |
| Computers, Engineering & Science | 799 (77.1%) | 237 (22.9%) |
| Computers & Mathematics | 233 (50.5%) | 228 (49.5%) |
| Architecture & Engineering | 367 (100.0%) | 0 (0.0%) |
| Life, Physical & Social Science | 199 (95.7%) | 9 (4.3%) |
| Community & Social Service | 1,125 (33.9%) | 2,198 (66.1%) |
| Education, Arts & Media | 169 (29.2%) | 410 (70.8%) |
| Legal Services & Support | 111 (47.4%) | 123 (52.6%) |
| Education Instruction & Library | 485 (25.0%) | 1,458 (75.0%) |
| Arts, Media & Entertainment | 360 (63.5%) | 207 (36.5%) |
| Health Diagnosing & Treating | 824 (37.2%) | 1,389 (62.8%) |
| Health Technologists | 357 (35.4%) | 650 (64.5%) |
| Total (Category) | 4,782 (45.5%) | 5,720 (54.5%) |
| Total (Overall) | 14,171 (48.4%) | 15,115 (51.6%) |
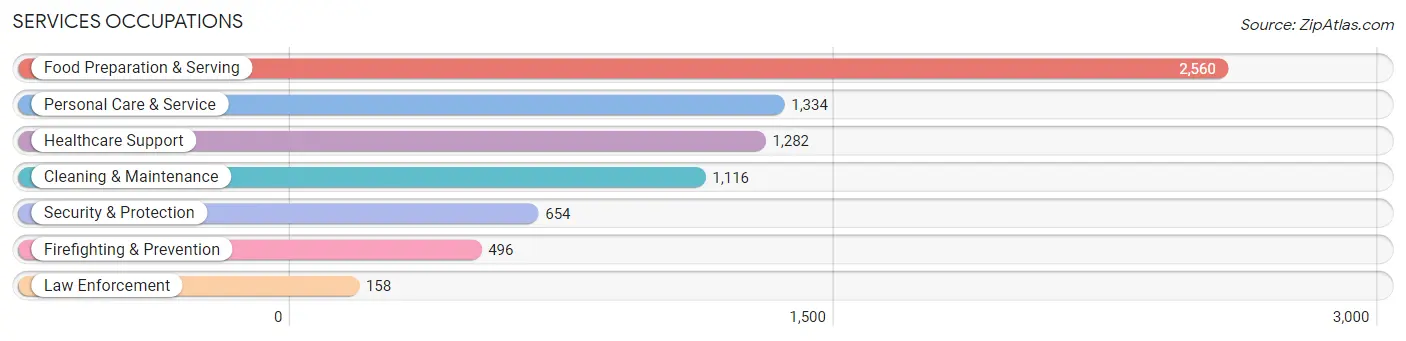
Services Occupations
The most common Services occupations in Gulfport are Food Preparation & Serving (2,560 | 8.7%), Personal Care & Service (1,334 | 4.6%), Healthcare Support (1,282 | 4.4%), Cleaning & Maintenance (1,116 | 3.8%), and Security & Protection (654 | 2.2%).
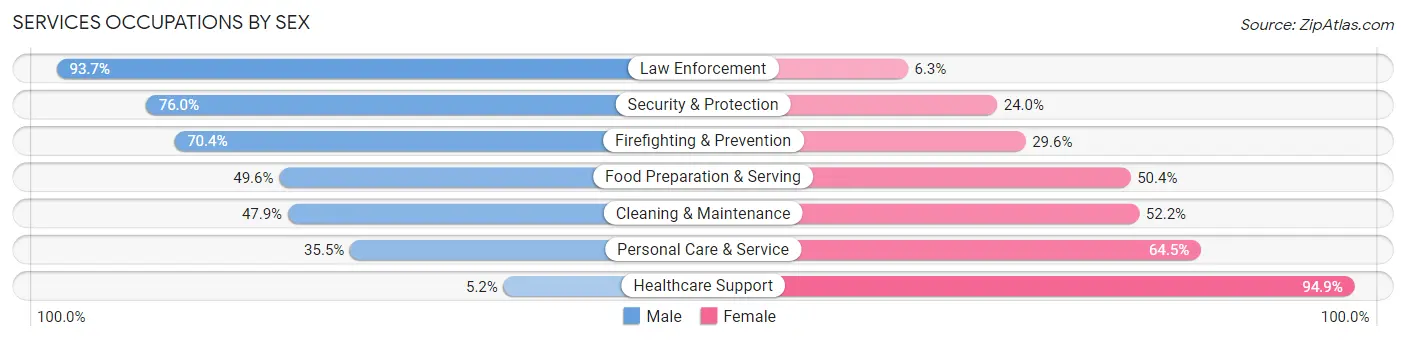
Services Occupations by Sex
Within the Services occupations in Gulfport, the most male-oriented occupations are Law Enforcement (93.7%), Security & Protection (76.0%), and Firefighting & Prevention (70.4%), while the most female-oriented occupations are Healthcare Support (94.9%), Personal Care & Service (64.5%), and Cleaning & Maintenance (52.1%).
| Occupation | Male | Female |
| Healthcare Support | 66 (5.1%) | 1,216 (94.9%) |
| Security & Protection | 497 (76.0%) | 157 (24.0%) |
| Firefighting & Prevention | 349 (70.4%) | 147 (29.6%) |
| Law Enforcement | 148 (93.7%) | 10 (6.3%) |
| Food Preparation & Serving | 1,269 (49.6%) | 1,291 (50.4%) |
| Cleaning & Maintenance | 534 (47.8%) | 582 (52.1%) |
| Personal Care & Service | 474 (35.5%) | 860 (64.5%) |
| Total (Category) | 2,840 (40.9%) | 4,106 (59.1%) |
| Total (Overall) | 14,171 (48.4%) | 15,115 (51.6%) |
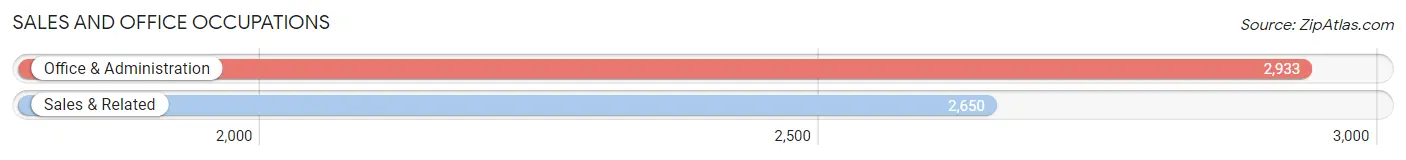
Sales and Office Occupations
The most common Sales and Office occupations in Gulfport are Office & Administration (2,933 | 10.0%), and Sales & Related (2,650 | 9.0%).
Sales and Office Occupations by Sex

| Occupation | Male | Female |
| Sales & Related | 980 (37.0%) | 1,670 (63.0%) |
| Office & Administration | 361 (12.3%) | 2,572 (87.7%) |
| Total (Category) | 1,341 (24.0%) | 4,242 (76.0%) |
| Total (Overall) | 14,171 (48.4%) | 15,115 (51.6%) |
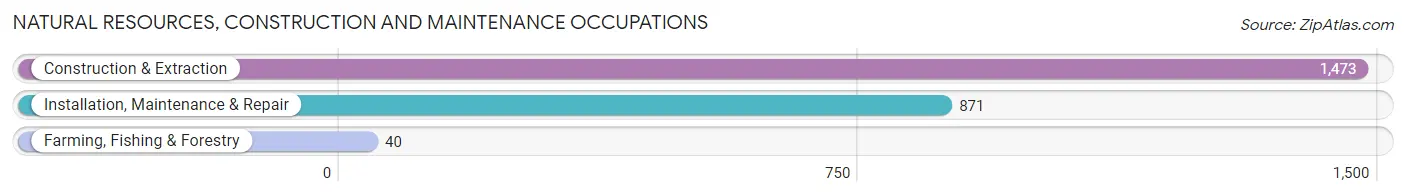
Natural Resources, Construction and Maintenance Occupations
The most common Natural Resources, Construction and Maintenance occupations in Gulfport are Construction & Extraction (1,473 | 5.0%), Installation, Maintenance & Repair (871 | 3.0%), and Farming, Fishing & Forestry (40 | 0.1%).
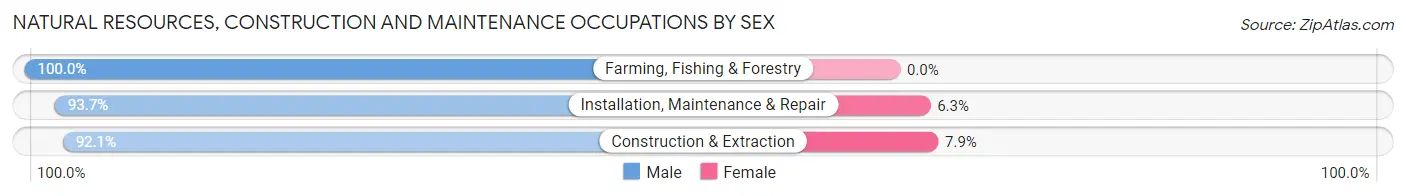
Natural Resources, Construction and Maintenance Occupations by Sex
| Occupation | Male | Female |
| Farming, Fishing & Forestry | 40 (100.0%) | 0 (0.0%) |
| Construction & Extraction | 1,356 (92.1%) | 117 (7.9%) |
| Installation, Maintenance & Repair | 816 (93.7%) | 55 (6.3%) |
| Total (Category) | 2,212 (92.8%) | 172 (7.2%) |
| Total (Overall) | 14,171 (48.4%) | 15,115 (51.6%) |
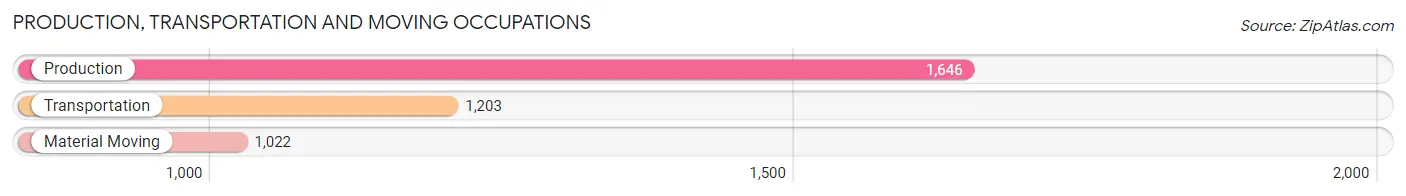
Production, Transportation and Moving Occupations
The most common Production, Transportation and Moving occupations in Gulfport are Production (1,646 | 5.6%), Transportation (1,203 | 4.1%), and Material Moving (1,022 | 3.5%).
Production, Transportation and Moving Occupations by Sex
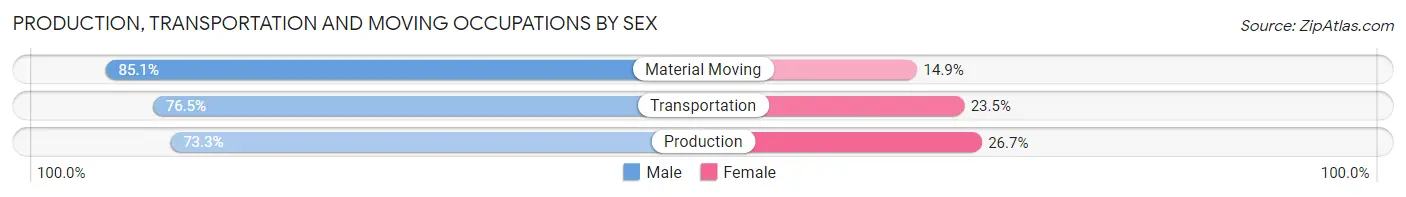
| Occupation | Male | Female |
| Production | 1,206 (73.3%) | 440 (26.7%) |
| Transportation | 920 (76.5%) | 283 (23.5%) |
| Material Moving | 870 (85.1%) | 152 (14.9%) |
| Total (Category) | 2,996 (77.4%) | 875 (22.6%) |
| Total (Overall) | 14,171 (48.4%) | 15,115 (51.6%) |
Employment Industries by Sex in Gulfport
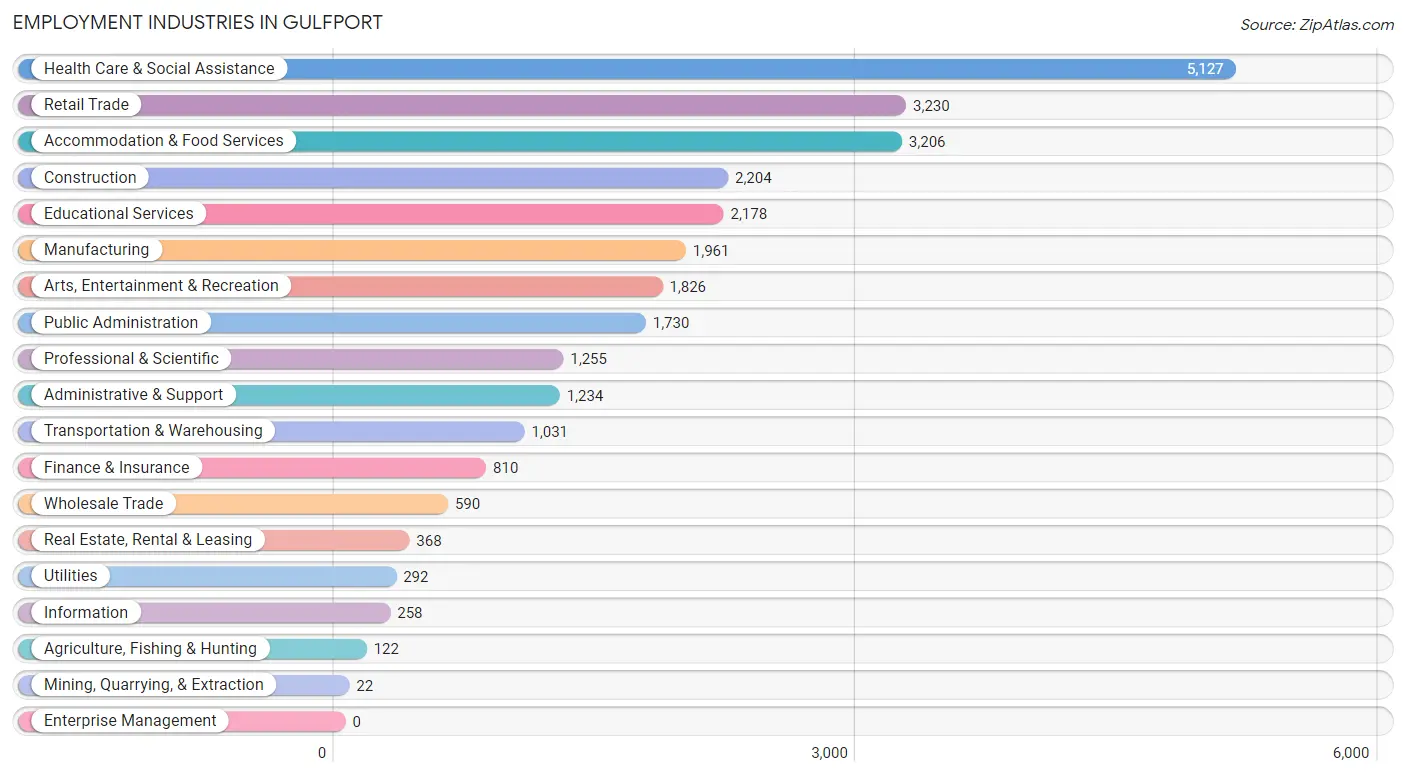
Employment Industries in Gulfport
The major employment industries in Gulfport include Health Care & Social Assistance (5,127 | 17.5%), Retail Trade (3,230 | 11.0%), Accommodation & Food Services (3,206 | 11.0%), Construction (2,204 | 7.5%), and Educational Services (2,178 | 7.4%).
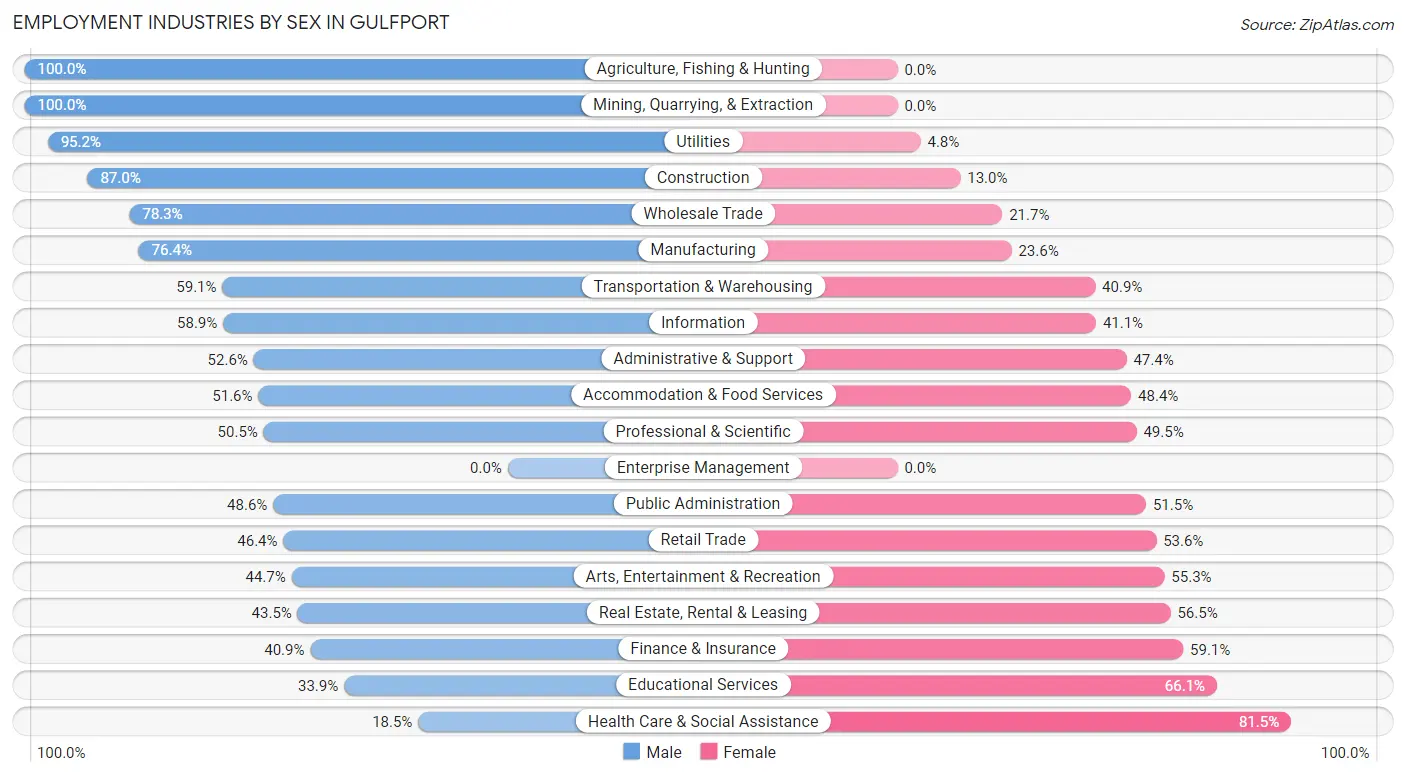
Employment Industries by Sex in Gulfport
The Gulfport industries that see more men than women are Agriculture, Fishing & Hunting (100.0%), Mining, Quarrying, & Extraction (100.0%), and Utilities (95.2%), whereas the industries that tend to have a higher number of women are Health Care & Social Assistance (81.5%), Educational Services (66.1%), and Finance & Insurance (59.1%).
| Industry | Male | Female |
| Agriculture, Fishing & Hunting | 122 (100.0%) | 0 (0.0%) |
| Mining, Quarrying, & Extraction | 22 (100.0%) | 0 (0.0%) |
| Construction | 1,917 (87.0%) | 287 (13.0%) |
| Manufacturing | 1,498 (76.4%) | 463 (23.6%) |
| Wholesale Trade | 462 (78.3%) | 128 (21.7%) |
| Retail Trade | 1,500 (46.4%) | 1,730 (53.6%) |
| Transportation & Warehousing | 609 (59.1%) | 422 (40.9%) |
| Utilities | 278 (95.2%) | 14 (4.8%) |
| Information | 152 (58.9%) | 106 (41.1%) |
| Finance & Insurance | 331 (40.9%) | 479 (59.1%) |
| Real Estate, Rental & Leasing | 160 (43.5%) | 208 (56.5%) |
| Professional & Scientific | 634 (50.5%) | 621 (49.5%) |
| Enterprise Management | 0 (0.0%) | 0 (0.0%) |
| Administrative & Support | 649 (52.6%) | 585 (47.4%) |
| Educational Services | 738 (33.9%) | 1,440 (66.1%) |
| Health Care & Social Assistance | 950 (18.5%) | 4,177 (81.5%) |
| Arts, Entertainment & Recreation | 817 (44.7%) | 1,009 (55.3%) |
| Accommodation & Food Services | 1,655 (51.6%) | 1,551 (48.4%) |
| Public Administration | 840 (48.5%) | 890 (51.4%) |
| Total | 14,171 (48.4%) | 15,115 (51.6%) |
Education in Gulfport
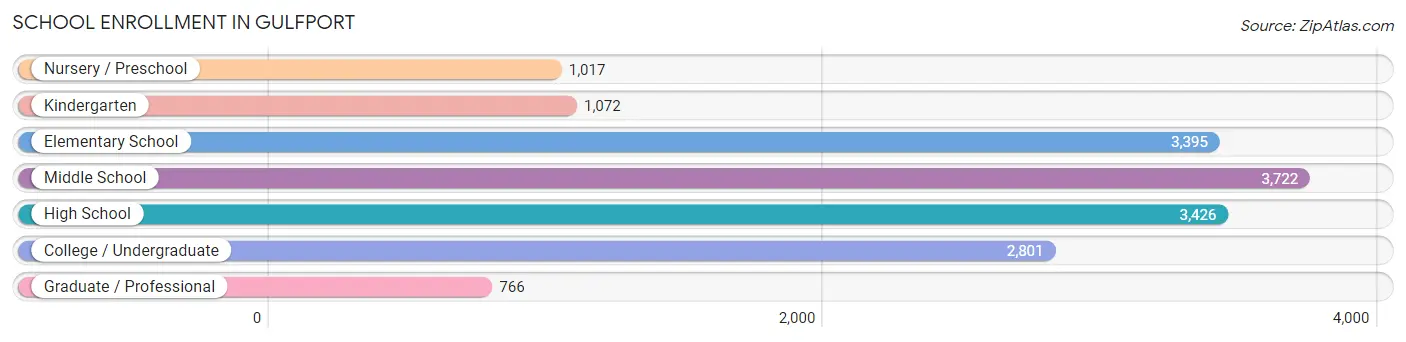
School Enrollment in Gulfport
The most common levels of schooling among the 16,199 students in Gulfport are middle school (3,722 | 23.0%), high school (3,426 | 21.1%), and elementary school (3,395 | 21.0%).
| School Level | # Students | % Students |
| Nursery / Preschool | 1,017 | 6.3% |
| Kindergarten | 1,072 | 6.6% |
| Elementary School | 3,395 | 21.0% |
| Middle School | 3,722 | 23.0% |
| High School | 3,426 | 21.1% |
| College / Undergraduate | 2,801 | 17.3% |
| Graduate / Professional | 766 | 4.7% |
| Total | 16,199 | 100.0% |
School Enrollment by Age by Funding Source in Gulfport
Out of a total of 16,199 students who are enrolled in schools in Gulfport, 1,960 (12.1%) attend a private institution, while the remaining 14,239 (87.9%) are enrolled in public schools. The age group of 3 to 4 year olds has the highest likelihood of being enrolled in private schools, with 250 (33.4% in the age bracket) enrolled. Conversely, the age group of 18 to 19 year olds has the lowest likelihood of being enrolled in a private school, with 939 (94.5% in the age bracket) attending a public institution.
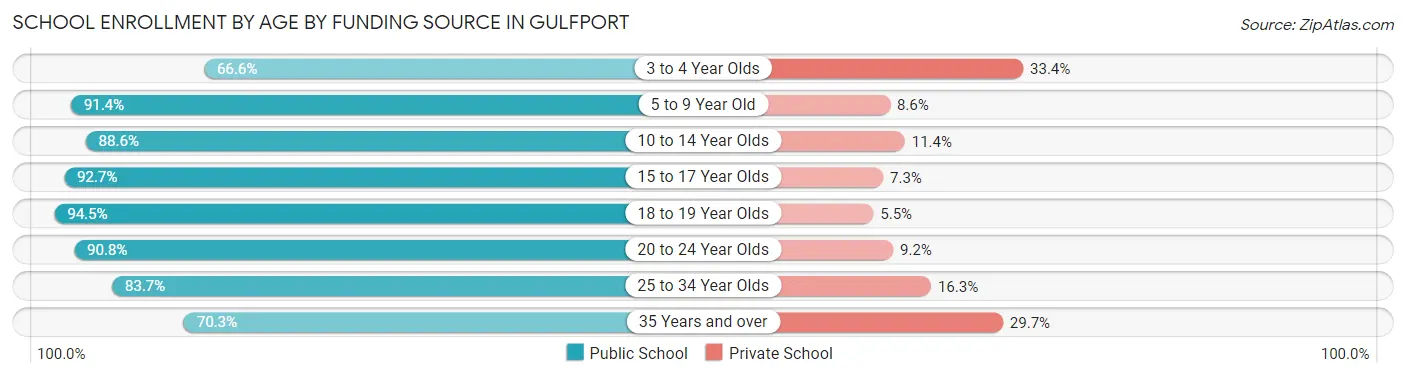
| Age Bracket | Public School | Private School |
| 3 to 4 Year Olds | 498 (66.6%) | 250 (33.4%) |
| 5 to 9 Year Old | 3,731 (91.4%) | 352 (8.6%) |
| 10 to 14 Year Olds | 4,049 (88.6%) | 520 (11.4%) |
| 15 to 17 Year Olds | 2,375 (92.7%) | 188 (7.3%) |
| 18 to 19 Year Olds | 939 (94.5%) | 55 (5.5%) |
| 20 to 24 Year Olds | 1,094 (90.8%) | 111 (9.2%) |
| 25 to 34 Year Olds | 757 (83.7%) | 147 (16.3%) |
| 35 Years and over | 797 (70.3%) | 336 (29.7%) |
| Total | 14,239 (87.9%) | 1,960 (12.1%) |
Educational Attainment by Field of Study in Gulfport
Business (3,041 | 25.0%), education (1,862 | 15.3%), science & technology (1,360 | 11.2%), arts & humanities (1,029 | 8.5%), and computers & mathematics (700 | 5.8%) are the most common fields of study among 12,178 individuals in Gulfport who have obtained a bachelor's degree or higher.
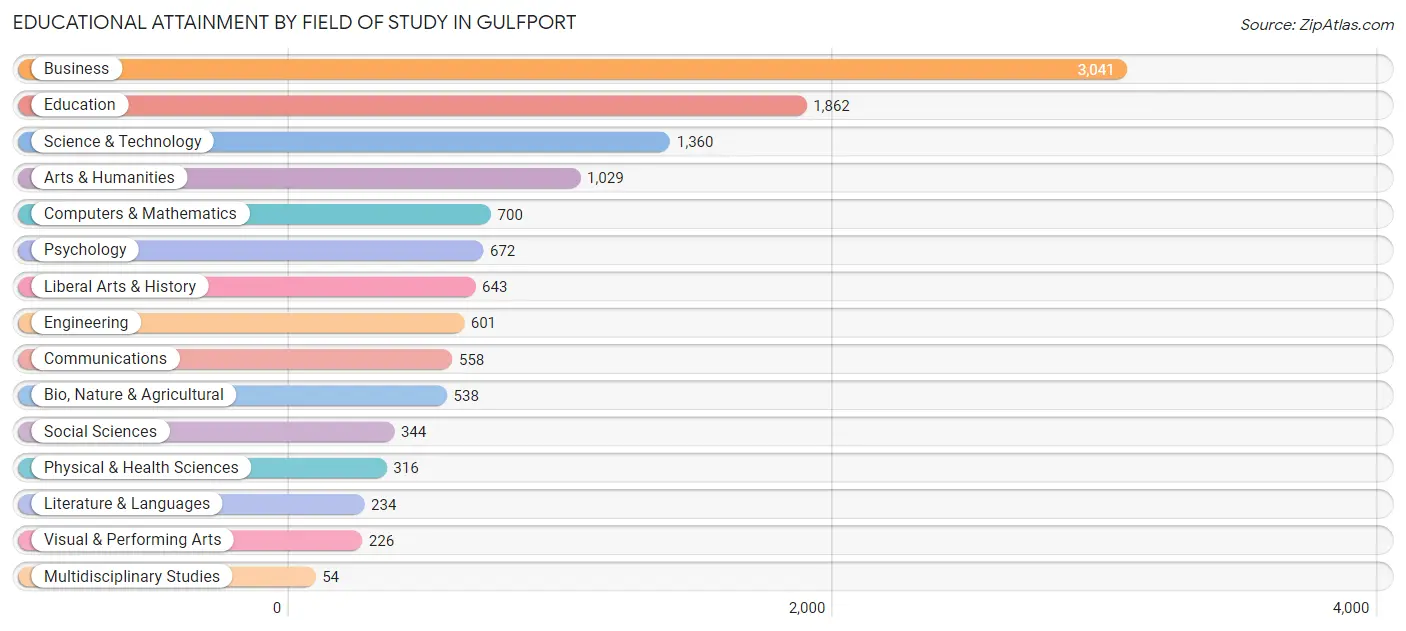
| Field of Study | # Graduates | % Graduates |
| Computers & Mathematics | 700 | 5.8% |
| Bio, Nature & Agricultural | 538 | 4.4% |
| Physical & Health Sciences | 316 | 2.6% |
| Psychology | 672 | 5.5% |
| Social Sciences | 344 | 2.8% |
| Engineering | 601 | 4.9% |
| Multidisciplinary Studies | 54 | 0.4% |
| Science & Technology | 1,360 | 11.2% |
| Business | 3,041 | 25.0% |
| Education | 1,862 | 15.3% |
| Literature & Languages | 234 | 1.9% |
| Liberal Arts & History | 643 | 5.3% |
| Visual & Performing Arts | 226 | 1.9% |
| Communications | 558 | 4.6% |
| Arts & Humanities | 1,029 | 8.5% |
| Total | 12,178 | 100.0% |
Transportation & Commute in Gulfport
Vehicle Availability by Sex in Gulfport
The most prevalent vehicle ownership categories in Gulfport are males with 2 vehicles (6,067, accounting for 41.5%) and females with 2 vehicles (5,695, making up 40.5%).
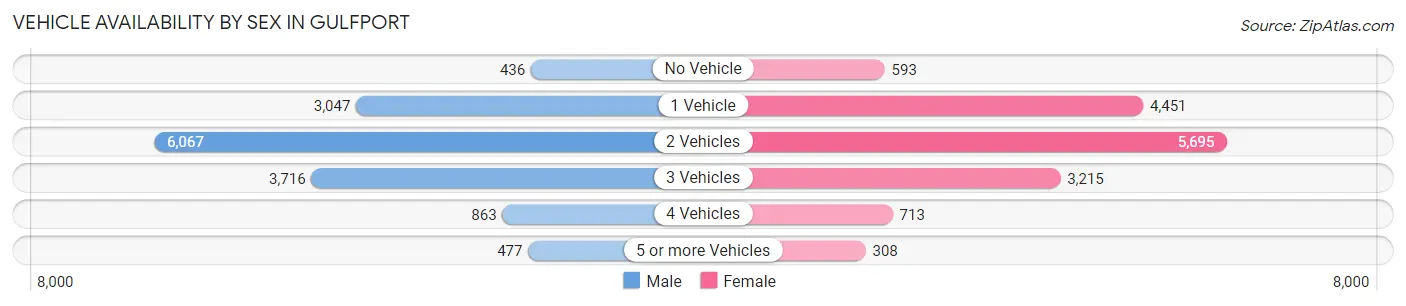
| Vehicles Available | Male | Female |
| No Vehicle | 436 (3.0%) | 593 (4.0%) |
| 1 Vehicle | 3,047 (20.9%) | 4,451 (29.7%) |
| 2 Vehicles | 6,067 (41.5%) | 5,695 (38.0%) |
| 3 Vehicles | 3,716 (25.4%) | 3,215 (21.5%) |
| 4 Vehicles | 863 (5.9%) | 713 (4.8%) |
| 5 or more Vehicles | 477 (3.3%) | 308 (2.1%) |
| Total | 14,606 (100.0%) | 14,975 (100.0%) |
Commute Time in Gulfport
The most frequently occuring commute durations in Gulfport are 15 to 19 minutes (5,331 commuters, 18.6%), 20 to 24 minutes (5,194 commuters, 18.1%), and 10 to 14 minutes (4,800 commuters, 16.8%).
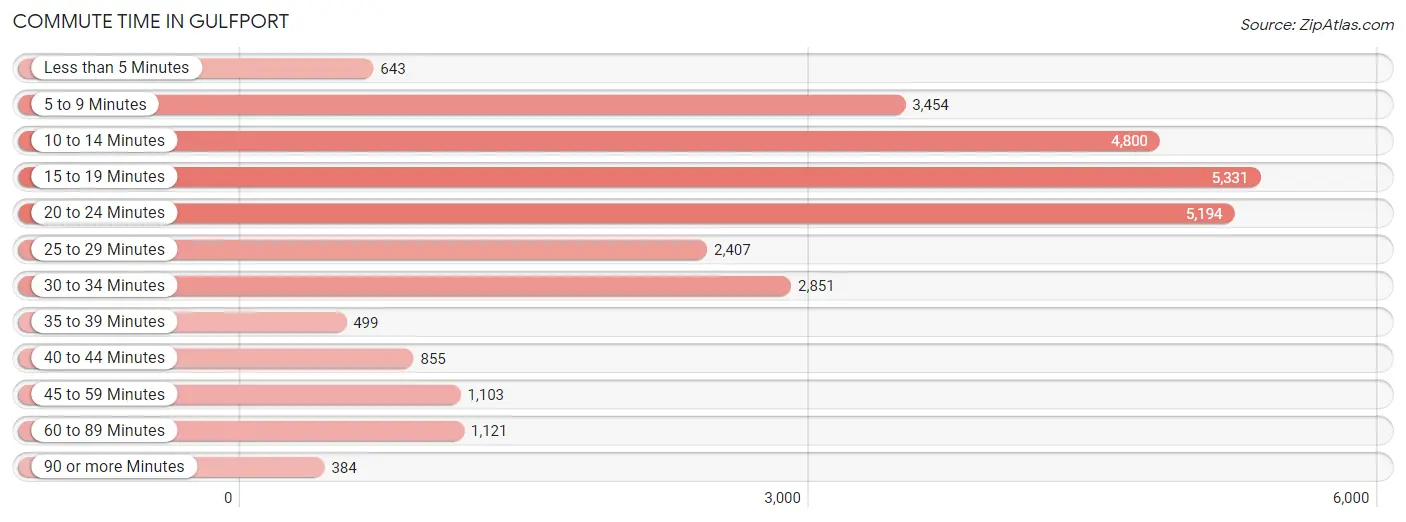
| Commute Time | # Commuters | % Commuters |
| Less than 5 Minutes | 643 | 2.2% |
| 5 to 9 Minutes | 3,454 | 12.1% |
| 10 to 14 Minutes | 4,800 | 16.8% |
| 15 to 19 Minutes | 5,331 | 18.6% |
| 20 to 24 Minutes | 5,194 | 18.1% |
| 25 to 29 Minutes | 2,407 | 8.4% |
| 30 to 34 Minutes | 2,851 | 10.0% |
| 35 to 39 Minutes | 499 | 1.7% |
| 40 to 44 Minutes | 855 | 3.0% |
| 45 to 59 Minutes | 1,103 | 3.8% |
| 60 to 89 Minutes | 1,121 | 3.9% |
| 90 or more Minutes | 384 | 1.3% |
Commute Time by Sex in Gulfport
The most common commute times in Gulfport are 20 to 24 minutes (2,721 commuters, 18.8%) for males and 15 to 19 minutes (2,624 commuters, 18.5%) for females.
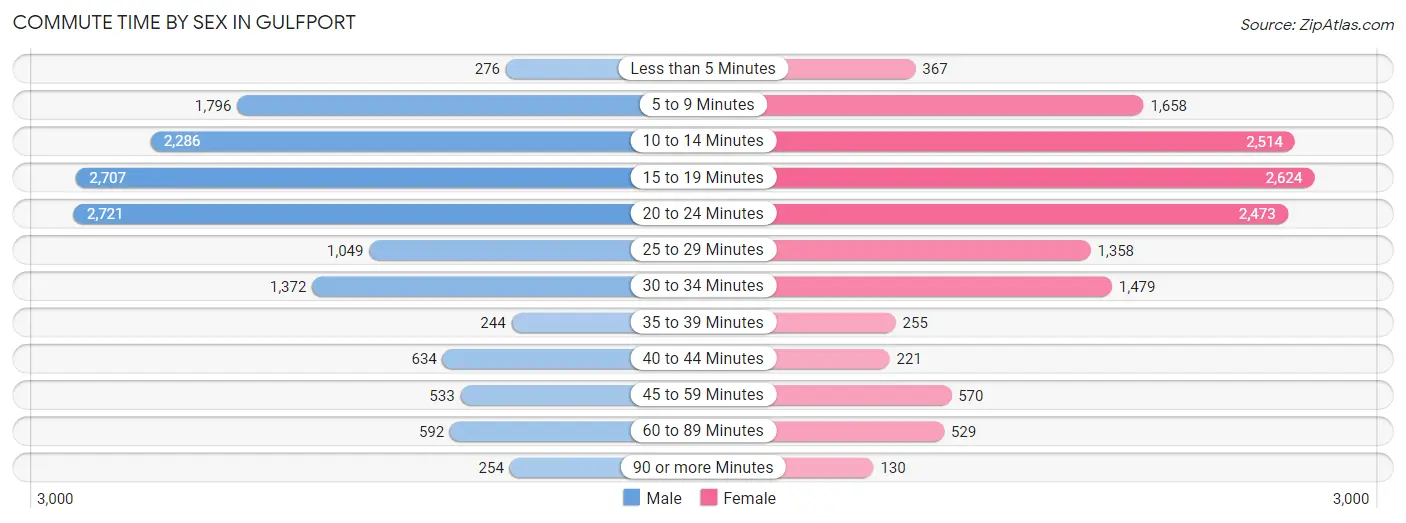
| Commute Time | Male | Female |
| Less than 5 Minutes | 276 (1.9%) | 367 (2.6%) |
| 5 to 9 Minutes | 1,796 (12.4%) | 1,658 (11.7%) |
| 10 to 14 Minutes | 2,286 (15.8%) | 2,514 (17.7%) |
| 15 to 19 Minutes | 2,707 (18.7%) | 2,624 (18.5%) |
| 20 to 24 Minutes | 2,721 (18.8%) | 2,473 (17.4%) |
| 25 to 29 Minutes | 1,049 (7.2%) | 1,358 (9.6%) |
| 30 to 34 Minutes | 1,372 (9.5%) | 1,479 (10.4%) |
| 35 to 39 Minutes | 244 (1.7%) | 255 (1.8%) |
| 40 to 44 Minutes | 634 (4.4%) | 221 (1.6%) |
| 45 to 59 Minutes | 533 (3.7%) | 570 (4.0%) |
| 60 to 89 Minutes | 592 (4.1%) | 529 (3.7%) |
| 90 or more Minutes | 254 (1.8%) | 130 (0.9%) |
Time of Departure to Work by Sex in Gulfport
The most frequent times of departure to work in Gulfport are 6:00 AM to 6:29 AM (1,967, 13.6%) for males and 7:00 AM to 7:29 AM (2,579, 18.2%) for females.
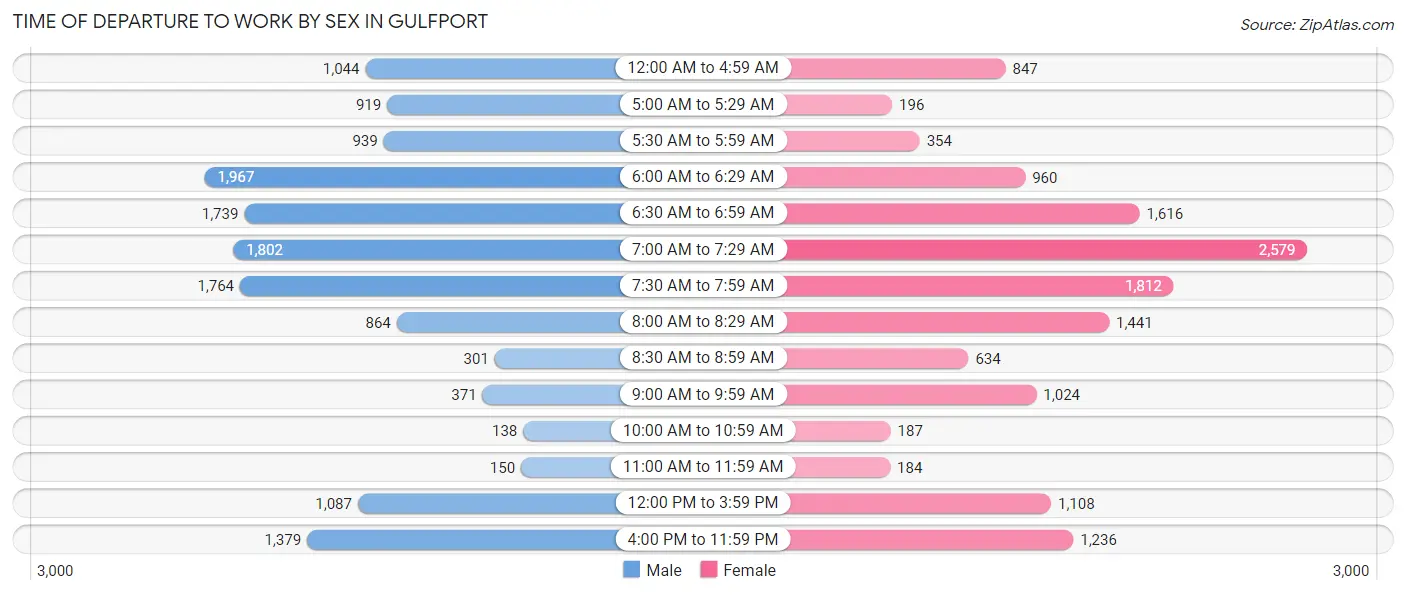
| Time of Departure | Male | Female |
| 12:00 AM to 4:59 AM | 1,044 (7.2%) | 847 (6.0%) |
| 5:00 AM to 5:29 AM | 919 (6.4%) | 196 (1.4%) |
| 5:30 AM to 5:59 AM | 939 (6.5%) | 354 (2.5%) |
| 6:00 AM to 6:29 AM | 1,967 (13.6%) | 960 (6.8%) |
| 6:30 AM to 6:59 AM | 1,739 (12.0%) | 1,616 (11.4%) |
| 7:00 AM to 7:29 AM | 1,802 (12.5%) | 2,579 (18.2%) |
| 7:30 AM to 7:59 AM | 1,764 (12.2%) | 1,812 (12.8%) |
| 8:00 AM to 8:29 AM | 864 (6.0%) | 1,441 (10.2%) |
| 8:30 AM to 8:59 AM | 301 (2.1%) | 634 (4.5%) |
| 9:00 AM to 9:59 AM | 371 (2.6%) | 1,024 (7.2%) |
| 10:00 AM to 10:59 AM | 138 (0.9%) | 187 (1.3%) |
| 11:00 AM to 11:59 AM | 150 (1.0%) | 184 (1.3%) |
| 12:00 PM to 3:59 PM | 1,087 (7.5%) | 1,108 (7.8%) |
| 4:00 PM to 11:59 PM | 1,379 (9.5%) | 1,236 (8.7%) |
| Total | 14,464 (100.0%) | 14,178 (100.0%) |
Housing Occupancy in Gulfport
Occupancy by Ownership in Gulfport
Of the total 28,137 dwellings in Gulfport, owner-occupied units account for 14,479 (51.5%), while renter-occupied units make up 13,658 (48.5%).
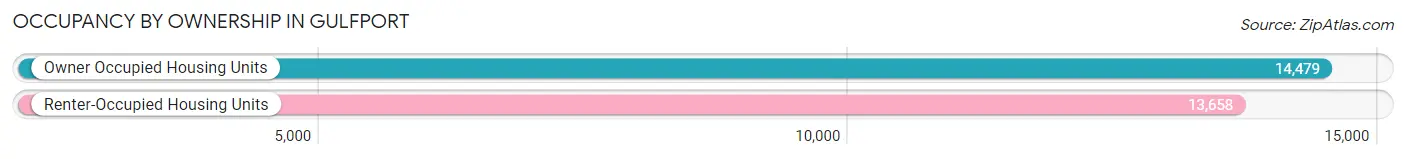
| Occupancy | # Housing Units | % Housing Units |
| Owner Occupied Housing Units | 14,479 | 51.5% |
| Renter-Occupied Housing Units | 13,658 | 48.5% |
| Total Occupied Housing Units | 28,137 | 100.0% |
Occupancy by Household Size in Gulfport
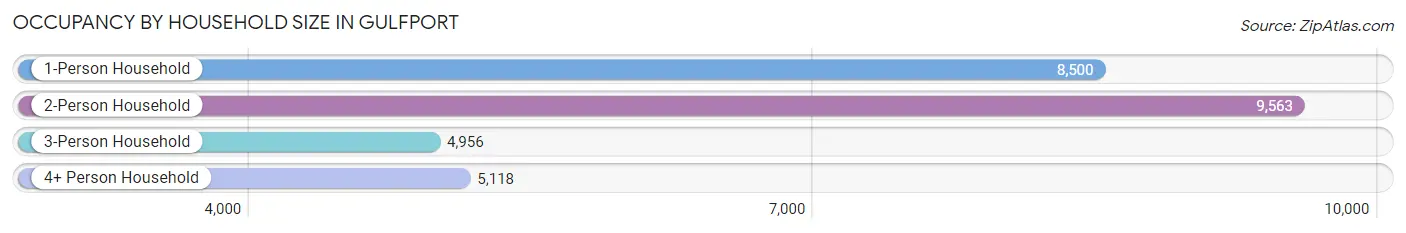
| Household Size | # Housing Units | % Housing Units |
| 1-Person Household | 8,500 | 30.2% |
| 2-Person Household | 9,563 | 34.0% |
| 3-Person Household | 4,956 | 17.6% |
| 4+ Person Household | 5,118 | 18.2% |
| Total Housing Units | 28,137 | 100.0% |
Occupancy by Ownership by Household Size in Gulfport
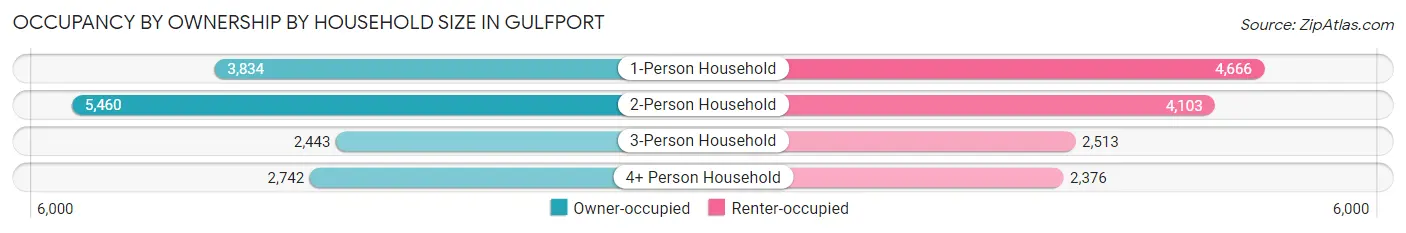
| Household Size | Owner-occupied | Renter-occupied |
| 1-Person Household | 3,834 (45.1%) | 4,666 (54.9%) |
| 2-Person Household | 5,460 (57.1%) | 4,103 (42.9%) |
| 3-Person Household | 2,443 (49.3%) | 2,513 (50.7%) |
| 4+ Person Household | 2,742 (53.6%) | 2,376 (46.4%) |
| Total Housing Units | 14,479 (51.5%) | 13,658 (48.5%) |
Occupancy by Educational Attainment in Gulfport
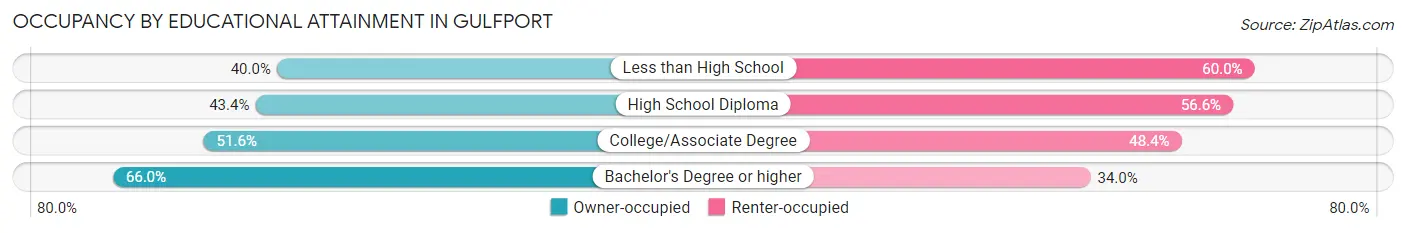
| Household Size | Owner-occupied | Renter-occupied |
| Less than High School | 1,242 (40.0%) | 1,862 (60.0%) |
| High School Diploma | 3,450 (43.4%) | 4,496 (56.6%) |
| College/Associate Degree | 5,337 (51.6%) | 5,008 (48.4%) |
| Bachelor's Degree or higher | 4,450 (66.0%) | 2,292 (34.0%) |
Occupancy by Age of Householder in Gulfport
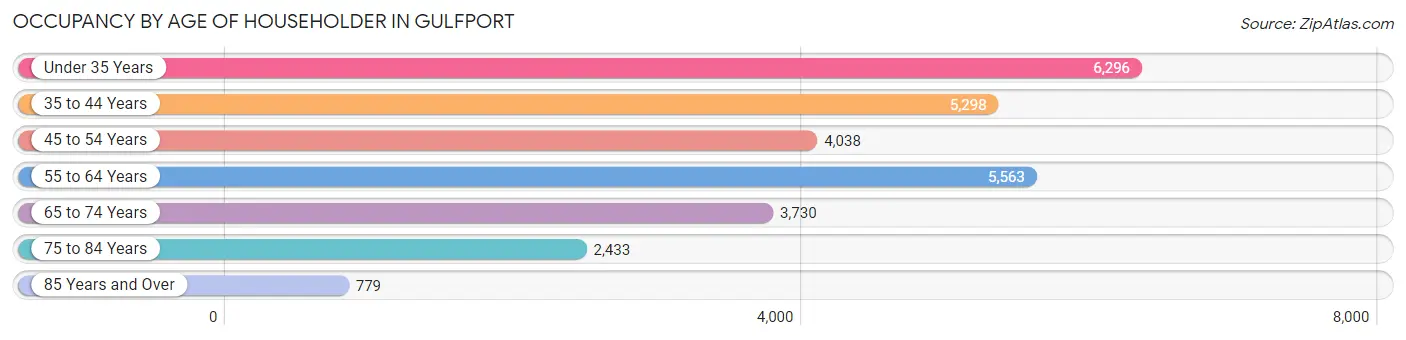
| Age Bracket | # Households | % Households |
| Under 35 Years | 6,296 | 22.4% |
| 35 to 44 Years | 5,298 | 18.8% |
| 45 to 54 Years | 4,038 | 14.3% |
| 55 to 64 Years | 5,563 | 19.8% |
| 65 to 74 Years | 3,730 | 13.3% |
| 75 to 84 Years | 2,433 | 8.6% |
| 85 Years and Over | 779 | 2.8% |
| Total | 28,137 | 100.0% |
Housing Finances in Gulfport
Median Income by Occupancy in Gulfport
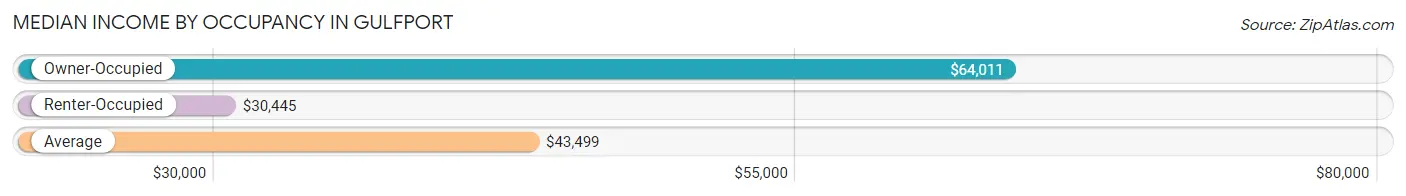
| Occupancy Type | # Households | Median Income |
| Owner-Occupied | 14,479 (51.5%) | $64,011 |
| Renter-Occupied | 13,658 (48.5%) | $30,445 |
| Average | 28,137 (100.0%) | $43,499 |
Occupancy by Householder Income Bracket in Gulfport
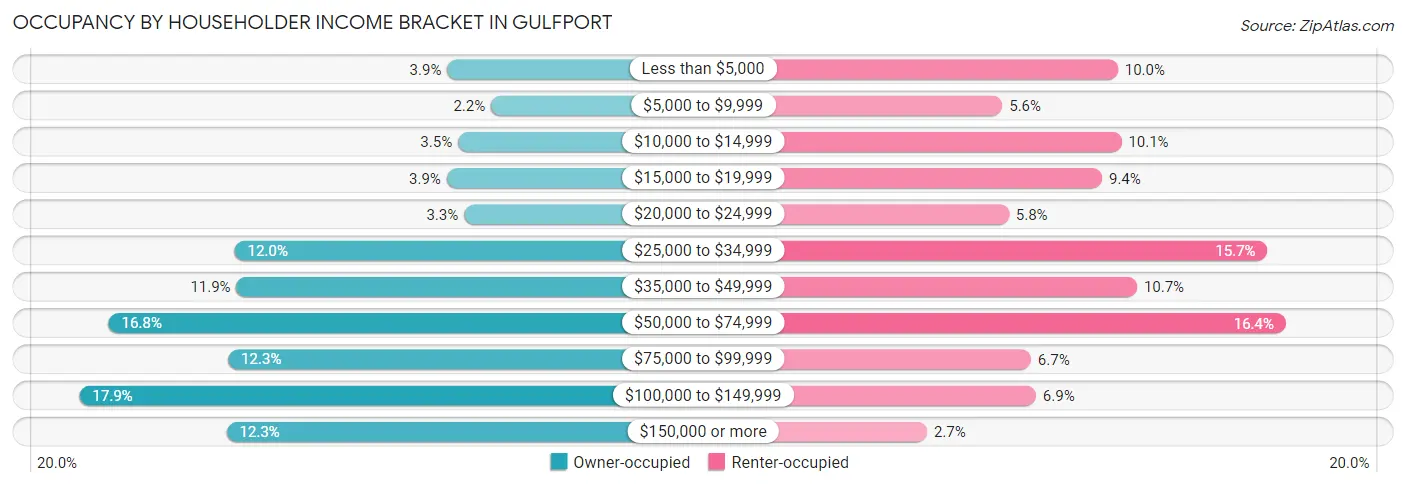
| Income Bracket | Owner-occupied | Renter-occupied |
| Less than $5,000 | 565 (3.9%) | 1,364 (10.0%) |
| $5,000 to $9,999 | 323 (2.2%) | 763 (5.6%) |
| $10,000 to $14,999 | 505 (3.5%) | 1,383 (10.1%) |
| $15,000 to $19,999 | 567 (3.9%) | 1,282 (9.4%) |
| $20,000 to $24,999 | 472 (3.3%) | 798 (5.8%) |
| $25,000 to $34,999 | 1,738 (12.0%) | 2,143 (15.7%) |
| $35,000 to $49,999 | 1,728 (11.9%) | 1,464 (10.7%) |
| $50,000 to $74,999 | 2,432 (16.8%) | 2,238 (16.4%) |
| $75,000 to $99,999 | 1,773 (12.2%) | 913 (6.7%) |
| $100,000 to $149,999 | 2,593 (17.9%) | 938 (6.9%) |
| $150,000 or more | 1,783 (12.3%) | 372 (2.7%) |
| Total | 14,479 (100.0%) | 13,658 (100.0%) |
Monthly Housing Cost Tiers in Gulfport
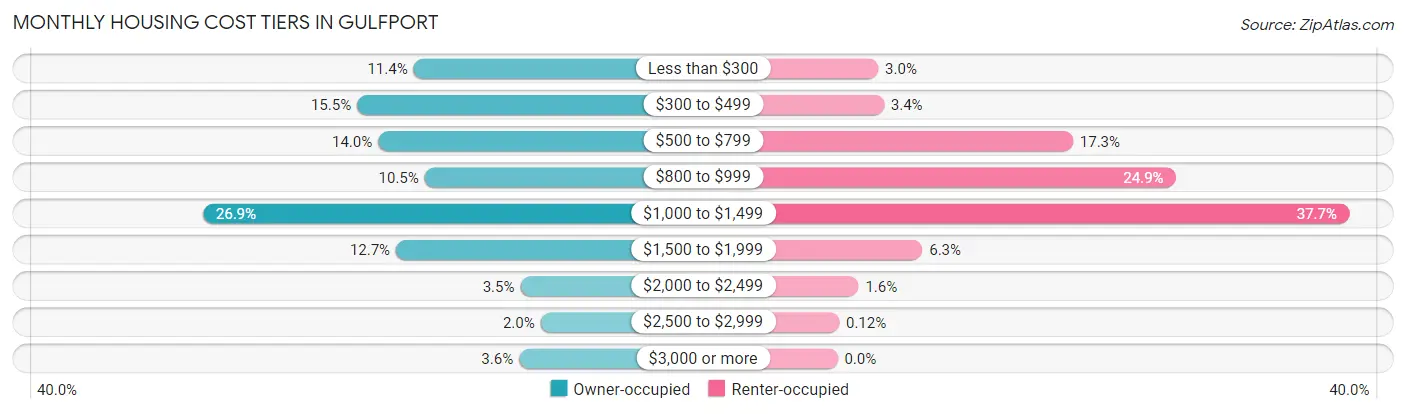
| Monthly Cost | Owner-occupied | Renter-occupied |
| Less than $300 | 1,645 (11.4%) | 410 (3.0%) |
| $300 to $499 | 2,247 (15.5%) | 467 (3.4%) |
| $500 to $799 | 2,023 (14.0%) | 2,368 (17.3%) |
| $800 to $999 | 1,526 (10.5%) | 3,400 (24.9%) |
| $1,000 to $1,499 | 3,890 (26.9%) | 5,144 (37.7%) |
| $1,500 to $1,999 | 1,832 (12.7%) | 854 (6.2%) |
| $2,000 to $2,499 | 506 (3.5%) | 212 (1.5%) |
| $2,500 to $2,999 | 290 (2.0%) | 16 (0.1%) |
| $3,000 or more | 520 (3.6%) | 0 (0.0%) |
| Total | 14,479 (100.0%) | 13,658 (100.0%) |
Physical Housing Characteristics in Gulfport
Housing Structures in Gulfport
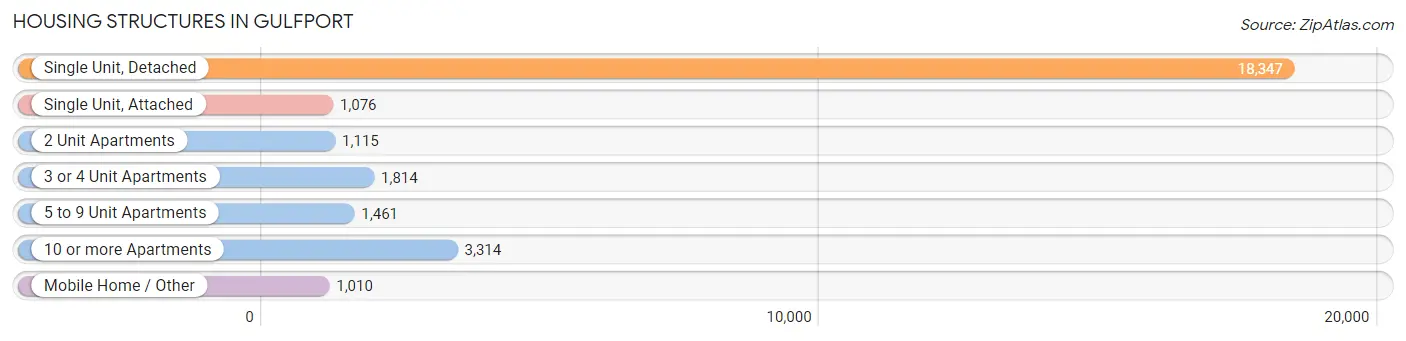
| Structure Type | # Housing Units | % Housing Units |
| Single Unit, Detached | 18,347 | 65.2% |
| Single Unit, Attached | 1,076 | 3.8% |
| 2 Unit Apartments | 1,115 | 4.0% |
| 3 or 4 Unit Apartments | 1,814 | 6.5% |
| 5 to 9 Unit Apartments | 1,461 | 5.2% |
| 10 or more Apartments | 3,314 | 11.8% |
| Mobile Home / Other | 1,010 | 3.6% |
| Total | 28,137 | 100.0% |
Housing Structures by Occupancy in Gulfport
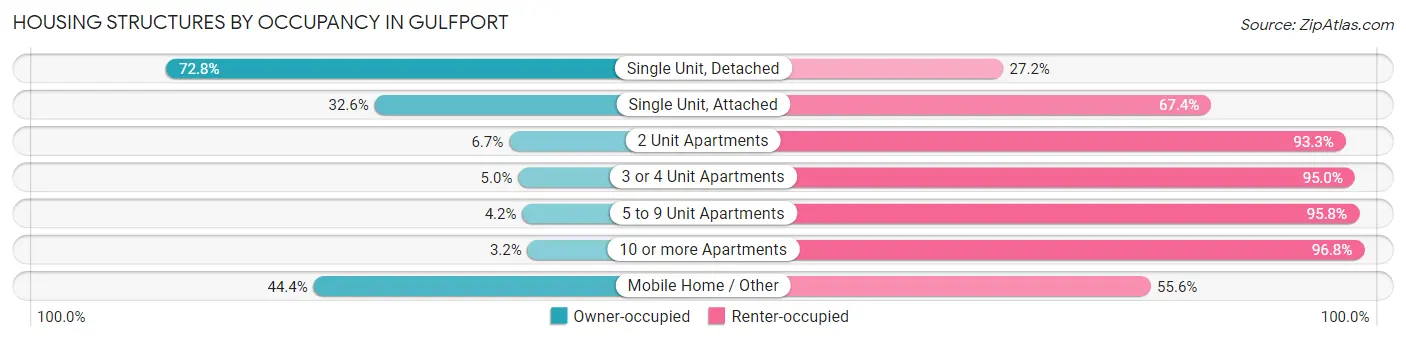
| Structure Type | Owner-occupied | Renter-occupied |
| Single Unit, Detached | 13,349 (72.8%) | 4,998 (27.2%) |
| Single Unit, Attached | 351 (32.6%) | 725 (67.4%) |
| 2 Unit Apartments | 75 (6.7%) | 1,040 (93.3%) |
| 3 or 4 Unit Apartments | 90 (5.0%) | 1,724 (95.0%) |
| 5 to 9 Unit Apartments | 61 (4.2%) | 1,400 (95.8%) |
| 10 or more Apartments | 105 (3.2%) | 3,209 (96.8%) |
| Mobile Home / Other | 448 (44.4%) | 562 (55.6%) |
| Total | 14,479 (51.5%) | 13,658 (48.5%) |
Housing Structures by Number of Rooms in Gulfport
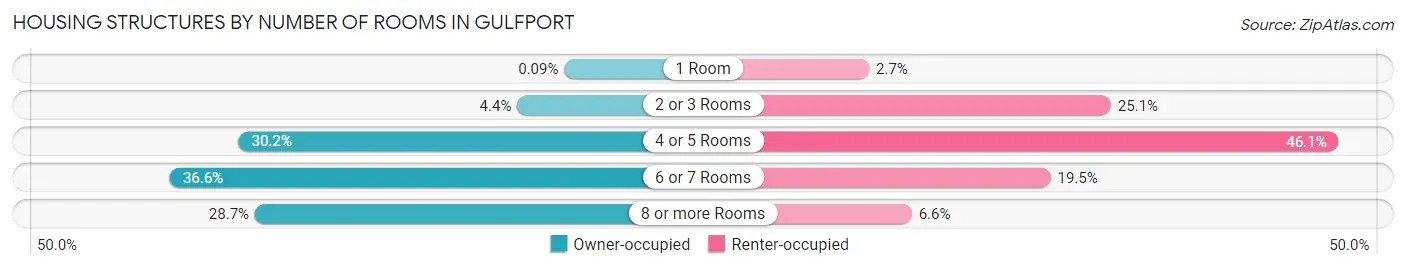
| Number of Rooms | Owner-occupied | Renter-occupied |
| 1 Room | 13 (0.1%) | 369 (2.7%) |
| 2 or 3 Rooms | 643 (4.4%) | 3,423 (25.1%) |
| 4 or 5 Rooms | 4,374 (30.2%) | 6,298 (46.1%) |
| 6 or 7 Rooms | 5,294 (36.6%) | 2,661 (19.5%) |
| 8 or more Rooms | 4,155 (28.7%) | 907 (6.6%) |
| Total | 14,479 (100.0%) | 13,658 (100.0%) |
Housing Structure by Heating Type in Gulfport
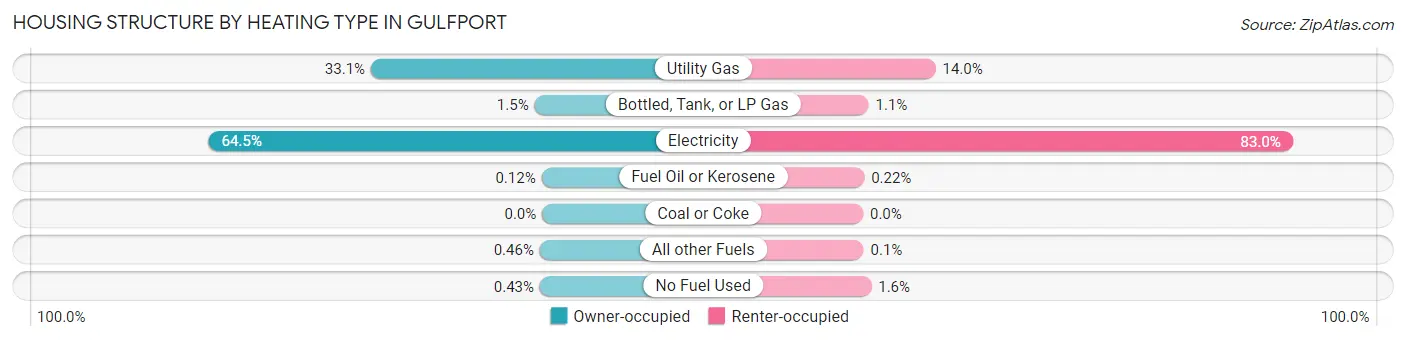
| Heating Type | Owner-occupied | Renter-occupied |
| Utility Gas | 4,789 (33.1%) | 1,913 (14.0%) |
| Bottled, Tank, or LP Gas | 213 (1.5%) | 146 (1.1%) |
| Electricity | 9,331 (64.4%) | 11,338 (83.0%) |
| Fuel Oil or Kerosene | 17 (0.1%) | 30 (0.2%) |
| Coal or Coke | 0 (0.0%) | 0 (0.0%) |
| All other Fuels | 67 (0.5%) | 14 (0.1%) |
| No Fuel Used | 62 (0.4%) | 217 (1.6%) |
| Total | 14,479 (100.0%) | 13,658 (100.0%) |
Household Vehicle Usage in Gulfport
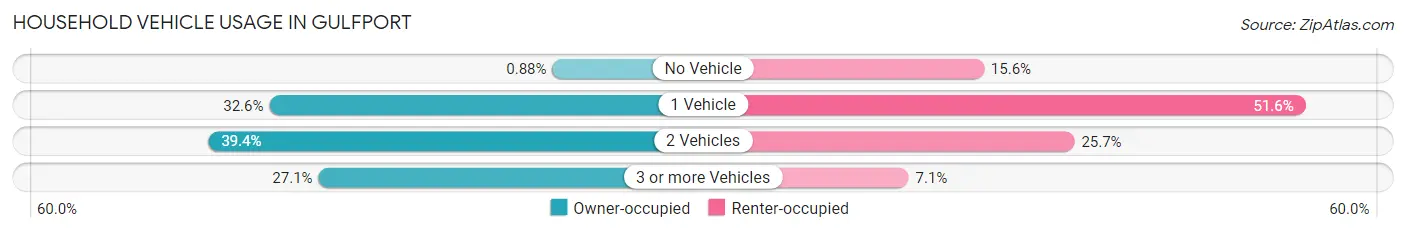
| Vehicles per Household | Owner-occupied | Renter-occupied |
| No Vehicle | 128 (0.9%) | 2,126 (15.6%) |
| 1 Vehicle | 4,719 (32.6%) | 7,046 (51.6%) |
| 2 Vehicles | 5,709 (39.4%) | 3,512 (25.7%) |
| 3 or more Vehicles | 3,923 (27.1%) | 974 (7.1%) |
| Total | 14,479 (100.0%) | 13,658 (100.0%) |
Real Estate & Mortgages in Gulfport
Real Estate and Mortgage Overview in Gulfport
| Characteristic | Without Mortgage | With Mortgage |
| Housing Units | 5,595 | 8,884 |
| Median Property Value | $145,300 | $164,500 |
| Median Household Income | $40,636 | $1,347 |
| Monthly Housing Costs | $417 | $520 |
| Real Estate Taxes | $913 | $1,379 |
Property Value by Mortgage Status in Gulfport
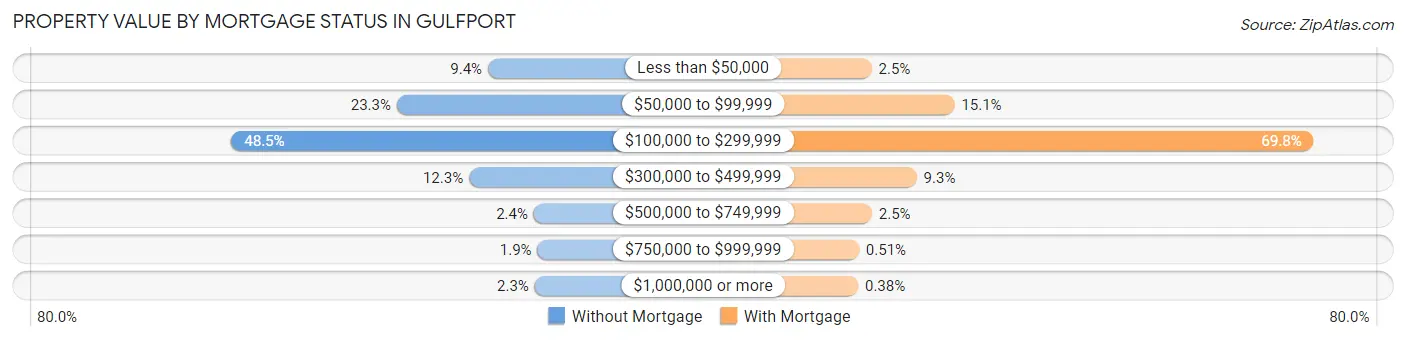
| Property Value | Without Mortgage | With Mortgage |
| Less than $50,000 | 526 (9.4%) | 218 (2.5%) |
| $50,000 to $99,999 | 1,303 (23.3%) | 1,339 (15.1%) |
| $100,000 to $299,999 | 2,713 (48.5%) | 6,201 (69.8%) |
| $300,000 to $499,999 | 687 (12.3%) | 827 (9.3%) |
| $500,000 to $749,999 | 135 (2.4%) | 220 (2.5%) |
| $750,000 to $999,999 | 104 (1.9%) | 45 (0.5%) |
| $1,000,000 or more | 127 (2.3%) | 34 (0.4%) |
| Total | 5,595 (100.0%) | 8,884 (100.0%) |
Household Income by Mortgage Status in Gulfport
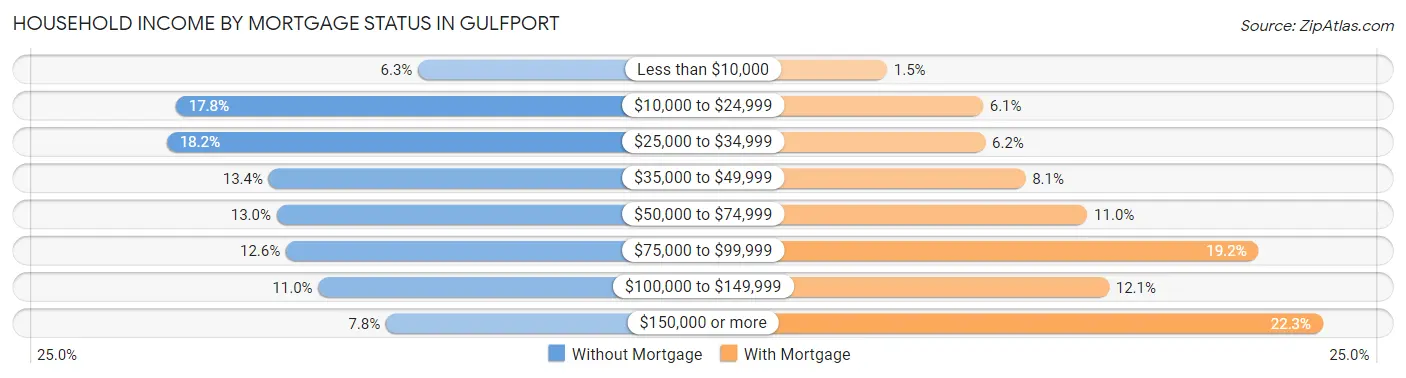
| Household Income | Without Mortgage | With Mortgage |
| Less than $10,000 | 350 (6.3%) | 132 (1.5%) |
| $10,000 to $24,999 | 996 (17.8%) | 538 (6.1%) |
| $25,000 to $34,999 | 1,020 (18.2%) | 548 (6.2%) |
| $35,000 to $49,999 | 748 (13.4%) | 718 (8.1%) |
| $50,000 to $74,999 | 727 (13.0%) | 980 (11.0%) |
| $75,000 to $99,999 | 702 (12.6%) | 1,705 (19.2%) |
| $100,000 to $149,999 | 616 (11.0%) | 1,071 (12.1%) |
| $150,000 or more | 436 (7.8%) | 1,977 (22.3%) |
| Total | 5,595 (100.0%) | 8,884 (100.0%) |
Property Value to Household Income Ratio in Gulfport
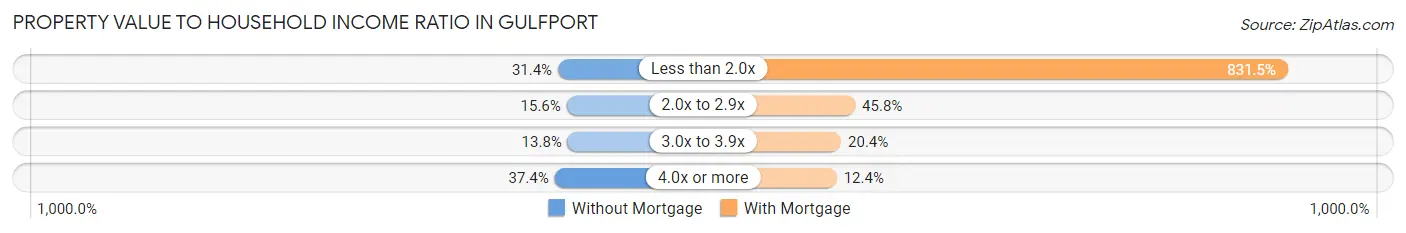
| Value-to-Income Ratio | Without Mortgage | With Mortgage |
| Less than 2.0x | 1,757 (31.4%) | 73,870 (831.5%) |
| 2.0x to 2.9x | 875 (15.6%) | 4,072 (45.8%) |
| 3.0x to 3.9x | 771 (13.8%) | 1,808 (20.3%) |
| 4.0x or more | 2,092 (37.4%) | 1,101 (12.4%) |
| Total | 5,595 (100.0%) | 8,884 (100.0%) |
Real Estate Taxes by Mortgage Status in Gulfport
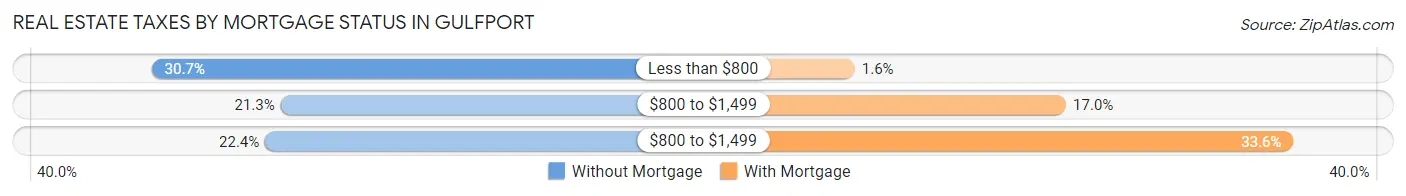
| Property Taxes | Without Mortgage | With Mortgage |
| Less than $800 | 1,719 (30.7%) | 141 (1.6%) |
| $800 to $1,499 | 1,192 (21.3%) | 1,513 (17.0%) |
| $800 to $1,499 | 1,255 (22.4%) | 2,988 (33.6%) |
| Total | 5,595 (100.0%) | 8,884 (100.0%) |
Health & Disability in Gulfport
Health Insurance Coverage by Age in Gulfport
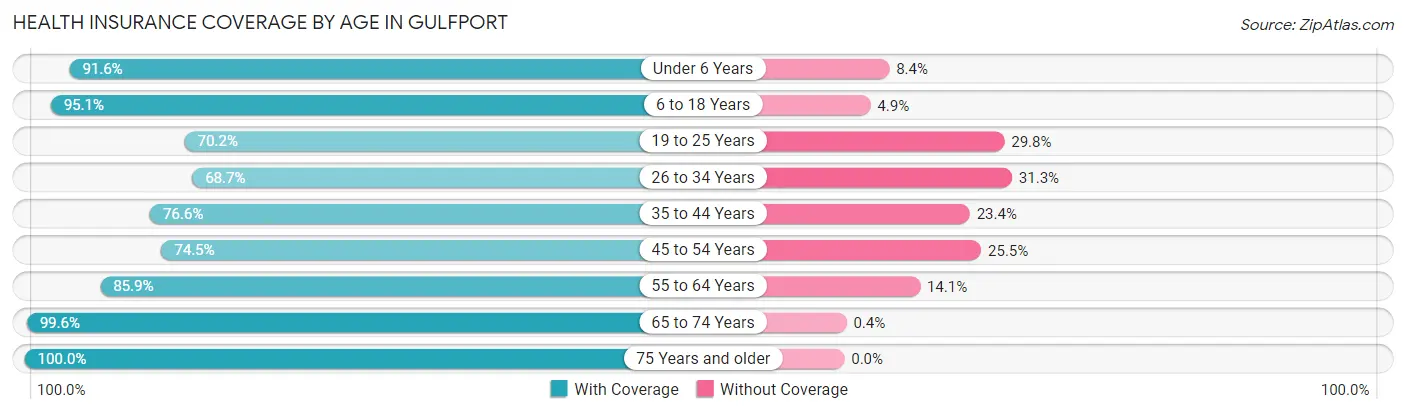
| Age Bracket | With Coverage | Without Coverage |
| Under 6 Years | 5,333 (91.6%) | 487 (8.4%) |
| 6 to 18 Years | 10,868 (95.1%) | 556 (4.9%) |
| 19 to 25 Years | 4,789 (70.2%) | 2,037 (29.8%) |
| 26 to 34 Years | 6,659 (68.7%) | 3,028 (31.3%) |
| 35 to 44 Years | 6,798 (76.6%) | 2,076 (23.4%) |
| 45 to 54 Years | 6,224 (74.5%) | 2,132 (25.5%) |
| 55 to 64 Years | 7,611 (85.9%) | 1,250 (14.1%) |
| 65 to 74 Years | 5,776 (99.6%) | 23 (0.4%) |
| 75 Years and older | 4,504 (100.0%) | 0 (0.0%) |
| Total | 58,562 (83.5%) | 11,589 (16.5%) |
Health Insurance Coverage by Citizenship Status in Gulfport
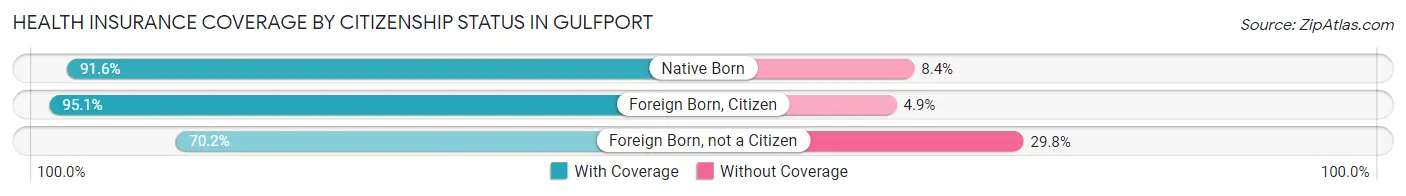
| Citizenship Status | With Coverage | Without Coverage |
| Native Born | 5,333 (91.6%) | 487 (8.4%) |
| Foreign Born, Citizen | 10,868 (95.1%) | 556 (4.9%) |
| Foreign Born, not a Citizen | 4,789 (70.2%) | 2,037 (29.8%) |
Health Insurance Coverage by Household Income in Gulfport
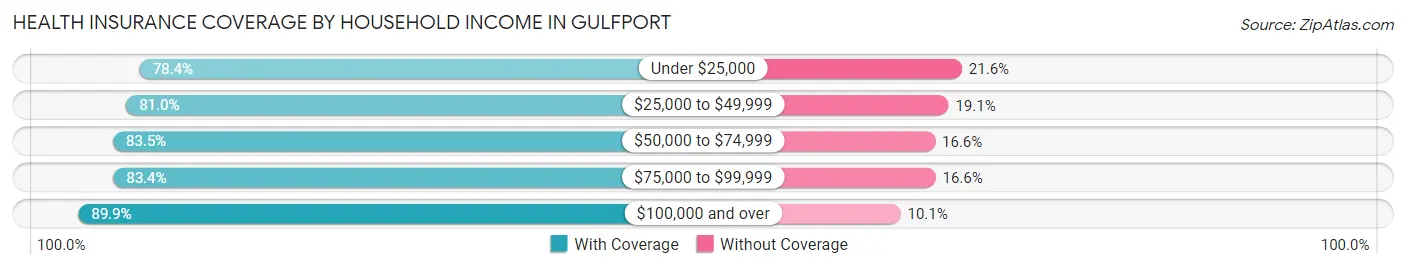
| Household Income | With Coverage | Without Coverage |
| Under $25,000 | 12,405 (78.4%) | 3,411 (21.6%) |
| $25,000 to $49,999 | 12,648 (80.9%) | 2,977 (19.1%) |
| $50,000 to $74,999 | 10,002 (83.5%) | 1,984 (16.6%) |
| $75,000 to $99,999 | 6,737 (83.4%) | 1,344 (16.6%) |
| $100,000 and over | 16,721 (89.9%) | 1,873 (10.1%) |
Public vs Private Health Insurance Coverage by Age in Gulfport
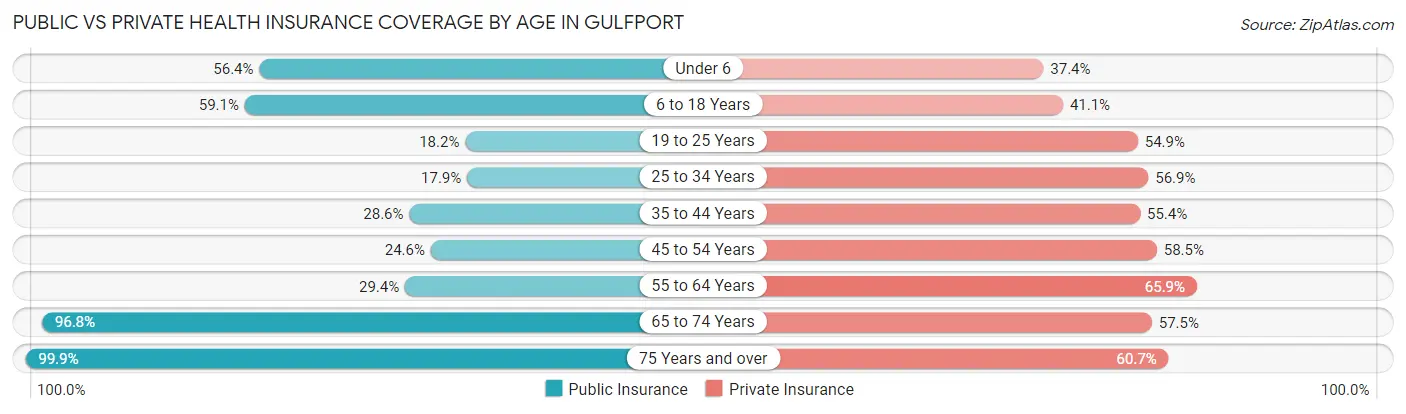
| Age Bracket | Public Insurance | Private Insurance |
| Under 6 | 3,284 (56.4%) | 2,177 (37.4%) |
| 6 to 18 Years | 6,755 (59.1%) | 4,690 (41.0%) |
| 19 to 25 Years | 1,243 (18.2%) | 3,750 (54.9%) |
| 25 to 34 Years | 1,730 (17.9%) | 5,511 (56.9%) |
| 35 to 44 Years | 2,536 (28.6%) | 4,913 (55.4%) |
| 45 to 54 Years | 2,056 (24.6%) | 4,886 (58.5%) |
| 55 to 64 Years | 2,604 (29.4%) | 5,839 (65.9%) |
| 65 to 74 Years | 5,613 (96.8%) | 3,337 (57.5%) |
| 75 Years and over | 4,498 (99.9%) | 2,732 (60.7%) |
| Total | 30,319 (43.2%) | 37,835 (53.9%) |
Disability Status by Sex by Age in Gulfport
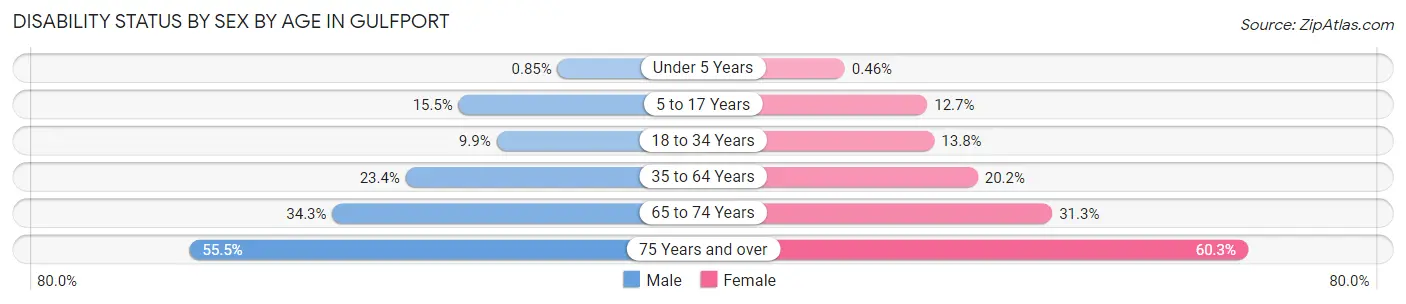
| Age Bracket | Male | Female |
| Under 5 Years | 18 (0.9%) | 12 (0.5%) |
| 5 to 17 Years | 959 (15.5%) | 726 (12.7%) |
| 18 to 34 Years | 864 (9.9%) | 1,162 (13.8%) |
| 35 to 64 Years | 2,669 (23.4%) | 2,966 (20.2%) |
| 65 to 74 Years | 899 (34.3%) | 993 (31.2%) |
| 75 Years and over | 1,096 (55.5%) | 1,525 (60.3%) |
Disability Class by Sex by Age in Gulfport
Disability Class: Hearing Difficulty
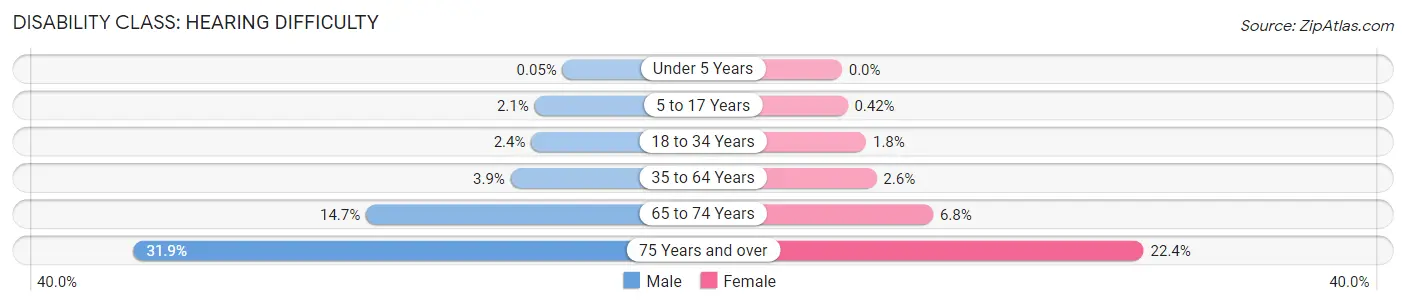
| Age Bracket | Male | Female |
| Under 5 Years | 1 (0.1%) | 0 (0.0%) |
| 5 to 17 Years | 132 (2.1%) | 24 (0.4%) |
| 18 to 34 Years | 207 (2.4%) | 152 (1.8%) |
| 35 to 64 Years | 446 (3.9%) | 378 (2.6%) |
| 65 to 74 Years | 384 (14.6%) | 215 (6.8%) |
| 75 Years and over | 630 (31.9%) | 567 (22.4%) |
Disability Class: Vision Difficulty
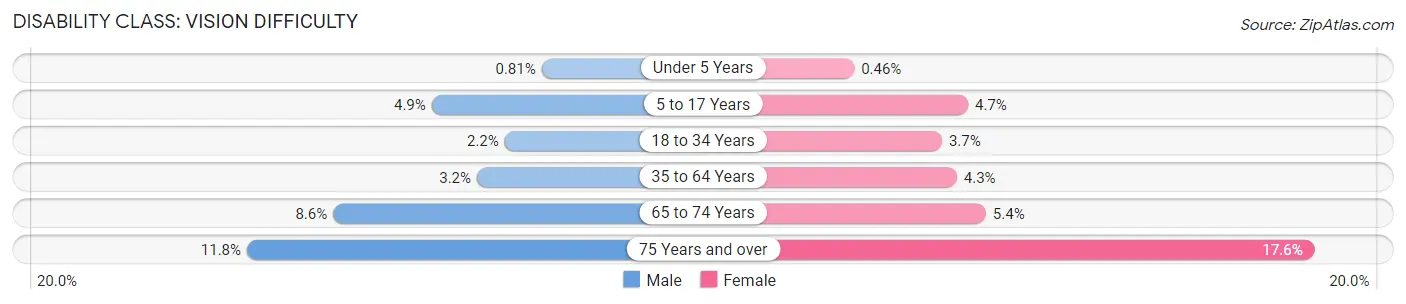
| Age Bracket | Male | Female |
| Under 5 Years | 17 (0.8%) | 12 (0.5%) |
| 5 to 17 Years | 302 (4.9%) | 268 (4.7%) |
| 18 to 34 Years | 190 (2.2%) | 314 (3.7%) |
| 35 to 64 Years | 366 (3.2%) | 627 (4.3%) |
| 65 to 74 Years | 224 (8.6%) | 170 (5.3%) |
| 75 Years and over | 232 (11.7%) | 444 (17.5%) |
Disability Class: Cognitive Difficulty
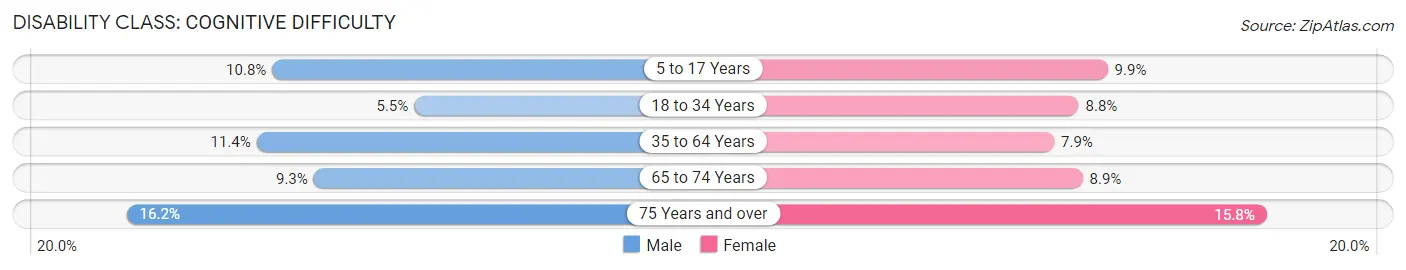
| Age Bracket | Male | Female |
| 5 to 17 Years | 667 (10.8%) | 564 (9.9%) |
| 18 to 34 Years | 482 (5.5%) | 743 (8.8%) |
| 35 to 64 Years | 1,299 (11.4%) | 1,158 (7.9%) |
| 65 to 74 Years | 243 (9.3%) | 284 (8.9%) |
| 75 Years and over | 320 (16.2%) | 399 (15.8%) |
Disability Class: Ambulatory Difficulty
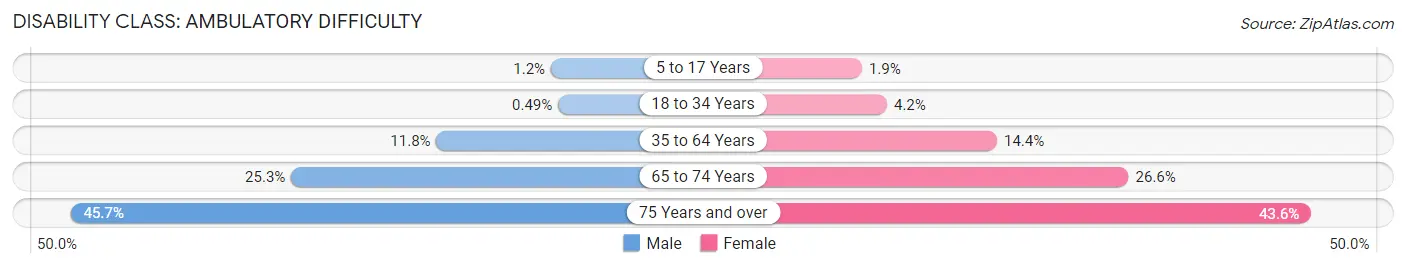
| Age Bracket | Male | Female |
| 5 to 17 Years | 71 (1.1%) | 107 (1.9%) |
| 18 to 34 Years | 43 (0.5%) | 355 (4.2%) |
| 35 to 64 Years | 1,343 (11.8%) | 2,116 (14.4%) |
| 65 to 74 Years | 662 (25.3%) | 846 (26.6%) |
| 75 Years and over | 903 (45.7%) | 1,102 (43.6%) |
Disability Class: Self-Care Difficulty
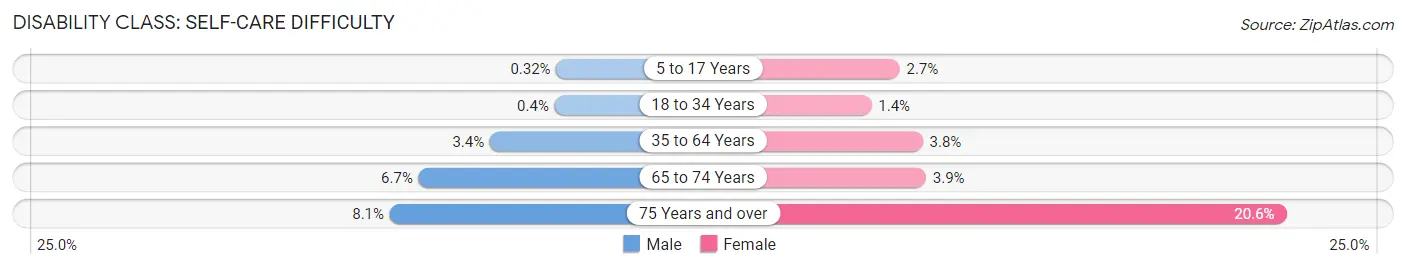
| Age Bracket | Male | Female |
| 5 to 17 Years | 20 (0.3%) | 153 (2.7%) |
| 18 to 34 Years | 35 (0.4%) | 116 (1.4%) |
| 35 to 64 Years | 388 (3.4%) | 551 (3.7%) |
| 65 to 74 Years | 176 (6.7%) | 124 (3.9%) |
| 75 Years and over | 159 (8.1%) | 522 (20.6%) |
Technology Access in Gulfport
Computing Device Access in Gulfport
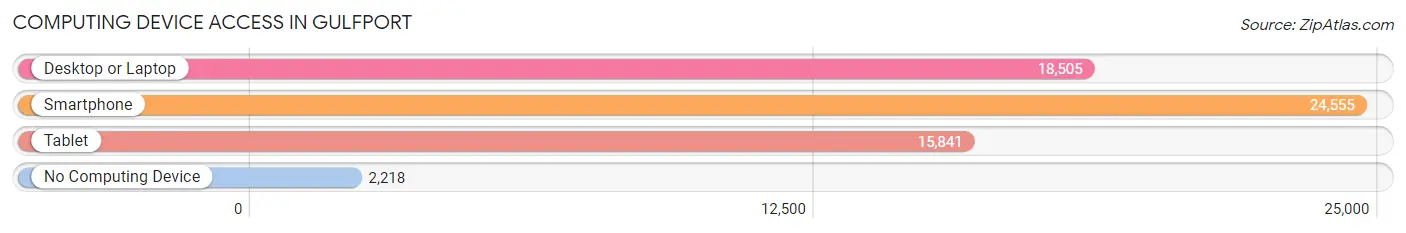
| Device Type | # Households | % Households |
| Desktop or Laptop | 18,505 | 65.8% |
| Smartphone | 24,555 | 87.3% |
| Tablet | 15,841 | 56.3% |
| No Computing Device | 2,218 | 7.9% |
| Total | 28,137 | 100.0% |
Internet Access in Gulfport
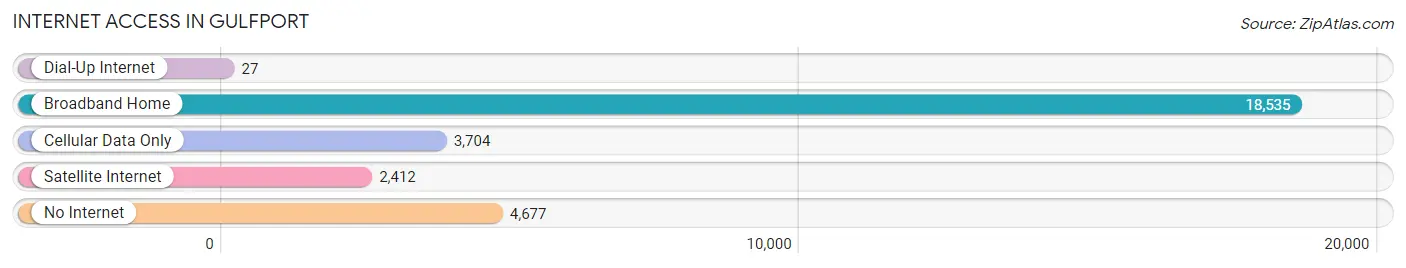
| Internet Type | # Households | % Households |
| Dial-Up Internet | 27 | 0.1% |
| Broadband Home | 18,535 | 65.9% |
| Cellular Data Only | 3,704 | 13.2% |
| Satellite Internet | 2,412 | 8.6% |
| No Internet | 4,677 | 16.6% |
| Total | 28,137 | 100.0% |
Gulfport Summary
Gulfport is a city located in Harrison County, Mississippi, United States, along the Gulf of Mexico. It is the second-largest city in Mississippi after the state capital, Jackson. Gulfport is the county seat of Harrison County and the principal city of the Gulfport-Biloxi Metropolitan Statistical Area, which is included in the Gulfport-Biloxi-Pascagoula Combined Statistical Area. As of the 2010 census, the city of Gulfport had a total population of 67,793.
History
Gulfport was founded in 1898 by William H. Hardy, who named the city after the Gulf of Mexico. The city was incorporated in 1902 and was the first city in Harrison County to be incorporated. The city was originally a fishing village, but it quickly grew to become a major port city. The city was a major port for the export of cotton and other goods during the early 20th century.
During World War II, the city was a major port for the United States Navy and was home to a large naval air station. After the war, the city experienced a period of growth and development, becoming a major tourist destination. The city is now home to a variety of attractions, including the Gulf Islands National Seashore, the Gulfport-Biloxi International Airport, and the Gulfport-Biloxi Regional Airport.
Geography
Gulfport is located in Harrison County, Mississippi, along the Gulf of Mexico. The city is situated on the Mississippi Sound, which is part of the Gulf of Mexico. The city is located approximately 25 miles east of Biloxi and approximately 50 miles west of Mobile, Alabama. The city is bordered by the cities of Long Beach, Pass Christian, and Bay St. Louis.
Gulfport has a total area of 44.2 square miles, of which 42.2 square miles is land and 2.0 square miles is water. The city is located at an elevation of 10 feet above sea level.
Economy
Gulfport is a major port city and is home to a variety of industries. The city is home to a large number of manufacturing and industrial companies, including shipbuilding, oil refining, and chemical production. The city is also home to a number of retail stores, restaurants, and other businesses.
Gulfport is also home to a number of military installations, including the Naval Construction Battalion Center, the Naval Air Station, and the Seabee Base. The city is also home to a number of educational institutions, including the University of Southern Mississippi, Mississippi Gulf Coast Community College, and the Gulf Coast Community College.
Demographics
As of the 2010 census, the city of Gulfport had a total population of 67,793. The racial makeup of the city was 68.3% White, 28.2% African American, 0.4% Native American, 0.7% Asian, 0.1% Pacific Islander, 0.7% from other races, and 1.6% from two or more races. Hispanic or Latino of any race were 2.7% of the population.
The median income for a household in the city was $37,945, and the median income for a family was $45,945. The per capita income for the city was $20,945. About 17.2% of families and 21.2% of the population were below the poverty line, including 28.2% of those under age 18 and 11.2% of those age 65 or over.
Common Questions
What is Per Capita Income in Gulfport?
Per Capita income in Gulfport is $26,397.
What is the Median Family Income in Gulfport?
Median Family Income in Gulfport is $54,838.
What is the Median Household income in Gulfport?
Median Household Income in Gulfport is $43,499.
What is Income or Wage Gap in Gulfport?
Income or Wage Gap in Gulfport is 20.4%.
Women in Gulfport earn 79.6 cents for every dollar earned by a man.
What is Family Income Deficit in Gulfport?
Family Income Deficit in Gulfport is $12,682.
Families that are below poverty line in Gulfport earn $12,682 less on average than the poverty threshold level.
What is Inequality or Gini Index in Gulfport?
Inequality or Gini Index in Gulfport is 0.49.
What is the Total Population of Gulfport?
Total Population of Gulfport is 72,524.
What is the Total Male Population of Gulfport?
Total Male Population of Gulfport is 34,939.
What is the Total Female Population of Gulfport?
Total Female Population of Gulfport is 37,585.
What is the Ratio of Males per 100 Females in Gulfport?
There are 92.96 Males per 100 Females in Gulfport.
What is the Ratio of Females per 100 Males in Gulfport?
There are 107.57 Females per 100 Males in Gulfport.
What is the Median Population Age in Gulfport?
Median Population Age in Gulfport is 36.1 Years.
What is the Average Family Size in Gulfport
Average Family Size in Gulfport is 3.1 People.
What is the Average Household Size in Gulfport
Average Household Size in Gulfport is 2.5 People.
How Large is the Labor Force in Gulfport?
There are 34,252 People in the Labor Forcein in Gulfport.
What is the Percentage of People in the Labor Force in Gulfport?
59.5% of People are in the Labor Force in Gulfport.
What is the Unemployment Rate in Gulfport?
Unemployment Rate in Gulfport is 11.4%.