Louisville, MS Map & Demographics
Louisville Map
Louisville Overview
$22,580
PER CAPITA INCOME
$34,567
AVG FAMILY INCOME
$36,078
AVG HOUSEHOLD INCOME
26.0%
WAGE / INCOME GAP [ % ]
74.0¢/ $1
WAGE / INCOME GAP [ $ ]
0.53
INEQUALITY / GINI INDEX
6,061
TOTAL POPULATION
2,977
MALE POPULATION
3,084
FEMALE POPULATION
96.53
MALES / 100 FEMALES
103.59
FEMALES / 100 MALES
39.9
MEDIAN AGE
3.2
AVG FAMILY SIZE
2.5
AVG HOUSEHOLD SIZE
2,020
LABOR FORCE [ PEOPLE ]
43.6%
PERCENT IN LABOR FORCE
7.0%
UNEMPLOYMENT RATE
Louisville Zip Codes
Louisville Area Codes
Income in Louisville
Income Overview in Louisville
Per Capita Income in Louisville is $22,580, while median incomes of families and households are $34,567 and $36,078 respectively.
| Characteristic | Number | Measure |
| Per Capita Income | 6,061 | $22,580 |
| Median Family Income | 1,502 | $34,567 |
| Mean Family Income | 1,502 | $62,252 |
| Median Household Income | 2,386 | $36,078 |
| Mean Household Income | 2,386 | $57,166 |
| Income Deficit | 1,502 | $0 |
| Wage / Income Gap (%) | 6,061 | 26.02% |
| Wage / Income Gap ($) | 6,061 | 73.98¢ per $1 |
| Gini / Inequality Index | 6,061 | 0.53 |
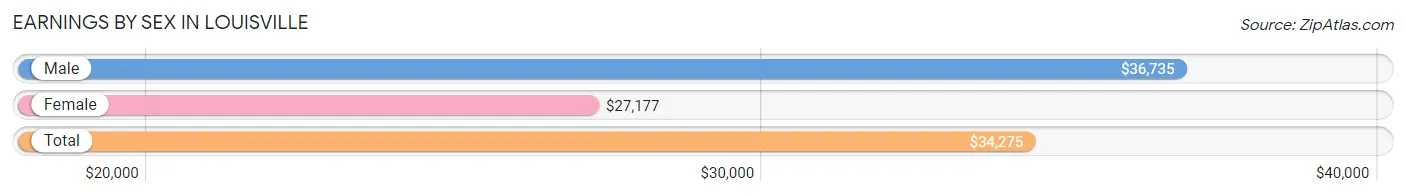
Earnings by Sex in Louisville
Average Earnings in Louisville are $34,275, $36,735 for men and $27,177 for women, a difference of 26.0%.
| Sex | Number | Average Earnings |
| Male | 1,030 (49.0%) | $36,735 |
| Female | 1,070 (50.9%) | $27,177 |
| Total | 2,100 (100.0%) | $34,275 |
Earnings by Sex by Income Bracket in Louisville
The most common earnings brackets in Louisville are $55,000 to $64,999 for men (138 | 13.4%) and $55,000 to $64,999 for women (139 | 13.0%).
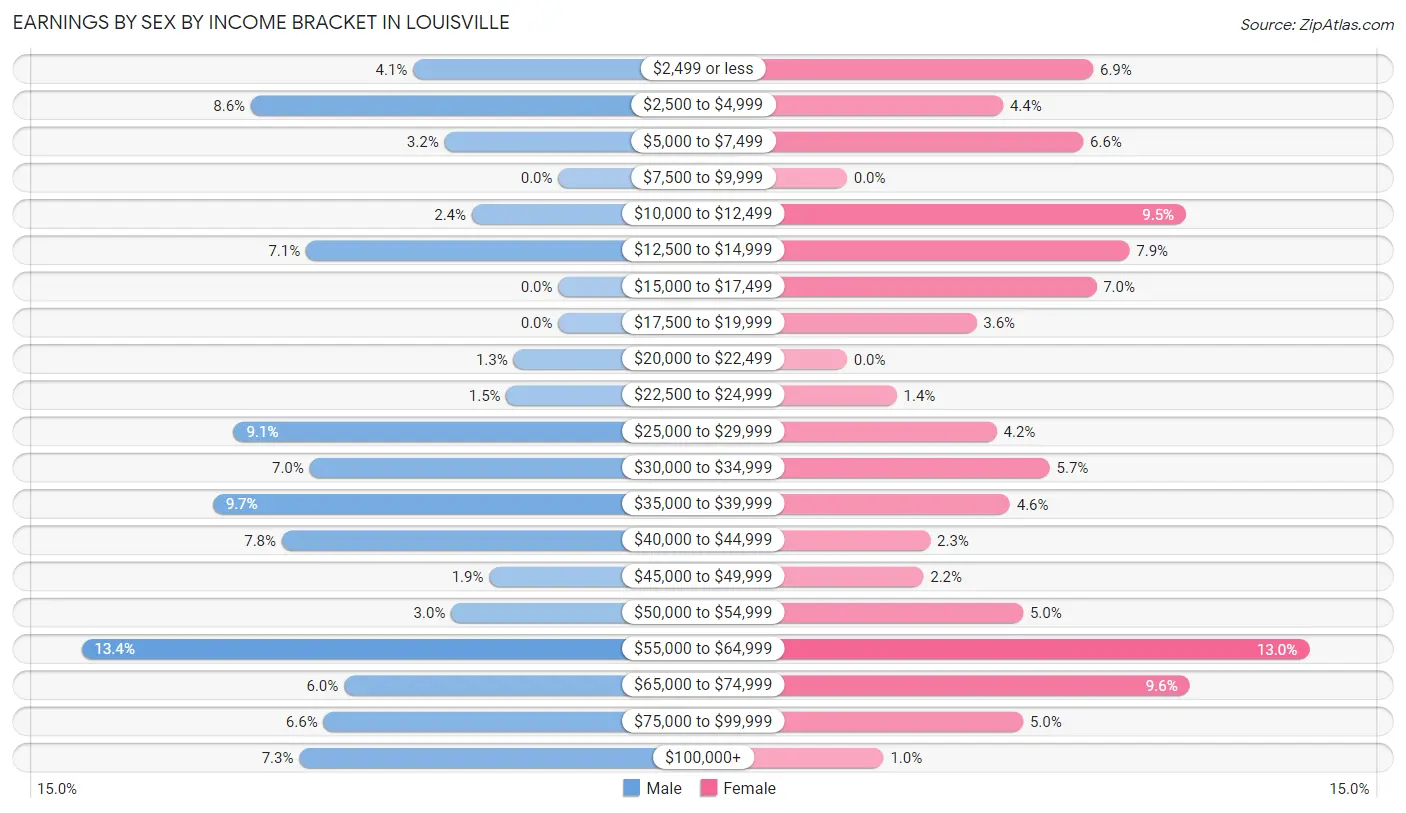
| Income | Male | Female |
| $2,499 or less | 42 (4.1%) | 74 (6.9%) |
| $2,500 to $4,999 | 89 (8.6%) | 47 (4.4%) |
| $5,000 to $7,499 | 33 (3.2%) | 71 (6.6%) |
| $7,500 to $9,999 | 0 (0.0%) | 0 (0.0%) |
| $10,000 to $12,499 | 25 (2.4%) | 102 (9.5%) |
| $12,500 to $14,999 | 73 (7.1%) | 85 (7.9%) |
| $15,000 to $17,499 | 0 (0.0%) | 75 (7.0%) |
| $17,500 to $19,999 | 0 (0.0%) | 39 (3.6%) |
| $20,000 to $22,499 | 13 (1.3%) | 0 (0.0%) |
| $22,500 to $24,999 | 15 (1.5%) | 15 (1.4%) |
| $25,000 to $29,999 | 94 (9.1%) | 45 (4.2%) |
| $30,000 to $34,999 | 72 (7.0%) | 61 (5.7%) |
| $35,000 to $39,999 | 100 (9.7%) | 49 (4.6%) |
| $40,000 to $44,999 | 80 (7.8%) | 25 (2.3%) |
| $45,000 to $49,999 | 20 (1.9%) | 23 (2.1%) |
| $50,000 to $54,999 | 31 (3.0%) | 53 (5.0%) |
| $55,000 to $64,999 | 138 (13.4%) | 139 (13.0%) |
| $65,000 to $74,999 | 62 (6.0%) | 103 (9.6%) |
| $75,000 to $99,999 | 68 (6.6%) | 53 (5.0%) |
| $100,000+ | 75 (7.3%) | 11 (1.0%) |
| Total | 1,030 (100.0%) | 1,070 (100.0%) |
Earnings by Sex by Educational Attainment in Louisville
Average earnings in Louisville are $41,716 for men and $32,875 for women, a difference of 21.2%. Men with an educational attainment of college or associate's degree enjoy the highest average annual earnings of $45,938, while those with less than high school education earn the least with $35,575. Women with an educational attainment of graduate degree earn the most with the average annual earnings of $85,625, while those with college or associate's degree education have the smallest earnings of $16,048.
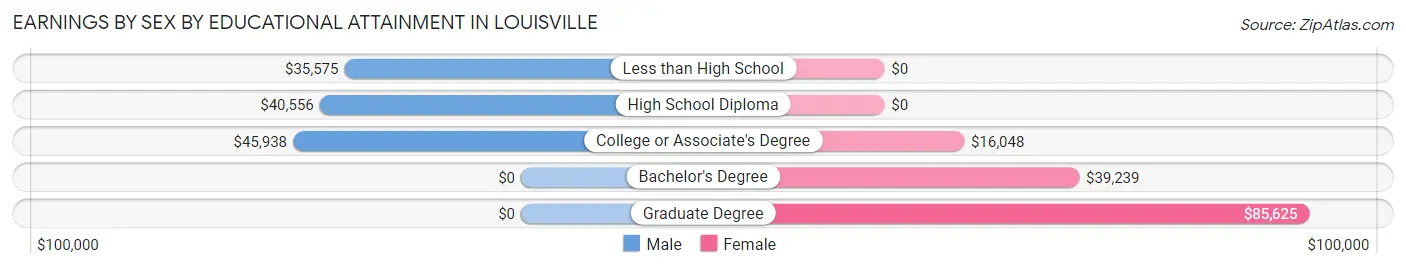
| Educational Attainment | Male Income | Female Income |
| Less than High School | $35,575 | $0 |
| High School Diploma | $40,556 | $0 |
| College or Associate's Degree | $45,938 | $16,048 |
| Bachelor's Degree | - | - |
| Graduate Degree | - | - |
| Total | $41,716 | $32,875 |
Family Income in Louisville
Family Income Brackets in Louisville
According to the Louisville family income data, there are 251 families falling into the $50,000 to $74,999 income range, which is the most common income bracket and makes up 16.7% of all families. Conversely, the $200,000+ income bracket is the least frequent group with only 53 families (3.5%) belonging to this category.
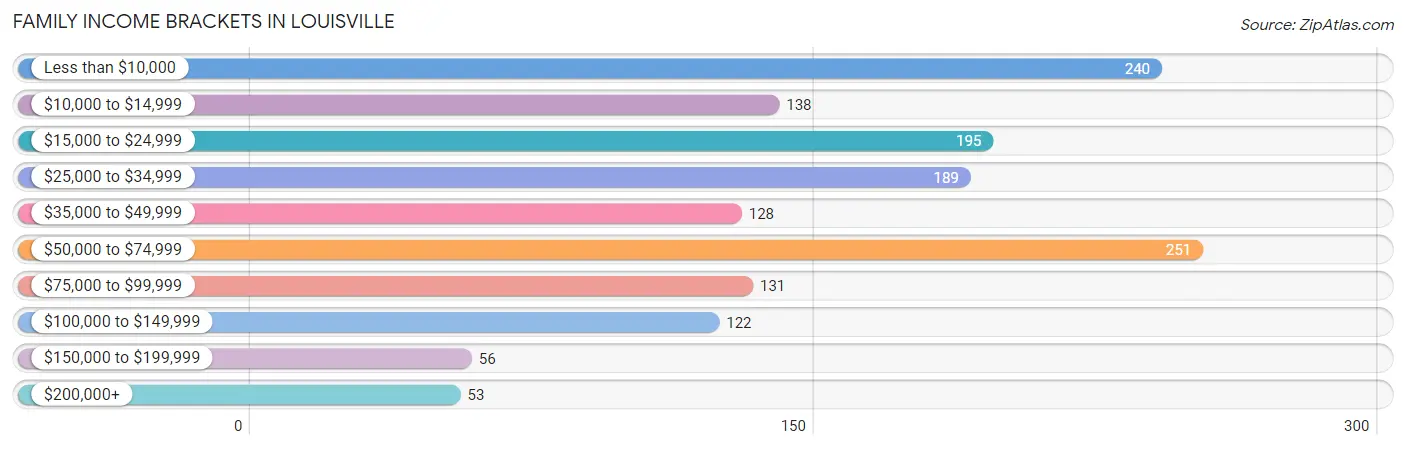
| Income Bracket | # Families | % Families |
| Less than $10,000 | 240 | 16.0% |
| $10,000 to $14,999 | 138 | 9.2% |
| $15,000 to $24,999 | 195 | 13.0% |
| $25,000 to $34,999 | 189 | 12.6% |
| $35,000 to $49,999 | 128 | 8.5% |
| $50,000 to $74,999 | 251 | 16.7% |
| $75,000 to $99,999 | 131 | 8.7% |
| $100,000 to $149,999 | 122 | 8.1% |
| $150,000 to $199,999 | 56 | 3.7% |
| $200,000+ | 53 | 3.5% |
Family Income by Famaliy Size in Louisville
4-person families (136 | 9.0%) account for the highest median family income in Louisville with $97,500 per family, while 4-person families (136 | 9.0%) have the highest median income of $24,375 per family member.
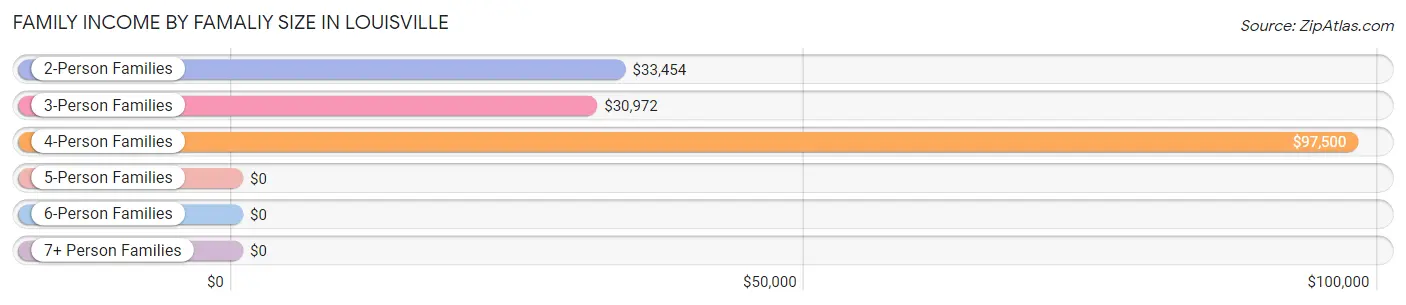
| Income Bracket | # Families | Median Income |
| 2-Person Families | 779 (51.9%) | $33,454 |
| 3-Person Families | 454 (30.2%) | $30,972 |
| 4-Person Families | 136 (9.0%) | $97,500 |
| 5-Person Families | 64 (4.3%) | $0 |
| 6-Person Families | 33 (2.2%) | $0 |
| 7+ Person Families | 36 (2.4%) | $0 |
| Total | 1,502 (100.0%) | $34,567 |
Family Income by Number of Earners in Louisville
The median family income in Louisville is $34,567, with families comprising 3+ earners (73) having the highest median family income of $165,795, while families with no earners (549) have the lowest median family income of $21,063, accounting for 4.9% and 36.5% of families, respectively.
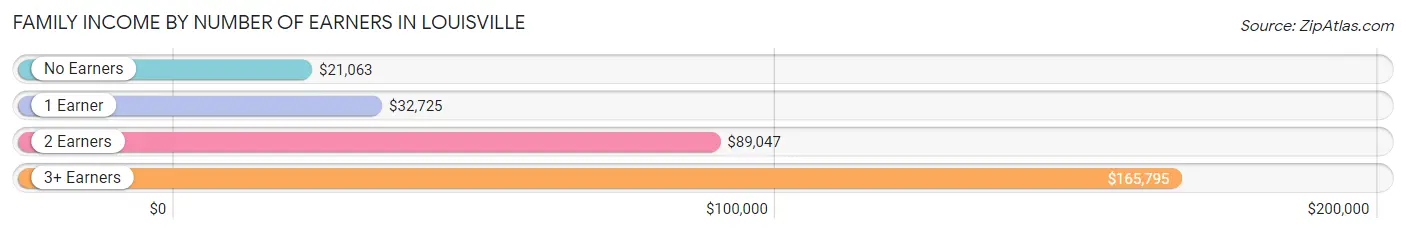
| Number of Earners | # Families | Median Income |
| No Earners | 549 (36.5%) | $21,063 |
| 1 Earner | 585 (39.0%) | $32,725 |
| 2 Earners | 295 (19.6%) | $89,047 |
| 3+ Earners | 73 (4.9%) | $165,795 |
| Total | 1,502 (100.0%) | $34,567 |
Household Income in Louisville
Household Income Brackets in Louisville
With 406 households falling in the category, the $50,000 to $74,999 income range is the most frequent in Louisville, accounting for 17.0% of all households. In contrast, only 55 households (2.3%) fall into the $150,000 to $199,999 income bracket, making it the least populous group.
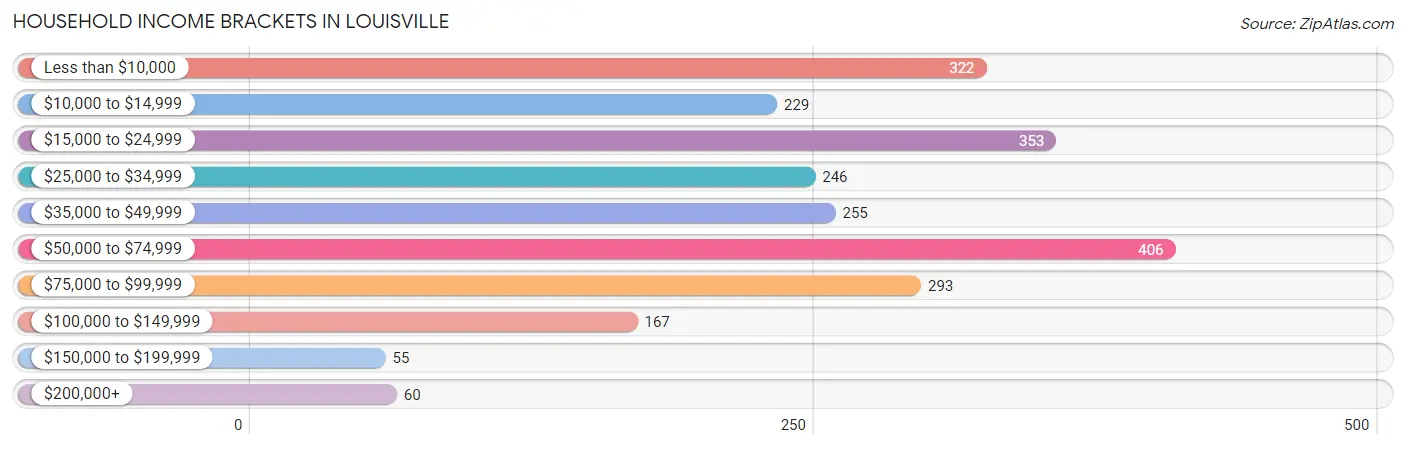
| Income Bracket | # Households | % Households |
| Less than $10,000 | 322 | 13.5% |
| $10,000 to $14,999 | 229 | 9.6% |
| $15,000 to $24,999 | 353 | 14.8% |
| $25,000 to $34,999 | 246 | 10.3% |
| $35,000 to $49,999 | 255 | 10.7% |
| $50,000 to $74,999 | 406 | 17.0% |
| $75,000 to $99,999 | 293 | 12.3% |
| $100,000 to $149,999 | 167 | 7.0% |
| $150,000 to $199,999 | 55 | 2.3% |
| $200,000+ | 60 | 2.5% |
Household Income by Householder Age in Louisville
The median household income in Louisville is $36,078, with the highest median household income of $58,125 found in the 45 to 64 years age bracket for the primary householder. A total of 810 households (34.0%) fall into this category. Meanwhile, the 25 to 44 years age bracket for the primary householder has the lowest median household income of $0, with 691 households (29.0%) in this group.
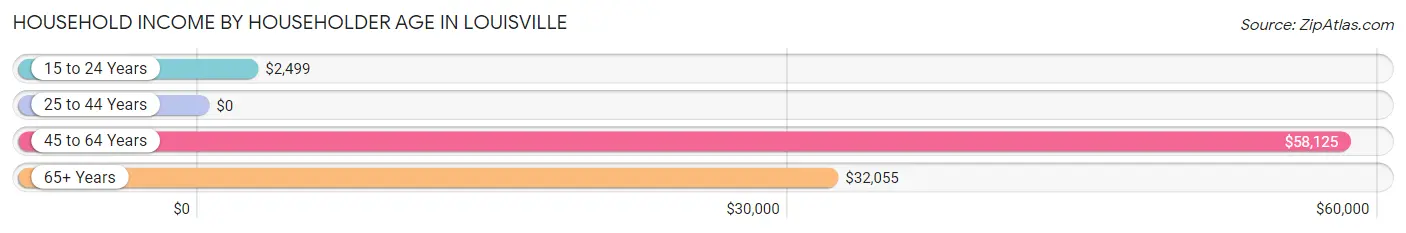
| Income Bracket | # Households | Median Income |
| 15 to 24 Years | 102 (4.3%) | $2,499 |
| 25 to 44 Years | 691 (29.0%) | $0 |
| 45 to 64 Years | 810 (34.0%) | $58,125 |
| 65+ Years | 783 (32.8%) | $32,055 |
| Total | 2,386 (100.0%) | $36,078 |
Poverty in Louisville
Income Below Poverty by Sex and Age in Louisville
With 36.5% poverty level for males and 34.0% for females among the residents of Louisville, under 5 year old males and under 5 year old females are the most vulnerable to poverty, with 120 males (75.9%) and 14 females (100.0%) in their respective age groups living below the poverty level.
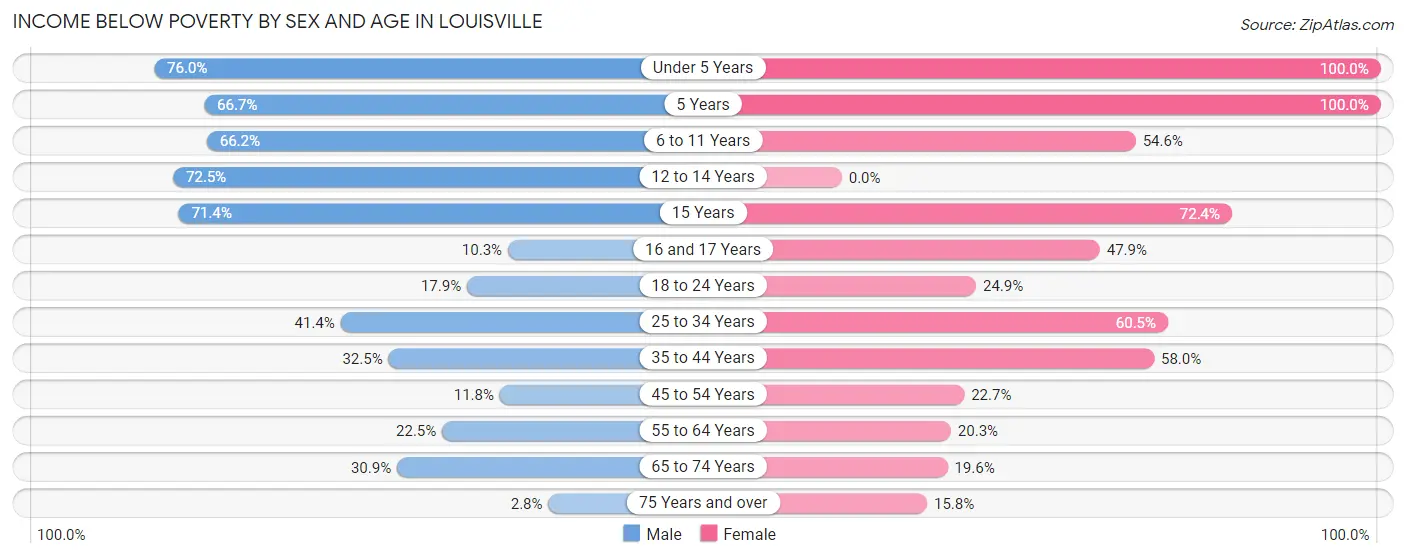
| Age Bracket | Male | Female |
| Under 5 Years | 120 (75.9%) | 14 (100.0%) |
| 5 Years | 22 (66.7%) | 31 (100.0%) |
| 6 to 11 Years | 274 (66.2%) | 96 (54.5%) |
| 12 to 14 Years | 121 (72.5%) | 0 (0.0%) |
| 15 Years | 40 (71.4%) | 97 (72.4%) |
| 16 and 17 Years | 7 (10.3%) | 34 (47.9%) |
| 18 to 24 Years | 39 (17.9%) | 81 (24.9%) |
| 25 to 34 Years | 86 (41.3%) | 164 (60.5%) |
| 35 to 44 Years | 124 (32.5%) | 233 (58.0%) |
| 45 to 54 Years | 27 (11.8%) | 70 (22.7%) |
| 55 to 64 Years | 126 (22.5%) | 82 (20.3%) |
| 65 to 74 Years | 84 (30.9%) | 52 (19.6%) |
| 75 Years and over | 5 (2.8%) | 56 (15.8%) |
| Total | 1,075 (36.5%) | 1,010 (34.0%) |
Income Above Poverty by Sex and Age in Louisville
According to the poverty statistics in Louisville, males aged 75 years and over and females aged 12 to 14 years are the age groups that are most secure financially, with 97.2% of males and 100.0% of females in these age groups living above the poverty line.
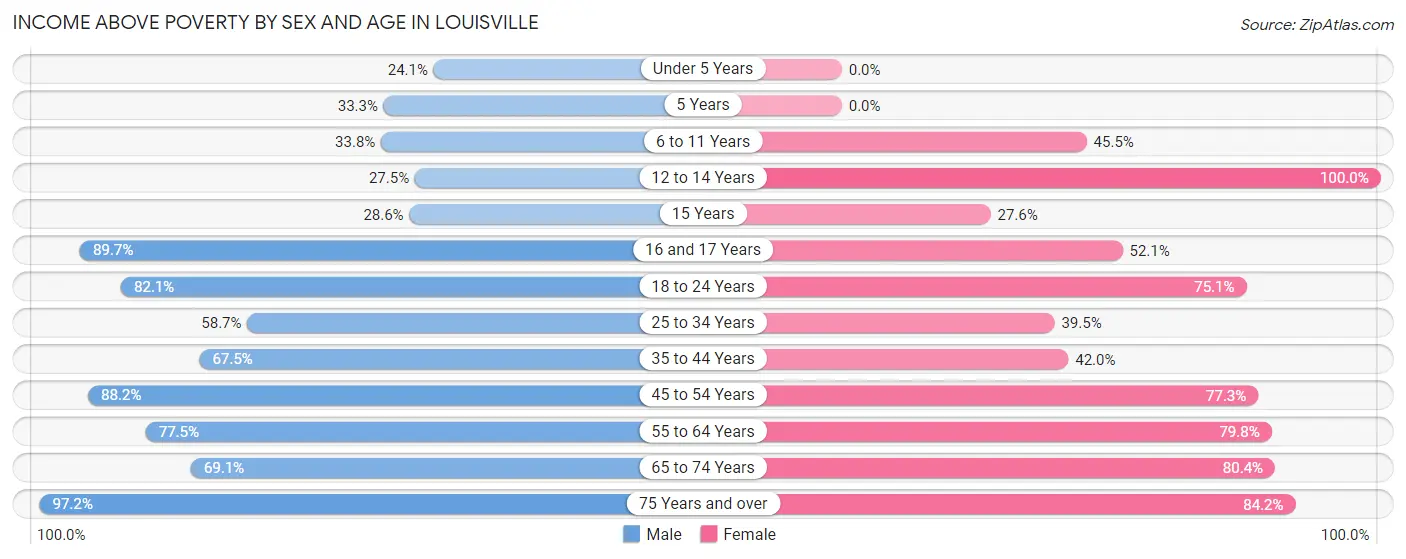
| Age Bracket | Male | Female |
| Under 5 Years | 38 (24.0%) | 0 (0.0%) |
| 5 Years | 11 (33.3%) | 0 (0.0%) |
| 6 to 11 Years | 140 (33.8%) | 80 (45.5%) |
| 12 to 14 Years | 46 (27.5%) | 219 (100.0%) |
| 15 Years | 16 (28.6%) | 37 (27.6%) |
| 16 and 17 Years | 61 (89.7%) | 37 (52.1%) |
| 18 to 24 Years | 179 (82.1%) | 244 (75.1%) |
| 25 to 34 Years | 122 (58.7%) | 107 (39.5%) |
| 35 to 44 Years | 258 (67.5%) | 169 (42.0%) |
| 45 to 54 Years | 202 (88.2%) | 238 (77.3%) |
| 55 to 64 Years | 434 (77.5%) | 323 (79.7%) |
| 65 to 74 Years | 188 (69.1%) | 213 (80.4%) |
| 75 Years and over | 175 (97.2%) | 298 (84.2%) |
| Total | 1,870 (63.5%) | 1,965 (66.0%) |
Income Below Poverty Among Married-Couple Families in Louisville
The poverty statistics for married-couple families in Louisville show that 13.7% or 102 of the total 745 families live below the poverty line. Families with 5 or more children have the highest poverty rate of 100.0%, comprising of 36 families. On the other hand, families with 1 or 2 children have the lowest poverty rate of 0.0%, which includes 0 families.
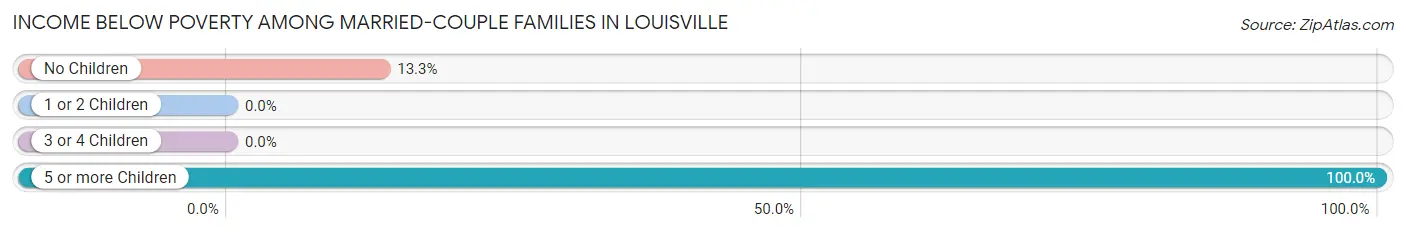
| Children | Above Poverty | Below Poverty |
| No Children | 432 (86.8%) | 66 (13.3%) |
| 1 or 2 Children | 194 (100.0%) | 0 (0.0%) |
| 3 or 4 Children | 17 (100.0%) | 0 (0.0%) |
| 5 or more Children | 0 (0.0%) | 36 (100.0%) |
| Total | 643 (86.3%) | 102 (13.7%) |
Income Below Poverty Among Single-Parent Households in Louisville
According to the poverty data in Louisville, 29.3% or 27 single-father households and 58.1% or 386 single-mother households are living below the poverty line. Among single-father households, those with no children have the highest poverty rate, with 27 households (39.7%) experiencing poverty. Likewise, among single-mother households, those with 3 or 4 children have the highest poverty rate, with 29 households (100.0%) falling below the poverty line.
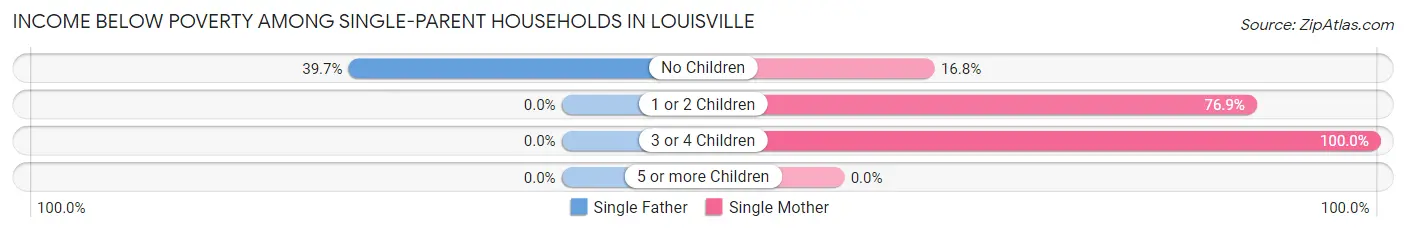
| Children | Single Father | Single Mother |
| No Children | 27 (39.7%) | 37 (16.8%) |
| 1 or 2 Children | 0 (0.0%) | 320 (76.9%) |
| 3 or 4 Children | 0 (0.0%) | 29 (100.0%) |
| 5 or more Children | 0 (0.0%) | 0 (0.0%) |
| Total | 27 (29.3%) | 386 (58.1%) |
Income Below Poverty Among Married-Couple vs Single-Parent Households in Louisville
The poverty data for Louisville shows that 102 of the married-couple family households (13.7%) and 413 of the single-parent households (54.6%) are living below the poverty level. Within the married-couple family households, those with 5 or more children have the highest poverty rate, with 36 households (100.0%) falling below the poverty line. Among the single-parent households, those with 3 or 4 children have the highest poverty rate, with 29 household (100.0%) living below poverty.
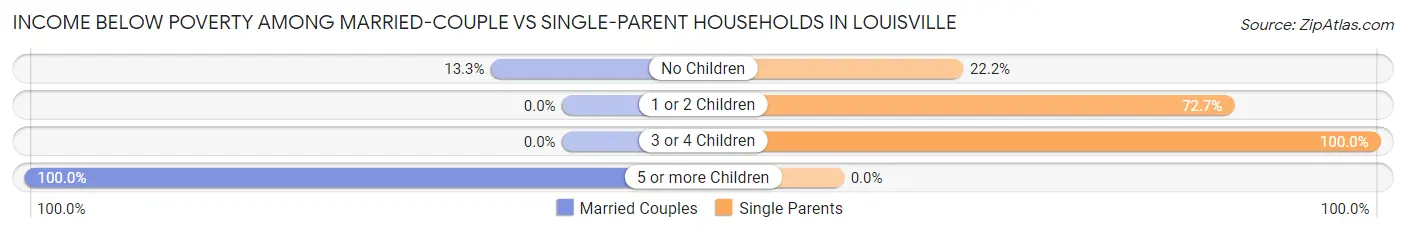
| Children | Married-Couple Families | Single-Parent Households |
| No Children | 66 (13.3%) | 64 (22.2%) |
| 1 or 2 Children | 0 (0.0%) | 320 (72.7%) |
| 3 or 4 Children | 0 (0.0%) | 29 (100.0%) |
| 5 or more Children | 36 (100.0%) | 0 (0.0%) |
| Total | 102 (13.7%) | 413 (54.6%) |
Race in Louisville
The most populous races in Louisville are Black / African American (3,613 | 59.6%), White / Caucasian (2,226 | 36.7%), and Two or more Races (198 | 3.3%).
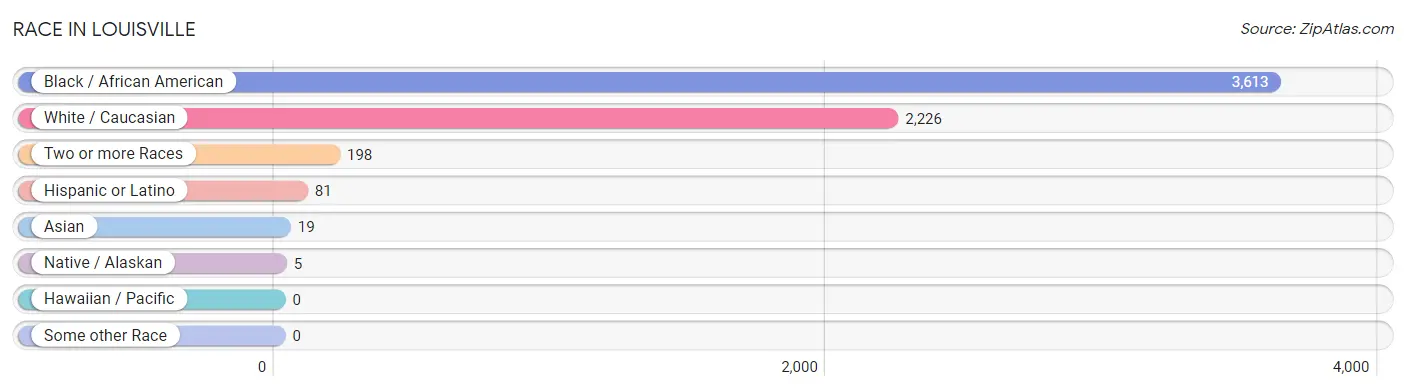
| Race | # Population | % Population |
| Asian | 19 | 0.3% |
| Black / African American | 3,613 | 59.6% |
| Hawaiian / Pacific | 0 | 0.0% |
| Hispanic or Latino | 81 | 1.3% |
| Native / Alaskan | 5 | 0.1% |
| White / Caucasian | 2,226 | 36.7% |
| Two or more Races | 198 | 3.3% |
| Some other Race | 0 | 0.0% |
| Total | 6,061 | 100.0% |
Ancestry in Louisville
The most populous ancestries reported in Louisville are English (492 | 8.1%), American (336 | 5.5%), Irish (336 | 5.5%), German (138 | 2.3%), and African (134 | 2.2%), together accounting for 23.7% of all Louisville residents.
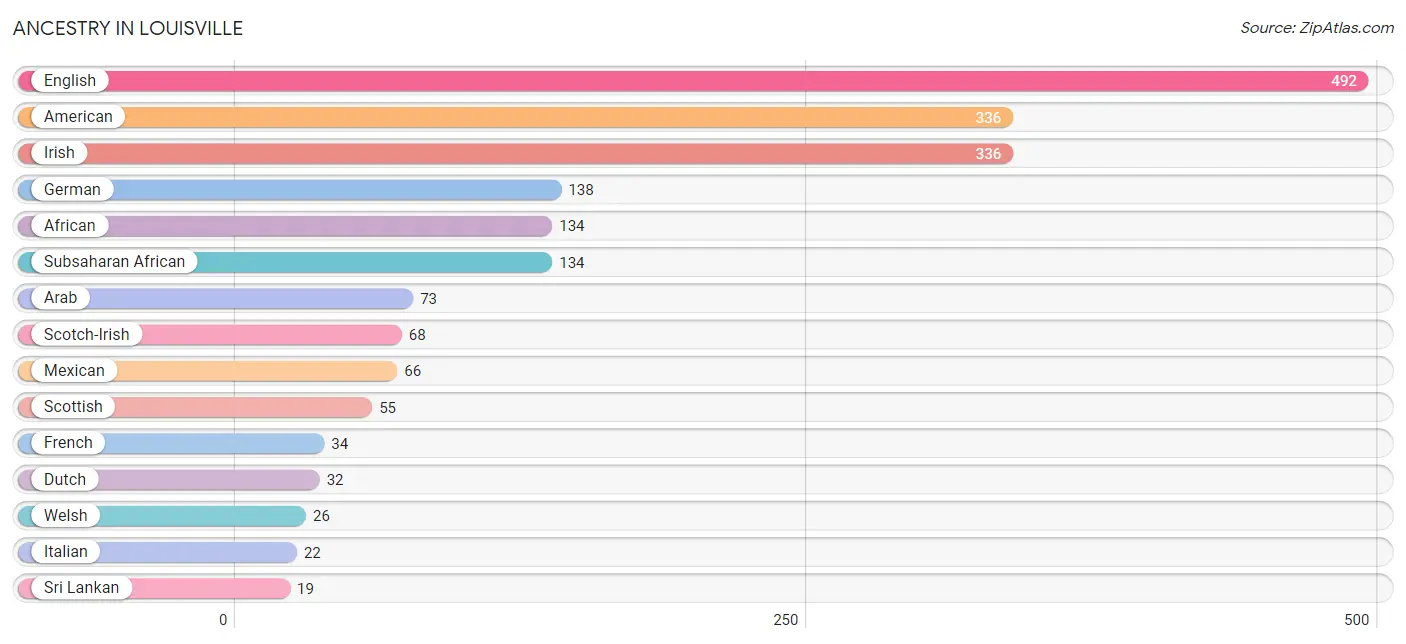
| Ancestry | # Population | % Population |
| African | 134 | 2.2% |
| American | 336 | 5.5% |
| Apache | 5 | 0.1% |
| Arab | 73 | 1.2% |
| Belgian | 7 | 0.1% |
| Dutch | 32 | 0.5% |
| English | 492 | 8.1% |
| French | 34 | 0.6% |
| German | 138 | 2.3% |
| Irish | 336 | 5.5% |
| Italian | 22 | 0.4% |
| Mexican | 66 | 1.1% |
| Northern European | 5 | 0.1% |
| Puerto Rican | 15 | 0.3% |
| Scotch-Irish | 68 | 1.1% |
| Scottish | 55 | 0.9% |
| Sri Lankan | 19 | 0.3% |
| Subsaharan African | 134 | 2.2% |
| Welsh | 26 | 0.4% | View All 19 Rows |
Immigrants in Louisville
The most numerous immigrant groups reported in Louisville came from Asia (40 | 0.7%), Western Asia (21 | 0.4%), Yemen (21 | 0.4%), South Eastern Asia (19 | 0.3%), and Vietnam (19 | 0.3%), together accounting for 2.0% of all Louisville residents.
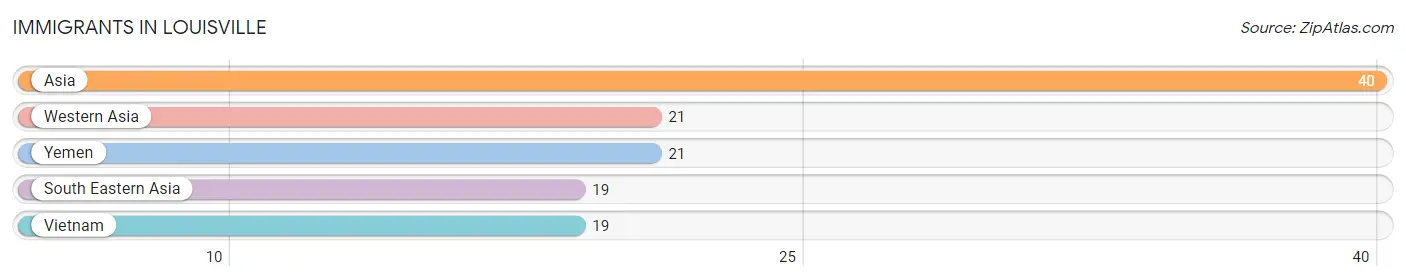
| Immigration Origin | # Population | % Population |
| Asia | 40 | 0.7% |
| South Eastern Asia | 19 | 0.3% |
| Vietnam | 19 | 0.3% |
| Western Asia | 21 | 0.4% |
| Yemen | 21 | 0.4% | View All 5 Rows |
Sex and Age in Louisville
Sex and Age in Louisville
The most populous age groups in Louisville are 10 to 14 Years (380 | 12.8%) for men and 10 to 14 Years (339 | 11.0%) for women.
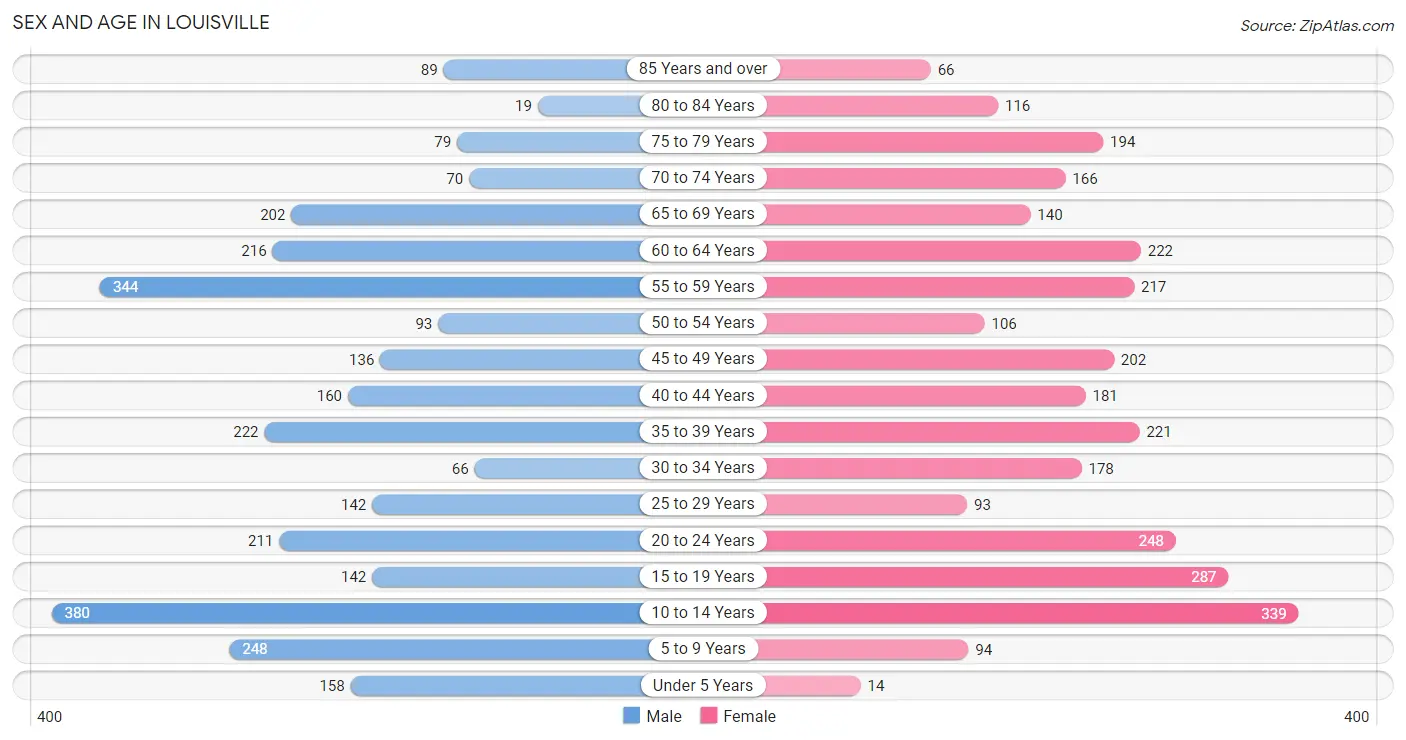
| Age Bracket | Male | Female |
| Under 5 Years | 158 (5.3%) | 14 (0.4%) |
| 5 to 9 Years | 248 (8.3%) | 94 (3.0%) |
| 10 to 14 Years | 380 (12.8%) | 339 (11.0%) |
| 15 to 19 Years | 142 (4.8%) | 287 (9.3%) |
| 20 to 24 Years | 211 (7.1%) | 248 (8.0%) |
| 25 to 29 Years | 142 (4.8%) | 93 (3.0%) |
| 30 to 34 Years | 66 (2.2%) | 178 (5.8%) |
| 35 to 39 Years | 222 (7.5%) | 221 (7.2%) |
| 40 to 44 Years | 160 (5.4%) | 181 (5.9%) |
| 45 to 49 Years | 136 (4.6%) | 202 (6.6%) |
| 50 to 54 Years | 93 (3.1%) | 106 (3.4%) |
| 55 to 59 Years | 344 (11.6%) | 217 (7.0%) |
| 60 to 64 Years | 216 (7.3%) | 222 (7.2%) |
| 65 to 69 Years | 202 (6.8%) | 140 (4.5%) |
| 70 to 74 Years | 70 (2.4%) | 166 (5.4%) |
| 75 to 79 Years | 79 (2.6%) | 194 (6.3%) |
| 80 to 84 Years | 19 (0.6%) | 116 (3.8%) |
| 85 Years and over | 89 (3.0%) | 66 (2.1%) |
| Total | 2,977 (100.0%) | 3,084 (100.0%) |
Families and Households in Louisville
Median Family Size in Louisville
The median family size in Louisville is 3.16 persons per family, with single male/father families (92 | 6.1%) accounting for the largest median family size of 3.59 persons per family. On the other hand, single female/mother families (665 | 44.3%) represent the smallest median family size with 2.95 persons per family.
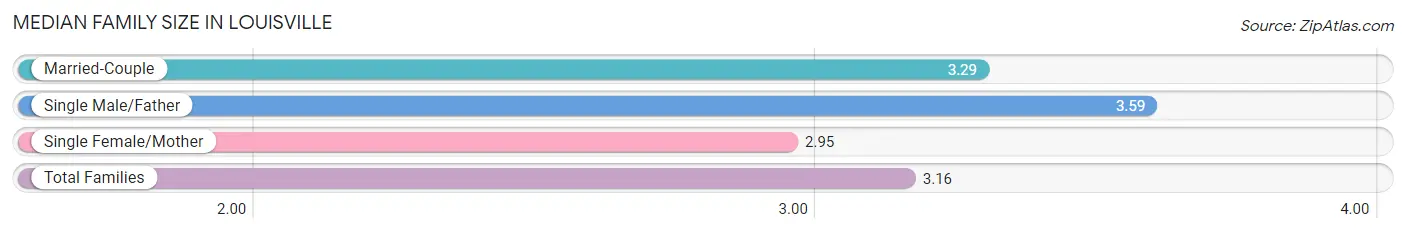
| Family Type | # Families | Family Size |
| Married-Couple | 745 (49.6%) | 3.29 |
| Single Male/Father | 92 (6.1%) | 3.59 |
| Single Female/Mother | 665 (44.3%) | 2.95 |
| Total Families | 1,502 (100.0%) | 3.16 |
Median Household Size in Louisville
The median household size in Louisville is 2.47 persons per household, with single male/father households (92 | 3.9%) accounting for the largest median household size of 3.79 persons per household. non-family households (884 | 37.0%) represent the smallest median household size with 1.19 persons per household.
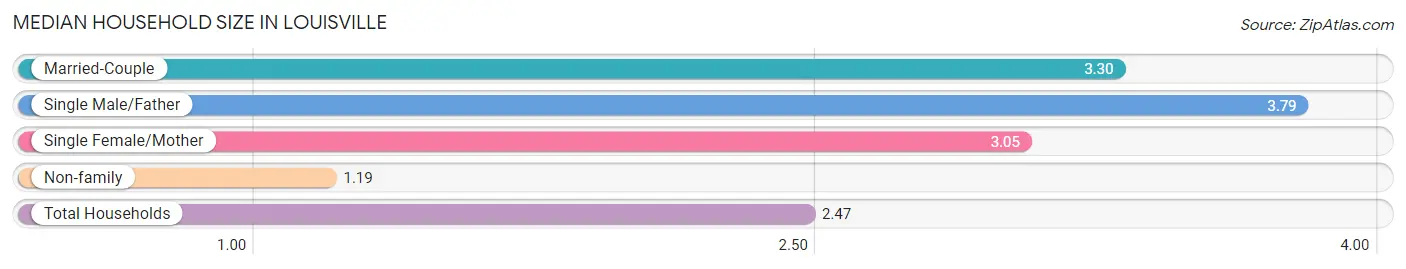
| Household Type | # Households | Household Size |
| Married-Couple | 745 (31.2%) | 3.30 |
| Single Male/Father | 92 (3.9%) | 3.79 |
| Single Female/Mother | 665 (27.9%) | 3.05 |
| Non-family | 884 (37.0%) | 1.19 |
| Total Households | 2,386 (100.0%) | 2.47 |
Household Size by Marriage Status in Louisville
Out of a total of 2,386 households in Louisville, 1,502 (62.9%) are family households, while 884 (37.0%) are nonfamily households. The most numerous type of family households are 2-person households, comprising 656, and the most common type of nonfamily households are 1-person households, comprising 711.
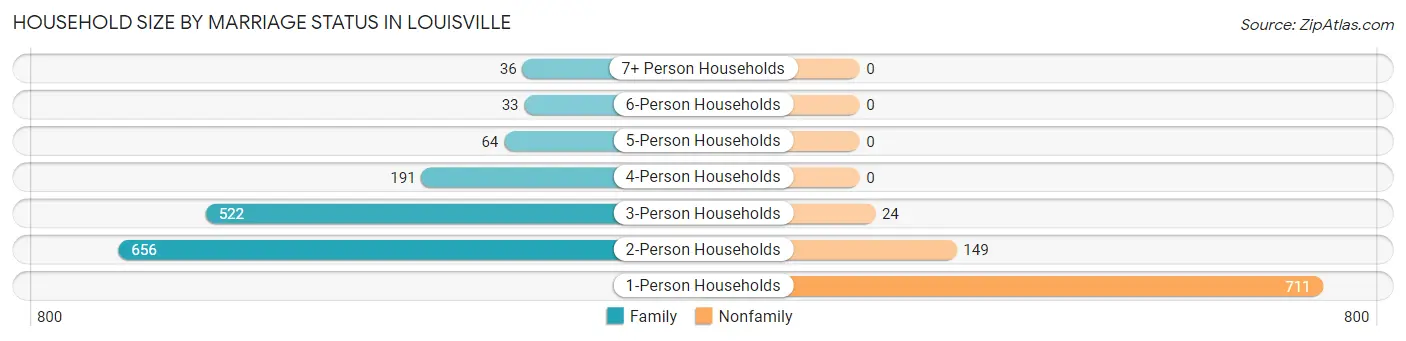
| Household Size | Family Households | Nonfamily Households |
| 1-Person Households | - | 711 (29.8%) |
| 2-Person Households | 656 (27.5%) | 149 (6.2%) |
| 3-Person Households | 522 (21.9%) | 24 (1.0%) |
| 4-Person Households | 191 (8.0%) | 0 (0.0%) |
| 5-Person Households | 64 (2.7%) | 0 (0.0%) |
| 6-Person Households | 33 (1.4%) | 0 (0.0%) |
| 7+ Person Households | 36 (1.5%) | 0 (0.0%) |
| Total | 1,502 (62.9%) | 884 (37.0%) |
Female Fertility in Louisville
Fertility by Age in Louisville
Average fertility rate in Louisville is 41.0 births per 1,000 women. Women in the age bracket of 35 to 50 years have the highest fertility rate with 61.0 births per 1,000 women. Women in the age bracket of 35 to 50 years acount for 65.0% of all women with births.
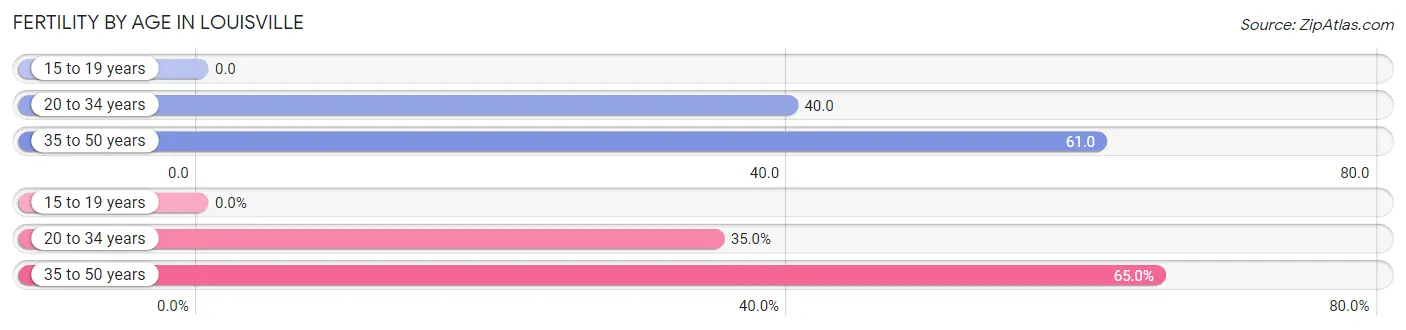
| Age Bracket | Women with Births | Births / 1,000 Women |
| 15 to 19 years | 0 (0.0%) | 0.0 |
| 20 to 34 years | 21 (35.0%) | 40.0 |
| 35 to 50 years | 39 (65.0%) | 61.0 |
| Total | 60 (100.0%) | 41.0 |
Fertility by Age by Marriage Status in Louisville
95.0% of women with births (60) in Louisville are married. The highest percentage of unmarried women with births falls into 35 to 50 years age bracket with 7.7% of them unmarried at the time of birth, while the lowest percentage of unmarried women with births belong to 20 to 34 years age bracket with 0.0% of them unmarried.
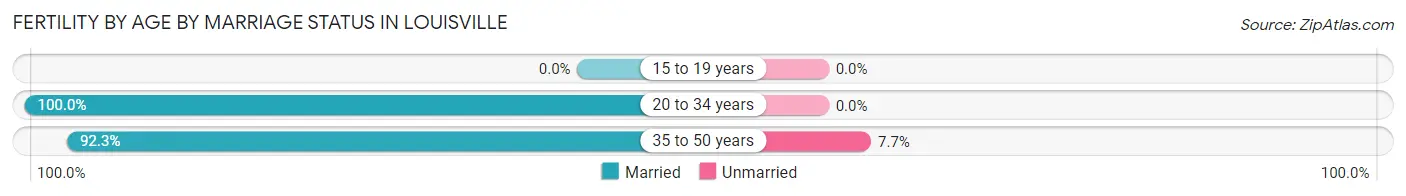
| Age Bracket | Married | Unmarried |
| 15 to 19 years | 0 (0.0%) | 0 (0.0%) |
| 20 to 34 years | 21 (100.0%) | 0 (0.0%) |
| 35 to 50 years | 36 (92.3%) | 3 (7.7%) |
| Total | 57 (95.0%) | 3 (5.0%) |
Fertility by Education in Louisville
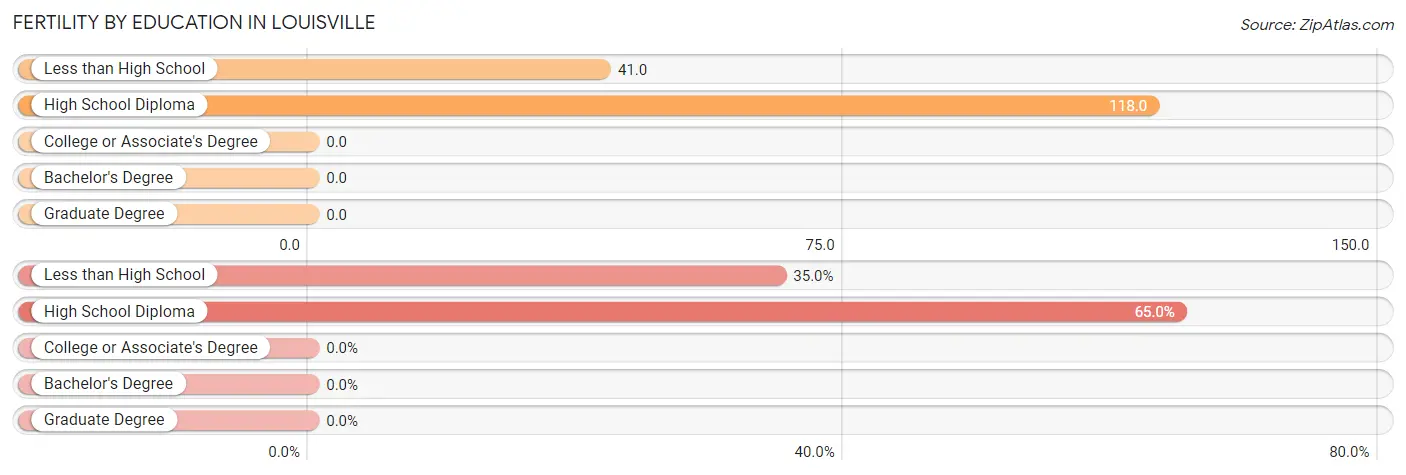
| Educational Attainment | Women with Births | Births / 1,000 Women |
| Less than High School | 21 (35.0%) | 41.0 |
| High School Diploma | 39 (65.0%) | 118.0 |
| College or Associate's Degree | 0 (0.0%) | 0.0 |
| Bachelor's Degree | 0 (0.0%) | 0.0 |
| Graduate Degree | 0 (0.0%) | 0.0 |
| Total | 60 (100.0%) | 41.0 |
Fertility by Education by Marriage Status in Louisville
5.0% of women with births in Louisville are unmarried. Women with the educational attainment of less than high school are most likely to be married with 100.0% of them married at childbirth, while women with the educational attainment of high school diploma are least likely to be married with 7.7% of them unmarried at childbirth.
| Educational Attainment | Married | Unmarried |
| Less than High School | 21 (100.0%) | 0 (0.0%) |
| High School Diploma | 36 (92.3%) | 3 (7.7%) |
| College or Associate's Degree | 0 (0.0%) | 0 (0.0%) |
| Bachelor's Degree | 0 (0.0%) | 0 (0.0%) |
| Graduate Degree | 0 (0.0%) | 0 (0.0%) |
| Total | 57 (95.0%) | 3 (5.0%) |
Employment Characteristics in Louisville
Employment by Class of Employer in Louisville
Among the 1,760 employed individuals in Louisville, private company employees (1,244 | 70.7%), federal government employees (186 | 10.6%), and state government employees (99 | 5.6%) make up the most common classes of employment.
| Employer Class | # Employees | % Employees |
| Private Company Employees | 1,244 | 70.7% |
| Self-Employed (Incorporated) | 38 | 2.2% |
| Self-Employed (Not Incorporated) | 81 | 4.6% |
| Not-for-profit Organizations | 55 | 3.1% |
| Local Government Employees | 57 | 3.2% |
| State Government Employees | 99 | 5.6% |
| Federal Government Employees | 186 | 10.6% |
| Unpaid Family Workers | 0 | 0.0% |
| Total | 1,760 | 100.0% |
Employment Status by Age in Louisville
According to the labor force statistics for Louisville, out of the total population over 16 years of age (4,633), 43.6% or 2,020 individuals are in the labor force, with 7.0% or 141 of them unemployed. The age group with the highest labor force participation rate is 25 to 29 years, with 80.4% or 189 individuals in the labor force. Within the labor force, the 25 to 29 years age range has the highest percentage of unemployed individuals, with 19.6% or 37 of them being unemployed.
| Age Bracket | In Labor Force | Unemployed |
| 16 to 19 Years | 6 (2.6%) | 0 (0.0%) |
| 20 to 24 Years | 194 (42.3%) | 0 (0.0%) |
| 25 to 29 Years | 189 (80.4%) | 37 (19.6%) |
| 30 to 34 Years | 167 (68.4%) | 26 (15.6%) |
| 35 to 44 Years | 582 (74.2%) | 52 (8.9%) |
| 45 to 54 Years | 406 (75.6%) | 0 (0.0%) |
| 55 to 59 Years | 233 (41.5%) | 26 (11.2%) |
| 60 to 64 Years | 128 (29.2%) | 0 (0.0%) |
| 65 to 74 Years | 74 (12.8%) | 0 (0.0%) |
| 75 Years and over | 43 (7.6%) | 0 (0.0%) |
| Total | 2,020 (43.6%) | 141 (7.0%) |
Employment Status by Educational Attainment in Louisville
According to labor force statistics for Louisville, 60.9% of individuals (1,705) out of the total population between 25 and 64 years of age (2,799) are in the labor force, with 8.3% or 142 of them being unemployed. The group with the highest labor force participation rate are those with the educational attainment of bachelor's degree or higher, with 92.2% or 332 individuals in the labor force. Within the labor force, individuals with less than high school education have the highest percentage of unemployment, with 32.9% or 71 of them being unemployed.
| Educational Attainment | In Labor Force | Unemployed |
| Less than High School | 216 (38.8%) | 183 (32.9%) |
| High School Diploma | 642 (50.7%) | 51 (4.0%) |
| College / Associate Degree | 514 (83.6%) | 22 (3.5%) |
| Bachelor's Degree or higher | 332 (92.2%) | 28 (7.8%) |
| Total | 1,705 (60.9%) | 232 (8.3%) |
Employment Occupations by Sex in Louisville
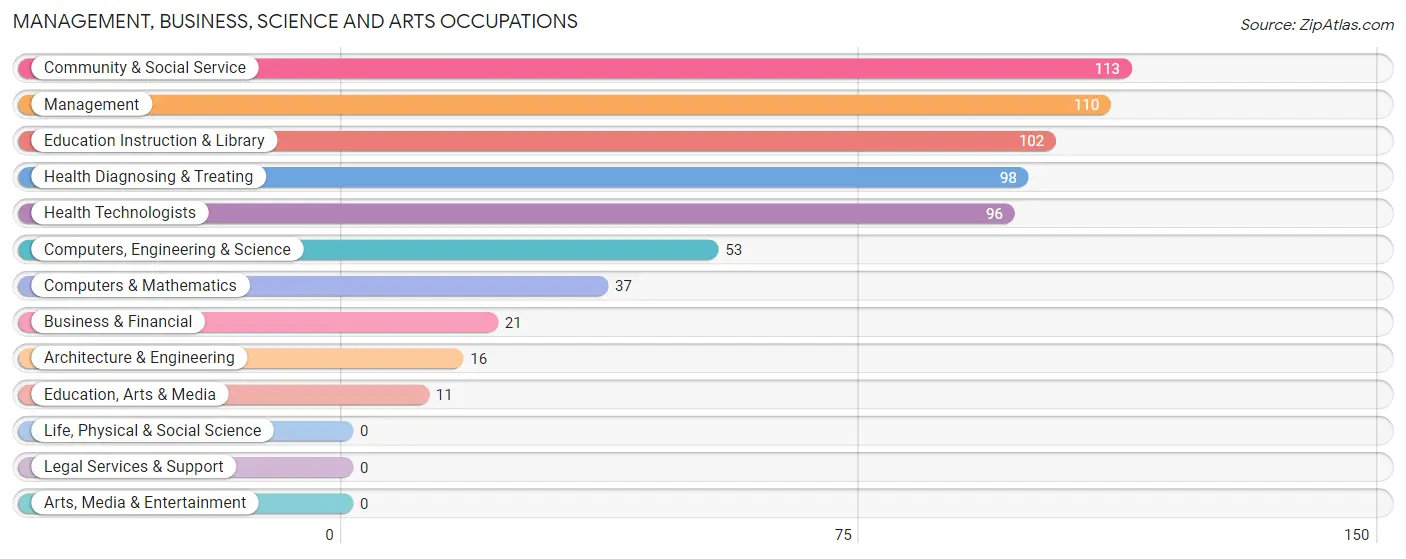
Management, Business, Science and Arts Occupations
The most common Management, Business, Science and Arts occupations in Louisville are Community & Social Service (113 | 6.0%), Management (110 | 5.9%), Education Instruction & Library (102 | 5.4%), Health Diagnosing & Treating (98 | 5.2%), and Health Technologists (96 | 5.1%).
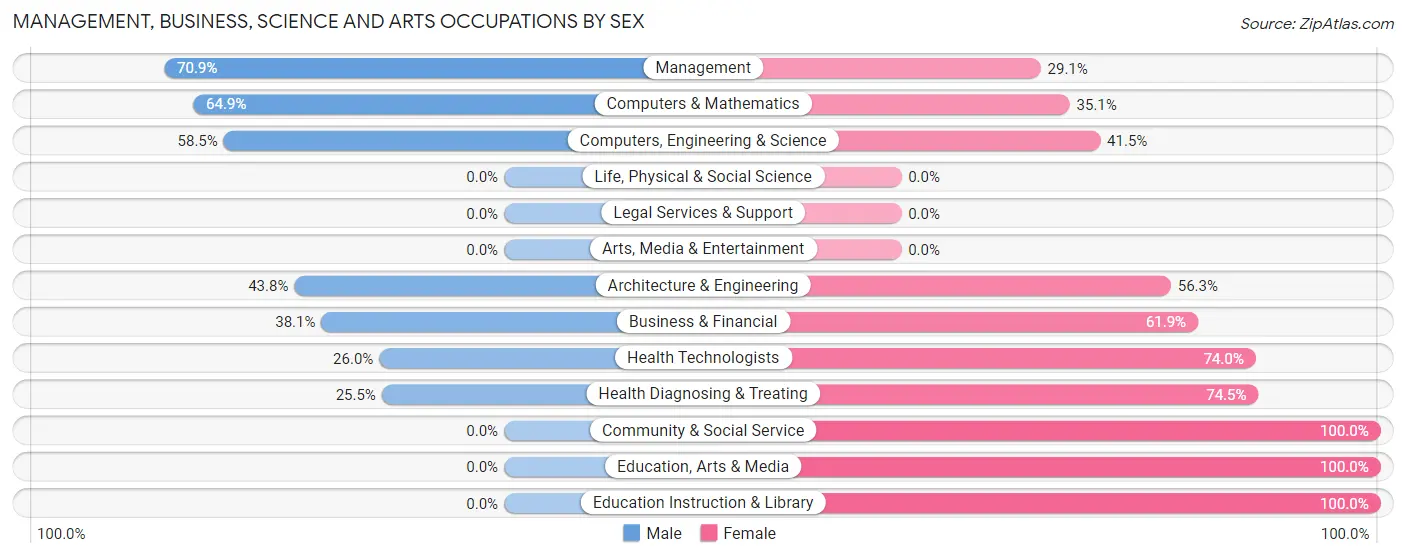
Management, Business, Science and Arts Occupations by Sex
Within the Management, Business, Science and Arts occupations in Louisville, the most male-oriented occupations are Management (70.9%), Computers & Mathematics (64.9%), and Computers, Engineering & Science (58.5%), while the most female-oriented occupations are Community & Social Service (100.0%), Education, Arts & Media (100.0%), and Education Instruction & Library (100.0%).
| Occupation | Male | Female |
| Management | 78 (70.9%) | 32 (29.1%) |
| Business & Financial | 8 (38.1%) | 13 (61.9%) |
| Computers, Engineering & Science | 31 (58.5%) | 22 (41.5%) |
| Computers & Mathematics | 24 (64.9%) | 13 (35.1%) |
| Architecture & Engineering | 7 (43.8%) | 9 (56.2%) |
| Life, Physical & Social Science | 0 (0.0%) | 0 (0.0%) |
| Community & Social Service | 0 (0.0%) | 113 (100.0%) |
| Education, Arts & Media | 0 (0.0%) | 11 (100.0%) |
| Legal Services & Support | 0 (0.0%) | 0 (0.0%) |
| Education Instruction & Library | 0 (0.0%) | 102 (100.0%) |
| Arts, Media & Entertainment | 0 (0.0%) | 0 (0.0%) |
| Health Diagnosing & Treating | 25 (25.5%) | 73 (74.5%) |
| Health Technologists | 25 (26.0%) | 71 (74.0%) |
| Total (Category) | 142 (35.9%) | 253 (64.0%) |
| Total (Overall) | 909 (48.3%) | 972 (51.7%) |
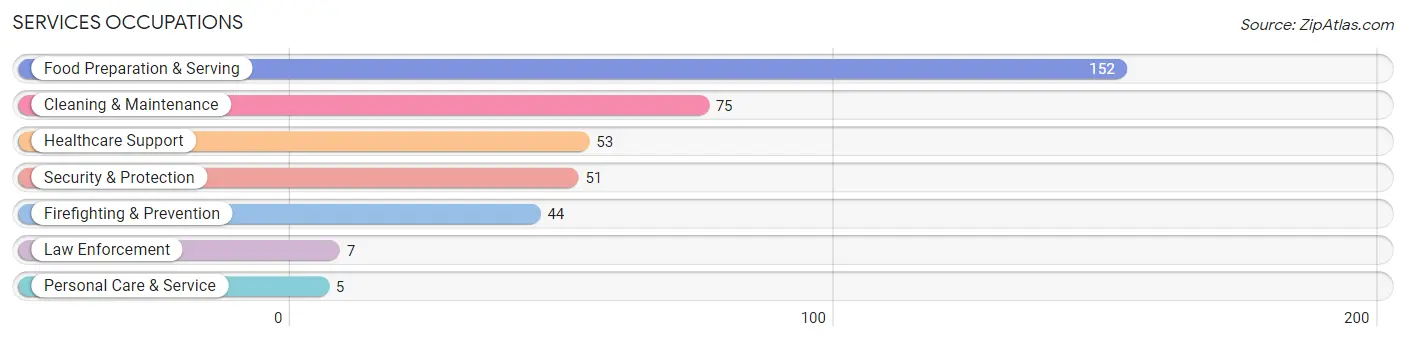
Services Occupations
The most common Services occupations in Louisville are Food Preparation & Serving (152 | 8.1%), Cleaning & Maintenance (75 | 4.0%), Healthcare Support (53 | 2.8%), Security & Protection (51 | 2.7%), and Firefighting & Prevention (44 | 2.3%).
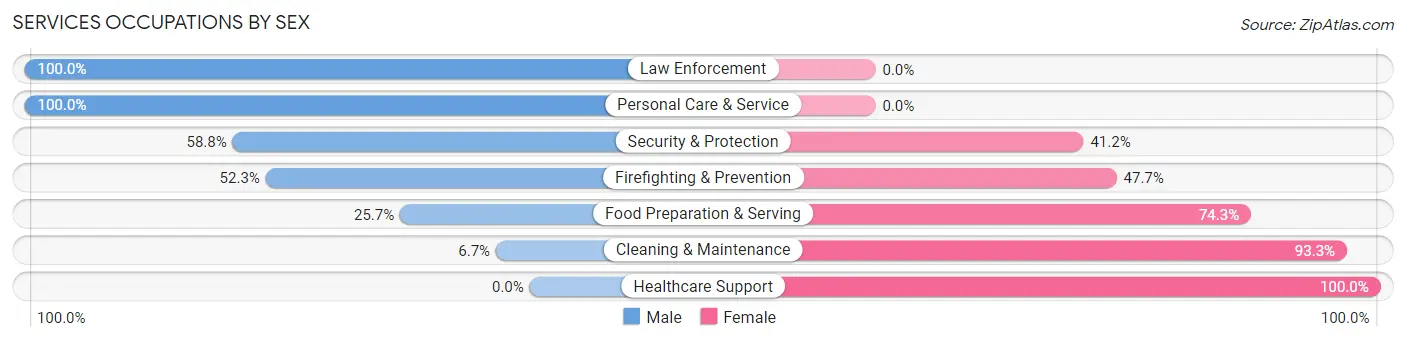
Services Occupations by Sex
Within the Services occupations in Louisville, the most male-oriented occupations are Law Enforcement (100.0%), Personal Care & Service (100.0%), and Security & Protection (58.8%), while the most female-oriented occupations are Healthcare Support (100.0%), Cleaning & Maintenance (93.3%), and Food Preparation & Serving (74.3%).
| Occupation | Male | Female |
| Healthcare Support | 0 (0.0%) | 53 (100.0%) |
| Security & Protection | 30 (58.8%) | 21 (41.2%) |
| Firefighting & Prevention | 23 (52.3%) | 21 (47.7%) |
| Law Enforcement | 7 (100.0%) | 0 (0.0%) |
| Food Preparation & Serving | 39 (25.7%) | 113 (74.3%) |
| Cleaning & Maintenance | 5 (6.7%) | 70 (93.3%) |
| Personal Care & Service | 5 (100.0%) | 0 (0.0%) |
| Total (Category) | 79 (23.5%) | 257 (76.5%) |
| Total (Overall) | 909 (48.3%) | 972 (51.7%) |
Sales and Office Occupations
The most common Sales and Office occupations in Louisville are Office & Administration (212 | 11.3%), and Sales & Related (168 | 8.9%).

Sales and Office Occupations by Sex

| Occupation | Male | Female |
| Sales & Related | 89 (53.0%) | 79 (47.0%) |
| Office & Administration | 8 (3.8%) | 204 (96.2%) |
| Total (Category) | 97 (25.5%) | 283 (74.5%) |
| Total (Overall) | 909 (48.3%) | 972 (51.7%) |
Natural Resources, Construction and Maintenance Occupations
The most common Natural Resources, Construction and Maintenance occupations in Louisville are Construction & Extraction (65 | 3.5%), Installation, Maintenance & Repair (31 | 1.7%), and Farming, Fishing & Forestry (22 | 1.2%).

Natural Resources, Construction and Maintenance Occupations by Sex

| Occupation | Male | Female |
| Farming, Fishing & Forestry | 22 (100.0%) | 0 (0.0%) |
| Construction & Extraction | 65 (100.0%) | 0 (0.0%) |
| Installation, Maintenance & Repair | 31 (100.0%) | 0 (0.0%) |
| Total (Category) | 118 (100.0%) | 0 (0.0%) |
| Total (Overall) | 909 (48.3%) | 972 (51.7%) |
Production, Transportation and Moving Occupations
The most common Production, Transportation and Moving occupations in Louisville are Production (478 | 25.4%), Material Moving (129 | 6.9%), and Transportation (45 | 2.4%).
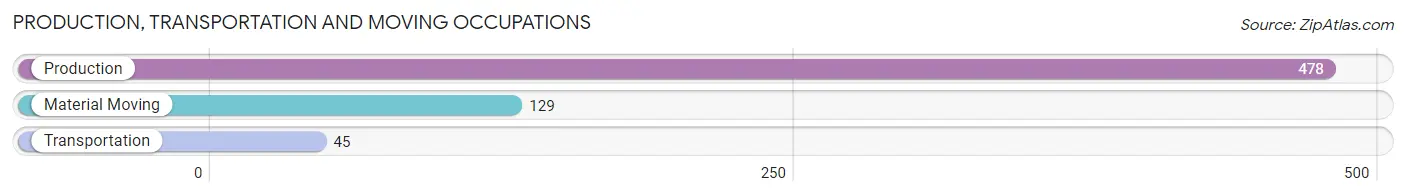
Production, Transportation and Moving Occupations by Sex
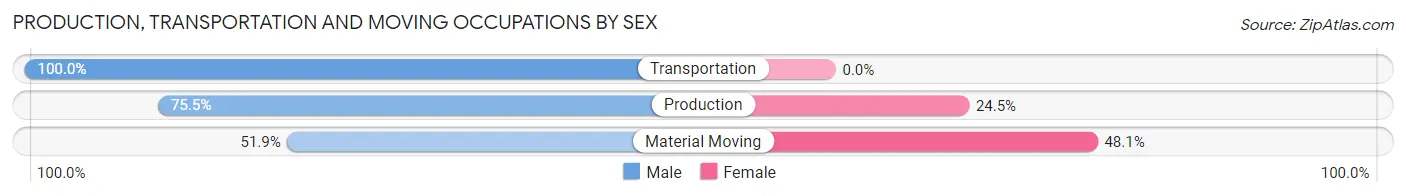
| Occupation | Male | Female |
| Production | 361 (75.5%) | 117 (24.5%) |
| Transportation | 45 (100.0%) | 0 (0.0%) |
| Material Moving | 67 (51.9%) | 62 (48.1%) |
| Total (Category) | 473 (72.6%) | 179 (27.5%) |
| Total (Overall) | 909 (48.3%) | 972 (51.7%) |
Employment Industries by Sex in Louisville
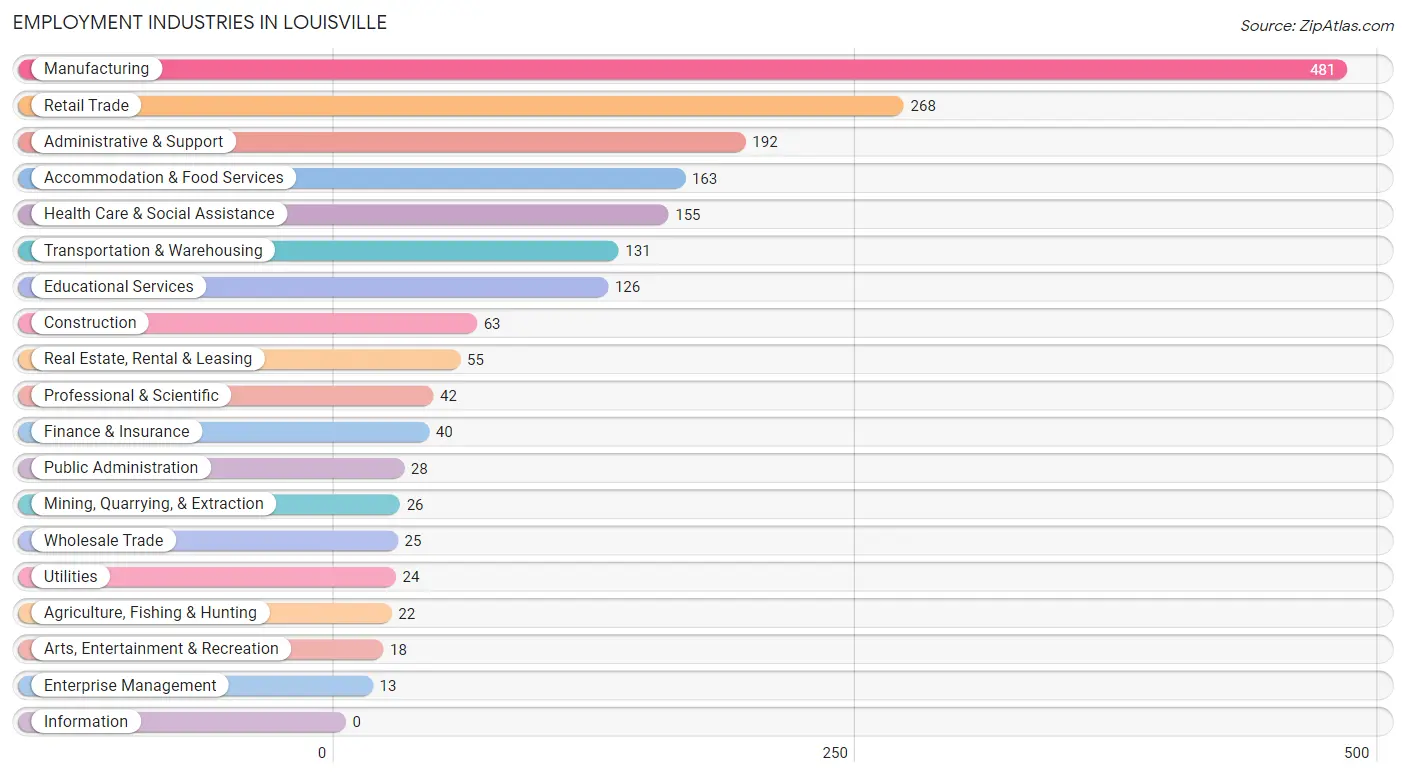
Employment Industries in Louisville
The major employment industries in Louisville include Manufacturing (481 | 25.6%), Retail Trade (268 | 14.2%), Administrative & Support (192 | 10.2%), Accommodation & Food Services (163 | 8.7%), and Health Care & Social Assistance (155 | 8.2%).
Employment Industries by Sex in Louisville
The Louisville industries that see more men than women are Agriculture, Fishing & Hunting (100.0%), Mining, Quarrying, & Extraction (100.0%), and Construction (100.0%), whereas the industries that tend to have a higher number of women are Arts, Entertainment & Recreation (100.0%), Educational Services (94.4%), and Health Care & Social Assistance (83.9%).
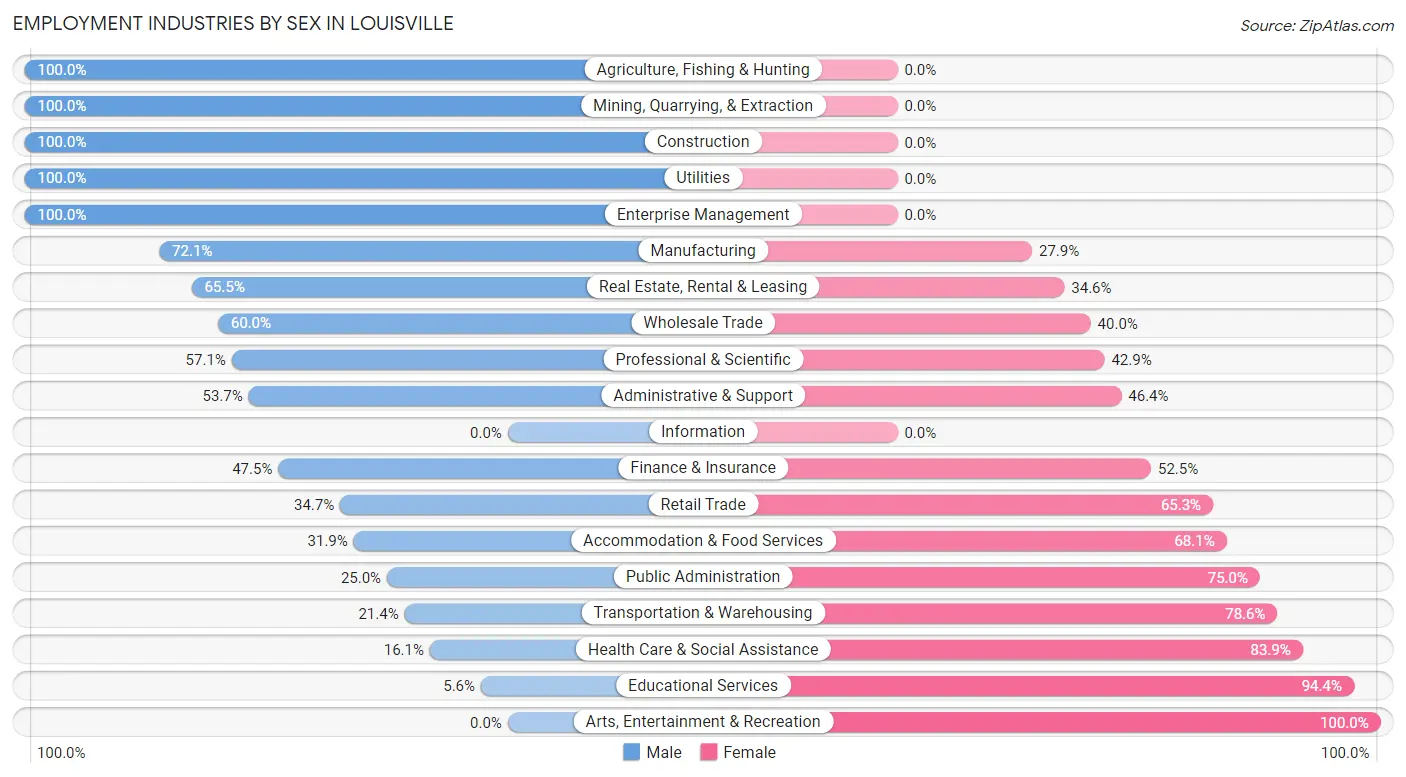
| Industry | Male | Female |
| Agriculture, Fishing & Hunting | 22 (100.0%) | 0 (0.0%) |
| Mining, Quarrying, & Extraction | 26 (100.0%) | 0 (0.0%) |
| Construction | 63 (100.0%) | 0 (0.0%) |
| Manufacturing | 347 (72.1%) | 134 (27.9%) |
| Wholesale Trade | 15 (60.0%) | 10 (40.0%) |
| Retail Trade | 93 (34.7%) | 175 (65.3%) |
| Transportation & Warehousing | 28 (21.4%) | 103 (78.6%) |
| Utilities | 24 (100.0%) | 0 (0.0%) |
| Information | 0 (0.0%) | 0 (0.0%) |
| Finance & Insurance | 19 (47.5%) | 21 (52.5%) |
| Real Estate, Rental & Leasing | 36 (65.4%) | 19 (34.5%) |
| Professional & Scientific | 24 (57.1%) | 18 (42.9%) |
| Enterprise Management | 13 (100.0%) | 0 (0.0%) |
| Administrative & Support | 103 (53.6%) | 89 (46.4%) |
| Educational Services | 7 (5.6%) | 119 (94.4%) |
| Health Care & Social Assistance | 25 (16.1%) | 130 (83.9%) |
| Arts, Entertainment & Recreation | 0 (0.0%) | 18 (100.0%) |
| Accommodation & Food Services | 52 (31.9%) | 111 (68.1%) |
| Public Administration | 7 (25.0%) | 21 (75.0%) |
| Total | 909 (48.3%) | 972 (51.7%) |
Education in Louisville
School Enrollment in Louisville
The most common levels of schooling among the 1,685 students in Louisville are high school (522 | 31.0%), elementary school (413 | 24.5%), and middle school (368 | 21.8%).
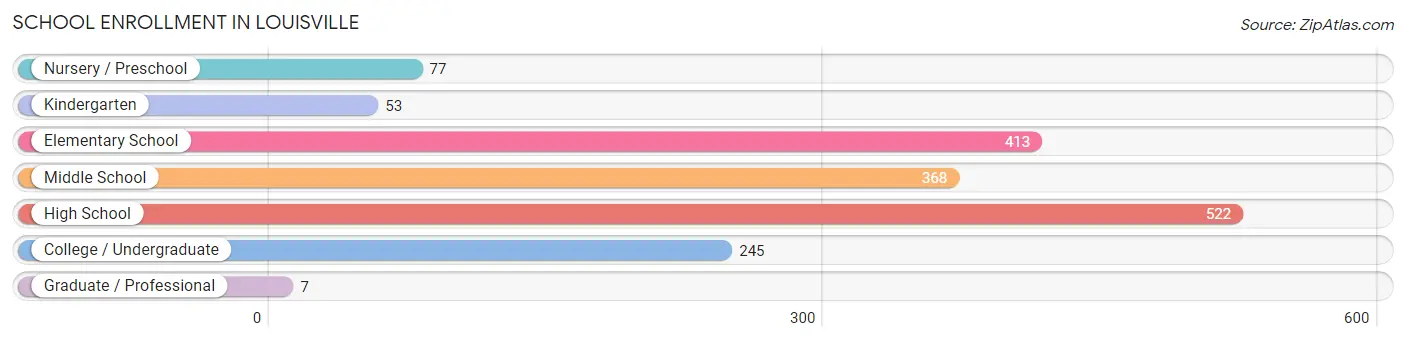
| School Level | # Students | % Students |
| Nursery / Preschool | 77 | 4.6% |
| Kindergarten | 53 | 3.2% |
| Elementary School | 413 | 24.5% |
| Middle School | 368 | 21.8% |
| High School | 522 | 31.0% |
| College / Undergraduate | 245 | 14.5% |
| Graduate / Professional | 7 | 0.4% |
| Total | 1,685 | 100.0% |
School Enrollment by Age by Funding Source in Louisville
Out of a total of 1,685 students who are enrolled in schools in Louisville, 221 (13.1%) attend a private institution, while the remaining 1,464 (86.9%) are enrolled in public schools. The age group of 3 to 4 year olds has the highest likelihood of being enrolled in private schools, with 35 (100.0% in the age bracket) enrolled. Conversely, the age group of 20 to 24 year olds has the lowest likelihood of being enrolled in a private school, with 182 (100.0% in the age bracket) attending a public institution.
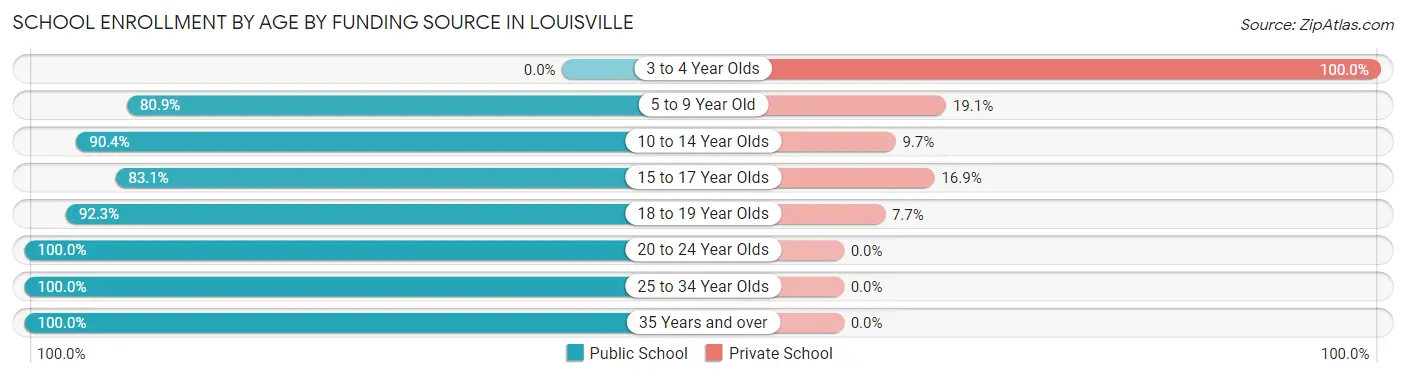
| Age Bracket | Public School | Private School |
| 3 to 4 Year Olds | 0 (0.0%) | 35 (100.0%) |
| 5 to 9 Year Old | 242 (80.9%) | 57 (19.1%) |
| 10 to 14 Year Olds | 618 (90.3%) | 66 (9.7%) |
| 15 to 17 Year Olds | 275 (83.1%) | 56 (16.9%) |
| 18 to 19 Year Olds | 84 (92.3%) | 7 (7.7%) |
| 20 to 24 Year Olds | 182 (100.0%) | 0 (0.0%) |
| 25 to 34 Year Olds | 56 (100.0%) | 0 (0.0%) |
| 35 Years and over | 7 (100.0%) | 0 (0.0%) |
| Total | 1,464 (86.9%) | 221 (13.1%) |
Educational Attainment by Field of Study in Louisville
Education (208 | 33.1%), business (122 | 19.4%), science & technology (97 | 15.4%), bio, nature & agricultural (58 | 9.2%), and arts & humanities (43 | 6.9%) are the most common fields of study among 628 individuals in Louisville who have obtained a bachelor's degree or higher.
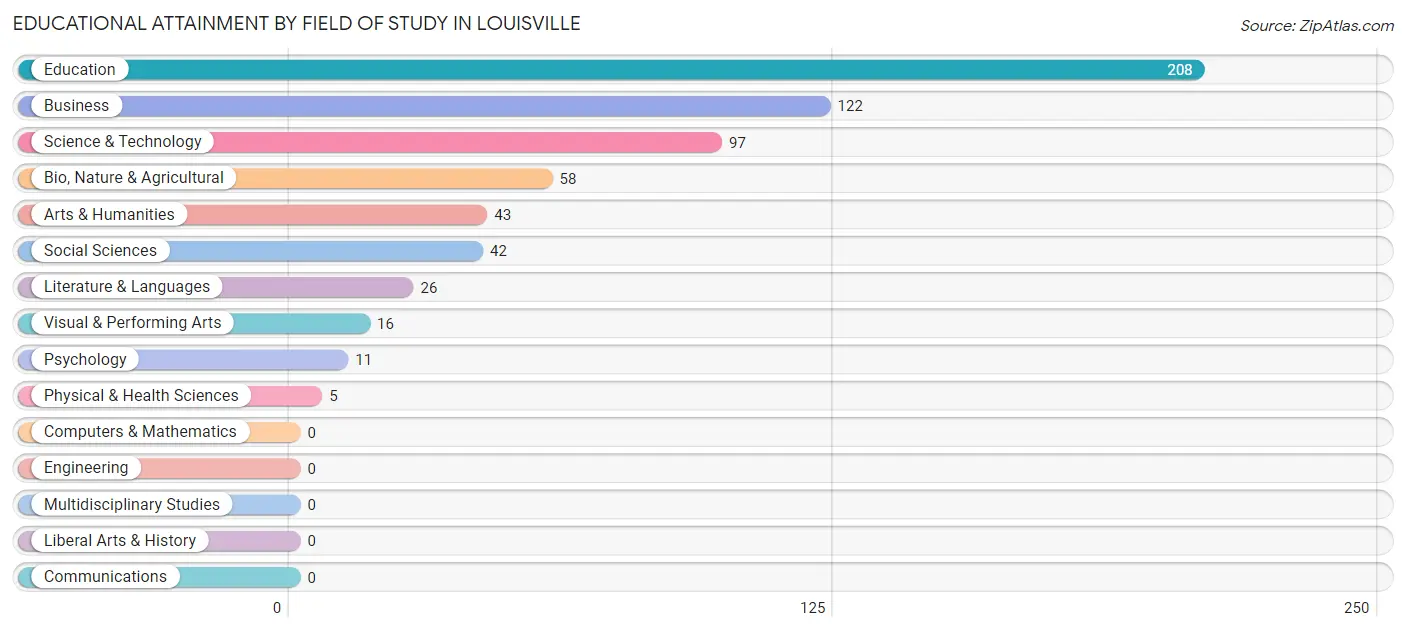
| Field of Study | # Graduates | % Graduates |
| Computers & Mathematics | 0 | 0.0% |
| Bio, Nature & Agricultural | 58 | 9.2% |
| Physical & Health Sciences | 5 | 0.8% |
| Psychology | 11 | 1.8% |
| Social Sciences | 42 | 6.7% |
| Engineering | 0 | 0.0% |
| Multidisciplinary Studies | 0 | 0.0% |
| Science & Technology | 97 | 15.4% |
| Business | 122 | 19.4% |
| Education | 208 | 33.1% |
| Literature & Languages | 26 | 4.1% |
| Liberal Arts & History | 0 | 0.0% |
| Visual & Performing Arts | 16 | 2.5% |
| Communications | 0 | 0.0% |
| Arts & Humanities | 43 | 6.9% |
| Total | 628 | 100.0% |
Transportation & Commute in Louisville
Vehicle Availability by Sex in Louisville
The most prevalent vehicle ownership categories in Louisville are males with 2 vehicles (256, accounting for 30.7%) and females with 2 vehicles (155, making up 27.9%).
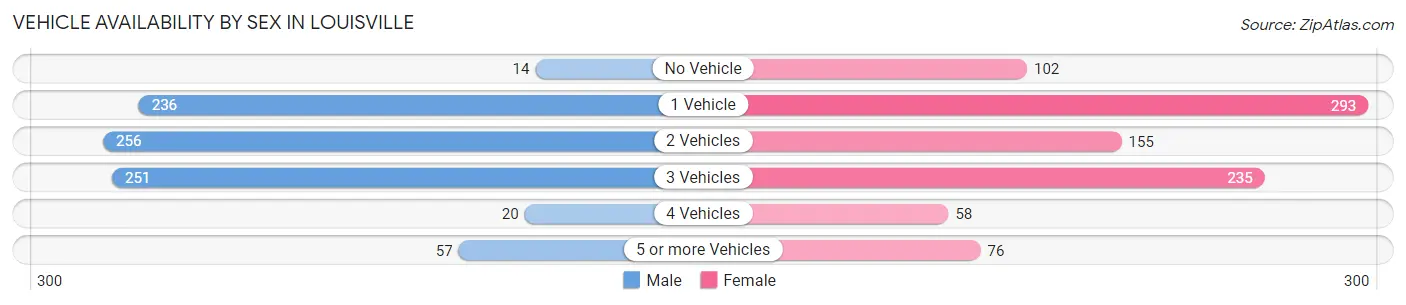
| Vehicles Available | Male | Female |
| No Vehicle | 14 (1.7%) | 102 (11.1%) |
| 1 Vehicle | 236 (28.3%) | 293 (31.9%) |
| 2 Vehicles | 256 (30.7%) | 155 (16.9%) |
| 3 Vehicles | 251 (30.1%) | 235 (25.6%) |
| 4 Vehicles | 20 (2.4%) | 58 (6.3%) |
| 5 or more Vehicles | 57 (6.8%) | 76 (8.3%) |
| Total | 834 (100.0%) | 919 (100.0%) |
Commute Time in Louisville
The most frequently occuring commute durations in Louisville are 5 to 9 minutes (628 commuters, 36.1%), 15 to 19 minutes (347 commuters, 20.0%), and 10 to 14 minutes (299 commuters, 17.2%).
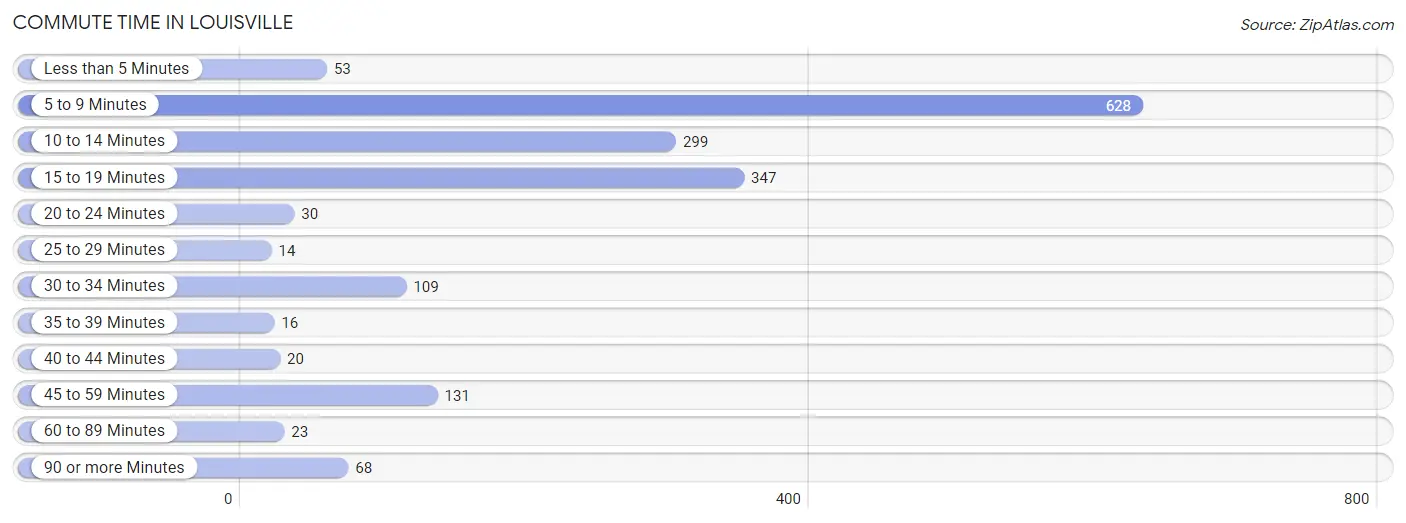
| Commute Time | # Commuters | % Commuters |
| Less than 5 Minutes | 53 | 3.0% |
| 5 to 9 Minutes | 628 | 36.1% |
| 10 to 14 Minutes | 299 | 17.2% |
| 15 to 19 Minutes | 347 | 20.0% |
| 20 to 24 Minutes | 30 | 1.7% |
| 25 to 29 Minutes | 14 | 0.8% |
| 30 to 34 Minutes | 109 | 6.3% |
| 35 to 39 Minutes | 16 | 0.9% |
| 40 to 44 Minutes | 20 | 1.1% |
| 45 to 59 Minutes | 131 | 7.5% |
| 60 to 89 Minutes | 23 | 1.3% |
| 90 or more Minutes | 68 | 3.9% |
Commute Time by Sex in Louisville
The most common commute times in Louisville are 5 to 9 minutes (275 commuters, 33.9%) for males and 5 to 9 minutes (353 commuters, 38.1%) for females.
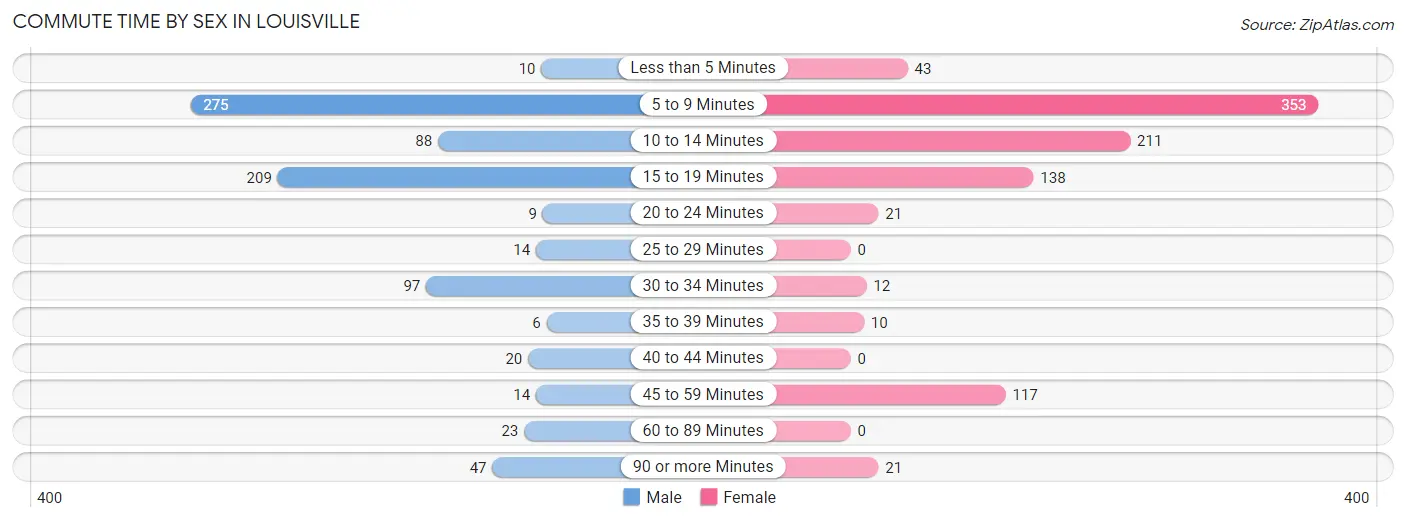
| Commute Time | Male | Female |
| Less than 5 Minutes | 10 (1.2%) | 43 (4.6%) |
| 5 to 9 Minutes | 275 (33.9%) | 353 (38.1%) |
| 10 to 14 Minutes | 88 (10.8%) | 211 (22.8%) |
| 15 to 19 Minutes | 209 (25.7%) | 138 (14.9%) |
| 20 to 24 Minutes | 9 (1.1%) | 21 (2.3%) |
| 25 to 29 Minutes | 14 (1.7%) | 0 (0.0%) |
| 30 to 34 Minutes | 97 (11.9%) | 12 (1.3%) |
| 35 to 39 Minutes | 6 (0.7%) | 10 (1.1%) |
| 40 to 44 Minutes | 20 (2.5%) | 0 (0.0%) |
| 45 to 59 Minutes | 14 (1.7%) | 117 (12.6%) |
| 60 to 89 Minutes | 23 (2.8%) | 0 (0.0%) |
| 90 or more Minutes | 47 (5.8%) | 21 (2.3%) |
Time of Departure to Work by Sex in Louisville
The most frequent times of departure to work in Louisville are 5:30 AM to 5:59 AM (191, 23.5%) for males and 10:00 AM to 10:59 AM (193, 20.8%) for females.
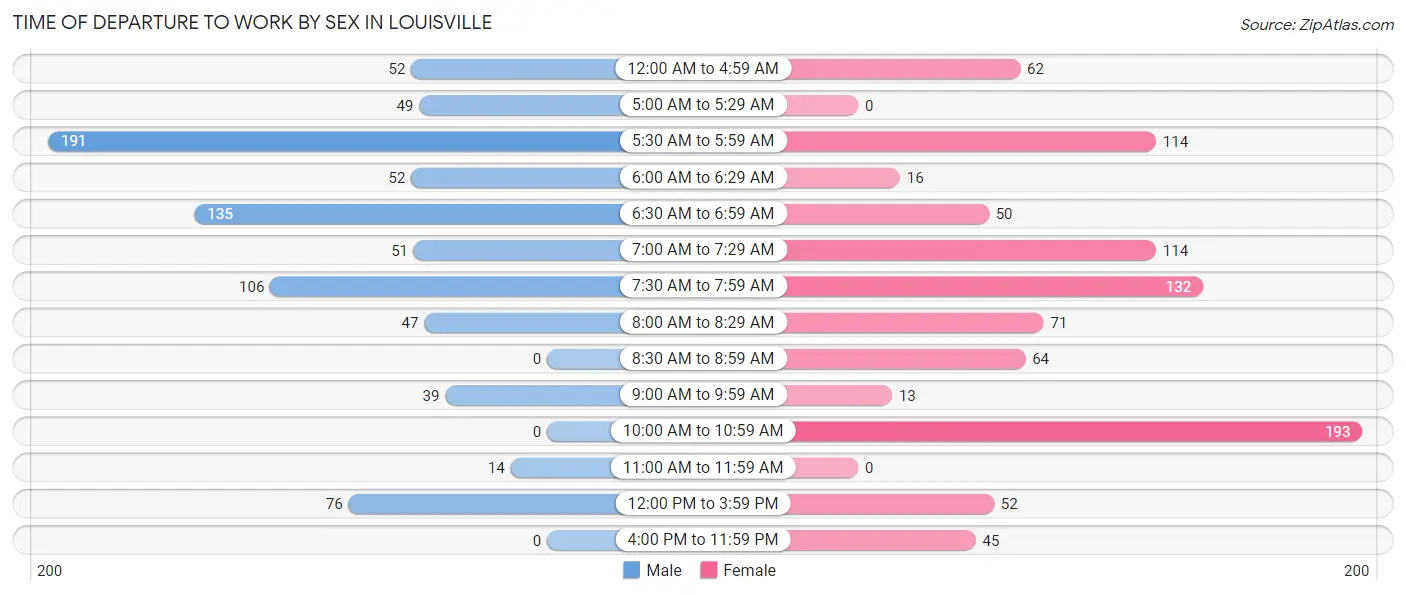
| Time of Departure | Male | Female |
| 12:00 AM to 4:59 AM | 52 (6.4%) | 62 (6.7%) |
| 5:00 AM to 5:29 AM | 49 (6.0%) | 0 (0.0%) |
| 5:30 AM to 5:59 AM | 191 (23.5%) | 114 (12.3%) |
| 6:00 AM to 6:29 AM | 52 (6.4%) | 16 (1.7%) |
| 6:30 AM to 6:59 AM | 135 (16.6%) | 50 (5.4%) |
| 7:00 AM to 7:29 AM | 51 (6.3%) | 114 (12.3%) |
| 7:30 AM to 7:59 AM | 106 (13.1%) | 132 (14.2%) |
| 8:00 AM to 8:29 AM | 47 (5.8%) | 71 (7.7%) |
| 8:30 AM to 8:59 AM | 0 (0.0%) | 64 (6.9%) |
| 9:00 AM to 9:59 AM | 39 (4.8%) | 13 (1.4%) |
| 10:00 AM to 10:59 AM | 0 (0.0%) | 193 (20.8%) |
| 11:00 AM to 11:59 AM | 14 (1.7%) | 0 (0.0%) |
| 12:00 PM to 3:59 PM | 76 (9.4%) | 52 (5.6%) |
| 4:00 PM to 11:59 PM | 0 (0.0%) | 45 (4.9%) |
| Total | 812 (100.0%) | 926 (100.0%) |
Housing Occupancy in Louisville
Occupancy by Ownership in Louisville
Of the total 2,386 dwellings in Louisville, owner-occupied units account for 1,458 (61.1%), while renter-occupied units make up 928 (38.9%).
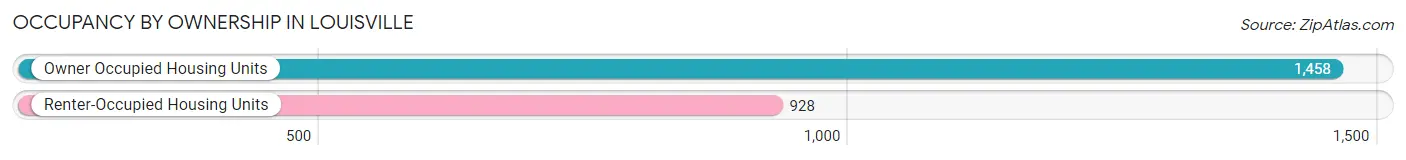
| Occupancy | # Housing Units | % Housing Units |
| Owner Occupied Housing Units | 1,458 | 61.1% |
| Renter-Occupied Housing Units | 928 | 38.9% |
| Total Occupied Housing Units | 2,386 | 100.0% |
Occupancy by Household Size in Louisville
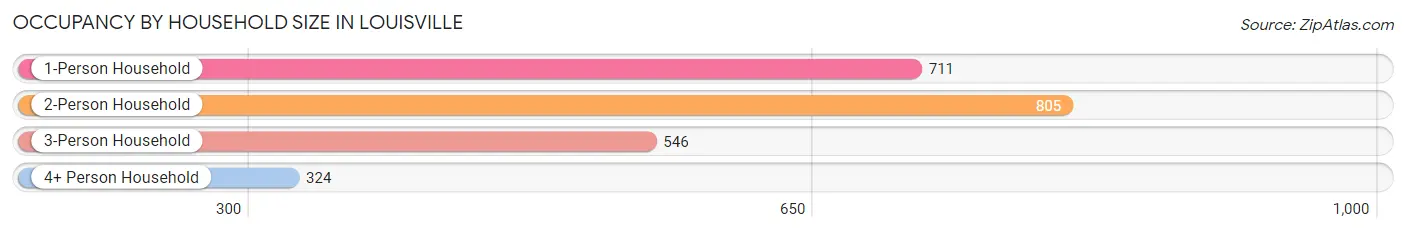
| Household Size | # Housing Units | % Housing Units |
| 1-Person Household | 711 | 29.8% |
| 2-Person Household | 805 | 33.7% |
| 3-Person Household | 546 | 22.9% |
| 4+ Person Household | 324 | 13.6% |
| Total Housing Units | 2,386 | 100.0% |
Occupancy by Ownership by Household Size in Louisville
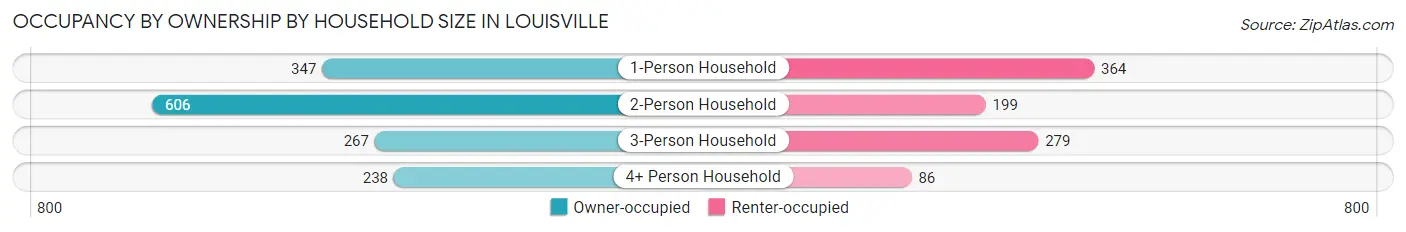
| Household Size | Owner-occupied | Renter-occupied |
| 1-Person Household | 347 (48.8%) | 364 (51.2%) |
| 2-Person Household | 606 (75.3%) | 199 (24.7%) |
| 3-Person Household | 267 (48.9%) | 279 (51.1%) |
| 4+ Person Household | 238 (73.5%) | 86 (26.5%) |
| Total Housing Units | 1,458 (61.1%) | 928 (38.9%) |
Occupancy by Educational Attainment in Louisville
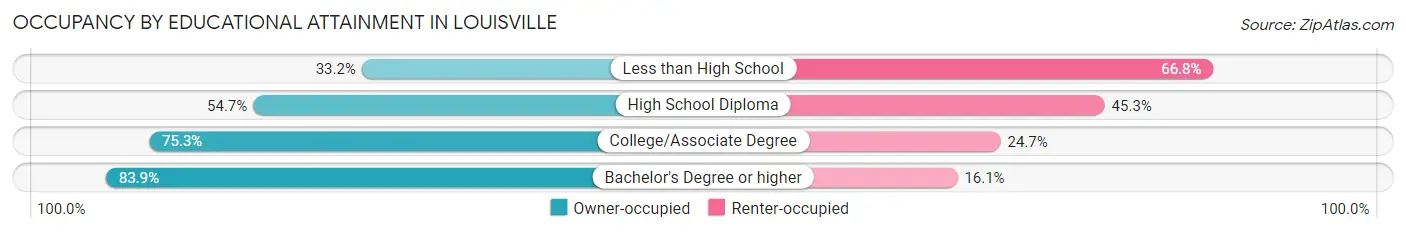
| Household Size | Owner-occupied | Renter-occupied |
| Less than High School | 134 (33.2%) | 270 (66.8%) |
| High School Diploma | 530 (54.7%) | 439 (45.3%) |
| College/Associate Degree | 492 (75.3%) | 161 (24.7%) |
| Bachelor's Degree or higher | 302 (83.9%) | 58 (16.1%) |
Occupancy by Age of Householder in Louisville
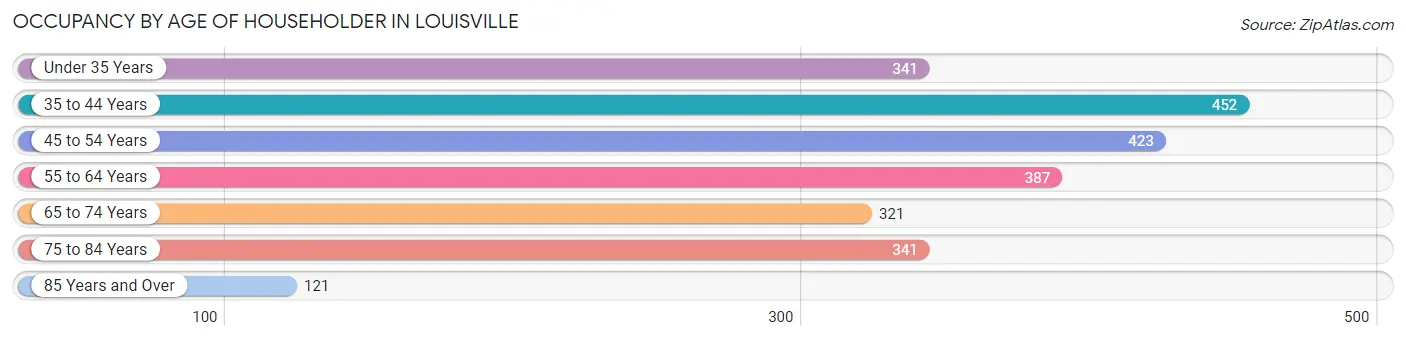
| Age Bracket | # Households | % Households |
| Under 35 Years | 341 | 14.3% |
| 35 to 44 Years | 452 | 18.9% |
| 45 to 54 Years | 423 | 17.7% |
| 55 to 64 Years | 387 | 16.2% |
| 65 to 74 Years | 321 | 13.5% |
| 75 to 84 Years | 341 | 14.3% |
| 85 Years and Over | 121 | 5.1% |
| Total | 2,386 | 100.0% |
Housing Finances in Louisville
Median Income by Occupancy in Louisville
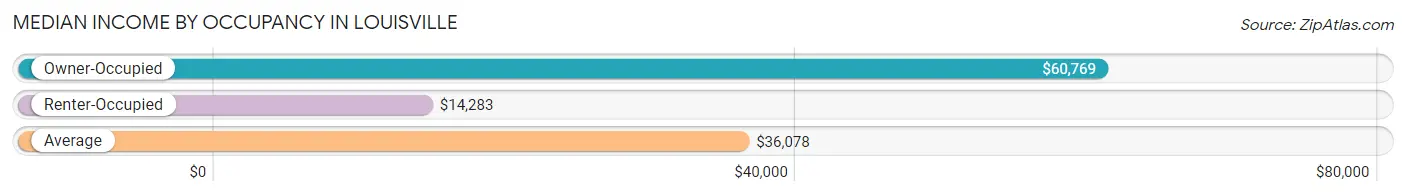
| Occupancy Type | # Households | Median Income |
| Owner-Occupied | 1,458 (61.1%) | $60,769 |
| Renter-Occupied | 928 (38.9%) | $14,283 |
| Average | 2,386 (100.0%) | $36,078 |
Occupancy by Householder Income Bracket in Louisville
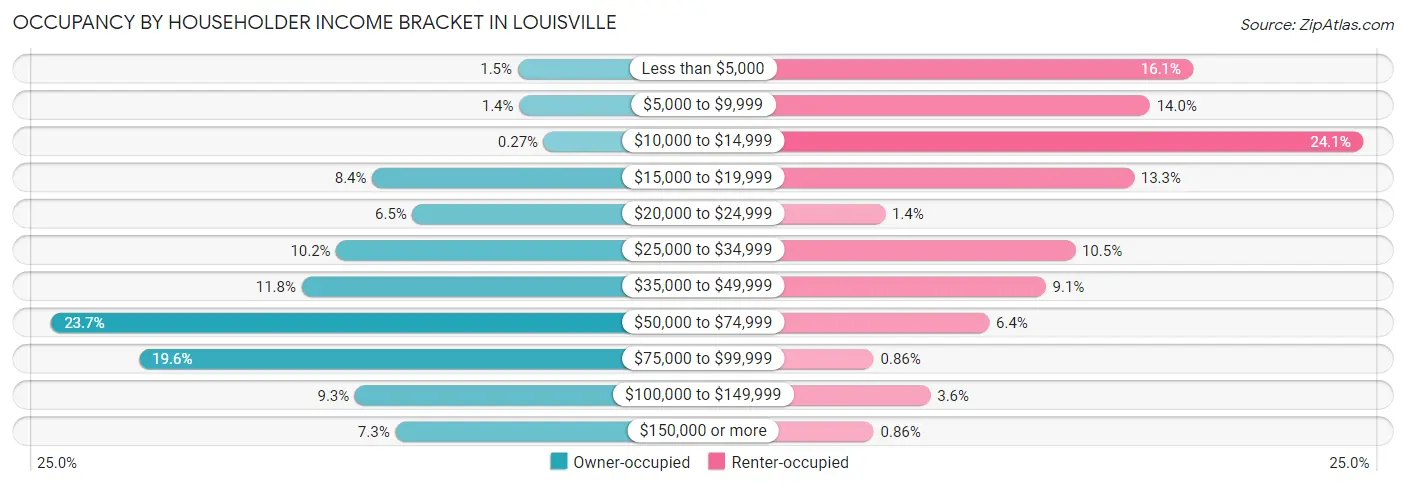
| Income Bracket | Owner-occupied | Renter-occupied |
| Less than $5,000 | 22 (1.5%) | 149 (16.1%) |
| $5,000 to $9,999 | 21 (1.4%) | 130 (14.0%) |
| $10,000 to $14,999 | 4 (0.3%) | 224 (24.1%) |
| $15,000 to $19,999 | 123 (8.4%) | 123 (13.3%) |
| $20,000 to $24,999 | 95 (6.5%) | 13 (1.4%) |
| $25,000 to $34,999 | 148 (10.2%) | 97 (10.4%) |
| $35,000 to $49,999 | 172 (11.8%) | 84 (9.0%) |
| $50,000 to $74,999 | 346 (23.7%) | 59 (6.4%) |
| $75,000 to $99,999 | 285 (19.6%) | 8 (0.9%) |
| $100,000 to $149,999 | 135 (9.3%) | 33 (3.6%) |
| $150,000 or more | 107 (7.3%) | 8 (0.9%) |
| Total | 1,458 (100.0%) | 928 (100.0%) |
Monthly Housing Cost Tiers in Louisville
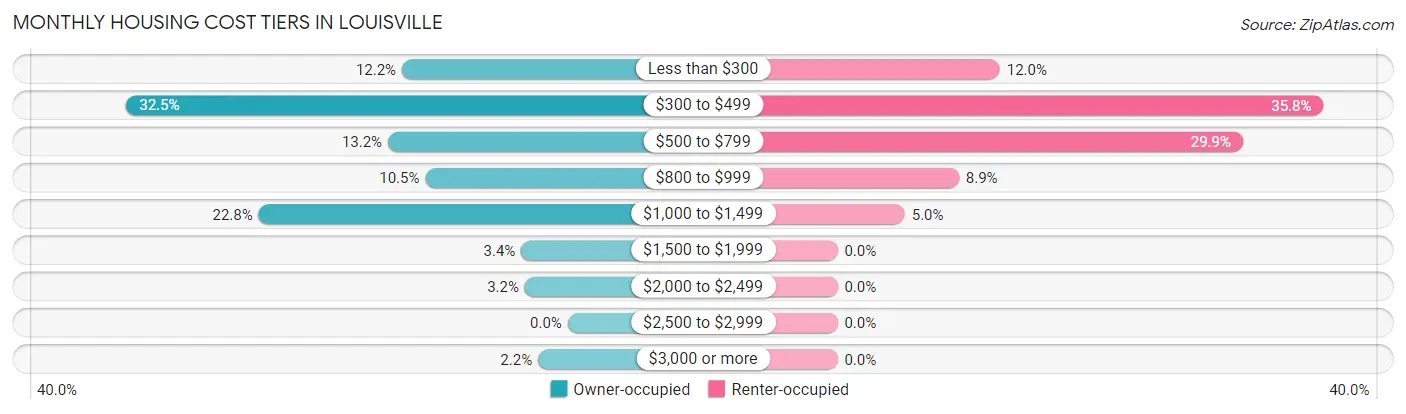
| Monthly Cost | Owner-occupied | Renter-occupied |
| Less than $300 | 178 (12.2%) | 111 (12.0%) |
| $300 to $499 | 474 (32.5%) | 332 (35.8%) |
| $500 to $799 | 193 (13.2%) | 277 (29.8%) |
| $800 to $999 | 153 (10.5%) | 83 (8.9%) |
| $1,000 to $1,499 | 332 (22.8%) | 46 (5.0%) |
| $1,500 to $1,999 | 50 (3.4%) | 0 (0.0%) |
| $2,000 to $2,499 | 46 (3.2%) | 0 (0.0%) |
| $2,500 to $2,999 | 0 (0.0%) | 0 (0.0%) |
| $3,000 or more | 32 (2.2%) | 0 (0.0%) |
| Total | 1,458 (100.0%) | 928 (100.0%) |
Physical Housing Characteristics in Louisville
Housing Structures in Louisville
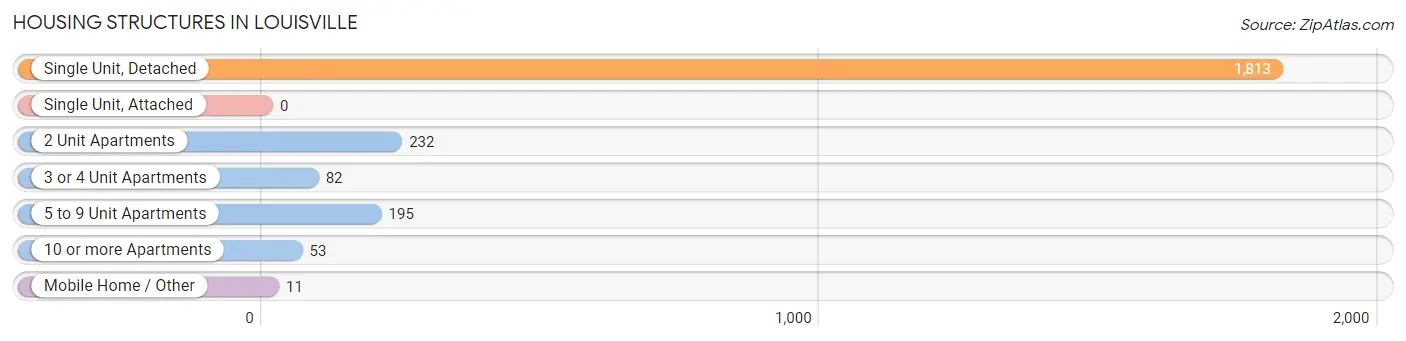
| Structure Type | # Housing Units | % Housing Units |
| Single Unit, Detached | 1,813 | 76.0% |
| Single Unit, Attached | 0 | 0.0% |
| 2 Unit Apartments | 232 | 9.7% |
| 3 or 4 Unit Apartments | 82 | 3.4% |
| 5 to 9 Unit Apartments | 195 | 8.2% |
| 10 or more Apartments | 53 | 2.2% |
| Mobile Home / Other | 11 | 0.5% |
| Total | 2,386 | 100.0% |
Housing Structures by Occupancy in Louisville
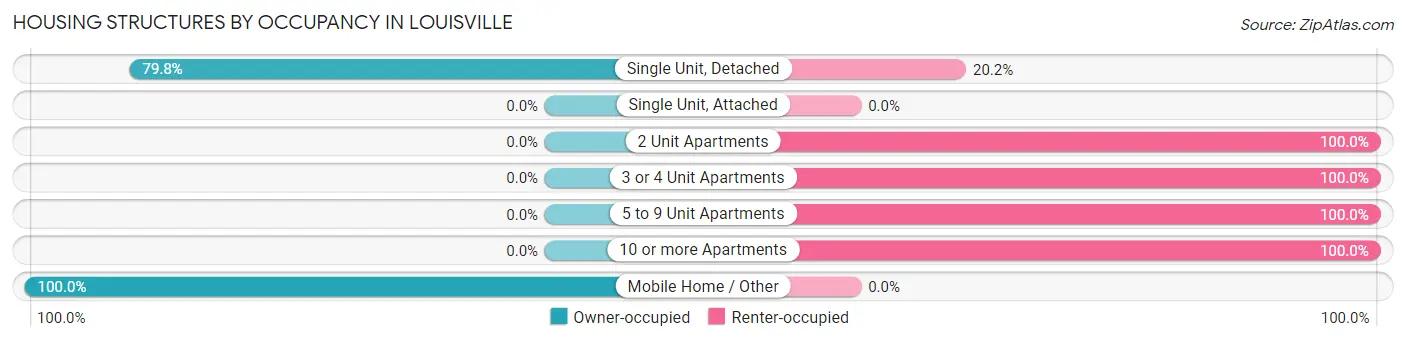
| Structure Type | Owner-occupied | Renter-occupied |
| Single Unit, Detached | 1,447 (79.8%) | 366 (20.2%) |
| Single Unit, Attached | 0 (0.0%) | 0 (0.0%) |
| 2 Unit Apartments | 0 (0.0%) | 232 (100.0%) |
| 3 or 4 Unit Apartments | 0 (0.0%) | 82 (100.0%) |
| 5 to 9 Unit Apartments | 0 (0.0%) | 195 (100.0%) |
| 10 or more Apartments | 0 (0.0%) | 53 (100.0%) |
| Mobile Home / Other | 11 (100.0%) | 0 (0.0%) |
| Total | 1,458 (61.1%) | 928 (38.9%) |
Housing Structures by Number of Rooms in Louisville
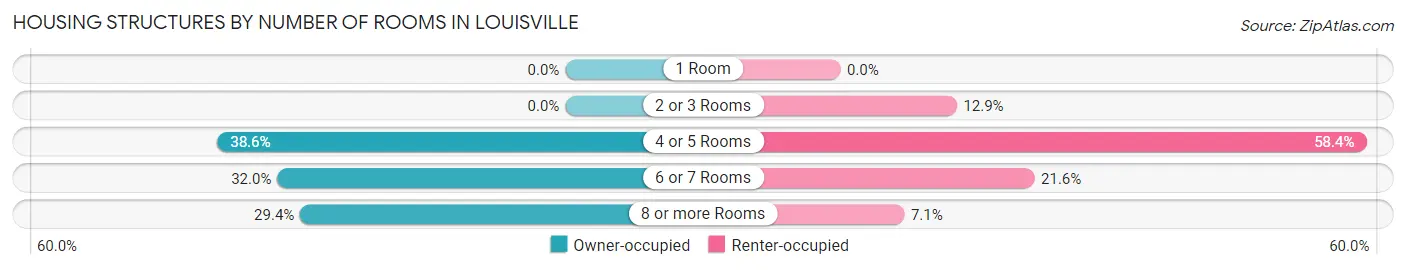
| Number of Rooms | Owner-occupied | Renter-occupied |
| 1 Room | 0 (0.0%) | 0 (0.0%) |
| 2 or 3 Rooms | 0 (0.0%) | 120 (12.9%) |
| 4 or 5 Rooms | 563 (38.6%) | 542 (58.4%) |
| 6 or 7 Rooms | 466 (32.0%) | 200 (21.5%) |
| 8 or more Rooms | 429 (29.4%) | 66 (7.1%) |
| Total | 1,458 (100.0%) | 928 (100.0%) |
Housing Structure by Heating Type in Louisville
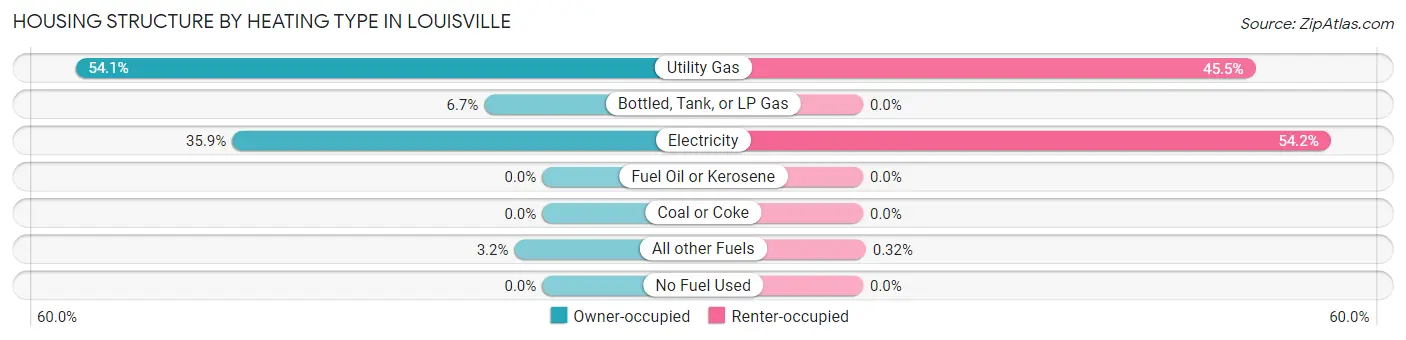
| Heating Type | Owner-occupied | Renter-occupied |
| Utility Gas | 789 (54.1%) | 422 (45.5%) |
| Bottled, Tank, or LP Gas | 98 (6.7%) | 0 (0.0%) |
| Electricity | 524 (35.9%) | 503 (54.2%) |
| Fuel Oil or Kerosene | 0 (0.0%) | 0 (0.0%) |
| Coal or Coke | 0 (0.0%) | 0 (0.0%) |
| All other Fuels | 47 (3.2%) | 3 (0.3%) |
| No Fuel Used | 0 (0.0%) | 0 (0.0%) |
| Total | 1,458 (100.0%) | 928 (100.0%) |
Household Vehicle Usage in Louisville
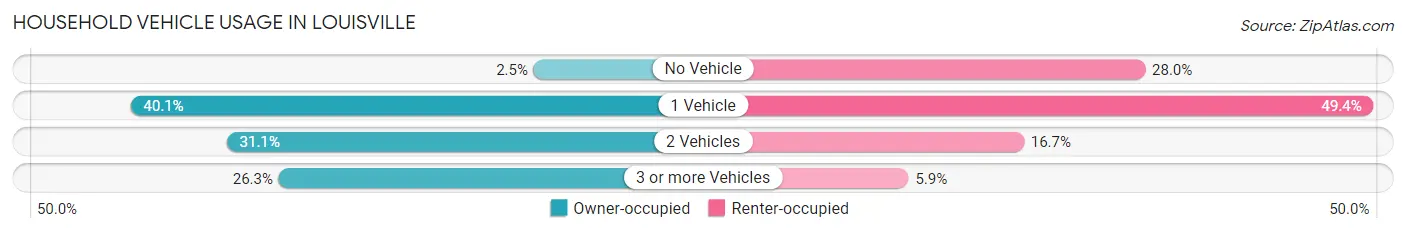
| Vehicles per Household | Owner-occupied | Renter-occupied |
| No Vehicle | 36 (2.5%) | 260 (28.0%) |
| 1 Vehicle | 585 (40.1%) | 458 (49.3%) |
| 2 Vehicles | 454 (31.1%) | 155 (16.7%) |
| 3 or more Vehicles | 383 (26.3%) | 55 (5.9%) |
| Total | 1,458 (100.0%) | 928 (100.0%) |
Real Estate & Mortgages in Louisville
Real Estate and Mortgage Overview in Louisville
| Characteristic | Without Mortgage | With Mortgage |
| Housing Units | 766 | 692 |
| Median Property Value | $96,700 | $178,500 |
| Median Household Income | $46,842 | $79 |
| Monthly Housing Costs | $358 | $24 |
| Real Estate Taxes | $570 | $157 |
Property Value by Mortgage Status in Louisville
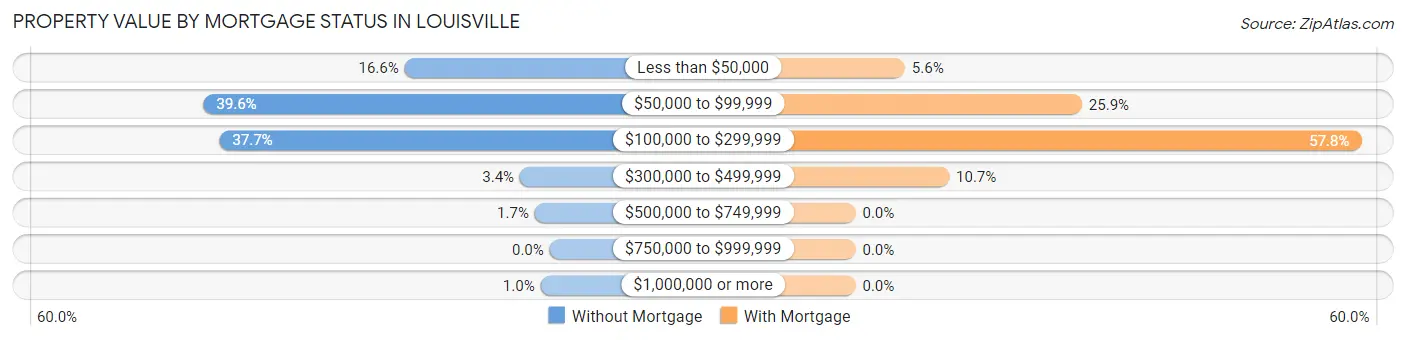
| Property Value | Without Mortgage | With Mortgage |
| Less than $50,000 | 127 (16.6%) | 39 (5.6%) |
| $50,000 to $99,999 | 303 (39.6%) | 179 (25.9%) |
| $100,000 to $299,999 | 289 (37.7%) | 400 (57.8%) |
| $300,000 to $499,999 | 26 (3.4%) | 74 (10.7%) |
| $500,000 to $749,999 | 13 (1.7%) | 0 (0.0%) |
| $750,000 to $999,999 | 0 (0.0%) | 0 (0.0%) |
| $1,000,000 or more | 8 (1.0%) | 0 (0.0%) |
| Total | 766 (100.0%) | 692 (100.0%) |
Household Income by Mortgage Status in Louisville
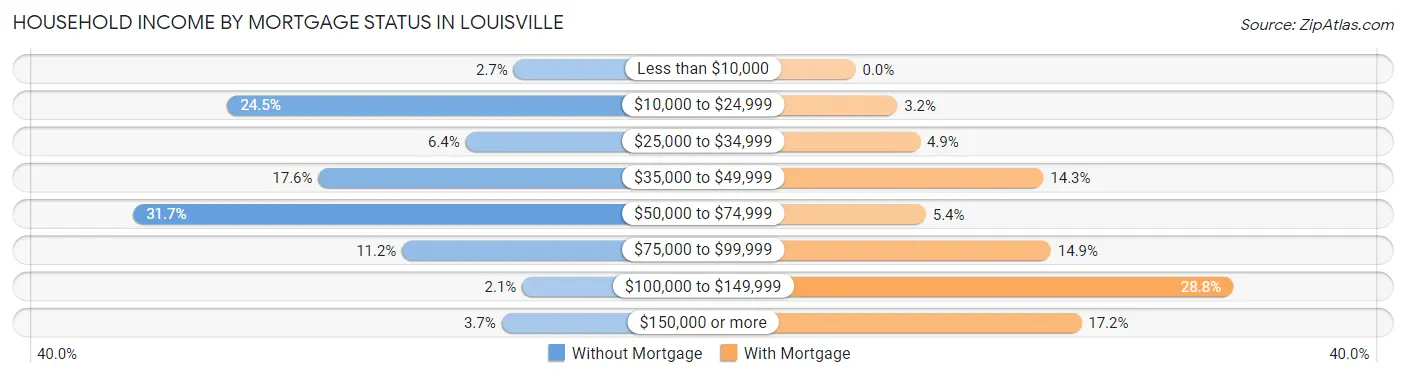
| Household Income | Without Mortgage | With Mortgage |
| Less than $10,000 | 21 (2.7%) | 0 (0.0%) |
| $10,000 to $24,999 | 188 (24.5%) | 22 (3.2%) |
| $25,000 to $34,999 | 49 (6.4%) | 34 (4.9%) |
| $35,000 to $49,999 | 135 (17.6%) | 99 (14.3%) |
| $50,000 to $74,999 | 243 (31.7%) | 37 (5.3%) |
| $75,000 to $99,999 | 86 (11.2%) | 103 (14.9%) |
| $100,000 to $149,999 | 16 (2.1%) | 199 (28.8%) |
| $150,000 or more | 28 (3.7%) | 119 (17.2%) |
| Total | 766 (100.0%) | 692 (100.0%) |
Property Value to Household Income Ratio in Louisville
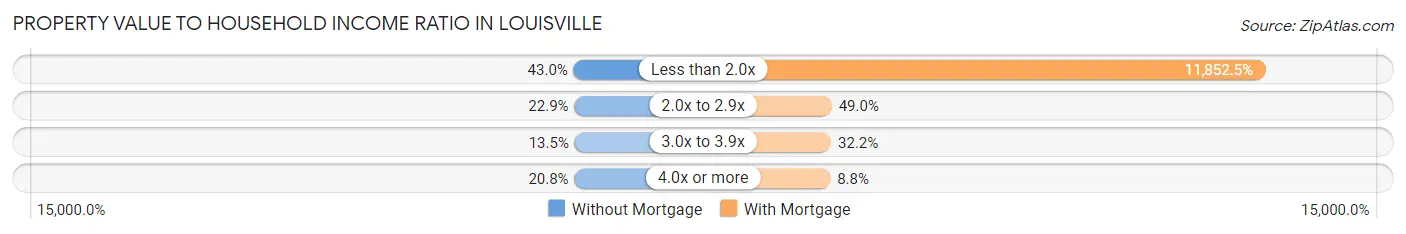
| Value-to-Income Ratio | Without Mortgage | With Mortgage |
| Less than 2.0x | 329 (42.9%) | 82,019 (11,852.5%) |
| 2.0x to 2.9x | 175 (22.9%) | 339 (49.0%) |
| 3.0x to 3.9x | 103 (13.5%) | 223 (32.2%) |
| 4.0x or more | 159 (20.8%) | 61 (8.8%) |
| Total | 766 (100.0%) | 692 (100.0%) |
Real Estate Taxes by Mortgage Status in Louisville
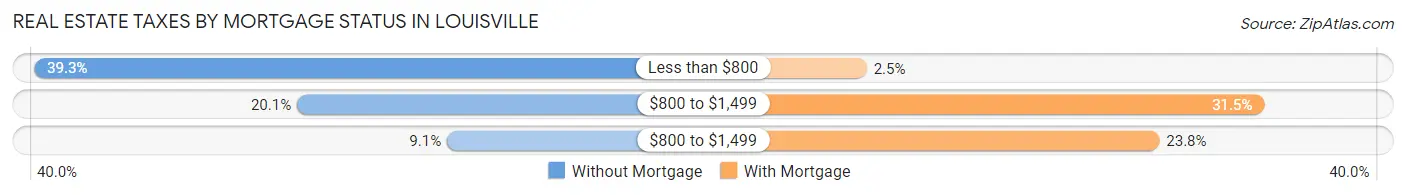
| Property Taxes | Without Mortgage | With Mortgage |
| Less than $800 | 301 (39.3%) | 17 (2.5%) |
| $800 to $1,499 | 154 (20.1%) | 218 (31.5%) |
| $800 to $1,499 | 70 (9.1%) | 165 (23.8%) |
| Total | 766 (100.0%) | 692 (100.0%) |
Health & Disability in Louisville
Health Insurance Coverage by Age in Louisville
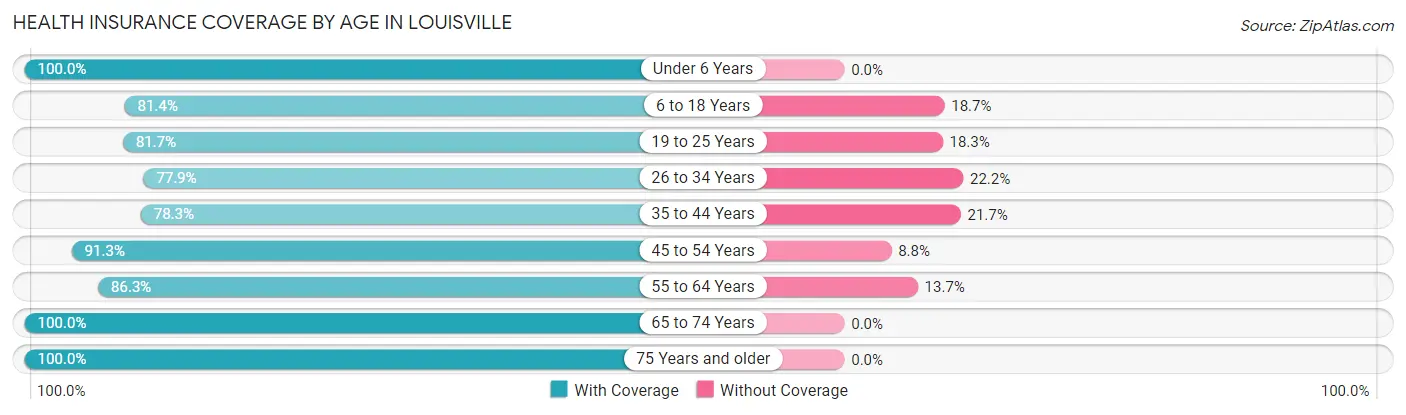
| Age Bracket | With Coverage | Without Coverage |
| Under 6 Years | 250 (100.0%) | 0 (0.0%) |
| 6 to 18 Years | 1,130 (81.4%) | 259 (18.6%) |
| 19 to 25 Years | 379 (81.7%) | 85 (18.3%) |
| 26 to 34 Years | 369 (77.8%) | 105 (22.2%) |
| 35 to 44 Years | 614 (78.3%) | 170 (21.7%) |
| 45 to 54 Years | 490 (91.2%) | 47 (8.7%) |
| 55 to 64 Years | 833 (86.3%) | 132 (13.7%) |
| 65 to 74 Years | 537 (100.0%) | 0 (0.0%) |
| 75 Years and older | 534 (100.0%) | 0 (0.0%) |
| Total | 5,136 (86.6%) | 798 (13.5%) |
Health Insurance Coverage by Citizenship Status in Louisville
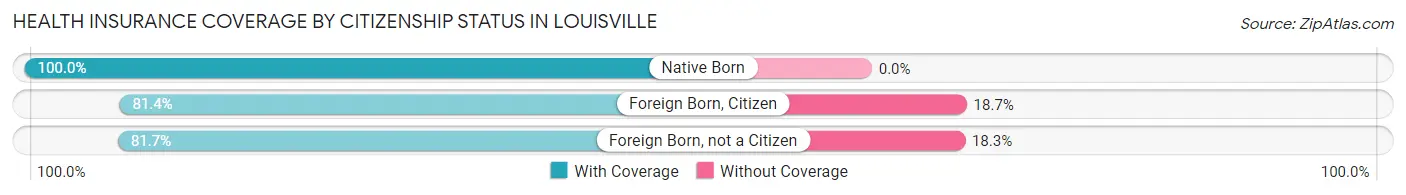
| Citizenship Status | With Coverage | Without Coverage |
| Native Born | 250 (100.0%) | 0 (0.0%) |
| Foreign Born, Citizen | 1,130 (81.4%) | 259 (18.6%) |
| Foreign Born, not a Citizen | 379 (81.7%) | 85 (18.3%) |
Health Insurance Coverage by Household Income in Louisville
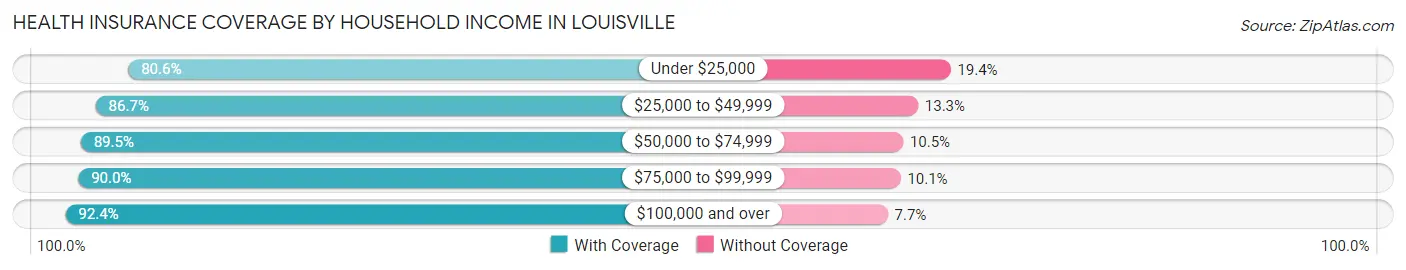
| Household Income | With Coverage | Without Coverage |
| Under $25,000 | 1,668 (80.6%) | 402 (19.4%) |
| $25,000 to $49,999 | 873 (86.7%) | 134 (13.3%) |
| $50,000 to $74,999 | 987 (89.5%) | 116 (10.5%) |
| $75,000 to $99,999 | 573 (89.9%) | 64 (10.1%) |
| $100,000 and over | 990 (92.3%) | 82 (7.6%) |
Public vs Private Health Insurance Coverage by Age in Louisville
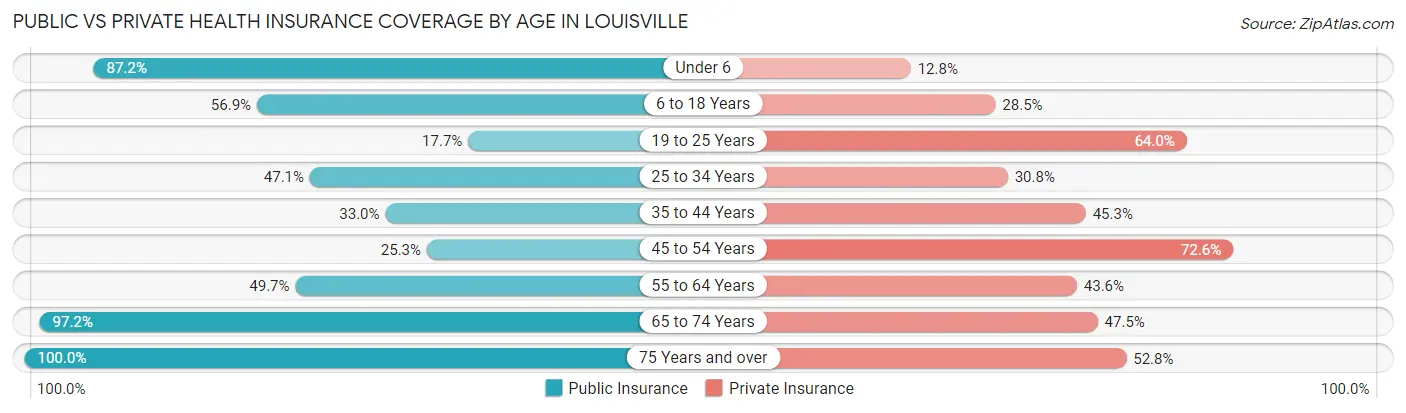
| Age Bracket | Public Insurance | Private Insurance |
| Under 6 | 218 (87.2%) | 32 (12.8%) |
| 6 to 18 Years | 790 (56.9%) | 396 (28.5%) |
| 19 to 25 Years | 82 (17.7%) | 297 (64.0%) |
| 25 to 34 Years | 223 (47.0%) | 146 (30.8%) |
| 35 to 44 Years | 259 (33.0%) | 355 (45.3%) |
| 45 to 54 Years | 136 (25.3%) | 390 (72.6%) |
| 55 to 64 Years | 480 (49.7%) | 421 (43.6%) |
| 65 to 74 Years | 522 (97.2%) | 255 (47.5%) |
| 75 Years and over | 534 (100.0%) | 282 (52.8%) |
| Total | 3,244 (54.7%) | 2,574 (43.4%) |
Disability Status by Sex by Age in Louisville
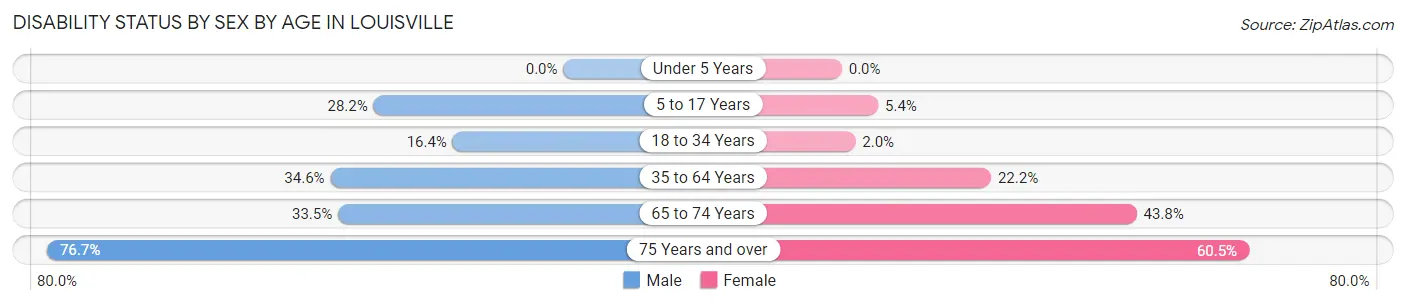
| Age Bracket | Male | Female |
| Under 5 Years | 0 (0.0%) | 0 (0.0%) |
| 5 to 17 Years | 212 (28.2%) | 34 (5.4%) |
| 18 to 34 Years | 70 (16.4%) | 12 (2.0%) |
| 35 to 64 Years | 405 (34.6%) | 247 (22.2%) |
| 65 to 74 Years | 91 (33.5%) | 116 (43.8%) |
| 75 Years and over | 138 (76.7%) | 214 (60.5%) |
Disability Class by Sex by Age in Louisville
Disability Class: Hearing Difficulty
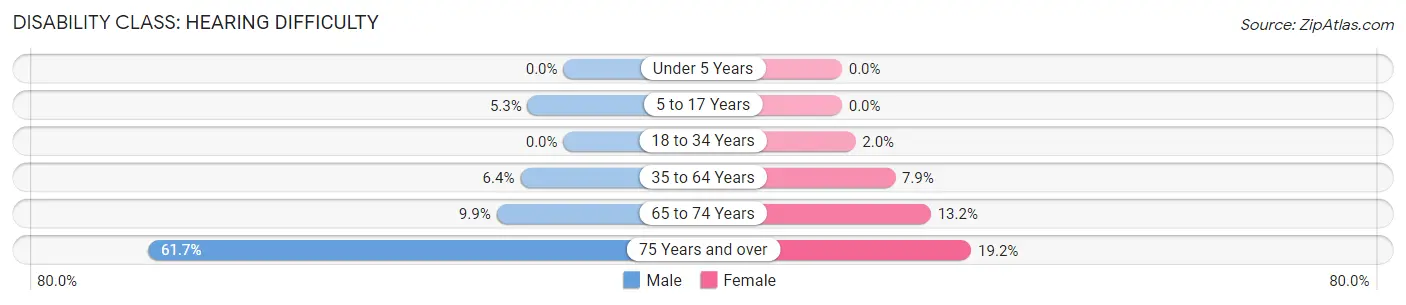
| Age Bracket | Male | Female |
| Under 5 Years | 0 (0.0%) | 0 (0.0%) |
| 5 to 17 Years | 40 (5.3%) | 0 (0.0%) |
| 18 to 34 Years | 0 (0.0%) | 12 (2.0%) |
| 35 to 64 Years | 75 (6.4%) | 88 (7.9%) |
| 65 to 74 Years | 27 (9.9%) | 35 (13.2%) |
| 75 Years and over | 111 (61.7%) | 68 (19.2%) |
Disability Class: Vision Difficulty
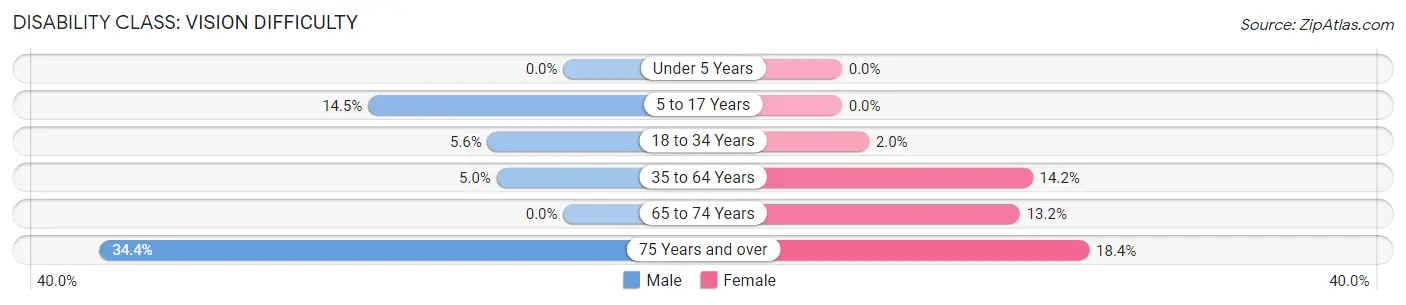
| Age Bracket | Male | Female |
| Under 5 Years | 0 (0.0%) | 0 (0.0%) |
| 5 to 17 Years | 109 (14.5%) | 0 (0.0%) |
| 18 to 34 Years | 24 (5.6%) | 12 (2.0%) |
| 35 to 64 Years | 58 (5.0%) | 158 (14.2%) |
| 65 to 74 Years | 0 (0.0%) | 35 (13.2%) |
| 75 Years and over | 62 (34.4%) | 65 (18.4%) |
Disability Class: Cognitive Difficulty
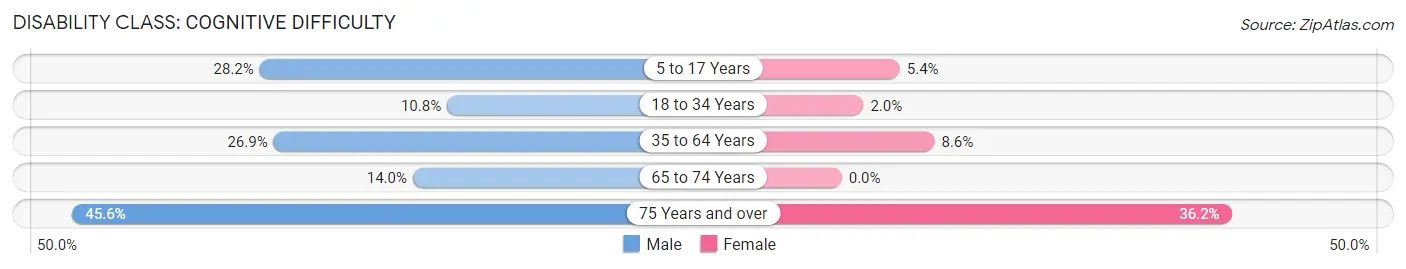
| Age Bracket | Male | Female |
| 5 to 17 Years | 212 (28.2%) | 34 (5.4%) |
| 18 to 34 Years | 46 (10.8%) | 12 (2.0%) |
| 35 to 64 Years | 315 (26.9%) | 96 (8.6%) |
| 65 to 74 Years | 38 (14.0%) | 0 (0.0%) |
| 75 Years and over | 82 (45.6%) | 128 (36.2%) |
Disability Class: Ambulatory Difficulty
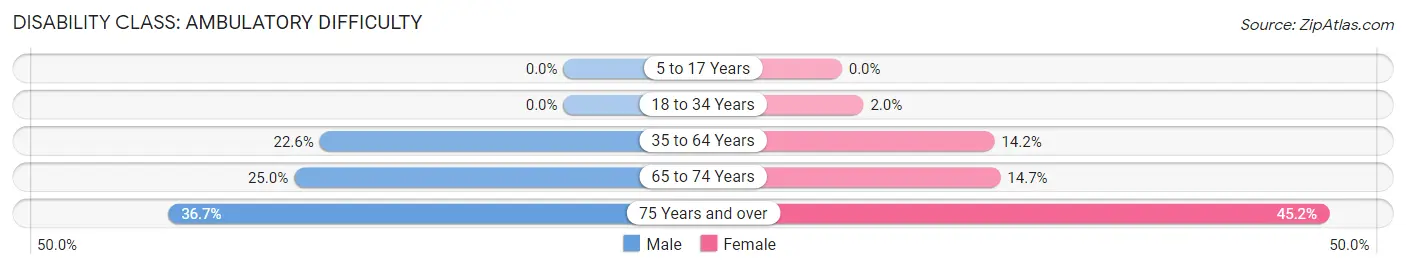
| Age Bracket | Male | Female |
| 5 to 17 Years | 0 (0.0%) | 0 (0.0%) |
| 18 to 34 Years | 0 (0.0%) | 12 (2.0%) |
| 35 to 64 Years | 265 (22.6%) | 158 (14.2%) |
| 65 to 74 Years | 68 (25.0%) | 39 (14.7%) |
| 75 Years and over | 66 (36.7%) | 160 (45.2%) |
Disability Class: Self-Care Difficulty
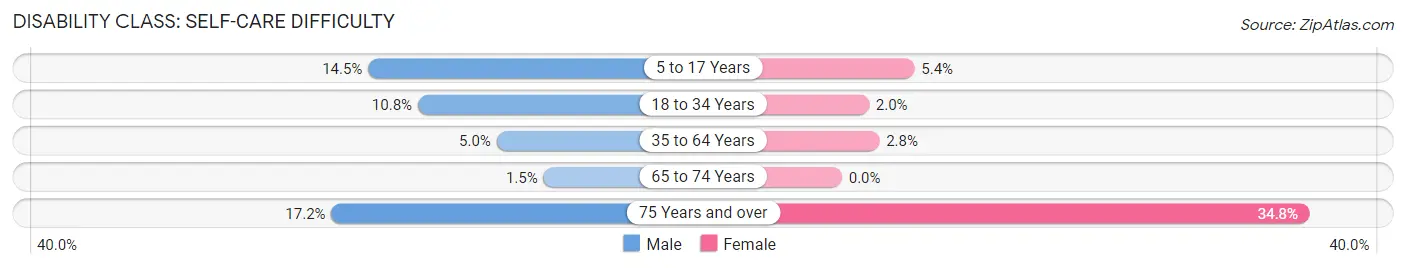
| Age Bracket | Male | Female |
| 5 to 17 Years | 109 (14.5%) | 34 (5.4%) |
| 18 to 34 Years | 46 (10.8%) | 12 (2.0%) |
| 35 to 64 Years | 58 (5.0%) | 31 (2.8%) |
| 65 to 74 Years | 4 (1.5%) | 0 (0.0%) |
| 75 Years and over | 31 (17.2%) | 123 (34.7%) |
Technology Access in Louisville
Computing Device Access in Louisville
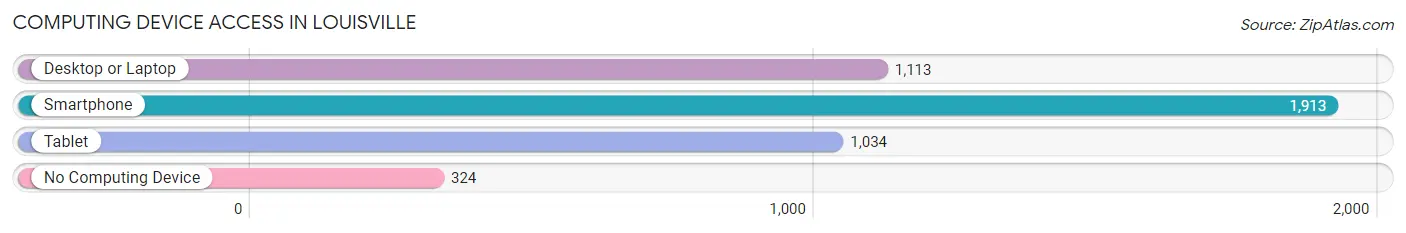
| Device Type | # Households | % Households |
| Desktop or Laptop | 1,113 | 46.7% |
| Smartphone | 1,913 | 80.2% |
| Tablet | 1,034 | 43.3% |
| No Computing Device | 324 | 13.6% |
| Total | 2,386 | 100.0% |
Internet Access in Louisville
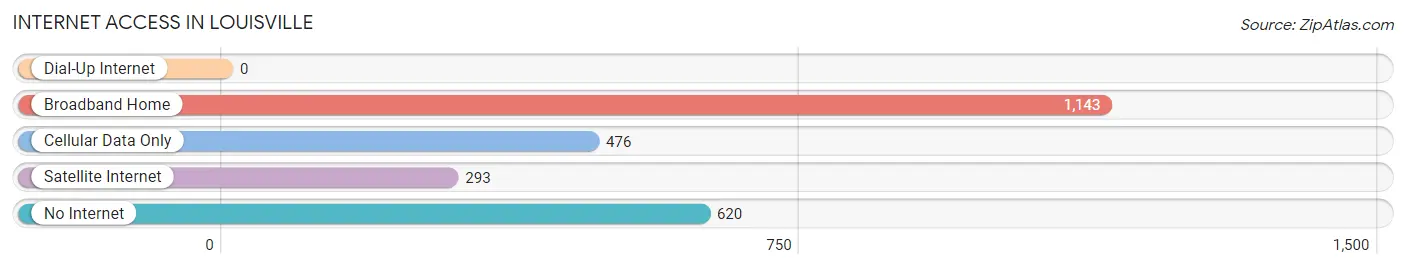
| Internet Type | # Households | % Households |
| Dial-Up Internet | 0 | 0.0% |
| Broadband Home | 1,143 | 47.9% |
| Cellular Data Only | 476 | 20.0% |
| Satellite Internet | 293 | 12.3% |
| No Internet | 620 | 26.0% |
| Total | 2,386 | 100.0% |
Louisville Summary
Louisville, Mississippi is a small city located in Winston County, Mississippi. It is the county seat of Winston County and is located in the northeast corner of the state. The city has a population of approximately 7,000 people and is part of the Tupelo Micropolitan Statistical Area. Louisville is known for its rich history, beautiful geography, and vibrant economy.
History
Louisville was founded in 1837 and was named after Louis Winston, a prominent local landowner. The city was incorporated in 1839 and quickly became a center of commerce and industry. The city was a major stop on the Mobile and Ohio Railroad, which connected the city to other parts of the state and the country. During the Civil War, Louisville was the site of several battles, including the Battle of Louisville in 1862. After the war, the city experienced a period of growth and prosperity, with the establishment of several businesses and industries.
Geography
Louisville is located in the northeast corner of Mississippi, in Winston County. The city is situated on the banks of the Tombigbee River and is surrounded by rolling hills and forests. The city is located approximately 90 miles from the state capital of Jackson and is part of the Tupelo Micropolitan Statistical Area. Louisville has a humid subtropical climate, with hot, humid summers and mild winters.
Economy
Louisville’s economy is largely based on agriculture and manufacturing. The city is home to several large agricultural operations, including poultry farms, cotton farms, and timber operations. The city is also home to several manufacturing companies, including furniture makers, paper mills, and food processing plants. In addition, Louisville is home to several retail stores, restaurants, and other businesses.
Demographics
As of the 2010 census, Louisville had a population of 7,006 people. The racial makeup of the city was 63.3% White, 34.2% African American, 0.3% Native American, 0.3% Asian, 0.1% Pacific Islander, 0.7% from other races, and 1.1% from two or more races. The median household income was $30,945 and the median family income was $37,917. The per capita income was $17,845.
Louisville is a small city with a rich history, beautiful geography, and vibrant economy. The city is home to a diverse population and is a great place to live and work. Louisville is a great place to visit and explore, and offers a variety of activities and attractions for visitors.
Common Questions
What is Per Capita Income in Louisville?
Per Capita income in Louisville is $22,580.
What is the Median Family Income in Louisville?
Median Family Income in Louisville is $34,567.
What is the Median Household income in Louisville?
Median Household Income in Louisville is $36,078.
What is Income or Wage Gap in Louisville?
Income or Wage Gap in Louisville is 26.0%.
Women in Louisville earn 74.0 cents for every dollar earned by a man.
What is Inequality or Gini Index in Louisville?
Inequality or Gini Index in Louisville is 0.53.
What is the Total Population of Louisville?
Total Population of Louisville is 6,061.
What is the Total Male Population of Louisville?
Total Male Population of Louisville is 2,977.
What is the Total Female Population of Louisville?
Total Female Population of Louisville is 3,084.
What is the Ratio of Males per 100 Females in Louisville?
There are 96.53 Males per 100 Females in Louisville.
What is the Ratio of Females per 100 Males in Louisville?
There are 103.59 Females per 100 Males in Louisville.
What is the Median Population Age in Louisville?
Median Population Age in Louisville is 39.9 Years.
What is the Average Family Size in Louisville
Average Family Size in Louisville is 3.2 People.
What is the Average Household Size in Louisville
Average Household Size in Louisville is 2.5 People.
How Large is the Labor Force in Louisville?
There are 2,020 People in the Labor Forcein in Louisville.
What is the Percentage of People in the Labor Force in Louisville?
43.6% of People are in the Labor Force in Louisville.
What is the Unemployment Rate in Louisville?
Unemployment Rate in Louisville is 7.0%.