Aberdeen, MS Map & Demographics
Aberdeen Map
Aberdeen Overview
$28,278
PER CAPITA INCOME
$62,517
AVG FAMILY INCOME
$46,788
AVG HOUSEHOLD INCOME
32.7%
WAGE / INCOME GAP [ % ]
67.3¢/ $1
WAGE / INCOME GAP [ $ ]
$14,109
FAMILY INCOME DEFICIT
0.53
INEQUALITY / GINI INDEX
4,972
TOTAL POPULATION
2,592
MALE POPULATION
2,380
FEMALE POPULATION
108.91
MALES / 100 FEMALES
91.82
FEMALES / 100 MALES
41.5
MEDIAN AGE
3.2
AVG FAMILY SIZE
2.4
AVG HOUSEHOLD SIZE
2,042
LABOR FORCE [ PEOPLE ]
50.6%
PERCENT IN LABOR FORCE
6.4%
UNEMPLOYMENT RATE
Aberdeen Zip Codes
Aberdeen Area Codes
Income in Aberdeen
Income Overview in Aberdeen
Per Capita Income in Aberdeen is $28,278, while median incomes of families and households are $62,517 and $46,788 respectively.
| Characteristic | Number | Measure |
| Per Capita Income | 4,972 | $28,278 |
| Median Family Income | 1,165 | $62,517 |
| Mean Family Income | 1,165 | $77,014 |
| Median Household Income | 1,977 | $46,788 |
| Mean Household Income | 1,977 | $65,384 |
| Income Deficit | 1,165 | $14,109 |
| Wage / Income Gap (%) | 4,972 | 32.66% |
| Wage / Income Gap ($) | 4,972 | 67.34¢ per $1 |
| Gini / Inequality Index | 4,972 | 0.53 |
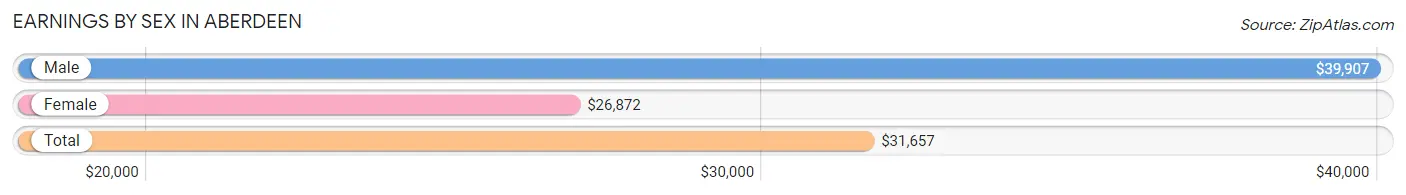
Earnings by Sex in Aberdeen
Average Earnings in Aberdeen are $31,657, $39,907 for men and $26,872 for women, a difference of 32.7%.
| Sex | Number | Average Earnings |
| Male | 1,080 (50.7%) | $39,907 |
| Female | 1,049 (49.3%) | $26,872 |
| Total | 2,129 (100.0%) | $31,657 |
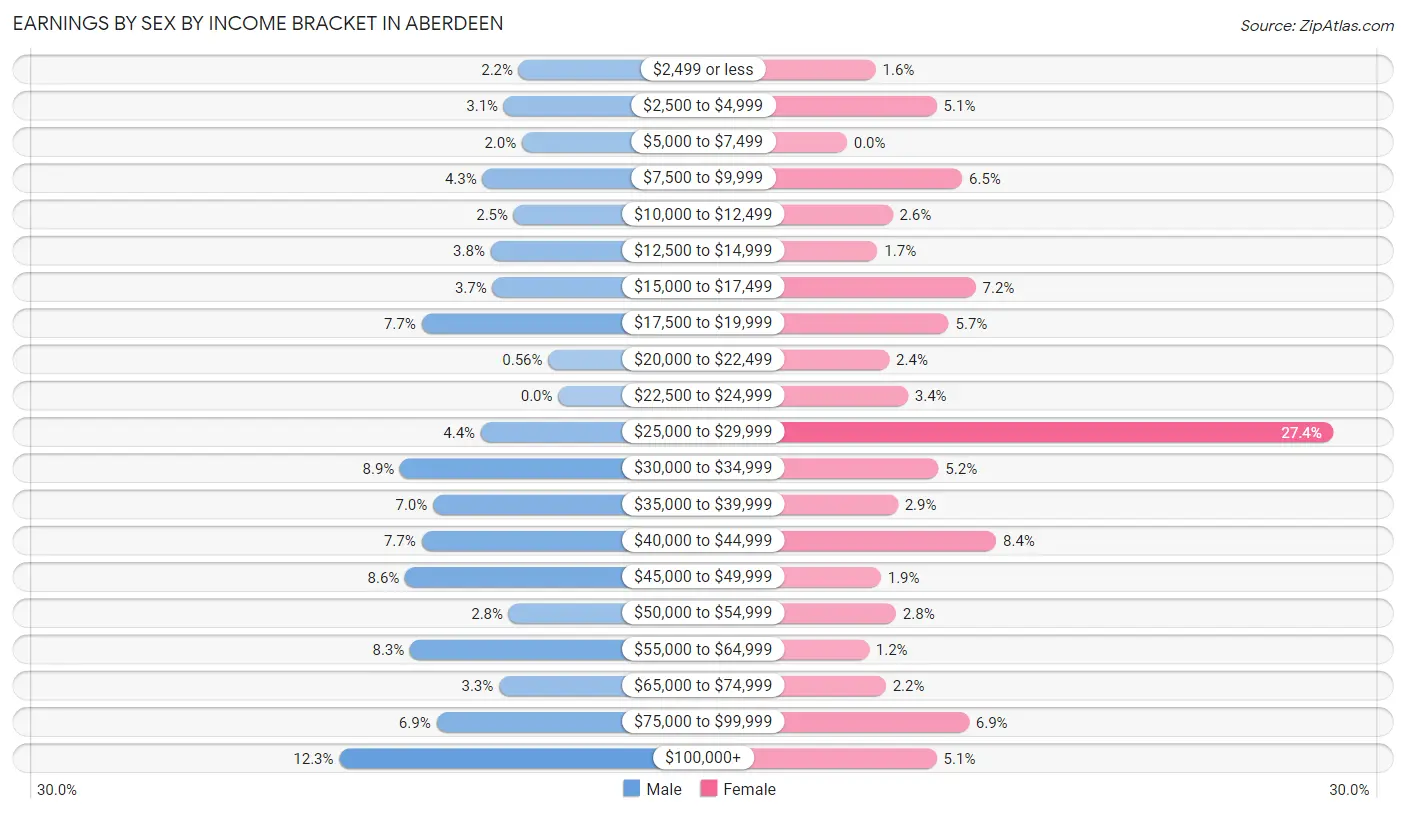
Earnings by Sex by Income Bracket in Aberdeen
The most common earnings brackets in Aberdeen are $100,000+ for men (133 | 12.3%) and $25,000 to $29,999 for women (287 | 27.4%).
| Income | Male | Female |
| $2,499 or less | 24 (2.2%) | 17 (1.6%) |
| $2,500 to $4,999 | 33 (3.1%) | 53 (5.1%) |
| $5,000 to $7,499 | 22 (2.0%) | 0 (0.0%) |
| $7,500 to $9,999 | 46 (4.3%) | 68 (6.5%) |
| $10,000 to $12,499 | 27 (2.5%) | 27 (2.6%) |
| $12,500 to $14,999 | 41 (3.8%) | 18 (1.7%) |
| $15,000 to $17,499 | 40 (3.7%) | 76 (7.2%) |
| $17,500 to $19,999 | 83 (7.7%) | 60 (5.7%) |
| $20,000 to $22,499 | 6 (0.6%) | 25 (2.4%) |
| $22,500 to $24,999 | 0 (0.0%) | 36 (3.4%) |
| $25,000 to $29,999 | 47 (4.3%) | 287 (27.4%) |
| $30,000 to $34,999 | 96 (8.9%) | 54 (5.1%) |
| $35,000 to $39,999 | 76 (7.0%) | 30 (2.9%) |
| $40,000 to $44,999 | 83 (7.7%) | 88 (8.4%) |
| $45,000 to $49,999 | 93 (8.6%) | 20 (1.9%) |
| $50,000 to $54,999 | 30 (2.8%) | 29 (2.8%) |
| $55,000 to $64,999 | 90 (8.3%) | 13 (1.2%) |
| $65,000 to $74,999 | 36 (3.3%) | 23 (2.2%) |
| $75,000 to $99,999 | 74 (6.9%) | 72 (6.9%) |
| $100,000+ | 133 (12.3%) | 53 (5.1%) |
| Total | 1,080 (100.0%) | 1,049 (100.0%) |
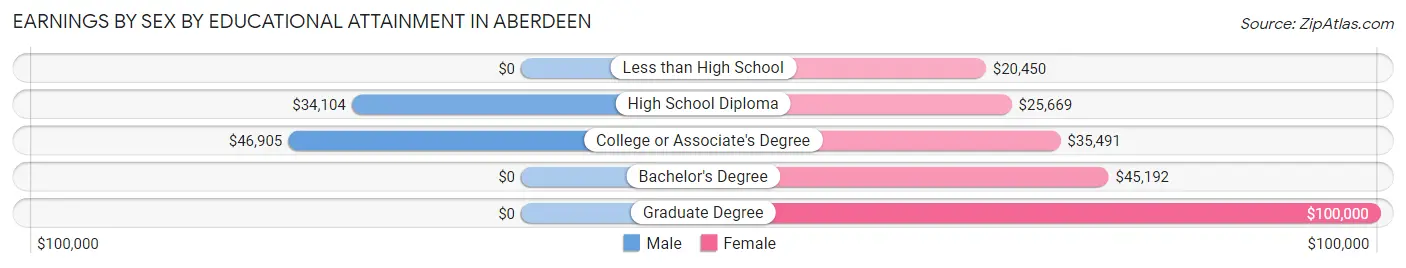
Earnings by Sex by Educational Attainment in Aberdeen
Average earnings in Aberdeen are $41,094 for men and $27,899 for women, a difference of 32.1%. Men with an educational attainment of college or associate's degree enjoy the highest average annual earnings of $46,905, while those with high school diploma education earn the least with $34,104. Women with an educational attainment of graduate degree earn the most with the average annual earnings of $100,000, while those with less than high school education have the smallest earnings of $20,450.
| Educational Attainment | Male Income | Female Income |
| Less than High School | - | - |
| High School Diploma | $34,104 | $25,669 |
| College or Associate's Degree | $46,905 | $35,491 |
| Bachelor's Degree | - | - |
| Graduate Degree | - | - |
| Total | $41,094 | $27,899 |
Family Income in Aberdeen
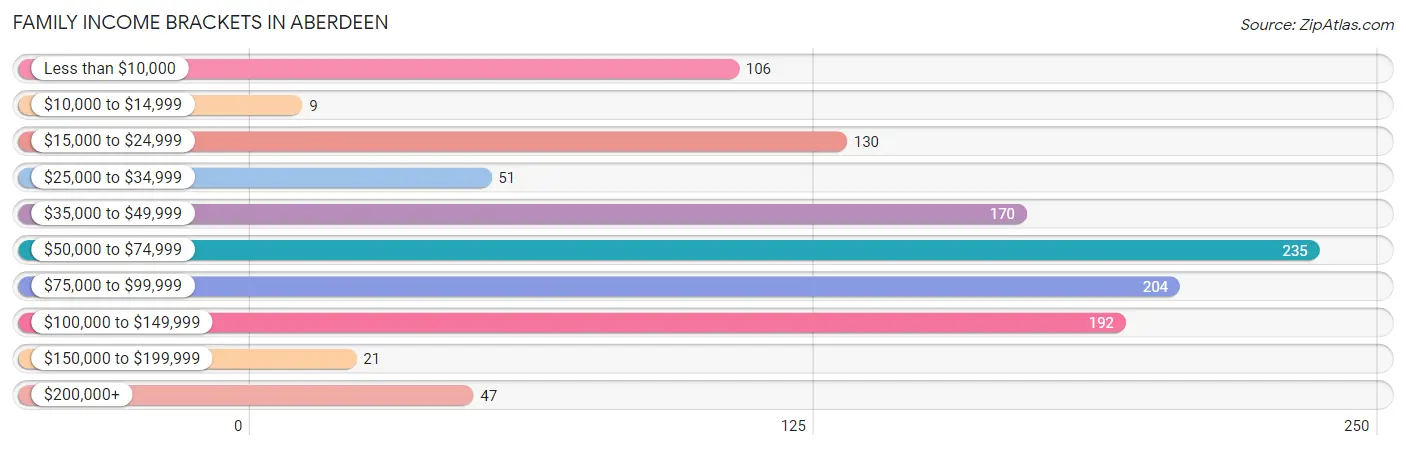
Family Income Brackets in Aberdeen
According to the Aberdeen family income data, there are 235 families falling into the $50,000 to $74,999 income range, which is the most common income bracket and makes up 20.2% of all families. Conversely, the $10,000 to $14,999 income bracket is the least frequent group with only 9 families (0.8%) belonging to this category.
| Income Bracket | # Families | % Families |
| Less than $10,000 | 106 | 9.1% |
| $10,000 to $14,999 | 9 | 0.8% |
| $15,000 to $24,999 | 130 | 11.2% |
| $25,000 to $34,999 | 51 | 4.4% |
| $35,000 to $49,999 | 170 | 14.6% |
| $50,000 to $74,999 | 235 | 20.2% |
| $75,000 to $99,999 | 204 | 17.5% |
| $100,000 to $149,999 | 192 | 16.5% |
| $150,000 to $199,999 | 21 | 1.8% |
| $200,000+ | 47 | 4.0% |
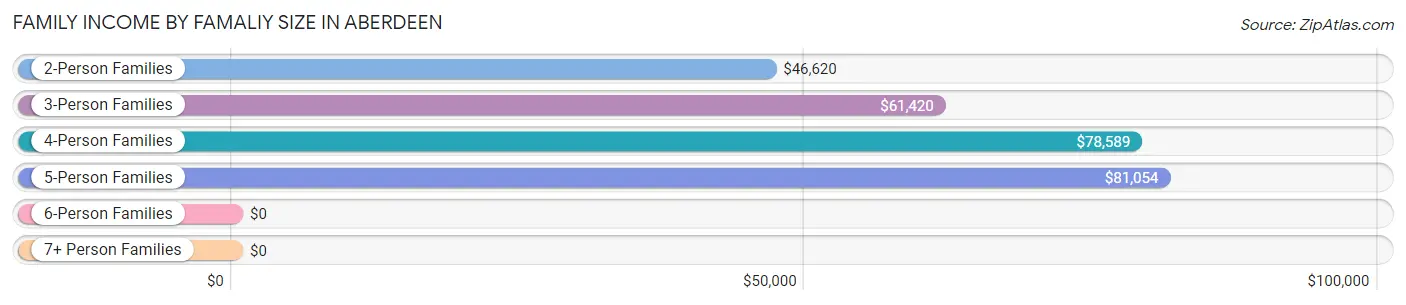
Family Income by Famaliy Size in Aberdeen
5-person families (135 | 11.6%) account for the highest median family income in Aberdeen with $81,054 per family, while 2-person families (507 | 43.5%) have the highest median income of $23,310 per family member.
| Income Bracket | # Families | Median Income |
| 2-Person Families | 507 (43.5%) | $46,620 |
| 3-Person Families | 287 (24.6%) | $61,420 |
| 4-Person Families | 196 (16.8%) | $78,589 |
| 5-Person Families | 135 (11.6%) | $81,054 |
| 6-Person Families | 0 (0.0%) | $0 |
| 7+ Person Families | 40 (3.4%) | $0 |
| Total | 1,165 (100.0%) | $62,517 |
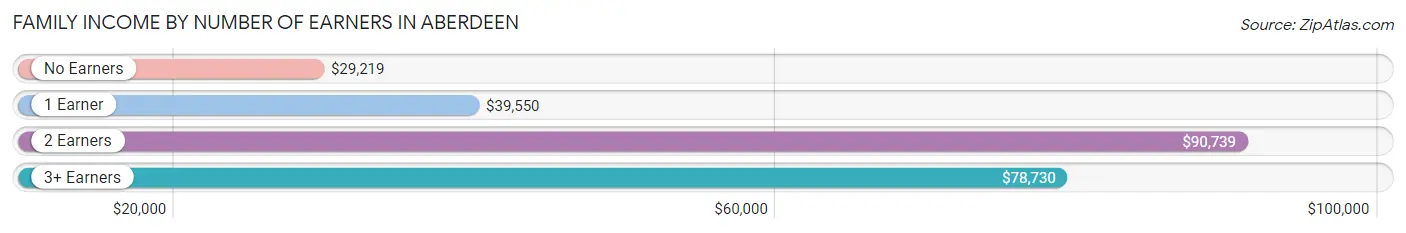
Family Income by Number of Earners in Aberdeen
The median family income in Aberdeen is $62,517, with families comprising 2 earners (375) having the highest median family income of $90,739, while families with no earners (189) have the lowest median family income of $29,219, accounting for 32.2% and 16.2% of families, respectively.
| Number of Earners | # Families | Median Income |
| No Earners | 189 (16.2%) | $29,219 |
| 1 Earner | 454 (39.0%) | $39,550 |
| 2 Earners | 375 (32.2%) | $90,739 |
| 3+ Earners | 147 (12.6%) | $78,730 |
| Total | 1,165 (100.0%) | $62,517 |
Household Income in Aberdeen
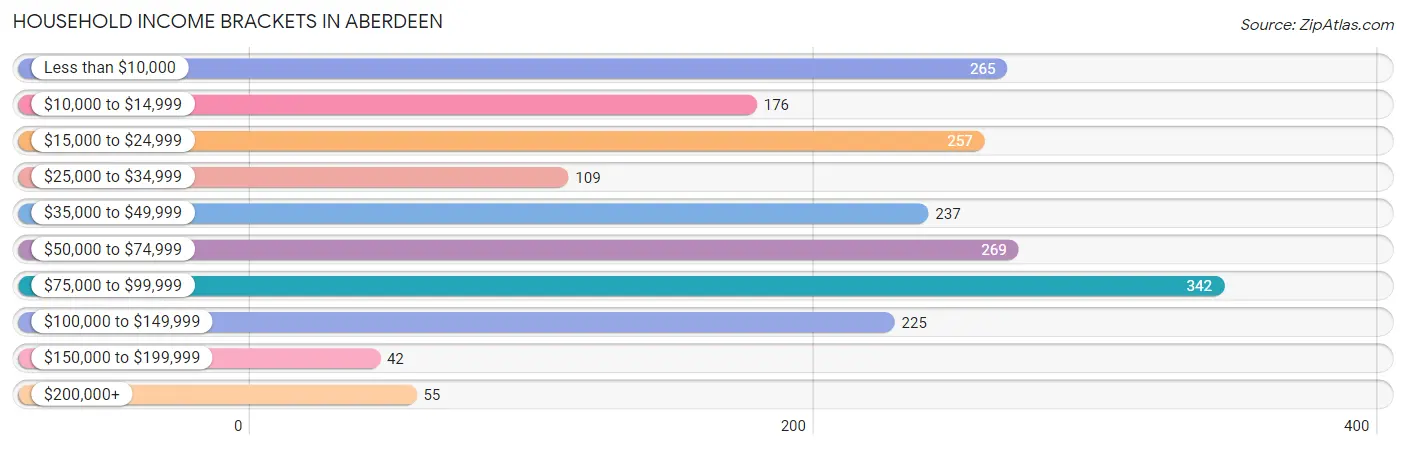
Household Income Brackets in Aberdeen
With 342 households falling in the category, the $75,000 to $99,999 income range is the most frequent in Aberdeen, accounting for 17.3% of all households. In contrast, only 42 households (2.1%) fall into the $150,000 to $199,999 income bracket, making it the least populous group.
| Income Bracket | # Households | % Households |
| Less than $10,000 | 265 | 13.4% |
| $10,000 to $14,999 | 176 | 8.9% |
| $15,000 to $24,999 | 257 | 13.0% |
| $25,000 to $34,999 | 109 | 5.5% |
| $35,000 to $49,999 | 237 | 12.0% |
| $50,000 to $74,999 | 269 | 13.6% |
| $75,000 to $99,999 | 342 | 17.3% |
| $100,000 to $149,999 | 225 | 11.4% |
| $150,000 to $199,999 | 42 | 2.1% |
| $200,000+ | 55 | 2.8% |
Household Income by Householder Age in Aberdeen
The median household income in Aberdeen is $46,788, with the highest median household income of $63,284 found in the 25 to 44 years age bracket for the primary householder. A total of 587 households (29.7%) fall into this category. Meanwhile, the 15 to 24 years age bracket for the primary householder has the lowest median household income of $0, with 22 households (1.1%) in this group.
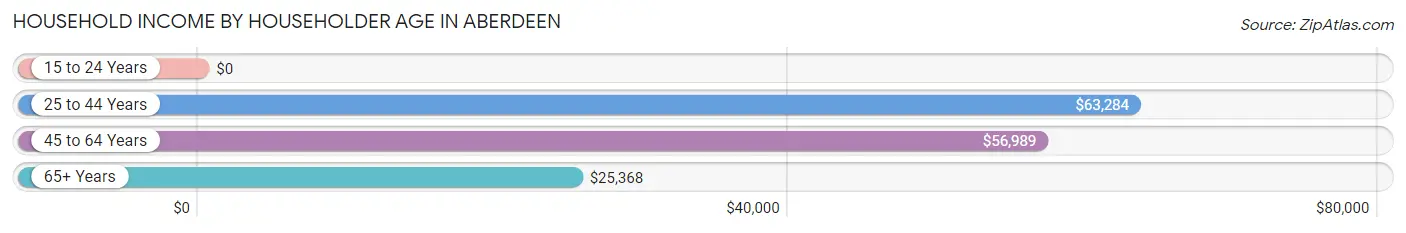
| Income Bracket | # Households | Median Income |
| 15 to 24 Years | 22 (1.1%) | $0 |
| 25 to 44 Years | 587 (29.7%) | $63,284 |
| 45 to 64 Years | 739 (37.4%) | $56,989 |
| 65+ Years | 629 (31.8%) | $25,368 |
| Total | 1,977 (100.0%) | $46,788 |
Poverty in Aberdeen
Income Below Poverty by Sex and Age in Aberdeen
With 22.7% poverty level for males and 29.4% for females among the residents of Aberdeen, 5 year old males and 6 to 11 year old females are the most vulnerable to poverty, with 27 males (100.0%) and 54 females (48.6%) in their respective age groups living below the poverty level.
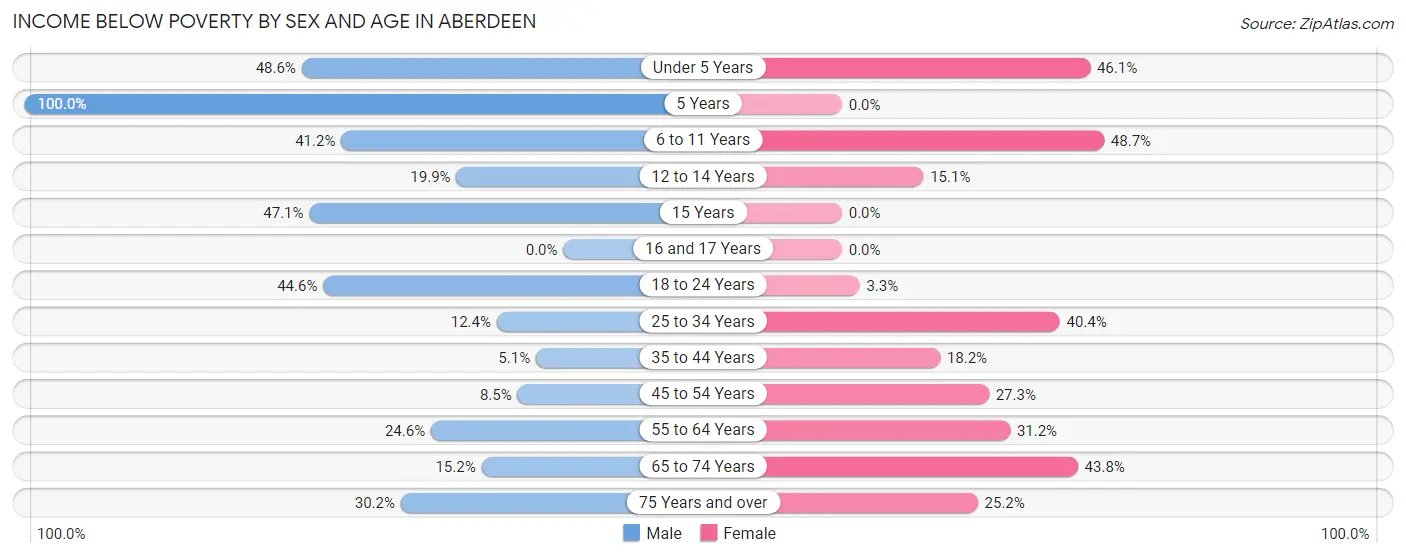
| Age Bracket | Male | Female |
| Under 5 Years | 85 (48.6%) | 41 (46.1%) |
| 5 Years | 27 (100.0%) | 0 (0.0%) |
| 6 to 11 Years | 87 (41.2%) | 54 (48.6%) |
| 12 to 14 Years | 27 (19.9%) | 13 (15.1%) |
| 15 Years | 33 (47.1%) | 0 (0.0%) |
| 16 and 17 Years | 0 (0.0%) | 0 (0.0%) |
| 18 to 24 Years | 41 (44.6%) | 8 (3.3%) |
| 25 to 34 Years | 52 (12.3%) | 133 (40.4%) |
| 35 to 44 Years | 12 (5.1%) | 45 (18.2%) |
| 45 to 54 Years | 26 (8.5%) | 72 (27.3%) |
| 55 to 64 Years | 85 (24.6%) | 88 (31.2%) |
| 65 to 74 Years | 31 (15.2%) | 162 (43.8%) |
| 75 Years and over | 35 (30.2%) | 59 (25.2%) |
| Total | 541 (22.7%) | 675 (29.4%) |
Income Above Poverty by Sex and Age in Aberdeen
According to the poverty statistics in Aberdeen, males aged 16 and 17 years and females aged 5 years are the age groups that are most secure financially, with 100.0% of males and 100.0% of females in these age groups living above the poverty line.
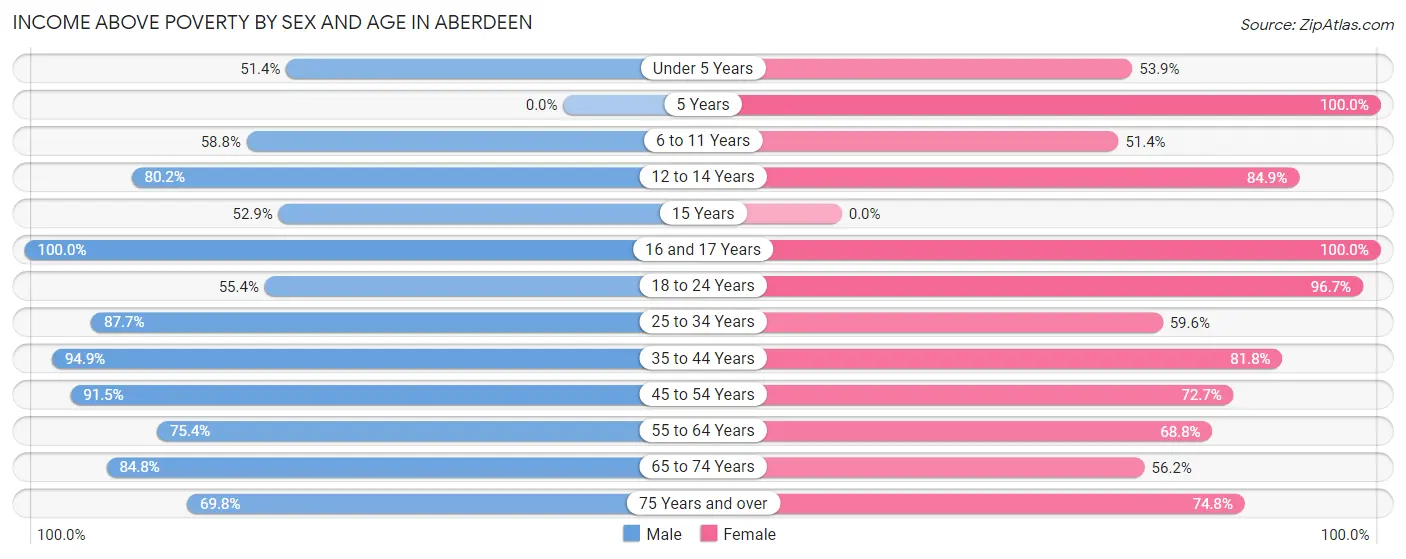
| Age Bracket | Male | Female |
| Under 5 Years | 90 (51.4%) | 48 (53.9%) |
| 5 Years | 0 (0.0%) | 5 (100.0%) |
| 6 to 11 Years | 124 (58.8%) | 57 (51.3%) |
| 12 to 14 Years | 109 (80.1%) | 73 (84.9%) |
| 15 Years | 37 (52.9%) | 0 (0.0%) |
| 16 and 17 Years | 41 (100.0%) | 33 (100.0%) |
| 18 to 24 Years | 51 (55.4%) | 236 (96.7%) |
| 25 to 34 Years | 369 (87.6%) | 196 (59.6%) |
| 35 to 44 Years | 224 (94.9%) | 202 (81.8%) |
| 45 to 54 Years | 280 (91.5%) | 192 (72.7%) |
| 55 to 64 Years | 261 (75.4%) | 194 (68.8%) |
| 65 to 74 Years | 173 (84.8%) | 208 (56.2%) |
| 75 Years and over | 81 (69.8%) | 175 (74.8%) |
| Total | 1,840 (77.3%) | 1,619 (70.6%) |
Income Below Poverty Among Married-Couple Families in Aberdeen
The poverty statistics for married-couple families in Aberdeen show that 10.2% or 66 of the total 645 families live below the poverty line. Families with 1 or 2 children have the highest poverty rate of 13.5%, comprising of 49 families. On the other hand, families with 3 or 4 children have the lowest poverty rate of 0.0%, which includes 0 families.
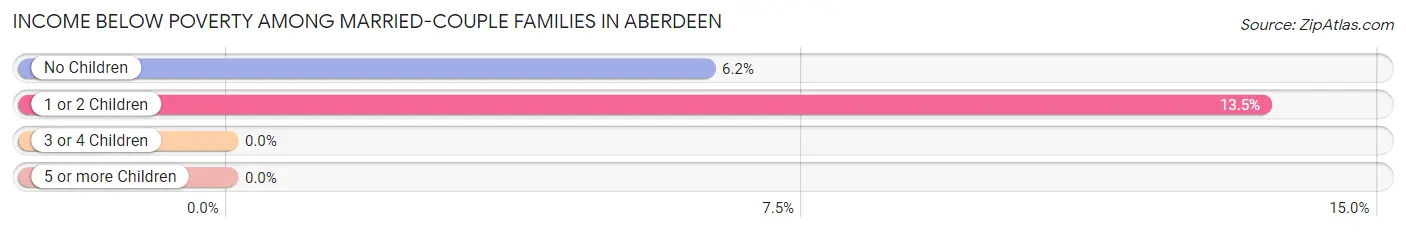
| Children | Above Poverty | Below Poverty |
| No Children | 256 (93.8%) | 17 (6.2%) |
| 1 or 2 Children | 314 (86.5%) | 49 (13.5%) |
| 3 or 4 Children | 9 (100.0%) | 0 (0.0%) |
| 5 or more Children | 0 (0.0%) | 0 (0.0%) |
| Total | 579 (89.8%) | 66 (10.2%) |
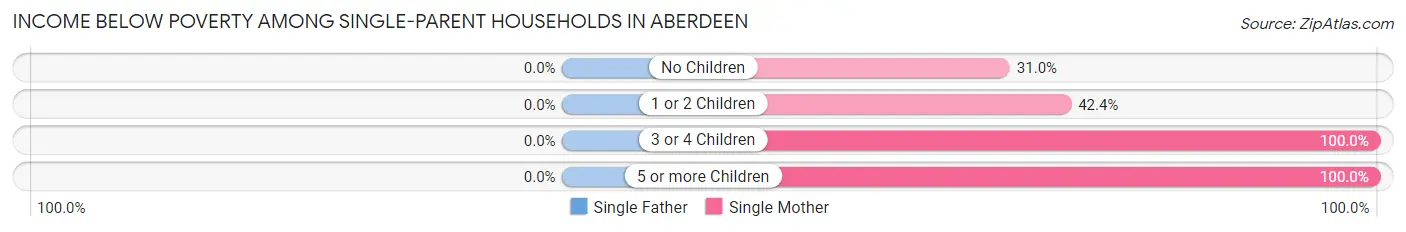
Income Below Poverty Among Single-Parent Households in Aberdeen
| Children | Single Father | Single Mother |
| No Children | 0 (0.0%) | 61 (31.0%) |
| 1 or 2 Children | 0 (0.0%) | 64 (42.4%) |
| 3 or 4 Children | 0 (0.0%) | 5 (100.0%) |
| 5 or more Children | 0 (0.0%) | 18 (100.0%) |
| Total | 0 (0.0%) | 148 (39.9%) |
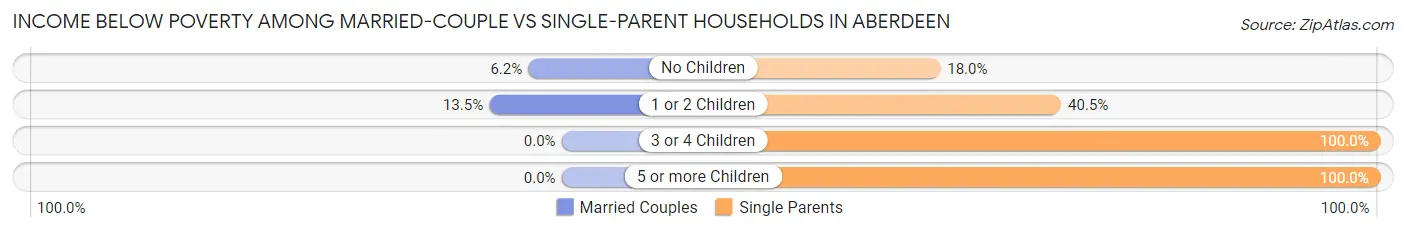
Income Below Poverty Among Married-Couple vs Single-Parent Households in Aberdeen
The poverty data for Aberdeen shows that 66 of the married-couple family households (10.2%) and 148 of the single-parent households (28.5%) are living below the poverty level. Within the married-couple family households, those with 1 or 2 children have the highest poverty rate, with 49 households (13.5%) falling below the poverty line. Among the single-parent households, those with 3 or 4 children have the highest poverty rate, with 5 household (100.0%) living below poverty.
| Children | Married-Couple Families | Single-Parent Households |
| No Children | 17 (6.2%) | 61 (18.0%) |
| 1 or 2 Children | 49 (13.5%) | 64 (40.5%) |
| 3 or 4 Children | 0 (0.0%) | 5 (100.0%) |
| 5 or more Children | 0 (0.0%) | 18 (100.0%) |
| Total | 66 (10.2%) | 148 (28.5%) |
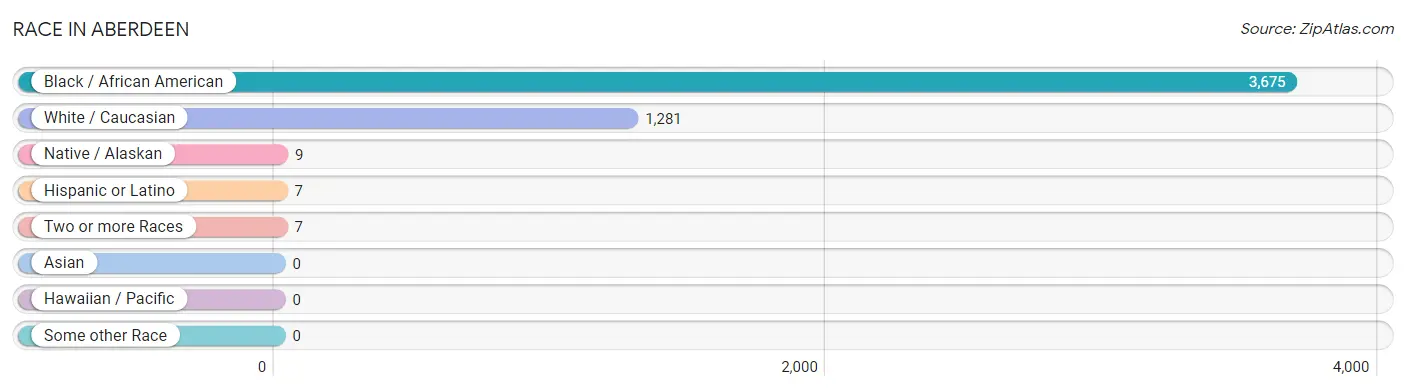
Race in Aberdeen
The most populous races in Aberdeen are Black / African American (3,675 | 73.9%), White / Caucasian (1,281 | 25.8%), and Native / Alaskan (9 | 0.2%).
| Race | # Population | % Population |
| Asian | 0 | 0.0% |
| Black / African American | 3,675 | 73.9% |
| Hawaiian / Pacific | 0 | 0.0% |
| Hispanic or Latino | 7 | 0.1% |
| Native / Alaskan | 9 | 0.2% |
| White / Caucasian | 1,281 | 25.8% |
| Two or more Races | 7 | 0.1% |
| Some other Race | 0 | 0.0% |
| Total | 4,972 | 100.0% |
Ancestry in Aberdeen
The most populous ancestries reported in Aberdeen are English (269 | 5.4%), American (194 | 3.9%), Irish (166 | 3.3%), German (117 | 2.4%), and African (93 | 1.9%), together accounting for 16.9% of all Aberdeen residents.
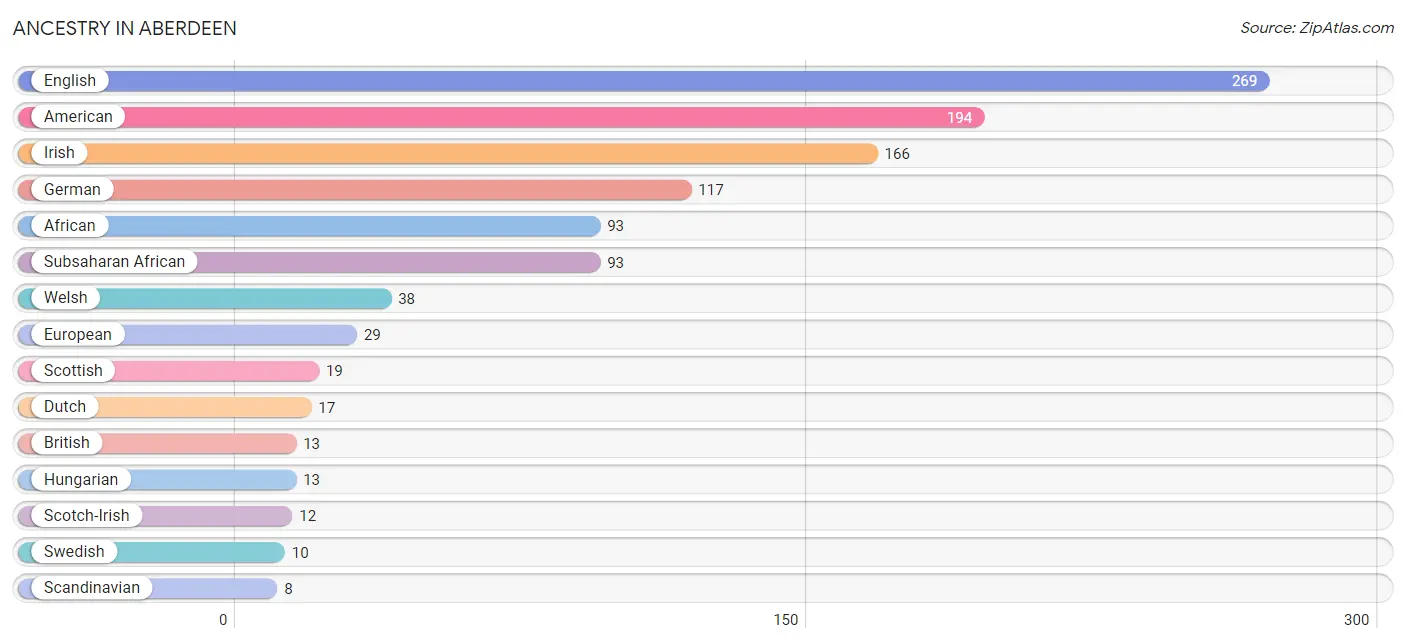
| Ancestry | # Population | % Population |
| African | 93 | 1.9% |
| American | 194 | 3.9% |
| British | 13 | 0.3% |
| Cherokee | 7 | 0.1% |
| Dutch | 17 | 0.3% |
| English | 269 | 5.4% |
| European | 29 | 0.6% |
| French | 4 | 0.1% |
| German | 117 | 2.4% |
| Hungarian | 13 | 0.3% |
| Irish | 166 | 3.3% |
| Puerto Rican | 7 | 0.1% |
| Scandinavian | 8 | 0.2% |
| Scotch-Irish | 12 | 0.2% |
| Scottish | 19 | 0.4% |
| Subsaharan African | 93 | 1.9% |
| Swedish | 10 | 0.2% |
| Swiss | 5 | 0.1% |
| Welsh | 38 | 0.8% | View All 19 Rows |
Immigrants in Aberdeen
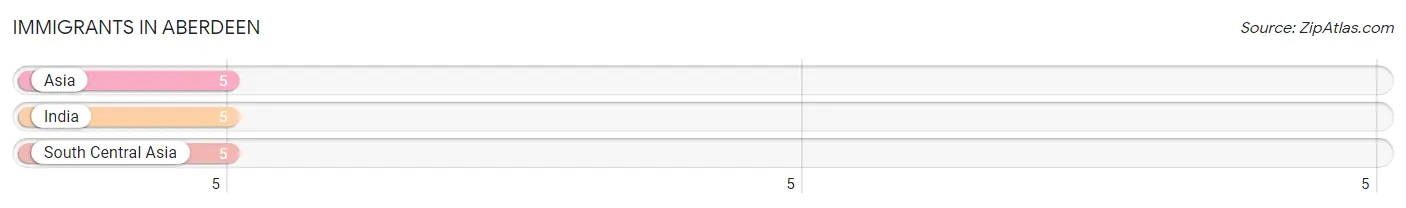
The most numerous immigrant groups reported in Aberdeen came from Asia (5 | 0.1%), India (5 | 0.1%), and South Central Asia (5 | 0.1%), together accounting for 0.3% of all Aberdeen residents.
| Immigration Origin | # Population | % Population |
| Asia | 5 | 0.1% |
| India | 5 | 0.1% |
| South Central Asia | 5 | 0.1% | View All 3 Rows |
Sex and Age in Aberdeen
Sex and Age in Aberdeen
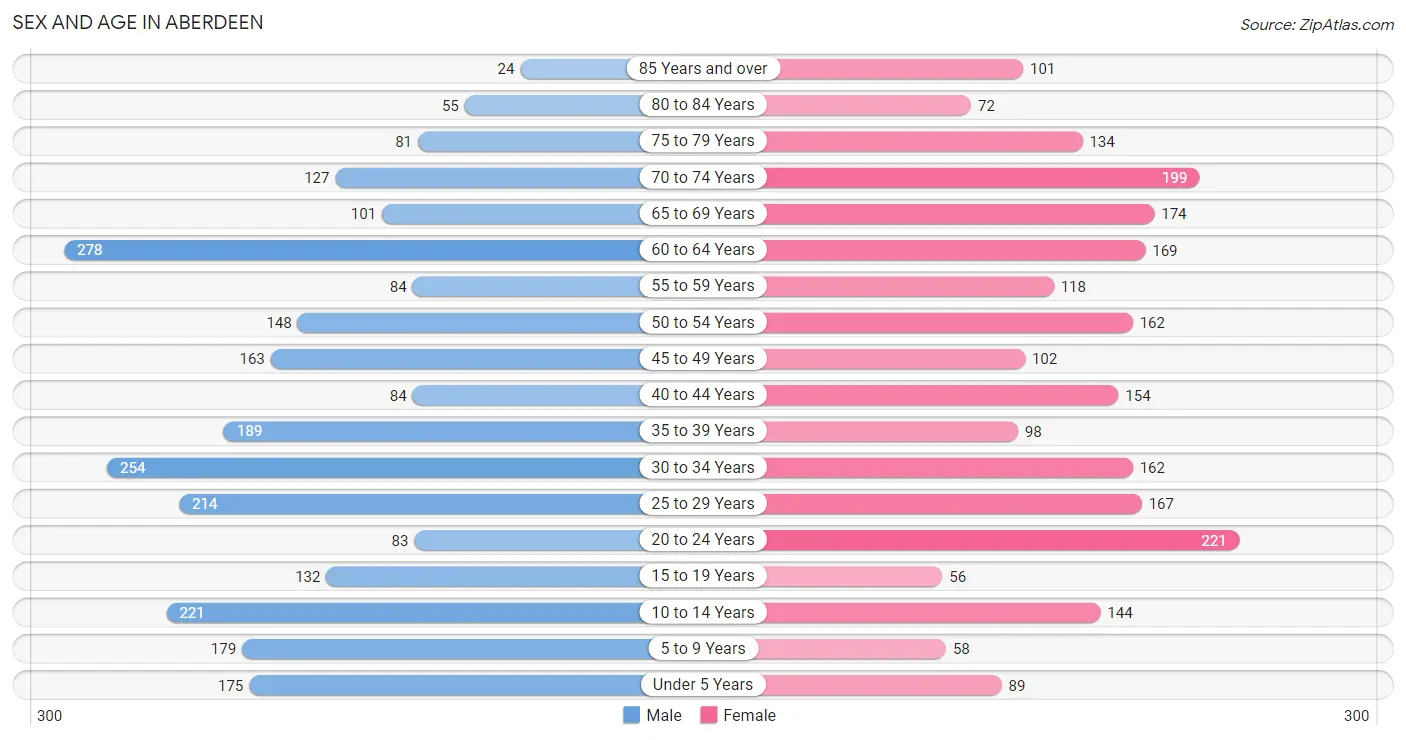
The most populous age groups in Aberdeen are 60 to 64 Years (278 | 10.7%) for men and 20 to 24 Years (221 | 9.3%) for women.
| Age Bracket | Male | Female |
| Under 5 Years | 175 (6.8%) | 89 (3.7%) |
| 5 to 9 Years | 179 (6.9%) | 58 (2.4%) |
| 10 to 14 Years | 221 (8.5%) | 144 (6.0%) |
| 15 to 19 Years | 132 (5.1%) | 56 (2.4%) |
| 20 to 24 Years | 83 (3.2%) | 221 (9.3%) |
| 25 to 29 Years | 214 (8.3%) | 167 (7.0%) |
| 30 to 34 Years | 254 (9.8%) | 162 (6.8%) |
| 35 to 39 Years | 189 (7.3%) | 98 (4.1%) |
| 40 to 44 Years | 84 (3.2%) | 154 (6.5%) |
| 45 to 49 Years | 163 (6.3%) | 102 (4.3%) |
| 50 to 54 Years | 148 (5.7%) | 162 (6.8%) |
| 55 to 59 Years | 84 (3.2%) | 118 (5.0%) |
| 60 to 64 Years | 278 (10.7%) | 169 (7.1%) |
| 65 to 69 Years | 101 (3.9%) | 174 (7.3%) |
| 70 to 74 Years | 127 (4.9%) | 199 (8.4%) |
| 75 to 79 Years | 81 (3.1%) | 134 (5.6%) |
| 80 to 84 Years | 55 (2.1%) | 72 (3.0%) |
| 85 Years and over | 24 (0.9%) | 101 (4.2%) |
| Total | 2,592 (100.0%) | 2,380 (100.0%) |
Families and Households in Aberdeen
Median Family Size in Aberdeen
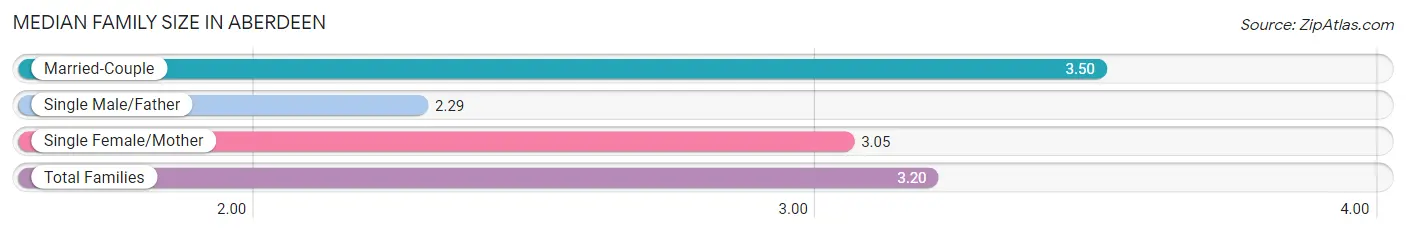
The median family size in Aberdeen is 3.20 persons per family, with married-couple families (645 | 55.4%) accounting for the largest median family size of 3.5 persons per family. On the other hand, single male/father families (149 | 12.8%) represent the smallest median family size with 2.29 persons per family.
| Family Type | # Families | Family Size |
| Married-Couple | 645 (55.4%) | 3.50 |
| Single Male/Father | 149 (12.8%) | 2.29 |
| Single Female/Mother | 371 (31.9%) | 3.05 |
| Total Families | 1,165 (100.0%) | 3.20 |
Median Household Size in Aberdeen
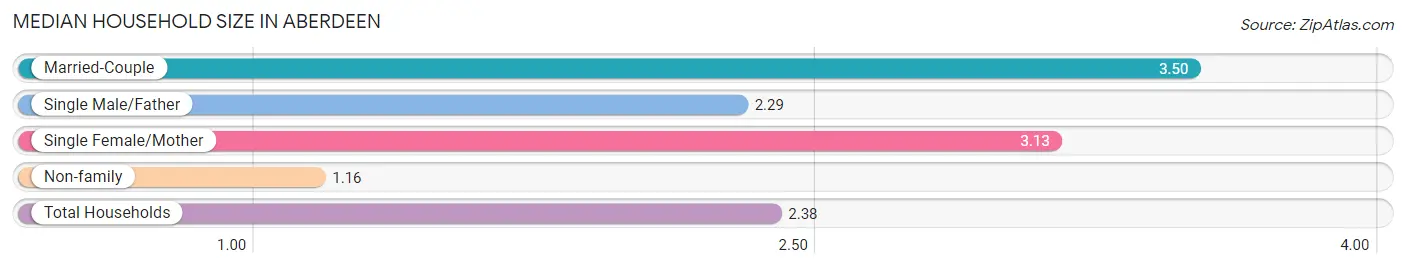
The median household size in Aberdeen is 2.38 persons per household, with married-couple households (645 | 32.6%) accounting for the largest median household size of 3.5 persons per household. non-family households (812 | 41.1%) represent the smallest median household size with 1.16 persons per household.
| Household Type | # Households | Household Size |
| Married-Couple | 645 (32.6%) | 3.50 |
| Single Male/Father | 149 (7.5%) | 2.29 |
| Single Female/Mother | 371 (18.8%) | 3.13 |
| Non-family | 812 (41.1%) | 1.16 |
| Total Households | 1,977 (100.0%) | 2.38 |
Household Size by Marriage Status in Aberdeen
Out of a total of 1,977 households in Aberdeen, 1,165 (58.9%) are family households, while 812 (41.1%) are nonfamily households. The most numerous type of family households are 2-person households, comprising 491, and the most common type of nonfamily households are 1-person households, comprising 707.
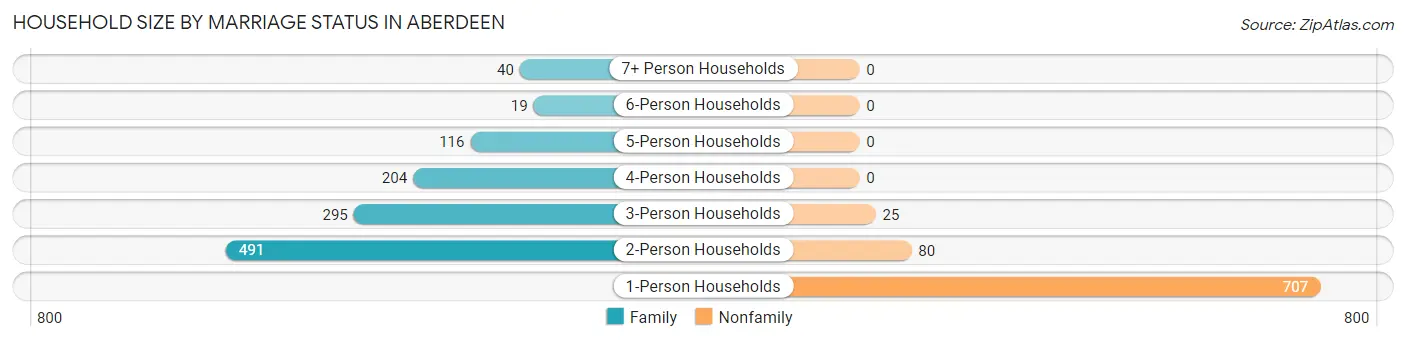
| Household Size | Family Households | Nonfamily Households |
| 1-Person Households | - | 707 (35.8%) |
| 2-Person Households | 491 (24.8%) | 80 (4.1%) |
| 3-Person Households | 295 (14.9%) | 25 (1.3%) |
| 4-Person Households | 204 (10.3%) | 0 (0.0%) |
| 5-Person Households | 116 (5.9%) | 0 (0.0%) |
| 6-Person Households | 19 (1.0%) | 0 (0.0%) |
| 7+ Person Households | 40 (2.0%) | 0 (0.0%) |
| Total | 1,165 (58.9%) | 812 (41.1%) |
Female Fertility in Aberdeen
Fertility by Age in Aberdeen
Average fertility rate in Aberdeen is 76.0 births per 1,000 women. Women in the age bracket of 20 to 34 years have the highest fertility rate with 135.0 births per 1,000 women. Women in the age bracket of 20 to 34 years acount for 100.0% of all women with births.
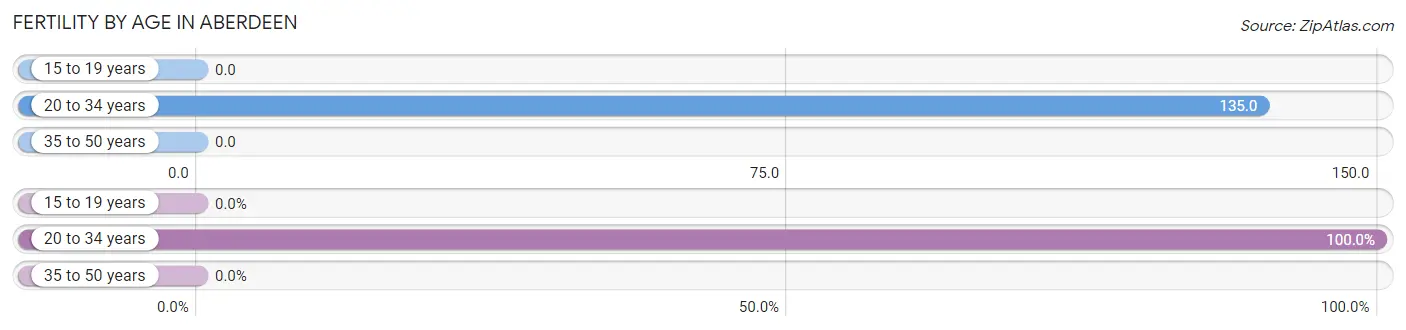
| Age Bracket | Women with Births | Births / 1,000 Women |
| 15 to 19 years | 0 (0.0%) | 0.0 |
| 20 to 34 years | 74 (100.0%) | 135.0 |
| 35 to 50 years | 0 (0.0%) | 0.0 |
| Total | 74 (100.0%) | 76.0 |
Fertility by Age by Marriage Status in Aberdeen
43.2% of women with births (74) in Aberdeen are married. The highest percentage of unmarried women with births falls into 20 to 34 years age bracket with 56.8% of them unmarried at the time of birth, while the lowest percentage of unmarried women with births belong to 20 to 34 years age bracket with 56.8% of them unmarried.
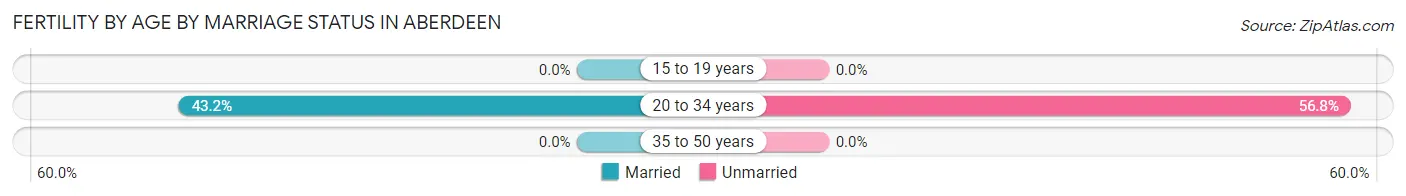
| Age Bracket | Married | Unmarried |
| 15 to 19 years | 0 (0.0%) | 0 (0.0%) |
| 20 to 34 years | 32 (43.2%) | 42 (56.8%) |
| 35 to 50 years | 0 (0.0%) | 0 (0.0%) |
| Total | 32 (43.2%) | 42 (56.8%) |
Fertility by Education in Aberdeen
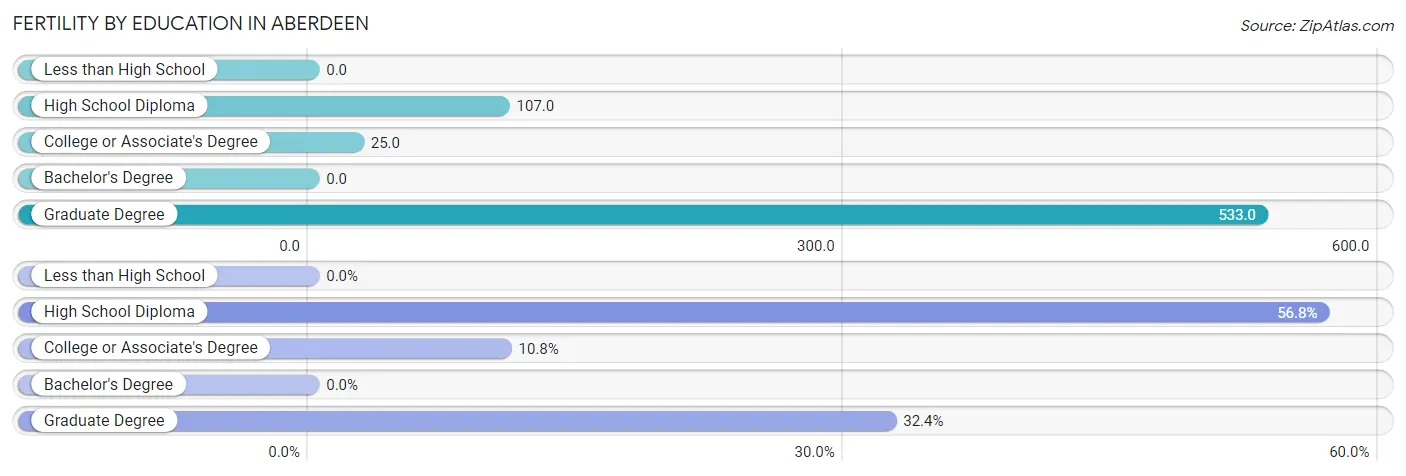
| Educational Attainment | Women with Births | Births / 1,000 Women |
| Less than High School | 0 (0.0%) | 0.0 |
| High School Diploma | 42 (56.8%) | 107.0 |
| College or Associate's Degree | 8 (10.8%) | 25.0 |
| Bachelor's Degree | 0 (0.0%) | 0.0 |
| Graduate Degree | 24 (32.4%) | 533.0 |
| Total | 74 (100.0%) | 76.0 |
Fertility by Education by Marriage Status in Aberdeen
56.8% of women with births in Aberdeen are unmarried. Women with the educational attainment of college or associate's degree are most likely to be married with 100.0% of them married at childbirth, while women with the educational attainment of high school diploma are least likely to be married with 100.0% of them unmarried at childbirth.
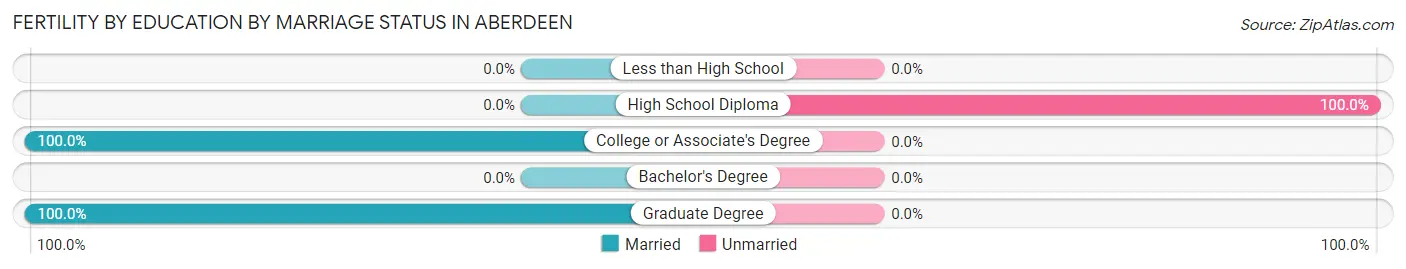
| Educational Attainment | Married | Unmarried |
| Less than High School | 0 (0.0%) | 0 (0.0%) |
| High School Diploma | 0 (0.0%) | 42 (100.0%) |
| College or Associate's Degree | 8 (100.0%) | 0 (0.0%) |
| Bachelor's Degree | 0 (0.0%) | 0 (0.0%) |
| Graduate Degree | 24 (100.0%) | 0 (0.0%) |
| Total | 32 (43.2%) | 42 (56.8%) |
Employment Characteristics in Aberdeen
Employment by Class of Employer in Aberdeen
Among the 1,902 employed individuals in Aberdeen, private company employees (1,507 | 79.2%), state government employees (111 | 5.8%), and local government employees (92 | 4.8%) make up the most common classes of employment.
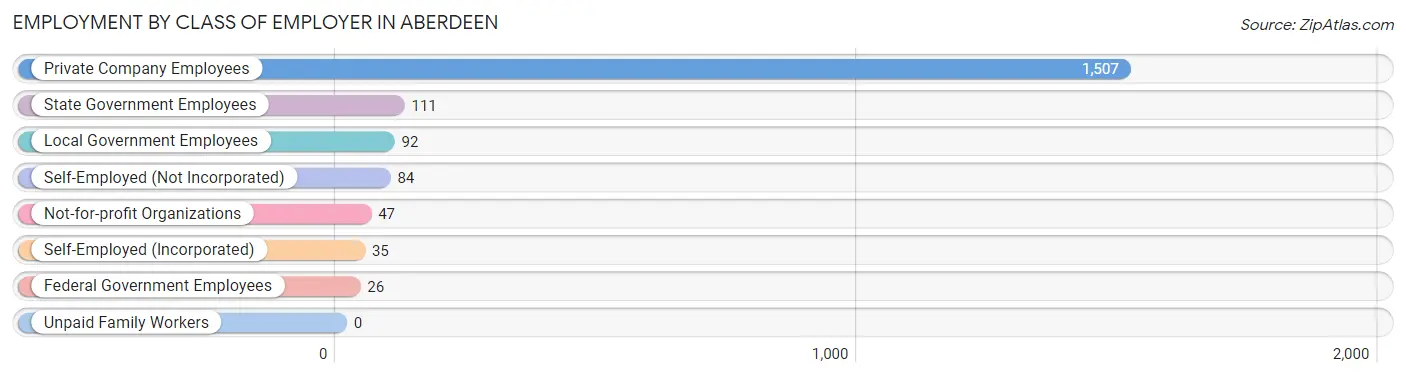
| Employer Class | # Employees | % Employees |
| Private Company Employees | 1,507 | 79.2% |
| Self-Employed (Incorporated) | 35 | 1.8% |
| Self-Employed (Not Incorporated) | 84 | 4.4% |
| Not-for-profit Organizations | 47 | 2.5% |
| Local Government Employees | 92 | 4.8% |
| State Government Employees | 111 | 5.8% |
| Federal Government Employees | 26 | 1.4% |
| Unpaid Family Workers | 0 | 0.0% |
| Total | 1,902 | 100.0% |
Employment Status by Age in Aberdeen
According to the labor force statistics for Aberdeen, out of the total population over 16 years of age (4,036), 50.6% or 2,042 individuals are in the labor force, with 6.4% or 131 of them unemployed. The age group with the highest labor force participation rate is 25 to 29 years, with 90.8% or 346 individuals in the labor force. Within the labor force, the 60 to 64 years age range has the highest percentage of unemployed individuals, with 12.0% or 24 of them being unemployed.
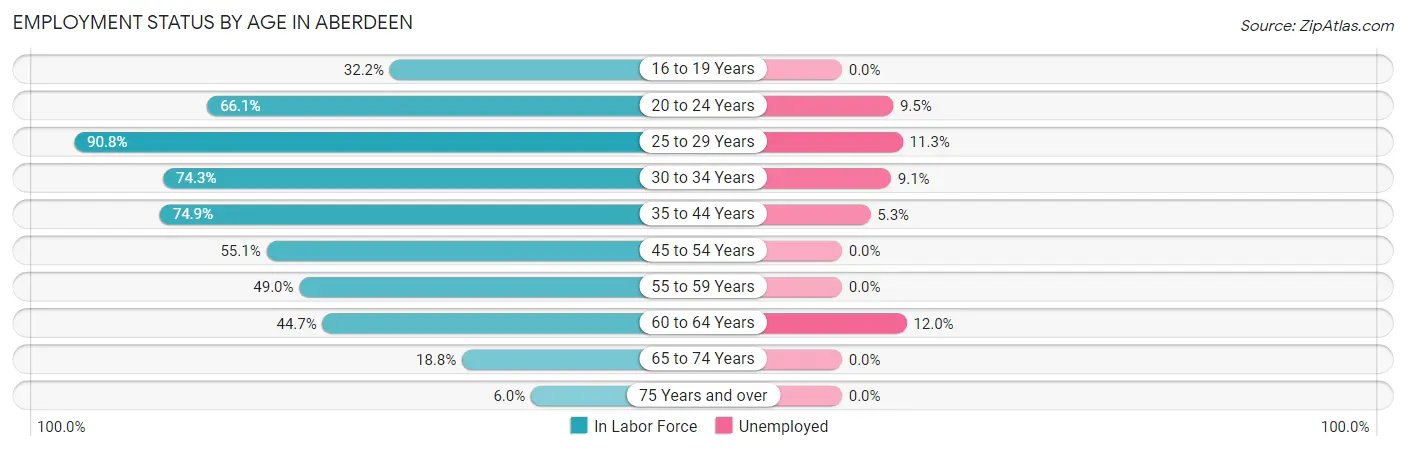
| Age Bracket | In Labor Force | Unemployed |
| 16 to 19 Years | 38 (32.2%) | 0 (0.0%) |
| 20 to 24 Years | 201 (66.1%) | 19 (9.5%) |
| 25 to 29 Years | 346 (90.8%) | 39 (11.3%) |
| 30 to 34 Years | 309 (74.3%) | 28 (9.1%) |
| 35 to 44 Years | 393 (74.9%) | 21 (5.3%) |
| 45 to 54 Years | 317 (55.1%) | 0 (0.0%) |
| 55 to 59 Years | 99 (49.0%) | 0 (0.0%) |
| 60 to 64 Years | 200 (44.7%) | 24 (12.0%) |
| 65 to 74 Years | 113 (18.8%) | 0 (0.0%) |
| 75 Years and over | 28 (6.0%) | 0 (0.0%) |
| Total | 2,042 (50.6%) | 131 (6.4%) |
Employment Status by Educational Attainment in Aberdeen
According to labor force statistics for Aberdeen, 65.4% of individuals (1,665) out of the total population between 25 and 64 years of age (2,546) are in the labor force, with 6.7% or 112 of them being unemployed. The group with the highest labor force participation rate are those with the educational attainment of college / associate degree, with 77.2% or 588 individuals in the labor force. Within the labor force, individuals with high school diploma education have the highest percentage of unemployment, with 10.1% or 76 of them being unemployed.
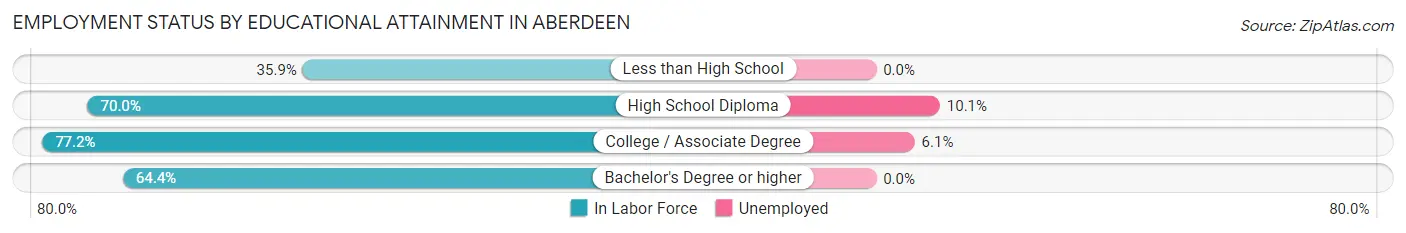
| Educational Attainment | In Labor Force | Unemployed |
| Less than High School | 168 (35.9%) | 0 (0.0%) |
| High School Diploma | 754 (70.0%) | 109 (10.1%) |
| College / Associate Degree | 588 (77.2%) | 46 (6.1%) |
| Bachelor's Degree or higher | 154 (64.4%) | 0 (0.0%) |
| Total | 1,665 (65.4%) | 171 (6.7%) |
Employment Occupations by Sex in Aberdeen
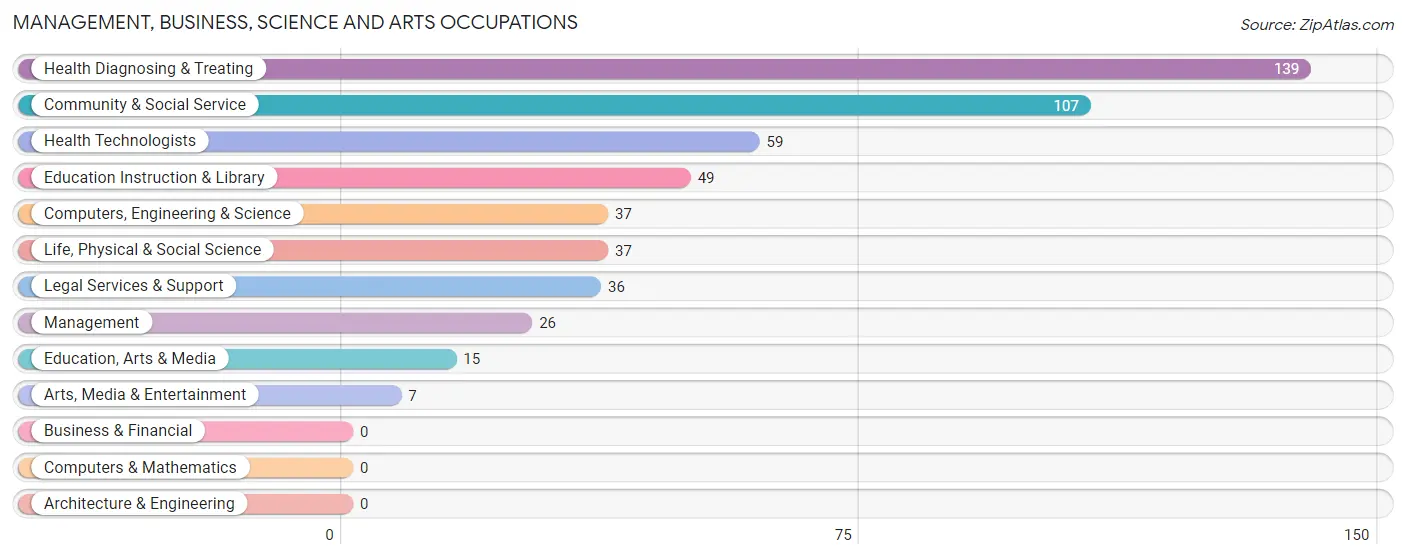
Management, Business, Science and Arts Occupations
The most common Management, Business, Science and Arts occupations in Aberdeen are Health Diagnosing & Treating (139 | 7.3%), Community & Social Service (107 | 5.6%), Health Technologists (59 | 3.1%), Education Instruction & Library (49 | 2.6%), and Computers, Engineering & Science (37 | 1.9%).
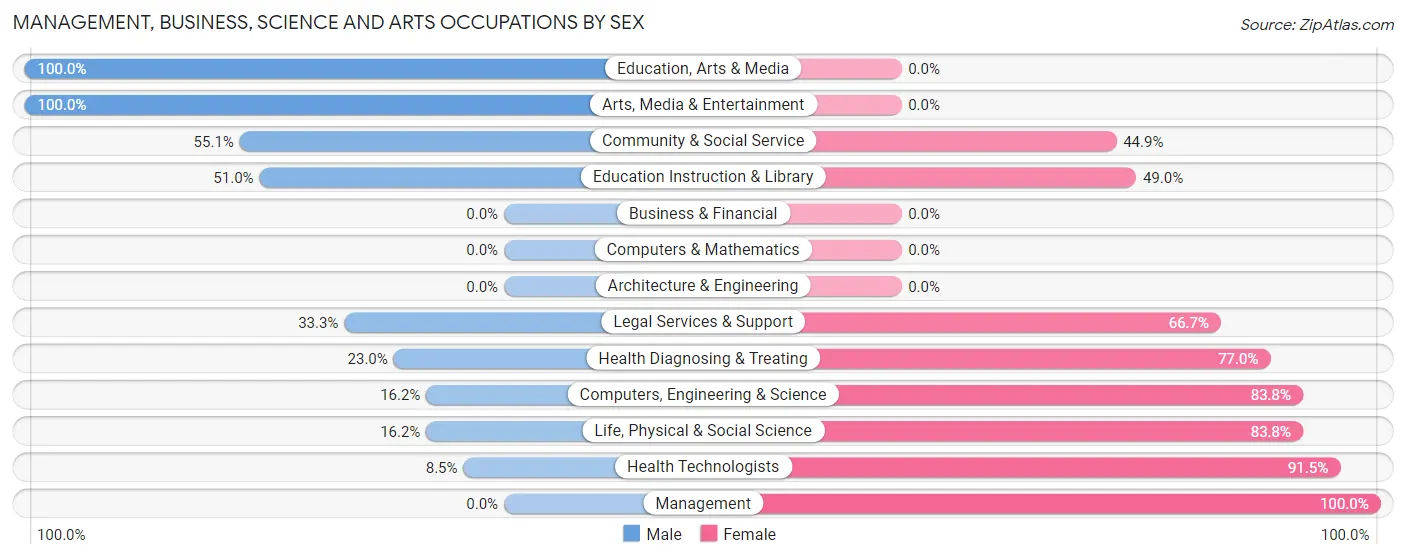
Management, Business, Science and Arts Occupations by Sex
Within the Management, Business, Science and Arts occupations in Aberdeen, the most male-oriented occupations are Education, Arts & Media (100.0%), Arts, Media & Entertainment (100.0%), and Community & Social Service (55.1%), while the most female-oriented occupations are Management (100.0%), Health Technologists (91.5%), and Computers, Engineering & Science (83.8%).
| Occupation | Male | Female |
| Management | 0 (0.0%) | 26 (100.0%) |
| Business & Financial | 0 (0.0%) | 0 (0.0%) |
| Computers, Engineering & Science | 6 (16.2%) | 31 (83.8%) |
| Computers & Mathematics | 0 (0.0%) | 0 (0.0%) |
| Architecture & Engineering | 0 (0.0%) | 0 (0.0%) |
| Life, Physical & Social Science | 6 (16.2%) | 31 (83.8%) |
| Community & Social Service | 59 (55.1%) | 48 (44.9%) |
| Education, Arts & Media | 15 (100.0%) | 0 (0.0%) |
| Legal Services & Support | 12 (33.3%) | 24 (66.7%) |
| Education Instruction & Library | 25 (51.0%) | 24 (49.0%) |
| Arts, Media & Entertainment | 7 (100.0%) | 0 (0.0%) |
| Health Diagnosing & Treating | 32 (23.0%) | 107 (77.0%) |
| Health Technologists | 5 (8.5%) | 54 (91.5%) |
| Total (Category) | 97 (31.4%) | 212 (68.6%) |
| Total (Overall) | 940 (49.1%) | 973 (50.9%) |
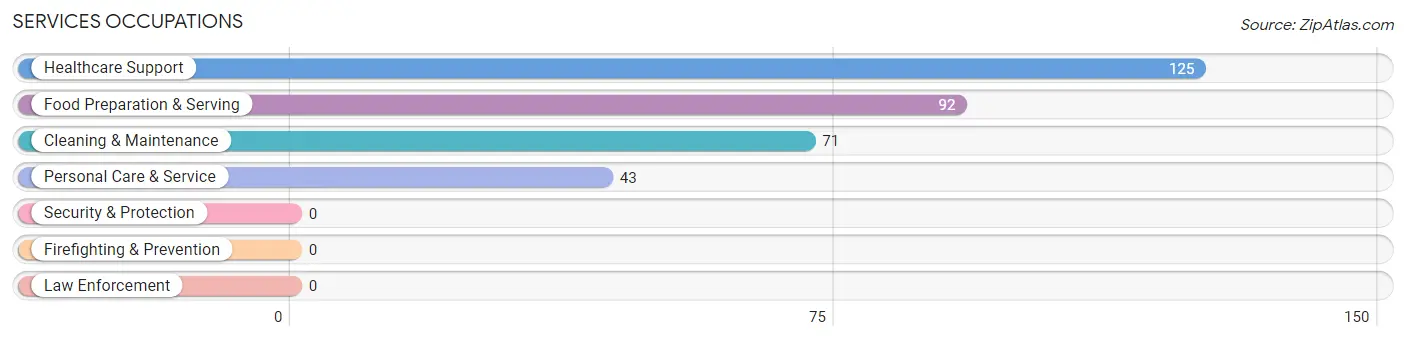
Services Occupations
The most common Services occupations in Aberdeen are Healthcare Support (125 | 6.5%), Food Preparation & Serving (92 | 4.8%), Cleaning & Maintenance (71 | 3.7%), and Personal Care & Service (43 | 2.2%).
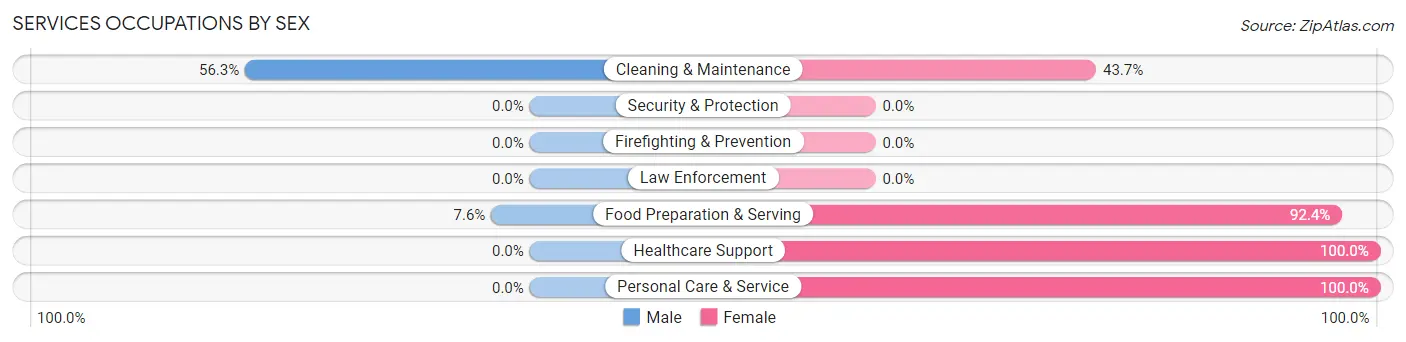
Services Occupations by Sex
Within the Services occupations in Aberdeen, the most male-oriented occupations are Cleaning & Maintenance (56.3%), and Food Preparation & Serving (7.6%), while the most female-oriented occupations are Healthcare Support (100.0%), Personal Care & Service (100.0%), and Food Preparation & Serving (92.4%).
| Occupation | Male | Female |
| Healthcare Support | 0 (0.0%) | 125 (100.0%) |
| Security & Protection | 0 (0.0%) | 0 (0.0%) |
| Firefighting & Prevention | 0 (0.0%) | 0 (0.0%) |
| Law Enforcement | 0 (0.0%) | 0 (0.0%) |
| Food Preparation & Serving | 7 (7.6%) | 85 (92.4%) |
| Cleaning & Maintenance | 40 (56.3%) | 31 (43.7%) |
| Personal Care & Service | 0 (0.0%) | 43 (100.0%) |
| Total (Category) | 47 (14.2%) | 284 (85.8%) |
| Total (Overall) | 940 (49.1%) | 973 (50.9%) |
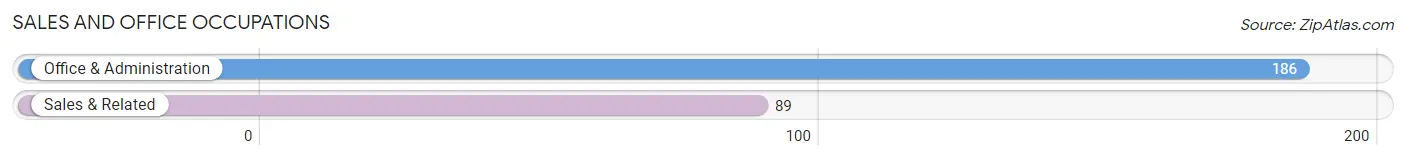
Sales and Office Occupations
The most common Sales and Office occupations in Aberdeen are Office & Administration (186 | 9.7%), and Sales & Related (89 | 4.6%).
Sales and Office Occupations by Sex
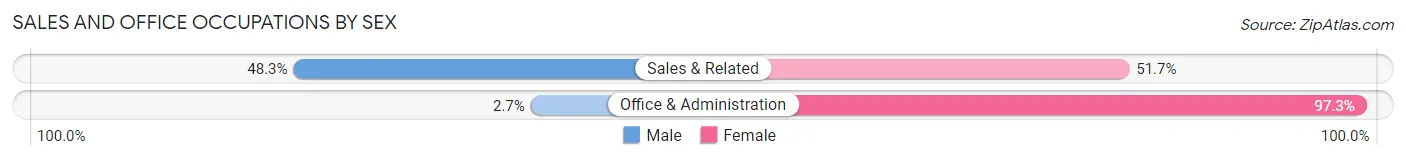
| Occupation | Male | Female |
| Sales & Related | 43 (48.3%) | 46 (51.7%) |
| Office & Administration | 5 (2.7%) | 181 (97.3%) |
| Total (Category) | 48 (17.4%) | 227 (82.6%) |
| Total (Overall) | 940 (49.1%) | 973 (50.9%) |
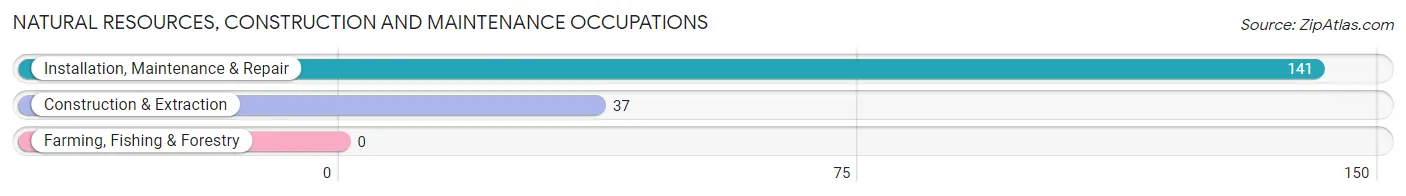
Natural Resources, Construction and Maintenance Occupations
The most common Natural Resources, Construction and Maintenance occupations in Aberdeen are Installation, Maintenance & Repair (141 | 7.4%), and Construction & Extraction (37 | 1.9%).
Natural Resources, Construction and Maintenance Occupations by Sex
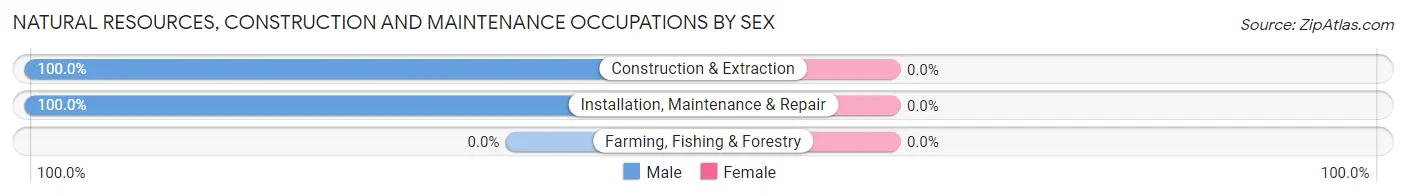
| Occupation | Male | Female |
| Farming, Fishing & Forestry | 0 (0.0%) | 0 (0.0%) |
| Construction & Extraction | 37 (100.0%) | 0 (0.0%) |
| Installation, Maintenance & Repair | 141 (100.0%) | 0 (0.0%) |
| Total (Category) | 178 (100.0%) | 0 (0.0%) |
| Total (Overall) | 940 (49.1%) | 973 (50.9%) |
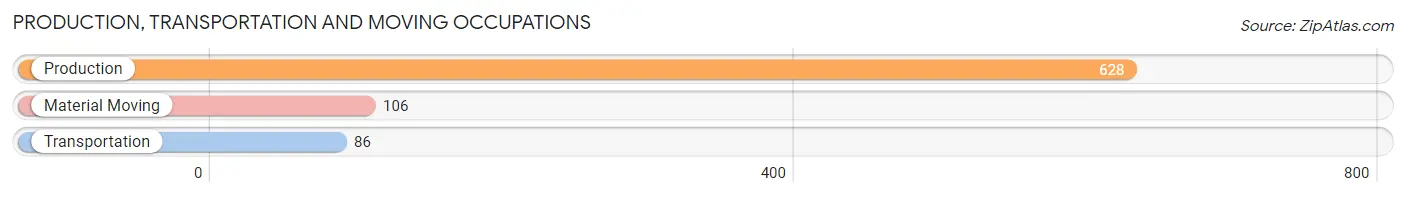
Production, Transportation and Moving Occupations
The most common Production, Transportation and Moving occupations in Aberdeen are Production (628 | 32.8%), Material Moving (106 | 5.5%), and Transportation (86 | 4.5%).
Production, Transportation and Moving Occupations by Sex
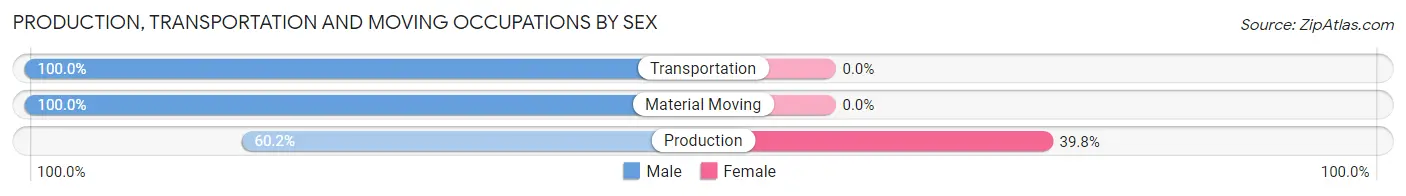
| Occupation | Male | Female |
| Production | 378 (60.2%) | 250 (39.8%) |
| Transportation | 86 (100.0%) | 0 (0.0%) |
| Material Moving | 106 (100.0%) | 0 (0.0%) |
| Total (Category) | 570 (69.5%) | 250 (30.5%) |
| Total (Overall) | 940 (49.1%) | 973 (50.9%) |
Employment Industries by Sex in Aberdeen
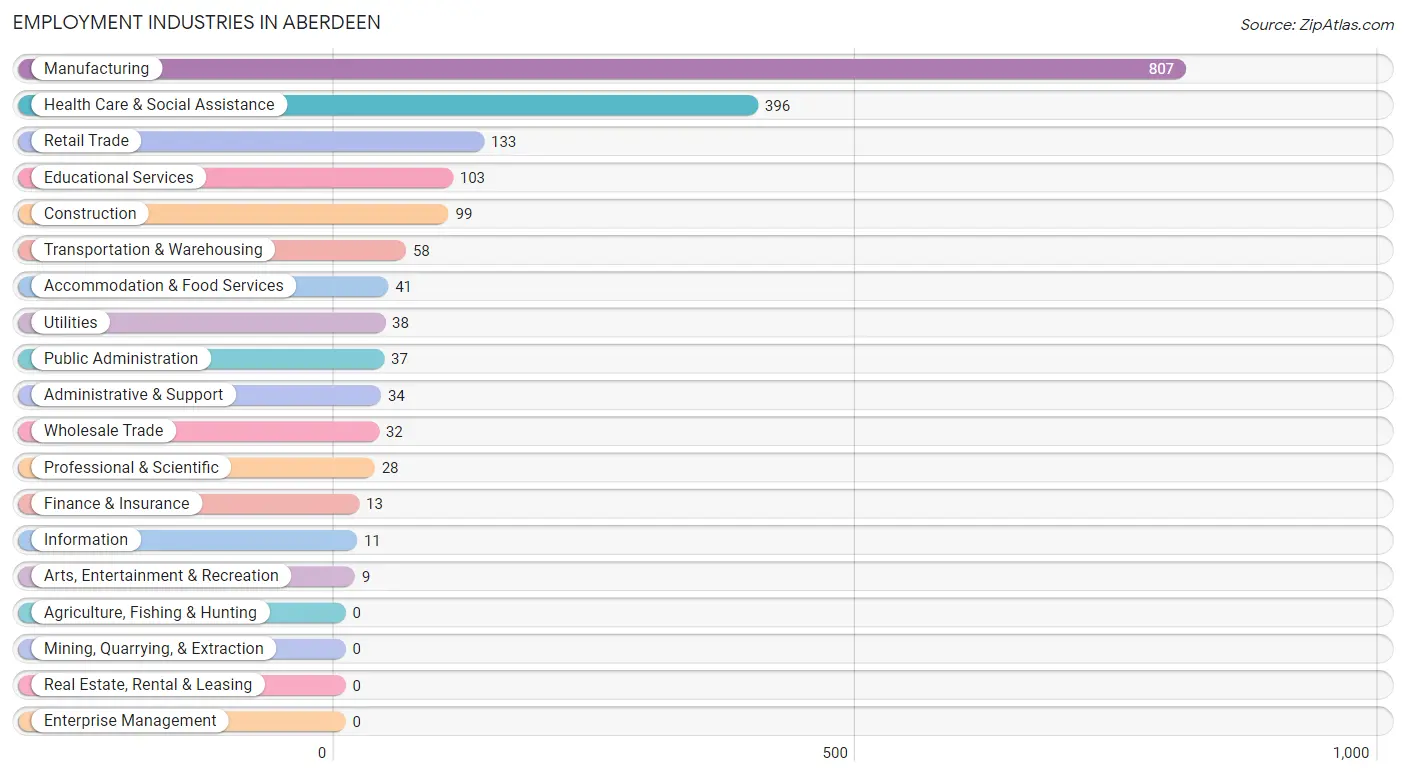
Employment Industries in Aberdeen
The major employment industries in Aberdeen include Manufacturing (807 | 42.2%), Health Care & Social Assistance (396 | 20.7%), Retail Trade (133 | 7.0%), Educational Services (103 | 5.4%), and Construction (99 | 5.2%).
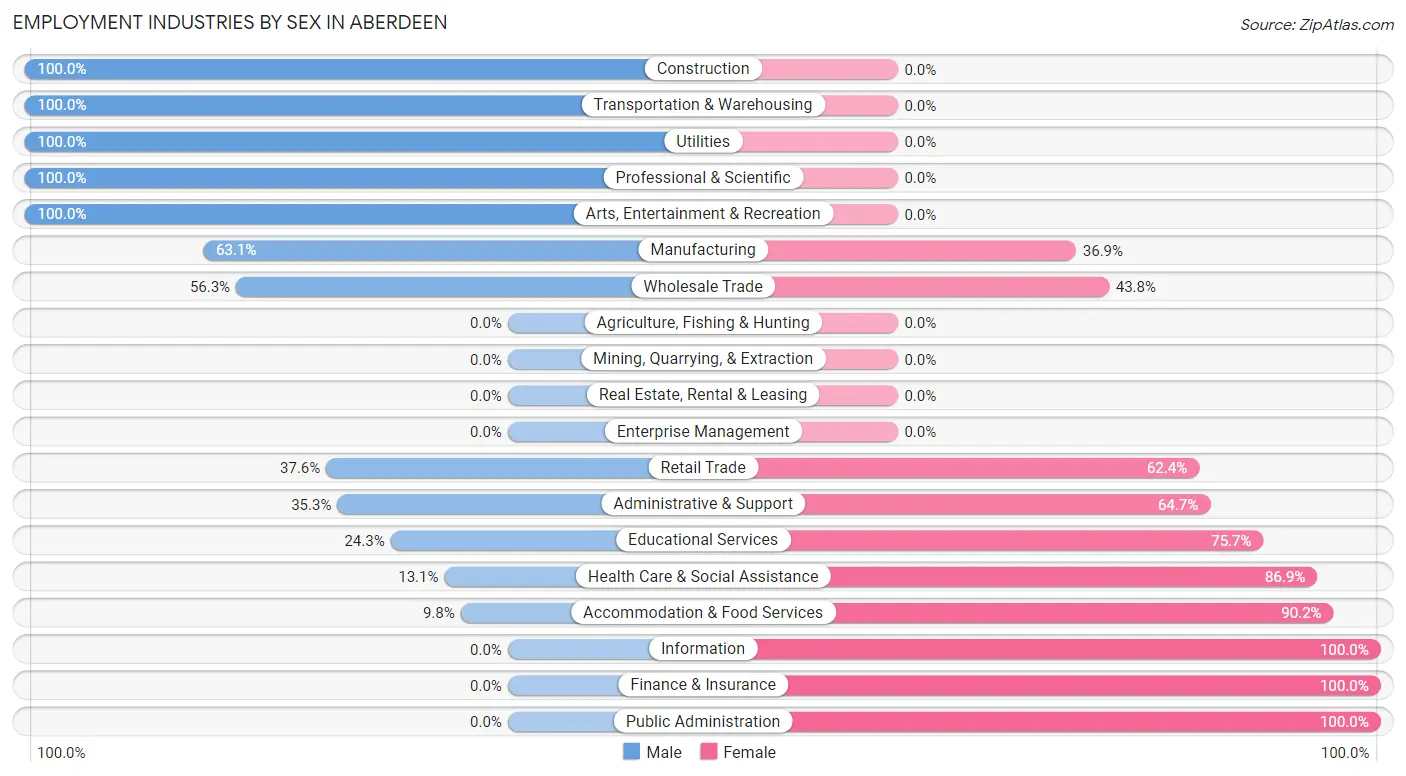
Employment Industries by Sex in Aberdeen
The Aberdeen industries that see more men than women are Construction (100.0%), Transportation & Warehousing (100.0%), and Utilities (100.0%), whereas the industries that tend to have a higher number of women are Information (100.0%), Finance & Insurance (100.0%), and Public Administration (100.0%).
| Industry | Male | Female |
| Agriculture, Fishing & Hunting | 0 (0.0%) | 0 (0.0%) |
| Mining, Quarrying, & Extraction | 0 (0.0%) | 0 (0.0%) |
| Construction | 99 (100.0%) | 0 (0.0%) |
| Manufacturing | 509 (63.1%) | 298 (36.9%) |
| Wholesale Trade | 18 (56.2%) | 14 (43.8%) |
| Retail Trade | 50 (37.6%) | 83 (62.4%) |
| Transportation & Warehousing | 58 (100.0%) | 0 (0.0%) |
| Utilities | 38 (100.0%) | 0 (0.0%) |
| Information | 0 (0.0%) | 11 (100.0%) |
| Finance & Insurance | 0 (0.0%) | 13 (100.0%) |
| Real Estate, Rental & Leasing | 0 (0.0%) | 0 (0.0%) |
| Professional & Scientific | 28 (100.0%) | 0 (0.0%) |
| Enterprise Management | 0 (0.0%) | 0 (0.0%) |
| Administrative & Support | 12 (35.3%) | 22 (64.7%) |
| Educational Services | 25 (24.3%) | 78 (75.7%) |
| Health Care & Social Assistance | 52 (13.1%) | 344 (86.9%) |
| Arts, Entertainment & Recreation | 9 (100.0%) | 0 (0.0%) |
| Accommodation & Food Services | 4 (9.8%) | 37 (90.2%) |
| Public Administration | 0 (0.0%) | 37 (100.0%) |
| Total | 940 (49.1%) | 973 (50.9%) |
Education in Aberdeen
School Enrollment in Aberdeen
The most common levels of schooling among the 915 students in Aberdeen are middle school (268 | 29.3%), high school (236 | 25.8%), and elementary school (232 | 25.4%).
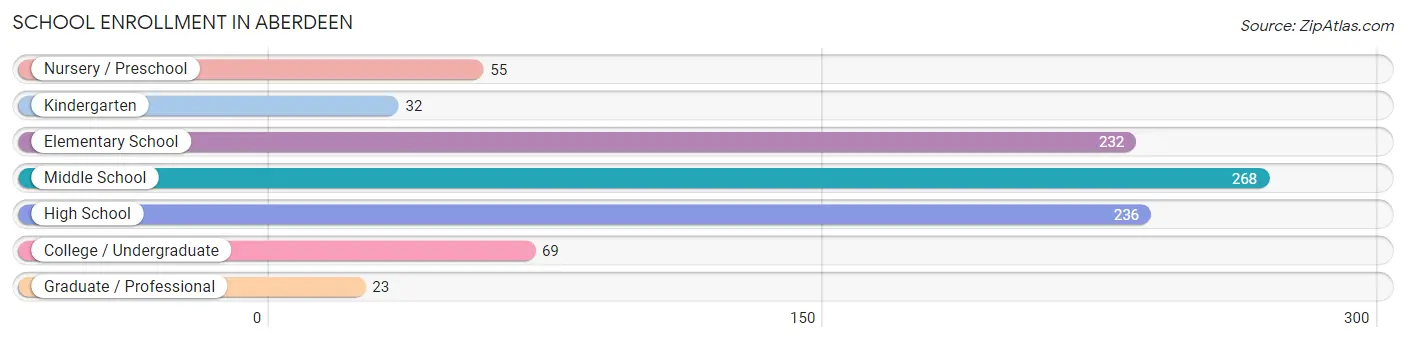
| School Level | # Students | % Students |
| Nursery / Preschool | 55 | 6.0% |
| Kindergarten | 32 | 3.5% |
| Elementary School | 232 | 25.4% |
| Middle School | 268 | 29.3% |
| High School | 236 | 25.8% |
| College / Undergraduate | 69 | 7.5% |
| Graduate / Professional | 23 | 2.5% |
| Total | 915 | 100.0% |
School Enrollment by Age by Funding Source in Aberdeen
Out of a total of 915 students who are enrolled in schools in Aberdeen, 52 (5.7%) attend a private institution, while the remaining 863 (94.3%) are enrolled in public schools. The age group of 18 to 19 year olds has the highest likelihood of being enrolled in private schools, with 16 (76.2% in the age bracket) enrolled. Conversely, the age group of 3 to 4 year olds has the lowest likelihood of being enrolled in a private school, with 55 (100.0% in the age bracket) attending a public institution.
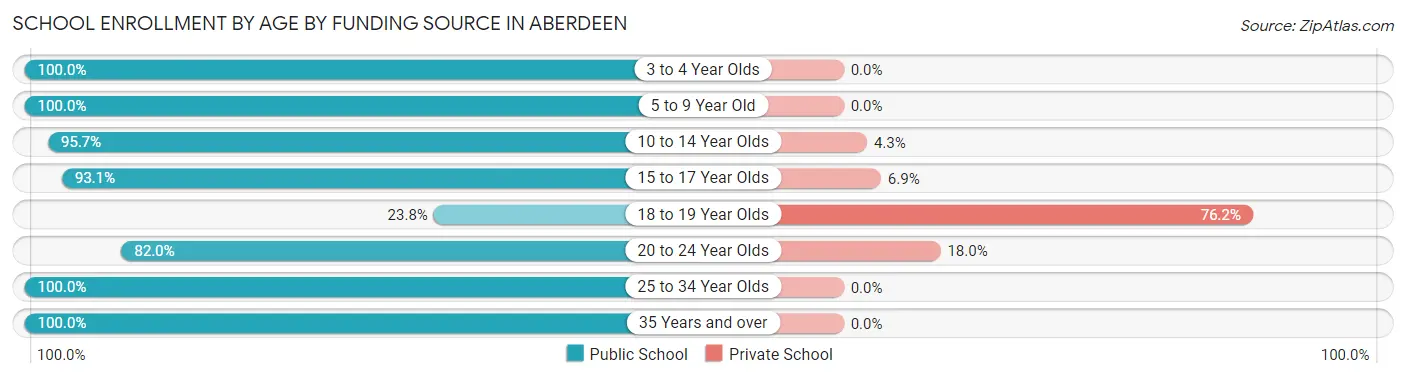
| Age Bracket | Public School | Private School |
| 3 to 4 Year Olds | 55 (100.0%) | 0 (0.0%) |
| 5 to 9 Year Old | 222 (100.0%) | 0 (0.0%) |
| 10 to 14 Year Olds | 331 (95.7%) | 15 (4.3%) |
| 15 to 17 Year Olds | 134 (93.1%) | 10 (6.9%) |
| 18 to 19 Year Olds | 5 (23.8%) | 16 (76.2%) |
| 20 to 24 Year Olds | 50 (82.0%) | 11 (18.0%) |
| 25 to 34 Year Olds | 4 (100.0%) | 0 (0.0%) |
| 35 Years and over | 62 (100.0%) | 0 (0.0%) |
| Total | 863 (94.3%) | 52 (5.7%) |
Educational Attainment by Field of Study in Aberdeen
Education (107 | 25.2%), business (102 | 24.1%), arts & humanities (48 | 11.3%), science & technology (43 | 10.1%), and computers & mathematics (37 | 8.7%) are the most common fields of study among 424 individuals in Aberdeen who have obtained a bachelor's degree or higher.
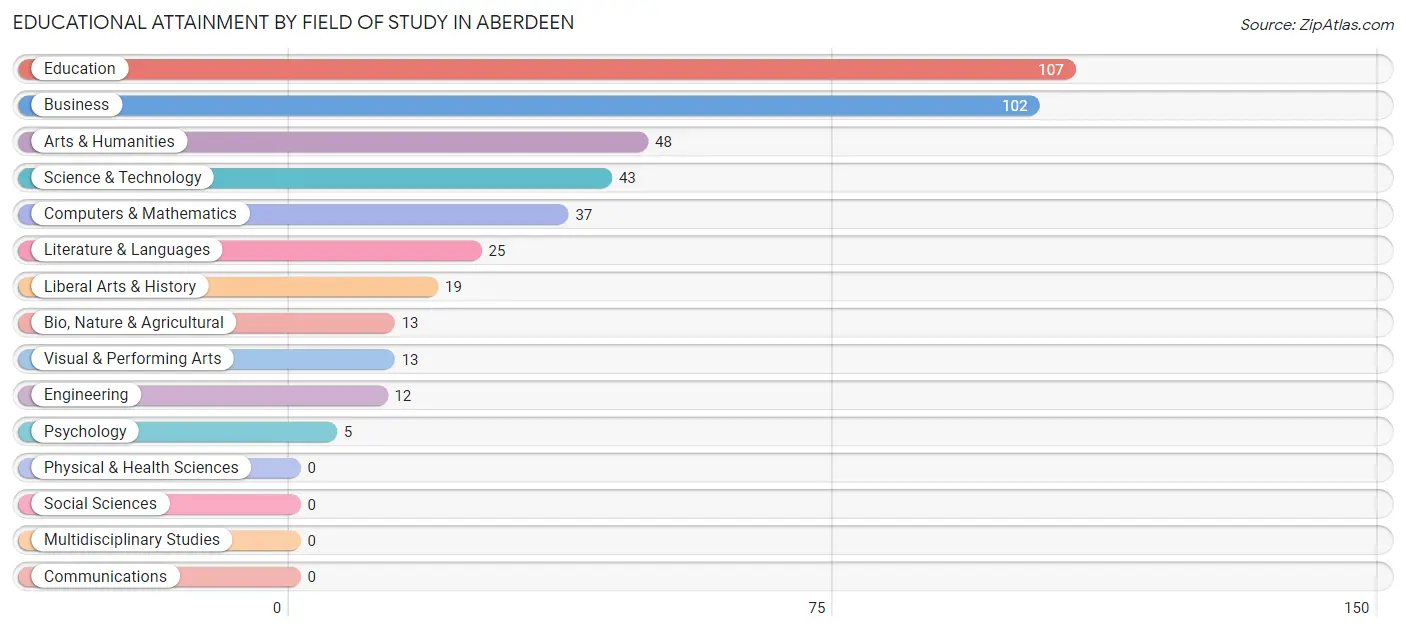
| Field of Study | # Graduates | % Graduates |
| Computers & Mathematics | 37 | 8.7% |
| Bio, Nature & Agricultural | 13 | 3.1% |
| Physical & Health Sciences | 0 | 0.0% |
| Psychology | 5 | 1.2% |
| Social Sciences | 0 | 0.0% |
| Engineering | 12 | 2.8% |
| Multidisciplinary Studies | 0 | 0.0% |
| Science & Technology | 43 | 10.1% |
| Business | 102 | 24.1% |
| Education | 107 | 25.2% |
| Literature & Languages | 25 | 5.9% |
| Liberal Arts & History | 19 | 4.5% |
| Visual & Performing Arts | 13 | 3.1% |
| Communications | 0 | 0.0% |
| Arts & Humanities | 48 | 11.3% |
| Total | 424 | 100.0% |
Transportation & Commute in Aberdeen
Vehicle Availability by Sex in Aberdeen
The most prevalent vehicle ownership categories in Aberdeen are males with 2 vehicles (334, accounting for 35.8%) and females with 2 vehicles (285, making up 34.5%).
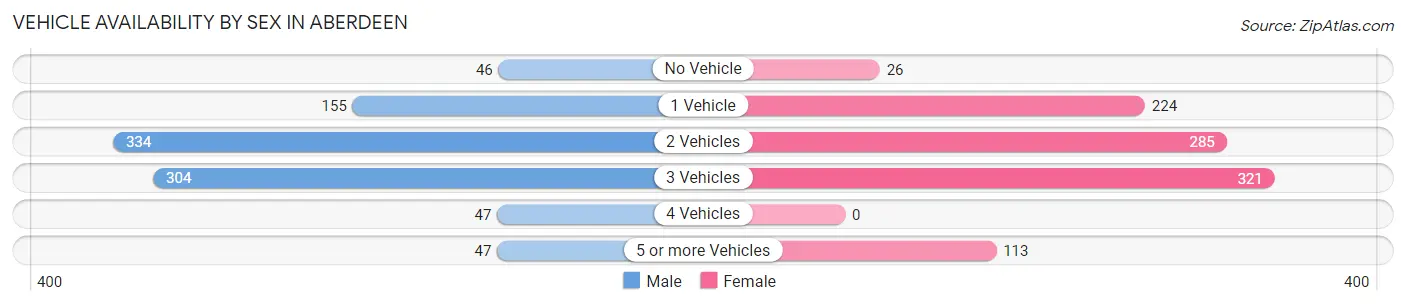
| Vehicles Available | Male | Female |
| No Vehicle | 46 (4.9%) | 26 (2.7%) |
| 1 Vehicle | 155 (16.6%) | 224 (23.1%) |
| 2 Vehicles | 334 (35.8%) | 285 (29.4%) |
| 3 Vehicles | 304 (32.6%) | 321 (33.1%) |
| 4 Vehicles | 47 (5.0%) | 0 (0.0%) |
| 5 or more Vehicles | 47 (5.0%) | 113 (11.7%) |
| Total | 933 (100.0%) | 969 (100.0%) |
Commute Time in Aberdeen
The most frequently occuring commute durations in Aberdeen are 25 to 29 minutes (423 commuters, 24.4%), 20 to 24 minutes (240 commuters, 13.9%), and 35 to 39 minutes (215 commuters, 12.4%).
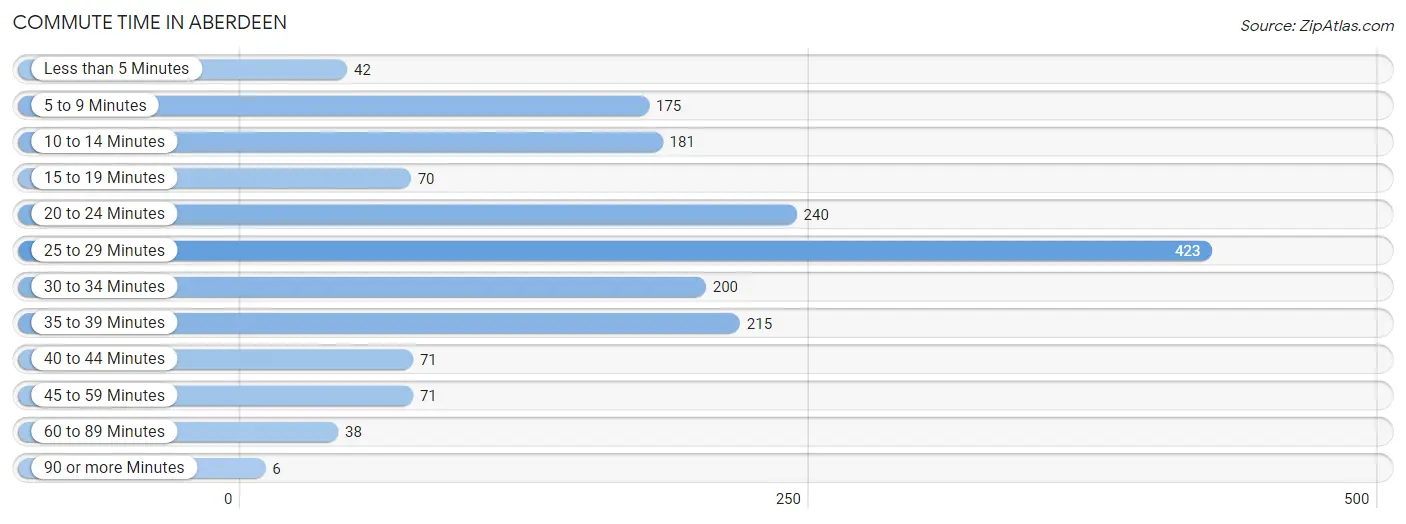
| Commute Time | # Commuters | % Commuters |
| Less than 5 Minutes | 42 | 2.4% |
| 5 to 9 Minutes | 175 | 10.1% |
| 10 to 14 Minutes | 181 | 10.4% |
| 15 to 19 Minutes | 70 | 4.0% |
| 20 to 24 Minutes | 240 | 13.9% |
| 25 to 29 Minutes | 423 | 24.4% |
| 30 to 34 Minutes | 200 | 11.6% |
| 35 to 39 Minutes | 215 | 12.4% |
| 40 to 44 Minutes | 71 | 4.1% |
| 45 to 59 Minutes | 71 | 4.1% |
| 60 to 89 Minutes | 38 | 2.2% |
| 90 or more Minutes | 6 | 0.4% |
Commute Time by Sex in Aberdeen
The most common commute times in Aberdeen are 25 to 29 minutes (243 commuters, 27.7%) for males and 25 to 29 minutes (180 commuters, 21.1%) for females.
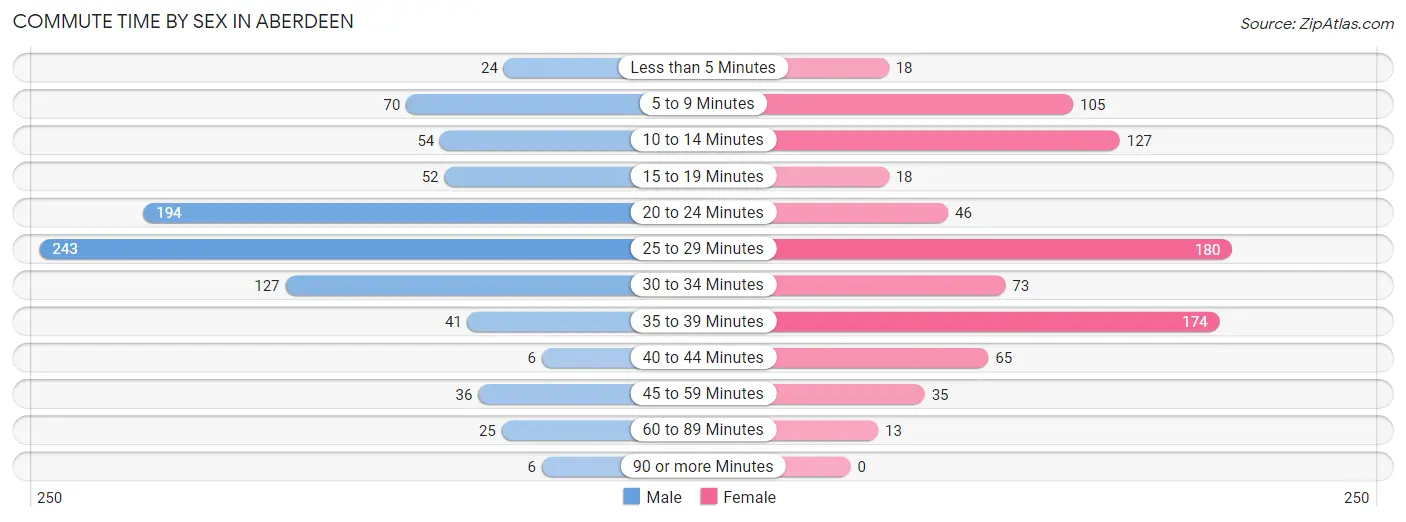
| Commute Time | Male | Female |
| Less than 5 Minutes | 24 (2.7%) | 18 (2.1%) |
| 5 to 9 Minutes | 70 (8.0%) | 105 (12.3%) |
| 10 to 14 Minutes | 54 (6.1%) | 127 (14.9%) |
| 15 to 19 Minutes | 52 (5.9%) | 18 (2.1%) |
| 20 to 24 Minutes | 194 (22.1%) | 46 (5.4%) |
| 25 to 29 Minutes | 243 (27.7%) | 180 (21.1%) |
| 30 to 34 Minutes | 127 (14.5%) | 73 (8.6%) |
| 35 to 39 Minutes | 41 (4.7%) | 174 (20.4%) |
| 40 to 44 Minutes | 6 (0.7%) | 65 (7.6%) |
| 45 to 59 Minutes | 36 (4.1%) | 35 (4.1%) |
| 60 to 89 Minutes | 25 (2.9%) | 13 (1.5%) |
| 90 or more Minutes | 6 (0.7%) | 0 (0.0%) |
Time of Departure to Work by Sex in Aberdeen
The most frequent times of departure to work in Aberdeen are 6:00 AM to 6:29 AM (268, 30.5%) for males and 8:00 AM to 8:29 AM (176, 20.6%) for females.
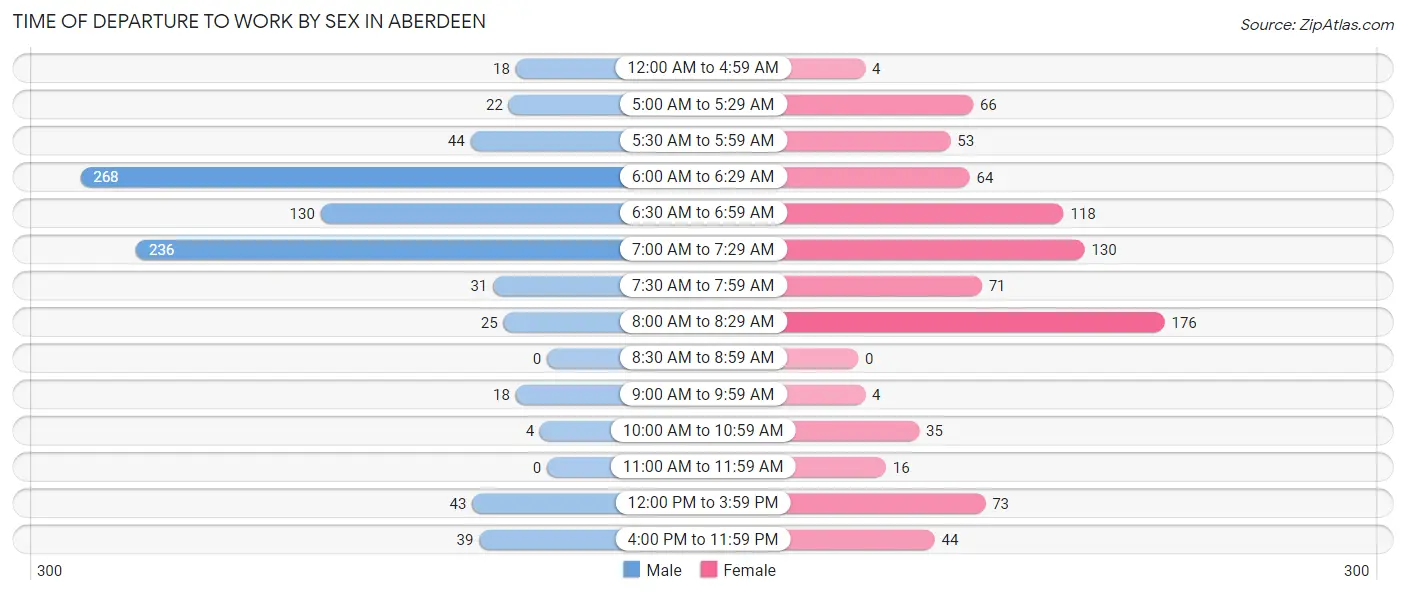
| Time of Departure | Male | Female |
| 12:00 AM to 4:59 AM | 18 (2.1%) | 4 (0.5%) |
| 5:00 AM to 5:29 AM | 22 (2.5%) | 66 (7.7%) |
| 5:30 AM to 5:59 AM | 44 (5.0%) | 53 (6.2%) |
| 6:00 AM to 6:29 AM | 268 (30.5%) | 64 (7.5%) |
| 6:30 AM to 6:59 AM | 130 (14.8%) | 118 (13.8%) |
| 7:00 AM to 7:29 AM | 236 (26.9%) | 130 (15.2%) |
| 7:30 AM to 7:59 AM | 31 (3.5%) | 71 (8.3%) |
| 8:00 AM to 8:29 AM | 25 (2.9%) | 176 (20.6%) |
| 8:30 AM to 8:59 AM | 0 (0.0%) | 0 (0.0%) |
| 9:00 AM to 9:59 AM | 18 (2.1%) | 4 (0.5%) |
| 10:00 AM to 10:59 AM | 4 (0.5%) | 35 (4.1%) |
| 11:00 AM to 11:59 AM | 0 (0.0%) | 16 (1.9%) |
| 12:00 PM to 3:59 PM | 43 (4.9%) | 73 (8.6%) |
| 4:00 PM to 11:59 PM | 39 (4.4%) | 44 (5.1%) |
| Total | 878 (100.0%) | 854 (100.0%) |
Housing Occupancy in Aberdeen
Occupancy by Ownership in Aberdeen
Of the total 1,977 dwellings in Aberdeen, owner-occupied units account for 1,178 (59.6%), while renter-occupied units make up 799 (40.4%).
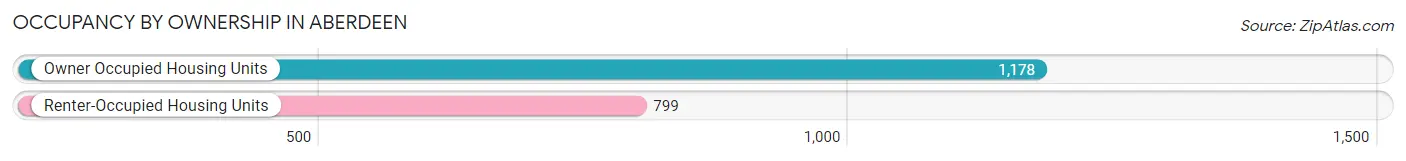
| Occupancy | # Housing Units | % Housing Units |
| Owner Occupied Housing Units | 1,178 | 59.6% |
| Renter-Occupied Housing Units | 799 | 40.4% |
| Total Occupied Housing Units | 1,977 | 100.0% |
Occupancy by Household Size in Aberdeen
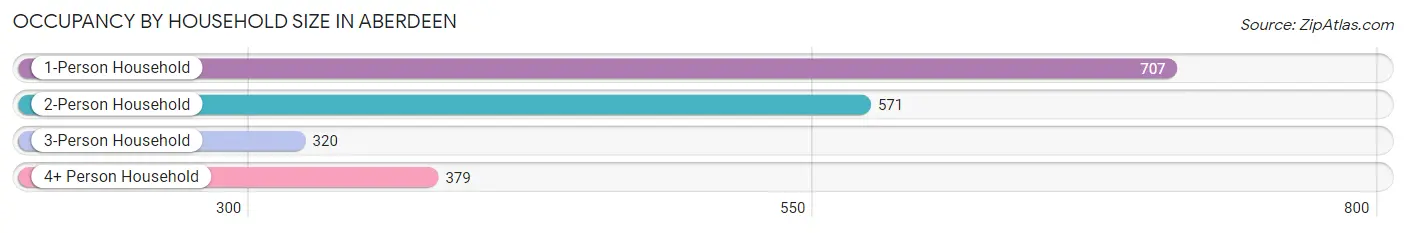
| Household Size | # Housing Units | % Housing Units |
| 1-Person Household | 707 | 35.8% |
| 2-Person Household | 571 | 28.9% |
| 3-Person Household | 320 | 16.2% |
| 4+ Person Household | 379 | 19.2% |
| Total Housing Units | 1,977 | 100.0% |
Occupancy by Ownership by Household Size in Aberdeen
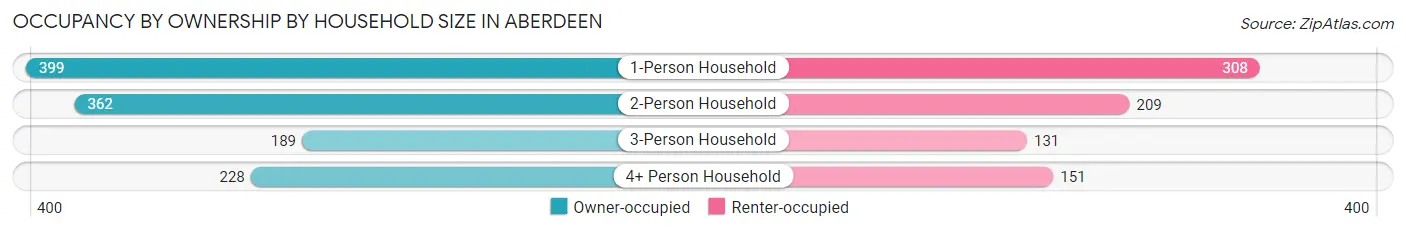
| Household Size | Owner-occupied | Renter-occupied |
| 1-Person Household | 399 (56.4%) | 308 (43.6%) |
| 2-Person Household | 362 (63.4%) | 209 (36.6%) |
| 3-Person Household | 189 (59.1%) | 131 (40.9%) |
| 4+ Person Household | 228 (60.2%) | 151 (39.8%) |
| Total Housing Units | 1,178 (59.6%) | 799 (40.4%) |
Occupancy by Educational Attainment in Aberdeen
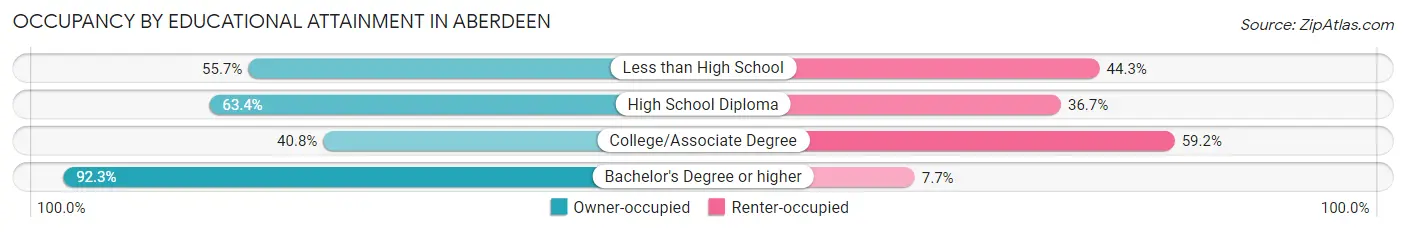
| Household Size | Owner-occupied | Renter-occupied |
| Less than High School | 225 (55.7%) | 179 (44.3%) |
| High School Diploma | 534 (63.3%) | 309 (36.6%) |
| College/Associate Degree | 202 (40.8%) | 293 (59.2%) |
| Bachelor's Degree or higher | 217 (92.3%) | 18 (7.7%) |
Occupancy by Age of Householder in Aberdeen
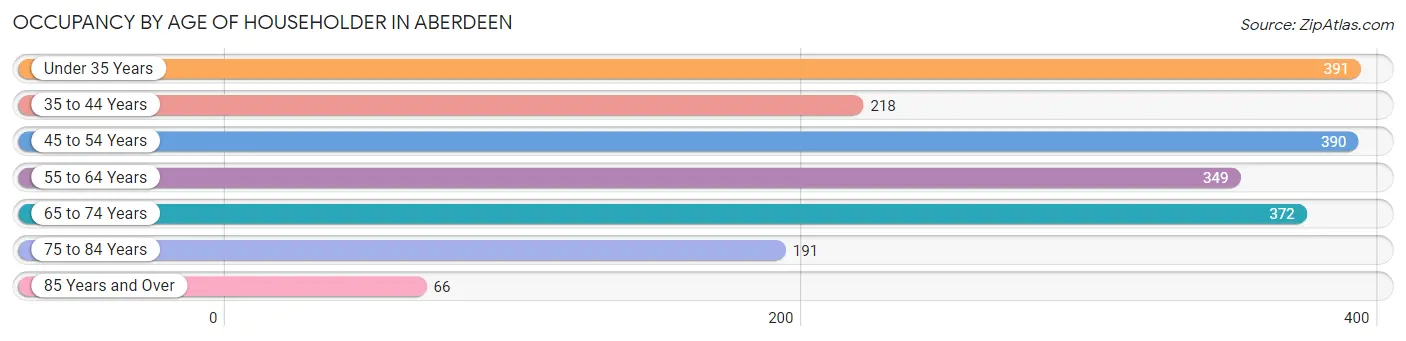
| Age Bracket | # Households | % Households |
| Under 35 Years | 391 | 19.8% |
| 35 to 44 Years | 218 | 11.0% |
| 45 to 54 Years | 390 | 19.7% |
| 55 to 64 Years | 349 | 17.6% |
| 65 to 74 Years | 372 | 18.8% |
| 75 to 84 Years | 191 | 9.7% |
| 85 Years and Over | 66 | 3.3% |
| Total | 1,977 | 100.0% |
Housing Finances in Aberdeen
Median Income by Occupancy in Aberdeen
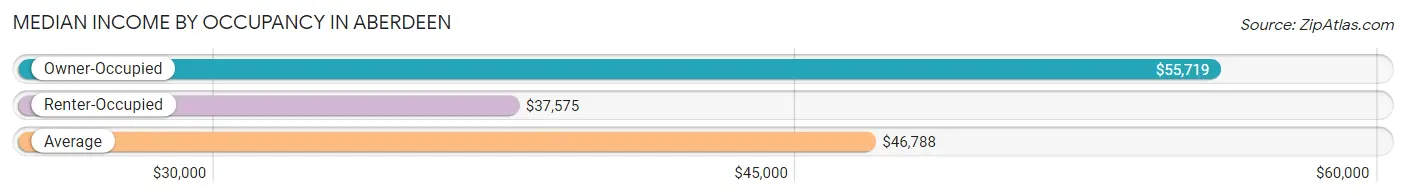
| Occupancy Type | # Households | Median Income |
| Owner-Occupied | 1,178 (59.6%) | $55,719 |
| Renter-Occupied | 799 (40.4%) | $37,575 |
| Average | 1,977 (100.0%) | $46,788 |
Occupancy by Householder Income Bracket in Aberdeen
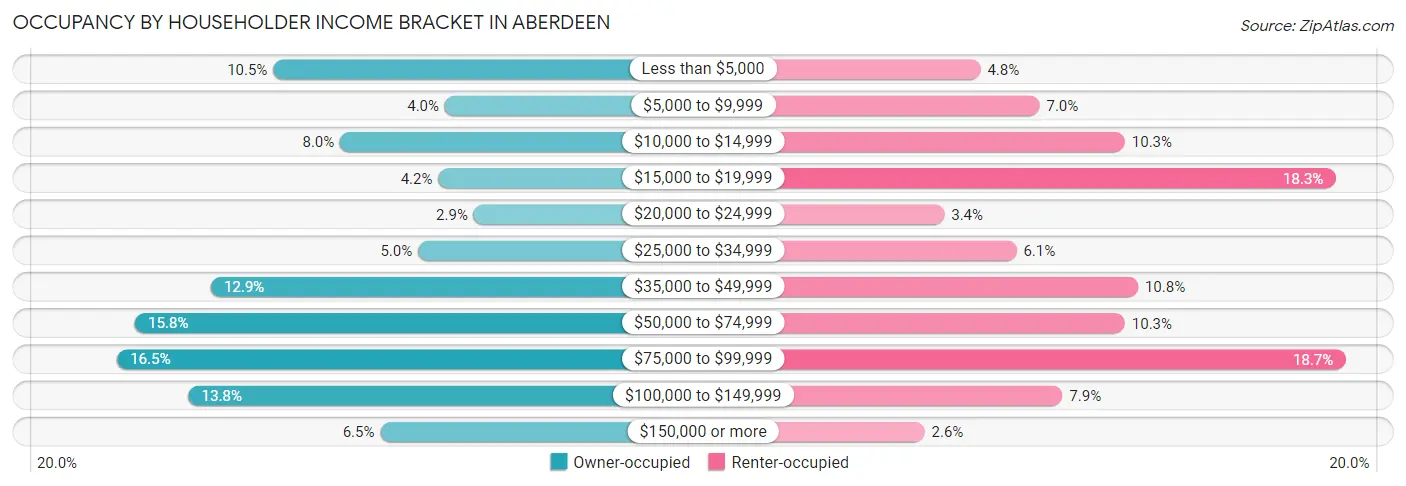
| Income Bracket | Owner-occupied | Renter-occupied |
| Less than $5,000 | 124 (10.5%) | 38 (4.8%) |
| $5,000 to $9,999 | 47 (4.0%) | 56 (7.0%) |
| $10,000 to $14,999 | 94 (8.0%) | 82 (10.3%) |
| $15,000 to $19,999 | 50 (4.2%) | 146 (18.3%) |
| $20,000 to $24,999 | 34 (2.9%) | 27 (3.4%) |
| $25,000 to $34,999 | 59 (5.0%) | 49 (6.1%) |
| $35,000 to $49,999 | 152 (12.9%) | 86 (10.8%) |
| $50,000 to $74,999 | 186 (15.8%) | 82 (10.3%) |
| $75,000 to $99,999 | 194 (16.5%) | 149 (18.6%) |
| $100,000 to $149,999 | 162 (13.8%) | 63 (7.9%) |
| $150,000 or more | 76 (6.5%) | 21 (2.6%) |
| Total | 1,178 (100.0%) | 799 (100.0%) |
Monthly Housing Cost Tiers in Aberdeen
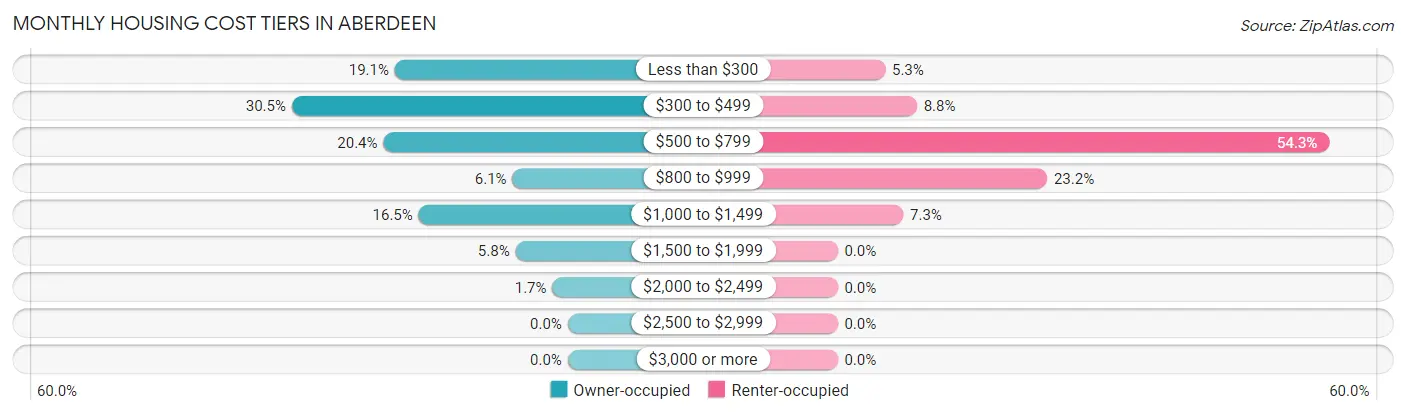
| Monthly Cost | Owner-occupied | Renter-occupied |
| Less than $300 | 225 (19.1%) | 42 (5.3%) |
| $300 to $499 | 359 (30.5%) | 70 (8.8%) |
| $500 to $799 | 240 (20.4%) | 434 (54.3%) |
| $800 to $999 | 72 (6.1%) | 185 (23.2%) |
| $1,000 to $1,499 | 194 (16.5%) | 58 (7.3%) |
| $1,500 to $1,999 | 68 (5.8%) | 0 (0.0%) |
| $2,000 to $2,499 | 20 (1.7%) | 0 (0.0%) |
| $2,500 to $2,999 | 0 (0.0%) | 0 (0.0%) |
| $3,000 or more | 0 (0.0%) | 0 (0.0%) |
| Total | 1,178 (100.0%) | 799 (100.0%) |
Physical Housing Characteristics in Aberdeen
Housing Structures in Aberdeen
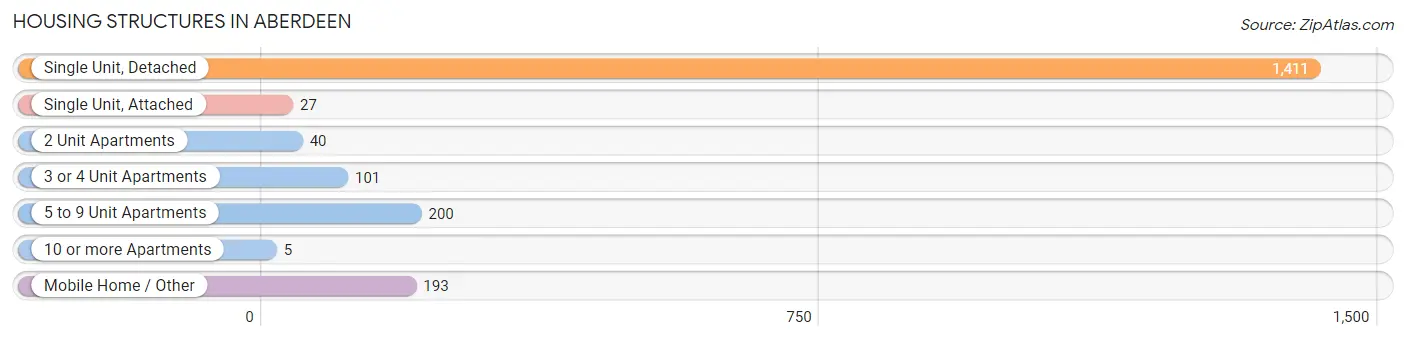
| Structure Type | # Housing Units | % Housing Units |
| Single Unit, Detached | 1,411 | 71.4% |
| Single Unit, Attached | 27 | 1.4% |
| 2 Unit Apartments | 40 | 2.0% |
| 3 or 4 Unit Apartments | 101 | 5.1% |
| 5 to 9 Unit Apartments | 200 | 10.1% |
| 10 or more Apartments | 5 | 0.3% |
| Mobile Home / Other | 193 | 9.8% |
| Total | 1,977 | 100.0% |
Housing Structures by Occupancy in Aberdeen
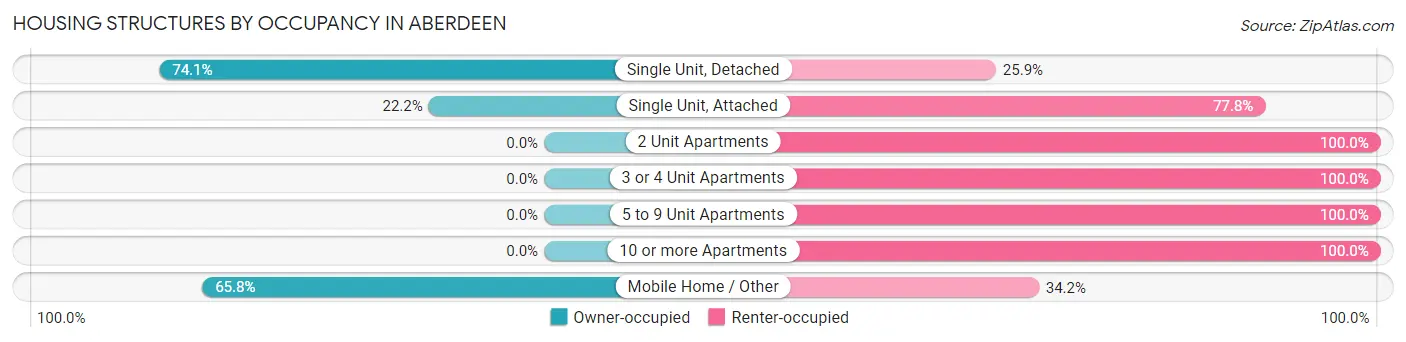
| Structure Type | Owner-occupied | Renter-occupied |
| Single Unit, Detached | 1,045 (74.1%) | 366 (25.9%) |
| Single Unit, Attached | 6 (22.2%) | 21 (77.8%) |
| 2 Unit Apartments | 0 (0.0%) | 40 (100.0%) |
| 3 or 4 Unit Apartments | 0 (0.0%) | 101 (100.0%) |
| 5 to 9 Unit Apartments | 0 (0.0%) | 200 (100.0%) |
| 10 or more Apartments | 0 (0.0%) | 5 (100.0%) |
| Mobile Home / Other | 127 (65.8%) | 66 (34.2%) |
| Total | 1,178 (59.6%) | 799 (40.4%) |
Housing Structures by Number of Rooms in Aberdeen
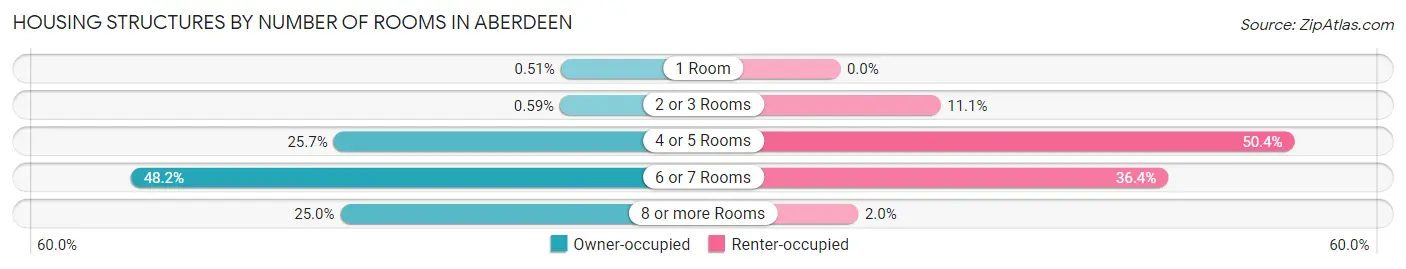
| Number of Rooms | Owner-occupied | Renter-occupied |
| 1 Room | 6 (0.5%) | 0 (0.0%) |
| 2 or 3 Rooms | 7 (0.6%) | 89 (11.1%) |
| 4 or 5 Rooms | 303 (25.7%) | 403 (50.4%) |
| 6 or 7 Rooms | 568 (48.2%) | 291 (36.4%) |
| 8 or more Rooms | 294 (25.0%) | 16 (2.0%) |
| Total | 1,178 (100.0%) | 799 (100.0%) |
Housing Structure by Heating Type in Aberdeen
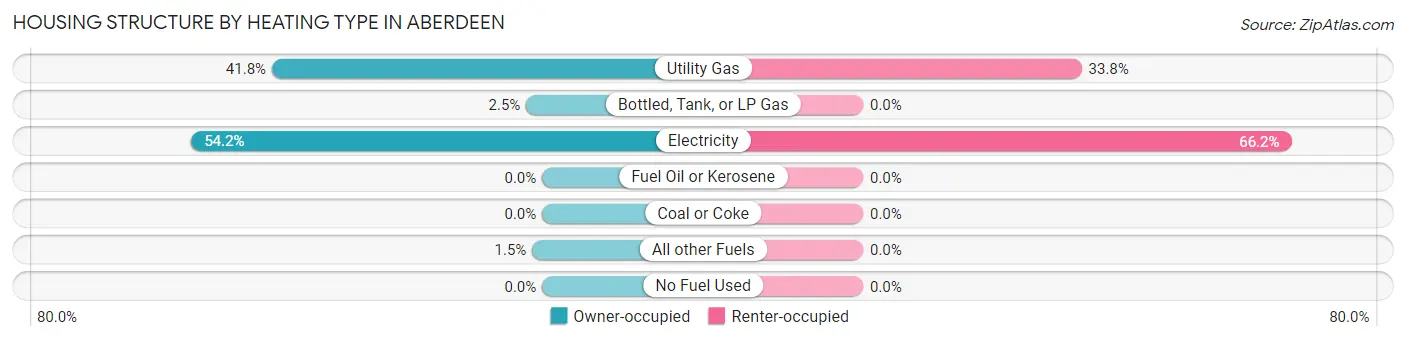
| Heating Type | Owner-occupied | Renter-occupied |
| Utility Gas | 492 (41.8%) | 270 (33.8%) |
| Bottled, Tank, or LP Gas | 29 (2.5%) | 0 (0.0%) |
| Electricity | 639 (54.2%) | 529 (66.2%) |
| Fuel Oil or Kerosene | 0 (0.0%) | 0 (0.0%) |
| Coal or Coke | 0 (0.0%) | 0 (0.0%) |
| All other Fuels | 18 (1.5%) | 0 (0.0%) |
| No Fuel Used | 0 (0.0%) | 0 (0.0%) |
| Total | 1,178 (100.0%) | 799 (100.0%) |
Household Vehicle Usage in Aberdeen
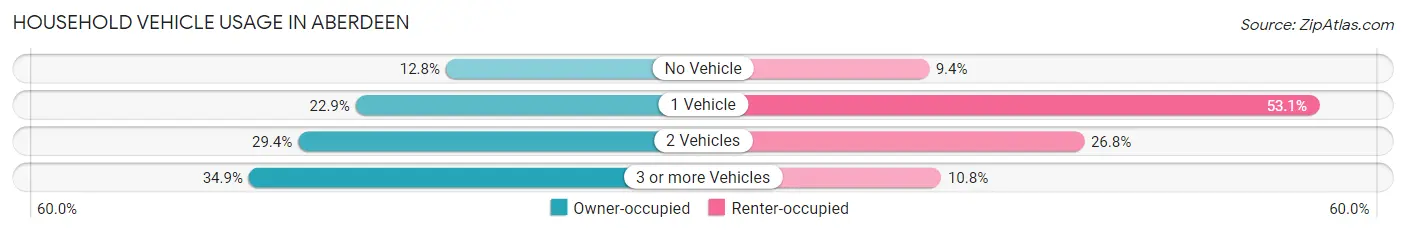
| Vehicles per Household | Owner-occupied | Renter-occupied |
| No Vehicle | 151 (12.8%) | 75 (9.4%) |
| 1 Vehicle | 270 (22.9%) | 424 (53.1%) |
| 2 Vehicles | 346 (29.4%) | 214 (26.8%) |
| 3 or more Vehicles | 411 (34.9%) | 86 (10.8%) |
| Total | 1,178 (100.0%) | 799 (100.0%) |
Real Estate & Mortgages in Aberdeen
Real Estate and Mortgage Overview in Aberdeen
| Characteristic | Without Mortgage | With Mortgage |
| Housing Units | 669 | 509 |
| Median Property Value | $74,000 | $114,500 |
| Median Household Income | $45,975 | $41 |
| Monthly Housing Costs | $393 | $0 |
| Real Estate Taxes | $489 | $188 |
Property Value by Mortgage Status in Aberdeen
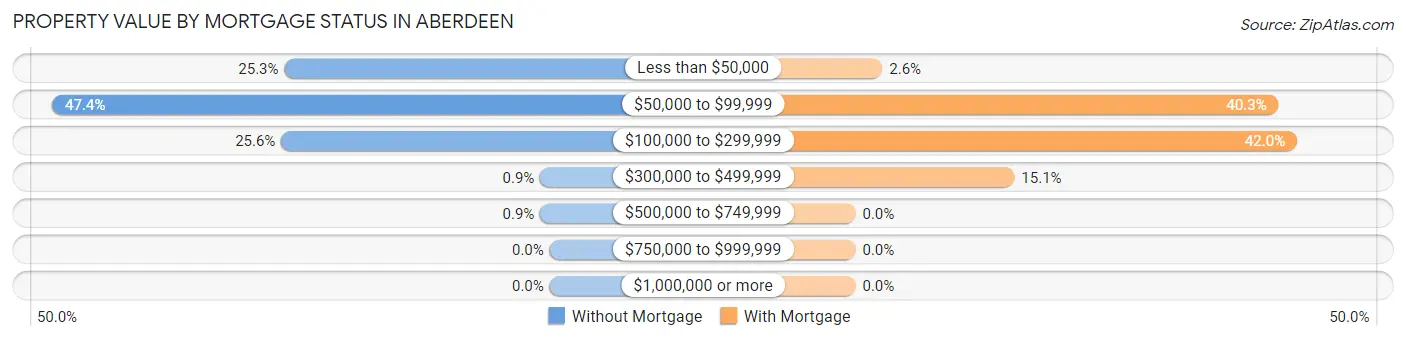
| Property Value | Without Mortgage | With Mortgage |
| Less than $50,000 | 169 (25.3%) | 13 (2.5%) |
| $50,000 to $99,999 | 317 (47.4%) | 205 (40.3%) |
| $100,000 to $299,999 | 171 (25.6%) | 214 (42.0%) |
| $300,000 to $499,999 | 6 (0.9%) | 77 (15.1%) |
| $500,000 to $749,999 | 6 (0.9%) | 0 (0.0%) |
| $750,000 to $999,999 | 0 (0.0%) | 0 (0.0%) |
| $1,000,000 or more | 0 (0.0%) | 0 (0.0%) |
| Total | 669 (100.0%) | 509 (100.0%) |
Household Income by Mortgage Status in Aberdeen
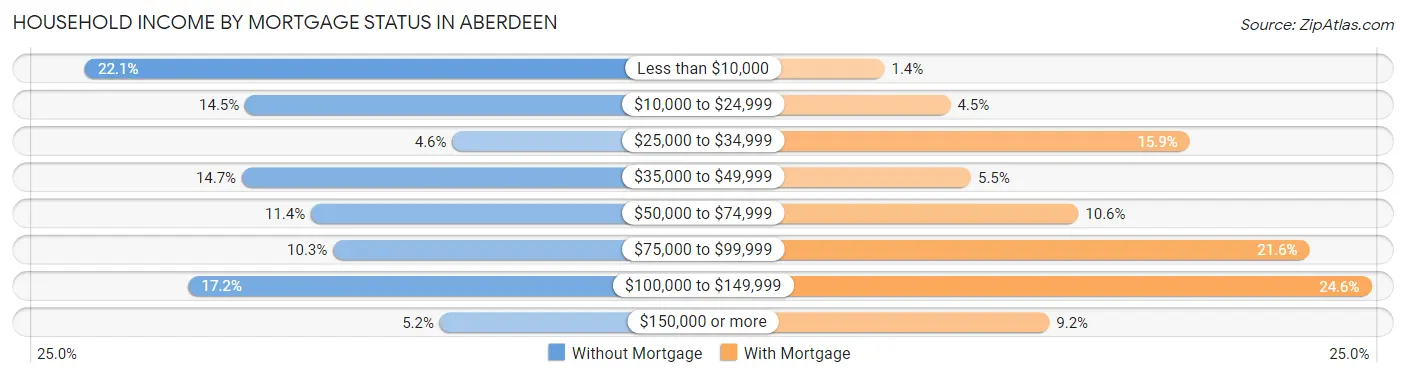
| Household Income | Without Mortgage | With Mortgage |
| Less than $10,000 | 148 (22.1%) | 7 (1.4%) |
| $10,000 to $24,999 | 97 (14.5%) | 23 (4.5%) |
| $25,000 to $34,999 | 31 (4.6%) | 81 (15.9%) |
| $35,000 to $49,999 | 98 (14.6%) | 28 (5.5%) |
| $50,000 to $74,999 | 76 (11.4%) | 54 (10.6%) |
| $75,000 to $99,999 | 69 (10.3%) | 110 (21.6%) |
| $100,000 to $149,999 | 115 (17.2%) | 125 (24.6%) |
| $150,000 or more | 35 (5.2%) | 47 (9.2%) |
| Total | 669 (100.0%) | 509 (100.0%) |
Property Value to Household Income Ratio in Aberdeen
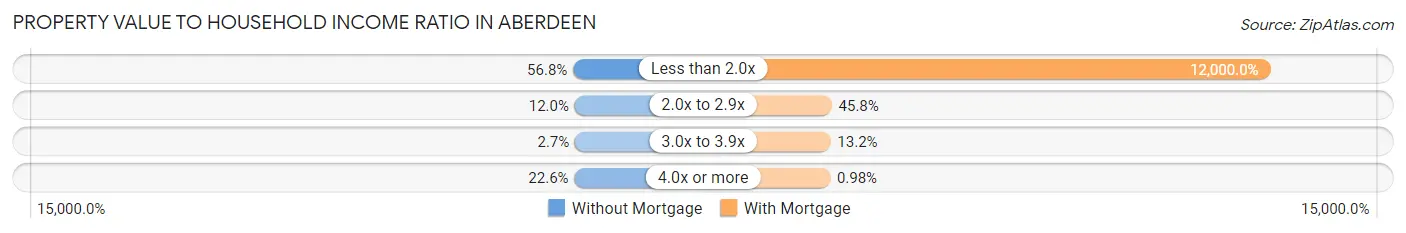
| Value-to-Income Ratio | Without Mortgage | With Mortgage |
| Less than 2.0x | 380 (56.8%) | 61,080 (12,000.0%) |
| 2.0x to 2.9x | 80 (12.0%) | 233 (45.8%) |
| 3.0x to 3.9x | 18 (2.7%) | 67 (13.2%) |
| 4.0x or more | 151 (22.6%) | 5 (1.0%) |
| Total | 669 (100.0%) | 509 (100.0%) |
Real Estate Taxes by Mortgage Status in Aberdeen
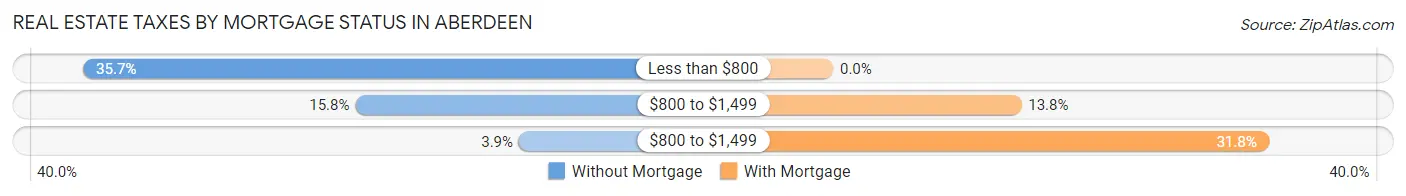
| Property Taxes | Without Mortgage | With Mortgage |
| Less than $800 | 239 (35.7%) | 0 (0.0%) |
| $800 to $1,499 | 106 (15.8%) | 70 (13.8%) |
| $800 to $1,499 | 26 (3.9%) | 162 (31.8%) |
| Total | 669 (100.0%) | 509 (100.0%) |
Health & Disability in Aberdeen
Health Insurance Coverage by Age in Aberdeen
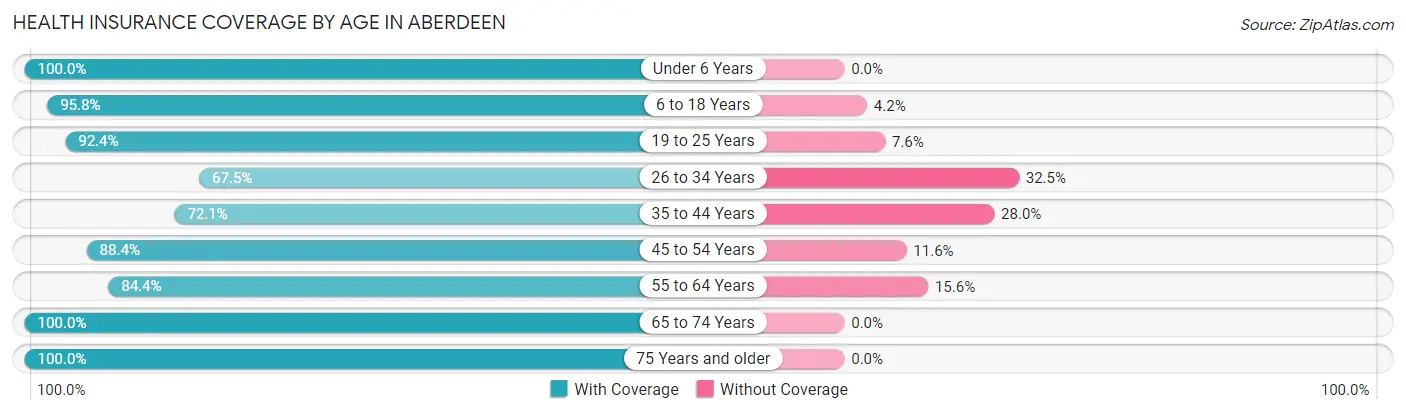
| Age Bracket | With Coverage | Without Coverage |
| Under 6 Years | 296 (100.0%) | 0 (0.0%) |
| 6 to 18 Years | 704 (95.8%) | 31 (4.2%) |
| 19 to 25 Years | 365 (92.4%) | 30 (7.6%) |
| 26 to 34 Years | 452 (67.5%) | 218 (32.5%) |
| 35 to 44 Years | 348 (72.1%) | 135 (28.0%) |
| 45 to 54 Years | 504 (88.4%) | 66 (11.6%) |
| 55 to 64 Years | 530 (84.4%) | 98 (15.6%) |
| 65 to 74 Years | 574 (100.0%) | 0 (0.0%) |
| 75 Years and older | 350 (100.0%) | 0 (0.0%) |
| Total | 4,123 (87.7%) | 578 (12.3%) |
Health Insurance Coverage by Citizenship Status in Aberdeen
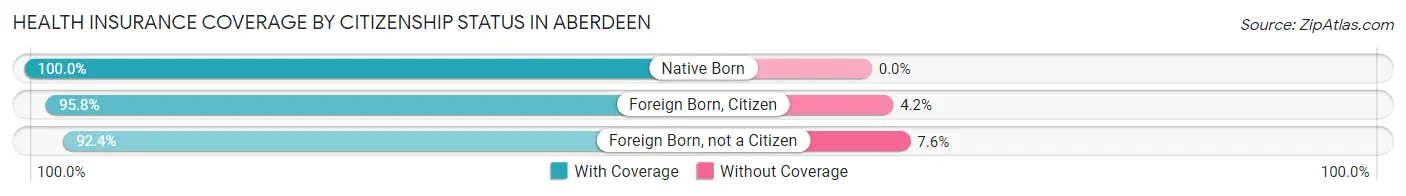
| Citizenship Status | With Coverage | Without Coverage |
| Native Born | 296 (100.0%) | 0 (0.0%) |
| Foreign Born, Citizen | 704 (95.8%) | 31 (4.2%) |
| Foreign Born, not a Citizen | 365 (92.4%) | 30 (7.6%) |
Health Insurance Coverage by Household Income in Aberdeen
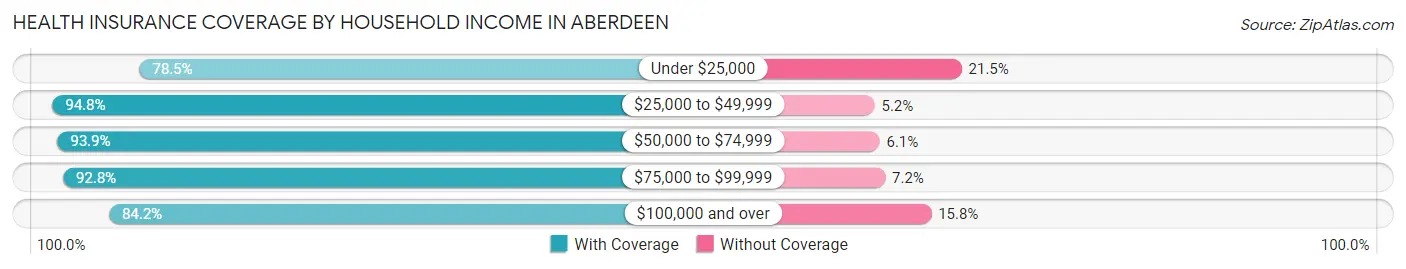
| Household Income | With Coverage | Without Coverage |
| Under $25,000 | 1,040 (78.5%) | 285 (21.5%) |
| $25,000 to $49,999 | 675 (94.8%) | 37 (5.2%) |
| $50,000 to $74,999 | 810 (93.9%) | 53 (6.1%) |
| $75,000 to $99,999 | 879 (92.8%) | 68 (7.2%) |
| $100,000 and over | 719 (84.2%) | 135 (15.8%) |
Public vs Private Health Insurance Coverage by Age in Aberdeen
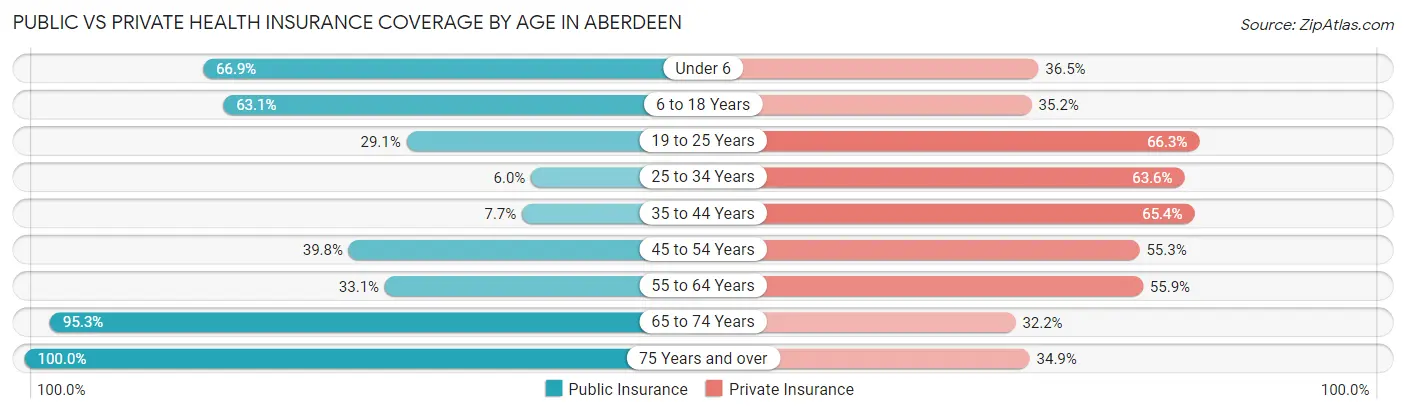
| Age Bracket | Public Insurance | Private Insurance |
| Under 6 | 198 (66.9%) | 108 (36.5%) |
| 6 to 18 Years | 464 (63.1%) | 259 (35.2%) |
| 19 to 25 Years | 115 (29.1%) | 262 (66.3%) |
| 25 to 34 Years | 40 (6.0%) | 426 (63.6%) |
| 35 to 44 Years | 37 (7.7%) | 316 (65.4%) |
| 45 to 54 Years | 227 (39.8%) | 315 (55.3%) |
| 55 to 64 Years | 208 (33.1%) | 351 (55.9%) |
| 65 to 74 Years | 547 (95.3%) | 185 (32.2%) |
| 75 Years and over | 350 (100.0%) | 122 (34.9%) |
| Total | 2,186 (46.5%) | 2,344 (49.9%) |
Disability Status by Sex by Age in Aberdeen
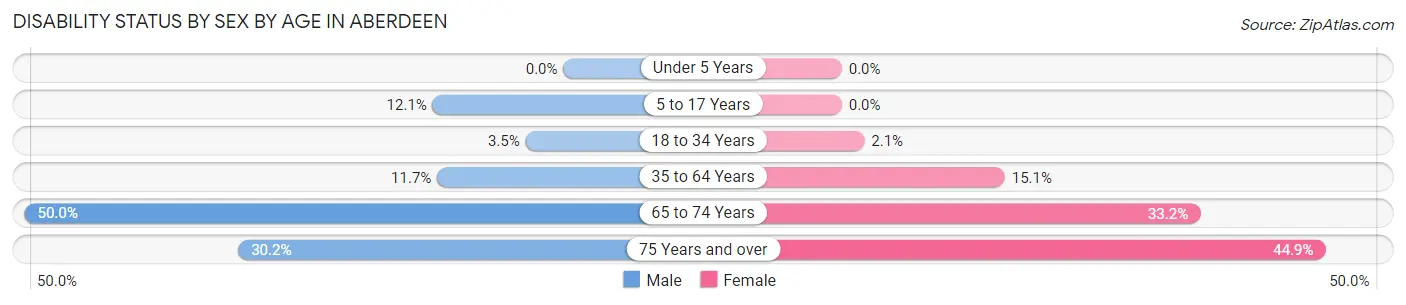
| Age Bracket | Male | Female |
| Under 5 Years | 0 (0.0%) | 0 (0.0%) |
| 5 to 17 Years | 62 (12.1%) | 0 (0.0%) |
| 18 to 34 Years | 18 (3.5%) | 12 (2.1%) |
| 35 to 64 Years | 104 (11.7%) | 120 (15.1%) |
| 65 to 74 Years | 102 (50.0%) | 123 (33.2%) |
| 75 Years and over | 35 (30.2%) | 105 (44.9%) |
Disability Class by Sex by Age in Aberdeen
Disability Class: Hearing Difficulty
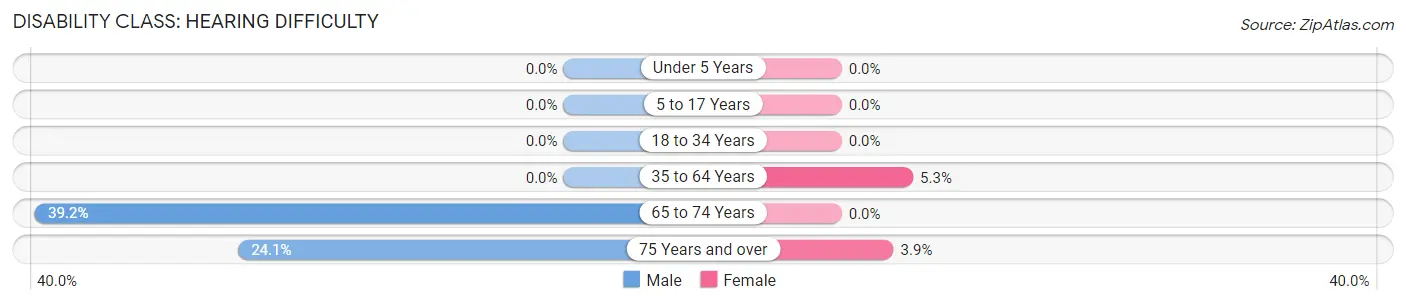
| Age Bracket | Male | Female |
| Under 5 Years | 0 (0.0%) | 0 (0.0%) |
| 5 to 17 Years | 0 (0.0%) | 0 (0.0%) |
| 18 to 34 Years | 0 (0.0%) | 0 (0.0%) |
| 35 to 64 Years | 0 (0.0%) | 42 (5.3%) |
| 65 to 74 Years | 80 (39.2%) | 0 (0.0%) |
| 75 Years and over | 28 (24.1%) | 9 (3.8%) |
Disability Class: Vision Difficulty
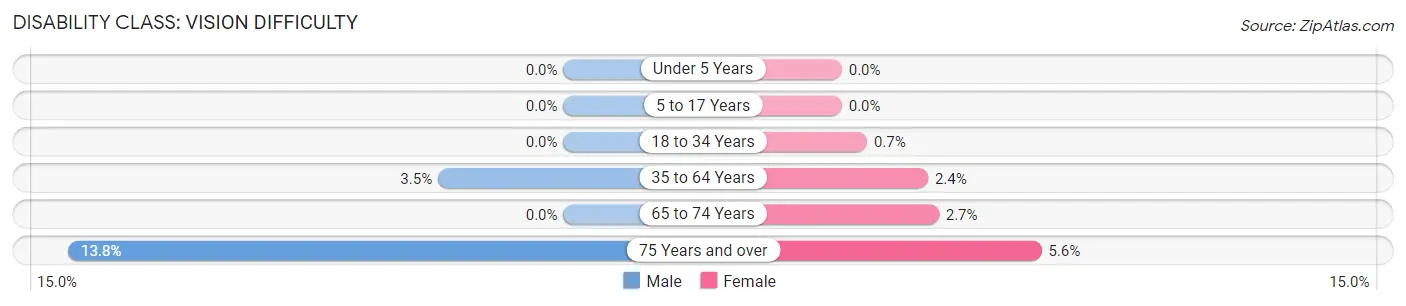
| Age Bracket | Male | Female |
| Under 5 Years | 0 (0.0%) | 0 (0.0%) |
| 5 to 17 Years | 0 (0.0%) | 0 (0.0%) |
| 18 to 34 Years | 0 (0.0%) | 4 (0.7%) |
| 35 to 64 Years | 31 (3.5%) | 19 (2.4%) |
| 65 to 74 Years | 0 (0.0%) | 10 (2.7%) |
| 75 Years and over | 16 (13.8%) | 13 (5.6%) |
Disability Class: Cognitive Difficulty
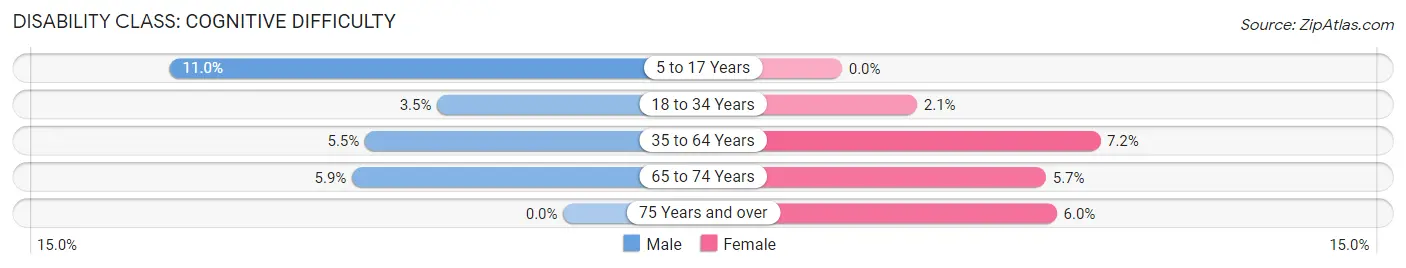
| Age Bracket | Male | Female |
| 5 to 17 Years | 56 (11.0%) | 0 (0.0%) |
| 18 to 34 Years | 18 (3.5%) | 12 (2.1%) |
| 35 to 64 Years | 49 (5.5%) | 57 (7.2%) |
| 65 to 74 Years | 12 (5.9%) | 21 (5.7%) |
| 75 Years and over | 0 (0.0%) | 14 (6.0%) |
Disability Class: Ambulatory Difficulty
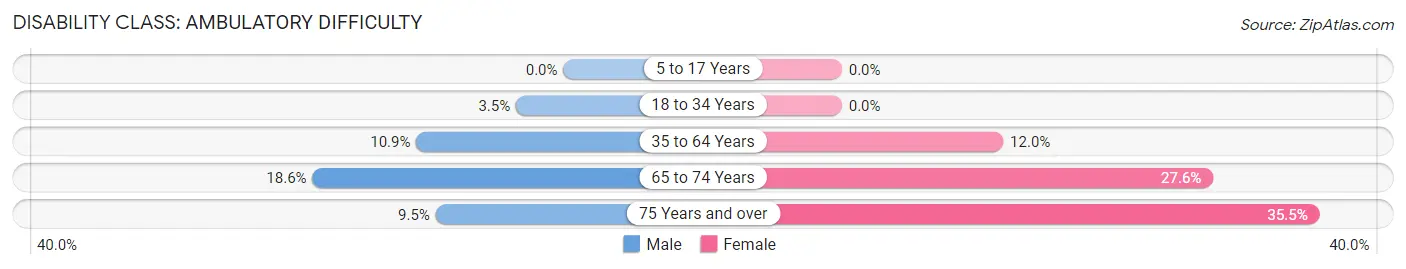
| Age Bracket | Male | Female |
| 5 to 17 Years | 0 (0.0%) | 0 (0.0%) |
| 18 to 34 Years | 18 (3.5%) | 0 (0.0%) |
| 35 to 64 Years | 97 (10.9%) | 95 (12.0%) |
| 65 to 74 Years | 38 (18.6%) | 102 (27.6%) |
| 75 Years and over | 11 (9.5%) | 83 (35.5%) |
Disability Class: Self-Care Difficulty
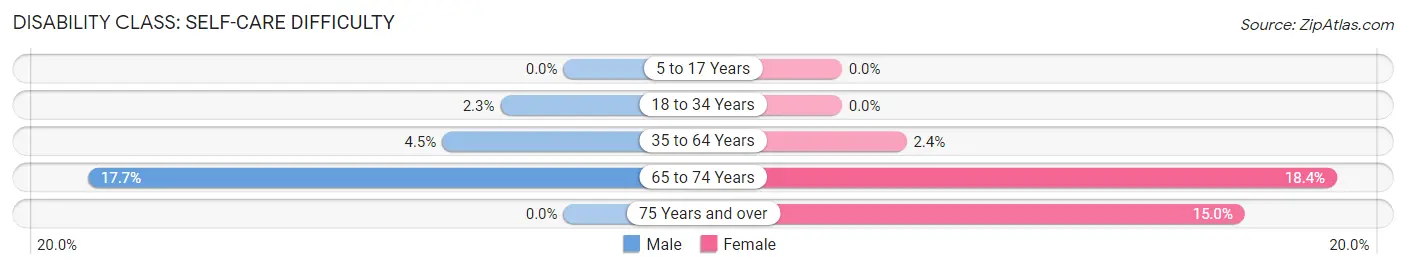
| Age Bracket | Male | Female |
| 5 to 17 Years | 0 (0.0%) | 0 (0.0%) |
| 18 to 34 Years | 12 (2.3%) | 0 (0.0%) |
| 35 to 64 Years | 40 (4.5%) | 19 (2.4%) |
| 65 to 74 Years | 36 (17.6%) | 68 (18.4%) |
| 75 Years and over | 0 (0.0%) | 35 (15.0%) |
Technology Access in Aberdeen
Computing Device Access in Aberdeen
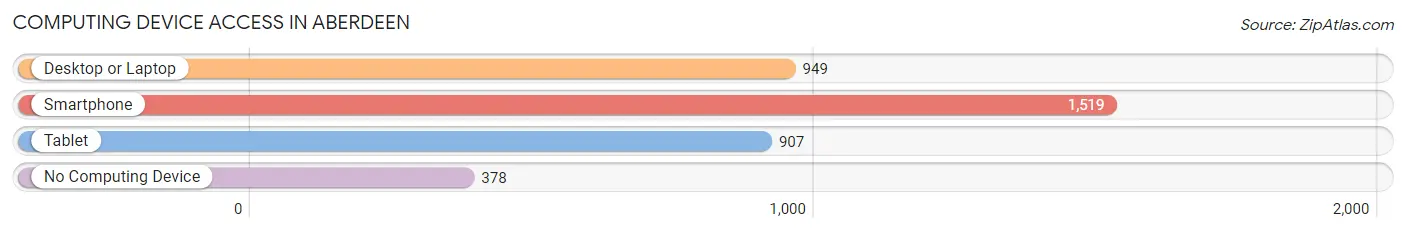
| Device Type | # Households | % Households |
| Desktop or Laptop | 949 | 48.0% |
| Smartphone | 1,519 | 76.8% |
| Tablet | 907 | 45.9% |
| No Computing Device | 378 | 19.1% |
| Total | 1,977 | 100.0% |
Internet Access in Aberdeen
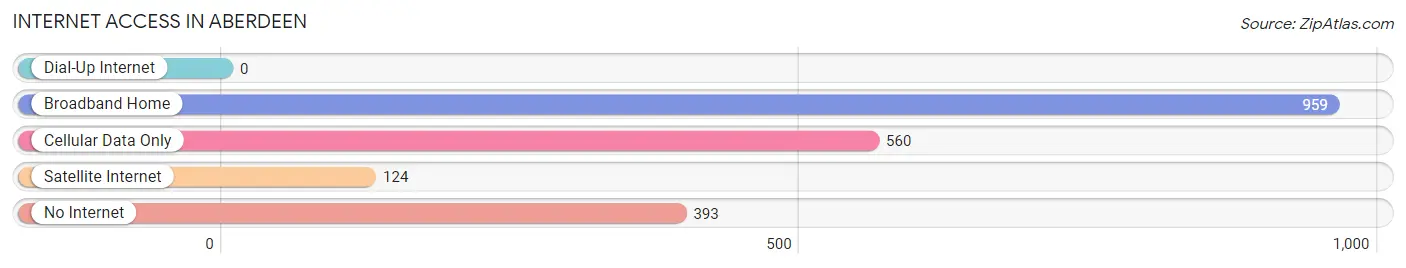
| Internet Type | # Households | % Households |
| Dial-Up Internet | 0 | 0.0% |
| Broadband Home | 959 | 48.5% |
| Cellular Data Only | 560 | 28.3% |
| Satellite Internet | 124 | 6.3% |
| No Internet | 393 | 19.9% |
| Total | 1,977 | 100.0% |
Aberdeen Summary
Aberdeen is a city located in Monroe County, Mississippi, United States. It is the county seat of Monroe County and is located in the northeastern part of the state. The population of Aberdeen was 5,612 at the 2010 census.
History
Aberdeen was founded in 1837 by a group of settlers from North Carolina. The town was named after Aberdeen, Scotland, and was incorporated in 1848. The town was originally located on the banks of the Tombigbee River, but was moved to its current location in 1854 due to flooding.
During the Civil War, Aberdeen was a major supply depot for the Confederate Army. The town was also the site of a major battle in 1864, when Union forces attempted to capture the town. The Union forces were unsuccessful, and the town remained in Confederate hands until the end of the war.
After the Civil War, Aberdeen experienced a period of growth and prosperity. The town was home to several cotton mills, and the population grew to over 5,000 by the early 1900s.
Geography
Aberdeen is located at 33°48'N 88°37'W (33.80, -88.62). According to the United States Census Bureau, the city has a total area of 5.2 square miles (13.4 km2), of which 5.1 square miles (13.2 km2) is land and 0.1 square miles (0.2 km2) (1.54%) is water.
Economy
Aberdeen is a small town with a diverse economy. The town is home to several manufacturing companies, including a furniture factory, a paper mill, and a plastics plant. The town is also home to several retail stores, restaurants, and other businesses.
The town is also home to a number of agricultural businesses, including a cotton gin, a grain elevator, and a feed mill. The town is also home to a number of small farms, which produce a variety of crops, including cotton, corn, soybeans, and wheat.
Demographics
As of the 2010 census, there were 5,612 people, 2,093 households, and 1,395 families residing in the city. The population density was 1,098.7 people per square mile (424.3/km2). There were 2,309 housing units at an average density of 449.7 per square mile (173.9/km2). The racial makeup of the city was 57.2% White, 40.2% African American, 0.2% Native American, 0.4% Asian, 0.1% Pacific Islander, 0.7% from other races, and 1.2% from two or more races. Hispanic or Latino of any race were 1.7% of the population.
There were 2,093 households, out of which 33.2% had children under the age of 18 living with them, 41.2% were married couples living together, 21.2% had a female householder with no husband present, and 33.2% were non-families. 28.7% of all households were made up of individuals, and 13.2% had someone living alone who was 65 years of age or older. The average household size was 2.60 and the average family size was 3.17.
In the city, the population was spread out, with 28.2% under the age of 18, 9.2% from 18 to 24, 25.2% from 25 to 44, 22.2% from 45 to 64, and 15.2% who were 65 years of age or older. The median age was 36 years. For every 100 females, there were 86.2 males. For every 100 females age 18 and over, there were 81.2 males.
The median income for a household in the city was $25,938, and the median income for a family was $31,964. Males had a median income of $27,917 versus $20,938 for females. The per capita income for the city was $13,945. About 19.2% of families and 22.2% of the population were below the poverty line, including 33.2% of those under age 18 and 18.2% of those age 65 or over.
Common Questions
What is Per Capita Income in Aberdeen?
Per Capita income in Aberdeen is $28,278.
What is the Median Family Income in Aberdeen?
Median Family Income in Aberdeen is $62,517.
What is the Median Household income in Aberdeen?
Median Household Income in Aberdeen is $46,788.
What is Income or Wage Gap in Aberdeen?
Income or Wage Gap in Aberdeen is 32.7%.
Women in Aberdeen earn 67.3 cents for every dollar earned by a man.
What is Family Income Deficit in Aberdeen?
Family Income Deficit in Aberdeen is $14,109.
Families that are below poverty line in Aberdeen earn $14,109 less on average than the poverty threshold level.
What is Inequality or Gini Index in Aberdeen?
Inequality or Gini Index in Aberdeen is 0.53.
What is the Total Population of Aberdeen?
Total Population of Aberdeen is 4,972.
What is the Total Male Population of Aberdeen?
Total Male Population of Aberdeen is 2,592.
What is the Total Female Population of Aberdeen?
Total Female Population of Aberdeen is 2,380.
What is the Ratio of Males per 100 Females in Aberdeen?
There are 108.91 Males per 100 Females in Aberdeen.
What is the Ratio of Females per 100 Males in Aberdeen?
There are 91.82 Females per 100 Males in Aberdeen.
What is the Median Population Age in Aberdeen?
Median Population Age in Aberdeen is 41.5 Years.
What is the Average Family Size in Aberdeen
Average Family Size in Aberdeen is 3.2 People.
What is the Average Household Size in Aberdeen
Average Household Size in Aberdeen is 2.4 People.
How Large is the Labor Force in Aberdeen?
There are 2,042 People in the Labor Forcein in Aberdeen.
What is the Percentage of People in the Labor Force in Aberdeen?
50.6% of People are in the Labor Force in Aberdeen.
What is the Unemployment Rate in Aberdeen?
Unemployment Rate in Aberdeen is 6.4%.