Brandon, MS Map & Demographics
Brandon Map
Brandon Overview
$38,452
PER CAPITA INCOME
$95,043
AVG FAMILY INCOME
$89,051
AVG HOUSEHOLD INCOME
37.0%
WAGE / INCOME GAP [ % ]
63.0¢/ $1
WAGE / INCOME GAP [ $ ]
$13,888
FAMILY INCOME DEFICIT
0.35
INEQUALITY / GINI INDEX
25,142
TOTAL POPULATION
11,998
MALE POPULATION
13,144
FEMALE POPULATION
91.28
MALES / 100 FEMALES
109.55
FEMALES / 100 MALES
41.3
MEDIAN AGE
3.1
AVG FAMILY SIZE
2.6
AVG HOUSEHOLD SIZE
12,634
LABOR FORCE [ PEOPLE ]
63.9%
PERCENT IN LABOR FORCE
4.2%
UNEMPLOYMENT RATE
Income in Brandon
Income Overview in Brandon
Per Capita Income in Brandon is $38,452, while median incomes of families and households are $95,043 and $89,051 respectively.
| Characteristic | Number | Measure |
| Per Capita Income | 25,142 | $38,452 |
| Median Family Income | 6,819 | $95,043 |
| Mean Family Income | 6,819 | $112,878 |
| Median Household Income | 9,286 | $89,051 |
| Mean Household Income | 9,286 | $101,505 |
| Income Deficit | 6,819 | $13,888 |
| Wage / Income Gap (%) | 25,142 | 36.95% |
| Wage / Income Gap ($) | 25,142 | 63.05¢ per $1 |
| Gini / Inequality Index | 25,142 | 0.35 |
Earnings by Sex in Brandon
Average Earnings in Brandon are $47,933, $58,805 for men and $37,076 for women, a difference of 36.9%.
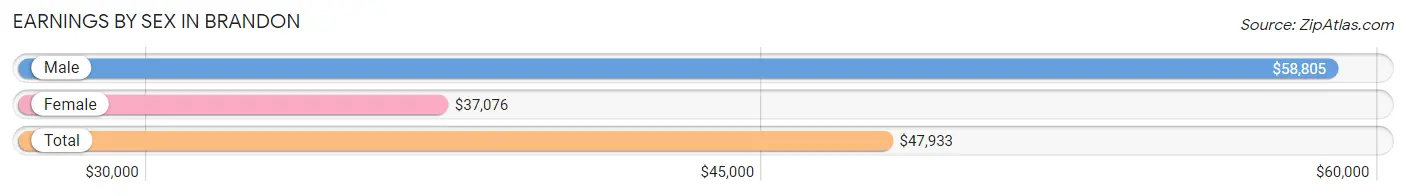
| Sex | Number | Average Earnings |
| Male | 6,545 (50.0%) | $58,805 |
| Female | 6,547 (50.0%) | $37,076 |
| Total | 13,092 (100.0%) | $47,933 |
Earnings by Sex by Income Bracket in Brandon
The most common earnings brackets in Brandon are $100,000+ for men (1,361 | 20.8%) and $35,000 to $39,999 for women (597 | 9.1%).
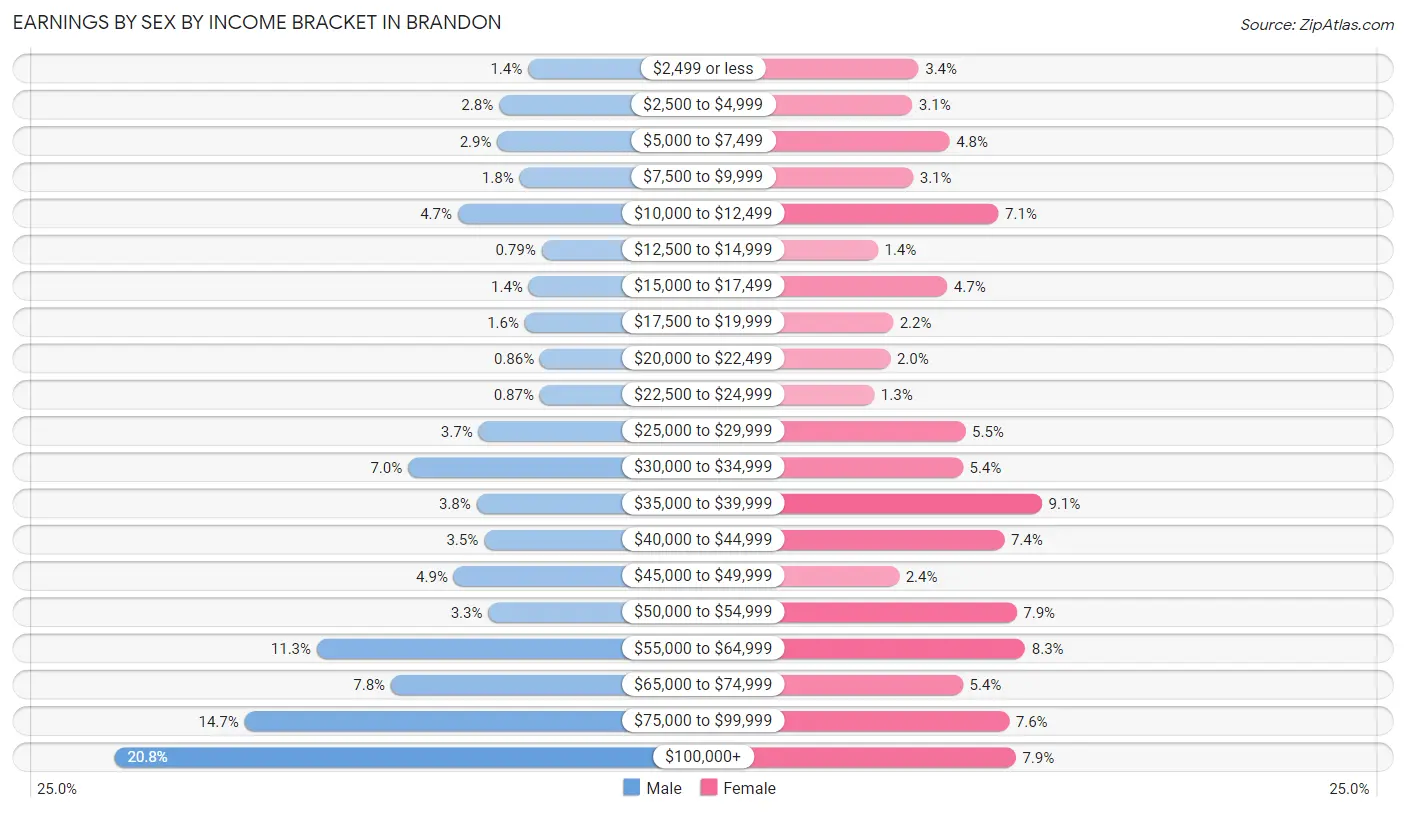
| Income | Male | Female |
| $2,499 or less | 93 (1.4%) | 219 (3.4%) |
| $2,500 to $4,999 | 182 (2.8%) | 200 (3.0%) |
| $5,000 to $7,499 | 187 (2.9%) | 314 (4.8%) |
| $7,500 to $9,999 | 119 (1.8%) | 202 (3.1%) |
| $10,000 to $12,499 | 308 (4.7%) | 464 (7.1%) |
| $12,500 to $14,999 | 52 (0.8%) | 94 (1.4%) |
| $15,000 to $17,499 | 91 (1.4%) | 307 (4.7%) |
| $17,500 to $19,999 | 103 (1.6%) | 141 (2.1%) |
| $20,000 to $22,499 | 56 (0.9%) | 132 (2.0%) |
| $22,500 to $24,999 | 57 (0.9%) | 83 (1.3%) |
| $25,000 to $29,999 | 245 (3.7%) | 363 (5.5%) |
| $30,000 to $34,999 | 461 (7.0%) | 355 (5.4%) |
| $35,000 to $39,999 | 251 (3.8%) | 597 (9.1%) |
| $40,000 to $44,999 | 228 (3.5%) | 482 (7.4%) |
| $45,000 to $49,999 | 321 (4.9%) | 159 (2.4%) |
| $50,000 to $54,999 | 215 (3.3%) | 520 (7.9%) |
| $55,000 to $64,999 | 740 (11.3%) | 546 (8.3%) |
| $65,000 to $74,999 | 513 (7.8%) | 355 (5.4%) |
| $75,000 to $99,999 | 962 (14.7%) | 497 (7.6%) |
| $100,000+ | 1,361 (20.8%) | 517 (7.9%) |
| Total | 6,545 (100.0%) | 6,547 (100.0%) |
Earnings by Sex by Educational Attainment in Brandon
Average earnings in Brandon are $61,105 for men and $42,310 for women, a difference of 30.8%. Men with an educational attainment of graduate degree enjoy the highest average annual earnings of $100,326, while those with less than high school education earn the least with $22,281. Women with an educational attainment of graduate degree earn the most with the average annual earnings of $63,524, while those with college or associate's degree education have the smallest earnings of $40,659.
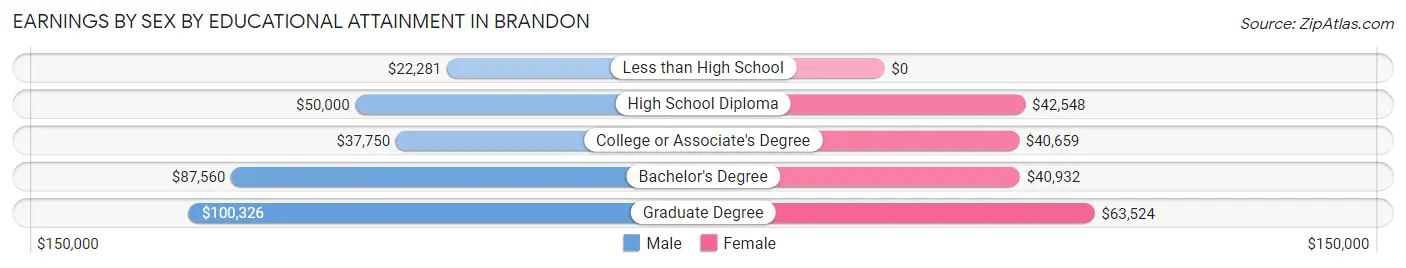
| Educational Attainment | Male Income | Female Income |
| Less than High School | $22,281 | $0 |
| High School Diploma | $50,000 | $42,548 |
| College or Associate's Degree | $37,750 | $40,659 |
| Bachelor's Degree | $87,560 | $40,932 |
| Graduate Degree | $100,326 | $63,524 |
| Total | $61,105 | $42,310 |
Family Income in Brandon
Family Income Brackets in Brandon
According to the Brandon family income data, there are 1,739 families falling into the $100,000 to $149,999 income range, which is the most common income bracket and makes up 25.5% of all families. Conversely, the $10,000 to $14,999 income bracket is the least frequent group with only 41 families (0.6%) belonging to this category.
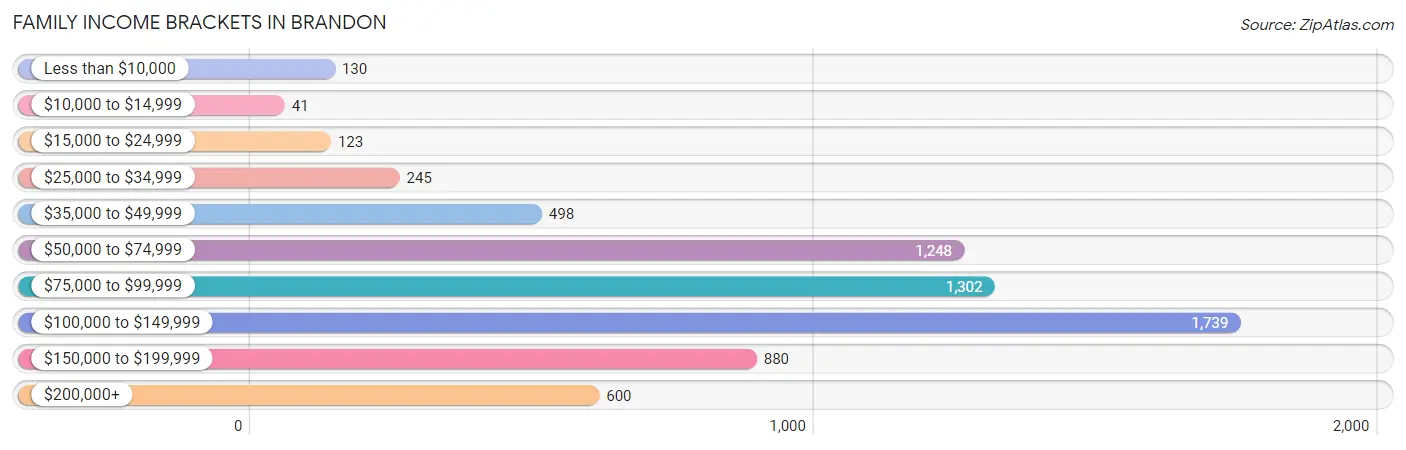
| Income Bracket | # Families | % Families |
| Less than $10,000 | 130 | 1.9% |
| $10,000 to $14,999 | 41 | 0.6% |
| $15,000 to $24,999 | 123 | 1.8% |
| $25,000 to $34,999 | 245 | 3.6% |
| $35,000 to $49,999 | 498 | 7.3% |
| $50,000 to $74,999 | 1,248 | 18.3% |
| $75,000 to $99,999 | 1,302 | 19.1% |
| $100,000 to $149,999 | 1,739 | 25.5% |
| $150,000 to $199,999 | 880 | 12.9% |
| $200,000+ | 600 | 8.8% |
Family Income by Famaliy Size in Brandon
5-person families (384 | 5.6%) account for the highest median family income in Brandon with $133,214 per family, while 3-person families (1,060 | 15.5%) have the highest median income of $40,516 per family member.
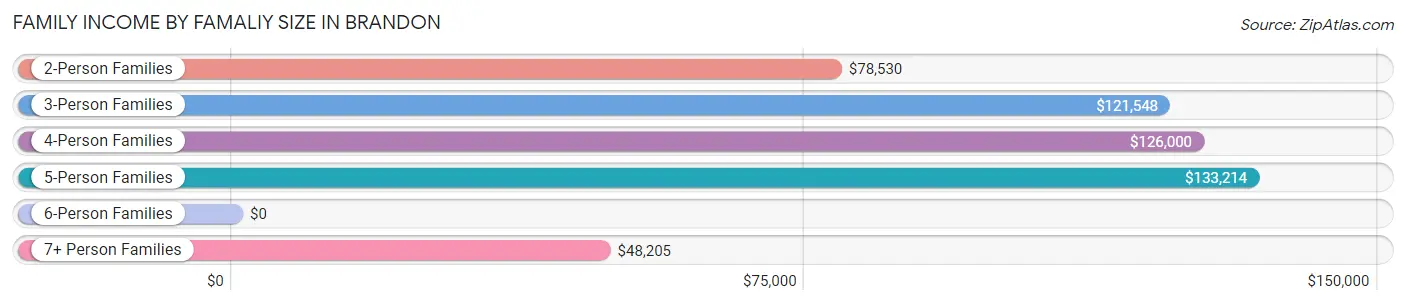
| Income Bracket | # Families | Median Income |
| 2-Person Families | 3,335 (48.9%) | $78,530 |
| 3-Person Families | 1,060 (15.5%) | $121,548 |
| 4-Person Families | 1,590 (23.3%) | $126,000 |
| 5-Person Families | 384 (5.6%) | $133,214 |
| 6-Person Families | 384 (5.6%) | $0 |
| 7+ Person Families | 66 (1.0%) | $48,205 |
| Total | 6,819 (100.0%) | $95,043 |
Family Income by Number of Earners in Brandon
The median family income in Brandon is $95,043, with families comprising 3+ earners (804) having the highest median family income of $138,078, while families with no earners (1,148) have the lowest median family income of $63,472, accounting for 11.8% and 16.8% of families, respectively.
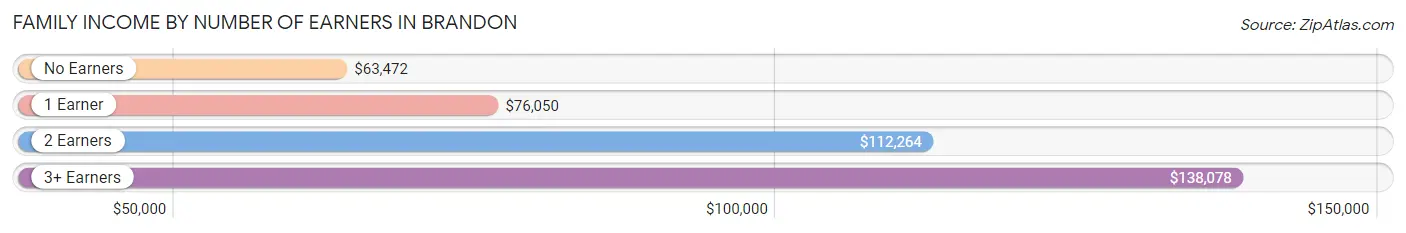
| Number of Earners | # Families | Median Income |
| No Earners | 1,148 (16.8%) | $63,472 |
| 1 Earner | 1,775 (26.0%) | $76,050 |
| 2 Earners | 3,092 (45.3%) | $112,264 |
| 3+ Earners | 804 (11.8%) | $138,078 |
| Total | 6,819 (100.0%) | $95,043 |
Household Income in Brandon
Household Income Brackets in Brandon
With 2,117 households falling in the category, the $100,000 to $149,999 income range is the most frequent in Brandon, accounting for 22.8% of all households. In contrast, only 102 households (1.1%) fall into the $10,000 to $14,999 income bracket, making it the least populous group.
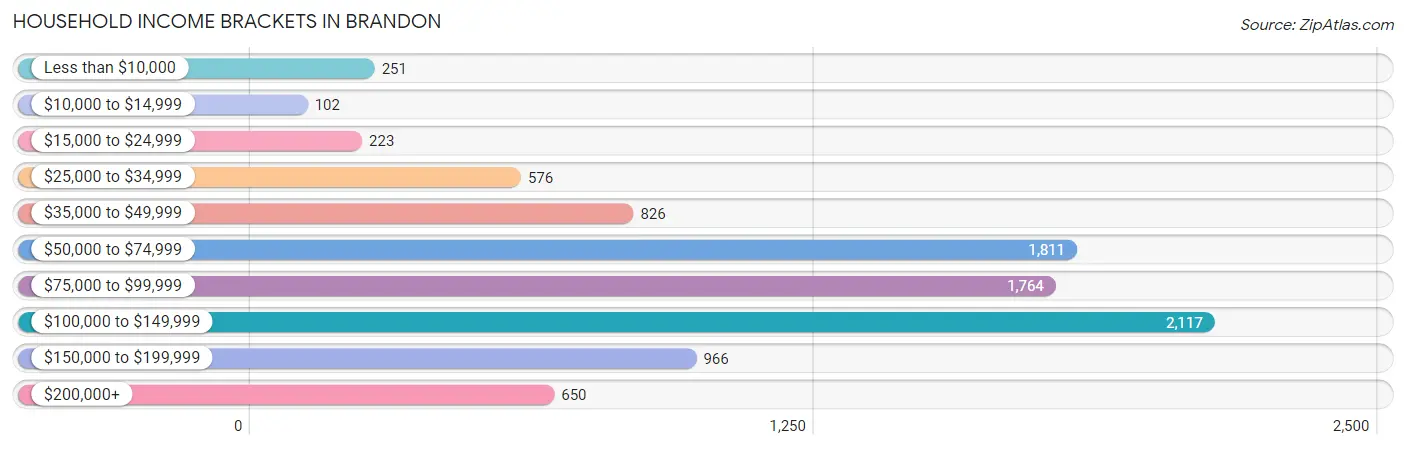
| Income Bracket | # Households | % Households |
| Less than $10,000 | 251 | 2.7% |
| $10,000 to $14,999 | 102 | 1.1% |
| $15,000 to $24,999 | 223 | 2.4% |
| $25,000 to $34,999 | 576 | 6.2% |
| $35,000 to $49,999 | 826 | 8.9% |
| $50,000 to $74,999 | 1,811 | 19.5% |
| $75,000 to $99,999 | 1,764 | 19.0% |
| $100,000 to $149,999 | 2,117 | 22.8% |
| $150,000 to $199,999 | 966 | 10.4% |
| $200,000+ | 650 | 7.0% |
Household Income by Householder Age in Brandon
The median household income in Brandon is $89,051, with the highest median household income of $100,436 found in the 25 to 44 years age bracket for the primary householder. A total of 2,602 households (28.0%) fall into this category. Meanwhile, the 65+ years age bracket for the primary householder has the lowest median household income of $68,361, with 2,681 households (28.9%) in this group.
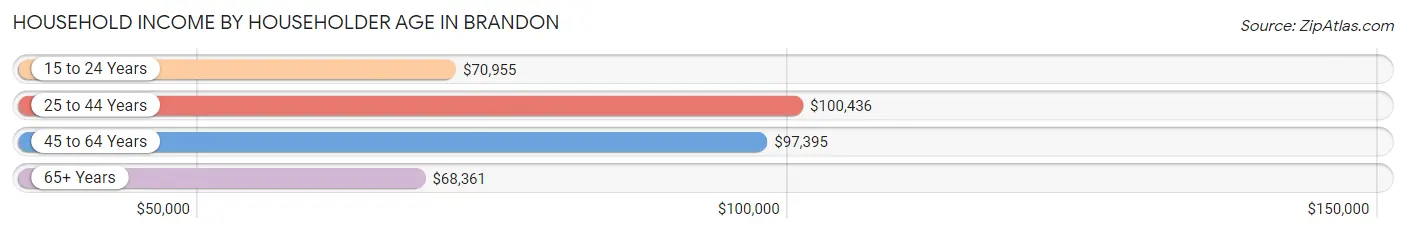
| Income Bracket | # Households | Median Income |
| 15 to 24 Years | 367 (4.0%) | $70,955 |
| 25 to 44 Years | 2,602 (28.0%) | $100,436 |
| 45 to 64 Years | 3,636 (39.2%) | $97,395 |
| 65+ Years | 2,681 (28.9%) | $68,361 |
| Total | 9,286 (100.0%) | $89,051 |
Poverty in Brandon
Income Below Poverty by Sex and Age in Brandon
With 4.2% poverty level for males and 5.7% for females among the residents of Brandon, under 5 year old males and 15 year old females are the most vulnerable to poverty, with 127 males (17.7%) and 15 females (19.7%) in their respective age groups living below the poverty level.
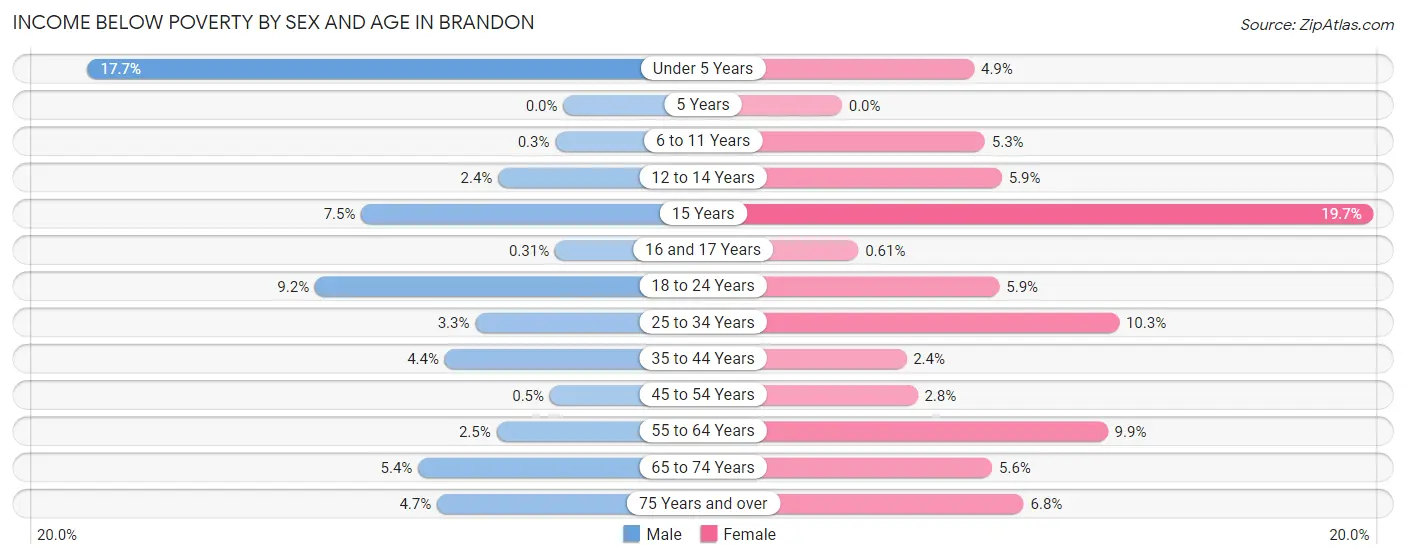
| Age Bracket | Male | Female |
| Under 5 Years | 127 (17.7%) | 37 (4.9%) |
| 5 Years | 0 (0.0%) | 0 (0.0%) |
| 6 to 11 Years | 4 (0.3%) | 53 (5.3%) |
| 12 to 14 Years | 14 (2.4%) | 37 (5.9%) |
| 15 Years | 6 (7.5%) | 15 (19.7%) |
| 16 and 17 Years | 1 (0.3%) | 2 (0.6%) |
| 18 to 24 Years | 89 (9.2%) | 69 (5.9%) |
| 25 to 34 Years | 37 (3.3%) | 112 (10.3%) |
| 35 to 44 Years | 68 (4.4%) | 38 (2.4%) |
| 45 to 54 Years | 8 (0.5%) | 57 (2.8%) |
| 55 to 64 Years | 28 (2.5%) | 160 (9.9%) |
| 65 to 74 Years | 64 (5.4%) | 71 (5.6%) |
| 75 Years and over | 34 (4.7%) | 79 (6.8%) |
| Total | 480 (4.2%) | 730 (5.7%) |
Income Above Poverty by Sex and Age in Brandon
According to the poverty statistics in Brandon, males aged 5 years and females aged 5 years are the age groups that are most secure financially, with 100.0% of males and 100.0% of females in these age groups living above the poverty line.
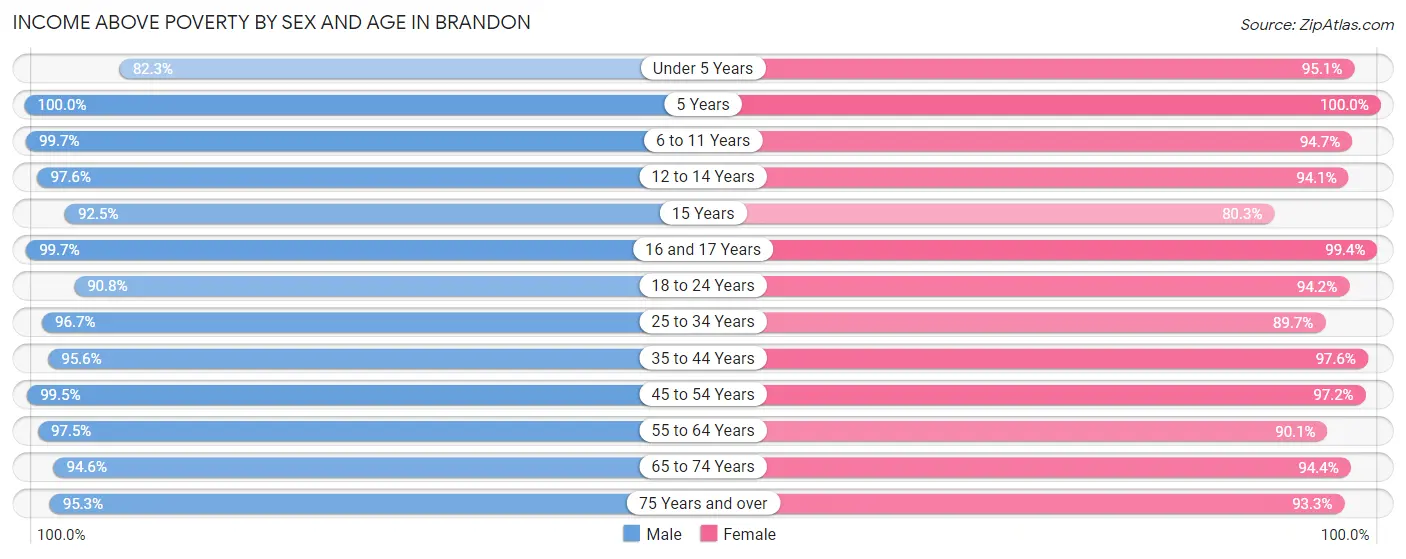
| Age Bracket | Male | Female |
| Under 5 Years | 592 (82.3%) | 717 (95.1%) |
| 5 Years | 66 (100.0%) | 64 (100.0%) |
| 6 to 11 Years | 1,342 (99.7%) | 945 (94.7%) |
| 12 to 14 Years | 564 (97.6%) | 586 (94.1%) |
| 15 Years | 74 (92.5%) | 61 (80.3%) |
| 16 and 17 Years | 317 (99.7%) | 328 (99.4%) |
| 18 to 24 Years | 876 (90.8%) | 1,110 (94.2%) |
| 25 to 34 Years | 1,095 (96.7%) | 976 (89.7%) |
| 35 to 44 Years | 1,478 (95.6%) | 1,554 (97.6%) |
| 45 to 54 Years | 1,607 (99.5%) | 1,968 (97.2%) |
| 55 to 64 Years | 1,103 (97.5%) | 1,461 (90.1%) |
| 65 to 74 Years | 1,123 (94.6%) | 1,202 (94.4%) |
| 75 Years and over | 691 (95.3%) | 1,091 (93.2%) |
| Total | 10,928 (95.8%) | 12,063 (94.3%) |
Income Below Poverty Among Married-Couple Families in Brandon
The poverty statistics for married-couple families in Brandon show that 3.5% or 198 of the total 5,618 families live below the poverty line. Families with 5 or more children have the highest poverty rate of 31.2%, comprising of 20 families. On the other hand, families with 1 or 2 children have the lowest poverty rate of 2.0%, which includes 39 families.
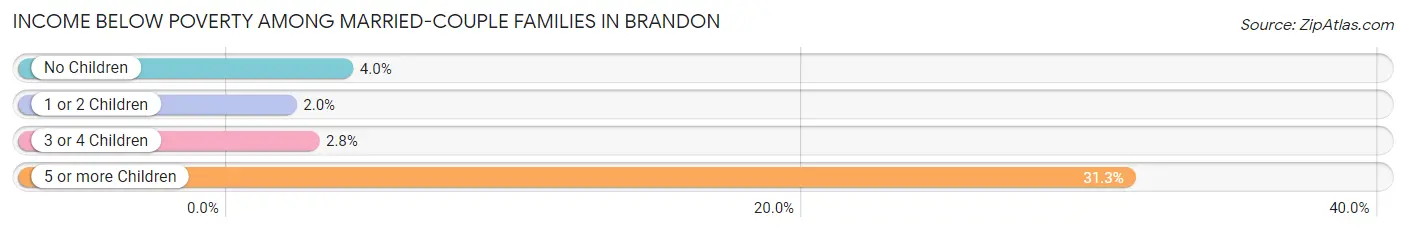
| Children | Above Poverty | Below Poverty |
| No Children | 2,975 (96.0%) | 124 (4.0%) |
| 1 or 2 Children | 1,885 (98.0%) | 39 (2.0%) |
| 3 or 4 Children | 516 (97.2%) | 15 (2.8%) |
| 5 or more Children | 44 (68.8%) | 20 (31.2%) |
| Total | 5,420 (96.5%) | 198 (3.5%) |
Income Below Poverty Among Single-Parent Households in Brandon
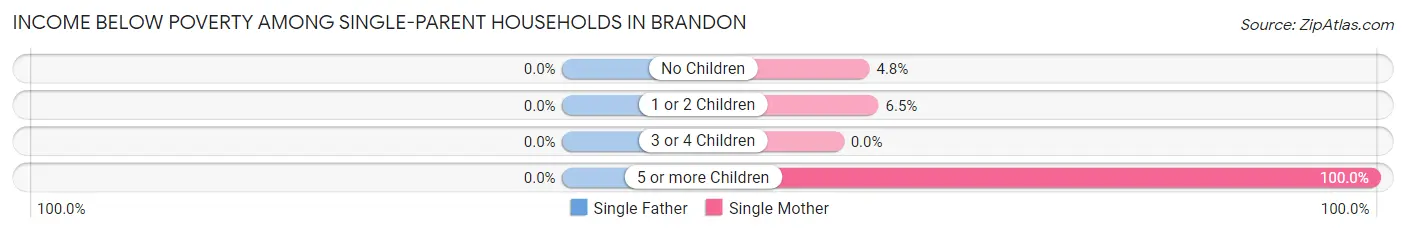
| Children | Single Father | Single Mother |
| No Children | 0 (0.0%) | 20 (4.8%) |
| 1 or 2 Children | 0 (0.0%) | 36 (6.5%) |
| 3 or 4 Children | 0 (0.0%) | 0 (0.0%) |
| 5 or more Children | 0 (0.0%) | 2 (100.0%) |
| Total | 0 (0.0%) | 58 (5.7%) |
Income Below Poverty Among Married-Couple vs Single-Parent Households in Brandon
The poverty data for Brandon shows that 198 of the married-couple family households (3.5%) and 58 of the single-parent households (4.8%) are living below the poverty level. Within the married-couple family households, those with 5 or more children have the highest poverty rate, with 20 households (31.2%) falling below the poverty line. Among the single-parent households, those with 5 or more children have the highest poverty rate, with 2 household (100.0%) living below poverty.
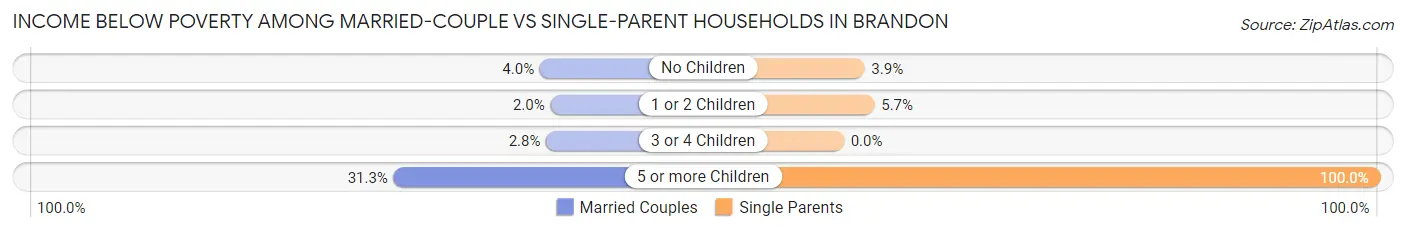
| Children | Married-Couple Families | Single-Parent Households |
| No Children | 124 (4.0%) | 20 (3.9%) |
| 1 or 2 Children | 39 (2.0%) | 36 (5.7%) |
| 3 or 4 Children | 15 (2.8%) | 0 (0.0%) |
| 5 or more Children | 20 (31.2%) | 2 (100.0%) |
| Total | 198 (3.5%) | 58 (4.8%) |
Race in Brandon
The most populous races in Brandon are White / Caucasian (19,563 | 77.8%), Black / African American (5,001 | 19.9%), and Hispanic or Latino (543 | 2.2%).
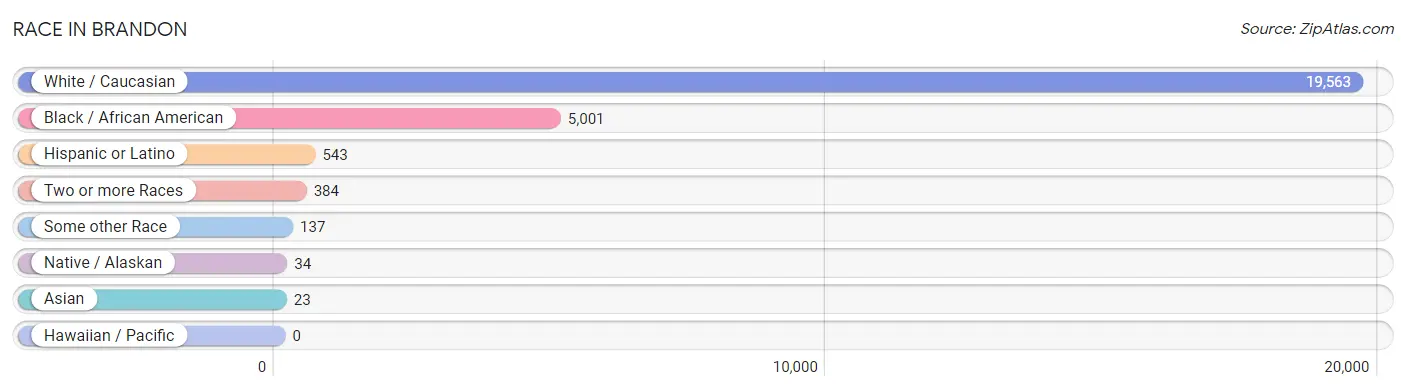
| Race | # Population | % Population |
| Asian | 23 | 0.1% |
| Black / African American | 5,001 | 19.9% |
| Hawaiian / Pacific | 0 | 0.0% |
| Hispanic or Latino | 543 | 2.2% |
| Native / Alaskan | 34 | 0.1% |
| White / Caucasian | 19,563 | 77.8% |
| Two or more Races | 384 | 1.5% |
| Some other Race | 137 | 0.5% |
| Total | 25,142 | 100.0% |
Ancestry in Brandon
The most populous ancestries reported in Brandon are English (3,622 | 14.4%), American (3,097 | 12.3%), Irish (3,066 | 12.2%), German (1,828 | 7.3%), and European (756 | 3.0%), together accounting for 49.2% of all Brandon residents.
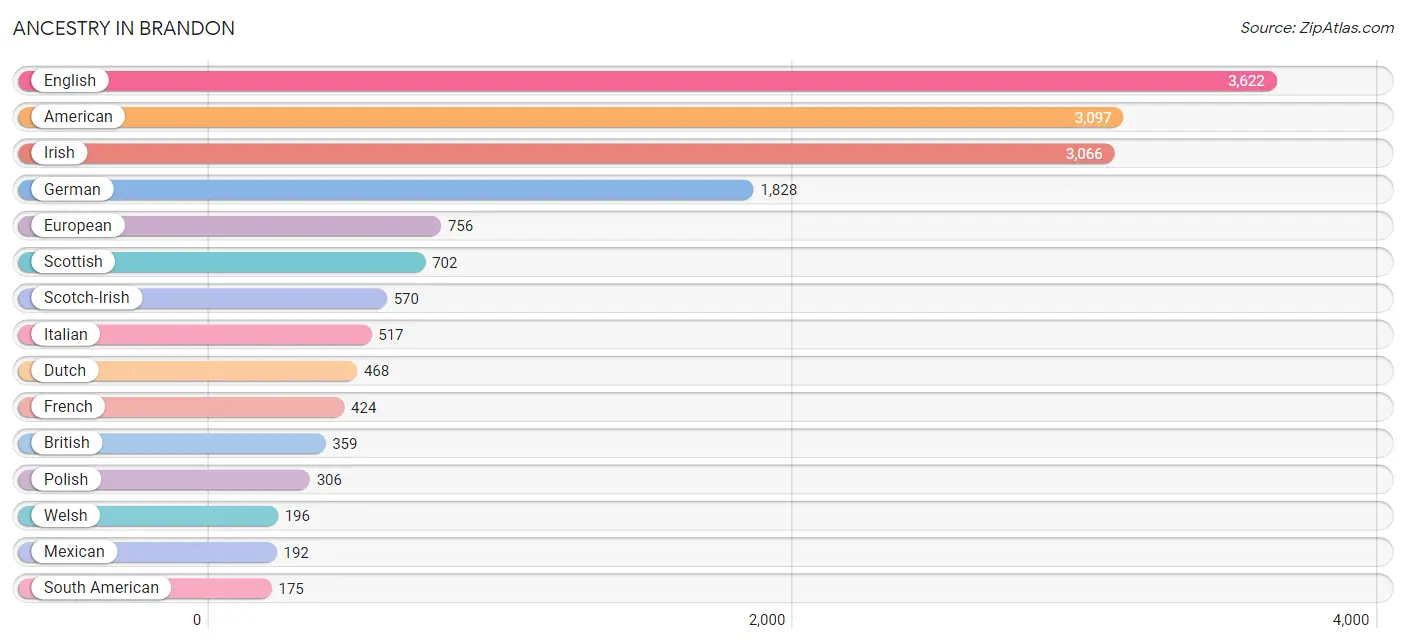
| Ancestry | # Population | % Population |
| African | 91 | 0.4% |
| American | 3,097 | 12.3% |
| Arab | 168 | 0.7% |
| Argentinean | 9 | 0.0% |
| Armenian | 7 | 0.0% |
| Belgian | 22 | 0.1% |
| Brazilian | 18 | 0.1% |
| British | 359 | 1.4% |
| Burmese | 12 | 0.1% |
| Cajun | 59 | 0.2% |
| Cherokee | 5 | 0.0% |
| Chickasaw | 4 | 0.0% |
| Choctaw | 21 | 0.1% |
| Creek | 5 | 0.0% |
| Croatian | 5 | 0.0% |
| Cuban | 82 | 0.3% |
| Czech | 31 | 0.1% |
| Dutch | 468 | 1.9% |
| Dutch West Indian | 4 | 0.0% |
| Eastern European | 21 | 0.1% |
| Egyptian | 17 | 0.1% |
| English | 3,622 | 14.4% |
| European | 756 | 3.0% |
| French | 424 | 1.7% |
| French Canadian | 14 | 0.1% |
| German | 1,828 | 7.3% |
| Greek | 115 | 0.5% |
| Hungarian | 63 | 0.3% |
| Iranian | 6 | 0.0% |
| Irish | 3,066 | 12.2% |
| Italian | 517 | 2.1% |
| Korean | 11 | 0.0% |
| Lebanese | 108 | 0.4% |
| Lithuanian | 19 | 0.1% |
| Mexican | 192 | 0.8% |
| Moroccan | 4 | 0.0% |
| Nigerian | 64 | 0.3% |
| Northern European | 101 | 0.4% |
| Norwegian | 14 | 0.1% |
| Osage | 9 | 0.0% |
| Palestinian | 39 | 0.2% |
| Peruvian | 166 | 0.7% |
| Polish | 306 | 1.2% |
| Puerto Rican | 69 | 0.3% |
| Scandinavian | 7 | 0.0% |
| Scotch-Irish | 570 | 2.3% |
| Scottish | 702 | 2.8% |
| South American | 175 | 0.7% |
| South American Indian | 10 | 0.0% |
| Subsaharan African | 155 | 0.6% |
| Swedish | 87 | 0.4% |
| Ukrainian | 5 | 0.0% |
| Welsh | 196 | 0.8% | View All 53 Rows |
Immigrants in Brandon
The most numerous immigrant groups reported in Brandon came from Latin America (361 | 1.4%), South America (252 | 1.0%), Peru (158 | 0.6%), Caribbean (67 | 0.3%), and Cuba (67 | 0.3%), together accounting for 3.6% of all Brandon residents.
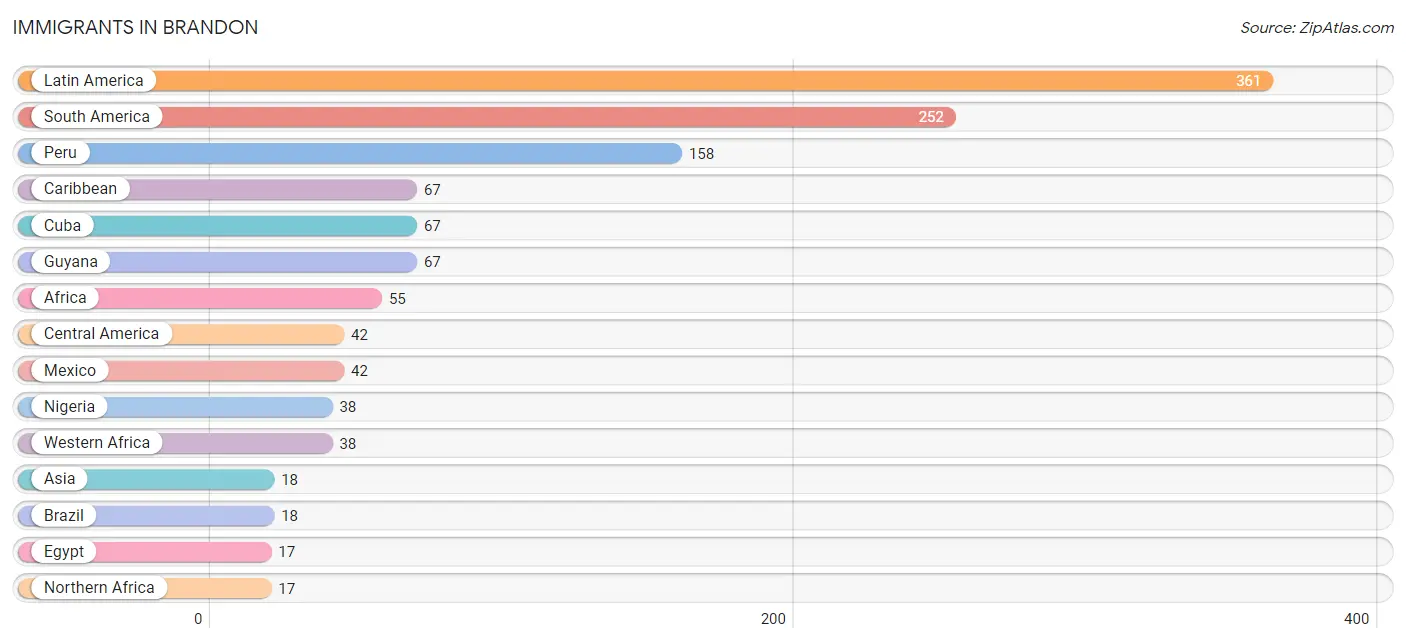
| Immigration Origin | # Population | % Population |
| Africa | 55 | 0.2% |
| Argentina | 9 | 0.0% |
| Asia | 18 | 0.1% |
| Brazil | 18 | 0.1% |
| Caribbean | 67 | 0.3% |
| Central America | 42 | 0.2% |
| Cuba | 67 | 0.3% |
| Eastern Asia | 12 | 0.1% |
| Eastern Europe | 5 | 0.0% |
| Egypt | 17 | 0.1% |
| Europe | 7 | 0.0% |
| Germany | 2 | 0.0% |
| Guyana | 67 | 0.3% |
| Iran | 6 | 0.0% |
| Korea | 12 | 0.1% |
| Latin America | 361 | 1.4% |
| Mexico | 42 | 0.2% |
| Nigeria | 38 | 0.2% |
| Northern Africa | 17 | 0.1% |
| Oceania | 11 | 0.0% |
| Peru | 158 | 0.6% |
| South America | 252 | 1.0% |
| South Central Asia | 6 | 0.0% |
| Ukraine | 5 | 0.0% |
| Western Africa | 38 | 0.2% |
| Western Europe | 2 | 0.0% | View All 26 Rows |
Sex and Age in Brandon
Sex and Age in Brandon
The most populous age groups in Brandon are 10 to 14 Years (1,022 | 8.5%) for men and 10 to 14 Years (1,164 | 8.9%) for women.
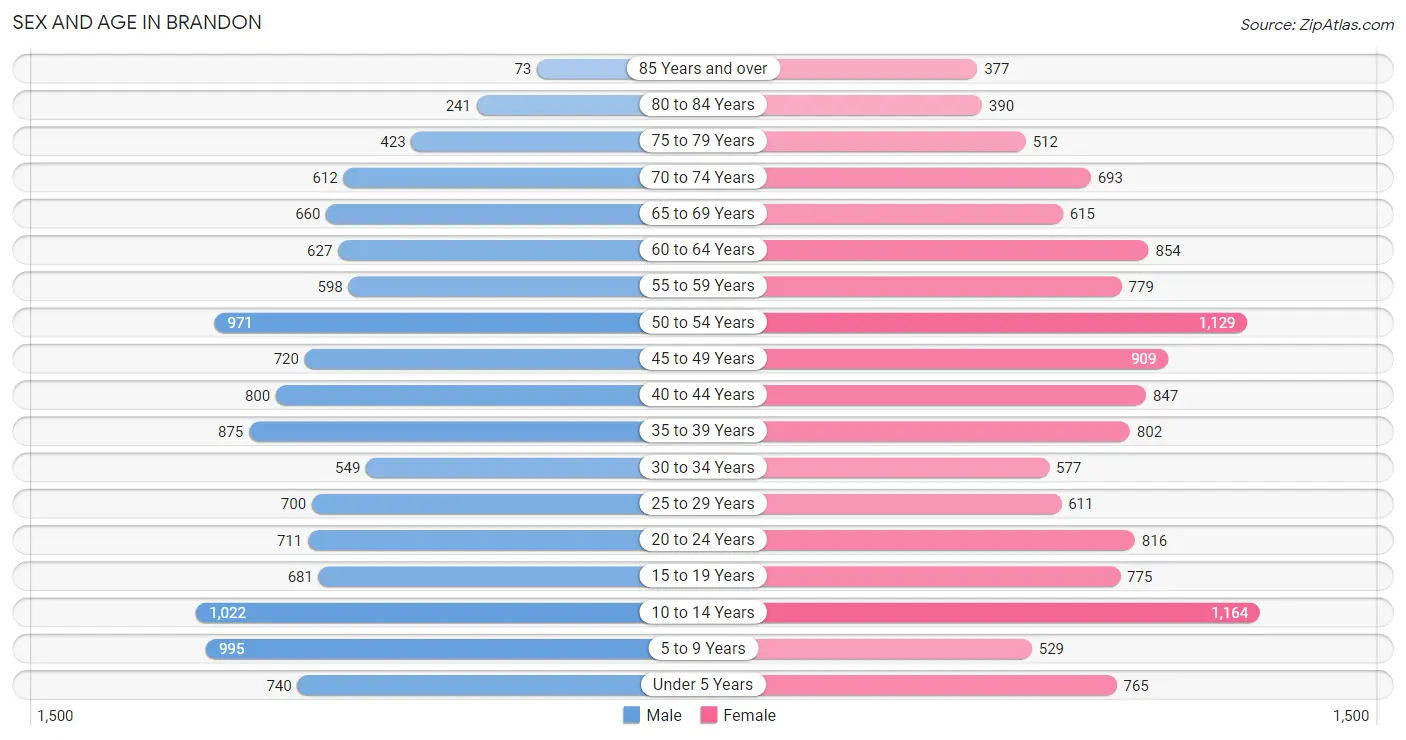
| Age Bracket | Male | Female |
| Under 5 Years | 740 (6.2%) | 765 (5.8%) |
| 5 to 9 Years | 995 (8.3%) | 529 (4.0%) |
| 10 to 14 Years | 1,022 (8.5%) | 1,164 (8.9%) |
| 15 to 19 Years | 681 (5.7%) | 775 (5.9%) |
| 20 to 24 Years | 711 (5.9%) | 816 (6.2%) |
| 25 to 29 Years | 700 (5.8%) | 611 (4.6%) |
| 30 to 34 Years | 549 (4.6%) | 577 (4.4%) |
| 35 to 39 Years | 875 (7.3%) | 802 (6.1%) |
| 40 to 44 Years | 800 (6.7%) | 847 (6.4%) |
| 45 to 49 Years | 720 (6.0%) | 909 (6.9%) |
| 50 to 54 Years | 971 (8.1%) | 1,129 (8.6%) |
| 55 to 59 Years | 598 (5.0%) | 779 (5.9%) |
| 60 to 64 Years | 627 (5.2%) | 854 (6.5%) |
| 65 to 69 Years | 660 (5.5%) | 615 (4.7%) |
| 70 to 74 Years | 612 (5.1%) | 693 (5.3%) |
| 75 to 79 Years | 423 (3.5%) | 512 (3.9%) |
| 80 to 84 Years | 241 (2.0%) | 390 (3.0%) |
| 85 Years and over | 73 (0.6%) | 377 (2.9%) |
| Total | 11,998 (100.0%) | 13,144 (100.0%) |
Families and Households in Brandon
Median Family Size in Brandon
The median family size in Brandon is 3.11 persons per family, with married-couple families (5,618 | 82.4%) accounting for the largest median family size of 3.24 persons per family. On the other hand, single female/mother families (1,019 | 14.9%) represent the smallest median family size with 2.51 persons per family.
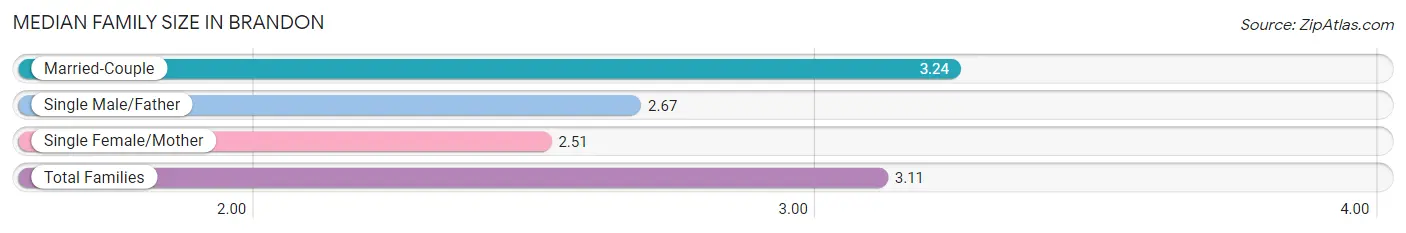
| Family Type | # Families | Family Size |
| Married-Couple | 5,618 (82.4%) | 3.24 |
| Single Male/Father | 182 (2.7%) | 2.67 |
| Single Female/Mother | 1,019 (14.9%) | 2.51 |
| Total Families | 6,819 (100.0%) | 3.11 |
Median Household Size in Brandon
The median household size in Brandon is 2.60 persons per household, with married-couple households (5,618 | 60.5%) accounting for the largest median household size of 3.24 persons per household. non-family households (2,467 | 26.6%) represent the smallest median household size with 1.12 persons per household.
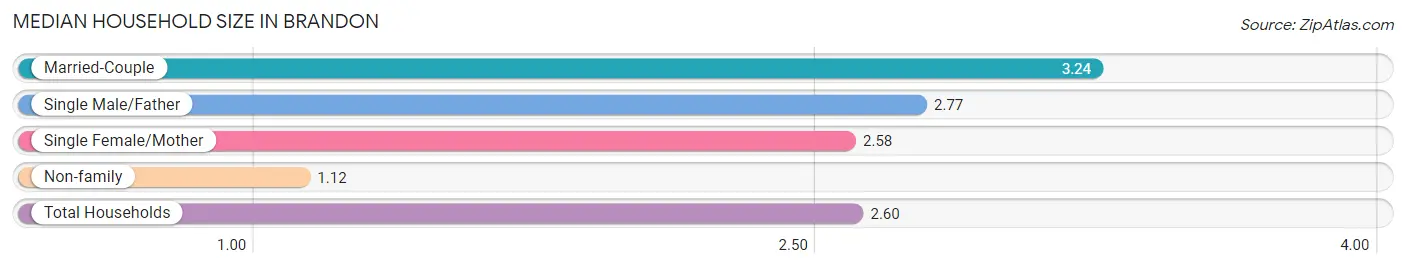
| Household Type | # Households | Household Size |
| Married-Couple | 5,618 (60.5%) | 3.24 |
| Single Male/Father | 182 (2.0%) | 2.77 |
| Single Female/Mother | 1,019 (11.0%) | 2.58 |
| Non-family | 2,467 (26.6%) | 1.12 |
| Total Households | 9,286 (100.0%) | 2.60 |
Household Size by Marriage Status in Brandon
Out of a total of 9,286 households in Brandon, 6,819 (73.4%) are family households, while 2,467 (26.6%) are nonfamily households. The most numerous type of family households are 2-person households, comprising 3,257, and the most common type of nonfamily households are 1-person households, comprising 2,248.
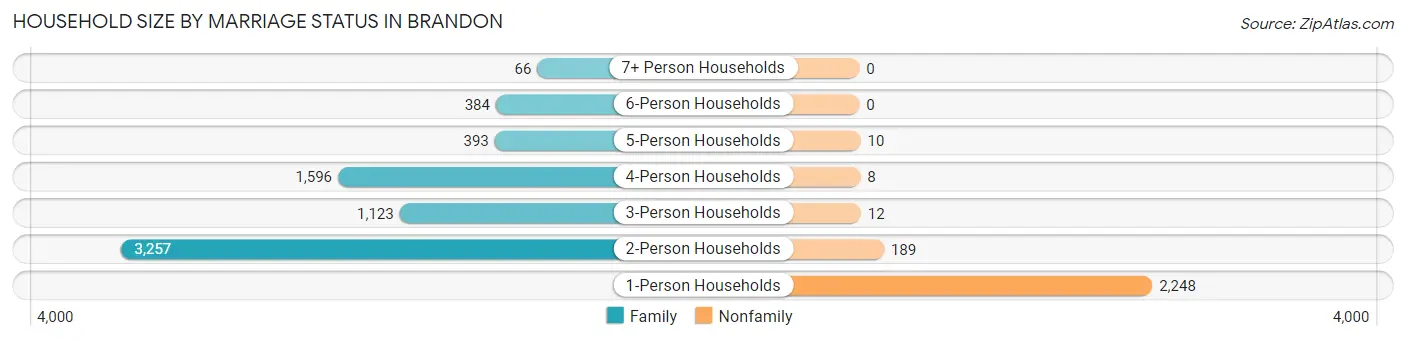
| Household Size | Family Households | Nonfamily Households |
| 1-Person Households | - | 2,248 (24.2%) |
| 2-Person Households | 3,257 (35.1%) | 189 (2.0%) |
| 3-Person Households | 1,123 (12.1%) | 12 (0.1%) |
| 4-Person Households | 1,596 (17.2%) | 8 (0.1%) |
| 5-Person Households | 393 (4.2%) | 10 (0.1%) |
| 6-Person Households | 384 (4.1%) | 0 (0.0%) |
| 7+ Person Households | 66 (0.7%) | 0 (0.0%) |
| Total | 6,819 (73.4%) | 2,467 (26.6%) |
Female Fertility in Brandon
Fertility by Age in Brandon
Average fertility rate in Brandon is 84.0 births per 1,000 women. Women in the age bracket of 15 to 19 years have the highest fertility rate with 283.0 births per 1,000 women. Women in the age bracket of 20 to 34 years acount for 50.0% of all women with births.
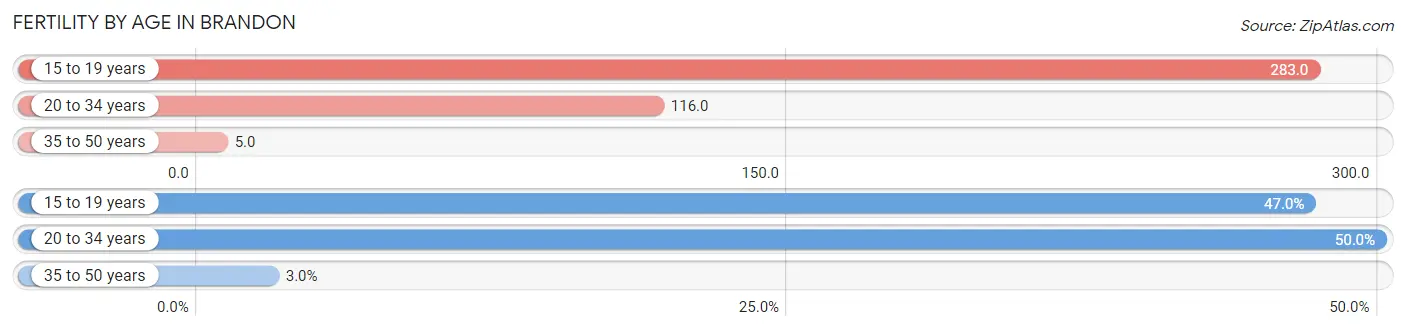
| Age Bracket | Women with Births | Births / 1,000 Women |
| 15 to 19 years | 219 (47.0%) | 283.0 |
| 20 to 34 years | 233 (50.0%) | 116.0 |
| 35 to 50 years | 14 (3.0%) | 5.0 |
| Total | 466 (100.0%) | 84.0 |
Fertility by Age by Marriage Status in Brandon
38.8% of women with births (466) in Brandon are married. The highest percentage of unmarried women with births falls into 15 to 19 years age bracket with 100.0% of them unmarried at the time of birth, while the lowest percentage of unmarried women with births belong to 20 to 34 years age bracket with 22.3% of them unmarried.
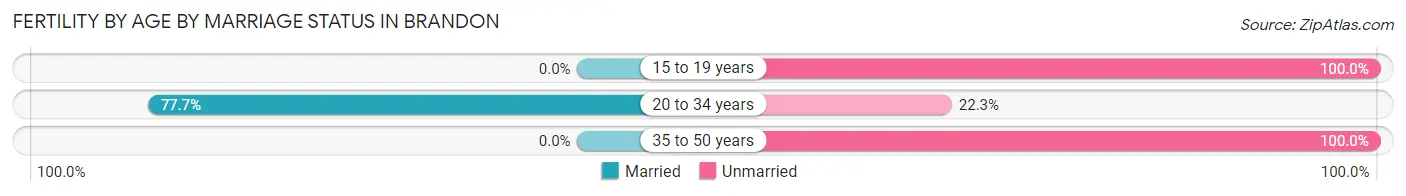
| Age Bracket | Married | Unmarried |
| 15 to 19 years | 0 (0.0%) | 219 (100.0%) |
| 20 to 34 years | 181 (77.7%) | 52 (22.3%) |
| 35 to 50 years | 0 (0.0%) | 14 (100.0%) |
| Total | 181 (38.8%) | 285 (61.2%) |
Fertility by Education in Brandon
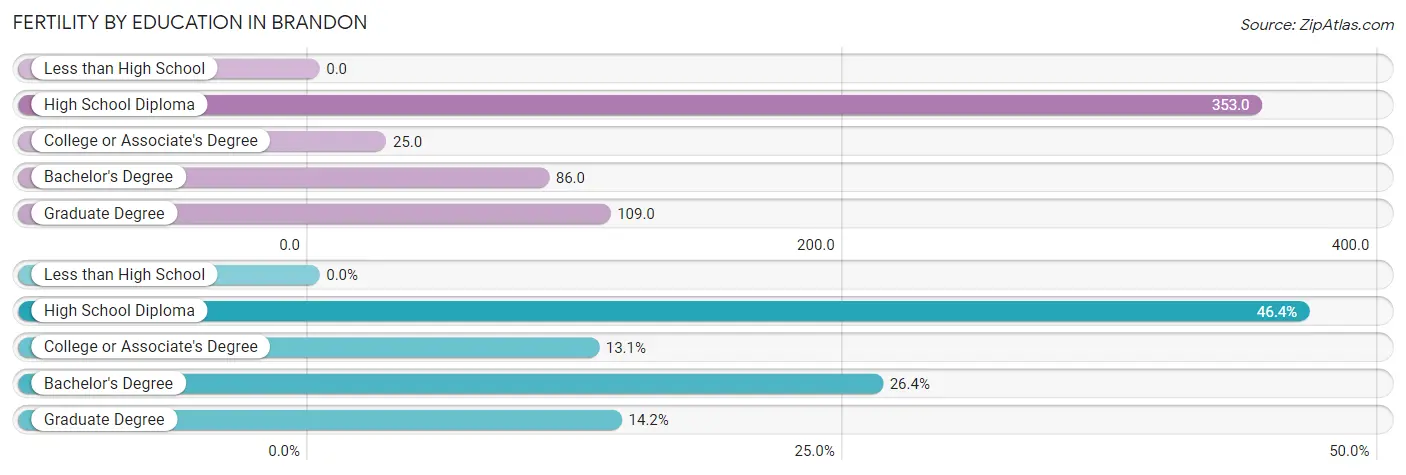
| Educational Attainment | Women with Births | Births / 1,000 Women |
| Less than High School | 0 (0.0%) | 0.0 |
| High School Diploma | 216 (46.4%) | 353.0 |
| College or Associate's Degree | 61 (13.1%) | 25.0 |
| Bachelor's Degree | 123 (26.4%) | 86.0 |
| Graduate Degree | 66 (14.2%) | 109.0 |
| Total | 466 (100.0%) | 84.0 |
Fertility by Education by Marriage Status in Brandon
61.2% of women with births in Brandon are unmarried. Women with the educational attainment of bachelor's degree are most likely to be married with 100.0% of them married at childbirth, while women with the educational attainment of high school diploma are least likely to be married with 100.0% of them unmarried at childbirth.
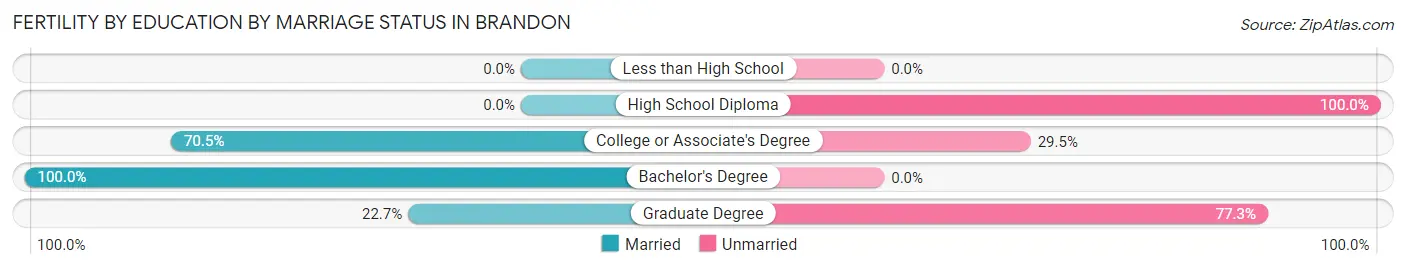
| Educational Attainment | Married | Unmarried |
| Less than High School | 0 (0.0%) | 0 (0.0%) |
| High School Diploma | 0 (0.0%) | 216 (100.0%) |
| College or Associate's Degree | 43 (70.5%) | 18 (29.5%) |
| Bachelor's Degree | 123 (100.0%) | 0 (0.0%) |
| Graduate Degree | 15 (22.7%) | 51 (77.3%) |
| Total | 181 (38.8%) | 285 (61.2%) |
Employment Characteristics in Brandon
Employment by Class of Employer in Brandon
Among the 11,856 employed individuals in Brandon, private company employees (7,301 | 61.6%), state government employees (1,345 | 11.3%), and local government employees (901 | 7.6%) make up the most common classes of employment.
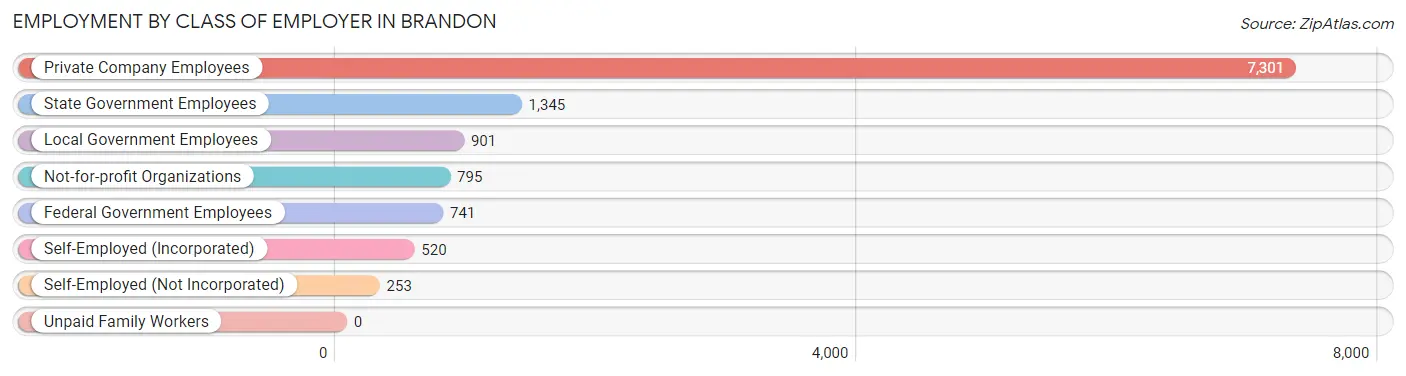
| Employer Class | # Employees | % Employees |
| Private Company Employees | 7,301 | 61.6% |
| Self-Employed (Incorporated) | 520 | 4.4% |
| Self-Employed (Not Incorporated) | 253 | 2.1% |
| Not-for-profit Organizations | 795 | 6.7% |
| Local Government Employees | 901 | 7.6% |
| State Government Employees | 1,345 | 11.3% |
| Federal Government Employees | 741 | 6.2% |
| Unpaid Family Workers | 0 | 0.0% |
| Total | 11,856 | 100.0% |
Employment Status by Age in Brandon
According to the labor force statistics for Brandon, out of the total population over 16 years of age (19,771), 63.9% or 12,634 individuals are in the labor force, with 4.2% or 531 of them unemployed. The age group with the highest labor force participation rate is 45 to 54 years, with 92.9% or 3,464 individuals in the labor force. Within the labor force, the 16 to 19 years age range has the highest percentage of unemployed individuals, with 48.9% or 270 of them being unemployed.
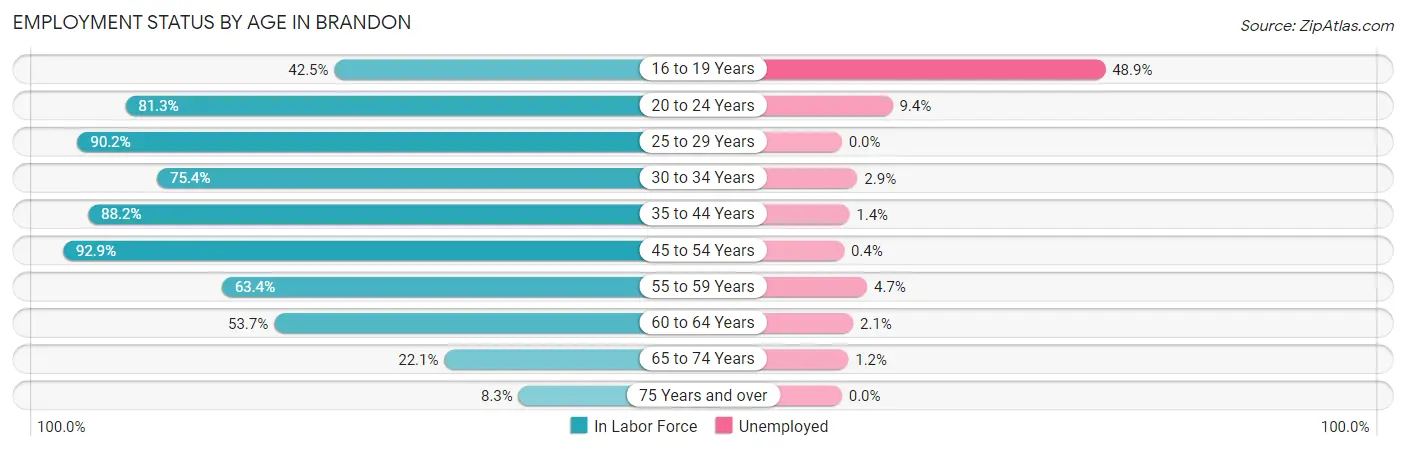
| Age Bracket | In Labor Force | Unemployed |
| 16 to 19 Years | 552 (42.5%) | 270 (48.9%) |
| 20 to 24 Years | 1,241 (81.3%) | 117 (9.4%) |
| 25 to 29 Years | 1,183 (90.2%) | 0 (0.0%) |
| 30 to 34 Years | 849 (75.4%) | 25 (2.9%) |
| 35 to 44 Years | 2,932 (88.2%) | 41 (1.4%) |
| 45 to 54 Years | 3,464 (92.9%) | 14 (0.4%) |
| 55 to 59 Years | 873 (63.4%) | 41 (4.7%) |
| 60 to 64 Years | 795 (53.7%) | 17 (2.1%) |
| 65 to 74 Years | 570 (22.1%) | 7 (1.2%) |
| 75 Years and over | 167 (8.3%) | 0 (0.0%) |
| Total | 12,634 (63.9%) | 531 (4.2%) |
Employment Status by Educational Attainment in Brandon
According to labor force statistics for Brandon, 81.8% of individuals (10,101) out of the total population between 25 and 64 years of age (12,348) are in the labor force, with 1.4% or 141 of them being unemployed. The group with the highest labor force participation rate are those with the educational attainment of college / associate degree, with 87.5% or 3,864 individuals in the labor force. Within the labor force, individuals with less than high school education have the highest percentage of unemployment, with 11.0% or 21 of them being unemployed.
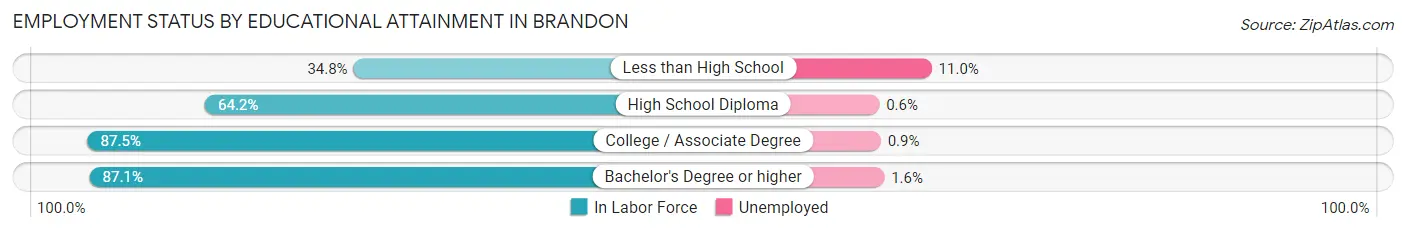
| Educational Attainment | In Labor Force | Unemployed |
| Less than High School | 191 (34.8%) | 60 (11.0%) |
| High School Diploma | 1,099 (64.2%) | 10 (0.6%) |
| College / Associate Degree | 3,864 (87.5%) | 40 (0.9%) |
| Bachelor's Degree or higher | 4,939 (87.1%) | 91 (1.6%) |
| Total | 10,101 (81.8%) | 173 (1.4%) |
Employment Occupations by Sex in Brandon
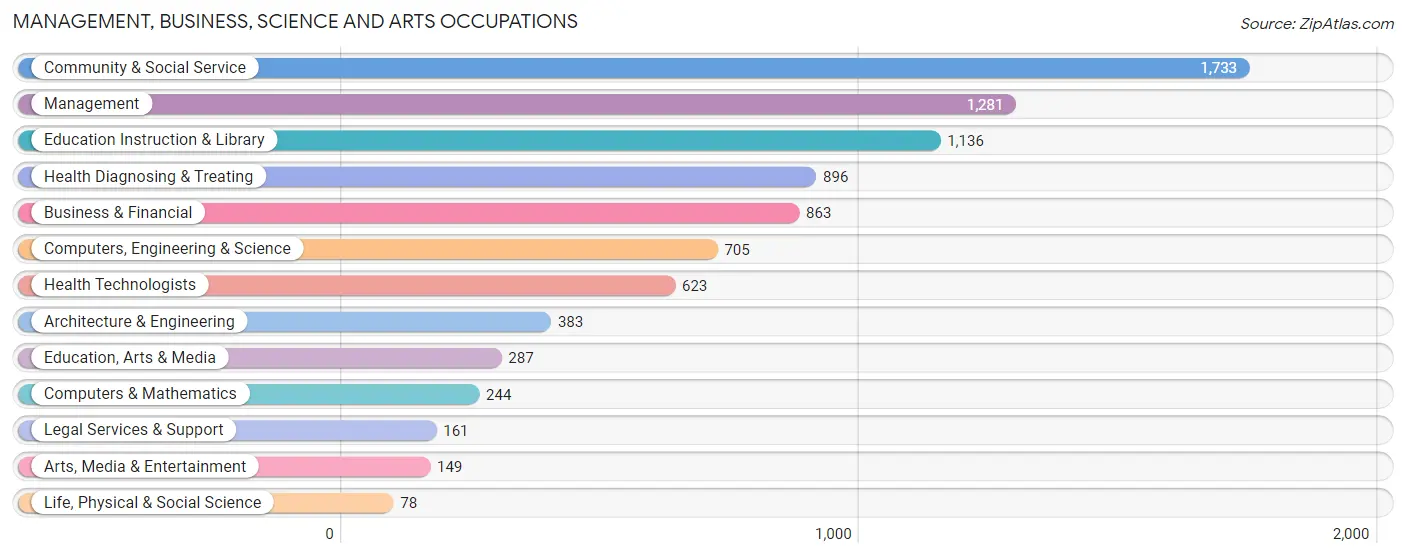
Management, Business, Science and Arts Occupations
The most common Management, Business, Science and Arts occupations in Brandon are Community & Social Service (1,733 | 14.5%), Management (1,281 | 10.7%), Education Instruction & Library (1,136 | 9.5%), Health Diagnosing & Treating (896 | 7.5%), and Business & Financial (863 | 7.2%).
Management, Business, Science and Arts Occupations by Sex
Within the Management, Business, Science and Arts occupations in Brandon, the most male-oriented occupations are Computers & Mathematics (95.1%), Architecture & Engineering (92.7%), and Computers, Engineering & Science (91.2%), while the most female-oriented occupations are Education Instruction & Library (83.4%), Legal Services & Support (83.2%), and Community & Social Service (77.7%).
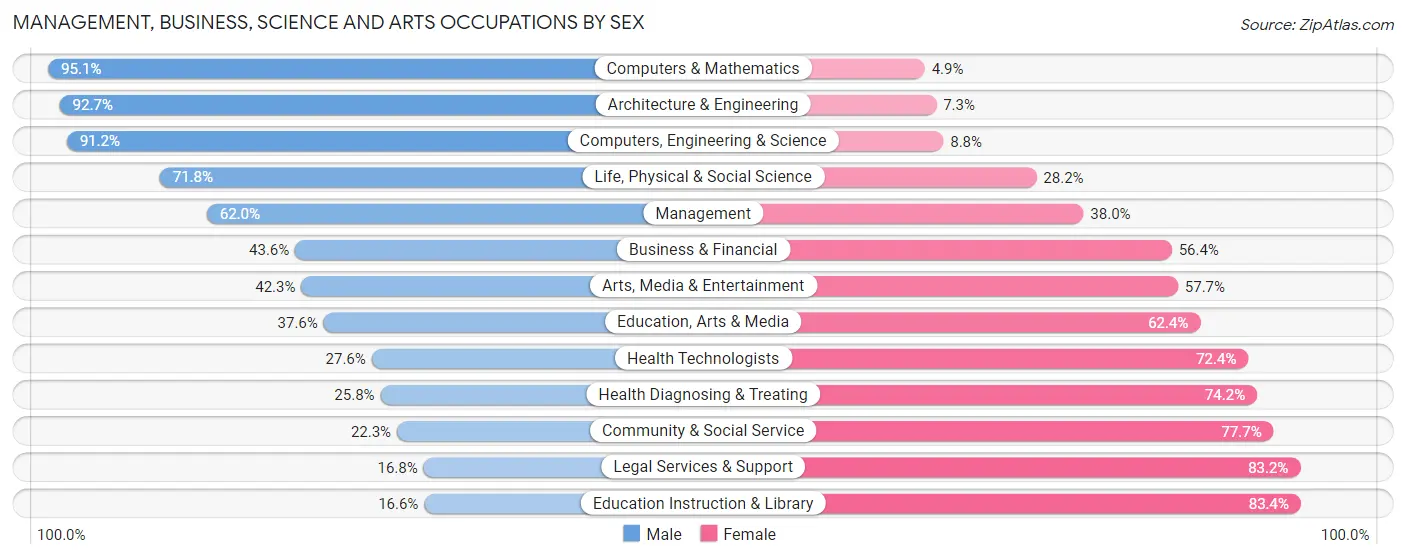
| Occupation | Male | Female |
| Management | 794 (62.0%) | 487 (38.0%) |
| Business & Financial | 376 (43.6%) | 487 (56.4%) |
| Computers, Engineering & Science | 643 (91.2%) | 62 (8.8%) |
| Computers & Mathematics | 232 (95.1%) | 12 (4.9%) |
| Architecture & Engineering | 355 (92.7%) | 28 (7.3%) |
| Life, Physical & Social Science | 56 (71.8%) | 22 (28.2%) |
| Community & Social Service | 387 (22.3%) | 1,346 (77.7%) |
| Education, Arts & Media | 108 (37.6%) | 179 (62.4%) |
| Legal Services & Support | 27 (16.8%) | 134 (83.2%) |
| Education Instruction & Library | 189 (16.6%) | 947 (83.4%) |
| Arts, Media & Entertainment | 63 (42.3%) | 86 (57.7%) |
| Health Diagnosing & Treating | 231 (25.8%) | 665 (74.2%) |
| Health Technologists | 172 (27.6%) | 451 (72.4%) |
| Total (Category) | 2,431 (44.4%) | 3,047 (55.6%) |
| Total (Overall) | 5,940 (49.8%) | 5,983 (50.2%) |
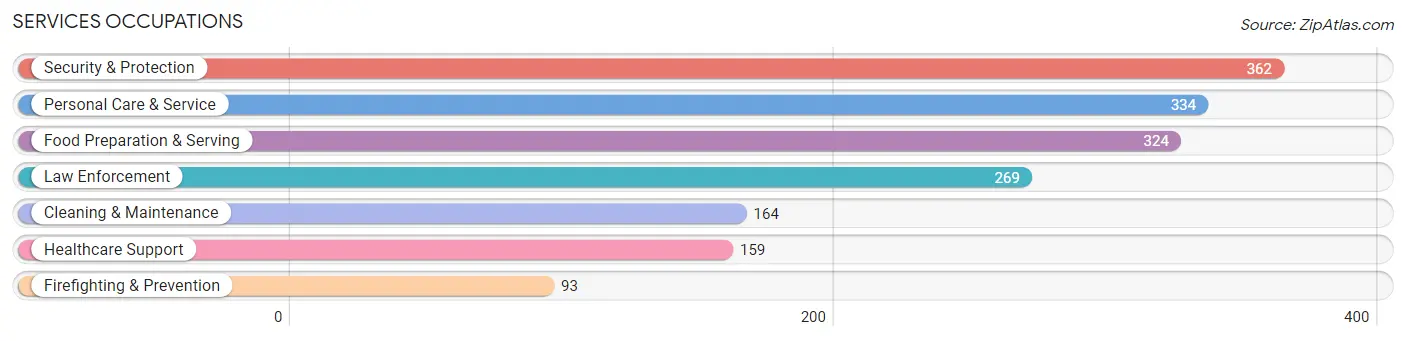
Services Occupations
The most common Services occupations in Brandon are Security & Protection (362 | 3.0%), Personal Care & Service (334 | 2.8%), Food Preparation & Serving (324 | 2.7%), Law Enforcement (269 | 2.3%), and Cleaning & Maintenance (164 | 1.4%).
Services Occupations by Sex
Within the Services occupations in Brandon, the most male-oriented occupations are Firefighting & Prevention (94.6%), Security & Protection (92.0%), and Law Enforcement (91.1%), while the most female-oriented occupations are Healthcare Support (100.0%), Food Preparation & Serving (92.3%), and Personal Care & Service (78.7%).
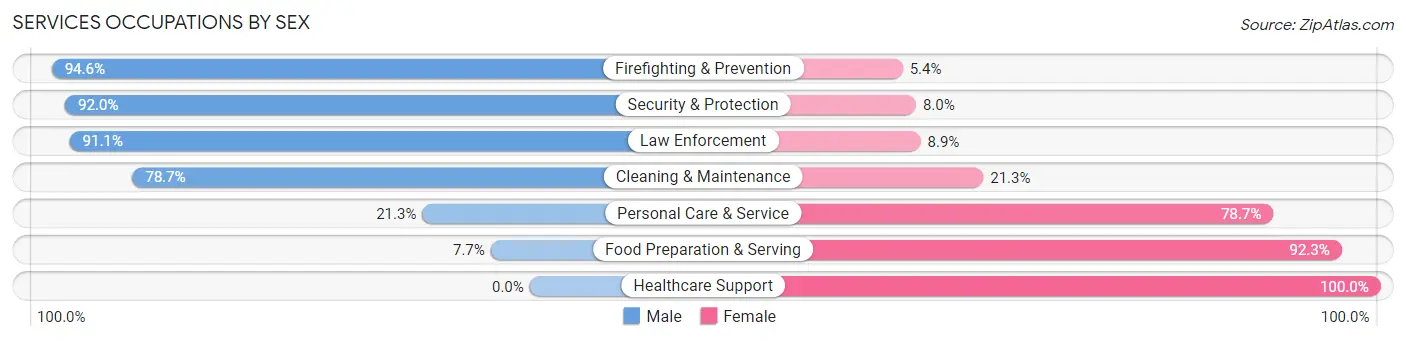
| Occupation | Male | Female |
| Healthcare Support | 0 (0.0%) | 159 (100.0%) |
| Security & Protection | 333 (92.0%) | 29 (8.0%) |
| Firefighting & Prevention | 88 (94.6%) | 5 (5.4%) |
| Law Enforcement | 245 (91.1%) | 24 (8.9%) |
| Food Preparation & Serving | 25 (7.7%) | 299 (92.3%) |
| Cleaning & Maintenance | 129 (78.7%) | 35 (21.3%) |
| Personal Care & Service | 71 (21.3%) | 263 (78.7%) |
| Total (Category) | 558 (41.5%) | 785 (58.5%) |
| Total (Overall) | 5,940 (49.8%) | 5,983 (50.2%) |
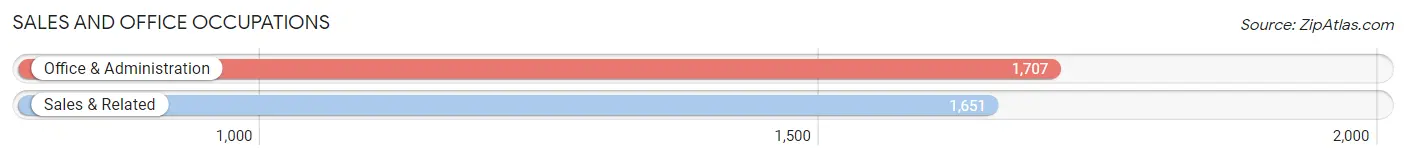
Sales and Office Occupations
The most common Sales and Office occupations in Brandon are Office & Administration (1,707 | 14.3%), and Sales & Related (1,651 | 13.9%).
Sales and Office Occupations by Sex
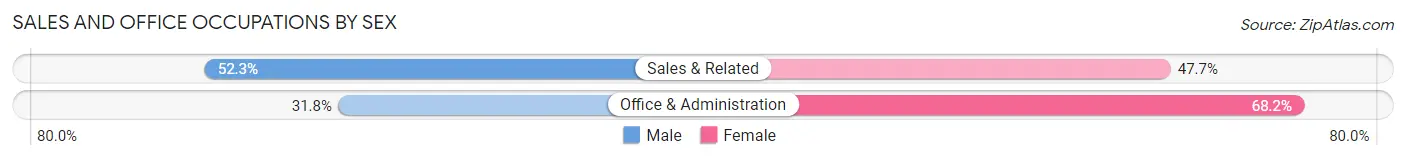
| Occupation | Male | Female |
| Sales & Related | 863 (52.3%) | 788 (47.7%) |
| Office & Administration | 543 (31.8%) | 1,164 (68.2%) |
| Total (Category) | 1,406 (41.9%) | 1,952 (58.1%) |
| Total (Overall) | 5,940 (49.8%) | 5,983 (50.2%) |
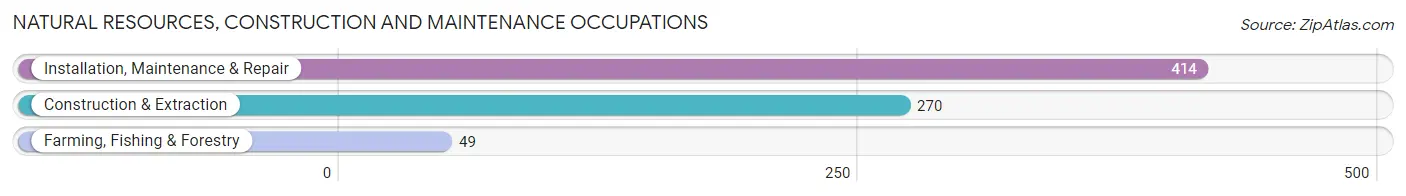
Natural Resources, Construction and Maintenance Occupations
The most common Natural Resources, Construction and Maintenance occupations in Brandon are Installation, Maintenance & Repair (414 | 3.5%), Construction & Extraction (270 | 2.3%), and Farming, Fishing & Forestry (49 | 0.4%).
Natural Resources, Construction and Maintenance Occupations by Sex
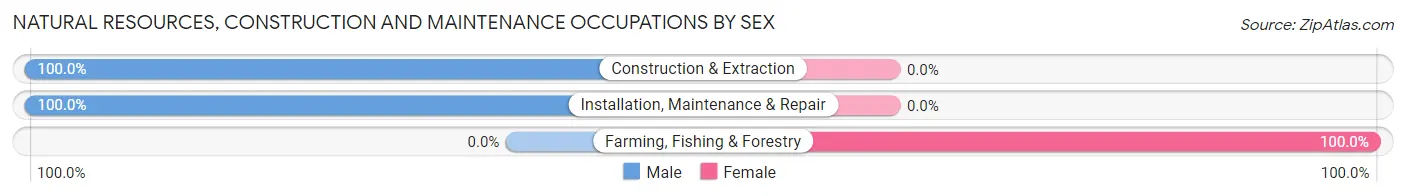
| Occupation | Male | Female |
| Farming, Fishing & Forestry | 0 (0.0%) | 49 (100.0%) |
| Construction & Extraction | 270 (100.0%) | 0 (0.0%) |
| Installation, Maintenance & Repair | 414 (100.0%) | 0 (0.0%) |
| Total (Category) | 684 (93.3%) | 49 (6.7%) |
| Total (Overall) | 5,940 (49.8%) | 5,983 (50.2%) |
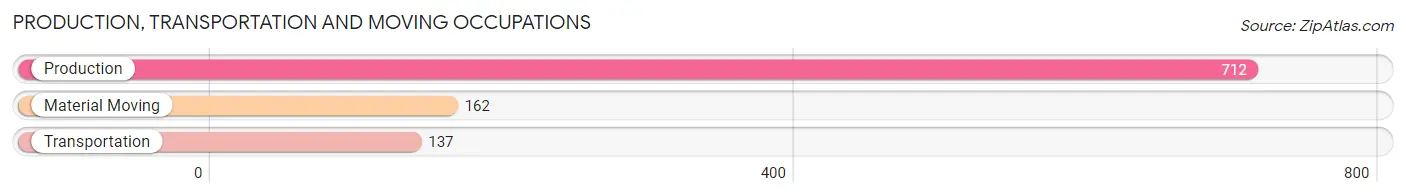
Production, Transportation and Moving Occupations
The most common Production, Transportation and Moving occupations in Brandon are Production (712 | 6.0%), Material Moving (162 | 1.4%), and Transportation (137 | 1.1%).
Production, Transportation and Moving Occupations by Sex
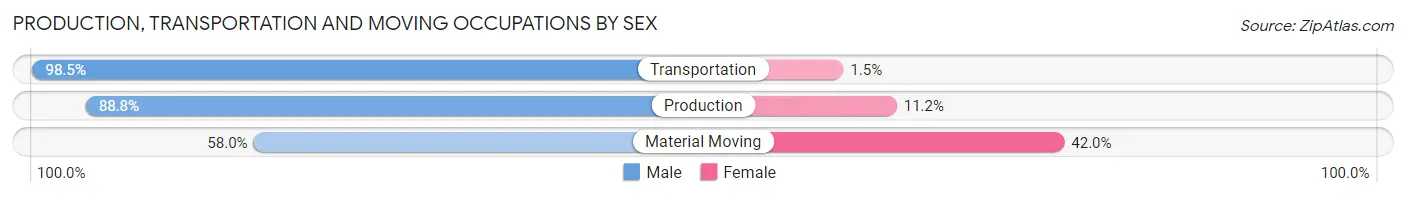
| Occupation | Male | Female |
| Production | 632 (88.8%) | 80 (11.2%) |
| Transportation | 135 (98.5%) | 2 (1.5%) |
| Material Moving | 94 (58.0%) | 68 (42.0%) |
| Total (Category) | 861 (85.2%) | 150 (14.8%) |
| Total (Overall) | 5,940 (49.8%) | 5,983 (50.2%) |
Employment Industries by Sex in Brandon
Employment Industries in Brandon
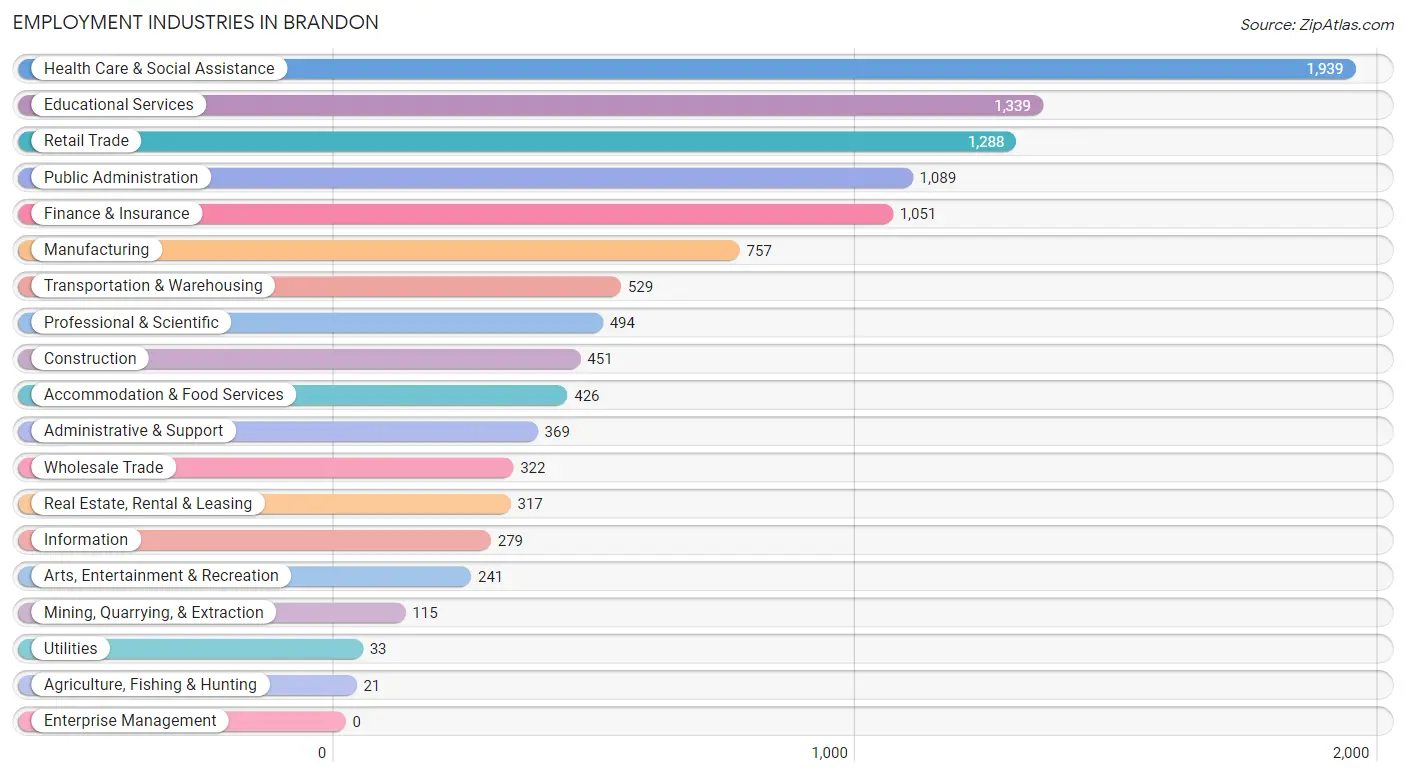
The major employment industries in Brandon include Health Care & Social Assistance (1,939 | 16.3%), Educational Services (1,339 | 11.2%), Retail Trade (1,288 | 10.8%), Public Administration (1,089 | 9.1%), and Finance & Insurance (1,051 | 8.8%).
Employment Industries by Sex in Brandon
The Brandon industries that see more men than women are Mining, Quarrying, & Extraction (100.0%), Construction (91.8%), and Real Estate, Rental & Leasing (90.8%), whereas the industries that tend to have a higher number of women are Health Care & Social Assistance (81.2%), Educational Services (69.7%), and Accommodation & Food Services (60.8%).
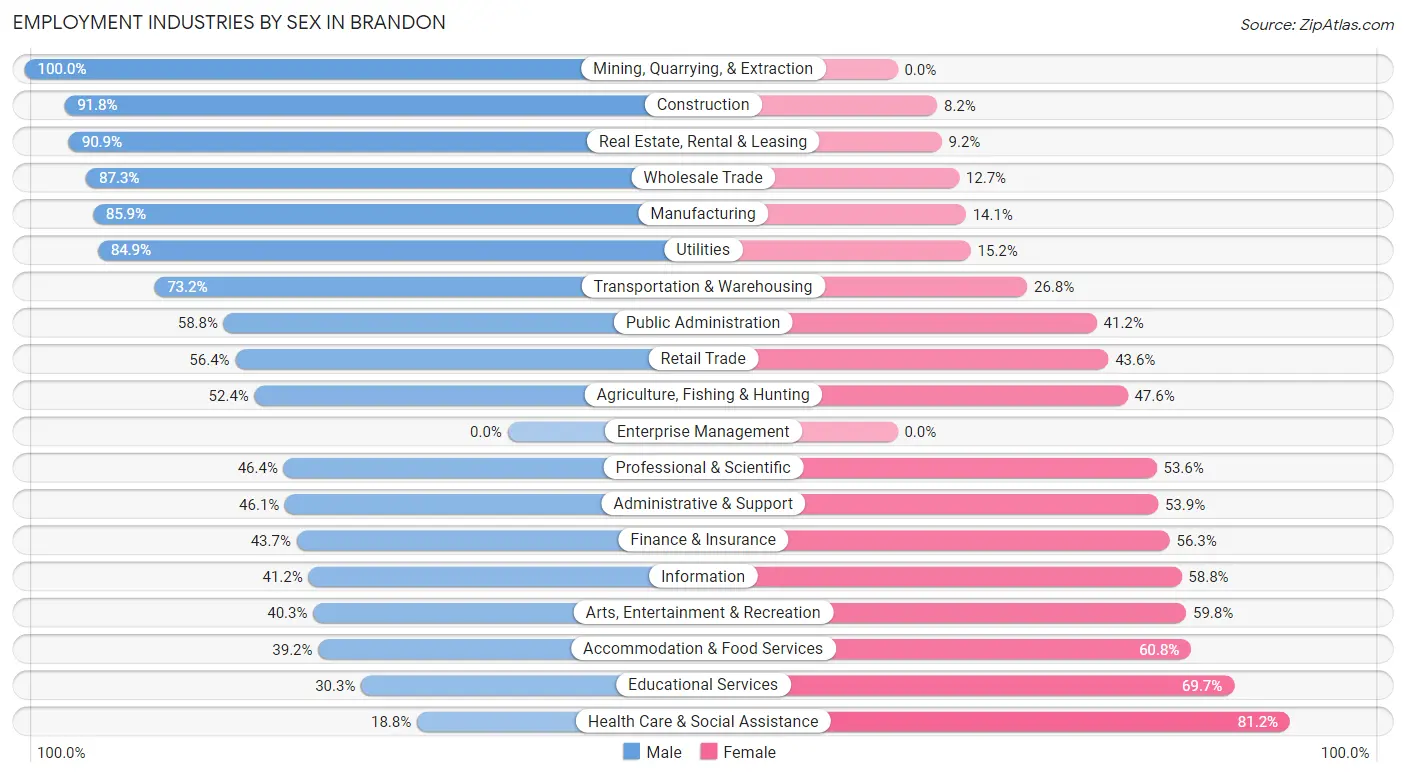
| Industry | Male | Female |
| Agriculture, Fishing & Hunting | 11 (52.4%) | 10 (47.6%) |
| Mining, Quarrying, & Extraction | 115 (100.0%) | 0 (0.0%) |
| Construction | 414 (91.8%) | 37 (8.2%) |
| Manufacturing | 650 (85.9%) | 107 (14.1%) |
| Wholesale Trade | 281 (87.3%) | 41 (12.7%) |
| Retail Trade | 726 (56.4%) | 562 (43.6%) |
| Transportation & Warehousing | 387 (73.2%) | 142 (26.8%) |
| Utilities | 28 (84.9%) | 5 (15.1%) |
| Information | 115 (41.2%) | 164 (58.8%) |
| Finance & Insurance | 459 (43.7%) | 592 (56.3%) |
| Real Estate, Rental & Leasing | 288 (90.8%) | 29 (9.1%) |
| Professional & Scientific | 229 (46.4%) | 265 (53.6%) |
| Enterprise Management | 0 (0.0%) | 0 (0.0%) |
| Administrative & Support | 170 (46.1%) | 199 (53.9%) |
| Educational Services | 406 (30.3%) | 933 (69.7%) |
| Health Care & Social Assistance | 364 (18.8%) | 1,575 (81.2%) |
| Arts, Entertainment & Recreation | 97 (40.3%) | 144 (59.8%) |
| Accommodation & Food Services | 167 (39.2%) | 259 (60.8%) |
| Public Administration | 640 (58.8%) | 449 (41.2%) |
| Total | 5,940 (49.8%) | 5,983 (50.2%) |
Education in Brandon
School Enrollment in Brandon
The most common levels of schooling among the 6,467 students in Brandon are elementary school (1,656 | 25.6%), middle school (1,434 | 22.2%), and college / undergraduate (1,243 | 19.2%).
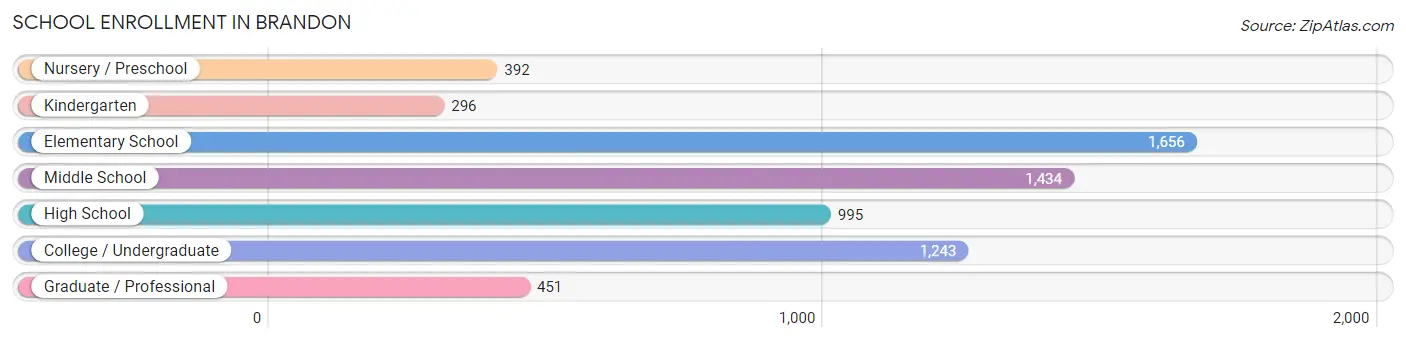
| School Level | # Students | % Students |
| Nursery / Preschool | 392 | 6.1% |
| Kindergarten | 296 | 4.6% |
| Elementary School | 1,656 | 25.6% |
| Middle School | 1,434 | 22.2% |
| High School | 995 | 15.4% |
| College / Undergraduate | 1,243 | 19.2% |
| Graduate / Professional | 451 | 7.0% |
| Total | 6,467 | 100.0% |
School Enrollment by Age by Funding Source in Brandon
Out of a total of 6,467 students who are enrolled in schools in Brandon, 1,339 (20.7%) attend a private institution, while the remaining 5,128 (79.3%) are enrolled in public schools. The age group of 3 to 4 year olds has the highest likelihood of being enrolled in private schools, with 305 (77.8% in the age bracket) enrolled. Conversely, the age group of 15 to 17 year olds has the lowest likelihood of being enrolled in a private school, with 628 (93.0% in the age bracket) attending a public institution.
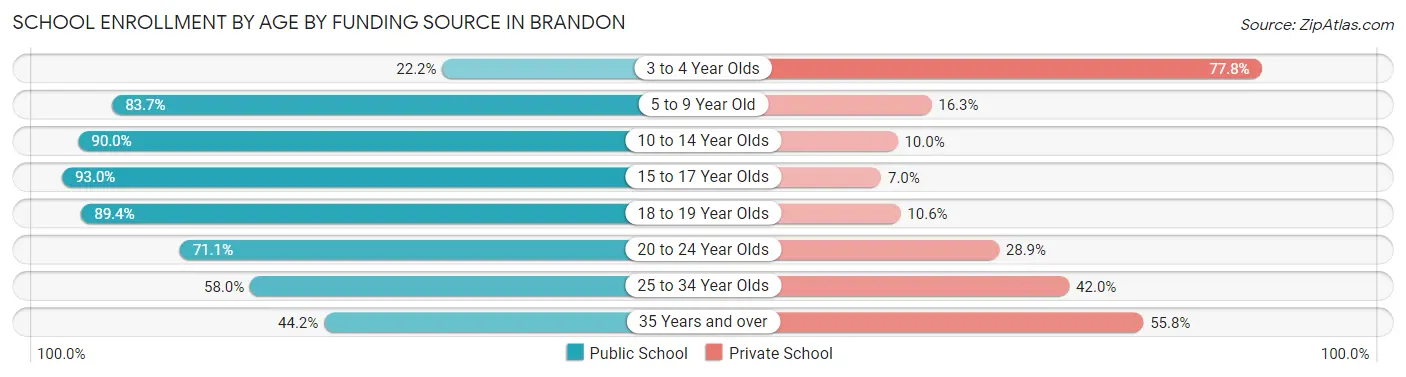
| Age Bracket | Public School | Private School |
| 3 to 4 Year Olds | 87 (22.2%) | 305 (77.8%) |
| 5 to 9 Year Old | 1,174 (83.7%) | 229 (16.3%) |
| 10 to 14 Year Olds | 1,967 (90.0%) | 219 (10.0%) |
| 15 to 17 Year Olds | 628 (93.0%) | 47 (7.0%) |
| 18 to 19 Year Olds | 516 (89.4%) | 61 (10.6%) |
| 20 to 24 Year Olds | 460 (71.1%) | 187 (28.9%) |
| 25 to 34 Year Olds | 145 (58.0%) | 105 (42.0%) |
| 35 Years and over | 149 (44.2%) | 188 (55.8%) |
| Total | 5,128 (79.3%) | 1,339 (20.7%) |
Educational Attainment by Field of Study in Brandon
Business (1,922 | 25.5%), science & technology (1,173 | 15.5%), education (1,171 | 15.5%), arts & humanities (587 | 7.8%), and bio, nature & agricultural (525 | 7.0%) are the most common fields of study among 7,545 individuals in Brandon who have obtained a bachelor's degree or higher.
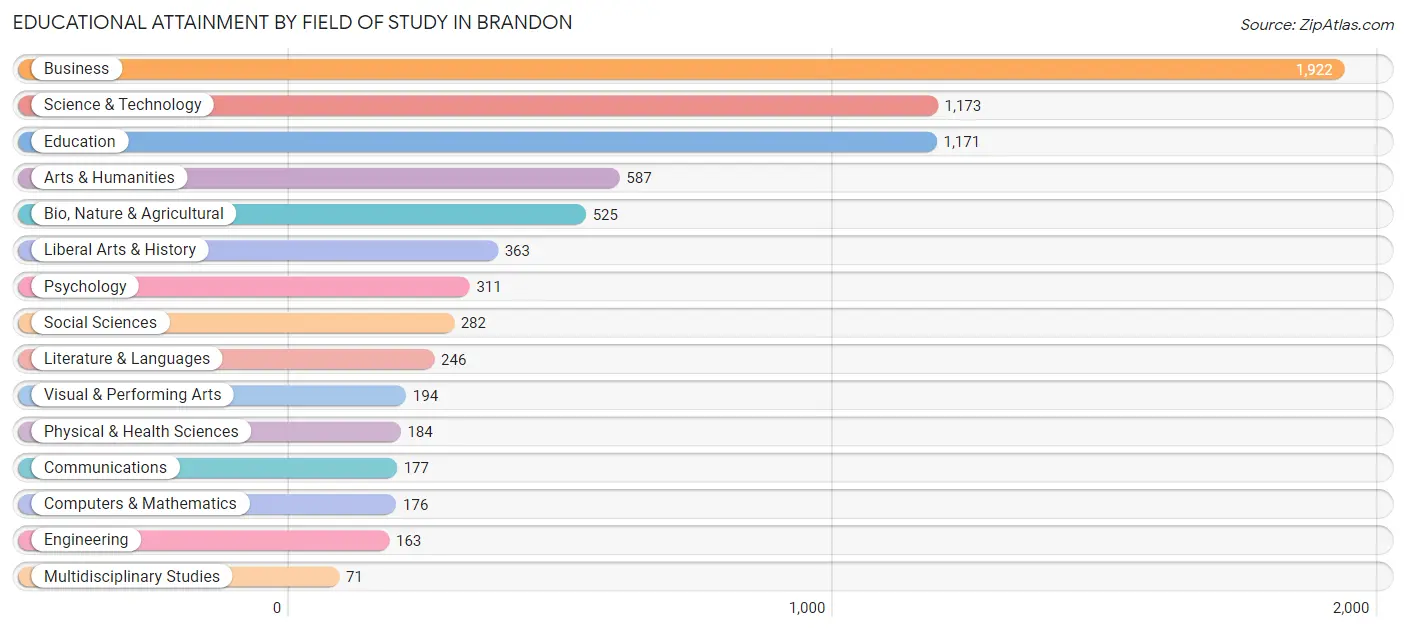
| Field of Study | # Graduates | % Graduates |
| Computers & Mathematics | 176 | 2.3% |
| Bio, Nature & Agricultural | 525 | 7.0% |
| Physical & Health Sciences | 184 | 2.4% |
| Psychology | 311 | 4.1% |
| Social Sciences | 282 | 3.7% |
| Engineering | 163 | 2.2% |
| Multidisciplinary Studies | 71 | 0.9% |
| Science & Technology | 1,173 | 15.5% |
| Business | 1,922 | 25.5% |
| Education | 1,171 | 15.5% |
| Literature & Languages | 246 | 3.3% |
| Liberal Arts & History | 363 | 4.8% |
| Visual & Performing Arts | 194 | 2.6% |
| Communications | 177 | 2.4% |
| Arts & Humanities | 587 | 7.8% |
| Total | 7,545 | 100.0% |
Transportation & Commute in Brandon
Vehicle Availability by Sex in Brandon
The most prevalent vehicle ownership categories in Brandon are males with 2 vehicles (2,456, accounting for 41.2%) and females with 2 vehicles (2,201, making up 41.7%).
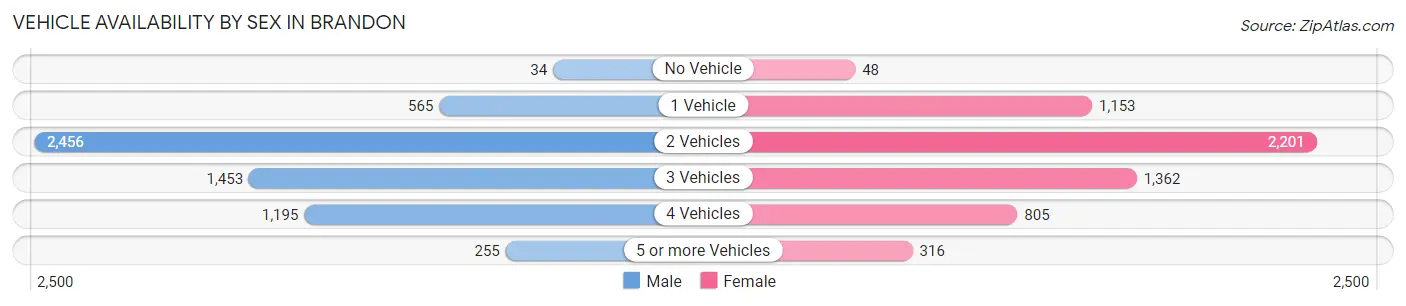
| Vehicles Available | Male | Female |
| No Vehicle | 34 (0.6%) | 48 (0.8%) |
| 1 Vehicle | 565 (9.5%) | 1,153 (19.6%) |
| 2 Vehicles | 2,456 (41.2%) | 2,201 (37.4%) |
| 3 Vehicles | 1,453 (24.4%) | 1,362 (23.1%) |
| 4 Vehicles | 1,195 (20.1%) | 805 (13.7%) |
| 5 or more Vehicles | 255 (4.3%) | 316 (5.4%) |
| Total | 5,958 (100.0%) | 5,885 (100.0%) |
Commute Time in Brandon
The most frequently occuring commute durations in Brandon are 20 to 24 minutes (2,541 commuters, 22.3%), 30 to 34 minutes (2,499 commuters, 22.0%), and 15 to 19 minutes (1,907 commuters, 16.8%).
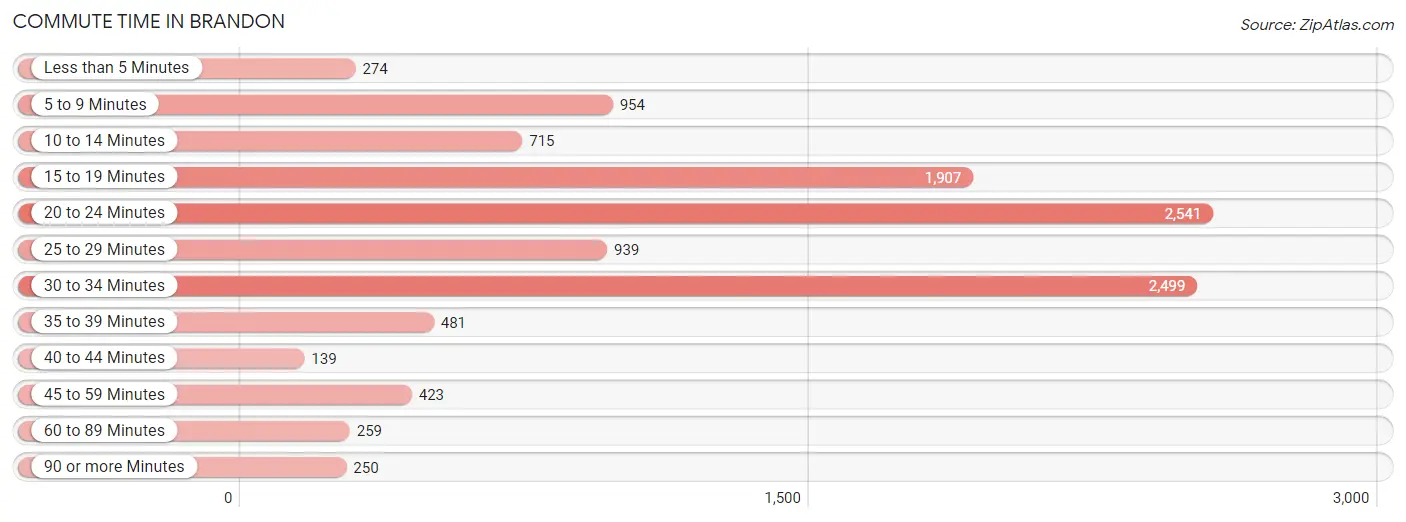
| Commute Time | # Commuters | % Commuters |
| Less than 5 Minutes | 274 | 2.4% |
| 5 to 9 Minutes | 954 | 8.4% |
| 10 to 14 Minutes | 715 | 6.3% |
| 15 to 19 Minutes | 1,907 | 16.8% |
| 20 to 24 Minutes | 2,541 | 22.3% |
| 25 to 29 Minutes | 939 | 8.3% |
| 30 to 34 Minutes | 2,499 | 22.0% |
| 35 to 39 Minutes | 481 | 4.2% |
| 40 to 44 Minutes | 139 | 1.2% |
| 45 to 59 Minutes | 423 | 3.7% |
| 60 to 89 Minutes | 259 | 2.3% |
| 90 or more Minutes | 250 | 2.2% |
Commute Time by Sex in Brandon
The most common commute times in Brandon are 20 to 24 minutes (1,558 commuters, 27.3%) for males and 30 to 34 minutes (1,405 commuters, 24.7%) for females.
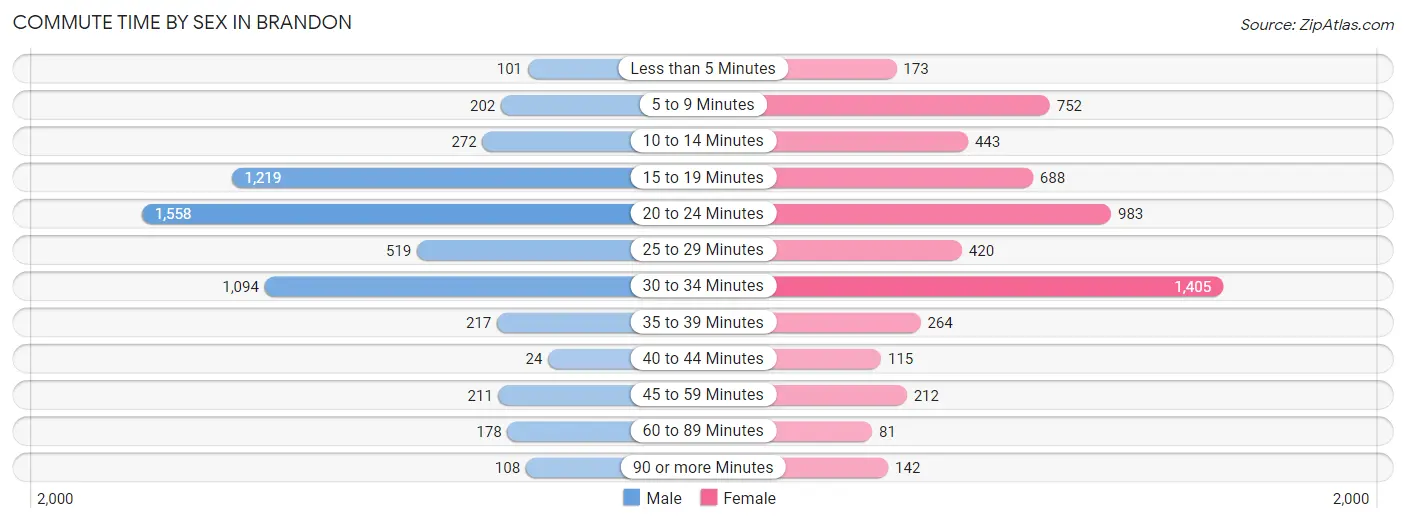
| Commute Time | Male | Female |
| Less than 5 Minutes | 101 (1.8%) | 173 (3.0%) |
| 5 to 9 Minutes | 202 (3.5%) | 752 (13.2%) |
| 10 to 14 Minutes | 272 (4.8%) | 443 (7.8%) |
| 15 to 19 Minutes | 1,219 (21.4%) | 688 (12.1%) |
| 20 to 24 Minutes | 1,558 (27.3%) | 983 (17.3%) |
| 25 to 29 Minutes | 519 (9.1%) | 420 (7.4%) |
| 30 to 34 Minutes | 1,094 (19.2%) | 1,405 (24.7%) |
| 35 to 39 Minutes | 217 (3.8%) | 264 (4.6%) |
| 40 to 44 Minutes | 24 (0.4%) | 115 (2.0%) |
| 45 to 59 Minutes | 211 (3.7%) | 212 (3.7%) |
| 60 to 89 Minutes | 178 (3.1%) | 81 (1.4%) |
| 90 or more Minutes | 108 (1.9%) | 142 (2.5%) |
Time of Departure to Work by Sex in Brandon
The most frequent times of departure to work in Brandon are 7:00 AM to 7:29 AM (890, 15.6%) for males and 7:00 AM to 7:29 AM (1,285, 22.6%) for females.
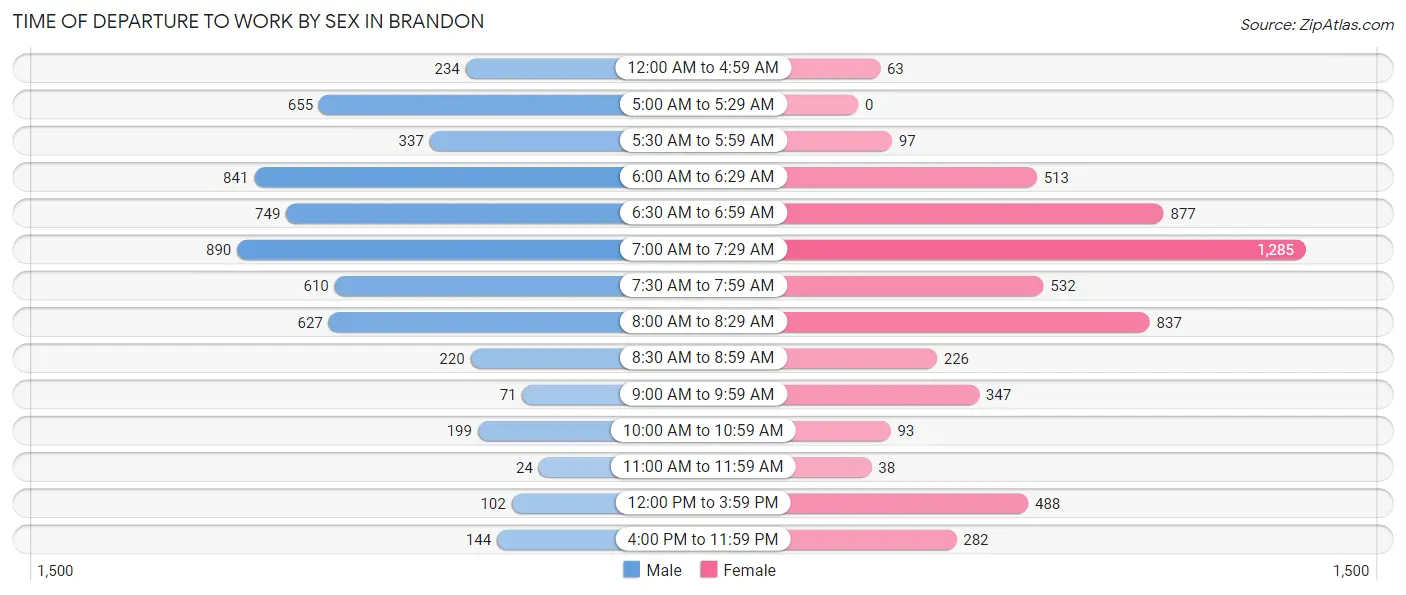
| Time of Departure | Male | Female |
| 12:00 AM to 4:59 AM | 234 (4.1%) | 63 (1.1%) |
| 5:00 AM to 5:29 AM | 655 (11.5%) | 0 (0.0%) |
| 5:30 AM to 5:59 AM | 337 (5.9%) | 97 (1.7%) |
| 6:00 AM to 6:29 AM | 841 (14.7%) | 513 (9.0%) |
| 6:30 AM to 6:59 AM | 749 (13.1%) | 877 (15.4%) |
| 7:00 AM to 7:29 AM | 890 (15.6%) | 1,285 (22.6%) |
| 7:30 AM to 7:59 AM | 610 (10.7%) | 532 (9.4%) |
| 8:00 AM to 8:29 AM | 627 (11.0%) | 837 (14.7%) |
| 8:30 AM to 8:59 AM | 220 (3.9%) | 226 (4.0%) |
| 9:00 AM to 9:59 AM | 71 (1.2%) | 347 (6.1%) |
| 10:00 AM to 10:59 AM | 199 (3.5%) | 93 (1.6%) |
| 11:00 AM to 11:59 AM | 24 (0.4%) | 38 (0.7%) |
| 12:00 PM to 3:59 PM | 102 (1.8%) | 488 (8.6%) |
| 4:00 PM to 11:59 PM | 144 (2.5%) | 282 (5.0%) |
| Total | 5,703 (100.0%) | 5,678 (100.0%) |
Housing Occupancy in Brandon
Occupancy by Ownership in Brandon
Of the total 9,286 dwellings in Brandon, owner-occupied units account for 7,526 (81.0%), while renter-occupied units make up 1,760 (19.0%).
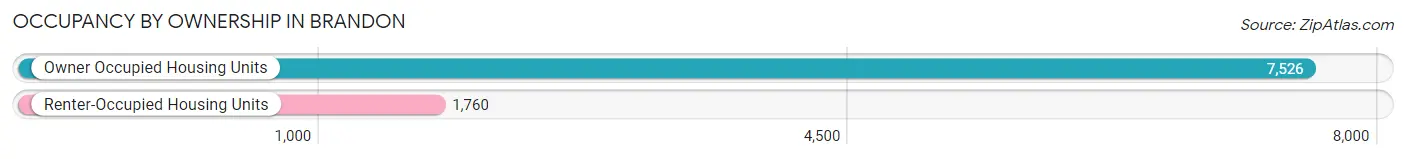
| Occupancy | # Housing Units | % Housing Units |
| Owner Occupied Housing Units | 7,526 | 81.0% |
| Renter-Occupied Housing Units | 1,760 | 19.0% |
| Total Occupied Housing Units | 9,286 | 100.0% |
Occupancy by Household Size in Brandon
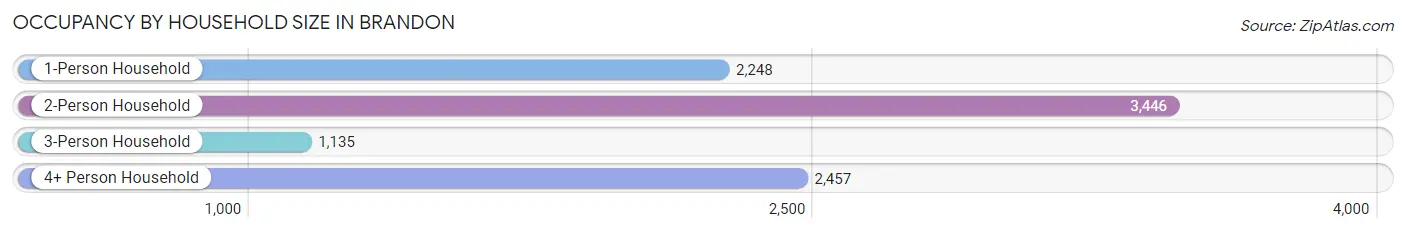
| Household Size | # Housing Units | % Housing Units |
| 1-Person Household | 2,248 | 24.2% |
| 2-Person Household | 3,446 | 37.1% |
| 3-Person Household | 1,135 | 12.2% |
| 4+ Person Household | 2,457 | 26.5% |
| Total Housing Units | 9,286 | 100.0% |
Occupancy by Ownership by Household Size in Brandon
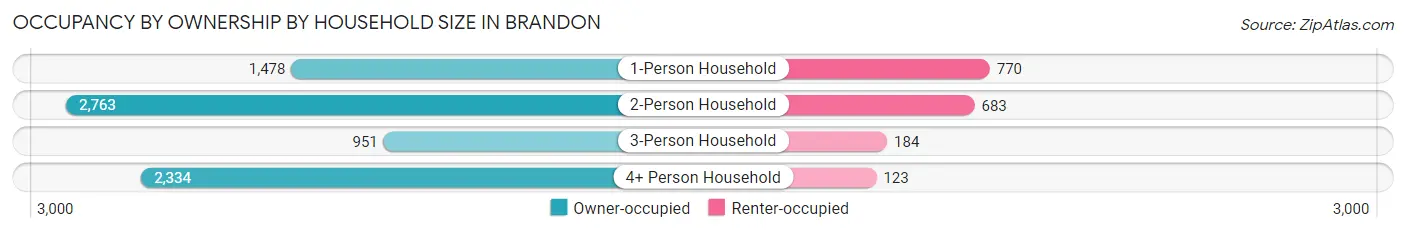
| Household Size | Owner-occupied | Renter-occupied |
| 1-Person Household | 1,478 (65.7%) | 770 (34.3%) |
| 2-Person Household | 2,763 (80.2%) | 683 (19.8%) |
| 3-Person Household | 951 (83.8%) | 184 (16.2%) |
| 4+ Person Household | 2,334 (95.0%) | 123 (5.0%) |
| Total Housing Units | 7,526 (81.0%) | 1,760 (19.0%) |
Occupancy by Educational Attainment in Brandon
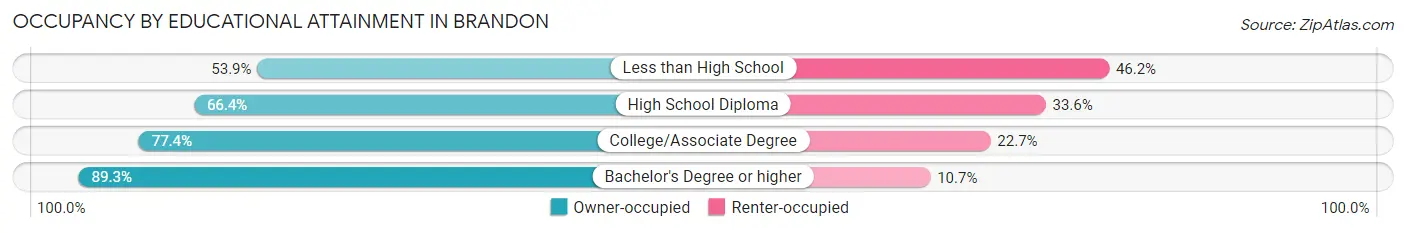
| Household Size | Owner-occupied | Renter-occupied |
| Less than High School | 91 (53.8%) | 78 (46.2%) |
| High School Diploma | 991 (66.4%) | 501 (33.6%) |
| College/Associate Degree | 2,356 (77.3%) | 690 (22.7%) |
| Bachelor's Degree or higher | 4,088 (89.3%) | 491 (10.7%) |
Occupancy by Age of Householder in Brandon
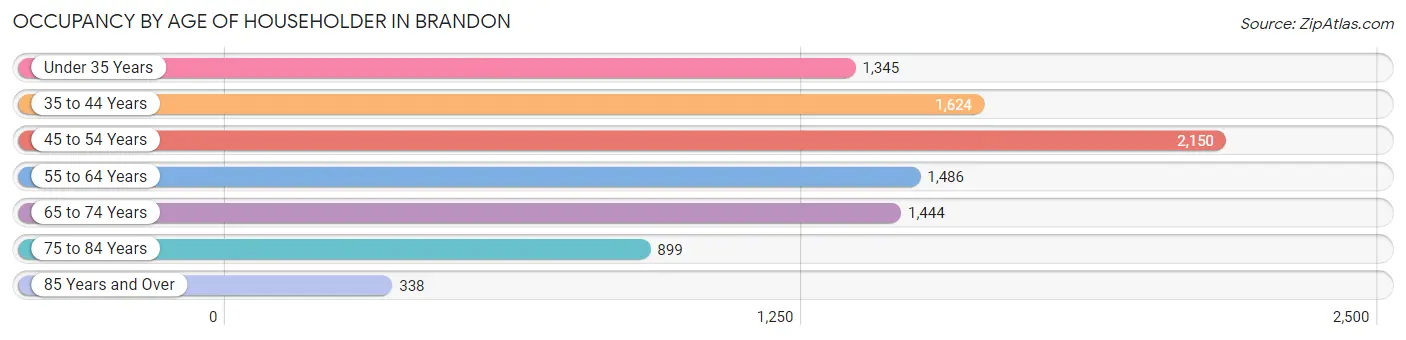
| Age Bracket | # Households | % Households |
| Under 35 Years | 1,345 | 14.5% |
| 35 to 44 Years | 1,624 | 17.5% |
| 45 to 54 Years | 2,150 | 23.2% |
| 55 to 64 Years | 1,486 | 16.0% |
| 65 to 74 Years | 1,444 | 15.5% |
| 75 to 84 Years | 899 | 9.7% |
| 85 Years and Over | 338 | 3.6% |
| Total | 9,286 | 100.0% |
Housing Finances in Brandon
Median Income by Occupancy in Brandon
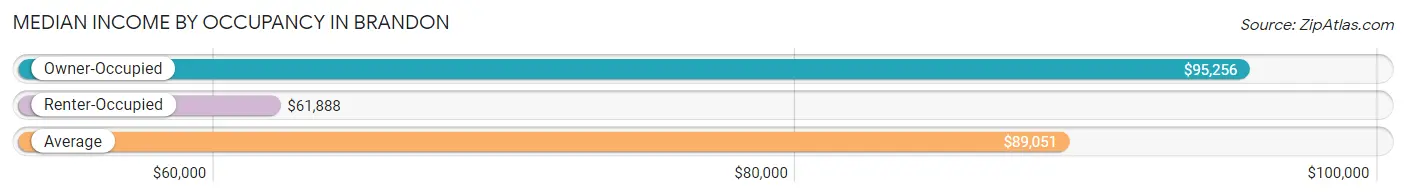
| Occupancy Type | # Households | Median Income |
| Owner-Occupied | 7,526 (81.0%) | $95,256 |
| Renter-Occupied | 1,760 (19.0%) | $61,888 |
| Average | 9,286 (100.0%) | $89,051 |
Occupancy by Householder Income Bracket in Brandon
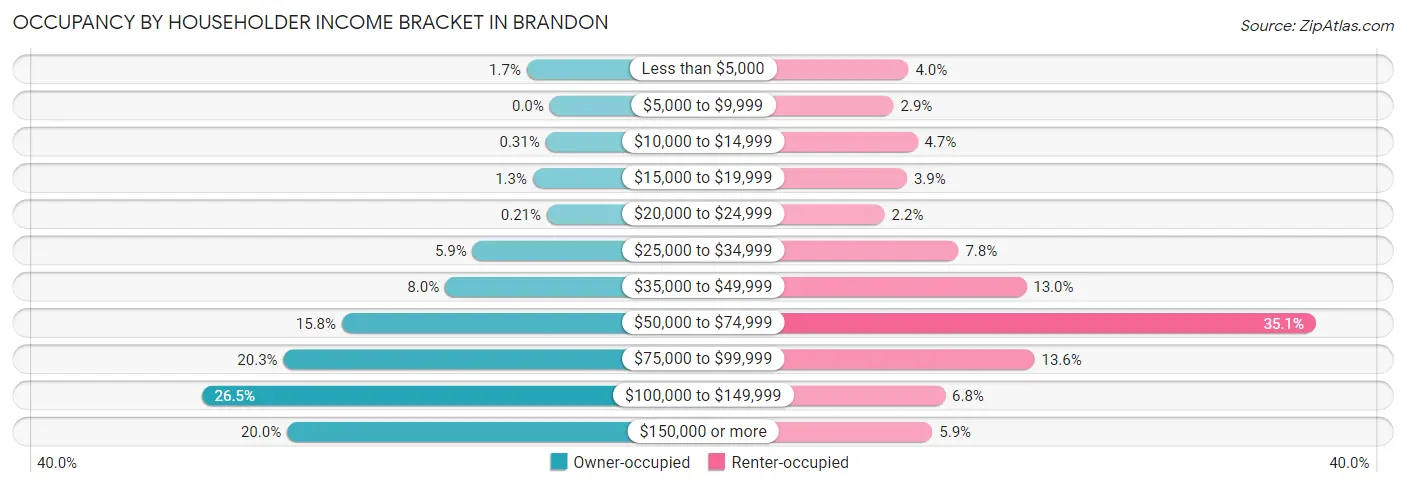
| Income Bracket | Owner-occupied | Renter-occupied |
| Less than $5,000 | 131 (1.7%) | 71 (4.0%) |
| $5,000 to $9,999 | 0 (0.0%) | 51 (2.9%) |
| $10,000 to $14,999 | 23 (0.3%) | 83 (4.7%) |
| $15,000 to $19,999 | 96 (1.3%) | 69 (3.9%) |
| $20,000 to $24,999 | 16 (0.2%) | 39 (2.2%) |
| $25,000 to $34,999 | 442 (5.9%) | 138 (7.8%) |
| $35,000 to $49,999 | 600 (8.0%) | 229 (13.0%) |
| $50,000 to $74,999 | 1,191 (15.8%) | 617 (35.1%) |
| $75,000 to $99,999 | 1,526 (20.3%) | 240 (13.6%) |
| $100,000 to $149,999 | 1,995 (26.5%) | 120 (6.8%) |
| $150,000 or more | 1,506 (20.0%) | 103 (5.9%) |
| Total | 7,526 (100.0%) | 1,760 (100.0%) |
Monthly Housing Cost Tiers in Brandon
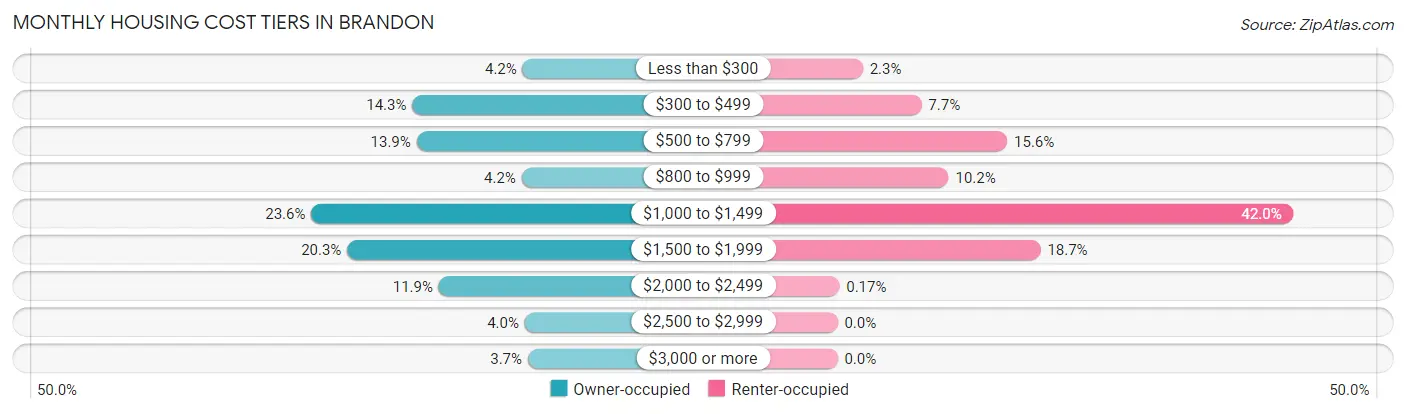
| Monthly Cost | Owner-occupied | Renter-occupied |
| Less than $300 | 312 (4.2%) | 41 (2.3%) |
| $300 to $499 | 1,077 (14.3%) | 136 (7.7%) |
| $500 to $799 | 1,047 (13.9%) | 275 (15.6%) |
| $800 to $999 | 319 (4.2%) | 180 (10.2%) |
| $1,000 to $1,499 | 1,777 (23.6%) | 739 (42.0%) |
| $1,500 to $1,999 | 1,528 (20.3%) | 329 (18.7%) |
| $2,000 to $2,499 | 893 (11.9%) | 3 (0.2%) |
| $2,500 to $2,999 | 297 (4.0%) | 0 (0.0%) |
| $3,000 or more | 276 (3.7%) | 0 (0.0%) |
| Total | 7,526 (100.0%) | 1,760 (100.0%) |
Physical Housing Characteristics in Brandon
Housing Structures in Brandon
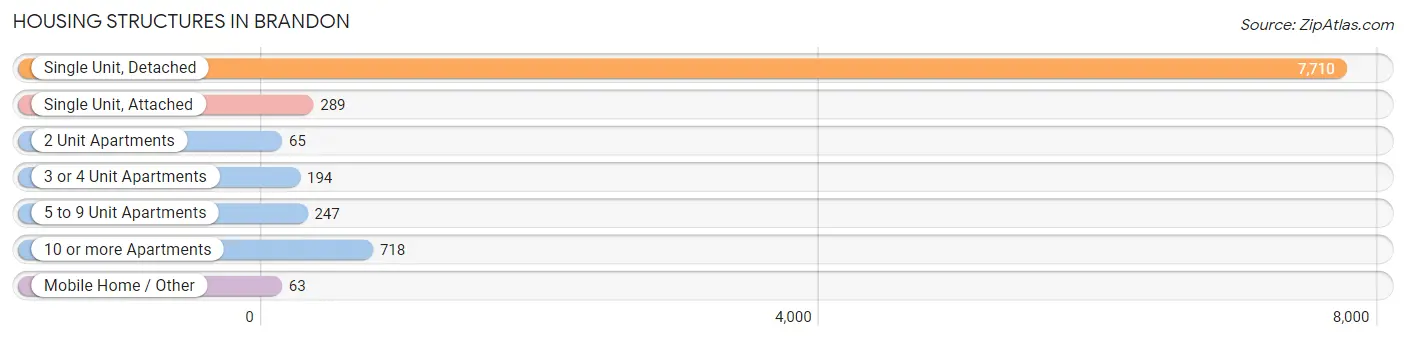
| Structure Type | # Housing Units | % Housing Units |
| Single Unit, Detached | 7,710 | 83.0% |
| Single Unit, Attached | 289 | 3.1% |
| 2 Unit Apartments | 65 | 0.7% |
| 3 or 4 Unit Apartments | 194 | 2.1% |
| 5 to 9 Unit Apartments | 247 | 2.7% |
| 10 or more Apartments | 718 | 7.7% |
| Mobile Home / Other | 63 | 0.7% |
| Total | 9,286 | 100.0% |
Housing Structures by Occupancy in Brandon
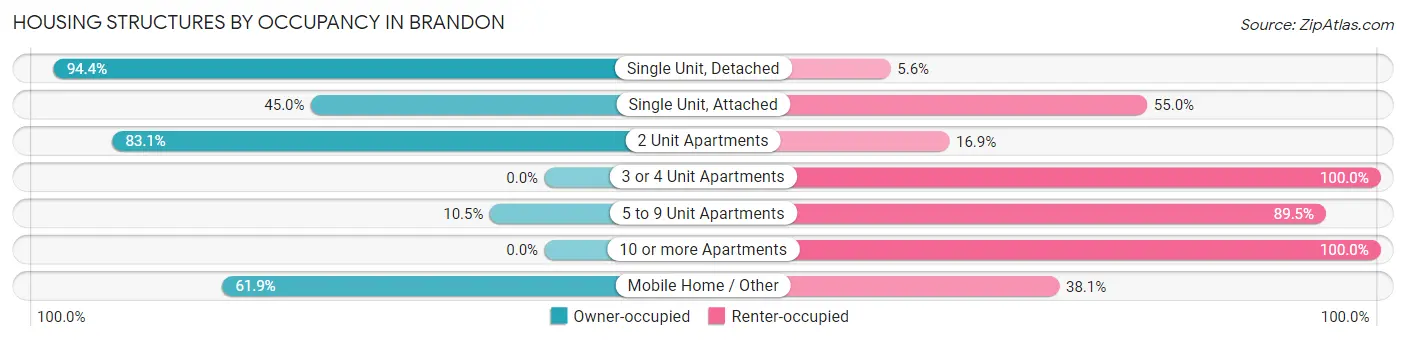
| Structure Type | Owner-occupied | Renter-occupied |
| Single Unit, Detached | 7,277 (94.4%) | 433 (5.6%) |
| Single Unit, Attached | 130 (45.0%) | 159 (55.0%) |
| 2 Unit Apartments | 54 (83.1%) | 11 (16.9%) |
| 3 or 4 Unit Apartments | 0 (0.0%) | 194 (100.0%) |
| 5 to 9 Unit Apartments | 26 (10.5%) | 221 (89.5%) |
| 10 or more Apartments | 0 (0.0%) | 718 (100.0%) |
| Mobile Home / Other | 39 (61.9%) | 24 (38.1%) |
| Total | 7,526 (81.0%) | 1,760 (19.0%) |
Housing Structures by Number of Rooms in Brandon
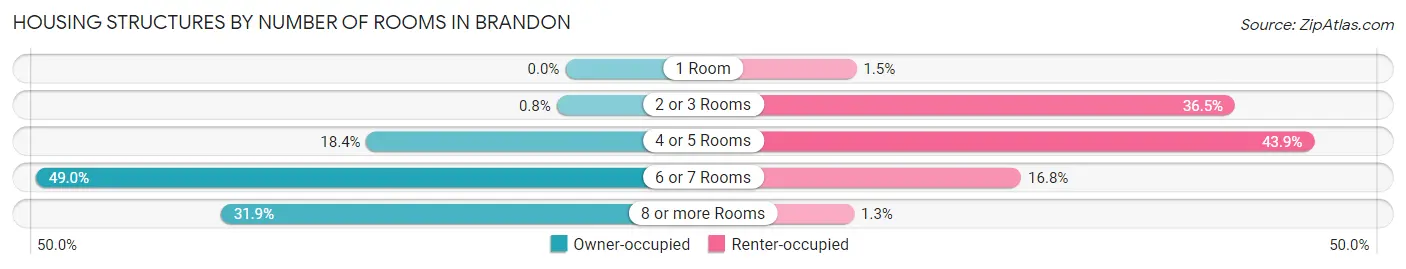
| Number of Rooms | Owner-occupied | Renter-occupied |
| 1 Room | 0 (0.0%) | 27 (1.5%) |
| 2 or 3 Rooms | 60 (0.8%) | 643 (36.5%) |
| 4 or 5 Rooms | 1,384 (18.4%) | 772 (43.9%) |
| 6 or 7 Rooms | 3,685 (49.0%) | 295 (16.8%) |
| 8 or more Rooms | 2,397 (31.9%) | 23 (1.3%) |
| Total | 7,526 (100.0%) | 1,760 (100.0%) |
Housing Structure by Heating Type in Brandon
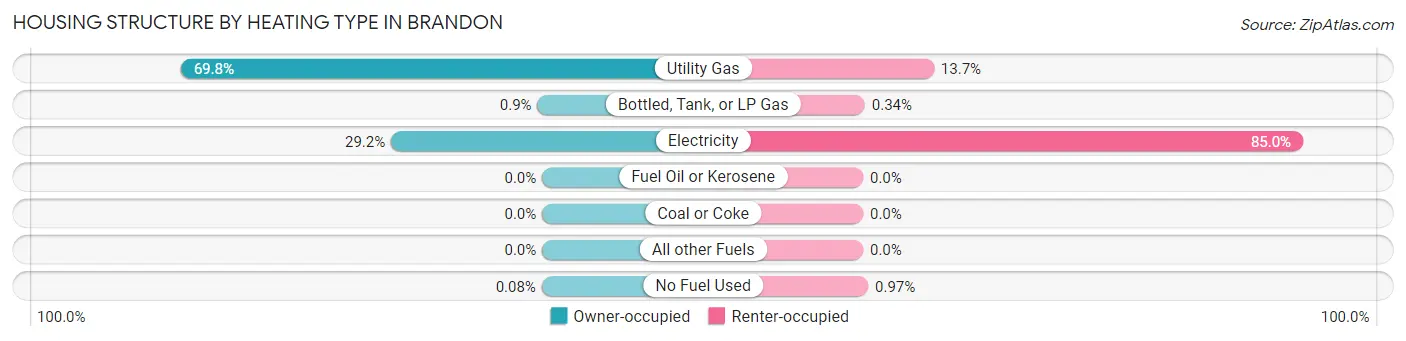
| Heating Type | Owner-occupied | Renter-occupied |
| Utility Gas | 5,255 (69.8%) | 241 (13.7%) |
| Bottled, Tank, or LP Gas | 68 (0.9%) | 6 (0.3%) |
| Electricity | 2,197 (29.2%) | 1,496 (85.0%) |
| Fuel Oil or Kerosene | 0 (0.0%) | 0 (0.0%) |
| Coal or Coke | 0 (0.0%) | 0 (0.0%) |
| All other Fuels | 0 (0.0%) | 0 (0.0%) |
| No Fuel Used | 6 (0.1%) | 17 (1.0%) |
| Total | 7,526 (100.0%) | 1,760 (100.0%) |
Household Vehicle Usage in Brandon
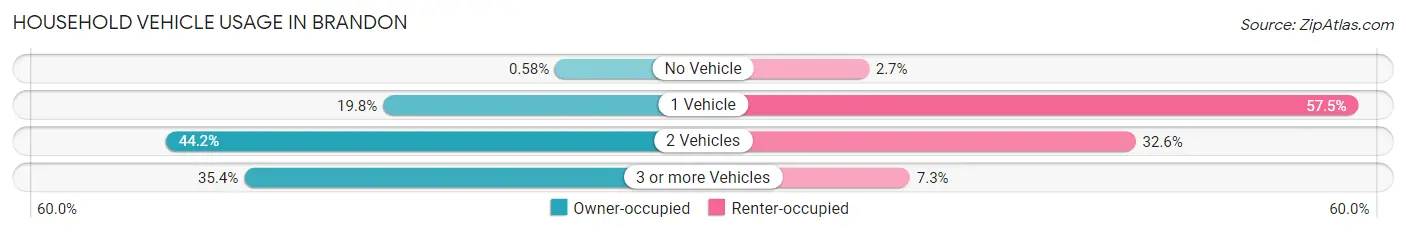
| Vehicles per Household | Owner-occupied | Renter-occupied |
| No Vehicle | 44 (0.6%) | 47 (2.7%) |
| 1 Vehicle | 1,493 (19.8%) | 1,012 (57.5%) |
| 2 Vehicles | 3,324 (44.2%) | 573 (32.6%) |
| 3 or more Vehicles | 2,665 (35.4%) | 128 (7.3%) |
| Total | 7,526 (100.0%) | 1,760 (100.0%) |
Real Estate & Mortgages in Brandon
Real Estate and Mortgage Overview in Brandon
| Characteristic | Without Mortgage | With Mortgage |
| Housing Units | 2,470 | 5,056 |
| Median Property Value | $236,300 | $247,700 |
| Median Household Income | $88,099 | $1,183 |
| Monthly Housing Costs | $479 | $276 |
| Real Estate Taxes | $1,304 | $117 |
Property Value by Mortgage Status in Brandon
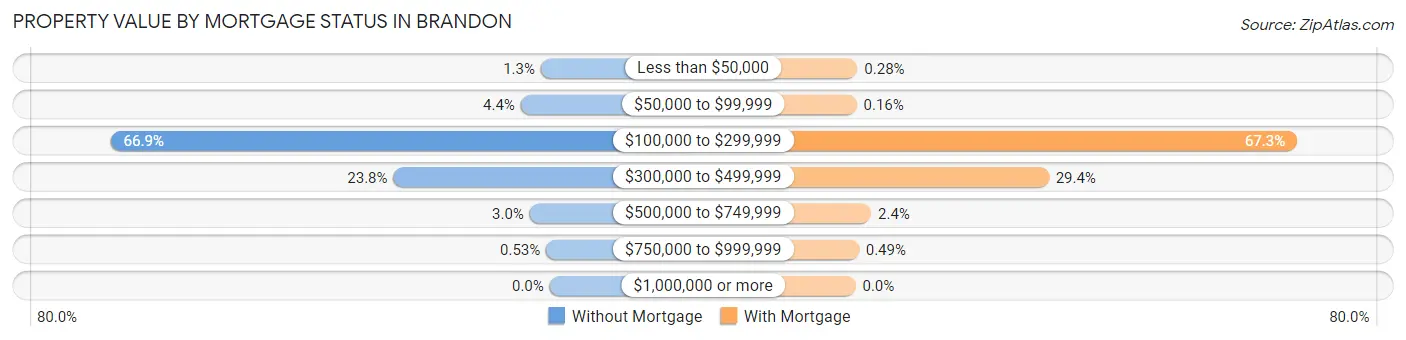
| Property Value | Without Mortgage | With Mortgage |
| Less than $50,000 | 33 (1.3%) | 14 (0.3%) |
| $50,000 to $99,999 | 109 (4.4%) | 8 (0.2%) |
| $100,000 to $299,999 | 1,652 (66.9%) | 3,401 (67.3%) |
| $300,000 to $499,999 | 588 (23.8%) | 1,488 (29.4%) |
| $500,000 to $749,999 | 75 (3.0%) | 120 (2.4%) |
| $750,000 to $999,999 | 13 (0.5%) | 25 (0.5%) |
| $1,000,000 or more | 0 (0.0%) | 0 (0.0%) |
| Total | 2,470 (100.0%) | 5,056 (100.0%) |
Household Income by Mortgage Status in Brandon
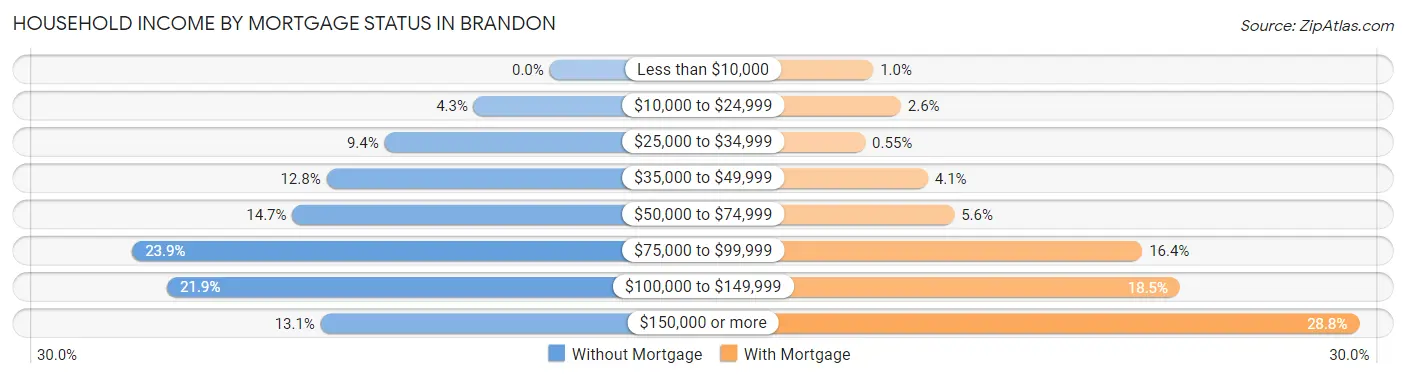
| Household Income | Without Mortgage | With Mortgage |
| Less than $10,000 | 0 (0.0%) | 51 (1.0%) |
| $10,000 to $24,999 | 107 (4.3%) | 131 (2.6%) |
| $25,000 to $34,999 | 233 (9.4%) | 28 (0.5%) |
| $35,000 to $49,999 | 315 (12.8%) | 209 (4.1%) |
| $50,000 to $74,999 | 363 (14.7%) | 285 (5.6%) |
| $75,000 to $99,999 | 589 (23.8%) | 828 (16.4%) |
| $100,000 to $149,999 | 540 (21.9%) | 937 (18.5%) |
| $150,000 or more | 323 (13.1%) | 1,455 (28.8%) |
| Total | 2,470 (100.0%) | 5,056 (100.0%) |
Property Value to Household Income Ratio in Brandon
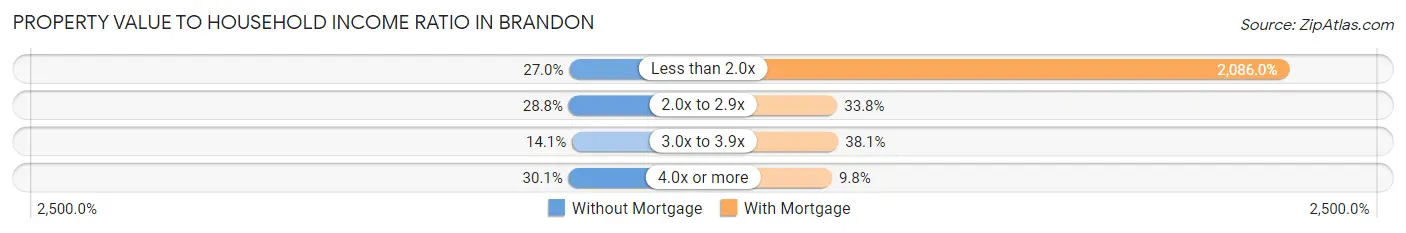
| Value-to-Income Ratio | Without Mortgage | With Mortgage |
| Less than 2.0x | 667 (27.0%) | 105,466 (2,086.0%) |
| 2.0x to 2.9x | 712 (28.8%) | 1,708 (33.8%) |
| 3.0x to 3.9x | 348 (14.1%) | 1,926 (38.1%) |
| 4.0x or more | 743 (30.1%) | 493 (9.8%) |
| Total | 2,470 (100.0%) | 5,056 (100.0%) |
Real Estate Taxes by Mortgage Status in Brandon
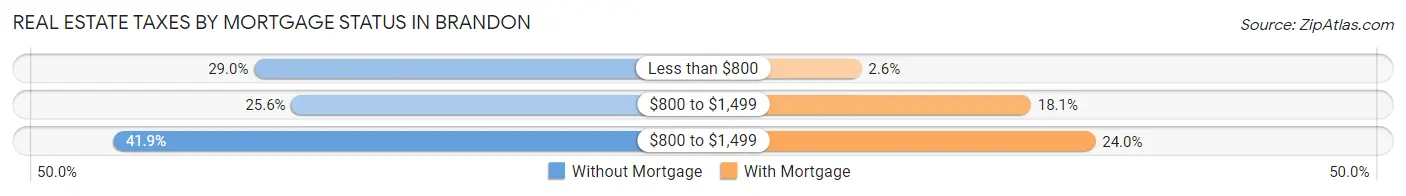
| Property Taxes | Without Mortgage | With Mortgage |
| Less than $800 | 717 (29.0%) | 131 (2.6%) |
| $800 to $1,499 | 633 (25.6%) | 913 (18.1%) |
| $800 to $1,499 | 1,036 (41.9%) | 1,211 (23.9%) |
| Total | 2,470 (100.0%) | 5,056 (100.0%) |
Health & Disability in Brandon
Health Insurance Coverage by Age in Brandon
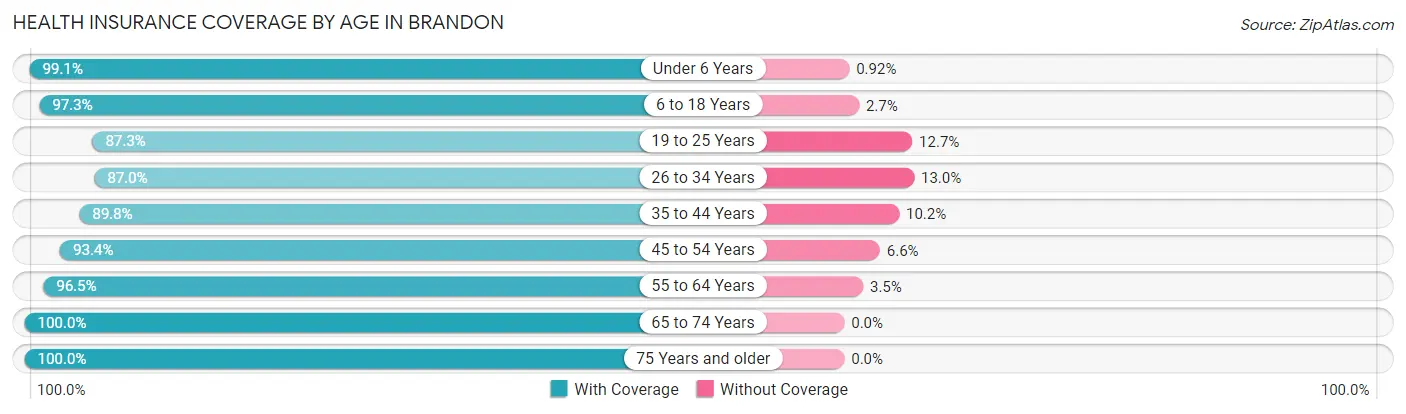
| Age Bracket | With Coverage | Without Coverage |
| Under 6 Years | 1,620 (99.1%) | 15 (0.9%) |
| 6 to 18 Years | 4,363 (97.3%) | 123 (2.7%) |
| 19 to 25 Years | 2,091 (87.3%) | 303 (12.7%) |
| 26 to 34 Years | 1,553 (87.0%) | 232 (13.0%) |
| 35 to 44 Years | 2,735 (89.8%) | 311 (10.2%) |
| 45 to 54 Years | 3,396 (93.4%) | 241 (6.6%) |
| 55 to 64 Years | 2,656 (96.5%) | 96 (3.5%) |
| 65 to 74 Years | 2,460 (100.0%) | 0 (0.0%) |
| 75 Years and older | 1,895 (100.0%) | 0 (0.0%) |
| Total | 22,769 (94.5%) | 1,321 (5.5%) |
Health Insurance Coverage by Citizenship Status in Brandon
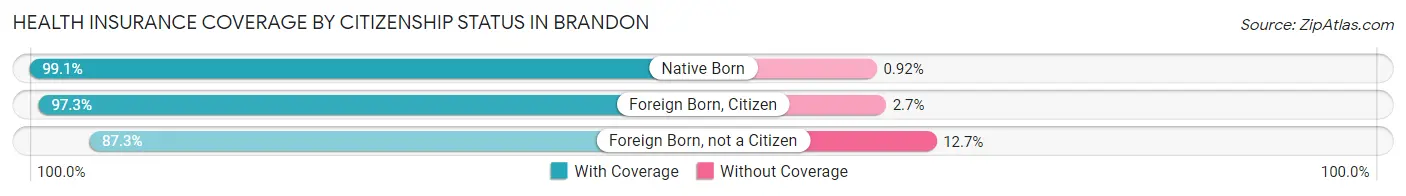
| Citizenship Status | With Coverage | Without Coverage |
| Native Born | 1,620 (99.1%) | 15 (0.9%) |
| Foreign Born, Citizen | 4,363 (97.3%) | 123 (2.7%) |
| Foreign Born, not a Citizen | 2,091 (87.3%) | 303 (12.7%) |
Health Insurance Coverage by Household Income in Brandon
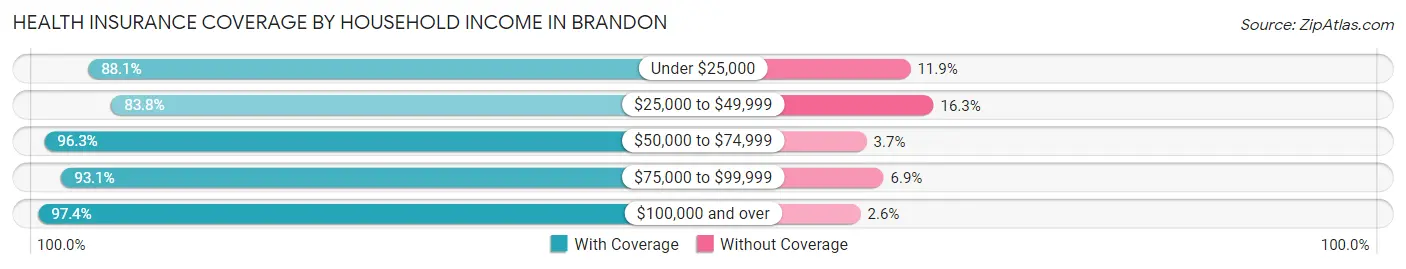
| Household Income | With Coverage | Without Coverage |
| Under $25,000 | 974 (88.1%) | 132 (11.9%) |
| $25,000 to $49,999 | 2,257 (83.8%) | 438 (16.3%) |
| $50,000 to $74,999 | 4,145 (96.3%) | 160 (3.7%) |
| $75,000 to $99,999 | 3,905 (93.1%) | 289 (6.9%) |
| $100,000 and over | 11,340 (97.4%) | 302 (2.6%) |
Public vs Private Health Insurance Coverage by Age in Brandon
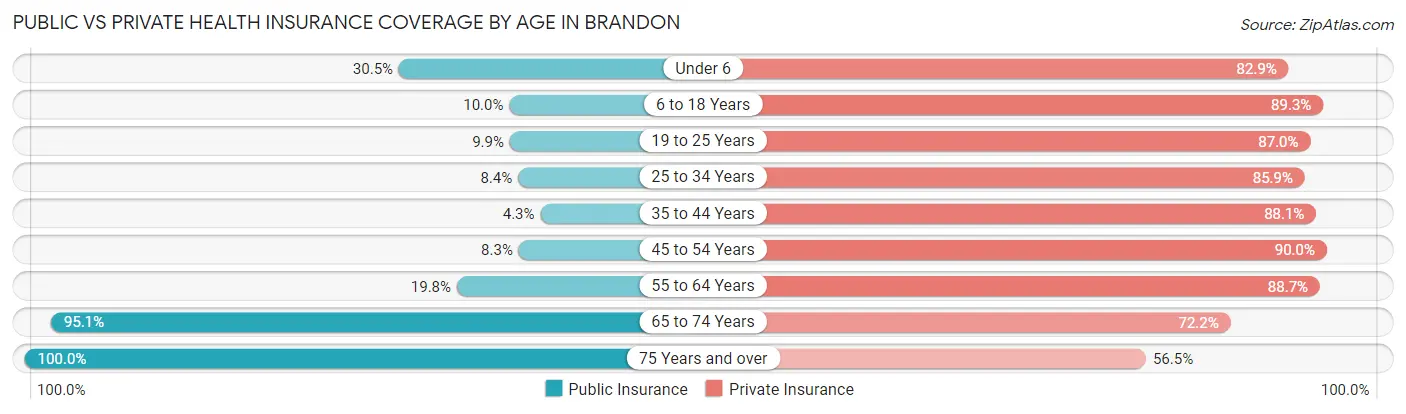
| Age Bracket | Public Insurance | Private Insurance |
| Under 6 | 499 (30.5%) | 1,356 (82.9%) |
| 6 to 18 Years | 450 (10.0%) | 4,008 (89.3%) |
| 19 to 25 Years | 238 (9.9%) | 2,082 (87.0%) |
| 25 to 34 Years | 150 (8.4%) | 1,534 (85.9%) |
| 35 to 44 Years | 130 (4.3%) | 2,682 (88.0%) |
| 45 to 54 Years | 301 (8.3%) | 3,274 (90.0%) |
| 55 to 64 Years | 544 (19.8%) | 2,442 (88.7%) |
| 65 to 74 Years | 2,340 (95.1%) | 1,775 (72.2%) |
| 75 Years and over | 1,895 (100.0%) | 1,070 (56.5%) |
| Total | 6,547 (27.2%) | 20,223 (84.0%) |
Disability Status by Sex by Age in Brandon
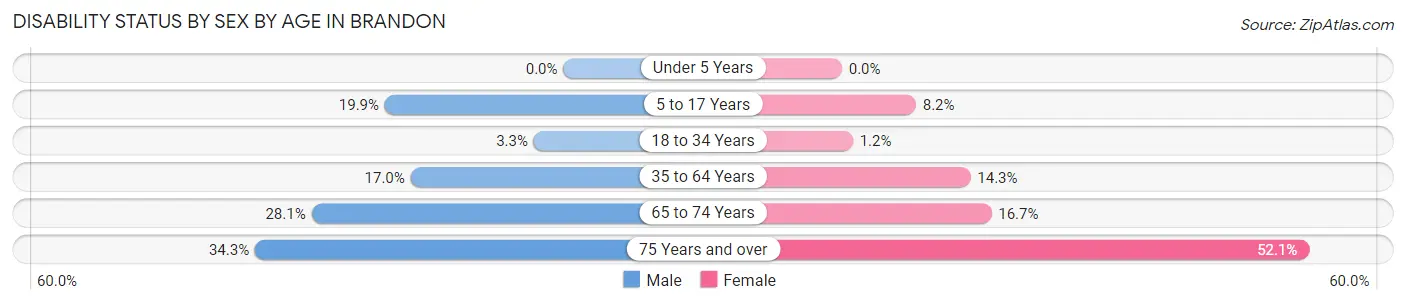
| Age Bracket | Male | Female |
| Under 5 Years | 0 (0.0%) | 0 (0.0%) |
| 5 to 17 Years | 480 (19.9%) | 173 (8.2%) |
| 18 to 34 Years | 68 (3.3%) | 27 (1.2%) |
| 35 to 64 Years | 714 (17.0%) | 750 (14.3%) |
| 65 to 74 Years | 333 (28.1%) | 212 (16.7%) |
| 75 Years and over | 249 (34.3%) | 609 (52.0%) |
Disability Class by Sex by Age in Brandon
Disability Class: Hearing Difficulty
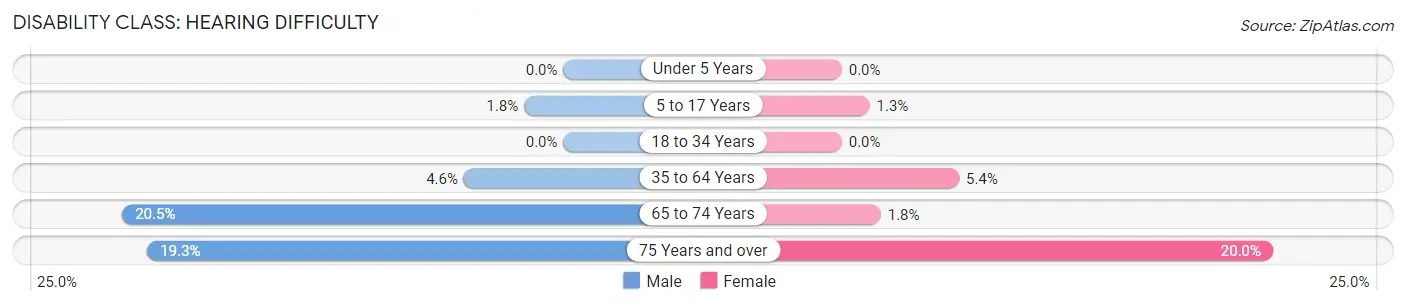
| Age Bracket | Male | Female |
| Under 5 Years | 0 (0.0%) | 0 (0.0%) |
| 5 to 17 Years | 44 (1.8%) | 27 (1.3%) |
| 18 to 34 Years | 0 (0.0%) | 0 (0.0%) |
| 35 to 64 Years | 194 (4.6%) | 285 (5.4%) |
| 65 to 74 Years | 243 (20.5%) | 23 (1.8%) |
| 75 Years and over | 140 (19.3%) | 234 (20.0%) |
Disability Class: Vision Difficulty
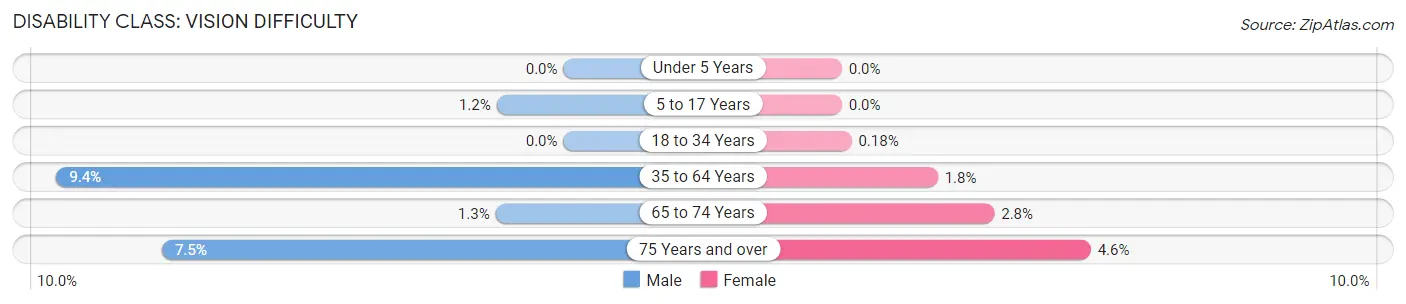
| Age Bracket | Male | Female |
| Under 5 Years | 0 (0.0%) | 0 (0.0%) |
| 5 to 17 Years | 30 (1.2%) | 0 (0.0%) |
| 18 to 34 Years | 0 (0.0%) | 4 (0.2%) |
| 35 to 64 Years | 395 (9.4%) | 93 (1.8%) |
| 65 to 74 Years | 15 (1.3%) | 36 (2.8%) |
| 75 Years and over | 54 (7.4%) | 54 (4.6%) |
Disability Class: Cognitive Difficulty
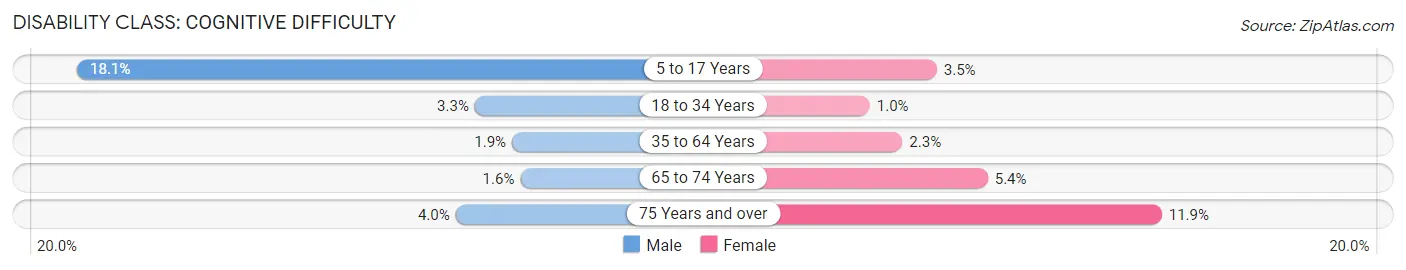
| Age Bracket | Male | Female |
| 5 to 17 Years | 436 (18.0%) | 74 (3.5%) |
| 18 to 34 Years | 68 (3.3%) | 23 (1.0%) |
| 35 to 64 Years | 80 (1.9%) | 118 (2.2%) |
| 65 to 74 Years | 19 (1.6%) | 69 (5.4%) |
| 75 Years and over | 29 (4.0%) | 139 (11.9%) |
Disability Class: Ambulatory Difficulty
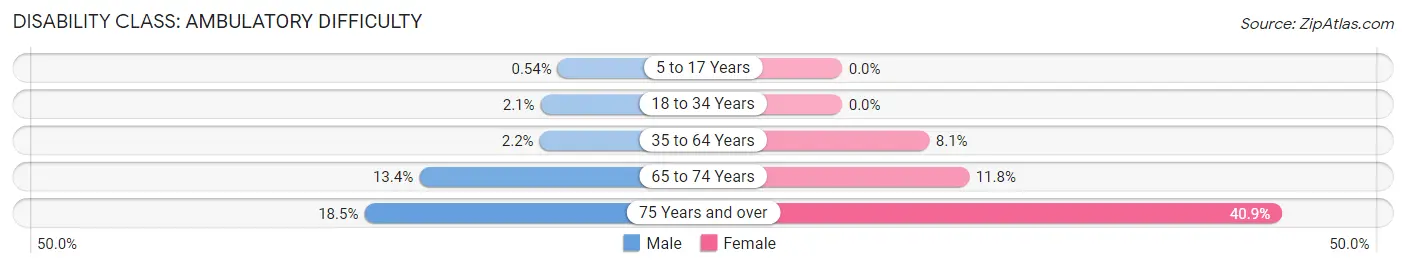
| Age Bracket | Male | Female |
| 5 to 17 Years | 13 (0.5%) | 0 (0.0%) |
| 18 to 34 Years | 44 (2.1%) | 0 (0.0%) |
| 35 to 64 Years | 93 (2.2%) | 423 (8.1%) |
| 65 to 74 Years | 159 (13.4%) | 150 (11.8%) |
| 75 Years and over | 134 (18.5%) | 478 (40.8%) |
Disability Class: Self-Care Difficulty
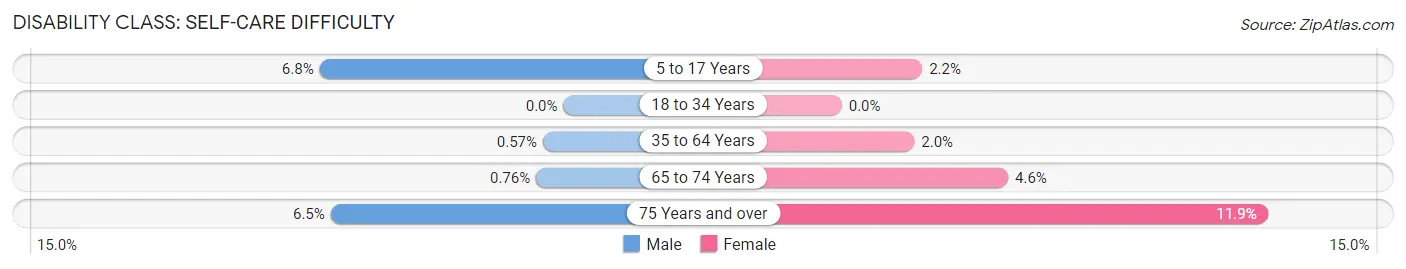
| Age Bracket | Male | Female |
| 5 to 17 Years | 164 (6.8%) | 47 (2.2%) |
| 18 to 34 Years | 0 (0.0%) | 0 (0.0%) |
| 35 to 64 Years | 24 (0.6%) | 106 (2.0%) |
| 65 to 74 Years | 9 (0.8%) | 59 (4.6%) |
| 75 Years and over | 47 (6.5%) | 139 (11.9%) |
Technology Access in Brandon
Computing Device Access in Brandon
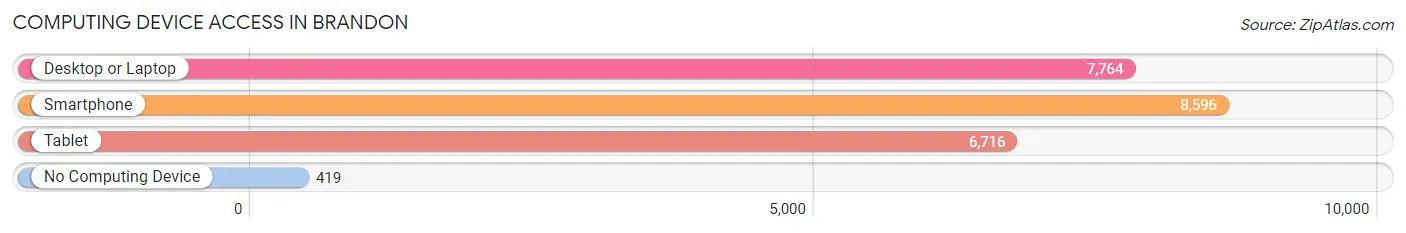
| Device Type | # Households | % Households |
| Desktop or Laptop | 7,764 | 83.6% |
| Smartphone | 8,596 | 92.6% |
| Tablet | 6,716 | 72.3% |
| No Computing Device | 419 | 4.5% |
| Total | 9,286 | 100.0% |
Internet Access in Brandon
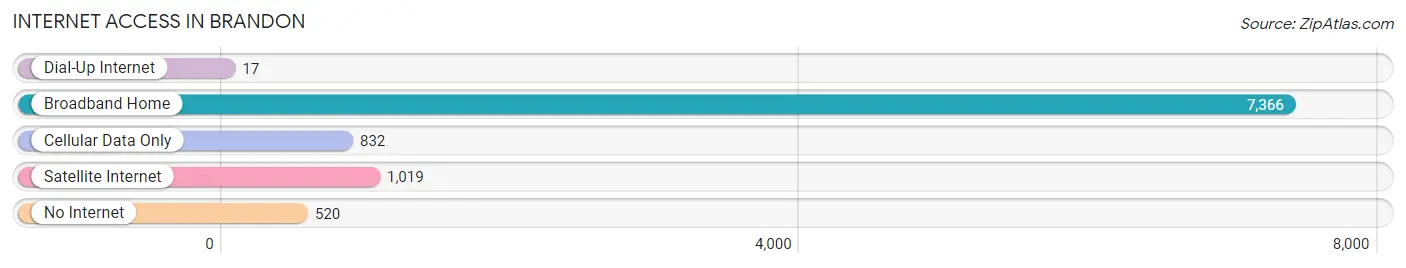
| Internet Type | # Households | % Households |
| Dial-Up Internet | 17 | 0.2% |
| Broadband Home | 7,366 | 79.3% |
| Cellular Data Only | 832 | 9.0% |
| Satellite Internet | 1,019 | 11.0% |
| No Internet | 520 | 5.6% |
| Total | 9,286 | 100.0% |
Brandon Summary
Brandon, Mississippi is a city located in Rankin County, Mississippi, United States. It is located east of the state capital, Jackson, and is part of the Jackson Metropolitan Statistical Area. As of the 2010 census, the city had a population of 23,856.
History
The area that is now Brandon was first settled in the early 1800s. The town was originally known as Brandon Station, and was a stop on the New Orleans, Jackson and Great Northern Railroad. The town was officially incorporated in 1858.
During the Civil War, Brandon was the site of a major battle between Union and Confederate forces. The Battle of Brandon was fought on May 12, 1863, and resulted in a Confederate victory.
In the late 19th century, Brandon began to grow as a center of commerce and industry. The town was home to several cotton mills, and was a major producer of cotton and other agricultural products.
Geography
Brandon is located in central Rankin County, Mississippi, at 32°17'N 90°7'W. It is situated on the Pearl River, about 10 miles east of the state capital, Jackson.
The city has a total area of 16.2 square miles, of which 16.1 square miles is land and 0.1 square miles is water.
Economy
Brandon is a major center of commerce and industry in the Jackson metropolitan area. The city is home to several large businesses, including a major manufacturing plant for Nissan, a major distribution center for Walmart, and a major distribution center for Amazon.
The city is also home to several smaller businesses, including restaurants, retail stores, and professional services.
Demographics
As of the 2010 census, there were 23,856 people, 8,945 households, and 6,541 families residing in the city. The population density was 1,478.3 people per square mile. The racial makeup of the city was 79.2% White, 17.3% African American, 0.4% Native American, 1.2% Asian, 0.1% Pacific Islander, 0.7% from other races, and 1.1% from two or more races. Hispanic or Latino of any race were 2.2% of the population.
The median income for a household in the city was $50,945, and the median income for a family was $60,945. The per capita income for the city was $24,845. About 8.2% of families and 10.2% of the population were below the poverty line, including 14.2% of those under age 18 and 8.2% of those age 65 or over.
Common Questions
What is Per Capita Income in Brandon?
Per Capita income in Brandon is $38,452.
What is the Median Family Income in Brandon?
Median Family Income in Brandon is $95,043.
What is the Median Household income in Brandon?
Median Household Income in Brandon is $89,051.
What is Income or Wage Gap in Brandon?
Income or Wage Gap in Brandon is 37.0%.
Women in Brandon earn 63.0 cents for every dollar earned by a man.
What is Family Income Deficit in Brandon?
Family Income Deficit in Brandon is $13,888.
Families that are below poverty line in Brandon earn $13,888 less on average than the poverty threshold level.
What is Inequality or Gini Index in Brandon?
Inequality or Gini Index in Brandon is 0.35.
What is the Total Population of Brandon?
Total Population of Brandon is 25,142.
What is the Total Male Population of Brandon?
Total Male Population of Brandon is 11,998.
What is the Total Female Population of Brandon?
Total Female Population of Brandon is 13,144.
What is the Ratio of Males per 100 Females in Brandon?
There are 91.28 Males per 100 Females in Brandon.
What is the Ratio of Females per 100 Males in Brandon?
There are 109.55 Females per 100 Males in Brandon.
What is the Median Population Age in Brandon?
Median Population Age in Brandon is 41.3 Years.
What is the Average Family Size in Brandon
Average Family Size in Brandon is 3.1 People.
What is the Average Household Size in Brandon
Average Household Size in Brandon is 2.6 People.
How Large is the Labor Force in Brandon?
There are 12,634 People in the Labor Forcein in Brandon.
What is the Percentage of People in the Labor Force in Brandon?
63.9% of People are in the Labor Force in Brandon.
What is the Unemployment Rate in Brandon?
Unemployment Rate in Brandon is 4.2%.