Pass Christian, MS Map & Demographics
Pass Christian Map
Pass Christian Overview
$36,815
PER CAPITA INCOME
$74,816
AVG FAMILY INCOME
$65,000
AVG HOUSEHOLD INCOME
37.6%
WAGE / INCOME GAP [ % ]
62.4¢/ $1
WAGE / INCOME GAP [ $ ]
0.47
INEQUALITY / GINI INDEX
5,802
TOTAL POPULATION
2,764
MALE POPULATION
3,038
FEMALE POPULATION
90.98
MALES / 100 FEMALES
109.91
FEMALES / 100 MALES
41.1
MEDIAN AGE
3.0
AVG FAMILY SIZE
2.5
AVG HOUSEHOLD SIZE
2,658
LABOR FORCE [ PEOPLE ]
59.2%
PERCENT IN LABOR FORCE
8.4%
UNEMPLOYMENT RATE
Pass Christian Zip Codes
Pass Christian Area Codes
Income in Pass Christian
Income Overview in Pass Christian
Per Capita Income in Pass Christian is $36,815, while median incomes of families and households are $74,816 and $65,000 respectively.
| Characteristic | Number | Measure |
| Per Capita Income | 5,802 | $36,815 |
| Median Family Income | 1,474 | $74,816 |
| Mean Family Income | 1,474 | $104,830 |
| Median Household Income | 2,284 | $65,000 |
| Mean Household Income | 2,284 | $89,372 |
| Income Deficit | 1,474 | $0 |
| Wage / Income Gap (%) | 5,802 | 37.56% |
| Wage / Income Gap ($) | 5,802 | 62.44¢ per $1 |
| Gini / Inequality Index | 5,802 | 0.47 |
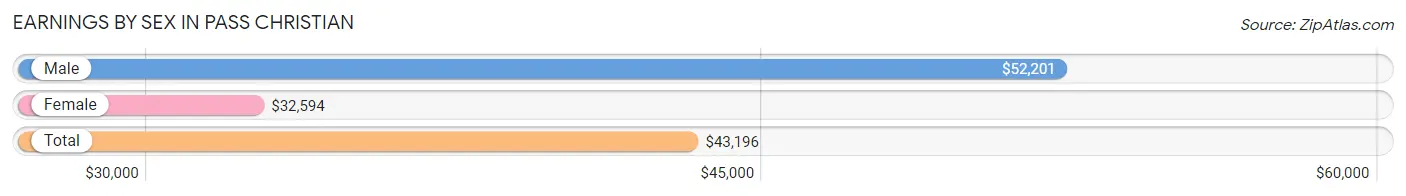
Earnings by Sex in Pass Christian
Average Earnings in Pass Christian are $43,196, $52,201 for men and $32,594 for women, a difference of 37.6%.
| Sex | Number | Average Earnings |
| Male | 1,318 (49.3%) | $52,201 |
| Female | 1,355 (50.7%) | $32,594 |
| Total | 2,673 (100.0%) | $43,196 |
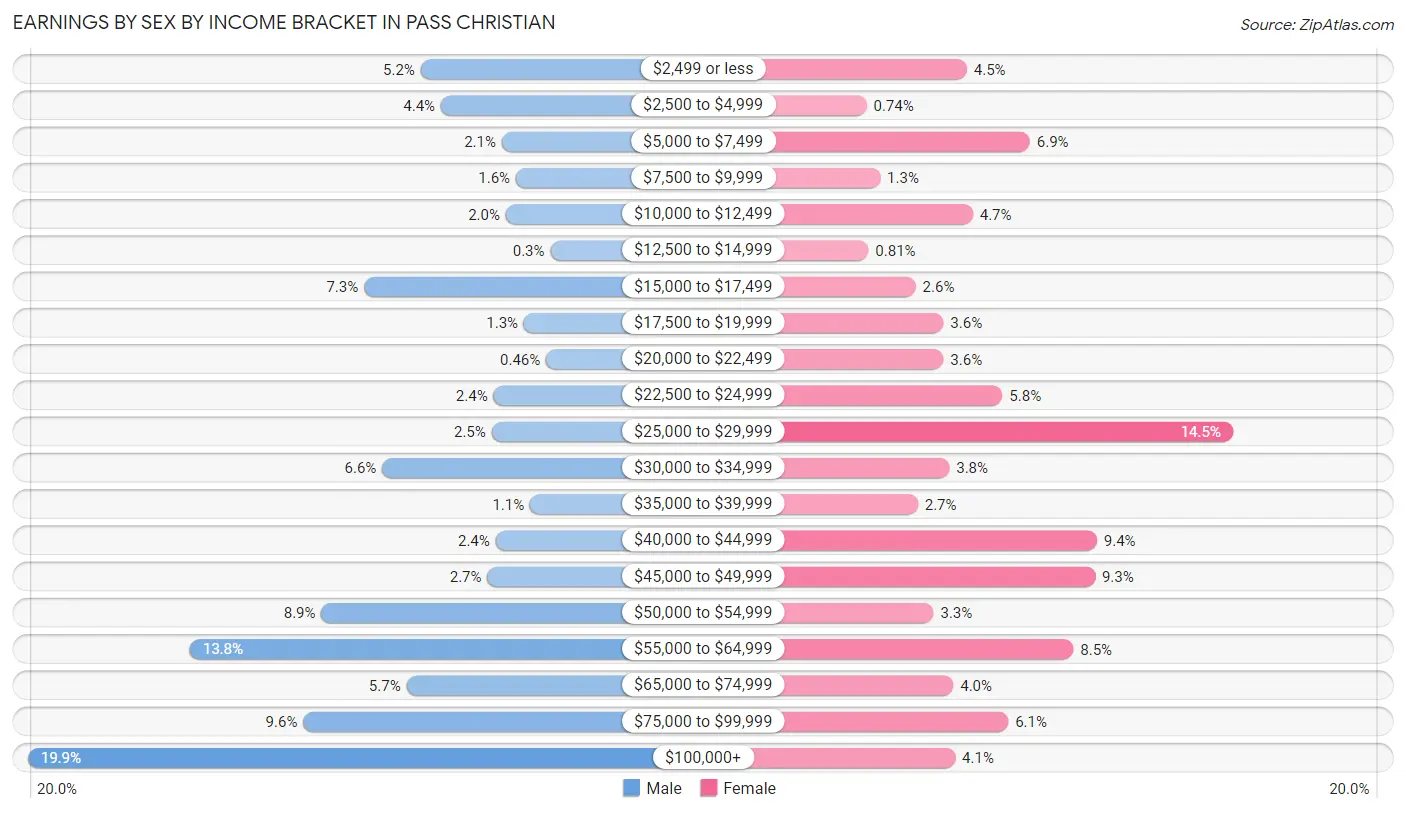
Earnings by Sex by Income Bracket in Pass Christian
The most common earnings brackets in Pass Christian are $100,000+ for men (262 | 19.9%) and $25,000 to $29,999 for women (196 | 14.5%).
| Income | Male | Female |
| $2,499 or less | 68 (5.2%) | 61 (4.5%) |
| $2,500 to $4,999 | 58 (4.4%) | 10 (0.7%) |
| $5,000 to $7,499 | 28 (2.1%) | 93 (6.9%) |
| $7,500 to $9,999 | 21 (1.6%) | 17 (1.3%) |
| $10,000 to $12,499 | 26 (2.0%) | 64 (4.7%) |
| $12,500 to $14,999 | 4 (0.3%) | 11 (0.8%) |
| $15,000 to $17,499 | 96 (7.3%) | 35 (2.6%) |
| $17,500 to $19,999 | 17 (1.3%) | 49 (3.6%) |
| $20,000 to $22,499 | 6 (0.5%) | 49 (3.6%) |
| $22,500 to $24,999 | 32 (2.4%) | 79 (5.8%) |
| $25,000 to $29,999 | 33 (2.5%) | 196 (14.5%) |
| $30,000 to $34,999 | 87 (6.6%) | 52 (3.8%) |
| $35,000 to $39,999 | 14 (1.1%) | 36 (2.7%) |
| $40,000 to $44,999 | 31 (2.4%) | 127 (9.4%) |
| $45,000 to $49,999 | 35 (2.7%) | 126 (9.3%) |
| $50,000 to $54,999 | 117 (8.9%) | 44 (3.3%) |
| $55,000 to $64,999 | 182 (13.8%) | 115 (8.5%) |
| $65,000 to $74,999 | 75 (5.7%) | 54 (4.0%) |
| $75,000 to $99,999 | 126 (9.6%) | 82 (6.0%) |
| $100,000+ | 262 (19.9%) | 55 (4.1%) |
| Total | 1,318 (100.0%) | 1,355 (100.0%) |
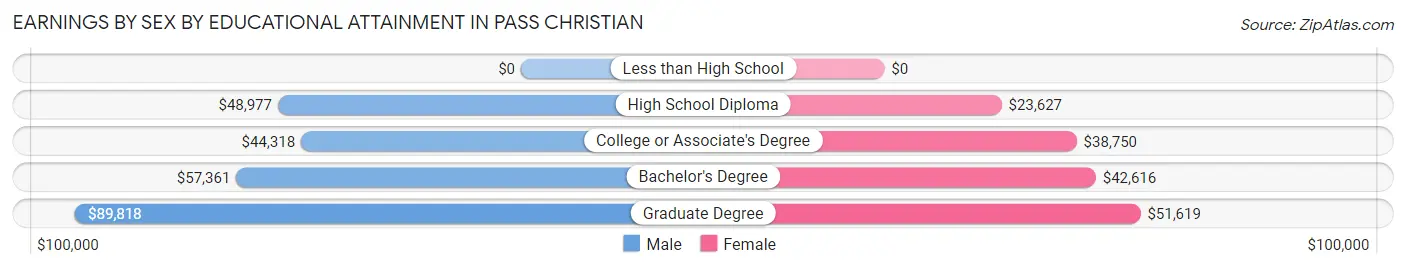
Earnings by Sex by Educational Attainment in Pass Christian
Average earnings in Pass Christian are $55,943 for men and $40,425 for women, a difference of 27.7%. Men with an educational attainment of graduate degree enjoy the highest average annual earnings of $89,818, while those with college or associate's degree education earn the least with $44,318. Women with an educational attainment of graduate degree earn the most with the average annual earnings of $51,619, while those with high school diploma education have the smallest earnings of $23,627.
| Educational Attainment | Male Income | Female Income |
| Less than High School | - | - |
| High School Diploma | $48,977 | $23,627 |
| College or Associate's Degree | $44,318 | $38,750 |
| Bachelor's Degree | $57,361 | $42,616 |
| Graduate Degree | $89,818 | $51,619 |
| Total | $55,943 | $40,425 |
Family Income in Pass Christian
Family Income Brackets in Pass Christian
According to the Pass Christian family income data, there are 274 families falling into the $100,000 to $149,999 income range, which is the most common income bracket and makes up 18.6% of all families. Conversely, the $10,000 to $14,999 income bracket is the least frequent group with only 27 families (1.8%) belonging to this category.
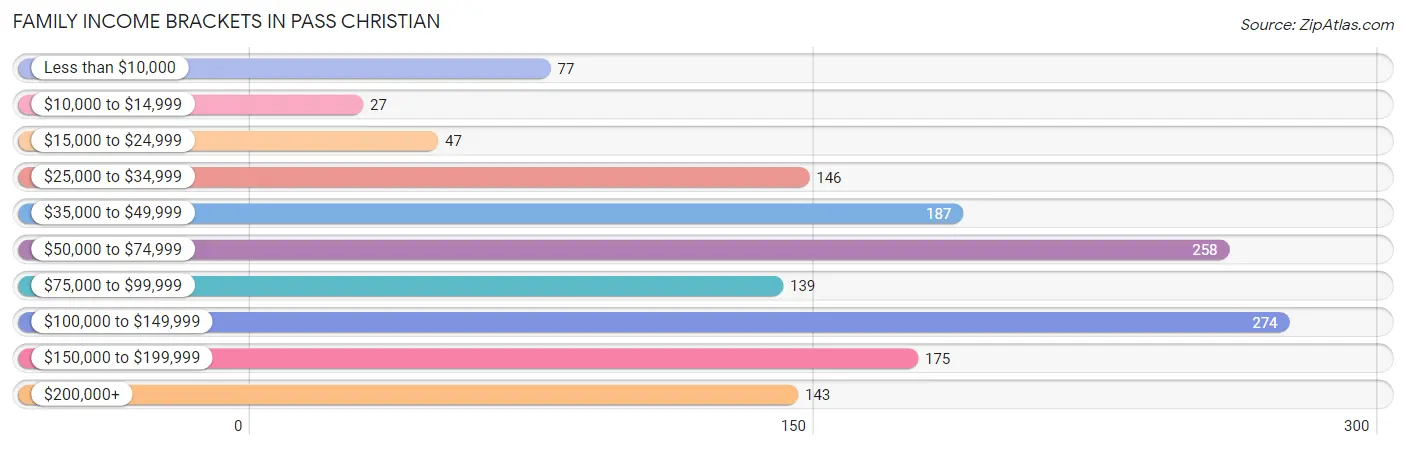
| Income Bracket | # Families | % Families |
| Less than $10,000 | 77 | 5.2% |
| $10,000 to $14,999 | 27 | 1.8% |
| $15,000 to $24,999 | 47 | 3.2% |
| $25,000 to $34,999 | 146 | 9.9% |
| $35,000 to $49,999 | 187 | 12.7% |
| $50,000 to $74,999 | 258 | 17.5% |
| $75,000 to $99,999 | 139 | 9.4% |
| $100,000 to $149,999 | 274 | 18.6% |
| $150,000 to $199,999 | 175 | 11.9% |
| $200,000+ | 143 | 9.7% |
Family Income by Famaliy Size in Pass Christian
6-person families (79 | 5.4%) account for the highest median family income in Pass Christian with $138,932 per family, while 2-person families (800 | 54.3%) have the highest median income of $36,032 per family member.
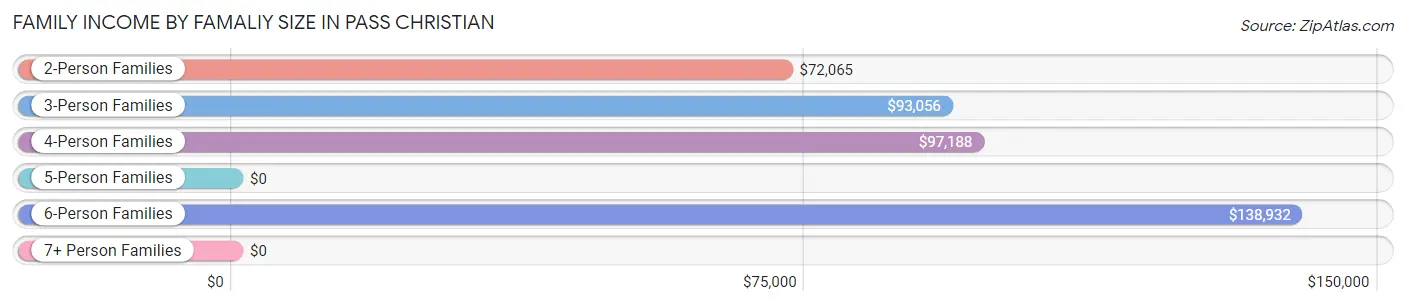
| Income Bracket | # Families | Median Income |
| 2-Person Families | 800 (54.3%) | $72,065 |
| 3-Person Families | 270 (18.3%) | $93,056 |
| 4-Person Families | 178 (12.1%) | $97,188 |
| 5-Person Families | 147 (10.0%) | $0 |
| 6-Person Families | 79 (5.4%) | $138,932 |
| 7+ Person Families | 0 (0.0%) | $0 |
| Total | 1,474 (100.0%) | $74,816 |
Family Income by Number of Earners in Pass Christian
The median family income in Pass Christian is $74,816, with families comprising 3+ earners (123) having the highest median family income of $157,386, while families with no earners (396) have the lowest median family income of $37,237, accounting for 8.3% and 26.9% of families, respectively.
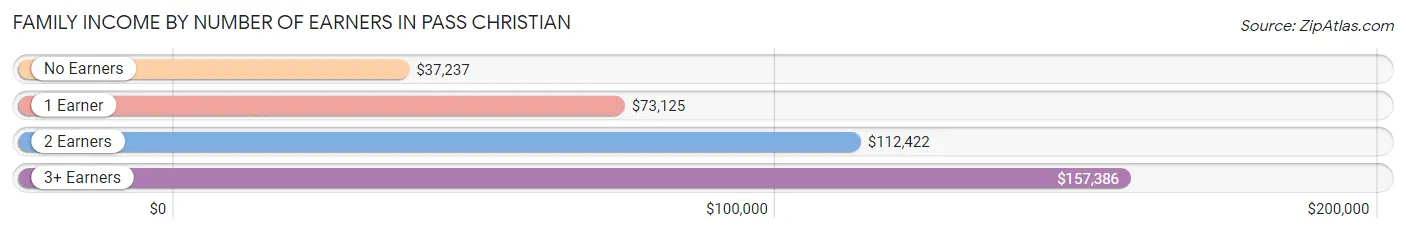
| Number of Earners | # Families | Median Income |
| No Earners | 396 (26.9%) | $37,237 |
| 1 Earner | 465 (31.6%) | $73,125 |
| 2 Earners | 490 (33.2%) | $112,422 |
| 3+ Earners | 123 (8.3%) | $157,386 |
| Total | 1,474 (100.0%) | $74,816 |
Household Income in Pass Christian
Household Income Brackets in Pass Christian
With 498 households falling in the category, the $50,000 to $74,999 income range is the most frequent in Pass Christian, accounting for 21.8% of all households. In contrast, only 87 households (3.8%) fall into the $10,000 to $14,999 income bracket, making it the least populous group.
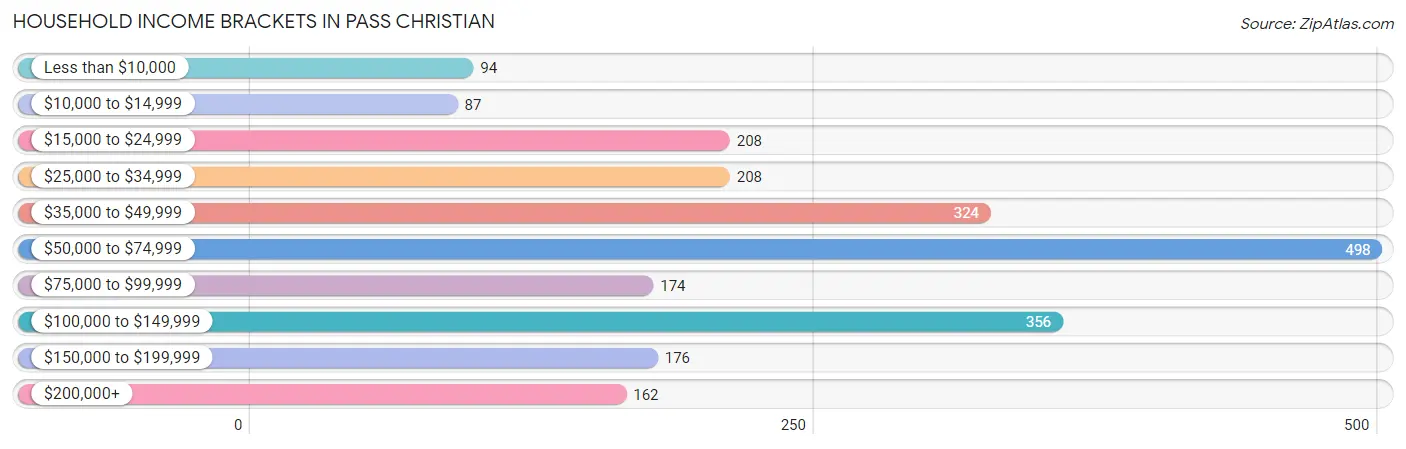
| Income Bracket | # Households | % Households |
| Less than $10,000 | 94 | 4.1% |
| $10,000 to $14,999 | 87 | 3.8% |
| $15,000 to $24,999 | 208 | 9.1% |
| $25,000 to $34,999 | 208 | 9.1% |
| $35,000 to $49,999 | 324 | 14.2% |
| $50,000 to $74,999 | 498 | 21.8% |
| $75,000 to $99,999 | 174 | 7.6% |
| $100,000 to $149,999 | 356 | 15.6% |
| $150,000 to $199,999 | 176 | 7.7% |
| $200,000+ | 162 | 7.1% |
Household Income by Householder Age in Pass Christian
The median household income in Pass Christian is $65,000, with the highest median household income of $72,115 found in the 25 to 44 years age bracket for the primary householder. A total of 574 households (25.1%) fall into this category. Meanwhile, the 15 to 24 years age bracket for the primary householder has the lowest median household income of $0, with 27 households (1.2%) in this group.
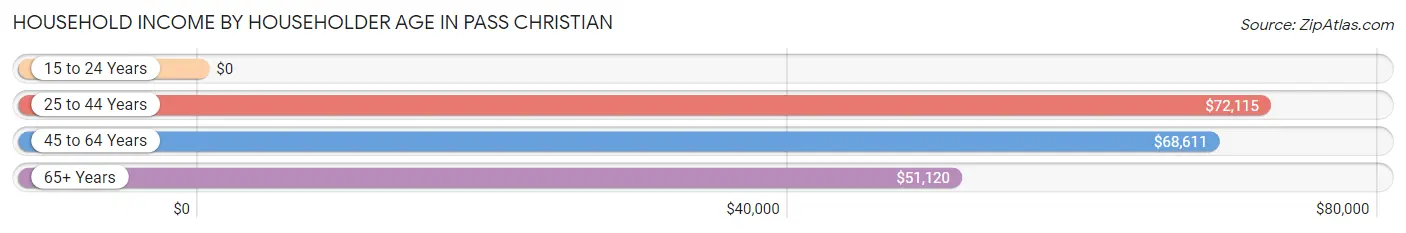
| Income Bracket | # Households | Median Income |
| 15 to 24 Years | 27 (1.2%) | $0 |
| 25 to 44 Years | 574 (25.1%) | $72,115 |
| 45 to 64 Years | 820 (35.9%) | $68,611 |
| 65+ Years | 863 (37.8%) | $51,120 |
| Total | 2,284 (100.0%) | $65,000 |
Poverty in Pass Christian
Income Below Poverty by Sex and Age in Pass Christian
With 10.9% poverty level for males and 14.0% for females among the residents of Pass Christian, 15 year old males and 12 to 14 year old females are the most vulnerable to poverty, with 22 males (66.7%) and 80 females (53.0%) in their respective age groups living below the poverty level.
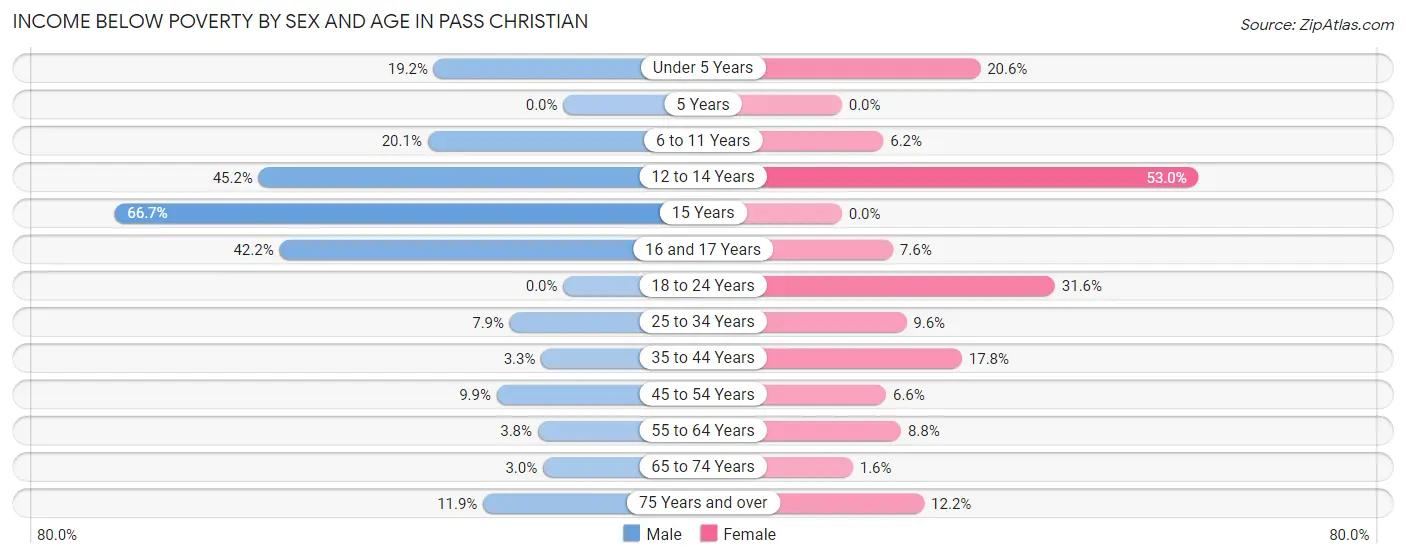
| Age Bracket | Male | Female |
| Under 5 Years | 40 (19.2%) | 30 (20.5%) |
| 5 Years | 0 (0.0%) | 0 (0.0%) |
| 6 to 11 Years | 57 (20.1%) | 9 (6.2%) |
| 12 to 14 Years | 19 (45.2%) | 80 (53.0%) |
| 15 Years | 22 (66.7%) | 0 (0.0%) |
| 16 and 17 Years | 51 (42.1%) | 6 (7.6%) |
| 18 to 24 Years | 0 (0.0%) | 56 (31.6%) |
| 25 to 34 Years | 27 (7.9%) | 21 (9.6%) |
| 35 to 44 Years | 8 (3.3%) | 92 (17.8%) |
| 45 to 54 Years | 32 (9.9%) | 23 (6.6%) |
| 55 to 64 Years | 14 (3.8%) | 29 (8.8%) |
| 65 to 74 Years | 11 (3.0%) | 6 (1.6%) |
| 75 Years and over | 20 (11.9%) | 40 (12.2%) |
| Total | 301 (10.9%) | 392 (14.0%) |
Income Above Poverty by Sex and Age in Pass Christian
According to the poverty statistics in Pass Christian, males aged 5 years and females aged 65 to 74 years are the age groups that are most secure financially, with 100.0% of males and 98.4% of females in these age groups living above the poverty line.
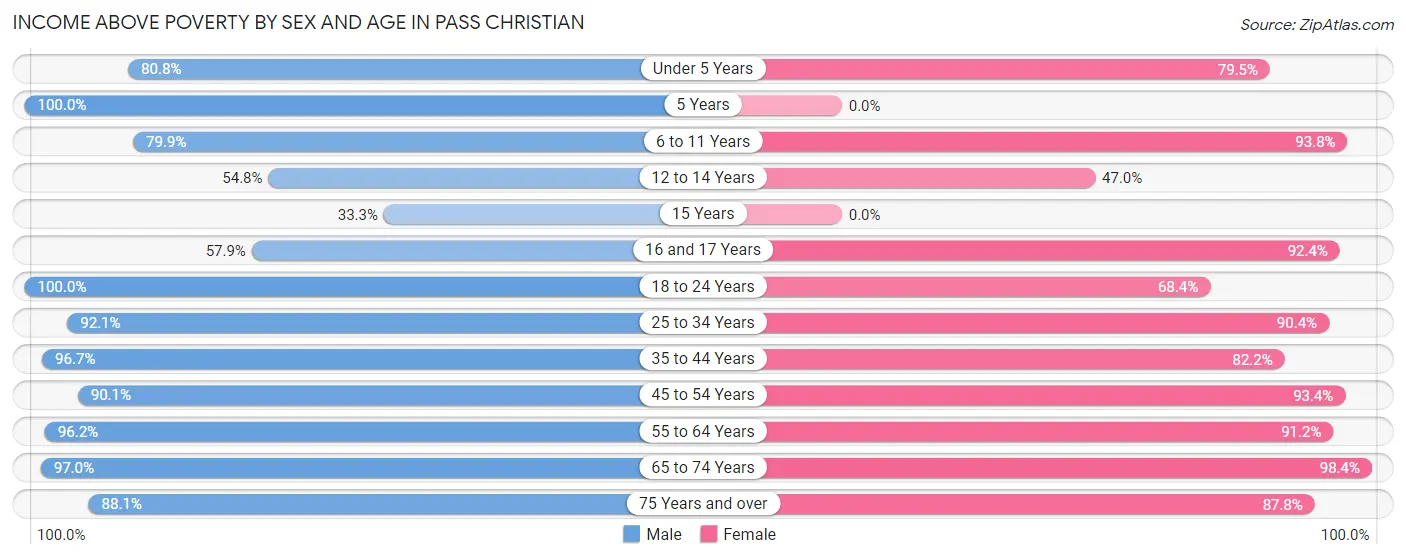
| Age Bracket | Male | Female |
| Under 5 Years | 168 (80.8%) | 116 (79.4%) |
| 5 Years | 146 (100.0%) | 0 (0.0%) |
| 6 to 11 Years | 226 (79.9%) | 137 (93.8%) |
| 12 to 14 Years | 23 (54.8%) | 71 (47.0%) |
| 15 Years | 11 (33.3%) | 0 (0.0%) |
| 16 and 17 Years | 70 (57.9%) | 73 (92.4%) |
| 18 to 24 Years | 118 (100.0%) | 121 (68.4%) |
| 25 to 34 Years | 313 (92.1%) | 198 (90.4%) |
| 35 to 44 Years | 237 (96.7%) | 424 (82.2%) |
| 45 to 54 Years | 292 (90.1%) | 327 (93.4%) |
| 55 to 64 Years | 356 (96.2%) | 301 (91.2%) |
| 65 to 74 Years | 355 (97.0%) | 363 (98.4%) |
| 75 Years and over | 148 (88.1%) | 287 (87.8%) |
| Total | 2,463 (89.1%) | 2,418 (86.1%) |
Income Below Poverty Among Married-Couple Families in Pass Christian
The poverty statistics for married-couple families in Pass Christian show that 3.0% or 31 of the total 1,030 families live below the poverty line. Families with no children have the highest poverty rate of 4.4%, comprising of 31 families. On the other hand, families with 1 or 2 children have the lowest poverty rate of 0.0%, which includes 0 families.
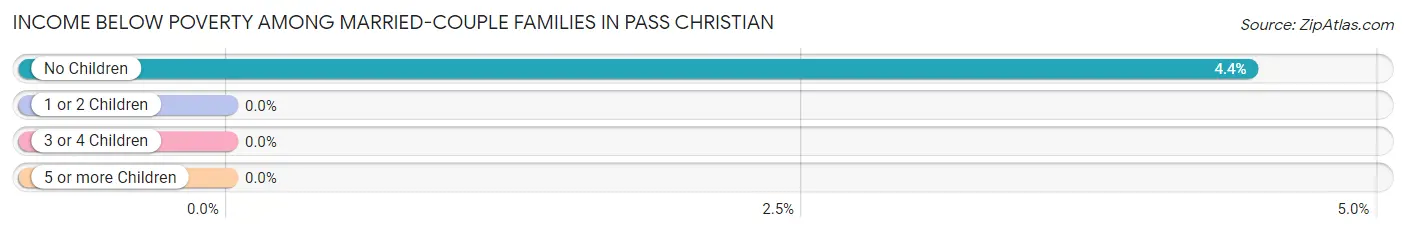
| Children | Above Poverty | Below Poverty |
| No Children | 667 (95.6%) | 31 (4.4%) |
| 1 or 2 Children | 233 (100.0%) | 0 (0.0%) |
| 3 or 4 Children | 99 (100.0%) | 0 (0.0%) |
| 5 or more Children | 0 (0.0%) | 0 (0.0%) |
| Total | 999 (97.0%) | 31 (3.0%) |
Income Below Poverty Among Single-Parent Households in Pass Christian
According to the poverty data in Pass Christian, 9.8% or 9 single-father households and 36.6% or 129 single-mother households are living below the poverty line. Among single-father households, those with no children have the highest poverty rate, with 9 households (25.7%) experiencing poverty. Likewise, among single-mother households, those with 3 or 4 children have the highest poverty rate, with 92 households (69.7%) falling below the poverty line.
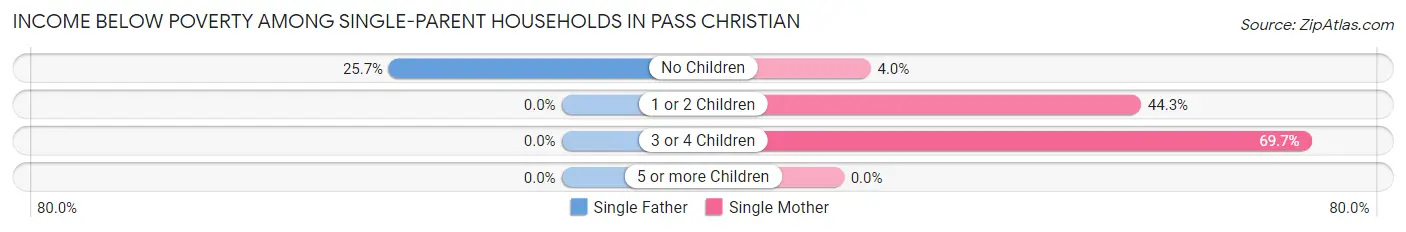
| Children | Single Father | Single Mother |
| No Children | 9 (25.7%) | 6 (4.0%) |
| 1 or 2 Children | 0 (0.0%) | 31 (44.3%) |
| 3 or 4 Children | 0 (0.0%) | 92 (69.7%) |
| 5 or more Children | 0 (0.0%) | 0 (0.0%) |
| Total | 9 (9.8%) | 129 (36.6%) |
Income Below Poverty Among Married-Couple vs Single-Parent Households in Pass Christian
The poverty data for Pass Christian shows that 31 of the married-couple family households (3.0%) and 138 of the single-parent households (31.1%) are living below the poverty level. Within the married-couple family households, those with no children have the highest poverty rate, with 31 households (4.4%) falling below the poverty line. Among the single-parent households, those with 3 or 4 children have the highest poverty rate, with 92 household (69.7%) living below poverty.
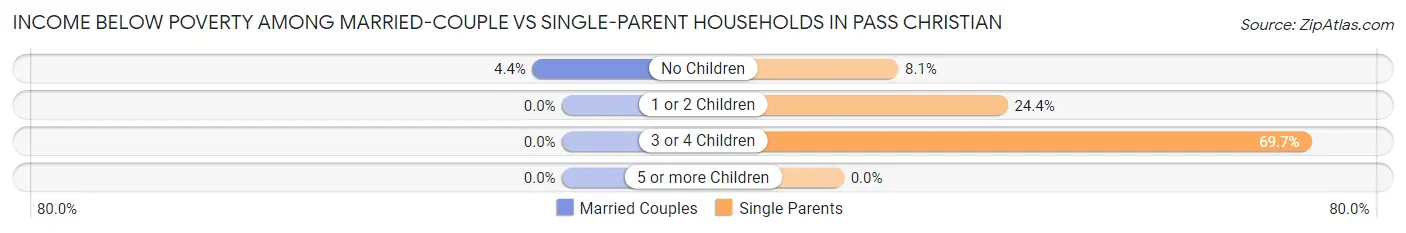
| Children | Married-Couple Families | Single-Parent Households |
| No Children | 31 (4.4%) | 15 (8.1%) |
| 1 or 2 Children | 0 (0.0%) | 31 (24.4%) |
| 3 or 4 Children | 0 (0.0%) | 92 (69.7%) |
| 5 or more Children | 0 (0.0%) | 0 (0.0%) |
| Total | 31 (3.0%) | 138 (31.1%) |
Race in Pass Christian
The most populous races in Pass Christian are White / Caucasian (4,231 | 72.9%), Black / African American (1,099 | 18.9%), and Two or more Races (319 | 5.5%).
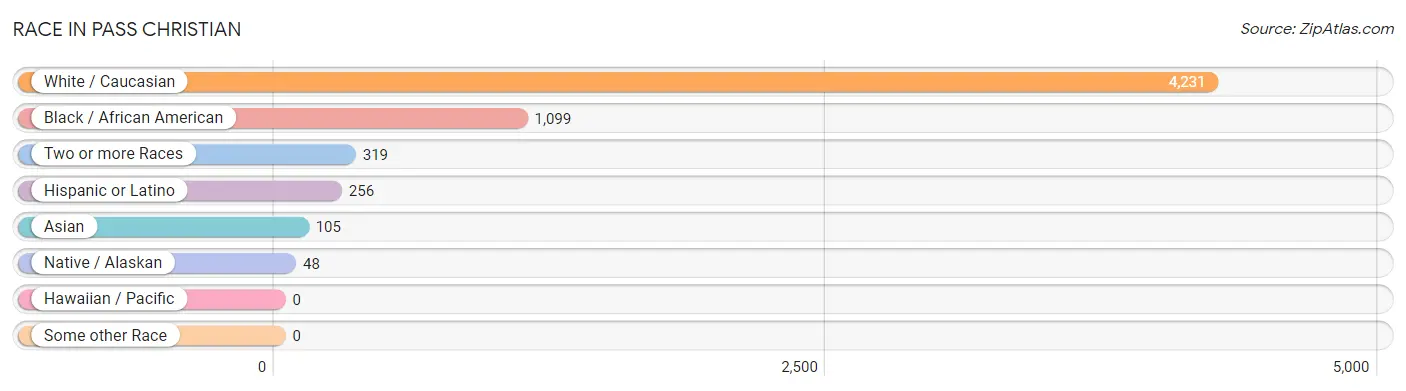
| Race | # Population | % Population |
| Asian | 105 | 1.8% |
| Black / African American | 1,099 | 18.9% |
| Hawaiian / Pacific | 0 | 0.0% |
| Hispanic or Latino | 256 | 4.4% |
| Native / Alaskan | 48 | 0.8% |
| White / Caucasian | 4,231 | 72.9% |
| Two or more Races | 319 | 5.5% |
| Some other Race | 0 | 0.0% |
| Total | 5,802 | 100.0% |
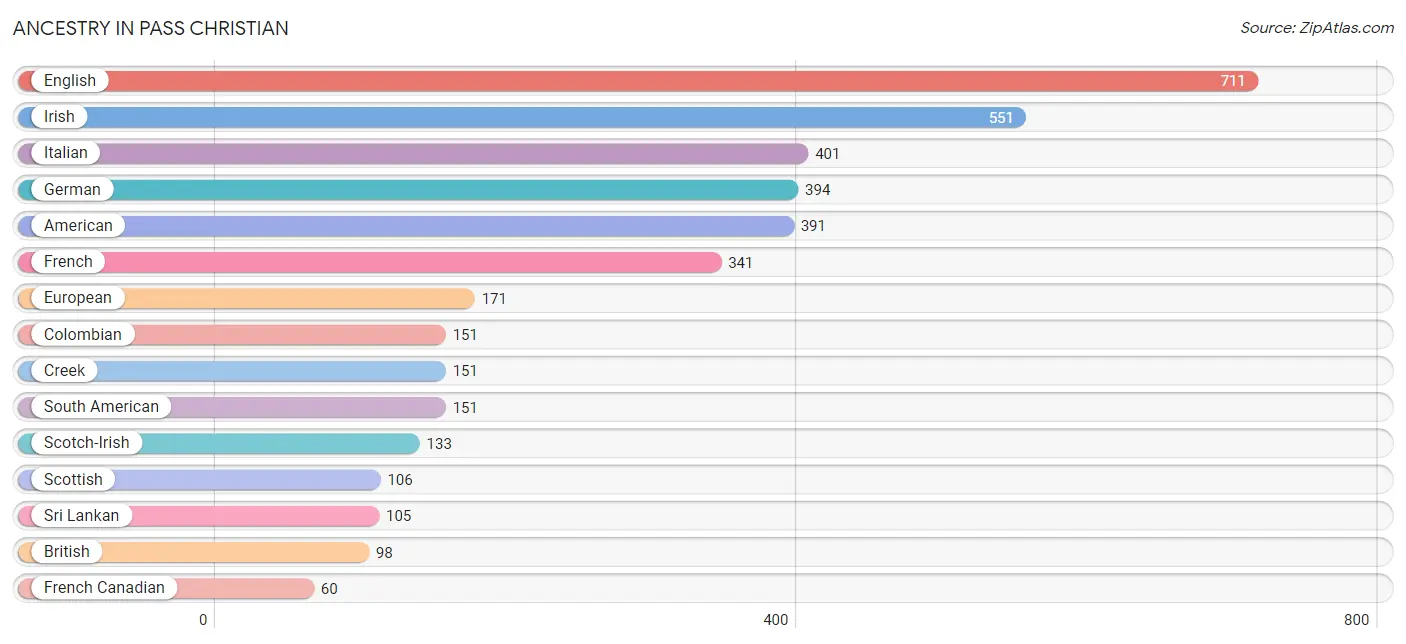
Ancestry in Pass Christian
The most populous ancestries reported in Pass Christian are English (711 | 12.2%), Irish (551 | 9.5%), Italian (401 | 6.9%), German (394 | 6.8%), and American (391 | 6.7%), together accounting for 42.2% of all Pass Christian residents.
| Ancestry | # Population | % Population |
| African | 32 | 0.5% |
| American | 391 | 6.7% |
| Arab | 18 | 0.3% |
| Austrian | 1 | 0.0% |
| Belgian | 5 | 0.1% |
| British | 98 | 1.7% |
| Cajun | 16 | 0.3% |
| Canadian | 5 | 0.1% |
| Central American | 35 | 0.6% |
| Cherokee | 10 | 0.2% |
| Chickasaw | 9 | 0.2% |
| Colombian | 151 | 2.6% |
| Creek | 151 | 2.6% |
| Cuban | 28 | 0.5% |
| Czech | 5 | 0.1% |
| Dutch | 10 | 0.2% |
| Dutch West Indian | 9 | 0.2% |
| English | 711 | 12.2% |
| European | 171 | 2.9% |
| French | 341 | 5.9% |
| French Canadian | 60 | 1.0% |
| German | 394 | 6.8% |
| Greek | 19 | 0.3% |
| Guatemalan | 35 | 0.6% |
| Irish | 551 | 9.5% |
| Italian | 401 | 6.9% |
| Jamaican | 2 | 0.0% |
| Korean | 44 | 0.8% |
| Lebanese | 10 | 0.2% |
| Mexican | 14 | 0.2% |
| Norwegian | 10 | 0.2% |
| Polish | 6 | 0.1% |
| Romanian | 33 | 0.6% |
| Russian | 18 | 0.3% |
| Scandinavian | 11 | 0.2% |
| Scotch-Irish | 133 | 2.3% |
| Scottish | 106 | 1.8% |
| Slavic | 6 | 0.1% |
| South American | 151 | 2.6% |
| Sri Lankan | 105 | 1.8% |
| Subsaharan African | 32 | 0.5% |
| Swedish | 6 | 0.1% |
| Welsh | 15 | 0.3% |
| Yugoslavian | 6 | 0.1% | View All 44 Rows |
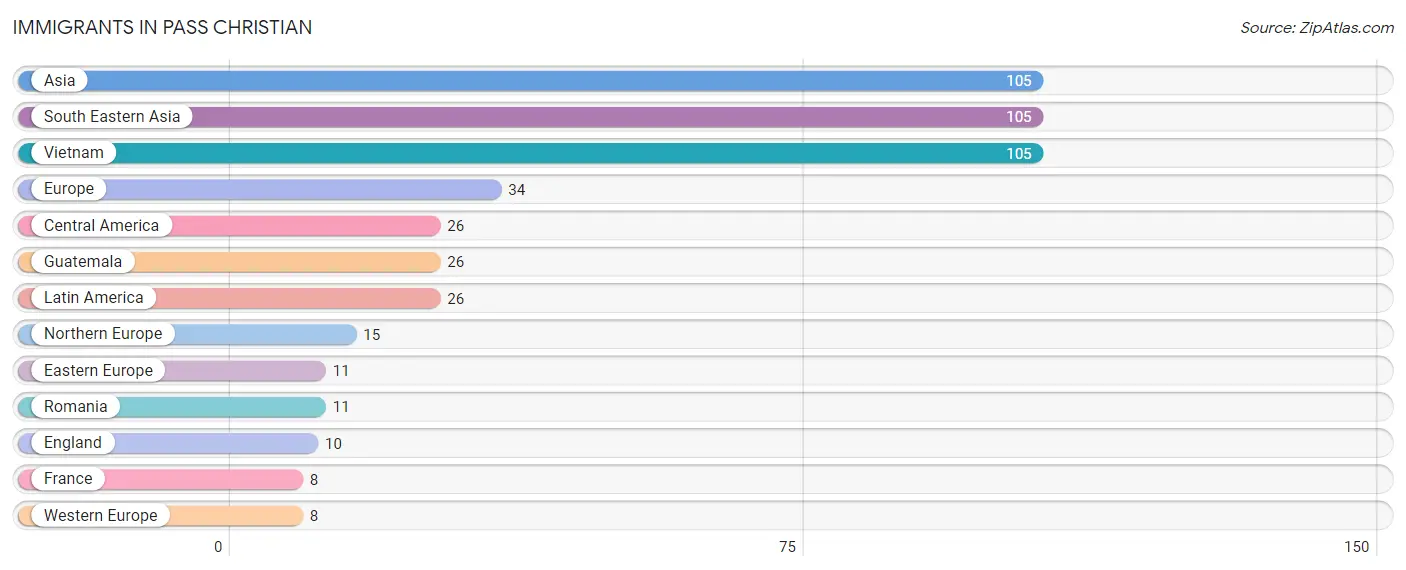
Immigrants in Pass Christian
The most numerous immigrant groups reported in Pass Christian came from Asia (105 | 1.8%), South Eastern Asia (105 | 1.8%), Vietnam (105 | 1.8%), Europe (34 | 0.6%), and Central America (26 | 0.4%), together accounting for 6.5% of all Pass Christian residents.
| Immigration Origin | # Population | % Population |
| Asia | 105 | 1.8% |
| Central America | 26 | 0.4% |
| Eastern Europe | 11 | 0.2% |
| England | 10 | 0.2% |
| Europe | 34 | 0.6% |
| France | 8 | 0.1% |
| Guatemala | 26 | 0.4% |
| Latin America | 26 | 0.4% |
| Northern Europe | 15 | 0.3% |
| Romania | 11 | 0.2% |
| South Eastern Asia | 105 | 1.8% |
| Vietnam | 105 | 1.8% |
| Western Europe | 8 | 0.1% | View All 13 Rows |
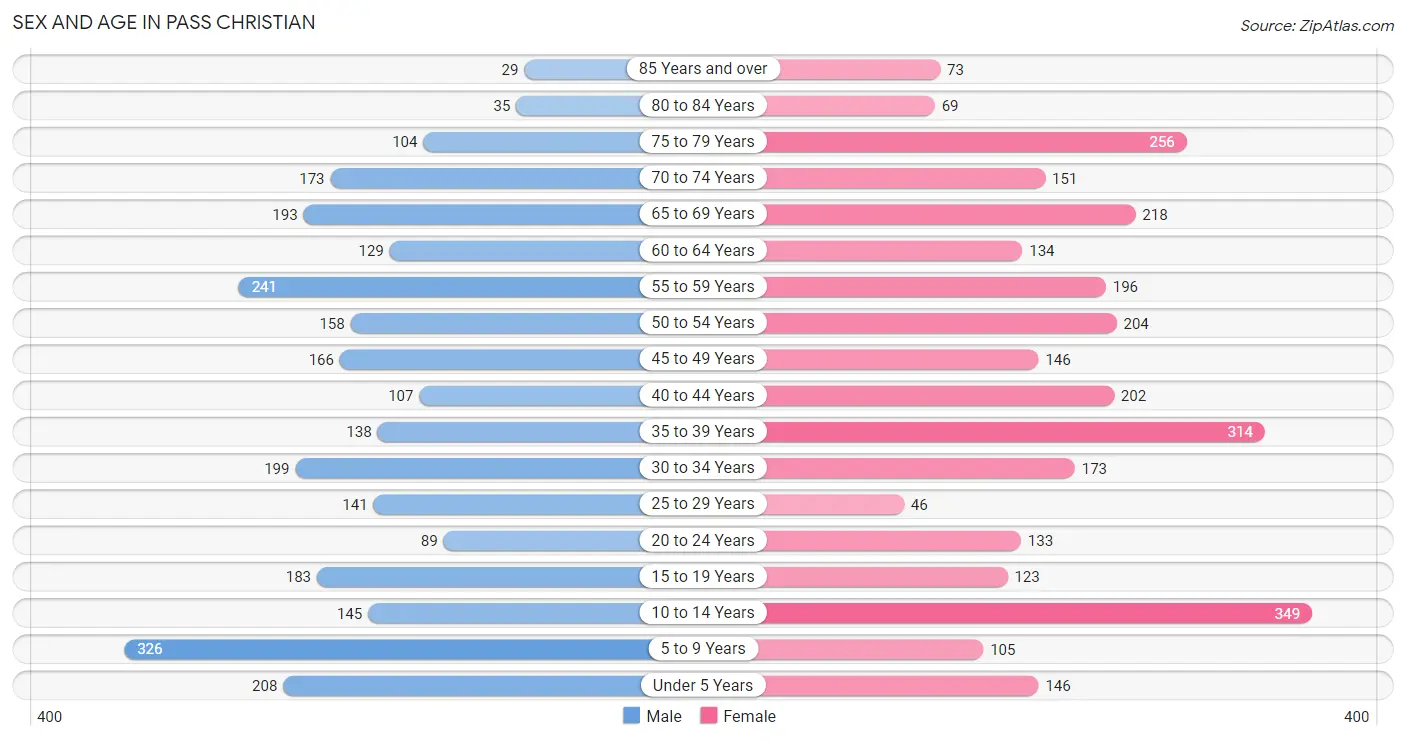
Sex and Age in Pass Christian
Sex and Age in Pass Christian
The most populous age groups in Pass Christian are 5 to 9 Years (326 | 11.8%) for men and 10 to 14 Years (349 | 11.5%) for women.
| Age Bracket | Male | Female |
| Under 5 Years | 208 (7.5%) | 146 (4.8%) |
| 5 to 9 Years | 326 (11.8%) | 105 (3.5%) |
| 10 to 14 Years | 145 (5.2%) | 349 (11.5%) |
| 15 to 19 Years | 183 (6.6%) | 123 (4.1%) |
| 20 to 24 Years | 89 (3.2%) | 133 (4.4%) |
| 25 to 29 Years | 141 (5.1%) | 46 (1.5%) |
| 30 to 34 Years | 199 (7.2%) | 173 (5.7%) |
| 35 to 39 Years | 138 (5.0%) | 314 (10.3%) |
| 40 to 44 Years | 107 (3.9%) | 202 (6.7%) |
| 45 to 49 Years | 166 (6.0%) | 146 (4.8%) |
| 50 to 54 Years | 158 (5.7%) | 204 (6.7%) |
| 55 to 59 Years | 241 (8.7%) | 196 (6.5%) |
| 60 to 64 Years | 129 (4.7%) | 134 (4.4%) |
| 65 to 69 Years | 193 (7.0%) | 218 (7.2%) |
| 70 to 74 Years | 173 (6.3%) | 151 (5.0%) |
| 75 to 79 Years | 104 (3.8%) | 256 (8.4%) |
| 80 to 84 Years | 35 (1.3%) | 69 (2.3%) |
| 85 Years and over | 29 (1.1%) | 73 (2.4%) |
| Total | 2,764 (100.0%) | 3,038 (100.0%) |
Families and Households in Pass Christian
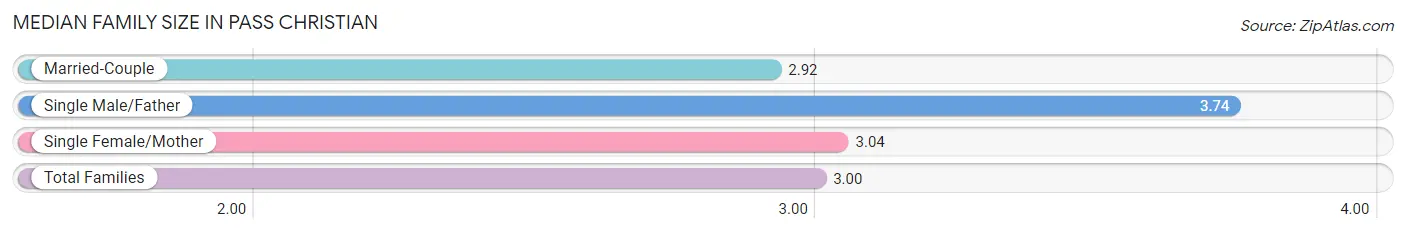
Median Family Size in Pass Christian
The median family size in Pass Christian is 3.00 persons per family, with single male/father families (92 | 6.2%) accounting for the largest median family size of 3.74 persons per family. On the other hand, married-couple families (1,030 | 69.9%) represent the smallest median family size with 2.92 persons per family.
| Family Type | # Families | Family Size |
| Married-Couple | 1,030 (69.9%) | 2.92 |
| Single Male/Father | 92 (6.2%) | 3.74 |
| Single Female/Mother | 352 (23.9%) | 3.04 |
| Total Families | 1,474 (100.0%) | 3.00 |
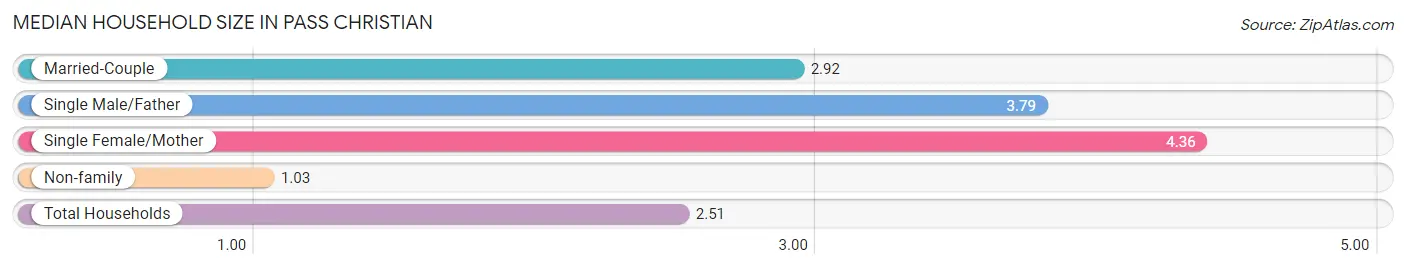
Median Household Size in Pass Christian
The median household size in Pass Christian is 2.51 persons per household, with single female/mother households (352 | 15.4%) accounting for the largest median household size of 4.36 persons per household. non-family households (810 | 35.5%) represent the smallest median household size with 1.03 persons per household.
| Household Type | # Households | Household Size |
| Married-Couple | 1,030 (45.1%) | 2.92 |
| Single Male/Father | 92 (4.0%) | 3.79 |
| Single Female/Mother | 352 (15.4%) | 4.36 |
| Non-family | 810 (35.5%) | 1.03 |
| Total Households | 2,284 (100.0%) | 2.51 |
Household Size by Marriage Status in Pass Christian
Out of a total of 2,284 households in Pass Christian, 1,474 (64.5%) are family households, while 810 (35.5%) are nonfamily households. The most numerous type of family households are 2-person households, comprising 727, and the most common type of nonfamily households are 1-person households, comprising 787.
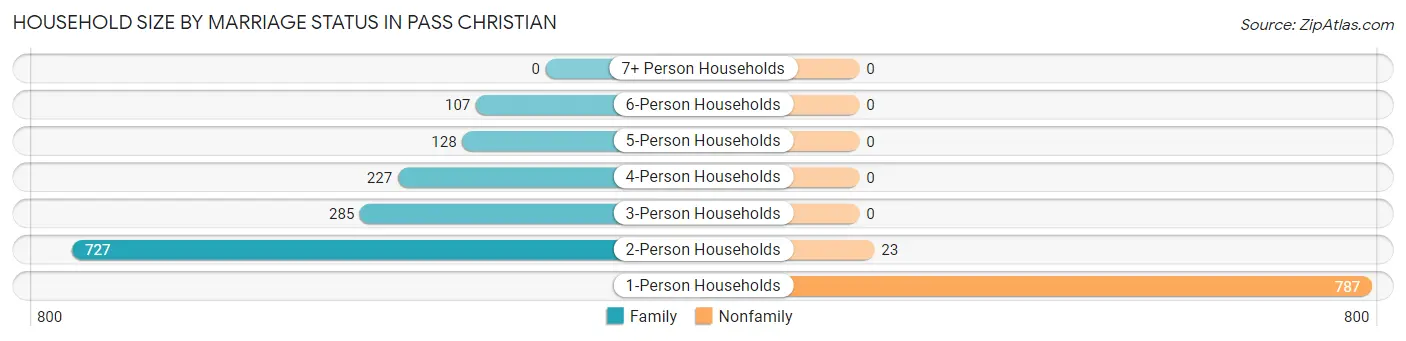
| Household Size | Family Households | Nonfamily Households |
| 1-Person Households | - | 787 (34.5%) |
| 2-Person Households | 727 (31.8%) | 23 (1.0%) |
| 3-Person Households | 285 (12.5%) | 0 (0.0%) |
| 4-Person Households | 227 (9.9%) | 0 (0.0%) |
| 5-Person Households | 128 (5.6%) | 0 (0.0%) |
| 6-Person Households | 107 (4.7%) | 0 (0.0%) |
| 7+ Person Households | 0 (0.0%) | 0 (0.0%) |
| Total | 1,474 (64.5%) | 810 (35.5%) |
Female Fertility in Pass Christian
Fertility by Age in Pass Christian
Average fertility rate in Pass Christian is 57.0 births per 1,000 women. Women in the age bracket of 20 to 34 years have the highest fertility rate with 116.0 births per 1,000 women. Women in the age bracket of 20 to 34 years acount for 63.1% of all women with births.
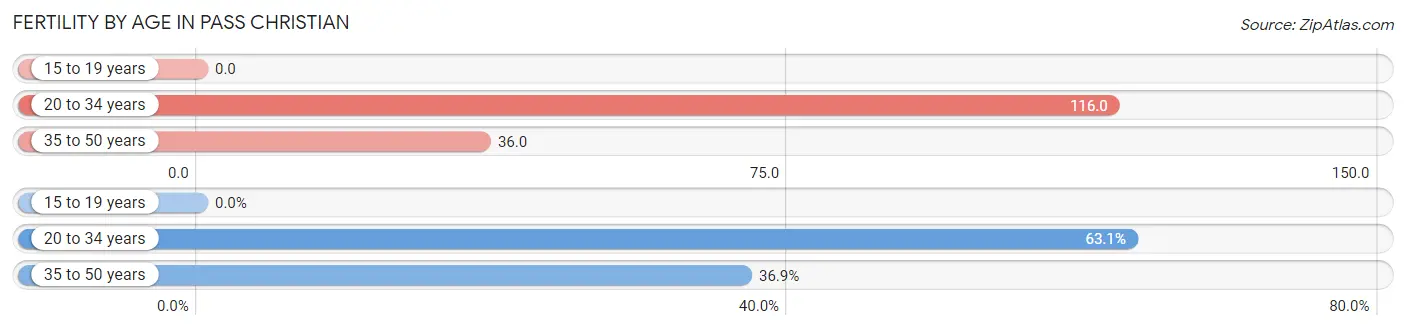
| Age Bracket | Women with Births | Births / 1,000 Women |
| 15 to 19 years | 0 (0.0%) | 0.0 |
| 20 to 34 years | 41 (63.1%) | 116.0 |
| 35 to 50 years | 24 (36.9%) | 36.0 |
| Total | 65 (100.0%) | 57.0 |
Fertility by Age by Marriage Status in Pass Christian
78.5% of women with births (65) in Pass Christian are married. The highest percentage of unmarried women with births falls into 35 to 50 years age bracket with 58.3% of them unmarried at the time of birth, while the lowest percentage of unmarried women with births belong to 20 to 34 years age bracket with 0.0% of them unmarried.
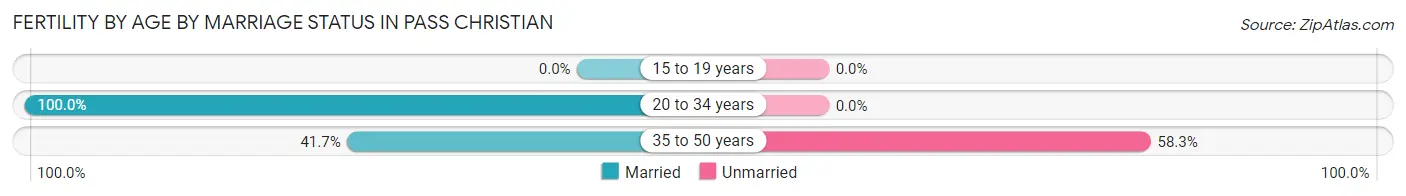
| Age Bracket | Married | Unmarried |
| 15 to 19 years | 0 (0.0%) | 0 (0.0%) |
| 20 to 34 years | 41 (100.0%) | 0 (0.0%) |
| 35 to 50 years | 10 (41.7%) | 14 (58.3%) |
| Total | 51 (78.5%) | 14 (21.5%) |
Fertility by Education in Pass Christian
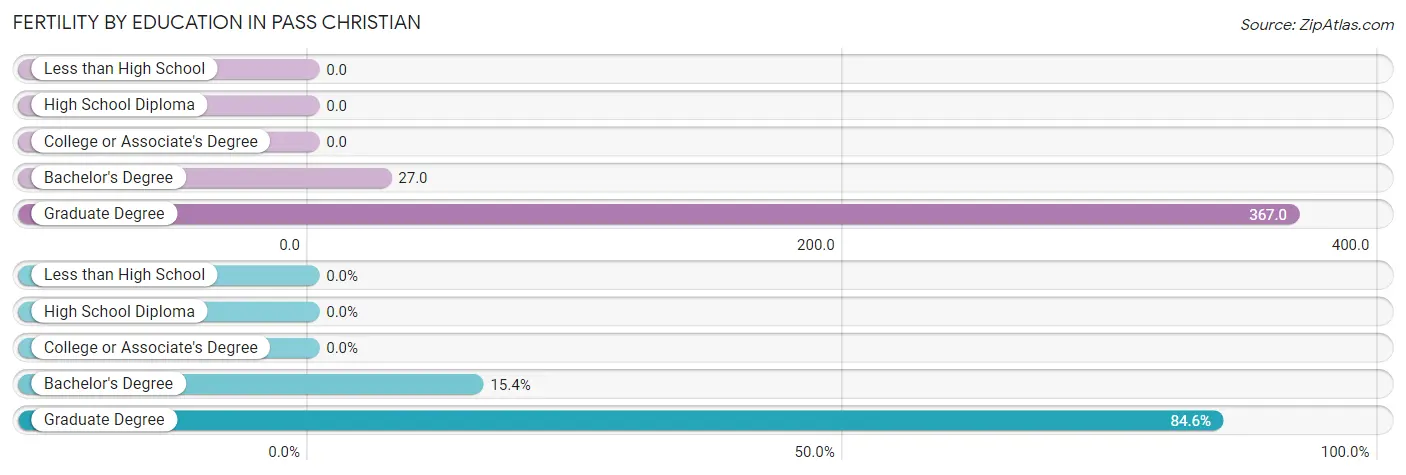
| Educational Attainment | Women with Births | Births / 1,000 Women |
| Less than High School | 0 (0.0%) | 0.0 |
| High School Diploma | 0 (0.0%) | 0.0 |
| College or Associate's Degree | 0 (0.0%) | 0.0 |
| Bachelor's Degree | 10 (15.4%) | 27.0 |
| Graduate Degree | 55 (84.6%) | 367.0 |
| Total | 65 (100.0%) | 57.0 |
Fertility by Education by Marriage Status in Pass Christian
21.5% of women with births in Pass Christian are unmarried. Women with the educational attainment of bachelor's degree are most likely to be married with 100.0% of them married at childbirth, while women with the educational attainment of graduate degree are least likely to be married with 25.5% of them unmarried at childbirth.
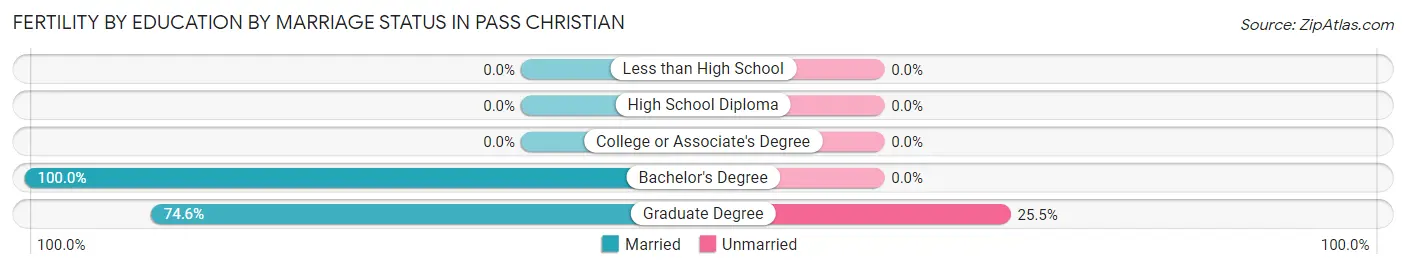
| Educational Attainment | Married | Unmarried |
| Less than High School | 0 (0.0%) | 0 (0.0%) |
| High School Diploma | 0 (0.0%) | 0 (0.0%) |
| College or Associate's Degree | 0 (0.0%) | 0 (0.0%) |
| Bachelor's Degree | 10 (100.0%) | 0 (0.0%) |
| Graduate Degree | 41 (74.6%) | 14 (25.5%) |
| Total | 51 (78.5%) | 14 (21.5%) |
Employment Characteristics in Pass Christian
Employment by Class of Employer in Pass Christian
Among the 2,438 employed individuals in Pass Christian, private company employees (1,621 | 66.5%), local government employees (232 | 9.5%), and state government employees (146 | 6.0%) make up the most common classes of employment.
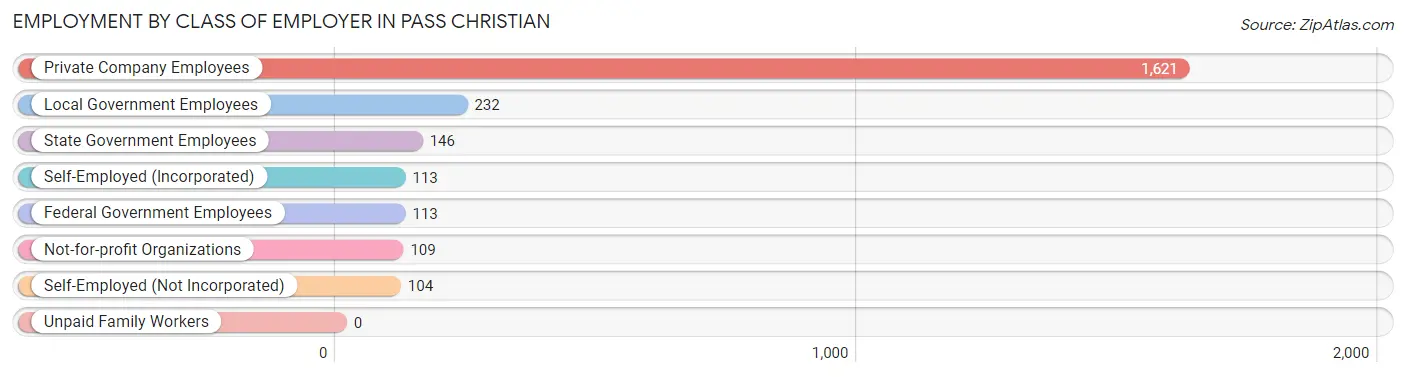
| Employer Class | # Employees | % Employees |
| Private Company Employees | 1,621 | 66.5% |
| Self-Employed (Incorporated) | 113 | 4.6% |
| Self-Employed (Not Incorporated) | 104 | 4.3% |
| Not-for-profit Organizations | 109 | 4.5% |
| Local Government Employees | 232 | 9.5% |
| State Government Employees | 146 | 6.0% |
| Federal Government Employees | 113 | 4.6% |
| Unpaid Family Workers | 0 | 0.0% |
| Total | 2,438 | 100.0% |
Employment Status by Age in Pass Christian
According to the labor force statistics for Pass Christian, out of the total population over 16 years of age (4,490), 59.2% or 2,658 individuals are in the labor force, with 8.4% or 223 of them unemployed. The age group with the highest labor force participation rate is 25 to 29 years, with 100.0% or 187 individuals in the labor force. Within the labor force, the 20 to 24 years age range has the highest percentage of unemployed individuals, with 28.9% or 52 of them being unemployed.
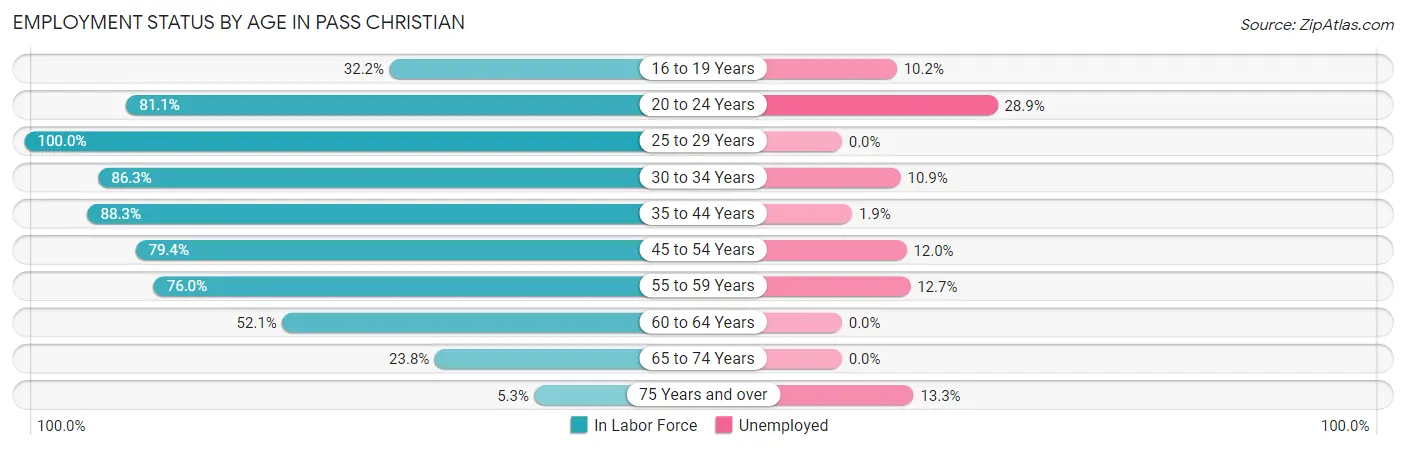
| Age Bracket | In Labor Force | Unemployed |
| 16 to 19 Years | 88 (32.2%) | 9 (10.2%) |
| 20 to 24 Years | 180 (81.1%) | 52 (28.9%) |
| 25 to 29 Years | 187 (100.0%) | 0 (0.0%) |
| 30 to 34 Years | 321 (86.3%) | 35 (10.9%) |
| 35 to 44 Years | 672 (88.3%) | 13 (1.9%) |
| 45 to 54 Years | 535 (79.4%) | 64 (12.0%) |
| 55 to 59 Years | 332 (76.0%) | 42 (12.7%) |
| 60 to 64 Years | 137 (52.1%) | 0 (0.0%) |
| 65 to 74 Years | 175 (23.8%) | 0 (0.0%) |
| 75 Years and over | 30 (5.3%) | 4 (13.3%) |
| Total | 2,658 (59.2%) | 223 (8.4%) |
Employment Status by Educational Attainment in Pass Christian
According to labor force statistics for Pass Christian, 81.1% of individuals (2,185) out of the total population between 25 and 64 years of age (2,694) are in the labor force, with 7.2% or 157 of them being unemployed. The group with the highest labor force participation rate are those with the educational attainment of bachelor's degree or higher, with 91.8% or 1,125 individuals in the labor force. Within the labor force, individuals with less than high school education have the highest percentage of unemployment, with 23.1% or 12 of them being unemployed.
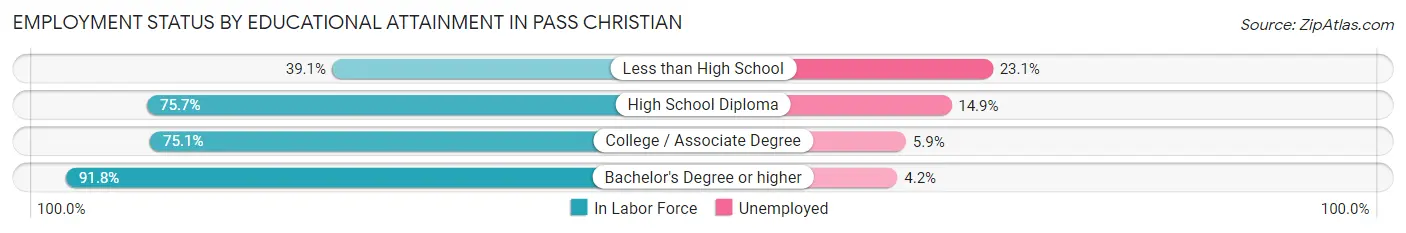
| Educational Attainment | In Labor Force | Unemployed |
| Less than High School | 52 (39.1%) | 31 (23.1%) |
| High School Diploma | 430 (75.7%) | 85 (14.9%) |
| College / Associate Degree | 576 (75.1%) | 45 (5.9%) |
| Bachelor's Degree or higher | 1,125 (91.8%) | 51 (4.2%) |
| Total | 2,185 (81.1%) | 194 (7.2%) |
Employment Occupations by Sex in Pass Christian
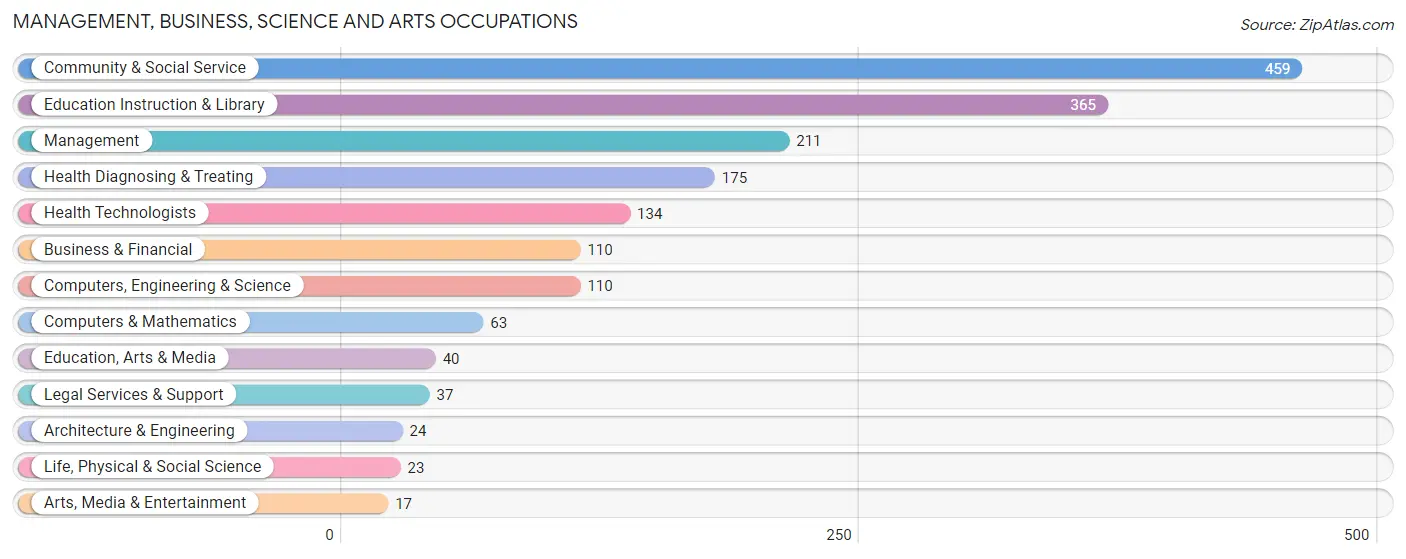
Management, Business, Science and Arts Occupations
The most common Management, Business, Science and Arts occupations in Pass Christian are Community & Social Service (459 | 19.2%), Education Instruction & Library (365 | 15.3%), Management (211 | 8.8%), Health Diagnosing & Treating (175 | 7.3%), and Health Technologists (134 | 5.6%).
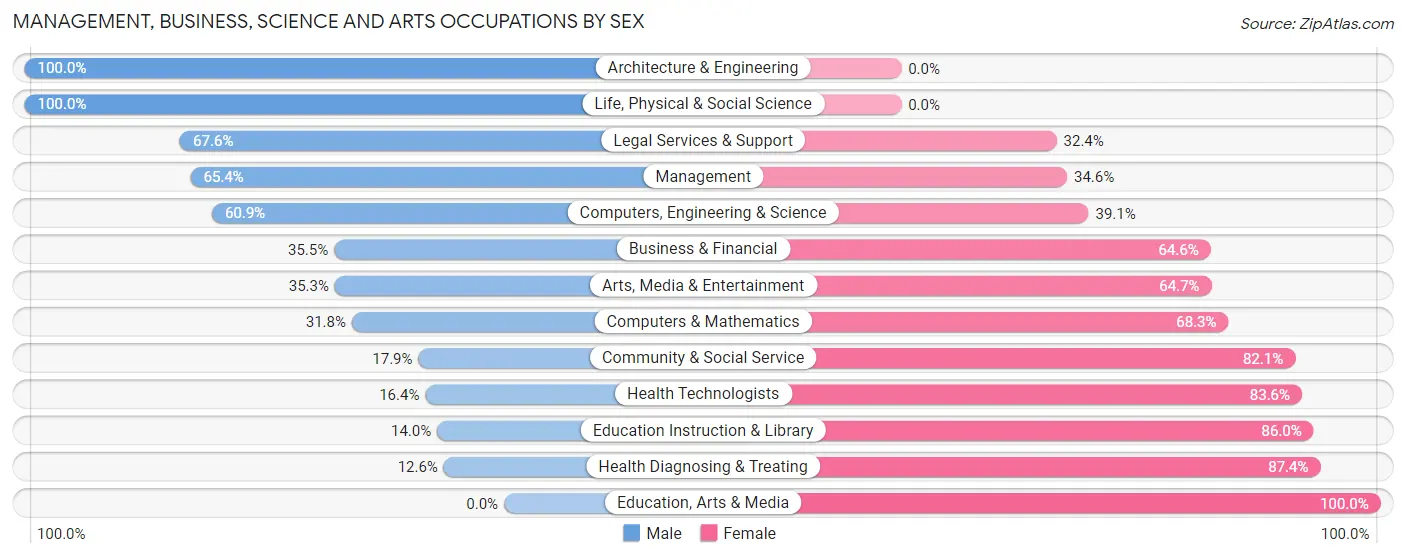
Management, Business, Science and Arts Occupations by Sex
Within the Management, Business, Science and Arts occupations in Pass Christian, the most male-oriented occupations are Architecture & Engineering (100.0%), Life, Physical & Social Science (100.0%), and Legal Services & Support (67.6%), while the most female-oriented occupations are Education, Arts & Media (100.0%), Health Diagnosing & Treating (87.4%), and Education Instruction & Library (86.0%).
| Occupation | Male | Female |
| Management | 138 (65.4%) | 73 (34.6%) |
| Business & Financial | 39 (35.4%) | 71 (64.5%) |
| Computers, Engineering & Science | 67 (60.9%) | 43 (39.1%) |
| Computers & Mathematics | 20 (31.8%) | 43 (68.2%) |
| Architecture & Engineering | 24 (100.0%) | 0 (0.0%) |
| Life, Physical & Social Science | 23 (100.0%) | 0 (0.0%) |
| Community & Social Service | 82 (17.9%) | 377 (82.1%) |
| Education, Arts & Media | 0 (0.0%) | 40 (100.0%) |
| Legal Services & Support | 25 (67.6%) | 12 (32.4%) |
| Education Instruction & Library | 51 (14.0%) | 314 (86.0%) |
| Arts, Media & Entertainment | 6 (35.3%) | 11 (64.7%) |
| Health Diagnosing & Treating | 22 (12.6%) | 153 (87.4%) |
| Health Technologists | 22 (16.4%) | 112 (83.6%) |
| Total (Category) | 348 (32.7%) | 717 (67.3%) |
| Total (Overall) | 1,122 (47.0%) | 1,266 (53.0%) |
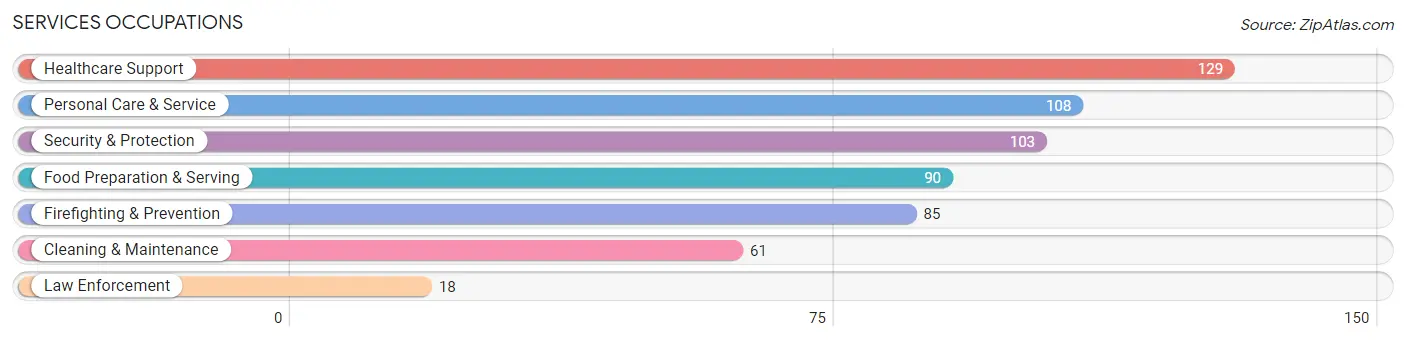
Services Occupations
The most common Services occupations in Pass Christian are Healthcare Support (129 | 5.4%), Personal Care & Service (108 | 4.5%), Security & Protection (103 | 4.3%), Food Preparation & Serving (90 | 3.8%), and Firefighting & Prevention (85 | 3.6%).
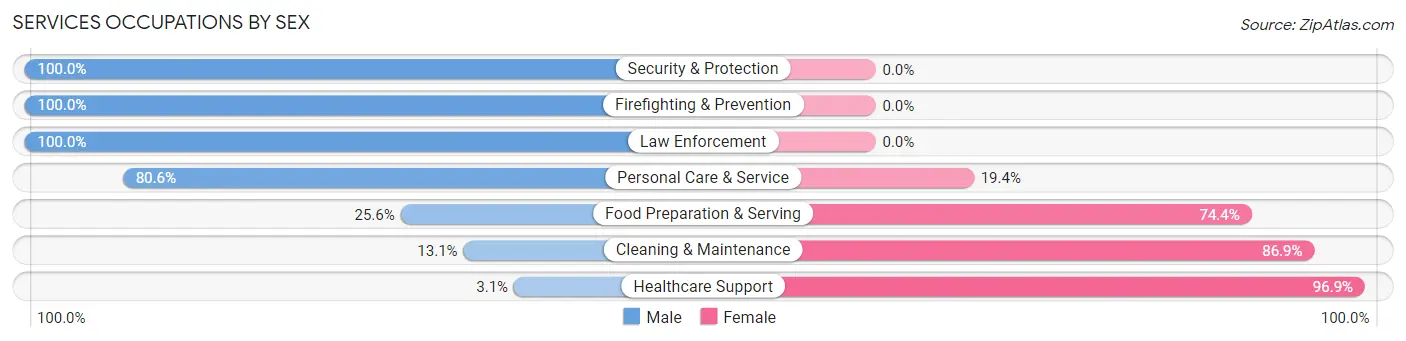
Services Occupations by Sex
Within the Services occupations in Pass Christian, the most male-oriented occupations are Security & Protection (100.0%), Firefighting & Prevention (100.0%), and Law Enforcement (100.0%), while the most female-oriented occupations are Healthcare Support (96.9%), Cleaning & Maintenance (86.9%), and Food Preparation & Serving (74.4%).
| Occupation | Male | Female |
| Healthcare Support | 4 (3.1%) | 125 (96.9%) |
| Security & Protection | 103 (100.0%) | 0 (0.0%) |
| Firefighting & Prevention | 85 (100.0%) | 0 (0.0%) |
| Law Enforcement | 18 (100.0%) | 0 (0.0%) |
| Food Preparation & Serving | 23 (25.6%) | 67 (74.4%) |
| Cleaning & Maintenance | 8 (13.1%) | 53 (86.9%) |
| Personal Care & Service | 87 (80.6%) | 21 (19.4%) |
| Total (Category) | 225 (45.8%) | 266 (54.2%) |
| Total (Overall) | 1,122 (47.0%) | 1,266 (53.0%) |
Sales and Office Occupations
The most common Sales and Office occupations in Pass Christian are Sales & Related (268 | 11.2%), and Office & Administration (223 | 9.3%).
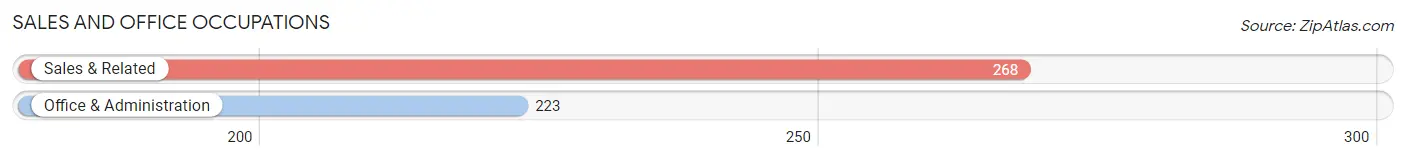
Sales and Office Occupations by Sex
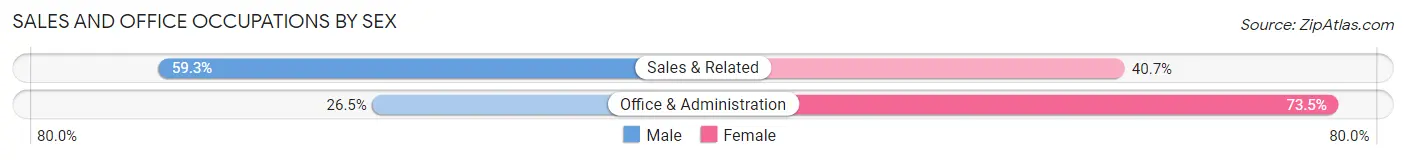
| Occupation | Male | Female |
| Sales & Related | 159 (59.3%) | 109 (40.7%) |
| Office & Administration | 59 (26.5%) | 164 (73.5%) |
| Total (Category) | 218 (44.4%) | 273 (55.6%) |
| Total (Overall) | 1,122 (47.0%) | 1,266 (53.0%) |
Natural Resources, Construction and Maintenance Occupations
The most common Natural Resources, Construction and Maintenance occupations in Pass Christian are , and Installation, Maintenance & Repair (19 | 0.8%).
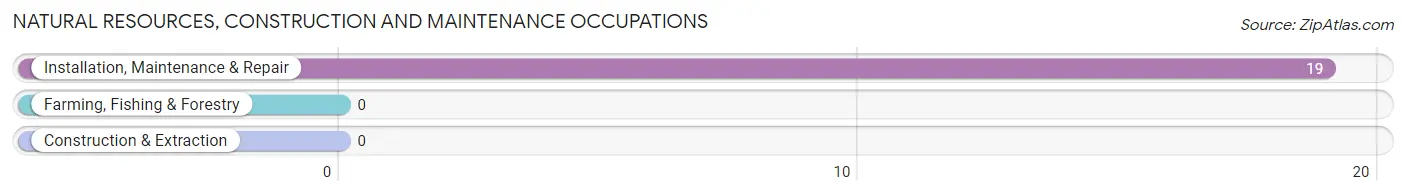
Natural Resources, Construction and Maintenance Occupations by Sex
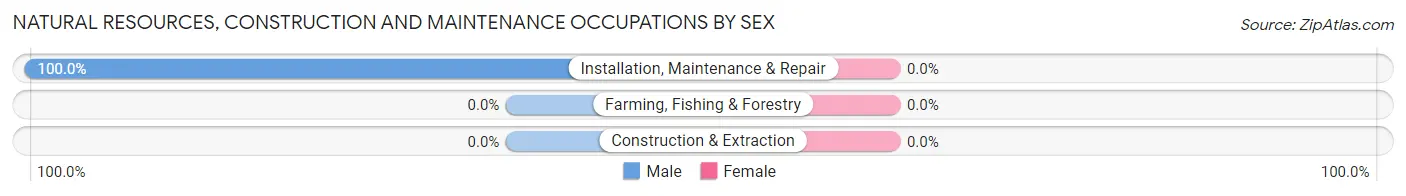
| Occupation | Male | Female |
| Farming, Fishing & Forestry | 0 (0.0%) | 0 (0.0%) |
| Construction & Extraction | 0 (0.0%) | 0 (0.0%) |
| Installation, Maintenance & Repair | 19 (100.0%) | 0 (0.0%) |
| Total (Category) | 19 (100.0%) | 0 (0.0%) |
| Total (Overall) | 1,122 (47.0%) | 1,266 (53.0%) |
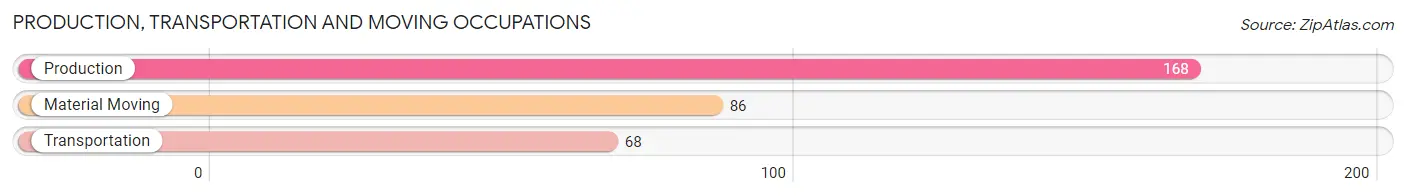
Production, Transportation and Moving Occupations
The most common Production, Transportation and Moving occupations in Pass Christian are Production (168 | 7.0%), Material Moving (86 | 3.6%), and Transportation (68 | 2.9%).
Production, Transportation and Moving Occupations by Sex
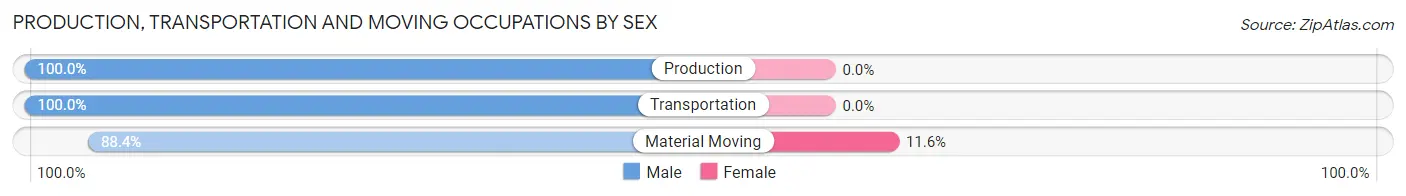
| Occupation | Male | Female |
| Production | 168 (100.0%) | 0 (0.0%) |
| Transportation | 68 (100.0%) | 0 (0.0%) |
| Material Moving | 76 (88.4%) | 10 (11.6%) |
| Total (Category) | 312 (96.9%) | 10 (3.1%) |
| Total (Overall) | 1,122 (47.0%) | 1,266 (53.0%) |
Employment Industries by Sex in Pass Christian
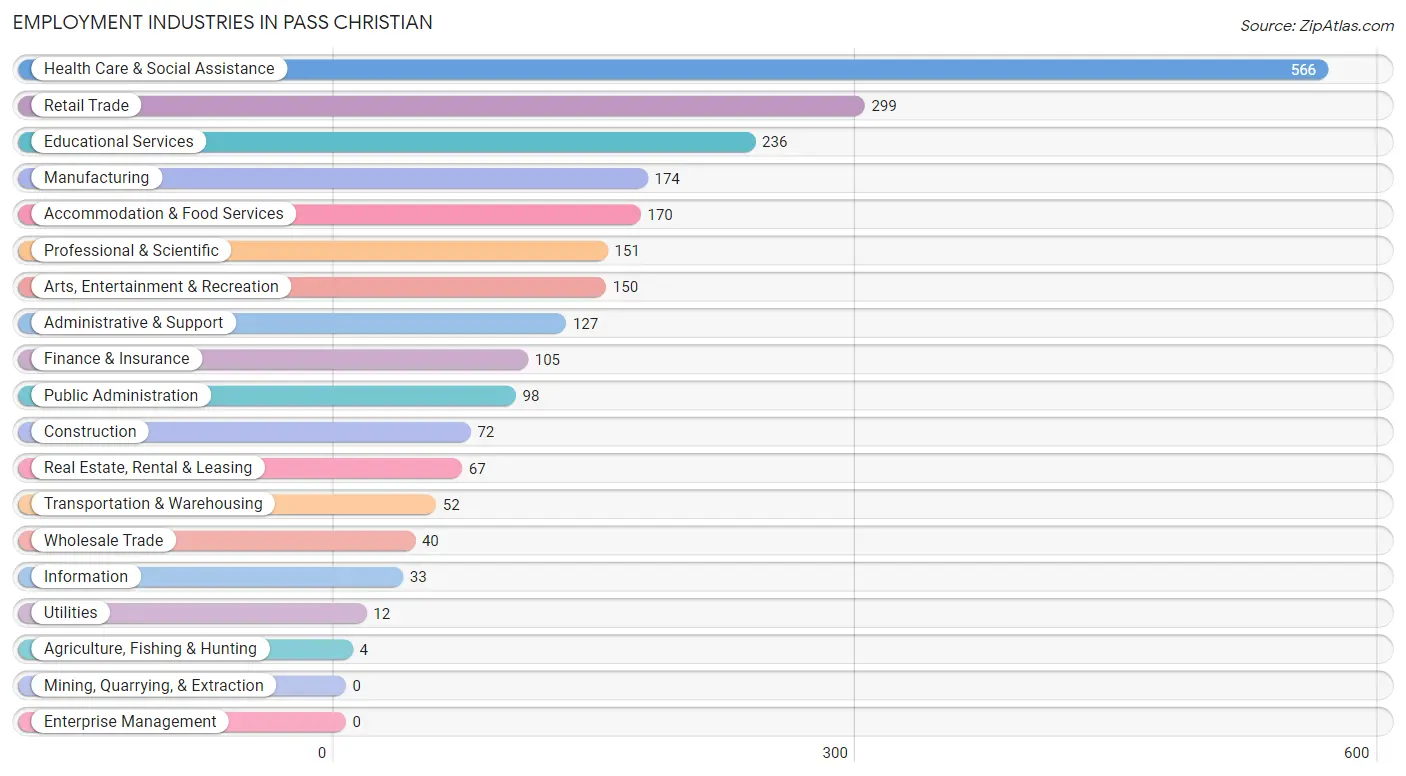
Employment Industries in Pass Christian
The major employment industries in Pass Christian include Health Care & Social Assistance (566 | 23.7%), Retail Trade (299 | 12.5%), Educational Services (236 | 9.9%), Manufacturing (174 | 7.3%), and Accommodation & Food Services (170 | 7.1%).
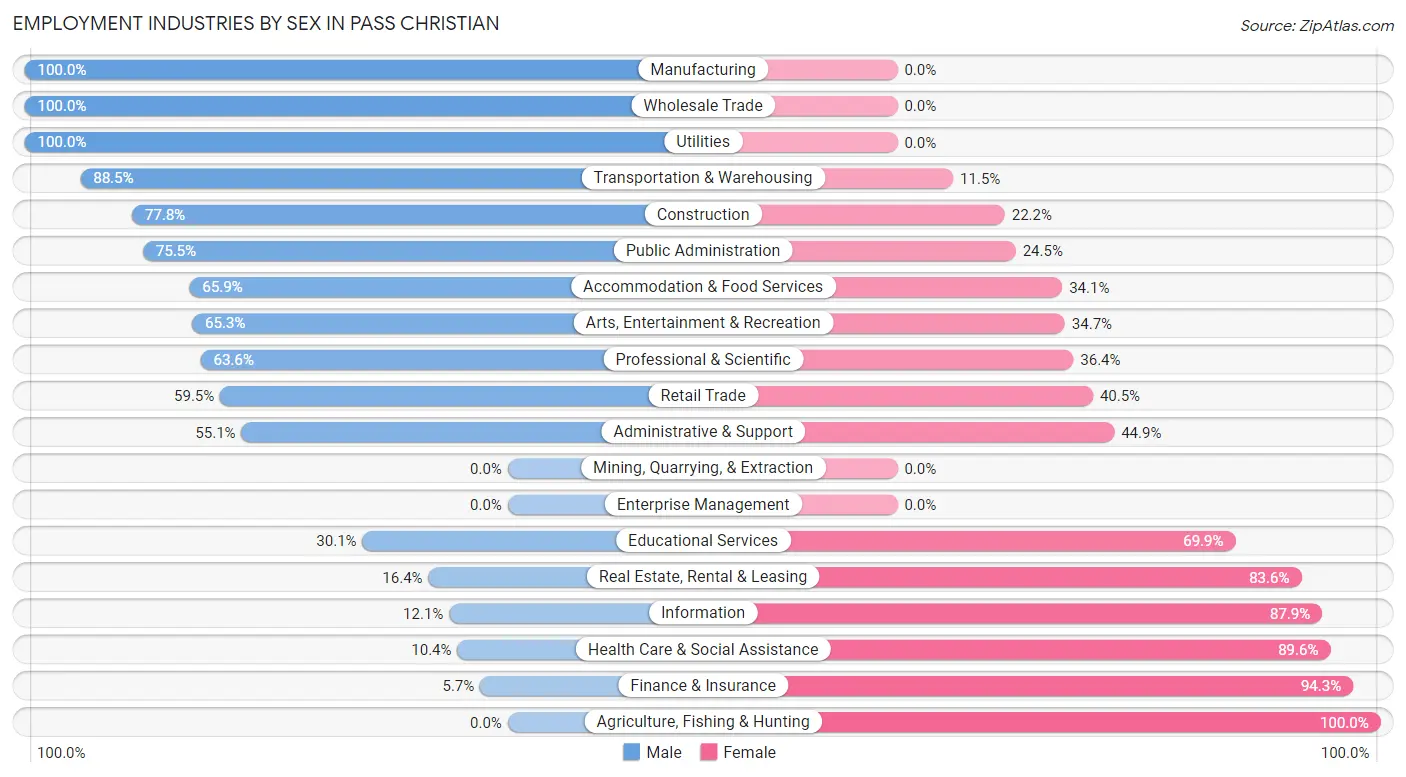
Employment Industries by Sex in Pass Christian
The Pass Christian industries that see more men than women are Manufacturing (100.0%), Wholesale Trade (100.0%), and Utilities (100.0%), whereas the industries that tend to have a higher number of women are Agriculture, Fishing & Hunting (100.0%), Finance & Insurance (94.3%), and Health Care & Social Assistance (89.6%).
| Industry | Male | Female |
| Agriculture, Fishing & Hunting | 0 (0.0%) | 4 (100.0%) |
| Mining, Quarrying, & Extraction | 0 (0.0%) | 0 (0.0%) |
| Construction | 56 (77.8%) | 16 (22.2%) |
| Manufacturing | 174 (100.0%) | 0 (0.0%) |
| Wholesale Trade | 40 (100.0%) | 0 (0.0%) |
| Retail Trade | 178 (59.5%) | 121 (40.5%) |
| Transportation & Warehousing | 46 (88.5%) | 6 (11.5%) |
| Utilities | 12 (100.0%) | 0 (0.0%) |
| Information | 4 (12.1%) | 29 (87.9%) |
| Finance & Insurance | 6 (5.7%) | 99 (94.3%) |
| Real Estate, Rental & Leasing | 11 (16.4%) | 56 (83.6%) |
| Professional & Scientific | 96 (63.6%) | 55 (36.4%) |
| Enterprise Management | 0 (0.0%) | 0 (0.0%) |
| Administrative & Support | 70 (55.1%) | 57 (44.9%) |
| Educational Services | 71 (30.1%) | 165 (69.9%) |
| Health Care & Social Assistance | 59 (10.4%) | 507 (89.6%) |
| Arts, Entertainment & Recreation | 98 (65.3%) | 52 (34.7%) |
| Accommodation & Food Services | 112 (65.9%) | 58 (34.1%) |
| Public Administration | 74 (75.5%) | 24 (24.5%) |
| Total | 1,122 (47.0%) | 1,266 (53.0%) |
Education in Pass Christian
School Enrollment in Pass Christian
The most common levels of schooling among the 1,330 students in Pass Christian are middle school (396 | 29.8%), high school (311 | 23.4%), and elementary school (269 | 20.2%).
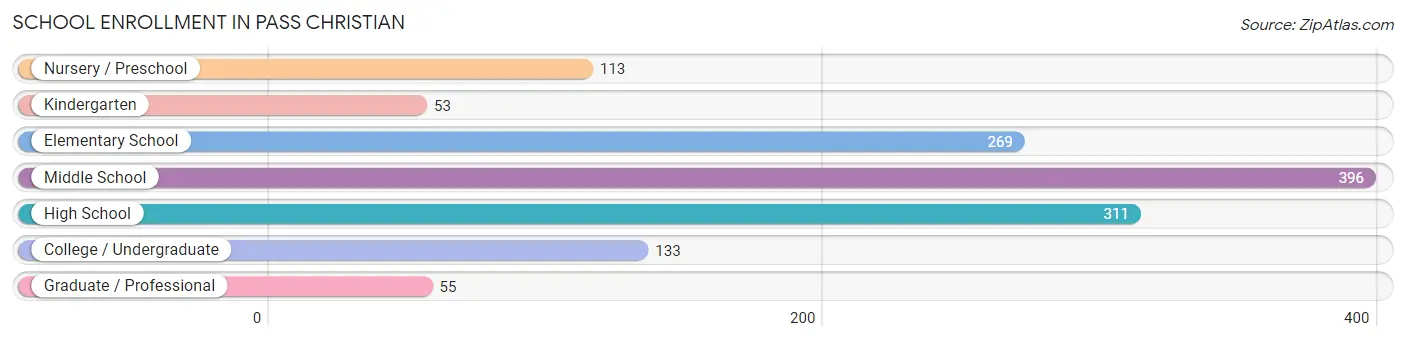
| School Level | # Students | % Students |
| Nursery / Preschool | 113 | 8.5% |
| Kindergarten | 53 | 4.0% |
| Elementary School | 269 | 20.2% |
| Middle School | 396 | 29.8% |
| High School | 311 | 23.4% |
| College / Undergraduate | 133 | 10.0% |
| Graduate / Professional | 55 | 4.1% |
| Total | 1,330 | 100.0% |
School Enrollment by Age by Funding Source in Pass Christian
Out of a total of 1,330 students who are enrolled in schools in Pass Christian, 275 (20.7%) attend a private institution, while the remaining 1,055 (79.3%) are enrolled in public schools. The age group of 3 to 4 year olds has the highest likelihood of being enrolled in private schools, with 58 (76.3% in the age bracket) enrolled. Conversely, the age group of 25 to 34 year olds has the lowest likelihood of being enrolled in a private school, with 11 (100.0% in the age bracket) attending a public institution.
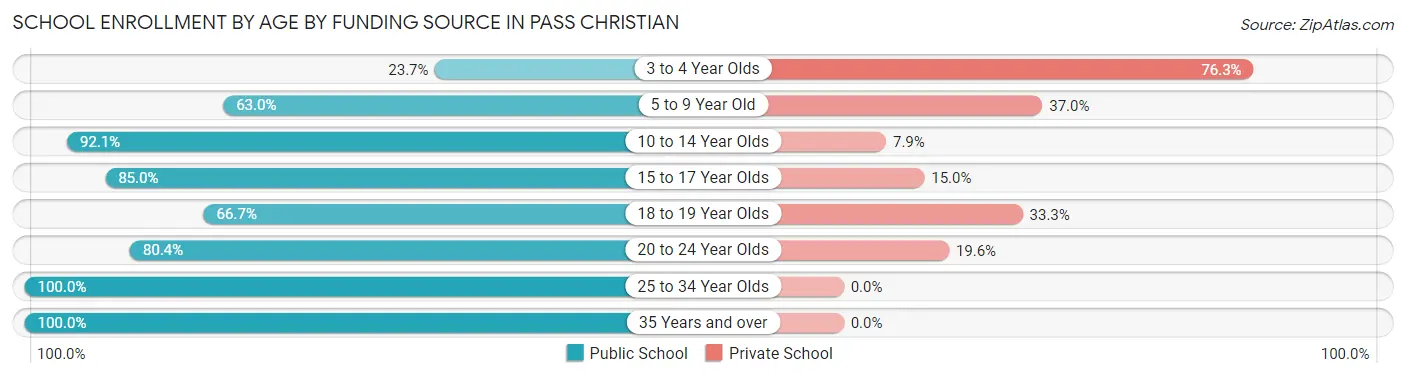
| Age Bracket | Public School | Private School |
| 3 to 4 Year Olds | 18 (23.7%) | 58 (76.3%) |
| 5 to 9 Year Old | 206 (63.0%) | 121 (37.0%) |
| 10 to 14 Year Olds | 455 (92.1%) | 39 (7.9%) |
| 15 to 17 Year Olds | 198 (85.0%) | 35 (15.0%) |
| 18 to 19 Year Olds | 24 (66.7%) | 12 (33.3%) |
| 20 to 24 Year Olds | 41 (80.4%) | 10 (19.6%) |
| 25 to 34 Year Olds | 11 (100.0%) | 0 (0.0%) |
| 35 Years and over | 102 (100.0%) | 0 (0.0%) |
| Total | 1,055 (79.3%) | 275 (20.7%) |
Educational Attainment by Field of Study in Pass Christian
Science & technology (440 | 23.1%), business (334 | 17.5%), education (207 | 10.9%), social sciences (138 | 7.2%), and engineering (123 | 6.5%) are the most common fields of study among 1,906 individuals in Pass Christian who have obtained a bachelor's degree or higher.
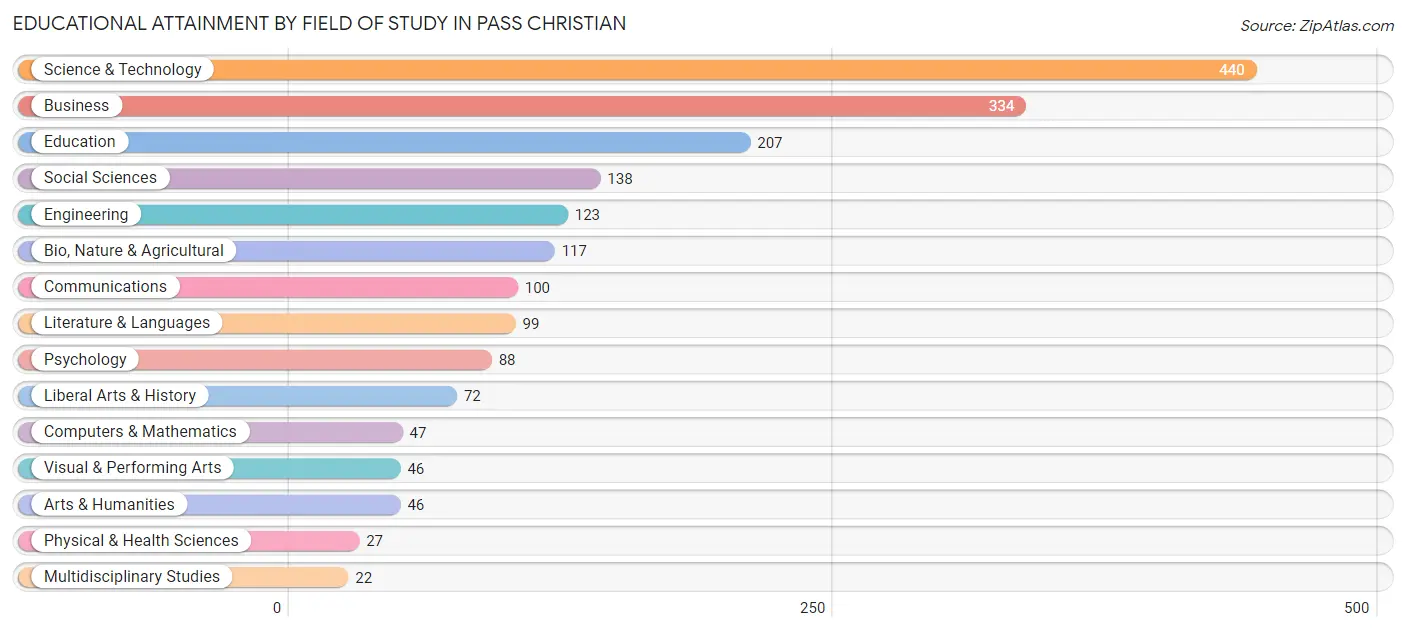
| Field of Study | # Graduates | % Graduates |
| Computers & Mathematics | 47 | 2.5% |
| Bio, Nature & Agricultural | 117 | 6.1% |
| Physical & Health Sciences | 27 | 1.4% |
| Psychology | 88 | 4.6% |
| Social Sciences | 138 | 7.2% |
| Engineering | 123 | 6.5% |
| Multidisciplinary Studies | 22 | 1.1% |
| Science & Technology | 440 | 23.1% |
| Business | 334 | 17.5% |
| Education | 207 | 10.9% |
| Literature & Languages | 99 | 5.2% |
| Liberal Arts & History | 72 | 3.8% |
| Visual & Performing Arts | 46 | 2.4% |
| Communications | 100 | 5.2% |
| Arts & Humanities | 46 | 2.4% |
| Total | 1,906 | 100.0% |
Transportation & Commute in Pass Christian
Vehicle Availability by Sex in Pass Christian
The most prevalent vehicle ownership categories in Pass Christian are males with 2 vehicles (538, accounting for 45.9%) and females with 2 vehicles (582, making up 42.5%).
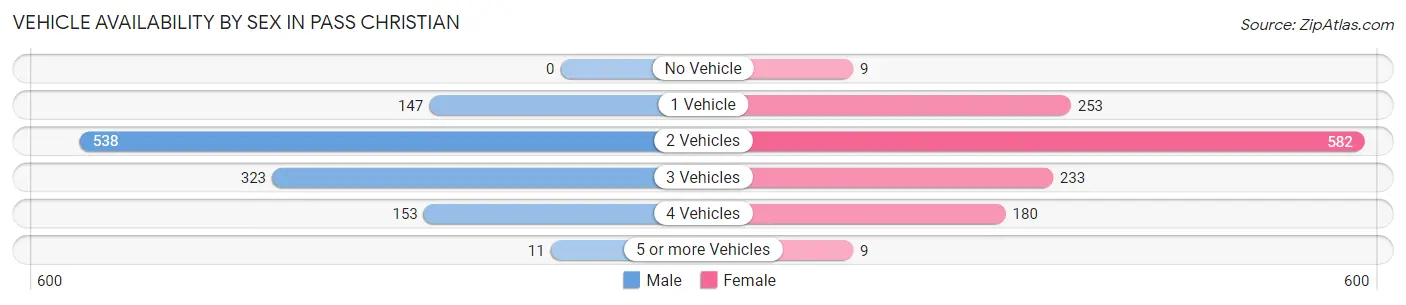
| Vehicles Available | Male | Female |
| No Vehicle | 0 (0.0%) | 9 (0.7%) |
| 1 Vehicle | 147 (12.5%) | 253 (20.0%) |
| 2 Vehicles | 538 (45.9%) | 582 (46.0%) |
| 3 Vehicles | 323 (27.6%) | 233 (18.4%) |
| 4 Vehicles | 153 (13.1%) | 180 (14.2%) |
| 5 or more Vehicles | 11 (0.9%) | 9 (0.7%) |
| Total | 1,172 (100.0%) | 1,266 (100.0%) |
Commute Time in Pass Christian
The most frequently occuring commute durations in Pass Christian are 15 to 19 minutes (528 commuters, 22.7%), 20 to 24 minutes (513 commuters, 22.0%), and 45 to 59 minutes (358 commuters, 15.4%).
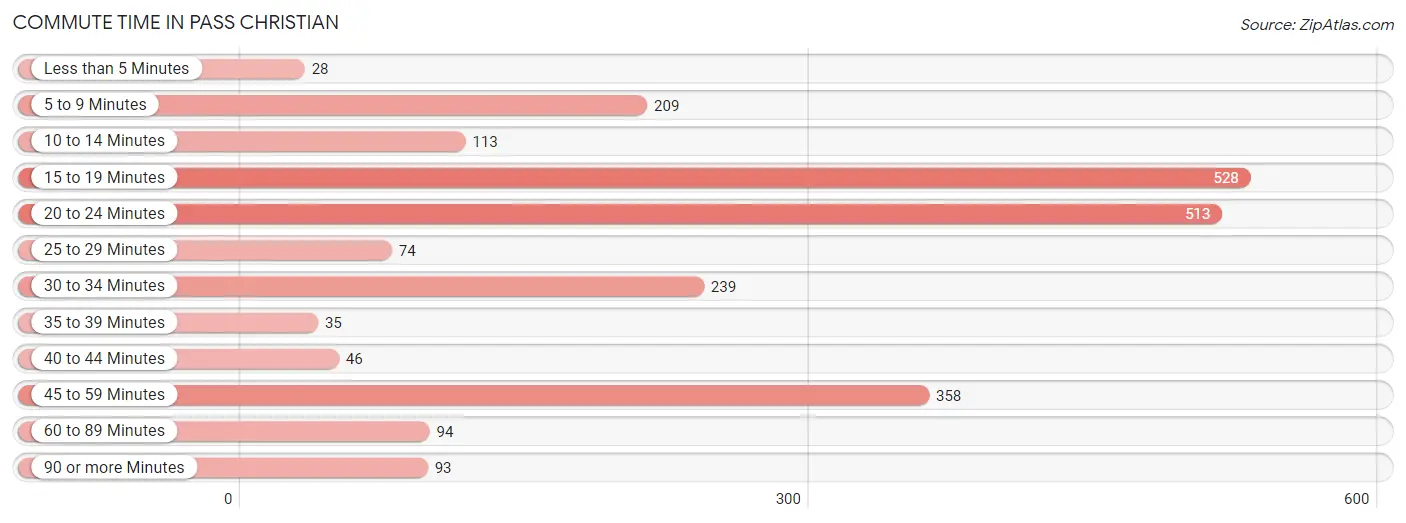
| Commute Time | # Commuters | % Commuters |
| Less than 5 Minutes | 28 | 1.2% |
| 5 to 9 Minutes | 209 | 9.0% |
| 10 to 14 Minutes | 113 | 4.9% |
| 15 to 19 Minutes | 528 | 22.7% |
| 20 to 24 Minutes | 513 | 22.0% |
| 25 to 29 Minutes | 74 | 3.2% |
| 30 to 34 Minutes | 239 | 10.3% |
| 35 to 39 Minutes | 35 | 1.5% |
| 40 to 44 Minutes | 46 | 2.0% |
| 45 to 59 Minutes | 358 | 15.4% |
| 60 to 89 Minutes | 94 | 4.0% |
| 90 or more Minutes | 93 | 4.0% |
Commute Time by Sex in Pass Christian
The most common commute times in Pass Christian are 20 to 24 minutes (275 commuters, 24.1%) for males and 15 to 19 minutes (346 commuters, 29.1%) for females.
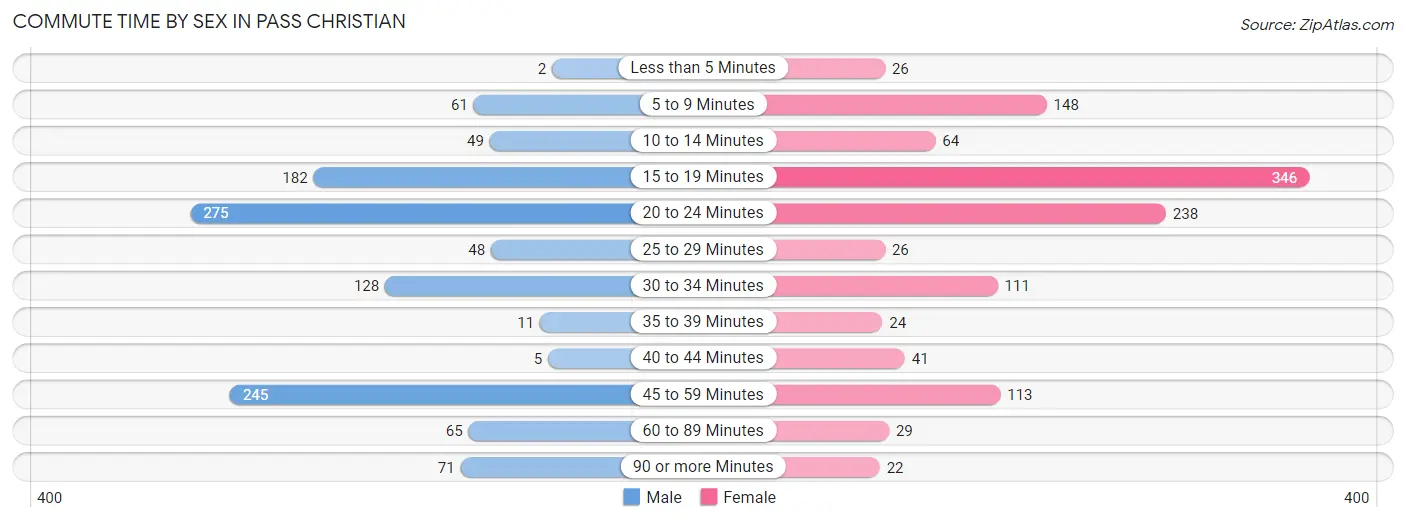
| Commute Time | Male | Female |
| Less than 5 Minutes | 2 (0.2%) | 26 (2.2%) |
| 5 to 9 Minutes | 61 (5.3%) | 148 (12.5%) |
| 10 to 14 Minutes | 49 (4.3%) | 64 (5.4%) |
| 15 to 19 Minutes | 182 (15.9%) | 346 (29.1%) |
| 20 to 24 Minutes | 275 (24.1%) | 238 (20.0%) |
| 25 to 29 Minutes | 48 (4.2%) | 26 (2.2%) |
| 30 to 34 Minutes | 128 (11.2%) | 111 (9.3%) |
| 35 to 39 Minutes | 11 (1.0%) | 24 (2.0%) |
| 40 to 44 Minutes | 5 (0.4%) | 41 (3.5%) |
| 45 to 59 Minutes | 245 (21.4%) | 113 (9.5%) |
| 60 to 89 Minutes | 65 (5.7%) | 29 (2.4%) |
| 90 or more Minutes | 71 (6.2%) | 22 (1.8%) |
Time of Departure to Work by Sex in Pass Christian
The most frequent times of departure to work in Pass Christian are 7:00 AM to 7:29 AM (185, 16.2%) for males and 7:00 AM to 7:29 AM (362, 30.5%) for females.
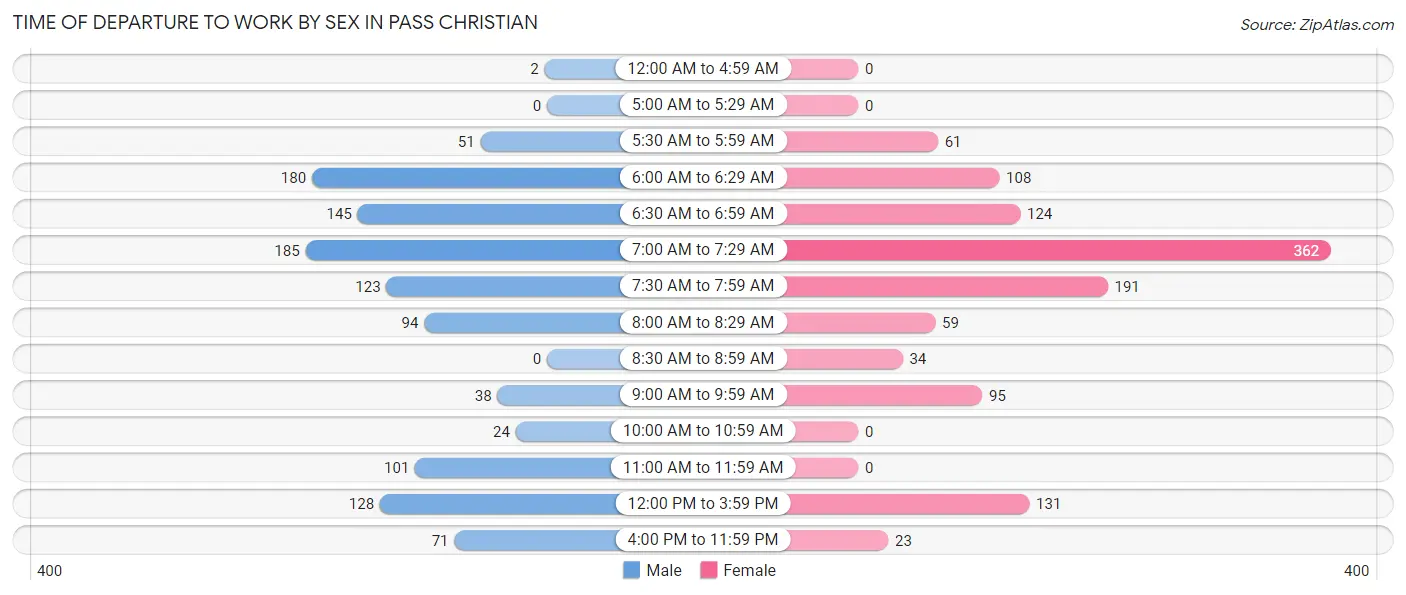
| Time of Departure | Male | Female |
| 12:00 AM to 4:59 AM | 2 (0.2%) | 0 (0.0%) |
| 5:00 AM to 5:29 AM | 0 (0.0%) | 0 (0.0%) |
| 5:30 AM to 5:59 AM | 51 (4.5%) | 61 (5.1%) |
| 6:00 AM to 6:29 AM | 180 (15.8%) | 108 (9.1%) |
| 6:30 AM to 6:59 AM | 145 (12.7%) | 124 (10.4%) |
| 7:00 AM to 7:29 AM | 185 (16.2%) | 362 (30.5%) |
| 7:30 AM to 7:59 AM | 123 (10.8%) | 191 (16.1%) |
| 8:00 AM to 8:29 AM | 94 (8.2%) | 59 (5.0%) |
| 8:30 AM to 8:59 AM | 0 (0.0%) | 34 (2.9%) |
| 9:00 AM to 9:59 AM | 38 (3.3%) | 95 (8.0%) |
| 10:00 AM to 10:59 AM | 24 (2.1%) | 0 (0.0%) |
| 11:00 AM to 11:59 AM | 101 (8.8%) | 0 (0.0%) |
| 12:00 PM to 3:59 PM | 128 (11.2%) | 131 (11.0%) |
| 4:00 PM to 11:59 PM | 71 (6.2%) | 23 (1.9%) |
| Total | 1,142 (100.0%) | 1,188 (100.0%) |
Housing Occupancy in Pass Christian
Occupancy by Ownership in Pass Christian
Of the total 2,284 dwellings in Pass Christian, owner-occupied units account for 1,673 (73.3%), while renter-occupied units make up 611 (26.8%).
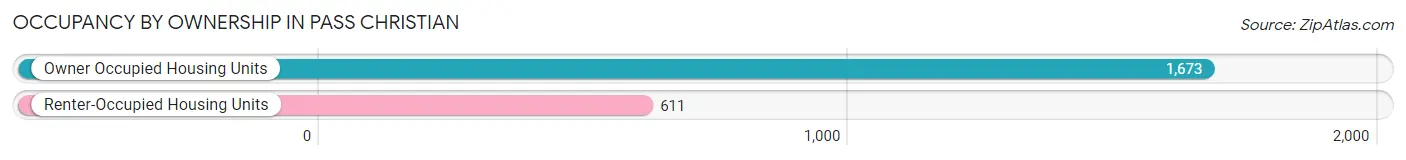
| Occupancy | # Housing Units | % Housing Units |
| Owner Occupied Housing Units | 1,673 | 73.3% |
| Renter-Occupied Housing Units | 611 | 26.8% |
| Total Occupied Housing Units | 2,284 | 100.0% |
Occupancy by Household Size in Pass Christian
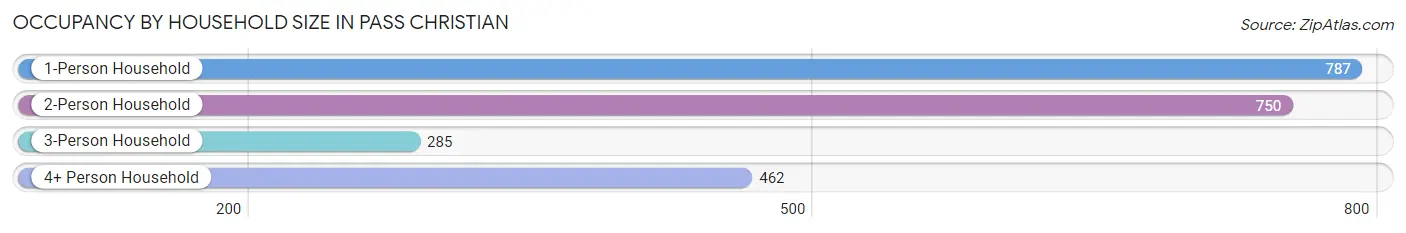
| Household Size | # Housing Units | % Housing Units |
| 1-Person Household | 787 | 34.5% |
| 2-Person Household | 750 | 32.8% |
| 3-Person Household | 285 | 12.5% |
| 4+ Person Household | 462 | 20.2% |
| Total Housing Units | 2,284 | 100.0% |
Occupancy by Ownership by Household Size in Pass Christian
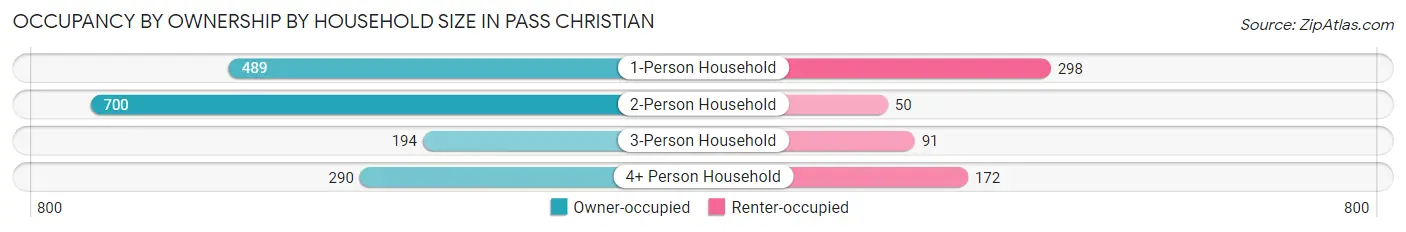
| Household Size | Owner-occupied | Renter-occupied |
| 1-Person Household | 489 (62.1%) | 298 (37.9%) |
| 2-Person Household | 700 (93.3%) | 50 (6.7%) |
| 3-Person Household | 194 (68.1%) | 91 (31.9%) |
| 4+ Person Household | 290 (62.8%) | 172 (37.2%) |
| Total Housing Units | 1,673 (73.3%) | 611 (26.8%) |
Occupancy by Educational Attainment in Pass Christian
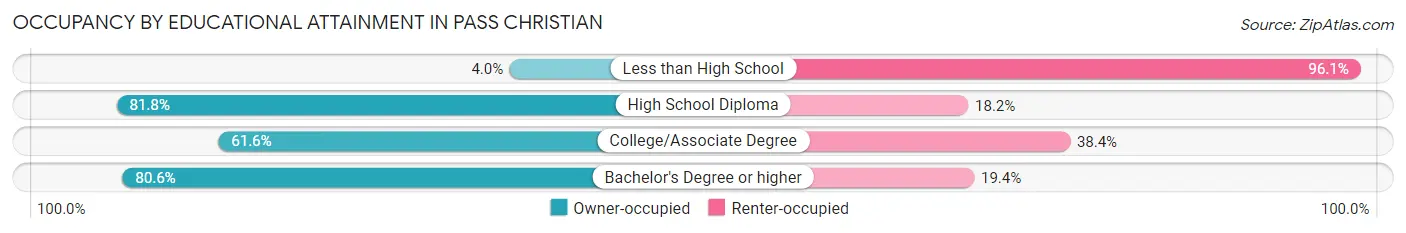
| Household Size | Owner-occupied | Renter-occupied |
| Less than High School | 3 (4.0%) | 73 (96.1%) |
| High School Diploma | 435 (81.8%) | 97 (18.2%) |
| College/Associate Degree | 375 (61.6%) | 234 (38.4%) |
| Bachelor's Degree or higher | 860 (80.6%) | 207 (19.4%) |
Occupancy by Age of Householder in Pass Christian
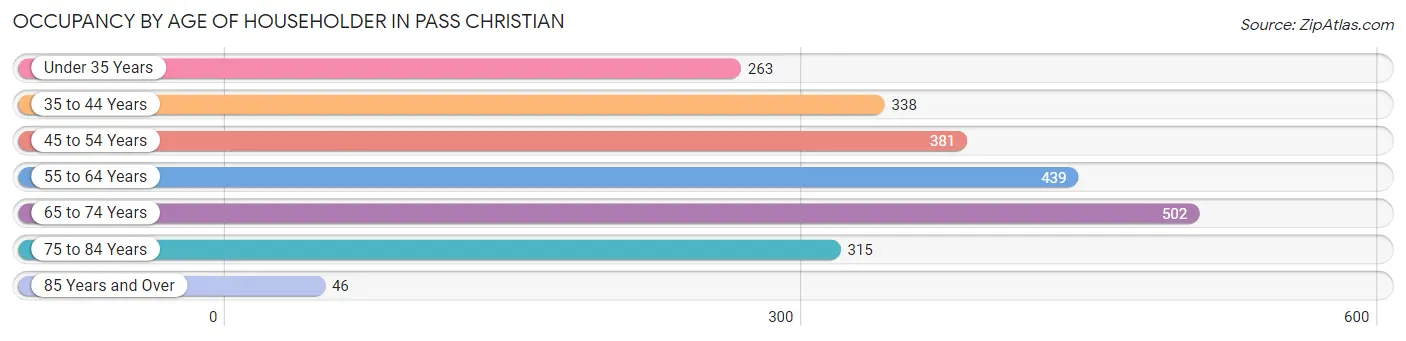
| Age Bracket | # Households | % Households |
| Under 35 Years | 263 | 11.5% |
| 35 to 44 Years | 338 | 14.8% |
| 45 to 54 Years | 381 | 16.7% |
| 55 to 64 Years | 439 | 19.2% |
| 65 to 74 Years | 502 | 22.0% |
| 75 to 84 Years | 315 | 13.8% |
| 85 Years and Over | 46 | 2.0% |
| Total | 2,284 | 100.0% |
Housing Finances in Pass Christian
Median Income by Occupancy in Pass Christian
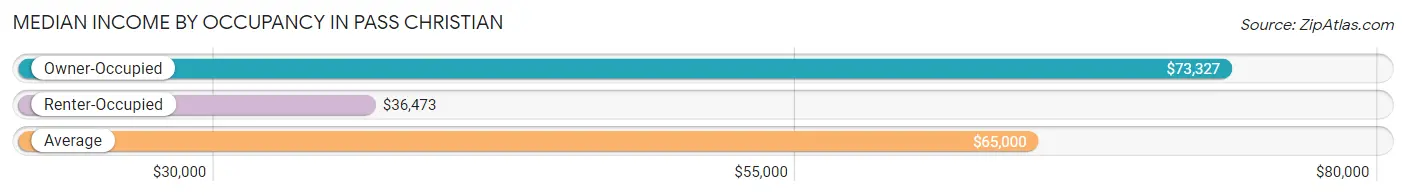
| Occupancy Type | # Households | Median Income |
| Owner-Occupied | 1,673 (73.3%) | $73,327 |
| Renter-Occupied | 611 (26.8%) | $36,473 |
| Average | 2,284 (100.0%) | $65,000 |
Occupancy by Householder Income Bracket in Pass Christian
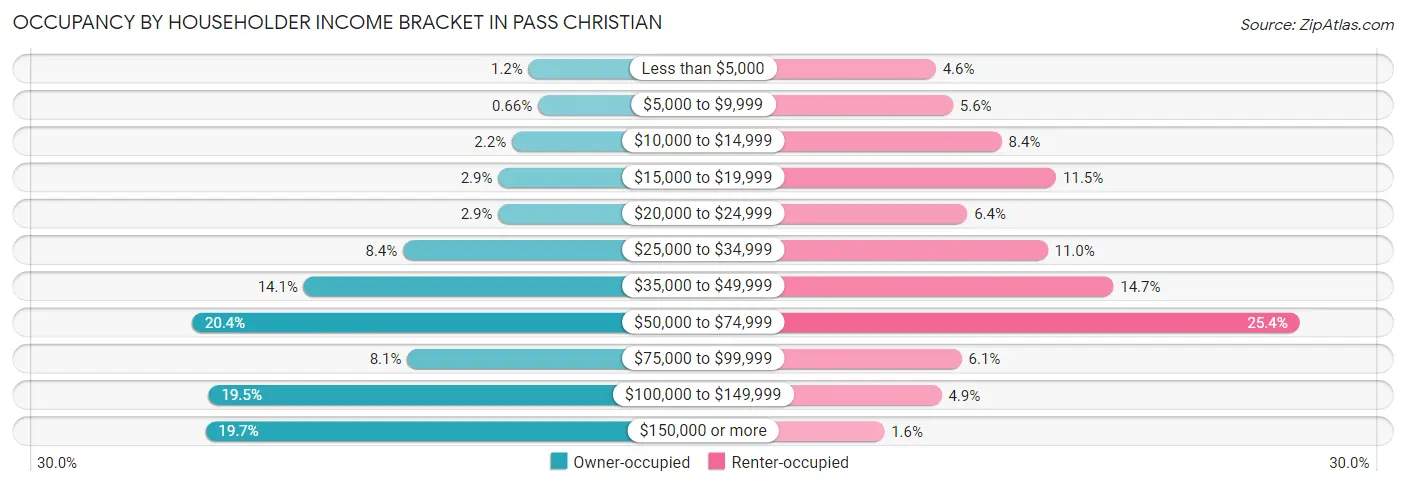
| Income Bracket | Owner-occupied | Renter-occupied |
| Less than $5,000 | 20 (1.2%) | 28 (4.6%) |
| $5,000 to $9,999 | 11 (0.7%) | 34 (5.6%) |
| $10,000 to $14,999 | 36 (2.1%) | 51 (8.4%) |
| $15,000 to $19,999 | 49 (2.9%) | 70 (11.5%) |
| $20,000 to $24,999 | 49 (2.9%) | 39 (6.4%) |
| $25,000 to $34,999 | 140 (8.4%) | 67 (11.0%) |
| $35,000 to $49,999 | 235 (14.1%) | 90 (14.7%) |
| $50,000 to $74,999 | 342 (20.4%) | 155 (25.4%) |
| $75,000 to $99,999 | 136 (8.1%) | 37 (6.1%) |
| $100,000 to $149,999 | 326 (19.5%) | 30 (4.9%) |
| $150,000 or more | 329 (19.7%) | 10 (1.6%) |
| Total | 1,673 (100.0%) | 611 (100.0%) |
Monthly Housing Cost Tiers in Pass Christian
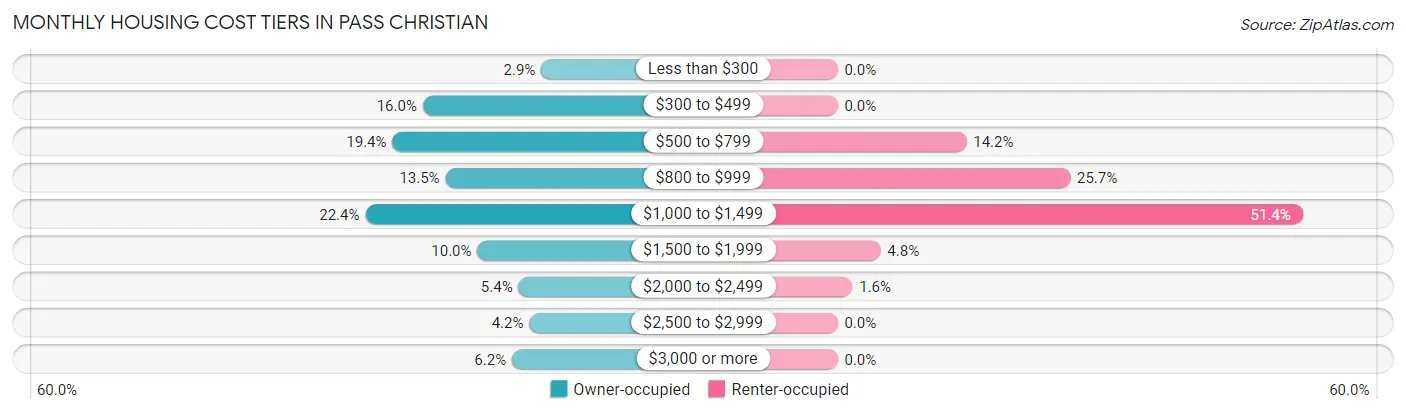
| Monthly Cost | Owner-occupied | Renter-occupied |
| Less than $300 | 49 (2.9%) | 0 (0.0%) |
| $300 to $499 | 268 (16.0%) | 0 (0.0%) |
| $500 to $799 | 324 (19.4%) | 87 (14.2%) |
| $800 to $999 | 226 (13.5%) | 157 (25.7%) |
| $1,000 to $1,499 | 374 (22.4%) | 314 (51.4%) |
| $1,500 to $1,999 | 167 (10.0%) | 29 (4.8%) |
| $2,000 to $2,499 | 91 (5.4%) | 10 (1.6%) |
| $2,500 to $2,999 | 71 (4.2%) | 0 (0.0%) |
| $3,000 or more | 103 (6.2%) | 0 (0.0%) |
| Total | 1,673 (100.0%) | 611 (100.0%) |
Physical Housing Characteristics in Pass Christian
Housing Structures in Pass Christian
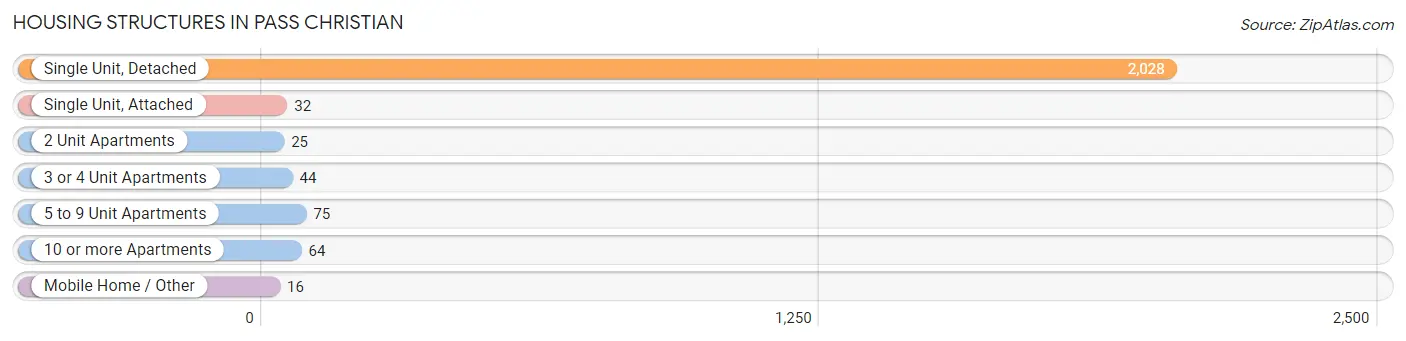
| Structure Type | # Housing Units | % Housing Units |
| Single Unit, Detached | 2,028 | 88.8% |
| Single Unit, Attached | 32 | 1.4% |
| 2 Unit Apartments | 25 | 1.1% |
| 3 or 4 Unit Apartments | 44 | 1.9% |
| 5 to 9 Unit Apartments | 75 | 3.3% |
| 10 or more Apartments | 64 | 2.8% |
| Mobile Home / Other | 16 | 0.7% |
| Total | 2,284 | 100.0% |
Housing Structures by Occupancy in Pass Christian
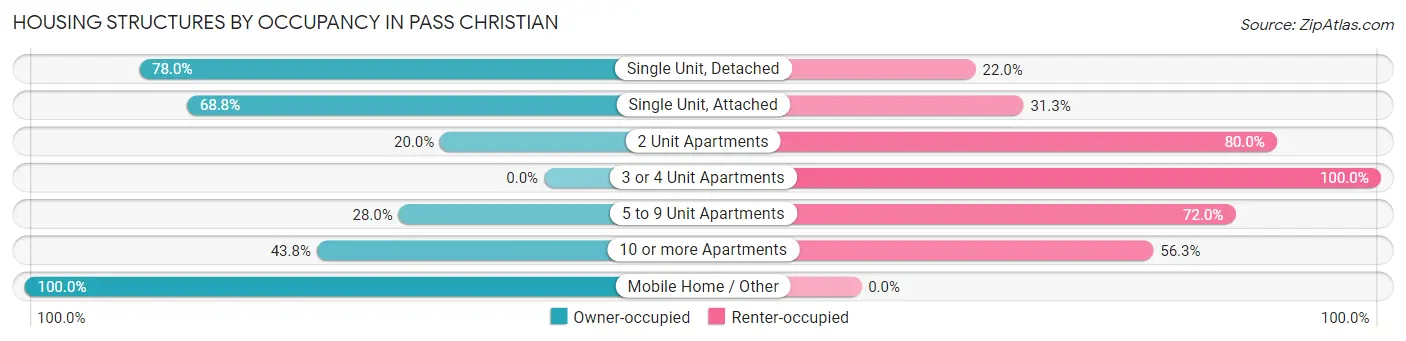
| Structure Type | Owner-occupied | Renter-occupied |
| Single Unit, Detached | 1,581 (78.0%) | 447 (22.0%) |
| Single Unit, Attached | 22 (68.8%) | 10 (31.2%) |
| 2 Unit Apartments | 5 (20.0%) | 20 (80.0%) |
| 3 or 4 Unit Apartments | 0 (0.0%) | 44 (100.0%) |
| 5 to 9 Unit Apartments | 21 (28.0%) | 54 (72.0%) |
| 10 or more Apartments | 28 (43.8%) | 36 (56.2%) |
| Mobile Home / Other | 16 (100.0%) | 0 (0.0%) |
| Total | 1,673 (73.3%) | 611 (26.8%) |
Housing Structures by Number of Rooms in Pass Christian
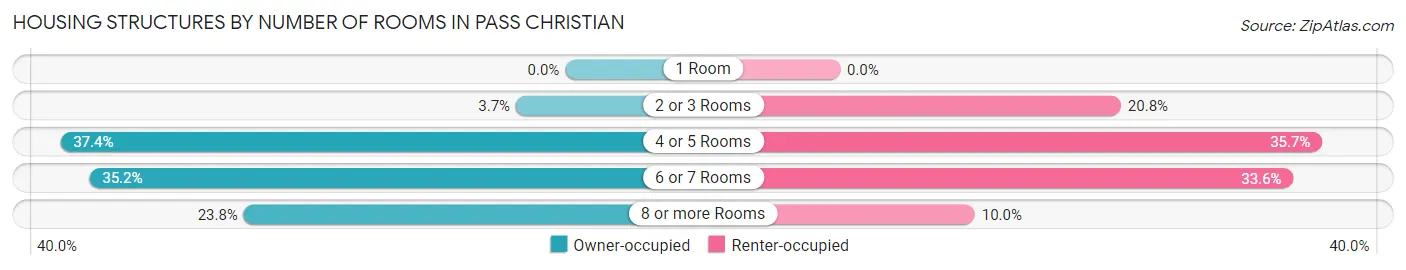
| Number of Rooms | Owner-occupied | Renter-occupied |
| 1 Room | 0 (0.0%) | 0 (0.0%) |
| 2 or 3 Rooms | 61 (3.6%) | 127 (20.8%) |
| 4 or 5 Rooms | 625 (37.4%) | 218 (35.7%) |
| 6 or 7 Rooms | 589 (35.2%) | 205 (33.6%) |
| 8 or more Rooms | 398 (23.8%) | 61 (10.0%) |
| Total | 1,673 (100.0%) | 611 (100.0%) |
Housing Structure by Heating Type in Pass Christian
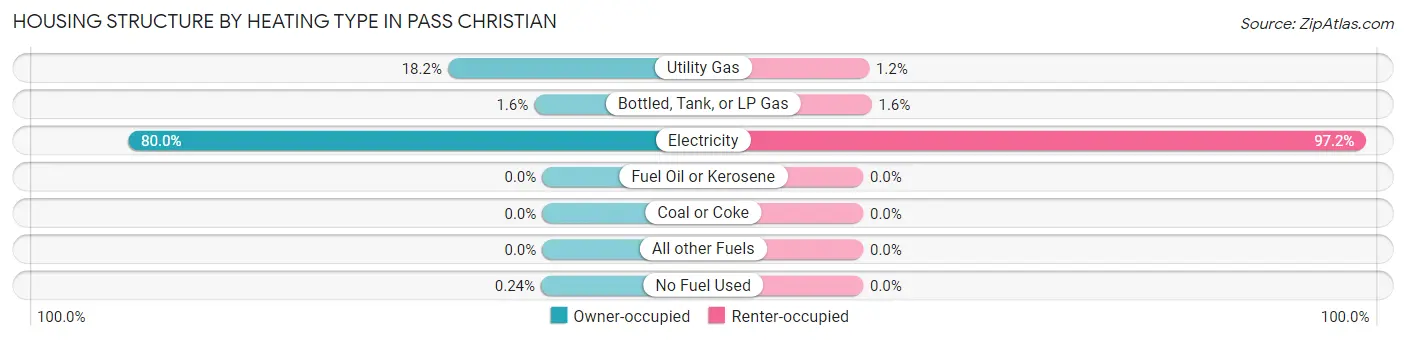
| Heating Type | Owner-occupied | Renter-occupied |
| Utility Gas | 305 (18.2%) | 7 (1.1%) |
| Bottled, Tank, or LP Gas | 26 (1.5%) | 10 (1.6%) |
| Electricity | 1,338 (80.0%) | 594 (97.2%) |
| Fuel Oil or Kerosene | 0 (0.0%) | 0 (0.0%) |
| Coal or Coke | 0 (0.0%) | 0 (0.0%) |
| All other Fuels | 0 (0.0%) | 0 (0.0%) |
| No Fuel Used | 4 (0.2%) | 0 (0.0%) |
| Total | 1,673 (100.0%) | 611 (100.0%) |
Household Vehicle Usage in Pass Christian
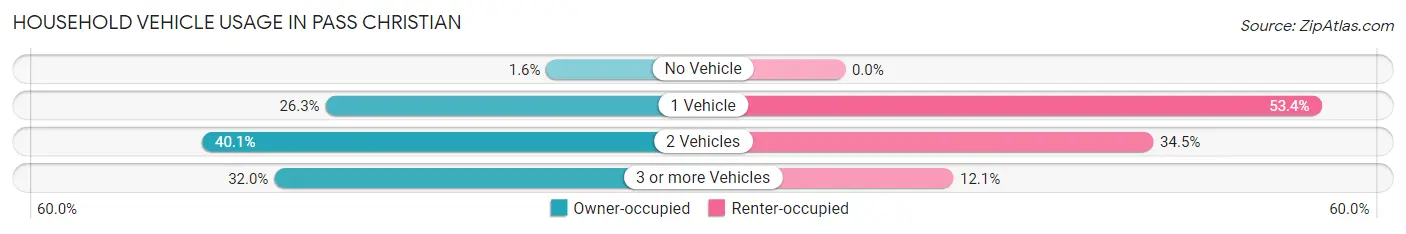
| Vehicles per Household | Owner-occupied | Renter-occupied |
| No Vehicle | 26 (1.5%) | 0 (0.0%) |
| 1 Vehicle | 440 (26.3%) | 326 (53.4%) |
| 2 Vehicles | 671 (40.1%) | 211 (34.5%) |
| 3 or more Vehicles | 536 (32.0%) | 74 (12.1%) |
| Total | 1,673 (100.0%) | 611 (100.0%) |
Real Estate & Mortgages in Pass Christian
Real Estate and Mortgage Overview in Pass Christian
| Characteristic | Without Mortgage | With Mortgage |
| Housing Units | 807 | 866 |
| Median Property Value | $233,400 | $250,000 |
| Median Household Income | $52,237 | $233 |
| Monthly Housing Costs | $573 | $103 |
| Real Estate Taxes | $1,668 | $119 |
Property Value by Mortgage Status in Pass Christian
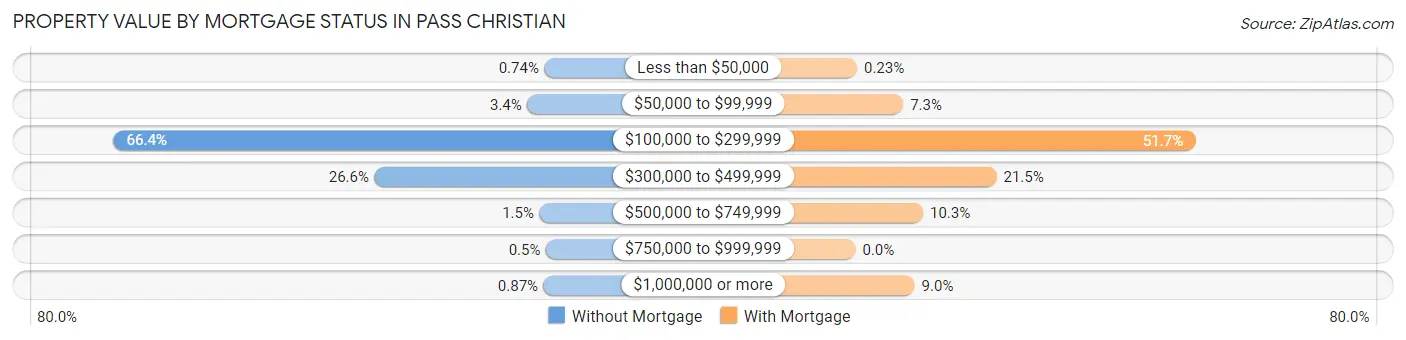
| Property Value | Without Mortgage | With Mortgage |
| Less than $50,000 | 6 (0.7%) | 2 (0.2%) |
| $50,000 to $99,999 | 27 (3.4%) | 63 (7.3%) |
| $100,000 to $299,999 | 536 (66.4%) | 448 (51.7%) |
| $300,000 to $499,999 | 215 (26.6%) | 186 (21.5%) |
| $500,000 to $749,999 | 12 (1.5%) | 89 (10.3%) |
| $750,000 to $999,999 | 4 (0.5%) | 0 (0.0%) |
| $1,000,000 or more | 7 (0.9%) | 78 (9.0%) |
| Total | 807 (100.0%) | 866 (100.0%) |
Household Income by Mortgage Status in Pass Christian
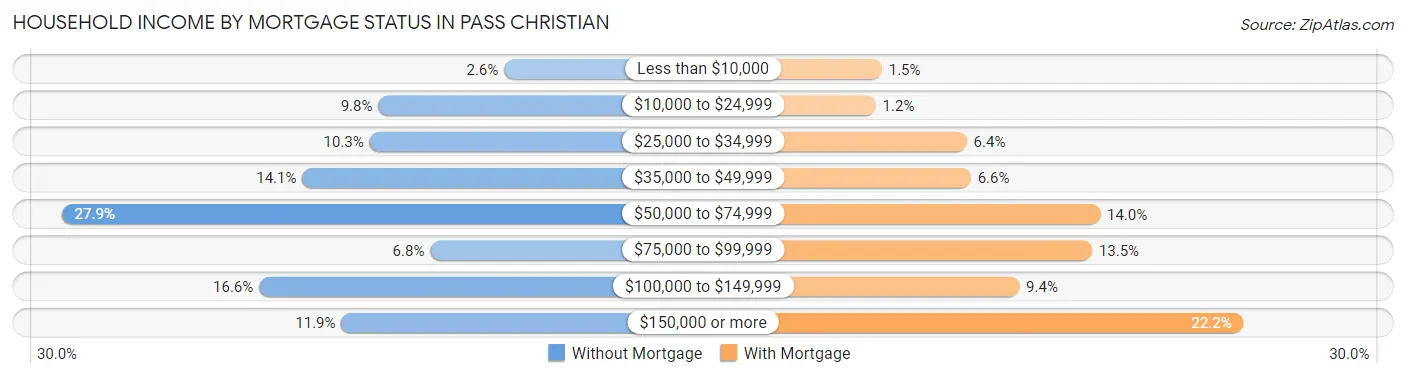
| Household Income | Without Mortgage | With Mortgage |
| Less than $10,000 | 21 (2.6%) | 13 (1.5%) |
| $10,000 to $24,999 | 79 (9.8%) | 10 (1.1%) |
| $25,000 to $34,999 | 83 (10.3%) | 55 (6.4%) |
| $35,000 to $49,999 | 114 (14.1%) | 57 (6.6%) |
| $50,000 to $74,999 | 225 (27.9%) | 121 (14.0%) |
| $75,000 to $99,999 | 55 (6.8%) | 117 (13.5%) |
| $100,000 to $149,999 | 134 (16.6%) | 81 (9.3%) |
| $150,000 or more | 96 (11.9%) | 192 (22.2%) |
| Total | 807 (100.0%) | 866 (100.0%) |
Property Value to Household Income Ratio in Pass Christian
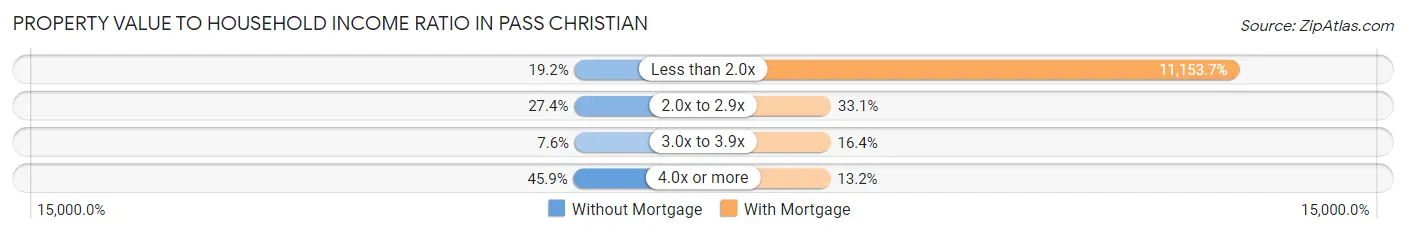
| Value-to-Income Ratio | Without Mortgage | With Mortgage |
| Less than 2.0x | 155 (19.2%) | 96,591 (11,153.7%) |
| 2.0x to 2.9x | 221 (27.4%) | 287 (33.1%) |
| 3.0x to 3.9x | 61 (7.6%) | 142 (16.4%) |
| 4.0x or more | 370 (45.9%) | 114 (13.2%) |
| Total | 807 (100.0%) | 866 (100.0%) |
Real Estate Taxes by Mortgage Status in Pass Christian
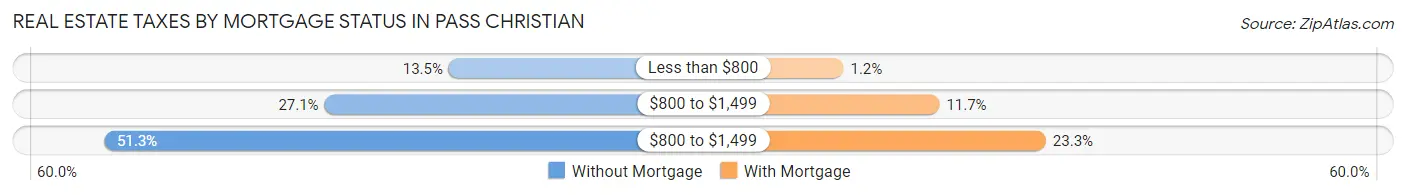
| Property Taxes | Without Mortgage | With Mortgage |
| Less than $800 | 109 (13.5%) | 10 (1.1%) |
| $800 to $1,499 | 219 (27.1%) | 101 (11.7%) |
| $800 to $1,499 | 414 (51.3%) | 202 (23.3%) |
| Total | 807 (100.0%) | 866 (100.0%) |
Health & Disability in Pass Christian
Health Insurance Coverage by Age in Pass Christian
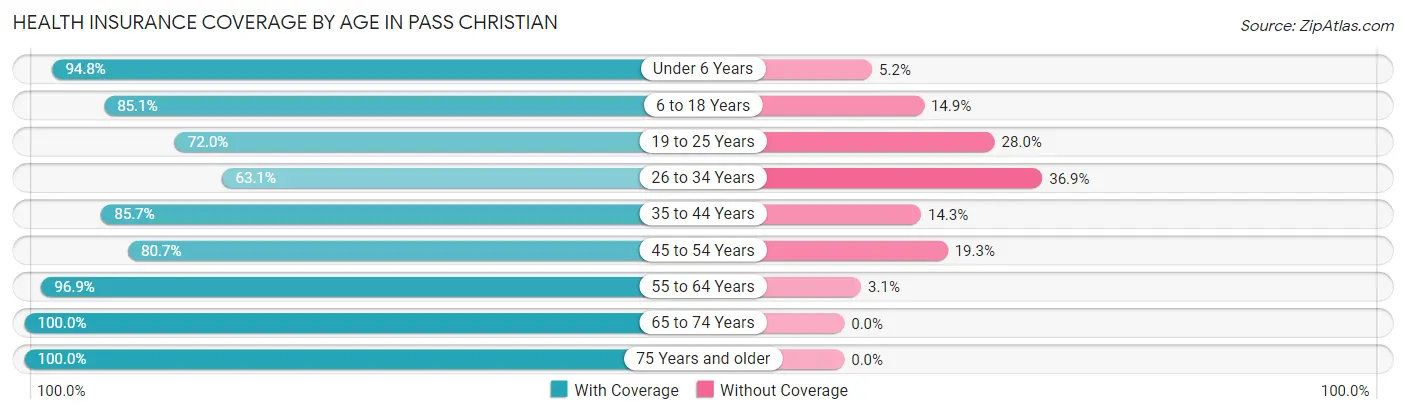
| Age Bracket | With Coverage | Without Coverage |
| Under 6 Years | 474 (94.8%) | 26 (5.2%) |
| 6 to 18 Years | 905 (85.1%) | 158 (14.9%) |
| 19 to 25 Years | 195 (72.0%) | 76 (28.0%) |
| 26 to 34 Years | 304 (63.1%) | 178 (36.9%) |
| 35 to 44 Years | 652 (85.7%) | 109 (14.3%) |
| 45 to 54 Years | 544 (80.7%) | 130 (19.3%) |
| 55 to 64 Years | 678 (96.9%) | 22 (3.1%) |
| 65 to 74 Years | 735 (100.0%) | 0 (0.0%) |
| 75 Years and older | 495 (100.0%) | 0 (0.0%) |
| Total | 4,982 (87.7%) | 699 (12.3%) |
Health Insurance Coverage by Citizenship Status in Pass Christian
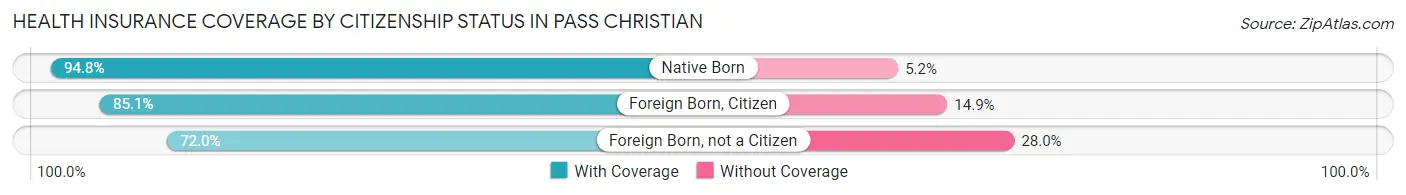
| Citizenship Status | With Coverage | Without Coverage |
| Native Born | 474 (94.8%) | 26 (5.2%) |
| Foreign Born, Citizen | 905 (85.1%) | 158 (14.9%) |
| Foreign Born, not a Citizen | 195 (72.0%) | 76 (28.0%) |
Health Insurance Coverage by Household Income in Pass Christian
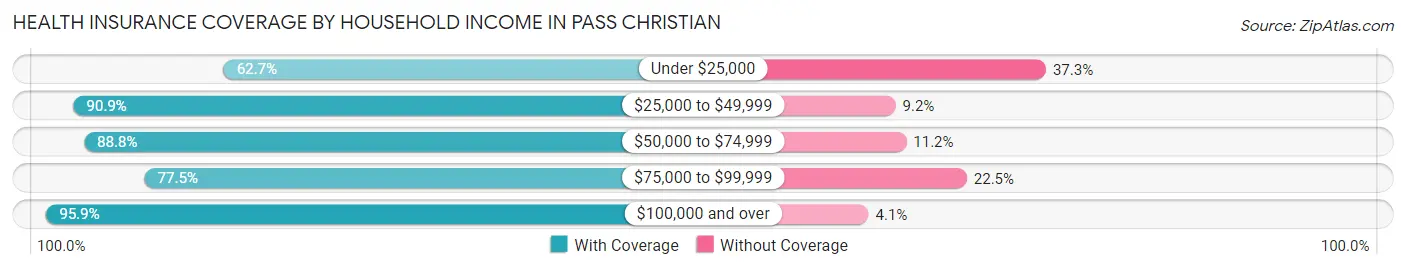
| Household Income | With Coverage | Without Coverage |
| Under $25,000 | 445 (62.7%) | 265 (37.3%) |
| $25,000 to $49,999 | 1,023 (90.8%) | 103 (9.1%) |
| $50,000 to $74,999 | 1,075 (88.8%) | 135 (11.2%) |
| $75,000 to $99,999 | 372 (77.5%) | 108 (22.5%) |
| $100,000 and over | 2,067 (95.9%) | 88 (4.1%) |
Public vs Private Health Insurance Coverage by Age in Pass Christian
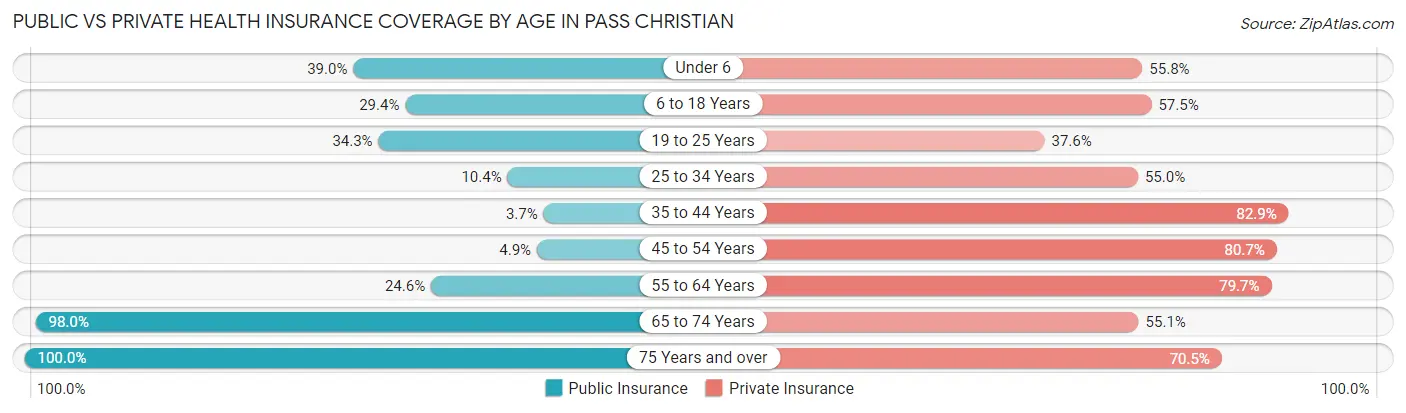
| Age Bracket | Public Insurance | Private Insurance |
| Under 6 | 195 (39.0%) | 279 (55.8%) |
| 6 to 18 Years | 312 (29.3%) | 611 (57.5%) |
| 19 to 25 Years | 93 (34.3%) | 102 (37.6%) |
| 25 to 34 Years | 50 (10.4%) | 265 (55.0%) |
| 35 to 44 Years | 28 (3.7%) | 631 (82.9%) |
| 45 to 54 Years | 33 (4.9%) | 544 (80.7%) |
| 55 to 64 Years | 172 (24.6%) | 558 (79.7%) |
| 65 to 74 Years | 720 (98.0%) | 405 (55.1%) |
| 75 Years and over | 495 (100.0%) | 349 (70.5%) |
| Total | 2,098 (36.9%) | 3,744 (65.9%) |
Disability Status by Sex by Age in Pass Christian
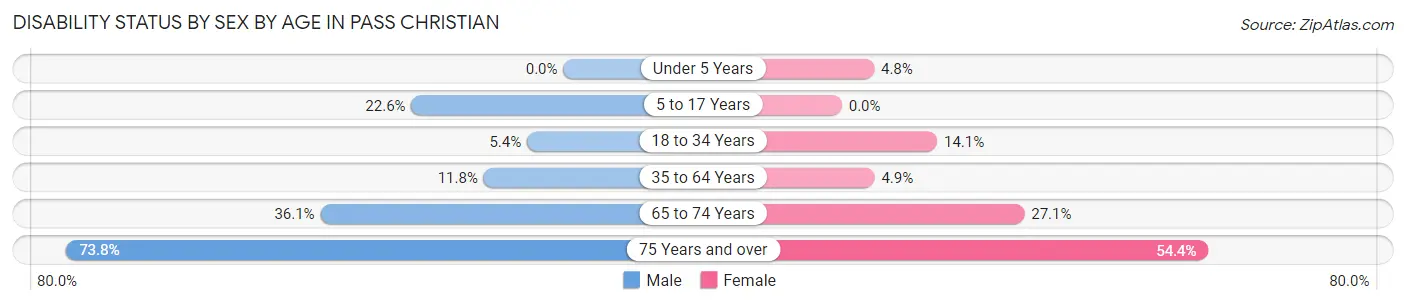
| Age Bracket | Male | Female |
| Under 5 Years | 0 (0.0%) | 7 (4.8%) |
| 5 to 17 Years | 141 (22.6%) | 0 (0.0%) |
| 18 to 34 Years | 22 (5.4%) | 56 (14.1%) |
| 35 to 64 Years | 111 (11.8%) | 58 (4.9%) |
| 65 to 74 Years | 132 (36.1%) | 100 (27.1%) |
| 75 Years and over | 124 (73.8%) | 178 (54.4%) |
Disability Class by Sex by Age in Pass Christian
Disability Class: Hearing Difficulty
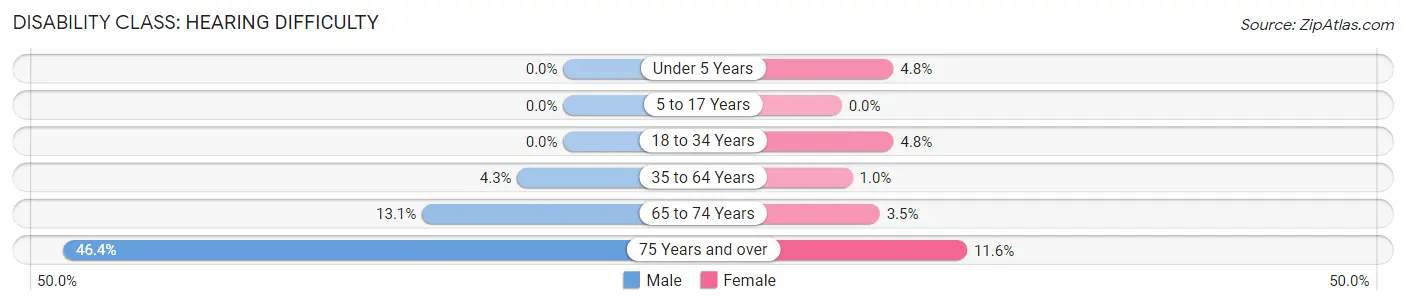
| Age Bracket | Male | Female |
| Under 5 Years | 0 (0.0%) | 7 (4.8%) |
| 5 to 17 Years | 0 (0.0%) | 0 (0.0%) |
| 18 to 34 Years | 0 (0.0%) | 19 (4.8%) |
| 35 to 64 Years | 40 (4.3%) | 12 (1.0%) |
| 65 to 74 Years | 48 (13.1%) | 13 (3.5%) |
| 75 Years and over | 78 (46.4%) | 38 (11.6%) |
Disability Class: Vision Difficulty
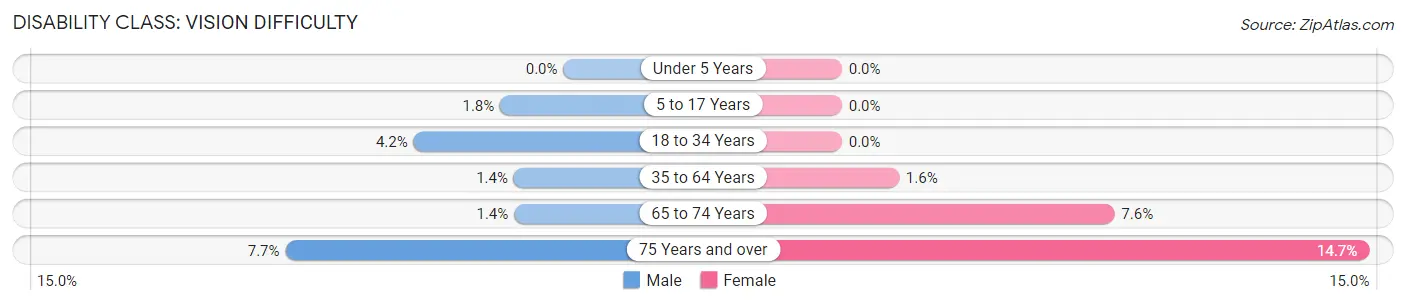
| Age Bracket | Male | Female |
| Under 5 Years | 0 (0.0%) | 0 (0.0%) |
| 5 to 17 Years | 11 (1.8%) | 0 (0.0%) |
| 18 to 34 Years | 17 (4.2%) | 0 (0.0%) |
| 35 to 64 Years | 13 (1.4%) | 19 (1.6%) |
| 65 to 74 Years | 5 (1.4%) | 28 (7.6%) |
| 75 Years and over | 13 (7.7%) | 48 (14.7%) |
Disability Class: Cognitive Difficulty
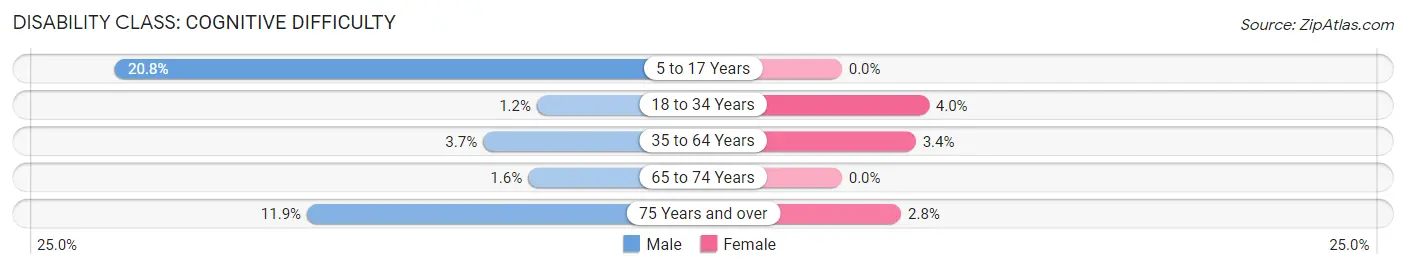
| Age Bracket | Male | Female |
| 5 to 17 Years | 130 (20.8%) | 0 (0.0%) |
| 18 to 34 Years | 5 (1.2%) | 16 (4.0%) |
| 35 to 64 Years | 35 (3.7%) | 41 (3.4%) |
| 65 to 74 Years | 6 (1.6%) | 0 (0.0%) |
| 75 Years and over | 20 (11.9%) | 9 (2.8%) |
Disability Class: Ambulatory Difficulty
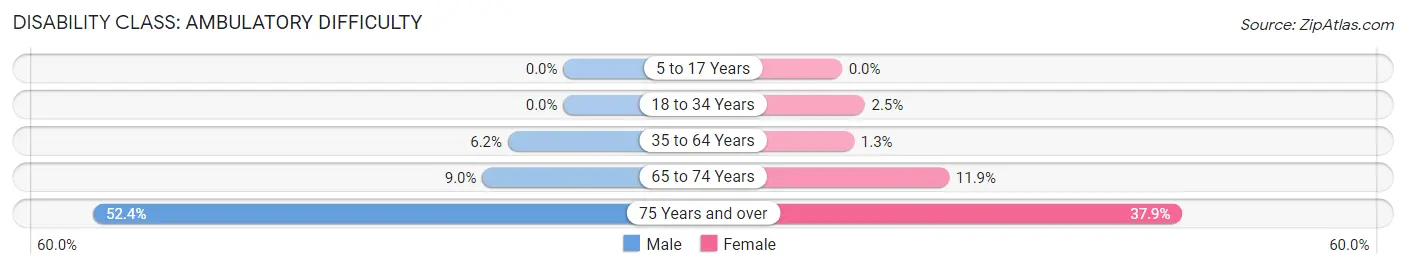
| Age Bracket | Male | Female |
| 5 to 17 Years | 0 (0.0%) | 0 (0.0%) |
| 18 to 34 Years | 0 (0.0%) | 10 (2.5%) |
| 35 to 64 Years | 58 (6.2%) | 16 (1.3%) |
| 65 to 74 Years | 33 (9.0%) | 44 (11.9%) |
| 75 Years and over | 88 (52.4%) | 124 (37.9%) |
Disability Class: Self-Care Difficulty
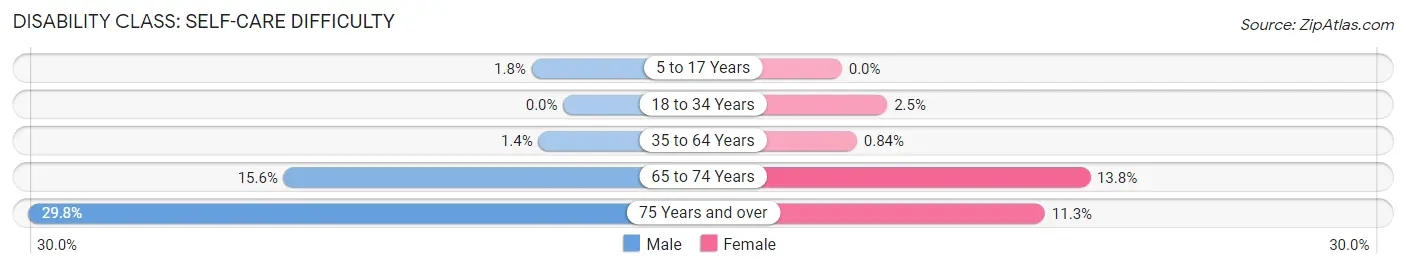
| Age Bracket | Male | Female |
| 5 to 17 Years | 11 (1.8%) | 0 (0.0%) |
| 18 to 34 Years | 0 (0.0%) | 10 (2.5%) |
| 35 to 64 Years | 13 (1.4%) | 10 (0.8%) |
| 65 to 74 Years | 57 (15.6%) | 51 (13.8%) |
| 75 Years and over | 50 (29.8%) | 37 (11.3%) |
Technology Access in Pass Christian
Computing Device Access in Pass Christian
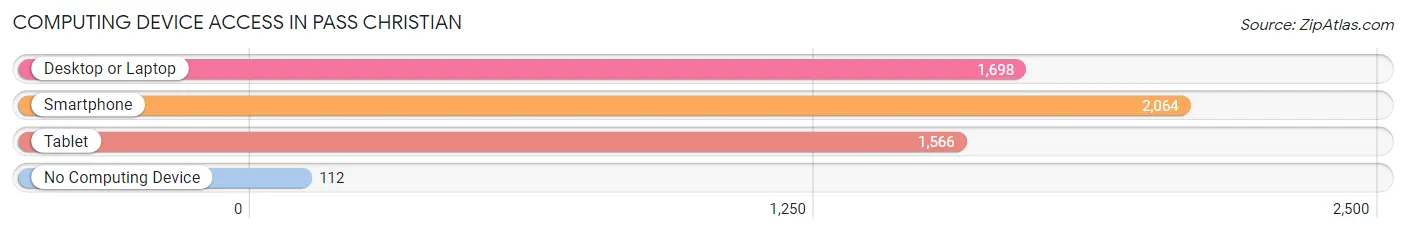
| Device Type | # Households | % Households |
| Desktop or Laptop | 1,698 | 74.3% |
| Smartphone | 2,064 | 90.4% |
| Tablet | 1,566 | 68.6% |
| No Computing Device | 112 | 4.9% |
| Total | 2,284 | 100.0% |
Internet Access in Pass Christian
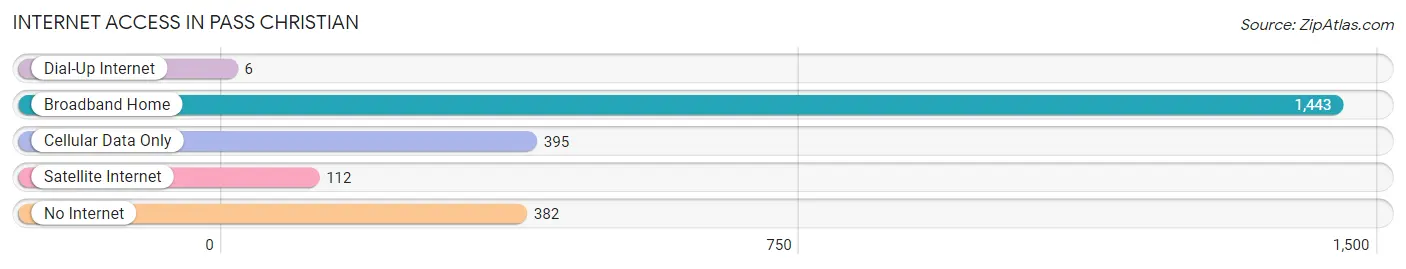
| Internet Type | # Households | % Households |
| Dial-Up Internet | 6 | 0.3% |
| Broadband Home | 1,443 | 63.2% |
| Cellular Data Only | 395 | 17.3% |
| Satellite Internet | 112 | 4.9% |
| No Internet | 382 | 16.7% |
| Total | 2,284 | 100.0% |
Pass Christian Summary
Introduction
Pass Christian is a city located in Harrison County, Mississippi, United States. It is situated along the Gulf of Mexico and is part of the Gulfport-Biloxi metropolitan area. The city is known for its historic homes, beaches, and seafood restaurants. The population of Pass Christian was 4,613 at the 2010 census.
History
Pass Christian was founded in 1699 by French settlers. The city was named after a nearby pass in the Mississippi Sound. The city was a major port during the 19th century and was home to many wealthy plantation owners. During the Civil War, the city was occupied by Union forces and was the site of several battles. After the war, the city experienced a period of economic decline.
In the late 19th century, the city began to experience a revival as a resort town. The city was a popular destination for wealthy tourists from the North. In the early 20th century, the city was a popular destination for Hollywood stars.
Geography
Pass Christian is located at 30°20'N 89°2'W (30.33, -89.03). The city is situated along the Gulf of Mexico and is part of the Gulfport-Biloxi metropolitan area. The city is bordered by the cities of Long Beach, Gulfport, and Bay St. Louis.
The city has a total area of 4.2 square miles, of which 4.1 square miles is land and 0.1 square miles is water. The city is located on a narrow strip of land between the Gulf of Mexico and Bay of St. Louis.
Economy
The economy of Pass Christian is largely based on tourism. The city is home to several resorts and hotels, as well as numerous restaurants and shops. The city is also home to several marinas and boat docks.
The city is also home to several manufacturing and industrial businesses. The city is home to a large shipbuilding and repair facility, as well as a large seafood processing plant.
Demographics
As of the 2010 census, there were 4,613 people, 1,945 households, and 1,220 families residing in the city. The population density was 1,118.3 people per square mile. The racial makeup of the city was 79.2% White, 17.3% African American, 0.4% Native American, 0.7% Asian, 0.1% Pacific Islander, 0.7% from other races, and 1.6% from two or more races. Hispanic or Latino of any race were 2.2% of the population.
The median income for a household in the city was $41,944, and the median income for a family was $50,938. Males had a median income of $37,917 versus $27,917 for females. The per capita income for the city was $21,945. About 11.2% of families and 14.2% of the population were below the poverty line, including 19.2% of those under age 18 and 8.2% of those age 65 or over.
Conclusion
Pass Christian is a city located in Harrison County, Mississippi, United States. It is situated along the Gulf of Mexico and is part of the Gulfport-Biloxi metropolitan area. The city is known for its historic homes, beaches, and seafood restaurants. The population of Pass Christian was 4,613 at the 2010 census. The economy of Pass Christian is largely based on tourism, with the city being home to several resorts and hotels, as well as numerous restaurants and shops. The city is also home to several manufacturing and industrial businesses. The racial makeup of the city was 79.2% White, 17.3% African American, 0.4% Native American, 0.7% Asian, 0.1% Pacific Islander, 0.7% from other races, and 1.6% from two or more races. The median income for a household in the city was $41,944, and the median income for a family was $50,938. Pass Christian is a unique city with a rich history and culture that continues to attract visitors from all over the world.
Common Questions
What is Per Capita Income in Pass Christian?
Per Capita income in Pass Christian is $36,815.
What is the Median Family Income in Pass Christian?
Median Family Income in Pass Christian is $74,816.
What is the Median Household income in Pass Christian?
Median Household Income in Pass Christian is $65,000.
What is Income or Wage Gap in Pass Christian?
Income or Wage Gap in Pass Christian is 37.6%.
Women in Pass Christian earn 62.4 cents for every dollar earned by a man.
What is Inequality or Gini Index in Pass Christian?
Inequality or Gini Index in Pass Christian is 0.47.
What is the Total Population of Pass Christian?
Total Population of Pass Christian is 5,802.
What is the Total Male Population of Pass Christian?
Total Male Population of Pass Christian is 2,764.
What is the Total Female Population of Pass Christian?
Total Female Population of Pass Christian is 3,038.
What is the Ratio of Males per 100 Females in Pass Christian?
There are 90.98 Males per 100 Females in Pass Christian.
What is the Ratio of Females per 100 Males in Pass Christian?
There are 109.91 Females per 100 Males in Pass Christian.
What is the Median Population Age in Pass Christian?
Median Population Age in Pass Christian is 41.1 Years.
What is the Average Family Size in Pass Christian
Average Family Size in Pass Christian is 3.0 People.
What is the Average Household Size in Pass Christian
Average Household Size in Pass Christian is 2.5 People.
How Large is the Labor Force in Pass Christian?
There are 2,658 People in the Labor Forcein in Pass Christian.
What is the Percentage of People in the Labor Force in Pass Christian?
59.2% of People are in the Labor Force in Pass Christian.
What is the Unemployment Rate in Pass Christian?
Unemployment Rate in Pass Christian is 8.4%.