Booneville, MS Map & Demographics
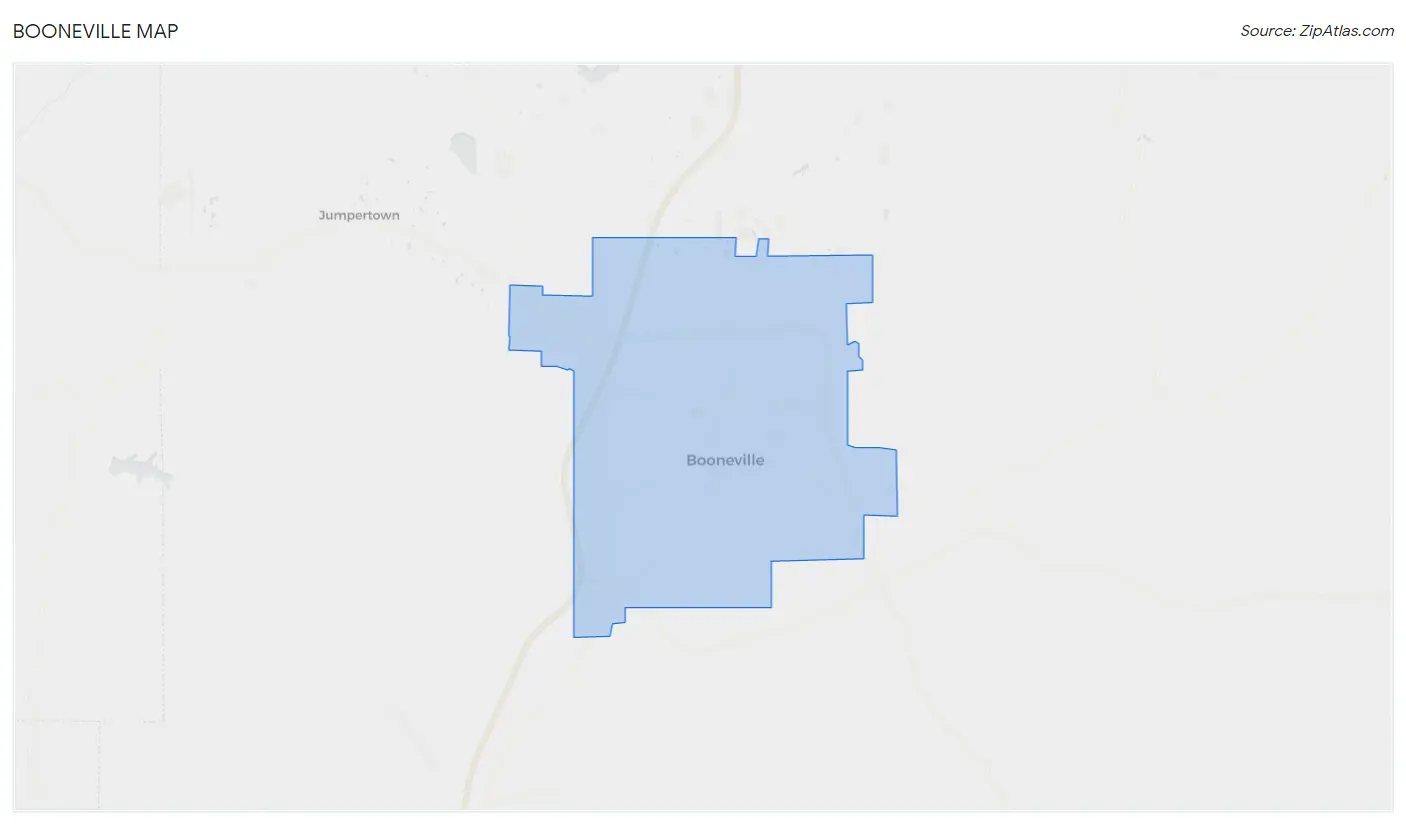
Booneville Map
Booneville Overview
$29,407
PER CAPITA INCOME
$70,260
AVG FAMILY INCOME
$48,655
AVG HOUSEHOLD INCOME
1.5%
WAGE / INCOME GAP [ % ]
98.5¢/ $1
WAGE / INCOME GAP [ $ ]
0.51
INEQUALITY / GINI INDEX
9,027
TOTAL POPULATION
4,352
MALE POPULATION
4,675
FEMALE POPULATION
93.09
MALES / 100 FEMALES
107.42
FEMALES / 100 MALES
34.5
MEDIAN AGE
3.1
AVG FAMILY SIZE
2.4
AVG HOUSEHOLD SIZE
3,621
LABOR FORCE [ PEOPLE ]
49.8%
PERCENT IN LABOR FORCE
4.6%
UNEMPLOYMENT RATE
Booneville Zip Codes
Booneville Area Codes
Income in Booneville
Income Overview in Booneville
Per Capita Income in Booneville is $29,407, while median incomes of families and households are $70,260 and $48,655 respectively.
| Characteristic | Number | Measure |
| Per Capita Income | 9,027 | $29,407 |
| Median Family Income | 1,974 | $70,260 |
| Mean Family Income | 1,974 | $99,320 |
| Median Household Income | 3,231 | $48,655 |
| Mean Household Income | 3,231 | $76,451 |
| Income Deficit | 1,974 | $0 |
| Wage / Income Gap (%) | 9,027 | 1.49% |
| Wage / Income Gap ($) | 9,027 | 98.51¢ per $1 |
| Gini / Inequality Index | 9,027 | 0.51 |
Earnings by Sex in Booneville
Average Earnings in Booneville are $38,901, $39,213 for men and $38,629 for women, a difference of 1.5%.
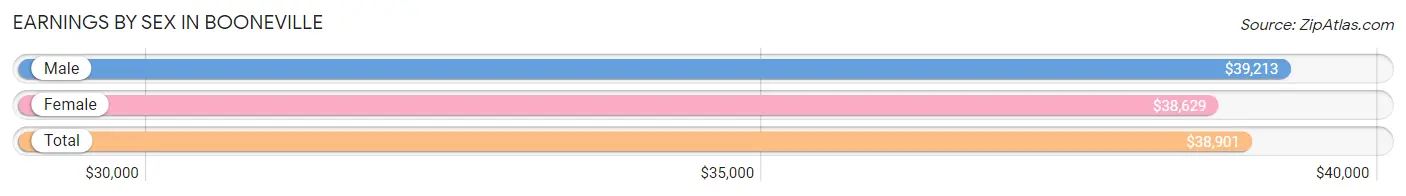
| Sex | Number | Average Earnings |
| Male | 1,994 (51.7%) | $39,213 |
| Female | 1,864 (48.3%) | $38,629 |
| Total | 3,858 (100.0%) | $38,901 |
Earnings by Sex by Income Bracket in Booneville
The most common earnings brackets in Booneville are $75,000 to $99,999 for men (397 | 19.9%) and $30,000 to $34,999 for women (242 | 13.0%).
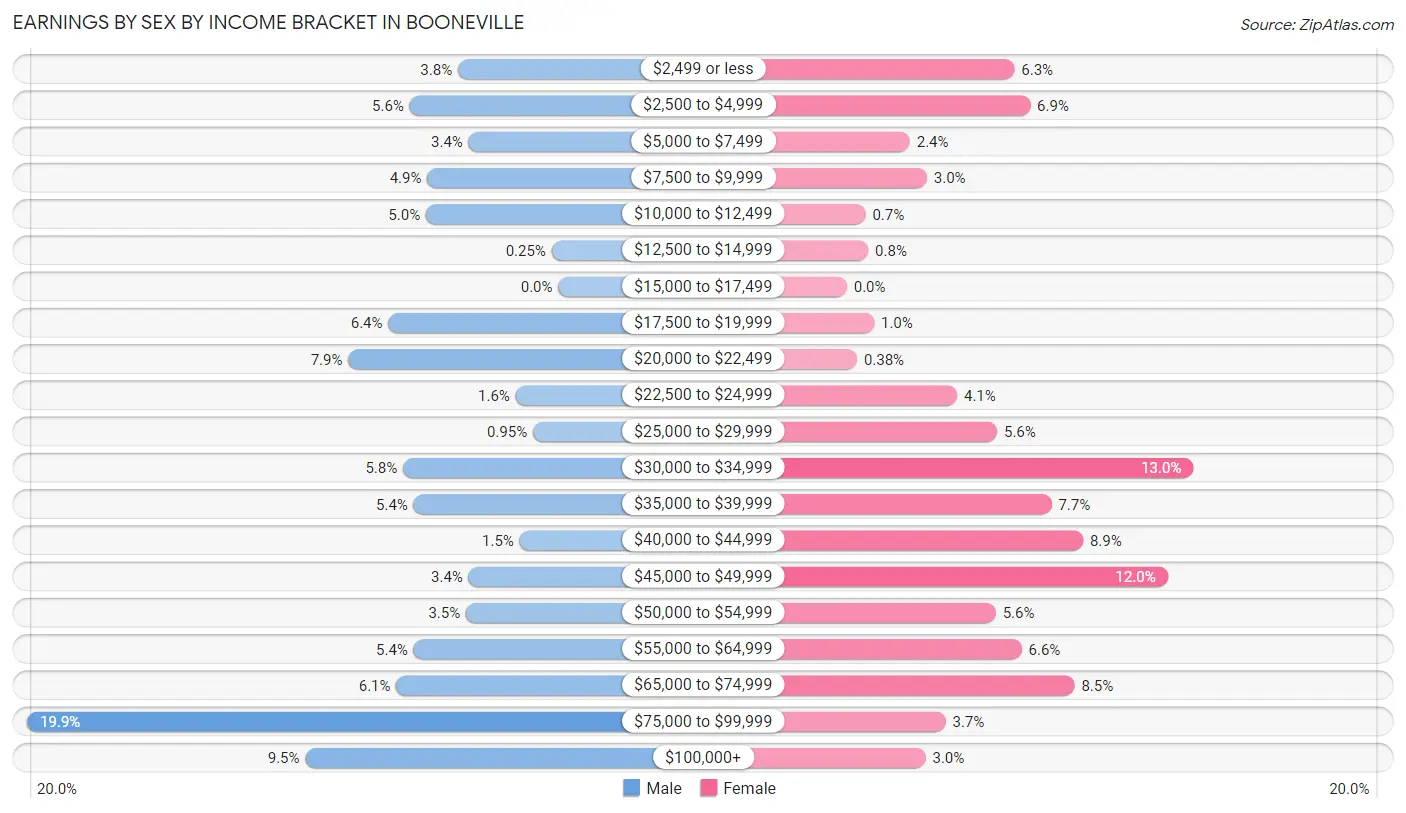
| Income | Male | Female |
| $2,499 or less | 75 (3.8%) | 117 (6.3%) |
| $2,500 to $4,999 | 111 (5.6%) | 128 (6.9%) |
| $5,000 to $7,499 | 67 (3.4%) | 44 (2.4%) |
| $7,500 to $9,999 | 98 (4.9%) | 56 (3.0%) |
| $10,000 to $12,499 | 99 (5.0%) | 13 (0.7%) |
| $12,500 to $14,999 | 5 (0.3%) | 15 (0.8%) |
| $15,000 to $17,499 | 0 (0.0%) | 0 (0.0%) |
| $17,500 to $19,999 | 127 (6.4%) | 19 (1.0%) |
| $20,000 to $22,499 | 157 (7.9%) | 7 (0.4%) |
| $22,500 to $24,999 | 32 (1.6%) | 77 (4.1%) |
| $25,000 to $29,999 | 19 (0.9%) | 105 (5.6%) |
| $30,000 to $34,999 | 116 (5.8%) | 242 (13.0%) |
| $35,000 to $39,999 | 108 (5.4%) | 143 (7.7%) |
| $40,000 to $44,999 | 29 (1.5%) | 165 (8.8%) |
| $45,000 to $49,999 | 67 (3.4%) | 224 (12.0%) |
| $50,000 to $54,999 | 69 (3.5%) | 104 (5.6%) |
| $55,000 to $64,999 | 108 (5.4%) | 122 (6.6%) |
| $65,000 to $74,999 | 121 (6.1%) | 159 (8.5%) |
| $75,000 to $99,999 | 397 (19.9%) | 69 (3.7%) |
| $100,000+ | 189 (9.5%) | 55 (2.9%) |
| Total | 1,994 (100.0%) | 1,864 (100.0%) |
Earnings by Sex by Educational Attainment in Booneville
Average earnings in Booneville are $54,688 for men and $41,913 for women, a difference of 23.4%. Men with an educational attainment of bachelor's degree enjoy the highest average annual earnings of $68,862, while those with less than high school education earn the least with $32,604. Women with an educational attainment of less than high school earn the most with the average annual earnings of $56,675, while those with bachelor's degree education have the smallest earnings of $32,888.
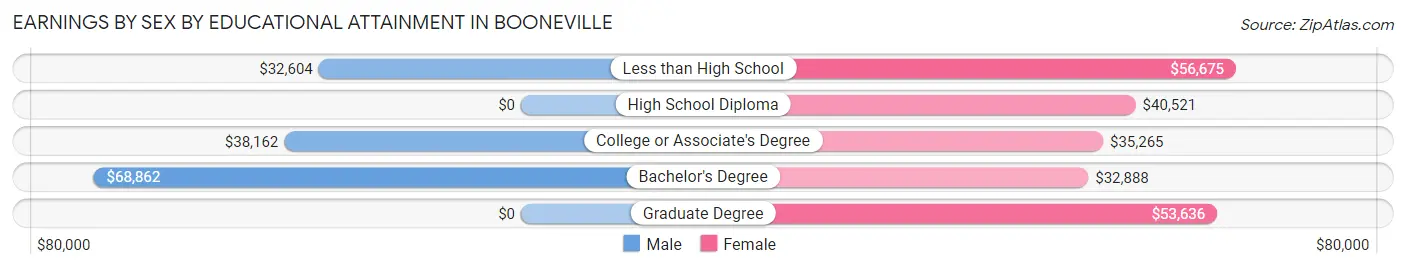
| Educational Attainment | Male Income | Female Income |
| Less than High School | $32,604 | $56,675 |
| High School Diploma | - | - |
| College or Associate's Degree | $38,162 | $35,265 |
| Bachelor's Degree | $68,862 | $32,888 |
| Graduate Degree | - | - |
| Total | $54,688 | $41,913 |
Family Income in Booneville
Family Income Brackets in Booneville
According to the Booneville family income data, there are 387 families falling into the $100,000 to $149,999 income range, which is the most common income bracket and makes up 19.6% of all families. Conversely, the less than $10,000 income bracket is the least frequent group with only 34 families (1.7%) belonging to this category.
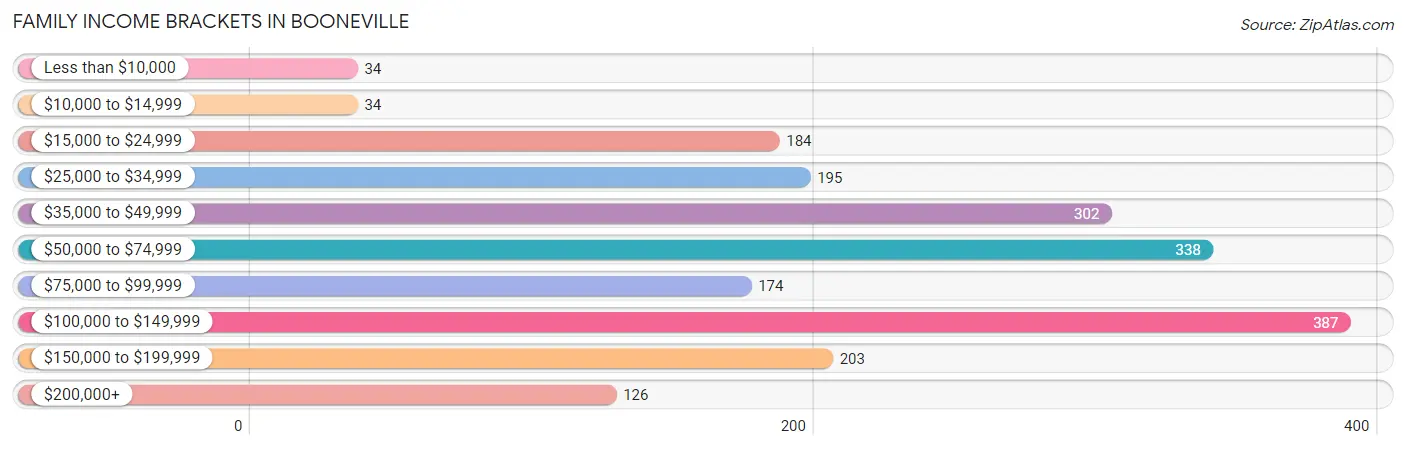
| Income Bracket | # Families | % Families |
| Less than $10,000 | 34 | 1.7% |
| $10,000 to $14,999 | 34 | 1.7% |
| $15,000 to $24,999 | 184 | 9.3% |
| $25,000 to $34,999 | 195 | 9.9% |
| $35,000 to $49,999 | 302 | 15.3% |
| $50,000 to $74,999 | 338 | 17.1% |
| $75,000 to $99,999 | 174 | 8.8% |
| $100,000 to $149,999 | 387 | 19.6% |
| $150,000 to $199,999 | 203 | 10.3% |
| $200,000+ | 126 | 6.4% |
Family Income by Famaliy Size in Booneville
5-person families (177 | 9.0%) account for the highest median family income in Booneville with $110,684 per family, while 2-person families (966 | 48.9%) have the highest median income of $25,384 per family member.
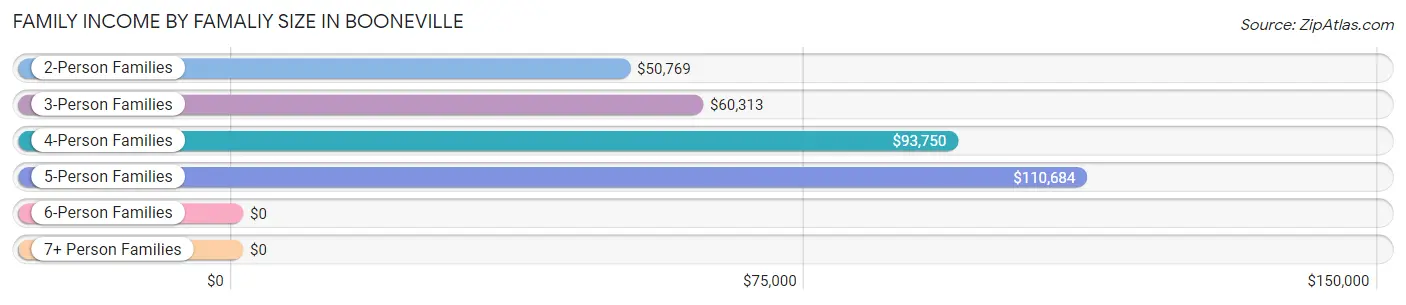
| Income Bracket | # Families | Median Income |
| 2-Person Families | 966 (48.9%) | $50,769 |
| 3-Person Families | 406 (20.6%) | $60,313 |
| 4-Person Families | 376 (19.1%) | $93,750 |
| 5-Person Families | 177 (9.0%) | $110,684 |
| 6-Person Families | 37 (1.9%) | $0 |
| 7+ Person Families | 12 (0.6%) | $0 |
| Total | 1,974 (100.0%) | $70,260 |
Family Income by Number of Earners in Booneville
The median family income in Booneville is $70,260, with families comprising 2 earners (850) having the highest median family income of $108,219, while families with no earners (333) have the lowest median family income of $26,761, accounting for 43.1% and 16.9% of families, respectively.
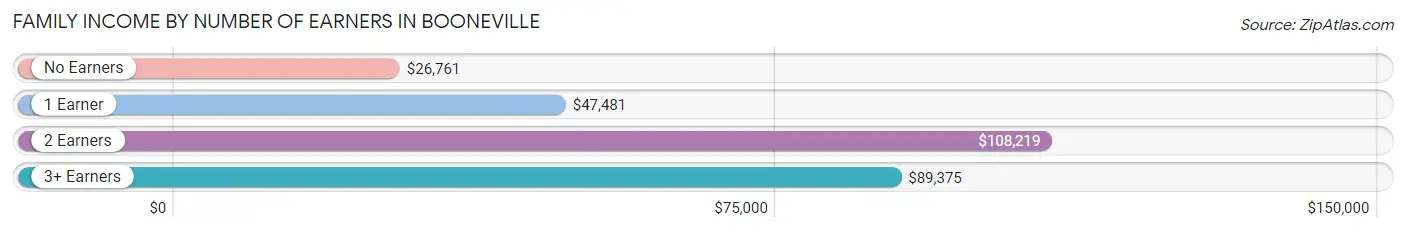
| Number of Earners | # Families | Median Income |
| No Earners | 333 (16.9%) | $26,761 |
| 1 Earner | 719 (36.4%) | $47,481 |
| 2 Earners | 850 (43.1%) | $108,219 |
| 3+ Earners | 72 (3.6%) | $89,375 |
| Total | 1,974 (100.0%) | $70,260 |
Household Income in Booneville
Household Income Brackets in Booneville
With 582 households falling in the category, the $35,000 to $49,999 income range is the most frequent in Booneville, accounting for 18.0% of all households. In contrast, only 126 households (3.9%) fall into the $200,000+ income bracket, making it the least populous group.
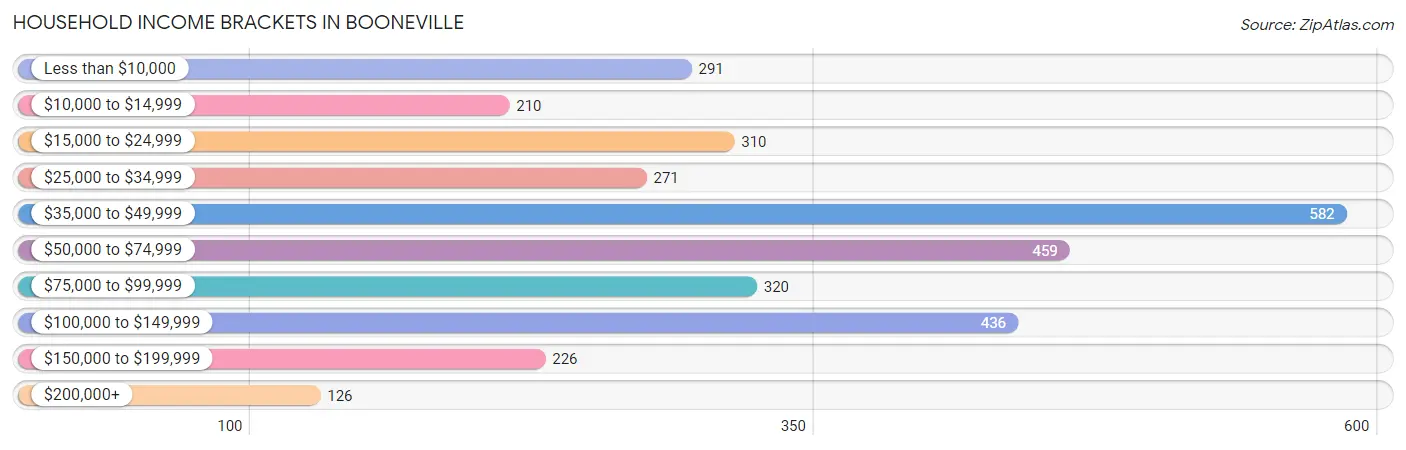
| Income Bracket | # Households | % Households |
| Less than $10,000 | 291 | 9.0% |
| $10,000 to $14,999 | 210 | 6.5% |
| $15,000 to $24,999 | 310 | 9.6% |
| $25,000 to $34,999 | 271 | 8.4% |
| $35,000 to $49,999 | 582 | 18.0% |
| $50,000 to $74,999 | 459 | 14.2% |
| $75,000 to $99,999 | 320 | 9.9% |
| $100,000 to $149,999 | 436 | 13.5% |
| $150,000 to $199,999 | 226 | 7.0% |
| $200,000+ | 126 | 3.9% |
Household Income by Householder Age in Booneville
The median household income in Booneville is $48,655, with the highest median household income of $70,250 found in the 45 to 64 years age bracket for the primary householder. A total of 923 households (28.6%) fall into this category. Meanwhile, the 15 to 24 years age bracket for the primary householder has the lowest median household income of $0, with 123 households (3.8%) in this group.
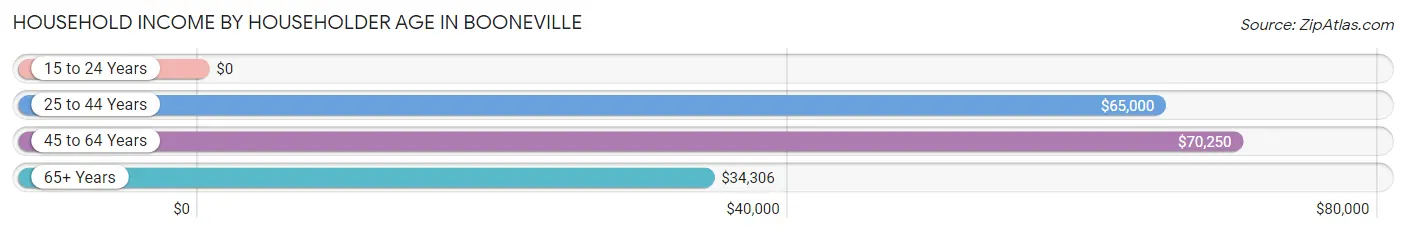
| Income Bracket | # Households | Median Income |
| 15 to 24 Years | 123 (3.8%) | $0 |
| 25 to 44 Years | 1,070 (33.1%) | $65,000 |
| 45 to 64 Years | 923 (28.6%) | $70,250 |
| 65+ Years | 1,115 (34.5%) | $34,306 |
| Total | 3,231 (100.0%) | $48,655 |
Poverty in Booneville
Income Below Poverty by Sex and Age in Booneville
With 14.0% poverty level for males and 24.7% for females among the residents of Booneville, 5 year old males and 18 to 24 year old females are the most vulnerable to poverty, with 64 males (51.6%) and 177 females (58.8%) in their respective age groups living below the poverty level.
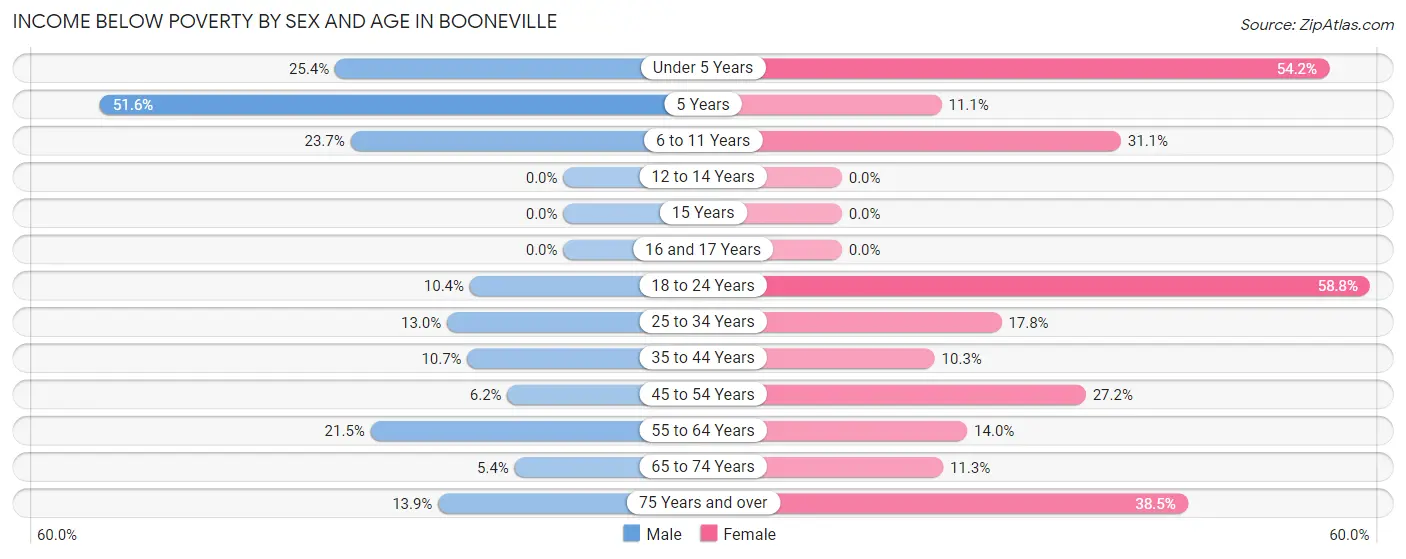
| Age Bracket | Male | Female |
| Under 5 Years | 76 (25.4%) | 160 (54.2%) |
| 5 Years | 64 (51.6%) | 1 (11.1%) |
| 6 to 11 Years | 64 (23.7%) | 115 (31.1%) |
| 12 to 14 Years | 0 (0.0%) | 0 (0.0%) |
| 15 Years | 0 (0.0%) | 0 (0.0%) |
| 16 and 17 Years | 0 (0.0%) | 0 (0.0%) |
| 18 to 24 Years | 28 (10.4%) | 177 (58.8%) |
| 25 to 34 Years | 58 (13.0%) | 104 (17.8%) |
| 35 to 44 Years | 75 (10.7%) | 48 (10.3%) |
| 45 to 54 Years | 16 (6.2%) | 116 (27.2%) |
| 55 to 64 Years | 91 (21.5%) | 67 (14.0%) |
| 65 to 74 Years | 16 (5.4%) | 62 (11.3%) |
| 75 Years and over | 29 (13.9%) | 164 (38.5%) |
| Total | 517 (14.0%) | 1,014 (24.7%) |
Income Above Poverty by Sex and Age in Booneville
According to the poverty statistics in Booneville, males aged 12 to 14 years and females aged 12 to 14 years are the age groups that are most secure financially, with 100.0% of males and 100.0% of females in these age groups living above the poverty line.
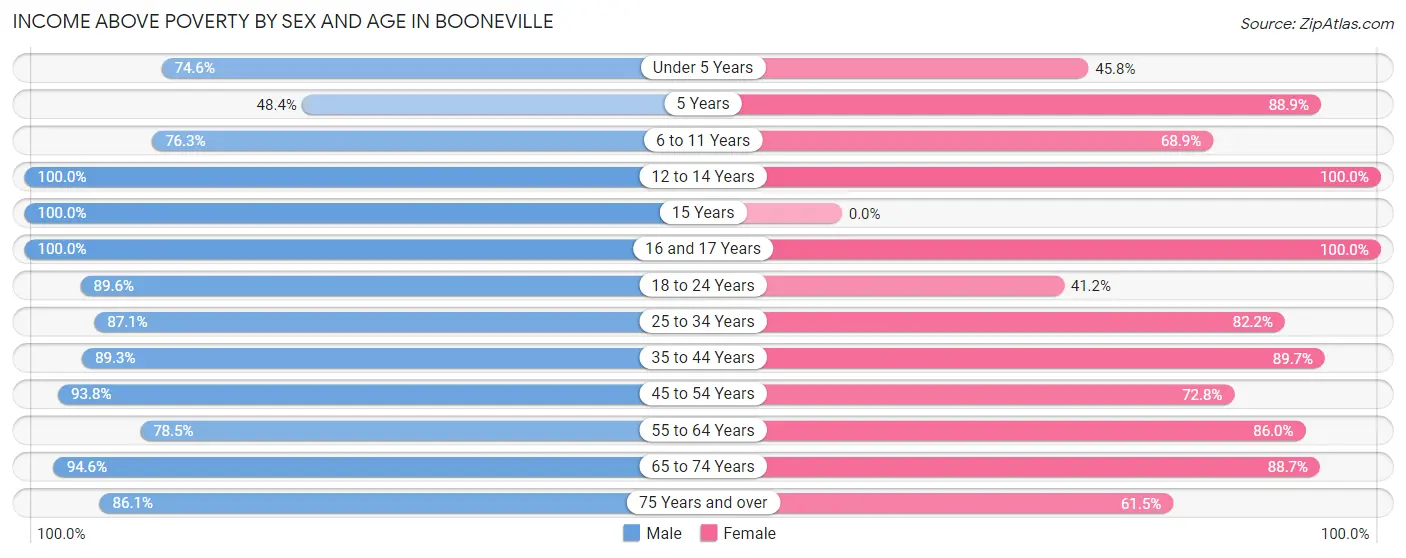
| Age Bracket | Male | Female |
| Under 5 Years | 223 (74.6%) | 135 (45.8%) |
| 5 Years | 60 (48.4%) | 8 (88.9%) |
| 6 to 11 Years | 206 (76.3%) | 255 (68.9%) |
| 12 to 14 Years | 176 (100.0%) | 86 (100.0%) |
| 15 Years | 113 (100.0%) | 0 (0.0%) |
| 16 and 17 Years | 112 (100.0%) | 110 (100.0%) |
| 18 to 24 Years | 241 (89.6%) | 124 (41.2%) |
| 25 to 34 Years | 390 (87.1%) | 481 (82.2%) |
| 35 to 44 Years | 627 (89.3%) | 416 (89.7%) |
| 45 to 54 Years | 241 (93.8%) | 311 (72.8%) |
| 55 to 64 Years | 333 (78.5%) | 413 (86.0%) |
| 65 to 74 Years | 279 (94.6%) | 488 (88.7%) |
| 75 Years and over | 179 (86.1%) | 262 (61.5%) |
| Total | 3,180 (86.0%) | 3,089 (75.3%) |
Income Below Poverty Among Married-Couple Families in Booneville
The poverty statistics for married-couple families in Booneville show that 5.2% or 70 of the total 1,350 families live below the poverty line. Families with no children have the highest poverty rate of 6.8%, comprising of 47 families. On the other hand, families with 3 or 4 children have the lowest poverty rate of 0.0%, which includes 0 families.
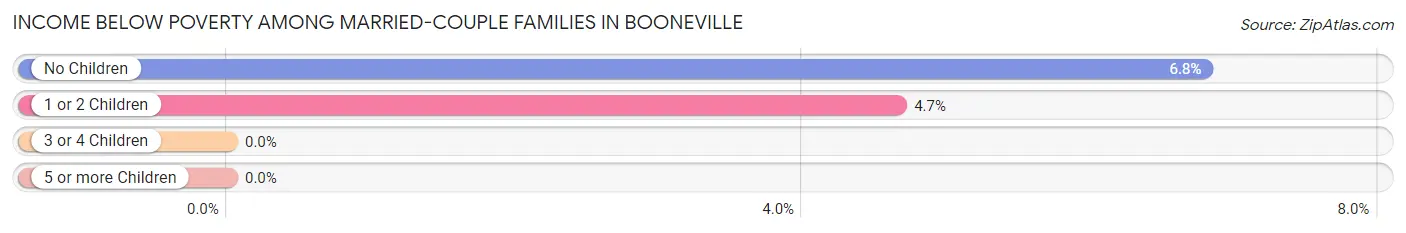
| Children | Above Poverty | Below Poverty |
| No Children | 645 (93.2%) | 47 (6.8%) |
| 1 or 2 Children | 471 (95.3%) | 23 (4.7%) |
| 3 or 4 Children | 152 (100.0%) | 0 (0.0%) |
| 5 or more Children | 12 (100.0%) | 0 (0.0%) |
| Total | 1,280 (94.8%) | 70 (5.2%) |
Income Below Poverty Among Single-Parent Households in Booneville
According to the poverty data in Booneville, 18.1% or 32 single-father households and 23.9% or 107 single-mother households are living below the poverty line. Among single-father households, those with 5 or more children have the highest poverty rate, with 32 households (100.0%) experiencing poverty. Likewise, among single-mother households, those with 3 or 4 children have the highest poverty rate, with 33 households (41.8%) falling below the poverty line.
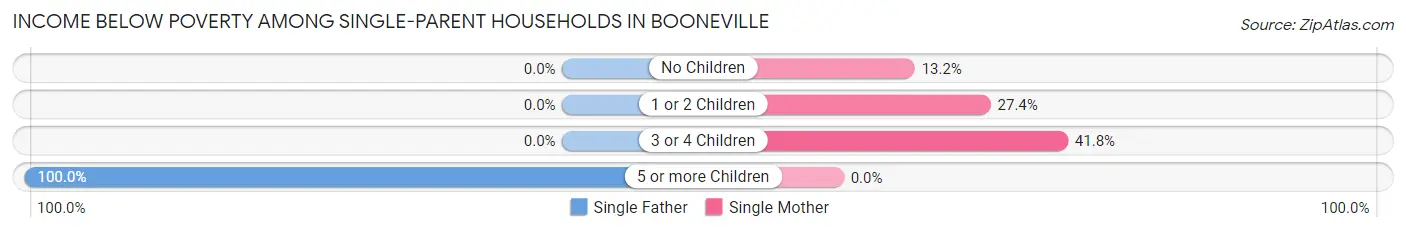
| Children | Single Father | Single Mother |
| No Children | 0 (0.0%) | 25 (13.2%) |
| 1 or 2 Children | 0 (0.0%) | 49 (27.4%) |
| 3 or 4 Children | 0 (0.0%) | 33 (41.8%) |
| 5 or more Children | 32 (100.0%) | 0 (0.0%) |
| Total | 32 (18.1%) | 107 (23.9%) |
Income Below Poverty Among Married-Couple vs Single-Parent Households in Booneville
The poverty data for Booneville shows that 70 of the married-couple family households (5.2%) and 139 of the single-parent households (22.3%) are living below the poverty level. Within the married-couple family households, those with no children have the highest poverty rate, with 47 households (6.8%) falling below the poverty line. Among the single-parent households, those with 5 or more children have the highest poverty rate, with 32 household (100.0%) living below poverty.
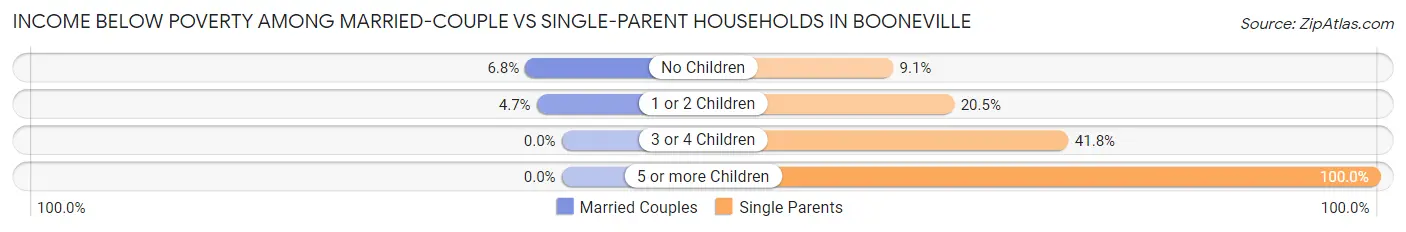
| Children | Married-Couple Families | Single-Parent Households |
| No Children | 47 (6.8%) | 25 (9.1%) |
| 1 or 2 Children | 23 (4.7%) | 49 (20.5%) |
| 3 or 4 Children | 0 (0.0%) | 33 (41.8%) |
| 5 or more Children | 0 (0.0%) | 32 (100.0%) |
| Total | 70 (5.2%) | 139 (22.3%) |
Race in Booneville
The most populous races in Booneville are White / Caucasian (6,932 | 76.8%), Black / African American (1,526 | 16.9%), and Two or more Races (474 | 5.2%).
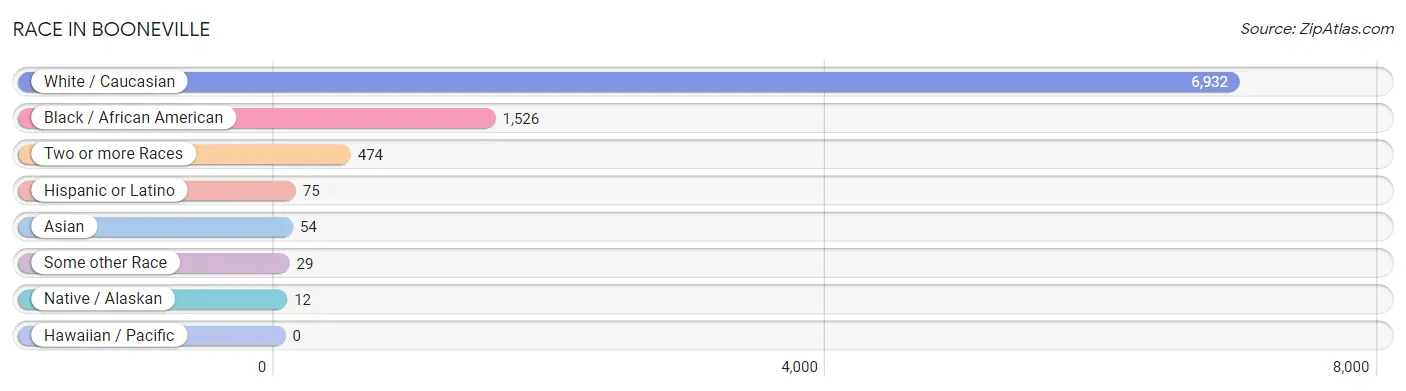
| Race | # Population | % Population |
| Asian | 54 | 0.6% |
| Black / African American | 1,526 | 16.9% |
| Hawaiian / Pacific | 0 | 0.0% |
| Hispanic or Latino | 75 | 0.8% |
| Native / Alaskan | 12 | 0.1% |
| White / Caucasian | 6,932 | 76.8% |
| Two or more Races | 474 | 5.2% |
| Some other Race | 29 | 0.3% |
| Total | 9,027 | 100.0% |
Ancestry in Booneville
The most populous ancestries reported in Booneville are American (1,231 | 13.6%), Irish (903 | 10.0%), English (876 | 9.7%), European (340 | 3.8%), and Scottish (303 | 3.4%), together accounting for 40.5% of all Booneville residents.
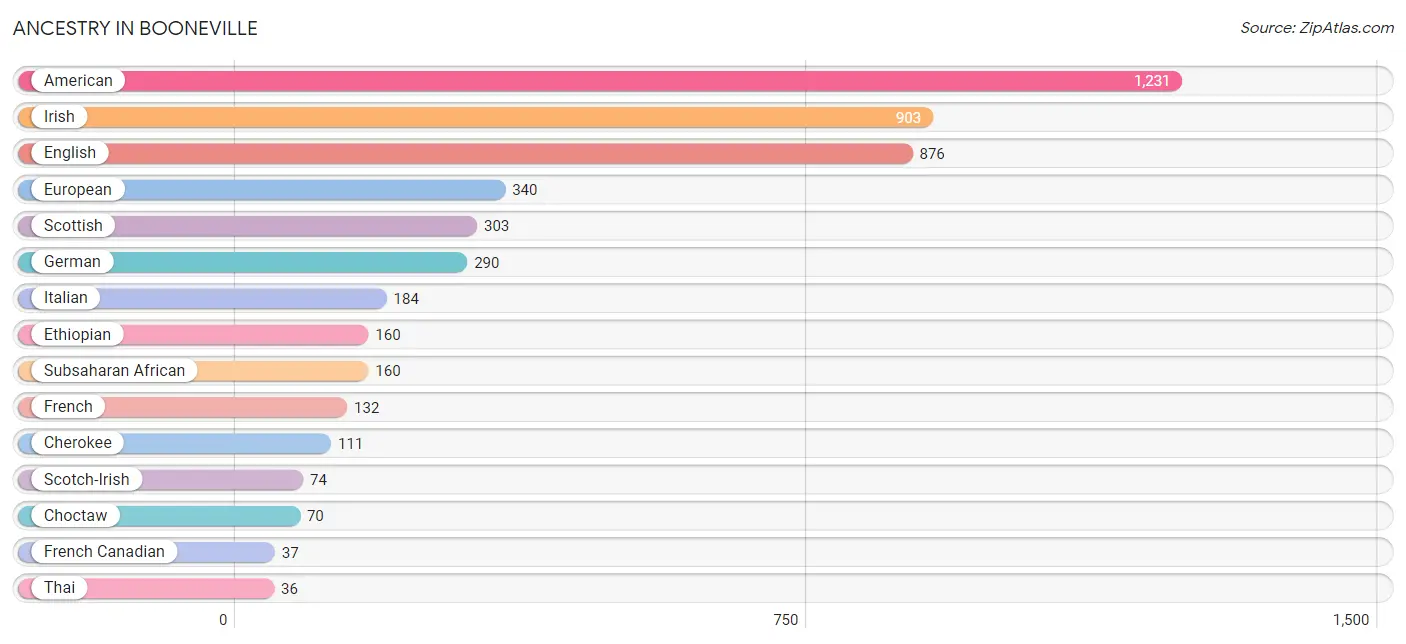
| Ancestry | # Population | % Population |
| American | 1,231 | 13.6% |
| Arab | 13 | 0.1% |
| British | 19 | 0.2% |
| Burmese | 7 | 0.1% |
| Cajun | 16 | 0.2% |
| Central American | 15 | 0.2% |
| Cherokee | 111 | 1.2% |
| Choctaw | 70 | 0.8% |
| English | 876 | 9.7% |
| Ethiopian | 160 | 1.8% |
| European | 340 | 3.8% |
| French | 132 | 1.5% |
| French Canadian | 37 | 0.4% |
| German | 290 | 3.2% |
| Irish | 903 | 10.0% |
| Italian | 184 | 2.0% |
| Korean | 24 | 0.3% |
| Lebanese | 13 | 0.1% |
| Mexican | 33 | 0.4% |
| Nicaraguan | 7 | 0.1% |
| Russian | 10 | 0.1% |
| Salvadoran | 8 | 0.1% |
| Scotch-Irish | 74 | 0.8% |
| Scottish | 303 | 3.4% |
| Seminole | 32 | 0.4% |
| Spaniard | 22 | 0.2% |
| Spanish | 5 | 0.1% |
| Subsaharan African | 160 | 1.8% |
| Thai | 36 | 0.4% |
| Welsh | 18 | 0.2% | View All 30 Rows |
Immigrants in Booneville
The most numerous immigrant groups reported in Booneville came from Asia (34 | 0.4%), India (23 | 0.3%), South Central Asia (23 | 0.3%), Central America (16 | 0.2%), and Latin America (16 | 0.2%), together accounting for 1.2% of all Booneville residents.
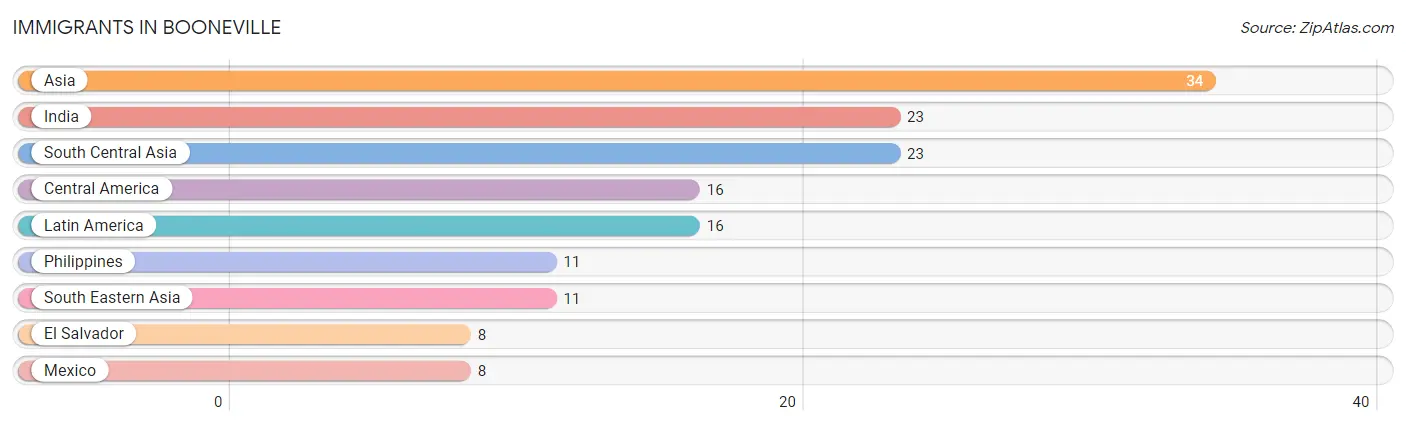
| Immigration Origin | # Population | % Population |
| Asia | 34 | 0.4% |
| Central America | 16 | 0.2% |
| El Salvador | 8 | 0.1% |
| India | 23 | 0.3% |
| Latin America | 16 | 0.2% |
| Mexico | 8 | 0.1% |
| Philippines | 11 | 0.1% |
| South Central Asia | 23 | 0.3% |
| South Eastern Asia | 11 | 0.1% | View All 9 Rows |
Sex and Age in Booneville
Sex and Age in Booneville
The most populous age groups in Booneville are 15 to 19 Years (537 | 12.3%) for men and 70 to 74 Years (443 | 9.5%) for women.
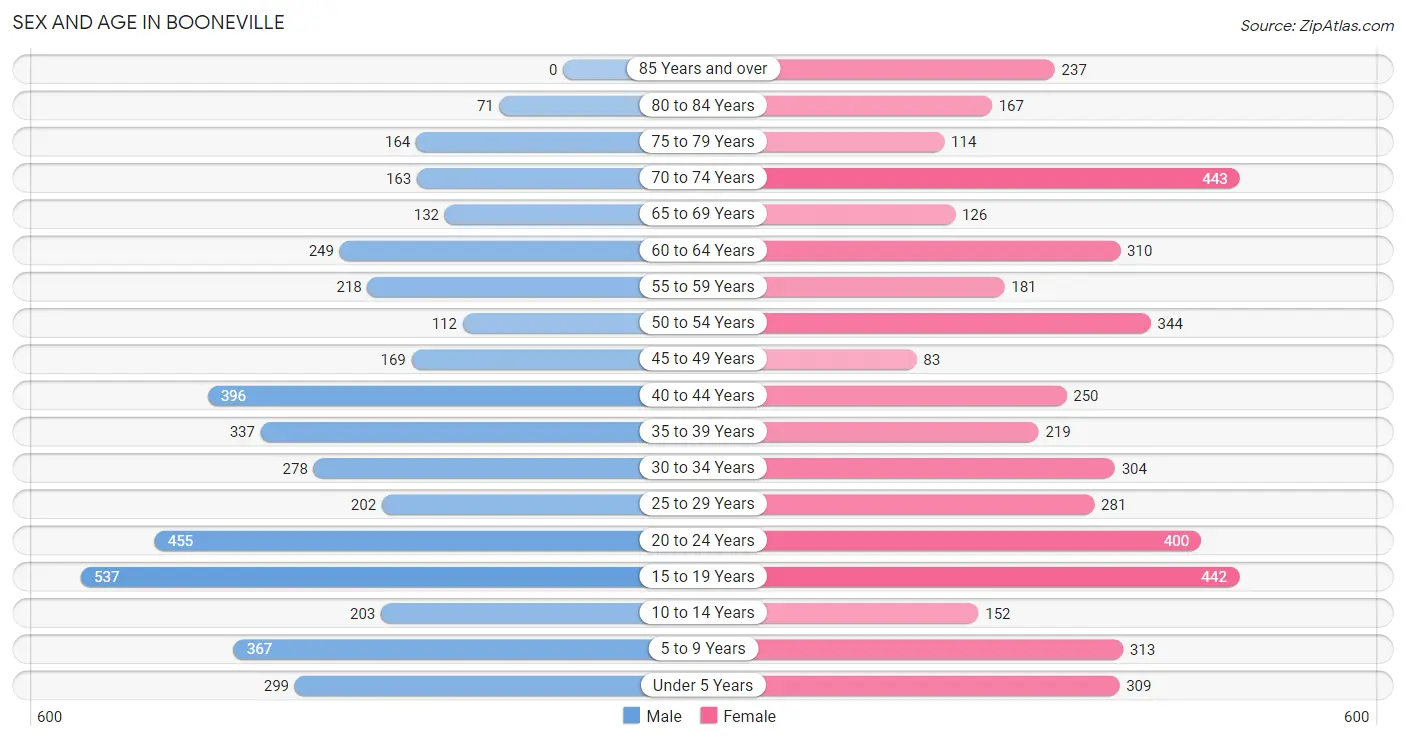
| Age Bracket | Male | Female |
| Under 5 Years | 299 (6.9%) | 309 (6.6%) |
| 5 to 9 Years | 367 (8.4%) | 313 (6.7%) |
| 10 to 14 Years | 203 (4.7%) | 152 (3.3%) |
| 15 to 19 Years | 537 (12.3%) | 442 (9.5%) |
| 20 to 24 Years | 455 (10.4%) | 400 (8.6%) |
| 25 to 29 Years | 202 (4.6%) | 281 (6.0%) |
| 30 to 34 Years | 278 (6.4%) | 304 (6.5%) |
| 35 to 39 Years | 337 (7.7%) | 219 (4.7%) |
| 40 to 44 Years | 396 (9.1%) | 250 (5.3%) |
| 45 to 49 Years | 169 (3.9%) | 83 (1.8%) |
| 50 to 54 Years | 112 (2.6%) | 344 (7.4%) |
| 55 to 59 Years | 218 (5.0%) | 181 (3.9%) |
| 60 to 64 Years | 249 (5.7%) | 310 (6.6%) |
| 65 to 69 Years | 132 (3.0%) | 126 (2.7%) |
| 70 to 74 Years | 163 (3.7%) | 443 (9.5%) |
| 75 to 79 Years | 164 (3.8%) | 114 (2.4%) |
| 80 to 84 Years | 71 (1.6%) | 167 (3.6%) |
| 85 Years and over | 0 (0.0%) | 237 (5.1%) |
| Total | 4,352 (100.0%) | 4,675 (100.0%) |
Families and Households in Booneville
Median Family Size in Booneville
The median family size in Booneville is 3.09 persons per family, with single male/father families (177 | 9.0%) accounting for the largest median family size of 4.49 persons per family. On the other hand, single female/mother families (447 | 22.6%) represent the smallest median family size with 2.79 persons per family.
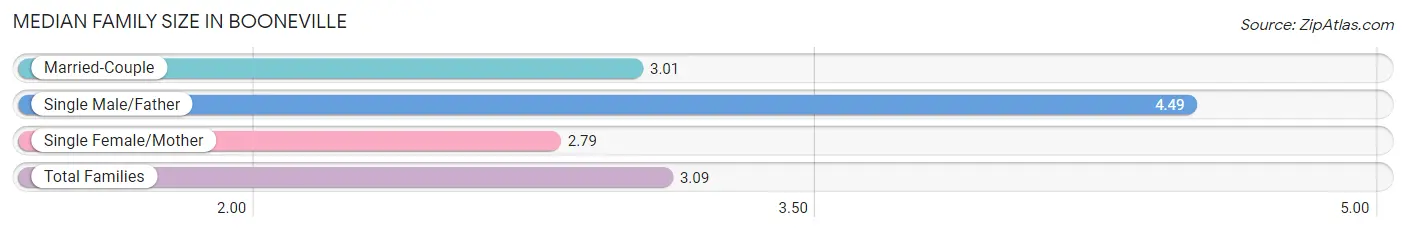
| Family Type | # Families | Family Size |
| Married-Couple | 1,350 (68.4%) | 3.01 |
| Single Male/Father | 177 (9.0%) | 4.49 |
| Single Female/Mother | 447 (22.6%) | 2.79 |
| Total Families | 1,974 (100.0%) | 3.09 |
Median Household Size in Booneville
The median household size in Booneville is 2.42 persons per household, with single male/father households (177 | 5.5%) accounting for the largest median household size of 4.79 persons per household. non-family households (1,257 | 38.9%) represent the smallest median household size with 1.18 persons per household.
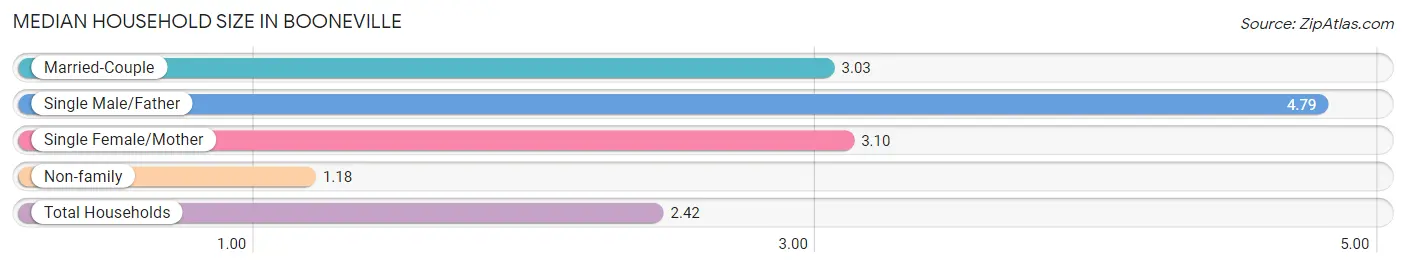
| Household Type | # Households | Household Size |
| Married-Couple | 1,350 (41.8%) | 3.03 |
| Single Male/Father | 177 (5.5%) | 4.79 |
| Single Female/Mother | 447 (13.8%) | 3.10 |
| Non-family | 1,257 (38.9%) | 1.18 |
| Total Households | 3,231 (100.0%) | 2.42 |
Household Size by Marriage Status in Booneville
Out of a total of 3,231 households in Booneville, 1,974 (61.1%) are family households, while 1,257 (38.9%) are nonfamily households. The most numerous type of family households are 2-person households, comprising 952, and the most common type of nonfamily households are 1-person households, comprising 1,103.
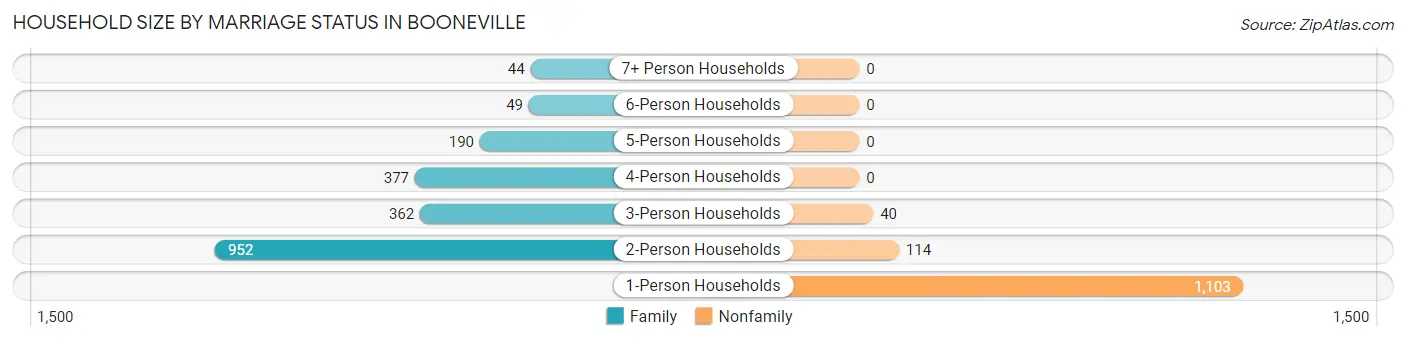
| Household Size | Family Households | Nonfamily Households |
| 1-Person Households | - | 1,103 (34.1%) |
| 2-Person Households | 952 (29.5%) | 114 (3.5%) |
| 3-Person Households | 362 (11.2%) | 40 (1.2%) |
| 4-Person Households | 377 (11.7%) | 0 (0.0%) |
| 5-Person Households | 190 (5.9%) | 0 (0.0%) |
| 6-Person Households | 49 (1.5%) | 0 (0.0%) |
| 7+ Person Households | 44 (1.4%) | 0 (0.0%) |
| Total | 1,974 (61.1%) | 1,257 (38.9%) |
Female Fertility in Booneville
Fertility by Age in Booneville
Average fertility rate in Booneville is 49.0 births per 1,000 women. Women in the age bracket of 20 to 34 years have the highest fertility rate with 85.0 births per 1,000 women. Women in the age bracket of 20 to 34 years acount for 84.0% of all women with births.
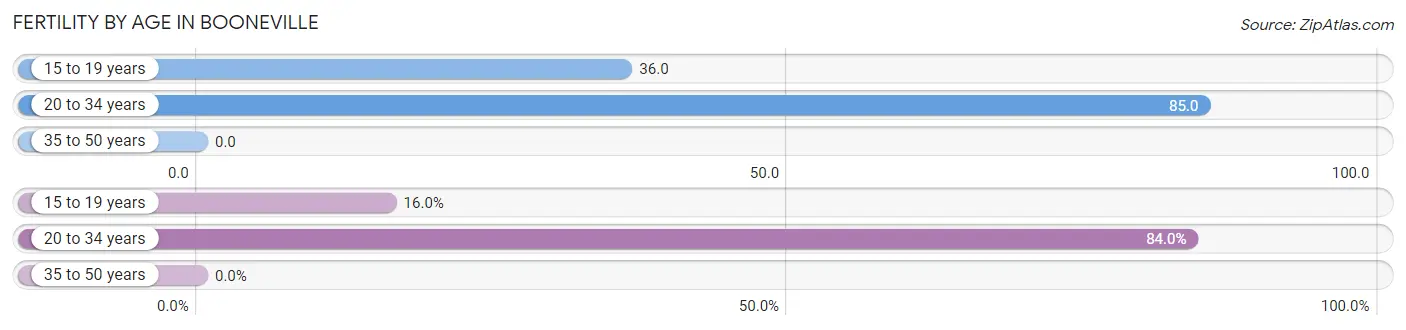
| Age Bracket | Women with Births | Births / 1,000 Women |
| 15 to 19 years | 16 (16.0%) | 36.0 |
| 20 to 34 years | 84 (84.0%) | 85.0 |
| 35 to 50 years | 0 (0.0%) | 0.0 |
| Total | 100 (100.0%) | 49.0 |
Fertility by Age by Marriage Status in Booneville
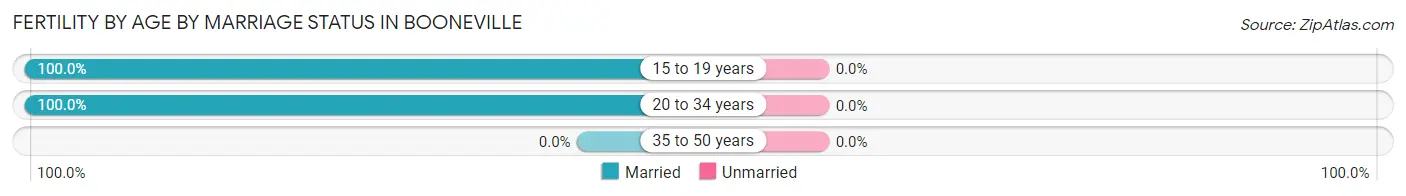
| Age Bracket | Married | Unmarried |
| 15 to 19 years | 16 (100.0%) | 0 (0.0%) |
| 20 to 34 years | 84 (100.0%) | 0 (0.0%) |
| 35 to 50 years | 0 (0.0%) | 0 (0.0%) |
| Total | 100 (100.0%) | 0 (0.0%) |
Fertility by Education in Booneville
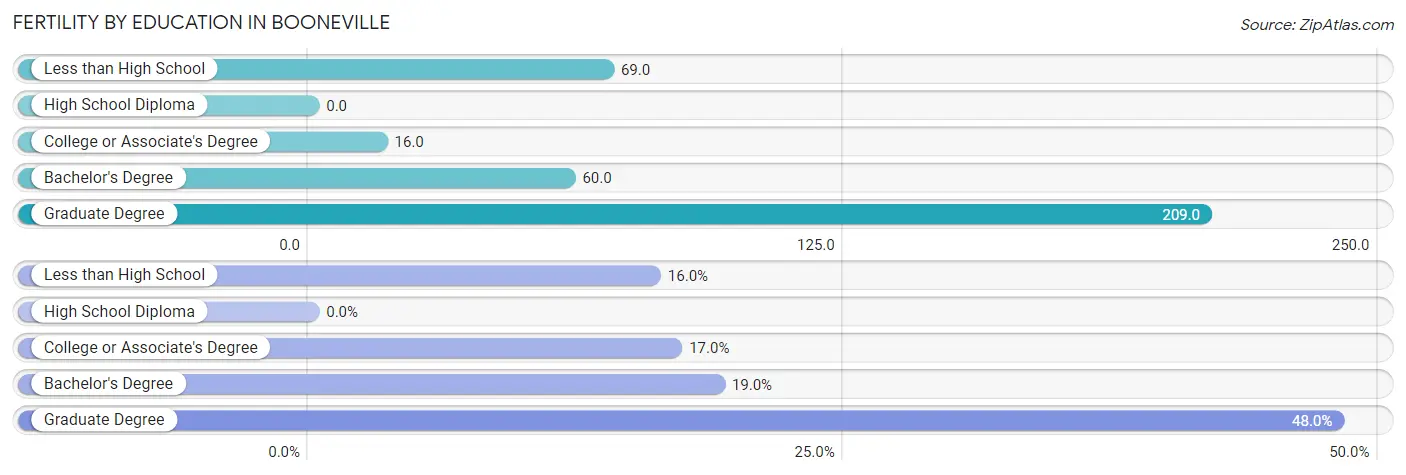
| Educational Attainment | Women with Births | Births / 1,000 Women |
| Less than High School | 16 (16.0%) | 69.0 |
| High School Diploma | 0 (0.0%) | 0.0 |
| College or Associate's Degree | 17 (17.0%) | 16.0 |
| Bachelor's Degree | 19 (19.0%) | 60.0 |
| Graduate Degree | 48 (48.0%) | 209.0 |
| Total | 100 (100.0%) | 49.0 |
Fertility by Education by Marriage Status in Booneville
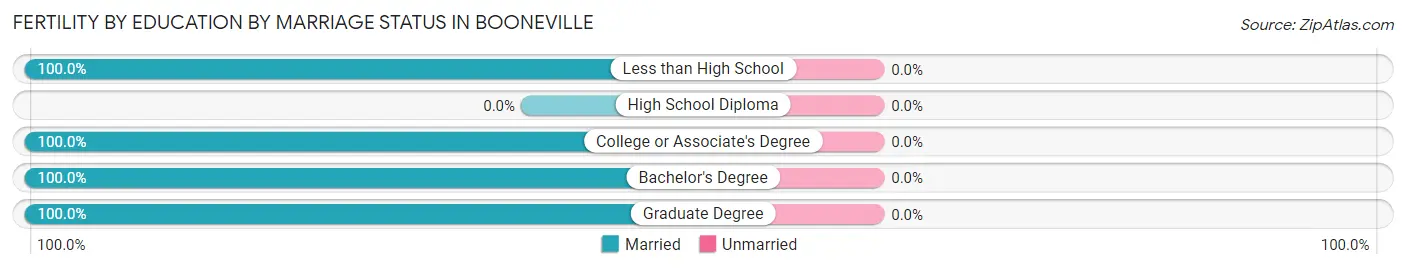
| Educational Attainment | Married | Unmarried |
| Less than High School | 16 (100.0%) | 0 (0.0%) |
| High School Diploma | 0 (0.0%) | 0 (0.0%) |
| College or Associate's Degree | 17 (100.0%) | 0 (0.0%) |
| Bachelor's Degree | 19 (100.0%) | 0 (0.0%) |
| Graduate Degree | 48 (100.0%) | 0 (0.0%) |
| Total | 100 (100.0%) | 0 (0.0%) |
Employment Characteristics in Booneville
Employment by Class of Employer in Booneville
Among the 3,349 employed individuals in Booneville, private company employees (2,292 | 68.4%), state government employees (288 | 8.6%), and self-employed (incorporated) (242 | 7.2%) make up the most common classes of employment.
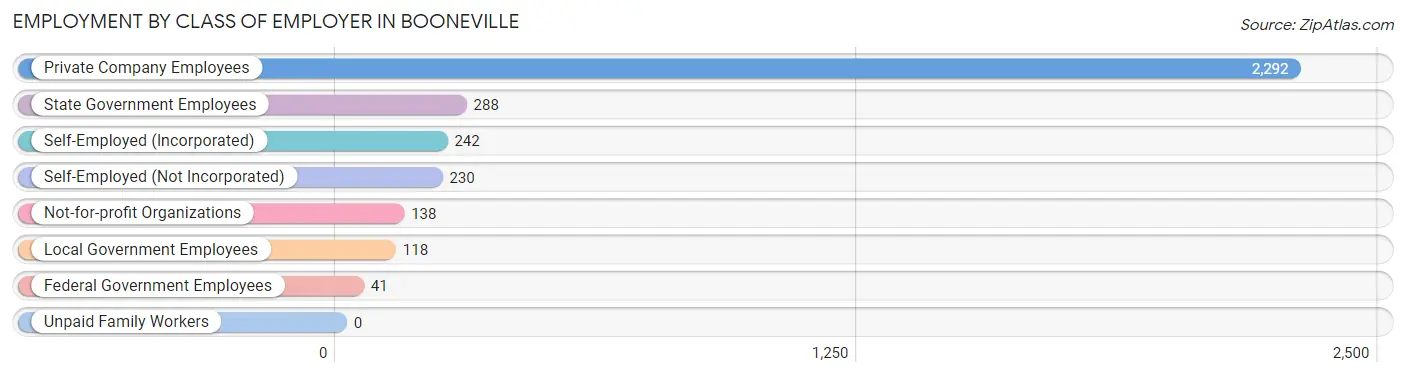
| Employer Class | # Employees | % Employees |
| Private Company Employees | 2,292 | 68.4% |
| Self-Employed (Incorporated) | 242 | 7.2% |
| Self-Employed (Not Incorporated) | 230 | 6.9% |
| Not-for-profit Organizations | 138 | 4.1% |
| Local Government Employees | 118 | 3.5% |
| State Government Employees | 288 | 8.6% |
| Federal Government Employees | 41 | 1.2% |
| Unpaid Family Workers | 0 | 0.0% |
| Total | 3,349 | 100.0% |
Employment Status by Age in Booneville
According to the labor force statistics for Booneville, out of the total population over 16 years of age (7,271), 49.8% or 3,621 individuals are in the labor force, with 4.6% or 167 of them unemployed. The age group with the highest labor force participation rate is 35 to 44 years, with 89.2% or 1,072 individuals in the labor force. Within the labor force, the 16 to 19 years age range has the highest percentage of unemployed individuals, with 24.1% or 45 of them being unemployed.
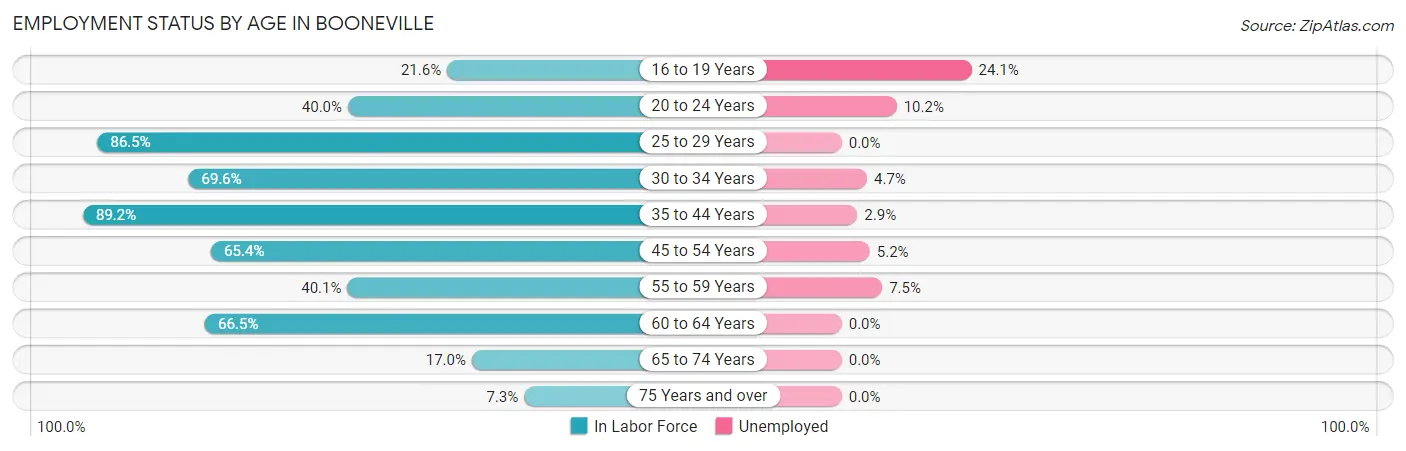
| Age Bracket | In Labor Force | Unemployed |
| 16 to 19 Years | 187 (21.6%) | 45 (24.1%) |
| 20 to 24 Years | 342 (40.0%) | 35 (10.2%) |
| 25 to 29 Years | 418 (86.5%) | 0 (0.0%) |
| 30 to 34 Years | 405 (69.6%) | 19 (4.7%) |
| 35 to 44 Years | 1,072 (89.2%) | 31 (2.9%) |
| 45 to 54 Years | 463 (65.4%) | 24 (5.2%) |
| 55 to 59 Years | 160 (40.1%) | 12 (7.5%) |
| 60 to 64 Years | 372 (66.5%) | 0 (0.0%) |
| 65 to 74 Years | 147 (17.0%) | 0 (0.0%) |
| 75 Years and over | 55 (7.3%) | 0 (0.0%) |
| Total | 3,621 (49.8%) | 167 (4.6%) |
Employment Status by Educational Attainment in Booneville
According to labor force statistics for Booneville, 73.5% of individuals (2,891) out of the total population between 25 and 64 years of age (3,933) are in the labor force, with 3.0% or 87 of them being unemployed. The group with the highest labor force participation rate are those with the educational attainment of bachelor's degree or higher, with 80.0% or 990 individuals in the labor force. Within the labor force, individuals with less than high school education have the highest percentage of unemployment, with 28.5% or 59 of them being unemployed.
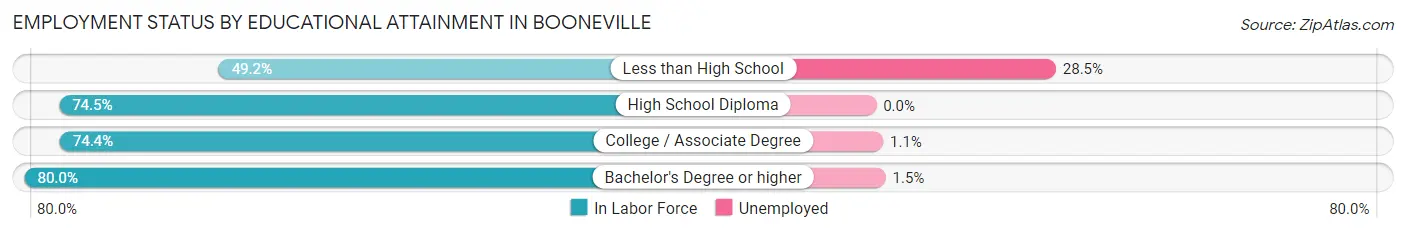
| Educational Attainment | In Labor Force | Unemployed |
| Less than High School | 207 (49.2%) | 120 (28.5%) |
| High School Diploma | 618 (74.5%) | 0 (0.0%) |
| College / Associate Degree | 1,076 (74.4%) | 16 (1.1%) |
| Bachelor's Degree or higher | 990 (80.0%) | 19 (1.5%) |
| Total | 2,891 (73.5%) | 118 (3.0%) |
Employment Occupations by Sex in Booneville
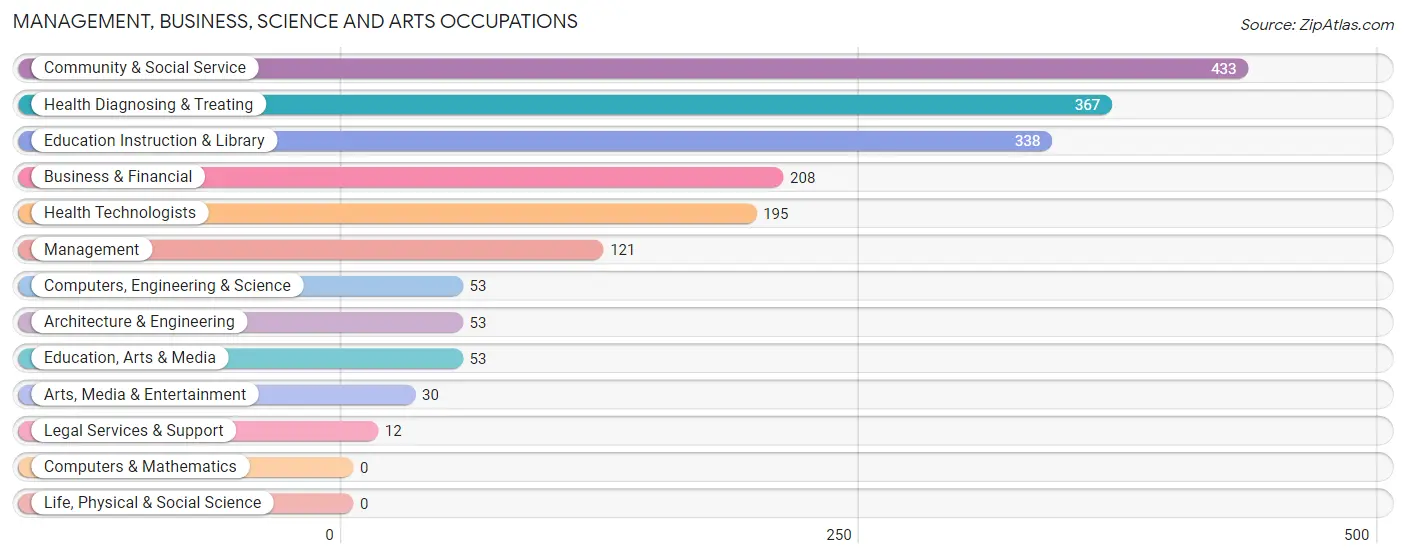
Management, Business, Science and Arts Occupations
The most common Management, Business, Science and Arts occupations in Booneville are Community & Social Service (433 | 12.5%), Health Diagnosing & Treating (367 | 10.6%), Education Instruction & Library (338 | 9.8%), Business & Financial (208 | 6.0%), and Health Technologists (195 | 5.6%).
Management, Business, Science and Arts Occupations by Sex
Within the Management, Business, Science and Arts occupations in Booneville, the most male-oriented occupations are Computers, Engineering & Science (100.0%), Architecture & Engineering (100.0%), and Legal Services & Support (100.0%), while the most female-oriented occupations are Education Instruction & Library (100.0%), Community & Social Service (86.6%), and Health Diagnosing & Treating (79.0%).
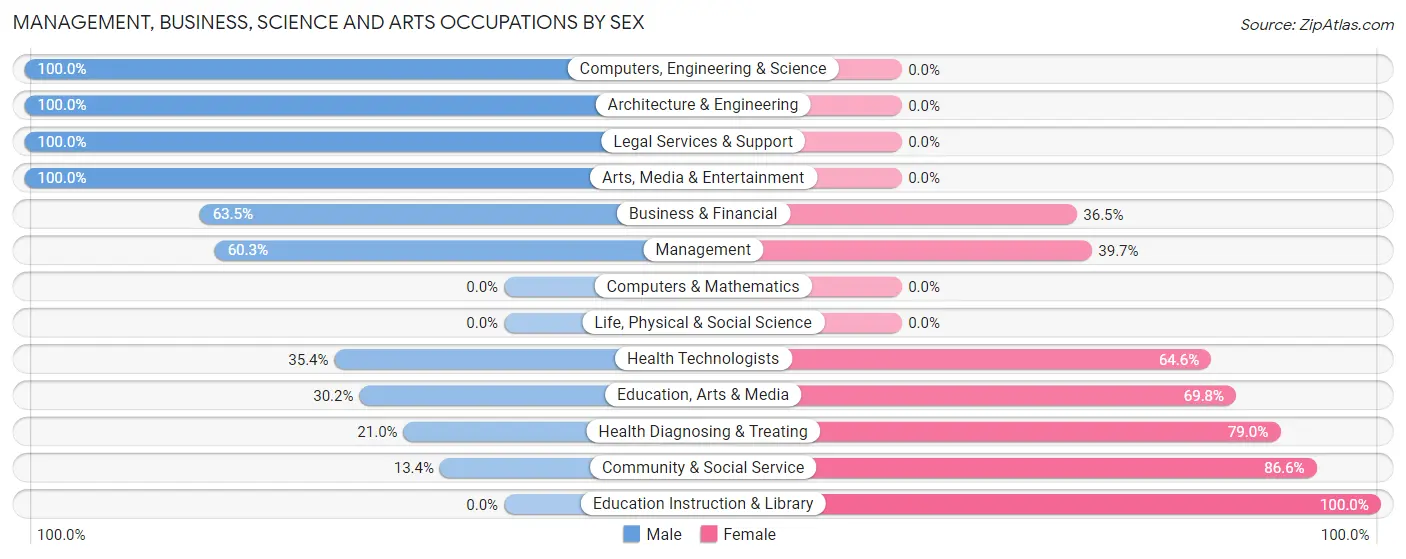
| Occupation | Male | Female |
| Management | 73 (60.3%) | 48 (39.7%) |
| Business & Financial | 132 (63.5%) | 76 (36.5%) |
| Computers, Engineering & Science | 53 (100.0%) | 0 (0.0%) |
| Computers & Mathematics | 0 (0.0%) | 0 (0.0%) |
| Architecture & Engineering | 53 (100.0%) | 0 (0.0%) |
| Life, Physical & Social Science | 0 (0.0%) | 0 (0.0%) |
| Community & Social Service | 58 (13.4%) | 375 (86.6%) |
| Education, Arts & Media | 16 (30.2%) | 37 (69.8%) |
| Legal Services & Support | 12 (100.0%) | 0 (0.0%) |
| Education Instruction & Library | 0 (0.0%) | 338 (100.0%) |
| Arts, Media & Entertainment | 30 (100.0%) | 0 (0.0%) |
| Health Diagnosing & Treating | 77 (21.0%) | 290 (79.0%) |
| Health Technologists | 69 (35.4%) | 126 (64.6%) |
| Total (Category) | 393 (33.3%) | 789 (66.7%) |
| Total (Overall) | 1,795 (51.9%) | 1,660 (48.0%) |
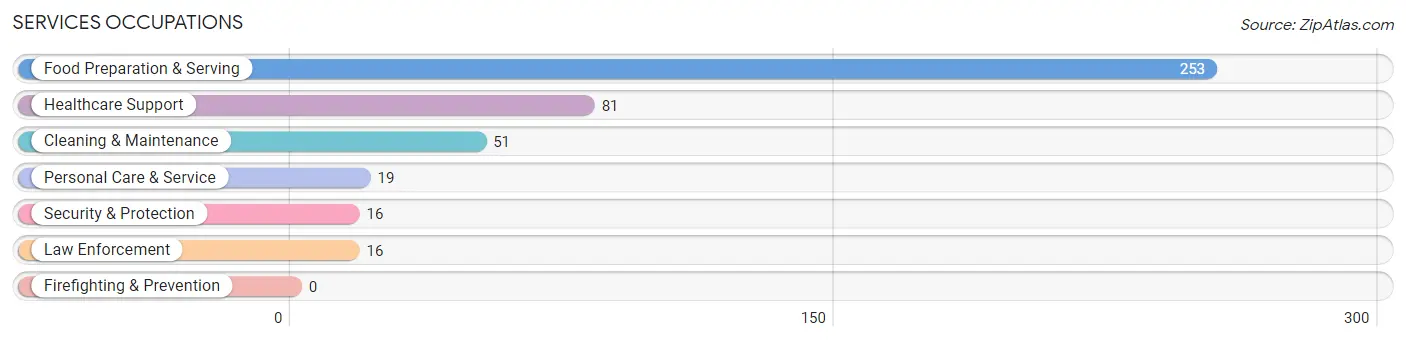
Services Occupations
The most common Services occupations in Booneville are Food Preparation & Serving (253 | 7.3%), Healthcare Support (81 | 2.3%), Cleaning & Maintenance (51 | 1.5%), Personal Care & Service (19 | 0.5%), and Security & Protection (16 | 0.5%).
Services Occupations by Sex
Within the Services occupations in Booneville, the most male-oriented occupations are Security & Protection (100.0%), Law Enforcement (100.0%), and Cleaning & Maintenance (70.6%), while the most female-oriented occupations are Personal Care & Service (100.0%), Healthcare Support (93.8%), and Food Preparation & Serving (67.2%).
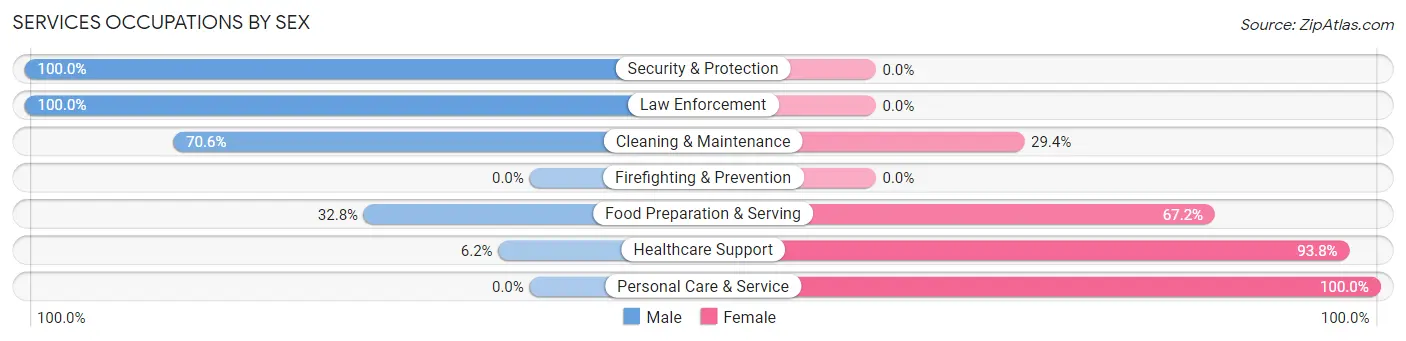
| Occupation | Male | Female |
| Healthcare Support | 5 (6.2%) | 76 (93.8%) |
| Security & Protection | 16 (100.0%) | 0 (0.0%) |
| Firefighting & Prevention | 0 (0.0%) | 0 (0.0%) |
| Law Enforcement | 16 (100.0%) | 0 (0.0%) |
| Food Preparation & Serving | 83 (32.8%) | 170 (67.2%) |
| Cleaning & Maintenance | 36 (70.6%) | 15 (29.4%) |
| Personal Care & Service | 0 (0.0%) | 19 (100.0%) |
| Total (Category) | 140 (33.3%) | 280 (66.7%) |
| Total (Overall) | 1,795 (51.9%) | 1,660 (48.0%) |
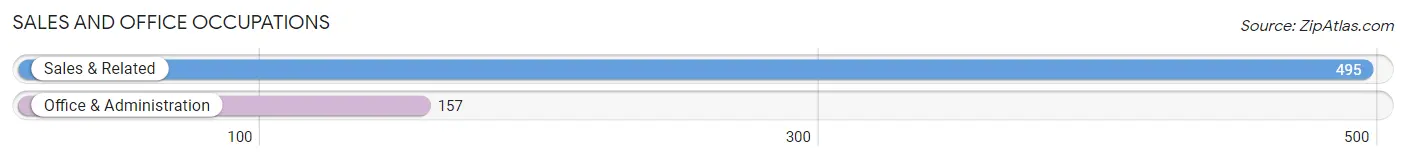
Sales and Office Occupations
The most common Sales and Office occupations in Booneville are Sales & Related (495 | 14.3%), and Office & Administration (157 | 4.5%).
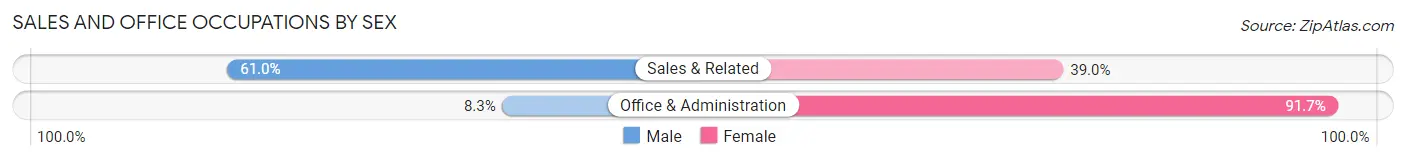
Sales and Office Occupations by Sex
| Occupation | Male | Female |
| Sales & Related | 302 (61.0%) | 193 (39.0%) |
| Office & Administration | 13 (8.3%) | 144 (91.7%) |
| Total (Category) | 315 (48.3%) | 337 (51.7%) |
| Total (Overall) | 1,795 (51.9%) | 1,660 (48.0%) |
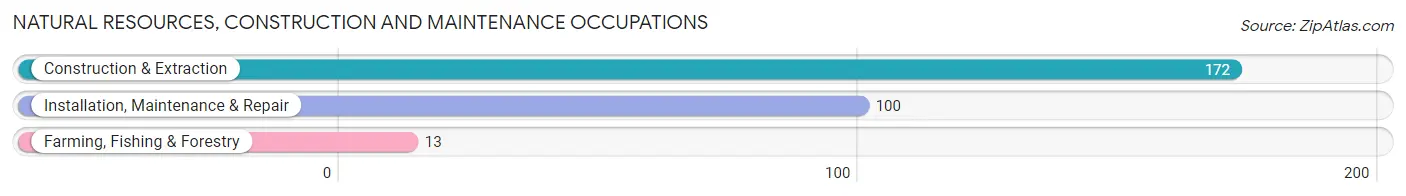
Natural Resources, Construction and Maintenance Occupations
The most common Natural Resources, Construction and Maintenance occupations in Booneville are Construction & Extraction (172 | 5.0%), Installation, Maintenance & Repair (100 | 2.9%), and Farming, Fishing & Forestry (13 | 0.4%).
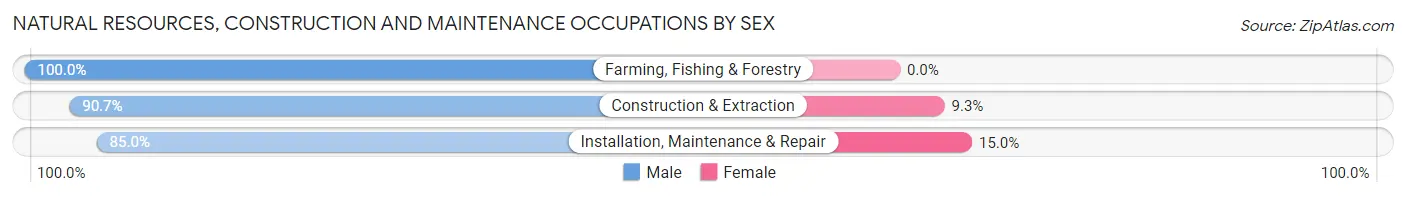
Natural Resources, Construction and Maintenance Occupations by Sex
| Occupation | Male | Female |
| Farming, Fishing & Forestry | 13 (100.0%) | 0 (0.0%) |
| Construction & Extraction | 156 (90.7%) | 16 (9.3%) |
| Installation, Maintenance & Repair | 85 (85.0%) | 15 (15.0%) |
| Total (Category) | 254 (89.1%) | 31 (10.9%) |
| Total (Overall) | 1,795 (51.9%) | 1,660 (48.0%) |
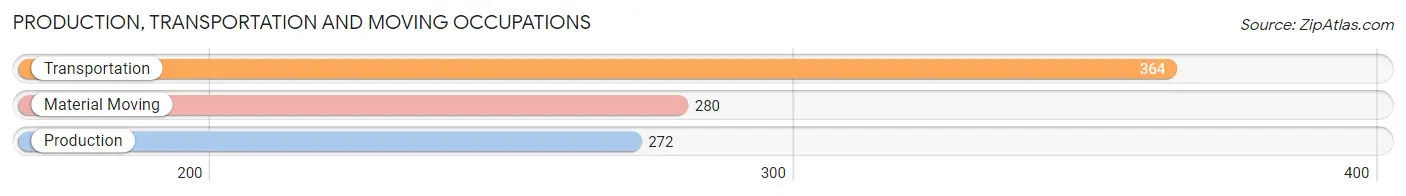
Production, Transportation and Moving Occupations
The most common Production, Transportation and Moving occupations in Booneville are Transportation (364 | 10.5%), Material Moving (280 | 8.1%), and Production (272 | 7.9%).
Production, Transportation and Moving Occupations by Sex
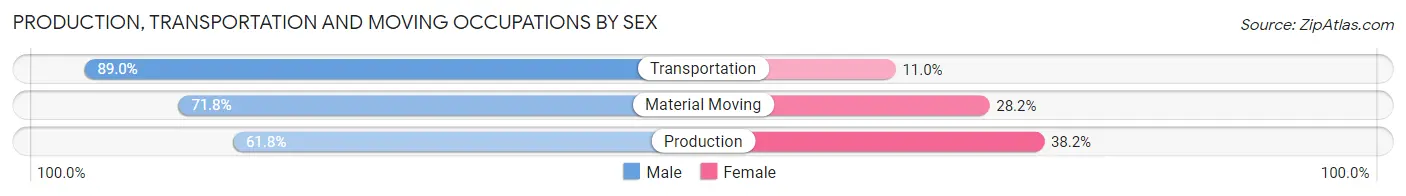
| Occupation | Male | Female |
| Production | 168 (61.8%) | 104 (38.2%) |
| Transportation | 324 (89.0%) | 40 (11.0%) |
| Material Moving | 201 (71.8%) | 79 (28.2%) |
| Total (Category) | 693 (75.7%) | 223 (24.3%) |
| Total (Overall) | 1,795 (51.9%) | 1,660 (48.0%) |
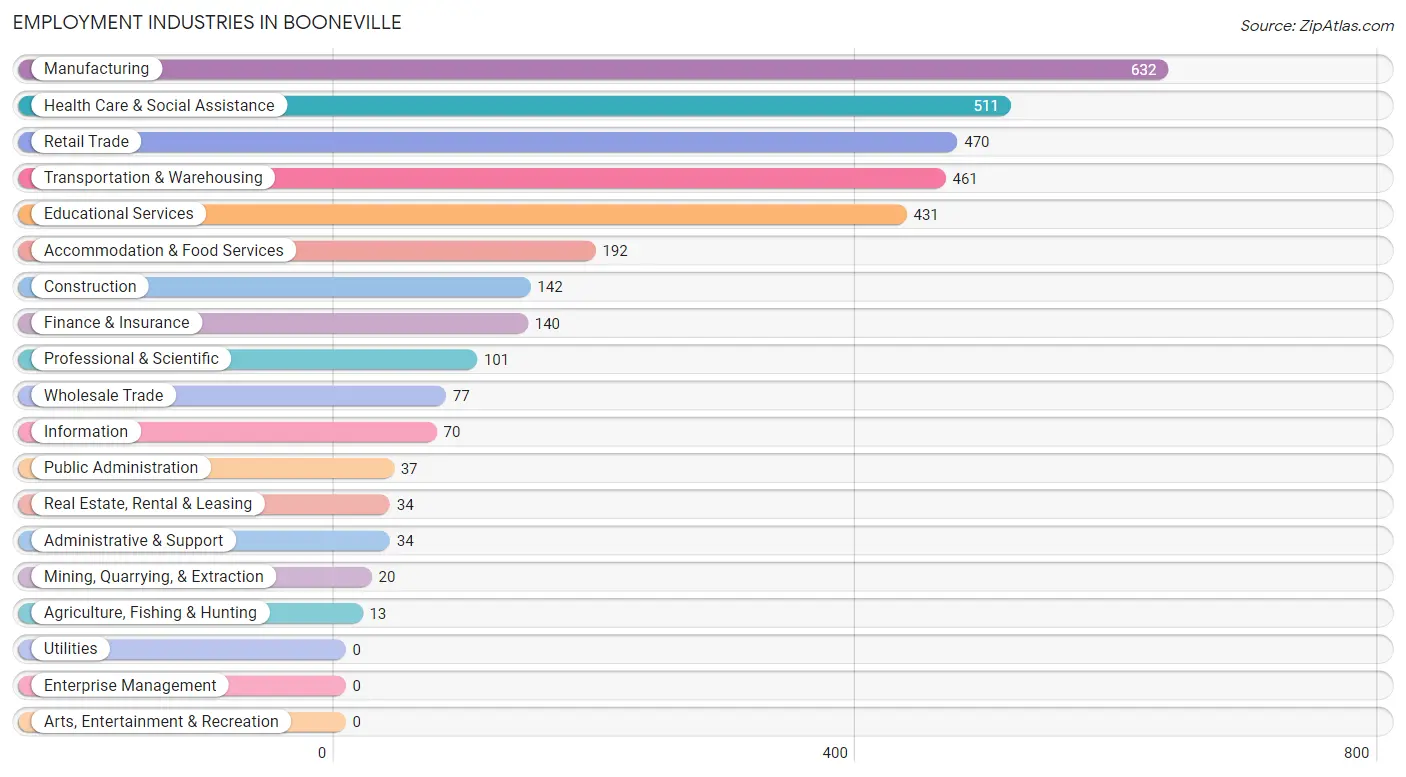
Employment Industries by Sex in Booneville
Employment Industries in Booneville
The major employment industries in Booneville include Manufacturing (632 | 18.3%), Health Care & Social Assistance (511 | 14.8%), Retail Trade (470 | 13.6%), Transportation & Warehousing (461 | 13.3%), and Educational Services (431 | 12.5%).
Employment Industries by Sex in Booneville
The Booneville industries that see more men than women are Agriculture, Fishing & Hunting (100.0%), Mining, Quarrying, & Extraction (100.0%), and Construction (100.0%), whereas the industries that tend to have a higher number of women are Educational Services (87.7%), Health Care & Social Assistance (87.1%), and Administrative & Support (82.4%).
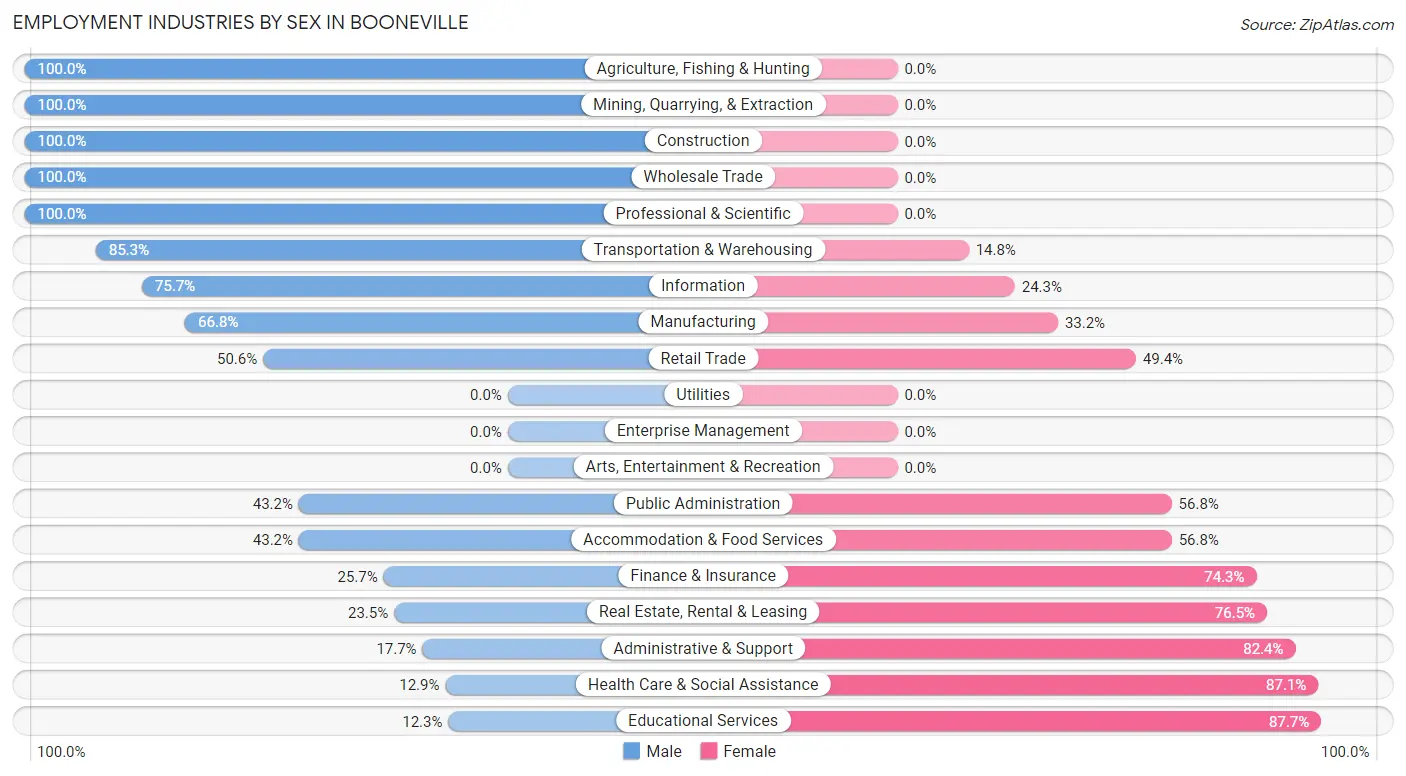
| Industry | Male | Female |
| Agriculture, Fishing & Hunting | 13 (100.0%) | 0 (0.0%) |
| Mining, Quarrying, & Extraction | 20 (100.0%) | 0 (0.0%) |
| Construction | 142 (100.0%) | 0 (0.0%) |
| Manufacturing | 422 (66.8%) | 210 (33.2%) |
| Wholesale Trade | 77 (100.0%) | 0 (0.0%) |
| Retail Trade | 238 (50.6%) | 232 (49.4%) |
| Transportation & Warehousing | 393 (85.3%) | 68 (14.7%) |
| Utilities | 0 (0.0%) | 0 (0.0%) |
| Information | 53 (75.7%) | 17 (24.3%) |
| Finance & Insurance | 36 (25.7%) | 104 (74.3%) |
| Real Estate, Rental & Leasing | 8 (23.5%) | 26 (76.5%) |
| Professional & Scientific | 101 (100.0%) | 0 (0.0%) |
| Enterprise Management | 0 (0.0%) | 0 (0.0%) |
| Administrative & Support | 6 (17.6%) | 28 (82.4%) |
| Educational Services | 53 (12.3%) | 378 (87.7%) |
| Health Care & Social Assistance | 66 (12.9%) | 445 (87.1%) |
| Arts, Entertainment & Recreation | 0 (0.0%) | 0 (0.0%) |
| Accommodation & Food Services | 83 (43.2%) | 109 (56.8%) |
| Public Administration | 16 (43.2%) | 21 (56.8%) |
| Total | 1,795 (51.9%) | 1,660 (48.0%) |
Education in Booneville
School Enrollment in Booneville
The most common levels of schooling among the 2,832 students in Booneville are college / undergraduate (1,264 | 44.6%), elementary school (464 | 16.4%), and high school (351 | 12.4%).
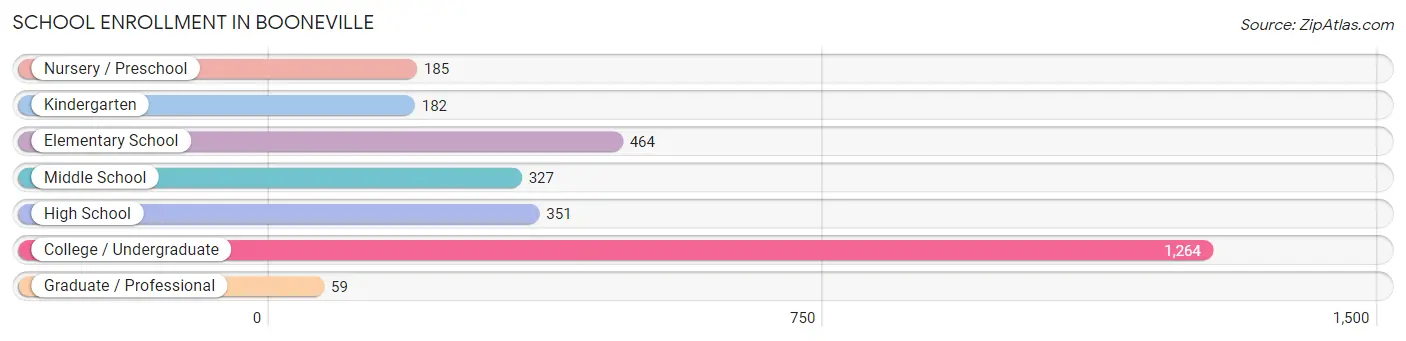
| School Level | # Students | % Students |
| Nursery / Preschool | 185 | 6.5% |
| Kindergarten | 182 | 6.4% |
| Elementary School | 464 | 16.4% |
| Middle School | 327 | 11.6% |
| High School | 351 | 12.4% |
| College / Undergraduate | 1,264 | 44.6% |
| Graduate / Professional | 59 | 2.1% |
| Total | 2,832 | 100.0% |
School Enrollment by Age by Funding Source in Booneville
Out of a total of 2,832 students who are enrolled in schools in Booneville, 113 (4.0%) attend a private institution, while the remaining 2,719 (96.0%) are enrolled in public schools. The age group of 35 years and over has the highest likelihood of being enrolled in private schools, with 15 (18.1% in the age bracket) enrolled. Conversely, the age group of 3 to 4 year olds has the lowest likelihood of being enrolled in a private school, with 151 (100.0% in the age bracket) attending a public institution.
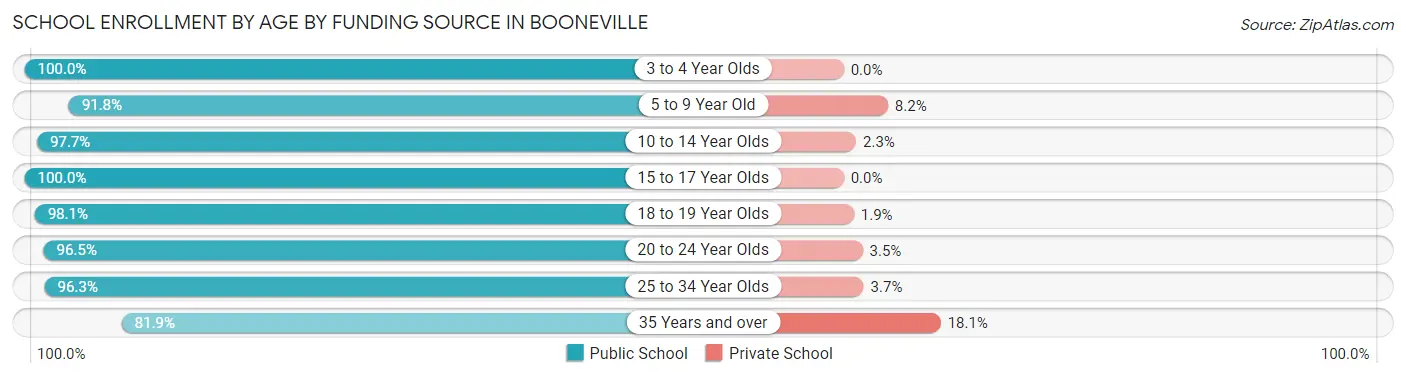
| Age Bracket | Public School | Private School |
| 3 to 4 Year Olds | 151 (100.0%) | 0 (0.0%) |
| 5 to 9 Year Old | 624 (91.8%) | 56 (8.2%) |
| 10 to 14 Year Olds | 338 (97.7%) | 8 (2.3%) |
| 15 to 17 Year Olds | 321 (100.0%) | 0 (0.0%) |
| 18 to 19 Year Olds | 571 (98.1%) | 11 (1.9%) |
| 20 to 24 Year Olds | 464 (96.5%) | 17 (3.5%) |
| 25 to 34 Year Olds | 181 (96.3%) | 7 (3.7%) |
| 35 Years and over | 68 (81.9%) | 15 (18.1%) |
| Total | 2,719 (96.0%) | 113 (4.0%) |
Educational Attainment by Field of Study in Booneville
Education (358 | 23.0%), business (308 | 19.8%), arts & humanities (201 | 12.9%), bio, nature & agricultural (188 | 12.1%), and science & technology (147 | 9.5%) are the most common fields of study among 1,556 individuals in Booneville who have obtained a bachelor's degree or higher.
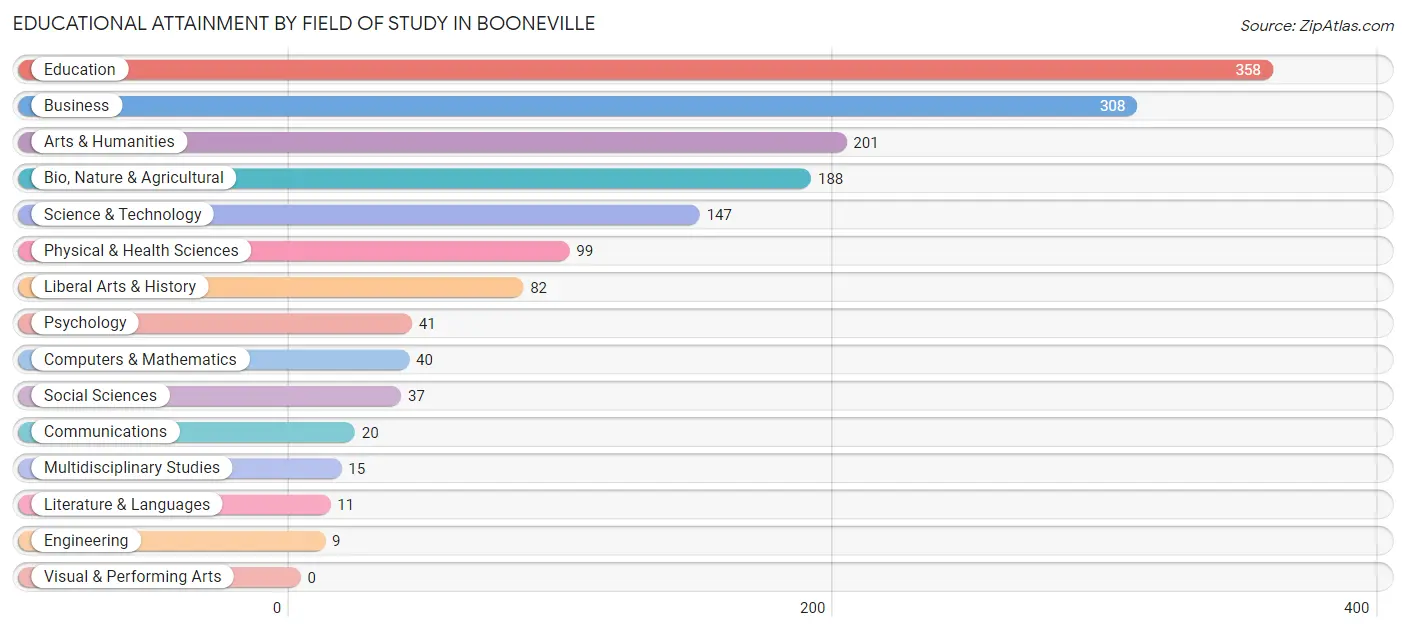
| Field of Study | # Graduates | % Graduates |
| Computers & Mathematics | 40 | 2.6% |
| Bio, Nature & Agricultural | 188 | 12.1% |
| Physical & Health Sciences | 99 | 6.4% |
| Psychology | 41 | 2.6% |
| Social Sciences | 37 | 2.4% |
| Engineering | 9 | 0.6% |
| Multidisciplinary Studies | 15 | 1.0% |
| Science & Technology | 147 | 9.5% |
| Business | 308 | 19.8% |
| Education | 358 | 23.0% |
| Literature & Languages | 11 | 0.7% |
| Liberal Arts & History | 82 | 5.3% |
| Visual & Performing Arts | 0 | 0.0% |
| Communications | 20 | 1.3% |
| Arts & Humanities | 201 | 12.9% |
| Total | 1,556 | 100.0% |
Transportation & Commute in Booneville
Vehicle Availability by Sex in Booneville
The most prevalent vehicle ownership categories in Booneville are males with 2 vehicles (844, accounting for 51.5%) and females with 2 vehicles (798, making up 50.9%).
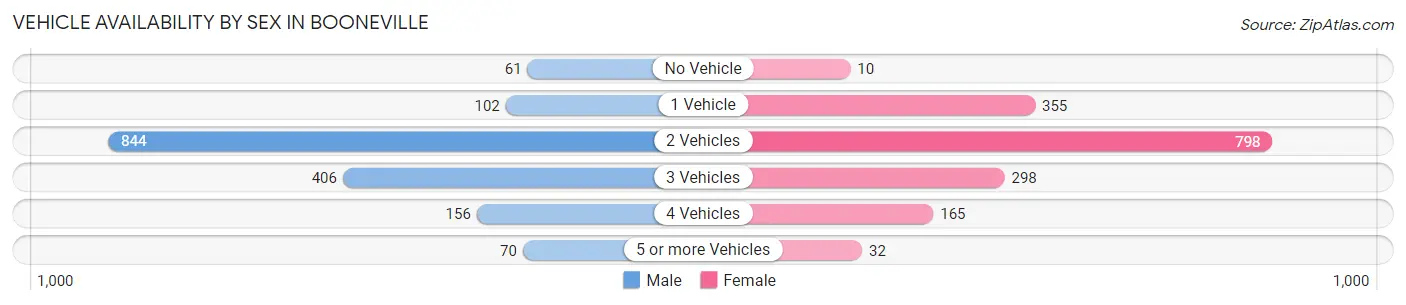
| Vehicles Available | Male | Female |
| No Vehicle | 61 (3.7%) | 10 (0.6%) |
| 1 Vehicle | 102 (6.2%) | 355 (21.4%) |
| 2 Vehicles | 844 (51.5%) | 798 (48.1%) |
| 3 Vehicles | 406 (24.8%) | 298 (18.0%) |
| 4 Vehicles | 156 (9.5%) | 165 (10.0%) |
| 5 or more Vehicles | 70 (4.3%) | 32 (1.9%) |
| Total | 1,639 (100.0%) | 1,658 (100.0%) |
Commute Time in Booneville
The most frequently occuring commute durations in Booneville are 10 to 14 minutes (998 commuters, 29.8%), 5 to 9 minutes (942 commuters, 28.1%), and 15 to 19 minutes (261 commuters, 7.8%).
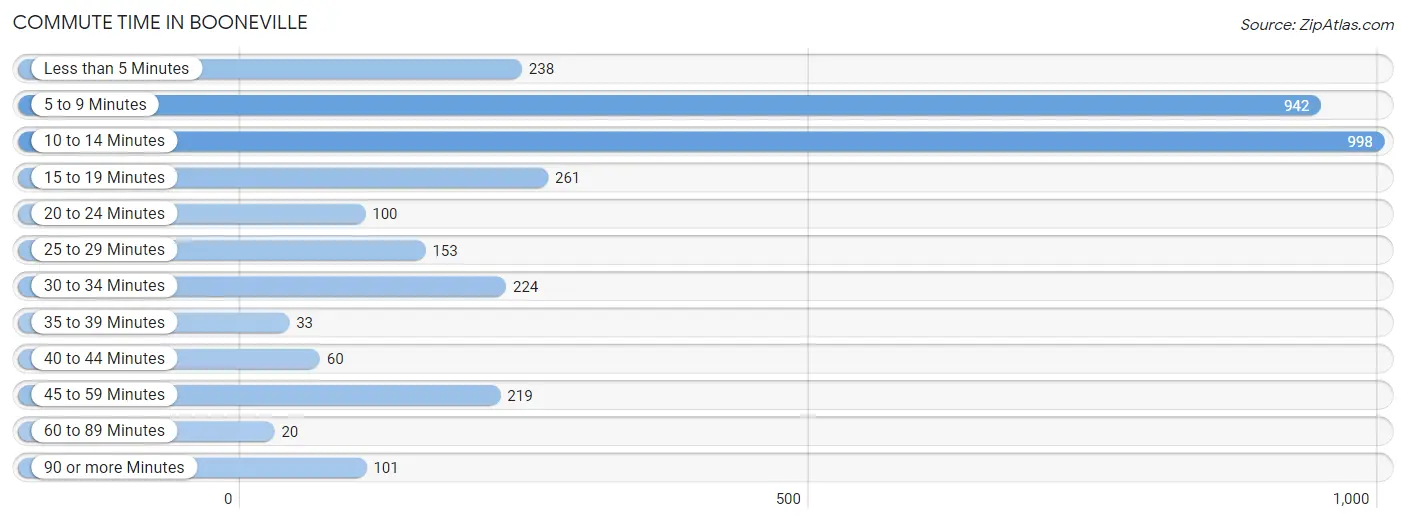
| Commute Time | # Commuters | % Commuters |
| Less than 5 Minutes | 238 | 7.1% |
| 5 to 9 Minutes | 942 | 28.1% |
| 10 to 14 Minutes | 998 | 29.8% |
| 15 to 19 Minutes | 261 | 7.8% |
| 20 to 24 Minutes | 100 | 3.0% |
| 25 to 29 Minutes | 153 | 4.6% |
| 30 to 34 Minutes | 224 | 6.7% |
| 35 to 39 Minutes | 33 | 1.0% |
| 40 to 44 Minutes | 60 | 1.8% |
| 45 to 59 Minutes | 219 | 6.5% |
| 60 to 89 Minutes | 20 | 0.6% |
| 90 or more Minutes | 101 | 3.0% |
Commute Time by Sex in Booneville
The most common commute times in Booneville are 5 to 9 minutes (477 commuters, 28.2%) for males and 10 to 14 minutes (576 commuters, 34.7%) for females.
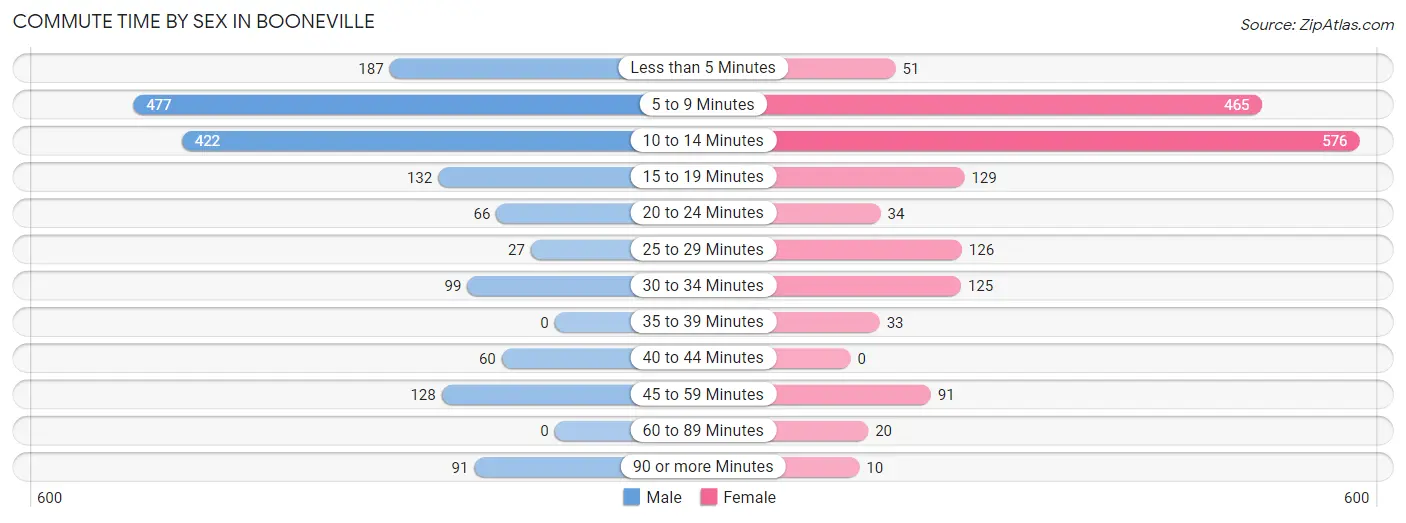
| Commute Time | Male | Female |
| Less than 5 Minutes | 187 (11.1%) | 51 (3.1%) |
| 5 to 9 Minutes | 477 (28.2%) | 465 (28.0%) |
| 10 to 14 Minutes | 422 (25.0%) | 576 (34.7%) |
| 15 to 19 Minutes | 132 (7.8%) | 129 (7.8%) |
| 20 to 24 Minutes | 66 (3.9%) | 34 (2.1%) |
| 25 to 29 Minutes | 27 (1.6%) | 126 (7.6%) |
| 30 to 34 Minutes | 99 (5.9%) | 125 (7.5%) |
| 35 to 39 Minutes | 0 (0.0%) | 33 (2.0%) |
| 40 to 44 Minutes | 60 (3.5%) | 0 (0.0%) |
| 45 to 59 Minutes | 128 (7.6%) | 91 (5.5%) |
| 60 to 89 Minutes | 0 (0.0%) | 20 (1.2%) |
| 90 or more Minutes | 91 (5.4%) | 10 (0.6%) |
Time of Departure to Work by Sex in Booneville
The most frequent times of departure to work in Booneville are 5:00 AM to 5:29 AM (266, 15.8%) for males and 7:00 AM to 7:29 AM (400, 24.1%) for females.
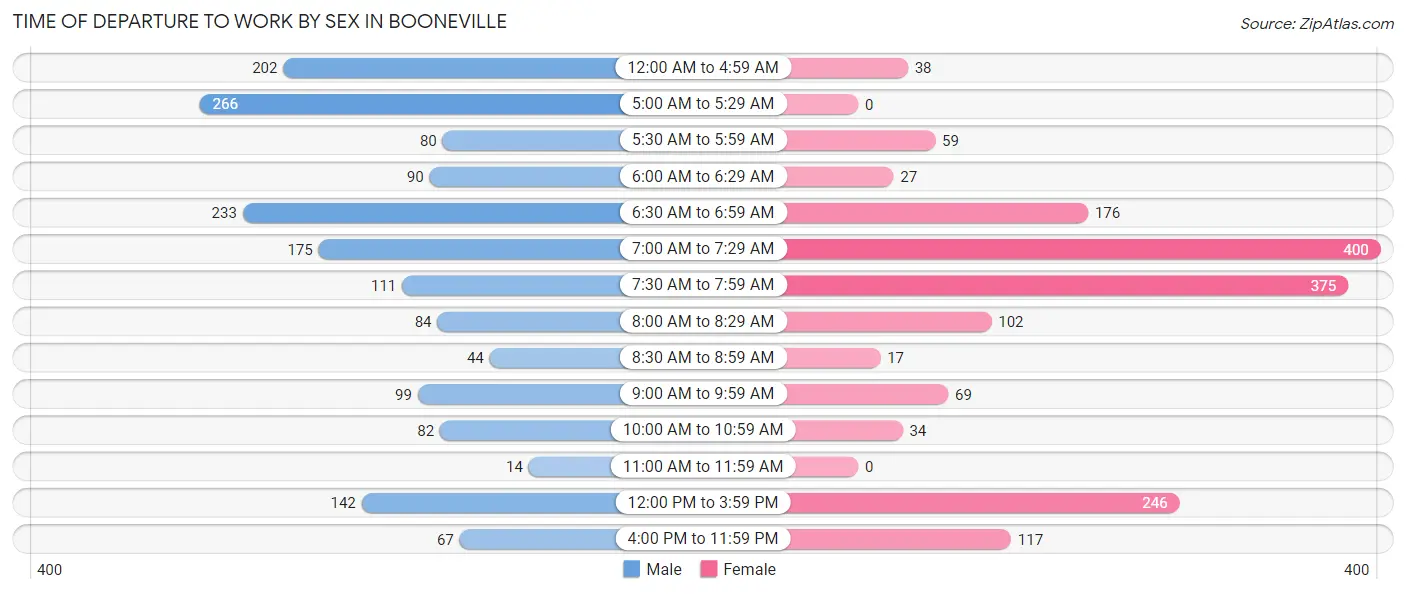
| Time of Departure | Male | Female |
| 12:00 AM to 4:59 AM | 202 (12.0%) | 38 (2.3%) |
| 5:00 AM to 5:29 AM | 266 (15.8%) | 0 (0.0%) |
| 5:30 AM to 5:59 AM | 80 (4.7%) | 59 (3.5%) |
| 6:00 AM to 6:29 AM | 90 (5.3%) | 27 (1.6%) |
| 6:30 AM to 6:59 AM | 233 (13.8%) | 176 (10.6%) |
| 7:00 AM to 7:29 AM | 175 (10.4%) | 400 (24.1%) |
| 7:30 AM to 7:59 AM | 111 (6.6%) | 375 (22.6%) |
| 8:00 AM to 8:29 AM | 84 (5.0%) | 102 (6.1%) |
| 8:30 AM to 8:59 AM | 44 (2.6%) | 17 (1.0%) |
| 9:00 AM to 9:59 AM | 99 (5.9%) | 69 (4.2%) |
| 10:00 AM to 10:59 AM | 82 (4.9%) | 34 (2.1%) |
| 11:00 AM to 11:59 AM | 14 (0.8%) | 0 (0.0%) |
| 12:00 PM to 3:59 PM | 142 (8.4%) | 246 (14.8%) |
| 4:00 PM to 11:59 PM | 67 (4.0%) | 117 (7.0%) |
| Total | 1,689 (100.0%) | 1,660 (100.0%) |
Housing Occupancy in Booneville
Occupancy by Ownership in Booneville
Of the total 3,231 dwellings in Booneville, owner-occupied units account for 2,236 (69.2%), while renter-occupied units make up 995 (30.8%).
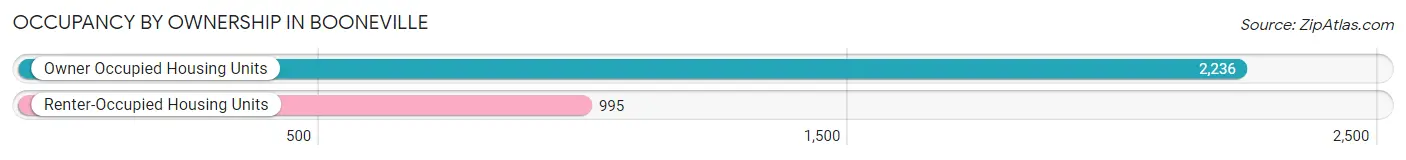
| Occupancy | # Housing Units | % Housing Units |
| Owner Occupied Housing Units | 2,236 | 69.2% |
| Renter-Occupied Housing Units | 995 | 30.8% |
| Total Occupied Housing Units | 3,231 | 100.0% |
Occupancy by Household Size in Booneville
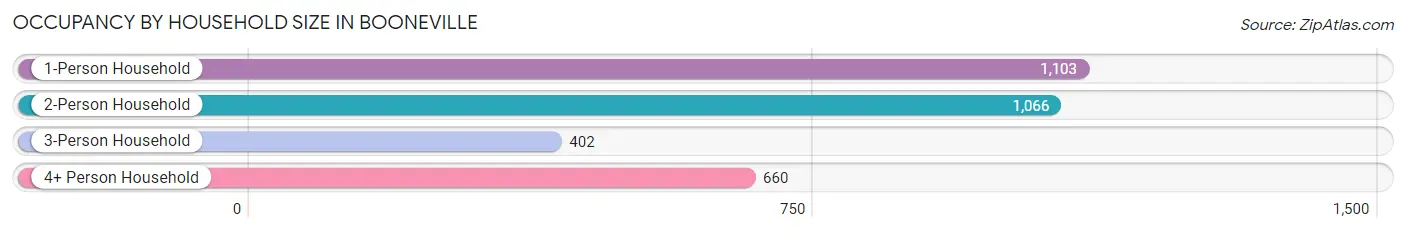
| Household Size | # Housing Units | % Housing Units |
| 1-Person Household | 1,103 | 34.1% |
| 2-Person Household | 1,066 | 33.0% |
| 3-Person Household | 402 | 12.4% |
| 4+ Person Household | 660 | 20.4% |
| Total Housing Units | 3,231 | 100.0% |
Occupancy by Ownership by Household Size in Booneville
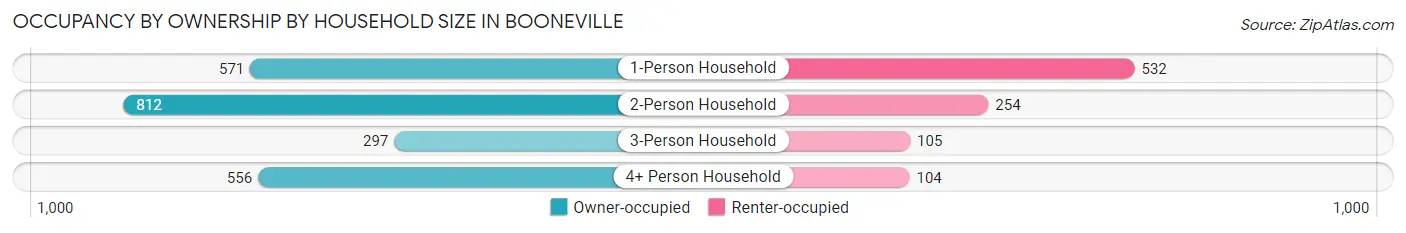
| Household Size | Owner-occupied | Renter-occupied |
| 1-Person Household | 571 (51.8%) | 532 (48.2%) |
| 2-Person Household | 812 (76.2%) | 254 (23.8%) |
| 3-Person Household | 297 (73.9%) | 105 (26.1%) |
| 4+ Person Household | 556 (84.2%) | 104 (15.8%) |
| Total Housing Units | 2,236 (69.2%) | 995 (30.8%) |
Occupancy by Educational Attainment in Booneville
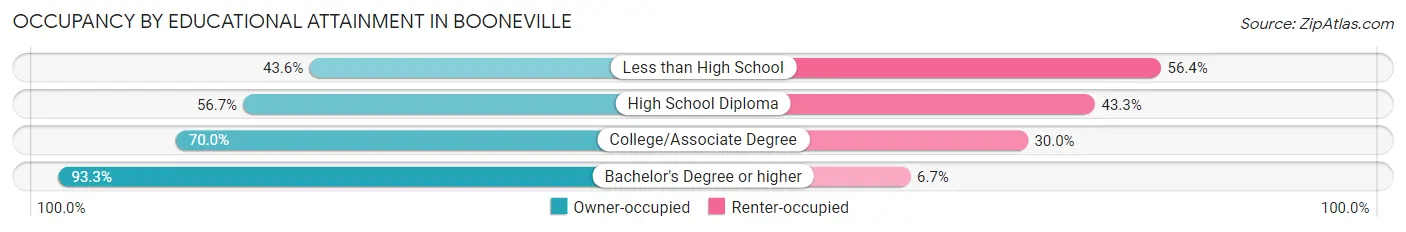
| Household Size | Owner-occupied | Renter-occupied |
| Less than High School | 184 (43.6%) | 238 (56.4%) |
| High School Diploma | 431 (56.7%) | 329 (43.3%) |
| College/Associate Degree | 873 (70.0%) | 374 (30.0%) |
| Bachelor's Degree or higher | 748 (93.3%) | 54 (6.7%) |
Occupancy by Age of Householder in Booneville
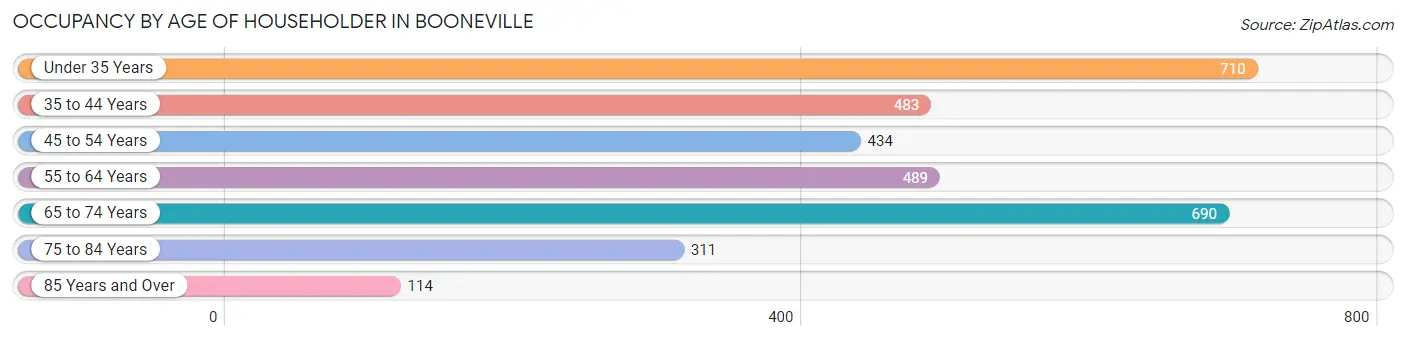
| Age Bracket | # Households | % Households |
| Under 35 Years | 710 | 22.0% |
| 35 to 44 Years | 483 | 14.9% |
| 45 to 54 Years | 434 | 13.4% |
| 55 to 64 Years | 489 | 15.1% |
| 65 to 74 Years | 690 | 21.4% |
| 75 to 84 Years | 311 | 9.6% |
| 85 Years and Over | 114 | 3.5% |
| Total | 3,231 | 100.0% |
Housing Finances in Booneville
Median Income by Occupancy in Booneville
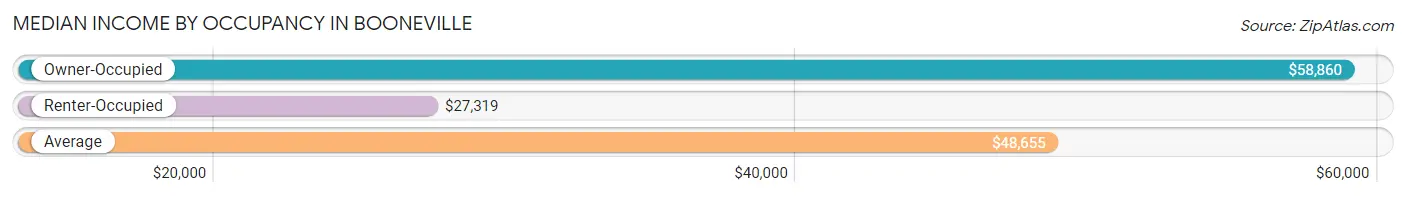
| Occupancy Type | # Households | Median Income |
| Owner-Occupied | 2,236 (69.2%) | $58,860 |
| Renter-Occupied | 995 (30.8%) | $27,319 |
| Average | 3,231 (100.0%) | $48,655 |
Occupancy by Householder Income Bracket in Booneville
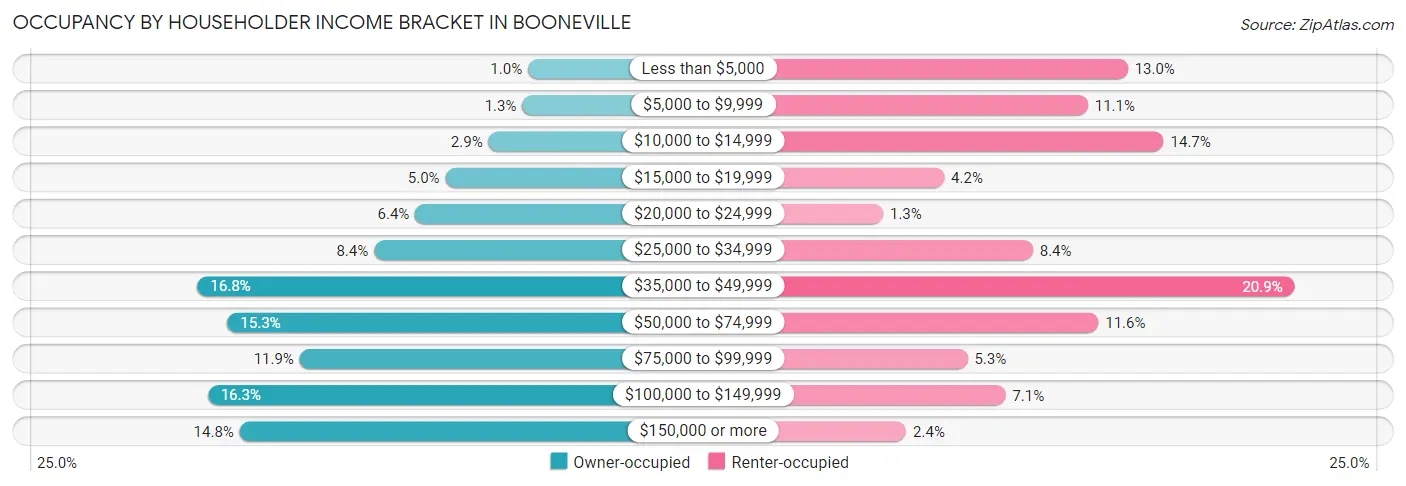
| Income Bracket | Owner-occupied | Renter-occupied |
| Less than $5,000 | 23 (1.0%) | 129 (13.0%) |
| $5,000 to $9,999 | 29 (1.3%) | 110 (11.1%) |
| $10,000 to $14,999 | 65 (2.9%) | 146 (14.7%) |
| $15,000 to $19,999 | 111 (5.0%) | 42 (4.2%) |
| $20,000 to $24,999 | 143 (6.4%) | 13 (1.3%) |
| $25,000 to $34,999 | 187 (8.4%) | 84 (8.4%) |
| $35,000 to $49,999 | 375 (16.8%) | 208 (20.9%) |
| $50,000 to $74,999 | 343 (15.3%) | 115 (11.6%) |
| $75,000 to $99,999 | 266 (11.9%) | 53 (5.3%) |
| $100,000 to $149,999 | 364 (16.3%) | 71 (7.1%) |
| $150,000 or more | 330 (14.8%) | 24 (2.4%) |
| Total | 2,236 (100.0%) | 995 (100.0%) |
Monthly Housing Cost Tiers in Booneville
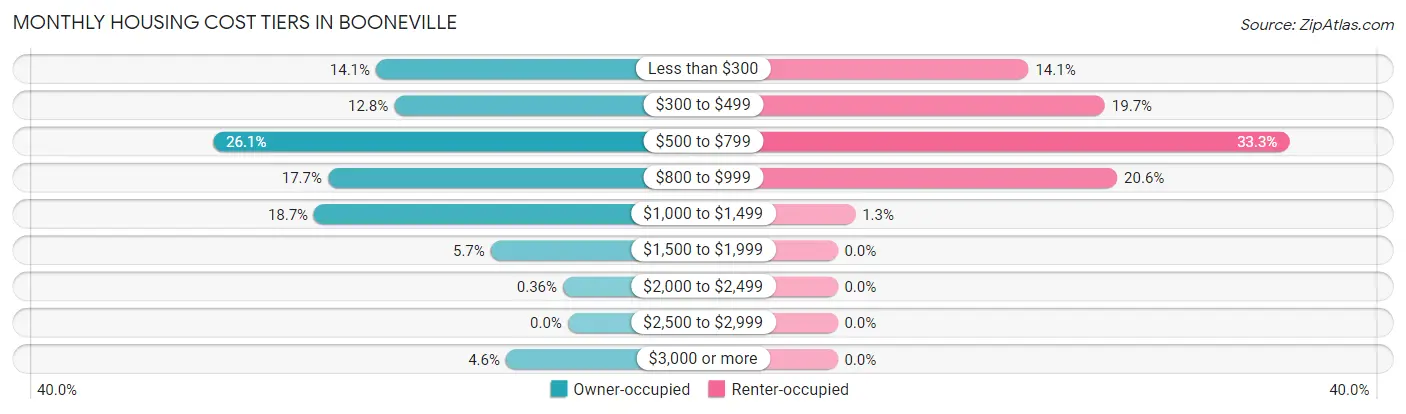
| Monthly Cost | Owner-occupied | Renter-occupied |
| Less than $300 | 316 (14.1%) | 140 (14.1%) |
| $300 to $499 | 286 (12.8%) | 196 (19.7%) |
| $500 to $799 | 584 (26.1%) | 331 (33.3%) |
| $800 to $999 | 395 (17.7%) | 205 (20.6%) |
| $1,000 to $1,499 | 418 (18.7%) | 13 (1.3%) |
| $1,500 to $1,999 | 127 (5.7%) | 0 (0.0%) |
| $2,000 to $2,499 | 8 (0.4%) | 0 (0.0%) |
| $2,500 to $2,999 | 0 (0.0%) | 0 (0.0%) |
| $3,000 or more | 102 (4.6%) | 0 (0.0%) |
| Total | 2,236 (100.0%) | 995 (100.0%) |
Physical Housing Characteristics in Booneville
Housing Structures in Booneville
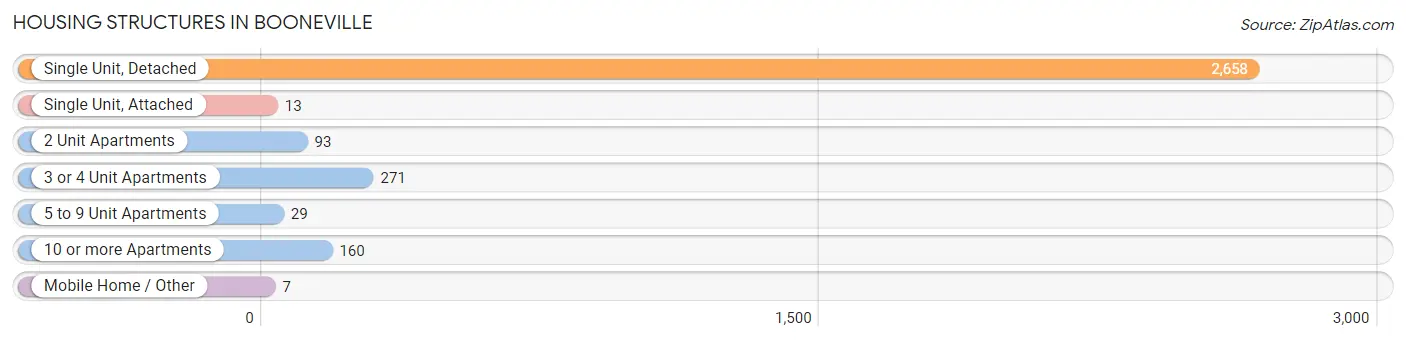
| Structure Type | # Housing Units | % Housing Units |
| Single Unit, Detached | 2,658 | 82.3% |
| Single Unit, Attached | 13 | 0.4% |
| 2 Unit Apartments | 93 | 2.9% |
| 3 or 4 Unit Apartments | 271 | 8.4% |
| 5 to 9 Unit Apartments | 29 | 0.9% |
| 10 or more Apartments | 160 | 5.0% |
| Mobile Home / Other | 7 | 0.2% |
| Total | 3,231 | 100.0% |
Housing Structures by Occupancy in Booneville
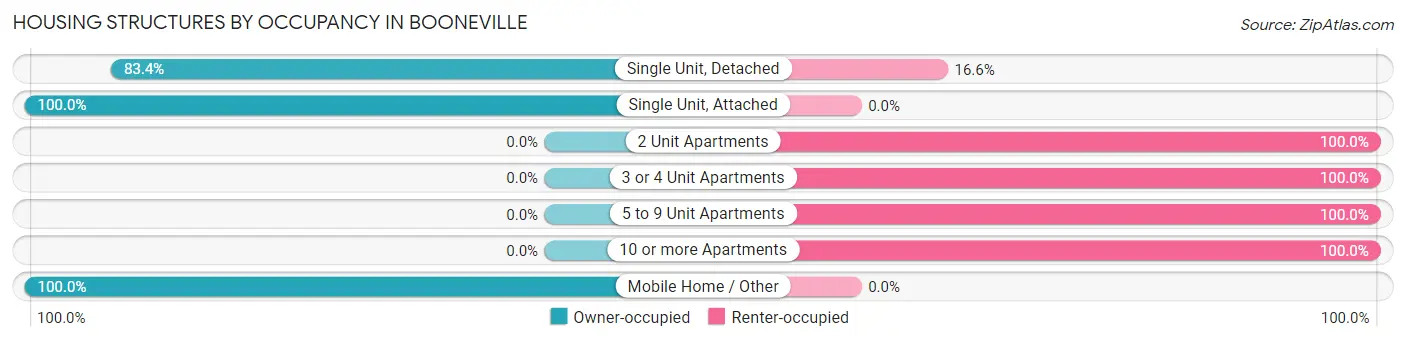
| Structure Type | Owner-occupied | Renter-occupied |
| Single Unit, Detached | 2,216 (83.4%) | 442 (16.6%) |
| Single Unit, Attached | 13 (100.0%) | 0 (0.0%) |
| 2 Unit Apartments | 0 (0.0%) | 93 (100.0%) |
| 3 or 4 Unit Apartments | 0 (0.0%) | 271 (100.0%) |
| 5 to 9 Unit Apartments | 0 (0.0%) | 29 (100.0%) |
| 10 or more Apartments | 0 (0.0%) | 160 (100.0%) |
| Mobile Home / Other | 7 (100.0%) | 0 (0.0%) |
| Total | 2,236 (69.2%) | 995 (30.8%) |
Housing Structures by Number of Rooms in Booneville
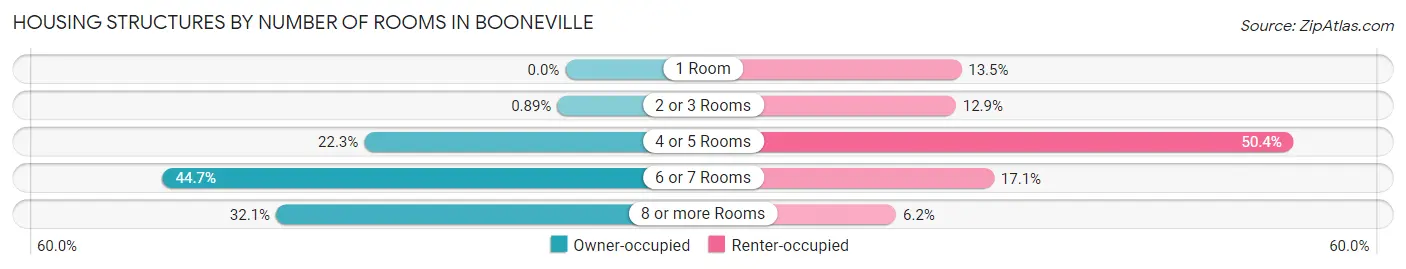
| Number of Rooms | Owner-occupied | Renter-occupied |
| 1 Room | 0 (0.0%) | 134 (13.5%) |
| 2 or 3 Rooms | 20 (0.9%) | 128 (12.9%) |
| 4 or 5 Rooms | 499 (22.3%) | 501 (50.3%) |
| 6 or 7 Rooms | 999 (44.7%) | 170 (17.1%) |
| 8 or more Rooms | 718 (32.1%) | 62 (6.2%) |
| Total | 2,236 (100.0%) | 995 (100.0%) |
Housing Structure by Heating Type in Booneville
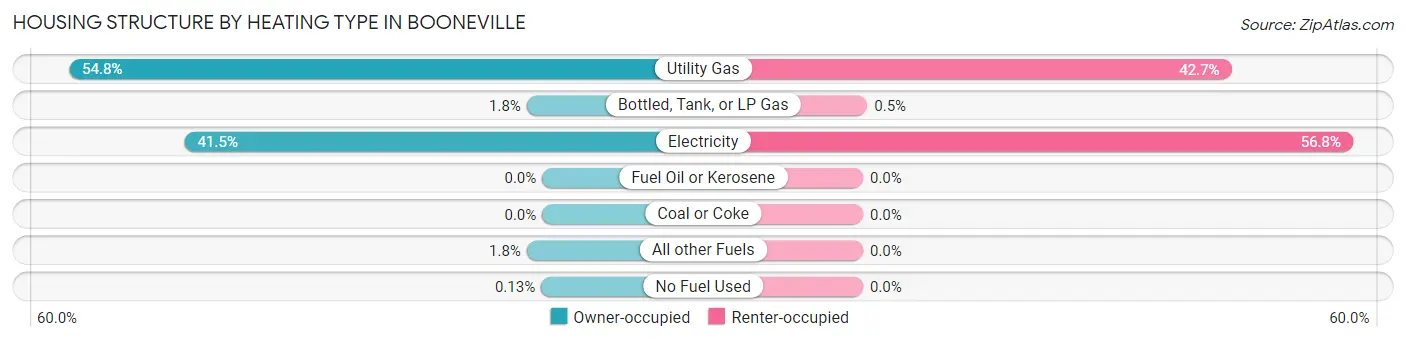
| Heating Type | Owner-occupied | Renter-occupied |
| Utility Gas | 1,226 (54.8%) | 425 (42.7%) |
| Bottled, Tank, or LP Gas | 40 (1.8%) | 5 (0.5%) |
| Electricity | 927 (41.5%) | 565 (56.8%) |
| Fuel Oil or Kerosene | 0 (0.0%) | 0 (0.0%) |
| Coal or Coke | 0 (0.0%) | 0 (0.0%) |
| All other Fuels | 40 (1.8%) | 0 (0.0%) |
| No Fuel Used | 3 (0.1%) | 0 (0.0%) |
| Total | 2,236 (100.0%) | 995 (100.0%) |
Household Vehicle Usage in Booneville
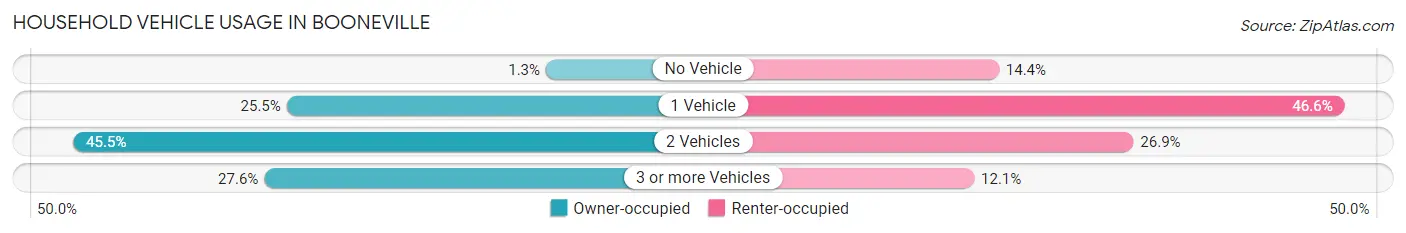
| Vehicles per Household | Owner-occupied | Renter-occupied |
| No Vehicle | 30 (1.3%) | 143 (14.4%) |
| 1 Vehicle | 571 (25.5%) | 464 (46.6%) |
| 2 Vehicles | 1,017 (45.5%) | 268 (26.9%) |
| 3 or more Vehicles | 618 (27.6%) | 120 (12.1%) |
| Total | 2,236 (100.0%) | 995 (100.0%) |
Real Estate & Mortgages in Booneville
Real Estate and Mortgage Overview in Booneville
| Characteristic | Without Mortgage | With Mortgage |
| Housing Units | 922 | 1,314 |
| Median Property Value | $151,500 | $119,400 |
| Median Household Income | $44,534 | $155 |
| Monthly Housing Costs | $429 | $102 |
| Real Estate Taxes | $1,343 | $232 |
Property Value by Mortgage Status in Booneville
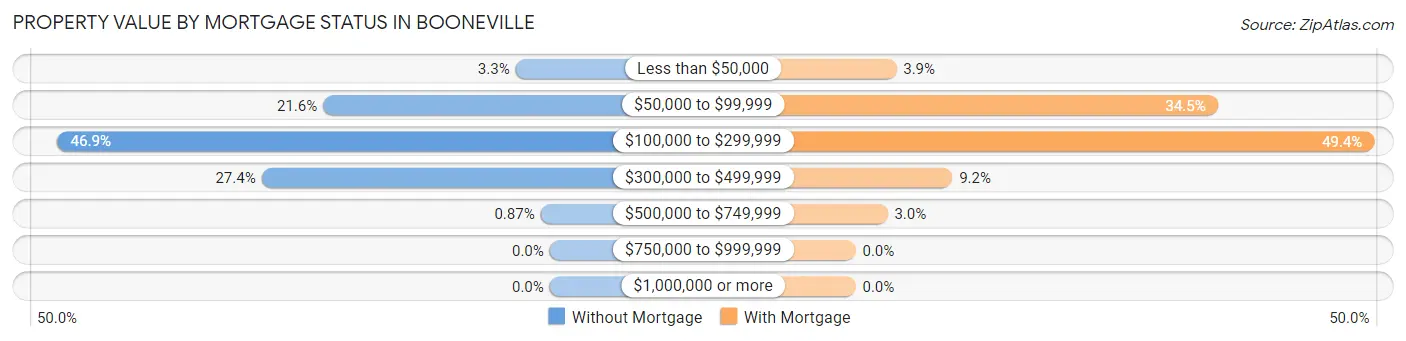
| Property Value | Without Mortgage | With Mortgage |
| Less than $50,000 | 30 (3.3%) | 51 (3.9%) |
| $50,000 to $99,999 | 199 (21.6%) | 453 (34.5%) |
| $100,000 to $299,999 | 432 (46.9%) | 649 (49.4%) |
| $300,000 to $499,999 | 253 (27.4%) | 121 (9.2%) |
| $500,000 to $749,999 | 8 (0.9%) | 40 (3.0%) |
| $750,000 to $999,999 | 0 (0.0%) | 0 (0.0%) |
| $1,000,000 or more | 0 (0.0%) | 0 (0.0%) |
| Total | 922 (100.0%) | 1,314 (100.0%) |
Household Income by Mortgage Status in Booneville
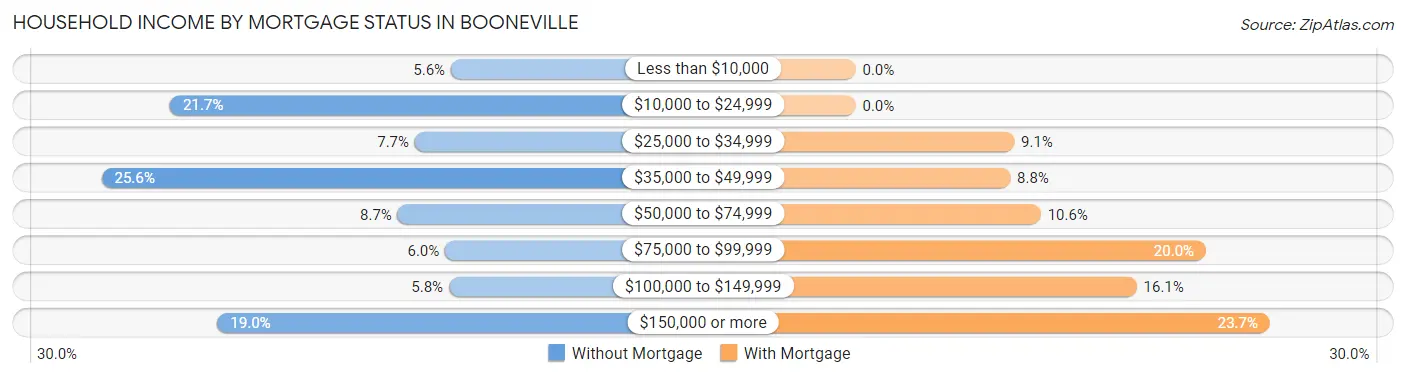
| Household Income | Without Mortgage | With Mortgage |
| Less than $10,000 | 52 (5.6%) | 0 (0.0%) |
| $10,000 to $24,999 | 200 (21.7%) | 0 (0.0%) |
| $25,000 to $34,999 | 71 (7.7%) | 119 (9.1%) |
| $35,000 to $49,999 | 236 (25.6%) | 116 (8.8%) |
| $50,000 to $74,999 | 80 (8.7%) | 139 (10.6%) |
| $75,000 to $99,999 | 55 (6.0%) | 263 (20.0%) |
| $100,000 to $149,999 | 53 (5.8%) | 211 (16.1%) |
| $150,000 or more | 175 (19.0%) | 311 (23.7%) |
| Total | 922 (100.0%) | 1,314 (100.0%) |
Property Value to Household Income Ratio in Booneville
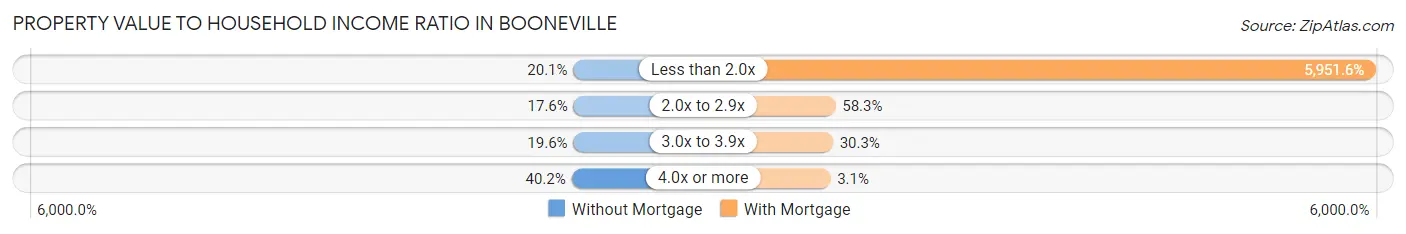
| Value-to-Income Ratio | Without Mortgage | With Mortgage |
| Less than 2.0x | 185 (20.1%) | 78,204 (5,951.6%) |
| 2.0x to 2.9x | 162 (17.6%) | 766 (58.3%) |
| 3.0x to 3.9x | 181 (19.6%) | 398 (30.3%) |
| 4.0x or more | 371 (40.2%) | 41 (3.1%) |
| Total | 922 (100.0%) | 1,314 (100.0%) |
Real Estate Taxes by Mortgage Status in Booneville
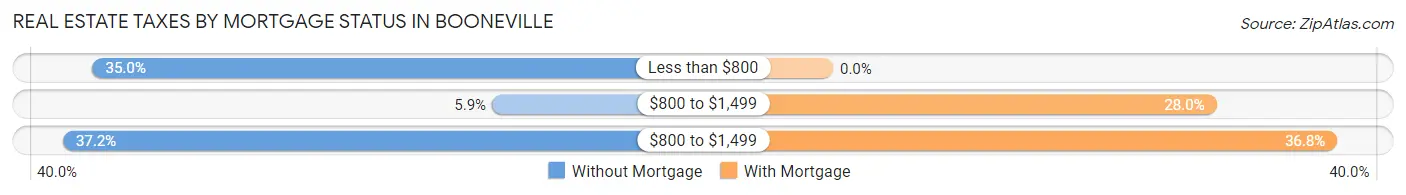
| Property Taxes | Without Mortgage | With Mortgage |
| Less than $800 | 323 (35.0%) | 0 (0.0%) |
| $800 to $1,499 | 54 (5.9%) | 368 (28.0%) |
| $800 to $1,499 | 343 (37.2%) | 484 (36.8%) |
| Total | 922 (100.0%) | 1,314 (100.0%) |
Health & Disability in Booneville
Health Insurance Coverage by Age in Booneville
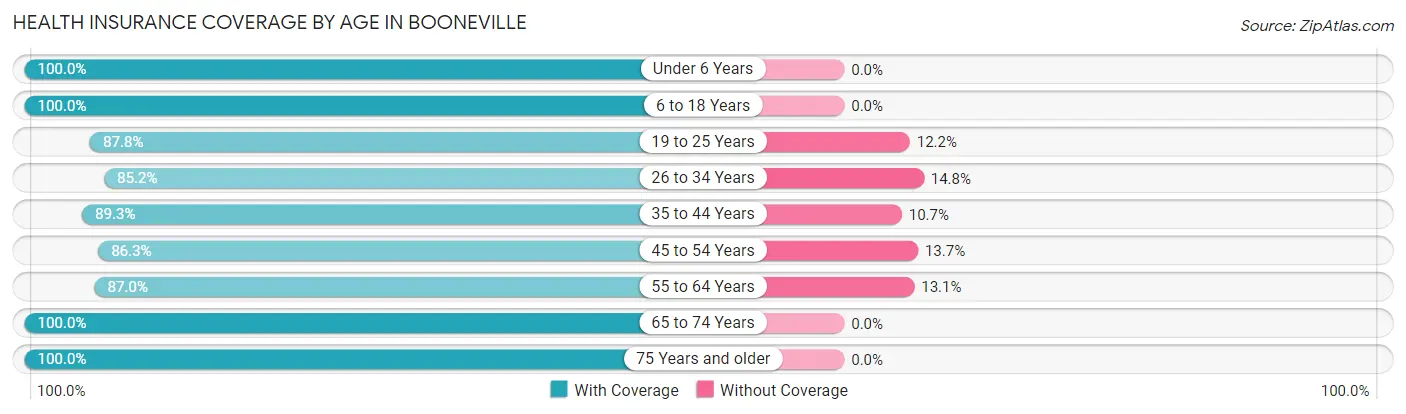
| Age Bracket | With Coverage | Without Coverage |
| Under 6 Years | 741 (100.0%) | 0 (0.0%) |
| 6 to 18 Years | 1,519 (100.0%) | 0 (0.0%) |
| 19 to 25 Years | 1,122 (87.8%) | 156 (12.2%) |
| 26 to 34 Years | 822 (85.2%) | 143 (14.8%) |
| 35 to 44 Years | 1,041 (89.3%) | 125 (10.7%) |
| 45 to 54 Years | 590 (86.3%) | 94 (13.7%) |
| 55 to 64 Years | 786 (87.0%) | 118 (13.1%) |
| 65 to 74 Years | 845 (100.0%) | 0 (0.0%) |
| 75 Years and older | 634 (100.0%) | 0 (0.0%) |
| Total | 8,100 (92.7%) | 636 (7.3%) |
Health Insurance Coverage by Citizenship Status in Booneville
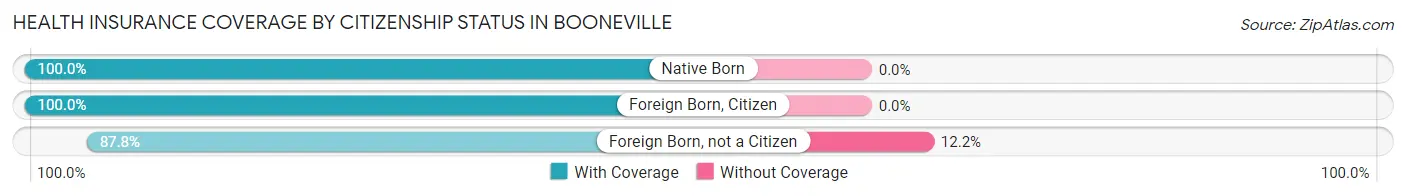
| Citizenship Status | With Coverage | Without Coverage |
| Native Born | 741 (100.0%) | 0 (0.0%) |
| Foreign Born, Citizen | 1,519 (100.0%) | 0 (0.0%) |
| Foreign Born, not a Citizen | 1,122 (87.8%) | 156 (12.2%) |
Health Insurance Coverage by Household Income in Booneville
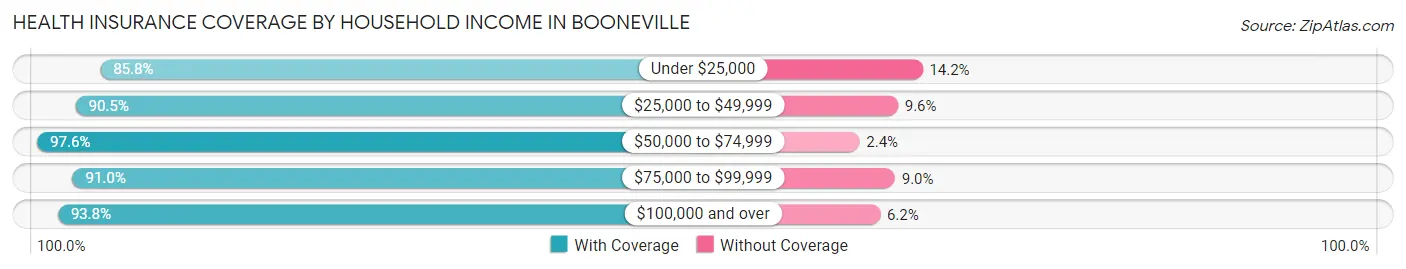
| Household Income | With Coverage | Without Coverage |
| Under $25,000 | 969 (85.8%) | 160 (14.2%) |
| $25,000 to $49,999 | 1,439 (90.4%) | 152 (9.6%) |
| $50,000 to $74,999 | 1,573 (97.6%) | 38 (2.4%) |
| $75,000 to $99,999 | 911 (91.0%) | 90 (9.0%) |
| $100,000 and over | 2,325 (93.8%) | 154 (6.2%) |
Public vs Private Health Insurance Coverage by Age in Booneville
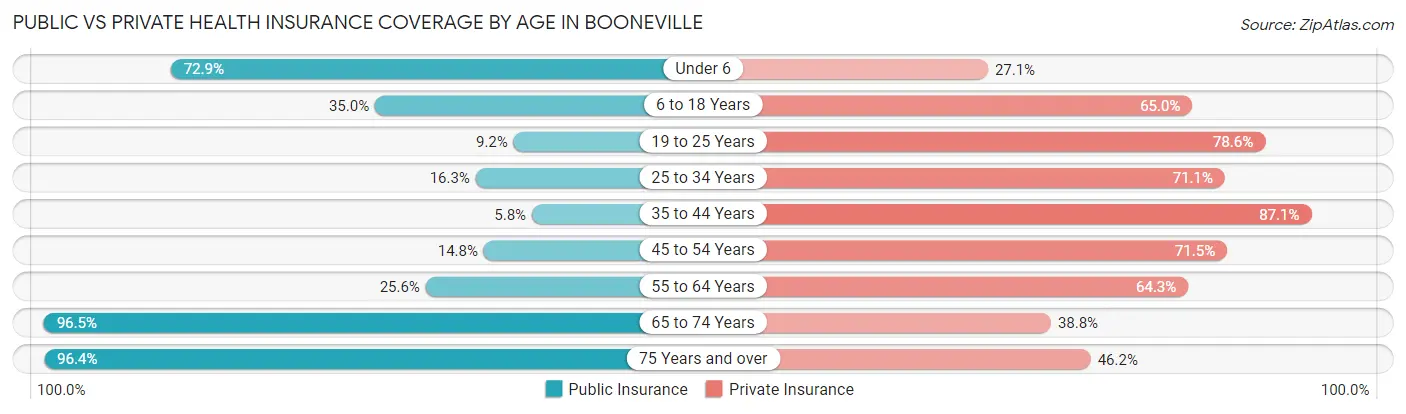
| Age Bracket | Public Insurance | Private Insurance |
| Under 6 | 540 (72.9%) | 201 (27.1%) |
| 6 to 18 Years | 531 (35.0%) | 988 (65.0%) |
| 19 to 25 Years | 118 (9.2%) | 1,004 (78.6%) |
| 25 to 34 Years | 157 (16.3%) | 686 (71.1%) |
| 35 to 44 Years | 68 (5.8%) | 1,016 (87.1%) |
| 45 to 54 Years | 101 (14.8%) | 489 (71.5%) |
| 55 to 64 Years | 231 (25.6%) | 581 (64.3%) |
| 65 to 74 Years | 815 (96.5%) | 328 (38.8%) |
| 75 Years and over | 611 (96.4%) | 293 (46.2%) |
| Total | 3,172 (36.3%) | 5,586 (63.9%) |
Disability Status by Sex by Age in Booneville
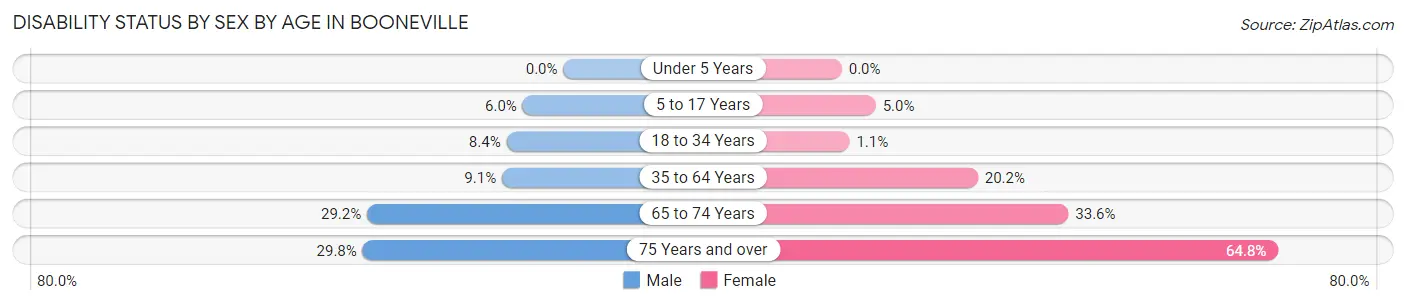
| Age Bracket | Male | Female |
| Under 5 Years | 0 (0.0%) | 0 (0.0%) |
| 5 to 17 Years | 48 (6.0%) | 29 (5.0%) |
| 18 to 34 Years | 102 (8.4%) | 15 (1.1%) |
| 35 to 64 Years | 126 (9.1%) | 277 (20.2%) |
| 65 to 74 Years | 86 (29.1%) | 185 (33.6%) |
| 75 Years and over | 62 (29.8%) | 276 (64.8%) |
Disability Class by Sex by Age in Booneville
Disability Class: Hearing Difficulty
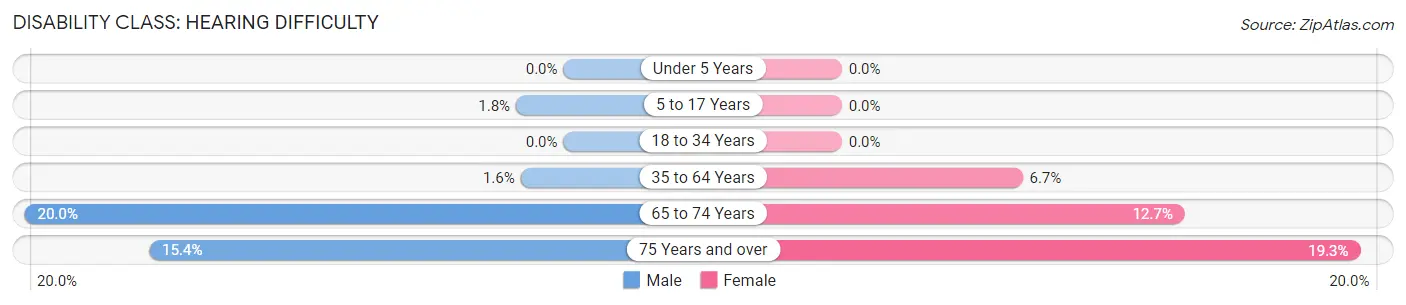
| Age Bracket | Male | Female |
| Under 5 Years | 0 (0.0%) | 0 (0.0%) |
| 5 to 17 Years | 14 (1.8%) | 0 (0.0%) |
| 18 to 34 Years | 0 (0.0%) | 0 (0.0%) |
| 35 to 64 Years | 22 (1.6%) | 92 (6.7%) |
| 65 to 74 Years | 59 (20.0%) | 70 (12.7%) |
| 75 Years and over | 32 (15.4%) | 82 (19.3%) |
Disability Class: Vision Difficulty

| Age Bracket | Male | Female |
| Under 5 Years | 0 (0.0%) | 0 (0.0%) |
| 5 to 17 Years | 0 (0.0%) | 0 (0.0%) |
| 18 to 34 Years | 16 (1.3%) | 0 (0.0%) |
| 35 to 64 Years | 53 (3.8%) | 100 (7.3%) |
| 65 to 74 Years | 18 (6.1%) | 115 (20.9%) |
| 75 Years and over | 0 (0.0%) | 64 (15.0%) |
Disability Class: Cognitive Difficulty
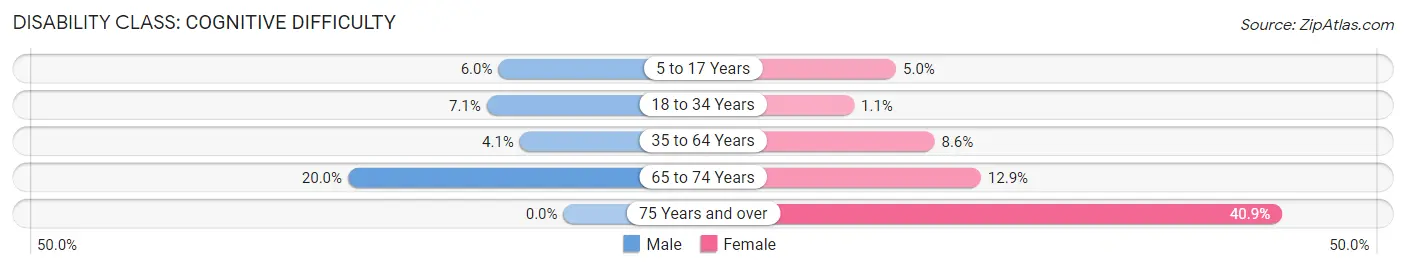
| Age Bracket | Male | Female |
| 5 to 17 Years | 48 (6.0%) | 29 (5.0%) |
| 18 to 34 Years | 86 (7.1%) | 15 (1.1%) |
| 35 to 64 Years | 56 (4.1%) | 118 (8.6%) |
| 65 to 74 Years | 59 (20.0%) | 71 (12.9%) |
| 75 Years and over | 0 (0.0%) | 174 (40.8%) |
Disability Class: Ambulatory Difficulty
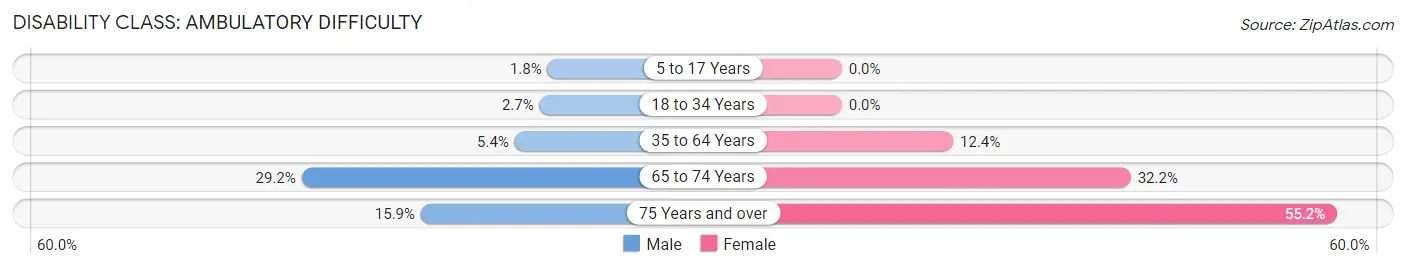
| Age Bracket | Male | Female |
| 5 to 17 Years | 14 (1.8%) | 0 (0.0%) |
| 18 to 34 Years | 32 (2.6%) | 0 (0.0%) |
| 35 to 64 Years | 75 (5.4%) | 170 (12.4%) |
| 65 to 74 Years | 86 (29.1%) | 177 (32.2%) |
| 75 Years and over | 33 (15.9%) | 235 (55.2%) |
Disability Class: Self-Care Difficulty
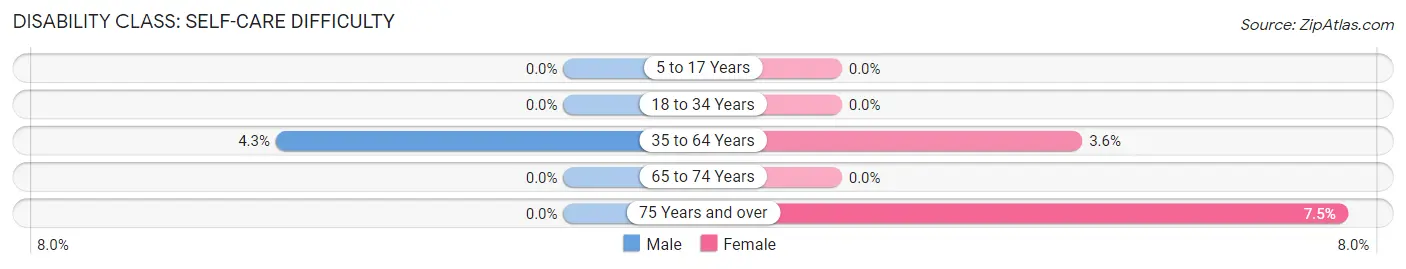
| Age Bracket | Male | Female |
| 5 to 17 Years | 0 (0.0%) | 0 (0.0%) |
| 18 to 34 Years | 0 (0.0%) | 0 (0.0%) |
| 35 to 64 Years | 59 (4.3%) | 49 (3.6%) |
| 65 to 74 Years | 0 (0.0%) | 0 (0.0%) |
| 75 Years and over | 0 (0.0%) | 32 (7.5%) |
Technology Access in Booneville
Computing Device Access in Booneville
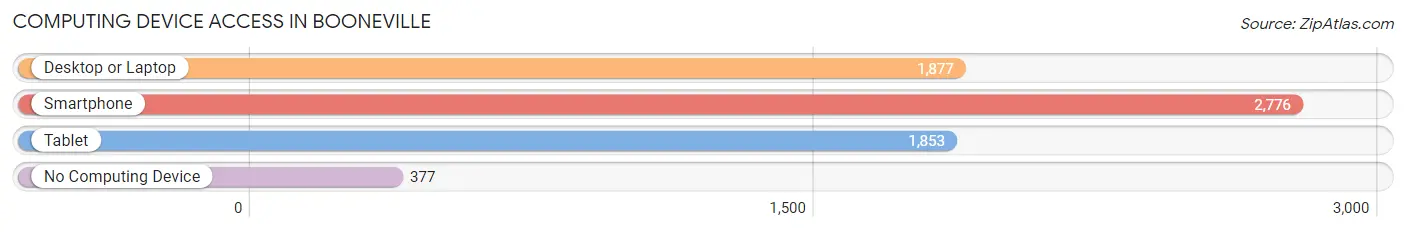
| Device Type | # Households | % Households |
| Desktop or Laptop | 1,877 | 58.1% |
| Smartphone | 2,776 | 85.9% |
| Tablet | 1,853 | 57.4% |
| No Computing Device | 377 | 11.7% |
| Total | 3,231 | 100.0% |
Internet Access in Booneville
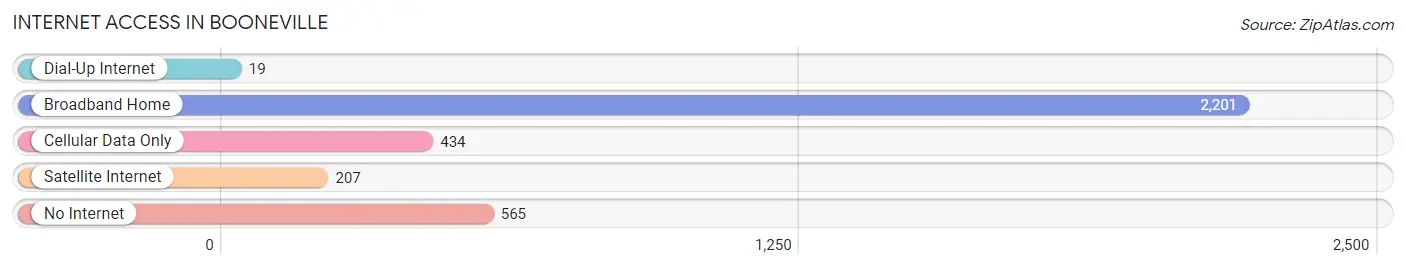
| Internet Type | # Households | % Households |
| Dial-Up Internet | 19 | 0.6% |
| Broadband Home | 2,201 | 68.1% |
| Cellular Data Only | 434 | 13.4% |
| Satellite Internet | 207 | 6.4% |
| No Internet | 565 | 17.5% |
| Total | 3,231 | 100.0% |
Booneville Summary
Booneville, Mississippi is a small city located in the northern part of the state, in Prentiss County. It is situated in the foothills of the Appalachian Mountains, and is part of the Tupelo Micropolitan Statistical Area. The city has a population of approximately 8,000 people, and is the county seat of Prentiss County.
History
Booneville was founded in 1837 by William H. Boone, a settler from North Carolina. The city was named after Boone, and was originally known as Booneville Station. The city was incorporated in 1854, and was the first county seat of Prentiss County.
During the Civil War, Booneville was the site of a major battle between Union and Confederate forces. The Battle of Booneville was fought on July 1, 1862, and resulted in a Confederate victory.
Geography
Booneville is located in the northern part of Mississippi, in Prentiss County. It is situated in the foothills of the Appalachian Mountains, and is part of the Tupelo Micropolitan Statistical Area. The city has a total area of 8.2 square miles, all of which is land.
The city is located near the Natchez Trace Parkway, a scenic byway that runs through the state. The city is also located near the Tennessee-Tombigbee Waterway, a navigable waterway that connects the Tennessee and Tombigbee rivers.
Economy
Booneville’s economy is largely based on agriculture and manufacturing. The city is home to several large manufacturing plants, including a Tyson Foods plant and a Whirlpool Corporation plant. The city is also home to several small businesses, including restaurants, retail stores, and service providers.
The city is also home to several educational institutions, including Northeast Mississippi Community College and the University of Mississippi Medical Center.
Demographics
As of the 2010 census, Booneville had a population of 8,039 people. The racial makeup of the city was 79.2% White, 17.7% African American, 0.3% Native American, 0.4% Asian, 0.1% Pacific Islander, 0.7% from other races, and 1.5% from two or more races. Hispanic or Latino of any race were 2.2% of the population.
The median income for a household in the city was $30,938, and the median income for a family was $37,917. The per capita income for the city was $15,945. About 17.2% of families and 20.3% of the population were below the poverty line, including 28.2% of those under age 18 and 16.2% of those age 65 or over.
Common Questions
What is Per Capita Income in Booneville?
Per Capita income in Booneville is $29,407.
What is the Median Family Income in Booneville?
Median Family Income in Booneville is $70,260.
What is the Median Household income in Booneville?
Median Household Income in Booneville is $48,655.
What is Income or Wage Gap in Booneville?
Income or Wage Gap in Booneville is 1.5%.
Women in Booneville earn 98.5 cents for every dollar earned by a man.
What is Inequality or Gini Index in Booneville?
Inequality or Gini Index in Booneville is 0.51.
What is the Total Population of Booneville?
Total Population of Booneville is 9,027.
What is the Total Male Population of Booneville?
Total Male Population of Booneville is 4,352.
What is the Total Female Population of Booneville?
Total Female Population of Booneville is 4,675.
What is the Ratio of Males per 100 Females in Booneville?
There are 93.09 Males per 100 Females in Booneville.
What is the Ratio of Females per 100 Males in Booneville?
There are 107.42 Females per 100 Males in Booneville.
What is the Median Population Age in Booneville?
Median Population Age in Booneville is 34.5 Years.
What is the Average Family Size in Booneville
Average Family Size in Booneville is 3.1 People.
What is the Average Household Size in Booneville
Average Household Size in Booneville is 2.4 People.
How Large is the Labor Force in Booneville?
There are 3,621 People in the Labor Forcein in Booneville.
What is the Percentage of People in the Labor Force in Booneville?
49.8% of People are in the Labor Force in Booneville.
What is the Unemployment Rate in Booneville?
Unemployment Rate in Booneville is 4.6%.