Decatur, MS Map & Demographics
Decatur Map
Decatur Overview
$17,700
PER CAPITA INCOME
$48,472
AVG FAMILY INCOME
$44,321
AVG HOUSEHOLD INCOME
41.4%
WAGE / INCOME GAP [ % ]
58.6¢/ $1
WAGE / INCOME GAP [ $ ]
0.49
INEQUALITY / GINI INDEX
2,325
TOTAL POPULATION
1,080
MALE POPULATION
1,245
FEMALE POPULATION
86.75
MALES / 100 FEMALES
115.28
FEMALES / 100 MALES
21.9
MEDIAN AGE
3.7
AVG FAMILY SIZE
2.7
AVG HOUSEHOLD SIZE
720
LABOR FORCE [ PEOPLE ]
39.0%
PERCENT IN LABOR FORCE
10.8%
UNEMPLOYMENT RATE
Decatur Zip Codes
Decatur Area Codes
Income in Decatur
Income Overview in Decatur
Per Capita Income in Decatur is $17,700, while median incomes of families and households are $48,472 and $44,321 respectively.
| Characteristic | Number | Measure |
| Per Capita Income | 2,325 | $17,700 |
| Median Family Income | 355 | $48,472 |
| Mean Family Income | 355 | $63,047 |
| Median Household Income | 615 | $44,321 |
| Mean Household Income | 615 | $54,962 |
| Income Deficit | 355 | $0 |
| Wage / Income Gap (%) | 2,325 | 41.37% |
| Wage / Income Gap ($) | 2,325 | 58.63¢ per $1 |
| Gini / Inequality Index | 2,325 | 0.49 |
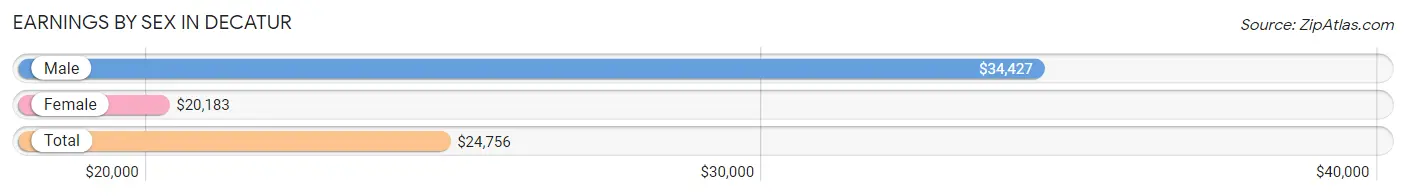
Earnings by Sex in Decatur
Average Earnings in Decatur are $24,756, $34,427 for men and $20,183 for women, a difference of 41.4%.
| Sex | Number | Average Earnings |
| Male | 390 (46.1%) | $34,427 |
| Female | 456 (53.9%) | $20,183 |
| Total | 846 (100.0%) | $24,756 |
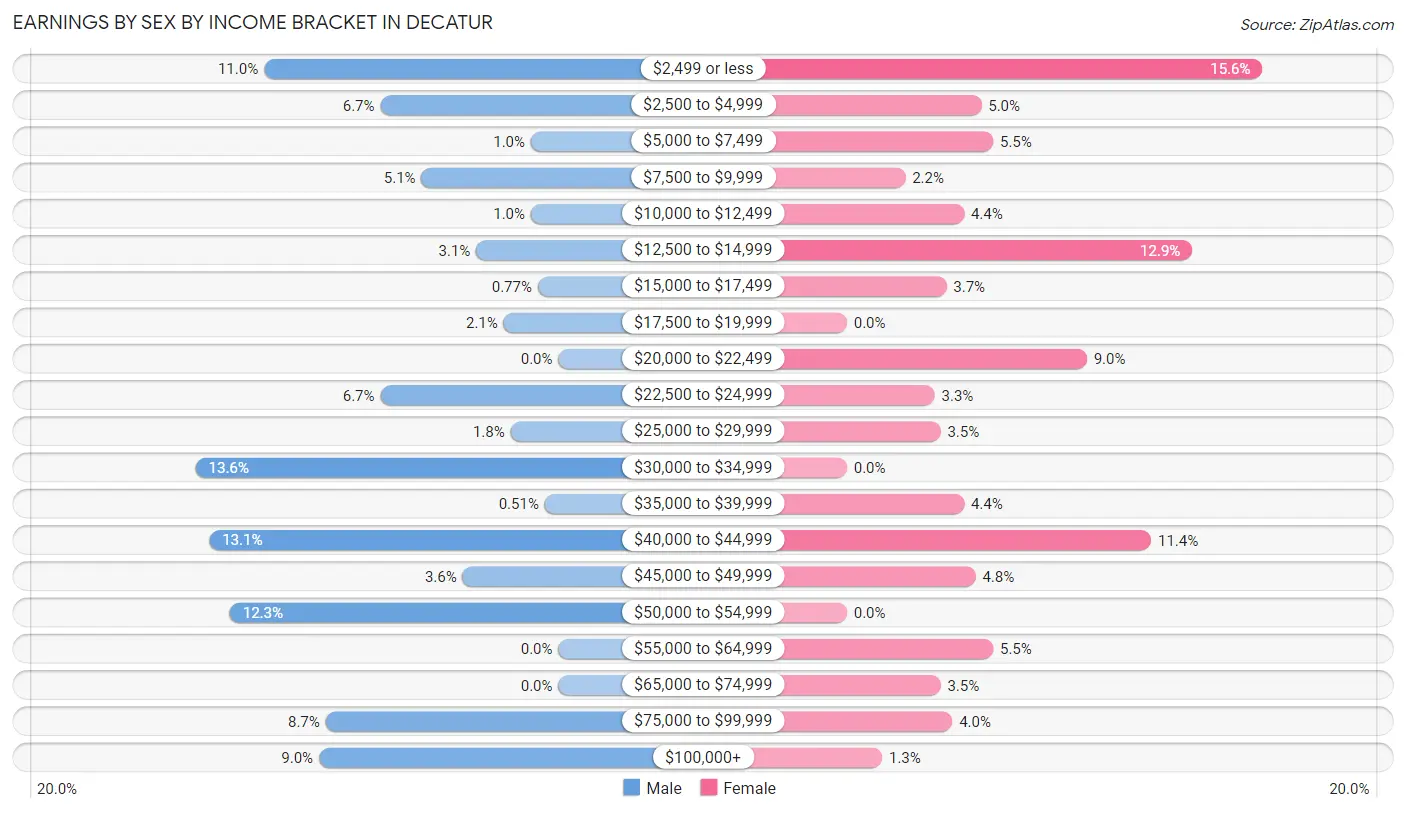
Earnings by Sex by Income Bracket in Decatur
The most common earnings brackets in Decatur are $30,000 to $34,999 for men (53 | 13.6%) and $2,499 or less for women (71 | 15.6%).
| Income | Male | Female |
| $2,499 or less | 43 (11.0%) | 71 (15.6%) |
| $2,500 to $4,999 | 26 (6.7%) | 23 (5.0%) |
| $5,000 to $7,499 | 4 (1.0%) | 25 (5.5%) |
| $7,500 to $9,999 | 20 (5.1%) | 10 (2.2%) |
| $10,000 to $12,499 | 4 (1.0%) | 20 (4.4%) |
| $12,500 to $14,999 | 12 (3.1%) | 59 (12.9%) |
| $15,000 to $17,499 | 3 (0.8%) | 17 (3.7%) |
| $17,500 to $19,999 | 8 (2.1%) | 0 (0.0%) |
| $20,000 to $22,499 | 0 (0.0%) | 41 (9.0%) |
| $22,500 to $24,999 | 26 (6.7%) | 15 (3.3%) |
| $25,000 to $29,999 | 7 (1.8%) | 16 (3.5%) |
| $30,000 to $34,999 | 53 (13.6%) | 0 (0.0%) |
| $35,000 to $39,999 | 2 (0.5%) | 20 (4.4%) |
| $40,000 to $44,999 | 51 (13.1%) | 52 (11.4%) |
| $45,000 to $49,999 | 14 (3.6%) | 22 (4.8%) |
| $50,000 to $54,999 | 48 (12.3%) | 0 (0.0%) |
| $55,000 to $64,999 | 0 (0.0%) | 25 (5.5%) |
| $65,000 to $74,999 | 0 (0.0%) | 16 (3.5%) |
| $75,000 to $99,999 | 34 (8.7%) | 18 (4.0%) |
| $100,000+ | 35 (9.0%) | 6 (1.3%) |
| Total | 390 (100.0%) | 456 (100.0%) |
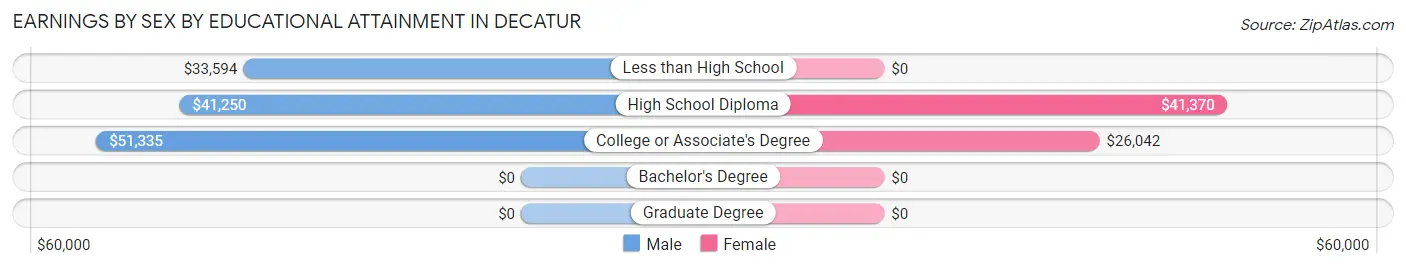
Earnings by Sex by Educational Attainment in Decatur
Average earnings in Decatur are $43,077 for men and $40,120 for women, a difference of 6.9%. Men with an educational attainment of college or associate's degree enjoy the highest average annual earnings of $51,335, while those with less than high school education earn the least with $33,594. Women with an educational attainment of high school diploma earn the most with the average annual earnings of $41,370, while those with college or associate's degree education have the smallest earnings of $26,042.
| Educational Attainment | Male Income | Female Income |
| Less than High School | $33,594 | $0 |
| High School Diploma | $41,250 | $41,370 |
| College or Associate's Degree | $51,335 | $26,042 |
| Bachelor's Degree | - | - |
| Graduate Degree | - | - |
| Total | $43,077 | $40,120 |
Family Income in Decatur
Family Income Brackets in Decatur
According to the Decatur family income data, there are 71 families falling into the $50,000 to $74,999 income range, which is the most common income bracket and makes up 20.0% of all families. Conversely, the $150,000 to $199,999 income bracket is the least frequent group with only 14 families (3.9%) belonging to this category.
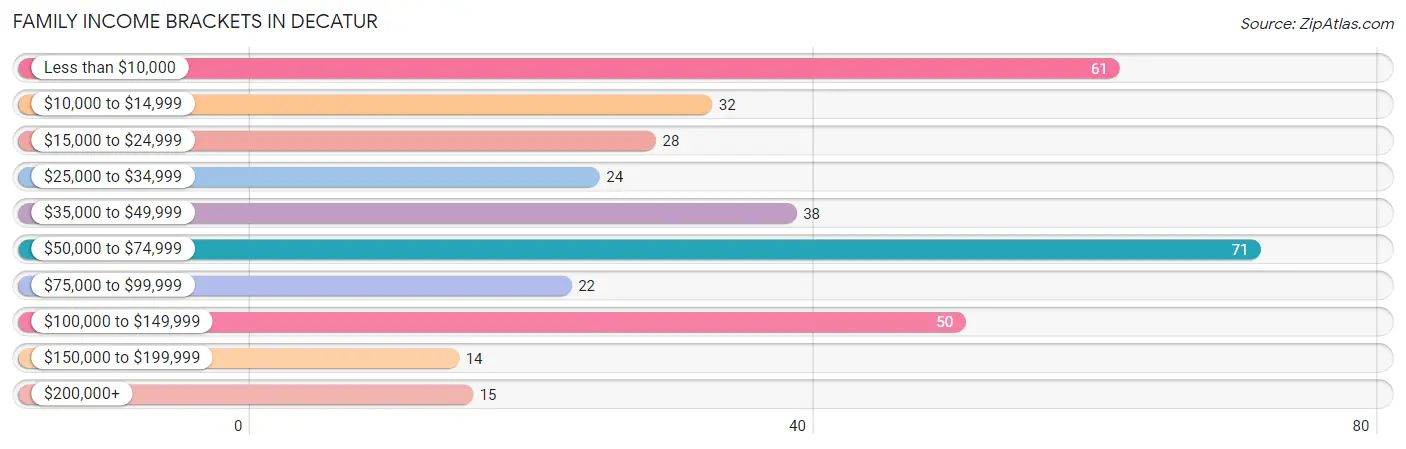
| Income Bracket | # Families | % Families |
| Less than $10,000 | 61 | 17.2% |
| $10,000 to $14,999 | 32 | 9.0% |
| $15,000 to $24,999 | 28 | 7.9% |
| $25,000 to $34,999 | 24 | 6.8% |
| $35,000 to $49,999 | 38 | 10.7% |
| $50,000 to $74,999 | 71 | 20.0% |
| $75,000 to $99,999 | 22 | 6.2% |
| $100,000 to $149,999 | 50 | 14.1% |
| $150,000 to $199,999 | 14 | 3.9% |
| $200,000+ | 15 | 4.2% |
Family Income by Famaliy Size in Decatur
2-person families (220 | 62.0%) account for the highest median family income in Decatur with $44,211 per family, while 2-person families (220 | 62.0%) have the highest median income of $22,106 per family member.
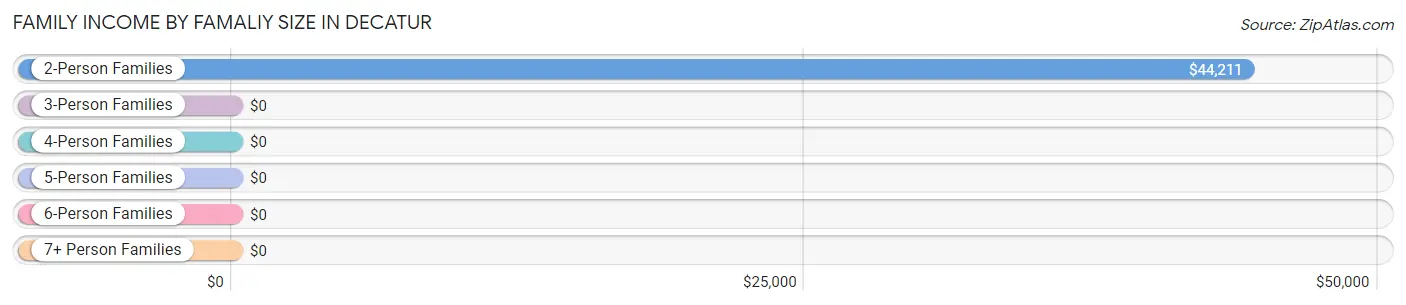
| Income Bracket | # Families | Median Income |
| 2-Person Families | 220 (62.0%) | $44,211 |
| 3-Person Families | 26 (7.3%) | $0 |
| 4-Person Families | 72 (20.3%) | $0 |
| 5-Person Families | 31 (8.7%) | $0 |
| 6-Person Families | 6 (1.7%) | $0 |
| 7+ Person Families | 0 (0.0%) | $0 |
| Total | 355 (100.0%) | $48,472 |
Family Income by Number of Earners in Decatur
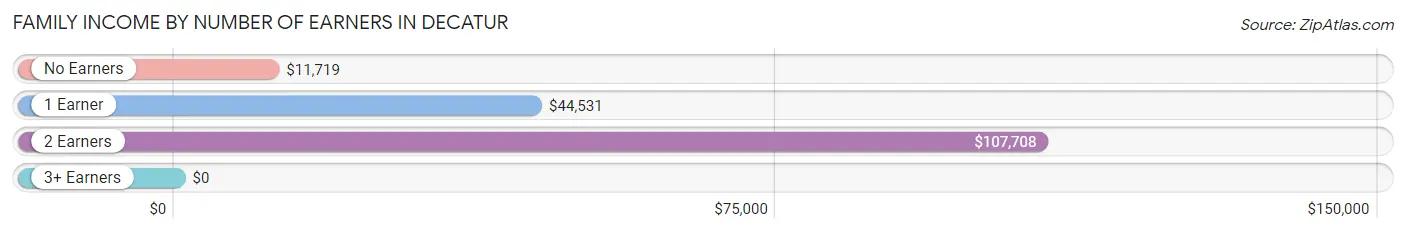
| Number of Earners | # Families | Median Income |
| No Earners | 102 (28.7%) | $11,719 |
| 1 Earner | 161 (45.4%) | $44,531 |
| 2 Earners | 82 (23.1%) | $107,708 |
| 3+ Earners | 10 (2.8%) | $0 |
| Total | 355 (100.0%) | $48,472 |
Household Income in Decatur
Household Income Brackets in Decatur
With 117 households falling in the category, the $35,000 to $49,999 income range is the most frequent in Decatur, accounting for 19.0% of all households. In contrast, only 14 households (2.3%) fall into the $150,000 to $199,999 income bracket, making it the least populous group.
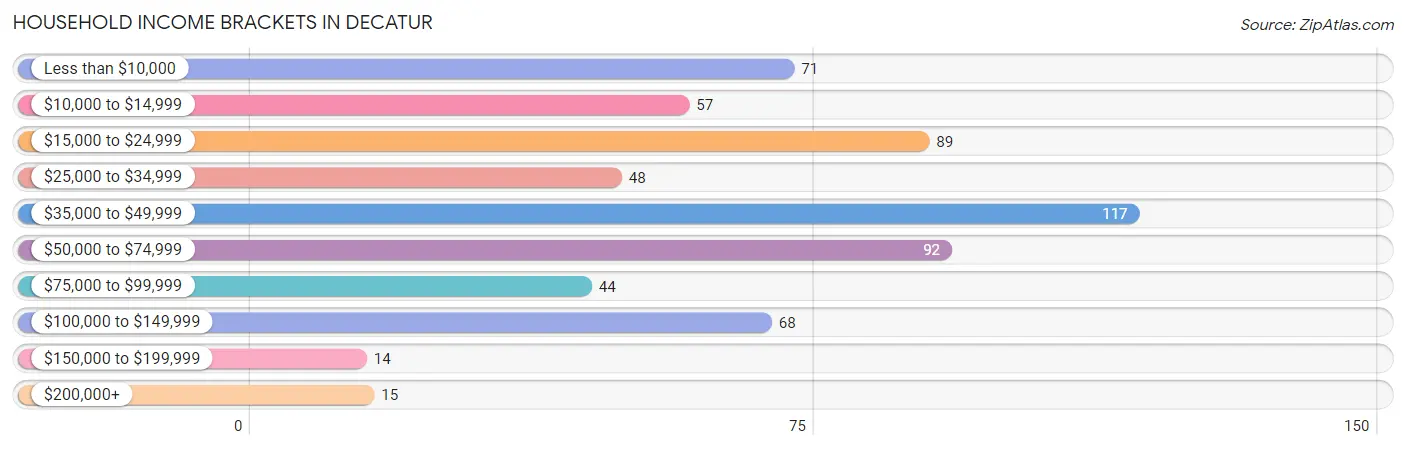
| Income Bracket | # Households | % Households |
| Less than $10,000 | 71 | 11.5% |
| $10,000 to $14,999 | 57 | 9.3% |
| $15,000 to $24,999 | 89 | 14.5% |
| $25,000 to $34,999 | 48 | 7.8% |
| $35,000 to $49,999 | 117 | 19.0% |
| $50,000 to $74,999 | 92 | 15.0% |
| $75,000 to $99,999 | 44 | 7.2% |
| $100,000 to $149,999 | 68 | 11.1% |
| $150,000 to $199,999 | 14 | 2.3% |
| $200,000+ | 15 | 2.4% |
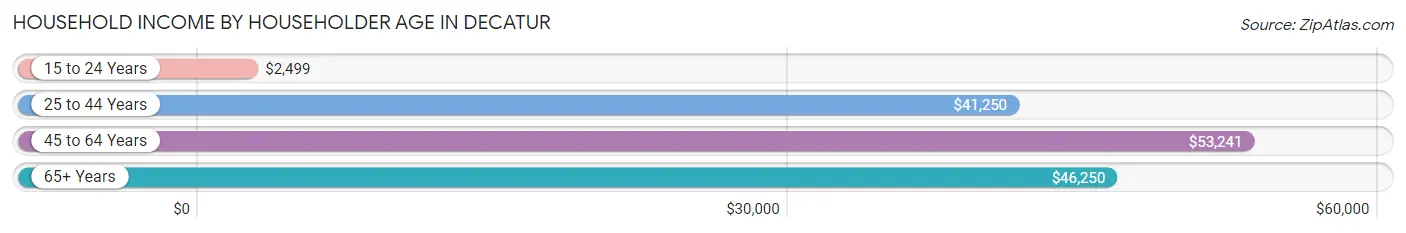
Household Income by Householder Age in Decatur
The median household income in Decatur is $44,321, with the highest median household income of $53,241 found in the 45 to 64 years age bracket for the primary householder. A total of 224 households (36.4%) fall into this category. Meanwhile, the 15 to 24 years age bracket for the primary householder has the lowest median household income of $2,499, with 51 households (8.3%) in this group.
| Income Bracket | # Households | Median Income |
| 15 to 24 Years | 51 (8.3%) | $2,499 |
| 25 to 44 Years | 152 (24.7%) | $41,250 |
| 45 to 64 Years | 224 (36.4%) | $53,241 |
| 65+ Years | 188 (30.6%) | $46,250 |
| Total | 615 (100.0%) | $44,321 |
Poverty in Decatur
Income Below Poverty by Sex and Age in Decatur
With 38.0% poverty level for males and 36.8% for females among the residents of Decatur, 5 year old males and 5 year old females are the most vulnerable to poverty, with 35 males (100.0%) and 11 females (100.0%) in their respective age groups living below the poverty level.
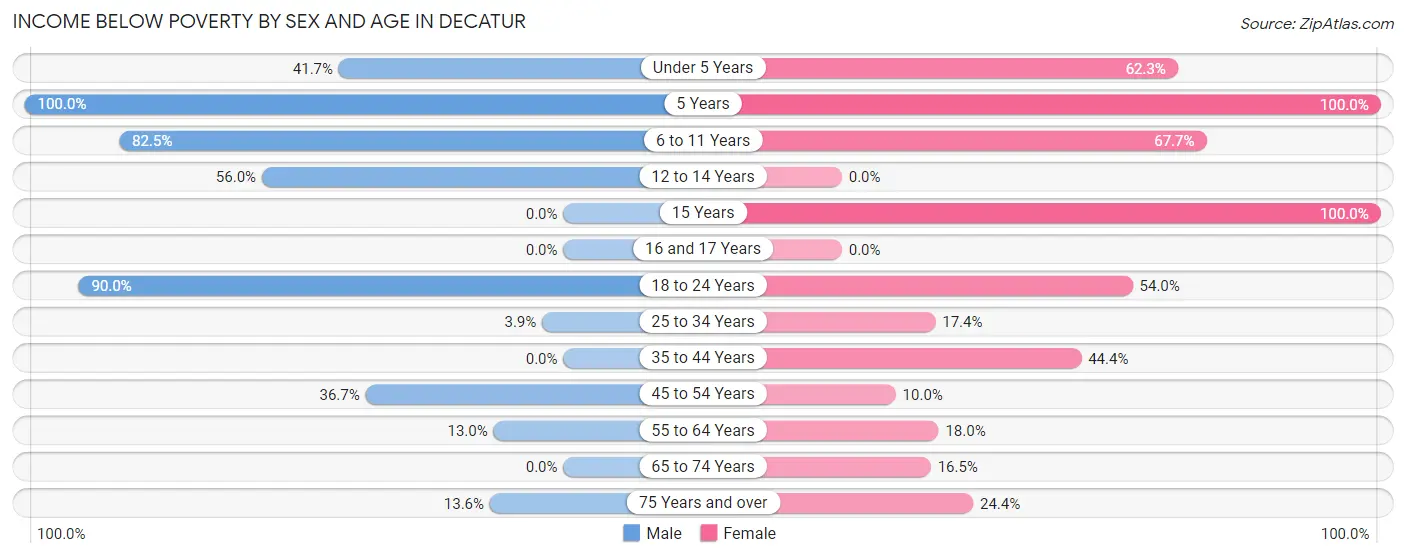
| Age Bracket | Male | Female |
| Under 5 Years | 15 (41.7%) | 48 (62.3%) |
| 5 Years | 35 (100.0%) | 11 (100.0%) |
| 6 to 11 Years | 47 (82.5%) | 92 (67.6%) |
| 12 to 14 Years | 47 (55.9%) | 0 (0.0%) |
| 15 Years | 0 (0.0%) | 21 (100.0%) |
| 16 and 17 Years | 0 (0.0%) | 0 (0.0%) |
| 18 to 24 Years | 54 (90.0%) | 61 (54.0%) |
| 25 to 34 Years | 5 (3.9%) | 25 (17.4%) |
| 35 to 44 Years | 0 (0.0%) | 40 (44.4%) |
| 45 to 54 Years | 47 (36.7%) | 6 (10.0%) |
| 55 to 64 Years | 7 (13.0%) | 21 (17.9%) |
| 65 to 74 Years | 0 (0.0%) | 17 (16.5%) |
| 75 Years and over | 6 (13.6%) | 19 (24.4%) |
| Total | 263 (38.0%) | 361 (36.8%) |
Income Above Poverty by Sex and Age in Decatur
According to the poverty statistics in Decatur, males aged 35 to 44 years and females aged 12 to 14 years are the age groups that are most secure financially, with 100.0% of males and 100.0% of females in these age groups living above the poverty line.
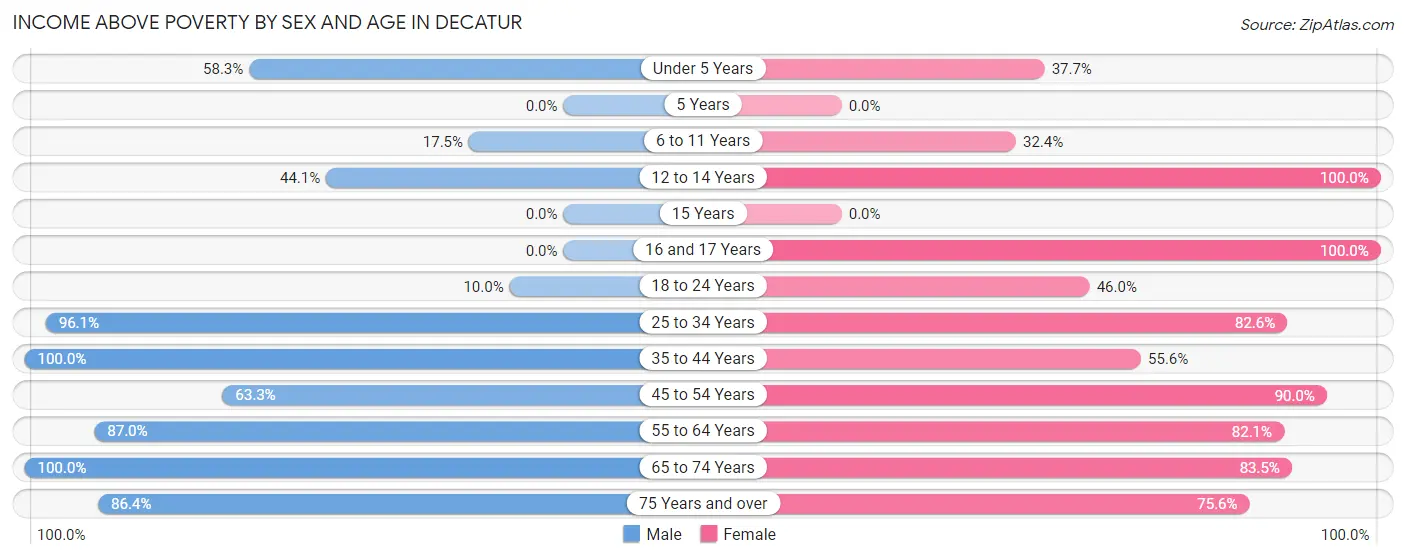
| Age Bracket | Male | Female |
| Under 5 Years | 21 (58.3%) | 29 (37.7%) |
| 5 Years | 0 (0.0%) | 0 (0.0%) |
| 6 to 11 Years | 10 (17.5%) | 44 (32.4%) |
| 12 to 14 Years | 37 (44.1%) | 22 (100.0%) |
| 15 Years | 0 (0.0%) | 0 (0.0%) |
| 16 and 17 Years | 0 (0.0%) | 10 (100.0%) |
| 18 to 24 Years | 6 (10.0%) | 52 (46.0%) |
| 25 to 34 Years | 122 (96.1%) | 119 (82.6%) |
| 35 to 44 Years | 54 (100.0%) | 50 (55.6%) |
| 45 to 54 Years | 81 (63.3%) | 54 (90.0%) |
| 55 to 64 Years | 47 (87.0%) | 96 (82.1%) |
| 65 to 74 Years | 13 (100.0%) | 86 (83.5%) |
| 75 Years and over | 38 (86.4%) | 59 (75.6%) |
| Total | 429 (62.0%) | 621 (63.2%) |
Income Below Poverty Among Married-Couple Families in Decatur
The poverty statistics for married-couple families in Decatur show that 8.1% or 15 of the total 185 families live below the poverty line. Families with no children have the highest poverty rate of 11.1%, comprising of 13 families. On the other hand, families with 3 or 4 children have the lowest poverty rate of 0.0%, which includes 0 families.
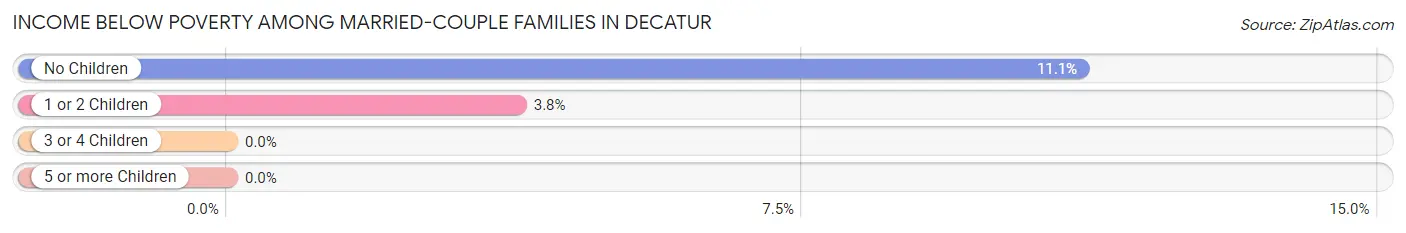
| Children | Above Poverty | Below Poverty |
| No Children | 104 (88.9%) | 13 (11.1%) |
| 1 or 2 Children | 51 (96.2%) | 2 (3.8%) |
| 3 or 4 Children | 15 (100.0%) | 0 (0.0%) |
| 5 or more Children | 0 (0.0%) | 0 (0.0%) |
| Total | 170 (91.9%) | 15 (8.1%) |
Income Below Poverty Among Single-Parent Households in Decatur
According to the poverty data in Decatur, 64.9% or 24 single-father households and 64.7% or 86 single-mother households are living below the poverty line. Among single-father households, those with 1 or 2 children have the highest poverty rate, with 24 households (80.0%) experiencing poverty. Likewise, among single-mother households, those with 1 or 2 children have the highest poverty rate, with 27 households (100.0%) falling below the poverty line.
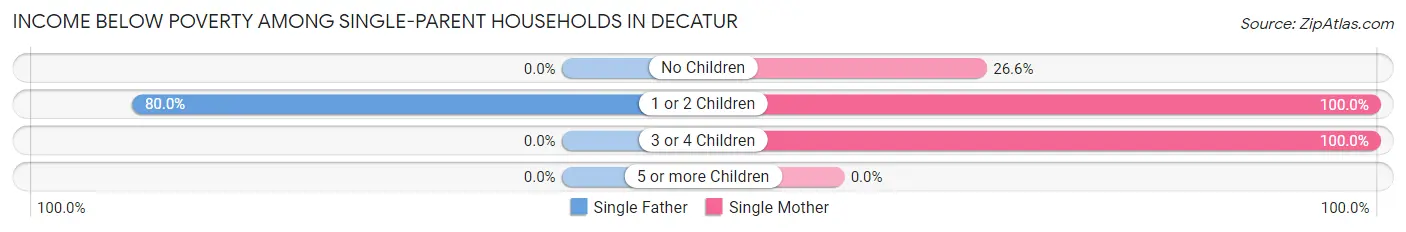
| Children | Single Father | Single Mother |
| No Children | 0 (0.0%) | 17 (26.6%) |
| 1 or 2 Children | 24 (80.0%) | 27 (100.0%) |
| 3 or 4 Children | 0 (0.0%) | 42 (100.0%) |
| 5 or more Children | 0 (0.0%) | 0 (0.0%) |
| Total | 24 (64.9%) | 86 (64.7%) |
Income Below Poverty Among Married-Couple vs Single-Parent Households in Decatur
The poverty data for Decatur shows that 15 of the married-couple family households (8.1%) and 110 of the single-parent households (64.7%) are living below the poverty level. Within the married-couple family households, those with no children have the highest poverty rate, with 13 households (11.1%) falling below the poverty line. Among the single-parent households, those with 3 or 4 children have the highest poverty rate, with 42 household (100.0%) living below poverty.
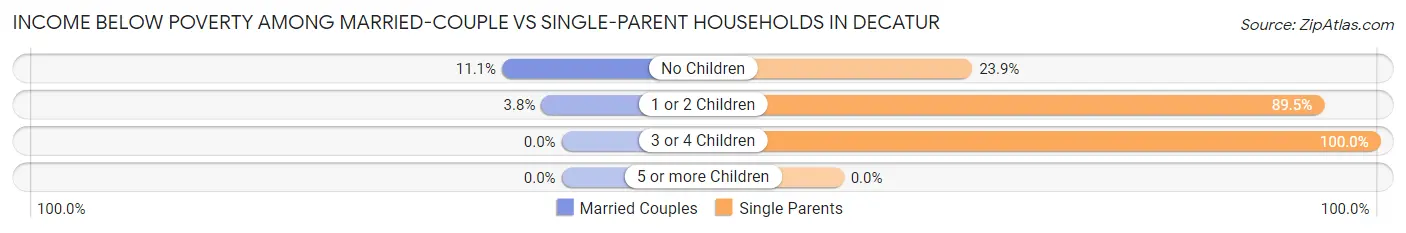
| Children | Married-Couple Families | Single-Parent Households |
| No Children | 13 (11.1%) | 17 (23.9%) |
| 1 or 2 Children | 2 (3.8%) | 51 (89.5%) |
| 3 or 4 Children | 0 (0.0%) | 42 (100.0%) |
| 5 or more Children | 0 (0.0%) | 0 (0.0%) |
| Total | 15 (8.1%) | 110 (64.7%) |
Race in Decatur
The most populous races in Decatur are White / Caucasian (1,220 | 52.5%), Black / African American (1,010 | 43.4%), and Two or more Races (55 | 2.4%).
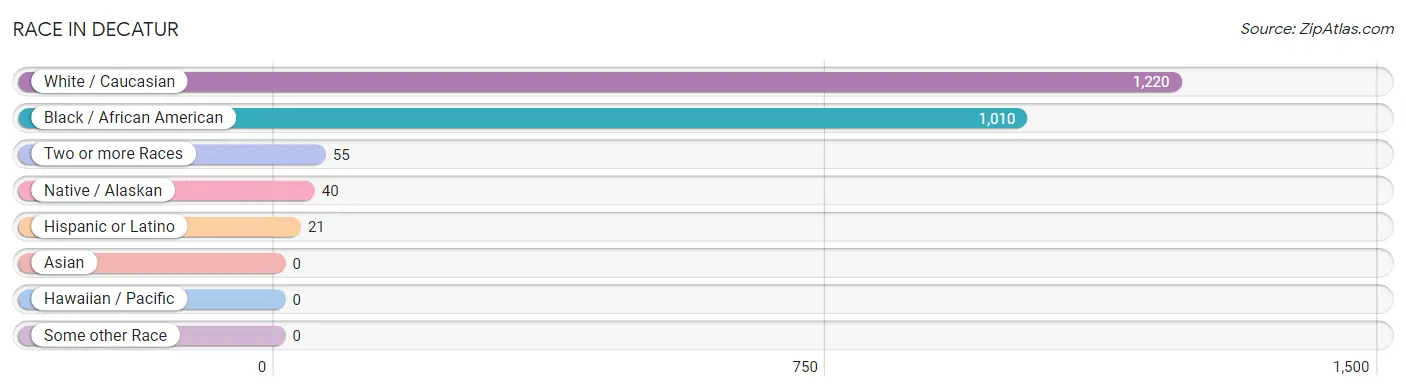
| Race | # Population | % Population |
| Asian | 0 | 0.0% |
| Black / African American | 1,010 | 43.4% |
| Hawaiian / Pacific | 0 | 0.0% |
| Hispanic or Latino | 21 | 0.9% |
| Native / Alaskan | 40 | 1.7% |
| White / Caucasian | 1,220 | 52.5% |
| Two or more Races | 55 | 2.4% |
| Some other Race | 0 | 0.0% |
| Total | 2,325 | 100.0% |
Ancestry in Decatur
The most populous ancestries reported in Decatur are Irish (293 | 12.6%), American (239 | 10.3%), English (89 | 3.8%), German (57 | 2.5%), and Choctaw (22 | 0.9%), together accounting for 30.1% of all Decatur residents.
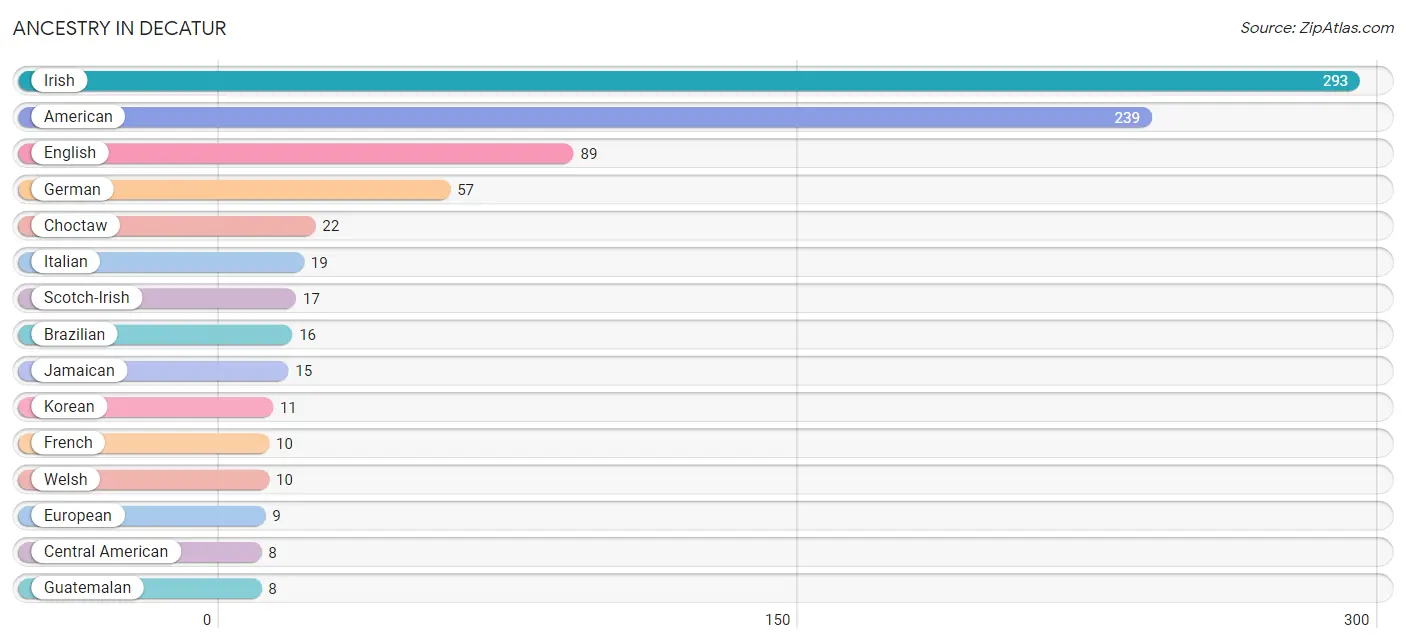
| Ancestry | # Population | % Population |
| African | 7 | 0.3% |
| American | 239 | 10.3% |
| Brazilian | 16 | 0.7% |
| Central American | 8 | 0.3% |
| Chilean | 6 | 0.3% |
| Choctaw | 22 | 0.9% |
| English | 89 | 3.8% |
| European | 9 | 0.4% |
| French | 10 | 0.4% |
| German | 57 | 2.5% |
| Greek | 2 | 0.1% |
| Guatemalan | 8 | 0.3% |
| Haitian | 6 | 0.3% |
| Irish | 293 | 12.6% |
| Italian | 19 | 0.8% |
| Jamaican | 15 | 0.6% |
| Korean | 11 | 0.5% |
| Mexican | 7 | 0.3% |
| Norwegian | 7 | 0.3% |
| Polish | 7 | 0.3% |
| Scotch-Irish | 17 | 0.7% |
| Scottish | 3 | 0.1% |
| South American | 6 | 0.3% |
| Subsaharan African | 7 | 0.3% |
| Welsh | 10 | 0.4% | View All 25 Rows |
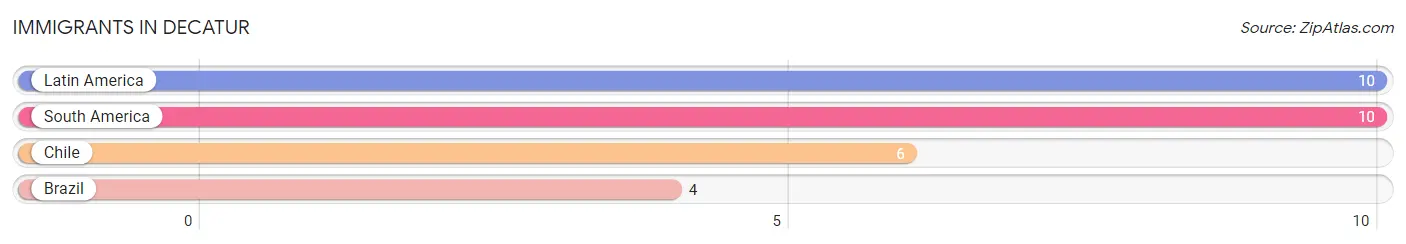
Immigrants in Decatur
The most numerous immigrant groups reported in Decatur came from Latin America (10 | 0.4%), South America (10 | 0.4%), Chile (6 | 0.3%), and Brazil (4 | 0.2%), together accounting for 1.3% of all Decatur residents.
| Immigration Origin | # Population | % Population |
| Brazil | 4 | 0.2% |
| Chile | 6 | 0.3% |
| Latin America | 10 | 0.4% |
| South America | 10 | 0.4% | View All 4 Rows |
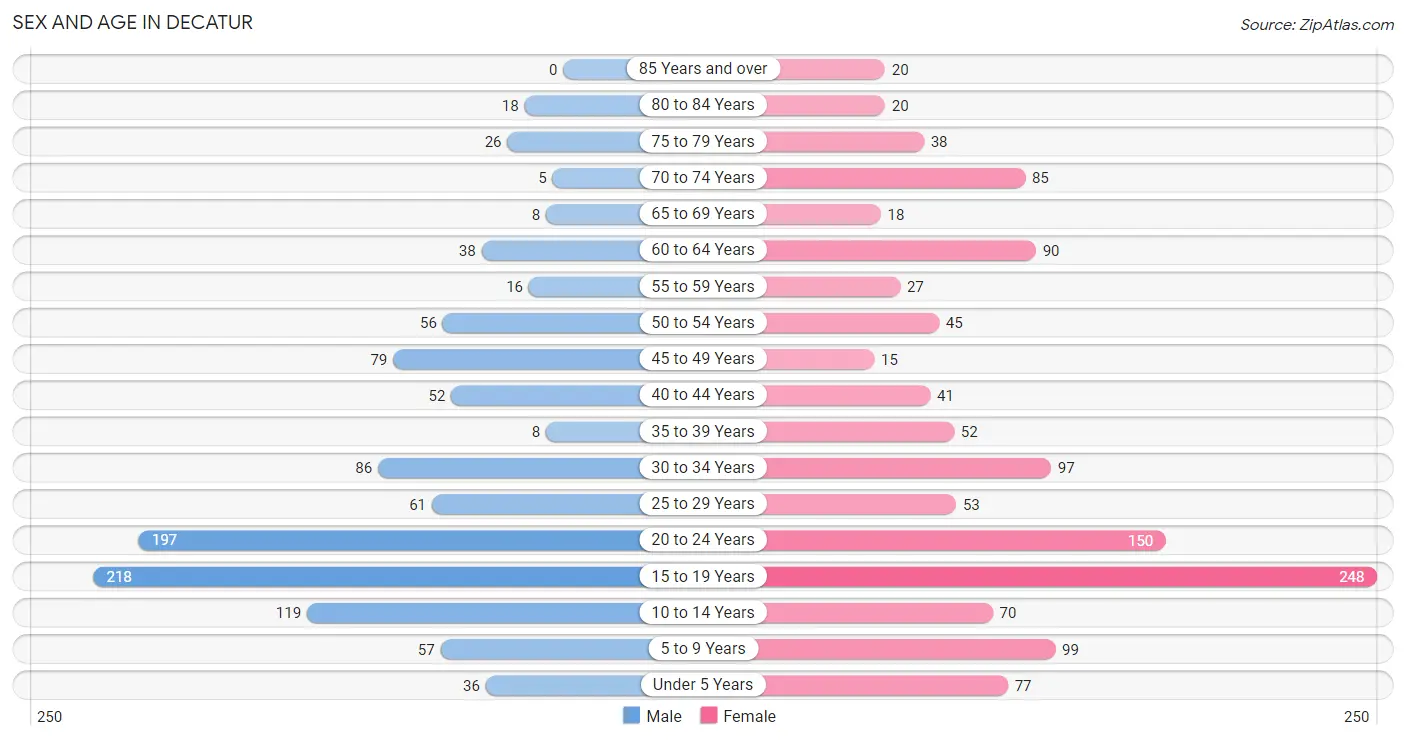
Sex and Age in Decatur
Sex and Age in Decatur
The most populous age groups in Decatur are 15 to 19 Years (218 | 20.2%) for men and 15 to 19 Years (248 | 19.9%) for women.
| Age Bracket | Male | Female |
| Under 5 Years | 36 (3.3%) | 77 (6.2%) |
| 5 to 9 Years | 57 (5.3%) | 99 (8.0%) |
| 10 to 14 Years | 119 (11.0%) | 70 (5.6%) |
| 15 to 19 Years | 218 (20.2%) | 248 (19.9%) |
| 20 to 24 Years | 197 (18.2%) | 150 (12.0%) |
| 25 to 29 Years | 61 (5.7%) | 53 (4.3%) |
| 30 to 34 Years | 86 (8.0%) | 97 (7.8%) |
| 35 to 39 Years | 8 (0.7%) | 52 (4.2%) |
| 40 to 44 Years | 52 (4.8%) | 41 (3.3%) |
| 45 to 49 Years | 79 (7.3%) | 15 (1.2%) |
| 50 to 54 Years | 56 (5.2%) | 45 (3.6%) |
| 55 to 59 Years | 16 (1.5%) | 27 (2.2%) |
| 60 to 64 Years | 38 (3.5%) | 90 (7.2%) |
| 65 to 69 Years | 8 (0.7%) | 18 (1.5%) |
| 70 to 74 Years | 5 (0.5%) | 85 (6.8%) |
| 75 to 79 Years | 26 (2.4%) | 38 (3.0%) |
| 80 to 84 Years | 18 (1.7%) | 20 (1.6%) |
| 85 Years and over | 0 (0.0%) | 20 (1.6%) |
| Total | 1,080 (100.0%) | 1,245 (100.0%) |
Families and Households in Decatur
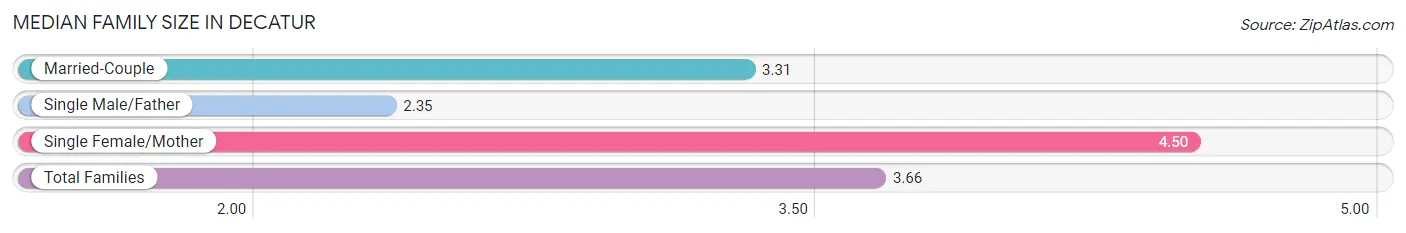
Median Family Size in Decatur
The median family size in Decatur is 3.66 persons per family, with single female/mother families (133 | 37.5%) accounting for the largest median family size of 4.5 persons per family. On the other hand, single male/father families (37 | 10.4%) represent the smallest median family size with 2.35 persons per family.
| Family Type | # Families | Family Size |
| Married-Couple | 185 (52.1%) | 3.31 |
| Single Male/Father | 37 (10.4%) | 2.35 |
| Single Female/Mother | 133 (37.5%) | 4.50 |
| Total Families | 355 (100.0%) | 3.66 |
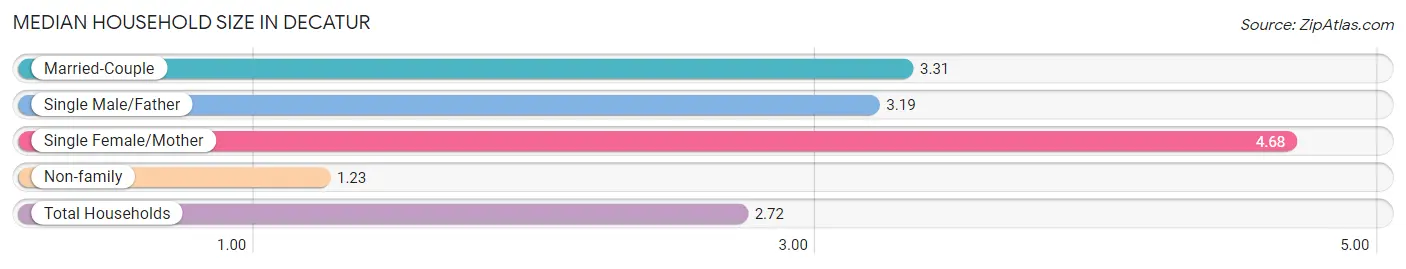
Median Household Size in Decatur
The median household size in Decatur is 2.72 persons per household, with single female/mother households (133 | 21.6%) accounting for the largest median household size of 4.68 persons per household. non-family households (260 | 42.3%) represent the smallest median household size with 1.23 persons per household.
| Household Type | # Households | Household Size |
| Married-Couple | 185 (30.1%) | 3.31 |
| Single Male/Father | 37 (6.0%) | 3.19 |
| Single Female/Mother | 133 (21.6%) | 4.68 |
| Non-family | 260 (42.3%) | 1.23 |
| Total Households | 615 (100.0%) | 2.72 |
Household Size by Marriage Status in Decatur
Out of a total of 615 households in Decatur, 355 (57.7%) are family households, while 260 (42.3%) are nonfamily households. The most numerous type of family households are 2-person households, comprising 185, and the most common type of nonfamily households are 1-person households, comprising 243.
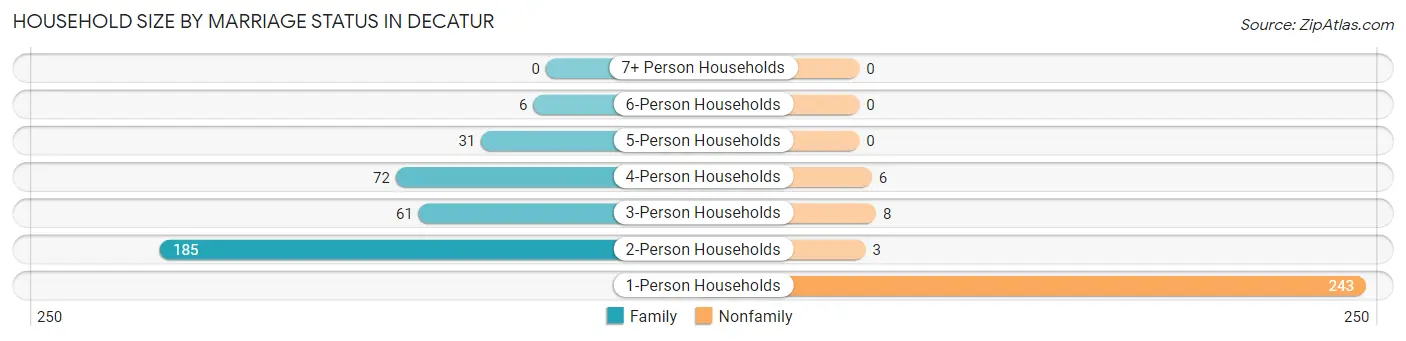
| Household Size | Family Households | Nonfamily Households |
| 1-Person Households | - | 243 (39.5%) |
| 2-Person Households | 185 (30.1%) | 3 (0.5%) |
| 3-Person Households | 61 (9.9%) | 8 (1.3%) |
| 4-Person Households | 72 (11.7%) | 6 (1.0%) |
| 5-Person Households | 31 (5.0%) | 0 (0.0%) |
| 6-Person Households | 6 (1.0%) | 0 (0.0%) |
| 7+ Person Households | 0 (0.0%) | 0 (0.0%) |
| Total | 355 (57.7%) | 260 (42.3%) |
Female Fertility in Decatur
Fertility by Age in Decatur
Average fertility rate in Decatur is 8.0 births per 1,000 women. Women in the age bracket of 20 to 34 years have the highest fertility rate with 17.0 births per 1,000 women. Women in the age bracket of 20 to 34 years acount for 100.0% of all women with births.
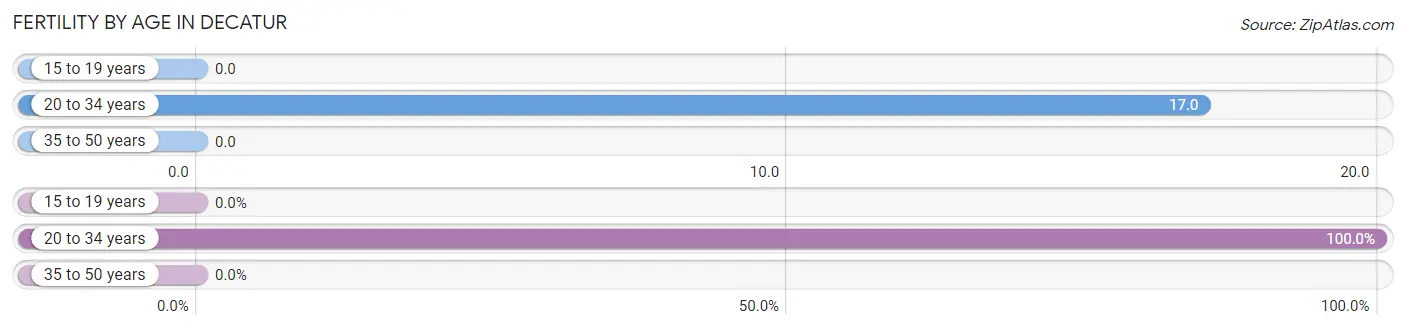
| Age Bracket | Women with Births | Births / 1,000 Women |
| 15 to 19 years | 0 (0.0%) | 0.0 |
| 20 to 34 years | 5 (100.0%) | 17.0 |
| 35 to 50 years | 0 (0.0%) | 0.0 |
| Total | 5 (100.0%) | 8.0 |
Fertility by Age by Marriage Status in Decatur
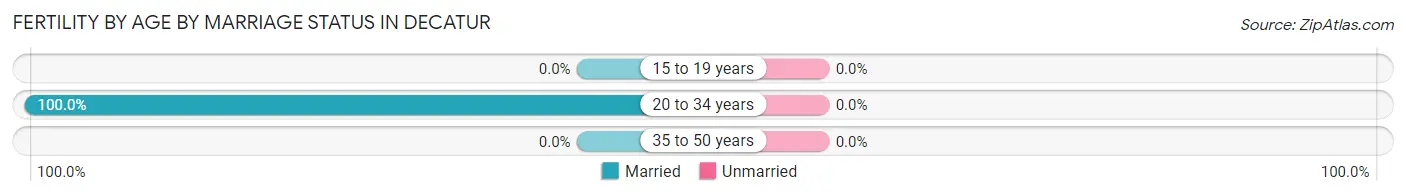
| Age Bracket | Married | Unmarried |
| 15 to 19 years | 0 (0.0%) | 0 (0.0%) |
| 20 to 34 years | 5 (100.0%) | 0 (0.0%) |
| 35 to 50 years | 0 (0.0%) | 0 (0.0%) |
| Total | 5 (100.0%) | 0 (0.0%) |
Fertility by Education in Decatur
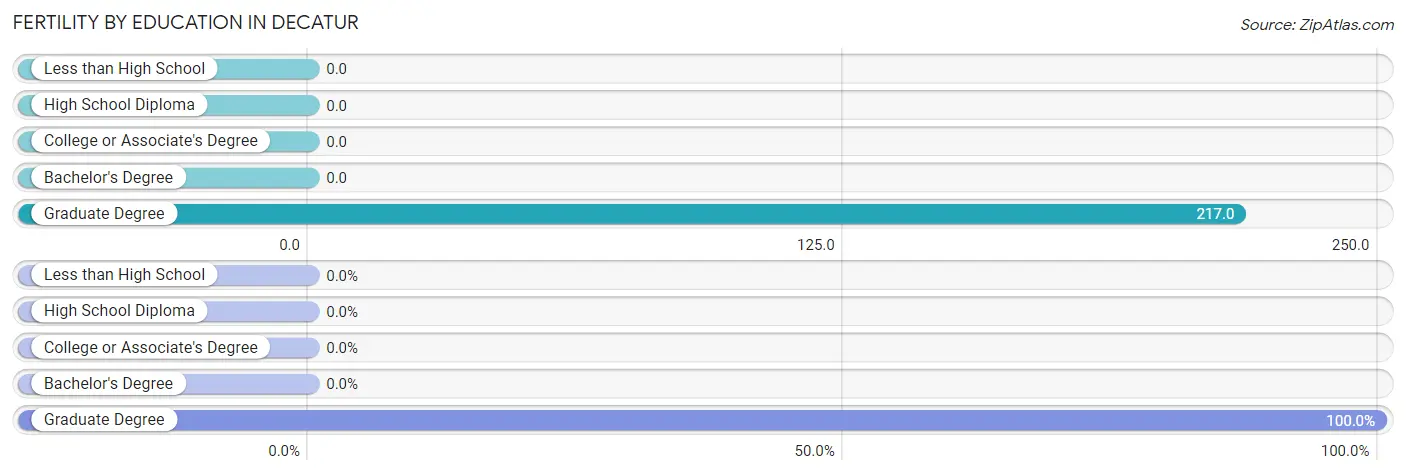
| Educational Attainment | Women with Births | Births / 1,000 Women |
| Less than High School | 0 (0.0%) | 0.0 |
| High School Diploma | 0 (0.0%) | 0.0 |
| College or Associate's Degree | 0 (0.0%) | 0.0 |
| Bachelor's Degree | 0 (0.0%) | 0.0 |
| Graduate Degree | 5 (100.0%) | 217.0 |
| Total | 5 (100.0%) | 8.0 |
Fertility by Education by Marriage Status in Decatur
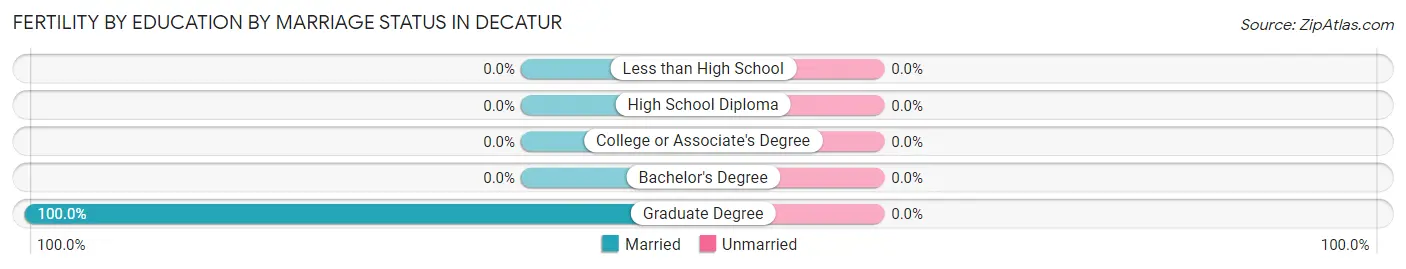
| Educational Attainment | Married | Unmarried |
| Less than High School | 0 (0.0%) | 0 (0.0%) |
| High School Diploma | 0 (0.0%) | 0 (0.0%) |
| College or Associate's Degree | 0 (0.0%) | 0 (0.0%) |
| Bachelor's Degree | 0 (0.0%) | 0 (0.0%) |
| Graduate Degree | 5 (100.0%) | 0 (0.0%) |
| Total | 5 (100.0%) | 0 (0.0%) |
Employment Characteristics in Decatur
Employment by Class of Employer in Decatur
Among the 634 employed individuals in Decatur, private company employees (342 | 53.9%), local government employees (97 | 15.3%), and state government employees (66 | 10.4%) make up the most common classes of employment.
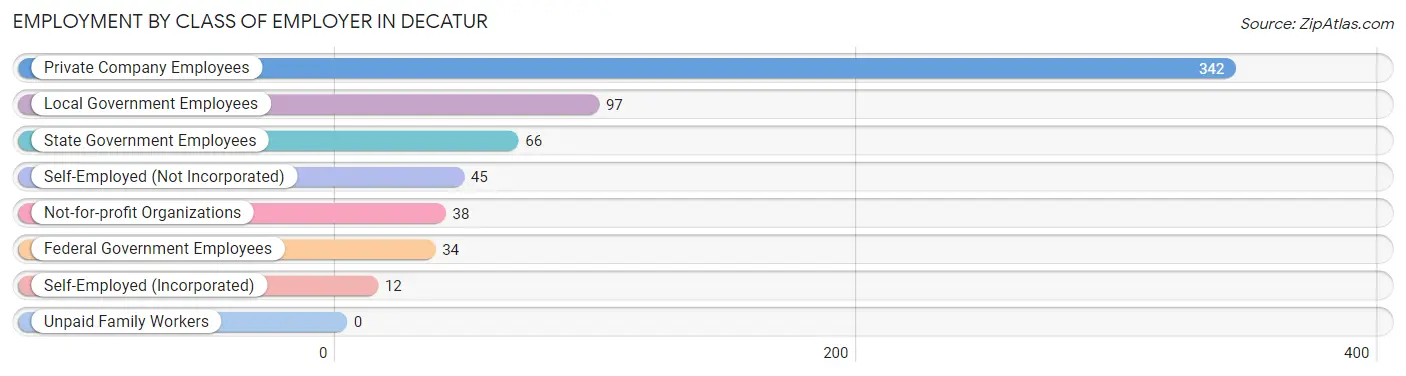
| Employer Class | # Employees | % Employees |
| Private Company Employees | 342 | 53.9% |
| Self-Employed (Incorporated) | 12 | 1.9% |
| Self-Employed (Not Incorporated) | 45 | 7.1% |
| Not-for-profit Organizations | 38 | 6.0% |
| Local Government Employees | 97 | 15.3% |
| State Government Employees | 66 | 10.4% |
| Federal Government Employees | 34 | 5.4% |
| Unpaid Family Workers | 0 | 0.0% |
| Total | 634 | 100.0% |
Employment Status by Age in Decatur
According to the labor force statistics for Decatur, out of the total population over 16 years of age (1,846), 39.0% or 720 individuals are in the labor force, with 10.8% or 78 of them unemployed. The age group with the highest labor force participation rate is 30 to 34 years, with 91.8% or 168 individuals in the labor force. Within the labor force, the 35 to 44 years age range has the highest percentage of unemployed individuals, with 21.2% or 25 of them being unemployed.
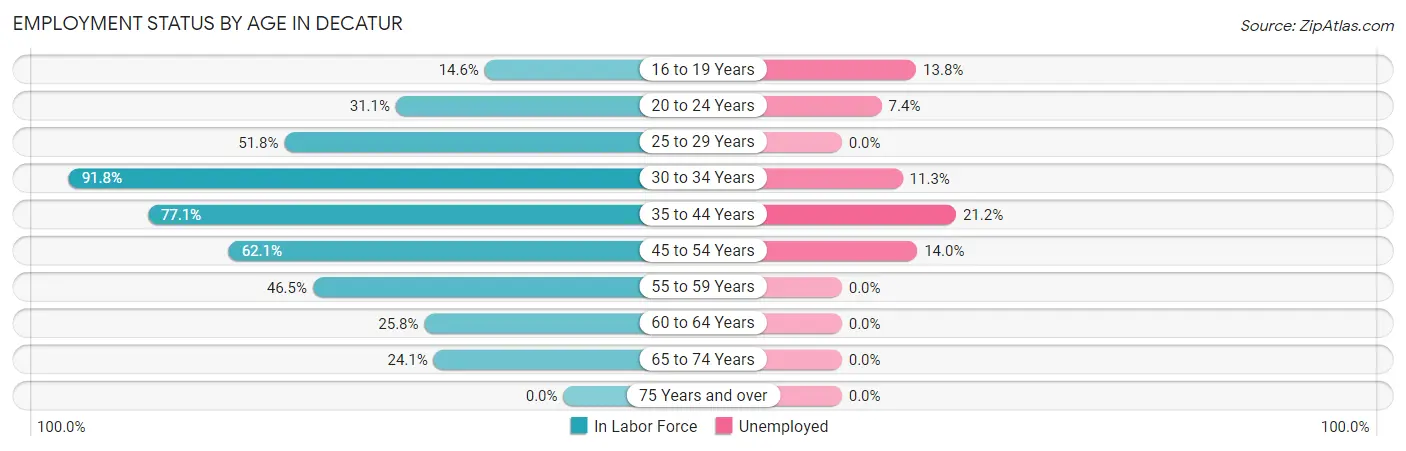
| Age Bracket | In Labor Force | Unemployed |
| 16 to 19 Years | 65 (14.6%) | 9 (13.8%) |
| 20 to 24 Years | 108 (31.1%) | 8 (7.4%) |
| 25 to 29 Years | 59 (51.8%) | 0 (0.0%) |
| 30 to 34 Years | 168 (91.8%) | 19 (11.3%) |
| 35 to 44 Years | 118 (77.1%) | 25 (21.2%) |
| 45 to 54 Years | 121 (62.1%) | 17 (14.0%) |
| 55 to 59 Years | 20 (46.5%) | 0 (0.0%) |
| 60 to 64 Years | 33 (25.8%) | 0 (0.0%) |
| 65 to 74 Years | 28 (24.1%) | 0 (0.0%) |
| 75 Years and over | 0 (0.0%) | 0 (0.0%) |
| Total | 720 (39.0%) | 78 (10.8%) |
Employment Status by Educational Attainment in Decatur
According to labor force statistics for Decatur, 63.6% of individuals (519) out of the total population between 25 and 64 years of age (816) are in the labor force, with 11.8% or 61 of them being unemployed. The group with the highest labor force participation rate are those with the educational attainment of bachelor's degree or higher, with 74.8% or 86 individuals in the labor force. Within the labor force, individuals with less than high school education have the highest percentage of unemployment, with 27.9% or 19 of them being unemployed.
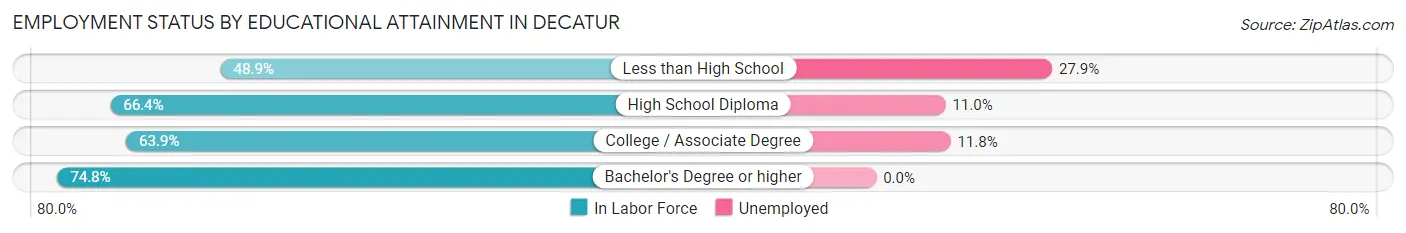
| Educational Attainment | In Labor Force | Unemployed |
| Less than High School | 68 (48.9%) | 39 (27.9%) |
| High School Diploma | 154 (66.4%) | 26 (11.0%) |
| College / Associate Degree | 211 (63.9%) | 39 (11.8%) |
| Bachelor's Degree or higher | 86 (74.8%) | 0 (0.0%) |
| Total | 519 (63.6%) | 96 (11.8%) |
Employment Occupations by Sex in Decatur
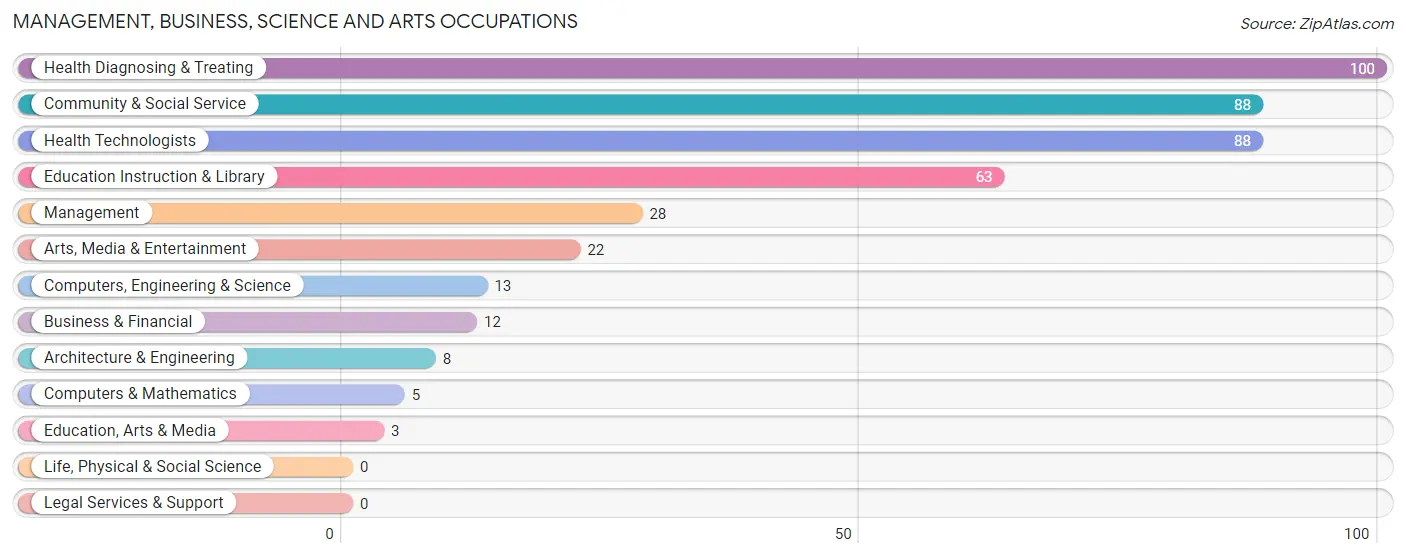
Management, Business, Science and Arts Occupations
The most common Management, Business, Science and Arts occupations in Decatur are Health Diagnosing & Treating (100 | 15.6%), Community & Social Service (88 | 13.7%), Health Technologists (88 | 13.7%), Education Instruction & Library (63 | 9.8%), and Management (28 | 4.4%).
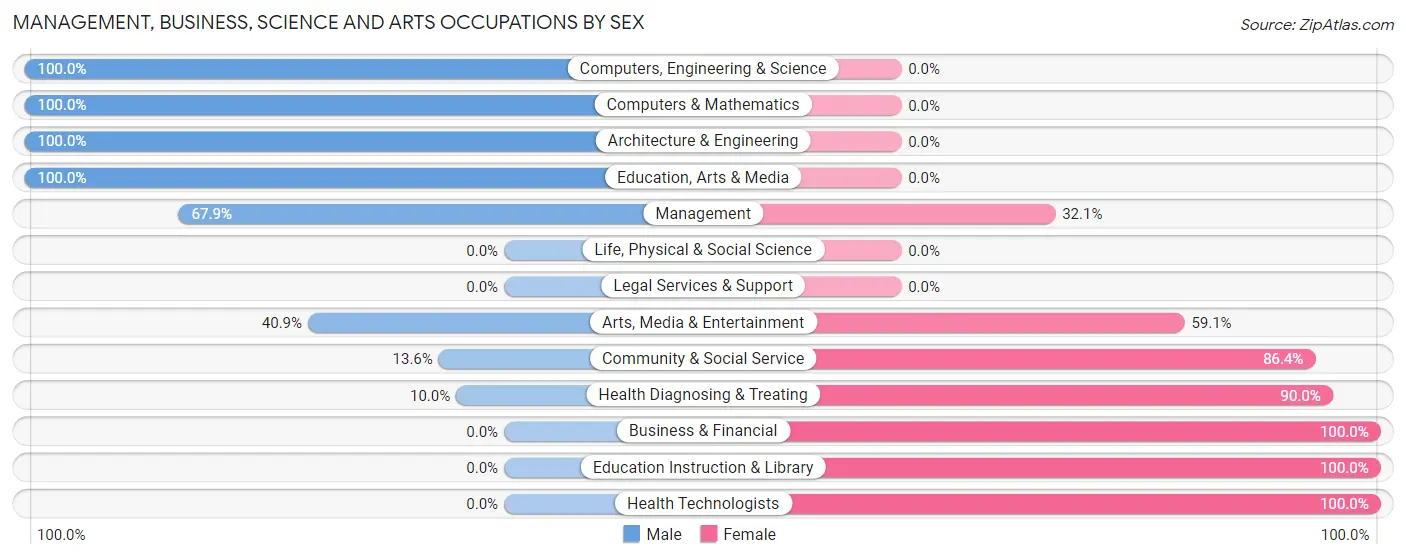
Management, Business, Science and Arts Occupations by Sex
Within the Management, Business, Science and Arts occupations in Decatur, the most male-oriented occupations are Computers, Engineering & Science (100.0%), Computers & Mathematics (100.0%), and Architecture & Engineering (100.0%), while the most female-oriented occupations are Business & Financial (100.0%), Education Instruction & Library (100.0%), and Health Technologists (100.0%).
| Occupation | Male | Female |
| Management | 19 (67.9%) | 9 (32.1%) |
| Business & Financial | 0 (0.0%) | 12 (100.0%) |
| Computers, Engineering & Science | 13 (100.0%) | 0 (0.0%) |
| Computers & Mathematics | 5 (100.0%) | 0 (0.0%) |
| Architecture & Engineering | 8 (100.0%) | 0 (0.0%) |
| Life, Physical & Social Science | 0 (0.0%) | 0 (0.0%) |
| Community & Social Service | 12 (13.6%) | 76 (86.4%) |
| Education, Arts & Media | 3 (100.0%) | 0 (0.0%) |
| Legal Services & Support | 0 (0.0%) | 0 (0.0%) |
| Education Instruction & Library | 0 (0.0%) | 63 (100.0%) |
| Arts, Media & Entertainment | 9 (40.9%) | 13 (59.1%) |
| Health Diagnosing & Treating | 10 (10.0%) | 90 (90.0%) |
| Health Technologists | 0 (0.0%) | 88 (100.0%) |
| Total (Category) | 54 (22.4%) | 187 (77.6%) |
| Total (Overall) | 325 (50.6%) | 317 (49.4%) |
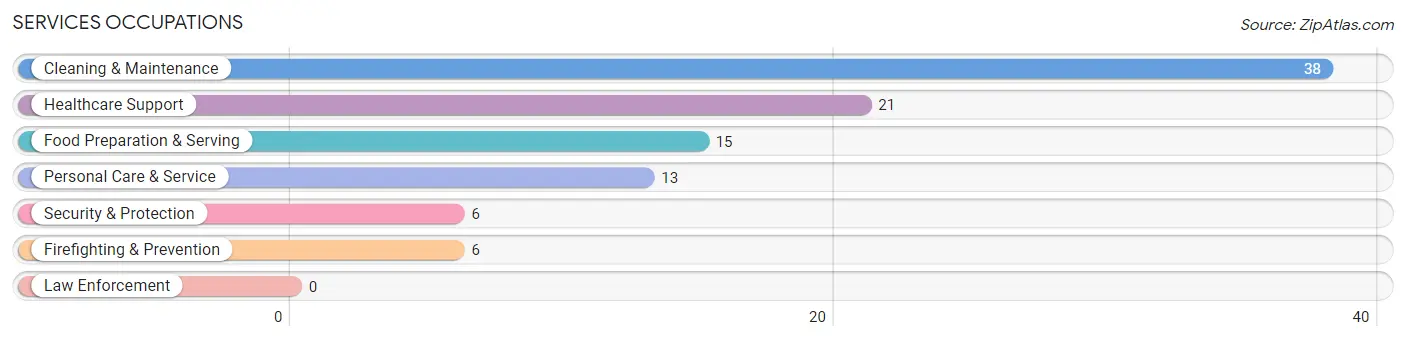
Services Occupations
The most common Services occupations in Decatur are Cleaning & Maintenance (38 | 5.9%), Healthcare Support (21 | 3.3%), Food Preparation & Serving (15 | 2.3%), Personal Care & Service (13 | 2.0%), and Security & Protection (6 | 0.9%).
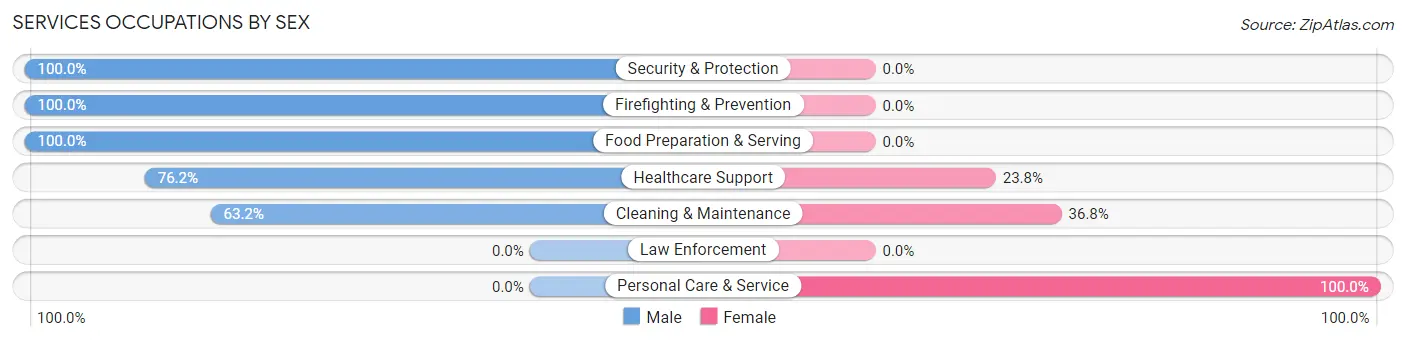
Services Occupations by Sex
Within the Services occupations in Decatur, the most male-oriented occupations are Security & Protection (100.0%), Firefighting & Prevention (100.0%), and Food Preparation & Serving (100.0%), while the most female-oriented occupations are Personal Care & Service (100.0%), Cleaning & Maintenance (36.8%), and Healthcare Support (23.8%).
| Occupation | Male | Female |
| Healthcare Support | 16 (76.2%) | 5 (23.8%) |
| Security & Protection | 6 (100.0%) | 0 (0.0%) |
| Firefighting & Prevention | 6 (100.0%) | 0 (0.0%) |
| Law Enforcement | 0 (0.0%) | 0 (0.0%) |
| Food Preparation & Serving | 15 (100.0%) | 0 (0.0%) |
| Cleaning & Maintenance | 24 (63.2%) | 14 (36.8%) |
| Personal Care & Service | 0 (0.0%) | 13 (100.0%) |
| Total (Category) | 61 (65.6%) | 32 (34.4%) |
| Total (Overall) | 325 (50.6%) | 317 (49.4%) |
Sales and Office Occupations
The most common Sales and Office occupations in Decatur are Office & Administration (97 | 15.1%), and Sales & Related (56 | 8.7%).
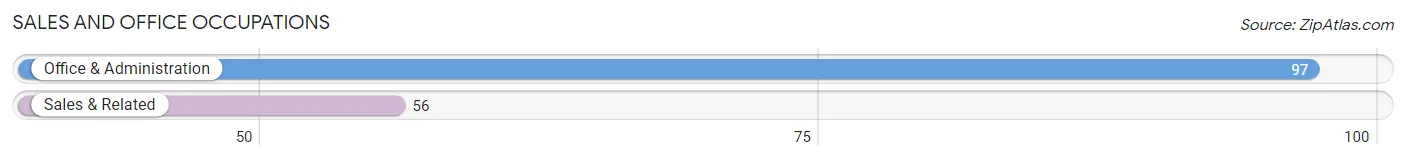
Sales and Office Occupations by Sex
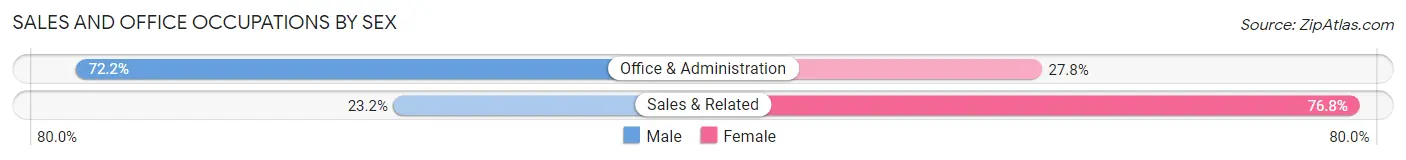
| Occupation | Male | Female |
| Sales & Related | 13 (23.2%) | 43 (76.8%) |
| Office & Administration | 70 (72.2%) | 27 (27.8%) |
| Total (Category) | 83 (54.2%) | 70 (45.8%) |
| Total (Overall) | 325 (50.6%) | 317 (49.4%) |
Natural Resources, Construction and Maintenance Occupations
The most common Natural Resources, Construction and Maintenance occupations in Decatur are Installation, Maintenance & Repair (25 | 3.9%), and Construction & Extraction (24 | 3.7%).
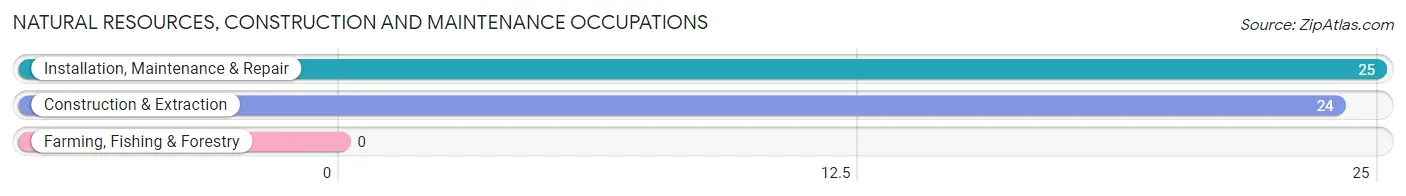
Natural Resources, Construction and Maintenance Occupations by Sex

| Occupation | Male | Female |
| Farming, Fishing & Forestry | 0 (0.0%) | 0 (0.0%) |
| Construction & Extraction | 24 (100.0%) | 0 (0.0%) |
| Installation, Maintenance & Repair | 25 (100.0%) | 0 (0.0%) |
| Total (Category) | 49 (100.0%) | 0 (0.0%) |
| Total (Overall) | 325 (50.6%) | 317 (49.4%) |
Production, Transportation and Moving Occupations
The most common Production, Transportation and Moving occupations in Decatur are Production (68 | 10.6%), Material Moving (32 | 5.0%), and Transportation (6 | 0.9%).
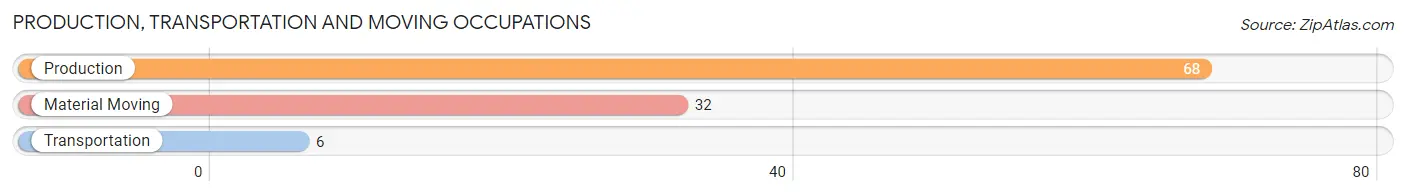
Production, Transportation and Moving Occupations by Sex
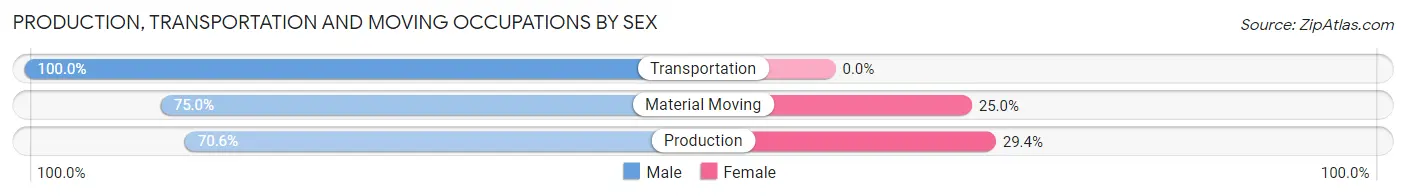
| Occupation | Male | Female |
| Production | 48 (70.6%) | 20 (29.4%) |
| Transportation | 6 (100.0%) | 0 (0.0%) |
| Material Moving | 24 (75.0%) | 8 (25.0%) |
| Total (Category) | 78 (73.6%) | 28 (26.4%) |
| Total (Overall) | 325 (50.6%) | 317 (49.4%) |
Employment Industries by Sex in Decatur
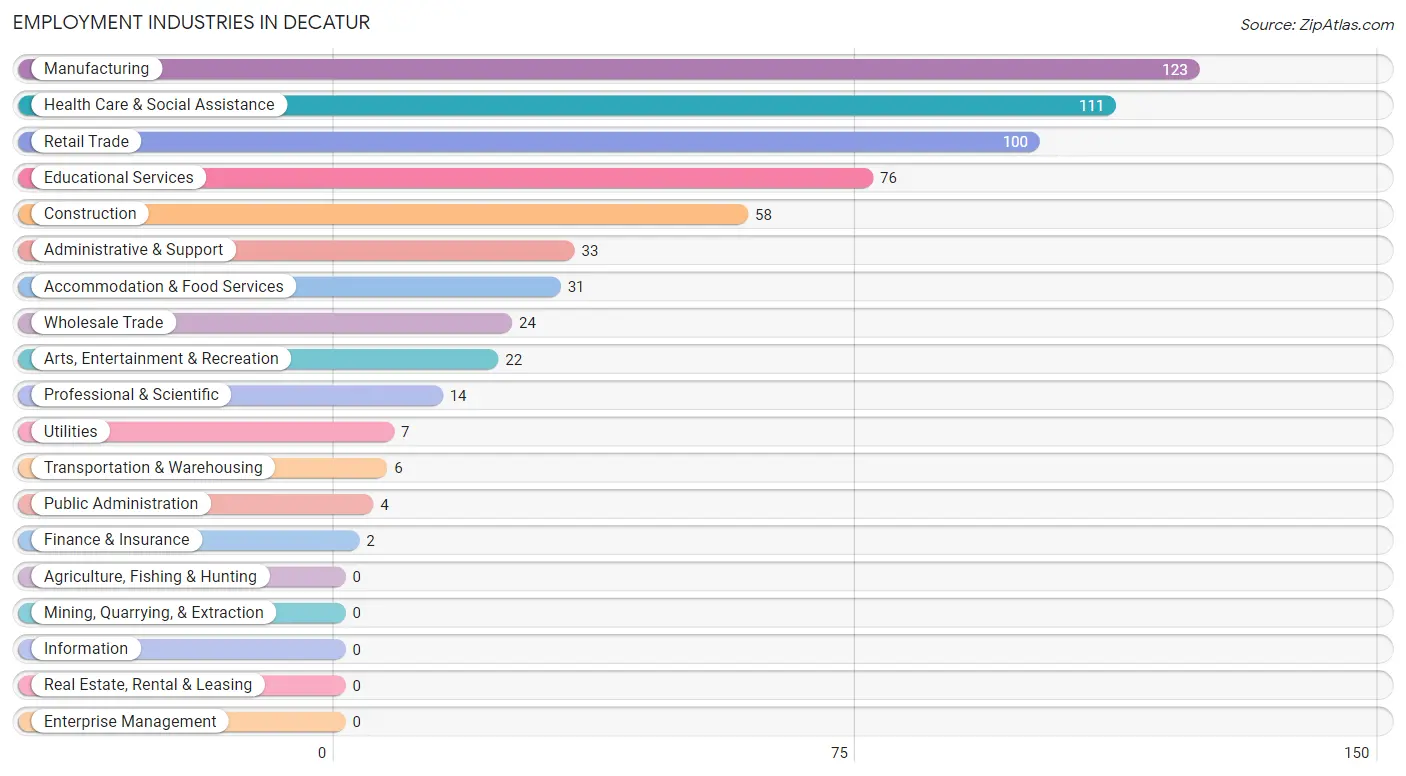
Employment Industries in Decatur
The major employment industries in Decatur include Manufacturing (123 | 19.2%), Health Care & Social Assistance (111 | 17.3%), Retail Trade (100 | 15.6%), Educational Services (76 | 11.8%), and Construction (58 | 9.0%).
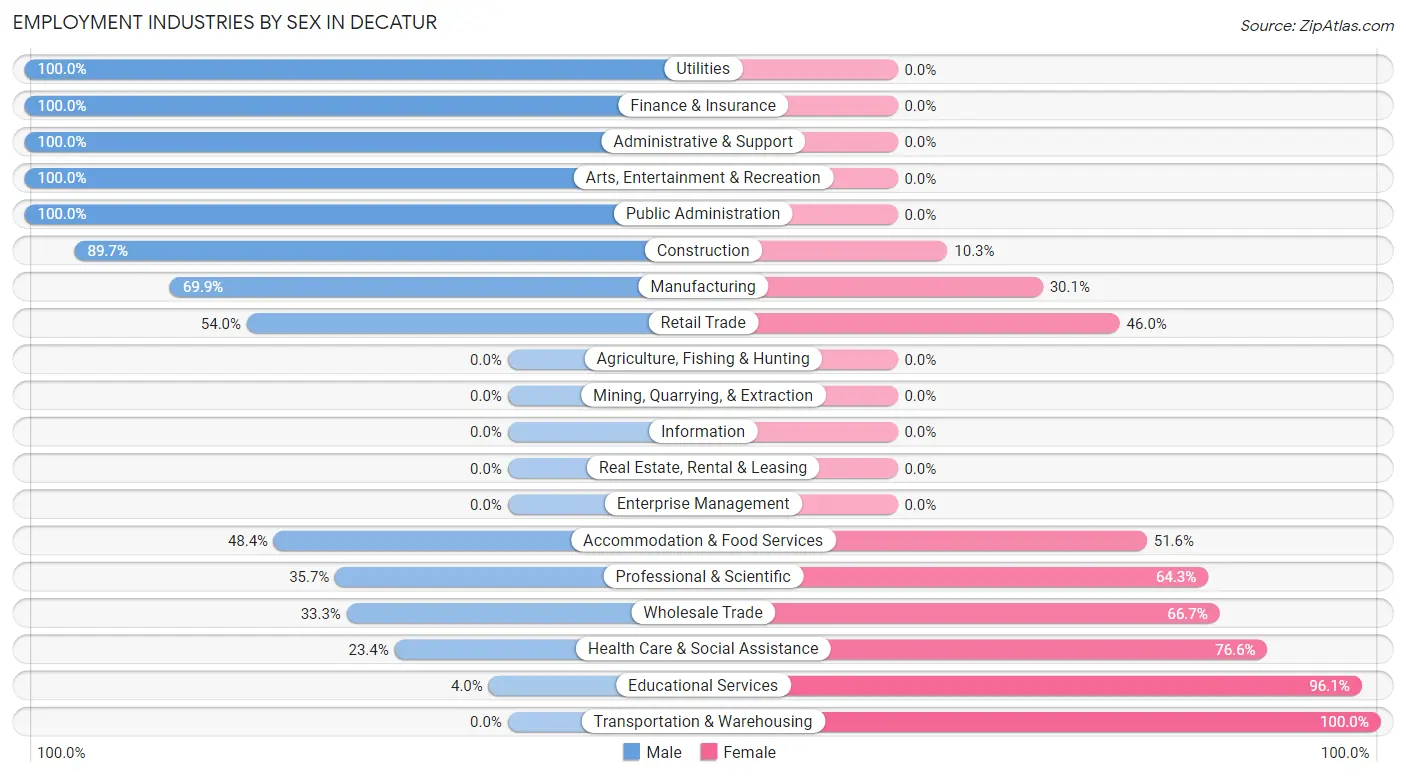
Employment Industries by Sex in Decatur
The Decatur industries that see more men than women are Utilities (100.0%), Finance & Insurance (100.0%), and Administrative & Support (100.0%), whereas the industries that tend to have a higher number of women are Transportation & Warehousing (100.0%), Educational Services (96.1%), and Health Care & Social Assistance (76.6%).
| Industry | Male | Female |
| Agriculture, Fishing & Hunting | 0 (0.0%) | 0 (0.0%) |
| Mining, Quarrying, & Extraction | 0 (0.0%) | 0 (0.0%) |
| Construction | 52 (89.7%) | 6 (10.3%) |
| Manufacturing | 86 (69.9%) | 37 (30.1%) |
| Wholesale Trade | 8 (33.3%) | 16 (66.7%) |
| Retail Trade | 54 (54.0%) | 46 (46.0%) |
| Transportation & Warehousing | 0 (0.0%) | 6 (100.0%) |
| Utilities | 7 (100.0%) | 0 (0.0%) |
| Information | 0 (0.0%) | 0 (0.0%) |
| Finance & Insurance | 2 (100.0%) | 0 (0.0%) |
| Real Estate, Rental & Leasing | 0 (0.0%) | 0 (0.0%) |
| Professional & Scientific | 5 (35.7%) | 9 (64.3%) |
| Enterprise Management | 0 (0.0%) | 0 (0.0%) |
| Administrative & Support | 33 (100.0%) | 0 (0.0%) |
| Educational Services | 3 (4.0%) | 73 (96.1%) |
| Health Care & Social Assistance | 26 (23.4%) | 85 (76.6%) |
| Arts, Entertainment & Recreation | 22 (100.0%) | 0 (0.0%) |
| Accommodation & Food Services | 15 (48.4%) | 16 (51.6%) |
| Public Administration | 4 (100.0%) | 0 (0.0%) |
| Total | 325 (50.6%) | 317 (49.4%) |
Education in Decatur
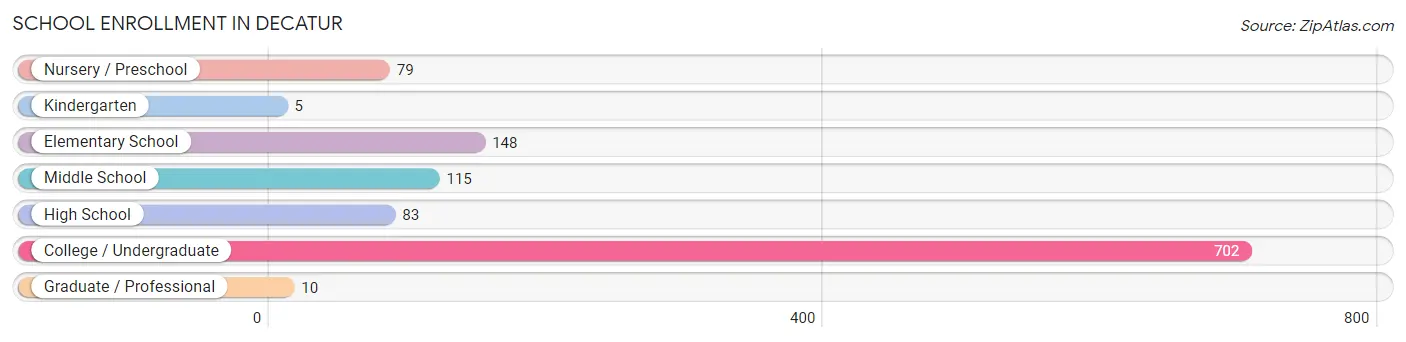
School Enrollment in Decatur
The most common levels of schooling among the 1,142 students in Decatur are college / undergraduate (702 | 61.5%), elementary school (148 | 13.0%), and middle school (115 | 10.1%).
| School Level | # Students | % Students |
| Nursery / Preschool | 79 | 6.9% |
| Kindergarten | 5 | 0.4% |
| Elementary School | 148 | 13.0% |
| Middle School | 115 | 10.1% |
| High School | 83 | 7.3% |
| College / Undergraduate | 702 | 61.5% |
| Graduate / Professional | 10 | 0.9% |
| Total | 1,142 | 100.0% |
School Enrollment by Age by Funding Source in Decatur
Out of a total of 1,142 students who are enrolled in schools in Decatur, 71 (6.2%) attend a private institution, while the remaining 1,071 (93.8%) are enrolled in public schools. The age group of 3 to 4 year olds has the highest likelihood of being enrolled in private schools, with 21 (63.6% in the age bracket) enrolled. Conversely, the age group of 15 to 17 year olds has the lowest likelihood of being enrolled in a private school, with 34 (100.0% in the age bracket) attending a public institution.
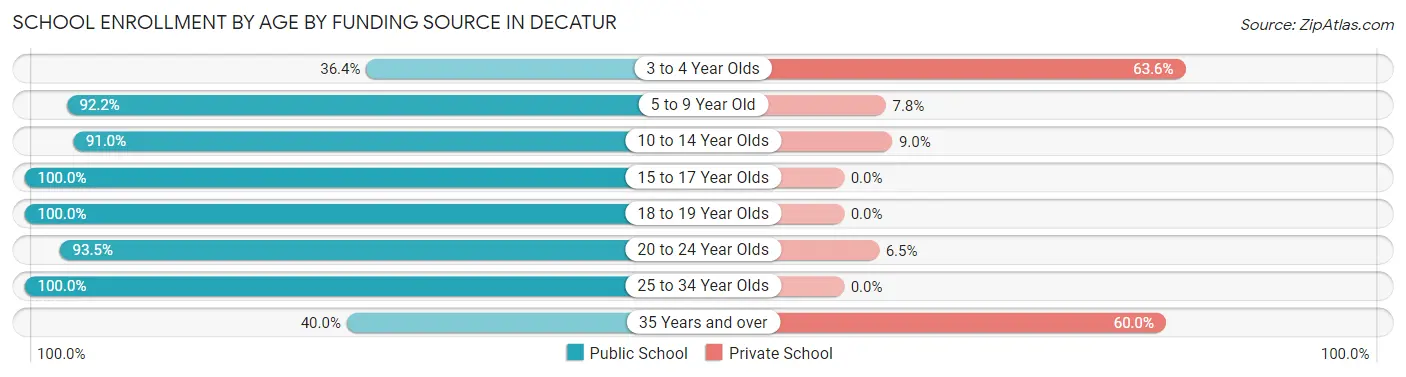
| Age Bracket | Public School | Private School |
| 3 to 4 Year Olds | 12 (36.4%) | 21 (63.6%) |
| 5 to 9 Year Old | 130 (92.2%) | 11 (7.8%) |
| 10 to 14 Year Olds | 172 (91.0%) | 17 (9.0%) |
| 15 to 17 Year Olds | 34 (100.0%) | 0 (0.0%) |
| 18 to 19 Year Olds | 432 (100.0%) | 0 (0.0%) |
| 20 to 24 Year Olds | 272 (93.5%) | 19 (6.5%) |
| 25 to 34 Year Olds | 17 (100.0%) | 0 (0.0%) |
| 35 Years and over | 2 (40.0%) | 3 (60.0%) |
| Total | 1,071 (93.8%) | 71 (6.2%) |
Educational Attainment by Field of Study in Decatur
Education (61 | 34.7%), science & technology (41 | 23.3%), business (20 | 11.4%), literature & languages (12 | 6.8%), and arts & humanities (9 | 5.1%) are the most common fields of study among 176 individuals in Decatur who have obtained a bachelor's degree or higher.
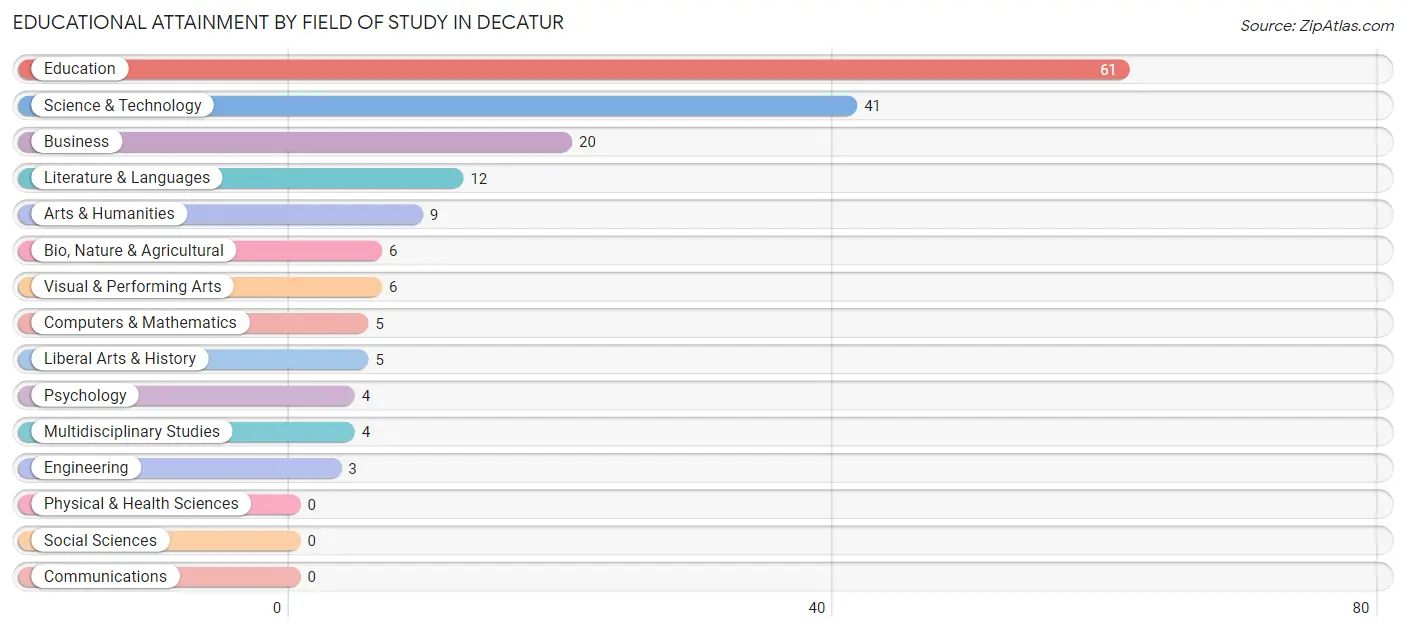
| Field of Study | # Graduates | % Graduates |
| Computers & Mathematics | 5 | 2.8% |
| Bio, Nature & Agricultural | 6 | 3.4% |
| Physical & Health Sciences | 0 | 0.0% |
| Psychology | 4 | 2.3% |
| Social Sciences | 0 | 0.0% |
| Engineering | 3 | 1.7% |
| Multidisciplinary Studies | 4 | 2.3% |
| Science & Technology | 41 | 23.3% |
| Business | 20 | 11.4% |
| Education | 61 | 34.7% |
| Literature & Languages | 12 | 6.8% |
| Liberal Arts & History | 5 | 2.8% |
| Visual & Performing Arts | 6 | 3.4% |
| Communications | 0 | 0.0% |
| Arts & Humanities | 9 | 5.1% |
| Total | 176 | 100.0% |
Transportation & Commute in Decatur
Vehicle Availability by Sex in Decatur
The most prevalent vehicle ownership categories in Decatur are males with 1 vehicle (111, accounting for 37.4%) and females with 1 vehicle (99, making up 43.7%).
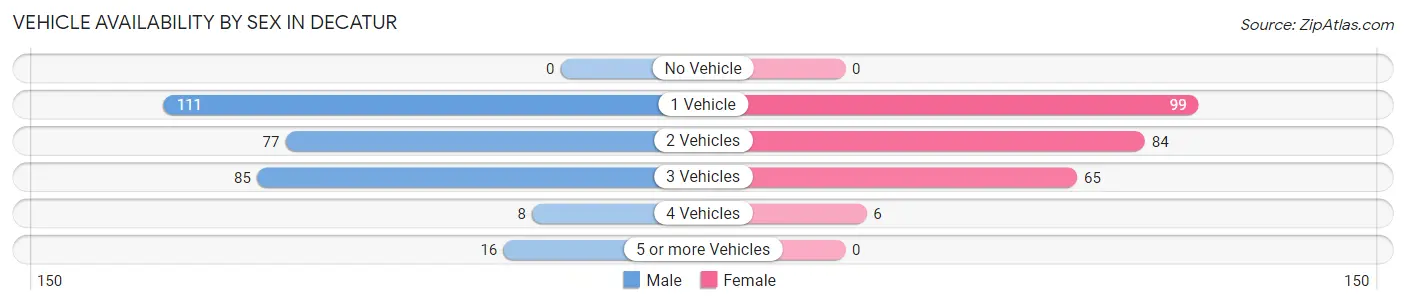
| Vehicles Available | Male | Female |
| No Vehicle | 0 (0.0%) | 0 (0.0%) |
| 1 Vehicle | 111 (37.4%) | 99 (39.0%) |
| 2 Vehicles | 77 (25.9%) | 84 (33.1%) |
| 3 Vehicles | 85 (28.6%) | 65 (25.6%) |
| 4 Vehicles | 8 (2.7%) | 6 (2.4%) |
| 5 or more Vehicles | 16 (5.4%) | 0 (0.0%) |
| Total | 297 (100.0%) | 254 (100.0%) |
Commute Time in Decatur
The most frequently occuring commute durations in Decatur are 5 to 9 minutes (132 commuters, 21.6%), 60 to 89 minutes (115 commuters, 18.8%), and 20 to 24 minutes (107 commuters, 17.5%).
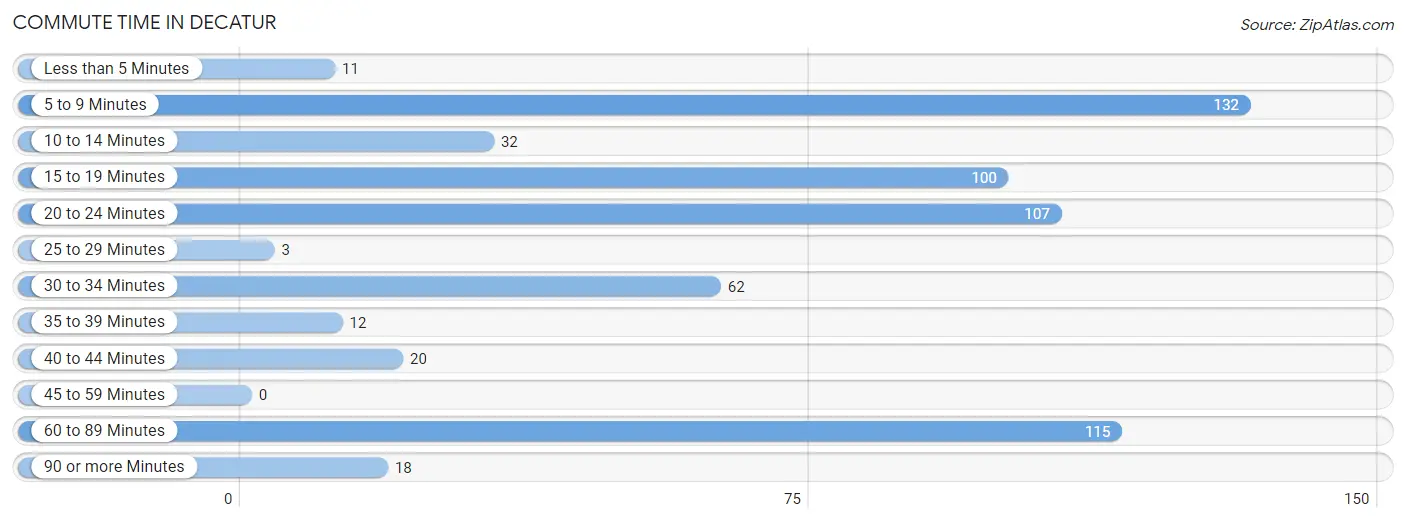
| Commute Time | # Commuters | % Commuters |
| Less than 5 Minutes | 11 | 1.8% |
| 5 to 9 Minutes | 132 | 21.6% |
| 10 to 14 Minutes | 32 | 5.2% |
| 15 to 19 Minutes | 100 | 16.3% |
| 20 to 24 Minutes | 107 | 17.5% |
| 25 to 29 Minutes | 3 | 0.5% |
| 30 to 34 Minutes | 62 | 10.1% |
| 35 to 39 Minutes | 12 | 2.0% |
| 40 to 44 Minutes | 20 | 3.3% |
| 45 to 59 Minutes | 0 | 0.0% |
| 60 to 89 Minutes | 115 | 18.8% |
| 90 or more Minutes | 18 | 2.9% |
Commute Time by Sex in Decatur
The most common commute times in Decatur are 15 to 19 minutes (80 commuters, 25.4%) for males and 60 to 89 minutes (81 commuters, 27.3%) for females.
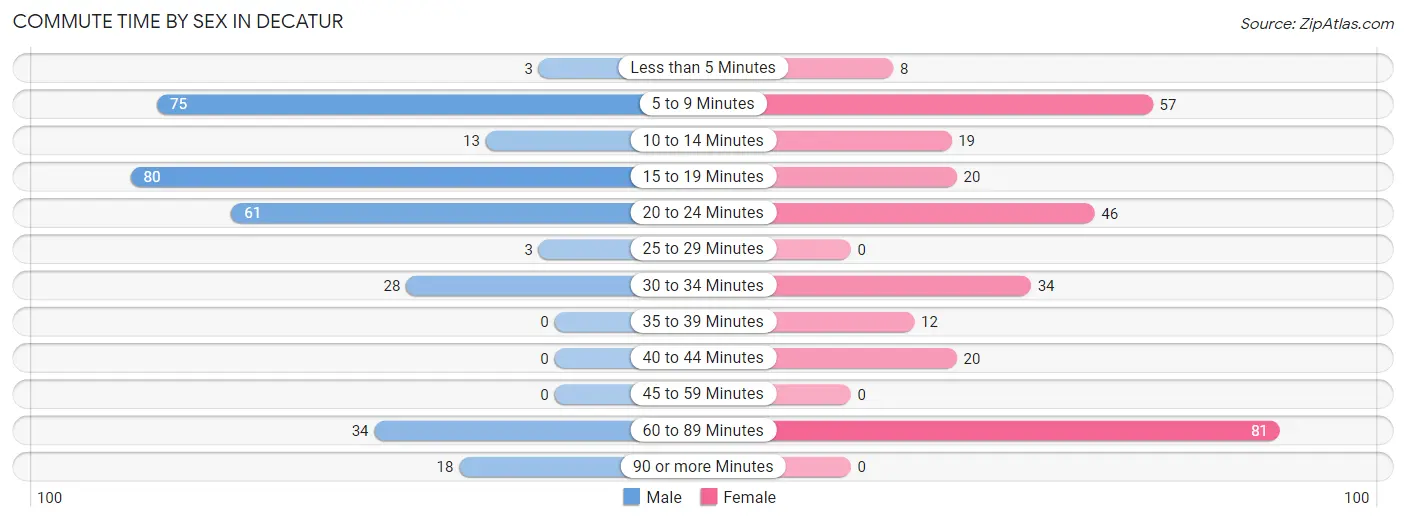
| Commute Time | Male | Female |
| Less than 5 Minutes | 3 (0.9%) | 8 (2.7%) |
| 5 to 9 Minutes | 75 (23.8%) | 57 (19.2%) |
| 10 to 14 Minutes | 13 (4.1%) | 19 (6.4%) |
| 15 to 19 Minutes | 80 (25.4%) | 20 (6.7%) |
| 20 to 24 Minutes | 61 (19.4%) | 46 (15.5%) |
| 25 to 29 Minutes | 3 (0.9%) | 0 (0.0%) |
| 30 to 34 Minutes | 28 (8.9%) | 34 (11.5%) |
| 35 to 39 Minutes | 0 (0.0%) | 12 (4.0%) |
| 40 to 44 Minutes | 0 (0.0%) | 20 (6.7%) |
| 45 to 59 Minutes | 0 (0.0%) | 0 (0.0%) |
| 60 to 89 Minutes | 34 (10.8%) | 81 (27.3%) |
| 90 or more Minutes | 18 (5.7%) | 0 (0.0%) |
Time of Departure to Work by Sex in Decatur
The most frequent times of departure to work in Decatur are 6:30 AM to 6:59 AM (93, 29.5%) for males and 7:00 AM to 7:29 AM (58, 19.5%) for females.
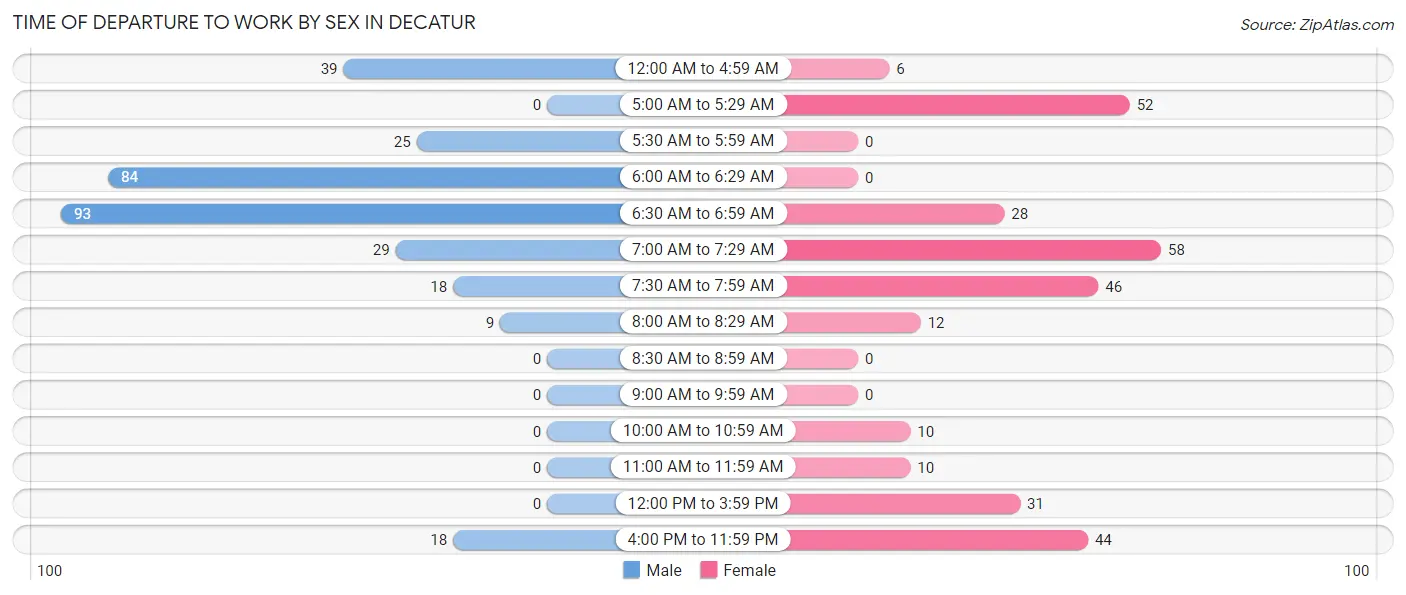
| Time of Departure | Male | Female |
| 12:00 AM to 4:59 AM | 39 (12.4%) | 6 (2.0%) |
| 5:00 AM to 5:29 AM | 0 (0.0%) | 52 (17.5%) |
| 5:30 AM to 5:59 AM | 25 (7.9%) | 0 (0.0%) |
| 6:00 AM to 6:29 AM | 84 (26.7%) | 0 (0.0%) |
| 6:30 AM to 6:59 AM | 93 (29.5%) | 28 (9.4%) |
| 7:00 AM to 7:29 AM | 29 (9.2%) | 58 (19.5%) |
| 7:30 AM to 7:59 AM | 18 (5.7%) | 46 (15.5%) |
| 8:00 AM to 8:29 AM | 9 (2.9%) | 12 (4.0%) |
| 8:30 AM to 8:59 AM | 0 (0.0%) | 0 (0.0%) |
| 9:00 AM to 9:59 AM | 0 (0.0%) | 0 (0.0%) |
| 10:00 AM to 10:59 AM | 0 (0.0%) | 10 (3.4%) |
| 11:00 AM to 11:59 AM | 0 (0.0%) | 10 (3.4%) |
| 12:00 PM to 3:59 PM | 0 (0.0%) | 31 (10.4%) |
| 4:00 PM to 11:59 PM | 18 (5.7%) | 44 (14.8%) |
| Total | 315 (100.0%) | 297 (100.0%) |
Housing Occupancy in Decatur
Occupancy by Ownership in Decatur
Of the total 615 dwellings in Decatur, owner-occupied units account for 256 (41.6%), while renter-occupied units make up 359 (58.4%).
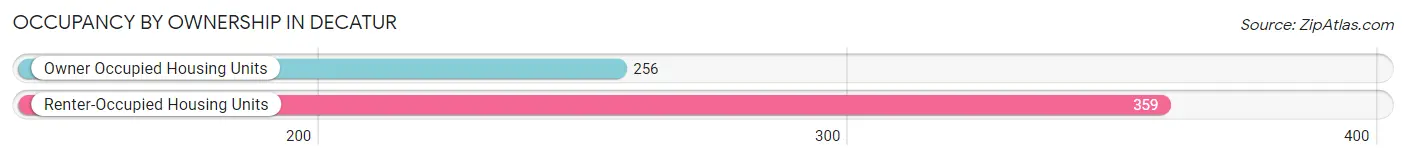
| Occupancy | # Housing Units | % Housing Units |
| Owner Occupied Housing Units | 256 | 41.6% |
| Renter-Occupied Housing Units | 359 | 58.4% |
| Total Occupied Housing Units | 615 | 100.0% |
Occupancy by Household Size in Decatur
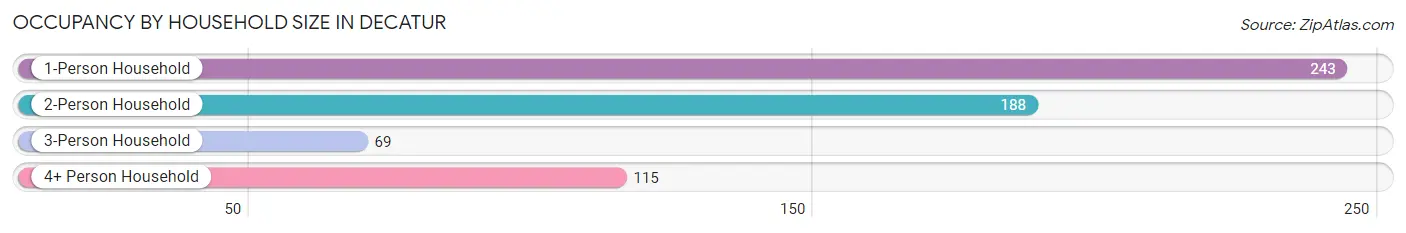
| Household Size | # Housing Units | % Housing Units |
| 1-Person Household | 243 | 39.5% |
| 2-Person Household | 188 | 30.6% |
| 3-Person Household | 69 | 11.2% |
| 4+ Person Household | 115 | 18.7% |
| Total Housing Units | 615 | 100.0% |
Occupancy by Ownership by Household Size in Decatur
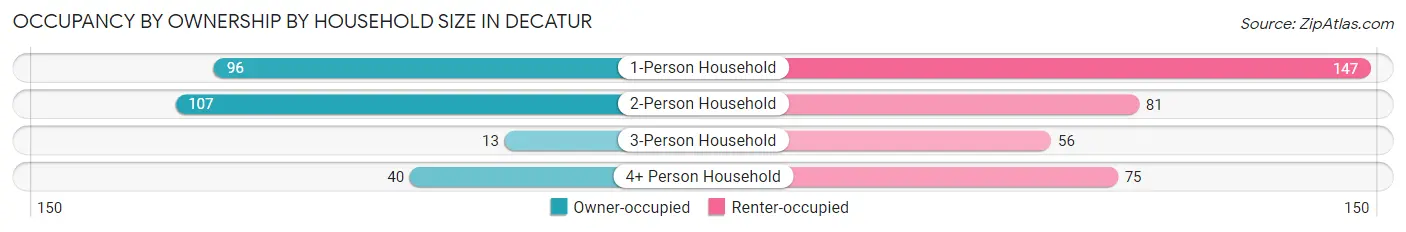
| Household Size | Owner-occupied | Renter-occupied |
| 1-Person Household | 96 (39.5%) | 147 (60.5%) |
| 2-Person Household | 107 (56.9%) | 81 (43.1%) |
| 3-Person Household | 13 (18.8%) | 56 (81.2%) |
| 4+ Person Household | 40 (34.8%) | 75 (65.2%) |
| Total Housing Units | 256 (41.6%) | 359 (58.4%) |
Occupancy by Educational Attainment in Decatur
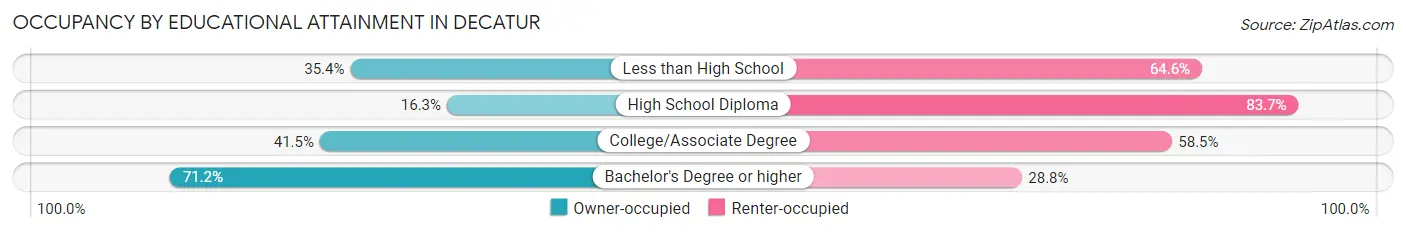
| Household Size | Owner-occupied | Renter-occupied |
| Less than High School | 34 (35.4%) | 62 (64.6%) |
| High School Diploma | 21 (16.3%) | 108 (83.7%) |
| College/Associate Degree | 107 (41.5%) | 151 (58.5%) |
| Bachelor's Degree or higher | 94 (71.2%) | 38 (28.8%) |
Occupancy by Age of Householder in Decatur
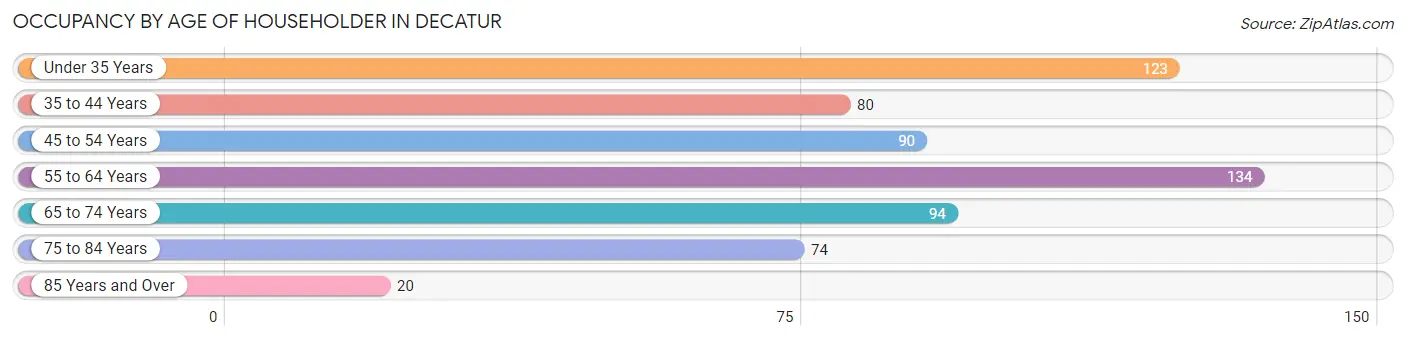
| Age Bracket | # Households | % Households |
| Under 35 Years | 123 | 20.0% |
| 35 to 44 Years | 80 | 13.0% |
| 45 to 54 Years | 90 | 14.6% |
| 55 to 64 Years | 134 | 21.8% |
| 65 to 74 Years | 94 | 15.3% |
| 75 to 84 Years | 74 | 12.0% |
| 85 Years and Over | 20 | 3.3% |
| Total | 615 | 100.0% |
Housing Finances in Decatur
Median Income by Occupancy in Decatur
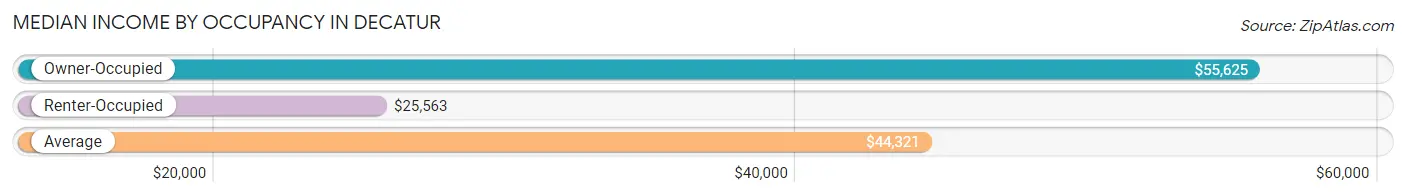
| Occupancy Type | # Households | Median Income |
| Owner-Occupied | 256 (41.6%) | $55,625 |
| Renter-Occupied | 359 (58.4%) | $25,563 |
| Average | 615 (100.0%) | $44,321 |
Occupancy by Householder Income Bracket in Decatur
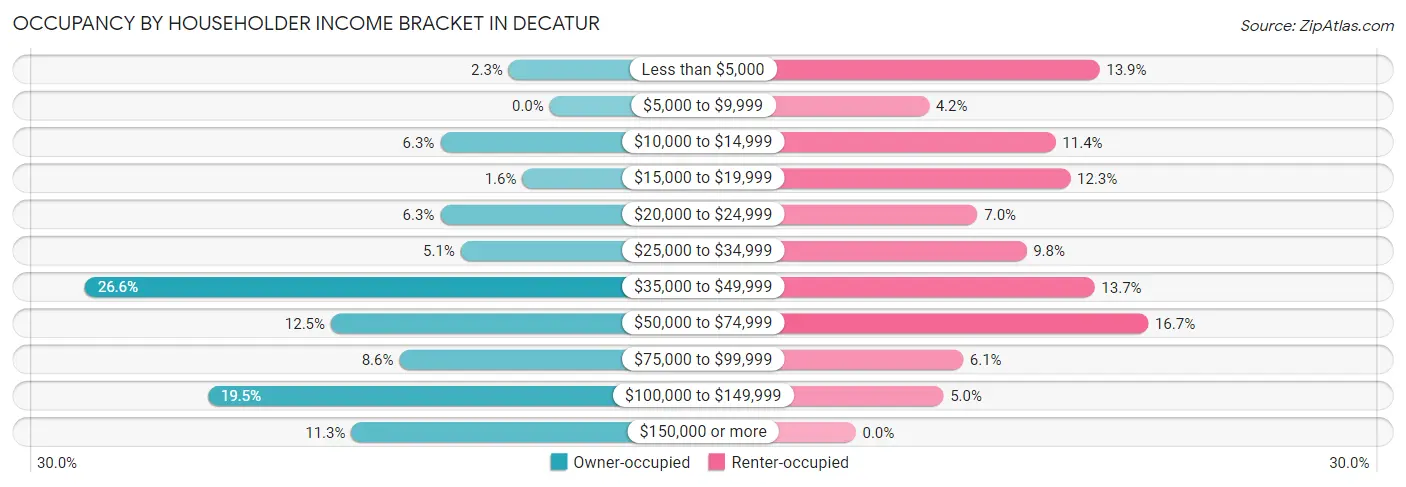
| Income Bracket | Owner-occupied | Renter-occupied |
| Less than $5,000 | 6 (2.3%) | 50 (13.9%) |
| $5,000 to $9,999 | 0 (0.0%) | 15 (4.2%) |
| $10,000 to $14,999 | 16 (6.2%) | 41 (11.4%) |
| $15,000 to $19,999 | 4 (1.6%) | 44 (12.3%) |
| $20,000 to $24,999 | 16 (6.2%) | 25 (7.0%) |
| $25,000 to $34,999 | 13 (5.1%) | 35 (9.8%) |
| $35,000 to $49,999 | 68 (26.6%) | 49 (13.7%) |
| $50,000 to $74,999 | 32 (12.5%) | 60 (16.7%) |
| $75,000 to $99,999 | 22 (8.6%) | 22 (6.1%) |
| $100,000 to $149,999 | 50 (19.5%) | 18 (5.0%) |
| $150,000 or more | 29 (11.3%) | 0 (0.0%) |
| Total | 256 (100.0%) | 359 (100.0%) |
Monthly Housing Cost Tiers in Decatur
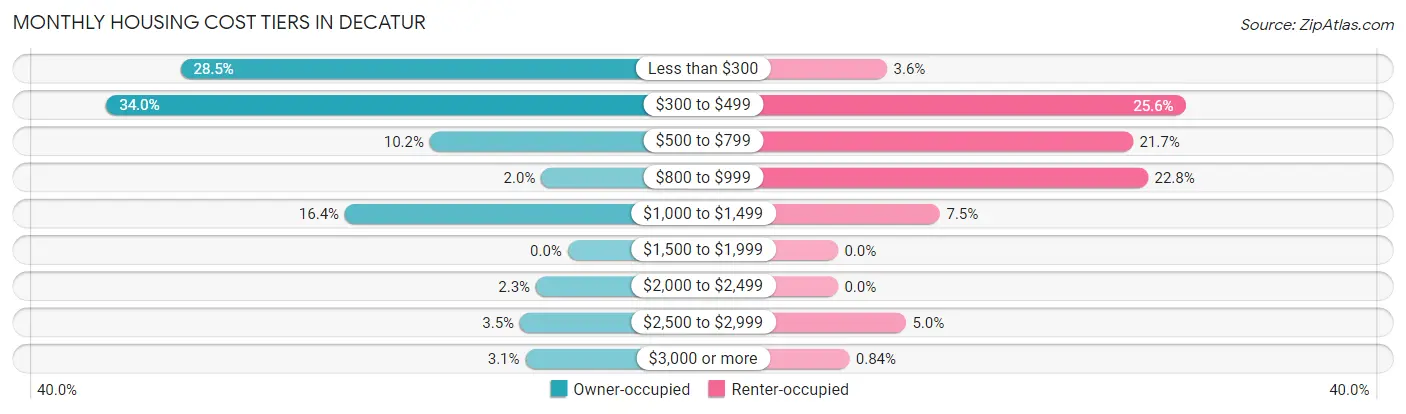
| Monthly Cost | Owner-occupied | Renter-occupied |
| Less than $300 | 73 (28.5%) | 13 (3.6%) |
| $300 to $499 | 87 (34.0%) | 92 (25.6%) |
| $500 to $799 | 26 (10.2%) | 78 (21.7%) |
| $800 to $999 | 5 (1.9%) | 82 (22.8%) |
| $1,000 to $1,499 | 42 (16.4%) | 27 (7.5%) |
| $1,500 to $1,999 | 0 (0.0%) | 0 (0.0%) |
| $2,000 to $2,499 | 6 (2.3%) | 0 (0.0%) |
| $2,500 to $2,999 | 9 (3.5%) | 18 (5.0%) |
| $3,000 or more | 8 (3.1%) | 3 (0.8%) |
| Total | 256 (100.0%) | 359 (100.0%) |
Physical Housing Characteristics in Decatur
Housing Structures in Decatur
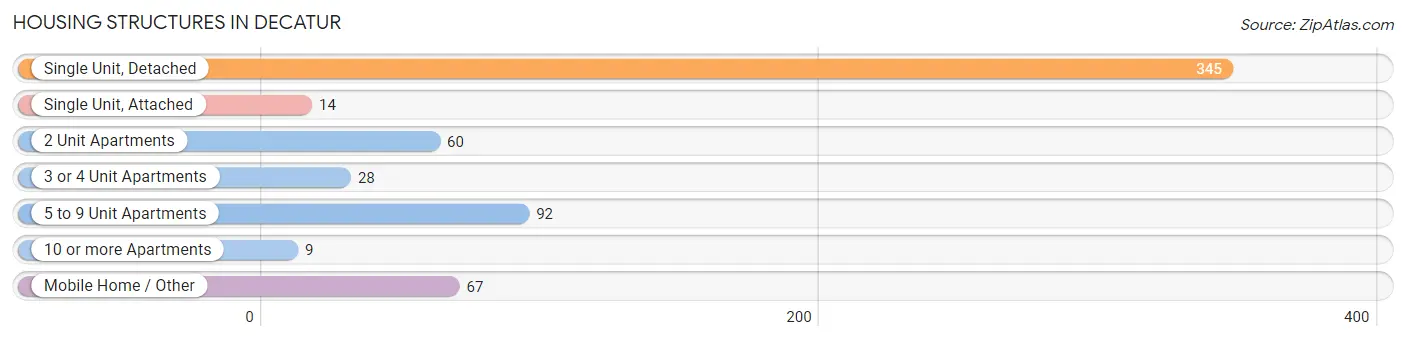
| Structure Type | # Housing Units | % Housing Units |
| Single Unit, Detached | 345 | 56.1% |
| Single Unit, Attached | 14 | 2.3% |
| 2 Unit Apartments | 60 | 9.8% |
| 3 or 4 Unit Apartments | 28 | 4.5% |
| 5 to 9 Unit Apartments | 92 | 15.0% |
| 10 or more Apartments | 9 | 1.5% |
| Mobile Home / Other | 67 | 10.9% |
| Total | 615 | 100.0% |
Housing Structures by Occupancy in Decatur
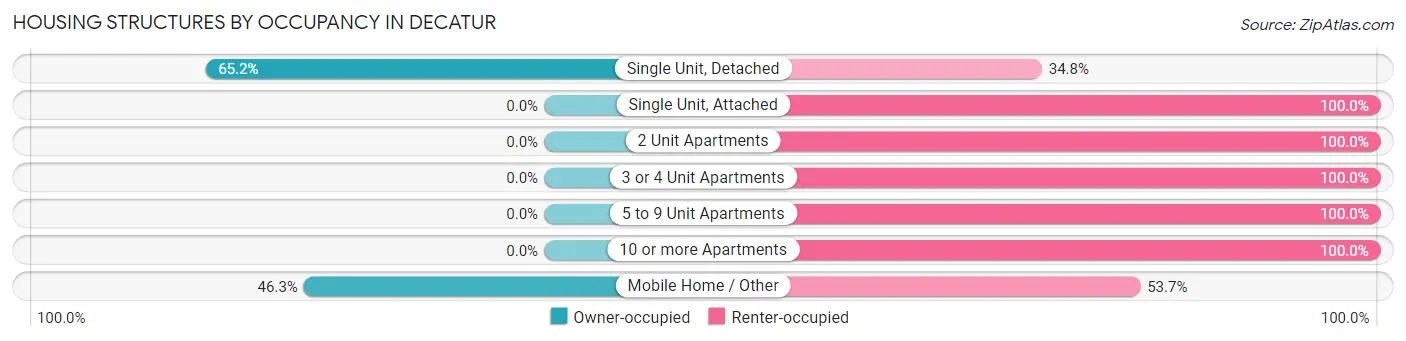
| Structure Type | Owner-occupied | Renter-occupied |
| Single Unit, Detached | 225 (65.2%) | 120 (34.8%) |
| Single Unit, Attached | 0 (0.0%) | 14 (100.0%) |
| 2 Unit Apartments | 0 (0.0%) | 60 (100.0%) |
| 3 or 4 Unit Apartments | 0 (0.0%) | 28 (100.0%) |
| 5 to 9 Unit Apartments | 0 (0.0%) | 92 (100.0%) |
| 10 or more Apartments | 0 (0.0%) | 9 (100.0%) |
| Mobile Home / Other | 31 (46.3%) | 36 (53.7%) |
| Total | 256 (41.6%) | 359 (58.4%) |
Housing Structures by Number of Rooms in Decatur
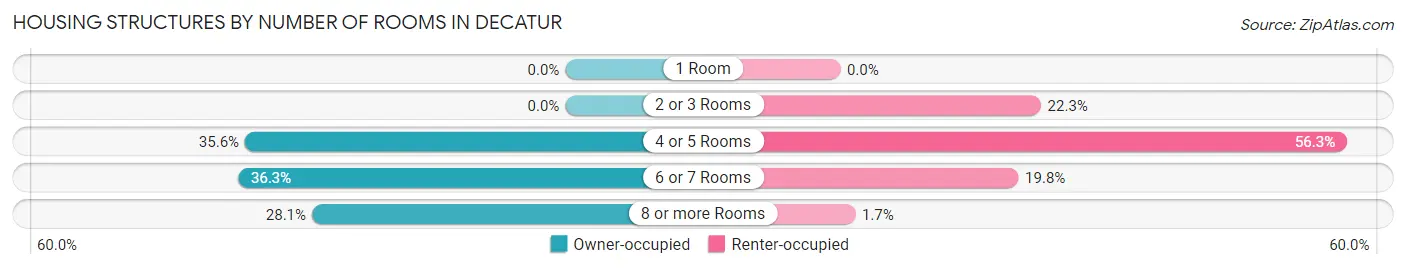
| Number of Rooms | Owner-occupied | Renter-occupied |
| 1 Room | 0 (0.0%) | 0 (0.0%) |
| 2 or 3 Rooms | 0 (0.0%) | 80 (22.3%) |
| 4 or 5 Rooms | 91 (35.5%) | 202 (56.3%) |
| 6 or 7 Rooms | 93 (36.3%) | 71 (19.8%) |
| 8 or more Rooms | 72 (28.1%) | 6 (1.7%) |
| Total | 256 (100.0%) | 359 (100.0%) |
Housing Structure by Heating Type in Decatur
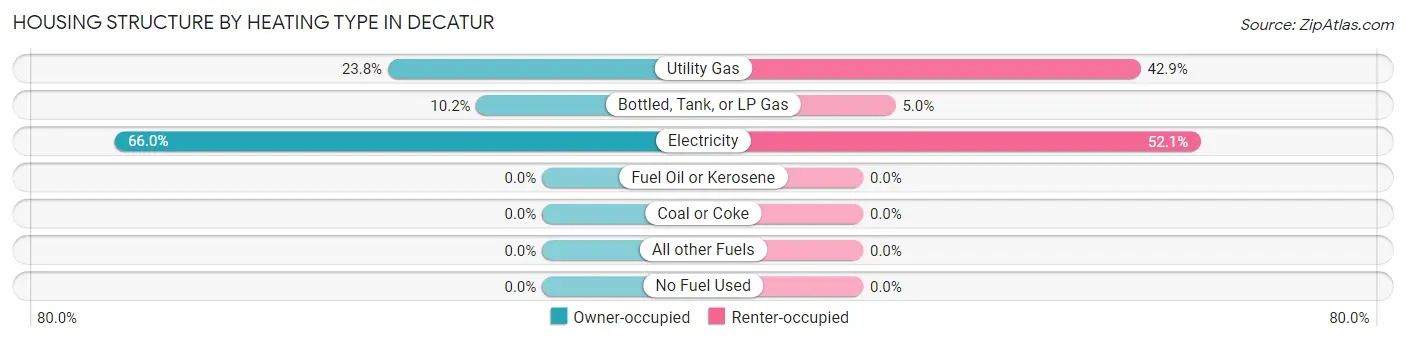
| Heating Type | Owner-occupied | Renter-occupied |
| Utility Gas | 61 (23.8%) | 154 (42.9%) |
| Bottled, Tank, or LP Gas | 26 (10.2%) | 18 (5.0%) |
| Electricity | 169 (66.0%) | 187 (52.1%) |
| Fuel Oil or Kerosene | 0 (0.0%) | 0 (0.0%) |
| Coal or Coke | 0 (0.0%) | 0 (0.0%) |
| All other Fuels | 0 (0.0%) | 0 (0.0%) |
| No Fuel Used | 0 (0.0%) | 0 (0.0%) |
| Total | 256 (100.0%) | 359 (100.0%) |
Household Vehicle Usage in Decatur
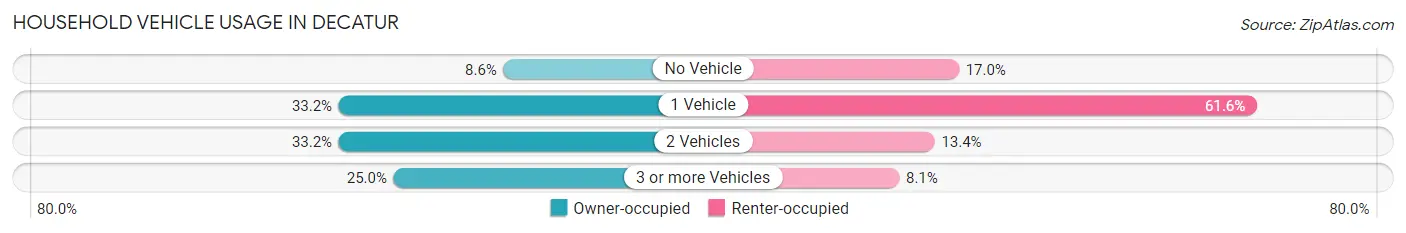
| Vehicles per Household | Owner-occupied | Renter-occupied |
| No Vehicle | 22 (8.6%) | 61 (17.0%) |
| 1 Vehicle | 85 (33.2%) | 221 (61.6%) |
| 2 Vehicles | 85 (33.2%) | 48 (13.4%) |
| 3 or more Vehicles | 64 (25.0%) | 29 (8.1%) |
| Total | 256 (100.0%) | 359 (100.0%) |
Real Estate & Mortgages in Decatur
Real Estate and Mortgage Overview in Decatur
| Characteristic | Without Mortgage | With Mortgage |
| Housing Units | 184 | 72 |
| Median Property Value | $92,300 | $168,000 |
| Median Household Income | $48,438 | $21 |
| Monthly Housing Costs | $353 | $8 |
| Real Estate Taxes | $847 | $11 |
Property Value by Mortgage Status in Decatur
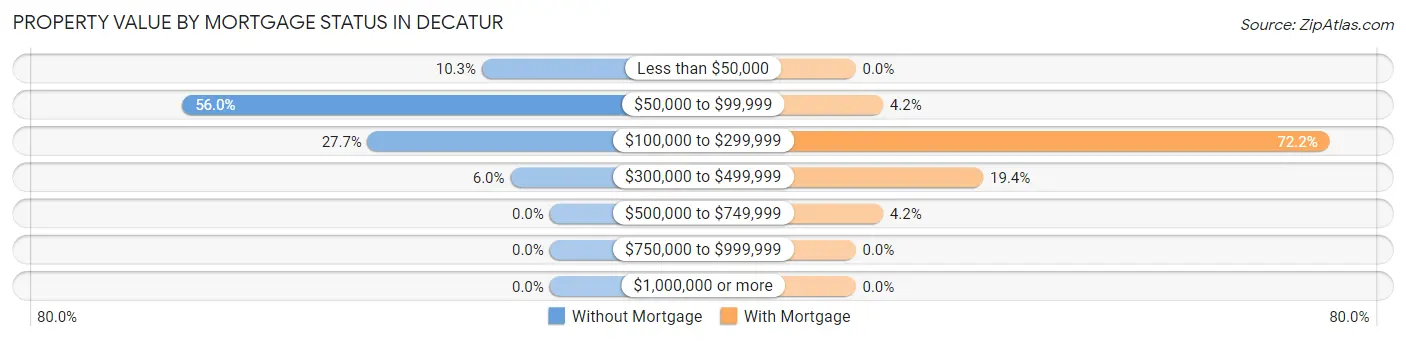
| Property Value | Without Mortgage | With Mortgage |
| Less than $50,000 | 19 (10.3%) | 0 (0.0%) |
| $50,000 to $99,999 | 103 (56.0%) | 3 (4.2%) |
| $100,000 to $299,999 | 51 (27.7%) | 52 (72.2%) |
| $300,000 to $499,999 | 11 (6.0%) | 14 (19.4%) |
| $500,000 to $749,999 | 0 (0.0%) | 3 (4.2%) |
| $750,000 to $999,999 | 0 (0.0%) | 0 (0.0%) |
| $1,000,000 or more | 0 (0.0%) | 0 (0.0%) |
| Total | 184 (100.0%) | 72 (100.0%) |
Household Income by Mortgage Status in Decatur
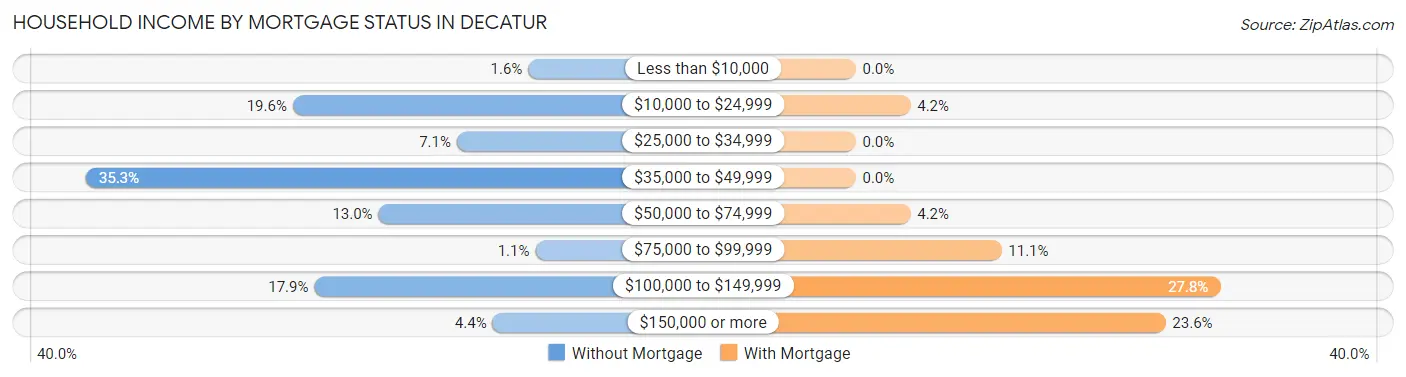
| Household Income | Without Mortgage | With Mortgage |
| Less than $10,000 | 3 (1.6%) | 0 (0.0%) |
| $10,000 to $24,999 | 36 (19.6%) | 3 (4.2%) |
| $25,000 to $34,999 | 13 (7.1%) | 0 (0.0%) |
| $35,000 to $49,999 | 65 (35.3%) | 0 (0.0%) |
| $50,000 to $74,999 | 24 (13.0%) | 3 (4.2%) |
| $75,000 to $99,999 | 2 (1.1%) | 8 (11.1%) |
| $100,000 to $149,999 | 33 (17.9%) | 20 (27.8%) |
| $150,000 or more | 8 (4.3%) | 17 (23.6%) |
| Total | 184 (100.0%) | 72 (100.0%) |
Property Value to Household Income Ratio in Decatur
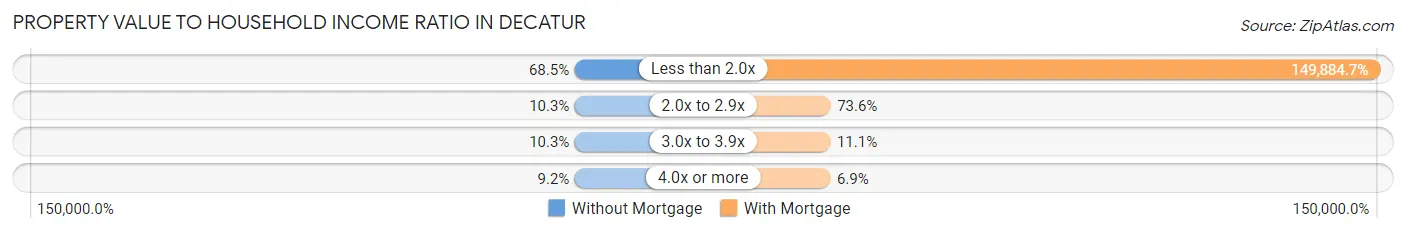
| Value-to-Income Ratio | Without Mortgage | With Mortgage |
| Less than 2.0x | 126 (68.5%) | 107,917 (149,884.7%) |
| 2.0x to 2.9x | 19 (10.3%) | 53 (73.6%) |
| 3.0x to 3.9x | 19 (10.3%) | 8 (11.1%) |
| 4.0x or more | 17 (9.2%) | 5 (6.9%) |
| Total | 184 (100.0%) | 72 (100.0%) |
Real Estate Taxes by Mortgage Status in Decatur
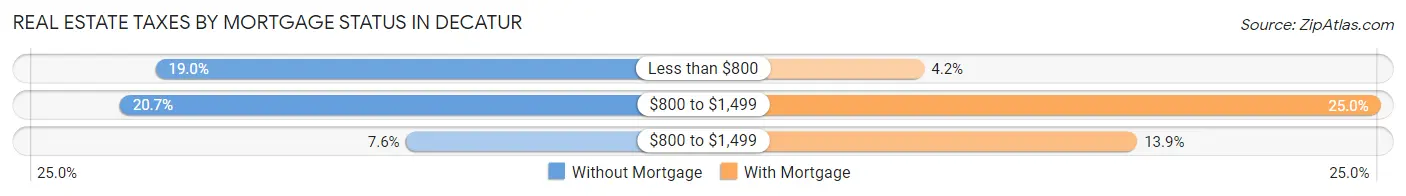
| Property Taxes | Without Mortgage | With Mortgage |
| Less than $800 | 35 (19.0%) | 3 (4.2%) |
| $800 to $1,499 | 38 (20.6%) | 18 (25.0%) |
| $800 to $1,499 | 14 (7.6%) | 10 (13.9%) |
| Total | 184 (100.0%) | 72 (100.0%) |
Health & Disability in Decatur
Health Insurance Coverage by Age in Decatur
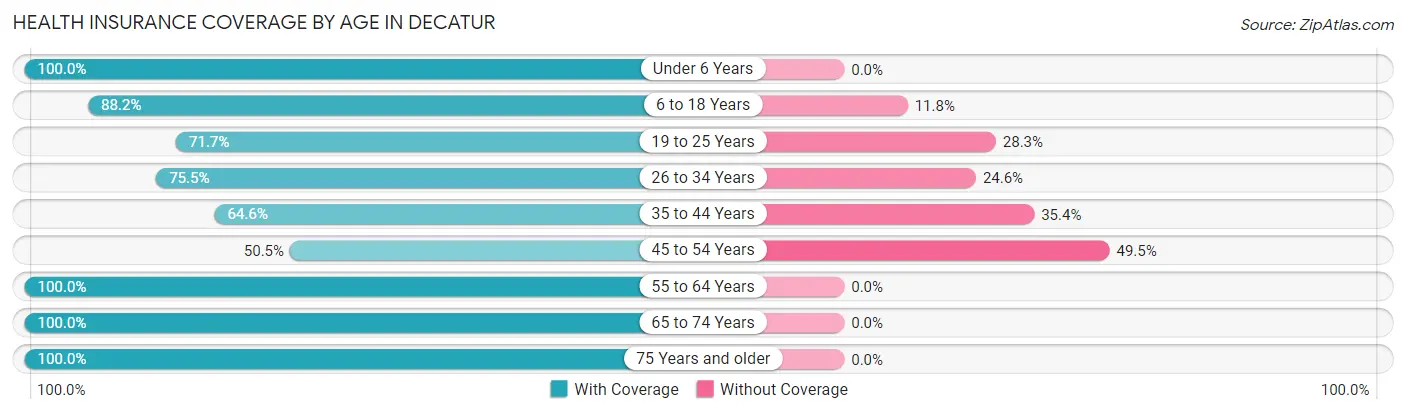
| Age Bracket | With Coverage | Without Coverage |
| Under 6 Years | 159 (100.0%) | 0 (0.0%) |
| 6 to 18 Years | 447 (88.2%) | 60 (11.8%) |
| 19 to 25 Years | 434 (71.7%) | 171 (28.3%) |
| 26 to 34 Years | 209 (75.4%) | 68 (24.5%) |
| 35 to 44 Years | 93 (64.6%) | 51 (35.4%) |
| 45 to 54 Years | 95 (50.5%) | 93 (49.5%) |
| 55 to 64 Years | 171 (100.0%) | 0 (0.0%) |
| 65 to 74 Years | 116 (100.0%) | 0 (0.0%) |
| 75 Years and older | 122 (100.0%) | 0 (0.0%) |
| Total | 1,846 (80.6%) | 443 (19.4%) |
Health Insurance Coverage by Citizenship Status in Decatur
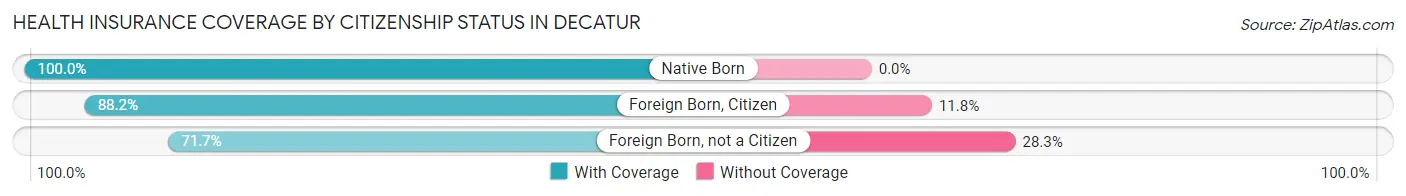
| Citizenship Status | With Coverage | Without Coverage |
| Native Born | 159 (100.0%) | 0 (0.0%) |
| Foreign Born, Citizen | 447 (88.2%) | 60 (11.8%) |
| Foreign Born, not a Citizen | 434 (71.7%) | 171 (28.3%) |
Health Insurance Coverage by Household Income in Decatur
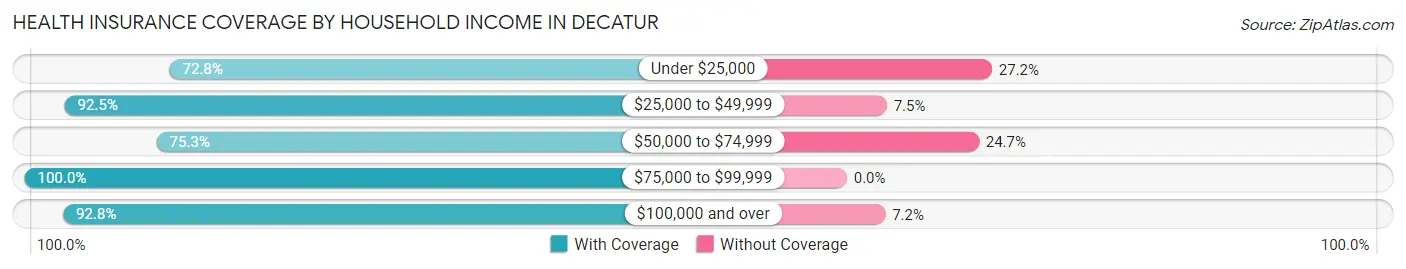
| Household Income | With Coverage | Without Coverage |
| Under $25,000 | 375 (72.8%) | 140 (27.2%) |
| $25,000 to $49,999 | 445 (92.5%) | 36 (7.5%) |
| $50,000 to $74,999 | 213 (75.3%) | 70 (24.7%) |
| $75,000 to $99,999 | 145 (100.0%) | 0 (0.0%) |
| $100,000 and over | 232 (92.8%) | 18 (7.2%) |
Public vs Private Health Insurance Coverage by Age in Decatur
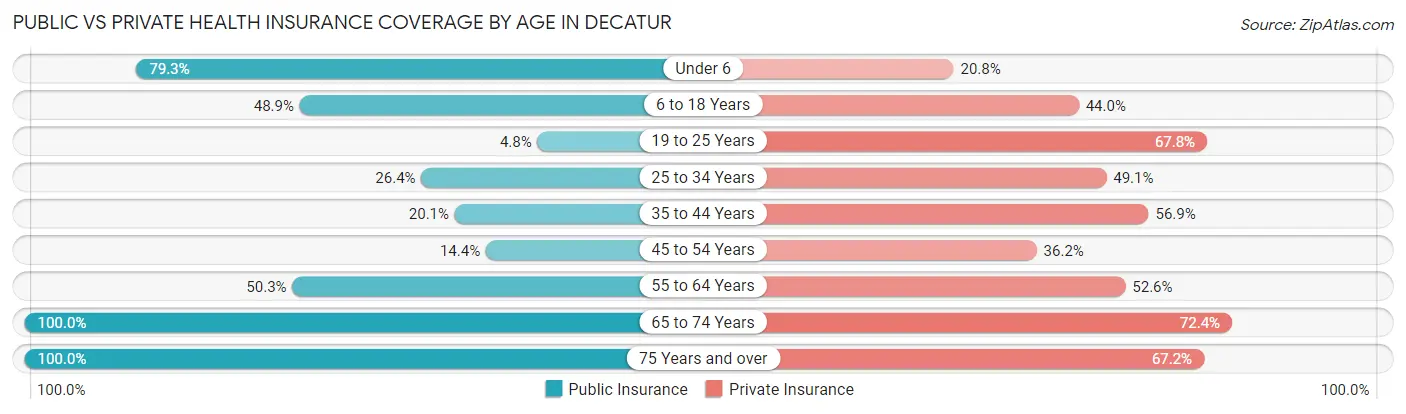
| Age Bracket | Public Insurance | Private Insurance |
| Under 6 | 126 (79.2%) | 33 (20.7%) |
| 6 to 18 Years | 248 (48.9%) | 223 (44.0%) |
| 19 to 25 Years | 29 (4.8%) | 410 (67.8%) |
| 25 to 34 Years | 73 (26.4%) | 136 (49.1%) |
| 35 to 44 Years | 29 (20.1%) | 82 (56.9%) |
| 45 to 54 Years | 27 (14.4%) | 68 (36.2%) |
| 55 to 64 Years | 86 (50.3%) | 90 (52.6%) |
| 65 to 74 Years | 116 (100.0%) | 84 (72.4%) |
| 75 Years and over | 122 (100.0%) | 82 (67.2%) |
| Total | 856 (37.4%) | 1,208 (52.8%) |
Disability Status by Sex by Age in Decatur
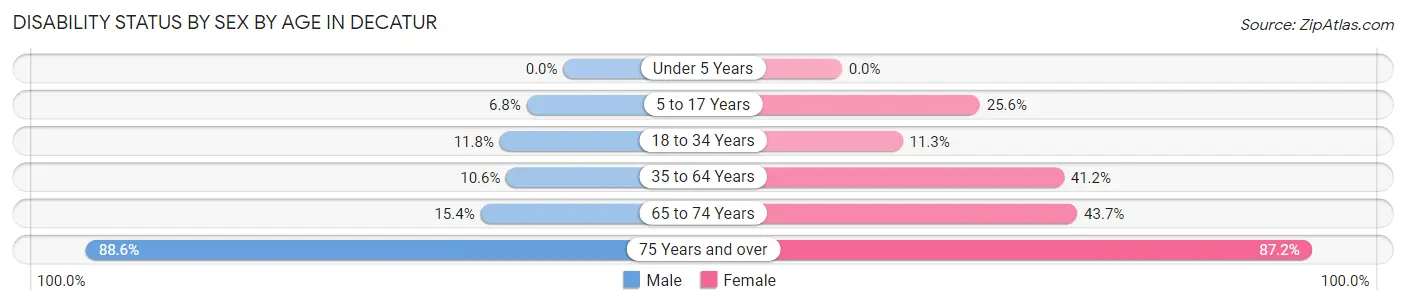
| Age Bracket | Male | Female |
| Under 5 Years | 0 (0.0%) | 0 (0.0%) |
| 5 to 17 Years | 12 (6.8%) | 52 (25.6%) |
| 18 to 34 Years | 64 (11.8%) | 58 (11.3%) |
| 35 to 64 Years | 25 (10.6%) | 110 (41.2%) |
| 65 to 74 Years | 2 (15.4%) | 45 (43.7%) |
| 75 Years and over | 39 (88.6%) | 68 (87.2%) |
Disability Class by Sex by Age in Decatur
Disability Class: Hearing Difficulty
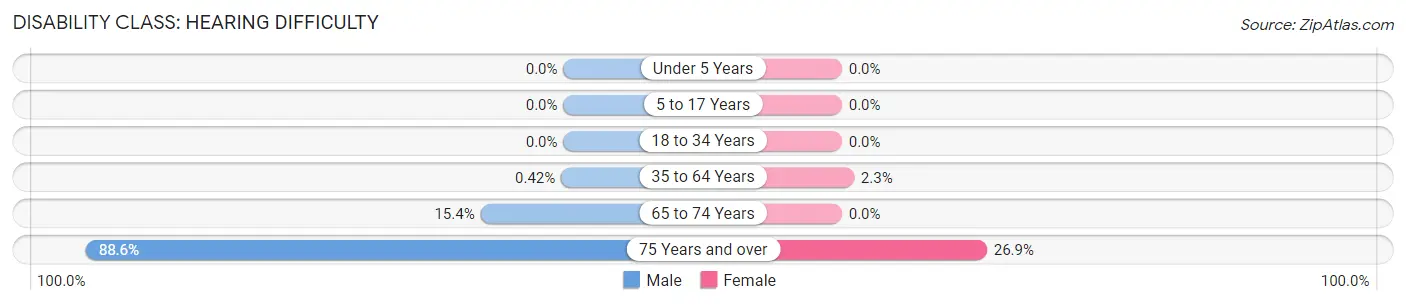
| Age Bracket | Male | Female |
| Under 5 Years | 0 (0.0%) | 0 (0.0%) |
| 5 to 17 Years | 0 (0.0%) | 0 (0.0%) |
| 18 to 34 Years | 0 (0.0%) | 0 (0.0%) |
| 35 to 64 Years | 1 (0.4%) | 6 (2.2%) |
| 65 to 74 Years | 2 (15.4%) | 0 (0.0%) |
| 75 Years and over | 39 (88.6%) | 21 (26.9%) |
Disability Class: Vision Difficulty
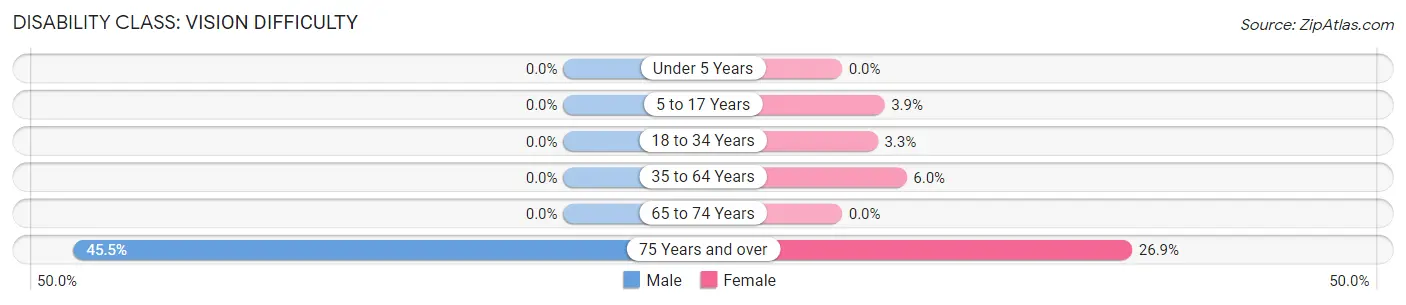
| Age Bracket | Male | Female |
| Under 5 Years | 0 (0.0%) | 0 (0.0%) |
| 5 to 17 Years | 0 (0.0%) | 8 (3.9%) |
| 18 to 34 Years | 0 (0.0%) | 17 (3.3%) |
| 35 to 64 Years | 0 (0.0%) | 16 (6.0%) |
| 65 to 74 Years | 0 (0.0%) | 0 (0.0%) |
| 75 Years and over | 20 (45.5%) | 21 (26.9%) |
Disability Class: Cognitive Difficulty
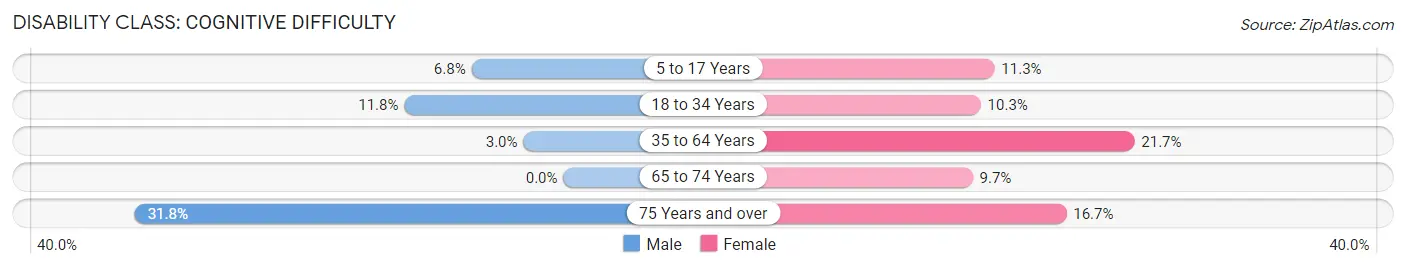
| Age Bracket | Male | Female |
| 5 to 17 Years | 12 (6.8%) | 23 (11.3%) |
| 18 to 34 Years | 64 (11.8%) | 53 (10.3%) |
| 35 to 64 Years | 7 (3.0%) | 58 (21.7%) |
| 65 to 74 Years | 0 (0.0%) | 10 (9.7%) |
| 75 Years and over | 14 (31.8%) | 13 (16.7%) |
Disability Class: Ambulatory Difficulty
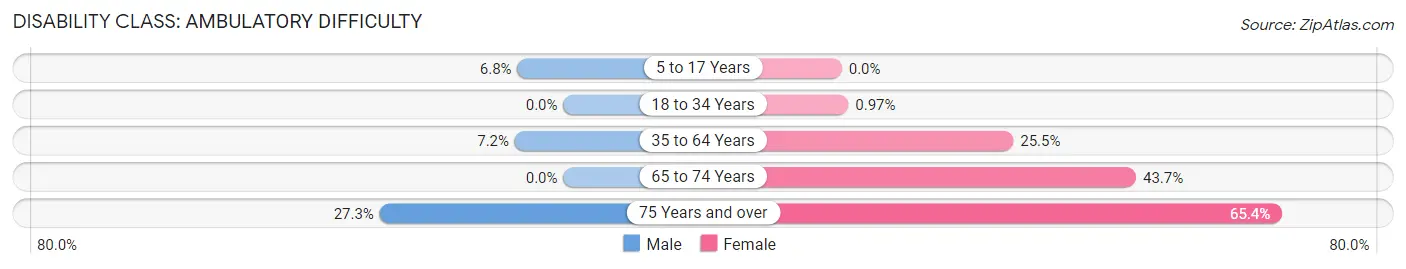
| Age Bracket | Male | Female |
| 5 to 17 Years | 12 (6.8%) | 0 (0.0%) |
| 18 to 34 Years | 0 (0.0%) | 5 (1.0%) |
| 35 to 64 Years | 17 (7.2%) | 68 (25.5%) |
| 65 to 74 Years | 0 (0.0%) | 45 (43.7%) |
| 75 Years and over | 12 (27.3%) | 51 (65.4%) |
Disability Class: Self-Care Difficulty
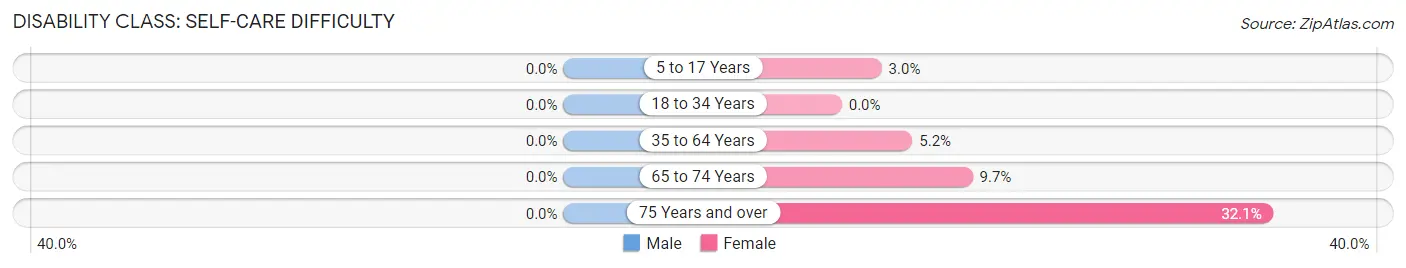
| Age Bracket | Male | Female |
| 5 to 17 Years | 0 (0.0%) | 6 (3.0%) |
| 18 to 34 Years | 0 (0.0%) | 0 (0.0%) |
| 35 to 64 Years | 0 (0.0%) | 14 (5.2%) |
| 65 to 74 Years | 0 (0.0%) | 10 (9.7%) |
| 75 Years and over | 0 (0.0%) | 25 (32.1%) |
Technology Access in Decatur
Computing Device Access in Decatur
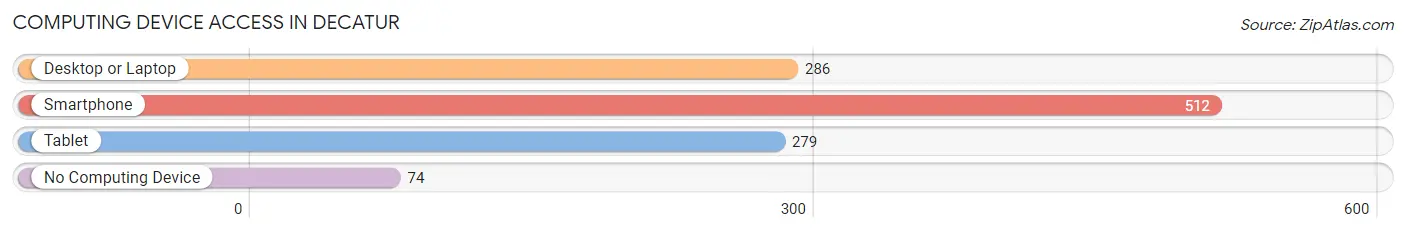
| Device Type | # Households | % Households |
| Desktop or Laptop | 286 | 46.5% |
| Smartphone | 512 | 83.3% |
| Tablet | 279 | 45.4% |
| No Computing Device | 74 | 12.0% |
| Total | 615 | 100.0% |
Internet Access in Decatur
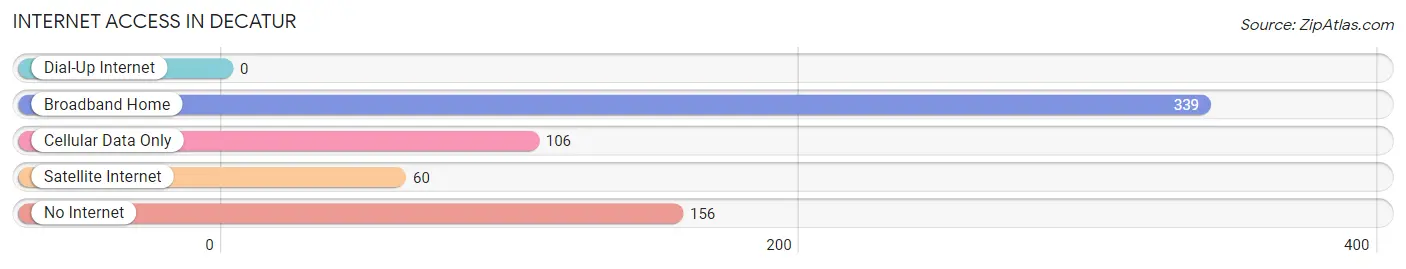
| Internet Type | # Households | % Households |
| Dial-Up Internet | 0 | 0.0% |
| Broadband Home | 339 | 55.1% |
| Cellular Data Only | 106 | 17.2% |
| Satellite Internet | 60 | 9.8% |
| No Internet | 156 | 25.4% |
| Total | 615 | 100.0% |
Decatur Summary
Decatur is a small town located in Newton County, Mississippi. It is situated on the banks of the Leaf River and is part of the Hattiesburg, Mississippi Metropolitan Statistical Area. The town has a population of approximately 1,500 people and is known for its rural charm and friendly atmosphere.
History
Decatur was founded in 1836 by a group of settlers from Georgia. The town was named after Commodore Stephen Decatur, a naval hero of the War of 1812. The town was incorporated in 1837 and quickly became a thriving agricultural center. The town was home to several cotton plantations and was a major producer of cotton and other agricultural products.
During the Civil War, Decatur was the site of several battles between Union and Confederate forces. After the war, the town experienced a period of economic decline as the cotton industry declined. However, the town was able to recover and by the early 20th century, Decatur had become a thriving agricultural center once again.
Geography
Decatur is located in the southeastern corner of Newton County, Mississippi. The town is situated on the banks of the Leaf River and is part of the Hattiesburg, Mississippi Metropolitan Statistical Area. The town is located approximately 30 miles south of Hattiesburg and is accessible via US Highway 49.
The town has a total area of 1.3 square miles, all of which is land. The town is located in a rural area and is surrounded by forests and farmland. The town is located in a humid subtropical climate zone and experiences hot, humid summers and mild winters.
Economy
Decatur’s economy is largely based on agriculture. The town is home to several cotton plantations and is a major producer of cotton and other agricultural products. The town is also home to several small businesses, including restaurants, retail stores, and service providers.
The town is also home to several manufacturing companies, including a furniture factory and a woodworking plant. The town is also home to several small businesses, including restaurants, retail stores, and service providers.
Demographics
As of the 2010 census, Decatur had a population of 1,500 people. The town has a population that is predominantly white (90.2%) and African American (9.8%). The median household income in the town is $30,000 and the median age is 37.
Decatur is a small town with a rural atmosphere and a friendly atmosphere. The town is home to several small businesses and is a major producer of cotton and other agricultural products. The town is also home to several manufacturing companies and is a popular destination for tourists.
Common Questions
What is Per Capita Income in Decatur?
Per Capita income in Decatur is $17,700.
What is the Median Family Income in Decatur?
Median Family Income in Decatur is $48,472.
What is the Median Household income in Decatur?
Median Household Income in Decatur is $44,321.
What is Income or Wage Gap in Decatur?
Income or Wage Gap in Decatur is 41.4%.
Women in Decatur earn 58.6 cents for every dollar earned by a man.
What is Inequality or Gini Index in Decatur?
Inequality or Gini Index in Decatur is 0.49.
What is the Total Population of Decatur?
Total Population of Decatur is 2,325.
What is the Total Male Population of Decatur?
Total Male Population of Decatur is 1,080.
What is the Total Female Population of Decatur?
Total Female Population of Decatur is 1,245.
What is the Ratio of Males per 100 Females in Decatur?
There are 86.75 Males per 100 Females in Decatur.
What is the Ratio of Females per 100 Males in Decatur?
There are 115.28 Females per 100 Males in Decatur.
What is the Median Population Age in Decatur?
Median Population Age in Decatur is 21.9 Years.
What is the Average Family Size in Decatur
Average Family Size in Decatur is 3.7 People.
What is the Average Household Size in Decatur
Average Household Size in Decatur is 2.7 People.
How Large is the Labor Force in Decatur?
There are 720 People in the Labor Forcein in Decatur.
What is the Percentage of People in the Labor Force in Decatur?
39.0% of People are in the Labor Force in Decatur.
What is the Unemployment Rate in Decatur?
Unemployment Rate in Decatur is 10.8%.